Use these linksQuickLinks-- Click here to rapidly review thenavigate through this document
TABLE OF CONTENTS
Index to Consolidated Financial Statements and Financial Statement Schedules


UNITED STATES
SECURITIES AND EXCHANGE COMMISSION
Washington, D.C. 20549

FORM 10-K

ý(Mark One)

ý

ANNUAL REPORT PURSUANT TO SECTION 13 OR 15(d) OF THE SECURITIES EXCHANGE ACT OF 1934

For the fiscal year ended December 31, 20042007

OR

o

TRANSITION REPORT PURSUANT TO SECTION 13 OR 15(d) OF THE SECURITIES EXCHANGE ACT OF 1934

For the transition period from                                    to                                     

Commission file number 1-8993

WHITE MOUNTAINS INSURANCE GROUP, LTD.
(Exact name of Registrant as specified in its charter)

Bermuda
(State or other jurisdiction of
incorporation or organization)
 94-2708455
(I.R.S. Employer
Identification No.)

80 South Main Street, Hanover, New Hampshire

(Address of principal executive offices)


03755-2053
(Zip Code)

Registrant's telephone number, including area code:
(603) 640-2200

Securities registered pursuant to Section 12(b) of the Act:

Registrant's telephone number, including area code: (603) 640-2200

Securities registered pursuant to Section 12(b) of the Act:

Title of each class

Name of each exchange on which registered

Common Shares, par value $1.00
per share
 New York Stock Exchange
Bermuda Stock Exchange

Securities registered pursuant to sectionSection 12(g) of the Act:
None

None          Indicate by check mark if the Registrant is a well-known seasoned issuer, as defined in Rule 405 of the Securities Act. Yes ý    No o

          Indicate by check mark if the Registrant is not required to file reports pursuant to Section 13 or Section 15(d) of the Exchange Act. Yes o    No ý

          Indicate by check mark whether the Registrant (1) has filed all reports required to be filed by Section 13 or 15(d) of the Securities Exchange Act of 1934 during the preceding 12 months (or for such shorter period that the Registrant was required to file such reports), and (2) has been subject to such filing requirements for the past 90 days. Yes ý    No o

          Indicate by check mark if disclosure of delinquent filers pursuant to Item 405 of Regulation S-K is not contained herein, and will not be contained, to the best of the Registrant's knowledge, in definitive proxy or information statements incorporated by reference in Part III of this Form 10-K or any amendment to this Form 10-K. ý

          Indicate by checkmarkcheck mark whether the registrant is a large accelerated filer, an accelerated filer, a non-accelerated filer, or a smaller reporting company. See definitions of "large accelerated filer," "accelerated filer," and "smaller reporting company" in Rule 12b-2 of the Exchange Act. (Check one):

Large accelerated filer ýAccelerated filer oNon-accelerated filer o
(Do not check if a smaller reporting company)
Smaller reporting company o

          Indicate by check mark whether the Registrant is a shell company (as defined in Rule 12b-2 of the Exchange Act). Yes ýo    No oý

          The aggregate market value of voting shares (based on the closing price of those shares listed on the New York Stock Exchange and the consideration received for those shares not listed on a national or regional exchange) held by non-affiliates of the Registrant as of June 30, 2004,2007, was $2,938,462,920.$6,022,012,862.

          As of March 1, 2005, 10,774,589February 28, 2008, 10,547,334 common shares, par value of $1.00 per share, ("Common Shares"), were outstanding.

DOCUMENTS INCORPORATED BY REFERENCE

          Portions of the Registrant's Definitive Proxy Statement to be filed with the Securities and Exchange Commission ("SEC") pursuant to Regulation 14A under the Securities Exchange Act of 1934, as amended (the "Exchange Act"), relating to the Registrant's Annual General Meeting of Members scheduled to be held May 19, 200529, 2008 are incorporated by reference into Part III of this Form 10-K. With the exception of the portions of the Proxy Statement specifically incorporated herein by reference, the Proxy Statement is not deemed to be filed as part of this Form 10-K.


TABLE OF CONTENTS

PART I

ITEM 1.


Business


3Business


2
      General2
    OneBeacon 3
      OneBeacon    White Mountains Re 414
      White Mountains Re16
    Esurance 24
      Other Operations 2827
      Investments 29
      Regulation 31
      Ratings 3435
      Employees 3436
      Available Information 3436
ITEM 1A.Risk Factors36
ITEM 1B.Unresolved Staff Comments42
ITEM 2. Properties 3442
ITEM 3. Legal Proceedings 3543
ITEM 4. Submission of Matters to a Vote of Security Holders 3643


Executive Officers of the Registrant and its Subsidiaries


3644

PART II

ITEM 5.


Market for the Company's Common Equity, Related Shareholder Matters and Issuer PurchasePurchases of Equity Securities


3845
ITEM 6. Selected Financial Data 3946
ITEM 7. Management's Discussion and Analysis of Financial Condition and Results of Operations 4047
      Non-GAAP Financial Measures55
    Liquidity and Capital Resources55
    Related Party Transactions 64
      Critical Accounting Estimates    Liquidity and Capital Resources 6465
      Forward-Looking Statements    Transactions With Related Persons 7974
    Critical Accounting Estimates74
    Forward-Looking Statements95
ITEM 7A. Quantitative and Qualitative Disclosures About Market Risk 8096
ITEM 8. Financial Statements and Supplementary Data 8199
ITEM 9. Changes in and Disagreements withWith Accountants on Accounting and Financial Disclosure 8199
ITEM 9A. Controls and Procedures 8199
ITEM 9B. Other Information 8299

PART III

ITEM 10.


Directors and Executive Officers


82Directors, Executive Officers and Corporate Governance


99
ITEM 11. Executive Compensation 8299
ITEM 12. Security Ownership of Certain Beneficial Owners and Management and Related Stockholder Matters 82100
ITEM 13. Certain Relationships and Related Transactions, and Director Independence 83100
ITEM 14. Principal AccountantAccounting Fees and Services 83100

PART IV

ITEM 15.


Exhibits, Financial Statement Schedules, and Reports on Form 8-K


83Exhibits and Financial Statement Schedules


100

CERTIFICATIONS


C-1


PART I

Item 1.    Business

GENERAL

        White Mountains Insurance Group, Ltd. (the "Company" or the "Registrant") was originally formed as a Delaware corporation in 1980. In October 1999, the Company completed a corporate reorganization that changed its domicile from Delaware to Bermuda. The Company'sis an exempted Bermuda limited liability company whose principal businesses are conducted through its subsidiaries and affiliates in the businesses of property and casualty insurance and reinsurance.reinsurance subsidiaries and affiliates. Within this report, the term "White Mountains" is used to refer to one or more entities within the consolidated organization, is referred to as "White Mountains".the context requires. The Company's headquarters are located at Bank of Butterfield Building, 42 Reid Street, Hamilton, Bermuda HM 12, its principal executive office is located at 80 South Main Street, Hanover, New Hampshire 03755-2053 and its registered office is located at Clarendon House, 2 Church Street, Hamilton, Bermuda HM 11. White Mountains' reportable segments are OneBeacon, White Mountains Re, Esurance and Other Operations.

        The OneBeacon segment consists of the OneBeacon Insurance Group, LLCLtd. ("OneBeacon Ltd."), an exempted Bermuda limited liability company that owns a family of companies (collectively "OneBeacon"), which are U.S.-based property and casualty insurance writers,companies (collectively "OneBeacon"), substantially all of which operate in a multi-company pool. OneBeacon offers a wide range of specialty, personalcommercial and commercialpersonal products and services sold primarily through select independent agents.agents and brokers. OneBeacon was acquired by White Mountains in 2001 from Aviva plcplc. ("Aviva"), formerly CGU) on June 1, 2001CGNU, (the "OneBeacon Acquisition"). During the fourth quarter of 2006, White Mountains sold 27.6 million, or 27.6%, of OneBeacon Ltd.'s common shares in an initial public offering (the "OneBeacon Offering"). As of December 31, 2007, White Mountains owned 72.9% of OneBeacon Ltd's outstanding common shares.

        The White Mountains Re segment consists of White Mountains Re Group, Ltd., an exempted Bermuda limited liability company, and its subsidiaries.subsidiaries (collectively, "White Mountains Re"). White Mountains Re offers leadreinsurance capacity for reinsurance on most liability, property, andcasualty, accident & health, agriculture, aviation and space, and certain other exposures on a worldwide basis through its reinsurance subsidiaries, Folksamerica Reinsurance Company (together with its parent, Folksamerica Holding Company, "Folksamerica"("Folksamerica"), which has been a wholly-owned subsidiary of White Mountains since 1998) and Sirius International Insurance Corporation ("Sirius International"). On April 16, 2004, and White Mountains acquired Sirius Insurance Holdings Sweden AB and its subsidiariesRe Bermuda Ltd. ("Sirius") from ABB Ltd. (the "Sirius Acquisition"). The principal companies acquired were Sirius International, Sirius America Insurance Company ("Sirius America")WMRe (Bermuda)", which provides primary insurance programs in the United States, and Scandinavianformerly Fund American Reinsurance Company, Ltd. ("Scandinavian Re"), a reinsurance company that has been in run-off since 2002.. White Mountains Re also provides reinsurance advisory services, specializing primarily in international property and marine excessother short-tailed lines of reinsurance, through White Mountains Re Underwriting Limited (domiciled in Ireland and formed in 2001) andServices Ltd. ("WMRUS"). During the third quarter of 2006, White Mountains Underwriting (Bermuda) Limited, formedRe sold one of its subsidiaries, Sirius America Insurance Company ("Sirius America"), to an investor group. As part of the transaction, White Mountains acquired an equity interest of approximately 18% in 2003 (collectively, "WMU"the acquiring entity, Lightyear Delos Acquisition Corp. ("Delos")., and accounts for Delos on the equity method within its Other Operations segment.

        The Esurance segment consists of Esurance Holdings, Inc., and its subsidiaries (collectively, "Esurance"). Esurance which has been a unit of White Mountains since October 2000, marketssells personal auto insurance directly to customers online and through select online agents.

        White Mountains' Other Operations segment consists of the Company and its intermediate holding companies, its wholly-owned investment management subsidiary, White Mountains Advisors LLC ("WM Advisors"), its weather risk management business ("Galileo"), its variable annuity reinsurance business, White Mountains Life Reinsurance (Bermuda) Ltd. ("WM Life Re"), as well as the International American Group, Inc. (the "International American Group"). and various other entities not included in the other segments. The International American Group, which was acquired by White Mountains in 1999, consists of American Centennial Insurance Company ("American Centennial") and British Insurance Company of Cayman ("British Insurance Company"), both of which are in run-off.

        On November 30, 2004, The Other Operations segment also includes White Mountains completed a significant corporate reorganization. As partMountains' investments in common shares and warrants to purchase common shares of Symetra Financial Corporation ("Symetra"), its investments in Delos and Pentelia Investment Ltd. ("Pentelia") and the consolidated results of the reorganization, ownership of Folksamerica was transferred to White Mountains Re from Fund American Companies, Inc. ("Fund American"), which remains OneBeacon's parent. As a result, the legal organization of White Mountains' subsidiaries is consistent with its main operating businesses (i.e., OneBeacon, White Mountains ReTuckerman Capital, LP and Esurance), and White Mountains Re is now a cohesive,


global reinsurance organization. The reorganization also allows White Mountains to independently manage the financial structures of its main operating segments.Tuckerman Capital II, LP funds (the "Tuckerman Funds").


White Mountains' Operating Principles

        White Mountains strives to operate within the spirit of four operating principles. These are:

        Underwriting Comes First.    An insurance enterprise must respect the fundamentals of insurance. There must be a realistic expectation of underwriting profit on all business written, and demonstrated fulfillment of that expectation over time, with focused attention to the loss ratio and to all the professional insurance disciplines of pricing, underwriting and claims management.


        Maintain a Disciplined Balance Sheet.    The first concern here is that insurance liabilities must always be fully recognized. Loss reserves and expense reserves must be solid before any other aspect of the business can be solid. Pricing, marketing and underwriting all depend on informed judgment of ultimate loss costs and that can be managed effectively only with a disciplined balance sheet.

        Invest for Total Return.    Historical insurance accounting has tended to hide unrealized gains and losses in the investment portfolio and over rewardover-reward reported investment income (interest and dividends). Regardless of the accounting, White Mountains must invest for the best growth in after-tax value over time. In addition to investing our bond portfolios for total after-tax return, that will also mean prudent investment in a balanced portfolio consistent with leverage and insurance risk considerations.

        Think Like Owners.    Thinking like owners has a value all its own. There are stakeholders in a business enterprise and doing good work requires more than this quarter's profit. But thinking like an owner embraces all that without losing the touchstone of a capitalist enterprise.


ONEBEACON

        On June 1, 2001, White Mountains purchased CGU Corporation from Aviva and renamed the company OneBeacon. HeadquarteredOneBeacon, whose United States headquarters is in Boston,Canton, Massachusetts, OneBeacon is one of the oldesta property and casualty insurers in the United States, tracing its roots to 1831 and the Potomac Fire Insurance Company. OneBeacon's legacy includes being among the first to issue automobile policies, honoring claims arising from the great San Francisco earthquake and the sinkinginsurance writer that provides a range of the Titanic,specialty insurance products as well as insuring several U.S. presidents.

a variety of segmented commercial and personal insurance products. With roots dating back to 1831, OneBeacon has been placing business for more than 175 years through independent insurance agencies, its primary distribution channel. At December 31, 20042007 and 2003,2006, OneBeacon had $10.0$9.5 billion and $11.3$9.9 billion of total assets, respectively, and shareholder's equity of $2.3$1.9 billion and $2.2$1.8 billion, respectively. At December 31, 2007 and 2006, White Mountains recorded $517 million and $491 million of minority interest related to its ownership in OneBeacon. OneBeacon wrote approximately $1.9 billion and $2.0 billion in net written premiums in 2007 and 2006, respectively. As of February 28, 2008, OneBeacon's principal operating insurance subsidiaries are rated "A" (Excellent, the third highest of fifteen ratings) by A.M. Best aand "A" (Strong, the sixth highest of twenty-one ratings) by Standard & Poor's, rating agency which specializesagencies that specialize in the insurance and reinsurance industry.


Property and Casualty Insurance Overview

        Generally, property and casualty insurance companies write insurance policies in exchange for premiums paid by itstheir customers (the insured). An insurance policy is a contract between the insurance company and the insured where the insurance company agrees to pay for losses suffered by the insured that are covered under the contract. Such contracts often are subject to subsequent legal interpretation by courts, legislative action and arbitration. Property insurance generally covers the financial consequences of accidental losses to the insured's property, such as a home and the personal property in it, or a business' building, inventory and equipment. Casualty insurance (often referred to as liability insurance) generally covers the financial consequences of a legal liability of an individual or an organization resulting from negligent acts and omissions causing bodily injury and/or property damage to a third party. Claims on property coverage generally are reported and settled in a relatively short period of time, whereas those on casualty coverage can take years, even decades, to settle.


        Insurance companies derive substantially all of their revenues from earned premiums, investment income and net gains and losses from sales of investment securities. Earned premiums represent premiums received from insureds, which are recognized as revenue over the period of time during whichthat insurance coverage is provided (i.e., ratably over the life of the policy). A significant period of time normally elapses between the receipt of insurance premiums and the payment of insurance claims. During this time, investment income is generated, consisting primarily of interest earned on fixed maturity investments and dividends earned on equity securities. Net realized investment gains and losses result from sales of securities from the insurance companies' investment portfolios.

        Insurance companies incur a significant amount of their total expenses from policyholder losses, which are commonly referred to as "claims". In settling policyholder losses, various loss adjustment expenses ("LAE") are incurred, such as insurance adjusters' fees and litigation expenses. In addition, insurance companies incur policy acquisition expenses, such as commissions paid to agents and premium taxes, and other expenses related to the underwriting process, including compensation and benefits for professional and clerical staff.

        The key measure of relative underwriting performance for an insurance company is the combined ratio. An insurance company's combined ratio under accounting principles generally accepted in the United States ("GAAP") is calculated by adding the ratio of incurred loss and LAE to earned premiums (the "loss and LAE ratio") and the ratio of commissions, premium taxes


policy acquisition and other underwriting expenses to earned premiums (the "expense ratio"). A combined ratio under 100% indicates that an insurance company is generating an underwriting profit. However, when considering investment income and investment gains or losses, insurance companies operating at a combined ratio of greater than 100% can be profitable.


Lines of Business

        OneBeacon providesOneBeacon's business is managed through three major underwriting units: specialty lines, insurance productscommercial lines and a variety of segmentedpersonal lines. OneBeacon's specialty lines businesses are national in scope, while its commercial and personal lines insurance products (for individuals)businesses have been concentrated primarily in the Northeastern United States.

        For the twelve months ended December 31, 2007, 2006 and commercial2005, OneBeacon's net written premiums by line of business were as follows:

Net written premiums by line of business
 Year Ended December 31,
Millions

 2007
 2006
 2005
Specialty $446.2 $437.6 $548.8
Commercial  727.7  718.3  654.4
Personal  690.4  800.6  910.2
Run-off  .1  1.1  7.7


Total $1,864.4 $1,957.6 $2,121.1


        OneBeacon has builtOneBeacon's specialty lines underwriting unit is a collection of niche businesses by providing customized coverages to certain niche markets. These specialtythat focus on solving the unique needs of particular customer groups on a national scale. Each of these businesses are not subject to extreme competitive market conditions and are distinct in their product design. Each specialty business has its ownmaintains stand-alone operations and distribution channels that targettargeting their specific customer groups. OneBeacon provides distinct products and offers tailored coverages and services, managed by teams of market specialists. OneBeacon's specialty lines insurance products include the following:businesses include:


        OneBeacon offered additional rural and farm related products through National Farmers Union Property and Casualty Company ("NFU") until its sale on September 30, 2005 and commercial farm and ranch and commercial agricultural products through its Agri division until the sale of the renewal rights of its policies on September 29, 2006.

        For the twelve months ended December 31, 2007, 2006 and 2005, OneBeacon's specialty lines net written premiums were as follows:

Specialty lines net written premiums
 Year Ended December 31,
Millions

 2007
 2006
 2005
OBPP $213.9 $179.3 $149.5
IMU  158.6  139.9  133.6
Other on-going specialty lines  73.7  53.7  49.2


 Total on-going specialty lines  446.2  372.9  332.3
NFU(1)      132.5
Agri(1)    64.7  84.0


Total specialty lines $446.2 $437.6 $548.8


(1)
OneBeacon sold NFU on September 30, 2005 and sold the renewal rights to its Agri division policies on September 29, 2006.

        OneBeacon provides insurance solutions for middle market and small businesses through products that target particular industry groups with customized coverages and services. OneBeacon has begun to expand selectively into new geographic territories that align well with OneBeacon's approach to target specific customer segments.

        OneBeacon's middle market accounts typically produce annualized gross premiums ranging from $25,000 to $1,000,000 and principally purchase "package" policies (combination policies offering property and liability coverage). OneBeacon targets 14 distinct customer groups including technology, financial institutions, professional services, wholesalers, metalworkers and commercial real estate, among others. OneBeacon also produces some standard commercial business that is not targeted to a resultspecific industry group. By partnering with its specialty lines businesses, OneBeacon's middle market commercial lines business can deliver a seamless, comprehensive insurance solution. OneBeacon has also formed strategic partnerships with specialized insurance agencies to offer OneBeacon coverage to targeted customer groups such as technology companies and community banks.

        Included in the middle market division of an illness, accident or certain other causes.

��
Excess and surplus property:OneBeacon is OneBeacon Specialty Property ("OBSP"). Formed in 2004, OBSP provides excess property covers the insuredcoverage against certain damages over and above those covered by primary policies. Surpluspolicies or a large self-insured retention. Target classes include apartments and condominiums, commercial real estate, small-to-medium manufacturing, retail/wholesale and public entity and educational institutions. OBSP has a preference for principally low catastrophe-exposed risks. However, OBSP is exposed to large catastrophes, like Hurricane Katrina, that may cause losses to insured property provides specialized insurance coverage in instances where such coverage is unavailable from insurers licensedexcess of its policies' attachment points. OBSP manages its catastrophic wind, earthquake and terrorism risks within a particular state.the OneBeacon entered thecatastrophe management programs, including individual risk and portfolio-loss modeling and reinsurance protection. OneBeacon's excess andproperty solutions are provided primarily through surplus lines propertywholesalers in all 50 states and the District of Columbia.


        OneBeacon also markets package, automobile, workers compensation and umbrella coverage to small businesses, which typically generate annualized premiums ranging from $500 to $25,000. OneBeacon targets 14 industry groups as well as some association and group businesses with products that provide a highly competitive solution for select agents. OneBeacon's small-business growth strategy is to target insurance networks of suburban and rural agents who represent a strong customer base in those areas. OneBeacon's proprietary web platform has expedited underwriting at the point of sale, which has enabled growth in new territories while limiting the need for much incremental infrastructure. In the first quarter of 2006, OneBeacon introduced a small business in 2004.

service center to handle customer administration for enrolled agents.

        OneBeacon's personal lines coverages include homeowners insurance, segmented private passenger automobile and package policies sold through select independent agents. In addition, OneBeacon provides management services for a fee to reciprocal exchanges. OneBeacon's focus on commercial lines is to write property, liability, automobile and other related lines for small and mid-sized businesses for specific industry segments. While its personal and commercial businesses are subject to more competitive pressures, OneBeacon believes that through proper segmentation in product design and rating, OneBeacon has created certain specialty niches in these segments. OneBeacon's objective is to underwrite only profitable business without regard to market share or premium growth. OneBeacon's personal and commercial lines insurance products include the following:include:

        For the years ended December 31, 2007, 2006 and 2005, commercial lines net written premiums were as follows:

Commercial lines net written premiums
 Year Ended December 31,
Millions

 2007
 2006
 2005
Middle market excluding OBSP $557.6 $564.8 $531.6
OBSP  32.2  51.2  43.6


 Total middle market  589.8  616.0  575.2
Small business  137.9  102.3  79.2


Total commercial lines $727.7 $718.3 $654.4


        OneBeacon's personal lines underwriting unit provides homeowners insurance, segmented private passenger automobile and package policies (package products are combination policies offering home and automobile coverage with optional umbrella, boatowners and other coverages) sold through select independent agents. OneBeacon refers to this business, management services provided to reciprocal insurance exchanges and the consolidation of reciprocal insurance exchanges described below, as traditional personal lines.

        In 2004, OneBeacon created a highly segmented product suite, called OneChoice, under which it is able to offer the appropriate risk-adjusted product and pricing to its customers. OneChoice is a multi-tiered product suite that enables OneBeacon to offer a broader range of coverages to a full spectrum of customers through more sophisticated pricing models that have a greater statistical correlation between historical loss experience and price than traditional pricing models. This product suite offers both automobile and homeowners coverages as well as package policies. OneChoice products rely on multiple, objective pricing tiers and rules-based underwriting that enable agents to offer OneBeacon solutions to a broad array of its customers and increase OneBeacon's market penetration. OneBeacon


regularly refines its product features and rating plans to optimize target market production. Ease of use is a critical aspect of this business. Agents can access OneChoice through either OneBeacon's proprietary agent portal or through comparative rating engines. The availability of multiple channels to access OneBeacon's product offerings provides increased opportunities for new business.

        Within OneBeacon's personal lines underwriting unit, OneBeacon also provides management services for a fee to three reciprocal insurance exchanges ("reciprocals") that OneBeacon has created and capitalized by lending the reciprocals funds in exchange for surplus notes. Reciprocals are not-for-profit, policyholder-owned insurance carriers organized as unincorporated associations. As required by GAAP, White Mountains' consolidated financial statements reflect the consolidation of these reciprocals (SeeNote 18—"Variable Interest Entities").

        OneBeacon's personal lines products include:


            For the twelve months ended December 31, 2004, 2003 and 2002, OneBeacon's net written premiums by line of business were as follows:

     
     Year Ended December 31,
    Net written premiums by line of business

     2004
     2003
     2002
     
     ($ in millions)

    Specialty $848.5 $733.7 $696.6
    Personal  724.7  676.8  845.2
    Commercial  807.1  426.7  454.6
    Other lines(1)  78.8  135.3  526.4


    Total $2,459.1 $1,972.5 $2,522.8


    (1)
    Other lines of business for 2004 are primarily from premiums written by reciprocal insurance exchanges administered by OneBeacon, while Other lines of business for 2003 and 2002 are primarily from business assumed from Liberty Mutual Insurance Group ("Liberty Mutual").

      Specialty Lines

            OneBeacon's specialty businesses include a LAD service provider (AutoOne Insurance), rural and farm related products (offered through National Farmers Union Property and Casualty Company, "NFU"), ocean marine (offered through International Marine Underwriters, "IMU"), medical errors and omissions (offered through OneBeacon Professional Partners, "OBPP"), agricultural ("Agri"), and other specialty products, such as tuition reimbursement. Additionally, in 2004, OneBeacon entered into the excess and surplus lines property business with the introduction of OneBeacon Specialty Property ("OBSP"). For the twelve months ended December 31, 2004, 2003 and 2002, OneBeacon's specialty lines net written premiums were as follows:

     
     Year Ended December 31,
    Specialty lines net written premiums

     2004
     2003
     2002
     
     ($ in millions)

    AutoOne Insurance $263.1 $233.8 $246.9
    National Farmers Union Property & Casualty  178.5  169.0  165.5
    International Marine Underwriters  136.5  125.7  109.0
    OneBeacon Professional Partners  119.5  68.7  28.7
    Agricultural  83.6  84.0  103.0
    OneBeacon Specialty Property  19.2    
    Other  48.1  52.5  43.5


    Total specialty lines $848.5 $733.7 $696.6


            As a condition to its license to write automobile business within New York, an insurance carrier is obligated by statute to accept future assignments from the NYAIP, a residual insurance market that obtains personal automobile insurance for those individuals who cannot otherwise obtain it in the voluntary insurance market. Alternatively, an insurance carrier can contractually satisfy its NYAIP obligation by (1) transferring its NYAIP assignments to another insurance company, or (2) through utilization of various credits offered by New York to those insurers who voluntarily write policies for individuals in the NYAIP. The process of transferring NYAIP obligations is called Limited Assigned Distribution, and the companies that assume this obligation are called LAD servicing carriers. New Jersey and certain other states have similar programs for personal and commercial automobile.

            In 2001, OneBeacon created AutoOne Insurance to provide LAD services and takeout credits to insurance companies required to accept future assignments from the NYAIP. In January 2004, AutoOne


    Insurance also began to handle NJ PAIP business as a LAD servicing carrier. New Jersey is now the second largest market in the United States for LAD servicing carriers, with nearly $300 million in NJ PAIP written premium over the last 12 months. Combined, the New York and New Jersey markets account for nearly 85 percent of personal automobile written premium serviced in the country through LAD servicing carriers. Additionally, AutoOne Insurance expects to begin writing LAD and commercial LAD business in several new states in 2005, including Pennsylvania, Texas, California, Connecticut, Vermont, Maine and Delaware.

            In late 2004, AutoOne Insurance introduced a multi-tiered private passenger auto product in New York. This sophisticated product utilizes underwriting tiers to move the price point higher or lower based on risk characteristics. The tiered structure is a key element in the design, as it provides the flexibility needed to adjust to changing market and competitor conditions.

            During 2004, OneBeacon entered the excess and surplus lines property business through its new OBSP division, which is focused on providing solutions for the excess property market. This new business is developing a portfolio with attachment points and policy limits tailored to specific business-class and market conditions. Target classes include schools and universities, municipalities, habitational risks (apartment/condos.), real estate and related classes (offices buildings, shopping centers), retail, wholesale (warehousing), builders risks and other inland marine classes.

            Since 2001, OneBeacon has expanded its specialty businesses to seven companies which represent 35% of OneBeacon's total net written premiums in 2004.

      Personal Lines

            OneBeacon's personal lines principally include automobile, homeowners and Custom-Pac products (Custom-Pac products arecustomized combination policies offering home and automobile coverage with optional umbrella and boatowners and other coverages).coverage.

            OneBeacon's mix of personal lines products betweenunderwriting unit also includes AutoOne Insurance ("AutoOne"). Formed in 2001, AutoOne is a market leader in "assigned risk" business in New York. Assigned risk plans provide automobile insurance for individuals unable to secure coverage in the voluntary market. Insurance carriers are obliged to accept future assignments from state assigned risk pools as a condition of maintaining a license to write automobile business in the state. However, carriers may satisfy their assigned risk obligation by transferring their assignments to another insurer or by utilizing various "credits" (i.e. take-out, territorial and homeowners, including Custom-Pac products,youthful driver credits). AutoOne offers services known as Limited Assigned Distribution, or LAD, and Commercial Limited Assigned Distribution, or CLAD, and credit programs to insurance carriers. While AutoOne was 67%able to expand its product offerings to an additional 12 states in 2006, its overall volume of business decreased due to a significant decrease in the involuntary market in New York and 25%, respectively,New Jersey, where the majority of AutoOne's assigned risk business is generated. AutoOne now provides 28 LAD and CLAD programs in 22 states where assigned risk obligations may be assumed by a servicing carrier under a negotiated fee arrangement.

            AutoOne also writes "voluntary take-out business" (policies "taken out" of the assigned risk pool and written in the voluntary market) by selecting policies from the assigned risk business it manages for its clients and from select insurance brokers to replace its clients assigned risk policy with an AutoOne policy. AutoOne receives credits for all policies taken out of the assigned risk plan which it can use either to reduce its future assigned risk obligations, or to sell to other carriers that can use the credits to reduce their own quota obligations. In 2007, AutoOne wrote more take-out business than all other carriers in New York combined and all of its take-out credits were sold to other carriers or used internally to reduce OneBeacon's own assigned risk quota obligation.

            For the years ended December 31, 2007, 2006 and 2005, personal lines net written premium during 2004, compared to 63%premiums were as follows:

    Personal lines net written premiums
     Year Ended December 31,
     
    Millions

     
     2007
     2006
     2005
     
    Traditional excluding reciprocals $338.0 $492.7 $618.8 
    Reciprocals(1)  221.3  93.2  43.5 


     Traditional personal lines  559.3  585.9  662.3 
    AutoOne  134.6  222.6  248.8 
    Other(2)  (3.5) (7.9) (.9)


    Total personal lines $690.4 $800.6 $910.2 


    (1)
    Adirondack Insurance Exchange, a reciprocal insurance exchange, began writing new and 30%, respectively, during 2003 and 69% and 24%, respectively, during 2002. OneBeacon writes the majority of itsrenewing traditional personal business in New York, Massachusetts and Maine.

            During 2004, OneBeacon launched a new multi-tiered product, OneChoice,lines policies in the Northeast. OneChoice enables OneBeacon to offer a broader rangesecond half of coverages by allowing it to develop more sophisticated pricing models that have a greater statistical correlation2006.

    (2)
    Represents elimination between historical loss experiencetraditional personal lines and price than traditional pricing models have shown. OneBeacon believes this product will enable it to profitably expand in selected markets throughout the United States.

      Commercial Lines

            OneBeacon's commercial lines products principally include multi-peril, commercial automobile and workers compensation, which represented 54%, 23% and 14%, respectively, of commercial lines net written premium during 2004, compared to 55%, 23% and 8%, respectively, during 2003 and 52%, 29% and 14%, respectively, during 2002.

            On March 31, 2004, OneBeacon acquired Atlantic Specialty Insurance Company ("Atlantic Specialty"), a subsidiary of Atlantic Mutual Insurance Company ("Atlantic Mutual"), and the renewal rights to Atlantic Mutual's segmented commercial insurance business, including the unearned premiums on the acquired book (the "Atlantic Specialty Transaction"). The overall gross written premium for this book of business totals approximately $400 million. This transaction has allowed OneBeacon to sell a highly segmented product to small and mid-sized companies on an industry basis. These industries include but are not limited to technology, professional services, printers and wholesalers.

    AutoOne.


            During the third quarter of 2004, OneBeacon entered into an agreement to sell the renewal rights to most of its pre-Atlantic Mutual New York commercial business to Tower Insurance Group. The transaction, effective with December 1, 2004 renewals, will impact approximately $110 million of premiums. OneBeacon will retain the commercial business acquired from Atlantic Mutual.

            OneBeacon's other lines include the results of reciprocal insurance exchanges that are included in OneBeacon's GAAP results and also business assumed from Liberty Mutual.

            Reciprocal insurance exchanges are policyholder-owned insurance associations. As part of a restructuring of its New Jersey personal lines, in 2002, OneBeacon formed New Jersey Skylands Management LLC to provide management services for a fee to the New Jersey Skylands Insurance Association, a reciprocal exchange, and its wholly owned subsidiary New Jersey Skylands Insurance Company (together, the "Association"). The Association began writing personal automobile coverage for new customers in August 2002. Additionally, during 2004, OneBeacon formed Houston General Management Company to provide management services for a fee to another reciprocal exchange, Houston General Insurance Exchange (the "Exchange"). OneBeacon has no ownership interest in the Association or the Exchange. As a result of accounting literature changes, OneBeacon began consolidating the results of reciprocal insurance exchanges on March 31, 2004 (SeeNote 15—Variable Interest Entities in the accompanying Consolidated Financial Statements). Net written premiums written by the Association and the Exchange that were included in OneBeacon's 2004 results totaled $75.0 million.

            On November 1, 2001, OneBeacon transferred its regional agency business, agents and operations in 42 states and the District of Columbia to Liberty Mutual pursuant to a renewal rights agreement (the "Liberty Agreement"). This transfer amounted to approximately 45% of OneBeacon's total business at the time of transfer. The Liberty Agreement expired on October 31, 2003. As a result, OneBeacon earned premium in 2004 on policies written prior to the expiration, but did not write any new premiums in 2004 under the Liberty Agreement. Net written premiums assumed under the Liberty Agreement were $130.4 million in 2003 and $496.7 million in 2002.


    Geographic Concentration

            OneBeacon's net written premiums are derived solely from business produced in the United States. Business from specialty, personal and commercial lines was produced in the following states:


     Year Ended December 31,
     
     Year Ended December 31,
     
    Specialty, personal and commercial net written premiums by state

     Specialty, personal and commercial net written premiums by state

     
    2004
     2003
     2002
      2007
     2006
     2005
     
    New York 30%36%38%New York 22%27%27%
    Massachusetts 17 20 19 Massachusetts 16 17 17 
    CaliforniaCalifornia 8 9 7 
    New Jersey 9 3 8 New Jersey 8 8 9 
    California 8 2 2 
    Maine 6 2 7 Maine 6 6 6 
    Connecticut 5 5 4 Connecticut 6 5 5 
    Other(1) 25 32 22 Other(1) 34 28 29 


    Total 100%100%100%


     Total 100%100%100%


    (1)
    No individual state is greater than 3% of specialty, personal andor commercial net written premiums for the years ended December 31, 2004, 20032007, 2006 and 2002.2005.


    Marketing

            OneBeacon offers its products thoughthrough a combinationnetwork comprised of independent insurance agents, regional and national brokers wholesalers and captive agents (through NFU). In total, OneBeacon haswholesalers. OneBeacon's distribution relationships consist of approximately 2,0002,840 select agencies and brokers. No agency and distribution relationships.or broker produced more than 3% of OneBeacon's direct written premiums during 2007.

            OneBeacon's specialty lines businesses are located in separatemanaged from locations logistically appropriate to their target markets. AutoOne Insurance issuesOBPP is based in Avon, Connecticut and distributes its LAD businessproducts through independent agents, generating takeout credits (inselect national and regional brokers and agents. IMU is headquartered in New York only)City and operates through this business to sell to other insurance carriers subject to NYAIP assignments. IMU distributes itsnine branch locations throughout the United States. Its products are distributed through a network of select agents that specialize in the ocean marine business. AgriDewar's affiliate, A.W.G. Dewar Agency, which is headquartered in Quincy, Massachusetts, distributes tuition refund products to independent schools and colleges throughout North America. A&H conducts business through independent agents and brokers and selectively markets directly to customers. GRS distributes its products through independent agencies. NFU distributes itsagents and brokers.

            The majority of OneBeacon's commercial and personal lines products primarily through a network of exclusive agents. Substantially all of these exclusive agents are under contract with NFU and the National Farmers Union, a non-profit organization founded in 1902 to advance the interests of family farmers. OBPP distributes its products nationally through excess and surplus lines brokers. OBSP's excess property solutions are provided primarily through surplus lines wholesalers. Through these distribution channels, OneBeacon leverages its knowledge about specialty markets to provide products and services that are tailored to meet customer needs.

            OneBeacon distributes its personal and commercial lines productsdistributed through select independent insurance agents. OneBeacon protects the integrity of its franchise value by selectively appointing agents that demonstrate business and geographic profiles that align with its target markets and specialized capabilities. OneBeacon believes that independent insurance agents provideadd value because they conduct more complete assessments of their clients' needs, which in turn results in more appropriate coverages and prudent risk management. OneBeacon also believes that independent agents will continue to be a significant force in overall industry premium production.production including the facilitation of cross-selling of specialty, commercial and personal business products. OneBeacon's commercial lines middle-market business, OBSP, provides its excess property solutions primarily through surplus lines wholesalers. In New York, AutoOne personal lines business generates take-out credits by writing policies from select insurance brokers that were previously in the New York Automobile Insurance Plan, or NYAIP. AutoOne sells these credits to insurance companies subject to NYAIP assignments. AutoOne markets its LAD and CLAD services and New York take-out credits directly to insurance carriers seeking assigned risk solutions.

            Each year, OneBeacon designates its top performing agencies as "Lighthouse Partners", a program designed to strengthen these priority relationships and build those books of business. This program was introduced in the second quarter of 2006 and provides enhanced benefits such as priority account handling, access to OneBeacon's entire franchise of products, preferred profit-sharing opportunities, and priority access to OneBeacon's producer development school and co-op advertising program. There were 95 agencies that achieved this designation in 2007. OneBeacon's Lighthouse Partners represent fewer than 3% of OneBeacon's agencies but write approximately 20% of OneBeacon's business and over 20% of OneBeacon's new business. OneBeacon believes that its Lighthouse Partners are the core of its distribution and marketing system and that this deeper mutual commitment will benefit both these agencies and OneBeacon.


    Underwriting and Pricing

            OneBeacon believes that there must be a realistic expectation of attaining an underwriting profit on all the business it writes, as well as a demonstrated fulfillment of that expectation over time. Adequate pricing is a critical component to the achievement offor achieving an underwriting profit and requiresprofit. OneBeacon will underwrite its book with a disciplined approach towards pricing its insurance products. Inadequate pricing can be caused by pressures from: (1) insurance companies selling their products at rates less than those acceptable to OneBeacon because they either underestimate ultimate claim costs or overestimate the amount of investment income and investment gains they will earn on premiums collected before claims are paid, (2) insurance companiesis willing to acceptforgo a lower returnbusiness opportunity if it believes that the opportunity is not priced appropriately to the exposure.

            Specialization—or a heightened focus on investmentcertain customer groups and/or geographies through products, pricing and expertise—is a key driver of OneBeacon's strategy in specialty lines and is being extended into OneBeacon's commercial and personal businesses. The proprietary knowledge OneBeacon develops regarding the industry, class and risk characteristics provides it with a competitive edge for their stakeholders thanits terms and conditions on individual accounts. OneBeacon (3) insurance companies seekingbelieves that specialization will result in superior returns as compared to increase revenues and market share by reducing the price of their products beneath levels acceptable toa more "generalist" underwriting approach.

            OneBeacon (4) the emergence and continued growth of insurance company competitors that have lower cost structures, and (5) state regulation, legislation and judicial mandates.

            Beginning in 2003 and continuing through 2004, OneBeacon introducedhas used tiered rating plans since 2003 in both its personalcommercial and commercialpersonal lines, which permit OneBeaconpermits it to offer more tailored price pointsquotes to its customers based on underwriting criteria applicable to each tier. As a result, OneBeacon now has the flexibility to renew expiring policies into the appropriate tier rather than being forced to choose to either renew the policy at the same base rate or cancel the policy. Management believes that this significant improvement in theThe enhanced accuracy and precision of OneBeacon's rate plans movesenable it towardto more confidently price its products to the pricing sophisticationexposure, and thereby permits its agency partners to deliver solutions to a broader range of the best insurance underwriters in the market.customers.

            These tiers are just one example of OneBeacon's segmented underwriting and pricing strategy. Segmentation is a key driver of OneBeacon's success in specialty lines and is being carried over into personal and commercial lines. OneBeacon develops proprietary knowledge about a given industry/class/risk type which provides it with a competitive edge when offering terms and conditions on individual accounts. OneBeacon believes this will deliver superior returns versus a more "generalist" underwriting approach.


            OneBeacon also monitors pricing activity on a weekly basis and regularly measures usage of tiers, credits, debits and limits; this includes monthly review calls with all field offices.limits. In addition, itOneBeacon regularly updates base rates to achieve targeted returns on surpluscapital and attempts to shift writings away from price inadequate lines/classes.lines and classes where pricing is inadequate. To the extent changes in premium rates, policy forms or other matters are subject to regulatory approval, OneBeacon proactively monitors its pending regulatory filings to facilitate, to the extent possible, their prompt processing and approval. Lastly, OneBeacon expends considerable effort to measure and verify exposure basesexposures and insured values.


    Competition

            Property and casualty insurance is highly competitive and extensively regulated by state insurance departments.competitive. In specialty lines, OneBeacon competes with numerous regional and national insurance companies, most notably The Robert Plan Corporation, The Chubb Corporation, American International Group, The St. Paul Travelers Companies, Inc. and the regional Farm Bureaus.CNA Financial Corporation. In personalcommercial and commercialpersonal lines, OneBeacon competes with numerous regional and national insurance companies, most notably The St. Paul Travelers Companies, Inc., Zurich InsuranceFinancial Services Group, CNA Financial theCorporation, Hartford Financial Services Group, Allmerica Financial Corporation,Inc., The Hanover Insurance Group, Inc., W.R. Berkley Corporation, The Chubb Corporation, The Progressive Insurance,Corporation, Allstate Insurance Company and Liberty Mutual.Mutual Insurance Company ("Liberty Mutual"). The more significant competitive factors for most insurance products offered by OneBeacon offers are price, product terms and claims service, which OneBeacon believes is the most important product differentiation that it brings to its agents and insureds.service. OneBeacon's underwriting principles and dedication to independent agency distribution are unlikely to make themit the low-cost provider in most markets. However, while it is often difficult for insurance companies to differentiate their products to consumers, OneBeacon believes that its dedication to providing superior product offerings, expertise and local talent, claims service and localizeddisciplined underwriting experience gives itprovide a competitive advantage over typical low-cost providers.


    Claims Management

            Effective claims management is a critical factor in achieving satisfactory underwriting results. OneBeacon maintains an experienced staff of appraisers, medical specialists, managers, staff attorneys and field adjusters strategically located throughout its operating territories. OneBeacon also maintains a special investigative unit designed to detect insurance fraud and abuse, and supportsupports efforts by regulatory bodies and trade associations to curtail the cost of fraud.

            OneBeacon's claims department's commitment to improvement is producing positive results. In 2004, OneBeacon made several operational changes in the claims department. Claims are now separately organized by specialty, and commercial, lines, personal lines and run-off operations. This segmentation has allowedapproach allows OneBeacon to increase loss cost management specializationbetter identify and better identifymanage claims handling costs. In addition, a shared claims service unit manages costs related to both staff and vendors. OneBeacon introducedtakes a total claims cost management practice whichapproach that gives equal importance to controlling claims handling costs,expenses, legal expenses and claims payments, enabling OneBeaconit to lower its overall claims handling costs. At the same time, over 97%sum of OneBeacon's insuredsthe three. This approach requires the utilization of approximately fifty metrics to monitor the effectiveness of various programs implemented to lower total loss cost. The metrics are designed to guard against the implementation of an expense containment program that respondedwill cost OneBeacon more than it expects to surveys were satisfied by the service provided by OneBeacon.save.


            OneBeacon's claims department utilizes a modern claims workstation implemented in 2002, that in addition to recordingrecords reserves, payments and adjuster activity and assists each claimsclaim handler in evaluating bodily injury claims, determining liability and identifying fraud. OneBeacon's commitment and performance in fighting insurance fraud not only reduceshas reduced claim costs but hasand aided law enforcement.enforcement investigations. Under its staff counsel program, OneBeacon's Staff Counsel Program, in-house attorneys defended 55%defend the majority of its newly arising suits at anew lawsuits, which has resulted in savings when compared to the cost of $8.0 million less than it would have cost to use outside counsel. OneBeacon's internal legal bill audit team saved an additional $6.2 million by reducing legal invoices submitted byusing outside counsel.

            Calender year reported claims in OneBeacon's ongoing businesses were down 19% in 2004 compared to 2003. This allowed the claims department personnel to increase their focus on older open claims. At December 31, 2004, total open claims were down 22% from December 31, 2003.


            Calendar year reported claims in OneBeacon's run-off operations were 1,800 in 2007 compared to 2,400 in 2006, a 25% reduction, in part due to the lapse of time and the nature of run-off wereoperations. These levels of reported claims are down from 3,400 in 2005, 5,900 in 2004 compared to 10,300and 64,800 in 2003. Total open claims infor run-off operations were 5,500 at December 31, 2004 were 14,6002007 compared to 28,5007,300 at December 31, 2003,2006, a 49% reduction. This number includes25% reduction, which reflects the success of OneBeacon's focus on settling claims from its run-off operations. Total open claims for run-off operations were 10,200 in 2005, 14,600 in 2004 and 33,000 in 2003. These numbers included all of the run-off claims that were previously handled by Liberty Mutual as a Third Party Administrator ("TPA"TPA") pursuant to a renewal rights agreement (the "Liberty Agreement"). The majorityUnder the Liberty Agreement, which expired on October 31, 2003, OneBeacon transferred its regional agency business, agents and operations in 42 states and the District of Columbia to Liberty Mutual. Most of OneBeacon's claims for run-off operations are handled by in-house adjustersadjusters.

            In connection with the exception of certain claims of certain businesses in run-off. Additionally,OneBeacon Acquisition, Aviva caused OneBeacon to purchase a reinsurance contract from the National Indemnity Company ("NICO") is used as a TPA forto help protect against potential asbestos and environmental reinsurance("A&E") claims relating to the pre-acquisition period (the "NICO Cover"). See the discussion in the "Reinsurance Protection" section below. NICO Cover (see "Asbestos and Environmental Reserves" discussion included inCRITICAL ACCOUNTING ESTIMATES inManagement's Discussion and Analysis of Financial Condition and Results of Operations below). OneBeaconhas retained a TPA, Resolute New England ("Resolute"), formerly Cavell USA, to manage the claims processing for A&E claims reinsured under the NICO Cover. OneBeacon's claims department personnel are consulted by NICO and Resolute on major claims. As with all TPAs, claims department personnel perform claim audits on NICOResolute to ensure their controls, processes and settlements are appropriate. For more information regarding OneBeacon's A&E exposures, see the "Asbestos and Environmental Reserves" discussion included in "CRITICAL ACCOUNTING ESTIMATES" in "Management's Discussion and Analysis of Financial Condition and Results of Operations".

            During the year, OneBeacon identified additional areas in claims processing which will be continuously improved in 2005, including litigation management, expense managementReinsurance Protection and staff productivity.


    Terrorism

            Since the terrorist attacks of September 11, 2001 (the "Attacks"), OneBeacon has sought to mitigate the risk associated with any future terrorist attacks by reducing the insured value of policies written in geographic areas with a high concentration of exposure to losses from terrorist attacks or by seeking to exclude coverage for such losses from their policies.

            On November 26, 2002, President Bush signed the Terrorism Risk Insurance Act (the "Terrorism Act") establishing a federal "backstop" for commercial property and casualty losses, including workers compensation, resulting from acts of terrorism by or on behalf of any foreign person or foreign interest. The Terrorism Act requires primary commercial insurers to make terrorism coverage available immediately and provides Federal protection above individual company retention and aggregate industry retention levels. OneBeacon estimates its individual retention level for commercial policies subject to the Terrorism Act to be approximately $160.0 million in 2005. Aggregate industry retention levels are $15.0 billion for 2005. The Federal government will pay 90% of covered terrorism losses that exceed either OneBeacon's or the industry's retention levels up to $100.0 billion. The fate of the Terrorism Act beyond 2005 remains uncertain. It is anticipated that Congress will likely rule on a possible extension during the summer of 2005; however, there is a chance that the Terrorism Act could expire on December 31, 2005. To prepare for that possibility, OneBeacon is notifying customers (in states where permitted) with policies that expire in 2006 of the potential implications to their coverage. OneBeacon's current property and casualty catastrophe reinsurance programs provide coverage for "non-certified" events as defined under the Terrorism Act, provided such losses are not the result of a nuclear, biological or chemical attack. See the discussion in the"Reinsurance Protection" section below for a further description of OneBeacon's catastrophe program.

            OneBeacon closely monitors and manages its concentration of risk by geographic area. Beginning in 2002 and continuing through 2004, OneBeacon aggressively reduced its terrorism exposure in the largest metropolitan areas in which OneBeacon writes insurance by implementing a strategy that limits total probable maximum loss ("PML") from a terrorism event in any half mile radius. (PML is a statistical modeling technique that measures a company's catastrophic exposure as the maximum probable loss in a given time period.) The addition of the Atlantic Mutual book in 2004 resulted in some areas exceeding corporate PML thresholds. In these areas, specific account exposure reduction plans have been established to bring exposures within tolerance levels by the end of 2005. The financial exposure of potential new business is evaluated when it is located in an area of existing concentration or individually presents significant terrorism exposure. Additionally, formal reports are generated quarterly to validate that action adheres to corporate standards. As a result, OneBeacon believes that it has taken appropriate actions to mitigate its exposure to losses from future terrorist attacks and will


    continue to monitor its terrorism exposure in the future. Nonetheless, risks insured by OneBeacon, and those contemplated by the enacted Terrorism Act, remain exposed to future terrorist attacks and the possibility remains that any future terrorist losses could prove to be material to the Company's financial position and/or its cash flows.


    Reinsurance Protection
    Catastrophe Management

            In the ordinary course of its business, OneBeacon purchases reinsurance from high-quality, highly rated third party reinsurers in order to provide diversification of its business and minimize loss from large risks or catastrophic events. OneBeacon uses PML forecasting to quantify its exposure to catastrophic losses.

            The timing and size of catastrophe losses are unpredictable and the level of losses experienced in any year could be material to OneBeacon's operating results and financial position. Examples of catastrophes include losses caused by hurricanes, earthquakes, wildfires hurricanes and other types of storms and terrorist acts. The extent of losses caused by catastrophes is both a function of the amount and type of insured exposure in an area affected by the event and the severity of the event. OneBeacon continually assesses and implements programsuses models (primarily AIR V.9) to estimate the losses its exposures would generate under various scenarios as well as the probability of those losses occurring. OneBeacon uses these model outputs in conjunction with other data to manage its exposure to catastrophe losses through individual risk selection and by limiting its concentration of insurance written in catastrophe-prone areas, such as coastal regions. In addition, OneBeacon imposes wind deductibles on existing coastal windstorm exposures. OneBeacon'sOneBeacon believes that its largest singlesingle-event natural catastrophe risk is Northeast windstorm.exposures are Northeastern United States windstorms and California earthquakes.

            OneBeacon seeks to further reduce its exposure topotential loss from catastrophe lossesexposures through the purchase of catastrophe reinsurance. Effective July 1, 2004,2007, OneBeacon renewed its normal property catastrophe reinsurance program to cover its full estimated PML (one-in-250 year) through June 30, 2005.2008. The program provides coverage for all of OneBeacon's property business including automobile physical damage, as well as terrorism coverage for non-Terrorism Risk Insurance Act of 2002 (the "Terrorism Act") events (excluding nuclear, biological, chemical and radiological). Under that cover,the program, the first $200.0$150 million of losses resulting from anya single catastrophe are retained by OneBeacon and losses from a single event in excess of $200.0$650 million and up to $850.0 million are reinsured for 100% of the loss.next $700 million of losses resulting from the catastrophe are reinsured. Any loss above $850 million would be retained by OneBeacon. In the event of a catastrophe, OneBeacon can reinstate itsOneBeacon's property catastrophe reinsurance program is reinstated for the remainder of the original contract term by paying a reinstatement premium whichthat is based on the percentage of coverage reinstated and the original property catastrophe coverage premium. OneBeacon anticipates this $850 million limit is sufficient to cover Northeast windstorm losses with a 0.4%-0.5% probability of occurrence (1-in-250-year event to 1-in-200-year event) based on OneBeacon's catastrophe modeling. Actual losses incurred by OneBeacon resulting from any particular catastrophic event may be substantially different than modeled losses from such event.


            OneBeacon's property catastrophe reinsurance program does not cover personal or commercial property losses resulting from nuclear, biological or chemical terrorist attacks. The program covers personal property losses resulting from other types of terrorist attacks,"certified" events as defined under the Terrorism Act, such as foreign terrorism, provided such losses were not caused by nuclear biological or chemical means. The program also covers personal and commercial property losses resulting from other types of domestic terrorist attacks or"non-certified" events not "certified" as defined under the Terrorism Act. The Terrorism Act, provides protection for commercial propertysuch as domestic terrorist attacks, provided such losses for certified events including those arising fromwere not caused by nuclear, biological or chemical attacks.means.

            OneBeacon also purchases individual property reinsurance coverage for certain risks to reduce large loss volatility. The Property per Riskproperty-per-risk reinsurance program reinsures losses in excess of $5.0$5 million up to $75.0$100 million. IndividualOneBeacon may purchase individual risk facultative reinsurance may be purchased above $75.0$100 million where OneBeacon deems it appropriate.in certain circumstances. The Property per Riskproperty-per-risk treaty also reinsuresprovides one limit of reinsurance protection for losses in excess of $10.0$10 million up to $75.0$100 million on an individual risk basis for terrorism losses. However, nuclear, biological and chemical events are not covered.

            OneBeacon also maintains a casualty reinsurance program whichthat provides protection for individual risk or catastrophe losses involving workers compensation, general liability, automobile liability or automobileumbrella liability in excess of $5.0$6 million up to $60.0$81 million. This program provides one full $55.0 million limitcoverage for either "certified" or "non-certified" terrorism losses but does not provide coverage for losses resulting from nuclear, biological or chemical attacks.

            In connection with the OneBeacon Acquisition in 2001, Aviva caused OneBeacon to purchase reinsurance contracts with two reinsurance companies rated "AAA" (Extremely Strong)("Extremely Strong", the highest of twenty-one ratings) by Standard & Poor's and


    "A+ "A++" (Superior)("Superior", the highest of fifteen ratings) by A.M. Best: a full risk-transfer cover fromBest. One contract is the NICO forCover, which entitles OneBeacon to recover up to $2.5 billion in oldultimate loss and LAE incurred related primarily to A&E claims arising from business written by OneBeacon's predecessor prior to 1992 for asbestos claims and 1987 for environmental claims (the "NICO Cover") and an adverse developmentclaims. As of December 31, 2007, OneBeacon has ceded estimated incurred losses of approximately $2.1 billion to the NICO Cover. The other contract is a reinsurance cover fromwith General Reinsurance Corporation ("GRC") for up to $400.0$570 million onof additional losses occurring inon all claims arising from accident years 2000 and prior (the "GRC Cover"). As of December 31, 2007, OneBeacon has ceded estimated incurred losses of $550 million to the GRC Cover. Pursuant to the GRC Cover, OneBeacon is not entitled to recover losses to the full contract limit if such losses are reimbursed by GRC more quickly than anticipated at the time the contract was signed. OneBeacon intends to only seek reimbursement from GRC for claims which result in payment patterns similar to those supporting the recoverables recorded pursuant to the GRC Cover. The economic cost of not submitting certain other eligible claims to GRC is primarily the investment spread between the rate credited by GRC and the rate achieved by OneBeacon on its investments. This cost, if any, is expected to be small.

            Reinsurance contracts do not relieve OneBeacon of its obligation to its ceding companies.policyholders. Therefore, collectibility of balances due from its reinsurers is critical to OneBeacon'sits financial strength. SeeNote 4 "Third—"Third Party Reinsurance"Reinsurance" in the accompanying Consolidated Financial Statements for a discussion of the largest balances due from OneBeacon's top reinsurers.

    Terrorism

            Since the terrorist attacks of September 11, 2001 (the "Attacks"), OneBeacon has sought to mitigate the risk associated with any future terrorist attacks by limiting the aggregate insured value of policies in geographic areas with exposure to losses from terrorist attacks. This is accomplished by either limiting the total insured values exposed, or, where applicable, through the use of terrorism exclusions.

            In December of 2007, the United States government extended the Terrorism Act until December 31, 2014. The Terrorism Act was originally enacted in 2002 and established a Federal "backstop" for commercial property and casualty losses, including workers compensation, resulting from acts of terrorism by or on behalf of any foreign person or foreign interest. As extended, the law now covers domestic acts of terrorism. The law limits the industry's aggregate liability by requiring the Federal government to share 85% of certified losses once a company meets a specific retention or deductible as determined by its prior year's direct written premiums and limits the aggregate liability to be paid by the government and industry without further action by Congress at $100.0 billion. In exchange for this "backstop", primary insurers are required to make coverage available to commercial insureds for losses from acts of terrorism as specified in the Terrorism Act. The following types of coverage are excluded from the program: commercial automobile, burglary and theft, surety, farmowners multi-peril and all professional liability coverage except directors and officers coverage.


            OneBeacon estimates its individual retention level for commercial policies subject to the Terrorism Act to be approximately $170 million in 2008. The aggregate industry retention level is $27.5 billion in 2008. The Federal government will pay 85% of covered terrorism losses that exceed OneBeacon's or the industry's retention levels in 2008 up to a total of $100.0 billion.

            The catastrophe reinsurance protection that OneBeacon currently has obtained provides coverage for "non-certified" events as defined under the Terrorism Act, provided such losses are not the result of a nuclear, biological or chemical attack. See the discussion in the "Reinsurance Protection and Catastrophe Management" section above for a further description of OneBeacon's catastrophe program.

            OneBeacon closely monitors and manages its concentration of risk by geographic area. OneBeacon's guideline is to control its exposures so that its total maximum expected loss from a likely terrorism event within any half-mile radius in a metropolitan area or around a target risk will not exceed $200 million, or $300 million in all other areas. OneBeacon monitors its terrorism exposures from existing policies on a quarterly basis, and the exposure of potential new business located in areas of existing concentration or that individually present significant exposure is evaluated during the underwriting process. As a result, OneBeacon believes that it has taken appropriate actions to limit its exposure to losses from terrorist attacks and it will continue to monitor its terrorism exposure in the future. Nonetheless, risks insured by OneBeacon, including those covered by the Terrorism Act, remain exposed to terrorist attacks and the possibility remains that losses resulting from future terrorist attacks could prove to be material to OneBeacon.

    Loss and Loss Adjustment Expense Reserves

            OneBeacon establishes loss and LAE reserves that are estimates of amounts needed to pay claims and related expenses in the future for insured events that have already occurred. The process of estimating reserves involves a considerable degree of judgment by management and, as of any given date, is inherently uncertain. See "CRITICAL ACCOUNTING ESTIMATES" in "Management's Discussion and Analysis of Financial Condition and Results of Operations" for a full discussion regarding OneBeacon's loss reserving process.

            The following information presents (1) OneBeacon's reserve development over the preceding tenseven years and (2) a reconciliation of reserves in accordance with accounting principles and practices prescribed or permitted by insurance authorities ("Statutory" basis) to such reserves determined in accordance with GAAP, each as prescribed by Securities Act Industry Guide No. 6.

            Section I of the ten year table shows the estimated liability that was recorded at the end of each of the indicated years for all current and prior accident year unpaid lossesloss and LAE. The liability represents the estimated amount of lossesloss and LAE for claims that were unpaid at the balance sheet date, including incurred but not reported ("IBNR") reserves. In accordance with GAAP, the liability for unpaid lossesloss and LAE is recorded in the balance sheet gross of the effects of reinsurance with an estimate of reinsurance recoverables arising from reinsurance contracts reported separately as an asset. The net balance represents the estimated amount of unpaid lossesloss and LAE outstanding as of the balance sheet date, reduced by estimates of amounts recoverable under reinsurance contracts.

            Section II shows the cumulative amount of net loss and LAE paid relating to recorded liabilities as of the end of each succeeding year. Section III shows the re-estimated amount of the previously recorded net liability as of the end of each succeeding year. Estimates of the liability for unpaid lossesloss and LAE are increased or decreased as payments are made and more information regarding individual claims and trends, such as overall frequency and severity patterns, becomes known. Section IIIIV shows the cumulative net (deficiency)/redundancy representing the aggregate change in the liability from original balance sheet dates and the re-estimated liability through December 31, 2004.2007. Section IVV shows the re-estimated gross liability and re-estimated reinsurance recoverables through December 31, 2004.2007. Section VVI shows the cumulative gross (deficiency)/redundancy representing the aggregate change in the liability between original balance sheet dates and the re-estimated liability through December 31, 2007.


    amount of net losses and LAE paid relating to recorded liabilities as of the end of each succeeding year.


     OneBeacon Loss and LAE(1),(3)
    Years Ended December 31,


     OneBeacon Loss and LAE
    Years Ended December 31,

     
    ($ in millions)

    ($ in millions)

     ($ in millions)

     June 1,
    2001(1)

     
    1994
     1995
     1996
     1997
     1998(2)
     1999
     2000
     2001
     2002
     2003
     2004
      2001
     2002
     2003
     2004
     2005
     2006
     2007
     
    I. Liability for unpaid losses and LAE:I. Liability for unpaid losses and LAE: $5,535.4 $5,844.4 $5,804.4 $5,655.9 $6,944.0 $6,368.8 $6,982.7 $8,425.2 $7,630.5 $6,241.2 $5,475.5 I. Liability for unpaid losses and LAE:                  
    Gross balance(2)Gross balance(2) $7,011.1 $8,425.2 $7,630.5 $6,237.7 $5,465.3 $5,713.4 $5,108.2 $4,718.8 
    Less: reins. recoverables on unpaid losses and LAELess: reins. recoverables on unpaid losses and LAE  (1,069.8) (1,307.4) (1,260.4) (1,159.2) (1,651.9) (1,285.6) (1,276.4) (3,609.7) (3,560.6) (2,984.0) (2,714.7)Less: reins. recoverables on unpaid losses and LAE  (2,316.7) (3,609.7) (3,560.6) (2,980.4) (2,704.5) (3,382.0) (3,079.7) (2,850.6)


    Net balanceNet balance $4,465.6 $4,537.0 $4,544.0 $4,496.7 $5,292.1 $5,083.2 $5,706.3 $4,815.5 $4,069.9 $3,257.2 $2,760.8 Net balance $4,694.4 $4,815.5 $4,069.9 $3,257.3 $2,760.8 $2,331.4 $2,028.5 $1,868.2 


    II. Net liability re-estimated as of:                                  
    II. Cumulative net amount of liability paid through:II. Cumulative net amount of liability paid through:                  
    1 year later  4,494.1  4,584.7  4,627.8  5,370.1  5,305.3  5,901.2  4,815.8  4,872.9  4,216.7  3,357.4   1 year later  1,288.1 1,891.3 1,656.6 1,463.5 1,239.3 1,004.6 769.8  
    2 years later  4,552.1  4,667.1  5,476.0  5,424.7  5,985.4  5,013.5  4,913.7  5,155.0  4,337.0       2 years later  2,661.2 3,100.5 2,834.2 2,374.6 1,926.2 1,547.8     
    3 years later  4,642.8  5,460.6  5,549.0  5,965.0  5,002.8  5,001.5  5,384.7  5,244.0          3 years later  3,715.3 4,039.6 3,598.1 2,910.0 2,356.9       
    4 years later  5,406.5  5,510.6  5,924.8  4,980.5  4,932.1  5,297.5  5,429.3             4 years later  4,480.6 4,634.2 4,049.5 3,236.0         
    5 years later  5,431.8  5,779.5  4,948.0  4,911.8  5,117.6  5,243.4                5 years later  4,950.8 4,980.6 4,317.8           
    6 years later  5,632.0  4,794.7  4,900.4  5,069.3  5,006.1                   6 years later  5,233.4 5,197.1             
    7 years later  4,658.7  4,749.4  5,028.9  4,902.3                      7 years later  5,415.0               
    8 years later  4,625.6  4,871.8  4,867.4                           


    9 years later  4,744.2  4,714.2                            
    10 years later  4,593.1                               


    III. Cumulative net (deficiency)/redundancy $(127.5)$(177.2)$(323.4)$(405.6)$286.0 $(160.2)$277.0 $(428.5)$(267.2)$(100.3)$ 
    Percent (deficient)/redundant  (2.9)% (3.9)% (7.1)% (9.0)% 5.4% (3.2)% 4.9% (8.9)% (6.6)% (3.1)% %


    IV. Reconciliation of net liability re-estimated as of the end of the latest re-estimation period (see II. above):                                  
    Gross re-estimated liability  5,559.2  5,893.0  5,996.2  5,898.5  6,574.0  6,545.8  6,730.0  8,830.6  7,878.1  6,331.6   
    Less: gross re-estimated reinsurance recoverable  (966.0) (1,178.8) (1,128.8) (996.2) (1,567.9) (1,302.4) (1,300.7) (3,586.6) (3,541.1) (2,974.2)  


    Net re-estimated liability $4,593.1 $4,714.2 $4,867.4 $4,902.3 $5,006.1 $5,243.4 $5,429.3 $5,244.0 $4,337.0 $3,357.4 $ 


    V. Cumulative net amount of liability paid through:                                  
    III. Net liability re-estimated as of:III. Net liability re-estimated as of:                  
    1 year later  1,390.1  1,476.6  1,591.9  1,687.3  1,815.2  1,966.5  2,007.9  1,892.0  1,656.7  1,463.7   1 year later  4,759.0 4,872.9 4,216.7 3,357.4 2,855.8 2,354.3 1,980.2  
    2 years later  2,240.8  2,372.6  2,621.3  2,735.4  2,954.8  3,136.2  3,213.8  3,101.3  2,834.7       2 years later  4,899.7 5,155.0 4,337.0 3,480.5 2,858.1 2,387.2     
    3 years later  2,821.9  3,083.3  3,331.1  3,518.0  3,709.2  3,882.3  4,057.3  4,040.5          3 years later  5,348.4 5,244.0 4,453.3 3,496.3 2,945.3       
    4 years later  3,328.3  3,571.3  3,872.2  4,044.0  4,125.9  4,394.5  4,677.2             4 years later  5,423.0 5,327.4 4,473.6 3,620.5         
    5 years later  3,672.7  3,961.5  4,233.4  4,282.8  4,421.0  4,736.0                5 years later  5,489.2 5,348.9 4,605.5           
    6 years later  3,978.3  4,225.4  4,398.1  4,464.4  4,627.2                   6 years later  5,499.1 5,477.5             
    7 years later  4,186.9  4,329.4  4,516.6  4,584.6                      7 years later  5,613.4               
    8 years later  4,265.6  4,416.0  4,609.4                           


    IV. Cumulative net (deficiency)/redundancyIV. Cumulative net (deficiency)/redundancy $(919.0)$(662.0)$(535.6)$(363.2)$(184.5)$(55.8)$48.3  

    Percent (deficient)/redundant

    Percent (deficient)/redundant


    (19.6

    )%


    (13.7

    )%


    (13.2

    )%


    (11.2

    )%


    (6.7

    )%


    (2.4

    )%


    2.4

    %


    9 years later  4,335.6  4,485.7                              


    V. Reconciliation of net liability re-estimated as of the end of the latest re-estimation period (see III. above):V. Reconciliation of net liability re-estimated as of the end of the latest re-estimation period (see III. above):                  

    Gross re-estimated liability

    Gross re-estimated liability


    $

    9,893.4


    $

    10,108.9


    $

    9,182.5


    $

    7,513.0


    $

    6,467.0


    $

    5,793.1


    $

    5,055.0


    Less: gross re-estimated reinsurance recoverable

    Less: gross re-estimated reinsurance recoverable


    (4,280.0

    )


    (4,631.4

    )


    (4,577.0

    )


    (3,892.5

    )


    (3,521.7

    )


    (3,405.9

    )


    (3,074.8

    )


    10 years later  4,392.9                                 


    Net re-estimated liabilityNet re-estimated liability $5,613.4 $5,477.5 $4,605.5 $3,620.5 $2,945.3 $2,387.2 $1,980.2  


    VI. Cumulative gross (deficiency)/redundancyVI. Cumulative gross (deficiency)/redundancy $(2,882.3)$(1,683.7)$(1,552.0)$(1,275.3)$(1,001.7)$(79.7)$53.2  

    Percent (deficient)/redundant

    Percent (deficient)/redundant


    (41.1

    )%


    (20.0

    )%


    (20.3

    )%


    (20.4

    )%


    (18.3

    )%


    (1.4

    )%


    1.0

    %


    (1)
    In 1998, OneBeacon was formed asbecame a resultwholly-owned subsidiary of a pooling of interests between Commercial Union and General Accident. All historical balances have been restated as though the companies had been merged throughout the periods presented.White Mountains on June 1, 2001.

    (2)
    In 1998, OneBeacon acquired Houston General Insurance Company and NFU. All liabilities related to these entities have been shown from the acquisition date forward in this table.

    (3)
    This table reflects the effects of the NICO Cover and the GRC Cover as if they had been in effect for all periods presented.

            The cumulative net (deficiency)/redundancyAmounts reported in the table above reflects reinsurance recoverables recorded in connection with the OneBeacon Acquisition under the NICO Cover and the GRC Cover. SeeNote 4, "Third Party Reinsurance" in the accompanying Consolidated Financial Statementsdo not include adjustments for a description of the NICO Cover and the GRC Cover. These covers apply to losses incurred in 2000 and prior years. As a result, they have the effect of significantly increasing OneBeacon's reinsurance recoverables in 2001 and 2002 and reducing its reserve deficiency for each of the years presented priorpurchase accounting related to the OneBeacon Acquisition by the amount of the reserves ceded at the time these covers were purchased. See "Asbestos and Environmental Reserves" under "CRITICAL ACCOUNTING ESTIMATES" in"Management's Discussion and Analysis of Financial Condition and Results of Operations" for a discussion of the impact of the NICO Cover on OneBeacon's net loss and LAE reserve position. The table presented below represents OneBeacon's cumulative net deficiency without regard to the NICO Cover and the GRC Cover.

     
     Years Ended December 31,
     
    ($ in millions)

     
     1994
     1995
     1996
     1997
     1998
     1999
     2000
     2001
     2002
     2003
     2004
     
    Cumulative net deficiency adjusted for the NICO Cover and the GRC Cover $(1,831.1)$(1,906.6)$(2,076.5)$(2,194.9)$(1,560.9)$(2,092.3)$(1,788.0)$(428.5)$(267.2)$(100.3)$ 

    Percent deficient


    (41.0

    )%


    (42.0

    )%


    (45.7

    )%


    (48.8

    )%


    (29.5

    )%


    (41.2

    )%


    (31.3

    )%


    (8.9

    )%


    (6.6

    )%


    (3.1

    )%


    %


    Acquisition.

            The following table reconciles loss and LAE reserves determined on a Statutory basis to loss and LAE reserves determined in accordance with GAAP at December 31, as follows:


     December 31,
      Year Ended December 31,
     
    ($ in millions)

     
    2004
     2003
     2002
     
    Millions

     Year Ended December 31,
     
     
    Statutory reserves $4,413.4 $5,085.5 $6,029.0  $3,564.5 $3,863.9 $4,253.4 
    Reinsurance recoverable on unpaid losses and LAE(1) 1,046.8 1,197.5 1,650.9  1,190.9 1,280.5 1,455.2 
    Reserves allocated from other segments 44.5   
    Reserves allocated from other segments, net   41.6 
    Purchase accounting (238.5) (270.5) (317.5)
    Other(2) (29.2) (41.8) (49.4) (36.6) (36.2) (36.8)


    GAAP reserves $5,475.5 $6,241.2 $7,630.5  $4,480.3 $4,837.7 $5,395.9 


    (1)
    Represents adjustments made to add back reinsurance recoverables included with the presentation of reserves under Statutory accounting.

    (2)
    Primarily representsRepresents long-term workers compensation loss and LAE reserve discount recorded of $36.1 million, $38.0 million and $42.2 million in 2004, 2003 and 2002 in excess of statutorily defined discount.


    OneBeacon's Intermediate Holding Companies

            OneBeacon's intermediate holding companies include Fund American Enterprises Holdings, Inc. ("FAEH") and Fund American Companies, Inc. ("Fund American"), both U.S.-domiciled companies, as well as various intermediate holding companies domiciled in the United States, Gibraltar, Luxembourg and Bermuda.

            In May 2003, Fund American issued $700 million face value of senior unsecured debt through a public offering, at an issue price of 99.7% (the "Fund American Senior Notes"). The Fund American Senior Notes bear an annual interest rate of 5.9% until maturity in May 2013. White Mountains provides an irrevocable and unconditional guarantee as to the payment of principal and interest on the Fund American Senior Notes. OneBeacon Ltd. pays White Mountains a guarantee fee equal to 25 basis points per annum on the outstanding principal amount of the Fund American Senior Notes. If White Mountains' voting interest in OneBeacon Ltd.'s common shares ceases to represent more than 50% of all of OneBeacon Ltd.'s voting securities, OneBeacon Ltd. will seek to redeem, exchange or otherwise modify the Fund American Senior Notes in order to fully and permanently eliminate White Mountains' obligations under the guarantee. In the event that White Mountains' guarantee is not eliminated, the guarantee fee will increase over time up to a maximum of 450 basis points.

            As part of the financing for the OneBeacon Acquisition, Berkshire Hathaway Inc. ("Berkshire") invested a total of $300 million in cash, of which (1) $225 million was for the purchase of cumulative non-voting preferred stock of Fund American (the "Berkshire Preferred Stock"), which has a $300 million redemption value; and (2) $75 million was for the purchase of warrants to acquire 1,724,200 common shares of the Company. The Berkshire Preferred Stock is entitled to a dividend of no less than 2.35% per quarter and is mandatorily redeemable on May 31, 2008. During 2004, Berkshire exercised its warrants for $294 million in cash.

            Also as part of the financing of the OneBeacon Acquisition, Zenith Insurance Company purchased $20 million in cumulative non-voting preferred stock of FAEH (the "Zenith Preferred Stock"). The Zenith Preferred Stock received dividends of 2.5% per quarter through June 30, 2007. OneBeacon redeemed the Zenith Preferred Stock in the second quarter of 2007 for $20 million, its redemption value.

            In connection with the OneBeacon Offering, OneBeacon created two irrevocable grantor trusts and funded them with assets sufficient to provide for the remaining dividend and redemption payments for the $20 million Zenith Preferred Stock and the $300 million Berkshire Preferred Stock. Assets held in one of the trusts were used to repay the Zenith Preferred Stock in June 2007, while assets held in the remaining trust will be used to repay the Berkshire Preferred Stock in May 2008. The creation and funding of this trust did not legally defease the preferred stock or create any additional rights for the holders of the preferred stock, although the assets in the trust remain segregated from OneBeacon's other general assets and are not available for any use other than the payment of dividends and redemption of the Berkshire Preferred Stock. The assets held in trust remain subject to the claims of Fund American's creditors in the event that Fund American becomes insolvent.

            In connection with the OneBeacon Offering, Fund American established a $75 million revolving credit facility that matures in November 2011 (the "Fund American Bank Facility"). As of December 31, 2007, the Fund American Bank Facility was undrawn.

    WHITE MOUNTAINS RE

            During 2004, White Mountains formed White Mountains Re, which combined Folksamerica, Fund American Reinsurance Company, Ltd. ("Fund American Re") and WMU with the newly acquired Sirius to form a cohesive, global reinsurance organization.

            White Mountains Re offers lead capacityis a global multi-line reinsurance organization that provides reinsurance for reinsurance on most property, casualty, accident & health, agriculture, aviation and liabilityspace, and certain other exposures on a worldwide basis through its subsidiaries, Folksamerica, Sirius International and writes direct program insurance business through Sirius America. White Mountains Re also provides reinsurance advisory services through WMU, specializing in international property and marine excess reinsurance. White Mountains Re has offices in Belgium, Bermuda, Chicago, Connecticut, Dublin, Hamburg, London, Miami, New York, Singapore, Stockholm, Toronto and Zurich. At December 31, 2004 and 2003, White Mountains Re had $8.2 billion and $3.7 billion of total assets and $1.7 billion and $1.0 billion of shareholder's equity, respectively.


    WMRe (Bermuda). Folksamerica which became a wholly-owned subsidiary of White Mountains in 1998, is a multi-line property and casualty reinsurer that provides reinsurance to insurers primarily in the United States, Canada, Continental Europe, Latin America, the Caribbean and Japan. Folksamerica Re is rated "A" (Excellent, the third highest of fifteen ratings) by A.M. Best.

            On April 16, 2004, White Mountains completed the Sirius Acquisition, through which the principal operating companies acquired were Sirius International, and Sirius America. Stockholm-based Sirius Internationalwhich is the largest reinsurance company domiciled in Scandinavia based on gross written premiums, is a multi-line property and casualty reinsurer that provides reinsurance primarily in Europe, North America and AsiaAsia. During the third and isfourth quarters of 2007, White Mountains Re increased the largestcapital of WMRe (Bermuda), its class III Bermuda domiciled reinsurance company domiciled in Scandinavia (based on gross written premiums). Sirius America is a U.S.-based insurer that specializes in primary insurance programs.company. WMRe (Bermuda)'s capital as of December 31, 2007 was $776 million.

            WMRUS provides reinsurance underwriting advice and reinsurance portfolio analysis services to Sirius International and Folksamerica. In exchange for these services, WMRUS receives fee income on the business it refers.

            White Mountains Re has offices in Belgium, Bermuda, Chicago, Connecticut, Copenhagen, Hamburg, London, Miami, New York, Singapore, Stockholm, Toronto and Zurich.


            At December 31, 2007 and 2006, White Mountains Re had $7.4 billion and $7.3 billion of total assets and $1.9 billion and $2.1 billion of shareholder's equity, respectively. Folksamerica is rated "A-" (Excellent, the fourth highest of fifteen ratings) by A.M. Best and "A-" (Strong, the seventh highest of twenty-one ratings) by Standard & Poor's. Sirius America are bothInternational is rated "A" (Excellent, the third highest of fifteen ratings) by A.M. Best and "A-" (Strong, the seventh highest of twenty-one ratings) by Standard & Poor's. WMRe (Bermuda) is rated "A-" (Excellent, the fourth highest of fifteen ratings) by A.M. Best.

            White Mountains Re has completed several significant transactions involving interests in other insurance and reinsurance organizations. In most cases the transactions were acquisitions of entities that were owned by organizations that no longer considered them core businesses. Since 2000, White Mountains Re has completed the following significant transactions:

      On January 7, 2008, White Mountains Re acquired Helicon Re Holdings, Ltd. and its wholly-owned subsidiary, Helicon Reinsurance Company, Ltd. ("Helicon"), a Bermuda domiciled reinsurance company, for approximately $150 million in cash. White Mountains Re did not acquire any infrastructure or employees.

      On December 22, 2006, White Mountains Re acquired Mutual Service Casualty Insurance Company ("Mutual Service"), a Minnesota-domiciled, run-off insurer for $34 million in cash. Mutual Service was renamed Stockbridge Insurance Company ("Stockbridge") as part of a sponsored demutualization and conversion to a stock company which was formerly affiliated with Illinois-based Country Insurance & Financial Services ("Country"). As part of the transaction, Country provided Stockbridge with approximately $25 million of reinsurance protection in excess of Stockbridge's carried reserves as of September 30, 2006. White Mountains Re did not acquire any infrastructure or employees and is managing Stockbridge's run-off administration through the use of a TPA under White Mountains Re's direction. On October 1, 2007, substantially all of the assets and liabilities of Stockbridge were transferred to Folksamerica through a Transfer and Assumption Agreement (the "Portfolio Transfer"). As a result of the Portfolio Transfer, Stockbridge was left with minimum capital and surplus to maintain its licenses. During the fourth quarter of 2007, White Mountains Re sold its 100% ownership interest in Stockbridge to a third party for approximately $26 million.

      On August 2, 2006, White Mountains Re sold Sirius America to an investor group led by Lightyear Capital for $139 million in cash. As part of the transaction, White Mountains acquired an equity interest of approximately 18% in the acquiring entity and accounts for such interest under the equity method within its Other Operations segment.

      On November 11, 2004, White Mountains Re acquired Denmark-based Tryg-Baltica Forsikring, internationalt forsikringsselskab A/S ("Tryg-Baltica"). Following the closing, White Mountains Re placed Tryg-Baltica into run-off, with select business renewed by Sirius International. White Mountains Re did not acquire any infrastructure or employees and is managing the company's run-off administration.

      On April 16, 2004, White Mountains Re acquired Sirius Insurance Holdings Sweden AB and its subsidiaries from ABB Ltd. for SEK 3.27 billion (approximately $427.5 million). The principal companies acquired were Sirius International, Sirius America, which was subsequently sold in 2006, and Scandinavian Reinsurance Company, Ltd. ("Scandinavian Re"), a reinsurance company that has been in run-off since 2002.

      On March 31, 2004, White Mountains Re acquired the Sierra Insurance Group companies (the "Sierra Group"). Subsequent to the acquisition, the Sierra Group companies, which previously wrote mainly workers compensation business, were placed into run-off and all of the acquired companies' run-off claims administration was transferred to TPAs working under White Mountains Re's direction.

      Effective October 1, 2003, White Mountains Re acquired renewal rights to the property and casualty treaty reinsurance business of CNA Reinsurance ("CNA Re"), a division of CNA Financial Corporation (the "CNA Re Agreement"). Under the terms of the CNA Re Agreement, White Mountains Re payspaid CNA Re a renewal commission on the premiums renewed over the two contract renewal periods subsequent to October 1, 2003. The renewal commission is 3% for the initial renewal and 2% for the second renewal.

              In December 2001, White Mountains formed WMU, a reinsurance advisory company domiciled in Ireland. As part of a corporate reorganization, WMU established a sister company in Bermuda in June 2003. WMU provides reinsurance underwriting advice and reinsurance portfolio analysis services to both Folksamerica and Olympus Reinsurance Company Ltd. ("Olympus"). Prior to the Sirius Acquisition, WMU's Irish company, a specialist in handling non-marine property treaty excess of loss classes, expanded White Mountains Re's international profile, particularly in the United Kingdom, Continental Europe, Japan and Australia. WMU's Bermuda company specializes in excess reinsurance coverages for the marine and energy sector.

              Since 1999, in addition to the transactions discussed above, White Mountains Re has made the following acquisitions:

        On November 11, 2004, Sirius International acquired 100% of Denmark-based Tryg-Baltica Forsikring, internationalt forsikringsselskab A/S ("Tryg Baltica"). Following the closing, White Mountains Re placed Tryg Baltica into runoff, though it is anticipated that select business will be renewed by Sirius International. White Mountains Re did not acquire any infrastructure or employees and will manage the company's runoff administration.

        On March 31, 2004, Folksamerica acquired 100% of the Sierra Insurance Group companies (the "Sierra Group"). Subsequent to the acquisition, the Sierra Group companies, which previously wrote mainly workers compensation business, were placed into runoff and all of the acquired companies' runoff claims administration was transferred to TPAs working under White Mountains Re's direction.

        In 2002, FolksamericaWhite Mountains Re acquired 100% of Imperial Casualty and Indemnity Insurance Company, ("Imperial"), a company in run-off.

        In 2001, Fund AmericanWhite Mountains Re acquired substantially all of the international reinsurance operations of Folksam International Insurance Company and Folksamericaalso acquired 100% of C-F Insurance Company, ("C-F"), a company in run-off.

        In 2000, FolksamericaWhite Mountains Re acquired substantially all the reinsurance operations of Risk Capital Reinsurance Company ("Risk Capital") and 100% of PCA Property & Casualty Insurance Company ("PCA"), a company in run-off.

        In 1999, Folksamerica acquired 100% of USF Re Insurance Co. ("USF Re").


        Reinsurance Overview

                Reinsurance is an arrangement in which a reinsurance company (the "reinsurer") agrees to indemnify an insurance company (the "ceding company") for all or a portion of the insurance risks underwritten by the ceding company under one or more insurance policies. Reinsurance can benefit a ceding company in a number of ways, including reducing exposure on individual risks, providing catastrophe protections from large or multiple losses, and assisting in maintaining acceptable capital levels as well as financial and operating leverage ratios. Reinsurance can also provide a ceding company with additional underwriting capacity by permitting it to accept larger risks and underwrite a greater number of risks without a corresponding increase in its capital or surplus. Reinsurers may also purchase reinsurance, known as retrocessional reinsurance, to cover their own risks assumed from primary ceding companies. Reinsurance companies often enter into retrocessional agreements for many of the same reasons that ceding companies enter into reinsurance agreements.

                Reinsurance is generally written on a treaty or facultative basis. Treaty reinsurance is an agreement whereby the reinsurer assumes a specified portion or category of risk under all qualifying policies issued by the ceding company during the term of the agreement, usually one year. In theWhen underwriting of treaty reinsurance, the reinsurer does not evaluate each individual risk and generally accepts the original underwriting decisions made by the ceding insurer.company. Treaty reinsurance is typically written on either a quota shareproportional or excess of loss basis. A quota shareproportional reinsurance treaty is an arrangement whereby a reinsurer assumes a predetermined proportional share of the premiums and losses generated on specified business. An excess of loss treaty is an arrangement whereby a reinsurer assumes losses that exceed an agreeda specific retention of loss by the ceding company. Facultative reinsurance, on the other hand, is underwritten on a risk-by-risk basis, which allows the reinsurer to determine pricing for each exposure.

                White Mountains Re writes both treaty and facultative reinsurance, as well as direct business. The majority of White Mountains Re premiums are derived from proportional and excess of loss reinsurance contracts, which in 2007 amounted to 43% and 47%, respectively, of its total net written premiums, while primary direct business represented 10% of total net written premiums.

                A significant period of time normally elapses between the receipt of reinsurance premiums and the payment of reinsurance claims. While premiums are generally paid to the reinsurer upon inception of coverage, the claims process is delayed and generally begins upon the occurrence of an event causing an insured loss followed by: (1) the reporting of the loss by the insured to its broker or agent; (2) the reporting by the broker or agent to the ceding company; (2)(3) the reporting of the loss by the ceding company to its reinsurance intermediary or agent; (4) the reporting by the reinsurance intermediary or agent to the reinsurer; (3)(5) the ceding company's adjustment and payment of the loss; and (4)(6) the payment to the ceding company by the reinsurer. During this time, reinsurance companiesreinsurers generate investment income on premium receipts, consisting primarily of interest earned on fixed maturity investments and dividends earned on equity securities. The period of time between the receipt of premiums and the payment of claims is typically longer for a reinsurer than for a primary insurer.


        Classes of Business

        However, this difference is less significant for reinsurers like White Mountains Re writes three main classesthat write large volumes of reinsurance: liability,short-tailed coverage, or coverage where information about the insured claims is known relatively quickly after the coverage period, such as property and accident and health.reinsurance.

        Classes of Business

                The following table shows White Mountains Re's net written premiums by class of business for the years ended December 31, 2004, 20032007, 2006 and 20022005 were as follows:

         
         Year Ended December 31,
        Business class
        (Millions)

         2004
         2003
         2002
        Liability $524.5 $450.7 $344.2
        Property  432.1  314.6  252.2
        Accident and Health  151.6  88.4  68.1
        Other  138.1  32.0  23.7


         Total $1,246.3 $885.7 $688.2


         Year Ended December 31,
        Business class
        Millions

         2007
         2006
         2005
        Property catastrophe excess $188.4 $195.0 $178.6
        Property other  307.5  313.6  190.6
        Casualty  175.7  278.6  375.0
        Accident & health  178.8  229.1  169.7
        Agriculture  69.0  50.4  131.6
        Aviation and space  55.9  55.3  31.4
        Other(1)  120.4  167.9  227.2


         Total $1,095.7 $1,289.9 $1,304.1


        (1)
        Primarily consists of marine and credit and bonding business. Also includes $39 million and $87 million in 2006 and 2005, respectively, of net written premiums at Sirius America, which White Mountains Re sold in August of 2006.

                A description of White Mountains Re's classes of business and related lines of business follows:

          Property Catastrophe Excess

                Property catastrophe excess of loss treaties cover losses from catastrophic events. White Mountains Re writes a worldwide portfolio with the largest concentration of exposure in Europe, and seeks to set prices and terms on treaties wherever possible. The current U.S. book has a national focus supporting the lower and/or middle layers of large capacity programs. The exposures written in the international portfolio are diversified across many countries and regions.

          Property Other

                White Mountains Re is a leader in the broker market for property treaties written on a proportional and excess of loss basis and writes a limited number of large transactions with carefully chosen partners. In the United States, White Mountains Re's focus is primarily on proportional treaties in the excess & surplus lines segment of this market. The excess book contains similar excess & surplus exposures, complemented by a smaller amount of large national company and small regional company standard lines of business. The international book primarily consists of excess of loss, facultative and proportional treaty business in Europe. Over half of this business class is written on a proportional basis.

          Casualty

                White Mountains Re writes bothproportional and excess of loss reinsurance on commercial and non-standard automobile liability, general liability, professional liability, umbrella and workers compensation lines. Participation on longer tail business is mostly on a proportional basis, rather than excess of loss.

          Accident & Health

                White Mountains Re's accident & health business is composed of three major lines of business. In the largest line of business, White Mountains Re is a surplus lines insurer of international medical expenses written through International Medical Group, which is the agent writing on White Mountains Re's behalf. The second major line of business comprises proportional treaties covering employer medical stop loss for per person (specific) and per employer (aggregate) exposures. The third major line of business comprises medical, health and personal accident coverages written on an excess treaty and facultative basis.

          Agriculture

                White Mountains Re primarily provides proportional coverage to companies writing U.S. government-sponsored Multi-Peril Crop Insurance ("MPCI"). White Mountains Re's participation is net of the government's stop loss reinsurance protection. White Mountains Re also provides coverage for crop-hail and certain named perils when bundled with MPCI business.

          Aviation & Space

                Aviation insurance covers loss of or damage to an aircraft and the aircraft operations' liability to passengers, cargo and mail as well as to third parties. Additionally, liability arising out of non-aircraft operations such as hangars, airports and aircraft products can be covered. Space insurance covers loss of or damage to a satellite during launch and in orbit.

          Other

                Included in this class is marine, credit and contingency business written by Sirius International, proportional marine business written on a direct business. The majority ofbasis, a discontinued marine book and the run-off exposures from various acquisitions. White Mountains Re's premiumsA&E exposures are derived from treaty reinsurance contracts both on a quota share and an excess of loss basis, which in 2004 amounted to 55% and 34%, respectively, of its total net written premiums, while directthe run-off business represented 11% of total net written premium.acquired by Folksamerica.

                During the years ended December 31, 2004, 2003 and 2002,Bermuda Advisory Services

                White Mountains Re received no more than 10% ofhas been in the reinsurance advisory business since January 2002, through its grossBermuda-based subsidiary, WMRUS. WMRUS provides reinsurance premiums from any individual ceding company. Duringunderwriting advice and reinsurance portfolio analysis services to Sirius International and Folksamerica. In exchange for these services, WMRUS receives fee income on the years ended December 31, 2004, 2003 and 2002, White Mountains Re received approximately 51%, 58% and 57%, respectively, of its gross reinsurance written premiums from three major, third-party reinsurance brokers as follows: (1) AON Re—22%, 25% and 28%, respectively; (2) Benfield—16%, 19% and 14%, respectively; and (3) Guy Carpenter—13%, 14% and 15%, respectively.business it refers.


        Geographic Concentration

                The following table shows White Mountains Re's net written premiums by geographic region for the years ended December 31, 2004, 20032007, 2006 and 2002 were as follows:2005:


         Year Ended December 31,

         Year Ended December 31,
        Geographic region
        (Millions)

        2004
         2003
         2002
        Geographic region
        Millions

        Geographic region
        Millions

         Year Ended December 31,
        United StatesUnited States $846.7 $702.5 $529.8United States $696.7 $864.7 $878.9
        EuropeEurope 303.5 114.0 88.0Europe 306.8 314.4 315.6
        Canada, the Caribbean and Latin AmericaCanada, the Caribbean and Latin America 42.4 53.6 58.8Canada, the Caribbean and Latin America 21.1 37.8 47.2
        Asia and OtherAsia and Other 53.7 15.6 11.6Asia and Other 71.1 73.0 62.4


        Total $1,246.3 $885.7 $688.2Total $1,095.7 $1,289.9 $1,304.1


        Marketing

                White Mountains Re which conducts its reinsurance business through Folksamerica and Sirius International, obtains most of its reinsurance business from reinsurance brokers.intermediaries. Business submissions come from intermediaries that represent the ceding company. The process of placing an intermediary reinsurance program typically begins when a ceding company enlists the aid of a reinsurance intermediary in structuring a reinsurance program. The ceding company and the reinsurance intermediary will often consult with one or through submissions recommendedmore lead reinsurers as to the pricing and contract terms for the reinsurance protection being sought. Once the ceding company has approved the terms quoted by WMU.the lead reinsurer, the reinsurance intermediary will offer participation to qualified reinsurers until the program is fully subscribed. White Mountains Re considers both the reinsurance intermediary and the ceding company to be its clients in any placement. White Mountains Re has developed strong business relationships over a long period of time with the management of many of its ceding companies. The process of placing an intermediary reinsurance program typically begins when a ceding company enlists the aid of a reinsurance intermediary in structuring a reinsurance program. Often the ceding company and the broker will consult with one or more lead reinsurers as to the pricing and contract terms for the reinsurance protection being sought. Once the ceding company has approved the terms quoted by the lead reinsurer, the broker will offer participation to qualified reinsurers until the program is fully subscribed.

                White Mountains Re pays ceding companies a ceding commission under most quota shareproportional reinsurance treaties and some excess of loss reinsurance treaties. The ceding commission is generally based on the ceding company's cost of acquiring and administering the business being reinsured (commissions,(e.g., commissions, premium taxes and certain miscellaneous expenses). Additionally, White Mountains Re pays reinsurance intermediaries commissions based on negotiated percentages of the premium they produce. The reinsurance intermediary'sintermediaries' commissions constitute a significant portion of White Mountains Re's total acquisition costs.

                As mentioned above,During the years ended December 31, 2007, 2006 and 2005, White Mountains Re also writes direct program business through Sirius America, which beganreceived no more than 10% of its program insurance operationsgross written premiums from any individual ceding company. During 2007, 2006 and 2005, White Mountains Re received approximately 63%, 52% and 40%, respectively, of its gross reinsurance premiums written from three major, third-party reinsurance intermediaries as detailed in 1999. Sirius America works with managing general agents to produce U.S. based liability, property and accident & health insurance programs for small and mid-sized commercial accounts. Sirius America establishes strict underwriting guidelines,the following table:


         Year Ended December 31,
         
         
         2007
         2006
         2005
         
        AON Re 33%24%18%
        Guy Carpenter 17 12 8 
        Benfield 13 16 14 


          63%52%40%


        closely monitors all exposures and performs periodic on-site audits of the managing general agents to confirm compliance with established guidelines and procedures.


        Underwriting and Pricing

                White Mountains Re derives its business from a broad spectrum of ceding insurers including national, regional, specialty and excess and surplus lines writers, both in the United States and internationally. White Mountains Re determines which risks it accepts based on the anticipated underwriting results of the transaction, which are evaluated on a variety of factors including types of risk, the quality of the reinsured, the attractiveness of the reinsured's insurance rates and policy conditions and the adequacy of the proposed reinsurance terms.

                White Mountains Re's underwriters and pricing actuaries perform reviews of the underwriting, pricing, and general underwriting controls of potential clients before quoting contract terms for its reinsurance products. White Mountains Re prices its products by assessing the desired return on the expected capital needed to write a given contract and by estimating future loss and LAE costs. White Mountains Re accepts contracts that are anticipated to generate expected returns on capital and an underwriting profit. White Mountains Re's pricing indications are based on a number of underwriting factors including historical results, analysis of exposure and estimates of future loss costs, a review of other programs displaying similar exposure characteristics, the primary insurer's underwriting and claims experience and the primary insurer's financial condition. Folksamerica's underwriters and claims personnel perform regular audits on certain classes of business to monitor the ceding company's pricing and claim handling discipline. Sirius International's underwriters frequently communicate with ceding companies to discuss current terms and conditions. Additionally, White Mountains Re's finance staff reviews the financial stability and creditworthiness of certain ceding companies. Such reviews provide important input to support underwriting decisions.

                White Mountains Re and other reinsurance companies have sought to mitigate the risk associated with future terrorist attacks in a similar manner as primary insurers. Since the Attacks, reinsurers have attained significant price increases across all lines of reinsurance in response to greater perceived policy exposures. Reinsurers do not have the stringent regulations with respect to contract terms and policy exclusions which are generally imposed on primary writers. For example, the Terrorism Act is not applicable to reinsurers. As a result, exclusions are more often dictated by the marketplace than by regulation. White Mountains Re evaluates terrorism exposure to its ceding company clients and applies exclusions as appropriate. For example, reinsurance written on commercial risks subsequent to the Attacks generally contain clauses that exclude certified acts of terrorism. Reinsurance on personal risks written subsequent to the Attacks generally contain exclusions related to nuclear, biological and chemical attacks.


        Claims Management

                White Mountains Re maintains a staff of experienced reinsurance claim specialists that work closely with reinsurance intermediaries to obtain specific claims information from its customers. Folksamerica's claims staff also regularly perform on site claim reviews to assess and suggest improvements regarding the reinsured's claim handling ability and reserving techniques. In addition, all of White Mountains Re's claims specialists review loss information provided by the reinsured for adequacy. The results of these claim reviews are shared with the actuaries and underwriters to ensure that they are making the correct assumptions in pricing products and that all relevant information is used in establishing loss reserves.

                White Mountains Re also uses TPAs for certain other claims, including the direct program business written by Sirius America and run-off claims related to the Sierra and PCA acquisitions. White


        Mountains Re's claims staff performs on-site claim audits of certain TPAs to ensure the propriety of the controls and processes over claims serviced by the TPA.


        Competition

                In general, White Mountains Re competes for reinsurance business with other major global reinsurers, local reinsurers in certain markets and reinsurance divisions of direct insurance companies. Competition in the worldwide reinsurance market is influenced by a variety of factors, including financial strength ratings, prior history and relationships, as well as expertise and the speed at which the company has historically paid claims.

                Through Folksamerica, White Mountains Re competes with all of the larger U.S. reinsurance companies. As reported by the Reinsurance Association of America ("RAA") for the nine month period ending September 30, 2004, (the most recent data available), Folksamerica wrote approximately 6% of gross written premiums of all reinsurance companies that are viewed as direct competition. The reinsurance companies writing the largest portion of gross premiums in this period were: XL Reinsurance America (18%), Transatlantic Reinsurance Company (16%) and Everest Reinsurance Company (15%).

                Through Sirius International, the largest reinsurance company domiciled in Scandinavia (based upon gross written premiums), White Mountains Re competes with many of the larger European and international reinsurance companies, including Munich Re, Swiss Re, Hannover Re, Lloyds, Partner Re and Everest Re.

                White Mountains Re, through its operating subsidiaries, has a long history of close relationships with ceding companies and maintainsmaintaining a disciplined underwriting strategy which, among other things,while considering overall exposure, focuses on writing more business when market terms and conditions are favorable and reducing business volume during soft markets when terms and conditions become less favorable. White Mountains Re also employs a multi-line approach, offering clients a wide range of reinsurance products to satisfy their risk management needs.

                White Mountains Re derives its business from a broad spectrum of ceding companies, including national, regional, specialty and excess and surplus lines writers, both in the United States and internationally. White Mountains Re's underwriters and pricing actuaries perform reviews of the underwriting, pricing, and general underwriting controls of potential ceding companies before quoting contract terms for its reinsurance products. White


        Mountains Re prices its products by assessing the desired return on the expected capital needed to write a given contract and on the expected underwriting results of the contract. White Mountains Re's pricing indications are based on a number of underwriting factors including historical results, analysis of exposure and estimates of future loss costs, a review of other programs displaying similar exposure characteristics and the ceding company's underwriting and claims experience. White Mountains Re's underwriters, actuaries and claims personnel perform audits to monitor certain ceding companies' risk selection and pricing. Additionally, White Mountains Re's acquisition strategy has contributedstaff reviews the financial stability and creditworthiness of ceding companies. Such reviews provide important input to its growth. Since 1995,support underwriting decisions.

                White Mountains Re has completed ten acquisitionsand other reinsurance companies have sought to mitigate the risks associated with future terrorist attacks in a similar manner as primary insurers. Reinsurers do not have the stringent regulations with respect to contract terms and policy exclusions that are generally imposed on primary insurers. For example, the Terrorism Act is not applicable to reinsurers. As a result, terrorism exclusions on reinsurance contracts are dictated by the marketplace. White Mountains Re evaluates terrorism exposure from its ceding companies and applies exclusions as it deems appropriate and as are permitted by market conditions. Reinsurance on commercial risks written by White Mountains Re subsequent to the Attacks generally contains clauses that exclude acts of other insuranceterrorism certified under the Terrorism Act. Reinsurance on personal risks written by White Mountains Re subsequent to the Attacks generally contains exclusions related to nuclear, biological and reinsurance organizations. In virtually all caseschemical attacks.

                White Mountains Re enhanced its catastrophe underwriting process by significantly raising its provision for demand surge (i.e., the acquired entities were fundamentally sound, but were ownedrise in costs from shortages of material and labor in regions affected by organizationsa catastrophe) and by employing a more conservative methodology to evaluate exposure than those that no longer considered them core businesses.result from standard actuarial and modeling techniques. Additionally, Folksamerica non-renewed its excess off-shore energy and marine business in the Gulf of Mexico effective January 1, 2006.


        Claims Management

                White Mountains Re maintains a staff of experienced reinsurance claim specialists that works closely with reinsurance intermediaries to obtain specific claims information from ceding companies. White Mountains Re's claims staff also regularly perform selective on-site claim reviews to assess reinsureds' claim handling abilities and reserve techniques. In addition, White Mountains Re's claims specialists review loss information provided by reinsureds for adequacy and accuracy. The results of these claim reviews are shared with the underwriters and actuaries to assist them in pricing products and establishing loss reserves.

                White Mountains Re also uses TPAs for certain claims, including claims arising from certain of White Mountains Re's accident & health business and run-off claims related to certain acquired companies. White Mountains Re's claims staff performs on-site claim audits of certain TPAs to ensure the propriety of the controls and processes over claims serviced by the TPAs.

        Competition

                The worldwide reinsurance market is highly competitive. Competition in the worldwide reinsurance market is influenced by a variety of factors, including price charged and other terms and conditions offered, financial strength ratings, prior history and relationships, as well as expertise and the speed at which the company has historically paid claims.

                White Mountains Re competes for reinsurance business in the United States, Bermuda, Europe, and other international reinsurance markets with numerous global competitors. White Mountains Re's competitors include reinsurance companies, and underwriting syndicates at Lloyd's of London. Some of the companies that White Mountains Re competes directly with include ACE Limited, Arch Capital Group Ltd., Endurance Specialty Holdings Ltd., Everest Re Group, Ltd., General Reinsurance Protection
        Corporation, Hannover Ruckversicherung AG, Lloyd's of London, Montpelier Re Holdings, Ltd. ("Montpelier Re"), Munich Re Group, PartnerRe Ltd., Platinum Underwriters Holdings Ltd., Renaissance Re Holdings Ltd., Swiss Re Group, Transatlantic Holdings, Inc. and XL Capital Ltd.

        Catastrophe Risk Management

                White Mountains Re has exposure to losses caused by hurricanes, earthquakes, tornadoes, winter storms, windstorms, floods, tsunamis, terrorist acts and other catastrophic events. In the normal course of business, White Mountains Re seeks to reduce the risk of loss that may arise from catastrophes or other events that cause unfavorable underwriting results by reinsuring certain levels of risk in various areas of exposure with other insurance and reinsurance enterprises and by closely monitoring aggregate property exposures and related PMLs. To manage and analyze aggregate exposures and PML, White Mountains Re utilizes a variety of tools and analyses, including catastrophe modeling software packages. White Mountains Re regularly assessesmanages its concentration of underwriting exposures in catastrophe prone areas and develops strategies to manage this exposure,catastrophic events, primarily throughby limiting accumulationconcentrations of exposure to what it deems acceptable levels and, if deemed necessary, the purchasepurchasing reinsurance. In addition,


        White Mountains Re seeks to limit loss that might arise from acts of terrorism in its reinsurance contracts by exclusionary provisions, where applicable. White Mountains Re also uses third party global catastrophe reinsurance.models as well as its own proprietary models to calculate expected probable maximum loss ("PML") from various natural catastrophic scenarios. White Mountains Re believes that its largest natural catastrophic exposures, net of reinsurance and based on a 250-year PML single event scenario, are European winter storms, United States Gulf Coast windstorms (i.e., Florida to Texas), California earthquakes, United States Atlantic Coast windstorms (i.e., Massachusetts to Florida) and, to a lesser extent, Japanese windstorms and earthquakes.

                Folksamerica'sWhite Mountains Re currently monitors and prices its property catastrophe contracts using third-party software models and internally developed models as well as other methods. For contracts that White Mountains Re determines to have exposure to natural catastrophic perils, it models and assesses exposure and uses the results in its underwriting process to ensure that the contracts it writes have an appropriate charge for the exposure.

                Catastrophe exposure modeling is inherently uncertain due to process risk (the probability and magnitude of the underlying event, e.g. earthquake) and parameter risk (the probability of making inaccurate model assumptions). In particular, geographic and policy coverage data on the primary policies reinsured by White Mountains Re is essential. Accordingly, White Mountains Re's ability to accurately predict its catastrophe exposure is dependent on the quality and accuracy of data obtained from its clients.

                Additionally, catastrophe modeling is dependent upon several broad economic and scientific assumptions, such as storm surge (the water that is pushed toward the shore by the force of a windstorm), demand surge (the localized increase in prices of goods and services that often follow a catastrophe) and zone density (the percentage of insured perils that would be affected in a region by a catastrophe). Third party modeling software also does not encompass all territories in which White Mountains Re writes business.

                While catastrophe modeling is an important tool, White Mountains Re does not believe that it can be strictly relied upon to measure its exposure to natural catastrophic risk. For example, the losses arising from Hurricane Katrina for both White Mountains Re and the industry were substantially in excess of losses previously predicted by third party models from such an event. This was due to issues such as inadequate storm surge and demand surge assumptions in the models, as well as flooding from levees breaking, which was not fully contemplated in these models. Correspondingly, White Mountains Re assesses catastrophe risk by monitoring total limits exposed to a catastrophe event in key zones.

                The following table provides an estimate of White Mountains Re's three largest PML zones at January 31, 2008. White Mountains Re has much less catastrophic loss exposure to other zones, such as Northeast wind and Japanese windstorm and earthquake risk.


         White Mountains Re Financial Impact
         
        ($ in millions)
         Modeled
        Industry Loss

         Gross
         Net After
        Reinstatement

         Net
        After Tax

         Net After Tax
        as % of
        GAAP Capital

         
          1 in 250 year event
         
        European Winter Storm $67,124 $756 $480 $394 14%
        Florida Windstorm  160,758  408  353  285 10%
        California Earthquake  65,369  365  331  260 9%


        1 in 10,000 year event

         
        European Winter Storm $167,756 $1,175 $736 $593 20%
        Florida Windstorm  391,937  596  521  419 14%
        California Earthquake  226,876  485  435  345 12%

                During 2007, to better manage its aggregate exposure to very large catastrophic events, White Mountains Re introduced an underwriting limit to the maximum net financial impact ("NFI") it would suffer in the worst aggregate loss year modeled in third party software (i.e., the 10,000 year global annual aggregate PML). The calculation of the NFI begins with the 10,000 year global annual aggregate PML and takes account of reinstatement premiums, reinsurance recoverables net of uncollectible balances, and tax benefits net of valuation allowances. This amount is deducted from the most recently forecasted comprehensive net income for the year, to arrive at the NFI. The NFI does not include the potential impact of the loss events on White Mountains Re's investment portfolio.

                For 2008, the NFI limit has been set at $650 million, which is approximately 22% of White Mountains Re's total GAAP capital. At January 1, 2008, White Mountains Re believes that it was under the $650 million limit. Actual losses incurred by White Mountains Re resulting from any particular catastrophic event may be substantially different than modeled losses from such event.


        Reinsurance Protection

                White Mountains Re generally enters into retrocessional arrangements in order to reduce its potential loss exposure to any large or series of smaller catastrophe events, stabilize financial ratios and obtain additional underwriting capacity where appropriate. White Mountains Re has several retrocessional arrangements, most of which are with highly rated reinsurers. White Mountains Re also has in place various retrocessions on specified property contracts White Mountains Re has assumed.

                For the three years ended December 31, 2007, the majority of White Mountains Re's reinsurance protection iswas provided through Folksamerica's quota share retrocessional arrangements with Olympus.Olympus Reinsurance Company, Ltd. ("Olympus") and Helicon. Sirius International also purchases excess of loss protection to cover its property catastrophe and aviation exposures. These arrangements arereinsurance protections were designed to increase Folksamerica'sWhite Mountains Re's underwriting capacity, to capitalize on the improved pricing trends that accelerated after the Attackswhere appropriate, and to reduce its potential loss exposure to any large or series of smaller property catastrophe events. UnderFolksamerica ceded 35% of its quota share agreements2007 underwriting year short-tailed excess of loss business, mainly property, to Olympus and Helicon, with each sharing approximately 55% and 45%, respectively. Folksamerica ceded 35% of its 2006 underwriting year short-tailed excess of loss business, mainly property, to Olympus and Helicon, with each sharing approximately 56% and 44%, respectively. Folksamerica cedesceded up to 75% of substantially all of its 2005 underwriting year short-tailed excess of loss business, mainly property and marine, and 50% of its 2005 underwriting year proportional property business to Olympus and receives an override commission on the premiums ceded to Olympus.


                Under its prior ownership, Sirius' threshold for risk exposure and earnings volatility was extremely low. As a consequence, Sirius purchased many reinsurance protections at significant costs. These protections were purchased primarily to reduce the company's property catastrophe exposure on both a treaty and facultative basis. Under White Mountains Re's ownership, Sirius' reinsurance purchasing is coordinated with that of Folksamerica on a group-wide basis. Selective purchases are made primarily for property catastrophe protection. Effective April 1, 2004, Sirius International entered into a quota share reinsurance agreement with Olympus. Under this agreement, Sirius International cedesceded 25% of its 2005 underwriting year short-tailed proportional and excess of loss business to Olympus. White Mountains Re receives an override commissionreceived fee income based on the premiums ceded to Olympus.Olympus and Helicon.

                White Mountains Re's reinsurance recoverable balances due from Olympus are fully collateralized in the form of assets in a trust, funds held and offsetting balances payable for all recoverable amounts recorded as of December 31, 2007. Folksamerica did not renew the quota share arrangements with Olympus and Helicon for 2008. Olympus will continue to be responsible for the payment of losses on exposures that have been ceded to it and will continue to earn premiums related primarily to the run-off of underwriting year 2007 business. White Mountains Re acquired Helicon on January 7, 2008.

                ReinsuranceAt December 31, 2007, White Mountains Re had $36 million of reinsurance recoverables on paid losses and $806 million of reinsurance recoverables on unpaid losses that will become recoverable if claims are paid in accordance with current reserve estimates. Because retrocessional reinsurance contracts do not relieve White Mountains Re of its obligation to itsWhite Mountains Re's ceding companies. Therefore,companies, the collectibility of balances due from its retrocessional reinsurersretrocessionaires is critical to its financial strength. White Mountains Re'sRe monitors the financial strength.strength and ratings of its retrocessionaires on an ongoing basis. SeeNote 4—"Third Party Reinsurance" to the accompanyingAccompanying Consolidated Financial Statements for a discussion of White Mountains Re's top reinsurers.


        Loss and Loss Adjustment Expense Reserves

                White Mountains Re establishes reserves that are estimates of future amounts needed to pay claims and related expenses for insured events that have already occurred. See "CRITICAL ACCOUNTING ESTIMATES" in ""Management's Discussion and Analysis of Financial Condition and Results of Operations"Operations" for a full discussion regarding White Mountains Re's loss reserving process.

                The following information presents (1) White Mountains Re's reserve development over the preceding ten years and (2) a reconciliation of reserves on a regulatory basis to reserves determined in accordance with GAAP, each as prescribed by Securities Act Industry Guide No. 6.

                Section I of the ten10 year table shows the estimated liability that was recorded at the end of each of the indicated years for all current and prior accident year unpaid lossesloss and LAE. The liability represents the estimated amount of lossesloss and LAE for claims that were unpaid at the balance sheet date, including IBNR reserves. In accordance with GAAP, the liability for unpaid lossesloss and LAE is recorded in the balance sheet gross of the effects of reinsurance with an estimate of reinsurance recoverables arising from reinsurance contracts reported separately as an asset. The net balance represents the estimated amount of unpaid lossesloss and LAE outstanding as of the balance sheet date, reduced by estimates of amounts recoverable under reinsurance contracts.


                Section II shows the cumulative amount of net loss and LAE paid relating to recorded liabilities as of the end of each succeeding year. Section III shows the re-estimated amount of the previously recorded net liability as of the end of each succeeding year. Estimates of the liability for unpaid lossesloss and LAE are increased or decreased as payments are made and more information regarding individual claims and trends, such as overall frequency and severity patterns, becomes known. Section IIIIV shows the cumulative net (deficiency)/redundancy representing the aggregate change in the liability between original balance sheet dates and the re-estimated liability through December 31, 2007. Section V shows the re-estimated gross liability and re-estimated reinsurance recoverables through December 31, 2007. Section VI shows the cumulative gross (deficiency)/redundancy representing the aggregate change in the liability from original balance sheet dates and the re-estimated liability through December 31, 2004. Section IV shows the re-estimated gross liability and re-estimated reinsurance recoverables through December 31, 2004. Section V shows the cumulative amount of net losses and LAE paid relating to recorded liabilities as of the end of each succeeding year.

          ��     The following table includes the complete loss development history for all periods presented for all companies acquired by White Mountains Re as if the companies had been combined from their inception.


        This table includes development on reserves reported by acquired companies before those companies were acquired by White Mountains Re2007.

         
         White Mountains Re Loss and LAE(1),(2),(3)(4)
        Years Ended December 31,

         
        ($ in millions)

         
         1994
         1995
         1996
         1997
         1998
         1999
         2000
         2001
         2002
         2003
         2004
         
        I.    Liability for unpaid losses and LAE:                                  
         Gross balance $1,642.7 $1,895.7 $2,448.2 $2,386.1 $2,524.2 $2,299.6 $3,175.1 $3,917.3 $3,925.1 $3,910.4 $4,170.3 
         Less: reins. recoverables on unpaid losses and LAE  (299.2) (336.6) (524.7) (513.3) (592.9) (651.0) (1,148.5) (1,353.7) (1,277.6) (1,214.6) (1,346.6)


        Net balance $1,343.5 $1,559.1 $1,923.5 $1,872.8  1,931.3 $1,648.6 $2,026.6 $2,563.6 $2,647.5 $2,695.8 $2,823.7 


        II.    Net liability re-estimated as of:                                  
         1 year later  1,411.7  1,470.8  1,937.9  1,855.4  2,001.3  1,908.2  2,491.9  2,617.0  2,844.0  2,718.4   
         2 years later  1,372.1  1,482.1  1,871.0  1,889.2  2,036.4  2,169.0  2,500.7  2,844.8  2,881.9       
         3 years later  1,382.3  1,423.4  1,909.2  1,862.8  2,011.9  2,175.0  2,744.5  2,907.7          
         4 years later  1,326.0  1,499.0  1,903.8  1,834.3  2,012.5  2,369.9  2,793.7             
         5 years later  1,408.0  1,483.4  1,870.1  1,817.6  2,065.9  2,388.3                
         6 years later  1,395.6  1,445.3  1,842.7  1,837.0  2,079.0                   
         7 years later  1,364.0  1,416.8  1,854.5  1,842.1                      
         8 years later  1,345.3  1,426.7  1,857.4                         
         9 years later  1,360.6  1,426.5                            
         10 years later  1,365.3                               


        III.    Cumulative net (deficiency)/redundancy $(21.8)$132.6 $66.1 $30.7 $(147.7)$(739.7)$(767.1)$(344.1)$(234.4)$(22.6)  
         Percent (deficient)/ redundant  (1.6)% 8.5% 3.4% 1.6% (7.6)% (44.9)% (37.9)% (13.4)% (8.9)% (.8)% %


        IV.    Reconciliation of net liability re-estimated as of the end of the latest re-estimation period (see II. above):                                  
         Gross re-estimated liability  1,691.6  1,753.4  2,402.0  2,402.8  2,738.2  3,052.2  4,135.2  4,412.4  4,256.3  4,005.6   
         Less: gross re-estimated reinsurance recoverable  (326.3) (326.9) (544.6) (560.7) (659.2) (663.9) (1,341.5) (1,504.7) (1,374.4) (1,287.2)  


        Net re-estimated liability $1,365.3 $1,426.5 $1,857.4 $1,842.1 $2,079.0 $2,388.3 $2,793.7 $2,907.7 $2,881.9 $2,718.4   


        V.    Cumulative net amount of liability paid through:                                  
         1 year later  479.7  463.5  504.5  498.7  542.9  420.5  689.2  729.8  994.0  720.9   
         2 years later  710.1  665.3  771.2  830.9  741.1  860.2  1,167.4  1,429.6  1,394.5       
         3 years later  836.0  788.4  1,007.0  975.3  1,008.0  1,142.4  1,731.1  1,720.3          
         4 years later  905.3  940.9  1,147.4  1,129.5  1,181.6  1,516.1  1,936.7             
         5 years later  1,012.8  1,018.6  1,258.2  1,242.9  1,382.7  1,658.7                
         6 years later  1,062.6  1,088.7  1,351.0  1,317.4  1,487.3                   
         7 years later  1,111.0  1,158.8  1,405.6  1,384.2                      
         8 years later  1,162.4  1,200.7  1,457.7                         
         9 years later  1,195.1  1,246.1                            
         10 years later  1,235.2                               


         White Mountains Re Loss and LAE(1)
        Years Ended December 31,

         
        ($ in millions)

         
         1997
         1998
         1999
         2000
         2001
         2002
         2003
         2004
         2005
         2006
         2007
         
        I. Liability for unpaid losses and LAE:                                  
        Gross balance $739.1 $723.2 $768.0 $1,479.9 $1,581.4 $1,588.4 $1,699.4 $3,864.3 $4,308.8 $3,708.8 $3,252.3 
        Less: reins. recoverables on unpaid losses and LAE  (124.0) (130.2) (137.3) (702.8) (879.5) (809.8) (741.1) (1,149.8) (1,633.6) (1,142.5) (806.4)


        Net balance $615.1 $593.0 $630.7 $777.1 $701.9 $778.6 $958.3 $2,714.5 $2,675.2 $2,566.3 $2,445.9 


        II. Cumulative net amount of liability paid through:                                  
         1 year later  155.2  161.3  53.3  350.1  230.6  250.7  321.5  941.0  949.4  721.7   
         2 years later  267.7  211.4  290.7  492.2  391.2  420.8  521.8  1,369.4  1,442.9       
         3 years later  329.0  364.6  500.1  596.9  501.4  559.1  710.8  1,684.9          
         4 years later  418.4  544.0  589.3  666.7  602.7  690.9  834.7             
         5 years later  576.3  604.8  678.2  735.2  739.3  804.5                
         6 years later  619.1  669.5  728.6  833.9  830.6                   
         7 years later  667.5  721.8  806.4  899.9                      
         8 years later  706.2  778.3  869.0                         
         9 years later  746.5  832.6                            
         10 years later  787.6                               


        III. Net liability re-estimated as of:                                  
         1 year later  618.3  602.3  648.8  782.7  704.9  828.9  984.9  2,771.9  2,893.2  2,575.4   
         2 years later  629.4  611.3  671.9  767.7  758.7  856.9  1,059.6  2,802.9  3,032.5       
         3 years later  632.6  615.9  693.8  815.7  800.5  929.8  1,148.1  2,917.9          
         4 years later  626.9  631.5  751.1  850.8  872.2  1,023.8  1,270.2             
         5 years later  629.7  677.0  778.8  918.5  968.4  1,138.6                
         6 years later  667.7  694.8  857.0  998.2  1,077.8                   
         7 years later  678.0  768.7  916.6  1,097.7                      
         8 years later  747.9  807.8  1,016.5                         
         9 years later  769.4  900.4                            
         10 years later  856.9                               


         White Mountains Re Loss and LAE(1)
        Years Ended December 31,

        ($ in millions)

         1997
         1998
         1999
         2000
         2001
         2002
         2003
         2004
         2005
         2006
         2007
        IV. Cumulative net (deficiency)/redundancy $(241.8)$(307.4)$(385.8)$(320.6)$(375.9)$(360.0)$(311.9)$(184.7)$(357.3)(2)$(9.1)
        Percent (deficient)/redundant  (39.3)% (51.8)% (61.2)% (41.3)% (53.6)% (46.2)% (32.5)% (6.8)% (13.4)% (.4)%


        V. Reconciliation of net liability re-estimated as of the end of the latest re-estimation period (see III. above):                                
        Gross re-estimated liability $1,188.8 $1,290.7 $1,323.1 $2,004.8 $2,093.5 $2,010.9 $2,087.9 $4,270.6 $4,897.7 $3,765.1 
        Less: gross re-estimated reinsurance recoverable  (331.9) (390.3) (306.6) (907.1) (1,015.7) (872.3) (817.7) (1,352.7) (1,865.2) (1,189.7)


        Net re-estimated liability $856.9 $900.4 $1,016.5 $1,097.7 $1,077.8 $1,138.6 $1,270.2 $2,917.9 $3,032.5 $2,575.4 


        VI. Cumulative gross deficiency $(449.7)$(567.5)$(555.1)$(524.9)$(512.1)$(422.5)$(388.5)$(406.3)$(588.9)$(56.3)
        Percent deficient  (60.8)% (78.5)% (72.3)% (35.5)% (32.4)% (26.6)% (22.9)% (10.5)% (13.7)% (1.5)%


        (1)
        The table includes the complete loss development history for all periods presented for all companies acquired by Folksamerica through an instrument of transfer and assumption approved by the appropriate insurance regulators. Under the instrument, insurance regulators require that Folksamerica report reserve development as if the companies had been combined from their inception.

        (2)
        Folksamerica became a wholly ownedwholly-owned subsidiary of White Mountains during 1998. Reserve development for the yearsyear ended 1994 through 1997 reflects development on reserves established before White Mountains consolidated Folksamerica's results.

        (3)(2)
        Sirius,Includes prior year development of $223 million on short-tailed losses related to hurricanes Katrina, Rita and Wilma, including Scandinavian Re, became a wholly owned subsidiary of White Mountains during 2004. Reserve development for the years ended 1994 through 2003 reflects development on reserves established before White Mountains consolidated Sirius' results. See table, below.

        (4)
        Loss and LAE reserves for Tryg Baltica (acquired in November, 2004) are only included as of December 31, 2004, due to lack of availability of loss development history on a comparable basis. Net loss and LAE reserves for Tryg Baltica are $134.5 million as of December 31, 2004.Olympus reimbursement.

                The cumulative net (deficiency)/redundancy in the table above reflectsincludes adverse development recordedfrom A&E claims. White Mountains Re's exposure to A&E claims results mainly from asbestos claims arising from treaty and facultative contracts written prior to 1985 at two companies acquired by Scandinavian Re, whichFolksamerica—MONY Reinsurance in 1991 and Christiania General in 1996. As a result, the table above reflects reserve development on A&E business that was acquirednot underwritten by White Mountains Re.

                White Mountains Re's net incurred losses from A&E claims have totaled $198 million over the past ten years. Although losses arising from A&E claims were on contracts that were not underwritten by White Mountains Re, White Mountains Re is liable for any additional losses arising from such contracts. Accordingly, White Mountains Re cannot guarantee that it will not incur additional A&E losses in 2004the future. Refer to "CRITICAL ACCOUNTING ESTIMATES" in "Management's Discussion and has been in run-off since 2002. This has the effectAnalysis of significantly increasingFinancial Condition and Results of Operations" for further details of White Mountains Re's cumulativeA&E reserves.


        deficiency for each of the years presented in the table, including the years prior to White Mountains Re's acquisition of Sirius. The table presented below represents White Mountains Re's cumulative net (deficiency)/redundancy excluding Scandinavian Re:

         
         Years Ended December 31,
         
        ($ in millions)

         
         1994
         1995
         1996
         1997
         1998
         1999
         2000
         2001
         2002
         2003
         2004
         
        Cumulative net (deficiency) /redundancy, excluding Scandinavian Re $(6.3)$159.2 $90.6 $42.1 $(64.6)$(244.8)$(74.0)$(20.8)$(30.6)$13.7 $ 


        Percent (deficient) / redundant  (0.5)% 10.4% 4.8% 2.3% (3.6)% (17.8)% (5.5)% (1.5)% (1.9)% 0.7% %


                The following table reconciles loss and LAE reserves determined on a regulatory basis to loss and LAE reserves determined in accordance with GAAP at December 31, as follows:


         December 31,
         December 31,
         
        (Millions)

        2004
         2003
         2002
        Millions

         December 31,
         
         
        Regulatory reserves $3,092.0 $1,325.9 $1,148.8 $2,821.6 $2,866.3 $3,109.7 
        Reinsurance recoverable on unpaid losses and LAE(1) 948.2 480.5 513.2 573.5 875.6 1,513.1 
        Discount on loss reserves 245.2   121.0 141.6 184.5 
        Reserves allocated to other segments (91.2) (31.5)  (218.6) (123.6) (105.6)
        Purchase accounting and other (23.9) 2.3 2.3 (45.4) (51.1) (21.4)


        GAAP reserves $4,170.3 $1,777.2 $1,664.3 $3,252.1 $3,708.8 $4,680.3 


            (1)
            Represents adjustments made to add back reinsurance recoverables included with the presentation of reserves under regulatory accounting.

        Recent Financing Activities

                In May 2007, White Mountains Re Group, Ltd. ("WMRe Group"), an intermediate holding company of White Mountains Re, issued $250 million non-cumulative perpetual preference shares, with a $1,000 per share liquidation preference (the "WMRe Preference Shares"), and received $246 million of proceeds, net of $4 million of issuance costs and commissions. These shares were issued in an offering that was exempt from the registration requirements of the Securities Act of 1933. Holders of the WMRe Preference Shares receive dividends on a non-cumulative basis when and if declared by WMRe Group. The holders of the WMRe Preference Shares have the right to elect two directors to WMRe Group's board in the event of non-payment of dividends for six quarterly dividend periods. The right ceases upon the payment of dividends for four quarterly periods or the redemption of the WMRe Preference Shares. In addition, WMRe Group may not declare or pay dividends on its common shares (other than stock dividends and dividends paid for purposes of any employee benefit plans of WMRe Group and its subsidiaries) unless it is current on its most recent dividend period. The dividend rate is fixed at an annual rate of 7.506% until June 30, 2017. After June 30, 2017, the dividend rate will be paid at a floating annual rate, equal to the greater of (1) the 3 month LIBOR plus 3.20% or (2) 7.506%. The WMRe Preference Shares are redeemable solely at the discretion of WMRe Group on or after June 30, 2017 at their liquidation preference of $1,000 per share, plus any declared but unpaid dividends. Prior to June 30, 2017, WMRe Group may elect to redeem the WMRe Preference Shares at an amount equal to the greater of (1) the aggregate liquidation preference of the shares to be redeemed and (2) the sum of the present values of the aggregate liquidation preference of the shares to be redeemed and the remaining scheduled dividend payments on the shares to be redeemed (excluding June 30, 2017), discounted to the redemption date on a semi-annual basis at a rate equal to the rate on a comparable treasury issue plus 45 basis points. In the event of liquidation of WMRe Group, the holders of the WMRe Preference Shares would have preference over the common shareholders and would receive a distribution equal to the liquidation preference per share, subject to availability of funds.

                In March 2007, WMRe Group issued $400.0 million face value of senior unsecured debt at an issue price of 99.715% (the "WMRe Senior Notes"), resulting in net proceeds of $392 million, which were distributed to its immediate parent. The WMRe Senior Notes, which were issued in an offering that was exempt from the registration requirements of the Securities Act of 1933, bear an annual interest rate of 6.375%, payable semi-annually in arrears on March 20 and September 20, until maturity in March 2017. Taking into effect the amortization of the original issue discount and all underwriting and issuance expenses, including an interest rate lock agreement, the WMRe Senior Notes yield an effective rate of 6.49% per annum.


        ESURANCE

                The Esurance group of companies, which is headquarteredhas its United States headquarters in San Francisco, havehas been part of White Mountains since October 2000. Esurance markets personal auto insurance directly to customers online and through select online agents. Most customer interaction with the company takes place throughvia Esurance's website, www.esurance.com. Through the website, customers can get real-time quotes, compare quotes from other companies, purchase their policies, report claims, watch vehicle repairs, make changes to their policy and manage their accounts. At December 31, 2007, Esurance's in-force policy count had grown to 485,000 policies, as compared to 43,000 policies at the end of 2002.

                Esurance's underwriting companies, Esurance Insurance Company, Esurance Insurance Company of New Jersey and Esurance Property and Casualty Insurance Company are both rated "A""A-" (Excellent, the thirdfourth highest of fifteen ratings) by A.M. Best. Additionally,Over the past several years, Esurance has ceded a large percentage of its business to certain other subsidiaries of White Mountains, primarily for capital management purposes. This business is included in the Esurance segment also includes insurance ceded bysegment. At December 31, 2007 and 2006, Esurance to its affiliate, Folksamerica.had $1,103 million and $724 million of total assets and $445 million and $309 million of shareholder's equity, respectively.


        Geographic Concentration

                As of December 31, 2004,2007, Esurance is writingwrites business in 17twenty-eight states. These states represent 66%approximately 85% of the premium volume for the entire U.S. personal automobileauto insurance market. For the years ended December 31, 2004, 20032007, 2006 and 2002, Esurance's business was2005, Esurance had net written premiums of $799 million, $596 million and $349 million, respectively, which were produced in the following states:


         Year Ended December 31,
         
         Year Ended December 31,
         
        Net written premiums by state

        Net written premiums by state

         Net written premiums by state

         
        2004
         2003
         2002
          2007
         2006
         2005
         
        CaliforniaCalifornia 25%32%43%California 22%19%20%
        FloridaFlorida 24 24 14 Florida 16 17 20 
        New YorkNew York 7 9 8 
        TexasTexas 11 15 12 Texas 6 6 9 
        MichiganMichigan 7 5 1 Michigan 5 6 7 
        PennsylvaniaPennsylvania 5 7 7 Pennsylvania 5 5 4 
        New York 5 2 4 
        WashingtonWashington 5 4 3 
        New JerseyNew Jersey 4 5 3 
        OtherOther 23 15 19 Other 30 29 26 


        Total 100%100%100%Total 100%100%100%


        Marketing

                Esurance distributes approximately 80% of its business directly to customers online and over the phone. For this business, Esurance does not pay agent commissions on either new or renewal policies. The remaining 20% of Esurance's business is distributed through large online agents. Esurance targets convenience-focused, technology savvytechnology-savvy consumers who userely on the Internet for most ofto manage their financial services transactions.

        needs. Esurance attractshas a diverse marketing mix and features its target customersanimated icon, "Erin Esurance", across its advertising channels. In 2007, Esurance expanded its national television campaign and its online video campaigns, forming partnerships with new video portals (e.g. Hulu and Joost). In 2007, the company continued to advertise through a continuously optimized mix of onlinepaid search engines (e.g., Google and offline advertising. Esurance advertises onYahoo! Search), and a wide variety of insurance, finance, and automotive sites, along with major portals (e.g., MSN and Yahoo!) and search advertisers, like Google.web sites. Esurance also advertiseshas sponsor relationships with professional and college sports teams, as well as various environmental and community organizations.

                Diversified advertising channels and the presence of "Erin Esurance" have resulted in continued, significant business growth and substantial increases in brand awareness, particularly among Esurance's target customer base of web-savvy individuals. Esurance is not only the third largest issuer of auto insurance quotes on television, radiothe Internet, behind only GEICO and through direct mail.Progressive, but also the third most recognizable brand for online auto insurance among consumers of online goods and services.


        Underwriting and Pricing

                With its web-enabled technology,        Esurance collects and verifies detailed underwriting information in real-time while customers transact with the company online. This real-timeReal-time access to customer information allows Esurance to continually develop and refine its highly segmented, tiered pricing models. Esurance believes that its tiered pricing models have a greater statistical correlation with historical loss experience than traditional pricing models have shown. As a result, Esurance canis able to quote rates to customers that most closely correspond to the individual risk characteristics of the customer, enabling Esurance to focus on keeping insurance rates competitive without compromising the company's loss ratio targets.


        Competition

                Esurance competes with national and regional personal automobileauto insurance companies, though Esurance's main competition iscomes from other direct writers like Progressive, GEICO and 21st Century.Progressive.

                Esurance leverages        By leveraging web-enabled technology, allowing it toEsurance can capture data real-time and reactrespond quickly to market shifts. With an array of customer information at its disposal,changing loss trends. Esurance is continually able to continually refine pricing, enhance its auto product, and optimize dollars spent on marketing. Technologymarketing with the assortment of customer information that is at the company's disposal. Web technology also allows Esurance to provide high quality,24/24/7 customer service and claims handling for a competitive price.cost effectively.


                Esurance's paperless business process allowallows the company to significantly reduce operating costs typically associated with policy processing, verification and endorsement activities. As a result, the company is able to achieve efficient, low-cost acquisition and operating expense structures. Further, Esurance's paperless business model is the foundation of the company's environmental commitment, which helps differentiate Esurance from its competitors.


        Claims Management

                Esurance handles its claims through regional claim centers in California, Florida, Texas and New York. Esurance takes the initial notice of claims at its loss at the company's customer service center,reporting unit in South Dakota, which is available for customers 24 hours a day, 365 days a year. The loss reporting unit then assignstransfers claims to the regional claim centers.offices in Arizona, California, Colorado, Florida, Georgia, New Jersey, New York, Texas and Wisconsin where claims are handled and adjusted.

                Esurance's claims organization leverages technology to reduce cycle times.times and achieve strict claims performance metrics. Rapid response to and resolution of claims creates a stronger relationship with customers, while also decreasing ancillary claims costs, such as rental car fees. Additionally, Esurance maintains a special investigative unit designed to detect insurance fraud, and actively supports efforts by regulatory bodies and trade associations to curtail the cost of insurance fraud.


        Catastrophe Risk
        Management

                Esurance's sole line of business is personal automobileauto insurance that covers liabilities and physical damage arising from the operation of automobiles. The majority of Esurance's customers elect coverage for physical damage (85%(81%), resulting in exposure to catastrophe losses at Esurance forfrom hurricanes, hailstorms, earthquakes and other acts of nature. Generally, catastrophe costs are low for personal auto in relation to other lines of business, such as homeowners and commercial property. Additionally, Esurance's broad geographic distribution limits its concentration of risk and the potential for losses to accumulate from a single event. Esurance estimates that its PML for a single event is less than 1% of net written premium.


        Loss and Loss Adjustment Expense Information

                Esurance establishes loss and LAE reserves that are estimates of amounts needed to pay claims and related expenses in the future for insured events that have already occurred. The process of estimating reserves for Esurance is similar to the process described in"Loss and Loss Adjustment Expense Reserves" in the"ONEBEACON" discussioninvolves a considerable degree of judgment by management and, as of any given date, is inherently uncertain. As described previously, uncertaintiesUncertainties in projecting estimates of ultimate loss and LAE are magnified by the time lag between when a claim actually occurs and when it is reported and settled i.e.(i.e., the "claim-tail."claim-tail). Esurance writes primarily "short-tail"short-tail personal automobileauto insurance policies, which reduces the uncertainty inherent in its loss and LAE reserves when compared to insurance companies that write "long-tail"long-tail policies, such as workers compensation.


                Management believes that Esurance's loss and LAE reserves as of December 31, 20042007 are adequate; however, ultimate loss and LAE may deviate, perhaps materially, from the amounts currently reflected in the reserve balance. Adverse development, if any, would impact the Company'sEsurance's future results of operations.

                The following information presents (1) Esurance's reserve development over the fourseven years since inception and (2) a reconciliation of reserves on a Statutory basis to reserves determined in accordance with GAAP, each as prescribed by Securities Act Industry Guide No. 6.

                Section I of the table shows the estimated liability that was recorded at the end of each of the indicated years for all current and prior accident year unpaid lossesloss and LAE. The liability represents the estimated amount of lossesloss and LAE for claims that were unpaid at the balance sheet date, including IBNR reserves. In accordance with GAAP, the liability for unpaid lossesloss and LAE is recorded in the balance sheet gross of the effects of reinsurance with an estimate of reinsurance recoverables arising from reinsurance contracts reported separately as an asset. The net balance represents the


        estimated amount of unpaid lossesloss and LAE outstanding as of the balance sheet date, reduced by estimates of amounts recoverable under reinsurance contracts.

                Section II shows the cumulative amount of net loss and LAE paid relating to recorded liabilities as of the end of each succeeding year. Section III shows the re-estimated amount of the previously recorded net liability as of the end of each succeeding year. Estimates of the liability for unpaid lossesloss and LAE are increased or decreased as payments are made and more information regarding individual claims and trends, such as overall frequency and severity patterns, becomes known. Section IIIIV shows the cumulative net (deficiency)/redundancy representing the aggregate change in the liability from original balance sheet dates and the re-estimated liability through December 31, 2004.2007. Section IVV shows the re-estimated gross liability and re-estimated reinsurance recoverables through December 31, 2004.2007. Section VVI shows the cumulative amount of net lossesgross (deficiency)/redundancy representing the aggregate change in the liability from original balance sheet dates and LAE paid relating to recorded liabilities as of the end of each succeeding year.re-estimated liability through December 31, 2007.

         
         Esurance Loss and LAE(1),(2)
        Years Ended December 31,

         
        ($ in millions)

         
         2001
         2002
         2003
         2004
         
        I.    Liability for unpaid losses and LAE:             
         Gross balance $4.0 $15.5 $39.1 $63.0 
         Less: reinsurance recoverables on unpaid losses and LAE        0.1 


        Net balance $4.0 $15.5 $39.1 $62.9 


        II.    Net liability re-estimated as of:             
         1 year later  4.0  16.0  34.0   
         2 years later  4.4  15.3       
         3 years later  4.3          


        III.    Cumulative net (deficiency)/ redundancy $(0.3)$0.2 $5.1 $ 
         Percent (deficient)/redundant  (6.7)% 1.3% 13.0% %


        IV.    Reconciliation of net liability re-estimated as of the end of the latest re-estimation period (see II. above):             
         Gross re-estimated liability  4.3  15.3  34.2   
         Less: gross re-estimated reinsurance recoverable        0.2    


        Net re-estimated liability $4.3 $15.3 $34.0 $ 


        V.    Cumulative net amount of liability paid through:             
         1 year later  2.5  9.3  18.9   
         2 years later  3.3  12.2       
         3 years later  3.9          


         Esurance Loss and LAE(1)(2)
        Years Ended December 31,

         
        ($ in millions)

         
         2001
         2002
         2003
         2004
         2005
         2006
         2007
         
        I. Liability for unpaid loss and LAE:                      
        Gross balance $4.0 $15.5 $39.1 $63.0 $94.1 $167.4 $285.3 
        Less: reinsurance recoverables on unpaid loss and LAE        (.1) (.1) (.5) (2.2)


        Net balance $4.0 $15.5 $39.1 $62.9 $94.0 $166.9 $283.1 


        II. Cumulative net amount of net liability paid through:                      
         1 year later  2.5  9.3  18.9  35.8  62.4  125.3   
         2 years later  3.3  12.2  24.5  47.4  89.9       
         3 years later  3.9  13.7  28.2  54.3          
         4 years later  4.1  14.6  29.6             
         5 years later  4.1  14.6                
         6 years later  4.1                   


        III. Net liability re-estimated as of:                      
         1 year later  4.0  16.0  34.0  54.9  97.2  196.4   
         2 years later  4.4  15.3  29.4  55.5  107.3       
         3 years later  4.3  14.4  29.5  58.2          
         4 years later  4.2  14.6  30.3             
         5 years later  4.1  14.6                
         6 years later  4.1                   


        IV. Cumulative net (deficiency)/redundancy $(.1)$.9 $8.9 $4.7 $(13.3)$(29.6)$ 
        Percent (deficient)/redundant  (3.7)% 5.8% 22.6% 7.5% (14.2)% (17.7)%  


        V. Reconciliation of net liability re-estimated as of the end of the latest re-estimation period (see III. above):                      
        Gross unpaid loss and LAE latest re-estimate $4.1 $14.6 $30.5 $58.9 $107.8 $198.7 $ 
        Reinsurance recoverable latest re-estimate      (.2) (.7) (.5) (2.3)  


        Net unpaid loss and LAE latest re-estimate $4.1 $14.6 $30.3 $58.2 $107.3 $196.4 $ 


        VI. Cumulative Gross (deficiency)/redundancy $(.1)$.9 $8.6 $4.1 $(13.7)$(31.3)$ 
        Percent (deficient)/redundant  (3.7)% 5.8% 22.2% 6.6% (14.6)% (18.7)%  


        (1)
        The table consists of reserve information for Esurance Insurance Company, Esurance Property & Casualty Insurance Company, and business ceded by Esurance to Folksamerica.Folksamerica, OneBeacon and Sirius.

        (2)
        Esurance became a wholly owned subsidiary of White Mountains during 2000.

                The following table reconciles loss and LAE reserves determined on a Statutory basis to loss and LAE reserves determined in accordance with GAAP at December 31, as follows:


         December 31,
         December 31,
        (Millions)

        2004
         2003
         2002
        Millions

         December 31,
        Statutory reserves $16.2 $7.6 $15.5 $64.3 $43.3 $30.1
        Reserves allocated from other segments 46.7 31.5  218.6 123.6 64.0
        Reinsurance recoverable on unpaid losses and LAE(1) .1   2.4 .5 


        GAAP reserves $63.0 $39.1 $15.5 $285.3 $167.4 $94.1


            (1)
            Represents adjustments made to add back reinsurance recoverables included with the presentation of reserves under regulatory accounting.


        OTHER OPERATIONS

                White Mountains' Other Operations segment consists of the operations of the Company, the Company's intermediate subsidiary holding companies, White Mountains' weather risk management and variable annuity reinsurance businesses, the consolidated results of the Tuckerman Funds, the International American Group, WM Advisors and White Mountains' investments in Symetra, Pentelia, Delos (seeThe CompanyInvestments in Unconsolidated Affiliates below) and Montpelier Re (until its Intermediate Holding Companies
        disposition in May 2007).

        WM Advisors

                The Company's intermediate holdingWM Advisors is a registered investment adviser that manages White Mountains' investments in fixed income and equity securities, including hedge funds, limited partnerships and private equities. WM Advisors also has investment management agreements with third parties, most notably with Symetra and Montpelier Re. At December 31, 2007, WM Advisors had approximately $29.6 billion in assets under management, $10.6 billion of which related to consolidated subsidiaries of White Mountains.

                WM Advisors has a sub-advisory agreement with Prospector Partners LLC ("Prospector"), a registered investment adviser, under which Prospector manages most of White Mountains' publicly-traded common equity and convertible securities. Prospector also provides consulting and advisory services to White Mountains through a separate agreement with WM Advisors on matters such as capital management, asset allocation, private equity investments and mergers and acquisitions.

        Galileo

                During 2006, White Mountains entered into the weather risk management business through its newly formed subsidiary, Galileo. Galileo sells weather and weather contingent risk management products, typically in derivative form, that are designed to assist corporate and governmental customers, primarily energy companies, utilities and construction companies, in managing their economic exposure to variations in weather conditions. Galileo then manages its weather and weather contingent derivative portfolio through the employment of a variety of risk management strategies to preserve its expected margins. These strategies include Fund Americangeographical diversification of risk exposures and Fund American Enterprises Holdings, Inc. ("FAEH")economic hedging through the use of weather and commodity derivatives traded in both the over-the-counter and exchange-traded derivative markets. Additionally, Galileo may economically hedge portions of its risk exposure by buying and selling similar weather risk contracts with different counterparties. For example, Galileo may sell an option to protect a customer if it becomes too cold in a certain location and then purchase an option from another counterparty that pays Galileo if it becomes too cold in that same location. Galileo may also diversify its risk exposure by entering into contracts that protect different clients with opposite exposures to the same quantifiable weather element. For example, Galileo may sell an option to protect a customer if it becomes too cold in a certain location and then sell another option that protects a different customer if it becomes too warm in that same location. Risk management is undertaken on a portfolio-wide basis in order to maintain a portfolio that Galileo believes is well diversified and that remains within the aggregate risk tolerance established by senior management.


                Weather derivatives, which usually take the form of swaps or options, are contracts with financial settlements based on the performance of an index linked to a quantifiable weather element, such as temperature, precipitation, snowfall or windspeed. Typical contracts span several months such as a summer or winter season. A weather swap is a contract that requires one of the contractual parties to make a payment to the other contractual party when a weather index rises above or falls below a specified level, or "strike". Therefore, upon settlement of a weather swap, Galileo may make or receive a payment. A weather call option is a contract that entitles the purchaser to receive a payment when the weather index exceeds a specified strike, and a weather put option is a contract that entitles the purchaser to receive a payment when the weather index is less than a specified strike. Every weather derivative is defined by a series of terms, including strike, location, notional payout rate (per unit or event), both U.S.-domiciled companies, as well as various intermediate holding companies domiciledmaximum payout, time period and reference index, which are calculated from weather data collected from a specified weather station.

                Weather contingent derivative products are weather derivatives with an additional commodity price trigger. Due to the dual trigger nature, weather contingent products are usually in the United States, Barbados, Luxembourg, Swedenform of a call or put option. For example, a temperature contingent gas call will usually pay a client if temperatures are colder than an agreed upon trigger and Bermuda. White Mountains arranges the majoritynatural gas prices are above a second trigger.

                Beginning in February 2006, OneBeacon Insurance Company ("OBIC"), a subsidiary of its financing through the Company and these intermediate holding companies.

                In May 2003, Fund American issued $700 million face value of senior unsecured debt through a public offering, at an issue price of 99.7% (the "Senior Notes"). The net proceeds from the issuanceOneBeacon, agreed to provide guarantees of the Senior Notes were usedobligations of Galileo to repayGalileo's counterparty in certain weather related product transactions. The guarantees require OBIC to pay the full amount of Galileo's obligations to the counterparty in the event of Galileo's failure to pay these obligations. In the event of a payment, OBIC would be eligible to exercise all of the term loans and a portionrights of the revolving loan (with the remainder repaid with cash on hand) under Fund American's previous bank facility.

                In September 2003, Fund American terminated its old revolving credit facility, which then consisted solely of an undrawn $175 million revolving credit line, and replaced it with a new $300 million revolving credit facility (the "Bank Facility"), under which both Fund American and the Company are permitted borrowers. In August 2004, Fund American restructured and re-syndicated the Bank Facility to increase the availability under the revolving credit facility to $400 million and to extend the maturity from September 2006 to August 2009.counterparty against Galileo. As of December 31, 2004,2007, OBIC had eight outstanding guarantees of Galileo transactions, the Bank Facilitytotal principal amount of which was undrawn.

                As partapproximately $49 million. In the event that the total guaranteed principal amount exceeds the lesser of 5% of OBIC's admitted assets of $3.5 billion at December 31, 2007 or 25% of OBIC's statutory surplus of $1.6 billion at December 31, 2007, OBIC would require the approval of the financingPennsylvania Department of Insurance in order to make any further guarantees. OBIC has agreed, at White Mountains' option, to continue to make these guarantees available until October 2008 and will receive from Galileo an annual fee of 25 basis points of the value at risk for providing the guarantees. Pursuant to a separation agreement White Mountains entered into with OneBeacon in connection with the OneBeacon Acquisition, Berkshire Hathaway, Inc. ("Berkshire") investedOffering, White Mountains has agreed that it will take appropriate steps to ensure that OBIC will not be called on to make payment on these guarantees.

        WM Life Re

                During 2006, White Mountains entered into the variable annuity reinsurance business through its newly formed subsidiary, WM Life Re. WM Life Re reinsures death and living benefit guarantees associated with certain variable annuities issued in Japan, commencing September 1, 2006. WM Life Re has assumed the risk related to a total of $300 millionshortfall between the account value and the guaranteed value that must be paid by the ceding company to an annuitant or to an annuitant's beneficiary in cash, ofaccordance with the underlying annuity contracts. Generally, the liabilities associated with these guarantees increase with declines in the equity markets, interest rates and currencies against the Japanese Yen, as well as with increases in market volatilities. The liability is also affected by annuitant-related actuarial assumptions, including surrender and mortality rates.

                WM Life Re purchases derivative instruments, which (1) $225 million was forcurrently include put options and futures contracts on major equity indices, currency pairs and futures contracts on bonds, to mitigate the purchase of preferred stock of Fund American (the "Berkshire Preferred Stock"), which has a $300 million redemption value; and (2) $75 million was forrisks associated with changes in the purchase of warrants to acquire 1,724,200 Common Sharesfair value of the Company (the "Warrants"reinsured variable annuity guarantees. WM Life Re measures its net exposure to changes in relevant interest rates, foreign exchange rates and equity markets on a daily basis and adjusts its economic hedge positions within risk guidelines established by senior management. WM Life Re also monitors the effects of annuitant-related experience against actuarial assumptions (including surrender and mortality rates) on a weekly basis and adjusts relevant assumptions and economic hedge positions if required.

        Tuckerman Capital, LP and Tuckerman Capital II, LP

                White Mountains owns approximately 96% of Tuckerman Capital, LP and approximately 50% of Tuckerman Capital II, LP (collectively, the "Tuckerman Funds"). The Berkshire Preferred Stock is entitledTuckerman Funds are managed by Tuckerman Capital, a private investment firm that focuses on acquisitions of small manufacturing companies, and are consolidated within White Mountains' financial statements. Tuckerman Capital focuses its acquisition efforts on companies with enterprise values ranging from $5 million to $25 million and with established track records of success. The companies owned by the Tuckerman Funds are manufacturers of highly engineered, non-commodity products across a dividendbroad range of no less than 2.35% per quarter and is mandatorily redeemable on May 31, 2008. During 2004, Berkshire exercised its warrants for $294 million in cash.

                Also as part of the financing of the OneBeacon Acquisition, Zenith Insurance Company ("Zenith") purchased $20 million in cumulative non-voting preferred stock of FAEH (the "Zenith Preferred Stock"). The Zenith Preferred Stock is entitled to a dividend of no less than a 2.5% per quarter through June 30, 2007 and a dividend of no less than 3.5% per quarter thereafter. The Zenith Preferred Stock is mandatorily redeemable on May 31, 2011. At the Company's option, the Zenith Preferred Stock may be redeemed on June 30, 2007.industries.


                At December 31, 2007 and 2006, the Tuckerman Funds had $91 million and $101 million of total assets and accounted for $32 million and $38 million of White Mountains' net assets, respectively.


        International American Group

                In October 1999, White Mountains acquired the group of companies included in the International American Group, which included American Centennial, British Insurance Company and Peninsula.

                Delaware-domiciled American Centennial and Cayman Island-domiciled British Insurance Company are property and casualty insurance and reinsurance companies in run-off. At December 31, 20042007 and 2003,2006, American Centennial had $61.3$78 million and $61.1$80 million of total assets and $21.0$11 million and $22.6$13 million of shareholder's equity, respectively. At December 31, 20042007 and 2003,2006, British Insurance Company had $33.4$18 million and $25.7$37 million of total assets and $4.5$6 million and $5.6$8 million of shareholder's equity, respectively.

                In January 2004,WTM Bank Facility

                During the second quarter of 2007, White Mountains sold Peninsula, which isreplaced its existing credit facility with a Maryland-domiciled propertynew $475 million revolving credit facility that matures in June 2012 (the "WTM Bank Facility"). This new facility removed WMRe Group as co-borrower and casualty insurer, for $23.3 million. Atco-guarantor, added certain intermediate holding companies of White Mountains as co-guarantors and amended and/or removed certain financial and other covenants. As of December 31, 2003 Peninsula had $60.6 million2007, the WTM Bank Facility was undrawn.

        INVESTMENTS

                White Mountains' investment philosophy is to maximize its after-tax total risk-adjusted return over the long term. Under this approach, each dollar of total assetsafter-tax investment income and $21.7 millionrealized and unrealized gains and losses is valued equally. White Mountains' investment portfolio mix as of shareholder's equity, respectively. For the years ended December 31, 2003 and 2002, Peninsula had $34.1 million and $29.5 million2007 consisted in large part of net written premiums, respectively.


        INVESTMENTS

                The investment portfolios of White Mountains' insurance and reinsurance operations consist primarily ofhigh-quality, fixed maturity investments but also consist, in part, ofand short-term investments, commonas well as equity securitiesinvestments and other investments, (principally investments insuch as hedge funds, limited partnership interests).partnerships and private equities. White Mountains' management believes that prudent levels of investments in common equity securities and other investments within its investment portfolio are likely to enhance long-term after-tax total returns without significantly increasing the risk profile of the portfolio when considered over long periods of time and balanced with leverage and insurance risk considerations. White Mountains seeks to maximize after-tax risk-adjusted returns over the long term.portfolio.

                At December 31, 2004, approximately 99% of White Mountains' fixed maturity investments received an investment grade rating from Standard and Poor's ("S&P") or from Moody's Investor Services ("Moody's") if a given security is unrated by S&P. S&P and Moody's are two third party rating agencies that assess the credit quality of companies that have publicly issued debt. An investment grade rating, which is indicative of a strong credit profile of an issuer, is defined as "BBB-" (Adequate, the 10th highest of 24 ratings) or better by S&P and "Baa3" (Adequate, the 10th highest of 21 ratings) or better by Moody's. White Mountains expects to continue to invest primarily in high quality, fixed maturity investments. Nearly all the fixed maturity investments currently held by White Mountains are publicly traded, and as such are considered to be liquid.

                At December 31, 2004 White Mountains' consolidated investment portfolio consisted of $7,900.0 million (75%) of fixed maturity investments, $1,058.2 million (10%) of short-term investments, $1,043.9 million (10%) of common equity securities and $527.4 million (5%) of other investments. White Mountains' fixed maturity investments at December 31, 2004 consisted principally of corporate debt securities (49%), U.S. government and agency securities (30%), foreign government obligations (10%), mortgage-backed securities (9%) and preferred equity securities and municipal bonds (2%).


                White Mountains' investment philosophy is to invest all assets with a view towards maximizing its after-tax total return over extended periods of time. Under this approach, each dollar of after-tax investment income, realized and unrealized gains and losses is valued equally.        White Mountains' overall fixed maturity investment strategy is to purchase securities that are attractively priced in relation to perceived credit risks. White Mountains generallyalso actively manages the interest rate risk associated with holding fixed maturity investments by actively monitoring and maintaining the average duration of the portfolio, about 2.5 years including short-term investments and about 3.0 years excluding short-term investments at December 31, 2007, to seek the highest after-tax, risk-adjusted total returns.

                Prospector's equity investment strategy is to maximize absolute risk-adjusted total return through investments in a variety of equity and equity-related instruments, using a bottom-up, value discipline. Preservation of capital is of the utmost importance. Using a value orientation, Prospector invests in relatively concentrated positions in the United States and other developed markets.

          Trust account investments

                In connection with the OneBeacon Offering, Fund American and FAEH each established an irrevocable grantor trust. The assets of each trust were solely dedicated to the satisfaction of the payment of dividends and redemption amounts, respectively, on $300 million liquidation preference of Fund American's Berkshire Preferred Stock, and $20 million liquidation preference of FAEH's Zenith Preferred Stock. Fund American and FAEH funded their respective trusts with cash and purchased a portfolio of fixed maturity securities issued by the U.S. government and government sponsored enterprises, the scheduled interest and principal payments of which are sufficient to pay when due all amounts required under the terms of the Berkshire Preferred Stock and the Zenith Preferred Stock, respectively (including the mandatory redemption of the Berkshire Preferred Stock in May 2008 and the optional redemption of the Zenith Preferred Stock in June 2007, which White Mountains exercised and redeemed).

          Prospector Offshore Fund, Ltd.

                White Mountains owns approximately 46% of the Prospector Offshore Fund, Ltd. ("Prospector Fund"). The Prospector Fund is managed by Prospector, a registered investment advisor, and is consolidated within White Mountains' financial statements. The Prospector Fund is an open-ended mutual fund that pursues investment opportunities in a variety of equity and equity-related instruments, with a view towards achieving an adequate after-tax total return without subjectingprincipal focus on the portfolio to an unreasonable level of interest rate risk.financial services sector and a special emphasis on the insurance industry.

                At December 31, 2004,2007 and 2006, the durationProspector Fund had $207 million and $211 million of total assets and accounted for $64 million and $59 million of White Mountains' fixed maturity investments and short-term investments was approximately 3 years.net assets, respectively.


          Montpelier Re Holdings Ltd. ("Montpelier")

                In December 2001, White Mountains, the Benfield Group plc and several other private investors established Montpelier Re and its wholly ownedwholly-owned subsidiary Montpelier Reinsurance Ltd. ("Montpelier Re"). Montpelier Re is a Bermuda-domiciled insurance and reinsurance company that was formed with approximately $1.0 billion in capital to respond to the then favorable underwriting and pricing environment in the reinsurance industry. Montpelier Re has initially focused on property reinsurance business. Montpelier Re is rated "A" (Excellent, the third highest of fifteen ratings) by A.M. Best. On October 15, 2002, Montpelier Re successfully completed an initial public offering and its common shares are listed on the New York Stock Exchange. White Mountains initially invested $180 million in Montpelier Re in exchange for 10.8 million common shares and warrants to acquire 4.8 million additional common shares of Montpelier.Montpelier Re.

                During the first quarter of 2004, White Mountains sold 4.5 million common shares of Montpelier to third parties. As a result of this sale, as well as changes to the composition of the Board of Directors of both Montpelier and White Mountains, White Mountains changed the method of accounting for its remaining common share investment in Montpelier as of March 31, 2004 from an equity method investment in an unconsolidated affiliate to a common equity security classified as available for sale and carried at fair value. Also during the first quarter of 2004, White Mountains purchased additional warrants to acquire 2.4 million common shares of Montpelier Re from an existing warrant holder for $54.1 million in cash, thereby raising the total number of such warrants owned byand White Mountains sold 4.5 million common shares of Montpelier Re to 7.2third parties. During 2006, White Mountains sold an additional 5.4 million shares of its common share investment in Montpelier Re to third parties.

                At December 31, 2006, White Mountains' investment in Montpelier Re warrants and common shares totaled $67 million. TheOn May 1, 2007, White Mountains sold all of its remaining interest in Montpelier Re, which consisted of 939,039 common shares and warrants haveto purchase 7,172,376 common shares, for total proceeds of $65 million and recognized an exercise priceafter tax loss of $16.67 per share (as adjusted for stock splits) and are exercisable until December 2011.$1.8 million.


        Investments in Unconsolidated Affiliates

          Symetra Financial Corporation ("Symetra")

                On August 2,In 2004, White Mountains, Berkshire and several other private investors capitalized Symetra in order to purchase the life and investment operations of Safeco Corporation for $1.35 billion. The acquired companies which are now operating under the Symetra brand, focus mainly on group insurance, individual life insurance, structured settlements and retirement services. Symetra had an initial capitalization of approximately $1.4 billion, consisting of $1,065 million of common equity and $315 million of debt. White Mountains invested $194.7$195 million in Symetra in exchange for 2.0 million common shares of Symetra. In addition, White Mountains and Berkshire each received warrants to acquire an additional 1.1 million common shares of Symetra at $100 per share. White Mountains owns approximately 19% of the outstanding common shares of Symetra and approximately 24% of Symetra on a fully-converted basis including the warrants. Three White Mountains designees serve on Symetra's eightseven member board of directors. White Mountains accounts for its investment in Symetra under the equity method as an investment in an unconsolidated affiliate.

                On October 26, 2007, Symetra executed a 7.7-for-1 stock dividend (substantially equivalent to an 8.7-for-1 stock split) that increased White Mountains' investment in Symetra's common shares from 2.0 million to 17.4 million, and the number of warrants to acquire additional common shares from 1.1 million at $100 per share to 9.5 million at $11.49 per share. The stock split, effected in the form of a dividend, had no effect on White Mountains' percentage of ownership in Symetra.

                Symetra's total revenues and net income for the five monthsyears ended December 31, 20042007, 2006, and 2005 were $701.9$1,590 million and $54.3$167 million, respectively.$1,568 million and $159 million, and $1,628 million and $146 million. Symetra's total assets and shareholders' equity as of December 31, 20042007 and 2006 were $22.1$19.6 billion and $1.4$1.3 billion, respectively, and $20.1 billion and $1.3 billion, respectively. Symetra's principal insurance operating subsidiaries are rated "A" (Excellent, the third highest of fifteen ratings) by A.M. Best and "A-" (Strong, the seventh highest of twenty-one ratings) by Standard & Poor's.

                As of December 31, 2004,2007 and 2006, White


        Mountains' total investment in Symetra was $248.4$324 million and $307 million, respectively, excluding $56.6$6 million and $4 million, respectively, of equity in unrealized gainslosses from Symetra's fixed maturity investments. During 2007 and 2006, White Mountains received special cash dividends from Symetra of $31 million and $16 million on its common share investment and $17 million and $9 million on its warrant investment.

          Pentelia

                In April of 2007, White Mountains invested $50 million in Pentelia, a fund that invests in insurance-related investment assets. White Mountains has determined that its investment in Pentelia is a variable interest entity. However, since White Mountains is not the primary beneficiary, it accounts for its interests in Pentelia as an equity method investment in an unconsolidated affiliate. White Mountains' exposure to loss is limited to the carrying value of its investment in Pentelia, which, as of December 31, 2007, was $52 million.

          Delos

                On August 3, 2006, White Mountains Re sold Sirius America to Delos. As part of the transaction, White Mountains invested $32 million in Delos, representing an equity interest of approximately 18%, which is accounted for as an equity method investment in an unconsolidated affiliate. As of December 31, 2007, White Mountains' total investment in Delos was $34 million.


          Main Street America Holdings, Inc. ("MSA")

                MSA is a subsidiary of National GrangeMain Street America Group Mutual Insurance CompanyHoldings, Inc. ("NGM"Main Street Group"), a New Hampshire-domiciledFlorida-domiciled mutual property and casualty insurance holding company, which insures risks located primarily in New York, Massachusetts, Connecticut, Pennsylvania, New Hampshire, Virginia and Florida. White Mountains ownsowned 50% of the outstanding common stock of MSA and accounts for this investment using the equity method.from March 1998 until October 2006, when White Mountains'Mountains received a $70 million cash dividend from MSA, following which White Mountains sold its 50% common stock investment in MSA was $161.6 million and $142.8 million at December 31, 2004 and December 31, 2003, respectively. MSA's net written premiums totaled $454.5 million, $427.6 million and $357.3 million and its net income (loss) was $29.6 million, $29.3 million and ($13.2)to Main Street America Group, Inc. ("MSA Group") for (i) $70.0 million in 2004, 20039.0% non-voting cumulative perpetual preferred stock of MSA Group, and 2002. MSA's total assets(ii) 4.9% of the common stock of MSA Group. As a result of this transaction, White Mountains no longer accounts for its investment in MSA under the equity method as of December 31, 2004 and 2003 were $978.1 million and $875.1 million and its shareholders' equity was $323.3 million and $290.4 million. The principal insurance operating subsidiaries of NGM and MSA are rated "A" (Excellent, the third highest of fifteen ratings) by A.M. Best.an investment in an unconsolidated affiliate.


        REGULATION

        United States

                White Mountains' U.S.-based insurance and reinsurance operating subsidiaries are subject to regulation and supervision in each of the states where they are domiciled and licensed to conduct business. Generally, regulatory authorities have broad supervisory and administrative powers over such matters as licenses, standards of solvency, premium rates, policy forms, investments, security deposits, methods of accounting, form and content of financial statements, reserves for unpaid loss and LAE, reinsurance, minimum capital and surplus requirements, dividends and other distributions to shareholders, periodic examinations and annual and other report filings. In general, such regulation is for the protection of policyholders rather than shareholders. White Mountains believes that it is in compliance with all applicable laws and regulations pertaining to its business that would have a material effect on its financial position in the event of non-compliance.

                Over the last several years most states have implemented laws that establish standards for current, as well as continued, state accreditation. In addition, the NAIC has adopted risk-based capital ("RBC") standards for property and casualty insurers as a means of monitoring certain aspects affecting the overall financial condition of insurance companies. The current RBC ratios of White Mountains' active insurance and reinsurance operating subsidiaries are satisfactory and such ratios are not expected to result in any adverse regulatory action. White Mountains is not aware of any current recommendations by regulatory authorities that would be expected to have a material effect on its results of operations or liquidity.

                As a condition of its license to do business in certain states, White Mountains' insurance operating subsidiaries are required to participate in mandatory shared market mechanisms. Each state dictates the types of insurance and the level of coverage that must be provided. The most common type of shared market mechanism in which White Mountains is required to participate is an assigned risk plan. Many states operate assigned risk plans. The NYAIP and New Jersey commercial automobile insurance plans are two such shared market mechanisms in which OneBeacon is required to participate. These plans require insurers licensed within the applicable state to accept the applications for insurance policies of individuals who are unable to obtain insurance in the voluntary market. The total number of such policies an insurer is required to accept is based on its market share of voluntary business in the state. Underwriting results related to assigned risk plans are typically adverse. Accordingly, OneBeacon may be required to underwrite policies with a higher risk of loss than it would otherwise accept.

                Reinsurance facilities are another type of shared market mechanism. Reinsurance facilities require an insurance company to accept all applications submitted by certain state designated agents. The


        reinsurance facility then allows the insurer to cede some of its business to the reinsurance facility so that the facility will reimburse the insurer for claims paid on ceded business. Typically, however, reinsurance facilities operate at a deficit, which is funded through assessments against the same insurers. The Massachusetts Commonwealth Automobile Reinsurers is one such reinsurance facility in which OneBeacon is compelled to participate. As a result, OneBeacon could be required to underwrite policies with a higher risk of loss than it would otherwise voluntarily accept.

                The insurance laws of many states generally provide that property and casualty insurers doing business in those states belong to a statutory property and casualty guaranty association. The purpose of these guaranty associations is to protect policyholders by requiring that solvent property and casualty insurers pay certain insurance claims of insolvent insurers. These guaranty associations generally pay these claims by assessing solvent insurers proportionately based on the insurer's share of voluntary written premiums in the state. While most guaranty associations provide for recovery of assessments through rate increases, surcharges or premium tax credits, there is no assurance that insurers will ultimately recover these assessments. At December 31, 2004,2007, the reserve for such assessments at OneBeacon totaled $18.3$17 million.


                Many states have laws and regulations that limit an insurer's ability to exit a market. For example, certain states limit a private passenger automobile insurer's ability to cancel and non-renew policies. Furthermore, certain states prohibit an insurer from withdrawing from one or more lines of insurance business in the state, unless the state regulators approve the company's withdrawal plans. State regulators may refuse to approve such plans on the grounds that they could lead to market disruption. Such laws and regulations may restrict White Mountains' ability to exit unprofitable markets.

                Nearly all states have insurance laws requiring personal property and casualty insurers to file price schedules, policy or coverage forms, and other information with the state's regulatory authority. In most cases, such price schedules and/or policy forms must be approved prior to use. While pricing laws vary from state to state, their objectives are generally to ensure that prices are adequate, not excessive and not discriminatory. For example, Massachusetts, a state where OneBeacon has a sizable presence, setshad previously set virtually all aspects of automobile insurance rates, including agent commissions. SuchWhile the state is now transitioning to a system of managed competition, existing regulations oftencontinue to challenge an insurers ability to adequately price its product, which often leads to unsatisfactory underwriting results.

                White Mountains' U.S. insurance and reinsurance operating subsidiaries are subject to state laws and regulations that require investment portfolio diversification and that limit the amount of investment in certain categories. Non-compliance may cause non-conforming investments to be non-admitted in measuring statutory surplus and, in some instances, may require divestiture. White MountainsMountains' investment portfolio at December 31, 20042007 complied with such laws and regulations in all material respects.

                One of the primary sources of cash inflows for the Company and certain of its intermediary holding companies is dividends received from its insurance and reinsurance operating subsidiaries. Under the insurance laws of the states under which White Mountains' U.S.-based insurance and reinsurance subsidiaries are domiciled, an insurer is restricted with respect to the timing or the amount of dividends it may pay without prior approval by regulatory authorities. See "Dividend Capacity" in the "LIQUIDITY AND CAPITAL RESOURCES" section of Item 7 for further discussion.

                White Mountains is subject to regulation under certain state insurance holding company acts. These regulations contain reporting requirements relating to the capital structure, ownership, financial condition and general business operations of White Mountains' insurance and reinsurance operating subsidiaries. These regulations also contain special reporting and prior approval requirements with respect to certain transactions among affiliates. Since the Company is an insurance holding company, the domiciliary states of its insurance and reinsurance operating subsidiaries impose regulatory application and approval requirements on acquisitions of Common SharesWhite Mountains' common shares which may be deemed to


        confer control over those subsidiaries, as that concept is defined under the applicable state laws. Acquisition of as little as 10% of White Mountains' Common Sharescommon shares, or in some states as little as 5%, may be deemed to confer control under the insurance laws of some jurisdictions, and the application process for approval can be extensive and time consuming.

                While the federal government does not directly regulate the insurance business, federal legislation and administrative policies affect the insurance industry. In addition, legislation has been introduced from time to time in recent years that, if enacted, could result in the federal government assuming a more direct role in the regulation of the insurance industry. A federal lawIn December of 2007, the United States government extended the Terrorism Act until December 31, 2014. The Terrorism Act was originally enacted in 2002 the Terrorism Act, providesand established a "back-stop" toFederal "backstop" for commercial property and casualty insurers inlosses, including workers compensation, resulting from acts of terrorism by or on behalf of any foreign person or foreign interest. As extended, the eventlaw now covers domestic acts of future terrorist acts perpetrated by foreign agents or interests. The law limits the industry's aggregate liability by requiring the federal government to share 90 percent of certified losses once a company meets a specific retention or deductible as determined by its prior year's direct written premiums and limits the aggregate liability to be paid by the government and industry without further action by Congress at $100 billion.terrorism. In exchange for this "back-stop""backstop", primary insurers are required to make coverage available to commercial insureds for losses from acts of non-domestic terrorism as specified in the Terrorism Act. OneBeacon is actively complying with the requirements of the Terrorism Act in order to ensure its ability to be reimbursed by the federal government for any losses it may incur as a result of future terrorist acts. (See "Terrorism" in the "ONEBEACON" `sectionsection of this Item for a further discussion of the Terrorism Act.)Act). A number of additional enacted and pending legislative measures could lead to increased consolidation and increased competition for business and for capital in the financial services industry. White Mountains cannot predict whether any state or federal measures will be adopted to change the nature or scope of the regulation of the insurance business or what effect such measures may have on its insurance and reinsurance operations.

                Environmental cleanup of polluted waste sites is subject to both federal and state regulation. The Comprehensive Environmental Response Compensation and Liability Act of 1980 ("Superfund") and comparable state statutes govern the cleanup and restoration of waste sites by potentially responsible parties ("PRPs"). These laws can impose liability for the entire cost of clean-up upon any responsible party, regardless of fault. The insurance industry in general is involved in extensive litigation regarding coverage issues arising out of the cleanup of waste


        sites by insured PRPs and as a result has disputed many such claims. From time to time, comprehensive Superfund reform proposals are introduced in Congress, but none has yet been enacted. At this time, it remains unclear as to whether Superfund reform legislation will be enacted or that any such legislation will provide for a fair, effective and cost-efficient system for settlement of Superfund related claims. The NICO Cover includes coverage for such exposures at OneBeacon; however, there can be no assurance that the coverage provided under the NICO Cover will ultimately prove to be adequate.


        Sweden

                Sirius International is subject to regulation and supervision by the Swedish Financial Supervisory Authorities (the "FSA"). As Sweden
        is a member of the European Union (the "EU"), this supervision covers all locations within the EU. Generally, the FSA has broad supervisory and administrative powers over such matters as licenses, standards of solvency, investments, methods of accounting, form and content of financial statements, minimum capital and surplus requirements, annual and other report filings. In general, such regulation is for the protection of policyholders rather than shareholders. White Mountains believes that it is in compliance with all applicable laws and regulations pertaining to its business that would have a material effect on its financial position in the event on non-compliance.

                In accordance with provisions of Swedish law, Sirius International can voluntarilyis permitted to transfer up to the full amount of its pretax earnings, or a portion thereof,pre-tax income, subject to certain limitations, into an untaxed reserve referred to as a safety reserve. The safety reserve, is a Swedish regulatory concept that has no equivalent under GAAP. Accordingly, underwhich equaled $1.4 billion at December 31, 2007. Under GAAP, an amount equal to Sirius International'sthe safety reserve, of $1.1 billion at December 31, 2004, net of the related deferred tax liability established at the statutory Swedish tax rate of 28%, is classified as shareholder's equity. Generally, this deferred tax liability is only required to be paid by Sirius International if it fails to maintain predetermined levels of premium writings and loss reserves in future years. As a result of the indefinite deferral of these taxes, Swedish regulatory authorities do not apply any taxes to the safety reserve when calculating solvency capital under Swedish insurance regulations. Accordingly, under local statutory requirements, an amount equal to the deferred tax liability on Sirius International's safety reserve ($398 million at December 31, 2007) is included in solvency capital. Access to the safety reserve is restricted to coverage of aggregate losses and requires the approval of Swedish regulatory authorities.

        Bermuda Insurance Regulation

                The Insurance Act 1978 of Bermuda and related regulations, as amended (the "Insurance Act"), regulates the insurance business of WMRe (Bermuda) and Scandinavian Re, and provides that no person may carry on any insurance business in or from within Bermuda unless registered as an insurer under the Insurance Act by the Bermuda Monetary Authority ("BMA"). The BMA, in deciding whether to grant registration, has broad discretion to act as it thinks fit in the public interest. The BMA is required by the Insurance Act to determine whether the applicant is a fit and proper body to be engaged in the insurance business and, in particular, whether it has, or has available to it, adequate knowledge and expertise to operate an insurance business. In addition, the BMA is required by the Insurance Act to determine whether a person who proposes to control 10 percent, 20 percent, 33 percent or 50 percent (as applicable) of the voting powers of a Bermuda registered insurer or its parent company is a fit and proper person to exercise such degree of control.

                The continued registration of an applicant as an insurer is subject to the applicant complying with the terms of its registration and such other conditions as the BMA may impose from time to time. The Insurance Act also grants to the BMA powers to supervise, investigate and intervene in the affairs of insurance companies.

                The Insurance Act imposes on Bermuda insurance companies solvency and liquidity standards as well as auditing and reporting requirements. White Mountains believes that it is in compliance with all applicable laws and regulations pertaining to its business that would have a material effect on its financial position in the event on non-compliance.

        Certain Other Bermuda Law Considerations

                White Mountains is an exempted company organized under the Companies Act 1981 of Bermuda (the "Companies Act"). As a result, White Mountains needs to comply with the provisions of the Companies Act regulating the payment of dividends and making of distributions from contributed surplus. A company is prohibited from declaring or paying a dividend, or making a distribution out of contributed surplus, if there are reasonable grounds for believing that:

          (1)
          the company is, or would after the payment be, unable to pay its liabilities as they become due; or

          (2)
          the realizable value of the company's assets would thereby be less than the aggregate of its liabilities and its issued share capital and share premium accounts.

                  Under White Mountains' bye-laws, each common share is entitled to dividends if, and when, dividends are declared by its board of directors, subject to any preferred dividend right of the holders of any preference shares. Issued share capital is the aggregate par value of the company's issued shares, and the share premium account is the aggregate amount paid for issued shares over and above their par value. Share premium accounts may be reduced in certain limited circumstances. In addition, the Companies Act regulates return of capital, reduction of capital and any purchase or redemption of shares by White Mountains.

                  Although White Mountains is incorporated in Bermuda, it has been designated as a non-resident of Bermuda for exchange control purposes by the BMA. Pursuant to its non-resident status, White Mountains may hold any currency other than Bermuda dollars and convert that currency into any other currency, other than Bermuda dollars, without restriction.

                  Shares may be offered or sold in Bermuda only in compliance with the provisions of the Investment Business Act of 2003 and the Exchange Control Act 1972, and related regulations of Bermuda which regulate the sale of securities in Bermuda. In addition, specific permission is required from the BMA pursuant to the provisions of the Exchange Control Act 1972 and related regulations, for all issuances and transfers of securities of Bermuda companies, other than in cases where the BMA has granted a general permission. The BMA in its policy dated June 1, 2005 provides that where any equity securities, including White Mountains' common shares, of a Bermuda company are listed on an appointed stock exchange, general permission is given for the issue and subsequent transfer of any securities of a company from and/or to a non-resident, for as long as any equities securities of such company remain so listed. The New York Stock Exchange is deemed to be an appointed stock exchange under Bermuda law. Notwithstanding the above general permission, the BMA has granted White Mountains permission to, subject to its common shares being listed on an appointed stock exchange, (a) issue and transfer its shares, up to the amount of its authorized capital from time to time, to persons resident and non-resident of Bermuda for exchange control purposes; (b) issue and transfer options, warrants, depositary receipts, rights, and other securities; and (c) issue and transfer loan notes and other debt instruments and options, warrants, receipts, rights over loan notes and other debt instruments to persons resident and non-resident of Bermuda for exchange control purposes.

                  Under Bermuda law, exempted companies are companies formed for the purpose of conducting business outside Bermuda from a principal place in Bermuda. As exempted companies, White Mountains may not, without the express authorization of the Bermuda legislature or under a license granted by the Bermuda Minister of Finance, participate in various specified business transactions, including:

            the acquisition or holding of land in Bermuda, except land held by way of lease or tenancy agreement which is required for White Mountains' business and held for a term not exceeding 50 years, or which is used to provide accommodation or recreational facilities for White Mountains' officers and employees and held with the consent of the Bermuda Minister of Finance, for a term not exceeding 21 years;

            the taking of mortgages on land in Bermuda in excess of $50,000;

            the acquisition of any bonds or debentures secured by any land in Bermuda, other than certain types of Bermuda government or public authority securities; or

            subject to some exceptions, the carrying on of business of any kind in Bermuda for which White Mountains is not licensed in Bermuda.

                  Under Bermuda law, non-Bermudians (other than spouses of Bermudians) may not engage in any gainful occupation in Bermuda without an appropriate governmental work permit. Work permits may be granted or extended by the Bermuda government upon showing that, after proper public advertisement in most cases, no Bermudian (or spouse of a Bermudian) is available who meets the minimum standard requirements for the advertised position. In 2001, the Bermuda government announced a new policy limiting the duration of work permits to six years, with certain exemptions for key employees. In addition, exempted companies, such as White Mountains, must comply with Bermuda resident representation provisions under the Companies Act which require that a minimum number of offices must be filled by persons who are ordinarily resident in Bermuda.


          RATINGS

                  Insurance and reinsurance companies are evaluated by various rating agencies in order to measure each company's financial strength. Higher ratings generally indicate financial stability and a stronger ability to pay claims. A.M. Best currently rates OneBeacon's, White Mountains Re's and Esurance's principal operating insurance subsidiaries "A" (Excellent, the third highest of fifteen ratings) and NFU "A-" (Excellent, the fourth highest of fifteen ratings). White Mountains believes that strong ratings are important factors in the marketing of insurance and reinsurance products to agents and consumers and ceding companies.

                  Rating agencies also evaluate the general creditworthiness of debt securities issued by companies. Their ratings are then used by existing or potential investors to assess the likelihood of repayment on a particular debt issue. White Mountains believes that strong debt ratings are important factors that provide better financial flexibility when issuing new debt or restructuring existing debt.

                  The following table presents the financial strength ratings assigned to White Mountains' principal insurance and reinsurance operating subsidiaries and the debt ratings for White Mountains' principal financial instruments as of February 28, 2008:


          A.M. Best(1)
          Standard & Poor's(2)
          Moody's(3)
          Fitch(4)
          OneBeacon
          Rating"A" (Excellent)"A" (Strong)"A2" (Good)"A" (Strong)
          OutlookStableStableStableStable

          Folksamerica


          Rating"A-" (Excellent)"A-" (Strong)"A3" (Good)"A-" (Strong)
          OutlookStableStableStableStable

          Sirius International


          Rating"A" (Excellent)"A-" (Strong)"A3" (Good)"A-" (Strong)
          OutlookStableStableStableStable

          WMRe (Bermuda)


          Rating"A-" (Excellent)No RatingNo RatingNo Rating
          OutlookStableN/AN/AN/A

          Esurance


          Rating"A-" (Excellent)No RatingNo RatingNo Rating
          OutlookStableN/AN/AN/A

          Fund American Senior Notes(5)


          Rating"bbb" (Adequate)"BBB" (Adequate)"Baa2" (Medium Grade)"BBB" (Good)
          OutlookStableStableStableStable

          WMRe Senior Notes


          Rating"bbb-" (Adequate)"BBB-" (Adequate)"Baa3" (Medium Grade)"BBB" (Good)
          OutlookStableStableStableStable

          WMRe Preference Shares


          Rating"bb" (Speculative)"BB" (Speculative)"Ba2" (Speculative)"BBB-" (Good)
          OutlookStableStableStableStable

          (1)
          "A" is the third highest of fifteen financial strength ratings, "A-" is the fourth highest of fifteen financial strength ratings, "bbb" is the ninth highest of twenty-two creditworthiness ratings, "bbb-"is the tenth highest of twenty-two creditworthiness ratings, and "bb" is the twelfth highest of twenty-two creditworthiness ratings assigned by A.M. Best.

          (2)
          "A" is the sixth and "A-" is the seventh highest of twenty-one financial strength ratings and "BBB" is the ninth highest of twenty-two creditworthiness ratings, "BBB-"is the tenth highest of twenty-two creditworthiness ratings, and "BB" is the twelfth highest of twenty-two creditworthiness ratings assigned by Standard & Poor's.

          (3)
          "A2" is the sixth and "A3" is the seventh highest of twenty-one financial strength ratings and "Baa2" is the ninth highest of twenty-one creditworthiness ratings, "Baa3" is the tenth highest of twenty-one creditworthiness ratings, and "Ba2" is the twelfth highest of twenty-one creditworthiness ratings assigned by Moody's.

          (4)
          "A" is the sixth and "A-" is the seventh highest of twenty-one financial strength ratings, "BBB" is the ninth highest of twenty-three creditworthiness ratings, and "BBB-"is the tenth highest of twenty-three creditworthiness ratings assigned by Fitch.

          (5)
          The Fund American Senior Notes are fully and unconditionally guaranteed as to the payment of principal and interest by the Company.


          EMPLOYEES

                  As of December 31, 2004,2007, White Mountains employed 5,0305,045 persons (consisting of 6540 persons at the Company and its intermediate holding companies, 3,8682,673 persons at OneBeacon, 542522 persons at White Mountains Re, 5421,754 persons at Esurance, 32 persons at WM Advisors, 9 persons at WM Life Re, 6 persons at Galileo and 139 persons at the International American Group companies). Management believes that White Mountains has satisfactory relations with its employees.


          AVAILABLE INFORMATION

                  The Company is subject to the informational reporting requirements of the Exchange Act. In accordance therewith, the Company files reports, proxy statements and other information with the SEC. These documents are available at www.whitemountains.com shortly after such material is electronically filed with or furnished to the SEC. In addition, the Company's code of business conduct and ethics as well as the various charters governing the actions of certain of the Company's Committees of its Board of Directors, including its Audit Committee, Compensation Committee and its Nominating and Governance Committee, are available at www.whitemountains.com.www.whitemountains.com.

                  The Company will provide to any shareholder, upon request and without charge, copies of these documents (excluding any applicable exhibits unless specifically requested). Written or telephone requests should be directed to the Corporate Secretary, White Mountains Insurance Group, Ltd., 80 South Main Street, Hanover, New Hampshire 03755, telephone number (603) 640-2200. Additionally, all such documents are physically available at the Company's registered office at Clarendon House, 2 Church Street, Hamilton, HM 11 Bermuda.

          Item 1A.    Risk Factors

                  The information contained in this report may contain "forward-looking statements" within the meaning of Section 27A of the Securities Act of 1933 and Section 21E of the Securities Exchange Act of 1934.See "FORWARD-LOOKING STATEMENTS"(page 95) for specific important factors that could cause actual results to differ materially from those contained in forward-looking statements. The Company's actual future results and trends may differ materially depending on a variety of factors including, but not limited to, the risks and uncertainties discussed below.

          Unpredictable catastrophic events could adversely affect our financial condition or results of operations.

                  We write insurance and reinsurance policies that cover catastrophic events. Our policies cover unpredictable natural and other disasters, such as hurricanes, windstorms, earthquakes, floods, fires and explosions. In recent years, the frequency of major weather-related catastrophes has increased. Our exposure to catastrophic windstorm damage in the Northeastern United States is the largest single natural risk to our business. In the case of OneBeacon, some extremely remote modeled catastrophic events, or series of catastrophic events, could be of sufficient size to cause OneBeacon to become insolvent, which could adversely effect our financial condition and results of operations. We also have significant exposure to a major earthquake in California or Japan and windstorm damage in Northern Europe, the United States Atlantic Coast (i.e., Massachusetts to Florida) and the United States Gulf Coast region (i.e., Florida to Texas). In addition, we are exposed to losses from terrorist attacks, such as the attacks on the United States on September 11, 2001.

                  The extent of losses from a catastrophe is a function of both the total amount of insured exposure in the area affected by the event and the severity of the event. Increases in the value of insured property, the effects of inflation and changes in cyclical weather patterns may increase the severity of claims from catastrophic events in the future. Claims from catastrophic events could reduce our earnings and cause substantial volatility in our results of operations for any fiscal quarter or year and adversely affect our financial condition. Our ability to write new insurance and reinsurance policies could also be impacted as a result of corresponding reductions in our surplus levels.

                  We manage our exposure to catastrophic losses by limiting the aggregate insured value of policies in geographic areas with exposure to catastrophic events and by estimating a PML for many different catastrophe scenarios and by buying reinsurance. To manage and analyze aggregate insured values and PML, we use a variety of tools, including catastrophe modeling software packages. Our estimates of PML are dependent on many variables, including assumptions about the demand surge and storm surge, loss adjustment expenses, insurance-to-value and storm intensity in the aftermath of weather-related catastrophes utilized to model the event, the relationship of the actual event to the modeled event and the quality of data provided to us by ceding companies (in the case of our reinsurance operations). Accordingly, if our assumptions about the variables are incorrect, the losses we might incur


          from an actual catastrophe could be materially higher than our expectation of losses generated from modeled catastrophe scenarios and our financial condition and results of operations could be materially adversely affected.

          We may not be able to successfully alleviate risk through reinsurance and retrocessional arrangements. Additionally, we may be unable to collect all amounts due from our reinsurers under our existing reinsurance and retrocessional arrangements.

                  We attempt to limit our risk of loss through reinsurance and retrocessional arrangements. Retrocessional arrangements refer to reinsurance purchased by a reinsurer to cover its own risks assumed from primary ceding companies. The availability and cost of reinsurance and retrocessional protection is subject to market conditions, which are outside of our control. As a result, we may not be able to successfully alleviate risk through these arrangements, which could have a material adverse effect on our financial condition and results of operations.

                  We are not relieved of our obligation to our policyholders or ceding companies by purchasing reinsurance. Accordingly, we are subject to credit risk with respect to our reinsurance and retrocessions in the event that a reinsurer is unable to pay amounts owed to us as a result of a deterioration in its financial condition. A number of reinsurers in the industry experienced such a deterioration in the aftermath of the 2001 terrorist attacks and the active 2005 hurricane season. It is possible that one or more of our reinsurers will be significantly adversely affected by future significant loss events, causing them to be unable to pay amounts owed to us. We also may be unable to recover amounts due under our reinsurance and retrocessional arrangements if our reinsurers choose to withhold payment due to a dispute or other factors beyond our control.

          Our loss reserves may be inadequate to cover our ultimate liability for losses and as a result our financial results could be adversely affected.

                  We are required to maintain adequate reserves to cover our estimated ultimate liabilities for loss and loss adjustment expenses. Loss and LAE reserves are typically comprised of (1) case reserves for claims reported and (2) IBNR reserves for losses that have occurred but for which claims have not yet been reported, or IBNR, which include a provision for expected future development on case reserves. These reserves are estimates based on actuarial and statistical projections of what we believe the settlement and administration of claims will cost based on facts and circumstances then known to us. Because of the uncertainties that surround estimating loss and LAE reserves, we cannot be certain that our reserves are adequate and actual claims and claim expenses paid might exceed our reserves due to the uncertainties that surround estimating loss and LAE reserves. If we determine in the future that our reserves are insufficient to cover our actual loss and LAE, we would have to strengthen our reserves, which could have a material adverse effect on our financial condition and results of operations.

                  For further discussion of our loss and LAE, including our asbestos and environmental reserves, see "Loss and Loss Adjustment Expenses" in "CRITICAL ACCOUNTING ESTIMATES" in Item 7.

          We may not maintain favorable financial strength or creditworthiness ratings which could adversely affect our ability to conduct business.

                  Third party rating agencies assess and rate the financial strength, including claims-paying ability, of insurers and reinsurers. These ratings are based upon criteria established by the rating agencies and are subject to revision at any time at the sole discretion of the agencies. Some of the criteria relate to general economic conditions and other circumstances outside the rated company's control. These financial strength ratings are used by policyholders, agents and brokers as an important means of assessing the suitability of insurers as business counterparties and have become an increasingly important factor in establishing the competitive position of insurance companies. These financial strength ratings do not refer to our ability to meet non-insurance obligations and are not a recommendation to purchase or discontinue any policy or contract issued by us or to buy, hold or sell our securities.

                  Rating agencies periodically evaluate us to confirm that we continue to meet the criteria of the ratings previously assigned to us. See "RATINGS" in Item 1 for a summary of financial strength ratings on our significant subsidiaries and creditworthiness ratings on our financial instruments. A downgrade or withdrawal of our financial strength ratings could severely limit or prevent our insurance subsidiaries from writing new insurance or reinsurance policies or renewing existing insurance policies, which could have a material adverse effect on our financial condition and results of operations. A downgrade or withdrawal of our creditworthiness ratings could severely limit our ability to raise new debt or could make new debt more costly and/or have more restrictive conditions.


                  Additionally, the majority of White Mountains Re's assumed reinsurance contracts contain optional cancellation, commutation and/or funding provisions that would be triggered if A.M. Best and/or S&P were to downgrade the financial strength ratings of either Folksamerica or Sirius International below "A-" or if the surplus of Folksamerica or Sirius International were to substantially decrease (generally, in excess of 20%). A client may choose to exercise these rights depending on, among other things, the reasons for such a downgrade, the extent of the downgrade, the prevailing market conditions, the degree of unexpired coverage, and the pricing and availability of replacement reinsurance coverage. We cannot predict in advance how many of our clients would actually exercise such rights or what effect such cancellations would have on our financial condition, results of operations and/or liquidity, but such an effect could be materially adverse.

          Our debt, preferred stock and related service obligations could adversely affect our business.

                  As of December 31, 2007, we had approximately $1,193 million face value of indebtedness, $300 million face value of mandatorily redeemable preferred stock and $250 million face value of non-cumulative perpetual preference shares outstanding. In connection with the OneBeacon Offering, we established and funded trusts that are solely dedicated to the payment of dividends and redemption amounts of our outstanding mandatorily redeemable preferred stock with a deposit of U.S. government securities.

                  Our ability to meet our debt and related service obligations will depend on our future performance, which will be affected by financial, business, economic and other factors. We will not be able to control many of these factors, such as economic conditions and governmental regulation. We cannot be certain that our earnings will be sufficient to allow us to pay the principal and interest on our debt and meet our other obligations. If we do not have enough cash, we may be required to refinance all or part of our existing debt, sell assets, borrow more cash or sell equity. We cannot assure you that we will be able to accomplish any of these alternatives on terms acceptable to us, if at all.

                  We could incur additional indebtedness and issue additional preferred stock in the future. To the extent new debt, new preferred stock and other obligations are added to our and our subsidiaries' current debt and preferred stock levels, the risks described in the previous paragraph would increase.

          Our investment portfolio may suffer reduced returns or losses which could adversely affect our results of operations and financial condition. Any increase in interest rates or volatility in the equity and debt markets could result in significant losses in the fair value of our investment portfolio.

                  Our investment portfolio consists of fixed maturity securities, short-term investments, common equity securities and other investments such as hedge funds, limited partnerships and private equities. Our investment selections are designed to maximize after-tax, total risk-adjusted return over the long term; however, investing entails substantial risks. We cannot assure you that we will achieve our investment objectives, and our investment performance may vary substantially over time.

                  Investment returns are an important part of our growth in book value, and fluctuations in the fixed income or equity markets could impair our results of operations or financial condition. A significant period of time normally elapses between the receipt of insurance premiums and the disbursement of insurance claims. During this time, we generate investment income, consisting primarily of interest earned on fixed maturity investments and dividends earned on equity securities, by investing our capital as well as insurance premiums allocated to support unpaid loss and LAE reserves. We also recognize unrealized investment gains and losses on the securities we hold in our investment portfolio and we generate investment gains and losses from sales of securities from our investment portfolio.

                  The investment income and fair market value of our investment portfolio are affected by general economic and market conditions, including fluctuations in interest rates and volatility in the stock market. Interest rates are highly sensitive to many factors, including governmental monetary policies, domestic and international economic and political conditions and other factors beyond our control. Although we attempt to manage the risks of investing in a changing interest rate environment, we may not be able to effectively mitigate interest rate sensitivity. In particular, a significant increase in interest rates could result in significant losses, realized or unrealized, in the fair value of our investment portfolio and, consequently, could have an adverse affect on our results of operations. In addition, we are exposed to changes in the level or volatility of equity prices that affect the value of securities or instruments that derive their value from a particular equity security, a basket of equity securities or a stock index. Further, because a portion of our investment portfolio is invested in securities denominated in currencies other than U.S. dollar, the value of our portfolio is sensitive to changes in foreign currency rates. These conditions are outside of our control and could adversely affect the value of our investments and our results of operations and financial condition.


          The property and casualty insurance and reinsurance industries are highly competitive and we may not be able to compete effectively in the future.

                  The property and casualty insurance and reinsurance industries are highly competitive and have, from time to time, experienced severe price competition. OneBeacon competes with numerous regional and national insurance companies, including The St. Paul Travelers Companies, Inc., Zurich Financial Services Group, CNA Financial Corporation, Hartford Financial Services Group, Inc., The Hanover Insurance Group, Inc., W.R. Berkley Corporation, The Chubb Corporation, The Progressive Corporation, Allstate Insurance Company, Liberty Mutual, American International Group, Inc. and the regional Farm Bureaus. White Mountains Re competes with numerous reinsurance companies throughout the world, including ACE Limited, Arch Capital Group Ltd., Endurance Specialty Holdings Ltd., Everest Re Group, Ltd., Hannover Ruckversicherung AG, Lloyd's of London, Munich Re Group, Partner Re Ltd., Platinum Underwriters Holdings Ltd., Renaissance Re Holdings Ltd., Swiss Re Group, Transatlantic Holdings, Inc., XL Capital Ltd and General Reinsurance Corporation. Esurance competes with national and regional personal automobile insurance companies, though Esurance's main competition comes from other direct writers like Progressive, GEICO, and 21st Century. Many of these competitors have greater financial, marketing and management resources than we do and have established long-term and continuing business relationships throughout the insurance industry, which can be a significant competitive advantage for them.

                  The agents upon whom OneBeacon relies compete with direct writers of insurance, who are often able to offer substantial discounts in pricing as compared to OneBeacon's insurance products. If OneBeacon's agents experience increased competition from direct writers of insurance, we in turn could be adversely affected if OneBeacon's agents are unable to maintain a competitive position in their respective markets. In addition, substantial new capital and competitors have entered the reinsurance market in recent years, and we expect to face further competition in the future. If we are unable to maintain our competitive position, our insurance and reinsurance businesses may be adversely affected and we may not be able to compete effectively in the future.

          We may suffer losses from unfavorable outcomes from litigation and other legal proceedings.

                  In the ordinary course of business, we are subject to litigation and other legal proceedings as part of the claims process, the outcomes of which are uncertain. We maintain reserves for these legal proceedings as part of our loss and LAE reserves. We also maintain separate reserves for legal proceedings that are not related to the claims process. In the event of an unfavorable outcome in one or more legal matters, our ultimate liability may be in excess of amounts we have currently reserved for and such additional amounts may be material to our results of operations and financial condition. For a description of our material legal proceedings, see "Item 3. Legal Proceedings."

                  As industry practices and legal, judicial, social and other conditions change, unexpected and unintended issues related to claims and coverage may emerge. These issues may adversely affect our financial condition and results of operations by either extending coverage beyond our underwriting intent or by increasing the number and size of claims. In some instances, these changes may not become apparent until some time after we have issued insurance and reinsurance contracts that are affected by the changes.

          Regulation may restrict our ability to operate.

                  The insurance and reinsurance industries are subject to extensive regulation under U.S., state and foreign laws. Governmental agencies have broad administrative power to regulate many aspects of the insurance business, which include premium rates, marketing practices, advertising, policy forms and capital adequacy. These governmental agencies are concerned primarily with the protection of policyholders rather than shareholders. Insurance laws and regulations impose restrictions on the amount and type of investments, prescribe solvency standards that must be met and maintained and require the maintenance of reserves. In our insurance underwriting, we rely heavily upon information gathered from third parties such as credit report agencies and other data aggregators. The use of this information is also highly regulated and any changes to the current regulatory structure could materially affect how we underwrite and price premiums.

                  Changes in laws and regulations may restrict our ability to operate and/or have an adverse effect upon the profitability of our business within a given jurisdiction. For example, legislation has been passed in Florida that significantly changes the reinsurance protection provided by the Florida Hurricane Catastrophe Fund to companies that write business in Florida. The new legislation also contains a provision that will disallow insurers that write homeowners insurance elsewhere in the United States to write automobile insurance in Florida unless they also write homeowners insurance in Florida. The impact of the new legislation, which could be adverse, upon White Mountains' insurance and reinsurance business in Florida cannot be determined until regulations interpreting the


          legislation are promulgated. In addition, state and Federal legislation has been proposed to establish catastrophe funds and underwriting in coastal areas which could impact our business.

          In recent years we have successfully created shareholder value through acquisitions and dispositions of insurance and reinsurance entities. We may not be able to continue to create shareholder value through such transactions in the future.

                  In the past several years, we have completed numerous acquisitions and dispositions of insurance and reinsurance entities, many of which have contributed significantly to our growth in tangible book value. Failure to identify and complete future acquisition and disposition opportunities could limit our ability to achieve our target returns. Even if we were to identify and complete future acquisition opportunities, there is no assurance that such acquisitions will ultimately achieve their anticipated benefits.

          We may become subject to taxes in Bermuda after 2016.

                  We may become subject to taxes in Bermuda after 2016. We have received a standard assurance from the Bermuda Minister of Finance, under Bermuda's Exempted Undertakings Tax Protection Act 1966, that if any legislation is enacted in Bermuda that would impose tax computed on profits or income, or computed on any capital asset, gain or appreciation, or any tax in the nature of estate, duty or inheritance tax, then the imposition of any such tax will not be applicable to us or to any of our operations or our shares, debentures or other obligations until March 28, 2016. Given the limited duration of the Minister of Finance's assurance, we cannot be certain that we will not be subject to any Bermuda tax after March 28, 2016. In the event that we become subject to any Bermuda tax after such date, it would have a material adverse effect on our financial condition and results of operations.

          Changes in tax laws or tax treaties may cause more of the income of certain non-U.S. companies in our group to become subject to taxes in the United States.

                  The taxable income of our U.S. subsidiaries is subject to U.S. Federal, state and local income taxes and other taxes. The income of the non-U.S. companies in our group is generally not subject to tax in the United States other than withholding taxes on interest and dividends. Certain of our non-U.S. companies are eligible for the benefits of tax treaties between the United States and other countries. We believe our non-U.S. companies will continue to be eligible for treaty benefits. However, it is possible that factual changes or changes to U.S. tax laws or changes to tax treaties that presently apply to our non-U.S. companies could impact income subject to tax in the United States. Similarly, changes to the applicable tax laws, treaties or regulations of other countries could subject the income of members of our group to higher rates of tax outside the United States.

          We have significant foreign operations that expose us to certain additional risks, including foreign currency risks and political risk.

                  White Mountains Re, in particular Sirius International and WMRe (Bermuda), conducts a significant portion of its business outside of the United States. As a result, a substantial portion of our assets, liabilities, revenues and expenses are denominated in currencies other than the U.S. dollar and are therefore subject to foreign currency risk. Our foreign currency risk cannot be eliminated entirely and significant changes in foreign exchange rates may adversely affect our financial condition or our results of operations.

                  Our foreign operations are also subject to legal, political and operational risks that may be greater than those present in the United States. As a result, our operations at these foreign locations could be temporarily or permanently disrupted.

          We depend on our key personnel to manage our business effectively and they may be difficult to replace.

                  Our performance substantially depends on the efforts and abilities of our management team and other executive officers and key employees. Furthermore, much of our competitive advantage is based on the expertise, experience and know-how of our key management personnel. We do not have fixed term employment agreements with any of our key employees nor key man life insurance and the loss of one or more of these key employees could adversely affect our business, results of operations and financial condition. Our success also depends on the ability to hire and retain additional personnel. Difficulty in hiring or retaining personnel could adversely affect our results of operations and financial condition.


          Bermuda law differs from the laws in effect in the United States and may afford less protection to shareholders.

                  We are organized under the laws of Bermuda, and a portion of our assets will be located outside the United States. As a result, it may not be possible for our shareholders to enforce court judgments obtained in the United States against us based on the civil liability provisions of the Federal or state securities laws of the United States, either in Bermuda or in countries other than the United States where we will have assets. In addition, there is some doubt as to whether the courts of Bermuda and other countries would recognize or enforce judgments of U.S. courts obtained against us or our directors or officers based on the civil liabilities provisions of the Federal or state securities laws of the United States or would hear actions against us or those persons based on those laws.

                  Our corporate affairs are governed by the Companies Act. The Companies Act differs in some material respects from laws generally applicable to U.S. corporations and shareholders, including the provisions relating to interested directors, amalgamations, mergers and acquisitions, takeovers, shareholder lawsuits and indemnification of directors. Generally, the duties of directors and officers of a Bermuda company are owed to the company only. Shareholders of Bermuda companies generally do not have rights to take action against directors or officers of the company and may only do so in limited circumstances. Class actions and derivative actions are generally not available to shareholders under Bermuda law. The Bermuda courts, however, would ordinarily be expected to permit a shareholder to commence an action in the name of a company to remedy a wrong to the company where the act complained of is alleged to be beyond the corporate power of the company or illegal, or would result in the violation of the company's memorandum of association or bye-laws. Furthermore, consideration would be given by a Bermuda court to acts that are alleged to constitute a fraud against the minority shareholders or, for instance, where an act requires the approval of a greater percentage of the company's shareholders than that which actually approved it.

                  When the affairs of a company are being conducted in a manner that is oppressive or prejudicial to the interests of some part of the shareholders, one or more shareholders may apply to the Supreme Court of Bermuda, which may make such order as it sees fit, including an order regulating the conduct of the company's affairs in the future or ordering the purchase of the shares of any shareholders by other shareholders or by the company. Additionally, under our bye-laws and as permitted by Bermuda law, each shareholder has waived any claim or right of action against our directors or officers for any action taken by directors or officers in the performance of their duties, except for actions involving fraud or dishonesty. In addition, the rights of our shareholders and the fiduciary responsibilities of our directors under Bermuda law are not as clearly established as under statutes or judicial precedent in existence in jurisdictions in the United States, particularly the State of Delaware. Therefore, our shareholders may have more difficulty protecting their interests than would shareholders of a corporation incorporated in a jurisdiction within the United States.

          The reinsurance business historically has been cyclical and, in the future, we expect to experience periods with excess underwriting capacity and unfavorable premium rates, terms and conditions.

                  Historically, reinsurers have experienced significant fluctuations in operating results due to competition, frequency of occurrence or severity of catastrophic events, levels of capacity, general economic conditions and other factors. The supply of reinsurance is related to prevailing prices, the level of insured losses and the level of industry surplus which, in turn, may fluctuate in response to changes in rates of return earned in the reinsurance industry. As a result, the reinsurance business historically has been a cyclical industry characterized by periods of intense price competition due to excess underwriting capacity as well as periods when shortages of capacity permitted favorable premium rate levels. For example, the industry experienced a soft casualty market of lower prices and less favorable terms from 1997 to 2001 during which profitability suffered while the losses incurred from the 2005 U.S. hurricanes triggered price increases. In addition to these considerations, changes in the frequency and severity of losses suffered by insureds and insurers significantly affect the reinsurance industry cycle. Any of these factors could lead to a significant reduction in premium rates, less favorable contract terms, fewer submissions for our underwriting capacity and potential regulatory response. We expect to continue to experience the effects of the industry's cyclicality.

          We are largely dependent upon our ceding companies' evaluation of risk.

                  White Mountains Re, like other reinsurance companies that write treaty reinsurance, generally does not evaluate separately each of the individual risks assumed under our reinsurance contracts. As such, we are largely dependent upon the cedents' original underwriting decisions. We are subject to the risk that the cedents may not have adequately or accurately evaluated the risks that they have insured, and we have reinsured, and that the premiums


          ceded may not adequately compensate us for the risks we assume. If our reserves are insufficient to cover our actual loss and LAE arising from our treaty reinsurance business, we would have to strengthen our reserves and incur charges to our earnings. These charges could be significant and could have a material adverse effect on our results of operations and financial condition.

          We have surety bonds in Latin America and write credit and bond reinsurance that could expose us to an economic downturn, or changes to the regulatory or legal environment, in certain countries and regions as a whole.

                  White Mountains, through Folksamerica, has run-off operations that include a material amount of Latin American facultative surety exposure (our "Surety Book"). Surety bonding describes a class of business where insurance companies guarantee various contractual commitments assumed by contractors and other businesses. The majority of Folksamerica's Surety Book is comprised of performance bonds, which is insurance obtained by service providers, such as construction firms, to protect against their failure to complete service engagements according to contractual terms. As of January 31, 2008, the maximum certificate or bonding value in our Surety Book (a measurement which does not factor in the percentage to completion of any of the projects supported by the bonds) was approximately $750 million. Approximately 81% of our Surety Book is represented by contracts in Colombia and 13% is represented in Brazil. While our Surety Book is comprised of a large number of contracts with relatively small individual exposures, a severe economic downturn that adversely affects the capital supply or business environment in Colombia or Brazil individually, or Latin America generally, or a significant shift in the regulatory or legal environments governing access to collateral in these markets, could have a material adverse effect on our results of operations and financial condition. An example of this type of a regional downturn is the Asian financial crisis that occurred in the mid-to-late 1990s principally affecting Thailand, South Korea and Hong Kong.

                  In addition, White Mountains Re, through Sirius International, writes credit and bond reinsurance, mostly on companies with worldwide operations. Most debtors are based in Europe, with companies in Germany, France and Italy representing approximately 40% of White Mountains Re's exposure. The bulk of the business is traditional short term commercial credit insurance, covering pre-agreed domestic and export sales of goods and services with typical coverage periods of 60 to 120 days.

                  Losses under these policies (protection of undisputed debts against declared insolvency and protracted default) are closely correlated to reductions in a respective country's gross national product. As such, a recession that occurs in a relatively short period of time and impacts multiple countries could result in higher than expected losses. As of December 31, 2007, White Mountains Re's contractual loss exposure for this business is approximately $1 billion. However, because of the short-term nature of this business, ceding companies can actively adjust credit exposures and substantially mitigate the effect of an economic crisis or a major bankruptcy. The limit of liability given above does not consider the positive impact of dynamic limit management nor does it include the credit for recoveries.

          Item 1B.    Unresolved Staff Comments

                  As of the date of this report, the Company had no unresolved comments from the Commission staff regarding its periodic or current reports under the Exchange Act.


          Item 2.    Properties

                  The Company maintains two professional offices in Hamilton, Bermuda which serve as its headquarters and its registered office. The Company's principal executive office is in Hanover, New Hampshire. In addition, the Company maintains professional offices in Guilford, Connecticut, which house its investment and corporate finance functions.

                  The United States headquarters of OneBeacon is located in Canton, Massachusetts, while its principal executive office is located in Minnetonka, Minnesota. OneBeacon also maintains offices in various cities throughout the United States.

          White Mountains Re's headquarters is in Hamilton, Bermuda with an additionaland its principal executive office is located in New Jersey.York, New York. Folksamerica is headquartered in New York, New York with branch offices in various cities throughout the United States.States and in Toronto, Canada. Sirius International is headquartered in Stockholm, Sweden with various branch offices in Europe and Asia. WMUWMRUS maintains officesan office in Dublin, Ireland and Hamilton, Bermuda. The home office of OneBeacon is located in Boston, Massachusetts, with branch offices in various cities throughout the United States. Esurance is headquartered in San Francisco, California with various offices throughout the United States. In addition, the Company maintains a professional office in Hanover, New Hampshire which serves as its principal executive office, and an office in Guilford, Connecticut, which houses its investment and corporate finance functions.


                  The Company's headquarters, registered office, principal executive office and investment and corporate finance officeoffices are leased. Sirius International's home office in Sweden and substantially all of its branch offices, as well as WMU's officesWMRUS's office in Ireland and Bermuda, are leased. Folksamerica's home office and its branch offices are leased as well. TheOneBeacon owns its home officeoffice. Most of OneBeacon and most of itsOneBeacon's branch offices are leased with the exception of branch offices located in New York, whichYork. Esurance's home office and its branch offices are owned by OneBeacon. Certain leased and owned OneBeacon office locations have been leased or subleased to


          Liberty Mutual in connection with the Liberty Agreement for a period of no more than three years.leased. Management considers its office facilities suitable and adequate for its current level of operations.


          Item 3.    Legal Proceedings

                  White Mountains, and the insurance and reinsurance industry in general, are subject to litigation and arbitration in the normal course of business. Other than those items listed below, White Mountains was not a party to any material litigation or arbitration other than as routinely encountered in claims activity, none of which is expected by management to have a material adverse effect on its financial condition and/or cash flows.

          OneBeacon

                  In NovemberAugust 2004, OneBeacon Insurance Group received a subpoena fromasserted claims against Liberty Mutual in the Attorney GeneralCourt of Common Pleas in Philadelphia, Pennsylvania (the "Court") for breach of contract and negligence with respect to agreements with Liberty Mutual (the "Liberty Agreements"). The portion of the State of New York requesting documents and seeking informationcontract claim relating to OBIC was submitted to arbitration and the conductCourt stayed the remaining claims, including OneBeacon's claims on behalf of business betweenits other insurance brokers and OneBeacon. Subsidiariessubsidiaries that were signatories to the Liberty Agreements, pending resolution of the Company have also received information requests from various state insurance departments regarding producer compensation arrangements. White Mountains believes these requests are partarbitration. In August 2007, the arbitration panel issued an award in favor of OneBeacon on the portion of the ongoing, industry-wide investigationbreach of contract claim submitted to it finding that Liberty Mutual breached the Liberty Agreements. The panel awarded OneBeacon $4.5 million plus interest.

                  Subsequent to the award, in September 2007, Liberty Mutual filed petitions in the U.S. District Court for the District of Massachusetts ("USDC") and the Court to vacate the arbitral award and dismiss or arbitrate the remaining Court claims. In October 2007, OneBeacon (on behalf of its other insurance subsidiaries that were signatories to the Liberty Agreements) filed suit against Liberty Mutual in Suffolk County Superior Court in Massachusetts to recover damages caused by Liberty Mutual's claims conduct. Concurrently, a demand for arbitration was served on Liberty Mutual to preserve the rights and interests of OneBeacon (on behalf of the same subsidiaries). In December 2007, the Court confirmed the arbitral award. Liberty Mutual has appealed the Court's confirmation of the award to the Pennsylvania Superior Court. Liberty Mutual's motion to vacate the award is still pending in USDC. Resolution of the outstanding motions is expected in the near future.

                  In January 2005 Liberty Mutual initiated arbitration against OneBeacon (the "ULAE Arbitration") seeking payment of approximately $67 million relating to claims-related services under the Liberty Agreements. In September 2006, OneBeacon initiated an arbitration against Liberty Mutual (the "Reinsurance Arbitration") seeking payment of approximately $57 million relating to reinsurance arrangements under the Liberty Agreements. In January 2007, the Reinsurance Arbitration was consolidated into the ULAE Arbitration. In July 2007, the reinsurance payment issues in the Reinsurance Arbitration were favorably resolved. Arbitration hearings regarding industry sales practices.ULAE issues and damages related thereto are scheduled to occur in the second and third quarters of 2008, respectively.

                  As of December 31, 2007, OneBeacon believes its loss and LAE reserves are sufficient to cover reasonably anticipated outcomes of all disputes with Liberty Mutual.

          Esurance

                  On May 15, 2002, The Robert Plan Corporation and several of its subsidiariesNovember 29, 2007, Dennis J. Czerwinski filed a lawsuit against Esurance Property and Casualty Insurance Company and Esurance Insurance Company in the Company, certainU.S. District Court, Eastern District of its subsidiaries and several individuals employed by the subsidiaries. The suit alleges that the defendants misappropriated confidential informationWisconsin, Milwaukee Division alleging violations of the plaintiffsFair Credit Reporting Act ("FCRA") and used such information to enter intoseeking class certification. Czerwinski alleged that Esurance's accessing of consumer credit reports in connection with prescreened offers of insurance violated the New York automobile assigned risk business in direct competition withFCRA because the plaintiffs.offers allegedly did not qualify as firm offers of insurance. The plaintiffs have recently increased their damages demand from $66 million to approximately $185 million, which they allege represents two yearsproposed class consists of their lost profitsall persons in the subject business. White Mountains, its named subsidiariesUnited States to whom Esurance sent a solicitation in the form of the one mailed to Czerwinski after February 1, 2006 through the date a class is certified. Esurance is disputing the allegations and employees do not believe they engaged in any improper or actionable conduct. White Mountains and its subsidiaries have no reason to believe they have any liability to The Robert Plan Corporation and intendintends to vigorously defend the lawsuit. In addition, OneBeacon has brought a counterclaim against the plaintiffs that it believes to be meritorious. OneBeacon is seeking compensatory damages of $9 million as a result of the breach by the plaintiffs of the LAD servicing contract that OneBeacon had entered into with them.this action.

                  On January 30, 2001, an action was filed in Los Angeles on behalf of Sierra National Life Insurance Holdings, Inc. ("Sierra Holdings", which is not related to the Sierra Group, as previously defined), a dissolved corporation in which White Mountains held a 28.8% interest, against Credit Lyonnais, S.A. and other parties who were the successful bidders for the assets of Executive Life Insurance Company ("ELIC"), a California insurer, in the 1991 sale of those assets conducted by the California Commissioner of Insurance. Sierra Holdings alleged that defendants' acquisition violated both federal and state law and that, but for defendants' wrongful acts, it would have been chosen to purchase ELIC's assets. Sierra Holdings settled its claims against Credit Lyonnais and certain other defendants for a total of $87 million. After expenses, White Mountains share of the settlement proceeds was approximately $15 million. In addition, a default judgment regarding liability was entered at trial against another defendant, Maaf Assurances, SA, a French mutual insurer. Sierra Holdings is reviewing its options in pursuing damages against Maaf. Finally, in certain circumstances, Sierra Holdings may be entitled to additional amounts from any settlements or judgments resulting from the ongoing lawsuit by the California Commissioner of Insurance against another defendant, Artemis SA.

                  In August 2000, Aramarine Brokerage, Inc. ("Aramarine"), a former insurance broker of OneBeacon's, filed a lawsuit alleging that OneBeacon had wrongfully terminated its business relationship with Aramarine. The suit originally claimed $410 million in compensatory damages for lost commissions, although Aramarine has recently reduced its demand to $158 million. OneBeacon does not believe it has engaged in any actionable conduct. During 2004, OneBeacon prevailed on a motion for summary judgment to dismiss the plaintiff's claim. OneBeacon expects the plaintiff to appeal the summary judgment upon resolution of OneBeacon's counterclaim for return commission.


          Item 4.    Submission of Matters to a Vote of Security Holders

                  At the Company's 2004 Annual General Meeting of Members, which was held on October 21, 2004 in Hamilton, Bermuda, the Company's Members approved proposals (as further described in the Company's 2004 Proxy Statement) calling for the Election of fiveThere were no matters submitted to a vote of the Company's directors to Class I ("Proposal I"),shareholders during the Electionfourth quarter of Directors of Sirius International Insurance Corporation ("Proposal II"), the Election of Directors of Fund American Reinsurance Company, Ltd. and Scandinavian Reinsurance Company Ltd. ("Proposal III"), the Election of Directors of any new non-United States operating subsidiary ("Proposal IV") and the Approval of Appointment of PricewaterhouseCoopers as the Company's Independent Registered Accounting Firm ("Proposal V"). As of August 27, 2004, the "Record Date" for the 2004 Annual Meeting, a total of 10,769,451 Common Shares were eligible to vote.2007.


                  With respect to Proposals I, II, III and IV, 6,386,624 votes, 6,559,440 votes, 6,557,514 and 6,597,508 votes were cast in favor of the proposals, respectively, and 264,527 votes, 91,711 votes, 93,637 votes and 53,643 votes were withheld, respectively. With respect to Proposal V, 7,800,774 votes were cast in favor of the proposal, 5,971 votes were cast against the proposal and 5,952 votes abstained. These results represent the number of Common Shares voted after taking into consideration the voting cut-back of all holders with 10% or more voting control in accordance with Bye-law 47 of the Company's Bye-laws

                  In connection with Proposal I, Bruce R. Berkowitz, Steven E. Fass, Edith E. Holiday, Joseph S. Steinberg and Lowndes A. Smith were elected to the Company's Board of Directors with terms ending in 2007. In connection with Proposal II, Messrs. Lars Ek, Fass, Gert Lindberg and Goran Thorstensson were elected to the Board of Directors of Sirius International Insurance Corporation. In connection with Proposal III, Messrs. Fass, Anders Henriksson, Mark Kaplen, Michael E. Maloney, Thorstensson and Michael E. Tyburski were elected to the Board of Directors of Fund American Reinsurance Company, Ltd. and Scandinavian Reinsurance Company Ltd. In connection with Proposal IV, Messrs. Barrette and Fass were elected to any new non-United States operating subsidiary that may be formed by the Company in the future.


          Executive Officers of the Registrant and its Subsidiaries (As of March 1, 2005)
          February 28, 2008)

          Name

           Position
           Age
           Executive officer
          since

           Position

           Age
           Executive
          officer
          since

          Raymond Barrette President and CEO 54 1997 Chairman and CEO 57 2007
          John P. Cavoores Managing Director, President and CEO of OneBeacon 47 2002
          Reid T. Campbell Managing Director of White Mountains Capital, Inc. 40 2007
          Charles B. Chokel Managing Director of White Mountains Capital, Inc. 51 2002 Managing Director and Chief Financial Officer of
          White Mountains Re
           54 2002
          Steven E. Fass President and CEO of White Mountains Re 59 2002
          David T. Foy Executive Vice President and Chief Financial Officer 38 2003 Executive Vice President and Chief Financial Officer 41 2003
          John D. Gillespie President of WM Advisors 45 2001
          Robert R. Lusardi Executive Vice President and Managing Director of White Mountains Capital, Inc. 47 2005 President and CEO of White Mountains Financial Services LLC 51 2005
          T. Michael Miller President and CEO of OneBeacon 49 2005
          J. Brian Palmer Chief Accounting Officer 32 2001 Chief Accounting Officer 35 2001
          Robert L. Seelig Vice President and General Counsel 36 2002 Vice President and General Counsel 39 2002
          Gary C. Tolman President and CEO of Esurance 56 2005
          Allan L. Waters President and CEO of White Mountains Re 50 2007

                  All executive officers of the Company and its subsidiaries are elected by the Board for a term of one-yearone year or until their successors have been elected and have duly qualified. Information with respect to the principal occupation and relevant business experience of the Executive Officers follows:

                  Mr. Barrette has served as Chairman and CEO of the Company since January 2007. He served as a director of the Company from 2000 to 2005 and was appointedre-appointed as a director in August 2006. He previously served as President and CEO of the Company on January 1,from 2003 and has been a director since 2000. Mr. Barrette wasto 2005, as CEO of OneBeacon from June 2001 to December 2002, as President of the Company from 2000 to 2001 and remains its Chairman. Mr. Barrette joined White Mountains Insurance Group in November 1997 as Executive Vice President and Chief Financial Officer.Officer of the Company from 1997 to 2000. Mr. Barrette also serves as a director of OneBeacon Ltd.

          Mr. Campbell has served as a Managing Director of White Mountains Capital, Inc. since January 2004. He was President from January 2000 to June 2001.joined White Mountains in 1994 and has served in a variety of financial management positions with White Mountains. Prior to joining White Mountains, Mr. Barrette had 23Campbell spent three years of experience in the insurance


          business, mostly at Fireman's Fund Insurance Company. He iswith KPMG LLP. Mr. Campbell also Chairman of Esurance, Lead Director of Montpelier andserves as a director of several White Mountains subsidiaries.

          Mr. Cavoores was appointed Managing Director and President of OneBeacon in December 2001 and was appointed CEO of OneBeacon in September 2003. Mr. Cavoores formerly served as a Managing Director of Fund American from 2000 to June 2001 and as a Managing Director of OneBeacon from June 2001 to December 2001. Prior to joining White Mountains in 2001, Mr. Cavoores served as Chief Operating Officer of Reliance Insurance Group from April 2000 to October 2000, and as President and CEO of National Union Fire Insurance Company (a wholly-owned subsidiary of American International Group) from May 1998 to April 2000. He was with Chubb Corporation from 1979 to 2000 in a variety of capacities, most recently as their Chief Underwriting Officer of worldwide specialty business.Ltd.

                  Mr. Chokel has served as Managing Director and Chief Financial Officer of White Mountains Re since August 2006. Prior to that he served as Managing Director of White Mountains Capital, Inc. since September 2003. Prior to that he served2003, as Managing Director and Chief Administrative Officer of OneBeacon since January 2003 and as Managing Director of OneBeacon since March 2002. Prior to joining OneBeacon, Mr. Chokel served as Executive Vice President and Chief Financial Officer of Conseco, Inc. from March 2001 to March 2002 and as Co-CEO of The Progressive Corporation from January 1999 to January 2001. Mr. Chokel was withjoined Progressive sincein 1978. He is also a director of other White Mountains subsidiaries.

          Mr. Fass has been a director of the Company since 2000. Mr. Fass has served as President and CEO of White Mountains Re since May 2004. Mr. Fass previously served as President and CEO of Folksamerica and its subsidiaries from 1984 to 2004. He joined Folksamerica as its Vice President, Treasurer and Chief Financial Officer in 1980. Mr. Fass also serves as Chairman of Folksamerica, a director of White Mountains Re and is a director of other White Mountains subsidiaries.

                  Mr. Foy was appointed Executive Vice President and Chief Financial Officer of the Company in April 2003. Prior to joining White Mountains in 2003, Mr. Foy served as Senior Vice President and Chief Financial Officer of Hartford Life Inc. and joined that company in 1993. Prior to joining Hartford Life, Mr. Foy was with Milliman and Robertson, an actuarial consulting firm. Mr. Foy also serves as the Chairman of Symetra.

          Mr. Gillespie has served as a Deputy Chairman of the Company since January 2003Symetra and serves as Chairman and President of WM Advisors. Mr. Gillespie served as Managing Director of OneBeacon from June 2001 to March 2003 and has been a director of the Company since 1999. He is also the founder and Managing Partner of his own investment firm, Prospector Partners, LLC ("Prospector"). Prior to forming Prospector, Mr. Gillespie was President of the T. Rowe Price Growth Stock Fund and the New Age Media Fund, Inc. Mr. Gillespie serves as a director of Montpelier, Symetra and certain White Mountains subsidiaries. Mr. Gillespie's father, George Gillespie, is Chairman of the Company.OneBeacon Ltd.

                  Mr. Lusardi was appointed Executive Vice President and Managing DirectorCEO of White Mountains Capital, Inc.Financial Services LLC in February 2005. Prior to joining White Mountains, Mr. Lusardi was an Executive Vice President of XL Capital Ltd, most recently as Chief Executive of Financial Products and Services. Prior to joining XL Capital Ltd, Mr. Lusardi was a Managing Director at Lehman Brothers, where he was employed from 1980 to 1998. Mr. Lusardi also serves as a director of OneBeacon Ltd., Symetra and Primus Guaranty, Ltd.

          Mr. Miller was appointed President and CEO of OneBeacon in July 2005 and joined OneBeacon as its Chief Operating Officer in April 2005. Mr. Miller also serves as a director of OneBeacon Ltd. Prior to joining White Mountains, Mr. Miller spent 10 years at St. Paul Travelers, most recently as Co-Chief Operating Officer. Prior to joining St. Paul Travelers, Mr. Miller spent 14 years with The Chubb Corporation.

                  Mr. Palmer has served as Chief Accounting Officer since June 2001 and previously served as Controller of a subsidiary of White Mountains from 1999 to 2001. Prior to joining White Mountains in 1999, Mr. Palmer was with PricewaterhouseCoopers LLP.

                  Mr. Seelig is Vice President and General Counsel of the Company. Prior to joining White Mountains in September 2002, Mr. Seelig was with the law firm of Cravath, Swaine & Moore.

          Mr. Tolman has served as President and CEO of Esurance since 2000. Prior to joining Esurance, Mr. Tolman was with Talegen Holdings for 6 years, serving most recently as its President. Prior to joining Talegen, Mr. Tolman was with Fireman's Fund Corporation for more than 15 years.


          Mr. Waters was elected Director, President and CEO of White Mountains Re on March 6, 2007. Mr. Waters was a director of White Mountains from 2003 to 2004 and was re-elected as a director in November 2005. From 1998 to 2007, Mr. Waters was the founder and Managing Member of Mulherrin Capital Advisors, LLC. Mr. Waters formerly served as Senior Vice President and Chief Financial Officer of White Mountains from 1993 to 1998, as Vice President and Controller from 1990 to 1993, as Vice President of Finance from 1987 to 1990 and as Assistant Vice President of Finance from 1985 to 1987.


          PART II

          Item 5.    Market for the Company's Common Equity, Related Shareholder Matters and Issuer PurchasePurchases of Equity Securities

                  As of February 15, 2005,28, 2008, there were 394378 registered holders of Common Shares,White Mountains' common shares, par value $1.00 per share.

                  During each of 20042007 and 20032006, the Company declared and paid cash dividends on Common Sharescommon shares of $1.00$8.00 per Common Share. The Company's dividend payment policy provides for an annual dividend payable in the first quarter of each year, dependent on the Company's financial position and the regularity of its cash flows.share.

                  Common Sharesshares are listed on the New York Stock Exchange (symbol WTM) and the Bermuda Stock Exchange (symbol WTM-BH). The quarterly range of the daily closinghigh and low sales price for Common Sharescommon shares during 20042007 and 20032006 is presented below:

           
           2004
           2003
           
           High
           Low
           High
           Low
          Quarter ended:            
           December 31 $659.00 $501.00 $461.00 $413.00
           September 30  526.00  467.00  416.75  362.00
           June 30  553.80  476.10  420.50  340.00
           March 31  524.50  453.50  340.00  311.70


           2007
           2006
           
           High
           Low
           High
           Low
          Quarter ended:            
           December 31 $566.50 $492.00 $603.00 $496.00
           September 30  608.96  507.00  537.00  447.00
           June 30  611.02  548.76  591.00  465.01
           March 31  590.40  532.35  594.50  517.00

                  As permittedOn October 26, 2007, White Mountains repurchased 282,341 of its common shares for $500 per share, or $141 million, in a transaction with an institutional investor. On November 26, 2007, White Mountains repurchased an additional 8,500 of its common shares for $500 per share, or $4 million. These transactions were the first repurchases under the previously announced share repurchase plan authorized by White Mountains' Board of Directors on November 17, 2006. There are 709,159 shares remaining for future share repurchases under the agreement governingplan.

                  For information on securities authorized for issuance under the Company's outstanding options to acquire Common Shares ("Options"),equity compensation plans, see "Item 12—Security Ownership of Certain Beneficial Owners and Management and Related Stockholder Matters."

                  The following graph shows the Company accepted 97five-year cumulative total return for a shareholder who invested $100 in common shares in partial satisfaction(NYSE symbol "WTM") as of January 1, 2003, assuming re-investment of dividends. Cumulative returns for the strike price relating tofive-year period ended December 31, 2007 are also shown for the exercise of 435 Options duringStandard & Poor's 500 Stocks (Property & Casualty) Capitalization Weighted Index ("S&P P&C") and the 2004 fourth quarter. The Common Shares received by the Company were valued at the applicable New York Stock Exchange closing price on the day of exercise ($629.75 per Common Share).Standard & Poor's 500 Stocks Capitalization Weighted Index ("S&P 500") for comparison.

          COMPARISON OF CUMULATIVE FIVE YEAR TOTAL RETURN
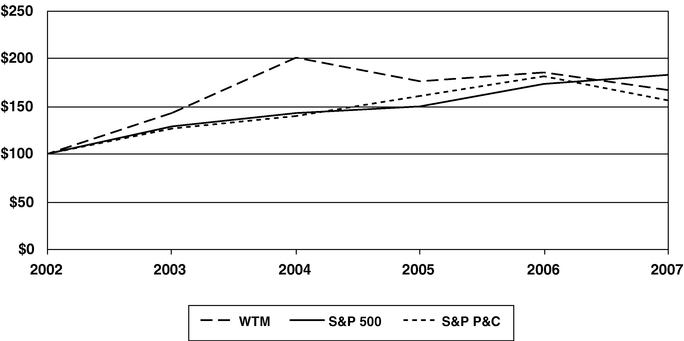


          Item 6.    Selected Financial Data

                  Selected consolidated income statement data and ending balance sheet data for each of the five years ended December 31, 2004,2007, follows:

           
           Year Ended December 31,
           
          $ in millions, except share and per share amounts

           
           2004
           2003
           2002
           2001(a)(l)
           2000(l)
           
          Income Statement Data:                
          Revenues $4,553 $3,794 $4,208 $3,234 $851 
          Expenses  4,305  3,422  4,089  3,662  493 


          Pretax earnings (loss)  248  372  119  (428) 358 
           Income tax (provision) benefit  (47) (127) (11) 179  (43)
           Accretion and dividends on preferred stock of subsidiaries    (21)(j) (41) (23)  
           Equity in earnings (loss) of unconsolidated affiliates  37  57  14  1  (2)


          Net income (loss) from continuing operations  238  281  81  (271) 313 
           Net income from discontinued operations          95(b)
           Cumulative effect of changes in accounting principles      660(i)    
           Extraordinary gains  181(k)   7  12   


          Net income (loss) $419 $281 $748 $(259)$408 


          Net income (loss) from continuing operations per share:                
           Basic $24.05 $26.48 $7.47 $(86.52)$53.08 
           Diluted $22.67 $23.63 $6.80 $(86.52)$52.84 


          Balance Sheet Data:                
          Total assets $19,015 $15,882 $17,267 $18,410 $3,545 
          Short-term debt      33  358   
          Long-term debt  783  743  760  767  96 
          Deferred credits      (i) 683(c) 92 
          Convertible preference shares      219     
          Mandatorily redeemable preferred stock of subsidiaries  212  195(j) 181  170   
          Common shareholders' equity(d)  3,884  2,979  2,408  1,445  1,046 
          Book value per share(e) $349.60 $293.15 $254.52 $160.36 $177.07 
          Fully converted tangible book value per share(f) $342.52 $291.27 $258.82 $225.81 $187.65 


          Share Data:                
          Cash dividends paid per Common Share $1.00 $1.00 $1.00 $1.00 $1.20 
          Ending Common Shares (000's)(g)  10,773  9,007  8,351  8,245  5,880 
          Ending equivalent Common Shares (000's)(h)  47  1,775  2,455  1,803  81 


          Ending Common and equivalent Common Shares (000's)  10,819  10,782  10,806  10,048  5,961 


           Year Ended December 31,
           
          $ in millions, except share and per share amounts

           
           2007
           2006
           2005
           2004
           2003
           
          Income Statement Data:                
          Revenues $4,734 $4,794(g)$4,632 $4,555 $3,794 
          Expenses  4,052  4,064  4,327  4,297  3,420 


          Pre-tax earnings  682  730(g) 305  258  374 
           Income tax provision  (211) (99) (37) (47) (127)
           Minority interest  (93) (16) (12) (11) (2)
           Equity in earnings of unconsolidated affiliates  29  37  34  38  57 
           Accretion and dividends on preferred stock of subsidiaries          (21)(a)


          Net income before extraordinary items  407  652  290  238  281 
           Extraordinary gains    21(b)   181(b)  


          Net income $407 $673 $290 $419 $281 


          Net income before extraordinary items per share:                
           Basic $37.96 $60.52 $26.96 $24.05 $26.48 
           Diluted $37 89 $60.33 $26.56 $22.67 $23.63 


          Balance Sheet Data:                
          Total assets $19,106 $19,444 $19,418 $19,015 $15,882 
          Long-term debt  1,193(h) 1,107(h) 779  783  743 
          Mandatorily redeemable preferred stock of subsidiaries  278  262  234  212  195 
          Minority interest—OneBeacon Ltd  517  491(g)      
          Minority interest—WMRe Preference Shares  250(i)        
          Minority interest—consolidated limited partnerships  100  113  96  59  5 
          Common shareholders' equity  4,713  4,455  3,833  3,884  2,979 
          Book value per share(c) $446.83 $408.62 $347.00 $349.60 $293.15 
          Fully diluted tangible book value per share(d) $444.47 $406.00 $342.51 $342.52 $291.27 


          Share Data:                
          Cash dividends paid per common share $8.00 $8.00 $8.00 $1.00 $1.00 
          Ending common shares (000's)(e)  10,554  10,783  10,779  10,773  9,007 
          Ending equivalent common shares (000's)(f)  (37) 29  34  46  1,775 


          Ending common and equivalent common shares (000's)  10,517  10,812  10,813  10,819  10,782 


          (a)
          Includes the acquisition of OneBeacon on June 1, 2001 and its results of operations from that date through December 31, 2001. In connection with the OneBeacon Acquisition, White Mountains issued $1,085 million in debt. White Mountains also issued preferred stock of subsidiaries, warrants to acquire Common Shares and Convertible Preference Shares for total proceeds of $758 million.

          (b)
          Relates to a tax reserve release associated with the 1991 sale of Fireman's Fund Insurance Company.

          (c)
          Deferred credits added during 2001 resulted from the purchase of OneBeacon.

          (d)
          Increase in 2001 included effects of capital raising activities undertaken in connection with the OneBeacon Acquisition. Increase in 2002 included the recognition of $660 million in net deferred credits as a result of a change in accounting principles. See Note 1.

          (e)
          Includes the dilutive effects of outstanding Options and, for years prior to 2004, warrants to acquire Common Shares.

          (f)
          Book value per share plus unamortized deferred credits less goodwill and the equity in net unrealized gains from Symetra's fixed income portfolio per Common and equivalent Common Share. The 2002 fully converted tangible book value per share assumes outstanding convertible preference shares to be equivalent Common Shares.

          (g)
          During 2003, 677,966 Common Shares were issued in satisfaction of Convertible Preference Shares. During 2004, 1,724,200 Common Shares were issued in satisfaction of warrants exercised.

          (h)
          Includes outstanding Convertible Preference Shares, Options and warrants to acquire Common Shares, when applicable.

          (i)
          In accordance with its adoption of Statement of Financial Accounting Standard ("SFAS") No. 141, "Business Combinations" ("SFAS 141"), the Company recognized all of its outstanding deferred credits on January 1, 2002. See Note 1.

          (j)
          In accordance with its adoption of SFAS No. 150, "Accounting for Certain Financial Instruments with Characteristics of both Liabilities and Equity" ("SFAS 150"), on July 1, 2003, the Company reclassified its outstanding mandatorily redeemable preferred stock from mezzanine equity to liabilities on its balance sheet and, beginning in the third quarter of 2003, White Mountains began presenting all accretion and dividends on its mandatorily redeemable preferred stock as interest expense. See Note 1.

          (k)(b)
          The extraordinary gain in 2006 resulted from the excess of the fair value over the cost of net assets acquired in the Mutual Services acquisition. Extraordinary gains in 2004 resulted from the excess of the fair value over the cost of net assets acquired in the Sirius, Symetra, Tryg-Baltica and Sierra transactions.

          (l)(c)
          ForIncludes the dilutive effects of outstanding incentive options to acquire common shares ("Options") and, for years prior to 2004, warrants to acquire common shares.

          (d)
          Fully diluted tangible book value per share is a descriptionnon-GAAP measure which is derived by expanding the GAAP book value per share calculation to include the effects of assumed conversion of all in-the-money convertible securities and to exclude any unamortized goodwill and net unrealized gains from Symetra's fixed maturity portfolio. See the reconciliation of fully diluted tangible book value per share to book value per share on page 47.

          (e)
          During 2007, the Company repurchased and retired 290,841 common shares in two transactions with institutional investors. During 2004, 1,724,200 common shares were issued in satisfaction of warrants exercised.

          (f)
          Includes outstanding Options and warrants to acquire common shares, when applicable. In addition, for periods subsequent to December 31, 2006, the number of common shares outstanding used in the calculation of fully diluted tangible book value per share is adjusted to exclude unearned shares of restricted stock representative of the historical factors affecting OneBeacon's loss and LAE reserves priorproportion of unamortized compensation cost at the date of the calculation to the OneBeacon Acquisition, see "Non-Asbestos and Environmental Reserves" under the caption "Loss and Loss Adjustment Expense Reserves" in the "OneBeacon" sectionvalue of the business description contained withinrestricted stock on the Company's Amendment No. 6 to Form S-3 dated July 17, 2003 (the "Form S-3"). Suchdate of issuance.

          (g)
          In connection with the OneBeacon Offering, White Mountains recognized a $171 million gain in other revenues and recorded a $491 million minority interest liability.

          (h)
          At December 31, 2006, White Mountains had $320 million outstanding under its credit facility. During 2007, White Mountains Re issued the $400 million WMRe Senior Notes, a portion of the Form S-3 is incorporated by reference into this Form 10-K.proceeds of which were used to repay the borrowings under White Mountains' credit facility.

          (i)
          In May 2007, WMRe Group, an intermediate holding company of White Mountains Re, issued $250 million non-cumulative perpetual preference shares.


          Item 7.    Management's Discussion and Analysis of Financial Condition and Results of Operations

                  The following discussion contains "forward-looking statements". White Mountains intends statements whichthat are not historical in nature, andwhich are hereby identified as forward-looking statements, to be covered by the safe harbor provisions of the Private Securities Litigation Reform Act of 1995. White Mountains cannot promise that its expectations in such forward-looking statements will turn out to be correct. White Mountains' actual results could be materially different from and worse than its expectations. See " "FORWARD-LOOKING STATEMENTS"for specific important factors that could cause actual results to differ materially from those contained in forward-looking statements.

                  The following discussion also includes twofive non-GAAP financial measures, adjusted comprehensive net income, and fully converteddiluted tangible book value per share, tangible capital, OneBeacon's adjusted book value per share and OneBeacon's specialty, commercial and personal lines' loss and LAE ratios and combined ratios prior to a reserve reallocation, that have been reconciled to their most comparable GAAP financial measures (see page 55)64). White Mountains believes these measures to be more relevant than comparable GAAP measures in evaluating White Mountains' financial performance.performance and condition.


          RESULTS OF OPERATIONS FOR THE YEARS ENDED DECEMBER 31, 2004, 20032007, 2006 and 2002
          2005

          Overview

                  White Mountains ended 20042007 with a fully converteddiluted tangible book value per Common Sharecommon share of $343,$444, which representsrepresented an increase of 18%11.4% (including dividends) over the fully converteddiluted tangible book value per Common Sharecommon share of $291$406 as of December 31, 2003. During 2003, fully converted2006. This increase reflects favorable weather conditions and strong investment results in 2007. Fully diluted tangible book value per Common Share increasedshare at December 31, 2007 was reduced by 13%$2 from the impact of share repurchases during the fourth quarter of 2007.

                  White Mountains ended 2006 with a fully diluted tangible book value per common share of $406, which represented an increase of 21% (including dividends) from $259over the fully diluted tangible book value per common share of $343 as of December 31, 2002.

                  Adjusted comprehensive net income was $539 million for 2004, compared to $360 million in 2003. Net income for 2004 was $419 million, compared to $281 million in 2003.

                  The growth in book value was driven by2005. This increase reflected favorable weather conditions and strong investment results particularly equities which returned 20%, and $180 million in transaction gains. This more than offsetwhen compared to 2005. Additionally, during the impactfourth quarter of higher than expected losses from catastrophes and prior year reserve development. The growth in earnings was primarily driven by the transaction gains as both 2004 and 2003 had strong investment results.

                  All three business segments performed well. OneBeacon's combined ratio in 2004 was 99%, the second consecutive year it was below 100%, and Esurance earned a profit for the first time in 2004.2006, White Mountains Re had a combined ratiorecognized an after-tax gain of 104% due to 11 points$171 million, or $16 per common share, from catastrophes. However, the segment contributed $140 million in transaction gains and therefore was a significant contributor to the Company's growth in book value for the year.OneBeacon Offering.


          Fully ConvertedDiluted Tangible Book Value Per Share

                  The following table presents the Company's tangible book value per share for the years ended December 31, 2004, 2003,2007, 2006, and 20022005 and reconciles this non-GAAP measure to the most comparable GAAP measure.measure:

           
           December 31,
           
           
           2004
           2003
           2002
           
          Book value per share numerators (in millions):          
          Common shareholders' equity $3,883.9 $2,979.2 $2,407.9 
           Proceeds from assumed exercise of outstanding warrants    300.0  300.0 
           Benefits to be received from share obligations under employee benefit plans  6.7  7.0  8.8 
           Remaining accretion of subsidiary preferred stock to face value  (108.1) (125.5) (139.1)


          Book value per share numerator  3,782.5  3,160.7  2,577.6 
           Equity in net unrealized gains from Symetra's fixed maturity portfolio  (56.6)    
           Assumed conversion of convertible preference shares to Common Shares      219.0 
           Unamortized goodwill of consolidated limited partnerships  (20.0) (20.3)  


          Fully converted tangible book value per common and equivalent share numerator $3,705.9 $3,140.4 $2,796.6 


          Book value per share denominators (in millions):          
          Common Shares outstanding  10,772.8  9,007.2  8,351.4 
           Common Shares issuable upon exercise of outstanding warrants    1,724.2  1,714.3 
           Share obligations under employee benefit plans  46.6  50.6  61.9 


          Book value per share denominator  10,819.4  10,782.0  10,127.6 
           Assumed conversion of convertible preference shares to Common Shares      678.0 


          Fully converted tangible book value per common and equivalent share denominator  10,819.4  10,782.0  10,805.6 


          Book value per share $349.60 $293.15 $254.52 
          Fully converted tangible book value per common and equivalent share  342.52  291.27  258.82 


           December 31,
           
           
           2007
           2006
           2005
           
          Book value per share numerators (in millions):          
          Common shareholders' equity $4,713.4 $4,455.3 $3,833.2 
           Benefits to be received from share obligations under employee benefit plans  1.7  4.7  5.1 
           Remaining accretion of subsidiary preferred stock to face value(1)  (15.8) (41.8) (86.0)


          Book value per share numerator  4,699.3  4,418.2  3,752.3 
           Equity in net unrealized (gains) losses from Symetra's fixed maturity portfolio  5.6  4.1  (24.2)
           Goodwill  (30.4) (32.5) (24.4)


          Fully diluted tangible book value per share numerator $4,674.5 $4,389.8 $3,703.7 


          Book value per share denominators (in thousands of shares):          
          Common shares outstanding  10,553.6  10,782.8  10,779.2 
           Unearned restricted shares  (46.5)    
           Share obligations under employee benefit plans  9.9  29.5  34.3 


          Fully diluted tangible book value per share denominator  10,517.0  10,812.3  10,813.5 


          Book value per share $446.83 $408.62 $347.00 
          Fully diluted tangible book value per share  444.47  406.00  342.51 


          (1)
          Remaining adjustment of subsidiary preferred stock to face value, which is based on White Mountains' ownership interest in OneBeacon Ltd. of 72.9%, 72.4% and 100% as of December 31, 2007, 2006 and 2005.


          Review of Consolidated Results

                  A tabular summary of White Mountains' consolidated financial results for the years ended December 31, 2004, 20032007, 2006 and 20022005 follows:


           Year Ended December 31,
           
           Year Ended December 31,
           
          Millions

          Millions

           Millions

           
          2004
           2003
           2002
            2007
           2006
           2005
           
          Gross written premiums $4,792.1 $3,823.4 $4,421.6 Gross written premiums $4,189.9 $4,312.4 $4,601.6 


          Net written premiums $3,904.8 $3,007.7 $3,293.5 Net written premiums $3,758.6 $3,843.5 $3,776.1 


          RevenuesRevenues       Revenues       
          Earned insurance and reinsurance premiums $3,783.7 $3,712.7 $3,798.6 
          Earned insurance and reinsurance premiums $3,820.5 $3,137.7 $3,576.4 Net investment income 533.0 435.5 491.5 
          Net investment income 360.9 290.9 366.0 Net realized investment gains 263.2 272.7 112.6 
          Net realized investment gains 181.1 162.6 156.0 Gain on sale of shares through the OneBeacon Offering  171.3  
          Other revenue 190.5 202.6 109.5 Other revenue 153.9 202.0 229.2 


           Total revenues 4,553.0 3,793.8 4,207.9  Total revenues 4,733.8 4,794.2 4,631.9 


          ExpensesExpenses       Expenses       
          Losses and LAE 2,591.1 2,138.1 2,638.2 Losses and LAE 2,406.4 2,452.7 2,858.2 
          Insurance and reinsurance acquisition expenses 743.5 615.0 804.3 Insurance and reinsurance acquisition expenses 776.6 754.8 761.2 
          Other underwriting expenses 521.3 347.1 401.7 Other underwriting expenses 509.0 505.4 424.7 
          General and administrative expenses 309.3 201.8 92.7 General and administrative expenses 200.5 218.3 148.8 
          Accretion of fair value adjustment to loss and LAE reserves 43.3 48.6 79.8 Accretion of fair value adjustment to loss and LAE reserves 21.4 24.5 36.9 
          Interest expense—debt 49.1 48.6 71.8 Interest expense—debt 73.0 50.1 44.5 
          Interest expense—dividends and accretion on preferred stock subject to mandatory redemption 47.6 22.3  Interest expense—dividends and accretion on preferred stock 65.4 58.6 52.4 


           Total expenses 4,305.2 3,421.5 4,088.5  Total expenses 4,052.3 4,064.4 4,326.7 


          Pretax income $247.8 $372.3 $119.4 
          Pre-tax incomePre-tax income $681.5 $729.8 $305.2 
          Income tax expense (47.0) (127.6) (11.7)Income tax provision (210.5) (98.9) (36.5)
          Accretion and dividends on mandatorily redeemable preferred stock of subsidiaries  (21.5) (40.9)Equity in earnings of unconsolidated affiliates 29.4 36.9 33.6 
          Equity in earnings of unconsolidated affiliates 37.4 57.4 14.0 Minority interest (93.0) (16.0) (12.2)


          Net income before accounting changes and extraordinary items $238.2 $280.6 $80.8 
          Excess of fair value of acquired net assets over cost 180.5  7.1 
          Net income before extraordinary itemsNet income before extraordinary items $407.4 $651.8 $290.1 
          Cumulative effect of changes in accounting principles   660.2 Excess of fair value of acquired net assets over cost  21.4  


          Net incomeNet income $418.7 $280.6 $748.1 Net income $407.4 $673.2 $290.1 
          Other comprehensive income 176.5 79.0 202.3 Other comprehensive income (loss) 71.9 32.9 (254.1)


          Comprehensive net incomeComprehensive net income $595.2 $359.6 $950.4 Comprehensive net income $479.3 $706.1 $36.0 
          Less: Change in net unrealized gains from Symetra's fixed maturity portfolio (56.6)   
          Change in net unrealized (gains) losses from Symetra's fixed maturity portfolioChange in net unrealized (gains) losses from Symetra's fixed maturity portfolio 1.5 28.3 32.4 


          Adjusted comprehensive net incomeAdjusted comprehensive net income $538.6 $359.6 $950.4 Adjusted comprehensive net income $480.8 $734.4 $68.4 


          Consolidated Results—Year Ended December 31, 20042007 versus Year Ended December 31, 20032006

                  White Mountains reported adjusted comprehensive net income of $481 million for 2007, compared to $734 million in 2006. Net income was $407 million in 2007, compared to $673 million in 2006. These results reflect favorable weather conditions and strong investment results in both years. During 2006, White Mountains benefited from an after-tax gain of $171 million from the OneBeacon Offering, an after-tax gain of $21 million on the purchase of Mutual Service, $29 million in after-tax transaction gains from the sales of Sirius America and OneBeacon's Agri business and $33 million in gains from the settlements of United States Federal and state income tax audits.

                  White Mountains' total revenues increaseddecreased by 20%1% to $4,734 million in 20042007 compared to 2003. Growth$4,794 million in 2006, mainly due to the $171 million gain from the OneBeacon Offering in 2006 and a $48 million decrease in other revenues, was drivenmainly at White Mountains Re. These revenue decreases were partially offset by the 22%a $98 million increase in net investment income, due mainly to a higher invested asset base in 2007, and a 2% increase in earned premiums. The increase in earned premiums due to the Sirius Acquisition and Atlantic Specialty transactions. Net investment income grew 24% in 2004was primarily due to the income earned on the additional invested assets acquired in the Sirius Acquisitionan increase at Esurance, partially offset by decreased net invested assetsdecreases at OneBeacon.OneBeacon and White Mountains Re.


                  White Mountains' total expenses grew 26%were relatively flat at $4,052 million for 2004 as loss and LAE, insurance acquisition and underwriting expenses were all up due2007 when compared to the Sirius Acquisition and Atlantic Specialty transactions. General and administrative costs were up 53%2006. Interest expense on debt increased 46% in 2004,2007, primarily due to interest on the WMRe Senior Notes that were issued in March of 2007. This was partially offset by an increase in incentive compensation accruals, which were driven by a 41% rise in White Mountains' stock price during the year. White Mountains expenses its full cost of all incentive compensation programs. This expense is spread among loss and LAE, other underwriting expense and general and administrative expense for White Mountains' insurance and reinsurance operating subsidiaries, depending upon the function of the employees being compensated. For Other Operations, it is entirely included8% decrease in general and administrative expenses.

                  White Mountains' net incomeexpenses, due primarily to lower incentive compensation expense in 2004 also benefitted from $181 million in transaction gains: $111 million from the Sirius Acquisition, $41 million for the Symetra investment, $20 million from the Tryg-Baltica acquisition and $9 million from the Sierra Group acquisition.2007.

          Consolidated Results—Year Ended December 31, 20032006 versus Year Ended December 31, 20022005

                  White Mountains reported adjusted comprehensive net income of $734 million for 2006, compared to $68 million in 2005. Net income was $673 million in 2006, compared to $290 million in 2005. The increase in 2006 adjusted comprehensive net income resulted primarily from the $171 million gain from the OneBeacon Offering, favorable weather conditions, strong investment returns and a $21 million after-tax gain on the purchase of Mutual Service. In addition, the 2005 results included $288 million in after-tax losses from hurricanes Katrina, Rita and Wilma, while 2006 included $70 million in after-tax losses from adverse development on those storms and a $95 million after-tax loss from the Olympus reimbursement (see description on page 58). 2005 also included $104 million of after-tax comprehensive net loss from the Montpelier Re investment, compared to $10 million in after-tax comprehensive net income in 2006. Adjusted comprehensive net income for 2006 also benefitted from $59 million of after-tax unrealized foreign currency gains, compared to $70 million of after-tax unrealized foreign currency losses in 2005, primarily from currency fluctuations of the U.S. dollar against the Swedish Krona and the Euro.

                  White Mountains' total revenues decreasedincreased by 10%4% to $4,794 million in 20032006 compared to 2002, as an$4,632 million in 2005, mainly due to the $171 million gain on the sale of OneBeacon shares and a $160 million increase in earned reinsurance premiums at Folksamerica was more thannet realized investment gains, primarily due to $165 million of pre-tax losses in the value of the Company's investment in Montpelier Re realized during 2005, compared to a $5 million pre-tax gain realized in 2006. These increases were partially offset by a $56 million decrease in net investment income, primarily due to the receipt in 2005 of a $74 million special dividend from Montpelier Re, and a 2% decrease in earned insurance premiums, primarily due to decreases at OneBeacon as a result of the business transferred to Liberty Mutual under the Liberty Agreement. Total revenues in 2003and White Mountains Re, which were also impacted by decreased net investment income due to the run-off of loss reserves from OneBeacon's other businesses as well as the reduced interest rate environment. The decline in total revenues in 2003 was partially offset by an increase in other revenues, primarily as a result of $50 million in gains recorded during 2003 related to the sale of several real estate properties previously written-off under purchase accounting for OneBeacon and a $30 million increase in fees and commissions for business placed by WMU.at Esurance.

                  TotalWhite Mountains' total expenses decreased by 16%6% to $4,064 million for 2006, primarily due to a $406 million decrease in 2003 as compared to 2002, as losslosses and LAE, as well as insurance acquisition and other underwriting expenses, decreased at OneBeacon aspartially offset by a result of improved underwriting performance on its on-going businesses and as the continued run-off of unprofitable business through the Liberty Agreement. In addition, interest expense on debt decreased 32% in 2003 as a result of the repayment of the $260$70 million of debt in November 2002 and the refinancing of $700 million of debt in May 2003. Also contributing to the decrease in expenses was a decrease in the accretion of the fair value adjustment to the reserves acquired as part of the OneBeacon Acquisition. This accretion will continue to decrease as those acquired reserves are paid over time. Partially offsetting these expense decreases was an increase in general and administrative expense of $109expenses. The decrease in losses and LAE was due mainly to lower catastrophe losses in 2006 compared to 2005. In 2005, White Mountains reported $422 million in 2003 over 2002,pre-tax loss and LAE on hurricanes Katrina, Rita and Wilma, compared to $106 million in loss and LAE from adverse development on those storms, as well as a $137 million loss and $9 million in forgone override commissions from the Olympus reimbursement in 2006. The increase in general and administrative expenses in 2006 when compared to 2005 was primarily due to an increase inincreased incentive compensation accruals, which were driven by a 42% rise in White Mountains' stock price during 2003.expenses.


          Income Taxes

                  The Company is domiciled in Bermuda and has subsidiaries domiciled in several countries. The majority of the Company's worldwide operations are taxed in the United States. Income earned or losses incurred by non-U.S. companies will generally be subject to an overall effective tax rate lower than that imposed by the United States.

                  The income tax provision related to pretax earnings for 2004, 20032007, 2006 and 20022005 represents an effective tax rate of 19.0%30.9%, 34.3%13.6% and 9.8%12.0%, respectively. White Mountains' effective tax raterates for 2004 was2007, 2006 and 2005 were lower than the U.S. statutory rate of 35% due primarily fromto income generated in jurisdictions other than the United States and from the recognition of foreign tax credits, offset by taxes incurred from an internal restructuring of the company.States. In addition, White Mountains' effective tax rate for 2002 was lower than the2006 reflected tax benefits related to settlements of U.S. statutory rate of 35% primarily fromFederal income generated in jurisdictions other than the United States.tax audits for years 2001 and 2002.


          I. Summary of Operations By Segment

                  White Mountains conducts its operations through four segments: (i) "OneBeacon", (ii) "White(1) OneBeacon, (2) White Mountains Re" (consisting primarily of the operations of Folksamerica, SiriusRe, (3) Esurance and WMU), (iii) "Esurance" and (iv) "Other Operations" (consisting of the Company and its intermediate subsidiary holding companies, White Mountains' investments in its Montpelier and Symetra warrants and the International American Group).(4) Other Operations. White Mountains manages allthe majority of its investments through its wholly ownedwholly-owned subsidiary, White MountainsWM Advisors, LLC ("WM Advisors"), therefore, a discussion of White Mountains' consolidated investment operations is included after the discussion of operations by segment. White Mountains' segment information is presented inNote 1316—"Segment Information" to the Consolidated Financial Statements.

          OneBeacon

                  Financial results for OneBeacon for the years ended December 31, 2004, 20032007, 2006 and 2002 follows:2005 follow:

           
           Year Ended December 31,
          Millions

           2004
           2003
           2002
           Gross written premiums $2,657.5 $2,250.9 $3,351.6


           Net written premiums $2,459.1 $1,972.5 $2,522.8


           Earned insurance and reinsurance premiums $2,378.5 $2,160.3 $2,870.9
           Net investment income  221.4  223.7  314.0
           Net realized investment gains  129.6  127.0  113.0
           Other revenue  141.8  90.5  14.4


            Total revenues  2,871.3  2,601.5  3,312.3


           Losses and LAE  1,545.2  1,475.6  2,131.3
           Insurance and reinsurance acquisition expenses  442.3  394.2  629.6
           Other underwriting expenses  369.2  258.7  329.2
           General and administrative expenses  122.2  67.6  22.4
           Interest expense on debt  1.0  .3  


            Total expenses  2,479.9  2,196.4  3,112.5


          Pretax earnings $391.4 $405.1 $199.8


           Year Ended December 31,
          ($ in millions)

           2007
           2006
           2005
           Gross written premiums $2,092.1 $2,088.4 $2,266.5


           Net written premiums $1,864.4 $1,957.6 $2,121.1


           Earned insurance and reinsurance premiums $1,873.6 $1,944.0 $2,118.4
           Net investment income  208.5  187.6  242.4
           Net realized investment gains  173.7  156.4  122.8
           Other revenue  17.2  38.8  50.3


            Total revenues  2,273.0  2,326.8  2,533.9


           Losses and LAE  1,089.8  1,180.3  1,401.5
           Insurance and reinsurance acquisition expenses  318.9  332.3  390.7
           Other underwriting expenses  329.4  360.1  278.9
           General and administrative expenses  9.8  15.3  8.4
           Accretion of fair value adjustment to loss and LAE reserves  16.0  23.0  26.0
           Interest expense on debt  45.2  45.6  44.1
           Interest expense—dividends and accretion on preferred stock  65.4  58.6  52.4


            Total expenses  1,874.5  2,015.2  2,202.0


          Pre-tax earnings $398.5 $311.6 $331.9


                  The following table presents OneBeacon's adjusted book value per common share and reconciles this non-GAAP measure to book value per common share, the most comparable GAAP measure.

           
           December 31,
           
          (Millions, except per share amounts)

           
           2007
           2006
           
          OneBeacon book value per share numerators:       
          OneBeacon common shareholders' equity $1,906.5 $1,777.2 
           Remaining accretion of subsidiary preferred stock to face value  (21.6) (57.7)


          Adjusted OneBeacon common shareholders' equity  1,884.9  1,719.5 


          OneBeacon Ltd. common shares outstanding  98.5  100.0 


          OneBeacon book value per common share $19.36 $17.77 
          OneBeacon adjusted book value per common share $19.14 $17.20 


          Growth in adjusted book value per common share, including dividends, for the year(1)  16.2%   


              (1)
              OneBeacon Ltd. has paid quarterly dividends of $.21 per common share beginning in March 2007.

                    The following tables provide GAAP ratios, net written premiums and earned insurance premiums for OneBeacon's ongoing businesses and in total for the years ended December 31, 2004, 2003,2007, 2006, and 2002:2005:

            Twelve Months Ended December 31, 2004

             Specialty
             Personal
             Commercial
             Total(1)
             
            GAAP Ratios:             
            Loss and LAE  59% 62% 56% 65%
            Expense  31% 32% 41% 34%


             Total Combined  90% 94% 97% 99%


            Dollars in millions


            Net written premiums $848.5 $724.7 $807.1 $2,459.1 


            Earned insurance premiums $812.0 $723.8 $703.3 $2,378.5 


            Twelve Months Ended December 31, 2003

             Specialty
             Personal
             Commercial
             Total(1)
             
            GAAP Ratios:             
            Loss and LAE  54% 61% 61% 68%
            Expense  32% 30% 34% 30%


             Total Combined  86% 91% 95% 98%


            Dollars in millions


            Net written premiums $733.7 $676.8 $426.7 $1,972.5 


            Earned insurance premiums $694.9 $744.7 $432.0 $2,160.3 


            Twelve Months Ended December 31, 2002

             Specialty
             Personal
             Commercial
             Total(1)
             
            GAAP Ratios:             
            Loss and LAE  64% 71% 67% 74%
            Expense  28% 26% 33% 33%


             Total Combined  92% 97% 100% 107%


            Dollars in millions


            Net written premiums $696.6 $845.2 $454.6 $2,522.8 
            Earned insurance premiums $564.3 $871.3 $527.4 $2,870.9 


             Year Ended December 31, 2007
             
            ($ in millions)

             
             Specialty
             Commercial
             Personal
             Total(1)
             
            GAAP Ratios:             
            Loss and LAE prior to reserve reallocation  58% 51% 60% 58%
             Effect of reserve reallocation(2)  (20)% 0% (3)% n/a 


            Loss and LAE  38% 51% 57% 58%
            Expense  31% 37% 34% 35%


             Total GAAP combined  69% 88% 91% 93%


             Total combined prior to reserve reallocation  89% 88% 94% 93%


            Net written premiums $446.2 $727.7 $690.4 $1,864.4 
            Earned insurance premiums $436.4 $712.0 $725.0 $1,873.6 
             
             Year Ended December 31, 2006
             
            ($ in millions)

             
             Specialty
             Commercial
             Personal
             Total(1)
             
            GAAP Ratios:             
            Loss and LAE  55% 56% 64% 61%
            Expense  34% 39% 32% 35%


             Total combined  89% 95% 96% 96%


            Net written premiums $437.6 $718.3 $800.6 $1,957.6 
            Earned insurance premiums $432.3 $689.3 $822.3 $1,944.0 
             
             Year Ended December 31, 2005
             
            ($ in millions)

             
             Specialty
             Commercial
             Personal
             Total(1)
             
            GAAP Ratios:             
            Loss and LAE prior to reserve reallocation  56% 61% 63% 66%
             Effect of reserve reallocation(2)  (2)% (2)% (1)% n/a 


            Loss and LAE  54% 59% 62% 66%
            Expense  31% 38% 29% 32%


             Total GAAP combined  85% 97% 91% 98%


             Total combined prior to reserve reallocation  87% 99% 92% 98%


            Net written premiums $548.8 $654.4 $910.2 $2,121.1 
            Earned insurance premiums $521.9 $654.7 $933.7 $2,118.4 

                (1)
                Includes results from reciprocals (consolidated beginning April 1, 2004)run-off operations.

                (2)
                During 2007 and 2005, OneBeacon reallocated loss and LAE reserves between its ongoing and run-off operations. Results from reciprocals are netoperations, which had the effect of business assumed by OneBeacon, which is contained in Personal Lines.lowering the combined ratios for the ongoing businesses. The reserve reallocation had no impact on OneBeacon's total combined ratio.

            OneBeacon Results—Year Ended December 31, 20042007 versus Year Ended December 31, 20032006

            Overview

                    OneBeacon's pretax        OneBeacon grew its adjusted book value per share by 16.2% during 2007, including dividends. Pre-tax income for 20042007 was $391$399 million compared to pre-tax income of $405$312 million for 20032006, and its GAAP combined ratio was 99%93% for 2007 compared to 96% for 2006. The improved underwriting results in 2007 reflected lower catastrophe losses and favorable development on prior accident year losses. The 2007 results also benefited from a $26 million gain from OneBeacon's partial pension settlement (SeeNote 11—Retirement and Postretirement Plans).

                    The decrease in OneBeacon's 2007 GAAP combined ratio was primarily due to a 3 point decrease in its loss and LAE ratio. The 2007 results included 3 points of favorable development on prior accident year losses due to lower than expected frequency for professional liability in specialty lines and lower than expected severity for automobile liability in personal lines, partially offset by unfavorable development for multiple peril and workers compensation, primarily for accident years 2001 and prior. The 2006 results included 1 point of adverse development on prior


            accident year losses, mainly due to adverse development on catastrophe losses, primarily related to hurricanes Katrina and Wilma and two 2004 catastrophes, partially offset by favorable development on prior accident year non-catastrophe losses in specialty lines and commercial lines.

                    OneBeacon's total revenues decreased by 2% in 2007 to $2,273 million, compared to $2,327 million in 2006, due principally to a 4% decrease in earned premiums in 2007. 2006 included $65 million of premium from OneBeacon's Agri division, the renewal rights to which were sold on September 30, 2006. Net other revenues decreased 56% in 2007 to $17 million, compared to $39 million in 2006. The 2006 period included a $30 million gain on the sale of renewal rights of Agri to QBE. Partially offsetting the Agri gain was a $13 million pre-tax loss on the sale of OneBeacon's investment in MSA (after tax, the MSA exchange resulted in an $8 million net realized gain). OneBeacon's 2007 net other revenues included an $11 million gain from the sale of one of its inactive licensed insurance subsidiaries.

                    During 2007, OneBeacon reallocated reserves from ongoing lines of business to run-off reserves, particularly on run-off reserves for construction defect and workers compensation related to accident years 2001 and prior. The reallocation shifted $117 million of reserves from specialty lines ($88 million), commercial lines ($6 million) and personal lines ($23 million) to run-off claims. This reallocation had the effect of lowering the combined ratios for specialty, commercial and personal lines, but had no net impact on OneBeacon's overall results. The ratio discussions by line of business that follow are based on the ratios as computed prior to the reallocation of reserves to run-off claims. OneBeacon believes that a presentation excluding the effect of the reserve reallocation on specialty, commercial and personal lines' loss and LAE ratios and GAAP combined ratios is meaningful for investors to understand the performance of its underwriting units during 2007.

                    Specialty lines.    Net written premiums for specialty lines increased by 2% to $446 million in 2007 from $438 million in 2006. Excluding the business transferred in the Agri Sale, net written premiums increased by 20% in 2007 due to a $35 million increase in net written premiums in specialty liability products at OBPP, a $19 million increase in net written premiums at IMU and $15 million in net written premiums in the Accident & Health business, which commenced operations in 2007.

                    The specialty lines combined ratio for 2007 was 89%, consistent with the 2006 combined ratio. The loss and LAE ratio increased 3 points to 58%, primarily due to unfavorable large non-catastrophe current accident year losses in the Agri run-off business, while the expense ratio for 2007 decreased 3 points to 31%, primarily due to a 3 point reduction of commission expense from fees received in 2007 from QBE for fronting services performed on renewals of Agri business.

                    Commercial lines.    Net written premiums for commercial lines increased by 1% to $728 million in 2007 from $718 million in 2006. The increase was mostly due to a $36 million increase in net written premiums in the small business division, principally driven by small business package products. Partially offsetting this increase was a $26 million decrease in the middle market division, due primarily to lower premiums at OBSP as a result of OneBeacon's strategy to manage its exposure to potential catastrophe losses.

                    The commercial lines combined ratio for 2007 decreased to 88% from 95% for 2006. The loss and LAE ratio decreased 5 points to 51%, primarily due to 3 points of favorable development on prior accident year losses in 2007, mostly from property and general liability claims, compared to 2 points of adverse development on prior accident years in 2006, which were primarily at OBSP related to hurricanes Katrina and Wilma and two 2004 catastrophes. This decrease was partially offset by a 1 point increase in the current accident year loss ratio in 2007, partly driven by the pricing environment and partly driven by unusually low large losses in 2006. The expense ratio decreased by 2 points to 37% in 2007, primarily due to lower policy acquisition expenses as a result of an increased deferral rate of commercial lines policy acquisition costs from the expansion into new states, as well as a 1 point favorable impact from the partial pension settlement. Both periods included 1 point of office consolidation costs.

                    Personal lines.    Net written premiums for personal lines decreased by 14% to $690 million in 2007 from $801 million in 2006. The decrease was primarily attributable to reduced writings at AutoOne due to significant declines in New York's assigned risk pool. Market trends indicate that New York's assigned risk volumes are expected to decline to approximately $137 million in 2008, down from $170 million in 2007, $253 million in 2006, and $383 million in 2005. Market trends indicate that the assigned risk pool in New Jersey is also expected to decline to approximately $61 million in 2008, down from $77 million in 2007, $141 million in 2006, and $247 million in 2005. The Company expects a reduction in AutoOne's premium volume reflective of these trends. In traditional personal lines, net written premium decreased in 2007 due to an increasingly competitive automobile market and Massachusetts state-mandated rate decreases. In September 2007, OneBeacon notified agents that it plans to seek regulatory approval of a withdrawal


            plan to cease writing business in Houston General Insurance Exchange and also took actions to better align personal lines staffing with business needs. Net written premiums for Houston General Insurance Exchange were $15 million in 2007, compared to $4 million in 2006.

                    The personal lines combined ratio for 2007 decreased to 94% from 96% for 2006. The loss and LAE ratio decreased 4 points to 60%, primarily due to 3 points of favorable development on prior accident years in automobile liability in traditional personal lines and at AutoOne, compared to 1 point of adverse development on prior accident years in 2006. Partially offsetting this decrease was higher large loss activity experienced in the first half of 2007. The expense ratio increased by 2 points to 34% from 32% in 2006. The increase was primarily due to the adverse effect of a lower earned premium base compared to 2006. The expense ratio in 2007 included the impact of non-recurring favorable items in 2007, including 1 point from a state premium tax refund and 1 point from the partial pension settlement. The 2006 expense ratio also included the benefit of non-recurring favorable items, including 1 point from a reduction of contingent commission accruals and 1 point related to the favorable settlement of a state franchise tax audit. Both periods included 1 point of office consolidation costs. In addition, the expense ratio for 2007 included 1 point of expense incurred in connection with the decision to cease writing business in Houston General Insurance Exchange and actions taken to reduce the personal lines workforce.

                    Run-off.    For 2007, run-off business generated an underwriting loss of $39 million (excluding $117 million from the reserve reallocation), compared to an underwriting loss of $44 million in 2006. The results for both 2007 (excluding the reserve reallocation) and 2006 included $9 million in adverse development.

            OneBeacon Results—Year Ended December 31, 2006 versus Year Ended December 31, 2005

            Overview

                    OneBeacon's pre-tax income for 2006 was $312 million compared to $332 million for 2005, and its GAAP combined ratio was 96% for 2006 compared to 98% for 2003.2005. OneBeacon's 2005 results included the results of NFU prior to its sale on September 30, 2005. The earnings andinclusion of NFU in the results for the first nine months of 2005 reduced the 2005 combined ratio by one point. During 2005, OneBeacon reallocated $34 million of IBNR reserves from ongoing lines of business to run-off. This reallocation had the effect of lowering the combined ratios for each period were relatively consistent as each periodspecialty, commercial and personal lines, but had solid performance for the current underwriting year, partially offset by someno impact on OneBeacon's overall results.

                    Lower adverse development inon prior year's reserves. In total,accident year losses caused OneBeacon's 2006 combined ratio to decrease four points from 2005. OneBeacon's 2006 results included $23 million of adverse development was $100on prior accident years compared to $95 million in 2004 (relating2005, which primarily related to 2002 and prior accident years) and $147years. Lower current accident year catastrophe losses also caused OneBeacon's 2006 combined ratio to decrease two points from 2005. OneBeacon's 2006 results included $29 million in 2003 (relatingcurrent accident year catastrophe losses compared to $81 million in 2005, which included $69 million from hurricanes Katrina, Rita and Wilma. Offsetting these decreases was a one point increase from higher incentive compensation expenses in 2006 and a one point increase from $20 million of expenses associated with actions taken to reduce long-term occupancy costs, including OneBeacon's move to its new U.S. headquarters in Canton, Massachusetts. In addition, OneBeacon's 2005 results included a $54 million gain from the settlement of its retiree medical plan, which reduced the 2005 combined ratio by three points. The retiree medical plan, which had been frozen in 2002, was terminated and an independent trust was established and funded to provide benefits to covered participants. These actions relieved OneBeacon of its future retiree medical obligations and triggered recognition of the gain. The majority of the gain was recorded as a reduction of other underwriting expenses with a portion of the gain reflected as a reduction in loss and LAE because a portion of the expense of the retiree medical program was allocated to the claims department.

                    OneBeacon's total revenues decreased 8% in 2006 to $2,327 million from $2,534 million in 2005. The decrease was due principally to a 6% decrease in earned premiums in 2006, primarily due to 2000the aforementioned sale of NFU, which had $130 million of earned premium in 2005. Net investment income decreased to $188 million in 2006 compared to $242 million in 2005, primarily due to the receipt of a $35 million special dividend on Montpelier Re common shares in the first quarter of 2005. Net realized investment gains increased to $156 million in 2006 compared to $123 million in 2005. The 2005 period included a realized loss of $55 million due to an other-than-temporary impairment on OneBeacon's investment in Montpelier Re common shares. Other revenues in 2006 included a pre-tax


            gain of $30 million from OneBeacon's sale of the renewal rights to its Agri business and a pre-tax loss on the exchange of its investment in MSA of $13 million (after tax, the MSA exchange resulted in an $8 million net realized gain). Other revenues in 2005 included $34 million in gains recorded from the sales of two subsidiaries, NFU and Traders and Pacific Insurance Company.

                    Specialty Lines.    Net written premiums for specialty lines decreased by 20% to $438 million in 2006 from $549 million in 2005, mainly due to the aforementioned sales of NFU and Agri. Excluding NFU and Agri, specialty lines net written premiums increased $41 million, or 12%, from 2005. The increase was mainly due to a $30 million increase in net written premiums at OBPP to $179 million in 2006 from $149 million in 2005, principally driven by long-term care and lawyers professional liability products. Net written premiums for all other specialty lines businesses increased modestly or were essentially flat when compared with the prior year.

                    The specialty lines combined ratio for 2006 increased to 89% from 87% for 2005. The increase was primarily due a higher expense ratio, which rose to 34% in 2006 from 31% in 2005. The increased expense ratio was primarily due to a one point increase in incentive compensation expense in 2006 and the favorable impact in 2005 of the settlement of the retiree medical plan, which lowered that year's expense ratio by two points. The loss and LAE ratio for 2006 was essentially flat when compared to 2005. Excluding the impact of the aforementioned reallocation of reserves to run-off, which reduced the 2005 loss ratio by three points, the loss and LAE ratio improved in 2006.

                    Commercial Lines.    Net written premiums for commercial lines increased by 10% to $718 million in 2006 from $654 million in 2005, as net written premiums increased for both the middle market division and the small business division. The increase in net written premiums in the middle market division was experienced in property and inland marine products as well as at OBSP. The increase in small business was experienced in small business package products.

                    The commercial lines combined ratio for 2006 decreased to 95% from 99% for 2005. Lower catastrophe losses caused the commercial lines 2006 combined ratio to decrease six points from 2005. Commercial lines 2006 results included $31 million in current and prior accident years).year catastrophe losses, which included $21 million in losses incurred from hurricanes Katrina, Rita and Wilma, compared to $64 million in 2005, which included $56 million in losses incurred from hurricanes Katrina, Rita and Wilma. Partially offsetting this decrease was the favorable impact of one point related to the benefit of the settlement of the retiree medical plan in 2005 and two points related to the reallocation in 2005 of IBNR reserves to run-off.

                    Personal Lines.    Net written premiums for personal lines decreased by 12% to $801 million in 2006 compared to $910 million in 2005. The 2004decrease was primarily attributable to reduced writings at AutoOne due to the size of New York's assigned risk pool significantly decreasing and reduced writings in traditional personal lines due to an increasingly competitive automobile market and state-mandated rate decreases in Massachusetts. With respect to the New York assigned risk pool, assigned risk volumes declined to $253 million in 2006, down from $383 million in 2005 and $629 million in 2004. Assigned risk volumes in New Jersey are also expected to decline. The assigned risk pool in New Jersey declined to $141 million in 2006, down from $247 million in 2005 and $375 million in 2004. OneBeacon expects a continued reduction in AutoOne's premium volume in 2007 reflective of these trends.

                    The personal lines combined ratio for 2006 increased to 96% from 92% for 2005. The loss and LAE ratio increased 1 point to 64% in 2006 from 63% in 2005, primarily due to favorable items in 2005. The personal lines 2005 loss and LAE ratio included the benefit of the settlement of the retiree medical plan and the favorable impact of the reallocation of IBNR reserves to run-off, which each reduced the loss and LAE ratio by approximately one point. The expense ratio increased to 32% in 2006, compared to 29% in the prior year, mainly due to increased incentive compensation expenses of approximately one point in 2006 and the benefit of the settlement of the retiree medical plan in 2005, which decreased the 2005 expense ratio by approximately two points. In addition, the 2006 expense ratio was higher than the 2005 expense ratio by approximately one point as expense reductions were not proportional to reductions in earned premiums.

                    Run-off.    For 2006, run-off business generated an underwriting loss of $44 million compared to an underwriting loss of $133 million in 2005. The 2005 results included $107 million in adverse development, relatedmainly from 2002 and prior accident years, which was primarily due to personal auto liability, general liability and multiple peril reserves due in part to emerging trends in claims experienced in OneBeacon's run-off operations, as


            well as national account and program claims administered by third parties. These claim trends principally included higher than anticipated defense costs and higher damages from liability assessments. The 2003 development was primarily related to construction defect claims. Adverse developmentassessments in 2004general liability and 2003, respectively, was partially offset by the releasemultiple peril lines. As described above, 2005 also included a reallocation of approximately $20 million and $30$34 million of the New York assigned risk liability due to the shrinking New York assigned risk pool.

                    OneBeacon's total revenues for 2004 increased by 10% compared to 2003, due principally to an increase in earned premiums resulting primarilyIBNR reserves from the Atlantic Specialty Transaction. Total revenues for 2004 were also impacted by an increase in other revenues due mainly to the commencementongoing lines of two new private equity funds managed by Tuckerman Capital, a group of private equity funds that are consolidated as a result of White Mountains' significant investment in the funds.

                    OneBeacon's total expenses for 2004 increased 13% compared to 2003, primarily as a result of increased incentive compensation accruals driven by the 41% rise in White Mountains' share price in 2004, partially offset by the release of $20 million of the New York assigned risk liability. The release of this liability resulted from the continued effects of favorable revisions to the structure of credit programs. General and administrative expenses were higher in 2004 due mainly to the commencement of two new private equity funds managed by Tuckerman Capital, a group of private equity funds that are consolidated as a result of White Mountains' significant investment in the funds.

                    During the fourth quarter of 2004, OneBeacon sold two of its subsidiaries, Potomac Insurance Company of Illinois ("Potomac") and Western States Insurance Company ("Western States"), as well as its boiler inspection service business, and recognized gains on the sales of $22 million through other revenues.

                    Specialty Lines.    The specialty lines combined ratio was 90% for 2004, compared to the 2003 combined ratio of 86%. The 2004 combined ratio was higher than 2003 primarily due to losses relating to the four storms in the southeastern United States that impacted IMU and better than expected weather losses in 2003. Written premiums for specialty lines were up 16% in 2004, driven by growth in writings at OBPP and AutoOne Insurance, as well as the introduction of OBSP in 2004, a new division offering coverages to the excess and surplus property market.

                    Personal Lines.    The combined ratio for personal lines for 2004 was 94%, compared to the 2003 combined ratio of 91%. The 2004 personal lines combined ratio was adversely impacted by seven points as a result of increased incentive compensation accruals, partially offset by three points due to the reduction of the New York assigned risk liability. The 2003 combined ratio benefitted by four points due to a reduction of the New York assigned risk liability. Premiums in this line grew 7% due in part to improved production of new business and increased retention levels and also $47 million in premiums assumed from New Jersey Skylands Insurance Association through a quota-share reinsurance agreement.

                    Commercial Lines.    The combined ratio for commercial lines for 2004 was 97%, compared to the 2003 combined ratio of 95%. The 2004 combined ratio was a bit higher as a result of transition and integration costs related to the Atlantic Specialty Transaction and adverse results from its non-Atlantic Mutual New York commercial lines book. The 2004 loss ratio includes two points relating to the four storms in the southeastern United States, which primarily related to Atlantic Specialty business in that area. Excluding these losses, the commercial lines loss ratio significantly improved. Premiums in this line grew by 89% primarily due to the Atlantic Specialty Transaction.

                    During the third quarter of 2004, OneBeacon entered into an agreement to sell the renewal rights to most of its non-Atlantic Mutual New York commercial lines business to Tower Insurance Group. The transaction, effective with December 1, 2004 renewals, will remove approximately $110 million of premiums over the next year.


            OneBeacon Results—Year Ended December 31, 2003 versus Year Ended December 31, 2002

            Overview

                    OneBeacon's pretax income for 2003 was $405 million, compared to pre-tax income of $200 million for 2002, and its GAAP combined ratio was 98% for 2003 compared to 107% for 2002. All of OneBeacon's ongoing businesses—specialty, personal and commercial lines—delivered combined ratios below 100% in 2003 and, in the second half of 2003, its premiums from its ongoing businesses grew for the first time since the OneBeacon Acquisition.

                    OneBeacon's total revenues for 2003 declined by 21% compared to 2002, due principally to a 25% decline in earned premiums, resulting primarily from a reduction in premiums assumed under the Liberty Agreement. Total revenues for 2003 were also impacted by a 29% decrease in net investment income due to the runoff of loss reserves as well as the reduced interest rate environment. Other revenues increased significantly in 2003 due mainly to fee revenue generated by New Jersey Skylands Management LLC and certain consolidated limited partnerships.

                    OneBeacon's total expenses for 2003 declined by 29% compared to 2002, primarily as a result of reduced premium writings and improved underwriting performance. Total expenses in 2003 included a net $147 million reserve increase in OneBeacon's runoff operations, primarily related to prior year construction defect claims, that was partially offset by an approximate $30 million release of the New York assigned risk liability due to the shrinking New York assigned risk pool. General and administrative expenses increased significantly in 2003 due mainly to expenses generated by New Jersey Skylands Management LLC and certain consolidated limited partnerships.

                    During the fourth quarter of 2003, OneBeacon sold one of its subsidiaries, National Farmers Union Standard Insurance Company ("NFU Standard"), for $22 million and recognized a $9 million gain on the sale through other revenue.

                    Specialty Lines.    The combined ratio in 2003 was 86%, a six point improvement over the 92% reported in 2002. This was driven by good underwriting results across OneBeacon's various specialty businesses, as well as favorable development in AutoOne Insurance's prior year reserves, which positively impacted the combined ratio by two points. OneBeacon wrote specialty lines premiums of $734 million in 2003, up 5% over 2002, mostly due to an increase in business written by OBPP and IMU.

                    Personal Lines.    The combined ratio in 2003 was 91%, a six point improvement over the 97% reported in 2002 as price increases achieved in 2002 and 2003 flowed through into underwriting results. In addition, the 2003 period reflected the reduction in OneBeacon's New York assigned risk liability, discussed above, which lowered the combined ratio by three points. OneBeacon's personal lines written premium volume for 2003 decreased 20% from 2002, primarily due to re-underwriting efforts such as actions to reduce exposure to windstorms on property located in coastal areas. Also contributing to the decrease were declines in written premiums relating to the transfer of OneBeacon's private passenger automobile business in New Jersey to New Jersey Skylands Insurance Association in 2002.

                    Commercial Lines.    The combined ratio in 2003 was 95%, a five point improvement over the 100% reported in 2002 as the Company's efforts to re-underwrite its book took hold, partially offset by prior year reserve development of three points. OneBeacon's commercial lines written premium volume for 2003 decreased 6% from 2002, primarily due to the continued effects of actions taken to reduce the concentration of risks subject to terrorism, such as reducing total insured values in 11 major cities, and reductions in workers compensation writings.

                    Run-off Operations.    Pursuant to the Liberty Agreement, Liberty Mutual assumed control of OneBeacon's claims offices in the regions subject to the Liberty Agreement and was responsible for servicing claims from the OneBeacon policies written prior to November 1, 2001, as well as policiesrun-off.


            which renewed in those regions since that date. Effective July 11, 2003, the servicing agreement with Liberty Mutual was amended and OneBeacon took back substantially all remaining outstanding claims related to policies written prior to the Liberty Agreement.

                    During the second quarter of 2003, OneBeacon claims and actuarial personnel noticed an unusual spike in case reserves related to the policies taken back from Liberty Mutual. The spike was isolated primarily to incurred losses on construction defect claims which were approximately $38 million higher than expected. There were 924 new claims, 32% higher than expected. The four states with the largest number of new construction defect claims were California, Nevada, Colorado and Arizona (345 of the total 924 new claims). As a result, OneBeacon claims and actuarial personnel undertook a study to determine the cause of the increase. This study, which was completed in the third quarter of 2003, indicated that most of the increase in activity was due to differences in case reserving philosophies between OneBeacon's and Liberty's claims adjusters, such as the identification and coding of construction defect claims. However, the study also indicated that some of the increase in activity related to an increase in the severity of construction defect claims stemming from increased litigation and resulting adverse court decisions. As a result, OneBeacon recorded an increase for construction defect claim reserves of $98 million in the third quarter of 2003. SeeConstruction Defect Claims in CRITICAL ACCOUNTING ESTIMATES below for further background on construction defect claims.

            White Mountains Re

                    Financial results and GAAP combined ratios for White Mountains Re for the years ended December 31, 2004, 20032007, 2006 and 20022005 follows:

             
             Year Ended December 31,
            Millions

             2004
             2003
             2002
             Gross written premiums $1,933.3 $1,414.9 $982.0


             Net written premiums $1,246.3 $885.7 $688.2


             Earned insurance and reinsurance premiums $1,265.5 $845.8 $635.0
             Net investment income  98.5  50.4  51.5
             Net realized investment gains  29.6  7.7  30.3
             Other revenue  36.1  75.5  53.6


              Total revenues  1,429.7  979.4  770.4


             Losses and LAE  918.9  557.6  442.2
             Insurance and reinsurance acquisition expenses  271.8  198.0  161.2
             Other underwriting expenses  122.9  57.8  41.0
             General and administrative expenses  15.1  19.6  20.6
             Accretion of fair value adjustment to loss and LAE reserves  10.1    
             Interest expense on debt  3.8  2.0  2.0


              Total expenses  1,342.6  835.0  667.0


            Pretax earnings $87.1 $144.4 $103.4


             Years Ended December 31,
             
             
             2004
             2003
             2002
             
            GAAP ratios:       
             Loss and LAE 73%66%70%
             Expense 31%30%32%


              Total Combined 104%96%102%


             Year Ended December 31,
             
            Millions

             
             2007
             2006
             2005
             
             Gross written premiums $1,295.3 $1,624.5 $1,981.3 


             Net written premiums $1,095.7 $1,290.0 $1,304.1 


             Earned insurance and reinsurance premiums $1,146.8 $1,241.2 $1,371.6 
             Net investment income  210.5  182.7  148.9 
             Net realized investment gains  63.7  59.0  76.8 
             Other revenue  5.0  47.8  33.5 


              Total revenues  1,426.0  1,530.7  1,630.8 


             Losses and LAE  701.0  884.6  1,237.9 
             Insurance and reinsurance acquisition expenses  255.0  287.2  279.6 
             Other underwriting expenses  118.5  94.7  107.0 
             General and administrative expenses  26.2  24.2  12.4 
             Accretion of fair value adjustment to loss and LAE reserves  5.4  1.5  10.9 
             Interest expense on debt  23.2  1.5  .4 


              Total expenses  1,129.3  1,293.7  1,648.2 


            Pre-tax earnings (loss) $296.7 $237.0 $(17.4)


             Year Ended December 31,
             
             
             2007
             2006
             2005
             
            GAAP ratios:       
             Loss and LAE 61%71%90%
             Expense 33%31%28%


              Total Combined 94%102%118%


            White Mountains Re Results—Year Ended December 31, 20042007 versus Year Ended December 31, 20032006

                    White Mountains Re's pre-tax income for 2007 was $297 million compared to a $237 million for 2006, and its GAAP combined ratio increasedwas 94% for 2007 compared to 102% for 2006. The loss and LAE ratio for 2007 included $76 million, or 7 points, of pre-tax catastrophe losses, net of reinsurance and reinstatement premiums, primarily from 96% in 2003 to 104% in 2004, due primarily to $135 million of claims incurred related to significant property catastrophe eventsEuropean windstorms Kyrill and Hanno in the second halffirst quarter of 2004. These catastrophes, which are discussed further below, increased2007, floods that impacted the combined ratio in 2004 by 11 points. In general, White Mountains Re has experienced favorable underwriting conditions for the past three underwriting years. Earnings from business segments not impacted by the property catastrophe events, and earnings from the recently completed Sirius Acquisition, have partially offset the impact of these natural disasters. Net written premiums, total revenues, and total expenses were all up substantially in 2004 due to the Sirius Acquisition.

                    Gross written premiums increased $518 million, or 37% from 2003 to 2004, and net written premiums increased $361 million, or 41% for the same period. This increase is due primarily to the Sirius Acquisition, which contributed $612 million of gross written premiums and $418 million of net written premiums during 2004. Included in these amounts is the U.S. program business written by Sirius America totaling $216 million of gross written premiums and $85 million of net written premiums. Additionally, in late 2003, White Mountains Re, through Folksamerica, entered into the CNA Re agreement and established a Chicago underwriting office. Annual gross written premiums for the 2004 underwriting year resulting from this transaction and the related opening of the Chicago underwriting office were approximately $177 million, of which $129 million was recorded as gross written premium and $91 million as net written premium for the year ended December 31, 2004. Partially offsetting the increases resulting from these transactions was the cancellation of several large casualty treaties at Folksamerica whose pricing or terms did not meet White Mountains Re's underwriting guidelines.

                    There were significant levels of property catastrophe activityUnited Kingdom during the last half of 2004, includingsecond and third quarters, the fourPeru earthquake, hurricanes which affected the Southeast United StatesDean and the Caribbean, where White Mountains Re has historically been a significant participantFelix, and floods in the property reinsurance market. Additionally, Sirius International was exposedJakarta, Slovenia, and Mexico. In addition to losses from the devastating tsunami that impacted South Asia in December 2004. White Mountains Re believes its underwriting discipline and risk management approach helped to contain these losses to manageable levels. This significant property catastrophe activity during the last half of 2004 resulted in $135 million of pre-tax losses, including $16 million related to the tsunami. There was no significant property catastrophe activity in 2003.

                    During 2004,catastrophes, White Mountains Re recorded $11$9 million of net unfavorable development in 2007, which consisted of $63 million related to A&E exposures, $28 million in strengthening of certain of its U.S. casualty reserves and $7 million related to surety business. These losses were largely offset by favorable development of $91 million, primarily on property lines from prior accident years. The loss reserveand LAE ratio for 2006 included net adverse development which contributed 1 point to the loss ratio in 2004, as compared to $46of $218 million, or 518 points, which included a charge of $137 million arising from the Olympus reimbursement described below, $92 million ($86 million net of reinstatement premiums) in 2003. The 2003 unfavorableadverse development is describedon hurricanes Katrina, Rita and Wilma, and $55 million of adverse development from casualty losses associated with the Risk Capital acquisition in further detail in the section titled White Mountains Re Results—Year Ended December 31, 2003 versus Year Ended December 31, 2002, below. The majority of the unfavorable development recorded in 2004 resulted from certain discontinued lines at Folksamerica as well as run-off operations acquired as part of the Sirius Acquisition. This unfavorable development was2000. These losses were partially offset by favorable development on various lines, including $46 million and $19 million of favorable development on the property and agriculture lines of business, respectively.

                    White Mountains Re's gross written premiums decreased by 20% to $1,295 million in 2007, compared to $1,625 million in 2006, and net written premiums decreased by 15% to $1,096 million in 2007 compared to $1,290 million in 2006. Excluding written premiums from Sirius America, which White Mountains Re sold during the Sirius International reserve portfolio, stemming mainly from the threethird quarter of


            2006, gross written premiums decreased by $258 million, or 17%, and net written premiums decreased by $155 million, or 12%, reflecting reductions in most recent underwriting years, and is indicativelines of the favorablebusiness. These decreases were primarily due to pricing, terms and conditions that have existed in the global reinsurance marketplace during that time. Additionally,no longer met White Mountains Re's underwriting guidelines. White Mountains Re recorded $10has been experiencing significant price competition in the reinsurance market due to excess underwriting capacity. This excess underwriting capacity, combined with fewer catastrophic events in 2007, has resulted in downward pressure on pricing. Higher ceding company retentions also reduced White Mountains Re's premium volume. Decreases in net written premiums were partially offset by the non-renewal in 2007 of a series of ceded property Second Event Industry Loss Warranty Covers that White Mountains Re had purchased during the first quarter of 2006. White Mountains Re ceded approximately $20 million in premiums related to the Second Event Industry Loss Warranty Covers in the first quarter of unfavorable loss development on its workers compensation reserves acquired as part2006. The decreases in volume were also partially offset by more favorable foreign currency exchange rates versus the U.S. dollar, particularly the Swedish Krona.

                    Net investment income in 2007 increased by 15% to $211 million compared to the prior year mainly due to an increase in invested assets from the transfer of White Mountains Re's investment in Symetra to White Mountains for cash in December 2006, proceeds from the issuance of the Sierra acquisitionpreference shares in 2004. This adverse development was offset dollar-for-dollar by the adjustable note discussedMay 2007, as well as capital contributions of $100 million from White Mountains in Note 2—Significant Transactions.June 2006.

                    White Mountains Re receivesrecognized fee income on reinsurance placements referred toof $10 million from Olympus and is entitledHelicon in 2007, $8 million of which was recorded as other revenues, compared to $12 million of fee income from Olympus and Helicon in 2006, $9 million of which was recorded as other revenues. White Mountains Re did not renew its quota share arrangements with Olympus and Helicon for 2008. Olympus continues to be responsible to pay losses on exposures that have been ceded to it and will continue to earn premiums related primarily to the run-off of underwriting year 2007. White Mountains Re acquired Helicon on January 7, 2008.

                    Other revenues for 2007 also included $13 million of realized foreign exchange losses compared to $21 million of foreign exchange gains for the comparable prior period. During the fourth quarter 2007, White Mountains Re sold its' wholly-owned subsidiary Stockbridge Insurance Company for $26 million in cash to a profit commission basedthird party and recognized a $10 million pre-tax gain on netthe sale through other revenues. In 2006, other revenues included a $14 million pre-tax gain from the sale of Sirius America, a wholly-owned subsidiary of White Mountains Re.

                    Other underwriting profits on referred business. The additional capacity providedexpenses in 2007 increased by $24 million to $119 million compared to 2006. This increase is due to increased incentive compensation accruals, movement in foreign exchange rates as the reinsurance relationship with Olympus supportsSwedish Krona strengthened against the U.S. dollar, as well as increased expenses arising from the expansion of White Mountains Re's abilityBermuda advisory operations. In addition, during the first quarter of 2006, Scandinavian Re reduced its unallocated loss adjustment expense reserve by approximately $7 million as a result of an evaluation of the remaining run-off contracts.

                    General and administrative expenses in 2007 increased by $2 million to offer significant reinsurance protection.$26 million compared to 2006. This increase is mainly due to costs expensed in connection with the issuance of $250 million of non-cumulative perpetual preference shares during the second quarter of 2007 and $400 million face value of senior unsecured notes during the first quarter of 2007, as further discussed below.

                    In May 2007, WMRe Group issued $250 million of non-cumulative perpetual preference shares and received $246 million of proceeds, net of $4 million of issuance costs and commissions. Holders of the WMRe Preference Shares receive dividends on a non-cumulative basis only when, as and if declared by White Mountains Re recognized net fee incomeat a fixed dividend rate of $69 million7.506% for the period from Olympus in 2004 as compared to $98 in 2003.issuance until June 30, 2017 and a variable dividend rate thereafter. The decline inWMRe Preference Shares are redeemable only at the fee income earned is


            due primarily to the negative impactoption of the four hurricanes on the profit commission arrangement betweenWhite Mountains Re. During 2007, White Mountains Re declared and Olympus.paid $11 million in dividends to holders of the WMRe Preference Shares.

                    In March 2007, White Mountains Re issued $400 million face value of senior unsecured notes that have an annual effective yield of 6.5% for net proceeds of $392 million. In anticipation of the issuance of the WMRe Senior Notes, White Mountains Re entered into an interest rate lock agreement to hedge its interest rate exposure and recorded a $2 million loss in accumulated other comprehensive income related to this agreement, which is being amortized into interest expense over the life of the WMRe Senior Notes. White Mountains Re deferred $4 million in expenses related to the issuance of the WMRe Senior Notes (including a $3 million underwriting discount), which are also being recognized into interest expense over the life of the WMRe Senior Notes.

                    White Mountains Re's interest expense in 2007 increased by $22 million, primarily due to the interest on the aforementioned WMRe Senior Notes.


            White Mountains Re Results—Year Ended December 31, 20032006 versus Year Ended December 31, 20022005

                    White Mountains' Re's pretax income was $144 million for 2003, an increase of 40% over the $103 million recorded in 2002. White Mountains Re's GAAP combined ratio improved to 96% for 2003, from 102% for 2002. The improvement in White Mountains Re's combined ratio resulted primarily from more favorable terms and conditions in the reinsurance marketplace, and fewer catastrophe losses affecting White Mountains Re in 2003 as compared to 2002.

                    White Mountains Re's gross writtenpre-tax income for 2006 was $237 million compared to a pre-tax loss of $17 million for 2005, and its GAAP combined ratio was 102% for 2006 compared to 118% for 2005. The improved combined ratio and the increase in pre-tax income resulted primarily from significantly lower catastrophe losses. During 2006, White Mountains Re recorded $86 million of unfavorable development, net of reinstatement premiums increased 44%and reinsurance, related to hurricanes Katrina, Rita and Wilma and $137 million in losses and $9 million of forgone override commissions related to the Olympus reimbursement. During 2005, White Mountains Re recognized $351 million in pre-tax losses, net of reinstatement premiums and reinsurance from 2002 to 2003, while net written premiums increased 29%hurricanes Katrina, Rita and earned premiums increased 33%. The increasesWilma. 2005 also included $57 million of other significant property catastrophe losses, primarily from European storm Erwin and floods in net writtenEurope.

                    Excluding the unfavorable development from Katrina, Rita and earned premiums were due to increased pricing onWilma and the Olympus reimbursement, White Mountains Re's expiringunderwriting units performed well in 2006, reflecting generally more favorable weather conditions and renewed contracts, increased sharescontinued favorable prices, terms and conditions within the reinsurance marketplace. Excluding the additional losses from hurricanes Katrina, Rita and Wilma and the Olympus reimbursement, favorable development on renewed contractsprior year reserves of $11 million resulted primarily from continued favorable run off of recent underwriting years at Sirius International of $46 million and new contracts resultingfavorable development of $19 million arising from Folksamerica's agriculture line of business, offset by unfavorable development of $55 million from casualty losses associated with the increased demand of reinsurance buyers for placing reinsurance with responsible, well-capitalized reinsurers.Risk Capital acquisition.

                    White Mountains Re's total revenues were2006 gross written premiums decreased by 18% to $1,625 million and net written premiums decreased by 1% to $1,290 million from $1,304 million in 2005. White Mountains Re reduced its overall property exposure and Folksamerica non-renewed its excess offshore energy and marine business in the Gulf of Mexico starting on January 1, 2006, which caused gross written premiums to decline substantially in 2006 versus 2005. All of the non-renewed excess offshore energy and marine business was subject to Folksamerica's reinsurance treaty with Olympus, under which Folksamerica ceded up 27%to 75% of this business in 2003 over 2002, primarily driven by2005. As a 33% increaseresult, the impact on the change in earned premiums. The increase in earned (and net written) premiums was due to increased pricing on White Mountains Re's expiringnet written premiums from 2005 to 2006 was significantly less than the impact on the change in its gross written premiums over the same period. Gross and renewed contracts,net written premiums were also lower during 2006 due to lower reinstatement premiums on property catastrophe reinsurance, which had primarily resulted from reinstated coverage after hurricanes Katrina and Rita in 2005, and lower premiums from Sirius America, which was sold in August 2006. Sirius America contributed $71 million and $39 million of gross and net written premiums, respectively, in 2006, compared to $248 million and $87 million, respectively, in 2005. Additionally, gross and net written premiums on casualty lines were lower in 2006, due mainly to pricing, terms and conditions that did not meet White Mountains Re's pricing guidelines and due to higher ceding company retentions. These decreases were partially offset by increases in certain non-catastrophe exposed classes, particularly in specialty lines.

                    White Mountains Re's net investment income increased shares on renewed contractsby $34 million in 2006 as a result of higher overall yields and new contractsa larger investment asset base, principally due to contributions from White Mountains. Other underwriting expenses decreased in 2006 by $12 million, or 11%, from 2005, primarily due to a reduction in unallocated loss adjustment expense reserves of approximately $7 million during the first quarter of 2006 resulting from an evaluation of the remaining run-off contracts at Scandinavian Re, as well as a reduction in incentive compensation accruals. General and administrative expenses increased demand of reinsurance buyers for placing reinsurance with responsible, well-capitalized reinsurers. Also contributingto $24 million in 2006 from $12 million in 2005. The increase is primarily due to accruals related to the increaserelocation of the underwriting advisory operations from Ireland to Bermuda and costs associated with expanding the Bermuda advisory operations.

                    Accretion of the fair value adjustment to loss and LAE reserves decreased in 2006 by $9 million, or 86%, from $11 million in 2005 as a result of a change in the rate of accretion of the fair value adjustment to loss and LAE reserves that was established in the purchase accounting for the Sirius Acquisition. The change in accretion resulted from the aforementioned evaluation of the remaining run-off contracts at Scandinavian Re and will be made prospectively over the remaining amortization period.

                    White Mountains Re recognized fee income of $12 million from Olympus and Helicon in 2006, $9 million of which was recorded as other revenues, compared to $61 million of fee income from Olympus in 2005, $28 million of which was recorded as other revenues. The decrease in fee income was primarily the result of a reduction in amounts ceded to Olympus and Helicon in 2006 compared to 2005 and due to Folksamerica Holdings Company ("Folksamerica Holdings") waiving $9 million of override commission due from Olympus in accordance with the


            Olympus reimbursement. Other revenues in 20032006 also included a $14 million gain from the sale of Sirius America and $21 million of realized foreign exchange gains. In 2005, other revenue also included a $5 million gain from the sale of California Indemnity Insurance Company, a wholly-owned subsidiary of White Mountains Re acquired in 2004 as part of the Sierra acquisition.

                    Olympus reimbursement.    In June 2006, following the receipt of new claims information reported from several ceding companies and subsequent reassessment of the ultimate loss exposures, White Mountains Re increased its gross loss estimates for hurricanes Katrina, Rita and Wilma by $201 million. This was mostly on Folksamerica's off-shore energy and marine exposures attributable to retrocessional arrangements and business interruption coverage. As a $49result, Folksamerica set its gross loss and LAE reserves as of June 30, 2006 on offshore energy and marine exposures for hurricanes Katrina and Rita at full contract limits. Starting January 1, 2006, Folksamerica non-renewed its excess offshore energy and marine business in the Gulf of Mexico.

                    Under the terms of Folksamerica's 2005 quota share reinsurance treaty with Olympus, $139 million increase ($98of the loss, net of reinstatement premiums, from hurricanes Katrina, Rita and Wilma recorded in the second quarter of 2006 was ceded to Olympus. However, Folksamerica Holdings entered into an indemnity agreement with Olympus on June 16, 2006, under which it agreed to reimburse Olympus for up to $137 million in 2003 vs $49 million in 2002) in advisory feesof these losses, which were recorded as loss and profitLAE during the second quarter of 2006. Folksamerica Holdings also waived override commissions receivedon premiums earned by Olympus after March 31, 2006 for reinsurance contracts recommended by White Mountains Re on reinsurance placements referred to Olympus, due principally towith an increase in the volumeeffective date of business ceded to Olympus in 2003.

            December 31, 2005 and prior. White Mountains Re experiencedexpects that the commission waivers will total approximately $46 million$12 million. Folksamerica ceded 35% of unfavorableits 2007 underwriting year short-tailed excess of loss reserve development during 2003, primarily due to strengthening of A&E reservesbusiness, mainly property and reserves on Risk Capital casualty lines. White Mountains Re's 2003 loss development for A&E exposures was due to the completion of a detailed A&E market share study. This study compared Folksamerica's share of industry paid losses to estimated industry carried reservesmarine, with Olympus and resultedHelicon sharing approximately 55% and 45%, respectively, in Folksamerica increasing its IBNR by approximately $25 million.2007.


            Esurance

                    Esurance's financial results and GAAP combined ratios for the years ended December 31, 2004, 20032007, 2006 and 20022005 follows:

             
             Year Ended December 31,
             
            Millions

             
             2004
             2003
             2002
             
             Gross written premiums $201.3 $116.4 $53.0 


             Net written premiums $199.4 $116.4 $53.0 


             Earned insurance and reinsurance premiums $176.5 $99.9 $40.8 
             Net investment income  3.5  1.3  1.2 
             Net realized investment gains  1.1  .2   
             Other revenue  2.2  .3  1.6 


              Total revenues  183.3  101.7  43.6 


             Losses and LAE  122.4  81.0  36.6 
             Insurance and reinsurance acquisition expenses  29.4  18.8  9.7 
             Other underwriting expenses  27.7  20.4  22.4 


              Total expenses  179.5  120.2  68.7 


            Pretax earnings (loss) $3.8 $(18.5)$(25.1)


             Years Ended December 31,
             
             
             2004
             2003
             2002
             
            GAAP ratios:       
             Loss and LAE 69%81%89%
             Expense 33%39%80%


              Total Combined 102%120%169%


             Year Ended December 31,
             
            Millions

             
             2007
             2006
             2005
             
             Gross written premiums $802.5 $599.5 $351.9 


             Net written premiums $798.5 $595.9 $349.1 


             Earned insurance and reinsurance premiums $763.3 $527.5 $306.8 
             Net investment income  29.6  18.4  9.8 
             Net realized investment gains  4.5  6.9  2.1 
             Other revenue  13.6  7.4  3.0 


              Total revenues  811.0  560.2  321.7 


             Losses and LAE  622.4  383.9  206.2 
             Insurance and reinsurance acquisition expenses  202.7  135.3  90.8 
             Other underwriting expenses  58.4  48.8  37.2 
             General and administrative expenses  .2  .2   


              Total expenses  883.7  568.2  334.2 


            Pre-tax loss $(72.7)$(8.0)$(12.5)


             Year Ended December 31,
             
             
             2007
             2006
             2005
             
            GAAP ratios:       
             Loss and LAE 82%73%67%
             Expense 34%35%42%


              Total Combined 116%108%109%


            Esurance Results—Year Ended December 31, 20042007 versus Year Ended December 31, 20032006

                    Esurance's pretax incomepre-tax loss for 2007 was $73 million compared to a pre-tax loss of $4$8 million for 2004 represented an improvement over the pretax loss of $19 million in 2003.2006. Esurance's 2004GAAP combined ratio improvedwas 116% for 2007 compared to 102% from 120% in 2003 due to improvements in both loss and expense ratios.108% for 2006. Esurance's loss ratio improvementincreased to 82% in 2007 from 73% in 2006 due to a higher current year loss ratio and $30 million, or 4 points, of prior period adverse loss development. During the second quarter of 2007, Esurance began to experience higher than expected paid loss severity for injury claims. A review of all open liability claim files was completed third quarter. As a result, case reserves were increased to reflect the higher loss severity for injury claims. Esurance is seeing higher injury claim severities reported by its peer group and in industry data, indicating that the trend is not unique to Esurance's business. In response to higher claim costs, Esurance has increased prices for injury coverages. Due to these rate increases and effects of competition in the personal auto market, Esurance expects to grow more slowly in 2008 than in previous years. Esurance's expense ratio decreased to 34% in 2007 from the prior period expense ratio of 35% as lower operating expenses offset higher acquisition costs that resulted from increased competition in the continued rollout and refinement of Esurance's proprietarypersonal auto insurance program. Loss ratio improvement also resulted from better claims performance, driven by the transition from a third party administrator to an in-house claims operation in 2003, as well as 3 points of favorable development on loss reserves.market.

                    The auto program, combined with Esurance's self-service, web-enabled operating platform, allowed EsuranceNet written premium increased to $799 million in 2007, a 34% increase premium volume and in-force policy count while reducing the expense ratio from 39% to 33%.2006. As of December 31, 2004,2007, Esurance's in-force policy count was 118,513 policies,totaled 485,000, a 60%30% increase over December 31, 2003. Increased advertising, particularly2006. During 2007, Esurance expanded its marketing programs through online video, search, and television while making site changes that improved the conversion rate (i.e. the ratio of policies written to quotes generated).

                    During 2007, Esurance wrote business in radio28 states, the largest of which were California (with 22% of direct premium written), Florida (16%), New York (7%), Texas (6%) and TV, drove policy count growth.Michigan (5%).

            Esurance Results—Year Ended December 31, 20032006 versus Year Ended December 31, 20022005

                    The trends described above that drove Esurance's favorable results in 2004 relative to 2003 also benefitted the 2003 results in relation to 2002. Thus, the pretaxpre-tax loss for Esurance decreased by $72006 was $8 million in 2003 and thecompared to a pre-tax loss of $13 million for 2005. Esurance's GAAP combined ratio fell 49was 108% for 2006 compared to 109% for 2005. Esurance's loss ratio increased to 73% in 2006 from 67% in the prior period, due to rate reductions and one point of unfavorable development on loss reserves in 2006 compared to three points while netof favorable development on loss reserves in the prior year. The expense ratio decreased to 35% in 2006 from the prior period expense ratio of 42% due to lower acquisition costs and additional operating efficiencies.

                    Net written premiums more than doubled.premium increased to $596 million, a 71% increase from 2005. As of December 31, 2006, Esurance's in-force policy count totaled 372,688, a 76% increase over 2005. During 2006, Esurance continued to expand through national and local television advertising, online marketing, direct mail, and online agency channels. More site traffic and improved conversion rates lowered the costs of acquiring new customers during 2006.

                    During 2006, Esurance wrote business in 24 states, the largest of which were California (with 19% of direct premium written), Florida (17%), New York (9%), Texas (6%) and Michigan (6%).


            Other Operations

                    Other Operations consists of the operations of the Company, and the Company's intermediate subsidiary holding companies, White Mountains' weather risk management and variable annuity reinsurance businesses, the consolidated results of the Tuckerman Funds, the International American Group, as well asWM Advisors and White Mountains' investments in Symetra, Pentelia, Delos and Montpelier and Symetra warrants.Re (until its disposition in May 2007).

                    A summary of White Mountains' financial results from its Other Operations segment for the years ended December 31, 2004, 20032007, 2006 and 20022005 follows:

             
             Year Ended December 31,
             
            Millions

             
             2004
             2003
             2002
             
             Gross written premiums $ $41.2 $35.0 


             Net written premiums $ $33.1 $29.5 


             Earned insurance and reinsurance premiums $ $31.7 $29.7 
             Net investment income  37.5  15.5  (.7)
             Net realized investment gains  20.8  27.7  12.7 
             Other revenue  10.4  36.3  39.9 


              Total revenues  68.7  111.2  81.6 


             Losses and LAE  4.6  23.9  28.1 
             Insurance and reinsurance acquisition expenses    4.0  3.8 
             Other underwriting expenses  1.5  10.2  9.1 
             General and administrative expenses  172.0  114.6  49.7 
             Accretion of fair value adjustment to loss and LAE reserves  33.2  48.6  79.8 
             Interest expense on debt  44.3  46.3  69.8 
             Interest expense—dividends and accretion on preferred stock subject to mandatory redemption  47.6  22.3   


              Total expenses  303.2  269.9  240.3 


            Pretax loss $(234.5)$(158.7)$(158.7)


                    White Mountains' capital raising and capital allocation activities are principally conducted through its holding companies. In this regard, the results of its Other Operations segment primarily relate to financing activities, purchase accounting adjustments relating to the OneBeacon Acquisition, gains and losses recognized from the purchase and sale of certain of the Company's subsidiaries and other assets and general and administrative expenses incurred at the holding company level.

             
             Year Ended December 31,
             
            Millions

             
             2007
             2006
             2005
             
             Gross written premiums $ $ $1.9 


             Net written premiums $ $ $1.8 


             Earned insurance and reinsurance premiums $ $ $1.8 
             Net investment income  84.4  46.8  90.4 
             Net realized investment gains (loss)  21.3  50.4  (89.1)
             Gain on sale of shares through the OneBeacon Offering    171.3   
             Other revenue—Tuckerman Funds  102.1  89.5  93.2 
             Other revenue  16.0  18.5  49.2 


              Total revenues  223.8  376.5  145.5 


             Losses and LAE  (6.8) 3.9  12.6 
             Insurance and reinsurance acquisition expenses      .1 
             Other underwriting expenses  2.7  1.8  1.6 
             General and administrative expenses—Tuckerman Funds  95.0  76.9  78.4 
             General and administrative expenses  69.3  101.7  49.6 
             Interest expense on debt  4.6  3.0   


              Total expenses  164.8  187.3  142.3 


            Pre-tax income $59.0 $189.2 $3.2 


            Other Operations Results—Year Ended December 31, 20042007 versus Year Ended December 31, 2003

                    White Mountains' Other Operations segment reported a pre-tax loss of $235 million for 2004, compared to $159 million for 2003. The increased loss for the year was primarily due to a $20 million increase in incentive compensation accruals, which were driven by a 41% rise in White Mountains' stock price during 2004, and higher gains from the sale of real estate in 2003 ($13 million in 2004 and $43 million in 2003). In addition, interest expense on preferred stock was up $25 million in 2004 due to the inclusion of a full year of expense in pre-tax income in 2004 as opposed to six months included in 2003 as a result of the Company's adoption of SFAS 150, effective July 1, 2003. Prior to the adoption of SFAS 150, the interest expense on preferred stock was classified below the pretax loss line on the income statement as preferred stock dividends.

                    During the periods presented, Peninsula was the only operating company in the segment, and therefore it accounts for all of the premiums reported in the tables above. During January 2004, White Mountains sold Peninsula for $23 million. The operations of American Centennial and British Insurance Company are not significant to White Mountains, as those companies have been in run-off since they were acquired in 1999.


            Other Operations Results—Year Ended December 31, 2003 versus Year Ended December 31, 20022006

                    White Mountains' Other Operations segment reported pre-tax lossesincome of $159$59 million for both 2003 and 2002. Incentive compensation accruals2007, compared to $189 million for 2006, which included a $171 million gain on the sale of OneBeacon shares. Excluding the gain on OneBeacon shares, pre-tax income from Other Operations increased by $72$41 million in 2003, but this increase was offset by, among other items,2007, due mainly to a $43$35 million decrease in losses on interest rate swap agreementsincentive compensation expense, a $26 million increase in pre-tax income from the Symetra warrants ($17 million increase in net realized gains and a $31$9 million decreaseincrease in the accretionnet investment income) and $11 million of the fair value adjustment on loss reserves acquired in the OneBeacon Acquisition. Interest expense on debt decreased by $24 million in 2003,favorable development during 2007, primarily due to the pay-offsettlement of a $260large claim at British Insurance Company. These increases in pre-tax income were partially offset by a $6 million loanincrease in other non-incentive compensation expenses. In addition, White Mountains' weather risk management and variable annuity reinsurance businesses had pre-tax income (losses) of $(5) million and $(11) million, respectively, in 2007 compared to $(3) million and $2 million, respectively, in 2006.

            Other Operations Results—Year Ended December 31, 2006 versus Year Ended December 31, 2005

                    White Mountains' Other Operations segment reported pre-tax income of $189 million for 2006, compared to $3 million for 2005. The increase was primarily attributable to the refinancing$171 million gain on the sale of $700OneBeacon shares. In addition, the Montpelier Re investment accounted for $13 million in pre-tax income during 2006, compared to $63 million of senior debt and amortizationpre-tax losses during 2005, which included $39 million of net investment income from the previous credit facility. This decrease wasspecial dividend. These increased gains were partially offset by a $58 million increase in incentive compensation expense in 2006 compared to 2005. In addition, White Mountains' weather risk management and variable annuity reinsurance businesses contributed $(3) million and $2 million, respectively, to pre-tax income for the inclusionOther Operations segment in their first year of $22 million of interest expense on preferred stock as a result of SFAS 150.operation.


            II. Summary of Investment Results

                    A summary of White Mountains' consolidated pre-tax investment results for the years ended December 31, 2007, 2006 and 2005 follows:

             
             Year Ended December 31,
             
            Millions

             
             2007
             2006
             2005
             
            Net investment income $533.0 $435.5 $491.5 
            Net realized investment gains  263.2  272.7  112.6 
            Net unrealized investment gains (losses)  62.5  114.0  (285.7)


             Total GAAP pre-tax investment results $858.7 $822.2 $318.4 


                    Gross investment returns versus typical benchmarks for the years ended December 31, 2007, 2006 and 2005 are as follows. For purposes of discussing rates of return, all percentages are presented gross of management fees and trading expenses in order to produce a more relevant comparison to benchmark returns, while all dollar amounts are presented net of any management fees and trading expenses.

             
             Year Ended December 31,
             
             
             2007
             2006
             2005
             
            Fixed maturity investments 6.4%6.0%2.6%
            Short-term investments 5.2 6.1 5.6 
             Total fixed maturities 6.2 6.0 3.0 
             Lehman U.S. Aggregate Index 7.0 4.3 2.4 

            Convertible fixed maturities


            4.3


            9.4


            6.4


            Common stock


            9.0


            22.0


            5.2

             
            Other investments 29.7 16.4 3.7 
             Total equities 14.9 20.2 4.7 
             S&P 500 Index (total return) 5.5 15.8 4.9 

            Total consolidated portfolio


            7.6

            %

            8.4

            %

            3.3

            %

            Investment Philosophy
            Returns—Year Ended December 31, 2007 versus Year Ended December 31, 2006

                    White Mountains manages allMountains' total pre-tax investment result was a gain of its consolidated investments through its wholly-owned subsidiary, WM Advisors.$859 million, a return of 7.6% for 2007 compared to a gain of $822 million, a return of 8.4% for 2006. White Mountains' total fixed maturity portfolio returned 6.2% during 2007, compared to 6.0% in 2006. White Mountains' fixed maturity portfolio provided positive results, as it avoided the sub-prime mortgage difficulties that have tainted many other investment philosophy is to investportfolios, and its assets with a view towards maximizing its after-tax total return over extended periods of time. Under this approach, each dollar of after-taxequity portfolio again exceeded industry benchmarks. Both benefited from the weakening U.S. dollar.

                    Net investment income of $533 million in 2007 increased by 22% from $436 million in 2006, principally due to a higher average invested asset base in 2007, resulting from the sale of OneBeacon shares late in 2006 and the issuance of the WMRe Senior Notes and Preference Shares early in 2007. Net realized andinvestment gains in 2007 of $263 million were relatively consistent with the $273 million reported in 2006. Pre-tax net unrealized gains and losses is valued equally. White Mountains' overall fixed maturity investment strategy isdecreased to purchase securities that are attractively priced$63 million in relation2007, from $114 million in 2006, mainly due to perceived credit risks. White Mountains generally manages the interest rate risk associated with holding fixed maturity investments by actively monitoring and maintaining the average duration of the portfolio with the goal of achieving an adequate after-tax total return without subjecting the portfolio to an unreasonable level of interest rate risk. White Mountains' investment portfolio mix as ofa higher foreign currency exchange unrealized gains in 2006 than in 2007.

            Investment Returns—Year Ended December 31, 2004 consisted in large part of high-quality, fixed maturity investments and short-term investments, as well as some equity investments and limited partnerships. White Mountains' management believes that prudent levels of investments in common equity securities and other investments within its investment portfolio are likely to enhance after-tax total returns without significantly increasing the risk profile of the portfolio when considered over long periods of time when balanced with leverage and insurance risk considerations. White Mountains seeks to maximize after-tax risk-adjusted returns over the long term.


            Investment Returns
            2006 versus Year Ended December 31, 2005

                    White Mountains generated strongMountains' total pre-tax investment returnsresult was a gain of $822 million, a return of 8.4% for 2006 compared to a gain of $318 million, a return of 3.3% for 2005. White Mountains' total fixed maturity portfolio returned 6.0% during 2006 versus 3.0% during 2005. The higher return in 2004. The GAAP2006 was primarily due to a more favorable interest rate environment, where the rate of increase in interest rates during 2006 was lower than during 2005. In addition, the weakening of the U.S. dollar during 2006 reversed a trend from 2005 and produced unrealized currency exchange


            gains of $112 million in White Mountains' foreign denominated fixed maturity securities portfolio. White Mountains' total return on invested assets was 7%, while the equity portfolio returned 20% for the year.20.2% during 2006 versus 4.7% during 2005. The equity return in 2005 was significantly better than the S&P 500, which returned 11% for the year, while the bond portfolio performed in line with its duration and credit characteristics. Management is continuing to keep its fixed maturity portfolio duration relatively short at about 3 years to reflect its concern that interest rates may rise in the next few years. Net investment income was up 24% from last year mainly due to the Sirius Acquisition, after declining 21% in 2003 primarilyadversely impacted by 12.1 points due to the decline in reserves at OneBeacon as its premium volume was reduced.the Montpelier Re investment.

                    White Mountains sold a portionNet investment income of its investment in Montpelier common shares$436 million during the first quarter of 2004 resulting in a $352006 decreased 11% from $492 million pre-tax realized gain and, as a result, changed the method of accounting for its remaining Montpelier common sharesduring 2005, principally due to the fair value method, resulting inreceipt of a $33$74 million special dividend on the Montpelier Re common share and warrant investments during 2005. Net realized investment gains of $273 million during 2006 increased by 142% from $113 million during 2005, primarily due to a $170 million increase in after-taxrealized gains from the Montpelier Re common share and warrant investment (a $5 million realized gain in 2006 period versus a $165 million realized loss in 2005, which included a $55 million other-than-temporary impairment charge). Net unrealized gains on investments of $114 million during 2006 improved from net unrealized losses of $286 million during 2005, primarily due to the effect of interest rate movements and foreign currency fluctuations, as described above. In addition, 2005 included a $65 million pre-tax unrealized loss from the Montpelier Re common share investment.

            Portfolio composition

                    The following table presents the composition of White Mountains' investment portfolio as of December 31, 2007 and 2006:

             
             As of December 31, 2007
             As of December 31, 2006
             
            $ in millions

             Carrying value
             % of total
             Carrying value
             % of total
             
            Fixed maturity investments $7,371.5 63.3%$7,475.3 66.0%
            Common equity securities  1,550.7 13.3  1,212.6 10.7 
            Short-term investments  1,327.3 11.4  1,344.9 11.9 
            Other investments  603.3 5.2  524.8 4.6 
            Convertible fixed maturity investments  490.6 4.2  436.2 3.8 
            Trust account investments  305.6 2.6  338.9 3.0 


             Total investments $11,649.0 100.0%$11,332.7 100.0%


                    The breakdown of White Mountains' fixed maturity investments, including trust account investments, at December 31, 2007 by credit class, based upon issue credit ratings provided by Standard & Poor's, or if unrated by Standard & Poor's, long term obligation ratings provided by Moody's, is as follows:

             
             As of December 31, 2007
             
            $ in millions

             Amortized cost
             % of total
             
            U.S. government and government-sponsored entities $3,419.6 45.6%
            AAA/Aaa  1,900.1 25.3 
            AA/Aa  133.2 1.8 
            A/A  845.0 11.3 
            BBB/Baa  986.5 13.2 
            Other/not rated  214.2 2.8 


             Total fixed maturity investments $7,498.6 100.0%


                    The weighted average duration of White Mountains' fixed maturity portfolio, excluding short-term investments, at December 31, 2007 was 3.0 years. The cost or amortized cost and carrying value of White Mountains' fixed maturity and convertible fixed maturity investments at December 31, 2007 is presented below by contractual maturity. Actual maturities could differ from contractual maturities because borrowers may have the right to call or prepay certain obligations with or without call or prepayment penalties.


             December 31, 2007
            Millions

             Cost or
            amortized cost

             Estimated
            fair value

            Due in one year or less $933.1 $972.3
            Due after one year through five years  2,951.2  3,056.5
            Due after five years through ten years  487.0  504.1
            Due after ten years  575.8  563.7
            Asset-backed securities  2,882.6  2,898.6
            Preferred stocks  159.5  173.8
              
             
            Total $7,989.2 $8,169.0


            Mortgage-backed, Asset-backed Securities

                    White Mountains purchases commercial and residential mortgage-backed securities to maximize its fixed income portfolio's risk adjusted returns and diversify the portfolio risk from primarily corporate credit risk to a mix of credit and cash flow risk. White Mountains is not an originator of residential mortgage loans and does not hold any residential mortgage-backed securities categorized as sub-prime as of December 31, 2007. In addition, White Mountains' investments in hedge funds, limited partnerships and private equities contain negligible amounts of sub-prime mortgage-backed securities at December 31, 2007. White Mountains is not directly exposed to potential losses on sub-prime mortgage-backed securities, other than approximately $11 million of sub-prime mortgage-backed securities that are in the first quarter.

            collateral account under its securities lending program at December 31, 2007. SeeNote 1—Summary of Significant Accounting Policies,ImpairmentSecurities Lending in the accompanying financial statements for a description of White Mountains' securities lending program. White Mountains considers sub-prime mortgage-backed securities to be those that are issued from dedicated sub-prime shelves, dedicated second-lien shelves (i.e., White Mountains considers investments backed primarily by second-liens to be a sub-prime risk regardless of credit score or other metrics) or otherwise have underlying loan pools that exhibit weak credit characteristics.

                    There are also mortgage-backed securities that White Mountains categorizes as "non-prime" (also called "Alt A" or "A-") that are backed by collateral that has overall credit quality between prime and sub-prime, based on a review of the characteristics of their underlying mortgage loan pools, such as credit scores and financial ratios. As of December 31, 2007, $149 million of White Mountains' mortgage-backed securities holdings were classified as non-prime. All of these non-prime securities continue to have the highest rating ascribed by Moody's ("Aaa") or Standard & Poors ("AAA"). White Mountains does not own any collateralized debt obligations, including residential mortgage-backed collateralized debt obligations.

                    The following table summarizes White Mountains' mortgage-backed and asset-backed securities holdings as of December 31, 2007 and 2006:

             
             December 31,
            Millions

             2007
             2006
            Mortgage-backed securities:      
             Agency(1) $1,019.2 $469.4
             Non-agency  1,438.9  1,819.9
              
             
            Total mortgage-backed securities  2,458.1  2,289.3
              
             
            Asset-backed securities:      
             Credit card  428.9  604.2
             Auto  8.4  59.0
             Other  3.2  9.1
              
             
            Total asset-backed securities  440.5  672.3
              
             
            Total mortgage-backed and asset-backed securities $2,898.6 $2,961.6


                (1)
                Represents publicly traded residential mortgage-backed securities which carry the full faith and credit guaranty of the U.S. government (i.e., GNMA) or are guaranteed by a government sponsored entity (e.g., FNMA, FHLMC).

              Impairment

                      SeeNote 5—Investments"Investments" of the accompanying consolidated financial statements for White Mountains' analysis of impairment losses on investment securities.


              NON-GAAP FINANCIAL MEASURES

                      This report includes twofive non-GAAP financial measures that have been reconciled to their most comparable GAAP financial measures. White Mountains believes these measures to be more relevant than comparable GAAP measures in evaluating White Mountains' results of operations and financial performance.condition.

                      Adjusted comprehensive net income is a non-GAAP financial measure that excludes the change in net unrealized gains and losses from Symetra's fixed maturity portfolio from comprehensive net income. In the calculation of comprehensive net income under GAAP, requires these assets to befixed maturity investments are marked-to-market which results in gains during periods when interest rates fall and losses in periods when interest rates rise. Becausewhile the liabilities related to which those assets are matched are not. Symetra attempts to earn a "spread" between what it earns on its investments and what it pays out on its products. In order to try to fix this spread, Symetra invests in a manner that tries to match the duration and cash flows of its investments with the required cash outflows associated with its life insurance and structured settlements products. As a result, Symetra typically earns the same spread on in-force business whether interest rates fall or rise. Further, at any given time, some of Symetra's structured settlement obligations may extend 40 or 50 years into the future, which is further out than the longest maturing fixed maturity investments regularly available for purchase in the market (typically 30 years). For these long-dated products, Symetra is unable to fully match the obligation with assets until the remaining expected payout schedule comes within the duration of securities available in the market. If at that time, these assets supportfixed maturity investments have yields that are not marked-to-market, it is likely thatlower than the economic impact onyields expected when the structured settlement product was originally priced, the spread for the product will shrink and Symetra will ultimately harvest lower returns for its shareholders. GAAP comprehensive net income increases when rates decline, which would be suggest an increase in the value of Symetra—the opposite of that shown under GAAP (i.e., in general, Symetra'swhat is happening to the intrinsic value increasesof the business. Therefore, White Mountains' management and Board of Directors use adjusted comprehensive net income when interest rates riseassessing Symetra's quarterly financial performance. In addition, this measure is typically the predominant component of growth in fully diluted tangible book value per share, which is used in calculation of White Mountains' performance for both short-term (annual bonus) and decreases when interest rates fall).long-term incentive plans. The reconciliation of adjusted comprehensive net income to comprehensive net income is included on page 43.48.

                      Book value per share is derived by dividing the Company's total GAAP shareholders' equity as of a given date by the number of Common Sharescommon shares outstanding as of that date, including the dilutive effects of outstanding Optionsoptions and warrants to acquire Common Shares,common shares, as well as the unamortized accretion of preferred stock. Fully converteddiluted tangible book value per share is a non-GAAP measure which is derived by expanding the GAAP book value per share calculation to include the effects of assumed conversion of all in-the-money convertible securities and to exclude any unamortized goodwill and net unrealized gains from Symetra's fixed maturity portfolio. In addition, for periods subsequent to December 31, 2006, the number of common shares outstanding used in the calculation of fully diluted tangible book value per share are adjusted to exclude unearned shares of restricted stock representative of the proportion of unamortized compensation cost at the date of the calculation to the value of the restricted stock on the date of issuance. This adjustment was not made to fully diluted tangible book value per share for periods prior to December 31, 2006 as the impact was not significant. The reconciliation of fully converteddiluted tangible book value per share to book value per share is included on page 42.47.

                      Total capital at White Mountains is comprised of common shareholders' equity, debt and minority interest in OneBeacon Ltd. Tangible capital excludes from total capital the unamortized goodwill of consolidated limited partnerships and the equity in net unrealized gains from Symetra's fixed maturity portfolio. The reconciliation of total capital to total tangible capital is included on page 68.

                      Adjusted book value per common share at OneBeacon is a non-GAAP financial measure which is derived by excluding the impact of economically defeasing OneBeacon's mandatorily redeemable preferred stock from book value per common share, the most closely comparable GAAP measure. Management believes that adjusted book value per common share is a useful supplement to understanding the OneBeacon's earnings and profitability. A reconciliation of OneBeacon's book value per common share to OneBeacon's adjusted book value per common share is included on page 50.


                      During 2005 and 2007, OneBeacon reallocated loss and LAE reserves from specialty, commercial and personal lines to run-off, which reduced specialty, commercial and personal lines' GAAP loss and LAE ratios and GAAP combined ratios, but had no impact on OneBeacon's total GAAP combined ratio. OneBeacon's specialty, commercial and personal lines' loss and LAE ratios and combined ratios prior to reserve reallocation are non-GAAP financial measures that are derived by excluding the impact of the reserve reallocation from specialty, commercial and personal lines' loss and LAE ratios and combined ratios. OneBeacon believes that a presentation excluding the effect of the reserve reallocation on specialty, commercial and personal lines' loss and LAE ratios and GAAP combined ratios is meaningful for investors to understand the performance of its underwriting units during 2005 and 2007. The reconciliation of these non-GAAP financial measures to the GAAP loss and LAE ratios and GAAP combined ratios is included on page 51.

              LIQUIDITY AND CAPITAL RESOURCES

              Operating cash and short-term investments

                      Holding company level.    The primary sources of cash for the Company and certain of its intermediate holding companies are dividends and tax sharing payments received from its insurance and reinsurance operating subsidiaries, financingcapital raising activities, and net investment income and proceeds from sales and maturities of holding company investments. The primary uses of cash are interestrepurchases of the Company's common shares, payments on the Senior Notes,its debt obligations, dividend payments on the Company's common shares, minority interest holders of OneBeacon Ltd.'s common shares, the Berkshire and Zenith Preferred Stock as well as on Commonand to holders of the WMRe Preference Shares, purchases of investments, payments made to tax authorities and holding company operating expenses.

                      Operating subsidiary level.    The primary sources of cash for White Mountains' insurance and reinsurance operating subsidiaries are premium collections, net investment income, capital raising activities and proceeds from sales and maturities of investments. The primary uses of cash are claim payments, policy acquisition costs, operating expenses, the purchasepurchases of investments, payments on its debt obligations and dividend and tax sharing payments made to parent holding companies.

                      Both internal and external forces influence White Mountains' financial condition, results of operations and cash flows. Claim settlements, premium levels and investment returns may be impacted by changing rates of inflation and other economic conditions. In many cases, significant periods of time, ranging up to several years or more, may lapse between the occurrence of an insured loss, the reporting of the loss to White Mountains and the settlement of the liability for that loss. The exact timing of the payment of claims and benefits cannot be predicted with certainty. White Mountains' insurance and reinsurance operating subsidiaries maintain portfolios of invested assets with varying maturities and a substantial amount of short-term investments to provide adequate cashliquidity for the payment of claims.

                      Management believes that White Mountains' cash balances, cash flows from operations, routine sales of investments and the liquidity provided by itsthe WTM Bank Facility and the Fund American Bank Facility are adequate to meet expected cash requirements for the foreseeable future on both a holding company and insurance and reinsurance operating subsidiary level.


              Dividend Capacity

                      Under the insurance laws of the states and jurisdictions under which White Mountains' insurance and reinsurance operating subsidiaries are domiciled, an insurer is restricted with respect to the timing or the amount of dividends it may pay without prior approval by regulatory authorities. Accordingly, there can be no assurance regarding the amount of such dividends that may be paid by such subsidiaries in the future. Following is a description of the abilitydividend activities of White Mountains' insurance and reinsurance operating subsidiaries to pay dividends to the Company and certain of its intermediate holding companies:

                OneBeacon:

                      Generally, OneBeacon's regulated insurance operating subsidiaries have the ability to pay dividends during any 12 month12-month period without the prior approval of regulatory authorities in an amount equal to the greater of prior year statutory net income or 10% of prior year end statutory surplus, subject to the availability of unassigned funds. As a result, based on 20042007 statutory net income, OneBeacon's top tier regulated insurance operating subsidiaries have the ability to pay $325approximately $346 million of dividends during 20052008 without prior approval of regulatory authorities, subject to the availability of unassigned funds. As of December 31, 2004,2007, OneBeacon's top tier regulated insurance operating subsidiaries had $1.3$1.5 billion of unassigned funds available for dividend distribution.funds.


                      In addition, as of December 31, 2004,2007, OneBeacon had $195approximately $380 million of net unrestricted cash, fixed maturity and equity investments outside of its regulated insurance operating subsidiaries available for distribution during 2005.subsidiaries. During 2004,2007, OneBeacon paid $305$394 million of cash dividends to Fund American.American and OneBeacon Ltd. paid $84 million of dividends to its common shareholders, $60 million of which was paid to an intermediate holding company of White Mountains.

                      Fund American's ability to declare or pay dividends is limited by the terms of the Berkshire Preferred Stock. Fund American may not, under certain circumstances, declare or pay any dividend or distribution without the consent of the holders of the Berkshire Preferred Stock. In addition, White Mountains and Fund American entered into or amended certain agreements with respect to the Berkshire Preferred Stock to effect a corporate reorganization in 2004 (seeKeep-Well below).

                      On January 31, 2008, OneBeacon Ltd. declared a $200 million special dividend, of which White Mountains will receive a portion based on its ownership percentage on March 17, 2008 (the dividend record date). As of December 31, 2007, White Mountains owned 72.9% of OneBeacon Ltd.'s outstanding shares.

                White Mountains Re:

                      Folksamerica's principal regulated reinsurance operating subsidiaryFolksamerica has the ability to pay dividends during any 12 month12-month period without the prior approval of regulatory authorities in an amount equal to the lesser of net investment income, as defined by statute, or 10% of statutory surplus, in both cases as most recently reported to regulatory authorities, subject to the availability of earned surplus. As a result, basedBased upon December 31, 20042007 statutory surplus of $917$927 million, Folksamerica's principal regulated reinsurance operating subsidiaryFolksamerica would have the ability to pay approximately $92$93 million of dividends during 20052008 without prior approval of regulatory authorities, subject to the availability of earned surplus. As of December 31, 2004, Folksamerica's principal regulated reinsurance operating subsidiary2007, Folksamerica had $17$69 million of earned surplus, therefore it cansurplus.

                      Sirius International has the ability to pay dividends of $17 million plus additional earned surplus reported during 2005, subject to the $92 million limitation discussed above.

              availability of unrestricted statutory surplus. Historically, Sirius International has allocated the majority of its earnings to the Safety Reserve (see "Safety Reserve" below). As of December 31, 2004, WMU2007, Sirius International had $3$52 million of cash and investmentsunrestricted statutory surplus, which is available for distribution in 2008. Based on its 2007 results, Sirius International would have the ability to declare and pay additional dividends (on top of the $52 million noted above) of up to $60 million in 2008 without regulatory approval, if it elects not to allocate its related pre-tax earnings to the Safety Reserve.

                      In accordance with the provisions of Swedish law, Sirius International can voluntarily transfer its pre-tax income, or a portion thereof, subject to certain limitations, to its parent company to minimize taxes. In early 2008, Sirius International intends to transfer aproximately $33 million of its 2007 pre-tax income to its Swedish parent company as a group contribution.

                      During 2007, White Mountains Re increased the capital of WMRe (Bermuda), as Sirius International first contributed $136 million to WMRe (Bermuda), and then White Mountains Re extracted WMRe (Bermuda) from Sirius International and contributed the net proceeds of its May 2007 Preference Share issuance, or approximately $246 million, to WMRe (Bermuda). Additionally, during 2005. In addition, WMUthe fourth quarter of 2007, Folksamerica redeemed $285 million of its common shares, after receiving approval from the Insurance Department of the State of New York. $250 million of these proceeds were used to further capitalize WMRe (Bermuda). As of December 31, 2007 WMRe (Bermuda)'s capital was $776 million.

                      WMRe (Bermuda) has the ability to declare and pay dividends of up to $103 million in 2008 without regulatory approval, subject to meeting all appropriate liquidity and solvency requirements.

                      WMRUS has the ability to distribute its 20052008 earnings without restriction. During 2004, WMU paid $60At December 31, 2007, WMRUS had $2 million of unrestricted cash. During 2007, WMRUS paid $8 million of dividends to its immediate parent.

                      White Mountains Re paid $392 million of cash dividends from the net proceeds of the WMRe Senior Notes and distributed its $54 million investment in Symetra warrants to its immediate parent during the first quarter 2007. During the remainder of 2007, White Mountains Re paid an additional $20 million of dividends to its immediate parent.

                      In addition, as of December 31, 2004,2007, White Mountains Re and its intermediate holding companies had approximately $97an additional $58 million of net unrestricted cash and fixed maturity investments outside of Folksamerica, Sirius International, WMRe (Bermuda) and WMRUS.


                Esurance:

                      Generally, Esurance's regulated insurance operating subsidiaries have the ability to pay dividends during any 12-month period without the prior approval of regulatory authorities in an amount equal to the lesser of prior year statutory net income or 10% of prior year end statutory surplus, subject to the availability of unassigned funds. As a result, based on December 31, 2007 statutory net income, Esurance's top tier regulated insurance operating subsidiary has the ability to pay $3 million of dividends during 2008 without prior approval of regulatory authorities, subject to the availability of unassigned funds. As of December 31, 2007, Esurance's top tier regulated insurance operating subsidiary had $30 million of unassigned funds.

                      In addition, as of December 31, 2007, Esurance had $.4 million of net unrestricted cash and fixed maturity investments outside of its regulated insurance operating subsidiaries. During 2007, Esurance did not pay any cash dividends to its immediate parent.

                Other operations:

                      As of December 31, 2007, White Mountains had $462 million of net unrestricted cash, fixed maturity and reinsurance operating subsidiaries available for distribution during 2005.equity investments at the Company and its intermediate holding companies included in its other operations segment.


              Safety Reserve

                      In accordance with provisions of Swedish law, Sirius International can voluntarilyis permitted to transfer up to the full amount of its pretax earnings, or a portion thereof,pre-tax income, subject to certain limitations, into an untaxed reserve referred to as a safety reserve. The safety reserve, is a Swedish regulatory concept that has no equivalent under GAAP. Accordingly, underwhich amounted to $1.4 billion at December 31, 2007. Under GAAP, an amount equal to Sirius International'sthe safety reserve, of $1.1 billion at December 31, 2004, net of the related deferred tax liability established at the statutory Swedish tax rate of 28%, is classified as shareholders' equity. Generally, this deferred tax liability is only required to be paid by Sirius


              International if it fails to maintain predetermined levels of premium writings and loss reserves in future years. As a result of the indefinite deferral of these taxes, Swedish regulatory authorities do not apply any taxes to the safety reserve when calculating solvency capital under Swedish insurance regulations. Accordingly, under local statutory requirements, an amount equal to the deferred tax liability on Sirius International's safety reserve ($398 million at December 31, 2007) is included in solvency capital. Access to the safety reserve is restricted to coverage of aggregate losses and requires the approval of Swedish regulatory authorities.


              Keep-Well

                      On November 30, 2004, White Mountains completed a significant corporate reorganization, through which ownership of Folksamerica was transferred to White Mountains Re from Fund American. In order to effect the reorganization, White Mountains and Fund American entered into or amended certain agreements with respect to the Berkshire Preferred Stock. Under the terms of a Keep-Well Agreement dated November 30, 2004 between White Mountains and Fund American (the "Keep-Well"), White Mountains has agreed to return to Fund American up to approximately $1.1 billion, which equals the amount of net assets transferred out of Fund American as a result of the reorganization, if some or all of that amount is required by Fund American to meet its obligations to Berkshire under the Berkshire Preferred Stock. Additionally, the Keep-Well limits the aggregate amount of distributions that White Mountains may make to its shareholdersshareholders. This distribution limit, which as of December 31, 2007 was $2.4 billion, will increase or decrease by an amount equal to approximately $1.3 billion plus White Mountains' aggregate consolidated net income after September 30, 2004.or loss over the remaining life of the agreement. The Keep-Well will expire upon the earlier of when all obligations of the Berkshire Preferred Stock, which is redeemable in May 2008, have been satisfied or when approximately $1.1 billion has been returned to Fund American.


              Insurance Float

                      Insurance float is an important dynamicaspect of White Mountains' operations that must be managed effectively. Floatinsurance operations. Insurance float is money that an insurance company holds for a limited time. In an insurance operation, float arises because premiums are collected before losses are paid. This interval can extend over many years. During that time, the insurer invests the money.funds. When the premiums that an insurer collects do not cover the losses and expenses it eventually must pay, the result is an underwriting loss, which is considered to be the cost of insurance float. The amount and cost of insurance float for White Mountains is affected by underlying market conditions, as well as acquisitions or dispositions of insurance and reinsurance businesses.


                      Although insurance float can be calculated using numbers determined under GAAP, insurance float is not a GAAP concept and, therefore, there is no comparable GAAP measure.


                      One of the means by which White Mountains calculates its insurance float is by taking its net investment assets and subtracting its total tangible capital. The following table illustrates White Mountains' consolidated insurance float position as of the past five year-ends:


               December 31,
               
               December 31,
               
              ($ in millions)

              ($ in millions)

               ($ in millions)

               
              2004
               2003
               2002
               2001
               2000
                2007
               2006
               2005
               2004
               2003
               
              Total investmentsTotal investments $10,529.5 $8,547.5 $8,899.4 $9,005.7 $2,102.2 Total investments $11,649.0 $11,332.7 $9,866.4 $10,529.5 $8,547.5 
              Consolidated limited partnership investments(1)Consolidated limited partnership investments(1)  (123.0) (123.4) (90.7) (64.3)  
              Trust account assetsTrust account assets  (305.6) (338.9)      
              CashCash 243.1 89.9 121.5 67.4 4.4 Cash  171.3  159.0  187.7  243.1  89.9 
              Investment in unconsolidated insurance affiliate(s) 466.6 515.9 399.9 311.1 130.6 
              Equity in net unrealized gains from Symetra's fixed maturity portfolio (56.6)     
              Investments in unconsolidated affiliatesInvestments in unconsolidated affiliates  406.3  335.5  479.7  466.6  515.9 
              Equity in net unrealized (gains) losses from Symetra's fixed maturity portfolioEquity in net unrealized (gains) losses from Symetra's fixed maturity portfolio  5.6  4.1  (24.2) (56.6)  
              Accounts receivable on unsettled investment salesAccounts receivable on unsettled investment sales 19.9 9.1 160.8 75.2  Accounts receivable on unsettled investment sales  201.1  8.5  21.7  19.9  9.1 
              Accounts payable on unsettled investment purchasesAccounts payable on unsettled investment purchases (30.9) (371.6) (495.2) (311.2) (.2)Accounts payable on unsettled investment purchases  (46.4) (66.8) (43.4) (30.9) (371.6)
              Interest-bearing funds held by ceding companies(1) 516.9 70.4 50.1 42.9 23.4 
              Interest-bearing funds held under reinsurance treaties(1) (105.1) (152.5) (236.2) (311.0) (400.6)
              Interest-bearing funds held by ceding companies(2)Interest-bearing funds held by ceding companies(2)  192.8  226.7  293.9  516.9  70.4 
              Interest-bearing funds held under reinsurance treaties(3)Interest-bearing funds held under reinsurance treaties(3)  (73.4) (94.5) (100.6) (105.1) (152.5)


              Net investment assets $11,583.4 $8,708.7 $8,900.3 $8,880.1 $1,859.8 Net investment assets $12,077.7 $11,442.9 $10,590.5 $11,519.1 $8,708.7 


              Total common shareholders' equityTotal common shareholders' equity $3,883.9 $2,979.2 $2,407.9 $1,444.6 $1,046.5 Total common shareholders' equity $4,713.4 $4,455.3 $3,833.2 $3,883.9 $2,979.2 
              Minority interest—OneBeacon Ltd. Minority interest—OneBeacon Ltd.   517.2  490.7       
              Minority interest—WMRe Preference SharesMinority interest—WMRe Preference Shares  250.0         
              DebtDebt 783.3 743.0 793.2 1,125.4 96.0 Debt  1,192.9  1,106.7  779.1  783.3  743.0 
              Preferred stock subject to mandatory redemption 211.9 194.5 180.9 170.3  
              Convertible preference shares   219.0   
              Less:           
              Preferred stock subject to mandatory redemption(4)Preferred stock subject to mandatory redemption(4)      234.0  211.9  194.5 


              Total capital $6,673.5 $6,052.7 $4,846.3 $4,879.1 $3,916.7 
               Unamortized deferred credits and goodwill (20.0) (20.3)  660.2 66.8  Unamortized goodwill  (30.4) (32.5) (24.4) (20.0) (20.3)
               Equity in net unrealized gains from Symetra's fixed maturity portfolio (56.6)      Equity in net unrealized (gains) losses from Symetra's fixed maturity portfolio  5.6  4.1  (24.2) (56.6)  


              Total tangible capital $4,802.5 $3,896.4 $3,601.0 $3,400.5 $1,209.3 Total tangible capital $6,648.7 $6,024.3 $4,797.7 $4,802.5 $3,896.4 


              Insurance float $6,780.9 $4,812.3 $5,299.3 $5,479.6 $650.5 Insurance float $5,429.0 $5,418.6 $5,792.8 $6,716.6 $4,812.3 


              Insurance float as a multiple of total tangible capitalInsurance float as a multiple of total tangible capital 1.4x 1.2x 1.5x 1.6x 0.5xInsurance float as a multiple of total tangible capital  0.8x  0.9x  1.2x  1.4x  1.2x 
              Net investment assets as a multiple of total tangible capitalNet investment assets as a multiple of total tangible capital 2.4x 2.2x 2.5x 2.6x 1.5xNet investment assets as a multiple of total tangible capital  1.8x  1.9x  2.2x  2.4x  2.2x 
              Insurance float as a multiple of common shareholders' equityInsurance float as a multiple of common shareholders' equity 1.7x 1.6x 2.2x 3.8x 0.6xInsurance float as a multiple of common shareholders' equity  1.2x  1.2x  1.5x  1.7x  1.6x 
              Net investment assets as a multiple of common shareholders' equityNet investment assets as a multiple of common shareholders' equity 3.0x 2.9x 3.7x 6.1x 1.8xNet investment assets as a multiple of common shareholders' equity  2.6x  2.6x  2.8x  3.0x  2.9x 


              (1)
              The minority interest portion of investments of consolidated limited partnerships have not been included in insurance float because White Mountains does not have the ability to utilize these assets.

              (2)
              Excludes funds held by ceding companies from which White Mountains does not receive interest credits and excludescredits.

              (3)
              Excludes funds held by White Mountains under reinsurance treaties for which White Mountains does not provide interest credits.

              (4)
              Excludes preferred stock subject to mandatory redemption, having an aggregate accreted liquidation preference at December 31, 2007 and 2006 of $278 million and $269 million, respectively (and $306 million and $339 million of investments held in irrevocable grantor trusts for the purpose of economically defeasing the preferred stock subject to mandatory redemption). The creation and funding of these trusts did not legally defease the preferred stock and therefore the preferred stock will continue to appear on White Mountains' balance sheet until it is redeemed.

                      White Mountains has historically obtained its insurance float primarily through acquisitions, as opposed to organic growth. For each of the years in the three-year period ending December 31, 2004, White Mountains has had negative cash flows from operations but has generated significant float from its insurance and reinsurance operations. This is due to the fact that White Mountains' cash flow from operations does not reflect cash and investments generated by the acquisition of insurance and


              reinsurance businesses in recent years. Post-acquisition, such companies are often placed into partial or complete run-off, thereby resulting in negative cash flows from operations as the investments acquired are liquidated over time to pay claims.

                      In the case of OneBeacon, the substantial amount of float initially acquired with the OneBeacon Acquisition has shrunk as a result of OneBeacon's re-underwriting efforts and the effects of the Liberty Agreement. OneBeacon's float is expected to continue to shrink during 2005 as older, long-tailed loss reserves are paid and are not replaced with the same level of current writings as those written in the past. In the case of White Mountains Re, its float increased substantially in 2004 as a result of the Sirius and Sierra acquisitions. White Mountains Re's float is expected to increase during 2005 as a result of higher premium writings from its increased capital base and acquisitions over the past few years.

              It is White Mountains' intention to generate low-cost float over time through a combination of acquisitions and/or by organic growth in its existing insurance and reinsurance operations. However, White Mountains will seek to increase its insurance float organically only when market conditions allow for an expectation of generating underwriting profits.


              Financing

                      The following table summarizes White Mountains' capital structure as of December 31, 20042007 and 2003:2006:

               
               December 31,
               
              $ in millions

               
               2004
               2003
               
              Senior Notes, carrying value $698.3 $698.1 
              Bank Facility     
              Other debt of operating subsidiaries(1)  85.0  44.9 


               Total debt  783.3  743.0 
              Preferred stock subject to mandatory redemption  211.9  194.5 
              Total common shareholders' equity  3,883.9  2,979.2 
              Unamortized goodwill of consolidated limited partnerships  (20.0) (20.3)
              Equity in net unrealized gains from Symetra's fixed maturity portfolio  (56.6)  


               Total tangible capital $4,802.5 $3,896.4 


              Senior Notes to total tangible capital  15% 18%
              Total debt to total tangible capital  16% 19%
              Total debt and preferred stock to total tangible capital  21% 24%
               
               December 31,
               
              ($ in millions)

               
               2007
               2006
               
              Fund American Senior Notes, carrying value $698.9 $698.7 
              WMRe Senior Notes, carrying value  398.9   
              WTM Bank Facility(1)    320.0 
              Fund American Bank Facility     
              Other debt of operating subsidiaries(2)  95.1  88.0 


               Total debt  1,192.9  1,106.7 

              Minority interest—OneBeacon Ltd. 


              517.2


              490.7

               
              Minority interest—WMRe Preference Shares  250.0   
              Total common shareholders' equity  4,713.4  4,455.3 


               Total capital(3)(4) $6,673.5 $6,052.7 
              Unamortized goodwill  (30.4) (32.5)
              Equity in net unrealized losses from Symetra's fixed maturity portfolio  5.6  4.1 


               Total tangible capital $6,648.7 $6,024.3 


              Total debt to total tangible capital  18% 18%
              Total debt and Preference Shares to total tangible capital  22% 18%


                  (1)
                  The $320.0 million outstanding on December 31, 2006 was under White Mountains' previous credit facility, which was refinanced in June 2007 (See below).

                  (2)
                  SeeNote 6—Debt"Debt" of the accompanying Consolidated Financial Statements for a discussion of operating subsidiary debt.

                  (2)
                  The minority interest arising from White Mountains' investments in consolidated limited partnerships has not been included in total capital because White Mountains does not have the ability to utilize the assets supporting this minority interest.

                  (4)
                  The preferred stock subject to mandatory redemption, having an aggregate accreted liquidation preference of $278 million and $262 million at December 31, 2007 and 2006, was not included in total capital because it was economically defeased in connection with the OneBeacon Offering.

                      Management believes that White Mountains' strong financial position provides it with the flexibility and capacity to obtain funds externally as needed through debt or equity financing on both a short-term and long-term basis.

                      In May 2003,2007, WMRe Group issued $250 million non-cumulative perpetual preference shares and received $246 million of proceeds, net of $4 million of issuance costs and commissions. Holders of the WMRe Preference Shares receive dividends on a non-cumulative basis only when, and if declared by WMRe Group at a fixed dividend rate of 7.506% for the period from issuance until June 30, 2017 and a variable dividend rate thereafter. The WMRe Preference Shares are redeemable only at the option of WMRe Group.

                      In March 2007, WMRe Group issued $400 million face value of senior unsecured debt at an issue price of 99.715%, wihich resulted in net proceeds of $392 million. The WMRe Senior Notes bear an annual interest rate of 6.375%, payable semi-annually in arrears on March 20 and September 20, until maturity in March 2017. Taking into effect the amortization of the orginal issue discount and all underwriting and issuance expenses, including an interest rate lock agreement, the WMRe Senior Notes yield an effective rate of 6.49% per annum.

                      During the first quarter of 2007, White Mountains reducedrepaid the $320 million outstanding under its costrevolving credit facility using a portion of capital and significantly reduced its near-term obligations by fully prepaying its previous $740 million amortizing bank facility, principally through the net proceeds from the issuance of the WMRe Senior Notes, which were issued by Fund American through a public offering. The Senior Notes bear a fixed annual interest rateNotes. During the second quarter of 5.9% and mature in May 2013. In July 2003,2007, White Mountains enhanced its access to the capital markets by having a shelf registration declared effective by the SEC for offerings of up to $2.0 billion in debt and/or equity securities.


                      In August 2004, Fund American restructured and re-syndicatedreplaced its existing $300credit facility with a new $475 million Bank Facility to increase the availability under the revolving credit facility to $400 millionthat matures in June 2012. This new facility removed WMRe Group as co-borrower and to extend the maturity from September 2006 to August 2009. Under the Bank Facility, for which both Fund Americanco-guarantor, added certain intermediate holding companies of White Mountains as co-guarantors and the Company are permitted borrowers, the Company guarantees all obligations of Fund American,amended and/or removed certain financial and Fund American guarantees all borrowings of the Company, subject to certain limitations imposed by the terms of the Berkshire Preferred Stock.other covenants. As of December 31, 2004,2007, the WTM Bank Facility was undrawn.

                      In connection with its acquisitionNovember 2006, Fund American, a subsidiary of OneBeacon Ltd., established a $75 million revolving credit facility that matures in November 2011. All borrowings under this facility are guaranteed by OneBeacon Ltd. As of December 31, 2007, this facility was undrawn.

                      SeeRATINGS in Item 1—Business for the current financial ratings of the Sierra Group on March 31, 2004, Folksamerica entered into a $62 million purchase note (the "Sierra Note"), $58 million of which will be adjusted over its approximate six-year term to reflect favorable or adverse loss reserve development on the acquired reserve portfolio and run-off of remaining policies in force (mainly workers compensation business) as well as certain other balance sheet protections. During 2004, the Sierra Note was reduced by $12 million as a result of adverse development on the acquired reserves and run-off of unearned premiums.

                      In connection with its acquisition of Atlantic Specialty on March 31, 2004, OneBeacon issued a $20 million ten-year note to the seller (the "Atlantic Specialty Note"). OneBeacon is required to repay $2 million of principal on the notes per year, commencing with the first payment due on January 1, 2007.

              Fund American'sAmerican Senior Notes, are currently rated "Baa2" (Adequate, the 9th highest of 21 ratings) with a stable outlook by Moody'sWMRe Senior Notes and "BBB-" (Adequate, the 10th highest of 24 ratings) with a positive outlook by S&P and "BBB" (Good, the 9th highest of 24 ratings) with a stable outlook by Fitch Ratings.WMRe Preference Shares. It is possible that, in the future, one or more of the rating agencies may lower White Mountains' existing ratings. If one or more of its ratings were downgraded, White Mountains could incur higher borrowing costs and its ability to access the capital markets could be impacted. In addition, White Mountains' insurance and reinsurance operating subsidiaries could be adversely impacted by a


              downgrade in their financial strength ratings, including a possible reduction in demand for their products in certain markets.

                      The Fund American Senior Notes and the WMRe Senior Notes were issued under an indentureindentures which containscontain restrictive covenants that, among other things, limit the ability of the Company, Fund American, WMRe Group and their respective subsidiaries to create liens and enter into sale and leaseback transactions and substantially limits the ability of Fund American, WMRe Group and itstheir respective subsidiaries to consolidate, merge or transfer their properties and assets. The indenture doesindentures do not contain any financial ratios or specified levels of net worth or liquidity to which the Company, or Fund American or WMRe Group must adhere. At December 31, 2004,2007, White Mountains was in compliance with all of the covenants under the Fund American Senior Notes and the WMRe Senior Notes, and anticipates it will continue to remain in compliance with these covenants for the foreseeable future.

                      The WTM Bank Facility containsand the Fund American Bank Facility contain various affirmative, negative and financial covenants which White Mountains considers to be customary for such borrowings and include maintaining certain minimum net worth and maximum debt to capitalization standards for White Mountains.standards. Failure to meet one or more of these covenants could result in an event of default, which ultimately could eliminate availability under the facilitythese facilities and result in acceleration of principal repayment on any amounts outstanding. At December 31, 2004,2007, White Mountains was in compliance with all of the covenants under the WTM Bank Facility and the Fund American Bank Facility, and anticipates it will continue to remain in compliance with these covenants for the foreseeable future.


              Contractual Obligations and Commitments

                      Below is a schedule of White Mountains' material contractual obligations and commitments as of December 31, 2004:2007:

              Millions

              Millions

               Due in
              One Year
              or Less

               Due in
              Two to Three
              Years

               Due in
              Four to Five
              Years

               Due After
              Five
              Years

               Total
              DebtDebt $ $17.0 $4.0 $764.0 $785.0Debt $2.1 $41.8 $5.7 $1,145.5 $1,195.1
              Mandatorily redeemable preferred stock(1)Mandatorily redeemable preferred stock(1)   300.0 20.0 320.0Mandatorily redeemable preferred stock(1) 300.0    300.0
              Loss and LAE reserves(1)(2)Loss and LAE reserves(1)(2) 2,967.9 3,026.4 1,485.0 2,588.2 10,067.5Loss and LAE reserves(1)(2) 2,446.4 2,198.2 1,135.1 2,521.0 8,300.7
              Reserves for structured contracts 69.5 102.9 68.5 135.0 375.9
              Interest on debt and dividends and accretion on preferred stock subject to mandatory redemption 98.0 216.0 119.6 149.5 583.1
              Interest on debt and dividends on preferred stock subject to mandatory redemptionInterest on debt and dividends on preferred stock subject to mandatory redemption 93.5 181.5 176.3 248.8 700.1
              Long-term incentive compensationLong-term incentive compensation 248.1 250.3 6.2 61.3 565.9Long-term incentive compensation 104.6 173.2 36.3 21.8 335.9
              Pension and other benefit plan obligationsPension and other benefit plan obligations 26.4 9.1 9.3 22.0 66.8
              Operating leasesOperating leases 41.8 71.8 26.3 28.6 168.5Operating leases 31.8 45.1 30.9 18.5 126.3


              Total contractual obligations $3,425.3 $3,684.4 $2,009.6 $3,746.6 $12,865.9Total contractual obligations $3,004.8 $2,648.9 $1,393.6 $3,977.6 $11,024.9


              (1)
              Economically defeased in connection with the OneBeacon Offering.

              (2)
              Represents expected future cash outflows resulting from loss and LAE payments. Accordingly, these balances excludeThe amounts presented are gross of reinsurance recoverables on unpaid losses of $3,468 million and include the discount on OneBeacon's workers compensation loss and LAE reserves of $259.4$157 million andas of December 31, 2007. These balances add back the remaining purchase accounting fair value adjustment of $409.6$239 million related to the OneBeacon and Sirius acquisitionsAcquisition as they areit is a non-cash items. Further, the amounts presented include reinsurance recoverables recorded of $3,797.4 million.item.

                      White Mountains' loss reserves do not have contractual maturity dates. However, based on historical payment patterns, the preceding table includes an estimate of when management expects White Mountains' loss reserves to be paid. The timing of claim payments is subject to significant uncertainty. White Mountains maintains a portfolio of marketable investments with varying maturities and a substantial amount of short-term investments to provide adequate cash flows for the payment of claims.

                      The WMRe Preference Shares are not included in the table above as these perpetual preferred shares have no stated maturity date and are redeemable only at the option of WMRe Group. SeeItem 1.—Business—WHITE MOUNTAINS RE—Recent Financing Activities for more details.

                      The balances included in the table above regarding White Mountains' long-term incentive compensation plans include amounts payable for performance shares and units, as well as deferred compensation balances. Exact amounts to be paid for performance shares cannot be predicted for performance shares, with certainty, as the ultimate amounts of these liabilities are based on the future performance of the Company and the market price of Common Sharesthe Company's common shares at the time the payments are made. The estimated payments reflected in the table are based on current accrual factors (Common Share(common share price and pay-out percentage) and assume that all outstanding balances were 100% vested as of December 31, 2004.2007.


                      There are no provisions within White Mountains' leasing agreements that would trigger acceleration of future lease payments. White Mountains does not finance its operations through the securitization of its trade receivables, through special purpose entities or through synthetic leases. Further, except as noted in the following paragraph, White Mountains has not entered into any material arrangement requiring it to guarantee payment of third party debt, lease payments or to fund losses of an unconsolidated special purpose entity, except as noted in the following paragraph.entity.

                      Through Sirius International, White Mountains has a long termlong-term investment as a stockholder in LUC Holdings, an entity that has entered into a head lease to rent the London Underwriting Center ("LUC") through 2016. LUC Holdings in turn subleases space in the LUC. In the LUC Holdings stockholders agreement, the stockholders have guaranteed any shortfall between the head lease and the sub-leases on a joint and several basis. As a consequence, in recent years the stockholders have funded an operating shortfall of LUC. At December 31, 2004,2007, White Mountains has recorded a liability of $10$8 million for its share of the expected future shortfall between LUC Holdings' head lease payments


              and sub-lease receipts. White Mountains does not believe that future shortfalls, if any, will have a material impact on its results of operations.

                      White Mountains also has future binding commitments to fund certain limited partnership investments. These commitments, which total approximately $25.9$144 million, do not have fixed funding dates and are therefore excluded from the table above.

              Share Repurchase Programs

                White Mountains:

                      On November 17, 2006, White Mountains' board of directors authorized the Company to repurchase up to 1 million of its common shares, from time to time, subject to market conditions. Shares may be repurchased on the open market or through privately negotiated transactions.The repurchase authorization does not obligate White Mountains to acquire any specific number of shares. As of December 31, 2007, 290,841 common shares had been repurchased for $145 million and retired.

                OneBeacon Ltd.:

                      On August 22, 2007, OneBeacon Ltd.'s board of directors authorized OneBeacon Ltd. to repurchase up to $200.0 million of its Class A common shares from time to time, subject to market conditions. Shares may be repurchased on the open market or through privately negotiated transactions. This program does not have a stated expiration date. As of December 31, 2007, 1.6 million Class A common shares had been repurchased for $33.0 million and retired.

              Cash Flows

                      Detailed information concerning White Mountains' liquiditycash flows during 2007, 2006 and capital resource activities during 2004, 2003 and 20022005 follows:

              For the year ended December 31, 20042007

                Financing and Other Capital Activities

                      In May 2007, White Mountains Re received net proceeds of $246 million through the issuance of the WMRe Preference Shares. White Mountains Re declared and paid $11 million in cash dividends on these shares in 2007.

                      In March 2007, White Mountains Re received net proceeds of $392 million through the issuance of the WMRe Senior Notes and subsequently paid a cash dividend of $392 million to its immediate parent. White Mountains used a portion of these proceeds to repay its $320 million outstanding balance on its existing bank facility.

                      During 2007, the Company declared and paid cash dividends of $86 million to its common shareholders.

                      During 2007, the Company repurchased and retired 290,841 of its common shares for $145 million as part of its previously announced share repurchase plan.

                      During 2007, OneBeacon Ltd. declared and paid cash dividends of $84 million to its common shareholders, $60 million of which was received by an intermediate holding company of White Mountains. On June 29, 2004, Berkshire exercised of all30, 2007, OneBeacon repaid $20 million of its warrants to purchase 1,724,200 Common Shares of White Mountains for $294 million. Berkshire acquired the warrantsmandatorily redeemable preferred stock using funds that were held in connection with the financing of White Mountains' acquisition of OneBeacon in 2001. The warrants were exercisable at any time until May 2008 and callable by the Company on or after May 31, 2005. In considerationtrust for the early exercisepurpose of economically defeasing the warrants, Berkshirepreferred stock. OneBeacon also paid $29 million in dividends on its mandatorily redeemable preferred stock during 2007, also using funds that were held in trust.


                      During 2007, OneBeacon Ltd. repurchased and the Company agreed to reduce the exercise price by approximately 2%.retired 1.6 million of its common shares for $33 million as part of its previously announced share repurchase plan.

                      During 2004, White Mountains2007, OneBeacon declared and paid dividends of $9 million, $28 million and $2$394 million to holdersFund American. Also during 2007, White Mountains Re paid $20 million of Common Shares,dividends to its immediate parent in addition to the Berkshire Preferred Stock and$392 million from the Zenith Preferred Stock, respectively.WMRe Senior Notes proceeds.

                      During 2004, Fund American restructured and re-syndicated the Bank Facility to extend its maturity and to increase the availability of the revolving credit facility to $400 million.

                      During 2004,2007, White Mountains paid a total of $41 million in interest under the Fund American Senior Notes and $20 million under the WMRe Senior Notes.

                      During 2004, OneBeacon declared2007, White Mountains received cash dividends from Symetra of $31 million on its common share investment and paid a total$17 million on its warrant investment.

                      During 2007, Sirius International contributed $136 million to WMRe (Bermuda). In addition, White Mountains Re contributed the $246 million net proceeds from the WMRe Preference Share issuance and $250 million of $305the $285 million redemption of Folksamerica common shares to further capitalize WMRe (Bermuda).

                      During 2007, White Mountains contributed $125 million in cash dividends to Fund American. Also during 2004, WMU paidEsurance and contributed $18 million and $15 million in cash and investments to Galileo and WM Life Re, respectively.

                      In April 2007, White Mountains invested $50 million in Pentelia, a totalfund that invests in insurance-related investment assets.

                Acquisitions and Dispositions

                      During 2007, OneBeacon sold one of $60its inactive licensed subsidiaries, American Employers' Insurance Company, to a third party for $48 million of cash dividends to its immediate parent. On March 31, 2004, OneBeacon distributed Folksamerica to Fund American.in cash.

                      During 2004,2007, White Mountains Re sold its' wholly-owned subsidiary Stockbridge Insurance Company for $26 million in cash to an external party.

                      During 2007, White Mountains sold 645,262 shares of OneBeacon Ltd. to OneBeacon's employee stock ownership plan for proceeds of $17 million.

                      On May 1, 2007, White Mountains sold all of its remaining interest in Montpelier Re, which consisted of 939,039 common shares and warrants to purchase 7,172,376 common shares, for total proceeds of $65 million.

                Other Liquidity and Capital Resource Activities

                      During 2007, the Company issued a net total of 3,938 Common Shares11,550 common shares to its employees through the exercise of Options during the yearperiod and the Company received cash proceeds of $.5$2 million in connection with these Option exercises. In addition, duringThe Company also accepted 4,465 common shares from an employee in satisfaction of a $3 million employee withholding tax liability associated with the first quartervesting of 2004, White Mountains issued 27,772 Common Shares to employees of OneBeacon in connection with OneBeacon's employee stock ownership plan. OneBeacon paid $13 million to the Company in consideration for these CommonRestricted Shares.

                      On August 27, 2004, White Mountains repaid the $25 million note that was issued as part of the financing of its 2001 acquisition of C-F Insurance Company.

              Acquisitions and Dispositions

              During 2004, White Mountains acquired Sirius for $428 million, 19% of Symetra for $195 million, Tryg-Baltica for $58 million, the Sierra Group for $14 million in cash and a $62 million note and Atlantic Specialty for $30 million in cash and a $20 million note.

                      During 2004, White Mountains sold Potomac for $22 million, Western States, as well as its boiler inspection service business, for $15 million (both subsidiaries of OneBeacon) and Peninsula for $23 million.

                      SeeNote 2—Significant Transactions of the accompanying Consolidated Financial Statements for further discussion of these transactions.


              Other Liquidity and Capital Resource Activities

                      During the first quarter of 2004, White Mountains sold 4.5 million common shares of Montpelier to third parties for net proceeds of $155.3 million. Also during the first quarter of 2004, White Mountains purchased additional warrants to acquire 2.4 million common shares of Montpelier from an existing warrant holder for $54.1 million in cash.

                      During the first quarter of 2004,2007, White Mountains made payments amounting to $127totaling $56 million, in cash or by deferral into certain non-qualified compensation plans of the Company or its subsidiaries, to participants in its long-term incentive compensation plans. These payments were made with respect to 167,78263,300 target performance shares at payout levels ranging from 93%145% to 200%186% of target.

              For the year ended December 31, 20032006

                Financing and Other Capital Activities

                        In May 2003, Fund American issued the Senior Notes for net proceeds of $693 million. Using proceeds from the Senior Notes, Fund American repaid the entire $615 million of term loans outstanding under its previous bank facility. In addition, on May 27, 2003, using the remaining $78 million in proceeds from the Senior Notes and cash on hand, Fund American repaid the entire $125 million of revolving loans outstanding under its previous bank facility. In connection with the repayment of its previous bank facility, Fund American paid an aggregate $56 million to unwind all of its existing interest rate swap agreements.

                        In September 2003, Fund American established its $300 million revolving Bank Facility. As discussed earlier, this Bank Facility was restructured and re-syndicated in August 2004.

                      During 2003, White Mountains paid a total of $20 million in interest under the Senior Notes.

                      During 2003, White Mountains made scheduled principal amortization payments of $7 million and paid a total of $23 million in interest under its previous bank facility, including $11 million paid under the interest rate swap agreements, prior to its repayment.

                      During 2003,2006, White Mountains declared and paid cash dividends of $8$86 million, $28 million and $2 million to holders of Common Shares,White Mountains' common shares, the Berkshire Preferred Stock and the Zenith Preferred Stock, respectively.

                      During 2003, White Mountains filed a shelf registration statement, which was declared effective by the SEC in July 2003, for offerings of up to $2.0 billion in debt and/or equity securities.

                      During 2003,2006, OneBeacon Ltd. declared and paid a total$12 million cash dividend to its immediate parent and OneBeacon paid $90 million of $235 million in cash dividends to Fund American. Also during 2003, WMU2006, White Mountains Re paid $46 million of dividends to its immediate parent.

                      During 2006, the Company, through various intermediate holding companies, contributed $100 million in cash and investments to White Mountains Re and $125 million in cash to Esurance.

                      During 2006, Fund American funded a trust account with $324 million of cash and investments to economically defease the Berkshire Preferred Stock and FAEH funded a trust account with $21 million of cash to economically defease the Zenith Preferred Stock.

                      During 2006, White Mountains paid a total of $35$41 million in interest under the Fund American Senior Notes.


                      During 2006, White Mountains borrowed and repaid $140 million under its previous credit facility and borrowed $320 million under its new WTM Bank Facility. In addition, OneBeacon drew an additional $22 million under its existing real estate construction loan.

                      During 2006, OneBeacon and Folksamerica Holdings repaid $8 million and $7 million, respectively, of loans to Dowling and Partners Connecticut Fund III LP.

                      During 2006, White Mountains received cash dividends tofrom Symetra of $16 million on its immediate parent,common share investment and $9 million on its warrant investment.

                Acquisitions and Dispositions

                      On December 22, 2006, White Mountains Re and WM Advisors paid a total of $10acquired Mutual Service for $34 million in cash dividendscash.

                      On November 14, 2006, White Mountains closed on the OneBeacon Offering and received $650 million in net proceeds for the sale of 27.6% of its ownership interest in OneBeacon Ltd.

                      On August 2, 2006, White Mountains Re sold one of its subsidiaries, Sirius America, to Fund American.an investor group for $139 million in cash. As part of the transaction, White Mountains acquired an equity interest of approximately 18% in the acquiring entity by investing $32 million into the investor group.

                      On September 29, 2006, OneBeacon transferred certain assets and the right to renew existing policies of its Agri division to QBE Insurance Group for $32 million in cash.

                      During 2003,the third quarter of 2006, White Mountains sold 5.4 million common shares of Montpelier Re for proceeds of $104 million in cash.

                Other Liquidity and Capital Resource Activities

                      During 2006, the Company issued a total of 11,116 Common Shares3,530 common shares to its employees through the exercise of Options and, as a result,during the Companyperiod and received cash proceeds of $1.5$.6 million in connection with these Option exercises.

              Acquisitions and Dispositions

                      During 2003, OneBeacon sold one of its subsidiaries, NFU Standard, for $22 million.

              Other Liquidity and Capital Resource Activities

                      During the first quarter of 2003,2006, White Mountains paid a total of 45,000 performance shares (relating to the 2000-2002 performance period) at 200%, amounting to $29made payments totaling $57 million, to its participants in


              cash Common Shares or by deferral into certain non-qualified compensation plans of the Company or its subsidiaries. Insubsidiaries, to participants in its long-term incentive compensation plans. These payments were made with respect to 64,100 target performance shares at payout levels ranging from 142% to 181% of target.

              For the secondyear ended December 31, 2005

                Financing and Other Capital Activities

                      During 2005, White Mountains declared and paid cash dividends of $86 million, $28 million and $2 million to holders of White Mountains' common shares, the Berkshire Preferred Stock and the Zenith Preferred Stock, respectively.

                      During 2005, OneBeacon declared and paid dividends of $340 million to Fund American and White Mountains Re declared and paid $98 million of dividends to its immediate parent.

                      During 2005, White Mountains contributed $250 million to White Mountains Re (which, in turn, contributed $250 million to Folksamerica) and $10 million to Esurance.

                      During 2005, White Mountains paid a total of $41 million in interest under the Fund American Senior Notes.

                      During 2005, OneBeacon drew down $18 million on an 18-year mortgage note that it entered into in connection with its purchase of land and a home office building.

                Acquisitions and Dispositions

                      During 2005, OneBeacon sold two of its insurance subsidiaries, NFU and Traders and Pacific Insurance Company, to third parties for a total of $162 million in cash.

                      During 2005, White Mountains Re sold one of its subsidiaries, California Indemnity Insurance Company, to a third party for a total of $20 million, $19 million of which was paid in cash.

                      On April 29, 2005, OneBeacon purchased a 284,000 square foot office facility located in Canton, MA for $23 million.


                Other Liquidity and Capital Resource Activities

                      During 2005, White Mountains received a total of $60 million in tax refunds and interest from the Internal Revenue Service related to the completion of an audit of White Mountains' 1997-2000 tax years, the period during which the Company redomesticated to Bermuda.

                      During 2005, the Company issued a total of 7,750 common shares to its employees through the exercise of Options during the period and received cash proceeds of $1 million in connection with these Option exercises.

                      During the first quarter of 2003,2005, White Mountains made performance share payments amounting to $13totaling $235 million, in cash or by deferral into certain non-qualified compensation plans of the Company. TheCompany or its subsidiaries, to participants in its long-term incentive compensation plans. These payments on these additionalwere made with respect to 212,611 performance shares in the second quarter represented accelerated paymentsat payout levels ranging from 113% to certain non-employee directors200% of the Company for performance periods originally scheduled to end on December 31, 2003, 2004 and 2005.

              For the year ended December 31, 2002

              Financing and Other Capital Activitiestarget.

                      During 2002,the first quarter of 2005, White Mountains sold $225received a $74 million of its equity securities in a private transaction and used the proceeds, along with cash on hand, to repay in full the $260 million Seller Note to Aviva, along with approximately $23 million ofspecial dividend related accrued interest.

                      During 2002, White Mountains made scheduled principal amortization payments of $78 million and interest payments of $55 million (including $18 million paid under related interest rate swap agreements) on its previous bank facility.

                      During 2002, OneBeacon declared and paid a total of $173 million in cash dividends to Fund American.

                      During 2002, White Mountains declared and paid a total of $31 million in dividends on the Berkshire Preferred Stock, the Zenith Preferred Stock and the Convertible Preference Shares. Also in 2002, the Company declared and paid an annual dividend of $8 million to its common shareholders

                      During 2002, the Company issued a total of 23,200 Common Shares to its employees in satisfaction of performance share and Option obligations under White Mountains' Long-Term Incentive Plan (the "Incentive Plan"). The Company received proceedswarrant investment in Montpelier Re. This dividend represented $5.50 per share and was in addition to Montpelier Re's normal quarterly dividend of $1.3 million as a result of exercises of Options to acquire 11,500 Common Shares during the period.

                      In December 2002, OBPP borrowed $8 million from a related third party.$.36 per share.

              Acquisitions and Dispositions

                      On April 25, 2002, Folksamerica acquired Imperial for $4 million including related expenses.

              Other Liquidity and Capital Resource Activities

                      In July and August of 2002, White Mountains received federal tax refunds totaling $167 million representing accelerated recoveries of carryback losses from 2001 under the Job Creation and Worker Assistance Act of 2002.

                      During 2002, White Mountains paid a total of 31,300 performance shares (relating to the 1999-2001 performance period) at a 200% value, amounting to $21 million, to its participants in cash, Common Shares or by deferral into certain non-qualified compensation plans of the Company or its subsidiaries.


              TRANSACTIONS WITH RELATED PARTY TRANSACTIONS
              PERSONS

                      SeeNote 17—20—"Transactions with Related Party Transactions"Persons" in the accompanying Consolidated Financial Statements.


              CRITICAL ACCOUNTING ESTIMATES

                      Management's Discussion and Analysis of Financial Condition and Results of Operations discusses the Company's consolidated financial statements, which have been prepared in accordance with GAAP.


              The financial statements presented herein include all adjustments considered necessary by management to fairly present the financial position, results of operations and cash flows of White Mountains. The preparation of financial statements in conformity with GAAP requires management to make estimates and assumptions that affect the reported amounts of assets and liabilities as of the date of the financial statements and the reported amounts of revenues and expenses during the reporting period.

                      In the current year presentation of financial information, certain amounts in the prior period financial statements have been reclassified to conform with the current presentation. White Mountains has completed numerous significant transactions during the periods presented that have affected the comparability of the financial statement information presented herein.

                      On an ongoing basis, management evaluates its estimates, including those related to loss and LAE reserves, purchase accounting, reinsurance estimates and its pension benefit obligations. Management bases its estimates on historical experience and on various other factors that are believed to be reasonable under the circumstances, the results of which form the basis for making judgements about the carrying values of assets and liabilities that are not readily apparent from other sources.

                      Management believes that its critical accounting policies affect its more significant estimates used in the preparation of its consolidated financial statements. The descriptions below are summarized and have been simplified for clarity.


              1. Loss and Loss Adjustment Expenses

              OneBeacon

                Non-AsbestosReserves other than Asbestos and Environmental Reserves and Construction Defect Claim Reserves

                      OneBeacon establishes loss and LAE reserves that are estimates of amounts needed to pay claims and related expenses in the future for insured events that have already occurred. The process of estimating reserves involves a considerable degree of judgment by management and, as of any given date, is inherently uncertain.

                      ReservesLoss and LAE reserves are typically comprised of (1) case reserves for claims reported and (2) reserves for losses that have occurred but for which claims have not yet been reported, referred to as incurred but not reported ("IBNR") reserves, which include a provision for expected future development on case reserves. Case reserves are estimated based on the experience and knowledge of claims staff regarding the nature and potential cost of each claim and are adjusted as additional information becomes known or payments are made. IBNR reserves are derived by subtracting paid loss and LAE and case reserves from estimates of ultimate loss and LAE. Actuaries estimate ultimate loss and LAE using various generally accepted actuarial methods applied to known losses and other relevant information. Like case reserves, IBNR reserves are adjusted as additional information becomes known or payments are made.

                      Ultimate loss and LAE are generally determined by extrapolation of claim emergence and settlement patterns observed in the past that can reasonably be expected to persist into the future. In forecasting ultimate loss and LAE with respect to any line of business, past experience with respect to that line of business is the primary resource, but cannot be relied upon in isolation. OneBeacon's own experience, particularly claims development experience, such as trends in case reserves, payments on and closings of claims, as well as changes in business mix and coverage limits, is the most important information for estimating its reserves. External data, available from organizations such as statistical bureaus, consulting firms and reinsurance companies, is sometimes used to supplement or corroborate OneBeacon's own experience, and can be especially useful for estimating costs of new business. For some lines of business, such as "long-tail" coverages discussed below, claims data reported in the most recent accident year is often too limited to provide a meaningful basis for analysis due to the typical delay in reporting of claims. For this type of business, OneBeacon uses a selected loss ratio method for the initial accident year or years. This is a standard and accepted actuarial reserve estimation method


              in these circumstances in which the loss ratio is selected based upon information used in pricing policies for that line of business, as well as any publicly available industry data, such as industry pricing, experience and trends, for that line of business.

                      Uncertainties in estimating ultimate loss and LAE are magnified by the time lag between when a claim actually occurs and when it is reported and settled. This time lag is sometimes referred to as the "claim-tail". The claim-tail for most property coverages is typically short (usually a few days up to a few months). The claim-tail for liability/casualty coverages, such as automobile liability, general liability, products liability, multiple peril coverage, and workers compensation, can be especially long as claims are often reported and ultimately paid or settled years, even decades, after the related loss events occur. During the long claims reporting and settlement period, additional facts regarding coverages written in prior accident years, as well as about actual claims and trends may become known and, as a result, OneBeacon may adjust its reserves. If management determines that an adjustment is appropriate, the adjustment is booked in the accounting period in which such determination is made in accordance with GAAP. Accordingly, should reserves need to be increased or decreased in the future from amounts currently established, future results of operations would be negatively or positively impacted, respectively.

                      In determining ultimate loss and LAE, the cost to indemnify claimants, provide needed legal defense and other services for insureds and administer the investigation and adjustment of claims are considered. These claim costs are influenced by many factors that change over time, such as expanded coverage definitions as a result of new court decisions, inflation in costs to repair or replace damaged property, inflation in the cost of medical services and legislated changes in statutory benefits, as well as by the particular, unique facts that pertain to each claim. As a result, the rate at which claims arose in the past and the costs to settle them may not always be representative of what will occur in the future. The factors influencing changes in claim costs are often difficult to isolate or quantify and developments in paid and incurred losses from historical trends are frequently subject to multiple and conflicting interpretations. Changes in coverage terms or claims handling practices may also cause future experience and/or development patterns to vary from the past. A key objective of actuaries in developing estimates of ultimate loss and LAE, and resulting IBNR reserves, is to identify aberrations and systemic changes occurring within historical


              experience and accurately adjust for them so that the future can be projected reliably. Because of the factors previously discussed, this process requires the use of informed judgment and is inherently uncertain.

                      OneBeacon's actuaries use several generally accepted actuarial methods to evaluate its loss reserves, each of which has its own strengths and weaknesses. OneBeacon places more or less reliance on a particular method based on the facts and circumstances at the time the reserve estimates are made. These methods generally fall into one of the following categories or are hybrids of one or more of the following categories:

                Historical paid loss development methods:    These methods use historical loss payments over discrete periods of time to estimate future losses. Historical paid loss development methods assume that the ratio of losses paid in one period to losses paid in an earlier period will remain constant. These methods necessarily assume that factors that have affected paid losses in the past, such as inflation or the effects of litigation, will remain constant in the future. Because historical paid loss development methods do not use case reserves to estimate ultimate losses, they can be more reliable than the other methods discussed below that look to case reserves (such as actuarial methods that use incurred losses) in situations where there are significant changes in how case reserves are established by a company's claims adjusters. However, historical paid loss development methods are more leveraged, (meaningmeaning that small changes in payments have a larger impact on estimates of ultimate losses)losses, than actuarial methods that use incurred losses because cumulative loss payments take much longer to equal the expected ultimate losses than cumulative incurred amounts. In addition, and for similar reasons, historical

                  paid loss development methods are often slow to react to situations when new or different factors arise than those that have affected paid losses in the past.


              Historical incurred loss development methods:    These methods, like historical paid loss development methods, assume that the ratio of losses in one period to losses in an earlier period will remain constant in the future. However, instead of using paid losses, these methods use incurred losses (i.e., the sum of cumulative historical loss payments plus outstanding case reserves) over discrete periods of time to estimate future losses. Historical incurred loss development methods can be preferable to historical paid loss development methods because they explicitly take into account open cases and the claims adjusters' evaluations of the cost to settle all known claims. However, historical incurred loss development methods necessarily assume that case reserving practices are consistently applied over time. Therefore, when there have been significant changes in how case reserves are established, using incurred loss data to project ultimate losses can be less reliable than other methods.

              Expected loss ratio methods:    These methods are based on the assumption that ultimate losses vary proportionately with premiums. Expected loss ratios are typically developed based upon the information used in pricing, and are multiplied by the total amount of premiums written to calculate ultimate losses. Expected loss ratio methods are useful for estimating ultimate losses in the early years of long-tailed lines of business, when little or no paid or incurred loss information is available.

              Adjusted historical paid and incurred loss development methods:    These methods take traditional historical paid and incurred loss development methods and adjust them for the estimated impact of changes from the past in factors such as inflation, the speed of claim payments or the adequacy of case reserves. Adjusted historical paid and incurred loss development methods are often more reliable methods of predicting ultimate losses in periods of significant change, provided the actuaries can develop methods to reasonably quantify the impact of changes.

                    OneBeacon performs an actuarial review of its recorded reserves each quarter. OneBeacon's actuaries compare the previous quarter's estimates of paid loss and LAE, case reserves and IBNR to amounts indicated by actual experience. Differences between previous estimates and actual experience are evaluated to determine whether a given actuarial method for estimating loss and LAE should be relied upon to a greater or lesser extent than it had been in the past. While some variance is expected each quarter due to the inherent uncertainty in loss and LAE, persistent or large variances would indicate that prior assumptions and/or reliance on certain reserving methods may need to be revised going forward.

                    In its selection of recorded reserves, OneBeacon historically gave greater weight to adjusted paid loss development methods, which are not dependent on the consistency of case reserving practices, over methods that rely on incurred losses. In recent years, the amount of weight given to methods based on incurred losses has increased with OneBeacon's confidence that its case reserving practices have been more consistently applied.


                    Upon completion of each quarterly review, OneBeacon's actuaries select indicated reserve levels based on the results of the actuarial methods described previously, which are the primary consideration in determining management's best estimate of required reserves. However, in making its best estimate, management also considers other qualitative factors that may lead to a difference between held reserves and actuarially recommended levels in the future. Typically, these factors exist when management and OneBeacon's actuaries conclude that there is insufficient historical incurred and paid loss information or that trends included in the historical incurred and paid loss information are unlikely to repeat in the future. Such factors include, among others, recent entry into new markets or new products, improvements in the claims department that are expected to lessen future ultimate loss costs and legal and regulatory developments. At December 31, 2007 and 2006, total carried reserves were 2.7% and 1.8% above the actuarial point estimate, respectively.

              Construction Defect Claims Reserves

                    Construction defect claims are a non-A&E exposure that has proven to have a greater degree of uncertainty when estimating loss and LAE using generally accepted actuarial methods. OneBeacon's general liability and multiple peril lines of business have been significantly impacted by an increasinga large number of construction defect claims. Construction defect is a liability allegation relating to defective work performed in the construction of structures such as apartments, condominiums, single family dwellings or other housing, as well as the sale of defective building materials. Such claims seek recovery due to damage caused by alleged deficient construction techniques or workmanship. Much of the increase inrecent claims activity has been generated by plaintiffs' lawyers who approach new homeowners, and in many cases homeowner associations with large numbers of homeowners in multi-residential complexes, about defects or other flaws in their homes. The increasing number of claimsClaims for construction defects began with claims relating to exposures in California. Then, as plaintiffs' lawyers organized suits in other states with high levels of multi-residential construction, construction defect claims were reported in nearby western states, such as Colorado and Nevada, and eventually throughout the country. The reporting of such claims can be quite delayed as the statute of limitations can be up to ten years. Court decisions have expanded insurers' exposure to construction defect claims as well. For example, in 1995 California courts adopted a "continuous trigger" theory in which all companies that had ever insured a property that was alleged to have been damaged by defective construction must respond to the claimant, even if evidence of the alleged damage did not appear until after the insurance period had expired. As a result, construction defect claims may be reported more than ten years after a project has been completed as litigation can proceed for several years before an insurance company is identified as a potential contributor. Recently, claimsClaims have also emerged from parties claiming additional insured status on policies issued to other parties (e.g., such as contractors seeking coverage on a sub-contractor's policy). Further, in reserving for these claims, there is additional uncertainty due to the potential for further unfavorable judicial rulings and regulatory actions. The primary actuarial methods that are used to estimate loss and LAE reserves for construction defect claims are frequency and severity methods. These methods separately project the frequency of future reported claims and the average cost, or severity, of individual claims. The reserve is the product of the projected number of reported claims and the severity.


                    A large number of construction defect claims have been identified relating to coverages that OneBeacon had written in the past through Commercial Union Corporation and General Accident Corporation of America, which OneBeacon refers to as their legacy companies, and their subsidiaries in California, Colorado, Nevada, Washington and Oregon. ManagementOneBeacon's management has sought to mitigate future construction defect risks in all states by no longer providing insurance to certain residential general contractors and sub-contractors involved in multi-habitational projects. Mitigating actions also included initiating the withdrawal from problematic sub-segments within OneBeacon's construction book of business, such as street and road construction, water, sewer and pipeline construction, and dam, waterway, railroad and subway construction. Management has undertakenAs a result of these actions, to mitigate future risks related to construction defect claims andOneBeacon's management believes that the number of reported construction defect claims relating to coverages written in the past peaked in 2004 and will begincontinue to decline. In addition, in reserving for these claims, there is additional uncertainty due to the potential for further unfavorable judicial rulings and regulatory actions.


              Asbestos and Environmental ("A&E") Reserves

                    OneBeacon's reserves include provisions made for claims that assert damages from A&E related exposures. Asbestos claims relate primarily to injuries asserted by those who allegedly came in contact with asbestos or products containing asbestos. Environmental claims relate primarily to pollution and related clean-up cost obligations, particularly as mandated by federal and state environmental protection agencies. In addition to the factors described above under"Non-Asbestos and Environmental Reserves" regarding the reserving process, OneBeacon estimates its A&E reserves based upon, among other factors, facts surrounding reported cases and exposures to claims, such as policy limits and deductibles, current law, past and projected claim activity and past settlement values for similar claims, as well as analysis of industry studies and events, such as recent settlements and asbestos-related bankruptcies. The cost of administering A&E claims, which is an important factor in estimating loss and LAE reserves, tends to be higher than in the case of non-A&E claims due to the higher legal costs typically associated with A&E claims. Due to the inherent difficulties in estimating ultimate A&E exposures, OneBeacon does not estimate a range for A&E incurred losses.

                    A large portion of OneBeacon's A&E losses resulted primarily from the operations of the Employers Group, an entity acquired by one of the legacy companies in 1971. These operations, including business of Employers Surplus Lines Insurance Company and Employers Liability Assurance Corporation, provided primary and excess liability insurance for commercial insureds, including Fortune 500-sized accounts, some of whom subsequently experienced claims for A&E losses. OneBeacon stopped writing such coverage in 1984.

                    OneBeacon's liabilities for A&E losses from business underwritten in the recent past are substantially limited by the application of exclusionary clauses in the policy language that eliminated coverage offor such claims. After 1987 for pollution and 1992 for asbestos, most liability policies contained industry-standard absolute exclusions of such claims. In earlier years, various exclusions were also applied, but the wording of those exclusions was less strict and subsequent court rulings have reduced their effectiveness.

                    OneBeacon also incurred A&E losses via its participation in industry pools and associations. The most significant of these pools was Excess Casualty Reinsurance Association ("ECRA"), which provided excess liability reinsurance to U.S. insurers from 1950 until the early 1980s. ECRA incurred significant liabilities for A&E, of which OneBeacon bears approximately a 4.7% share, or $60 million and $65 million at December 31, 2004 (compared to $66 million at December 31, 2003),2007 and 2006, respectively, which is fully reflected in OneBeacon's loss and LAE reserves.

                    More recently, since the 1990s, OneBeacon has experienced an influx ofincrease in claims from commercial insureds, including many non-Fortune 500-sized accounts written during the 1970s and 1980s, who are named as defendants in asbestos lawsuits. As a number of large well-known manufacturers of asbestos


            and asbestos-containing products have gone into bankruptcy, plaintiffs have sought recoveries from peripheral defendants, such as installers, transporters or sellers of such products, or from owners of premises on which the plaintiffs' exposure to asbestos allegedly occurred. At December 31, 2004, 6642007, 491 policyholders had asbestos-related claims against OneBeacon. In 2004, 1122007, 102 new insureds with such peripheral involvement presented asbestos claims under prior OneBeacon policies.

                    Historically, most asbestos claims have been asserted as product liability claims. Recently, insureds who have exhausted the available products liability limits of their insurance policies have sought from insurers such as OneBeacon payment for asbestos claims under the premises and operations coverage of their liability policies. It ispolicies, which may not be subject to similar aggregate limits. OneBeacon expects this trend to continue. However, to date there have been fewer of these premises and operations coverage claims than product liability coverage claims. This may be due to a variety of factors, including that it may be more difficult for underlying plaintiffs to establish losses as stemming from premises and operations exposures, which requires proof of the defendant's negligence, rather than products liability under which strict legal liability applies. Hence, there are fewer ofPremises and operations claims may vary significantly and policyholders may seek large amounts, although such claims andfrequently settle for a fraction of the initial alleged amount. Accordingly, there is a great deal of variation in damages awarded for the actual injuries. Additionally, several accounts that seek such coverage find that previously paid losses exhausted the aggregate limits under their policies. In these situationsAs of December 31, 2007, there is no coverage for these claims. There are currently 148were approximately 261 active claims by insureds against OneBeaconus without product liability coverage asserting operations or premises coverage.coverage, which may not be subject to aggregate limits under the policies.

                    Immediately prior to White Mountains' acquisition ofthe OneBeacon Acquisition, OneBeacon purchased a reinsurance contract with NICO under which OneBeacon is entitled to recover from NICO up to $2.5 billion in the future for asbestos claims arising from business written by OneBeacon in 1992 and prior, environmental claims arising from business written by OneBeacon in 1987 and prior, and certain other exposures.exposures, including mass torts. Under the terms of the NICO Cover, NICO receives the economic benefit of reinsurance recoverables from certain of OneBeacon's third party reinsurers in existence at the time the NICO Cover was executed ("Third Party Recoverables"). As a result, the Third Party Recoverables serve to protect the $2.5 billion limit of NICO coverage for the benefit of OneBeacon. Any amounts uncollectible from third party reinsurers due to dispute or the reinsurers' financial inability to pay are covered by NICO


            under its agreement with OneBeacon. Third Party Recoverables are typically for the amount of loss in excess of a stated level each year. Of claim payments in the past 11 years,from 1996 through 2007, approximately 63%49% of asbestos losses and 39% of environmental losses have been recovered under the historical third party reinsurance.

                    In June 2005, OneBeacon completed an internal study of its A&E exposures. This study considered, among other items, (1) facts, such as policy limits, deductibles and available third party reinsurance, related to reported claims; (2) current law; (3) past and projected claim activity and past settlement values for similar claims; (4) industry studies and events, such as recent settlements and asbestos-related bankruptcies; and (5) collectibility of third-party reinsurance. Based on the study, OneBeacon increased its best estimate of its incurred losses ceded to NICO, net of underlying reinsurance, by $353 million ($841 million gross) to $2.1 billion, which is within the $2.5 billion coverage provided by the NICO Cover. Based on the study, OneBeacon estimated that the range of reasonable outcomes around its best estimate was $1.7 billion to $2.4 billion, versus a range of $1.5 billion to $2.4 billion from the previous study that was conducted in 2003. Due to the NICO Cover, there was no impact to income or equity from the change in estimate.

                    The increase in the estimate of incurred A&E losses was principally driven by raised projections for claims related to asbestos (particularly from assumed reinsurance business), and for mass torts other than asbestos and environmental, particularly lead poisoning and sexual molestation. The increase was partially offset by reduced projections of ultimate hazardous waste losses.

                    As part of its previously described actuarial review process, OneBeacon reviews A&E activity each quarter and compares that activity to what was assumed in the original internal study. As of December 31, 2007, OneBeacon estimated that the range of reasonable outcomes around its best estimate was $1.7 billion to $2.4 billion.

                    As noted above, OneBeacon estimates that on an incurred basis it has exhaustedceded estimated incurred losses of approximately $1.7$2.1 billion of the coverage provided by NICO at December 31, 2004. At December 31, 2004, $14.32007. Since entering into the NICO Cover, $40 million of the $1.7$2.1 billion of exhaustedutilized coverage relates to uncollected amounts from NICO related to uncollectible Third Party Recoverables.third party reinsurers through December 31, 2007. Net losses paid totaled approximately $682$986 million as of December 31, 2004,2007, with $95$139 million paid in 2004.2007. Asbestos payments during 20042007 reflect payments resulting from intensified efforts by claimants to resolve asbestos claims prior to the potential enactment of potential Federal asbestos legislation. To the extent that OneBeacon's estimate of ultimate A&E losses as well as the estimate and collectibility of Third Party Recoverables differs from actual experience, the remaining protection under the NICO Cover may be more or less than the approximate $757$404 million that OneBeacon estimates remained at December 31, 2004.

                    For purposes of determining available reinsurance, product liability asbestos claims typically are aggregated as a single loss within each policy period. As a result, losses often exceed the retention level under the reinsurance agreement and reinsurance recoveries are obtained. However, for claims being asserted under premises and operations coverage, the losses are generally not aggregated for purposes of determining reinsurance recoveries, so OneBeacon expects that in the future a smaller percentage of these losses will be covered as Third Party Recoverables than has been true historically of products liability asbestos losses.2007.

                    OneBeacon's reserves for A&E losses, net of Third Party Recoverables but prior to NICO recoveries, arewere $1.0 billion at December 31, 2004.2007. An industry benchmark of reserve adequacy is the "survival ratio", computed as a company's reserves divided by its historical average yearly loss


            payments. This ratio indicates approximately how many more years of payments the reserves can support, assuming future yearly payments are equal to historical levels. OneBeacon's survival ratio was approximately 21.014.2 at December 31, 2004, which2007. This was computed as the ratio of A&E reserves, net of Third Party Recoverables prior to the NICO Cover of $1.0$1.2 billion plus the remaining unused portion of the NICO Cover of $757$404 million, to the average A&E loss payments inover the past three years. The average loss payments used to calculatethree-year period ended December 31, 2007, net of Third Party Recoverables. OneBeacon's survival ratio were net of a large commutation ($64 million) in 2003 with a Third Party Reinsurer. White Mountainswas 16.6 at December 31, 2006. OneBeacon believes that as a result of the NICO Cover and its historical third party reinsurance programs, OneBeacon should not experience material financial loss from old A&E exposures under current coverage interpretations and that its survival ratio compares favorably to industry survival ratios. However, the survival ratio is a simplistic measure estimating the number of years it would be before the current ending loss reserves for these claims would be paid using recent annual average payments. Many factors, such as aggressive settlement procedures, mix of business and coverage provided, have a significant effect on the amount of A&E reserves and payments and the resultant survival ratio. Thus, caution should be exercised in attempting to determine reserve adequacy for these claims based simply on this survival ratio.

                    OneBeacon's reserves for A&E losses at December 31, 20042007 represent management's best estimate of its ultimate liability based on information currently available. Based on this estimate, OneBeacon believes the NICO Cover will be adequate to cover all of its A&E obligations. However, as case law expands, medical and clean-up costs increase and industry settlement practices change, OneBeacon may be subject to asbestos and environmentalA&E losses beyond currently estimated amounts. Therefore, OneBeacon cannot guarantee that its A&E loss and LAE reserves, plus the remaining coverage under the NICO Cover, will be sufficient to cover additional liability arising from any such unfavorable developments. SeeNote 3 to3—"Reserves for Unpaid Loss and LAE—Asbestos and environmental loss and LAE reserve activity" of the accompanying historical consolidated financial statements for more information regarding White Mountains'its A&E reserves.


              OneBeacon A&E Claims Activity

                    OneBeacon's A&E claim activity for the last two years is illustrated in the table below.below:


             Year Ended
            December 31,

              Year Ended December 31,
             
            A&E Claims Activity

              
            2004
             2003
              2007
             2006
             
            Asbestos          
            Accounts with asbestos claims at the beginning of the year 642 615  542 592 
            Accounts reporting asbestos claims during the year 112 178  102 121 
            Accounts on which asbestos claims were closed during the year (90)(151) (153)(171)


            Accounts with asbestos claims at the end of the year 664 642  491 542 


            Environmental          
            Accounts with environmental claims at the beginning of the year 674 596  443 495 
            Accounts reporting environmental claims during the year 110 175  135 130 
            Accounts on which environmental claims were closed during the year (140)(97) (196)(182)


            Accounts with environmental claims at the end of the year 644 674  382 443 


            Total          
            Total accounts with A&E claims at the beginning of the year 1,316 1,211  985 1,087 
            Accounts reporting A&E claims during the year 222 353  237 251 
            Accounts on which A&E claims were closed during the year (230)(248) (349)(353)


            Total accounts with A&E claims at the end of the year 1,308 1,316  873 985 


              OneBeacon's Loss and LAE Reserves by Line of Business

                      The process of establishing loss reserves is complex and imprecise as it must take into consideration many variables that are subject to the outcome of future events. As a result, informed subjective estimates and judgments as to OneBeacon's ultimate exposure to losses are an integral component of its loss reserving process. OneBeacon, like other insurance companies, categorizes and tracks its insurance reserves by "line of business", such as automobile liability, multiple peril package business, and workers compensation. Furthermore, OneBeacon regularly reviews the appropriateness of reserve levels at the line of business level, taking into consideration the variety of trends that impact the ultimate settlement of claims for the subsets of claims in each particular line of business.

                      For loss and allocated loss adjustment expense reserves, excluding A&E, the key assumption as of December 31, 2007 was that the impact of the various reserving factors, as described below, on future paid losses would be similar to the impact of those factors on the historical loss data with the following exceptions:

                Recent increases in paid loss trends were inflated due to changes in claim handling procedures that decreased the settlement time for claims. This resulted in some increases in paid loss activity that OneBeacon believes will not continue into the future.

                Increases in case reserve adequacy over the 2001-2004 calendar periods have resulted in trends in case incurred activity that OneBeacon believes will not continue into the future. Case incurred activity can be the result of underlying changes in expected claim costs or changes in the adequacy of the case reserves relative to the underlying expected claim cost. If the activity is the result of underlying changes in expected costs, it is more likely to repeat in the future, and would likely result in prior year reserve development, as the change in ultimate claim costs would not have been considered when making the previous selection of IBNR reserves. If the activity is the result of changes in case reserve adequacy, it would not indicate any change in the ultimate claim costs and would not be expected to repeat in the future. In these cases, it is unlikely that prior year reserve development would occur, as the change in case reserves would be offset by a corresponding change in IBNR reserves (i.e., deficiency or redundancy in case reserves was implicitly captured when making the previous selection of IBNR reserves).

                In 2004, OneBeacon established a separate claim group to manage run-off claims. Due to the recent nature of this event, OneBeacon does not believe that the impacts of this group on future losses have been reflected in historical losses. Therefore, OneBeacon has given considerable weight to the most recent loss experience for this segment.

                        The major causes of material uncertainty ("reserving factors") generally will vary for each product line, as well as for each separately analyzed component of the product line. The following section details reserving factors by product line. There could be other reserving factors that may impact ultimate claim costs. Each reserving factor presented will have a different impact on estimated reserves. Also, reserving factors can have offsetting or compounding effects on estimated reserves. For example, in workers compensation, the use of expensive medical procedures that result in medical cost inflation may enable workers to return to work faster, thereby lowering indemnity costs. Thus, in almost all cases, it is impossible to discretely measure the effect of a single reserving factor and construct a meaningful sensitivity expectation. Actual results will likely vary from expectations for each of these assumptions, resulting in an ultimate claim liability that is different from that being estimated currently.

                  Workers compensation

                        Workers compensation is generally considered a long tail coverage, as it takes a relatively long period of time to finalize claims from a given accident year. While certain payments such as initial medical treatment or temporary wage replacement for the injured worker are made quickly, some other payments are made over the course of several years, such as awards for permanent partial injuries. In addition, some payments can run as long as the injured worker's life, such as permanent disability benefits and ongoing medical care. Despite the possibility of long payment tails, the reporting lags are generally short, settlements are generally not complex, and most of the liability can be considered high frequency with moderate severity. The largest reserve risk generally comes from the low frequency, high severity claims providing lifetime coverage for medical expense arising from a worker's injury. Examples of common reserving factors that can change and, thus, affect the estimated workers compensation reserves include:

                  General workers compensation reserving factors

                  Mortality trends of injured workers with lifetime benefits and medical treatment or dependents entitled to survivor benefits

                  Degree of cost shifting between workers compensation and health insurance

                  Changes in claim handling philosophies (e.g., case reserving standards)

                  Indemnity reserving factors

                  Time required to recover from the injury

                  Degree of available transitional jobs

                  Degree of legal involvement

                  Changes in the interpretations and processes of various workers compensation bureaus' oversight of claims

                  Future wage inflation for states that index benefits

                  Changes in the administrative policies of second injury funds

                  Re-marriage rate for spouse in instances of death

                  Medical reserving factors

                  Changes in the cost of medical treatments, including prescription drugs, and underlying fee schedules

                  Frequency of visits to health providers

                  Number of medical procedures given during visits to health providers

                  Types of health providers used

                  Type of medical treatments received

                  Use of preferred provider networks and other medical cost containment practices

                  Availability of new medical processes and equipment

                  Changes in the use of pharmaceutical drugs

                  Degree of patient responsiveness to treatment

                  Workers compensation book of business reserving factors

                  Product mix

                  Injury type mix

                  Changes in underwriting standards

                    Personal automobile liability

                          The personal automobile product line is a mix of property and liability coverages and, therefore, includes both short and long tail coverages. The payments that are made quickly typically pertain to auto physical damage (property) claims and property damage (liability) claims. The payments that take longer to finalize and are more difficult to estimate relate to bodily injury claims. Personal automobile reserves are typically analyzed in three components: bodily injury liability, property damage liability, and collision/comprehensive claims. This last component has minimum reserve risk and fast payouts and, accordingly, separate factors are not presented. Reporting lags are relatively short and the claim settlement process for personal automobile liability generally is the least complex of the liability products. It is generally viewed as a high frequency, low to moderate severity product line.

                          Examples of common reserving factors that can change and, thus, affect the estimated personal automobile liability reserves include:

                    Personal automobile liability reserving factors

                    Trends in jury awards

                    Changes in the underlying court system and its philosophy

                    Changes in case law

                    Litigation trends

                    Frequency of claims with payment capped by policy limits

                    Change in average severity of accidents, or proportion of severe accidents

                    Subrogation opportunities

                    Degree of patient responsiveness to treatment

                    Changes in claim handling philosophies (e.g., case reserving standards)

                    Personal automobile liability book of business reserving factors

                    Changes in policy provisions (e.g., deductibles, policy limits, or endorsements)

                    Changes in underwriting standards

                    Multiple peril

                          Commercial multiple peril provides a combination of property and liability coverage typically for small businesses and, therefore, includes both short and long tail coverages. For property coverage, it generally takes a relatively short period of time to close claims, while for the other coverages, generally for the liability coverages, it takes a longer period of time to close claims. The reserving risk for this line is dominated by the liability coverage portion of this product, except occasionally in the event of catastrophic or large single losses.

                          Multiple peril liability reserves here are generally analyzed as two components: bodily injury and property damage. Bodily injury payments reimburse the claimant for damages pertaining to physical injury as a result of the policyholder's legal obligation arising from non-intentional acts such as negligence, subject to the insurance policy provisions. In some cases the damages can include future wage loss (which is a function of future earnings power and wage inflation) and future medical treatment costs. Property damage payments result from damages to the claimant's private property arising from the policyholder's legal obligation for non-intentional acts. In most cases, property damage losses are a function of costs as of the loss date, or soon thereafter. Defense costs are also a part of the insured costs covered by liability policies and can be significant, sometimes greater than the cost of the actual paid claims, though for some products this risk is mitigated by policy language such that the insured portion of defense costs erodes the amount of policy limit available to pay the claim.

                          Multiple peril liability is generally considered a long tail line, as it takes a relatively long period of time to finalize and settle claims from a given accident year. The speed of claim reporting and claim settlement is a function of the specific coverage provided and the jurisdiction, among other factors. There are numerous components underlying the multiple peril liability product line. Some of these have relatively moderate payment patterns (with most of the claims for a given accident year closed within 5 to 7 years), while others can have extreme lags in both reporting and payment of claims (e.g., a reporting lag of a decade for "construction defect" claims).

                          Examples of common reserving factors that can change and, thus, affect the estimated multiple peril liability reserves include:


                    Multiple peril liability reserving factors

                    Changes in claim handling philosophies (e.g., case reserving standards)

                    Changes in policy provisions or court interpretations of such provisions

                    New theories of liability

                    Trends in jury awards

                    Changes in the propensity to sue, in general with specificity to particular issues

                    Changes in statutes of limitations

                    Changes in the underlying court system

                    Distortions from losses resulting from large single accounts or single issues

                    Changes in tort law

                    Shifts in law suit mix between federal and state courts

                    Changes in settlement patterns

                    Multiple peril liability book of business reserving factors

                    Changes in policy provisions (e.g., deductibles, policy limits, or endorsements)

                    Changes in underwriting standards

                    Product mix (e.g., size of account, industries insured, or jurisdiction mix)

                    Commercial automobile liability

                          The commercial automobile product line is a mix of property and liability coverages and, therefore, includes both short and long tail coverages. The payments that are made quickly typically pertain to auto physical damage (property) claims and property damage (liability) claims. The payments that take longer to finalize and are more difficult to estimate relate to bodily injury claims. Commercial automobile reserves are typically analyzed in three components; bodily injury liability, property damage liability, and collision/comprehensive claims. This last component has minimum reserve risk and fast payouts and, accordingly, separate reserving factors are not presented. In general, claim reporting lags are minor, claim complexity is not a major issue, and the line is viewed as high frequency, low to moderate severity.

                          Examples of common reserving factors that can change and, thus, affect the estimated commercial automobile liability reserves include:

                    Bodily injury and property damage liability reserving factors

                    Trends in jury awards

                    Changes in the underlying court system

                    Changes in case law

                    Litigation trends

                    Frequency of claims with payment capped by policy limits

                    Change in average severity of accidents, or proportion of severe accidents

                    Subrogation opportunities

                    Changes in claim handling philosophies (e.g., case reserving standards)

                    Frequency of visits to health providers

                    Number of medical procedures given during visits to health providers

                    Types of health providers used

                    Types of medical treatments received

                    Changes in cost of medical treatments

                    Degree of patient responsiveness to treatment

                    Commercial automobile liability book of business reserving factors

                    Changes in policy provisions (e.g., deductibles, policy limits, or endorsements)

                    Changes in mix of insured vehicles (e.g., long-haul trucks versus local and smaller vehicles, or fleet risks versus non-fleet risks)

                    Changes in underwriting standards

                      General liability

                            See the above discussions under the liability product lines with regard to reserving factors for multiple peril.

                      Homeowners/Farmowners

                            Homeowners/Farmowners is generally considered a short tail coverage. Most payments are related to the property portion of the policy, where the claim reporting and settlement process is generally restricted to the insured and the insurer. Claims on property coverage are typically reported soon after the actual damage occurs, although delays of several months are not unusual. The resulting settlement process is typically fairly short term, although exceptions do exist. The liability portion of the homeowners/farmowners policy generates claims which take longer to pay due to the involvement of litigation and negotiation, but with generally small reporting lags. Overall, the line is generally high frequency, low to moderate severity (except for catastrophes), with simple to moderate claim complexity.

                            Examples of common reserving factors that can change and, thus, affect the estimated homeowners/farmowners reserves include:

                      Non-catastrophe reserving factors

                      Salvage opportunities

                      Amount of time to return property to residential use

                      Changes in weather patterns

                      Local building codes

                      Litigation trends

                      Trends in jury awards

                      Catastrophe reserving factors

                      Physical concentration of policyholders

                      Availability and cost of local contractors

                      Local building codes

                      Quality of construction of damaged homes

                      Amount of time to return property to residential use

                      For the more severe catastrophic events, "demand surge" inflation, whereby the greatly increased demand for building materials such as plywood far surpasses the immediate supply, leading to short-term material increases in building material costs

                      Homeowners/Farmowners book of business reserving factors

                      Policy provisions mix (e.g., deductibles, policy limits, or endorsements)

                      Degree of concentration of policyholders

                      Changes in underwriting standards

                      OneBeacon Loss and LAE Development

                      Loss and LAE development—2007

                            In 2007, OneBeacon experienced $48 million of favorable development on prior accident year loss reserves. The favorable development was primarily related to lower than expected frequency for professional liability in specialty lines and lower than expected severity for automobile liability in personal lines offset by unfavorable development for multiple peril and workers compensation primarily for accident years 2001 and prior.

                            Specifically, at December 31, 2006, management continued to expect losses to emerge in the professional liability business (which is included in OneBeacon's general liability line of business) in line with initial expectations based on market analysis when this business was initiated in 2002 and 2003. During 2007, emerged losses continued to be significantly lower than those initial expectations. As a result, management lowered its selected reserves on the earliest years of this business which had some effect on the more recent years as total loss expectations for those years are partially based on results from earlier years.


                            Management had implicitly assumed at December 31, 2006 that the IBNR and known case development related to personal automobile liability would be approximately 49% of actual case reserves for the 2002 and subsequent accident years. During 2007, case incurred loss and allocated LAE ("ALAE") was only 28% of the future expected development which was smaller than expected for this relatively short tail line of business. As a result, management decreased IBNR reserves for this line so that as of December 31, 2007 the IBNR was approximately 49% relative to the remaining case reserves. Prior to decreasing the IBNR reserves, the IBNR as of December 31, 2007 was approximately 74% of remaining case reserves.

                            Management had implicitly assumed at December 31, 2006 that the IBNR and known case development related to workers compensation and multiple peril liability would be approximately 15% of actual case reserves for the 2001 and prior accident years. During 2007, case incurred loss and ALAE was 47% of the entire future expected development which was unusually large for these long tail lines of business. As a result, management increased IBNR reserves for these lines so that as of December 31, 2007 the IBNR was approximately 28% relative to the remaining case reserves.

                      Loss and LAE development—2006

                            In 2006, OneBeacon experienced $23 million of unfavorable development on prior accident year loss and LAE reserves, primarily due to additional losses incurred on hurricanes Katrina, Rita and Wilma in OBSP.

                            Specifically at December 31, 2005, OneBeacon's management had reviewed all known losses related to hurricane events impacting its excess property policies. Based on information at that time, management established reserves for those losses which were expected to reach coverage layers. During 2006, several individual claims experienced adverse development resulting in more losses penetrating coverage layers. As a result, management increased held reserves as of December 31, 2006 to reflect the actual adverse claim development as well as a provision for future adverse development on these claims.

                      Loss and LAE development—2005

                            In 2005, OneBeacon experienced $95 million of unfavorable development on prior accident year loss and LAE reserves, primarily due to higher than anticipated legal defense costs and higher damages from liability assessments in general liability and multiple peril reserves in its run-off operations.

                            Specifically, OneBeacon's management had assumed at December 31, 2004 that the IBNR and known case development would be approximately 26% of actual case reserves for the 2001 and prior accident years for multiple peril and general liability. During 2005, case incurred loss and ALAE was 72% of the entire future expected development which was unusually large for these long tail lines of business. As a result, OneBeacon's management increased IBNR reserves for these lines so that as of year end 2005 the IBNR was approximately 40% relative to the remaining case reserves.

                      OneBeacon's Case and IBNR Reserves by Line of Business

                            OneBeacon's net loss and LAE reserves by line of business at December 31, 20042007 and 20032006 were as follows:


                     December 31, 2004
                     December 31, 2003
                    Net loss and LAE reserves by class of business

                     December 31, 2007
                     December 31, 2006
                    Case
                     IBNR
                     Total
                     Case
                     IBNR
                     Total

                     ($ in millions)

                    Workers compensation $362.1 $135.5 $497.6 $600.8 $176.6 $777.4
                    Millions

                     December 31, 2007
                     December 31, 2006
                    Workers compensation(1) $81.3 $95.8 $177.1 $82.0 $136.3 $218.3
                    Personal automobile liability  530.7  244.1  774.8  512.0  227.3  739.3 305.2 139.3 444.5 378.6 187.5 566.1
                    Multiple peril  359.3  264.3  623.6  398.5  296.1  694.6
                    Multiple peril(1)(2) 247.0 206.1 453.1 237.9 193.0 430.9
                    Commercial automobile liability  203.8  82.8  286.6  290.2  132.1  422.3 99.7 61.8 161.5 110.2 66.2 176.4
                    General liability  121.6  151.1  272.7  154.9  176.6  331.5
                    General liability(2)(3) 80.2 305.3 385.5 77.0 281.1 358.1
                    Homeowners/Farmowners  82.2  41.8  124.0  102.1  68.0  170.1 71.5 22.8 94.3 72.7 33.4 106.1
                    Other  97.5  84.0  181.5  63.8  58.2  122.0
                    Other(1)(4) 95.9 56.3 152.2 105.2 67.4 172.6


                    Total $1,757.2 $1,003.6 $2,760.8 $2,122.3 $1,134.9 $3,257.2 $980.8 $887.4 $1,868.2 $1,063.6 $964.9 $2,028.5


                    (1)
                    Includes loss and LAE reserves related to A&E.

                    (2)
                    Includes loss and LAE reserves related to construction defect claims.

                    (3)
                    Includes loss and LAE reserves related to professional liability.

                    (4)
                    Includes loss and LAE reserves related to marine liability.

                      OneBeacon's Range of Reserves by Line of Business

                            For OneBeacon, theOneBeacon's range of reserve estimates at December 31, 20042007 was evaluated to consider the strengths and weaknesses of the actuarial methods applied against OneBeacon's historical claims experience data. The following table shows the recorded reserves and the high and low ends of OneBeacon's range of reasonable loss reserve estimates at December 31, 2004.2007. The high and low ends of OneBeacon's range of reserve estimates in the table below are based on the results of various actuarial methods described above.

                    OneBeacon net loss and LAE reserves by line of business


                    Range and recorded reserves

                     December 31, 2007
                    Millions

                     Low
                     Recorded
                     High
                    Workers compensation $142 $177.1 $225
                    Personal automobile liability  406  444.5  481
                    Multiple peril  408  453.1  504
                    Commercial automobile liability  152  161.5  173
                    General liability  287  385.5  424
                    Homeowners/Farmowners  83  94.3  96
                    Other  140  152.2  154


                    Total $1,618 $1,868.2 $2,057


                            The recorded reserve for eachreserves represent management's best estimate of unpaid loss and LAE by line of business. OneBeacon uses the results of several different actuarial methods to develop its estimate of ultimate reserves. While OneBeacon has not determined the statistical probability of actual ultimate paid losses falling within the range, OneBeacon believes that it is reasonably likely that actual ultimate paid losses will fall within the result ofranges noted above because the ranges were developed by using several different generally accepted actuarial method that management believes to be most appropriate based on known facts and trends.methods.

                     
                     December 31, 2004
                    OneBeacon net loss and LAE reserves by line of business
                    Range and recorded reserves

                     Low
                     Recorded
                     High
                     
                     ($ in millions)

                    Workers compensation $475 $498 $555
                    Personal automobile liability  665  774  780
                    Multiple peril  590  624  835
                    Commercial automobile liability  265  286  310
                    General liability  240  273  295
                    Homeowners/Farmowners  105  124  125
                    Other  155  182  185


                    Total $2,495 $2,761 $3,085


                            The probability that ultimate losses will fall outside of the ranges of estimates by line of business is higher for each line of business individually than it is for the sum of the estimates for all lines taken together due to the effects of diversification. The diversification effects result from the fact that losses across OneBeacon's different lines of business are not completely correlated. Although managementOneBeacon believes OneBeacon'sits reserves are reasonably stated, ultimate losses may deviate, perhaps materially, from the recorded reserve amounts and could be above the high end of the range of actuarial projections. This is because ranges are developed based on known events as of the valuation date, whereas the ultimate disposition of losses is subject to the outcome of events and circumstances that may be unknown as of the valuation date.

                            The recorded reservespercentages shown in the following table represent management's best estimatethe linear interpolation of unpaidwhere OneBeacon's recorded loss and LAE reserves are within the range of reserves estimates by line of business. In its selection of recorded reserves, management has generally given greater weight to adjusted paid loss development methods, which are not dependent on the consistency of case reserving practices, rather than methods that rely on incurred losses, because of the increased adequacy of case reserving by OneBeacon's claim staff in the recent past. For multiple peril this resulted in OneBeacon recording reserves nearerbusiness at December 31, 2007 and 2006, where the low end of the range. For some typesrange equals zero, the middle of claims, such asthe range equals 50% and the high end of the range equals 100%.

                    OneBeacon net loss and LAE reserves by line of business


                    (expressed as a percentage of the range)

                     December 31,
                     
                     2007
                     2006
                     
                    Workers compensation 42%29%
                    Personal automobile liability 51 81 
                    Multiple peril 47 24 
                    Commercial automobile liability 47 33 
                    General liability 72 75 
                    Homeowners/Farmowners 91 93 
                    Other 82 91 


                    Total 57%50%


                            During 2007, management saw increasing consistency in the actuarial methods which were used to develop the range of reserves for certain long tailed lines of business. As a result, management selected point estimates higher in the range and closer to the middle of the range for workers compensation, commercial automobile liability and construction defect,multiple peril. Additionally in 2007, management also considered special purpose forecasting models that its claims and actuarial staff have created that consider the unique loss development characteristics of these types of claims.continued to see favorable trends in some newer and/or growing segments relative to initial expectations. For personal automobile liability,this resulted in selecting a reserve lower in the range and closer to the middle of the range. For homeowners and "other" (principally shorter


                    tailed lines of business such as ocean and inland marine insurance) recorded reserves remain ratherat the high in theend of their respective ranges, as management's selections reflect a conservative approach to recognition of recent favorable incurred loss development experiencedpatterns. In general management continues to select somewhat higher in our ongoing businesses.the range for newer and/or growing segments and as those reserves become an increasing proportion of its total reserves, OneBeacon's overall selected reserves have moved up in the range.

                      Sensitivity Analysis

                            The following discussion includes disclosure of possible variations from current estimates of loss reserves due to a change in certain key assumptions. Each of the impacts described below is estimated individually, without consideration for any correlation among key assumptions or among lines of business. Therefore, it would be inappropriate to take each of the amounts described below and add them together in an attempt to estimate volatility for OneBeacon's reserves in total. It is important to note that the variations discussed are not meant to be a worst-case scenario, and therefore, it is possible that future variations may be more than amounts discussed below.

                      Workers compensation: Recorded reserves for workers compensation were $177 million at December 31, 2007. The two most important assumptions for workers compensation reserves are loss development factors and loss cost trends, particularly medical cost inflation. Loss development patterns are dependent on medical cost inflation. Approximately half of the workers compensation net reserves are related to future medical costs. Across the entire reserve base, a 0.5 point change in calendar year medical inflation would have changed the estimated net reserve by $50 million at December 31, 2007, in either direction.

                      Personal automobile liability: Recorded reserves for personal automobile liability were $444 million across all lines at December 31, 2007. Personal automobile liability reserves are shorter-tailed than other lines of business (such as workers compensation) and, therefore, less volatile. However, the size of the reserve base means that future changes in estimate could be material to OneBeacon's results of operations in any given period. A key assumption for personal automobile liability is the implicit loss cost trend, particularly the severity trend component of loss costs. A 2.0 point change in assumed annual severity for the two most recent accident years would have changed the estimated net reserve by $13 million at December 31, 2007, in either direction. Assumed annual severity for accident years prior to the two most recent accident years is likely to have minimal variability.

                      Multiple peril liability and general liability: Recorded reserves for multiple peril and general liability combined were $839 million at December 31, 2007. Reported loss development patterns are a key assumption for these lines of business, particularly for more mature accident years. Historically, assumptions on reported loss development patterns have been impacted by, among other things, emergence of new types of claims (e.g. construction defect claims) or a shift in the mixture between smaller, more routine claims and larger, more complex claims. If the severity trend for construction defect claims changed by 3.0 points this would have changed the estimated net reserve by $6 million at December 31, 2007, in either direction. Separately, if case reserve adequacy for non construction defect claims changed by 10.0 points this would have changed the estimated net reserve by $24 million at December 31, 2007, in either direction.

                      White Mountains Re

                        White Mountains Re A&E Reserves

                              White Mountains ReRe's A&E exposure is primarily from reinsurance contracts written between 1974 through 1985 by companies acquired by Folksamerica (MONY Reinsurance Company and Christiania General Insurance Company). The exposures are mostly higher layer excess of loss treaty and facultative coverages with relatively low limits exposed for each claim. Folksamerica has a specialized unit that handles claims emanating fromrelating to A&E exposures. The issues presented by these types of claims require specialization, expertise and an awareness of the various trends and jurisdictional developments.

                              White Mountains Re's A&E exposure is primarily from reinsurance contracts written between 1974 through 1985 by predecessor companies (MONY Reinsurance and Christiania General). The exposures are predominately higher layer excess of loss treaty and facultative coverages with relatively low limits exposed for each claim.developments in relevant jurisdictions. Net incurred loss activity for asbestos and environmental in the last two years was as follows:


                       December 31,
                      Net incurred loss and LAE activity

                       December 31,
                       
                      2004
                       2003

                       ($ in millions)

                      Millions

                       December 31,
                       
                       
                      Asbestos $2.6 $32.0 $51.6 $(.1)
                      Environmental .1 3.7 11.6 (.2)


                      Total $2.7 $35.7 $63.2 $(.3)


                              During 2005, White Mountains Re completed a detailed, ground-up asbestos exposure study. Comparing estimates generated by the study to Folksamerica exposed limits by underwriting year led to an increase of approximately $50 million in IBNR for asbestos during the third quarter of 2005.

                              During the fourth quarter of 2007, White Mountains Re completed another detailed, ground-up asbestos exposure study. This study was an update to the analysis first performed in 2005. The study analyzed potential exposure to loss of all insureds that had reported at least $250,000 in losses to Folksamerica through reinsurance contracts as of June 30, 2007. This analysis entailed examining total expected asbestos losses and LAE from a variety of information sources, including asbestos studies, data reported to Folksamerica and a review of historical public filings. The results of this analysis were compared to Folksamerica's reinsurance contract layers to derive an estimated expected loss. White Mountains Re also analyzed a significant sample of all other insureds that had reported losses of less than $250,000 and extrapolated the sample findings to the entire population.

                              In recentaddition, Folksamerica has received notices of claims from a number of other insureds with reported loss amounts that have not exceeded the attachment points in the reinsurance contracts written by Folksamerica. Based on the claims activity related to those insureds since the 2005 study, White Mountains Re estimated its exposure to these insureds as well as to insureds that have not reported any claims to date.

                              In the study, White Mountains Re sought to include adequate provision for future reported claims, premises/operations coverage (in addition to products liability coverage), and future adverse court decisions. To estimate this provision, White Mountains Re measured the changes in individual insured estimates from the 2005 study to the 2007 study to estimate future reported losses. The combined effect of all these estimates resulted in an increase of $52 million in IBNR asbestos losses and LAE.

                              In the fourth quarter of 2007, White Mountains Re also reviewed Folksamerica's exposure to environmental losses using industry benchmarks known as "survival ratios". The survival ratio, computed as a company's reserves divided by the average of its last three years' net loss payments, indicates approximately how many more years most of payments the current reserves can support, assuming future yearly payments are consistent with the average three-year historical levels. This analysis led to an increase of $11 million in IBNR for environmental losses and LAE in the fourth quarter of 2007.

                              White Mountains Re's reported activity in the asbestos area has related to (1) higher layer excess policies that are being reached by larger target defendants, (2) new noticesnet reserves for smaller regional defendants that are now exposed because of the larger defendant bankruptcies,A&E losses were $163 million and (3) new notices on "premises"$112 million at December 31, 2007 and "non-products" cases, where coverage is being sought by insureds against the non-aggregating portion of the underlying policy. WM Re expects to see a smaller percentage of these losses exceed the retention level under reinsurance agreements.

                              Approximately $25.0 million of2006, respectively. White Mountains Re's 2003A&E three-year survival ratio was approximately 13 years and 8 years at December 31, 2007 and 2006, respectively.


                              The following tables show gross and net loss developmentand LAE payments for asbestosA&E exposures was a bulk increase in IBNR resulting fromfor the completion of a detailed A&E market share study. This study compared White Mountains Re's share of industry paid losses to estimated industry carried reserves.years ending December 31, 2000 through December 31, 2007:

                       
                       Asbestos paid loss and LAE
                       Environmental paid loss and LAE
                      Millions

                      Year ended December 31,

                       Gross
                       Net
                       Gross
                       Net
                      2000 $4.7 $4.0 $2.3 $1.3
                      2001  10.5  6.7  1.8  1.6
                      2002  5.9  4.5  3.2  2.9
                      2003  10.7  7.4  1.7  1.1
                      2004  19.3  14.3  1.5  1.4
                      2005  11.7  12.2  4.8  4.0
                      2006  9.8  7.9  .6  .5
                      2007  12.3  10.7  2.0  1.7


                              Generally, White Mountains Re sets up claim files for each reported claim by each cedent for each individual insured. In many instances, a single claim notification from a cedent could involve several years and layers of coverage resulting in a file being set up for each involvement. Precautionary claim notices are submitted by the ceding companies in order to preserve their right to pursue coverage under the reinsurance contract. Such notices do not contain an incurred loss amount to White Mountains Re, accordingly,amount. Accordingly, an open claim file is not established. As of December 31, 2004,2007, White Mountains Re had approximately 1,3681,198 open claim files for asbestos and 786290 open claim files for environmental exposures.

                              The costs associated with administering the underlying A&E claims by White Mountains Re's clients tend to be higher than non-A&E claims due to generally higher legal costs incurred by ceding companies in connection with A&E claims ceded to White Mountains Re under the reinsurance contracts.


                        White Mountains Re A&E Claims Activity

                              White Mountains Re's A&E claim activity for the last two years is illustrated in the table below.


                       Year ended
                      December 31,

                        Year ended December 31,
                       
                      A&E Claims Activity

                        
                      2004
                       2003
                        2007
                       2006
                       
                      Asbestos          
                      Total asbestos claims at the beginning of the year 1,185 1,069  1,173 1,339 
                      Incoming asbestos claims due to Sirius Acquisition 199  
                      Outgoing asbestos claims due to Sirius America divestiture  (20)
                      Incoming asbestos claims due to Stockbridge acquisition  45 
                      Asbestos claims reported during the year 292 224  223 186 
                      Asbestos claims closed during the year (308)(108) (198)(377)


                      Total asbestos claims at the end of the year 1,368 1,185  1,198 1,173 


                      Environmental          
                      Total environmental claims at the beginning of the year 743 768  512 750 
                      Incoming environmental claims due to Sirius Acquisition 106  
                      Incoming environmental claims due to Stockbridge acquisition  43 
                      Environmental claims reported during the year 138 47  26 46 
                      Environmental claims closed during the year (201)(72) (248)(327)


                      Total environmental claims at the end of the year 786 743  290 512 


                      Total          
                      Total A&E claims at the beginning of the year 1,928 1,837  1,685 2,089 
                      Incoming A&E claims due to Sirius Acquisition 305  
                      Outgoing A&E claims due to Sirius America divestiture  (20)
                      Incoming A&E claims due to Stockbridge acquisition  88 
                      A&E claims reported during the year 430 271  249 232 
                      A&E claims closed during the year (509)(180) (446)(704)


                      Total A&E claims at the end of the year 2,154 1,928  1,488 1,685 


                        Loss and LAE Reserves by Class of Business

                              White Mountains Re establishes loss and LAE reserves that are estimates of amounts needed to pay claims and related expenses in the future for reinsured events that have already occurred. The estimation of net reinsurance loss and LAE reserves is subject to the same risk as the estimation of insurance loss and LAE reserves. In addition to those risk factors which give rise to inherent uncertainties in establishing insurance loss and LAE reserves, the inherent uncertainties of estimating such reserves are even greater for the reinsurer, due primarily to: (1) the claim-tail for reinsurers being further extended because claims are first reported to the cedingoriginal primary insurance company and then through one or more intermediary insurersintermediaries or reinsurers, (2) the diversity of loss development patterns among different types of reinsurance treaties or facultative contracts, (3) the necessary reliance on the ceding companies for information regarding reported claims and (4) the differing reserving practices among ceding companies.

                              As with insurance reserves, the process of estimating reinsurance reserves involves a considerable degree of judgment by management and, as of any given date, is inherently uncertain. Based on the above, such uncertainty may be larger relative to the reserve for a reinsurer compared to an insurance company, and may take a longer time to emerge.

                              In order to reduce the potential uncertainty of loss reserve estimation, White Mountains Re obtains information from numerous sources to assist in the process. White Mountains Re's pricing actuaries devote considerable effort to understanding and analyzing a ceding company's operations and loss history during the underwriting of the business, using a combination of ceding company and industry statistics. Such statistics normally include historical premium and loss data by class of business, individual claim information for larger claims, distributions of insurance limits provided, loss reporting


                      and payment patterns, and rate change history. This analysis is used to project expected loss ratios for each treaty during the upcoming contract period. These expected ultimate loss ratios are aggregated across all treaties and are input directly into the loss reserving process to generate the expected loss ratios that are used to estimate IBNR.

                              Upon notification of a loss from a ceding company, White Mountains Re establishes case reserves, including LAE reserves, based upon White Mountains Re's share of the amount of reserves established by the ceding company and ourits independent evaluation of the loss. In cases where available information indicates that reserves established by the ceding company are inadequate, White Mountains Re establishes case reserves or IBNR in excess of its share of the reserves established by the ceding company. In addition, specific claim information reported by ceding companies or obtained through claim audits can alert us to emerging trends such as changing legal interpretations of coverage and liability, claims from unexpected sources or classes of business, and significant changes in the frequency or severity of individual claims. Such information is often used to supplement estimates of IBNR.

                              As mentioned above, there can be a considerable time lag from the time a claim is reported to a ceding company to the time it is reported to the reinsurer. The lag can be several years in some cases. This lag can be due to a number of reasons, including the time it takes to investigate a claim, delays associated with the litigation process, the deterioration in a claimant's physical condition many years after an accident occurs, etc. In its loss reserving process, White Mountains Re assumes that such lags are predictable, on average, over time and therefore the lags are contemplated in the loss reporting patterns used in its actuarial methods. This means that, as a reinsurer, White Mountains Re must rely on such actuarial estimates for a longer period of time after reserves are first estimated than does a primary insurance company.

                              Backlogs in the recording of assumed reinsurance can also complicate the accuracy of loss reserve estimation. As of December 31, 2004,2007, there were no significant backlogs related to the processing of assumed reinsurance information at White Mountains Re.

                              White Mountains Re relies heavily on information reported by ceding companies, as discussed above. In order to determine the accuracy and completeness of such information, White Mountains Re's U.S.Re underwriters, actuaries, and claims personnel perform regular audits of Folksamerica'scertain ceding companies. While regularcompanies where customary. Generally, ceding company audits are not customary outside the United States, Sirius International's staff regularlyStates. In such cases, White Mountains Re reviews information from ceding companies for unusual or unexpected results. Any material findings are discussed with the ceding companies. White Mountains Re sometimes encounters situations where we determine that a claim presentation from a ceding company is not in accordance with contract terms. In these situations, White Mountains Re attempts to resolve the dispute directly with the ceding company. Most situations are resolved amicably and without the need for litigation or arbitration. However, in the infrequent situations where a resolution is not possible, White Mountains Re will vigorously defend ourits position in such disputes.

                              Although loss and LAE reserves are initially determined based on underwriting and pricing analysis, White Mountains Re constantly tests the accuracy of reserves using a variety of generally accepted actuarial methods, including historical incurred and paid loss development methods. If actual loss activity differs substantially from expectations based on historical information, an adjustment to loss reserves may be warranted. As time passes, loss reserve estimates for a given accident year will rely more on actual loss activity and historical patterns than on initial assumptions based on pricing indications.


                              White Mountains Re also obtainobtains reinsurance whereby another reinsurer contractually agrees to indemnify White Mountains Re for all or a portion of the reinsurance risks underwritten by White Mountains Re. Such arrangements, where one reinsurer provides reinsurance to another reinsurer, are usually referred to as "retrocessional reinsurance" arrangements. White Mountains Re establishes estimates of amounts recoverable from retrocessional reinsurance in a manner consistent with the loss


                      and LAE liability associated with reinsurance contracts offered to its customers (the "ceding companies"), net of an allowance for uncollectible amounts, if any. Net reinsurance loss reserves represent loss and LAE reserves reduced by retrocessional reinsurance recoverable on unpaid losses.

                              Although loss and LAE reserves are initially determined based on underwriting and pricing analyses, White Mountains Re regularly reviews the adequacy of its recorded reserves by using a variety of generally accepted actuarial methods, including historical incurred and paid loss development methods. If actual loss activity differs substantially from expectations, an adjustment to recorded reserves may be warranted. As time passes, loss reserve estimates for a given accident year will rely more on actual loss activity and historical patterns than on initial assumptions based on pricing indications.

                              White Mountains Re's expected annual loss reporting assumptions are updated at least once a year. These assumptions are applied to year-end IBNR to generate expected reported losses for the subsequent year. Interpolation methods are applied to estimate quarterly reported losses, which are then compared to actual reported losses each quarter. Significant differences may result in a change in estimates or a revision in the loss reporting pattern. Expected loss ratios underlying the current accident year are updated quarterly, to reflect new business that is underwritten by the company.

                              In 2007, White Mountains Re recorded $9 million of net unfavorable development, which consisted of $63 million related to A&E exposures, $28 million of strengthening of certain of its U.S. casualty reserves and $7 million related to surety business. This adverse development was largely offset by favorable development of $91 million, primarily on property lines from prior accident years.

                              In 2005 and 2007, White Mountains Re changed its assumptions relating to asbestos reserves, as discussed above in the A&E section. During 2006, White Mountains Re increased its estimate for net losses from hurricanes Katrina, Rita, and Wilma by $86 million following the receipt of new claims information from several ceding companies and subsequent reassessment of ultimate loss exposures. The company also entered into an indemnity agreement with Olympus, which resulted in an additional $137 million in losses and LAE. Also in 2006, White Mountains Re increased prior year loss and LAE reserves by $55 million for casualty losses associated with the Risk Capital acquisition, primarily as a result of a detailed study of loss exposure by individual contract. Reserves for 2004 and prior years were decreased by $46 million at Sirius in 2006, as White Mountains Re has seen lower than expected loss emergence across all lines of business and have reduced IBNR accordingly.

                      White Mountains Re's net loss and LAE reserves by class of business at December 31, 20042007 and 20032006 were as follows:

                       
                       December 31, 2004
                       December 31, 2003
                      Net loss and LAE reserves by class of business
                      ($ in millions)

                       Case
                       IBNR
                       Total
                       Case
                       IBNR
                       Total
                      Liability (excluding A&E) $920.4 $900.0 $1,820.4 $364.6 $276.4 $641.0
                      Property  143.3  318.0  461.3  68.5  149.0  217.5
                      Accident & Health and Other  279.5  187.5  467.0  25.9  66.4  92.3
                      A&E  50.2  24.8  75.0  35.0  44.2  79.2


                      Total $1,393.4 $1,430.3 $2,823.7 $494.0 $536.0 $1,030.0


                      Net loss and LAE reserves by class of business

                       December 31, 2007
                       December 31, 2006
                      Millions

                       Case
                       IBNR
                       Total
                       Case
                       IBNR
                       Total
                      Property catastrophe excess $224.6 $33.9 $258.5 $209.2 $61.5 $270.7
                      Property other  142.7  73.8  216.5  177.8  78.7  256.5
                      Casualty (excluding A&E)  458.2  553.6  1,011.8  507.0  646.7  1,153.7
                      Accident & health  38.4  57.8  96.2  42.8  63.9  106.7
                      Agriculture  4.5  62.7  67.2  4.6  51.7  56.3
                      Aviation and space  80.0  30.4  110.4  76.4  28.0  104.4
                      A&E  47.5  115.7  163.2  44.0  68.3  112.3
                      Other  150.7  371.4  522.1  93.3  412.2  505.5


                       Total $1,146.6 $1,299.3 $2,445.9 $1,155.1 $1,411.0 $2,566.1


                              The actuarial methods described above are used to calculate a point estimate of loss and LAE reserves for each company within White Mountains Re establishes loss reserves based on a singleRe. These point estimates are then aggregated to produce an actuarial point estimate which is management's best estimate of ultimate losses and loss expenses. This "best estimate" is derived from a combination of methods as described above.for the entire segment. Once a point estimate is established, White Mountains Re's actuaries estimate loss reserve ranges to measure the sensitivity of the actuarial assumptions used to set the point estimates. These ranges are calculated using similar methods to the point estimate calculation, but with different expected loss ratio and loss reporting pattern assumptions. For the low estimate, more optimistic loss ratios and faster reporting patterns are


                      assumed, while the high estimate uses more conservative loss ratios and slower reporting patterns. These variable assumptions are derived from historical variations in loss ratios and reporting patterns by class and type of business. Due

                              The actuarial point estimate is management's primary consideration in determining its best estimate of loss and LAE reserves. In making its best estimate, management also considers other qualitative factors that may lead to a difference between its best estimate of loss and LAE reserves and the inherent difficultiesactuarial point estimate. Typically, these factors exist when management and the company's actuaries conclude that there is insufficient historical incurred and paid loss information or that trends included in estimating ultimate A&E exposures, White Mountains Re does notthe historical incurred and paid loss information are unlikely to repeat in the future. These factors may include, among others, changes in the techniques used to assess underwriting risk, more accurate and detailed levels of data submitted with reinsurance applications, the uncertainty of the current reinsurance pricing environment, the level of inflation in loss costs, changes in ceding company reserving practices, and legal and regulatory developments. At December 31, 2007 and 2006, total carried reserves were 2.9% and 2.2% above the actuarial point estimate, ranges for these reserves. The growth in reserves from 2003 to 2004 was driven by acquisitions made during 2004.respectively.

                              The following table illustrates White Mountains Re's recorded net loss and LAE reserves and high and low estimates for those classes of business for which a range is calculated, at December 31, 2004.2007.

                       
                       December 31, 2004
                      Net loss and LAE reserves by class of business
                      ($ in millions)

                       Low
                       Recorded
                       High
                      Liability (excluding A&E) $1,670 $1,821 $1,990
                      Property  420  461  490
                      Accident & Health and Other  400  467  550


                       Sub-total $2,490 $2,749 $3,030


                      A&E     75   
                           
                         
                      Total    $2,824   
                           
                         
                      Net loss and LAE reserves by class of business

                       December 31, 2007
                      Millions

                       Low
                       Recorded
                       High
                      Property catastrophe excess $255 $258.5 $262
                      Property other  192  216.5  245
                      Casualty (excluding A&E)  794  1,011.8  1,149
                      Accident & health  84  96.2  109
                      Agriculture  60  67.2  71
                      Aviation and space  94  110.4  131
                      A&E  123  163.2  218
                      Other  455  522.1  570


                       Total $2,057 $2,445.9 $2,755


                              The probability that ultimate losses will fall outside of the rangesrange of estimates by class of business is higher for each class of business individually than it is for the sum of the estimates for all classes taken together due to the effects of diversification. While White Mountains Re has not determined the statistical probability of actual ultimate losses falling within the range, management believes that it is reasonably likely that actual ultimate losses will fall within the ranges noted above because the ranges were developed by using generally accepted actuarial methods. Although management believes reserves for White Mountains Re are reasonably stated, ultimate losses may deviate, perhaps materially, from the recorded reserve amounts and could be above the high end of the range of actuarial projections.


                      2. White Mountains Re Reinsurance Estimates

                              There is a time lag from the point when premium and related commission and expense activity is recorded by a ceding company to the point when such information is reported by the ceding company, through its reinsurance intermediary, to White Mountains Re. This time lag can vary from one to


                      several contractual reporting periods (i.e. quarterly/monthly). This lag is common in the broker market reinsurance business.business, but slightly longer when a reinsurance intermediary is involved.

                              As a result of this time lag in reporting, White Mountains Re estimates a portion of its written premium and related commissions and expenses. Given the nature of White Mountains Re's business, estimated premium balances, net of related commissions and expenses, comprise a large portion of total premium balances receivable. The estimation process begins by identifying which major accounts have not reported activity at the most recent period end. In general, premium estimates for excess of loss business are based on minimum deposit and premium information included in the contractual terms. For proportional business, White Mountains Re's estimates are derived based on a variety of factors and assumptions, including: prior reporting from the broker or ceding company, historical reporting patterns, expected premium volume based on contractual terms or ceding company reports and other correspondence and communication with underwriters, brokers, intermediaries and ceding companies. Once premium estimates are determined, related commission and expense estimates are derived using contractual terms.


                              White Mountains Re closely monitors its estimation process on a quarterly basis and adjusts its estimates as more information and actual amounts become known. There is no assurance that the amounts estimated by White Mountains Re will not deviate from the amounts reported by the ceding company or reinsurance broker.intermediary. Any such deviations are reflected in the results of operations when they become known.

                              The following table summarizes White Mountains Re's premium estimates and related commissions and expenses:

                       
                       December 31, 2004
                      Millions

                       Liability
                       Property
                       Accident &
                      Health

                       Other
                       Total
                      Gross premium estimates $150.7 $234.8 $41.9 $72.9 $500.3
                      Net premium estimates  148.5  129.1  33.6  65.5  376.7
                      Net commission and expense estimates  43.3  12.9  8.4  15.9  80.5


                      Net amount included in reinsurance balances receivable $105.2 $116.2 $25.2 $49.6 $296.2


                       December 31, 2003
                      Millions

                       Liability
                       Property
                       Accident &
                      Health

                       Other
                       Total
                      Gross premium estimates $126.6 $159.1 $22.5 $21.0 $329.2
                      Net premium estimates  126.6  75.5  22.5  10.4  235.0
                      Net commission and expense estimates  41.5  6.0  7.1  2.1  56.7


                      Net amount included in reinsurance balances receivable $85.1 $69.5 $15.4 $8.3 $178.3


                       December 31, 2007
                      Millions

                       Property Catastrophe Excess
                       Property Other
                       Casualty
                       Accident & Health
                       Agriculture
                       Aviation & Space
                       Other
                       Total
                      Gross premium estimates $32.1 $78.3 $46.7 $68.9 $69.5 $44.8 $46.7 $387.0


                      Net premium estimates $28.4 $13.1 $46.6 $56.2 $69.5 $42.2 $45.3 $301.3
                      Net commission and expense estimates  3.3  27.4  22.8  23.0  5.6  7.8  12.2  102.1


                      Net amount included in reinsurance balances receivable $25.1 $(14.3)$23.8 $33.2 $63.9 $34.4 $33.1 $199.2


                       December 31, 2006
                      Millions

                       Property Catastrophe Excess
                       Property Other
                       Casualty
                       Accident & Health
                       Agriculture
                       Aviation & Space
                       Other
                       Total
                      Gross premium estimates $25.9 $71.9 $95.9 $82.1 $51.1 $37.5 $42.8 $407.2


                      Net premium estimates $23.2 $6.3 $95.1 $68.1 $51.0 $35.7 $40.7 $320.1
                      Net commission and expense estimates  3.4  17.9  43.5  25.6  3.9  3.9  12.8  111.0


                      Net amount included in reinsurance balances receivable $19.8 $(11.6)$51.6 $42.5 $47.1 $31.8 $27.9 $209.1


                              The net amounts recorded in reinsurance balances receivable may not yet be due from the ceding company at the time of the estimate since actual reporting from the ceding company has not yet occurred. Therefore, based on the process described above, White Mountains Re believes all of its estimated balances are collectible, and as such no allowance has been recorded.


                      3. Reinsurance Transactions

                              White Mountains' insurance and reinsurance subsidiaries purchase reinsurance from time to time to protect their businesses from losses due to exposure aggregation, to manage their operating leverage ratios and to limit ultimate losses arising from catastrophic events. Amounts recoverable from reinsurers are estimated in a manner consistent with the claim liability associated with the reinsured


                      policies. Amounts related to reinsurance contracts are recorded in accordance with SFAS No. 113, "Accounting and Reporting for Reinsurance of Short-Duration and Long-Duration Contracts" ("SFAS 113").

                              In connection with the OneBeacon Acquisition, Aviva caused OneBeacon to purchase reinsurance contracts with two reinsurance companies rated "AAA" ("Extremely Strong", the highest of twenty-one ratings) by Standard & Poor's and "A++" ("Superior", the highest of fifteen ratings) by A.M. Best. One is a reinsurance cover with NICO which entitles OneBeacon to recover up to $2.5 billion in ultimate loss and LAE incurred related to A&E claims arising from business written by its predecessor prior to 1992 and 1987, respectively and certain other latent exposures. As of December 31, 2007, OneBeacon has ceded estimated incurred losses of approximately $2.1 billion to NICO under the NICO Cover. The other contract is a reinsurance cover with GRC for up to $570 million of additional losses on all claims arising from accident years 2000 and prior. As of December 31, 2007, OneBeacon has ceded estimated incurred losses of $550 million to GRC under the GRC Cover. The NICO Cover and GRC Cover, which were contingent on and occurred contemporaneously with the OneBeacon Acquisition, were put in place in lieu of a seller guarantee of loss and LAE reserves and are therefore accounted for as a seller guarantee under GAAP in accordance with Emerging Issues Task Force Topic No. D 54. NICO and GRC are wholly-owned subsidiaries of Berkshire.


                              The collectibility of reinsurance recoverables is subject to the solvency and willingness to pay of the reinsurer. The Company is selective in choosing its reinsurers, placing reinsurance principally with those reinsurers with a strong financial condition, industry ratings and underwriting ability. Management monitors the financial condition and ratings of its reinsurers on an ongoing basis. SeeNote 4—"Third Party ReinsuranceReinsurance" in the accompanying Consolidated Financial Statements for additional information on White Mountains' reinsurance programs.


                      4.    Pension and Post-Retirement Medical Plans

                              White Mountains accounts for its pension plans in accordance with SFAS No. 87, "Employers' Accounting for Pensions" ("SFAS 87") and accounts for its retiree medical plan in accordance with SFAS No. 106, "Employers' Accounting for Postretirement Benefits Other Than Pensions" ("SFAS 106"). SFAS 87 and SFAS 106 require that the cost of pension/retiree medical benefits be accrued over the period during which an employee provides service.

                              The majority of OneBeacon's pension and retiree medical plans were curtailed in the fourth quarter of 2002. The OneBeacon Pension Plan no longer adds new participants or increases benefits for existing participants. Non-vested participants already in the plan continue to vest during their employment with OneBeacon. Retirees are also eligible for medical benefits if they meet certain age and service requirements. However, due to the curtailment, the plan no longer accepts new participants. The majority of retiree medical costs are capped at defined dollar amounts, with retirees contributing the remainder.

                              The projected benefit obligation as of a particular date represents the actuarial present value of all benefits attributed by the plan's benefit formula to employee service rendered prior to that date. Therefore, future cash payments from pension and retiree medical plans are discounted using a discount rate based on published investment grade, long-term corporate bond yields. Many of the factors which are used to determine a plan's projected benefit obligation as of a particular date and the cost of pension/retiree medical benefits for a particular period are dependent upon future events, such as how long the employee and any survivors live, how many years of service the employee is expected to render and the employee's compensation in the years immediately before retirement or termination. Accordingly, the effects of such future factors are estimated. Further, since the projected benefit obligation and the periodic cost of pension/retiree medical benefits are based on actuarial present values, they are also sensitive to changes in the discount rate used to determine such amounts.

                              A hypothetical 1% increase in the discount rate would result in a decrease in pension and retiree medical projected benefit obligations of approximately $63 million. A hypothetical 1% decrease in the discount rate would result in an increase in pension and retiree medical projected benefit obligations of approximately $63 million. The impact of a hypothetical 1% change to the discount rate on periodic cost of pension/retiree medical benefits is not significant.

                              Additionally, the rate of return that is assumed on plan assets affects OneBeacon's pension expense during a particular period. Since the retiree medical plan is unfunded, it is not affected by changes in the rate of return assumption. OneBeacon performed an analysis of expected long-term rates of return based on the allocation of its pension plan assets as of both December 31, 2004 and December 31, 2003 to develop expected rates of return for each significant asset class or economic indicator. A range of returns was developed based both on forecasts and on broad-market historical benchmarks for expected return, correlation, and volatility for each asset class. Although the expected investment return assumption is long-term in nature, the range of reasonable returns has dropped over the past few years as a consequence of lower inflation and lower bond yields. As a result of the most


                      recent review, for 2004 OneBeacon elected to keep the expected return on its pension assets at 7.0%, as was used in 2003. At December 31, 2004, 36% of plan assets were invested in fixed maturity securities, 45% in equities and the remainder in cash, cash equivalents and convertible securities. A hypothetical 1% increase or decrease in the assumed rate of return would result in a pretax change in OneBeacon's pension expense (or income as the case may be) for 2004 of approximately $4.7 million.

                              During 2004, OneBeacon recognized pension expense of $3.3 million, which was comprised of net periodic benefit cost of $.4 million and special termination benefits of $2.9 million. Included in the net periodic benefit cost is $32.2 million of expected return on pension plan assets. OneBeacon contributed $4.2 million to the pension plan in 2004. No unrecognized losses on pension assets were recorded since the Company uses the market value method to value plan assets.


                      5. Purchase Accounting

                              When White Mountains acquires another company, management must estimate the fair values of the assets and liabilities acquired, as prescribed by SFAS No. 141, "Business Combinations" ("SFAS 141").Combinations." Certain assets and liabilities require little judgment to estimate their fair values, particularly those that are quoted on a market exchange, such as publicly-traded investment securities. Other assets and liabilities, however, require a substantial amount of judgment to estimate their fair values. The most significant of these is the estimation required to fair value loss and LAE reserves.

                      White Mountains estimates the fair value of loss and LAE reserves obtained in an acquisition following the principles contained within FASB Statement of Financial Accounting Concepts No. 7: "Using Cash Flow Information and Present Value in Accounting Measurements" ("CON 7"). Under CON 7, the fair value of a particular asset or liability essentially contains five elements: (1) an estimate of the future cash flows,flows; (2) expectations about possible variations in the amount or timing of those cash flows; (3) the time value of money, represented by the risk-free rate of interest; (4) the price for bearing the uncertainty inherent in the asset or liability; and (5) other, sometimes unidentifiable, factors including illiquidity and market imperfections.

                              White Mountains' actuaries estimate the fair value of loss and LAE reserves obtained in an acquisition by taking the acquired company's recorded reserves and discounting them based on expected reserve payout patterns using the current risk-free rate of interest. Then, White Mountains' actuaries develop additional cash flow scenarios that use different payout and ultimate reserve assumptions deemed to be reasonably possible based upon the inherent uncertainties present in determining the amount and timing of payment of such reserves. In each scenario, the risk-free rate of interest is used to discount future cash flows. These scenarios are put in a statistical model that assigns a probability to each cash flow scenario. White Mountains' actuaries then choose the scenario that best represents the price for bearing the uncertainty inherent within the acquired company's recorded reserves. The "price" for bearing the uncertainty inherent within the acquired company's reserves is measured as the difference between the selected cash flow scenario and the expected cash flow scenario. The scenario selected has typically been between 1.5 and 2 standard deviations from the expected cash flow outcome. The fair value of the acquired company's loss and LAE reserves is determined to be the sum of the expected cash flow scenario (i.e., the acquired company's discounted loss and LAE reserves) and the uncertainty "price".

                              The difference between an acquired company's loss and LAE reserves and White Mountains' best estimate of the fair value of such reserves at the acquisition date is amortized ratably over the payout period of the acquired loss and LAE reserves. Historically, the fair value of an acquired company's loss and LAE reserves has been less than the it's recordedits nominal reserves at acquisition. Accordingly, the amortization has been and will continue to be recorded as an expense on White Mountains' income statement until fully amortized.


                      FORWARD-LOOKING STATEMENTS

                              The information contained in this report may contain "forward-looking statements" within the meaning of Section 27A of the Securities Act of 1933 and Section 21E of the Securities Exchange Act of 1934. All statements, other than statements of historical facts, included or referenced in this report which address activities, events or developments which White Mountains expects or anticipates will or may occur in the future are forward-looking statements. The words "will", "believe," "intend," "expect," "anticipate," "project," "estimate," "predict" and similar expressions are also intended to identify forward-looking statements. These forward-looking statements include, among others, statements with respect to White Mountains':Mountains:

                        growth in book value per share or return on equity;

                        business strategy;

                        financial and operating targets or plans;

                        incurred losses and the adequacy of its loss and LAE reserves;reserves and related reinsurance;

                        projections of revenues, income (or loss), earnings (or loss) per share, dividends, market share or other financial forecasts;

                        expansion and growth of its business and operations; and

                        future capital expenditures.

                              These statements are based on certain assumptions and analyses made by White Mountains in light of its experience and perception of historical trends, current conditions and expected future developments, as well as other factors believed to be appropriate in the circumstances. However, whether actual results and developments will conform with its expectations and predictions is subject to a number of risks and uncertainties that could cause actual results to differ materially from expectations, including:

                        the risks associated with Item 1A of this Report on Form 10-K;

                        claims arising from catastrophic events, such as hurricanes, earthquakes, floods or terrorist attacks;

                        the continued availability of capital and financing;

                        general economic, market or business conditions;

                        business opportunities (or lack thereof) that may be presented to it and pursued;

                        competitive forces, including the conduct of other property and casualty insurers and reinsurers;

                        changes in domestic or foreign laws or regulations, or their interpretation, applicable to White Mountains, its competitors or its clients;

                        an economic downturn or other economic conditions adversely affecting its financial position;

                        recorded loss reserves established subsequently proving to have been inadequate; and

                        other factors, most of which are beyond White Mountains' control.

                              Consequently, all of the forward-looking statements made in this report are qualified by these cautionary statements, and there can be no assurance that the actual results or developments anticipated by White Mountains will be realized or, even if substantially realized, that they will have the expected consequences to, or effects on, White Mountains or its business or operations. White Mountains assumes no obligation to update publicly any such forward-looking statements, whether as a result of new information, future events or otherwise.


                      Item 7A.    Quantitative and Qualitative Disclosures About Market Risk

                              White Mountains' consolidated balance sheet includes a substantial amount of assets and liabilities whose fair values are subject to market risk. The term market risk refers to the risk of loss arising from adverse changes in interest rates and other relevant market rates and prices. Due to White Mountains' sizable balances of interest rate sensitive instruments, market risk can have a significant effect on White Mountains' consolidated financial position.


                      Interest Rate Risk

                              Fixed Maturity Portfolio.    In connection with the Company's consolidated insurance and reinsurance subsidiaries, White Mountains invests in interest rate sensitive securities, primarily debt securities. White Mountains' strategy is to purchase fixed maturity investments that are attractively priced in relation to perceived credit risks. White Mountains' fixed maturity investments are held as available for sale in accordance with SFAS No. 115, "Accounting for Certain Investments in Debt and Equity Securities" ("SFAS 115"), whereby these investments are carried at fair value on the balance sheet with net unrealized gains or losses reported net of tax in a separate component of common shareholders' equity. White Mountains generally manages its interest rate risk associated with its portfolio of fixed maturity investments by monitoring the average duration of the portfolio, which allows White Mountains to achieve an adequate yield without subjecting the portfolio to an unreasonable level of interest rate risk. White Mountains' fixed maturity portfolio is comprised of primarily investment grade corporate securities, U.S. government and agency securities, municipal obligations and mortgage-backed securities (e.g., those receiving an investment grade rating from S&PStandard & Poor's or Moody's).

                              Increases and decreases in prevailing interest rates generally translate into decreases and increases in fair values of fixed maturity investments, respectively. Additionally, fair values of interest rate sensitive instruments may be affected by the credit worthinesscreditworthiness of the issuer, prepayment options, relative values of alternative investments, the liquidity of the instrument and other general market conditions.

                              The table below summarizes the estimated effects of hypothetical increases and decreases in market interest rates on White Mountains' fixed maturity portfolio and fixed maturity investments in the pension plan.

                      $ in millions

                       Fair Value at
                      December 31,
                      2004

                       Assumed Change in
                      Relevant Interest Rate

                       Estimated Fair Value
                      After Change in
                      Interest Rate

                       After-Tax Increase
                      (Decrease) in Carrying
                      Value

                       
                      ($ in millions)

                       Fair Value at December 31, 2007
                       Assumed Change in Relevant Interest Rate
                       Estimated Fair Value After Change in Interest Rate
                       After-Tax Increase (Decrease) in Carrying Value
                       
                      Fixed maturity investments $7,900.0 100 bp decrease $8,110.6 $142.8  $7,371.5 100 bp decrease $7,523.4 $104.3 
                          50 bp decrease 8,005.8 71.7    50 bp decrease 7,444.7 50.2 
                          50 bp increase 7,795.8 (70.7)   50 bp increase 7,280.7 (62.6)
                          100 bp increase 7,706.0 (132.1)   100 bp increase 7,195.4 (121.2)
                      Pension fixed maturity investments $259.4 100 bp decrease $267.5 $5.3 
                       

                      $

                      40.9


                      100 bp decrease


                      $

                      42.3


                      $

                      ..9

                       
                          50 bp decrease 263.5 2.7    50 bp decrease 41.6 .5 
                          50 bp increase 255.3 (2.7)   50 bp increase 40.2 (.5)
                          100 bp increase 251.2 (5.3)   100 bp increase 39.5 (.9)

                              Long-term obligations.    As of December 31, 2004,2007, White Mountains' interest and dividend bearing long-term obligations consisted primarily of the Fund American Senior Notes, WMRe Senior Notes, the WMRe Preference Shares and the Berkshire and Zenith Preferred Stock, obligations, which have fixed interest and dividend rates. As a result, White MountainsMountains' exposure to interest rate risk resulting from variable interest rate obligations is insignificant.was insignificant as of December 31, 2007.


                              The Senior Notes were issued in 2003following table summarizes the fair value and mature on May 15, 2013. At December 31, 2004, the faircarrying value of White Mountains' Senior Notes was approximately $714 million, which compared to a carrying valuefinancial instruments as of $698 million.


                              The Berkshire and Zenith Preferred Stock obligations were issued in 2001 and mature on May 31, 2008 and May 31, 2011, respectively. At the Company's option, the Zenith Preferred Stock may be redeemed on June 30, 2007. At December 31, 2004, the fair values of the Berkshire and Zenith Preferred Stock were approximately $341 million and $23 million, respectively, which compared to carrying values of $192 million and $20 million, respectively.2007:

                       
                       December 31, 2007
                      Millions

                       Fair Value
                       Carrying Value
                      Senior Notes $703.2 $698.9
                      WMRe Senior Notes  398.3  398.9
                      WMRe Preference Shares(1)  219.4  250.0
                      Berkshire Preferred Stock  307.0  278.3


                          (1)
                          WMRe Preference Shares are recorded as minority interest.

                              The fair values of these obligations were estimated by discounting future cash flows using current market rates for similar obligations or using quoted market prices.


                      Mortgage Note on Real Estate Owned.
                          In December 2005, OneBeacon entered into a $41 million, 18-year mortgage note, which has a variable interest rate based upon the lender's 30-day LIBOR rate, to purchase land and its U.S. headquarters building in Canton, Massachusetts. As of December 31, 2007, OneBeacon had drawn down the entire $41 million available under the mortgage note. Repayment will commence on January 31, 2009.

                              Concurrent with entering into the mortgage note, OneBeacon also entered into an interest rate swap to hedge its exposure to variability in the interest rate on the mortgage note. The notional amount of the swap is equal to the debt outstanding on the mortgage note and will be adjusted to match the drawdowns and repayments on the mortgage note so that the principal amount of the mortgage note and the notional amount of the swap are equal at all times. Under the terms of the swap, OneBeacon pays a fixed interest rate of approximately 6% and receives a variable interest rate based on the same LIBOR index used for the mortgage note. As a result, OneBeacon's exposure to interest rate risk resulting from variable interest rate obligations was insignificant as of December 31, 2007.

                      Equity Price Risk

                              The carrying values of White Mountains' common equity securities and its other investments are based on quoted market prices or management's estimates of fair value (which is based, in part, on quoted market prices) as of the balance sheet date. Market prices of common equity securities, in general, are subject to fluctuations which could cause the amount to be realized upon sale or exercise of the instruments to differ significantly from the current reported value. The fluctuations may result from perceived changes in the underlying economic characteristics of the investee, the relative price of alternative investments, general market conditions and supply and demand imbalances for a particular security.


                      Foreign Currency Exchange Rates
                      Risk

                              White Mountains' foreign assets and liabilities are valued using period-end exchange rates and its foreign revenues and expenses are valued using average exchange rates. Foreign currency exchange rate risk is the risk that White Mountains will incur losses on a U.S. Dollardollar basis due to adverse changes in foreign currency exchange rates.

                              At December 31, 2004,2007, OneBeacon held approximately $384$241 million in bonds denominated in foreign currencies, mostly those denominated in British Pounds.Pounds and Australian dollars. Assuming a hypothetical 10% increase or decrease in the rate of exchange from the British Pound and Australian dollar to the U.S. Dollardollar as of December 31, 2004,2007, the carrying value of OneBeacon's foreign currency-denominated bond portfolio would have respectively decreased or increased by approximately $37$24 million.

                              As a result of the Sirius Acquisition during 2004, White Mountains has a higher concentration of assets, liabilities, revenues and expenses denominated in foreign currencies than in prior periods.        The functional currency of Sirius International is the Swedish Krona. Assuming a hypothetical 10% increase or decrease in the rate of exchange from the Swedish Krona to the U.S. Dollardollar as of December 31, 2004,2007, the carrying value of White Mountains' net assets denominated in Swedish KronorKrona would have respectively decreased or increased by approximately $40$62 million.

                      Weather Derivative Risk

                              Weather derivatives, which can be structured as either swaps or options, are typically purchased by corporations and governments exposed to volatility in earnings due to variable weather. Weather derivatives are products with financial settlements linked to an underlying index that measures a quantifiable weather element such as temperature, precipitation, snowfall and windspeed, typically over the course of a six-month summer or winter season.

                              Weather contingent derivative products are weather derivatives with an additional commodity trigger. Due to the dual trigger nature, weather contingent products are usually in the form of a call or put option. For example, a temperature contingent gas call may pay a client if temperatures are colder than an agreed upon trigger and natural gas prices are above a second trigger.


                              Galileo manages its exposure to weather and market risks based on guidelines established by senior management. Galileo manages its weather and weather contingent portfolio through the employment of a variety of strategies. These strategies include geographical diversification of risk exposures and economic hedging within the over-the-counter and exchange traded weather and commodity derivative markets. Additionally, Galileo may economically hedge protions of its risk exposure by buying and selling similar weather risk contracts with different counterparties. For example, Galileo may sell an option to protect a customer if it becomes too cold in a certain location and then purchase an option from another counterparty that pays Galileo if it becomes too cold in that same location. Galileo may also diversify its risk exposure by entering into contracts that protect different clients with opposite exposures to the same quantifiable weather element. For example, Galileo may sell an option to protect a customer if it becomes too cold in a certain location and then sell another option that protects a different customer if it becomes too warm in that same location. Risk management is undertaken on a portfolio-wide basis, to maintain a portfolio that Galileo believes is well diversified and that remains within the aggregate risk tolerance established by senior management.

                              Galileo uses value-at-risk ("VaR") analysis to monitor the risks associated with its weather derivative contracts. VaR is a tool that measures the potential loss that could occur over a defined period of time, calculated at a given statistical confidence level. Galileo's portfolio VaR analyses are calculated using a Monte Carlo simulation model that uses historical weather data, actual weather data since each contract's inception, forecasted weather conditions and prevailing market rates as inputs. Galileo performs a VaR analysis for each of its portfolios using both a seasonal and 20-day holding period. The average, low and high of amounts produced by Galileo's 20 day VaR analyses performed during the period ended December 31, 2007, calculated at a 99% confidence level, were approximately $4 million, $1 million, and $9 million, respectively. The average, low and high of amounts produced by Galileo's 20 day VaR analyses performed during the period ended December 31, 2006, calculated at a 99% confidence level, were approximately $3 million, zero, and $8 million, respectively.

                      Variable Annuity Guarantee Risk

                              White Mountains entered into an agreement to reinsure death and living benefit guarantees associated with certain variable annuities issued in Japan. The reinsurance agreement assumes risk related to a shortfall between the account value and the guaranteed value that must be paid by the ceding company to an annuitant or to an annuitant's beneficiary in accordance with the underlying annuity contracts. Generally, the liabilities associated with these guarantees increase with declines in the equity markets, interest rates and currencies against the Japanese Yen, as well as with increases in market volatilities. The liability is also affected by annuitant-related actuarial assumptions, including surrender and mortality rates. At December 31, 2007, the total liability for the reinsured variable annuity guarantees was $13 million.

                              White Mountains purchases derivative instruments, including futures and over-the counter option contracts on interest rates, major equity indices, and foreign currencies, to mitigate the risks associated with changes in the fair value of the reinsured variable annuity guarantees. At December 31, 2007, the fair value of these derivative instruments was $44 million.

                              White Mountains measures its net exposure to changes in relevant interest rates, foreign exchange rates and equity markets on a daily basis and adjusts its economic hedge positions within risk guidelines established by senior management. At December 31, 2007, White Mountains' modeled net exposure to a 10% change in each of these factors were as follows:

                       
                       ($ in millions)
                       
                      Change

                       Equity Markets
                       Interest Rates
                       Foreign Exchange Rates Against the Japanese Yen
                       
                      +10 Percent $ $1.0 $(2.1)
                      –10 Percent  (3.0) (1.0) (4.4)

                              White Mountains also monitors the effects of annuitant-related experience against actuarial assumptions (including surrender and mortality rates) on a weekly basis and adjusts relevant assumptions and economic hedge positions if required. While White Mountains actively manages its economic hedge positions, several factors, including policyholder behavior and mismatches between underlying variable annuity funds and the hedge indices, may result in economic hedge ineffectiveness.


                      Item 8.    Financial Statements and Supplementary Data

                              The financial statements and supplementary data have been filed as a part of this Annual Report on Form 10-K as indicated in the Index to Consolidated Financial Statements and Financial Statement Schedules appearing on page 88104 of this report.


                      Item 9.    Changes in and Disagreements withWith Accountants on Accounting and Financial Disclosure

                              None.


                      Item 9A.    Controls and Procedures

                              The Principal Executive Officer ("PEO") and the Principal Financial Officer ("PFO") of White Mountains have evaluated the effectiveness of its disclosure controls and procedures (as defined in Rule 13a-15(e) of the Exchange Act) as of December 31, 2004.2007. Based on that evaluation, the PEO and


                      PFO have concluded that White Mountains' disclosure controls and procedures are adequate and effective.

                              The PEO and the PFO of White Mountains have evaluated the effectiveness of its internal control over financial reporting as of December 31, 2004.2007. Based on that evaluation, the PEO and PFO have concluded that White Mountains' internal control over financial reporting is effective. Management's annual report on internal control over financial reporting is included on page F-71F-66 of this report. The attestation report on management's assessmentthe effectiveness of itsour internal control over financial reporting by PricewaterhouseCoopers LLP is containedincluded on page F-72F-67 of this report.

                              There havehas been no significant changeschange in White Mountains' internal controls over financial reporting that occurred during the fourth quarter of 2007 that has materially affected, or in factors that could significantlyis reasonably likely to materially affect White Mountains' internal controls, subsequent to their most recent evaluation of such controls.control over financial reporting.


                      Item 9B.    Other Information

                              None.


                      PART III

                      Item 10.    Directors, and Executive Officers and Corporate Governance

                        a.
                        Directors

                              Reported under the caption "Electioncaptions "The Board Of Directors", "Section 16(a) Beneficial Ownership Reporting Compliance" and "Corporate Governance—Committees of the Company's Directors" ofBoard—Audit Committee" in the Company's 20052008 Proxy Statement, herein incorporated by reference.

                        b.
                        Executivereference, and under the caption "Executive Officers

                              Reported of the Registrant" in Part I pursuant to General Instruction G toof this Annual Report on Form 10-K.

                        c.

                        Audit Committee Financial Expert

                              Reported under the caption "Committees of the Board—Audit Committee" of the Company's 2005 Proxy Statement, herein incorporated by reference.

                        d.
                        Code of Business Conduct and Ethics

                              The Company's Code of Business Conduct, which applies to all directors, officers and employees in carrying out their responsibilities to and on behalf of the Company, has been filed hereinis available atwww.whitemountains.com and is included as Exhibit 14.

                        e.
                        Compliance with Section 16(a)14 to the Company's 2004 Annual Report on Form 10-K. The Company's Code of Business Conduct is also available in print free of charge to any shareholder upon request.

                                There have been no material changes to the Exchange Act

                              Reportedprocedures by which shareholders may recommend nominees to the Company's Board of Directors. The procedures for shareholders to nominate directors are reported under the caption "Compliance with Section 16(a)"Corporate Governance—Committees of the Exchange Act" ofBoard—Nominating and Governance Committee" in the Company's 20052008 Proxy Statement, herein incorporated by reference.


                      Item 11.    Executive Compensation

                              Reported under the captions "Compensation of Executive Officers", "Reports of the"Executive Compensation" and "Corporate Governance—Compensation Committee on Executive Compensation", "Member Return Graph"Interlocks and "Compensation Plans" ofInsider Participation" in the Company's 20052008 Proxy Statement, herein incorporated by reference.


                      Item 12.    Security Ownership of Certain Beneficial Owners and Management and Related Stockholder Matters

                              Reported under the captions "Voting Securities and Principal Holders Thereof" and "Equity Compensation Plan Information" in the Company's 2008 Proxy Statement, herein incorporated by reference.

                      Item 13.    Certain Relationships, Related Transactions and Director Independence

                              Reported under the caption "Voting Securities"Transactions with Related Persons, Promoters and Principal Holders Thereof" ofCertain Control Persons" and "Corporate Governance—Director Independence" in the Company's 20052008 Proxy Statement, herein incorporated by reference.


                      Item 13.    Certain Relationships and Related Transactions

                              Reported under the captions "Other Compensation Arrangements", "Certain Relationships and Related Transactions" and "Compensation Committee Interlocks and Insider Participation in Compensation Decisions" of the Company's 2005 Proxy Statement, herein incorporated by reference.


                      Item 14.    Principal AccountantAccounting Fees and Services

                              Reported under the caption "Independent Registered Public"Principal Accountant Fees and Services" ofin the Company's 20052008 Proxy Statement, herein incorporated by reference.


                      PART IV

                      Item 15.    Exhibits and Financial Statement Schedules and Reports on Form 8-K

                        a.

                        Documents Filed as Part of the Report


                              The financial statements and financial statement schedules and reports of independent auditors have been filed as part of this Annual Report on Form 10-K as indicated in the Index to Consolidated Financial Statements and Financial Statement Schedules appearing on page 88104 of this report. A listing of exhibits filed as part of the report appear on pages 83101 through 85102 of this report.


                        b.

                        Exhibits


                      Exhibit number

                      Name
                      2Plan of Reorganization (incorporated by reference herein to the Company's Registration Statement on S-4 (No. 333-87649) dated September 23, 1999)

                      3.1


                      Memorandum of Continuance of the Company (incorporated by reference herein to Exhibit (3)(I) of the Company's Current Report on Form 8-K dated November 1, 1999)
                      3.2Bye-Laws of the Company (incorporated by reference herein to Annex III of the Company's Registration Statement on Form S-4 (No. 333-87649) dated September 23, 1999)

                      3.24.1


                      Bye-Laws of the Company (incorporated by reference herein to the Company's Registration Statement on S-4 (No. 333-87649) dated September 23, 1999)

                      4


                      Amended and Restated Certificate of Designation of Series A Preferred Stock of Fund American (incorporated by reference herein to Exhibit 99.1 of the Company's Report on Form 8-K dated December 3, 2004)

                      4.2
                      Form of Senior Indenture (incorporated by reference herein to the Company's Registration Statement on S-3 (No. 333-88352) dated July 17, 2003)
                      4.3Fiscal Agency Agreement between White Mountains Re Group, Ltd. as Issuer and The Bank of New York as Fiscal Agent (incorporated by reference herein to Exhibit 4.1 of the Company's Report on Form 8-K dated March 14, 2007)
                      4.4Certificate of Designation, setting forth the designations, powers, preferences and rights of the WMRe Preference Shares (incorporated by reference herein to Exhibit 3.1 of the Company's Report on Form 8-K dated May 29, 2007)
                      10.1

                      Amendment Agreement dated as of November 30, 2004, between General Reinsurance Corporation, a Delaware corporation, the Company and Fund American (incorporated by reference herein to Exhibit 99.2 of the Company's Report on Form 8-K dated December 3, 2004)

                      10.2


                      Keep-Well Agreement, dated as of November 30, 2004, by and between the Company and Fund American (incorporated by reference herein to Exhibit 99.3 of the Company's Report on Form 8-K dated December 3, 2004)

                      10.3


                      Stock Purchase$475,000,000 Credit Agreement, bydated June 19, 2007 among the Company, as the Borrower, Bank of America, N.A., as Administrative Agent, Swing Line Lender and among Safeco Corporation, General America Corporation, The Company, Occum Acquisition Corp. dated as of March 31, 2004Issuing Lender, and the other lenders party hereto. (incorporated by reference herein to Exhibit 10 of the Company's Report on Form 8-K dated March 15, 2004)

                      10.4


                      $400,000,000 Credit Agreement, dated as of August 26, 2004, among the Company and Fund American, as the borrowers, the several lenders from time to time parties hereto, JP Morgan Chase Bank, as Syndication Agent, and Bank of America, NA as Administrative Agent. (incorporated by reference herein to Exhibit 1010.2 of the Company's Report on Form 10-Q dated NovemberAugust 2, 2004)2007)
                      10.4$75,000,000 Credit Agreement, dated as of November 14, 2006 among Fund American as the Borrower, OneBeacon Insurance Group, Ltd., as Parent, Bank of America, N.A., as Administrative Agent, Swing Line Lender and Issuing Lender, and the other lenders party hereto. (incorporated by reference herein to Exhibit 10.4 of the Company's 2006 Annual Report on Form 10-K)


                      10.5


                      Adverse Development Agreement of Reinsurance No. 8888 between Potomac Insurance Company and GRC dated April 13, 2001 (incorporated by reference herein to Exhibit 99(m) of the Company's Report on Form 8-K dated June 1, 2001)

                      10.6


                      Adverse Development Agreement of Reinsurance between NICO (and certain of its affiliates) and Potomac Insurance Company dated April 13, 2001 and related documents (incorporated by reference herein to Exhibits 99(n)99 (n), 99(o), 99(p) and 99(q) of the Company's Report on Form 8-K dated June 1, 2001)

                      10.7


                      Purchase Agreement between ABB Holding AG, as Seller, and Fund American Holdings AB, as Purchaser, dated December 8, 2003 (incorporated by reference herein to Exhibit 99(a) of the Company's Report on Form 8-K dated December 8, 2003)

                      10.8


                      Subscription Agreement among Berkshire, Fund American and the Registrant dated May 30, 2001 (incorporated by reference herein to Exhibits 99(t) of the Company's Report on Form 8-K dated June 1, 2001)

                      10.910.8


                      Master Agreement by and among the Company, OneBeacon and Liberty Mutual including the Liberty RRA and related documents (incorporated by reference herein to Exhibits 99(d), 99(e), 99(f), 99(g) and 99(h) of the Company's Report on Form 8-K dated November 1, 2001)

                      10.1010.9


                      Folksamerica Holding Company, Inc. Long-Term Incentive Plan—2003Investment Management Agreement between Prospector Partners, LLC and Prior (*)

                      10.11


                      White Mountains Re Group, Ltd. Long-Term Incentive Unit Plan (*)

                      10.12


                      Folksamerica Holding Company, Inc. White Mountains Performance Share PlanAdvisors LLC (incorporated by reference herein to Exhibit 10(s)99.1 of the Company's 2002Report on Form 8-K dated June 20, 2005)
                      10.10Amendment to the Investment Management Agreement between Prospector Partners, LLC and White Mountains Advisors, LLC dated February 23, 2006 (incorporated by reference herein to the Company's Report on Form 8-K dated February 28, 2006)
                      10.11Investment Management Agreement between Prospector Partners, LLC and OneBeacon dated November 14, 2006 (incorporated by reference herein to Exhibit 10.11 of the Company's 2006 Annual Report on Form 10-K)

                      10.1310.12


                      Consulting Letter Agreement between Prospector Partners, LLC and White Mountains Re Group Ltd./Folksamerica 2004 Bonus Plan (*)Advisors LLC (incorporated by reference herein to Exhibit 99.2 of the Company's Report on Form 8-K dated June 20, 2005)

                      10.1410.13


                      Folksamerica Holding Company, Inc. Voluntary Deferred Compensation Plan (*)(incorporated by reference herein to Exhibit 10.14 of the Company's 2004 Annual Report on Form 10-K)

                      10.1510.14


                      Folksamerica Holding Company, Inc. Deferred Benefit Plan (*)(incorporated by reference herein to Exhibit 10.15 of the Company's 2004 Annual Report on Form 10-K)

                      10.1610.15


                      White Mountains Long-Term Incentive Plan as amended, (incorporated by reference herein to Appendix IExhibit 10.15 of the Company's Notice of 20032006 Annual General Meeting of Shareholders and Proxy Statement dated April 7, 2003)Report on Form 10-K)

                      Exhibit number

                      Name

                      10.1710.16


                      White Mountains Bonus Plan (*)(incorporated by reference herein to Exhibit 10.17 of the Company's 2004 Annual Report on Form 10-K)

                      10.1810.17


                      The Company's Voluntary Deferred Compensation Plan (incorporated by reference herein to Exhibit 4(c) of the Company's Report on Form S-8 dated October 19, 1999)

                      10.1910.18


                      White Mountains Insurance Group Deferred Compensation Plan (incorporated by reference herein to Exhibit 10.14 of the Company's 2003 Annual Report on Form 10-K)

                      10.2010.19


                      Fund American Deferred Compensation Plan (incorporated by reference herein to Exhibit 10.15 of the Company's 2003 Annual Report on Form 10-K)

                      10.2110.20


                      OneBeacon Insurance Performance Unit Plan (incorporated by reference herein to Exhibit 10.1610.20 of the Company's 20032006 Annual Report on Form 10-K)

                      10.2210.21


                      OneBeacon Insurance Supplemental2006 Management Incentive Plan (incorporated by reference herein to Exhibit 4(c)10.21 of the Company's 2006 Annual Report on Form S-8 dated August 27, 2001)10-K)

                      10.2310.22


                      OneBeacon's 2004 Management Incentive Plan (*)


                      10.24


                      OneBeacon Insurance Deferred Compensation Plan (incorporated by reference herein to Exhibit 10.18 of the Company's 2003 Annual Report on Form 10-K)

                      10.2510.23


                      Employment Agreement dated January 1, 2001 among John D. Gillespie and Fund American Companies, Inc.OneBeacon Phantom WTM Share Plan (incorporated by reference herein to Exhibit 10(y)10.23 of the Company's 20012006 Annual Report on Form 10-K)

                      10.24
                      OneBeacon Long-Term Incentive Plan (incorporated by reference herein to Exhibit 10.24 of the Company's 2006 Annual Report on Form 10-K)
                      10.25OneBeacon Insurance Group, Ltd. Non-Qualified Stock Option Agreement for T. Michael Miller (incorporated by reference herein to Exhibit 10.25 of the Company's 2006 Annual Report on Form 10-K)
                      10.26

                      Amended and Restated Revenue Sharing Agreement among John D. Gillespie, Fund American Companies, Inc. and Folksamerica Reinsurance Company (*)(incorporated by reference herein to Exhibit 10.26 of the Company's 2004 Annual Report on Form 10-K)

                      11


                      Statement Re Computation of Per Share Earnings (**)

                      12


                      Statement Re Computation of Ratio of Earnings to Fixed Charges (*)

                      14


                      The Company's Code of Business Conduct, which applies to all directors, officers and employees in carrying out their responsibilities to and on behalf of the Company (*)(incorporated by reference herein to Exhibit 14 of the Company's 2004 Annual Report on Form 10-K)

                      21


                      Subsidiaries of the Registrant (*)

                      23


                      Consent of PricewaterhouseCoopers LLP dated March 1, 2005February 29, 2008 (*)

                      24


                      Powers of Attorney (*)

                      31.1


                      Principal Executive Officer Certification Pursuant to Rule 13a-14 (a) of the Securities Exchange Act of 1934 (*)

                      31.2


                      Principal Financial Officer Certification Pursuant to Rule 13a-14 (a) of the Securities Exchange Act of 1934 (*)

                      32.1


                      Principal Executive Officer Certification Pursuant to 18 U.S.C. Section 1350, as Adopted Pursuant to Section 906 of the Sarbanes-Oxley Act of 2002 (*)

                      32.2


                      Principal Financial Officer Certification Pursuant to 18 U.S.C. Section 1350, as Adopted Pursuant to Section 906 of the Sarbanes-Oxley Act of 2002 (*)

                      99


                      Text entitled "Non-Asbestos and Environmental Reserves" under the caption "Loss and Loss Adjustment Expense Reserves" (incorporated by reference herein to pages 31 through 43 of the Company's Form S-3 dated March 14, 2003)

                      (*)
                      Included herein.

                      (**)
                      Not included herein as the information is contained elsewhere within report. See Note 1 of the Notes to Consolidated Financial Statements.

                        c.

                        Financial Statement Schedules

                              The financial statement schedules and report of independent registered public accounting firm have been filed as part of this Annual Report on Form 10-K as indicated in the Index to Consolidated Financial Statements and Financial Statement Schedules appearing on page 88104 of this report.


                      SIGNATURES

                              Pursuant to the requirements of Section 13 or 15(d) of the Securities Exchange Act of 1934, the Company has duly caused this report to be signed on its behalf by the undersigned, thereunto duly authorized.


                      WHITE MOUNTAINS INSURANCE GROUP, LTD.


                      Date: March 2, 2005February 29, 2008


                      By:


                      /s/  
                      J. BRIAN PALMER      
                      J. Brian Palmer
                      Chief Accounting Officer

                              Pursuant to the requirements of the Securities Exchange Act of 1934, this report has been signed below by the following persons on behalf of the Company and in the capacities and on the dates indicated.

                      Signature
                       Title
                       Date


                      /s/  
                      RAYMOND BARRETTE      
                      Raymond Barrette

                       
                      Director, President
                      Chairman and CEO (Principal
                      (Principal Executive Officer)

                       
                      March 2, 2005
                      February 28, 2008

                      /s/  
                      BRUCE R. BERKOWITZ*
                      Bruce R. Berkowitz


                      Director


                      March 2, 2005February 28, 2008


                      /s/  
                      JOHN J. BYRNE*      YVES BROUILLETTE*
                      John J. ByrneYves Brouillette


                      Director


                      March 2, 2005February 28, 2008

                      /s/  
                      HOWARD L. CLARK, JR.*
                      Howard L. Clark, Jr.


                      Director


                      March 2, 2005February 28, 2008

                      /s/  
                      ROBERT P. COCHRAN*
                      Robert P. Cochran


                      Director


                      March 2, 2005February 28, 2008


                      /s/  
                      STEVEN E. FASS*      MORGAN W. DAVIS*
                      Steven E. FassMorgan W. Davis


                      Director


                      March 2, 2005February 28, 2008

                      A. MICHAEL FRINQUELLI*
                      A. Michael Frinquelli


                      Director


                      February 28, 2008

                      /s/  
                      DAVID T. FOY      
                      David T. Foy


                      Executive Vice President and CFO (Principal
                      (Principal Financial Officer)


                      March 2, 2005February 28, 2008


                      /s/  
                      GEORGE J. GILLESPIE, III*
                      George J. Gillespie, III


                      ChairmanDirector


                      March 2, 2005February 28, 2008

                      /s/  
                      JOHN D. GILLESPIE*
                      John D. Gillespie


                      Director


                      March 2, 2005February 28, 2008

                      /s/  
                      EDITH E. HOLIDAY*
                      Edith E. Holiday


                      Director


                      March 2, 2005

                      /s/  
                      FRANK A. OLSON*      
                      Frank A. Olson


                      Director


                      March 2, 2005February 28, 2008

                      /s/  
                      J. BRIAN PALMER      
                      J. Brian Palmer


                      Chief Accounting Officer (Principal
                      (Principal Accounting Officer)


                      March 2, 2005February 28, 2008

                      /s/  
                      LOWNDES A. SMITH*
                      Lowndes A. Smith


                      Director


                      March 2, 2005February 28, 2008


                      /s/  
                      JOSEPH S. STEINBERG*      ALLAN L. WATERS*
                      Joseph S. SteinbergAllan L. Waters


                      Director


                      March 2, 2005

                      /s/  
                      ARTHUR ZANKEL*      
                      Arthur Zankel


                      Director


                      March 2, 2005February 28, 2008

                      *By:


                      /s/  
                      RAYMOND BARRETTE

                      Raymond Barrette,Attorney-in-Fact


                      WHITE MOUNTAINS INSURANCE GROUP, LTD.


                      Index to Consolidated Financial Statements and Financial Statement Schedules


                       Form 10-K
                      page(s)

                      Consolidated financial statements:  
                      Consolidated balance sheets as ofat December 31, 20042007 and 20032006 F-1
                      Consolidated statements of income and comprehensive income for each of the years ended December 31, 2004, 20032007, 2006 and 20022005 F-2
                      Consolidated statements of common shareholders' equity for each of the years ended December 31, 2004, 20032007, 2006 and 20022005 F-3
                      Consolidated statements of cash flows for each of the years ended December 31, 2004, 20032007, 2006 and 20022005 F-4
                      Notes to consolidated financial statements F-5

                      Other financial information:


                      Management's responsibility for financial statementsF-71
                      Management's annual report on internal control over financial reporting F-71F-66
                      Report of independent registered public accounting firm F-72F-67
                      Selected quarterly financial data (unaudited) F-74F-68

                      Financial statement schedules:


                      I. Summary of investments—other than investments in related parties FS-1
                      II. Condensed financial information of the Registrant FS-2
                      III. Supplementary insurance information FS-4
                      IV. Reinsurance FS-5
                      V. Valuation and qualifying accounts FS-6
                      VI. Supplemental information for property and casualty insurance underwriters FS-7


                      CONSOLIDATED BALANCE SHEETS


                       December 31,
                       
                       December 31,
                      in millions, except share amounts

                       
                      2004
                       2003
                       
                      (Millions, except share and per share amounts)

                      (Millions, except share and per share amounts)

                       December 31,
                      AssetsAssets     Assets    
                      Fixed maturity investments, at fair value (cost $7,684.1 and $6,010.2) $7,900.0 $6,248.1 
                      Fixed maturity investments, at fair value (amortized cost $7,193.0 and $7,377.0)Fixed maturity investments, at fair value (amortized cost $7,193.0 and $7,377.0) $7,371.5 $7,475.3
                      Common equity securities, at fair value (cost $1,333.9 and $972.0)Common equity securities, at fair value (cost $1,333.9 and $972.0) 1,550.7 1,212.6
                      Short-term investments, at amortized cost (which approximates fair value)Short-term investments, at amortized cost (which approximates fair value) 1,058.2 1,546.6 Short-term investments, at amortized cost (which approximates fair value) 1,327.3 1,344.9
                      Common equity securities, at fair value (cost $775.9 and $396.2) 1,043.9 513.6 
                      Other investments (cost $442.7 and $184.0) 527.4 239.2 
                      Other investments (cost $539.2 and $467.1)Other investments (cost $539.2 and $467.1) 603.3 524.8
                      Convertible fixed maturity investments, at fair value (cost $484.3 and $412.0)Convertible fixed maturity investments, at fair value (cost $484.3 and $412.0) 490.6 436.2
                      Trust account investments, at amortized cost (fair value $307.0 and $337.9)Trust account investments, at amortized cost (fair value $307.0 and $337.9) 305.6 338.9


                       Total investments 10,529.5 8,547.5  Total investments 11,649.0 11,332.7
                      CashCash 243.1 89.9 
                      Cash


                      171.3


                      159.0
                      Reinsurance recoverable on unpaid lossesReinsurance recoverable on unpaid losses 2,036.2 1,629.0 Reinsurance recoverable on unpaid losses 1,702.9 2,134.5
                      Reinsurance recoverable on unpaid losses—Berkshire Hathaway Inc.Reinsurance recoverable on unpaid losses—Berkshire Hathaway Inc. 1,761.2 1,844.8 Reinsurance recoverable on unpaid losses—Berkshire Hathaway Inc.  1,765.0 1,881.2
                      Reinsurance recoverable on paid lossesReinsurance recoverable on paid losses 92.0 121.7 Reinsurance recoverable on paid losses 59.5 159.4
                      Insurance and reinsurance premiums receivableInsurance and reinsurance premiums receivable 877.0 913.6
                      Securities lending collateralSecurities lending collateral 661.6 649.8
                      Funds held by ceding companiesFunds held by ceding companies 943.8 144.1 Funds held by ceding companies 231.1 452.8
                      Securities lending collateral 593.3 911.0 
                      Investments in unconsolidated affiliatesInvestments in unconsolidated affiliates 406.3 335.5
                      Deferred acquisition costsDeferred acquisition costs 326.0 320.3
                      Deferred tax assetDeferred tax asset 236.6 276.0
                      Ceded unearned premiumsCeded unearned premiums 123.1 87.9
                      Accrued investment incomeAccrued investment income 83.2 87.4
                      Accounts receivable on unsettled investment salesAccounts receivable on unsettled investment sales 19.9 9.1 Accounts receivable on unsettled investment sales 201.1 8.5
                      Insurance and reinsurance premiums receivable 942.2 779.0 
                      Investments in unconsolidated insurance affiliates 466.6 515.9 
                      Deferred tax asset 271.5 260.0 
                      Deferred acquisition costs 308.2 233.6 
                      Ceded unearned premiums 224.1 185.3 
                      Investment income accrued 102.4 73.0 
                      Other assetsOther assets 481.1 538.1 Other assets 611.9 645.1


                      Total assets $19,015.1 $15,882.0  Total assets $19,105.6 $19,443.7


                      LiabilitiesLiabilities     Liabilities    
                      Loss and loss adjustment expense reservesLoss and loss adjustment expense reserves $9,398.5 $7,728.2 Loss and loss adjustment expense reserves $8,062.1 $8,777.2
                      Reserves for structured contracts 375.9  
                      Unearned insurance and reinsurance premiumsUnearned insurance and reinsurance premiums 1,739.4 1,409.4 Unearned insurance and reinsurance premiums 1,605.2 1,584.9
                      DebtDebt 1,192.9 1,106.7
                      Securities lending payableSecurities lending payable 593.3 911.0 Securities lending payable 661.6 649.8
                      Debt 783.3 743.0 
                      Deferred tax liabilityDeferred tax liability 316.3 .4 Deferred tax liability 353.2 311.5
                      Incentive compensation payableIncentive compensation payable 224.2 285.2
                      Funds held under reinsurance treatiesFunds held under reinsurance treaties 103.0 141.6
                      Ceded reinsurance payableCeded reinsurance payable 201.4 158.3 Ceded reinsurance payable 124.8 138.4
                      Accounts payable on unsettled investment purchasesAccounts payable on unsettled investment purchases 30.9 371.6 Accounts payable on unsettled investment purchases 46.4 66.8
                      Funds held under reinsurance treaties 155.4 211.9 
                      Other liabilitiesOther liabilities 1,324.9 1,174.5 Other liabilities 873.1 1,060.8
                      Preferred stock subject to mandatory redemption:Preferred stock subject to mandatory redemption:     Preferred stock subject to mandatory redemption:    
                      Held by Berkshire Hathaway Inc. (redemption value $300.0) 191.9 174.5 Held by Berkshire Hathaway Inc. (redemption value $300.0) 278.3 242.3
                      Held by others (redemption value $20.0) 20.0 20.0 Held by others (redemption value $20.0)  20.0


                       Total liabilities 15,131.2 12,902.8  Total liabilities 13,524.8 14,385.2

                      Minority interest—OneBeacon, Ltd.

                      Minority interest—OneBeacon, Ltd.


                      517.2


                      490.7
                      Minority interest—WMRe Preference SharesMinority interest—WMRe Preference Shares 250.0 
                      Minority interest—consolidated limited partnershipsMinority interest—consolidated limited partnerships 100.2 112.5
                       
                       
                      Total minority interestTotal minority interest 867.4 603.2
                      Common shareholders' equityCommon shareholders' equity     
                      Common shareholders' equity


                      Common Shares at $1 par per share—authorized 50,000,000 Shares; issued and outstanding 10,772,789 and 9,007,195 Shares 10.8 9.0 
                      Common shares at $1 par value per share—authorized 50,000,000 shares; issued and outstanding 10,553,572 and 10,782,753 sharesCommon shares at $1 par value per share—authorized 50,000,000 shares; issued and outstanding 10,553,572 and 10,782,753 shares 10.5 10.8
                      Paid-in surplusPaid-in surplus 1,719.2 1,399.6 Paid-in surplus 1,680.7 1,716.7
                      Retained earningsRetained earnings 1,695.9 1,286.4 Retained earnings 2,718.5 2,496.0
                      Accumulated other comprehensive income, after-tax:Accumulated other comprehensive income, after-tax:     Accumulated other comprehensive income, after-tax:    
                      Unrealized gains on investments 416.1 286.0 Net unrealized gains on investments 207.0 194.0
                      Unrealized foreign currency translation gains (losses) 48.5 (.3)Net unrealized foreign currency translation gains 99.3 37.2
                      Minimum pension liability (2.4)  Other (2.6) .6
                      Unearned compensation—restricted Common Share awards (4.2) (1.5)


                       Total common shareholders' equity 3,883.9 2,979.2  Total common shareholders' equity 4,713.4 4,455.3


                       Total liabilities and common shareholders' equity $19,015.1 $15,882.0  Total liabilities, minority interest and common shareholders' equity $19,105.6 $19,443.7


                      See Notes to Consolidated Financial Statements including Note 1821 for Commitments and Contingencies.


                      CONSOLIDATED STATEMENTS OF INCOME AND COMPREHENSIVE INCOME

                       
                       Year Ended December 31,
                       
                      Millions, except per share amounts

                       
                       2004
                       2003
                       2002
                       
                      Revenues          
                       Earned insurance and reinsurance premiums $3,820.5 $3,137.7 $3,576.4 
                       Net investment income  360.9  290.9  366.0 
                       Net realized investment gains  181.1  162.6  156.0 
                       Other revenue  190.5  202.6  109.5 


                        Total revenues  4,553.0  3,793.8  4,207.9 


                      Expenses          
                       Losses and loss adjustment expenses  2,591.1  2,138.1  2,638.2 
                       Insurance and reinsurance acquisition expenses  743.5  615.0  804.3 
                       Other underwriting expenses  521.3  347.1  401.7 
                       General and administrative expenses  309.3  201.8  92.7 
                       Accretion of fair value adjustment to loss and loss adjustment expense reserves  43.3  48.6  79.8 
                       Interest expense on debt  49.1  48.6  71.8 
                       Interest expense—dividends and accretion on preferred stock subject to mandatory redemption  47.6  22.3   


                        Total expenses  4,305.2  3,421.5  4,088.5 


                      Pretax income  247.8  372.3  119.4 
                       Income tax provision  (47.0) (127.6) (11.7)


                      Net income before minority interest, equity in earnings of affiliates, accounting changes and extraordinary items  200.8  244.7  107.7 
                       Dividends on mandatorily redeemable preferred stock of subsidiaries    (15.1) (30.3)
                       Accretion of preferred stock of subsidiaries to face value    (6.4) (10.6)
                       Equity in earnings of unconsolidated affiliates  37.4  57.4  14.0 


                      Net income before accounting changes and extraordinary items  238.2  280.6  80.8 
                       Cumulative effect of changes in accounting principles      660.2 
                       Excess of fair value of acquired net assets over cost  180.5    7.1 


                      Net income  418.7  280.6  748.1 


                       Net change in unrealized gains and losses for investments held  218.0  163.1  298.7 
                       Net change in foreign currency translation  48.8  3.2  (1.4)
                       Recognition of unrealized gains and losses for investments sold  (87.9) (87.3) (95.0)
                       Net change in minimum pension liability  (2.4)    


                      Comprehensive net income $595.2 $359.6 $950.4 


                       Computation of net income available to common shareholders          
                       Net income $418.7 $280.6 $748.1 
                       Redemption value adjustment—Convertible Preference Shares    (49.5) (19.0)
                       Dividends declared on Convertible Preference Shares      (.4)


                      Net income available to common shareholders $418.7 $231.1 $728.7 


                      Basic earnings per Common Share          
                       Net income before accounting changes and extraordinary items $24.05 $26.48 $7.47 
                       Net income  42.28  26.48  88.61 
                      Diluted earnings per Common Share          
                       Net income before accounting changes and extraordinary items $22.67 $23.63 $6.80 
                       Net income  39.92  23.63  80.75 


                      Dividends declared and paid per Common Share $1.00 $1.00 $1.00 


                       Year Ended December 31,
                       
                      Millions, except per share amounts

                       
                       2007
                       2006
                       2005
                       
                      Revenues          
                       Earned insurance and reinsurance premiums $3,783.7 $3,712.7 $3,798.6 
                       Net investment income  533.0  435.5  491.5 
                       Net realized investment gains  263.2  272.7  112.6 
                       Gain on sale of shares through initial public offering of OneBeacon, Ltd.     171.3   
                       Other revenue  153.9  202.0  229.2 


                         Total revenues  4,733.8  4,794.2  4,631.9 


                      Expenses          
                       Loss and loss adjustment expenses  2,406.4  2,452.7  2,858.2 
                       Insurance and reinsurance acquisition expenses  776.6  754.8  761.2 
                       Other underwriting expenses  509.0  505.4  424.7 
                       General and administrative expenses  200.5  218.3  148.8 
                       Accretion of fair value adjustment to loss and loss adjustment expense reserves  21.4  24.5  36.9 
                       Interest expense on debt  73.0  50.1  44.5 
                       Interest expense—dividends on preferred stock subject to mandatory redemption  29.3  30.3  30.3 
                       Interest expense—accretion on preferred stock subject to mandatory redemption  36.1  28.3  22.1 


                         Total expenses  4,052.3  4,064.4  4,326.7 


                      Pre-tax income  681.5  729.8  305.2 
                       Income tax provision  (210.5) (98.9) (36.5)


                      Income before minority interest, equity in earnings of unconsolidated affiliates and extraordinary item  471.0  630.9  268.7 
                       Minority interest  (93.0) (16.0) (12.2)
                       Equity in earnings of unconsolidated affiliates  29.4  36.9  33.6 


                      Income before extraordinary item  407.4  651.8  290.1 
                       Excess of fair value of acquired net assets over cost    21.4   


                      Net income  407.4  673.2  290.1 
                       Change in net unrealized gains and losses for investments held  140.1  125.3  (50.8)
                       Recognition of net unrealized gains and losses for investments sold  (127.1) (156.0) (131.4)
                       Change in foreign currency translation  62.1  59.0  (70.3)
                       Net change in minimum pension liability and other  (3.2) 4.6  (1.6)


                      Comprehensive net income $479.3 $706.1 $36.0 


                      Basic earnings per share          
                        Income before extraordinary item $37.96 $60.52 $26.96 
                        Net income  37.96  62.51  26.96 
                      Diluted earnings per share          
                        Income before extraordinary item $37.89 $60.33 $26.56 
                        Net income  37.89  62.32  26.56 


                      Dividends declared and paid per common share $8.00 $8.00 $8.00 


                      See Notes to Consolidated Financial Statements.


                      CONSOLIDATED STATEMENTS OF COMMON SHAREHOLDERS' EQUITY

                      Millions

                       Total
                       Common
                      Shares and
                      paid-in
                      surplus

                       Retained
                      earnings

                       Accumulated
                      other
                      comprehensive
                      income

                       Unearned
                      compensation

                       
                      Balances at January 1, 2002 $1,444.6 $1,106.6 $355.1 $4.4 $(21.5)


                      Net income  748.1    748.1     
                      Net change in unrealized investment gains  203.7      203.7   
                      Net change in foreign currency translation  (1.4)     (1.4)  
                      Dividends declared on Convertible Preference Shares  (.4)   (.4)    
                      Dividends declared on Common Shares  (8.3)   (8.3)    
                      Issuances of Common Shares  30.2  30.2       
                      Redemption value adjustment—Convertible Preference Shares  (19.0)   (19.0)    
                      Repurchases and retirements of Common Shares  (6.5) (2.9) (3.6)    
                      Amortization of Restricted Share awards  16.2        16.2 
                      Accrued Option expense  .7  .7       


                      Balances at December 31, 2002  2,407.9  1,134.6  1,071.9  206.7  (5.3)


                      Net income  280.6    280.6     
                      Net change in unrealized investment gains  75.8      75.8   
                      Net change in foreign currency translation  3.2      3.2   
                      Dividends declared on Common Shares  (8.3)   (8.3)    
                      Issuances of Common Shares  270.1  270.1       
                      Repurchases and retirements of Common Shares  (13.8) (5.5) (8.3)    
                      Issuance of Restricted Shares    2.0      (2.0)
                      Amortization of Restricted Share awards  5.8        5.8 
                      Redemption value adjustment—Convertible Preference Shares  (49.5)   (49.5)    
                      Accrued Option expense  7.4  7.4       


                      Balances at December 31, 2003  2,979.2  1,408.6  1,286.4  285.7  (1.5)


                      Net income  418.7    418.7     
                      Net change in unrealized investment gains  130.1      130.1   
                      Net change in foreign currency translation  48.8      48.8   
                      Net change in minimum pension liability  (2.4)     (2.4)  
                      Dividends declared on Common Shares  (9.1)   (9.1)    
                      Exercise of warrants held by Berkshire Hathaway, Inc.  294.0  294.0       
                      Issuances of Common Shares  13.7  13.7       
                      Repurchases and retirements of Common Shares  (.2) (.1) (.1)    
                      Issuances of Restricted Shares    4.7      (4.7)
                      Amortization of Restricted Share awards  2.0        2.0 
                      Accrued Option expense  9.1  9.1       


                      Balances at December 31, 2004 $3,883.9 $1,730.0 $1,695.9 $462.2 $(4.2)


                      Millions

                       Common
                      shareholders'
                      equity

                       Common
                      shares and
                      paid-in
                      surplus

                       Retained
                      earnings

                       Accum. other
                      comprehensive
                      income,
                      after-tax

                       Unearned
                      compensation

                       
                      Balances at January 1, 2005 $3,883.9 $1,730.0 $1,695.9 $462.2 $(4.2)


                      Net income  290.1    290.1     
                      Net change in unrealized investment gains  (182.2)     (182.2)  
                      Net change in foreign currency translation  (70.3)     (70.3)  
                      Net change in minimum pension liability and other  (1.6)     (1.6)  
                      Dividends declared on common shares  (86.2)   (86.2)    
                      Issuances of common shares  1.1  1.1       
                      Repurchases and retirements of common shares  (.1) (.1)      
                      Forfeiture of restricted common shares    (.3)     .3 
                      Amortization of restricted common share awards  2.0        2.0 
                      Accrued Option expense  (3.5) (3.5)      


                      Balances at December 31, 2005  3,833.2  1,727.2  1,899.8  208.1  (1.9)


                      Cumulative effect adjustment—hybrid instruments      9.2  (9.2)  
                      Cumulative effect adjustment—share-based compensation    (1.9)     1.9 
                      Net income  673.2    673.2     
                      Net change in unrealized investment gains  (30.7)     (30.7)  
                      Net change in foreign currency translation  59.0      59.0   
                      Net change in other  .5      .5   
                      Dividends declared on common shares  (86.2)   (86.2)    
                      Issuances of common shares  .6  .6       
                      Amortization of restricted common share awards  1.6  1.6       
                      Adjustment for initial adoption of FAS 158, net of tax  4.1      4.1   


                      Balances at December 31, 2006  4,455.3  1,727.5  2,496.0  231.8   


                      Cumulative effect adjustment—taxes (FIN 48)  .2    .2     
                      Net income  407.4    407.4     
                      Net change in unrealized investment gains  13.0      13.0   
                      Net change in foreign currency translation  62.1      62.1   
                      Net change in other  (3.2)     (3.2)  
                      Dividends declared on common shares  (86.2)   (86.2)    
                      Issuances of common shares  2.2  2.2       
                      Repurchases and retirements of common shares  (148.0) (49.1) (98.9)    
                      Amortization of restricted common share awards  4.6  4.6       
                      Accrued Option expense  6.0  6.0       


                      Balances at December 31, 2007 $4,713.4 $1,691.2 $2,718.5 $303.7 $ 


                      See Notes to Consolidated Financial Statements.


                      CONSOLIDATED STATEMENTS OF CASH FLOWS


                       Year Ended December 31,
                       
                       Year Ended December 31,
                       
                      Millions

                      Millions

                       Millions

                       
                      2004
                       2003
                       2002
                        2007
                       2006
                       2005
                       
                      Cash flows from operations:Cash flows from operations:       
                      Net incomeNet income $418.7 $280.6 $748.1 Net income $407.4 $673.2 $290.1 
                      Charges (credits) to reconcile net income to net cash used for operating activities:       
                      Charges (credits) to reconcile net income to net cash used for operations:Charges (credits) to reconcile net income to net cash used for operations:       
                      Net realized investment gains (263.2) (272.7) (112.6)
                      Cumulative effect of changes in accounting principles   (660.2)Gain on sale of shares through initial public offering of OneBeacon Ltd.   (171.3)  
                      Excess of fair value of acquired net assets over cost (180.5)  (7.1)Excess of fair value of acquired net assets over cost  (21.4)  
                      Net realized investment gains (181.1) (162.6) (156.0)Minority interest 93.0 16.0 12.2 
                      Undistributed equity in earnings from unconsolidated insurance affiliates, after-tax (37.4) (57.4) (14.0)Deferred income tax provision 65.1 33.2 28.2 
                      Deferred income tax (benefit) provision (59.0) 105.0 163.9 Undistributed equity in earnings from unconsolidated affiliates, after-tax 1.8 48.7 (33.6)
                      Other operating items:Other operating items:       Other operating items:       
                      Net Federal income tax (payments) receipts (86.5) 27.4 189.6 Net change in loss and LAE reserves (770.3) (1,300.2) 1,188.0 
                      Net change in insurance and reinsurance balances receivable 90.0 51.5 273.0 Net change in reinsurance recoverable on paid and unpaid losses 659.0 738.2 (1,416.4)
                      Net change in reinsurance recoverable on paid and unpaid losses 300.8 636.2 110.3 Net change in funds held by ceding reinsurers 235.7 177.3 307.2 
                      Net change in deferred acquisition costs (33.5) 11.3 68.4 Net change in insurance and reinsurance premiums receivable 50.7 111.1 (58.9)
                      Net change in loss and LAE reserves and reserves for structured contracts (806.7) (1,147.1) (652.3)Net change in unearned insurance and reinsurance premiums (5.4) (4.5) (37.1)
                      Net change in unearned insurance and reinsurance premiums (54.0) (105.0) (300.1)Net change in ceded unearned premiums (31.2) 118.3 .3 
                      Net change in other assets and liabilities, net 72.5 (148.4) (137.7)Net change in reserves for structured contracts (146.0) (77.5) (151.3)


                       Net change in other assets and liabilities, net 57.7 27.1 (301.1)
                      Net cash used for operating activities (556.7) (508.5) (374.1)


                      Net cash provided from (used for) operationsNet cash provided from (used for) operations 354.3 95.5 (285.0)


                      Cash flows from investing activities:Cash flows from investing activities:       Cash flows from investing activities:       
                      Net decrease in short-term investments 768.2 244.0 755.2 Net change in short-term investments 16.0 (526.2) 295.3 
                      Sales of fixed maturity investments 5,905.1 17,290.5 13,531.9 Sales of fixed maturity and convertible fixed maturity investments 6,932.1 4,576.2 5,785.6 
                      Maturities of fixed maturity investments 1,561.7 1,372.0 411.9 Maturities, calls and paydowns of fixed maturity and convertible fixed maturity investments 672.5 833.9 597.2 
                      Sales of common equity securities and other investments 557.3 160.1 98.4 Sales of common equity securities and other investments 797.4 819.2 581.1 
                      Sales of consolidated and unconsolidated affiliates, net of cash sold 220.9 25.0  Sales of trust account investments 33.8 7.1  
                      Purchases of fixed maturity investments (7,157.3) (18,248.2) (14,066.6)Sales of consolidated and unconsolidated affiliates, net of cash sold 90.1 771.4 180.7 
                      Purchases of common equity securities and other investments (378.8) (354.4) (244.5)Sale of Agri renewal rights  32.0  
                      Purchases of consolidated and unconsolidated affiliates, net of cash acquired (659.8)  (.5)Purchases of trust account assets  (344.0)  
                      Net change in unsettled investment purchases and sales (337.2) 28.1 98.4 Purchases of common equity securities and other investments (1,135.7) (697.0) (589.8)
                      Net (acquisitions) dispositions of property and equipment (13.6) 43.4 (12.8)Purchases of fixed maturity and convertible fixed maturity investments (7,430.2) (5,800.5) (6,484.7)


                       Purchases of consolidated and unconsolidated affiliates, net of cash acquired (51.6) (33.0)  
                      Net cash provided from investing activities 466.5 560.5 571.4 
                      Net change in unsettled investment purchases and sales (213.0) 36.6 10.7 
                      Net acquisitions of property and equipment (26.2) (19.8) (38.5)


                      Net cash (used for) provided from investing activitiesNet cash (used for) provided from investing activities (314.8) (344.1) 337.6 


                      Cash flows from financing activities:Cash flows from financing activities:       Cash flows from financing activities:       
                      Proceeds from issuances of Common Shares and Convertible Preference Shares 307.8 1.5 226.4 Issuance of WMRe Preference Shares, net of issuance costs 246.6   
                      Proceeds from issuances of debt  693.4 8.0 Issuance of debt 394.4 482.4 18.4 
                      Repayments of debt (25.0) (739.9) (338.6)Repayment of debt (322.0) (155.0)  
                      Dividends paid on mandatorily redeemable preferred stock of subsidiaries (30.3) (30.3) (30.3)Redemption of mandatorily redeemable preferred stock (20.0)   
                      Dividends paid on Common Shares (9.1) (8.3) (8.3)Interest rate swap agreements (2.4)   
                      Dividends paid on Convertible Preference Shares   (.4)Cash dividends paid to the Company's common shareholders (86.2) (86.2) (86.2)


                       Cash dividends paid to OneBeacon Ltd.'s minority common shareholders (23.4)     
                      Net cash provided from (used for) financing activities 243.4 (83.6) (143.2)
                      Cash dividends paid to preferred shareholders (29.3) (30.3) (30.3)
                      Cash dividends paid on WMRe Preference Shares (11.3)   
                      Company's Common shares repurchased and retired (148.0)   
                      OneBeacon Ltd. Common shares repurchased and retired (33.0)   
                      Proceeds from issuances of common shares 2.2 .6 1.1 


                      Net cash (used for) provided from financing activitiesNet cash (used for) provided from financing activities (32.4) 211.5 (97.0)


                      Effect of exchange rate changes on cashEffect of exchange rate changes on cash 5.2 8.4 (11.0)


                      Net increase (decrease) in cash during yearNet increase (decrease) in cash during year 153.2 (31.6) 54.1 Net increase (decrease) in cash during year 12.3 (28.7) (55.4)
                      Cash balance at beginning of yearCash balance at beginning of year 89.9 121.5 67.4 Cash balance at beginning of year 159.0 187.7 243.1 


                      Cash balance at end of yearCash balance at end of year $243.1 $89.9 $121.5 Cash balance at end of year $171.3 $159.0 $187.7 


                      See Notes to Consolidated Financial Statements.


                      NOTES TO CONSOLIDATED FINANCIAL STATEMENTS

                      NOTE 1. Summary of Significant Accounting Policies

                      Basis of presentation

                              The accompanying consolidated financial statements include the accounts of White Mountains Insurance Group, Ltd. (the "Company" or the Company"Registrant") and its subsidiaries (collectively with the Company, "White Mountains") and have been prepared in accordance with GAAPgenerally accepted accounting principles in the United States. Previously defined terms used within these financial statements have the same meaning as they have elsewhere within this report.States ("GAAP"). The Company is aan exempted Bermuda limited liability company withwhose principal businesses are conducted through its property and casualty insurance and reinsurance subsidiaries and affiliates. The Company's headquarters are located at The Bank of Butterfield Building, 42 Reid Street, 6th Floor, Hamilton, Bermuda HM 12, Bermuda. The Company'sits principal executive office is located at 80 South Main Street, Hanover, New Hampshire 03755-2053 and its registered office is located at Clarendon House, 2 Church Street, Hamilton, Bermuda HM 11.

                              The Company's White Mountains' reportable segments are OneBeacon, White Mountains Re, Esurance and Other Operations. Significant transactions among White Mountains' segments have been eliminated in this report.

                              The OneBeacon segment consists of OneBeacon Insurance Group, Ltd. ("OneBeacon Ltd."), an exempted Bermuda limited liability company that owns a family of companies are U.S.-based property and casualty insurance writers,companies (collectively "OneBeacon"), substantially all of which wereoperate in a multi-company pool. OneBeacon offers a wide range of specialty, commercial and personal products and services sold primarily through select independent agents and brokers. OneBeacon was acquired by White Mountains from Aviva plc ("Aviva", formerly CGNU plc) on June 1,in 2001 (the "OneBeacon Acquisition"). During the fourth quarter of 2006, White Mountains sold 27.6 million, or 27.6%, of OneBeacon Ltd.'s common shares in an initial public offering (the "OneBeacon Offering"). At December 31, 2007 White Mountains owned 72.9% of OneBeacon Ltd.'s outstanding common shares.

                              The White Mountains'Mountains Re segment consists of White Mountains Re Ltd., an exempted Bermuda limited liability company, and its subsidiaries (collectively, "White Mountains Re"). White Mountains Re offers reinsurance operations are conducted primarilycapacity for property, casualty, accident & health, agriculture, aviation and space and certain other exposures on a worldwide basis through its recently formed global reinsurance organization ("White Mountains Re"), which oversees the operations of Folksamerica, Sirius, and WMU, as described below.

                      subsidiaries, Folksamerica Reinsurance Company together with its parent, Folksamerica Holding Company, ("Folksamerica") became a wholly-owned subsidiary of, Sirius International Insurance Corporation ("Sirius International"), and White Mountains in 1998. In connection with the OneBeacon Acquisition, Folksamerica was contributed to OneBeacon. On November 30, 2004,Re Bermuda Ltd. ("WMRe (Bermuda"), formerly Fund American Reinsurance Company, Ltd.). White Mountains completed a significant corporate reorganization and, as part of the reorganization, ownership of Folksamerica was transferred to White Mountains Re.

                              On April 16, 2004, White Mountains acquired Sirius Insurance Holding Sweden AB and its subsidiaries ("Sirius"), a group of international insurers and reinsurers that focuses mainly onRe also provides reinsurance advisory services, specializing primarily in property and other short-tailed lines from ABB Ltd. (See Note 2). Subsequent to White Mountains' acquisition of Sirius, Fund American Reinsurance Company Ltd. ("Fund American Re") was sold to Sirius by the Company. Accordingly, the results of Fund American Re are included in Sirius' results throughout this report. White Mountains' reinsurance, operations also include its wholly owned subsidiaries,through White Mountains Re Underwriting Limited (domiciled in Ireland) andServices Ltd. ("WMRUS"). On August 3, 2006, White Mountains Underwriting (Bermuda) Limited (collectively, "WMU"Re sold one of its subsidiaries, Sirius America Insurance Company ("Sirius America"). WMU is, to an reinsurance advisory company specializing in international property and marine excess reinsurance.

                              Esurance has been a unitinvestor group. As part of the transaction, White Mountains since October 2000.acquired an equity interest of approximately 18% in the acquiring entity, Lightyear Delos Acquisition Corp. ("Delos"), and accounts for Delos on the equity method within its Other Operations segment.

                              The Esurance marketssegment consists of Esurance Holdings, Inc., and its subsidiaries (collectively, "Esurance"). Esurance, sells personal auto insurance directly to customers online and through select online agents.

                              White Mountains' Other Operations segment consists of the Company and its intermediate holding companies, its wholly-owned investment management subsidiary, White Mountains Advisors LLC ("WM Advisors"), its weather risk management business ("Galileo"), its variable annuity reinsurance business White Mountains Life Reinsurance (Bermuda) Ltd. ("WM Life Re"), as well as the International American Group, Inc. (the "International American Group"). and various other entities not included in other segments. The International American Group which was acquired by White Mountains in 1999, consists ofincludes American Centennial Insurance Company ("American Centennial") and British Insurance Company of Cayman ("British Insurance Company") and, prior to its sale, both of which are in January 2004,run-off. The Other Operations segment also included Peninsula Insurance Company ("Peninsula").

                              White Mountains has completed numerous significant transactions during the periods presented which have affected the comparability of the financial statement information presented herein.includes White Mountains' consolidated statementsinvestments in common shares and warrants to purchase common shares of incomeSymetra Financial Corporation ("Symetra"), its investment in Delos and comprehensive income includePentelia Investment Ltd. and the consolidated results of acquired businesses beginning as of the date each respective acquisition was completed. Net changes in


                      assetsTuckerman Capital, LP and liabilities reported in the consolidated statements of cash flows exclude those assets and liabilities acquired or sold during the periods presented.Tuckerman Capital II, LP funds ("Tuckerman Funds").

                              All significant intercompany transactions have been eliminated in consolidation. The financial statements include all adjustments considered necessary by management to fairly present the Company's financial position, its results of operations and its cash flows.

                      The preparation of financial statements in conformity with GAAP requires management to make estimates and assumptions that affect the reported amounts of assets and liabilities as of the date of the financial statements and the reported amounts of revenues and expenses during the reporting period. Actual results could differ from those estimates. Certain amounts in the prior period financial statements have been reclassified to conform with the current presentation.


                      Investment securities

                              White Mountains' invested assets comprise securities and other investments held for general investment purposes and those held in two segregated trust accounts.

                              White Mountains' portfolio of fixed maturity investments and common equity securities held for general investment purposes are classified as available for sale and are reported at fair value as of the balance sheet date asdate. The fair value of White Mountains' fixed maturities and common equity securities is determined by quoted market values. Other investments principally include investments in limited partnership interests whichprices when available. When quoted market prices are recordedunavailable, White Mountains calculates an estimated fair value using the equity method of accounting.observable market inputs such as interest rates, yield curve, prepayment speeds, etc. Net unrealized investment gains and losses after-tax, associated with such investmentson available for sale securities are reported as a net, amountafter-tax, as a separate component of shareholders' equity. Changes in net unrealized investment gains and losses, net of the effect of adjustments for minority interest and after-tax, are reported as a component of other comprehensive income.

                              Asset-backed securities are included in fixed maturity investments and consist primarily of pooled collateralized mortgage obligations. Asset-backed securities are classified as available for sale and carried at fair value. Fair values for asset-backed securities are based on quoted market prices from a third party pricing service. Income on asset-backed securities is recognized using an effective yield based on anticipated prepayments and the estimated economic life of the securities. When actual prepayments differ significantly from anticipated prepayments, the estimated economic life is recalculated and the remaining unamortized premium or discount is amortized prospectively over the remaining economic life.

                              White Mountains' portfolio of fixed maturity investments held in the segregated trust accounts are classified as held to maturity as the Company has the ability and intent to hold the investments until maturity. Securities classified as held to maturity are recorded at amortized cost.

                              Investment securities are regularly reviewed for impairment based on criteria that include the extent to which cost exceeds market value, the duration of the market decline, the financial health of and specific prospects for the issuer and the ability and intent to hold the investment to maturity.recovery. Investment losses that are other than temporary are recognized in earnings. Realized gains and losses resulting from sales of investment securities are accounted for using the weighted average method.

                      Premiums and discounts on all fixed maturity investments are accreted to income over the anticipated life of the investment.

                              Short-term investments consist of money market funds, certificates of deposit and other securities which mature or become available for use within one year. Short-term investments are carried at amortized cost, which approximated fair value as of December 31, 20042007 and 2003.2006. Short-term investments held in the segregated trust account are included in the total of investments held in trust.

                              Other investments comprise White Mountains' investments in limited partnerships, warrants, equity method investments and an interest rate swap accounted for as a cash flow hedge.

                      Investments in limited partnerships

                              White Mountains has investments in a number of limited partnerships, which are recorded in other investments. Changes in White Mountains' interest in limited partnership interests accounted for using the equity method are included in net realized investment gains. Changes in White Mountains' interest in limited partnerships not accounted for under the equity method are reported, after-tax, as a component of shareholders' equity, with changes therein reported as a component of other comprehensive income.

                      Securities lending

                              White Mountains participates in a securities lending program wherebyas a mechanism for generating additional investment income on its fixed maturity portfolio. Under the security lending arrangements, certain of its fixed maturity investments are loaned to other institutions for short periods of time through a lending agent. White Mountains maintains control over the securities it lends, retains the earnings and cash flows associated with the loaned securities and receives a fee from the borrower for the temporary use of the asset. Collateral, inThe security lending counter party is required to provide cash collateral for the form of cash and United States governmentloaned securities, which is then invested by the lending agent. The collateral is required at a rate of 102% of the fair value of the loaned securities, and is monitored and maintainedcontrolled by the lending agent. The fair valueagent and may not be sold or re-pledged. In the event that the lending agent does not return the full amount of collateral to the securitiessecurity lending collateralcounter party, White Mountains is recorded as both an asset and liability on the balance sheet.obligated to make up any deficiency. An indemnification agreement with the lending agent protects White Mountains in the event a borrower becomes insolvent or fails to return any of the securities on loan. The contractual amount of the securities lending collateral is recorded as both an asset and liability on the balance sheet. At December 31, 2007 and 2006, security lending collateral was invested entirely in securities rated AA or better by Standard & Poor's.


                              At December 31, 2007 and 2006, the fair value of securities held as collateral exceeded the amounts required to be returned to the security lending counter party by the lending agent upon the return of the loaned securities. However, other than in the event of default by the borrower, this collateral is not available to White Mountains. Because of these restrictions, White Mountains considers the collateral transactions associated with its securities lending activities to be non-cash transactions.

                      Derivative financial instruments

                              White Mountains holds a variety of derivative financial instruments for both risk management and investment purposes. White Mountains recognizes all derivatives as either assets or liabilities, measured at fair value, in the consolidated balance sheets.

                      Convertible bonds

                              White Mountains owns convertible bonds. The Company does not use derivatives for hedging, but does own convertible bonds withequity conversion option is considered an embedded derivatives. Inderivative. Prior to January 1, 2006, in accordance with SFASStatement of Financial Accounting Standard ("SFAS") No. 133, "Accounting for Derivative Instruments and Hedging Activities" ("SFAS 133"), the Company bifurcatesWhite Mountains bifurcated all equity option derivatives that are embedded in its convertible bonds. The original host instruments arewere reported, at fair value, in fixed maturity investments and the embedded derivatives arewere reported, at fair value, in other investments. Because these derivatives do not qualify as hedging instruments, changesChanges in the fair values of derivatives arethe equity options were included in realized gains and losses. Effective January 1, 2006, White Mountains adopted FAS No. 155, "Accounting for Certain Hybrid Instruments, an amendment to Statement Nos. 133 and 140" ("FAS 155"). FAS 155 eliminated the requirement to bifurcate financial instruments with embedded derivatives if the holder of the instrument elects to account for the entire instrument on a fair value basis with changes in fair value of the entire instrument recorded through income as realized gains. Prior to adoption of FAS 155, White Mountains had recorded $283.5 million related to the host instrument in fixed maturity investments and $99.8 million for the equity conversion option in other investments. Upon adoption of FAS 155, White Mountains recorded an adjustment of $9.2 million to reclassify net unrealized gains on investments (gross gains of $9.8 million and gross losses of $.6 million) to opening retained earnings to reflect the cumulative effect of adoption. The fair value of derivatives includedconvertible bonds at December 31, 2007 was $490.6 million.

                      Warrants

                              White Mountains holds warrants to acquire common shares of Symetra. During 2007 and 2006, White Mountains also held warrants to acquire common shares of Montpelier Re. On May 1, 2007 White Mountains sold all of its remaining interest in Montpelier Re. White Mountains also holds warrants that it has received in the restructuring (e.g., securities received from bankruptcy proceedings) of certain of its common equity and/or fixed maturity investments. White Mountains accounts for its investments in warrants in accordance with SFAS 133 as derivatives. The warrants are recorded in other investments was $33.9 millionat fair value with changes therein recorded in realized gains or losses in the period in which they occur.

                              The Company uses a Black-Scholes valuation model to determine the fair value of the Symetra warrants. The major assumptions used in valuing the Symetra warrants at December 31, 20042007 were a risk-free rate of 3.70%, volatility of 25%, an expected life of 6.6 years and realized gains (losses) on derivatives was $7.3 milliona share price of $16.48 per share.

                      Cash flow hedge

                              Contemporaneously with entering into a variable rate mortgage note, OneBeacon entered into an interest rate swap agreement under which it pays a fixed rate and receives a variable rate to hedge its exposure to interest rate fluctuations. The notional amount of the swap is equal to the outstanding principal of the mortgage note it hedges and is adjusted at the same time as the mortgage note principal changes for drawdowns and repayments. The underlying index used to determine the variable interest paid under the swap is the same as that used for OneBeacon's variable rate mortgage note. In accordance with SFAS 133, OneBeacon has accounted for the period ending December 31, 2004.swap as a cash flow hedge and has recorded the interest rate swap at fair value on the balance sheet in other assets. Changes in the fair value of the interest rate swap, after tax, are reported as a component of other comprehensive income. OneBeacon monitors continued effectiveness of the hedge by monitoring the changes in the terms of the instruments as described above as compared to the actual changes in principal and notional amount in the mortgage note and interest rate swap.


                      Interest rate lock

                              In anticipation of the issuance of the WMRe Senior Notes, White Mountains Re entered into an interest rate lock agreement to hedge its interest rate exposure from the date of the agreement until the pricing of the WMRe Senior Notes. The agreement was terminated on March 15, 2007 and the resulting loss of $2.4 million was recorded in accumulated other comprehensive income. The loss is being reclassified from accumulated other comprehensive income to interest expense over the life of the WMRe Senior notes using the interest method.

                      Weather contracts

                              White Mountains offers weather and weather contingent risk management products through its subsidiary, Galileo. All of Galileo's products are in the form of derivative financial instruments. Galileo enters into weather and weather contingent derivative contracts with the objective of generating profits in normal climatic conditions. Accordingly, Galileo's weather and weather contingent derivatives are not designed to meet the GAAP criteria for hedge accounting. The majority of Galileo's business consists of receiving a payment or premium at the contract inception in exchange for bearing the risk of variations in a quantifiable weather index. Galileo initially recognizes the premium paid or received as an asset or liability, respectively, and recognizes any subsequent changes in fair value, as they occur, in other revenues within the income statement. The fair value for Galileo's derivative financial contracts are based upon quoted market prices, where available. Where quoted market prices are not available, management uses available market data and internal pricing models based upon consistent statistical methodologies to estimate the fair value. The gain or loss at the inception date for contracts valued based upon internal pricing models are deferred and amortized into income over the period at risk for each underlying contract.

                      Derivatives—Variable annuity reinsurance

                              White Mountains has entered into agreements to reinsure death and living benefit guarantees associated with certain variable annuities in Japan through its wholly owned subsidiary, WM Life Re. The accounting for benefit guarantees differs depending on whether or not the guarantee is classified as a derivative or an insurance liability.

                              Guaranteed minimum accumulation benefits ("GMABs") are paid to an annuitant for any shortfall between accumulated account value at the end of the accumulation period and the annuitant's total deposit, less any withdrawal payments made to the annuitant during the accumulation period. GMABs meet the definition of a derivative for accounting purposes and are accounted for under FAS 133. Therefore, GMABs are carried at fair value, with changes thereon recognized in income in the period of the change. The liability for the reinsured GMAB contracts has been determined using internal valuation models that use assumptions for interest rates, equity markets, foreign exchange rates and market volatilities at the valuation date, as well as annuitant-related actuarial assumptions, including surrender and mortality rates.

                              If an annuitant dies during the accumulation period of an annuity contract, guaranteed minimum death benefits ("GMDBs") are paid to the annuitant's beneficiary for shortfalls between accumulated account value at the time of an annuitant's death and the annuitant's total deposit, less any living benefit payments or withdrawal payments previously made to the annuitant. GMDBs are accounted for as life insurance liabilities in accordance with Statement of Position 03-1, "Accounting and Reporting by Insurance Enterprises for Certain Nontraditional Long-Duration Contracts and for Separate Accounts" (the "SOP"). The life insurance liability for the reinsured GMDB contracts has been calculated based on investment returns, mortality, surrender rates and other assumptions and is recognized over the contract period.

                              The valuation of these liabilities involves significant judgment and is subject to change based upon changes in capital market assumptions and emerging surrender and mortality experience of the underlying contracts in force.

                              WM Life Re has entered into derivative contracts that are designed to economically hedge against changes in the fair value of living and death benefit liabilities associated with its variable annuity reinsurance arrangements. The derivatives include futures and over-the-counter option contracts on interest rates, major equity indices, and foreign currencies. All WM Life Re's derivative instruments are recorded as assets or liabilities at fair value on the balance sheet within other assets. These derivative financial instruments do not meet the hedging criteria under FAS 133, and accordingly, changes in fair value are recognized in the current period as gains or losses in the income statement within other revenues.

                      Cash

                              Cash includes amounts on hand and demand deposits with banks and other financial institutions. Amounts presented in the statement of cash flows are shown net of balances acquired and sold in the purchase or sale of the Company's consolidated subsidiaries.


                      Insurance and reinsurance operations

                              White Mountains accounts for insurance and reinsurance policies that it writes in accordance with SFAS No. 60, "Accounting and Reporting by Insurance Enterprises" ("SFAS 60"). Premiums written are recognized as revenues and are earned ratably over the term of the related policy or reinsurance treaty. Unearned premiums represent the portion of premiums written that are applicable to future insurance or reinsurance coverage provided by policies or treaties in force. AutoOne Insurance, which acts as a limited assigned distribution ("LAD") servicing carrier, enters into contractual arrangements with insurance companies to assume private passenger automobile assigned risk exposures in the state of New York. AutoOne Insurance receives LAD servicing fees for assuming these risks. LAD servicing fees are typically a percentage of the total premiums that AutoOne Insurance must write to fulfill the obligation of the transferor company. LAD servicing carriers may choose to write certain policies voluntarily by taking risks out of the NYAIP.New York Automobile Insurance Plan ("NYAIP"). These policies generate takeout credits which can be "sold" for fees to the transferor company ("takeout fees"). These fees are also typically a percentage of the transferor company's NYAIP premium assignments. AutoOne Insurance's LAD servicing and takeout fees are recorded as written premium when billed and are earned ratably over the term of the related policy to which the fee relates.

                              White Mountains charges fees on certain of its insurance policies. Refundable fees are classified with premiums and recognized in earnings over the policy term. Fees that represent a reimbursement of expenses, such as installment fees, are recorded as a reduction of underwriting expenses.

                      Deferred acquisition costs represent commissions, premium taxes, brokerage expenses and other costs which are directly attributable to and vary with the production of new business. These costs are deferred and amortized over the applicable premium recognition period as insurance and reinsurance acquisition expenses. Deferred acquisition costs are limited to the amount expected to be recovered from future earned premiums and anticipated investment income. This limitation is referred to as a premium deficiency. A premium deficiency is recognized if the sum of expected loss and LAE,loss adjustment expenses ("LAE"), expected dividends to policyholders, unamortized acquisition costs, and maintenance costs exceeds related unearned premiums. A premium deficiency is recognized by charging any unamortized acquisition costs to expense to the extent required in order to eliminate the deficiency. If the premium deficiency exceeds unamortized acquisition costs then a liability is accrued for the excess deficiency.

                              Losses and LAE are charged against income as incurred. Unpaid insurance losses and LAE are based on estimates (generally determined by claims adjusters, legal counsel and actuarial staff) of the ultimate costs of settling claims, including the effects of inflation and other societal and economic factors. Unpaid reinsurance losses and LAE are based primarily on reports received from ceding companies and actuarial projections. Unpaid loss and LAE reserves represent management's best estimate of ultimate losses and LAE, net of estimated salvage and subrogation recoveries, if applicable. Such estimates are regularly reviewed and updated and any adjustments resulting therefrom are reflected in current operations. The process of estimating loss and LAE involves a considerable degree of judgment by management and the ultimate amount of expense to be incurred could be considerably greater than or less than the amounts currently reflected in the financial statements.

                              OneBeacon discounts certain of its long-term workers compensation loss and LAE reserves when such liabilities constitute unpaid but settled claims under which the payment pattern and ultimate costs are fixed and determinable on an individual claim basis. OneBeacon discounts these reserves using an average discount rate which is determined based on the facts and circumstances applicable at the time the claims are settled (4.7%(5.5% and 5.3% at December 31, 20042007 and 2003)2006). As of December 31, 20042007 and 2003,2006, the discount on OneBeacon's workers compensation loss and LAE reserves amounted to $259.4$156.9 million and $294.5 million, respectively.$190.7 million.


                              In connection with purchase accounting for the OneBeacon Acquisition, White Mountains was required to adjust to fair value OneBeacon's loss and LAE reserves and the related reinsurance recoverables by $646.9 million and $346.9 million, respectively, on OneBeacon's acquired balance sheet as of June 1, 2001. This net reduction to loss and LAE reserves of $300.0 million is being accreted through an income statement charge ratably with and over the period that the claims to which such reserves relate are expected to be settled. See(See Note 3.3)

                              In connection with purchase accounting for the Sirius, Acquisition, White Mountains was required to adjust to fair value the loss and LAE reserves on Sirius' acquired balance sheet by $58.1 million. This fair value adjustment is being recognizedaccreted through an income statement charge ratably with and over the period the claims are settled. See(See Note 3.3)


                              White Mountains' insurance and reinsurance subsidiaries enter into ceded reinsurance contracts from time to time to protect their businesses from losses due to concentration of risk, to manage their operating leverage ratios and to limit losses arising from catastrophic events. The majority of suchSuch reinsurance contracts are executed through excess of loss treaties and catastrophe contracts under which the reinsurer indemnifies for a specified part or all of certain types of losses over stipulated amounts arising from any one occurrence or event. White Mountains has also entered into quota share treaties with reinsurers under which all risks meeting prescribed criteria are covered on a pro-rata basis. The amount of each risk ceded by White Mountains is subject to maximum limits which vary by line of business and type of coverage. Amounts related to reinsurance contracts are recorded in accordance with SFAS 113, "Accounting and Reporting for Reinsurance of Short-Duration and Long-Duration Contracts" and Emerging Issues Task Force Topic No. D-54, as applicable.

                              Amounts recoverable from reinsurers are estimated in a manner consistent with the claim liability associated with the reinsured policies. The collectibility of reinsurance recoverables is subject to the solvency of the reinsurers. White Mountains is selective in regard to its reinsurers, principally placing reinsurance with those reinsurers with a strong financial condition, industry ratings and underwriting ability. Management monitors the financial condition and ratings of its reinsurers on an ongoing basis.

                              Reinsurance premiums, commissions, expense reimbursements and reserves related to reinsured business are accounted for on a basis consistent with those used in accounting for the original policies issued and the terms of the reinsurance contracts. Premiums ceded to other companies are reported as a reduction of premiums written. Expense allowances received in connection with reinsurance ceded have been accounted for as a reduction of the related policy acquisition costs and are deferred and amortized accordingly. Funds held by ceding companies represent amounts due to White Mountains in connection with certain assumed reinsurance agreements in which the ceding company retains a portion of the premium to provide security against future loss payments. The funds held by ceding companies are generally invested by the ceding company and a contractually agreed interest amount is credited to the Company and recognized as investment income. Funds held under reinsurance treaties represent contractual payments due to the reinsurer that White Mountains has retained to secure obligations of the reinsurer. Such amounts are recorded as liabilities in the consolidated financial statements.

                      Accounting for Mandatory Shared Market Mechanisms

                              As a condition to its licenses to do business in certain states, White Mountains' insurance operations must participate in various mandatory shared market mechanisms commonly referred to as "residual" or "involuntary" markets. These markets generally consist of risks considered to be undesirable from a standard or routine underwriting perspective. Each state dictates the levels of insurance coverage that is mandatorily assigned to participating insurers within these markets. The total amount of such business an insurer must accept in a particular state is generally based on that insurer's market share of voluntary business written within that state. In certain cases, White Mountains is obligated to write business from shared market mechanisms at a future date based on its historical market share of all voluntary policies written within that state. Involuntary business generated from


                      mandatory shared market mechanisms is accounted for in accordance with SFAS 60 or as assumed reinsurance under SFAS 113 "Accounting and Reporting for Reinsurance of Short-Duration and Long-Duration Contracts" (hereafter referred to as structured contracts) depending upon the structure of the mechanism.

                              OneBeacon's market assignments are typically required to be written in the current period, however, in certain cases OneBeacon is required to accept policy assignments at a future date. OneBeacon's residual market assignments to be written in the future primarily relate to private passenger automobile assigned risk exposures within the State of New York where several of OneBeacon's insurance subsidiaries write voluntary automobile insurance. The share of involuntary written premium for policies assigned by the NYAIP to a particular insurer in a given year is based on the proportion of the total voluntary writings in New York two years prior. Anticipated losses associated with future market assignments are recognized in accordance with SFAS No. 5, "Accounting for Contingencies", when the amount of such anticipated losses is determined to be probable and can be reasonably estimated.

                      Accounting for Insurance-Related Assessments

                              Under existing guaranty fund laws in all states, insurers licensed to do business in those states can be assessed for certain obligations of insolvent insurance companies to policyholders and claimants. In accordance with Statement of Position 97-3, "Accounting by Insurance and Other Enterprises for Insurance-Related Assessments" ("SOP 97-3"), White Mountains' insurance subsidiaries record guaranty fund assessments when such assessments are billed by the respective guaranty funds. In addition, each insurance subsidiary's policy is to accrue for any significant insolvencies when the lossit is probable that an assessment will be made and the assessment amount can be reasonably estimated.


                      Reserves for Structured Contracts

                              The reserve for structured contracts represents deposit liabilities for reinsurance contracts that do not satisfy the conditions for reinsurance accounting established in SFAS 113.

                              For insurance and reinsurance contracts that transfer only significant timing risk or that transfer neither significant timing risk nor significant underwriting risk, the amount of the deposit asset or liability is adjusted at the balance sheet date by calculating the effective yield on the deposit to reflect actual payments to date and expected future payments. Changes in the carrying amounts are reported as a component of net investment income. Fees related to these contracts are recorded as investment income and are earned using the effective yield method or evenly over the life of the contract dependent upon contract terms.

                      Deferred Software Costs

                              White Mountains capitalizes costs related to computer software developed for internal use during the application development stage of software development projects in accordance with Statement of Position 98-1, "Accounting for the Costs of Computer Software Developed or Obtained for Internal Use". These costs generally consist of certain external, payroll and payroll-related costs. White Mountains begins amortization of these costs once the project is completed and ready for its intended use. Amortization is on a straight-line basis and over a useful life of three to five years. At December 31, 20042007 and 2003,2006, White Mountains had unamortized deferred software costs of $56.1$40.4 million and $51.7 million, respectively.$43.9 million.


                      Federal and foreign income taxes

                              The majority of White Mountains' subsidiaries file consolidated tax returns in the United States. Income earned or losses generated by companies outside the United States are generally subject to an overall effective tax rate lower than that imposed by the United States.

                              Deferred tax assets and liabilities are recorded when a difference between an asset or liability'sthe carrying amounts of assets and liabilities for financial statement valuereporting purposes and itsthe amounts for tax reporting valuepurposes exists, and for other temporary differences as defined by SFAS No. 109, "Accounting for Income Taxes". The deferred tax asset or liability is recorded based on tax rates expected to be in effect when the difference reverses. The deferred tax asset is recognized when it is more likely than not that it will be realized.

                      Foreign currency exchange

                              The U.S. dollar is the functional currency for all of the Company's businesses except for the foreign reinsurance operations of Folksamerica, Sirius and WMU, foreign investment securitiesWMRUS and certain other smaller international activities. The national currencies of the subsidiaries are their functional currencies since their business is primarily transacted in such local currency. White Mountains also invests in securities denominated in foreign currencies. Assets and liabilities recorded in these foreign currencies are translated into U.S. dollars at exchange rates in effect at the balance sheet date, and revenues and expenses are converted using the average exchange rates for the period. Net foreign exchange gains and losses arising from the translation are generally reported in shareholders' equity, in accumulated other comprehensive income or loss, net of tax.

                              Assets and liabilities relating to foreign operations are translated into the functional currency using current exchange rates; revenues and expenses are translated into the functional currency using the exchange rate of the transaction day. The resulting exchange gains and losses are reported as a component of net income in the period in which they arise. As of December 31, 20042007 and 2003,2006, White Mountains had an after-tax unrealized foreign currency translation gain (loss) of $48.5$99.3 million, net of minority interest of $(.1) million, and ($.3)$37.2 million, net of minority interest of $.7 million, respectively, recorded on its consolidated balance sheet. For the years ended December 31, 2004, 2003 and 2002, White Mountains' foreign currency gains and losses reported on its consolidated income statements were insignificant for all periods presented.

                              The following rates of exchange for the U.S. dollar have been used for the most significant operations:

                      Currency

                       Opening Rate 2007
                       Closing Rate 2007
                       Opening Rate 2006
                       Closing Rate 2006
                      Swedish Krona 6.8640 6.4304 7.9603 6.8640
                      British Pound .5088 .4999 .5798 .5088
                      Canadian Dollar 1.1603 .9792 1.1647 1.1603
                      Currency

                       Opening Rate
                      2004

                       Closing Rate
                      2004

                      Swedish Krona 7.6466(1)6.6231
                      British Pound .5600 .5218
                      Canadian Dollar 1.2970 1.2132


                      (1)
                      Represents the exchange rate at April 16, 2004 as this is the date that White Mountains acquired Sirius, whose functional currency is the Swedish krona.

                      Earnings (loss) per shareVariable Interest Entities

                              Basic earnings (loss) per share amountsVariable interest entities ("VIEs") are based onentities that lack one or more of the weighted average numbercharacteristics of Common Shares outstanding. Diluted earnings per share amounts are based ona voting interest entity. A controlling financial interest in a VIE is present when an entity has a variable interest, or a combination of variable interests, that will absorb a majority of the weighted average numberVIE's expected losses, receive a majority of Common Sharesthe VIE's expected residual returns, or both. The entity with a controlling financial interest is the primary beneficiary and consolidates the net effect of potentially dilutive Common Shares outstanding, calculated using


                      the treasury stock method. The following table outlines the Company's computation of earnings (loss) per share for the years ended December 31, 2004, 2003 and 2002:

                       
                       Year Ended December 31,
                       
                       
                       2004
                       2003
                       2002
                       
                      Basic earnings per share numerators (in millions):          
                      Net income before accounting changes and extraordinary items $238.2 $280.6 $80.8 
                      Redemption value adjustment and dividends on Convertible Preference Shares    (49.5) (19.4)


                      Net income before accounting changes and extraordinary items available to common shareholders $238.2 $231.1 $61.4 


                       Cumulative effect of changes in accounting principles      660.2 
                       Extraordinary income items  180.5    7.1 


                      Net income available to common shareholders $418.7 $231.1 $728.7 


                      Diluted earnings per share numerators (in millions):          
                      Net income before accounting changes and extraordinary items available to common shareholders $238.2 $231.1 $61.4 
                       Other effects on diluted earnings(1)  (.9) (2.6) (.1)


                      Net income before accounting changes and extraordinary items available to common shareholders $237.3 $228.5 $61.3 


                       Cumulative effect of changes in accounting principles      660.2 
                       Extraordinary income items  180.5    7.1 


                      Adjusted net income available to common shareholders $417.8 $228.5 $728.6 


                      Earnings per share denominators (in thousands):          
                      Basic earnings per share denominator (average Common Shares outstanding)  9,902  8,725  8,225 
                      Average outstanding dilutive warrants to acquire Common Shares(2)  565  944  799 


                      Diluted earnings per share denominator  10,467  9,669  9,024 


                      Basic earnings per share (in dollars):          
                      Net income before accounting changes and extraordinary items $24.05 $26.48 $7.47 
                       Cumulative effect of changes in accounting principles      80.27 
                       Extraordinary income items  18.23    .87 


                      Net income $42.28 $26.48 $88.61 


                      Diluted earnings per share (in dollars):          
                      Net income before accounting changes and extraordinary items $22.67 $23.63 $6.80 
                       Cumulative effect of changes in accounting principles      73.16 
                       Extraordinary income items  17.25    .79 


                      Net income $39.92 $23.63 $80.75 


                      (1)
                      The diluted earnings per share numerators for certain periods presented include an adjustment to White Mountains' equity in earnings related to its investment in the common shares of Montpelier, which is reflective of dilution in Montpelier's earnings brought about by outstanding warrants and options to acquire common shares of Montpelier that are in-the-money. As of March 31, 2004, White Mountains changed its method of accounting for this investment from equity accounting to

                        fair value, therefore, this equity adjustment is not applicable to periods beginning after March 31, 2004.

                      (2)
                      The diluted earnings per share denominators for the years ended December 31, 2004, 2003 and 2002 include the dilutive effects of average outstanding warrants to acquire 852,678, 1,724,200 and 1,724,200 Common Shares, respectively, at a strike price of $173.99 per Common Share. The warrants were fully exercised on June 29, 2004. The diluted earnings per share denominators presented exclude the anti-dilutive effects of outstanding Options and unearned restricted Common Shares outstanding that are being fully expensed over the vesting period.

                      Recently Adopted Changes in Accounting Principles

                      Variable Interest Entities
                      VIE.

                              In January 2003,accordance with the Financial Accounting Standards Board ("FASB") issued Interpretation No. 46,46-R, "Consolidation of Variable Interest Entities" ("FIN 46"46-R"), White Mountains consolidates VIEs for which addresses consolidation issues surrounding special purpose entities and certain other entities, collectively termed variable interest entities ("VIE"), to which previous accounting guidance on consolidation doesit is the primary beneficiary. White Mountains determines whether or not apply. A VIEit is an entity in which the equity investors do not have the characteristics of a controlling interest or do not have sufficient equity at risk for the entity to finance its activities without additional subordinated financial support from other parties. Under FIN 46, the primary beneficiary of a VIE is required to consolidateby first performing a qualitative analysis of the VIE that includes a review of, among other factors, its capital structure, contractual terms, which interest creates or absorbs variability, related party relationships and the design of the VIE. Where qualitative analysis is not conclusive, White Mountains performs a quantitative analysis to calculate whether White Mountains' financial interest in its financial statements. The primary beneficiarythe VIE is an entity that haslarge enough to absorb a variable interest that will absorb the majority of the VIE's expected losses, if they occur, receive a majority of the entity'sVIE's expected residual returns, if they occur, or both. White Mountains adopted the disclosure provisions of FIN 46 beginning with its December 31, 2002 Form 10-K and its consolidation provisions as of March 31, 2004. See Note 15.


                      Mandatorily Redeemable Preferred Stock

                              In July 2003, White Mountains adopted the provisions of SFAS No. 150, "Accounting for Certain Financial Instruments with Characteristics of both Liabilities and Equity" ("SFAS 150") and it subsequently adopted FASB Staff Position No. 150-3 ("FSP 150-3") in November 2003. SFAS 150, among other things, required an issuer of mandatorily redeemable financial instruments to classify such instruments as a liability and to initially measure the liability at its fair value. Subsequently, these instruments are to be measured at their present value, using the interest rate implicit at the inception of the contract. In addition, all future dividends paid to holders of those instruments, as well as any accretion related to those instruments, are to be reflected as interest expense. FSP 150-3 was released by the FASB in November 2003 and it indefinitely deferred the fair value measurement provisions of SFAS 150 for certain mandatorily redeemable noncontrolling interests. However, the presentation provisions of SFAS 150 are still applicable to those instruments.

                              White Mountains has two classes of mandatorily redeemable preferred stock of subsidiaries which were previously classified as minority interests, that fell within the scope of SFAS 150 and are considered noncontrolling interests under FSP 150-3. Upon adoption of SFAS 150 in 2003, White Mountains reclassified these instruments from mezzanine equity toand have been recorded as liabilities at their historical carrying values. In addition, beginning in the third quarter of 2003, all dividendsDividends and accretion on White Mountains' mandatorily redeemable preferred stock have been recorded as interest expense. See(See Note 10.13).

                      Minority Interest

                              Minority interests consist of the ownership interests of noncontrolling shareholders in consolidated subsidiaries, and are presented separately on the balance sheet. The portion of income attributable to minority interests is presented net of related income taxes in the statement of income and comprehensive income. The change in unrealized investment gains, foreign currency translation and the change in the fair value of the interest rate swap to hedge OneBeacon's exposure to variability in the interest rate on its mortgage note are presented in accumulated other comprehensive income net of minority interest. The percentage of the noncontrolling shareholders' ownership interest in OneBeacon Ltd. at December 31, 2007 and December 31, 2006 was 27.1% and 27.6%.

                              White Mountains began to present minority interest subsequent to the OneBeacon Offering. The portion of income attributable to minority interest in certain limited partnership investments has been reclassified to conform with the presentation of the minority interest in OneBeacon Ltd.

                              On May 24, 2007, White Mountains Re Group, Ltd. ("WMRe Group"), an intermediate holding company of White Mountains Re, issued 250,000 non-cumulative perpetual preference shares with a $1,000 per share liquidation preference ("the WMRe Preference Shares"). Proceeds of $245.7 million, net of $4.3 million of issuance costs and commissions, were received from the issuance. These shares were issued in an offering that was exempt from the registration requirements of the Securities Act of 1933. Holders of the WMRe Preference Shares receive dividends on a non-cumulative basis when and if declared by WMRe Group. The holders of the WMRe Preference Shares have the right to elect two directors to WMRe Group's board in the event of non-payment of dividends for six quarterly dividend periods. The right ceases upon the payment of dividends for four quarterly periods or the redemption of the WMRe Preference Shares. In addition, WMRe Group may not declare or pay dividends on its common shares (other than stock dividends and dividends paid for purposes of any employee benefit plans of WMRe Group and its subsidiaries) unless it is current on its most recent dividend period. The dividend rate is fixed at an annual rate of 7.506% until June 30, 2017. After June 30, 2017, the dividend rate will be paid at a floating annual rate, equal to the greater of 3 month LIBOR plus 3.20% or 7.506%. The WMRe Preference Shares are redeemable solely at the discretion of WMRe Group on or after June 30, 2017 at their liquidation preference of $1,000 per share, plus any declared but unpaid dividends. Prior to June 30, 2017, WMRe Group may elect to redeem the WMRe Preference Shares at an amount equal to the greater of 1) the aggregate liquidation preference of the shares to be redeemed and 2) the sum of the present values of the aggregate liquidation preference of the shares to be redeemed and the remaining scheduled dividend payments on the shares to be redeemed (excluding June 30, 2017), discounted to the redemption date on a semi-annual basis at a rate equal to the rate on a comparable treasury issue, plus 45 basis points. In the event of liquidation of WMRe Group, the holders of the WMRe Preference Shares would have preference over the common shareholders and would receive a distribution equal to the liquidation preference per share, subject to availability of funds. The WMRe Preference Shares and dividends thereon are included in minority interest on the balance sheet and as minority interest expense on the statement of income and comprehensive income, respectively.


                      Recently Adopted Changes in Accounting Principles

                      Federal, State and Foreign Income Taxes

                              On January 1, 2007 White Mountains adopted FASB Interpretation No. 48,Accounting for Uncertainty in Income Taxes ("FIN 48"). FIN 48 prescribes when the impact of a given tax position should be recognized and how it should be measured. Under the new guidance, recognition is based upon whether or not a company determines that it is more likely than not that a tax position will be sustained upon examination based upon the technical merits of the position. In evaluating the more-likely-than-not recognition threshold, White Mountains must presume that the tax position will be subject to examination by a taxing authority with full knowledge of all relevant information. If the recognition threshold is met, then the tax position is measured at the largest amount of benefit that is more than 50% likely of being realized upon ultimate settlement.

                              In connection with the adoption of FIN 48, White Mountains recognized a $.2 million decrease in the liability for unrecognized tax benefits, primarily as a result of reductions in its estimates of accrued interest. The effect of adoption has been recorded as an adjustment to opening retained earnings.

                      Stock-BasedDefined Benefit Pension and Other Postretirement Plans

                              In September 2006, the FASB issued Statement of Financial Accounting Standards No. 158,Employers' Accounting for Defined Benefit Pension and Other Postretirement Plans ("FAS 158") which amends FASB Statement Nos. 87, 88, 106 and 132(R). The Statement requires an employer that sponsors a defined benefit plan to recognize the funded status of a benefit plan, measured as the difference between plan assets at fair value and the projected benefit obligation (for defined benefit pension plans) or the accumulated benefit obligation (for other postretirement benefit plans) in its statement of financial position. The Statement also requires recognition of amounts previously deferred and amortized under FAS 87 and FAS 106 in other comprehensive income in the period in which they occur. Under the new Statement, plan assets and obligations must be measured as of the fiscal year end. The recognition provisions of the Statement are effective for fiscal years ending after December 15, 2006. The measurement provisions of the Statement are effective for fiscal years ending after December 15, 2008. White Mountains recognized an increase to ending accumulated other comprehensive income of $4.1 million upon adoption of the recognition provisions of FAS 158 at December 31, 2006.

                      Share-Based Compensation

                              In December 2002,2004, the FASBFinancial Accounting Standards Board issued SFAS No. 148, "Accounting for Stock-Based Compensation—Transition and Disclosure"Statement of Financial Accounting Standard ("SFAS 148"FAS"), an amendment to SFAS No. 123 "Accounting for Stock-Based Compensation"(Revised), "Share-Based Payment" ("SFAS 123"). Among other things, SFAS 148 amends the disclosure provisions


                      of SFAS 123 to require prominent annual disclosure about the effects on reported net income in the Summary of Significant Accounting Policies and also requires disclosure about these effects in interim financial statements. Accordingly, the Company has adopted the applicable disclosure requirements of this statement for year-end and interim reporting.

                              White Mountains' share-based compensation plans, consisting primarily of performance shares with limited use of restricted Common Share awards ("Restricted Shares") and a one-time grant of incentive stock options to acquire Common Shares ("Options"FAS 123R"), are designedwhich is a revision to maximize shareholder value over long periods of time by aligning the financial interests of its management with those of its owners. Performance shares are payable only upon achievement of pre-defined business goalsFAS 123 and are valued based on the market value of Common Shares at the time awards are earned. Performance shares are typically paid in cash, though they may be paid in Common Shares at the election of the Board of Directors, or may be deferred in accordance with the terms of the Company's deferred compensation plans.

                              White Mountains expenses the full cost of all its share-based compensation, including its outstanding Options. White Mountains' share-based compensation plans, consisting primarily of performance shares, are designed to maximize shareholder value over long periods of time by aligning the financial interests of its management with those of its owners. See Note 9. White Mountains accounts for these plans under the recognition and measurement principles ofsupersedes Accounting Principles Board Opinion No. 25, ("APB 25"), "Accounting for Stock Issued to Employees" ("APB 25"), and related interpretations, including FASB Interpretation No. 28, "Accounting for Stock Appreciation Rights and Other Variable Stock Options or Award PlansPlans" ("FIN 28"). The accounting treatmentEffective January 1, 2006, White Mountains adopted FAS 123R to account for White Mountains' Restricted Shareits share-based compensation under the modified prospective method of adoption. Under this method of adoption, FAS 123R applies to new grants of share-based awards, under APB 25 is identical toawards modified after the method prescribed by SFAS 123, wherebyeffective date and the Restricted Shares are valued based uponremaining portion of the fair value of the unvested awards at the dateadoption date. The unvested portion of issuanceWhite Mountains incentive stock options ("Incentive Options"), restricted common share awards ("Restricted Shares") and charged to compensation expense ratably over the service period. Compensation expense charged to earnings for Restricted Shares was $2.0 million, $5.8 million and $16.2 million for the years ended December 31, 2004, 2003 and 2002, respectively. The accounting treatment for White Mountains' performance share awards outstanding as of January 1, 2006, as well as new awards, are subject to the fair value measurement and recognition requirements of FAS 123R.

                              Prior to adoption of FAS 123R, White Mountains accounted for performance shares, Restricted Shares and Incentive Options under the recognition and measurement principles of APB 25 is also identical toand FIN 28, and adopted the method prescribed by SFAS 123, wherebydisclosure provisions of FAS 123. Under APB 25 and FIN 28, the liability for the compensation cost for performance share awards iswas measured each period based upon the current market price of the underlying Common Shares. During 2004, 2003 and 2002,common shares. The compensation cost recognized for White Mountains recorded compensation charges of $215.0 million, $206.6 million and $63.5 million, respectively, for outstanding performance shares.

                              In 2000, the Company issued a one-time award of 81,000 Options. The Options were issued at an exercise price equal to the marketMountains' Restricted Shares under APB 25 was based upon fair value of the underlying Common Shares on February 27, 2000 (the grant date).award at the date of issuance and was charged to compensation expense ratably over the service period. Forfeitures were recognized as they occurred. Upon adoption of FAS 123R, an estimate of future forfeitures was incorporated into the determination of the compensation cost for performance shares and Restricted Shares. The effect of this change was immaterial.

                              White Mountains' Incentive Options have an escalating exercise price escalatesand vest on a straight-linepro rata basis by 6% per annum over the ten-year life of the Options.service period. As a result, the Company's outstanding Incentive Options arewere accounted for as variable optionsawards under FIN 28, with compensation expense charged to earnings over the service period based on the intrinsic value of the underlying Common Shares. Compensationcommon shares and with forfeitures recognized as they occurred. Upon adoption of FAS 123R, the grant date fair value of the awards, adjusted for estimated future forfeitures, became the basis for recognition of compensation expense charged to earnings for Options was $9.0 million, $7.4 million and $.7 million for the years ended December 31, 2004, 2003 and 2002, respectively. At December 31, 2004, the Company had 46,530 Options outstanding (10,530 of which were exercisable) with a weighted average exercise price of $140.80 per Common Share. During the year ended December 31, 2004, 4,035 Options were exercised at an average exercise price of $139.58 per Common Share.Incentive Options.


                              White Mountains has adopted the disclosure-only provisions of SFAS 123 with respect to its outstanding Options and Restricted Shares.        The following table illustrates the pro forma effect on net income and earnings per share for each period indicatedthe years ended December 31, 2005 as if the Company had applied the fair value recognition provisions of SFASFAS 123 to its employee Option incentive compensation program. The effects of Restricted Share and performance share expense are not included below because theIncentive Options at those times.


                      Millions, except per share amounts

                       Year Ended December 31, 2005
                       
                      Net income, as reported $290.1 
                       Incentive Option expense (income) included in reported net income  (3.5)
                       Incentive Option expense (income) determined under fair value based method  (.1)
                        
                       
                      Net income, pro forma $286.5 
                        
                       
                      Earnings per share:    
                        Basic—as reported $26.96 
                        Basic—pro forma  26.63 
                        Diluted—as reported  26.56 
                        Diluted—pro forma  26.56 

                      accounting treatment that the Company follows under APB 25 is identical to the fair value accounting prescribed by SFAS 123 for these instruments.

                       
                       Year Ended December 31,
                       
                      Millions, except per share amounts

                       
                       2004
                       2003
                       2002
                       
                      Net income, as reported $418.7 $280.6 $748.1 
                       Add: Option expense included in reported net income  9.0  7.4  .7 
                       Deduct: Option expense determined under fair value based method  (.1) (.1) (.1)


                      Net income, pro forma $427.6 $287.9 $748.7 


                      Earnings per share:          
                       Basic—as reported $42.28 $26.48 $88.61 
                       Basic—pro forma  43.18  27.32  88.67 
                       Diluted—as reported  39.92  23.63  80.75 
                       Diluted—pro forma  40.77  24.39  80.81 


                      Business Combinations
                      Hybrid Financial Instruments

                              In 2001, White Mountains adopted the provisions of SFAS No. 141, "Business Combinations", which required the recognition of all existing deferred credits (defined as the excess of fair value of acquired assets over cost) arising from business combinations prior to July 1, 2001 through the income statement as a change in accounting principle on the first day of the fiscal year beginning after December 15, 2001. In accordance with SFAS 141, White Mountains recognized its entire December 31, 2001 unamortized deferred credit balance of $682.5 million on January 1, 2002 as a cumulative effect of a change in accounting principle. SFAS 141 also requires deferred credits arising from business combinations on or after July 1, 2001 to be immediately recognized through the income statement as an extraordinary gain. See Note 2.

                      On January 1, 2002, White Mountains adopted the provisions of SFAS No. 142, "Goodwill and Other Intangible Assets", which calls for the amortization of existing and prospective goodwill (defined as the excess of cost over the fair value of acquired assets) only when the assets acquired are deemed to have been impaired rather than systematically over a perceived period of benefit. SFAS 142 specifically defines impairment as the condition that exists when the carrying amount of goodwill exceeds its implied fair value and requires goodwill to be evaluated for impairment periodically. Prior to the issuance of SFAS 142, little guidance existed as to how to determine and measure goodwill impairment. As a result of the issuance of SFAS 142, White Mountains performed a discounted cash flow analysis to determine the fair value of the net assets supporting its unamortized goodwill relating primarily to its 2000 acquisition of substantially all the reinsurance operations of Risk Capital Reinsurance Company ("Risk Capital") and recognized a transitional impairment loss of $22.3 million on January 1, 2002 as a cumulative effect of a change in accounting principle.


                      Employer's Disclosures about Pensions and Other Post Retirement Benefits

                              In December 2003,February 16, 2006, the FASB issued SFASFAS No. 132 (Revised 2003), "Employer's Disclosures about Pensions155, "Accounting for Certain Hybrid Instruments, an amendment to Statement Nos. 133 and Other Post Retirement Benefits,"140" ("SFAS 132(R)"FAS 155"). This statement retainsThe Statement eliminates the disclosure requirements contained in SFAS No. 132, "Employers' Disclosures about Pensions and Other Postretirement Benefits," which it replaces. Additionally, SFAS 132(R) requires more detailed disclosures about pension plan assets, benefit obligations, cash flows, benefit costs and related information. White Mountains has includedrequirement to bifurcate financial instruments with embedded derivatives if the disclosures required by SFAS 132(R)holder of the instrument elects to account for the years ended December 31, 2004 and 2003. See Note 8.


                      Other-Than-Temporary Impairment Disclosures

                              In Decemberentire instrument on a fair value basis. Changes in fair value are recorded as realized gains. The fair value election may be applied upon adoption of 2003, White Mountains adopted FASB Emerging Issues Task Force ("EITF") Issue 03-01, "The Meaning of Other-Than-Temporary Impairment and Its Applicationthe statement for hybrid instruments that had been bifurcated under FAS 133 prior to Certain Investments" ("EITF 03-01"). EITF 03-01 provides new disclosure requirements for other-than-temporary impairments on debt and equity investments. Investors are required to disclose quantitative information about: (i) the aggregate amount of unrealized losses, and (ii) the aggregate related fair values of investments with unrealized losses, segregated into time periods during which the investment has been in an unrealized loss position of less than 12 months and greater than 12 months. In addition, investors are required to disclose the qualitative information that supports their conclusion that the impairments noted in the quantitative disclosures are not other-than temporary. See Note 5.

                      Recently Issued Accounting Pronouncements

                              In December 2004, the FASB issued SFAS No. 123 (Revised 2004), "Share-Based Payment," "(SFAS 123(R)". SFAS 123(R) is a revision of FASB Statement 123, "Accounting for Stock-Based Compensation" and supersedes APB Opinion No. 25, "Accounting for Stock Issued to Employees," and its related implementation guidance.adoption. The Statement focuses primarily on accountingis effective for transactions in which an entity obtains employee services in share-based payment transactions. SFAS No. 123 (R) requires a public entity to measure the cost of employee services received in exchange for an award of equity instruments based on the grant-date fair value of the award. That cost is to be recognized over the period during which an employee is required to provide service in exchange for the award. This statement is effectivefiscal years commencing after September 15, 2006 with early adoption permitted as of the beginning of an entity's fiscal year.

                              White Mountains adopted FAS 155 effective January 1, 2006. See Convertible bonds section of this note for discussion of effect of adoption.

                      Recent Accounting Pronouncements

                      Fair Value Measurements

                              In September 2006, the first interimFASB issued Statement of Financial Accounting Standards No. 157,Fair Value Measurements ("FAS 157"). The Statement provides a revised definition of fair value and guidance on the methods used to measure fair value. The Statement also expands financial statement disclosure requirements for fair value information. The Statement establishes a fair value hierarchy that distinguishes between inputs based on market data from independent sources ("observable inputs") and a reporting entity's internal assumptions based upon the best information available when external market data is limited or annual reporting periodunavailable ("unobservable inputs"). The fair value hierarchy in FAS 157 prioritizes inputs within three levels. Quoted prices in active markets have the highest priority (Level 1) followed by observable inputs other than quoted prices (Level 2) and unobservable inputs having the lowest priority (Level 3). The Statement is effective for financial statements issued for fiscal years beginning after November 15, 2007 and must be adopted prospectively. White Mountains will adopt FAS 157 effective January 1, 2008. Upon adoption of FAS 157 White Mountains expects that beginswith the exception of its investments in hedge funds and private equity funds, its fair value measurements will not change materially. White Mountains holds a number of investments in hedge funds and private equity investment partnerships, the carrying value of which may be affected by the effect of adoption of FAS 157 by those investment partnerships. The hedge funds and private equity funds that the Company holds investments in have not yet provided an assessment of the effect of adoption of FAS 157. As a result, White Mountains is not yet able to determine the potential effect of adoption on the carrying value of its investments in hedge funds and private equity funds.


                      Fair Value Option

                              In February 2007, the FASB issued Statement of Financial Accounting Standards No. 159,The Fair Value Option for Financial Assets and Financial Liabilities ("FAS 159"). The Statement allows companies to make an election, on an individual instrument basis, to report financial assets and liabilities at fair value. The election must be made at the inception of a transaction and may not be reversed. The election may also be made for existing financial assets and liabilities at the time of adoption. Unrealized gains and losses on assets or liabilities for which the fair value option has been elected are to be reported in earnings. The Statement requires additional disclosures for instruments for which the election has been made, including a description of management's reasons for making the election. The Statement is effective for fiscal years beginning after JuneNovember 15, 20052007 and will be adopted prospectively. White Mountains will adopt FAS 159 effective January 1, 2008. The Company has decided to make the fair value election for its portfolio of available for sale securities, its investments in investment partnerships and for its assumed variable annuity GMDB guarantee liabilities. Upon adoption, White Mountains will increase retained earnings and decrease accumulated other comprehensive income by $208.9 million to reclassify net unrealized gains and net unrealized foreign currency translation gains related to available for sale securities. In addition, White Mountains expects to record a decrease of less than $1 million to retained earnings as of January 1, 2008 related to the combined effect of adopting FAS 157 and FAS 159 for its variable annuity liabilities. Subsequent to adoption, the Company will adoptreport changes in fair value in pre-tax income rather than through other comprehensive income, net of tax. The Company believes that making the standardelection for its portfolio of investment securities and investments in hedge funds and private equity funds will result in reporting its investment results on a basis consistent with one of its operating principles, namely to manage investments for total return. With respect to the variable annuity GMDB guarantees, making the election will result in recognition of changes in fair value on the same basis used by the Company to economically hedge its variable annuity guarantee liabilities.

                      Business Combinations and Non-controlling interests

                              In December 2007, the FASB issued FAS 141 (Revised 2007),Business Combinations ("FAS 141R") and FAS 160,Noncontrolling Interests—an amendment to ARB 51. FAS 141R and FAS 160 are effective for fiscal years beginning after December 15, 2008. White Mountains is in the third quarterprocess of fiscal 2005. White Mountains doesevaluating the potential effect of adoption. FAS 141R requires the acquiring company to recognize the fair value of all assets acquired and liabilities assumed at their fair values at the acquisition date, with certain exceptions. This represents a basic change in approach from the old cost allocation method originally described in FAS 141. In addition, FAS 141R changes the accounting for step acquisitions since it requires recognition of all assets acquired and liabilities assumed, regardless of the acquirer's percentage of ownership in the acquired company. This means that the acquirer will measure and recognize all of the assets, liabilities and goodwill, not expectjust the acquirer's share. Assets and liabilities arising from contractual contingencies are to be recognized at the acquisition date, at fair value. Non-contractual contingencies are to be recognized when it is more likely than not that they meet the CON 6 criteria for an asset or liability. Acquisition related costs, such as legal fees and due diligence costs would be expensed and would not be recognized as part of goodwill. Changes in the amount of deferred taxes arising from a material effectbusiness combination are to be recognized in either income or through a change in contributed capital, depending on its financial condition, resultsthe circumstances. Previously under FAS 109, such changes were recognized through goodwill. The classification of operationsinsurance and reinsurance contracts are re-evaluated at the acquisition date only if their terms were changed in connection with the acquisition.

                              FAS 160 requires all companies to account for minority interests in subsidiaries as equity, clearly identified and presented separately from parent company equity. Once a controlling interest has been acquired, any subsequent acquisitions or cash flowsdispositions of noncontrolling interest that do not result in a change of control are to be accounted for as equity transactions. Assets and liabilities acquired are measured at fair value only once; at the original acquisition date, i.e., the date at which the acquirer gained control.


                      NOTE 2. Significant Transactions

                      Sirius
                      Share Repurchase

                              On April 16, 2004,October 26, 2007, White Mountains repurchased 282,341 of its common shares for $500 per share, or $141 million, in a transaction with an institutional investor. On November 26, 2007, White Mountains repurchased an additional 8,500 of its common shares for $500 per share, or $4 million. These transactions were the first repurchases under the previously announced share repurchase plan authorized by White Mountains' Board of Directors on November 17, 2006. There are 709,159 shares remaining for future share repurchases under the plan.

                      Mutual Service Casualty

                              On December 22, 2006, White Mountains Re completed its acquisition of Mutual Service Casualty Insurance Company ("Mutual Service Casualty"), a runoff insurer formerly affiliated with Country Insurance & Financial Services. As part of a sponsored demutualization and conversion to a stock company, Mutual Service Casualty has been renamed Stockbridge Insurance Company ("Stockbridge"). White Mountains Re paid approximately $33.6 million for Stockbridge and recorded an after-tax extraordinary gain of $21.4 million, which represents the excess of fair value of acquired Sirius from ABB Ltd. (the "Sirius Acquisition") for SEK 3.27 billion (approximately $427.5assets over the purchase price. The fair value of net assets acquired were $55.1 million, based upon the foreign exchange spot rate at the date of acquisition), which includes $10.5including $81.0 million of expenses incurredcash and investments, $55.5 million of reinsurance recoverables, $12.2 million of deferred tax assets, $91.2 million of loss and LAE reserves and $2.3 million of deferred tax liabilities.

                      OneBeacon

                              On November 14, 2006, in connection with the acquisition. The principal companies acquired were OneBeacon Offering, White Mountains sold 27.6 million common shares, or 27.6%, of its subsidiary OneBeacon Ltd. for net proceeds of $650.3 million in cash. As a result of the sale, White Mountains recorded a gain of $171.3 million, which represents the excess of the offering proceeds over 27.6% of the book value of OneBeacon at the time of the sale.

                      Main Street America

                              On October 31, 2006, White Mountains' investment in Main Street America Holdings, Inc. ("MSA") was restructured. White Mountains received a $70 million cash dividend from MSA, following which White Mountains sold its 50% common stock investment in MSA to Main Street America Group, Inc. ("the MSA Group") for (i) $70.0 million in 9.0% non-voting cumulative perpetual preferred stock of the MSA Group, and (ii) $24.5 million, or 4.9%, of the common stock of the MSA Group. These transactions resulted in a net after tax realized gain of $8.5 million.

                      Sirius International Insurance Corporation ("Sirius International"),America

                              On August 3, 2006, White Mountains Re sold its wholly-owned subsidiary, Sirius America, Insurance Company ("to an investor group for $138.8 million in cash, which was $16.9 million above the book value of Sirius America") and Scandinavian Reinsurance Company Ltd. ("Scandinavian Re"). Sirius International is domiciled in Sweden and has offices in Belgium, Hamburg, London, Singapore, Stockholm and Zurich.America at the time of the sale. Sirius America is a U.S.-based insurer focused on primary insurance programs that was acquired by Folksamerica as part of the transaction. Scandinavian Re isacquisition of Sirius in 2004.

                              As part of the transaction, White Mountains acquired an equity interest of approximately 18% in the acquiring entity, Delos, and accounts for Delos under the equity method. White Mountains recognized a reinsurance company thatgain of $14.0 million ($9.1 million after tax) on the sale through other revenues and has beendeferred $2.9 million ($1.9 million after tax) of the gain related to its remaining equity interest in run-off since 2002.Delos (See Note 17).

                      National Farmers Union Property and Casualty Company

                              The Sirius Acquisition was accountedOn September 30, 2005, OneBeacon sold National Farmers Union Property and Casualty Company ("NFU") to QBE Insurance Group for by$138.3 million in cash and recognized a gain of approximately $26.2 million ($21.7 million after-tax) on the purchase methodsale through other revenues.


                      Other Acquisitions and Dispositions

                              On October 1, 2007, substantially all of accounting and, therefore, the identifiable assets and liabilities of SiriusStockbridge were recorded by White Mountains at their fair values on April 16, 2004. The process of determining the fair value of such assetstransferred to Folksamerica through a Transfer and liabilities acquired was as follows: (1) the purchase price of Sirius was preliminarily allocated to the acquired assets and liabilities, based on their respective estimated fair values at April 16, 2004; (2) the excessAssumption Agreement (the "Portfolio Transfer"). As a result of the estimated fair value of acquired net assets over the purchase pricePortfolio Transfer, Stockbridge was usedleft with minimum capital and surplus to reduce the estimated fair values of all non-current, non-financial assets acquired to zero; and (3) the remaining excess of the estimated fair value of net assets over the purchase price was recorded as an extraordinary gain.


                              The fair value of identifiable assets and liabilities acquired on April 16, 2004 were as follows (in millions):

                      Fair value of assets acquired $3,306.9 
                      Fair value of liabilities acquired  2,768.0 
                        
                       
                      Fair value of net assets acquired  538.9 
                      Total purchase price, including expenses  (427.5)
                        
                       
                      Resulting extraordinary gain $111.4 


                              Significant assets and liabilities acquired through Sirius included $1,851.9 million of cash and investments, $790.1 million of funds held by ceding companies, $286.2 million of reinsurance recoverable on paid and unpaid losses, $245.8 million of insurance and reinsurance balances receivable, $1,612.7 million of loss and loss adjustment expense reserves, $432.2 million of reserves for structured settlements, $276.5 million of unearned insurance premiums and $289.4 million of deferred tax liabilities.

                              Supplemental unaudited pro forma condensed combined income statement information for the year ended December 31, 2004, which assumes that the Sirius Acquisition had occurred as of January 1, 2004, and for the year ended December 31, 2003, which assumes the Sirius Acquisition had occurred as of January 1, 2003, follows:

                       
                       Pro Forma Twelve Months Ended December 31, 2004
                       Pro Forma Twelve Months Ended December 31, 2003
                       
                       (Unaudited)
                      Millions, except per share amounts

                      Total revenues $4,699.7 $4,408.3
                      Income before extraordinary items $273.4 $262.0
                      Net income $453.9 $347.5
                      Earnings per share:      
                       Pro forma net income—basic $45.83 $34.15
                       Pro forma net income—diluted $43.28 $30.55


                              The unaudited pro forma information presented above for the years ended December 31, 2004 and 2003 has been supplied for comparative purposes only and does not purport to reflect the actual results that would have been reported had the Sirius Acquisition been consummated at January 1, 2004 and 2003, respectively. Additionally, such pro forma financial information does not purport to represent results that may occur in the future.


                      Symetra

                              On August 2, 2004, White Mountains, Berkshire Hathaway Inc. ("Berkshire") and several other private investors capitalized Symetra Financial Corporation ("Symetra") in order to purchase the life and investments operations of Safeco Corporation for $1.35 billion. The acquired companies, which are now operating under the Symetra brand, focus mainly on group insurance, individual life insurance, structured settlements and retirement services. Symetra had an initial capitalization of approximately $1.4 billion, consisting of $1,065 million of common equity and $315 million of bank debt. White Mountains invested $194.7 million in Symetra in exchange for 2.0 million common shares of Symetra. In addition, White Mountains and Berkshire each received warrants to acquire an additional 1.1 million common shares of Symetra at $100 per share. White Mountains owns approximately 19% of the


                      outstanding common shares of Symetra, which are accounted for under the equity method, and approximately 24% of Symetra on a fully-converted basis including the warrants, which are accounted for under the provisions of SFAS No. 133, "Accounting for Derivative Instruments and Hedging Activities" ("FAS 133"). Three White Mountains designees serve on Symetra's eight member board of directors.

                              White Mountains recordedmaintain its initial investment in Symetra in accordance with GAAP by allocating the $194.7 million purchase price between the common shares and the warrants. The allocation was determined by recording the warrants at their fair value of $35.4 million, with the remaining $159.3 million allocated to the common shares. White Mountains then recognized an extraordinary gain of $40.7 million, representing the difference between the initial cost of the common shares and the amount of White Mountains' equity in the underlying net assets of Symetra, as required by APB 18, "The Equity Method of Accounting for Investments in Common Stock".


                      Sierra

                              On March 31, 2004, Folksamerica acquired the Sierra Insurance Group companies (the "Sierra Group"), consisting of California Indemnity Insurance Company and its three subsidiaries, from Nevada-based Sierra Health Services, Inc. Folksamerica paid $76.2 million for the Sierra Group, which included $14.2 million in cash and a $62.0 million purchase note (see Note 6), of which $58.0 million will be adjusted over its six-year term to reflect favorable or adverse loss reserve development on the acquired reserve portfolio and run-off of remaining policies in force (mainly workers compensation business) as well as certain other balance sheet protections. The acquired companies' net assets at the time of the close were $84.8 million, including $270.3 million of investments, $174.4 million of reinsurance balances recoverable, $406.9 million of loss and loss adjustment expense reserves and $25.1 million of unearned premium. The acquisition resulted in an $8.6 million extraordinary gain, which White Mountains recognized in the first quarter of 2004.


                      Tryg-Baltica

                              On November 11, 2004, Sirius International acquired 100% of Denmark-based Tryg-Baltica Forsikring, internationalt forsikringsselskab A/S ("Tryg Baltica"). Under the terms of the agreement, Sirius paid approximately DKK 316.3 million ($57.7 million) and an additional $0.3 million of expenses incurred in connection with the acquisition. Following the closing, White Mountains Re placed Tryg-Baltica into run-off, though it is anticipated that select business will be renewed by Sirius International. White Mountains Re did not acquire any infrastructure or employees and will manage the company's run-off administration. The acquired companies' net assets at closing were $77.5 million, including $144.3 million of cash and investments, $86.7 million of receivables, $20.8 million of deposits with insurance companies, $150.8 million of loss and LAE reserves and $36.9 million of unearned insurance premiums. The acquisition resulted in a $19.8 million extraordinary gain, which White Mountains recognized in the fourth quarter of 2004.


                      Other Acquisitions and Dispositions

                      licenses. During the fourth quarter of 2004, OneBeacon2007, White Mountains Re sold two of its subsidiaries, Potomac Insurance Company of Illinois ("Potomac")100% ownership interest in Stockbridge for $21.7 million and Western States Insurance Company ("Western States"), as well as its boiler inspection service business, for $15.1approximately $26.2 million and recognized combined gainsa $10.0 million pre-tax gain on the sales of $22.1 millionsale through other revenues.

                              During the third quarter of 2004, OneBeacon entered into an agreement to sell the renewal rights to most of its pre-Atlantic Mutual (defined below) New York commercial business to Tower Insurance Group. The transaction, effective with December 1, 2004 renewals, will impact approximately


                      $110.0 million of premiums. OneBeacon will retain the commercial business acquired from Atlantic Mutual (defined below).

                              On March 31, 2004, OneBeacon acquired Atlantic Specialty Insurance Company ("Atlantic Specialty"), a subsidiary of Atlantic Mutual Insurance Company ("Atlantic Mutual"), and the renewal rights to Atlantic Mutual's segmented commercial insurance business, including the unearned premiums on the acquired book (the "Atlantic Specialty Transaction"). The overall gross written premium for this book of business totals approximately $400 million. Under the terms of the agreement, OneBeacon will pay Atlantic Mutual a renewal commission on the premiums renewed. In connection with its acquisition of Atlantic Specialty, OneBeacon paid $30.1 million in cash and issued a $20.0 million note to the seller. See Note 6.

                              During the first quarter of 2004, White Mountains purchased additional warrants to acquire 2,390,786 common shares of Montpelier Re Holdings Ltd. ("Montpelier") from an existing warrant holder for $54.1 million in cash. Also during the first quarter of 2004, White Mountains sold 4.5 million common shares of Montpelier to third parties for net proceeds of $155.3 million. As a result of this sale, as well as changes to the composition of the Board of Directors of both Montpelier and White Mountains, White Mountains changed the method of accounting for its remaining common share investment in Montpelier as of March 31, 2004 from an equity method investment in an unconsolidated affiliate to a common equity security classified as available for sale and carried at fair value. See Note 5.

                              In January 2004, Folksamerica sold Peninsula to the Donegal Group for $23.3 million, or 107.5% of its GAAP book value, resulting in a pretax gain of $2.1 million, which White Mountains recognized in the first quarter of 2004.

                              Effective October 1, 2003, Folksamerica acquired renewal rights to the property and casualty treaty reinsurance business of CNA Reinsurance ("CNA Re"), a division of CNA Financial Corporation. Under the terms of the transaction, Folksamerica will compensate CNA Re based upon the amount of premiums renewed by Folksamerica over the next two contract renewals. No reserves or liabilities were transferred. In connection with this transaction, Folksamerica established an underwriting office in Chicago staffed with a number of reinsurance professionals previously employed by CNA Re.

                              In December 2003,2007, OneBeacon sold one of its wholly-ownedinactive licensed subsidiaries, NFU Standard,American Employers' Insurance Company, to Quanta U.S. Holdings, Inc., an indirect subsidiarya third party for $47.7 million in cash and recorded a pre-tax gain of Quanta Capital Holdings Ltd. OneBeacon received$11.3 million.

                              On May 1, 2007, White Mountains sold all of its remaining interest in Montpelier Re, which consisted of 939,039 common shares and warrants to purchase 7,172,376 common shares, for total proceeds of $22.4$65.0 million and recognized an after tax loss of $1.8 million.

                              On September 29, 2006, OneBeacon transferred certain assets and the right to renew existing policies of its Agri division to QBE for $32.0 million in cash and recorded an $8.7a gain of $30.4 million gain on the sale which is included inthrough other revenues. Concurrently, OneBeacon entered into an assumption reinsurance agreement to assume all in-force insurance contracts

                              On September 30, 2005, White Mountains Re sold one of NFU Standard, subject to regulatory and other approvals.

                              In April 2002, Folksamerica acquired Imperial Casualty andits subsidiaries, California Indemnity Insurance Company, ("Imperial") for $4.2total proceeds of $19.8 million, including related expenses ($.5$19.3 million net of which was paid in cash, acquired). Significant assets and liabilities acquired included investments of $22.8 million and gross loss and LAE reserves of $11.9 million. In accordance with SFAS 141, White Mountains recognized a $7.1gain of approximately $5.0 million extraordinary($3.3 million after-tax) on the sale through other revenues.

                              On August 2, 2005, OneBeacon sold one of its subsidiaries, Traders and Pacific Insurance Company ("TPIC"), to Endurance Reinsurance for $23.4 million in cash and recognized a gain during 2002 representingof approximately $8.0 million ($5.2 million after-tax) on the excess of the fair value of Imperial's net assets over its cost.sale through other revenues.


                      NOTE 3. Reserves for Unpaid Losses and Loss Adjustment Expenses

                      Insurance

                              White Mountains' insurance subsidiaries establish loss and LAE reserves that are estimates of amounts needed to pay claims and related expenses in the future for insured events that have already occurred. The process of estimating reserves involves a considerable degree of judgment by management and, as of any given date, is inherently uncertain.


                              Reserves are typically comprised of (1) case reserves for claims reported and (2) reserves for losses that have occurred but for which claims have not yet been reported, referred to as incurred but not reported ("IBNR") reserves, which include a provision for expected future development on case reserves. Case reserves are estimated based on the experience and knowledge of claims staff regarding the nature and potential cost of each claim and are adjusted as additional information becomes known or payments are made. IBNR reserves are derived by subtracting paid loss and LAE and case reserves from estimates of ultimate loss and LAE. Actuaries estimate ultimate loss and LAE using various generally accepted actuarial methods applied to known losses and other relevant information. Like case reserves, IBNR reserves are adjusted as additional information becomes known or payments are made.

                              Ultimate loss and LAE are generally determined by extrapolation of claim emergence and settlement patterns observed in the past that can reasonably be expected to persist into the future. In forecasting ultimate loss and LAE with respect to any line of business, past experience with respect to that line of business is the primary resource, but cannot be relied upon in isolation. White Mountains' own experience, particularly claims development experience, such as trends in case reserves, payments on and closings of claims, as well as changes in business mix and coverage limits, is the most important information for estimating its reserves. External data, available from organizations such as statistical bureaus, consulting firms and reinsurance companies, is sometimes used to supplement or corroborate White Mountains' own experience, and can be especially useful for estimating costs of new business. For some lines of business, such as "long-tail" coverages discussed below, claims data reported in the most recent accident year is often too limited to provide a meaningful basis for analysis due to the typical delay in reporting of claims. For this type of business, White Mountains uses a selected loss ratio method for the initial accident year or years. This is a standard and accepted actuarial reserve estimation method in these circumstances in which the loss ratio is selected based upon information used in pricing policies for that line of business, as well as any publicly available industry data, such as industry pricing, experience and trends, for that line of business.


                              Uncertainties in estimating ultimate loss and LAE are magnified by the time lag between when a claim actually occurs and when it is reported and settled. This time lag is sometimes referred to as the "claim-tail". The claim-tail for most property coverages is typically short (usually a few days up to a few months). The claim-tail for liability/casualty coverages, such as automobile liability, general liability, products liability, multiple peril coverage, and workers compensation, can be especially long as claims are often reported and ultimately paid or settled years, even decades, after the related loss events occur. During the long claims reporting and settlement period, additional facts regarding coverages written in prior accident years, as well as about actual claims and trends may become known and, as a result, White Mountains may adjust its reserves. If management determines that an adjustment is appropriate, the adjustment is booked in the accounting period in which such determination is made in accordance with GAAP. Accordingly, in the future should reserves need to be increased or decreased in the future from amounts currently established, future results of operations would be negatively or positively impacted, respectively.as applicable.

                              In determining ultimate loss and LAE, the cost to indemnify claimants, provide needed legal defense and other services for insureds and administer the investigation and adjustment of claims are considered. These claim costs are influenced by many factors that change over time, such as expanded coverage definitions as a result of new court decisions, inflation in costs to repair or replace damaged property, inflation in the cost of medical services and legislated changes in statutory benefits, as well as by the particular, unique facts that pertain to each claim. As a result, the rate at which claims arose in the past and the costs to settle them may not always be representative of what will occur in the future. The factors influencing changes in claim costs are often difficult to isolate or quantify and developments in paid and incurred losses from historical trends are frequently subject to multiple and conflicting interpretations. Changes in coverage terms or claims handling practices may also cause future experience and/or development patterns to vary from the past. A key objective of actuaries in


                      developing estimates of ultimate loss and LAE, and resulting IBNR reserves, is to identify aberrations and systemic changes occurring within historical experience and accurately adjust for them so that the future can be projected reliably. Because of the factors previously discussed, this process requires the use of informed judgment and is inherently uncertain.

                      Reinsurance

                              White Mountains' reinsurance subsidiaries establish loss and LAE reserves that are estimates of amounts needed to pay claims and related expenses in the future for reinsured events that have already occurred. White Mountains' reinsurance subsidiaries also obtain reinsurance whereby another reinsurer contractually agrees to indemnify White Mountains for all or a portion of the reinsurance risks underwritten by White Mountains. Such arrangements, where one reinsurer provides reinsurance to another reinsurer, are usually referred to as "retrocessional reinsurance" arrangements. White Mountains establishes estimates of amounts recoverable from retrocessional reinsurance in a manner consistent with the loss and LAE liability associated with reinsurance contracts offered to its customers (the "ceding companies"), net of an allowance for uncollectible amounts. Net reinsurance loss reserves represent loss and LAE reserves reduced by retrocessional reinsurance recoverable on unpaid losses.

                              Reinsurance loss and LAE reserve estimates reflect the judgment of both the ceding companies and White Mountains, based on the experience and knowledge of their respective claims personnel, regarding the nature and value of the claims. The ceding companies may periodically adjust the amount of the case reserves as additional information becomes known or partial payments are made. Upon notification of a loss from a ceding company, White Mountains establishes case reserves, including LAE reserves, based upon White Mountains' share of the amount of reserves established by the ceding company and White Mountains' independent evaluation of the loss. In cases where available information indicates that reserves established by the ceding company are inadequate, White Mountains establishes reserves in excess of its share of the reserves established by the ceding company.

                              The estimation of net reinsurance loss and LAE reserves is subject to the same factors as the estimation of insurance loss and LAE reserves. In addition to those factors which give rise to inherent uncertainties in establishing insurance loss and LAE reserves, the claim-tail for reinsurers is further extended because claims are first reported through one or more intermediary insurers or reinsurers.


                              White Mountains Re establishes loss reserves for White Mountains Re based on a singlean actuarial point estimate, which is management's primary consideration in determining its best estimate of ultimate lossesloss and loss expenses.LAE reserves. This "best"actuarial point estimate" is derived from a combination of generally accepted actuarial methods. In making its best estimate, management also considers other qualitative factors that may lead to a difference between its best estimate of loss and LAE reserves and the actuarial point estimate. Typically, these factors exist when management and the company's actuaries conclude that there is insufficient historical incurred and paid loss information or that the trends included in the historical incurred and paid loss information are unlikely to repeat in the future. These factors may include, among others, changes in the techniques used to assess underwriting risk, more accurate and detailed levels of data submitted with reinsurance applications, the uncertainty of the current reinsurance pricing environment, the level of inflation in loss costs, changes in ceding company reserving practices, and legal and regulatory developments. For current accident year business, the estimate is based on an expected loss ratio method. The parameters underlying this method are developed during the underwriting and pricing process. Loss ratio expectations are derived for each contract and these are aggregated by class of business and type of contract. These loss ratios are then applied to the actual earned premiums by class and type of business to estimate ultimate losses. Paid losses are deducted to determine loss and loss expenseLAE reserves.

                              For prior accident years, White Mountains Re gradually replaces this expected loss ratio approach with estimates based on historical loss reporting patterns. For both current and prior accident years, estimates also change when new information becomes available, such as changing loss emergence patterns, or as a result of claim and underwriting audits.

                              Once aan actuarial point estimate is established in the case ofby White Mountains Re, its actuaries estimate loss reserve ranges to measure the sensitivity of the actuarial assumptions used to set the point estimates. These ranges are calculated using similar methods to the point estimate calculation, but with different expected loss ratio and loss reporting pattern assumptions. For the low estimate, more optimistic loss ratios and faster reporting patterns are assumed, while the high estimate uses more conservative loss ratios and slower reporting patterns. These variable assumptions are derived from historical variations


                      in loss ratios and reporting patterns by class and type of business. Due to the inherent difficulties in estimating ultimate A&E exposures, White Mountains Re does not estimate ranges of these reserves.


                      Loss and loss adjustment expense reserve summary

                              The following table summarizes the loss and LAE reserve activities of White Mountains' insurance and reinsurance subsidiaries for the years ended December 31, 2004, 20032007, 2006 and 2002:2005:

                       
                       Year Ended December 31,
                       
                      Millions

                       
                       2004
                       2003
                       2002
                       
                      Gross beginning balance $7,728.2 $8,875.3 $9,527.6 
                       Less beginning reinsurance recoverable on unpaid losses  (3,473.8) (4,071.9) (4,203.5)


                      Net loss and LAE reserves  4,254.4  4,803.4  5,324.1 
                      Loss and LAE reserves acquired—Sirius(1)  1,328.9     
                      Loss and LAE reserves acquired—Sierra Group(1)  244.4     
                      Loss and LAE reserves acquired—Tryg-Baltica(1)  136.8     
                      Loss and LAE reserves consolidated—NJ Skylands Reciprocal  62.1     
                      Loss and LAE reserves sold—Peninsula  (17.0)    
                      Loss and LAE reserves acquired—Imperial      11.0 
                      Loss and LAE reserves acquired—Fund American Re      17.5 
                      Loss and LAE reserves transferred(2)    (5.0) (22.4)

                      Losses and LAE incurred relating to:


                       Current year losses  2,476.0  1,948.7  2,548.2 
                       Prior year losses  115.1  189.4  90.0 


                      Total incurred losses and LAE  2,591.1  2,138.1  2,638.2 

                      Accretion of fair value adjustment to loss and LAE reserves


                      43.3


                      48.6


                      79.8

                       
                      Foreign currency translation adjustment to loss and LAE reserves  48.0     

                      Loss and LAE paid relating to:


                       Current year losses  (926.3) (825.3) (1,072.9)
                       Prior year losses  (2,164.6) (1,905.4) (2,171.9)


                      Total loss and LAE payments  (3,090.9) (2,730.7) (3,244.8)
                      Net ending balance  5,601.1  4,254.4  4,803.4 
                       Plus ending reinsurance recoverable on unpaid losses  3,797.4  3,473.8  4,071.9 


                      Gross ending balance $9,398.5 $7,728.2 $8,875.3 


                       Year Ended December 31,
                       
                      Millions

                       
                       2007
                       2006
                       2005
                       
                      Gross beginning balance $8,777.2 $10,231.2 $9,398.5 
                       Less beginning reinsurance recoverable on unpaid losses  (4,015.7) (5,025.7) (3,797.4)


                      Net loss and LAE reserves  4,761.5  5,205.5  5,601.1 
                      Loss and LAE reserves sold—Sirius America    (124.1)  
                      Loss and LAE reserves acquired—Stockbridge(1)    38.3   
                      Loss and LAE reserves sold—NFU      (95.9)
                      Loss and LAE reserves sold—TPIC      (11.8)

                      Losses and LAE incurred relating to:


                       Current year losses  2,422.8  2,208.7  2,697.1 
                       Prior year losses  (16.4) 244.0  161.1 


                      Total incurred losses and LAE  2,406.4  2,452.7  2,858.2 

                      Net change in loss reserves—Sierra Insurance Group(2)


                      (9.1

                      )


                      22.8

                       
                      Accretion of fair value adjustment to net loss and LAE reserves  21.4  24.5  36.9 
                      Foreign currency translation adjustment to net loss and LAE reserves  39.7  35.2  (39.4)

                      Loss and LAE paid relating to:


                       Current year losses  (1,080.6) (845.5) (848.7)
                       Prior year losses  (1,545.1) (2,025.1) (2,317.7)


                      Total loss and LAE payments  (2,625.7) (2,870.6) (3,166.4)

                      Net ending balance


                      4,594.2


                      4,761.5


                      5,205.5

                       
                       Plus ending reinsurance recoverable on unpaid losses  3,467.9  4,015.7  5,025.7 


                      Gross ending balance $8,062.1 $8,777.2 $10,231.2 


                      (1)
                      Reinsurance recoverables on unpaid losses acquired in the Sirius, Sierra Group and Tryg-Baltica acquisitionsStockbridge acquisition totalled $283.8 million, $162.5 million and $14.0 million, respectively.$52.9 million.

                      (2)
                      Represents retroactiveDuring the years ended December 31, 2007, 2006 and 2005, White Mountains Re recorded $(9.1) million, $0 and $22.8 million of (favorable)/unfavorable development on its workers compensation reserves relating to its Sierra Insurance Group acquisition. This loss reserves ceded to Imagine Re. Seeand LAE development was offset in incurred losses and LAE dollar-for-dollar by a change in the principal amount of the adjustable note that White Mountains Re issued as part of the financing of that acquisition (See Note 4.6).

                        Loss and LAE development—20042007

                              During the year ended December 31, 2007, White Mountains experienced $115.1$16.4 million of net favorable development on prior accident year loss reserves. Esurance experienced net unfavorable development of $29.6 million that primarily related to bodily injury claims from prior accident years. White Mountains Re experienced net unfavorable development of $9.1 million that primarily related to an increase in asbestos and environmental related exposures offset by favorable development in property lines. The Other Operations segment experienced net favorable development of $6.8 million primarily due to the settlement of a large claim at British Insurance Company.

                              OneBeacon experienced $48.3 million of favorable development on prior accident year loss reserves that was primarily related to lower than expected frequency for professional liability in specialty lines and lower than expected severity for automobile liability in personal lines, offset by unfavorable development for multiple peril and workers compensation, primarily for accident years 2001 and prior. Specifically, at December 31, 2006, management continued to expect losses to emerge in the professional liability business, which is included in the general liability line of business, in line with initial expectations based on market analysis when this business was initiated in 2002 and 2003. During 2007, losses continued to be significantly lower than initial expectations. As a result, management lowered its selected reserves on the earliest years which affected more recent years as total loss expectations for those years are based in part on prior years' results. Management had implicitly assumed at December 31, 2006 that IBNR and known case development related to personal automobile liability would be approximately 49% of actual case reserves for the 2002 and subsequent years. During 2007, case incurred loss and allocated LAE ("ALAE") was 28% of the


                      future expected development, which was smaller than expected for this relatively short-tail line of business. As a result, management decreased IBNR reserves for this line so that as of December 31, 2007, the IBNR was approximately 49% relative to the remaining case reserves. Prior to decreasing the IBNR reserves, the IBNR as of December 31, 2007 was approximately 74% of remaining case reserves. Management had implicitly assumed at December 31, 2006 that the IBNR and know case development related to workers compensation and multiple peril liability would be approximately 15% of actual case reserves for the 2001 and prior accident years. During 2007, case incurred loss and ALAE was 47% of the entire future expected development, which was unusually large for these long tail lines of business. As a result, management increased IBNR reserves for these lines so that as of December 31, 2007 the IBNR was approximately 28% relative to the remaining case reserves.

                        Loss and LAE development—2006

                              During the year ended December 31, 2006, White Mountains experienced $244.0 million of unfavorable development on prior accident loss reserves, of which $218.0 million was experienced by White Mountains Re and $22.9 million was experienced by OneBeacon. The adverse development was primarily related to adverse development on loss and LAE reserves previously established for Katrina, Rita and Wilma.

                              During 2006, following the receipt of new claims information reported from several ceding companies and subsequent reassessment of the ultimate loss exposures, White Mountains Re increased its gross loss estimates for hurricanes Katrina, Rita and Wilma by $201 million.

                              The vast majority of the newly reported claims were on off-shore energy and marine exposures, and as a result, Folksamerica set its gross loss and LAE reserves in 2006 on off-shore energy and marine exposures for hurricanes Katrina and Rita at full contract limits and also increased reserves on other exposures affected by hurricanes Katrina, Rita and Wilma.

                              Under the terms of Folksamerica's 2005 quota share reinsurance treaty with Olympus Reinsurance Company ("Olympus"), $139 million of these losses, net of reinstatement premiums, recorded in 2006 were ceded to Olympus. However, Folksamerica Holding Company ("Folksamerica Holdings") entered into an indemnity agreement with Olympus, under which it agreed to reimburse Olympus for up to $137 million of these losses, which was recorded as loss and LAE expense during 2006.

                        Loss and LAE development—2005

                              During the year ended December 31, 2005, White Mountains experienced $161.1 million of unfavorable development on prior accident year loss and LAE reserves, during 2004, of which approximately $100.3$95.0 million (relating primarily to 2002 and prior accident years) was experienced byat OneBeacon and approximately $10.8$51.8 million was experienced by White Mountains Re.

                              The 2004adverse development relatedat OneBeacon was primarily due to personal auto liability, general liability and multiple peril reserves due in part to emerging trends in claims experienced in OneBeacon's run-off operations,


                      as well as national account and program claims administered by third parties. These claim trends principally included higher than anticipated legal defense costs and higher damages from liability assessments.assessments in general liability and multiple peril reserves in OneBeacon's run-off operations. Specifically, OneBeacon's management had assumed at December 31, 2004 that the IBNR and known case development would be approximately 26% of actual case reserves for the 2001 and prior accident years for multiple peril and general liability. During 2005, case incurred loss and LAE was 72% of the entire future expected development, which was unusually large for these long tail lines of business. As a result, OneBeacon's management increased IBNR reserves for these lines so that as of year end 2005 the IBNR was approximately 40% relative to the remaining case reserves.

                              The majority of the unfavorableadverse development recorded at White Mountains Re resulted from certain discontinued lines atactions taken in response to a ground-up study of Folksamerica's exposure to asbestos claims that was completed in the third quarter of 2005. The study examined losses incurred by all insureds that had reported over $250,000 of asbestos claims to Folksamerica as well as run-off operations acquired as partand a significant sample of all other insureds with reported asbestos claims of less than $250,000. Comparing estimates generated by the Sirius Acquisition.study to Folksamerica's exposed limits by underwriting year led management to record an increase of approximately $50 million in IBNR during the third quarter of 2005. This unfavorable development was partially offset by favorable development in the Sirius International reserve portfolio of approximately $12.0 million, mainly from the three most recent underwriting years, and is indicative of the favorable terms and conditions that have existed in the global reinsurance marketplace during that time. Additionally, White Mountains Re recorded $10.0 million of unfavorable loss development on its workers compensation reserves acquired as part of the Sierra Group acquisition in 2004. This unfavorable development was offset by a reduction to the purchase note issued in connection with the acquisition of the Sierra Group.years.

                      Loss and LAE development—2003

                              White Mountains recorded $189.4 million of net unfavorable loss reserve development on prior accident year loss and LAE reserves during 2003, of which approximately $146.9 million (relating primarily to 2000 and prior accident years) was experienced by OneBeacon and $45.5 million was experienced by White Mountains Re.

                              The majority of the net unfavorable development at OneBeacon in 2003 was due to a $97.7 million increase related to construction defect claims in its run-off operations. The development at OneBeacon in 2003 also included approximately $12.0 million for a significant 1995 property claim from a pool in which OneBeacon had participated (the Industrial Risk Insurers pool) which was settled through an arbitration decision during 2003.

                              White Mountains Re experienced approximately $45.5 million of unfavorable loss reserve development during 2003, primarily due to strengthening of A&E reserves and reserves on Risk Capital casualty lines. White Mountains Re's 2003 loss development for A&E exposures was due to the completion of a detailed A&E market share study. This study was based on White Mountains Re's share of industry paid losses to estimated industry carried reserves.

                      Loss and LAE development—2002

                              Prior accident year losses of $90.0 million incurred in 2002 consisted primarily of $57.4 million recorded during 2002 at OneBeacon, $17.0 million recorded at White Mountains Re, $10.5 million recorded at Fund American Re and $5.1 million recorded at White Mountains' other insurance subsidiaries.

                              OneBeacon's prior year development recorded in 2002 was comprised of a $97.4 million increase related to accident years 2000 and prior, while reserves for accident year 2001 were reduced by $40.0 million. Reserve increases for 2000 and prior accident years primarily relate to increases in reserves for workers compensation coverages of $155.3 million (on reserves as of December 31, 2001 of $1.2 billion) reduced primarily by favorable development in general liability coverages and decreases in reserves for unallocated LAE totaling approximately $57.9 million. Workers compensation reserves for accident year 2000 and prior increased related primarily to a continuing unfavorable trend of increases in workers compensation medical claims and indemnity costs. Based on a study provided by the NCCI, workers compensation medical claims costs rose an average of 14% during 2002, compared with an average of 12% during 2001. Average workers compensation indemnity costs rose 11% during 2002 compared with an increase of 9% during 2001. Decreases in reserves for unallocated LAE resulted from completion of an activity-based-cost study which indicated future claim servicing costs were less than originally projected. This decrease primarily related to multiple peril and general liability coverages. The reduction in reserves for accident year 2001 was due in large part to favorable development on property losses from the Attacks.


                              The prior year development recorded in 2002 at White Mountains Re consisted primarily of (i) additional losses of $9.7 million relating to the Attacks, (ii) additional losses of $7.3 million from aviation insurance coverage, in relation to the Risk Capital business, (iii) reserve additions relating to asbestos and environmental losses of $11.4 million, (iv) $3.5 million of adverse development relating to the remaining business from the USF Re acquisition, offset by (v) $17.0 million of net income recorded during the first quarter relating to the reversal of an allowance for doubtful reinsurance recoveries related to PCA. These losses, with exception of the those relating to the Attacks, are covered under the Imagine Cover, and were partially offset by amortization of the deferred gain related to retroactive reinsurance.

                        Fair value adjustment

                              In connection with purchase accounting for the acquisitions of OneBeacon, Acquisition,Sirius International, and Stockbridge Insurance Company, White Mountains was required to adjust to fair value OneBeacon's loss and LAE reserves and the related reinsurance recoverables by reducing them by $646.9 million and $346.9 million, respectively,to fair value on OneBeacon's, Sirius International's and Mutual Service Casualty's acquired balance sheet. Thissheets. The net reduction to net loss and LAE reserves of $300.0 million is being accreted through an income statement charge ratably over the period that the claims are expected to be settled. As a result, White Mountains recognized $33.2 million, $48.6 million and $79.8 million of accretion to loss and LAE reserves during 2004, 2003 and 2002, respectively. White Mountains will accrete the remaining $82.4 million over the future periods in which the claims are settled, which is expected to be seven or eight years from the OneBeacon Acquisition.

                              In connection with purchase accounting for the Sirius Acquisition, White Mountains was required to adjust to fair value the loss and LAE reserves on Sirius' acquired balance sheet by $58.1 million. This fair value adjustment is being recognized through an income statement charge ratably with and over the period the claims are settled. As such,Accordingly, White Mountains recognized $10.1$21.4 million, $24.5 million and $36.9 million of such charges, for the year endedrecorded as loss and LAE during 2007, 2006 and 2005. As of December 31, 2004.2007, the outstanding pre-tax unaccreted adjustment was $56.7 million.


                              The fair values of OneBeacon's loss and LAE reserves and related reinsurance recoverables acquired on June 1, 2001, and Sirius'Sirius International's loss and LAE reserves and related reinsurance recoverables acquired on April 16, 2004, and Stockbridge Insurance Company's loss and LAE reserves and related recoverables acquired on December 22, 2006 were based on the present value of their expected cash flows with consideration for the uncertainty inherent in both the timing of, and the ultimate amount of, future payments for losses and receipts of amounts recoverable from reinsurers. In estimating fair value, management adjusted the nominal loss reserves of OneBeacon (net of the effects of reinsurance obtained from the NICO Cover, as defined below and the GRC Cover)Cover, as defined below), Sirius International and SiriusStockbridge Insurance Company and discounted them to their present value using an applicable risk-free discount rate. The series of future cash flows related to such loss payments and reinsurance recoveries were developed using OneBeacon's, Sirius International's and Sirius'Stockbridge Insurance Company's historical loss data. The resulting discount was reduced by the "price" for bearing the uncertainty inherent in OneBeacon's, Sirius International's and Sirius'Stockbridge Insurance Company's net loss reserves in order to estimate fair value. This was approximately 11%, 12% and 12%2% of the present value of the expected underlying cash flows of the loss reserves and reinsurance recoverables of OneBeacon, Sirius International and Sirius,Stockbridge Insurance Company, respectively, which is believed to be reflective of the cost OneBeacon, Sirius International and SiriusStockbridge Insurance Company would incur if they had attempted to reinsure the full amount of its net loss and LAE reserves with a third party reinsurer.


                      Asbestos and environmental loss and loss adjustment expense reserve activity

                              White Mountains' reserves include provisions made for claims that assert damages from asbestos and environmental ("A&E&E") related exposures. Asbestos claims relate primarily to injuries asserted by those who came in contact with asbestos or products containing asbestos. Environmental claims relate primarily to pollution and related clean-up costscost obligations, particularly as mandated by federal and state environmental protection agencies. In addition to the factors described above regarding the reserving process, White Mountains estimates its A&E reserves based upon, among other factors, facts surrounding reported cases and exposures to claims, such as policy limits and deductibles, current law, past and projected


                      claim activity and past settlement values for similar claims, as well as analysis of industry studies and events, such as recent settlements and asbestos-related bankruptcies. The cost of administering A&E claims, which is an important factor in estimating loss reserves, tends to be higher than in the case of non-A&E claims due to the higher legal costs typically associated with A&E claims. Due

                              During 2005, White Mountains Re completed a detailed, ground-up asbestos exposure study. Comparing estimates generated by the study to Folksamerica exposed limits by underwriting year led to an increase of approximately $50 million in IBNR for asbestos during the third quarter of 2005.

                              During the fourth quarter of 2007, White Mountains Re completed another detailed ground-up asbestos exposure study and reviewed environmental reserves relative to industry benchmarks. This study was an update to the inherent difficultiesanalysis first performed in estimating ultimate2005. The study analyzed potential exposure to loss of all insureds that had reported at least $250,000 in losses to Folksamerica through reinsurance contracts as of June 30, 2007. This analysis entailed examining total expected asbestos losses and LAE from a variety of information sources, including asbestos studies, data reported to Folksamerica as well as a review of historical public filings. The resulting exposure from this analysis was compared against Folksamerica's reinsurance contract layers to derive an estimated expected loss. In addition, White Mountains Re analyzed a significant sample of all other insureds that had reported losses of less than $250,000 and extrapolated the sample findings to the entire population.

                              In addition, Folksamerica has received notices of claims from a number of other insureds with reported loss amounts that have not exceeded the attachment points of reinsurance contracts written by Folksamerica. Based on the claims activity related to those insureds since the 2005 study, White Mountains Re estimated the future impact of these insureds to its exposure as well as the impact of future claims from insureds that have not reported any claims to date.

                              In the study, White Mountains Re sought to include adequate provision for future reported claims, premises/operations coverage (in addition to products liability coverage), and future adverse court decisions. To estimate this provision, White Mountains Re measured the changes in individual insured estimates from the 2005 study to the 2007 study to estimate future reported losses. The combined effect of all these estimates resulted in an increase of $51.6 million in IBNR for asbestos losses and LAE.

                              White Mountains Re reviewed Folksamerica's exposure to environmental losses using industry benchmarks known as "survival ratios". The survival ratio, computed as a company's reserves divided by the average of its last three years' net loss payments, indicates approximately how many more years of payments the current reserves can support, assuming future yearly payments are consistent with the average three-year historical levels. This analysis led to an increase of $11 million in IBNR for environmental losses in the fourth quarter of 2007. White Mountains Re's A&E exposures, OneBeacon does not estimate a range for A&E incurred losses.three year survival ratio was approximately 13 years and 8 years at December 31, 2007 and 2006, respectively.


                              Immediately prior to White Mountains' acquisition of OneBeacon, Aviva caused OneBeacon purchasedto purchase a reinsurance contract with NICONational Indemnity Company ("NICO") under which OneBeacon is entitled to recover from NICO up to $2.5 billion in the future for asbestos claims arising from business written by OneBeacon in 1992 and prior, environmental claims arising from business written by OneBeacon in 1987 and prior, and certain other exposures.exposures (the "NICO Cover"). Under the terms of the NICO Cover, NICO receives the economic benefit of reinsurance recoverables from certain of OneBeacon's third party reinsurers in existence at the time the NICO Cover was executed ("Third Party Recoverables"). As a result, the Third Party Recoverables serve to protect the $2.5 billion limit of NICO coverage for the benefit of OneBeacon. Any amounts uncollectible from third party reinsurers due to dispute or the reinsurers' financial inability to pay are covered by NICO under its agreement with OneBeacon. Third Party Recoverables are typically for the amount of loss in excess of a stated level each year. Of claim payments in the past 11 years, approximately 63%49% of asbestos losses and 39% of environmental losses have been recovered under the historical third party reinsurance.

                              In June 2005, OneBeacon completed an internal study of its A&E exposures. This study considered, among other items, (1) facts, such as policy limits, deductibles and available third party reinsurance, related to reported claims; (2) current law; (3) past and projected claim activity and past settlement values for similar claims; (4) industry studies and events, such as recent settlements and asbestos-related bankruptcies; and (5) collectibility of third-party reinsurance. Based on the study, OneBeacon increased its best estimate of its incurred losses ceded to NICO, net of underlying reinsurance, by $353 million ($841 million gross) to $2.1 billion, which is within the $2.5 billion coverage provided by the NICO Cover. OneBeacon estimates that the range of reasonable outcomes around its best estimate is $1.7 billion to $2.4 billion, versus a range of $1.5 billion to $2.4 billion from its previous study that was conducted in 2003. Due to the NICO Cover, there was no impact to income or equity from the change in estimate.

                              The increase in the estimate of incurred A&E losses was principally driven by raised projections for claims related to asbestos (particularly from assumed reinsurance business), and for mass torts other than asbestos and environmental, particularly lead and sexual molestation. This increase was partially offset by reduced projections of ultimate hazardous waste losses.

                              As noted above, OneBeacon estimates that on an incurred basis it has exhaustedused approximately $1.7$2.1 billion of the coverage provided by NICO at December 31, 2004. At December 31, 2004, $14.32007. Since entering into the NICO Cover, $39.8 million of the $1.7$2.1 billion of exhaustedutilized coverage relates to uncollected amounts from NICO related to uncollectible Third Party Recoverables.third party reinsurers through December 31, 2007. Net losses paid totaled approximately $682$986.0 million as of December 31, 2004,2007, with $95$139.0 million paid in 2004.2007. Asbestos payments during 20042007 reflect payments resulting from intensified efforts by claimants to resolve asbestos claims prior to enactment of potential Federal asbestos legislation. To the extent that OneBeacon's estimate of ultimate A&E losses as well as the estimate and collectibility of Third Party Recoverables differs from actual experience, the remaining protection under the NICO Cover may be more or less than the approximate $757$404.0 million that OneBeacon estimates remained at December 31, 2004.

                              For purposes of determining available reinsurance, product liability asbestos claims typically are aggregated as a single loss within each policy period. As a result, losses often exceed the retention level under the reinsurance agreement and reinsurance recoveries are obtained. However, for claims being asserted under premises and operations coverage, the losses are generally not aggregated for purposes of determining reinsurance recoveries, so OneBeacon expects that in the future a smaller percentage of these losses will be covered as Third Party Recoverables than has been true historically of products liability asbestos losses.2007.

                              White Mountains' reserves for A&E losses at December 31, 20042007 represent management's best estimate of its ultimate liability based on information currently available. However, as case law expands, and medical and clean-up costs increase and industry settlement practices change, White Mountains may be subject to asbestos and environmental losses beyond currently estimated amounts. White Mountains cannot reasonably estimate at the present time loss reserve additions arising from any such future unfavorable developments and cannot be sure that allocated loss reserves, plus the remaining capacity under the NICO Cover and other reinsurance contracts, will be sufficient to cover additional liability arising from any such unfavorable developments.

                              The following tables summarize reported asbestos and environmental loss and LAE reserve activities (gross and net of reinsurance) for OneBeacon, White Mountains Re and White Mountains' other operations, consisting of American Centennial and British Insurance Company, for the years ended December 31, 2004, 20032007, 2006 and 2002, respectively.2005, respectively:


                      OneBeacon


                       Period Ended December 31,
                       
                       Year Ended December 31,
                       

                       2004
                       2003
                       2002
                       
                      Net Asbestos and Environmental Loss Reserve Activity
                      (in millions)

                       
                      Gross
                       Net
                       Gross
                       Net
                       Gross
                       Net
                       
                      Net A&E Loss Reserve Activity

                      Net A&E Loss Reserve Activity

                       2007
                       2006
                       2005
                       
                      Millions

                      Millions

                       Gross
                       Pre-NICO Net(1)
                       Net
                       Gross
                       Pre-NICO Net(1)
                       Net
                       Gross
                       Pre-NICO Net(1)
                       Net
                       
                      Asbestos:Asbestos:                   Asbestos:                            
                      Beginning balanceBeginning balance $969.5 $4.2 $1,137.0 $4.9 $1,194.8 $5.8 Beginning balance $1,227.6 $766.6 $6.8 $1,323.4 $845.9 $7.4 $868.9 $599.2 $8.5 
                      Incurred losses and LAE  6.7  5.9  (.6)      Incurred losses and LAE  14.7      (4.0) (1.6)   544.8  307.5   
                      Paid losses and LAE  (107.3) (1.6) (166.9) (.7) (57.8) (.9)Paid losses and LAE  (86.4) (66.9) .4  (91.8) (77.7) (.6) (90.3) (60.8) (1.1)


                      Ending balanceEnding balance  868.9  8.5  969.5  4.2  1,137.0  4.9 Ending balance  1,155.9  699.7  7.2  1,227.6  766.6  6.8  1,323.4  845.9  7.4 


                      Environmental:Environmental:                   Environmental:                            
                      Beginning balanceBeginning balance  559.8  8.6  701.3  17.1  749.8  18.4 Beginning balance  678.0  394.6  10.6  729.7  421.5  6.5  513.0  408.4  10.2 
                      Incurred losses and LAE  9.6  6.7  (11.1)      Incurred losses and LAE  (18.3)     (8.6) (7.8)   265.7  42.7  2.0 
                      Paid losses and LAE  (56.4) (5.1) (130.4) (8.5) (48.5) (1.3)Paid losses and LAE  (82.6) (52.1) (4.6) (43.1) (19.1) 4.1  (49.0) (29.6) (5.7)


                      Ending balanceEnding balance  513.0  10.2  559.8  8.6  701.3  17.1 Ending balance  577.1  342.5  6.0  678.0  394.6  10.6  729.7  421.5  6.5 


                      Total asbestos and environmental:Total asbestos and environmental:                   Total asbestos and environmental:                            
                      Beginning balanceBeginning balance  1,529.3  12.8  1,838.3  22.0  1,944.6  24.2 Beginning balance  1,905.6  1,161.2  17.4  2,053.1  1,267.4  13.9  1,381.9  1,007.6  18.7 
                      Incurred losses and LAE  16.3  12.6  (11.7)      Incurred losses and LAE  (3.6)     (12.6) (9.4)   810.5  350.2  2.0 
                      Paid losses and LAE  (163.7) (6.7) (297.3) (9.2) (106.3) (2.2)Paid losses and LAE  (169.0) (119.0) (4.2) (134.9) (96.8) 3.5  (139.3) (90.4) (6.8)


                      Ending balanceEnding balance $1,381.9 $18.7 $1,529.3 $12.8 $1,838.3 $22.0 Ending balance $1,733.0 $1,042.2 $13.2 $1,905.6 $1,161.2 $17.4 $2,053.1 $1,267.4 $13.9 


                      (1)
                      Represents A&E reserve activity, net of third party reinsurance, but prior to the NICO Cover.

                      White Mountains Re


                       Year Ended December 31,
                       
                       Year Ended December 31,
                       

                       2004
                       2003
                       2002
                       
                      Net Asbestos and Environmental Loss Reserve Activity
                      (in millions)

                       
                      Gross
                       Net
                       Gross
                       Net
                       Gross
                       Net
                       
                      Net A&E Loss Reserve Activity

                      Net A&E Loss Reserve Activity

                       2007
                       2006
                       2005
                       
                      Millions

                      Millions

                       
                      Gross
                       Net
                       Gross
                       Net
                       Gross
                       Net
                       
                      Asbestos:Asbestos:             Asbestos:             
                      Beginning balanceBeginning balance $69.7 $64.1 $52.7 $39.5 $48.9 $37.5 Beginning balance $135.6 $101.2 $147.7 $109.1 $68.1 $59.3 
                      Incoming (Outgoing) asbestos reserves due to Sirius America acquisition/divestiture   (3.3) (.9)   
                      Incoming reserves due to the Sirius Acquisition 9.7 6.9     Incoming asbestos reserves due to Mutual Service Casualty acquisition   1.3 1.0   
                      Incurred losses and LAE 8.0 2.6 27.7 32.0 9.7 6.5 Incurred losses and LAE 58.6 51.6 (.3) (.1) 91.3 62.0 
                      Paid losses and LAE (19.3) (14.3) (10.7) (7.4) (5.9) (4.5)Paid losses and LAE (12.3) (10.7) (9.8) (7.9) (11.7) (12.2)


                      Ending balanceEnding balance 68.1 59.3 69.7 64.1 52.7 39.5 Ending balance 181.9 142.1 135.6 101.2 147.7 109.1 


                      Environmental:Environmental:             Environmental:             
                      Beginning balanceBeginning balance 17.4 15.1 14.4 12.5 13.8 11.4 Beginning balance 15.8 11.1 13.5 8.3 21.9 15.7 
                      Incoming reserves due to the Sirius Acquisition 3.2 1.9     Incoming (Outgoing) environmental reserves due to Sirius America acquisition/divestiture   (1.5) (.9)   
                      Incurred losses and LAE 2.8 .1 4.7 3.7 3.8 4.0 Incoming environmental reserves due to Mutual Service Casualty acquisition   5.2 4.4   
                      Paid losses and LAE (1.5) (1.4) (1.7) (1.1) (3.2) (2.9)Incurred losses and LAE 12.9 11.6 (.8) (.2) (3.6) (3.4)


                       Paid losses and LAE (2.0) (1.7) (.6) (.5) (4.8) (4.0)


                      Ending balanceEnding balance 21.9 15.7 17.4 15.1 14.4 12.5 Ending balance 26.7 21.0 15.8 11.1 13.5 8.3 


                      Total asbestos and environmental:Total asbestos and environmental:             Total asbestos and environmental:             
                      Beginning balanceBeginning balance 87.1 79.2 67.1 52.0 62.7 48.9 Beginning balance 151.4 112.3 161.2 117.4 90.0 75.0 
                      Incoming reserves due to the Sirius Acquisition 12.9 8.8     Incoming (Outgoing) A&E reserves due to Sirius America acquisition/divestiture   (4.8) (1.8)   
                      Incurred losses and LAE 10.8 2.7 32.4 35.7 13.5 10.5 Incoming A&E reserves due to Mutual Service Casualty acquisition   6.5 5.4   
                      Paid losses and LAE (20.8) (15.7) (12.4) (8.5) (9.1) (7.4)Incurred losses and LAE 71.5 63.2 (1.1) (.3) 87.7 58.6 


                       Paid losses and LAE (14.3) (12.4) (10.4) (8.4) (16.5) (16.2)


                      Ending balanceEnding balance $90.0 $75.0 $87.1 $79.2 $67.1 $52.0 Ending balance $208.6 $163.1 $151.4 $112.3 $161.2 $117.4 


                      Other operations


                       Year Ended December 31,
                       
                       Year Ended December 31,
                       
                      Net Asbestos and Environmental Loss Reserve
                      Activity(1)
                      (in millions)

                       2004
                       2003
                       2002
                       
                      Gross
                       Net
                       Gross
                       Net
                       Gross
                       Net
                       
                      Net A&E Loss Reserve Activity(1)

                      Net A&E Loss Reserve Activity(1)

                       2007
                       2006
                       2005
                       
                      Millions

                      Millions

                       
                      Gross
                       Net
                       Gross
                       Net
                       Gross
                       Net
                       
                      Asbestos:Asbestos:             Asbestos:             
                      Beginning balanceBeginning balance $27.0 $25.7 $29.4 $28.4 $23.0 $21.9 Beginning balance $48.4 $47.1 $45.8 $44.7 $37.5 $36.5 
                      Incurred losses and LAE 15.3 7.6 1.3 (2.1) 10.2 10.1 Incurred losses and LAE (21.7) (20.6) 5.6 3.8 11.9 9.7 
                      Paid losses and LAE (4.8) 3.2 (3.7) (.6) (3.8) (3.6)Paid losses and LAE (6.3) (6.3) (3.0) (1.4) (3.6) (1.5)


                      Ending balanceEnding balance 37.5 36.5 27.0 25.7 29.4 28.4 Ending balance 20.4 20.2 48.4 47.1 45.8 44.7 


                      Environmental:Environmental:             Environmental:             
                      Beginning balanceBeginning balance 5.7 5.5 6.0 5.8 8.2 7.8 Beginning balance 9.1 9.1 10.1 9.7 6.9 6.8 
                      Incurred losses and LAE 2.0 .9 (.5) (.1) (1.5) (1.3)Incurred losses and LAE (1.9) (2.0) (0.6) (0.4) 4.1 3.3 
                      Paid losses and LAE (.8) .4 .2 (.2) (.7) (.7)Paid losses and LAE (1.1) (1.1) (0.4) (0.2) (.9) (.4)


                      Ending balanceEnding balance 6.9 6.8 5.7 5.5 6.0 5.8 Ending balance 6.1 6.0 9.1 9.1 10.1 9.7 


                      Total asbestos and environmental:Total asbestos and environmental:             Total asbestos and environmental:             
                      Beginning balanceBeginning balance 32.7 31.2 35.4 34.2 31.2 29.7 Beginning balance 57.5 56.2 55.9 54.4 44.4 43.3 
                      Incurred losses and LAE 17.3 8.5 .8 (2.2) 8.7 8.8 Incurred losses and LAE (23.6) (22.6) 5.0 3.4 16.0 13.0 
                      Paid losses and LAE (5.6) 3.6 (3.5) (.8) (4.5) (4.3)Paid losses and LAE (7.4) (7.4) (3.4) (1.6) (4.5) (1.9)


                      Ending balanceEnding balance $44.4 $43.3 $32.7 $31.2 $35.4 $34.2 Ending balance $26.5 $26.2 $57.5 $56.2 $55.9 $54.4 


                      (1)
                      The asbestos and environmental reserve activity for White Mountains' other operations is comprised of American Centennial and British Insurance Company, two insurance subsidiaries that have been in run-off since 1985. The majority of the A&E reserves from other operations are recorded at American Centennial. At December 31, 2004,2007, American Centennial had 33146 insureds with open asbestos and environmental claims of which 19 were79 related to asbestos related claims and 14 were67 related to environmental related claims.


                      NOTE 4. Third Party Reinsurance

                              In the normal course of business, White Mountains' insurance and reinsurance subsidiaries seek to limit losses that may arise from catastrophes or other events by reinsuring with third party reinsurers. White Mountains remains liable for risks reinsured even if the reinsurer does not honor its obligations


                      under reinsurance contracts. The effects of reinsurance on White Mountains' insurance and reinsurance subsidiaries' written and earned premiums and on losslosses and LAE were as follows:

                      Year ended December 31, 2004
                      Millions

                       OneBeacon
                       White
                      Mountains Re

                       Esurance
                       Other
                      Insurance
                      Operations

                       Total
                       
                      Gross written premiums:                
                       Direct $2,367.9 $367.4 $176.7 $ $2,912.0 
                       Assumed  289.6  1,565.9  24.6    1,880.1 
                       Ceded  (198.4) (687.0) (1.9)   (887.3)


                      Net written premiums $2,459.1 $1,246.3 $199.4 $ $3,904.8 


                      Gross earned premiums:                
                       Direct $2,253.9 $310.4 $153.6 $ $2,717.9 
                       Assumed  331.1  1,625.4  24.4    1,980.9 
                       Ceded  (206.5) (670.3) (1.5)   (878.3)


                      Net earned premiums $2,378.5 $1,265.5 $176.5 $ $3,820.5 


                      Losses and LAE:                
                       Direct $1,540.7 $196.3 $108.6 $2.4 $1,848.0 
                       Assumed  681.7  1,159.7  14.0  11.0  1,866.4 
                       Ceded  (677.2) (437.1) (.2) (8.8) (1,123.3)


                      Net losses and LAE $1,545.2 $918.9 $122.4 $4.6 $2,591.1 


                      Year ended December 31, 2003
                      Millions

                       OneBeacon(1)
                       White
                      Mountains Re

                       Esurance
                       Other
                      Insurance
                      Operations

                       Total
                       
                      Gross written premiums:                
                       Direct $2,016.2 $5.9 $87.4 $41.2 $2,150.7 
                       Assumed  234.7  1,409.0  29.0    1,672.7 
                       Ceded  (278.4) (529.2)   (8.1) (815.7)


                      Net written premiums $1,972.5 $885.7 $116.4 $33.1 $3,007.7 


                      Gross earned premiums:                
                       Direct $2,234.2 $6.5 $69.2 $39.2 $2,349.1 
                       Assumed  369.1  1,301.3  30.7  .1  1,701.2 
                       Ceded  (443.0) (462.0)   (7.6) (912.6)


                      Net earned premiums $2,160.3 $845.8 $99.9 $31.7 $3,137.7 


                      Losses and LAE:                
                       Direct $1,492.1 $(18.5)$55.6 $30.5 $1,559.7 
                       Assumed  107.3  711.4  25.4  .1  844.2 
                       Ceded  (123.8) (135.3)   (6.7) (265.8)


                      Net losses and LAE $1,475.6 $557.6 $81.0 $23.9 $2,138.1 


                       Year ended December 31, 2007
                       
                      Millions

                       OneBeacon
                       White Mountains Re
                       Esurance
                       Other Insurance Operations
                       Total
                       
                      Gross written premiums:                
                       Direct $2,041.3 $107.4 $773.5 $ $2,922.2 
                       Assumed  50.6  1,187.9  29.0    1,267.5 
                       Ceded  (227.5) (199.6) (4.0)   (431.1)


                      Net written premiums $1,864.4 $1,095.7 $798.5 $ $3,758.6 


                      Gross earned premiums:                
                       Direct $2,017.4 $108.2 $736.8 $ $2,862.4 
                       Assumed  54.6  1,235.2  30.5    1,320.3 
                       Ceded  (198.4) (196.6) (4.0)   (399.0)


                      Net earned premiums $1,873.6 $1,146.8 $763.3 $ $3,783.7 


                      Losses and LAE:                
                       Direct $1,172.0 $87.8 $598.2 $2.0 $1,860.0 
                       Assumed  (11.1) 787.5  26.0  (8.6) 793.8 
                       Ceded  (71.1) (174.3) (1.8) (.2) (247.4)


                      Net losses and LAE $1,089.8 $701.0 $622.4 $(6.8)$2,406.4 


                       Year ended December 31, 2006
                       
                      Millions

                       OneBeacon
                       White Mountains Re
                       Esurance
                       Other Insurance Operations
                       Total
                       
                      Gross written premiums:                
                       Direct $2,028.0 $236.2 $563.5 $ $2,827.7 
                       Assumed  60.4  1,388.4  36.0    1,484.8 
                       Ceded  (130.8) (334.6) (3.6)   (469.0)


                      Net written premiums $1,957.6 $1,290.0 $595.9 $ $3,843.5 


                      Gross earned premiums:                
                       Direct $2,007.6 $240.2 $495.3 $ $2,743.1 
                       Assumed  65.4  1,448.8  35.7    1,549.9 
                       Ceded  (129.0) (447.8) (3.5)   (580.3)


                      Net earned premiums $1,944.0 $1,241.2 $527.5 $ $3,712.7 


                      Losses and LAE:                
                       Direct $1,245.1 $132.0 $359.5 $5.6 $1,742.2 
                       Assumed  54.1  1,030.7  25.1  (.1) 1,109.8 
                       Ceded  (118.9) (278.1) (.7) (1.6) (399.3)


                      Net losses and LAE $1,180.3 $884.6 $383.9 $3.9 $2,452.7 


                      Year ended December 31, 2002
                      Millions

                       OneBeacon(1)
                       White
                      Mountains Re

                       Esurance
                       Other
                      Insurance
                      Operations

                       Total


                       Year ended December 31, 2005
                       
                      Millions

                      Millions

                       OneBeacon(1)
                       White Mountains Re
                       Esurance
                       Other Insurance Operations
                       Total
                       
                      Gross written premiums:Gross written premiums:           Gross written premiums:           
                      Direct $2,782.6 $7.2 $20.2 $34.9 $2,844.9 Direct $2,177.0 $338.0 $320.9 $ $2,835.9 
                      Assumed 569.0 974.8 32.8 .1 1,576.7 Assumed 89.6 1,643.3 31.0 1.9 1,765.8 
                      Ceded (828.8) (293.8)  (5.5) (1,128.1)Ceded (145.5) (677.2) (2.8) (.1) (825.6)


                      Net written premiumsNet written premiums $2,522.8 $688.2 $53.0 $29.5 $3,293.5 Net written premiums $2,121.1 $1,304.1 $349.1 $1.8 $3,776.1 


                      Gross earned premiums:Gross earned premiums:           Gross earned premiums:           
                      Direct $3,181.8 $7.1 $9.9 $34.8 $3,233.6 Direct $2,175.8 $347.6 $280.1 $ $2,803.5 
                      Assumed 504.6 922.4 30.9  1,457.9 Assumed 102.7 1,784.6 29.1 1.9 1,918.3 
                      Ceded (815.5) (294.5)  (5.1) (1,115.1)Ceded (160.1) (760.6) (2.4) (.1) (923.2)


                      Net earned premiumsNet earned premiums $2,870.9 $635.0 $40.8 $29.7 $3,576.4 Net earned premiums $2,118.4 $1,371.6 $306.8 $1.8 $3,798.6 


                      Losses and LAE:Losses and LAE:           Losses and LAE:           
                      Direct $2,405.5 $(25.9)$7.8 $31.1 $2,418.5 Direct $2,220.5 $224.2 $186.2 $13.7 $2,644.6 
                      Assumed 389.0 601.1 28.8 1.1 1,020.0 Assumed 187.0 2,113.9 20.1 1.9 2,322.9 
                      Ceded (663.2) (133.0)  (4.1) (800.3)Ceded (1,006.0) (1,100.2) (.1) (3.0) (2,109.3)


                      Net losses and LAENet losses and LAE $2,131.3 $442.2 $36.6 $28.1 $2,638.2 Net losses and LAE $1,401.5 $1,237.9 $206.2 $12.6 $2,858.2 


                      (1)
                      On November 1, 2001, OneBeacon transferred its regional agency business, agents and operations in 42 states and the District of Columbia to Liberty Mutual pursuant to a renewal rights agreement (the "Liberty Agreement"). Assumed amounts principally relate to business assumed under the Liberty Agreement.

                      OneBeacon

                              In the ordinary course of its business, OneBeacon purchases reinsurance from high-quality, highly rated, third party reinsurers in order to provide diversification of its business and minimize loss from large risks or catastrophic events. OneBeacon uses PML forecasting to quantify its exposure to catastrophic losses.

                              The timing and size of catastrophe losses are unpredictable and the level of losses experienced in any year could be material to OneBeacon's operating results and financial position. Examples of catastrophes include losses caused by hurricanes, earthquakes, wildfires hurricanes and other types of storms and terrorist acts. The extent of losses caused by catastrophes is both a function of the amount and type of insured exposure in an area affected by the event and the severity of the event. OneBeacon continually assesses and implements programsuses models to estimate the losses its exposures would generate under various scenarios as well as the probability of those losses occurring. OneBeacon uses this model output in conjunction with other data to manage its exposure to catastrophe losses through individual risk selection and by limiting its concentration of insurance written in catastrophe-prone areas, such as coastal regions. In addition, OneBeacon imposes wind deductibles on existing coastal windstorm exposures. OneBeacon'sOneBeacon believes that its largest single event natural catastrophe risk is Northeast windstorm.exposures are Northeastern United States windstorms and California earthquakes.

                              OneBeacon seeks to further reduce its exposure topotential loss from catastrophe lossesexposures through the purchase of catastrophe reinsurance. Effective July 1, 2007, OneBeacon uses PML forecasting to quantifyrenewed its exposure to catastrophic losses. PMLproperty catastrophe reinsurance program through June 30, 2008. The program provides coverage for all of OneBeacon's property business including automobile physical damage, as well as terrorism coverage for non-Terrorism Act (as defined below) events (excluding nuclear, biological, chemical and radiological). Under the program, the first $150 million of losses resulting from a single catastrophe are retained by OneBeacon and $650 million of the next $700 million of losses resulting from the catastrophe are reinsured. Any loss above $850 million would be retained by OneBeacon. In the event of a catastrophe, OneBeacon's property catastrophe reinsurance program is reinstated for the remainder of the original contract term by paying a statistical modeling techniquereinstatement premium that measures a company's catastrophic exposure asis based on the maximum probable loss in a given time period.percentage of coverage reinstated and the original property catastrophe coverage premium.

                              Since the terrorist attacks of September 11, 2001 (the "Attacks"), OneBeacon has sought to mitigate the risk associated with any future terrorist attacks by reducinglimiting the aggregate insured value of policies written in geographic areas with a high concentration of exposure to losses from terrorist attacksattacks. This is accomplished by either limiting the total insured values exposed, or, by seeking to exclude coverage for such losses from their policies.where applicable, through the use of terrorism exclusions.


                              On November 26, 2002, President Bush signedIn December of 2007, the United States government extended the Terrorism Risk Insurance Act of 2002 (the "Terrorism Act") establishinguntil December 31, 2014. The Terrorism Act was originally enacted in 2002 and established a federalFederal "backstop" for commercial property and casualty losses, including workers compensation, resulting from acts of terrorism by or on behalf of any foreign person or foreign interest. As extended, the law now covers domestic acts of terrorism. The Terrorism Act requireslaw limits the industry's aggregate liability by requiring the Federal government to share 85% of certified losses once a company meets a specific retention or deductible as determined by its prior year's direct written premiums and limits the aggregate liability to be paid by the government and industry without further action by Congress at $100.0 billion. In exchange for this "backstop", primary commercial insurers are required to make terrorism coverage available


                      immediately to commercial insureds for losses from acts of terrorism as specified in the Terrorism Act. The following types of coverage are excluded from the program: commercial automobile, burglary and provides Federal protection above individual company retentiontheft, surety, farmowners multi-peril and aggregate industry retention levels.all professional liability coverage except directors and officers coverage.

                              OneBeacon estimates its individual retention level for commercial policies subject to the Terrorism Act to be approximately $160.0$170 million in 2005. Aggregate2008. The aggregate industry retention levels are $15.0level is $27.5 billion for 2005.in 2008. The Federal government will pay 90%85% of covered terrorism losses that exceed either OneBeacon's or the industry's retention levels in 2008 up to $100.0a total of $100 billion. The fate of the Terrorism Act beyond 2005 remains uncertain. It is anticipated that Congress will likely rule on a possible extension during the summer of 2005; however, there is a chance that the Terrorism Act could expire on December 31, 2005.

                              Effective July 1, 2004, OneBeacon renewed its normal property catastrophe reinsurance program to cover its full estimated PML (one-in-250 year) through June 30, 2005. Under that cover, the first $200.0 million of losses resulting from any single catastrophe are retained by OneBeacon and losses from a single event in excess of $200.0 million and up to $850.0 million are reinsured for 100% of the loss. In the event of a catastrophe, OneBeacon can reinstate its property catastrophe reinsurance program for the remainder of the original contract term by paying a reinstatement premium which is based on the percentage of coverage reinstated and the original property catastrophe coverage premium.

                              OneBeacon's property catastrophe reinsurance program does not cover personal or commercial property losses resulting from nuclear, biological or chemical terrorist attacks. The program covers personal property losses resulting from other types of terrorist attacks,"certified" events as defined under the Terrorism Act, such as foreign terrorism, provided such losses were not caused by nuclear biological or chemical means. The program also covers personal and commercial property losses resulting from other types of domestic terrorist attacks or"non-certified" events not "certified" as defined under the Terrorism Act. The Terrorism Act, provides protection for commercial propertysuch as domestic terrorist attacks, provided such losses for certified events including those arising fromwere not caused by nuclear, biological or chemical attacks.means.

                              OneBeacon also purchases individual property reinsurance coverage for certain risks to reduce large loss volatility. The Property per Riskproperty-per-risk reinsurance program reinsures losses in excess of $5.0$5 million up to $75.0$100 million. Individual risk facultative reinsurance may be purchased above $75.0$100 million where OneBeaconit deems it appropriate. The Property per Riskproperty-per-risk treaty also reinsuresprovides one limit of reinsurance protection for losses in excess of $10.0$10 million up to $75.0$100 million on an individual risk basis for terrorism losses. However, nuclear, biological and chemical events are not covered.

                              OneBeacon also maintains a casualty reinsurance program whichthat provides protection for individual risk or catastrophe losses involving workers compensation, general liability, automobile liability or automobileumbrella liability in excess of $5.0$6 million up to $60.0$81 million. This program provides one full $55.0 million limitcoverage for either "certified" or "non-certified" terrorism losses but does not provide coverage for losses resulting from nuclear, biological or chemical attacks.

                              In connection with the2001, OneBeacon Acquisition, Aviva caused OneBeacon to purchasepurchased reinsurance contracts with two reinsurance companies rated "AAA" (Extremely Strong)("Extremely Strong", the highest of twenty-one ratings) by Standard & Poor's and "A++" (Superior)("Superior", the highest of fifteen ratings) by A.M. Best:Best. One contract is a full risk-transferreinsurance cover from National Indemnity Company ("NICO") forwith NICO which entitles OneBeacon to recover up to $2.5 billion in oldultimate loss and LAE incurred related primarily to A&E claims arising from business written by OneBeacon's predecessor prior to 1992 for asbestos claims and 1987 for environmental claims (the "NICO Cover") and an adverse developmentclaims. As of December 31, 2007, OneBeacon has ceded estimated incurred losses of approximately $2.1 billion to the NICO Cover. Through December 31, 2007 $986.4 million of these incurred losses have been paid by NICO. Since entering into the NICO Cover, $39.8 million of the $2.1 billion of utilized coverage from NICO related to uncollectible Third Party Recoverables.

                              The other contract is a reinsurance cover fromwith General Reinsurance Corporation, ("GRC")or GRC, for up to $400.0$570 million onof additional losses occurring inon all claims arising from accident years 2000 and prior (the "GRC Cover").prior. As of December 31, 2007, OneBeacon has ceded estimated incurred losses of $550 million to the GRC Cover. Pursuant to the GRC Cover, OneBeacon is not entitled to recover losses to the full contract limit if such losses are reimbursed by GRC more quickly than anticipated at the time the contract was signed. OneBeacon intends to only seek reimbursement from GRC for claims which result in payment patterns similar to those supporting the recoverables recorded pursuant to the GRC Cover. The economic cost of not submitting certain other eligible claims to GRC is primarily the investment spread between the rate credited by GRC and the rate achieved by OneBeacon on its investments. This cost, if any, is expected to be immaterial.


                              Reinsurance contracts do not relieve OneBeacon of its obligation to its ceding companies.policyholders. Therefore, collectibility of balances due from its reinsurers is critical to OneBeacon'sits financial strength. The following table provides a listing of OneBeacon's top reinsurers, excluding industry pools and


                      associations and affiliates of White Mountains, based upon recoverable amounts, the percentage of total reinsurance recoverables and the reinsurer's A.M. Best rating.

                      Top Reinsurers ($ in millions)

                       Balance at
                      December 31,
                      2004

                       % of Total
                       A.M. Best
                      Rating(2)

                      Subsidiaries of Berkshire (NICO and GRC)(3) $2,109.2 76%A++
                      Liberty Mutual and subsidiaries(1)  126.9 5%A
                      Tokio Fire and Marine Insurance Company  57.0 2%A++
                      American Re-Insurance Company  53.7 2%A+
                      Swiss Re  25.9 1%A+


                      Top Reinsurers (Millions)

                       Balance at December 31, 2007
                       % of Total
                       A.M. Best
                      Rating(1)

                      Subsidiaries of Berkshire (NICO and GRC)(2) $2,074.6 78.2%A++
                      Nichido (formerly Tokio Fire and Marine Insurance Company)  57.7 2.2%A++
                      Munich Re America (formerly Amer Re)  48.7 1.8%A+
                      Liberty Mutual and subsidiaries(3)  29.9 1.1%A
                      Swiss Re  24.4 .9%A+

                      (1)
                      At December 31, 2004, OneBeacon had assumed balances payable and expenses payable of approximately $85.3 million under the Liberty Agreement. In the event of Liberty Mutual's insolvency, OneBeacon has the right to offset these balances against its reinsurance recoverable due from Liberty Mutual.

                      (2)
                      A.M. Best ratings as detailed above are: "A++" (Superior, which is the highest of fifteen ratings), "A+" (Superior, which is the second highest of fifteen ratings) and "A" (Excellent, which is the third highest of fifteen ratings). Ratings are as of December 31, 2007.

                      (3)(2)
                      Includes $420.1$404.0 million of Third Party Recoverables, thatwhich NICO would pay under the terms of the NICO Cover if they are unable to collect from thethird party reinsurers. OneBeacon also has an additional $320.7 million of Third Party Reinsurers.Recoverables from various reinsurers, the majority of which are rated "A" or better by A.M. Best.

                      (3)
                      At December 31, 2007, OneBeacon had assumed balances payable and expenses payable of approximately $28.8 million under its renewal rights agreement with Liberty Mutual Insurance Group ("Liberty Mutual"), which expired on October 31, 2003. In the event of a Liberty Mutual insolvency, OneBeacon has the right to offset these balances against its reinsurance recoverable due from Liberty Mutual.

                      White Mountains Re

                              For the three years ended December 31, 2007, the majority of White Mountains Re has exposure to losses caused by hurricanes, earthquakes, winter storms, windstorms, terrorist acts and other catastrophic events. In the normal course of business, White Mountains Re seeks to reduce the risk of loss that may arise from catastrophes or other events that cause unfavorable underwriting results by reinsuring certain levels of risk in various areas of exposure with other insurance andRe's reinsurance enterprises and by closely monitoring aggregate property exposures and related PMLs. To manage and analyze aggregate exposures and PML, White Mountains Re utilizes a variety of tools and analyses, including catastrophe modeling software packages. White Mountains Re regularly assesses its concentration of underwriting exposures in catastrophe prone areas and develops strategies to manage this exposure, primarilyprotection was provided through limiting accumulation of exposure to acceptable levels and, if deemed necessary, the purchase of catastrophe reinsurance.

                      Folksamerica's primary reinsurance protections are through quota share arrangements with Olympus. Folksamerica's retrocessional arrangements with Olympus and Helicon Reinsurance Company, Ltd. ("Helicon") and through excess of loss protection purchased by Sirius International to cover Sirius International's property catastrophe and aviation exposures. These reinsurance protections are designed to increase Folksamerica'sWhite Mountains Re's underwriting capacity, to capitalize on the improved pricing trends that accelerated after the Attackswhere appropriate, and to reduce its potential loss exposure to any large, or series of smaller, property catastrophe events. Under the quota share agreements

                              Folksamerica ceded 35% of its 2007 underwriting year short-tailed excess of loss business, mainly property to Olympus and Helicon with each sharing approximately 55% and 45%, respectively. Folksamerica ceded 35% of its 2006 underwriting year short-tailed excess of loss business, mainly property to Olympus and Helicon, with each sharing approximately 56% and 44%, respectively. Folksamerica cedesceded up to 75% of substantially all of its 2005 underwriting year short-tailed excess of loss business, mainly property and marine, and 50% of its 2005 underwriting year proportional property business to Olympus and receives an override commission on the premiums ceded to Olympus.

                              Effective April 1, 2004, Sirius International entered into a quota share reinsurance agreement with Olympus. Under this agreement, Sirius International cedesceded 25% of its new and renewal2005 underwriting year short-tailed proportional and excess of loss business to Olympus. White Mountains Re receives an override commissionreceived fee income based on the premiums ceded to Olympus and Helicon. Folksamerica did not renew the quota share arrangements with Olympus and Helicon for 2008. Helicon was acquired by White Mountains Re on January 7, 2008. Olympus will continue to be responsible to pay losses on exposures that have been ceded to it and will continue to earn premiums related primarily to the run-off of underwriting year 2007.

                              White Mountains Re is also entitled to receive a profit commission with respect to the profitability of the business recommended to Olympus and Helicon. However, this profit commission arrangement is subject to a deficit carryforward whereby net underwriting losses from one year carryover to future years. As a result of the Gulf Coast hurricanes and several other significant loss events during 2005, Olympus recorded substantial net underwriting losses. Accordingly, White Mountains Re did not record a profit commission from Olympus or Helicon during 2007, 2006 or 2005 and does not expect to record profit commissions from Olympus or Helicon for the foreseeable future.

                              At December 31, 2007 and 2006, White Mountains Re had $226.8 million and $655.0 million of reinsurance recoverables from Olympus. White Mountains Re's reinsurance recoverables from Olympus recorded as of December 31, 2007, are fully collateralized in the form of assets in a trust, funds held and offsetting balances payable.


                              In 2000, Folksamerica purchased a reinsurance contract from Imagine Re (the "Imagine Cover") to reduce its statutory operating leverage and protect its surplus from adverse development relating to A&E exposures as well as the reserves assumed in severalcertain recent acquisitions. In accordance with


                      SFAS 113, the amounts related to reserves transferred to Imagine Re for liabilities incurred as a result of past insurable events have been accounted for as retroactive reinsurance. At December 31, 20042007 and 2003,2006, Folksamerica's reinsurance recoverables included $260.4$163.6 million and $312.4$186.9 million respectively, recorded under the Imagine Re Cover. All balances due from Imagine are fully collateralized, either with Folksamerica as the beneficiary of invested assets in a trust, with funds held, or through a letter of credit. As of December 31, 2003, the entire $115.0 million limit available under this contract had been fully utilized. At December 31, 20042007 and 2003,2006, Folksamerica had recorded $42.5$25.5 million and $50.6$29.3 million in deferred gains respectively, related to retroactive reinsurance with Imagine Re. White Mountains Re is recognizing these deferred gains into income over the expected settlement period of the underlying claims, and accordingly recognized $8.1$3.9 million, $8.2$7.5 million and $8.5$5.7 million of such deferred gains during 2004, 20032007, 2006 and 2002, respectively.2005.

                       ��        Reinsurance contracts do not relieve White Mountains Re of its obligation to its ceding companies. Therefore, collectibility of balances due from its retrocessional reinsurers is critical to White Mountains Re's financial strength.

                              The following table provides a listing of White Mountains Re's top reinsurers based upon recoverable amounts, the percentage of total recoverables and the reinsurer's A.M. Best Rating.

                      Top Reinsurers ($ in millions)

                       Balance at
                      December 31, 2004

                       % of Total
                       A.M. Best
                      Rating(2)

                      Top Reinsurers (Millions)

                       Balance at December 31, 2007
                       % of Total
                       A.M. Best
                      Rating(2)

                       % Collateralized
                       
                      Olympus(1)(3) $305.0 22%A- $226.8 27%NR-4 100%
                      Imagine Re(1) 260.4 19%A- 163.6 19%A- 100%
                      General Re 94.7 11%A++ 1%
                      London Life(1) 135.6 10%A 93.1 11%A 100%
                      General Re 71.7 5%A++
                      St. Paul Travelers 70.1 5%A


                      St. Paul Travelers Group 59.4 7%A+ %

                      (1)
                      Represents non-U.S. insurance entities which balances are fully collateralized through Funds Held, Letters of Credit or Trust Agreements.

                      (2)
                      A.M. Best ratings as detailed above are: "NR-4" (Not rated per company request), "A++" (Superior, which is the highest of fifteen ratings), "A+" (Superior, which is the second highest of fifteen ratings), "A" (Excellent, which is the third highest of fifteen ratings) and, "A-" (Excellent,(Excellent, which is the fourth highest of fifteen ratings). Ratings are as of December 31, 2007.

                      (3)
                      Gross of amounts due to Olympus under its indemnity agreement with Folksamerica Holdings.


                      NOTE 5. Investment Securities

                              White Mountains' net investment income is comprised primarily of interest income associated with theWhite Mountains' fixed maturity investments, of its consolidated insurance and reinsurance operations, dividend income from its equity investments and interest income from its short-term investments. Net investment income for 2004, 20032007, 2006 and 20022005 consisted of the following:


                       Year Ended December 31,
                       
                       Year Ended December 31,
                       
                      Millions

                      Millions

                       Millions

                       
                      2004
                       2003
                       2002
                        2007
                       2006
                       2005
                       
                      Investment income:Investment income:       Investment income:       
                      Fixed maturity investments $304.3 $267.2 $333.9 Fixed maturity investments $398.4 $339.0 $330.4 
                      Short-term investments 24.9 16.6 19.3 Short-term investments 72.6 63.3 51.7 
                      Common equity securities 25.1 9.5 6.6 Common equity securities 24.3 29.8 54.5 
                      Other 15.0 1.3 11.8 Other 46.1 14.7 67.9 


                       Convertible fixed maturity investments 7.7 2.6 1.7 


                      Total investment incomeTotal investment income 369.3 294.6 371.6 Total investment income 549.1 449.4 506.2 
                      Less investment expenses and other charges (8.4) (3.7) (5.6)Less investment expenses (16.1) (13.9) (14.7)


                      Net investment income, before tax $360.9 $290.9 $366.0 
                      Net investment income, pre-taxNet investment income, pre-tax $533.0 $435.5 $491.5 


                              During the first quarter of 2005, Montpelier Re declared a special dividend of $5.50 per share, payable to holders of both its common shares and warrants to acquire its common shares. White Mountains recorded pre-tax investment income of $74.1 million in the first quarter for this special dividend, of which $34.7 million (relating to its common share investment) was included in net investment income from common equity securities and $39.4 million (relating to its warrant investment) was included in net investment income from other investments. For the year ended December 31, 2006, White Mountains also recorded an aggregate of $3.6 million in pre-tax investment income from Montpelier Re's regular quarterly dividend.

                              The composition of realized investment gains (losses) consisted of the following:


                       Year Ended December 31,
                       
                       Year Ended December 31,
                       
                      Millions

                      Millions

                       Millions

                       
                      2004
                       2003
                       2002
                        2007
                       2006
                       2005
                       
                      Fixed maturity investmentsFixed maturity investments $32.2 $102.7 $156.0 Fixed maturity investments $14.8 $10.3 $51.2 
                      Common equity securitiesCommon equity securities 65.1 37.8 (3.0)Common equity securities 123.1 142.0 94.6 
                      Montpelier common shares 35.2   
                      Other investmentsOther investments 48.6 22.1 3.0 Other investments 111.9 90.0 (40.7)
                      Convertible fixed maturity investmentsConvertible fixed maturity investments 13.4 30.4 7.5 


                      Net realized investment gains, before tax 181.1 162.6 156.0 Net realized investment gains, pre-tax 263.2 272.7 112.6 
                      Income taxes attributable to realized investment gains and lossesIncome taxes attributable to realized investment gains and losses (56.7) (45.2) (33.1)
                      Income taxes attributable to realized investment gains and losses


                      (85.8

                      )


                      (74.1

                      )


                      (54.2

                      )


                      Net realized investment gains, after-tax $124.4 $117.4 $122.9 Net realized investment gains, after-tax $177.4 $198.6 $58.4 


                              Net realized gains from common equity securities include gains of $.4 million, $5.5 million and losses of $54.8 million on Montpelier Re common shares for 2007, 2006, and 2005. Net realized gains (losses) from other investments include $2.5 million, $.7 million, and $110.3 million on Montpelier Re warrants for 2007, 2006 and 2005 and investment gains of $23.3 million, $6.2 million, and $10.5 million for 2007, 2006, and 2005 on its Symetra warrants.

                              White Mountains recognized gross realized investment gains of $229.7$350.9 million, $271.7$344.4 million and $265.2$356.3 million and gross realized investment losses of $48.6$87.7 million, $109.1$71.7 million and $109.2$243.7 million on sales of investment securities during 2004, 20032007, 2006 and 2002, respectively.

                              In 2001,2005. Of the Company received$243.7 million in losses realized during 2005, $110.3 million related to the Company's investment in Montpelier Re warrants, $54.8 million of other-than-temporary impairment related to acquire 4,781,572White Mountains' investment in Montpelier Re common shares and $11.4 million of Montpelier at $16.67 per share (as adjusted for stock splits) that are exercisable until December 2011. During the first quarter of 2004,foreign exchange losses.

                              On May 1, 2007, White Mountains sold 4.5 millionall of its remaining interest in Montpelier Re, which consisted of 939,039 common shares of Montpelierand warrants to third partiespurchase 7,172,376 common shares for nettotal proceeds of $155.3$65 million resulting in a pretax realized gainand recognized an after tax loss of $35.2$1.8 million. Also during the first quarter of 2004, White Mountains purchased additional warrants to acquire 2,390,786 common shares of Montpelier from an existing warrant holder for $54.1 million in cash, thereby raising the total number of such warrants owned by White Mountains to 7,172,358.

                              The following table summarizes the carrying value of White Mountains' investment in Montpelier Re as of December 31, 20042007 and December 31, 2003:2006:

                       
                       As of December 31, 2004
                       As of December 31, 2003
                      Millions

                       Shares
                       Carrying
                      Value

                       Fair
                      Value

                       Shares
                       Carrying
                      Value

                       Fair
                      Value

                      Montpelier                
                      Common shares 6.3 $235.4 $235.4 10.8 $282.7 $396.3
                      Warrants to acquire common shares 7.2  160.9  160.9 4.8  90.5  90.5


                      Total 13.5 $396.3 $396.3 15.6 $373.2 $486.8


                              White Mountains accounts for its Montpelier and Symetra warrants (see Note 2) under FAS 133 as a component of other investments, recording the instruments at fair value with changes in fair value recognized through the income statement as a realized investment gain or loss. The Montpelier and Symetra warrants are valued using the Black-Scholes valuation method. The major assumptions used in valuing the Montpelier warrants were a risk-free rate of 3.25%, volatility of 30% and an expected life of approximately 3 years. The major assumptions used in valuing the Symetra warrants were a risk-free rate of 3.63%, volatility of 29% and an expected life of approximately 5 years.

                              White Mountains recorded investment gains of $15.7 million, $32.5 million and $58.0 million for the years ended December 31, 2004, 2003 and December 31, 2002, respectively related to its Montpelier warrants. White Mountains recorded an investment gain of $1.9 million for the year ended December 31, 2004 related to its Symetra warrants.

                       
                       As of December 31, 2007
                       As of December 31, 2006
                      Millions

                       Shares
                       Carrying Value
                       Fair Value
                       Shares
                       Carrying Value
                       Fair Value
                      Montpelier Re                
                      Common shares  $ $ .9 $17.0 $17.0
                      Warrants to acquire common shares      7.2  49.9  49.9


                      Total  $ $ 8.1 $66.9 $66.9


                              As of December 31, 20042007 and 2003,2006, White Mountains reported $30.9$46.4 million and $371.6$66.8 million respectively, in accounts payable on unsettled investment purchases and $19.9$201.1 million and $9.1$8.5 million respectively in accounts receivable on unsettled investment sales. The 2003 payable related primarily to


                      an unsettled purchase of a Swedish Treasury Bill bought with funds used to purchase Sirius previous to the closing of the acquisition, which was included in short-term investments at December 31, 2003.

                              Net realized investment gains were reduced by mark-to-market realized losses of $4.2 million and $47.4 million for the years ended December 31, 2003 and 2002, respectively in connection with White Mountains' interest rate swap agreements, which were undertaken to achieve a fixed interest rate on the Old Bank Facility. These interest rate swaps were terminated in May 2003 in connection with the repayment of the Old Bank Facility. Additionally, OneBeacon recorded a $5.4 million write-down of its surplus note investment in New Jersey Skylands Insurance Association during 2003, which is reflected in White Mountains' net realized investment gains.

                              The components of White Mountains' change in unrealized investment gains, after-tax, as recorded on the statements of income and comprehensive income were as follows:

                       
                       Year Ended December 31,
                       
                      Millions

                       
                       2004
                       2003
                       2002
                       
                      Net change in pretax unrealized gains for investment securities held $250.0 $235.9 $448.2 
                      Net change in pretax unrealized gains from investments in unconsolidated affiliates held  51.6  5.1  9.3 


                       Net change in pretax unrealized investment gains for investments held  301.6  241.0  457.5 
                      Income taxes attributable to investments held  (83.6) (77.9) (158.8)


                       Net change in unrealized gains for investments held, after-tax  218.0  163.1  298.7 


                      Recognition of pretax net unrealized gains for investments sold


                      (129.6

                      )


                      (134.0

                      )


                      (144.8

                      )
                      Income taxes attributable to investments sold  41.7  46.7  49.8 


                      Recognition of net unrealized gains for investments sold, after-tax  (87.9) (87.3) (95.0)


                      Change in net unrealized investment gains, after-tax


                      130.1


                      75.8


                      203.7


                      Change in net unrealized foreign currency gains (losses), after-tax


                      48.8


                      3.2


                      (1.4

                      )
                      Net realized investment gains, after-tax  124.4  117.4  122.9 


                      Total investment gains recorded during the period, after-tax $303.3 $196.4 $325.2 


                       Year Ended December 31,
                       
                      Millions

                       
                       2007
                       2006
                       2005
                       
                      Net change in pre-tax unrealized gains (losses) for investment securities held $214.6 $219.5 $(25.1)
                      Net change in pre-tax unrealized gains (losses) from investments in unconsolidated affiliates  (2.2) (32.1) (45.3)


                       Net change in pre-tax unrealized investment gains (losses) for investments held  212.4  187.4  (70.4)
                      Income taxes attributable to investments held  (73.5) (66.8) 19.6 


                       Net change in unrealized gains (losses) for investments held, after-tax  138.9  120.6  (50.8)


                      Recognition of pre-tax net unrealized gains for investments sold  (204.8) (217.8) (190.1)
                      Income taxes attributable to investments sold  77.7  61.8  58.7 


                      Recognition of net unrealized gains for investments sold, after-tax  (127.1) (156.0) (131.4)


                      Change in net unrealized investment gains (losses), after-tax  11.8  (35.4) (182.2)
                      Change in net unrealized foreign currency gains (losses) on investments, after-tax  31.9  77.6  (39.5)
                      Net realized investment gains, after-tax  177.4  198.6  58.4 


                      Total investment gains (losses) recorded during the period, after-tax $221.1 $240.8 $(163.3)


                              The components of White Mountains' ending net unrealized investment gains and losses on its investment portfolio and its investments in unconsolidated insurance affiliates were as follows:


                       December 31,
                       
                       December 31,
                       
                      Millions

                      Millions

                       Millions

                       
                      2004
                       2003
                        2007
                       2006
                       
                      Investment securities:Investment securities:     Investment securities:     
                      Gross unrealized investment gains $551.7 $410.4 Gross unrealized investment gains $396.8 $353.6 
                      Gross unrealized investment losses (26.3) (7.4)Gross unrealized investment losses (85.7) (52.2)


                      Net unrealized gains from investment securitiesNet unrealized gains from investment securities 525.4 403.0 Net unrealized gains from investment securities 311.1 301.4 
                      Net unrealized gains from investments in unconsolidated insurance affiliates 67.2 17.6 
                      Net unrealized gains (losses) from investments in unconsolidated affiliatesNet unrealized gains (losses) from investments in unconsolidated affiliates (1.9) .3 


                      Total net unrealized investment gains, before tax 592.6 420.6 Total net unrealized investment gains, before tax 309.2 301.7 
                       Income taxes attributable to such gains (176.5) (134.6) Income taxes attributable to such gains (99.0) (103.2)
                       
                       
                        Minority interest (3.2) (4.5)
                      Total net unrealized investment gains, after-tax $416.1 $286.0   


                       Total net unrealized investment gains, after-tax $207.0 $194.0 


                              The cost or amortized cost, gross unrealized investment gains and losses, and carrying values of White Mountains' fixed maturity available-for-sale investments as of December 31, 20042007 and 2003,2006, were as follows:

                       
                       December 31, 2004
                      Millions

                       Cost or
                      amortized
                      cost

                       Gross
                      unrealized
                      gains

                       Gross
                      unrealized
                      losses

                       Net
                      foreign
                      currency
                      gains

                       Carrying
                      value

                      U.S. Government obligations $2,362.3 $40.5 $(8.2)$ $2,394.6
                      Debt securities issued by industrial corporations  3,695.4  122.7  (6.2) 33.6  3,845.5
                      Municipal obligations  91.3  1.8  (0.4)   92.7
                      Asset-backed securities  681.9  1.0  (3.4)   679.5
                      Foreign government obligations  780.3  15.2  (1.3)   794.2
                      Preferred stocks  72.9  13.5    7.1  93.5


                       Total fixed maturity investments $7,684.1 $194.7 $(19.5)$40.7 $7,900.0


                       December 31, 2003
                      Millions

                       Cost or
                      amortized
                      cost

                       Gross
                      unrealized
                      gains

                       Gross
                      unrealized
                      losses

                       Net
                      foreign
                      currency
                      gains

                       Carrying
                      value

                      U.S. Government obligations $2,089.3 $53.6 $(3.7)$ $2,139.2
                      Debt securities issued by industrial corporations  2,686.7  160.7  (2.2)   2,845.2
                      Municipal obligations  53.1  4.5      57.6
                      Asset-backed securities  959.4  3.8  (.2)   963.0
                      Foreign government obligations  141.1  3.8      144.9
                      Preferred stocks  80.6  12.8  (.3) 5.1  98.2


                       Total fixed maturity investments $6,010.2 $239.2 $(6.4)$5.1 $6,248.1


                       December 31, 2007
                      Millions

                       Cost or amortized cost
                       Gross unrealized gains
                       Gross unrealized losses
                       Net foreign currency gains (losses)
                       Carrying value
                      U.S. Government obligations $1,250.9 $30.5 $(1.7)$ $1,279.7
                      Debt securities issued by industrial corporations  2,095.8  30.7  (31.1) 35.3  2,130.7
                      Municipal obligations  11.9  .5      12.4
                      Mortgage-backed and asset-backed securities  2,882.6  21.4  (7.3) 1.9  2,898.6
                      Foreign government obligations  792.3  2.6  (5.2) 86.6  876.3
                      Preferred stocks  159.5  8.2  (2.3) 8.4  173.8


                       Total fixed maturity investments $7,193.0 $93.9 $(47.6)$132.2 $7,371.5


                       December 31, 2006
                      Millions

                       Cost or amortized cost
                       Gross unrealized gains
                       Gross unrealized losses
                       Net foreign currency gains
                       Carrying value
                      U.S. Government obligations $1,702.3 $8.1 $(11.4)$ $1,699.0
                      Debt securities issued by industrial corporations  1,939.2  20.2  (23.6) 25.1  1,960.9
                      Municipal obligations  15.5  .5      16.0
                      Mortgage-backed and asset-backed securities  2,957.7  9.3  (8.0) 2.6  2,961.6
                      Foreign government obligations  657.2  2.1  (6.1) 55.2  708.4
                      Preferred stocks  105.1  16.8  (.4) 7.9  129.4


                       Total fixed maturity investments $7,377.0 $57.0 $(49.5)$90.8 $7,475.3


                              The trust account investments comprise $305.5 million of fixed maturity investments and $.1 million of short-term investments, classified as held-to-maturity. The carrying value, gross unrealized investment gains and losses, and estimated fair values of these investments as of December 31, 2007 and December 31, 2006, were as follows:

                       
                       December 31, 2007
                      Millions

                       Carrying value
                       Gross unrealized gains
                       Gross unrealized losses
                       Net foreign currency gains
                       Estimated fair value
                      U.S. Government obligation—fixed maturities $305.5 $1.4 $ $ $306.9
                      U.S. Government obligations—short-term $.1 $ $ $ $.1


                       Total trust account investments $305.6 $1.4 $ $ $307.0


                       December 31, 2006
                      Millions

                       Carrying value
                       Gross unrealized gains
                       Gross unrealized losses
                       Net foreign currency gains
                       Estimated fair value
                      U.S. Government obligations—fixed maturities $305.0 $ $(1.0)$ $304.0
                      U.S. Government obligations—short-term $33.9 $ $ $ $33.9


                       Total trust account investments $338.9 $ $(1.0)$ $337.9


                              The cost or amortized cost and carrying value of White Mountains' fixed maturity available-for-sale investments and convertible bonds, at December 31, 20042007 is presented below by contractual maturity. Actual maturities could differ from contractual maturities because borrowers may have the right to call or prepay certain obligations with or without call or prepayment penalties. All of White Mountains' held-to-maturity trust account investments mature within one year.


                       December 31, 2004
                       December 31, 2007
                      Millions

                       Cost or
                      amortized
                      cost

                       Carrying
                      value

                       Cost or amortized cost
                       Carrying value
                      Due in one year or less $521.3 $522.6 $627.5 $665.4
                      Due after one year through five years 4,123.5 4,200.0 2,951.2 3,056.5
                      Due after five years through ten years 1,715.3 1,797.4 487.0 504.1
                      Due after ten years 569.2 607.1 575.8 563.7
                      Asset-backed securities 681.9 679.4
                      Mortgage-backed and asset-backed securities 2,882.6 2,898.6
                      Preferred stocks 72.9 93.5 159.5 173.8


                      Total $7,684.1 $7,900.0 $7,683.6 $7,862.1


                              The cost or amortized cost, gross unrealized investment gains and losses, and carrying values of White Mountains' common equity securities and other investments as of December 31, 20042007 and 2003,2006, were as follows:

                       
                       December 31, 2004
                      Millions

                       Cost or
                      amortized
                      cost

                       Gross
                      unrealized
                      gains

                       Gross
                      unrealized
                      losses

                       Net
                      foreign
                      currency
                      gains

                       Carrying
                      value

                      Common equity securities $775.9 $267.6 $(2.1)2.5 $1,043.9


                      Other investments $442.7 $89.4 $(4.7) $527.4


                       December 31, 2003
                      Millions

                       Cost or
                      amortized
                      cost

                       Gross
                      unrealized
                      gains

                       Gross
                      unrealized
                      losses

                       Net
                      foreign
                      currency
                      gains

                       Carrying
                      value

                      Common equity securities $396.2 $115.4 $(.4)2.4 $513.6


                      Other investments $184.0 $55.8 $(.6) $239.2


                       December 31, 2007
                      Millions

                       Cost or amortized cost
                       Gross unrealized gains
                       Gross unrealized losses
                       Net foreign currency gains (losses)
                       Carrying value
                      Common equity securities $1,333.9 $234.8 $(34.8)$16.8 $1,550.7
                      Other investments $539.2 $68.1 $(3.3)$(.7)$603.3
                       
                       December 31, 2006
                      Millions

                       Cost or amortized cost
                       Gross unrealized gains
                       Gross unrealized losses
                       Net foreign currency gains
                       Carrying value
                      Common equity securities $972.0 $237.2 $(1.3)$4.7 $1,212.6
                      Other investments $467.1 $59.1 $(1.4)$ $524.8

                              White Mountains' consolidated insurance and reinsurance operations are required to maintain deposits with certain insurance regulatory agencies in order to maintain their insurance licenses. The fair value of such deposits totalled $940.3totaled $321.7 million and $592.7$352.7 million as of December 31, 20042007 and 2003, respectively.2006.

                              Sales and maturities of investments, excluding short-term investments, totalled $7,466.8totaled $8,435.8 million, $18,662.5$6,236.4 million and $13,943.8$6,963.9 million for the years ended December 31, 2004, 20032007, 2006 and 2002, respectively.2005. There were no non-cash exchanges or involuntary sales of investment securities during 2004, 20032007, 2006 or 2002.2005.

                              The Company participates in a securities lending program whereby it loans investment securities to other institutions for short periods of time. The Company receives a fee from the borrower in return for the use of its assets and its policy is to require collateral equal to approximately 102% of the fair value of the loaned securities, which is held by a third party. All securities loaned can be redeemed on short notice. The total market value of the Company's securities on loan at December 31, 20042007 was $580.7$642.7 million with corresponding collateral of $593.3$661.6 million.

                      Impairment

                              White Mountains' portfolio of fixed maturity investments is comprised primarily of investment grade corporate debt securities, U.S. government and agency securities and mortgage-backed securities and are classified as available for sale. At December 31, 2004,2007, approximately 99% of White Mountains' fixed maturity investments received an investment grade rating from S&PStandard & Poor's or from Moody's Investor Services if a given security iswas unrated by S&P.Standard & Poor's. White Mountains expects to continue to invest primarily in high quality, fixed maturity investments. Nearly all the fixed maturity investments currently held by White Mountains are publicly traded, and as such are considered to be liquid.


                              Temporary losses on investment securities are recorded as unrealized losses. Temporary losses do not impact net income and earnings per common share but serve to reduce comprehensive net income, shareholders' equity and tangible book value. Unrealized losses subsequently identified as other-than-temporary impairments are recorded as realized losses. Other-than-temporary impairments previously recorded as unrealized losses do not impact comprehensive net income, shareholders' equity and tangible book value but serve to reduce net income and earnings per share. For the year ended December 31, 2007, White Mountains experienced $18.6 million in other-than-temporary impairment charges, principally comprised of $5.6 million from an investment in the common stock of Centennial Bank Holdings, Inc. and $4.9 million from a fixed maturity investment in CIT Group Inc. For the year ended December 31, 2006, $6.7 million worth of impairments were taken. During the year ended December 31, 2005, White Mountains experienced $58.4 million in pre-tax other-than-temporary impairment charges due primarily to a $54.8 million write-down of its Montpelier investment. During 2005, the market value of Montpelier common shares decreased from $38.45 per share to $18.90 per share. White Mountains' original cost of this investment was $105.4 million which was subsequently increased by $65.3 million in equity in earnings recorded by White Mountains from 2001 to 2004, the period in which it accounted for the investment under the equity method of accounting. The impairment charge represented the difference between White Mountains' GAAP cost of $170.7 million and the investment's fair value of $115.9 million at December 31, 2005.


                              White Mountains' methodology of assessing other-than-temporary impairments is based on security-specific facts and circumstances as of the balance sheet date. As a result, subsequent adverse changes in an issuers' credit quality or subsequent weakening of market conditions that differ from expectations could result in additional other-than-temporary impairments. In addition, the sale of a fixed maturity security with a previously recorded unrealized loss would result in a realized loss. Either of these situations would adversely impact net income and earnings per common share but would not impact comprehensive net income, shareholders' equity or tangible book value.

                              The following table presents an analysis of the continuous periods during which White Mountains has held investment positions which were carried at an unrealized loss as of December 31, 20042007 (excluding short-term investments):

                       
                       December 31, 2004
                       
                      $ in millions

                       0-6
                      Months

                       6-12
                      Months

                       > 12
                      Months

                       Total
                       
                      Fixed maturity investments:             
                       Number of positions  209  166  6  381 
                       Market value $1,678.2 $787.0 $38.4 $2,503.6 
                       Amortized cost $1,686.8 $797.0 $39.3 $2,523.1 
                       Unrealized loss $(8.6)$(10.0)$(.9)$(19.5)


                      Common equity securities:             
                       Number of positions  10  2    12 
                       Market value $8.9 $6.7 $ $15.6 
                       Amortized cost $10.9 $6.8 $ $17.7 
                       Unrealized loss $(2.0)$(.1)$ $(2.1)


                      Other investments:             
                       Number of positions  7  4    11 
                       Market value $31.5 $7.2 $ $38.7 
                       Amortized cost $35.8 $7.6 $ $43.4 
                       Unrealized loss $(4.3)$(.4)$ $(4.7)


                      Total:             
                       Number of positions  226  172  6  404 
                       Market value $1,718.6 $800.9 $38.4 $2,557.9 
                       Amortized cost $1,733.5 $811.4 $39.3 $2,584.2 
                       Unrealized loss $(14.9)$(10.5)$(.9)$(26.3)


                      % of total gross unrealized losses  56.7% 39.9% 3.4% 100.0%


                              During the year ended December 31, 2004, White Mountains experienced $3.0 million in pre-tax, other-than-temporary impairment charges, comprised of $2.5 million taken on equity securities, and $.5 million on several limited partnership investments included in other investments. Of the charge taken on equity securities, $1.3 million was related to White Mountains' investment in the common stock of Callaway Golf Company and the remaining $1.2 million related to two other equity positions, neither of which were individually significant. White Mountains recorded the other-than-temporary impairments primarily due to the fact that the unrealized loss position on these securities was greater


                      than 20% of White Mountains' cost over the previous six-month period and also that certain factors have been reported by those companies which affect the likelihood that White Mountains will recover the original cost of its investment. White Mountains did not experience any other material impairment charges relating to any other individual investment security during the three years ended December 31, 2004.

                       
                       December 31, 2007
                       
                      ($ in millions)

                       0-6 Months
                       6-12 Months
                       > 12 Months
                       Total
                       
                      Fixed maturity investments:             
                       Number of positions  171  83  186  440 
                       Market value $1,148.7 $631.7 $1,025.4 $2,805.8 
                       Amortized cost $1,165.6 $649.0 $1,038.8 $2,853.4 
                       Unrealized loss $(16.9)$(17.3)$(13.4)$(47.6)


                      Common equity securities:


                       Number of positions  276  71  3  350 
                       Market value $289.1 $23.3 $1.0 $313.4 
                       Amortized cost $319.8 $27.3 $1.1 $348.2 
                       Unrealized loss $(30.7)$(4.0)$(.1)$(34.8)


                      Other investments:


                       Number of positions  7  1  1  9 
                       Market value $33.4 $4.1 $.3 $37.8 
                       Amortized cost $36.3 $4.4 $.4 $41.1 
                       Unrealized loss $(2.9)$(.3)$(.1)$(3.3)


                      Total:


                       Number of positions  454  155  190  799 
                       Market value $1,471.2 $659.1 $1,026.7 $3,157.0 
                       Amortized cost $1,521.7 $680.7 $1,040.3 $3,242.7 
                       Unrealized loss $(50.5)$(21.6)$(13.6)$(85.7)


                      % of total gross unrealized losses


                      58.9

                      %


                      25.2

                      %


                      15.9

                      %


                      100.0

                      %


                              White Mountains believes that the gross unrealized losses relating to its fixed maturity investments at December 31, 20042007 resulted primarily from increases in market interest rates from the dates that certain investments within that portfolio were acquired as opposed to fundamental changes in the credit quality of the issuers of such securities. Therefore,White Mountains views these decreases in value are viewed as being temporary because White Mountainsit has the intent and ability to retain such investments foruntil recovery. However, should White Mountains determine that it no longer has the intent and ability to hold a period of time sufficient to allow for any anticipated recoveryfixed maturity investment that has an existing unrealized loss resulting from an increase in market value.interest rates until it recovers, this loss would be realized through the income statement at the time such determination is made. White Mountains also believes that the gross unrealized losses recorded on its common equity securities and its other investments at December 31, 20042007 resulted primarily from decreases in quoted market values from the dates that certain investments securities within that portfolio were acquired as opposed to fundamental changes in the issuer's financial performance and near-term financial prospects. Therefore, these decreases are also viewed as being temporary. However, due to the inherent risk involved in investing in the equity markets, it is possible that the decrease in market value of these investments may ultimately prove to be other than temporary. As ofAt December 31, 2004,2007, White Mountains' investment portfolio did not include any investment securities with an after-tax unrealized loss of more than $2.0 million.$3.0 million for more than a six-month period.


                      NOTE 6. Debt

                              DebtWhite Mountains' debt outstanding as of December 31, 20042007 and 20032006 consisted of the following:

                       
                       December 31,
                       
                      Millions

                       
                       2004
                       2003
                       
                      Senior Notes, face value $700.0 $700.0 
                       Unamortized original issue discount  (1.7) (1.9)


                        Senior Notes, carrying value  698.3  698.1 


                      Sierra Note  50.0   
                      Atlantic Specialty Note  20.0   
                      C-F Seller Note    25.0 
                      Fund III notes  15.0  15.0 
                      Other debt    4.9 


                        Total debt $783.3 $743.0 


                       December 31,
                       
                      Millions

                       
                       2007
                       2006
                       
                      Fund American Senior Notes, at face value $700.0 $700.0 
                       Unamortized original issue discount  (1.1) (1.3)


                        Fund American Senior Notes, carrying value  698.9  698.7 


                      WMRe Senior Notes, at face value  400.0   
                       Unamortized original issue discount  (1.1)  


                         WMRe Senior Notes, carrying value  398.9   


                      WTM Bank Facility(1)    320.0 
                      Fund American Bank Facility     
                      Mortgage Note  40.8  40.8 
                      Sierra Note(2)  36.3  27.2 
                      Atlantic Specialty Note  18.0  20.0 


                        Total debt $1,192.9 $1,106.7 


                      (1)
                      The $320.0 million outstanding on December 31, 2006 was under White Mountains' previous credit facility, which was refinanced in June 2007 (See below).

                      (2)
                      The increase of $9.1 million in the adjustable Sierra Note is the result of a dollar-for-dollar decrease in prior year loss reserves (See Note 3).

                              A schedule of contractual repayments of White Mountains' debt as of December 31, 20042007 follows:

                      Millions

                       December 31,
                      2004

                      Millions

                       December 31, 2007
                      Due in one year or less $Due in one year or less $2.1
                      Due in two to three years 17.0Due in two to three years 41.8
                      Due in four to five years 4.0Due in four to five years 5.7
                      Due after five years 764.0Due after five years 1,145.5
                       
                       
                      Total $785.0
                       
                      Total $1,195.1


                      Fund American Senior Notes

                              In May 2003, Fund American Companies, Inc. ("Fund American"), a wholly-owned subsidiary of OneBeacon Ltd., issued $700.0 million face value of senior unsecured debt through a public offering, at an issue price of 99.7% (the "Fund American Senior Notes"). The Fund American Senior Notes bear an annual interest rate of 5.9%,


                      payable semi-annually in arrears on May 15 and November 15, until maturity onin May 15, 2013, and are2013. Pursuant to the offering of the Fund American Senior Notes, White Mountains fully and unconditionally guaranteed as to the payment of principal and interest byon the Company.Fund American Senior Notes. Following the OneBeacon Offering, White Mountains continues to guarantee the payment of principal and interest on the Fund American Senior Notes. OneBeacon Ltd. pays White Mountains a guarantee fee equal to 25 basis points per annum on the outstanding principal amount of the Fund American Senior Notes. If White Mountains' voting interest in OneBeacon Ltd.'s common shares ceases to represent more than 50% of all their voting securities, OneBeacon Ltd. will seek to redeem, exchange or otherwise modify the senior notes in order to fully and permanently eliminate White Mountains' obligations under its guarantee. In the event that White Mountains' guarantee is not eliminated, the guarantee fee will increase over time up to a maximum of 450 basis points.

                              Fund American incurred $7.3 million in expenses related to the issuance of the Fund American Senior Notes (including the $4.5 million underwriting discount), which have been deferred and are being recognized into interest expense over the life of the Fund American Senior Notes. Taking into effect the amortization of the original issue discount and all underwriting and issuance expenses, the Fund American Senior Notes have an effective yield to maturity of approximately 6.0% per annum.

                              At December 31, 2007, White Mountains was in compliance with all of the covenants under the Fund American Senior Notes.


                      WMRe Senior NotesBank Facility

                              On March 19, 2007, WMRe Group issued $400.0 million face value of senior unsecured notes at an issue price of 99.715% (the "WMRe Senior Notes") for net proceeds of $392.0 million after taking into effect both deferrable and non-deferrable issuance costs, including the interest rate lock agreement described below. The WMRe Senior Notes were issued in an offering that was exempt from the registration requirements of the Securities Act of 1933. The WMRe Senior Notes bear an annual interest rate of 6.375%, payable semi-annually in arrears on March 20 and September 20, until maturity in March 2017.

                              White Mountains Re deferred $3.6 million in expenses related to the issuance of the WMRe Senior Notes (including $2.6 million in underwriting fees), which are being recognized into interest expense over the life of the WMRe Senior Notes.

                              In September 2003,anticipation of the issuance of the WMRe Senior Notes, White Mountains Re entered into an interest rate lock agreement to hedge its interest rate exposure from the date of the agreement until the pricing of the WMRe Senior Notes. The agreement was terminated on March 15, 2007 with a loss of $2.4 million, which was recorded in other comprehensive income. The loss is being reclassified from accumulated other comprehensive income over the life of the WMRe Senior Notes using the interest method and is included in interest expense. At December 31, 2007, the unamortized balance of the loss remaining in accumulated other comprehensive income was $2.3 million.

                              Taking into effect the amortization of the original issue discount and all underwriting and issuance expenses, including the interest rate lock agreement, the WMRe Senior Notes yield an effective rate of 6.49% per annum. White Mountains recorded $20.2 million of interest expense, inclusive of amortization of issuance costs and the interest rate lock agreement, on the WMRe Senior Notes for the year ended December 31, 2007.

                              At December 31, 2007, White Mountains was in compliance with all of the covenants under the WMRe Senior Notes.

                      Bank Facilities

                              The net proceeds from the WMRe Senior Notes were distributed to White Mountains and were used in part to repay the $320 million in outstanding borrowings on White Mountains' revolving credit facility. In accordance with the mandatory commitment reduction provision in the credit facility at the time, following the issuance of the WMRe Senior Notes the revolving credit facility commitment was reduced from $500 million to $304 million.

                              During the second quarter of 2007, White Mountains replaced its existing credit facility with a new $475 million revolving credit facility that matures in June 2012 (the "WTM Bank Facility"). This new facility removed WMRe Group as co-borrower and co-guarantor, added certain intermediate holding companies of White Mountains as co-guarantors and amended and/or removed certain financial and other covenants. As of December 31, 2007, the WTM Bank Facility was undrawn.

                              In November 2006, Fund American established a $300.0$75 million revolving credit facility that matures in November 2011 (the "Bank"Fund American Bank Facility"). All borrowings under which boththis facility are guaranteed by OneBeacon Ltd. As of December 31, 2007, the Fund American Bank Facility was undrawn.

                              At December 31, 2007, White Mountains was in compliance with all of the covenants under the WTM Bank Facility and the Company are permitted borrowers. In August 2004, Fund American restructuredBank Facility.

                      Mortgage Note

                              In December 2005, OneBeacon entered into a $40.8 million, 18-year mortgage note, which has a variable interest rate based upon the lender's 30-day LIBOR rate, to purchase land and re-syndicatedits U.S. headquarters building in Canton, Massachusetts. As of December 31, 2007, OneBeacon had drawn down the Bank Facility to increase the availabilityentire $40.8 million available under the revolving credit facilitymortgage note. Repayment will commence on January 31, 2009.

                              Concurrent with entering into the mortgage note, OneBeacon also entered into an interest rate swap to $400.0 million andhedge its exposure to extendvariability in the maturity from September 2006 to August 2009. Underinterest rate on the Bank Facility, the Company guarantees all obligations of Fund American, and Fund American guarantees all borrowingsmortgage note. The notional amount of the Company, subjectswap is equal to certain limitations imposed bythe debt outstanding on the mortgage note and will be adjusted to match the drawdowns and repayments on the mortgage note so that the principal amount of the mortgage note and the notional amount of the swap are equal at all times. Under the terms of the Berkshire Preferred Stock. Asswap, OneBeacon pays a fixed interest rate of approximately 6% and receives a variable interest rate based on the same LIBOR index used for the mortgage note. Interest paid or received on the swap is reported in interest expense. Changes in the fair value of the interest rate swap, which was a $1.1 million loss, after tax and net of minority interest, for the year ended December 31, 2004, the Bank Facility was undrawn.2007, is reported as a component of other comprehensive income.


                      Other Debt of Operating Subsidiaries
                      Sierra Note

                              In connection with its acquisition of the Sierra Group on March 31, 2004, Folksamerica Holdings entered into a $62.0 million purchase note (the "Sierra Note"), $58.0 million of which willmay be adjusted over its approximate six-year term to reflect favorable or adverse loss reserve development on the acquired reserve portfolio and run-off of remaining policies in force (mainly workers compensation business), as well as certain other balance sheet protections. During 2004,Since inception the principal of the Sierra Note washas been reduced by $12.0$25.7 million as a result of adverse development on the acquired reserves and run-off of unearned premium.premium, which includes $22.8 million of adverse development which occurred during 2005 and $9.1 million of favorable development occurring in 2007. Interest will accrueaccrues on the unpaid balance of the Sierra Note at a rate of 4.0% per annum, compounded quarterly, and will beis payable at its maturity.

                      Atlantic Specialty Note

                              In connection with its acquisition of Atlantic Specialty on March 31, 2004, OneBeacon issued a $20.0 million ten-year note to the seller (the "Atlantic Specialty Note"). OneBeacon is required to repay $2.0 million of principal on the notes per year, commencing with the first payment duebeing made on January 1, 2007. The note accrues interest at a rate of 5.2%, except that the outstanding principal amount in excess of $15.0 million accrues interest at a rate of 3.6%.

                              OBPP and Folksamerica Specialty Underwriting, Inc. ("FSUI") have borrowed $8.0 million and $7.0 million, respectively, from Dowling & Partners Connecticut Fund III, LP ("Fund III") in connection with an incentive program sponsored by the State of Connecticut known as the Connecticut Insurance Reinvestment Act (the "CIR Act"). The CIR Act provides for Connecticut income tax credits to be granted for qualifying investments made by approved fund managers. The loans made by Fund III to OBPP and FSUI are qualifying investments and, together, have the potential to generate up to $15 million of tax credits that would be shared equally between Fund III on the one hand and OBPP and FSUI on the other. The borrowings mature in April 2007 and bear interest at the option of OBPP and FSUI at either (1) the greater of (a) the prime rate minus 1% and (b) the federal funds rate minus 0.50% or (2) the eurodollar rate plus 0.325%.

                              In connection with its acquisition of C-F Insurance Company in September 2001, Folksamerica issued a $25.0 million note to the seller (the "C-F Seller Note".) On August 27, 2004, Folksamerica paid off the remaining balance of this note.


                      Interest

                              Total interest expense incurred by White Mountains for its indebtedness was $49.1$73.0 million, $48.6$50.1 million and $71.8$44.5 million in 2004, 20032007, 2006 and 2002, respectively.2005. Total interest paid by White Mountains for its indebtedness was $48.9$62.5 million, $45.8$47.5 million and $79.8$44.7 million in 2004, 20032007, 2006 and 2002, respectively.2005.


                      NOTE 7. Income Taxes

                              The Company is domiciled in Bermuda and has subsidiaries domiciled in several countries. The majority of the Company's worldwide operations are taxed in the United States. Income earned or losses incurred by non-U.S. companies will generally be subject to an overall effective tax rate lower than that imposed by the United States.

                              The total income tax provision (benefit) for the years ended December 31, 2004, 20032007, 2006 and 20022005 consisted of the following:

                       
                       Year Ended December 31,
                      Millions

                       2004
                       2003
                       2002
                      U.S. income tax provision $19.5 $114.2 $4.7
                      State and local income tax provision  1.0  .1  
                      U.S. withholding tax and foreign income tax provision  26.5  13.3  7.0


                       Total income tax provision $47.0 $127.6 $11.7


                      Net Federal income tax receipts (payments) $(86.5)$27.4 $189.6


                       Year Ended December 31,
                       
                      Millions

                       
                       2007
                       2006
                       2005
                       
                      Current tax provision (benefit):          
                       Federal $105.0 $29.8 $(30.0)
                       State  .6  (1.8) (1.0)
                       Non-U.S.   39.8  18.3  39.3 


                      Total current tax provision  145.4  46.3  8.3 


                      Deferred tax provision (benefit):          
                       Federal  47.5  (2.2) 60.6 
                       State       
                       Non-U.S.   17.6  54.8  (32.4)


                      Total deferred tax provision (benefit)  65.1  52.6  28.2 


                       Total income tax provision $210.5 $98.9 $36.5 


                              The components of the income tax provision (benefit) on pretax earnings follow:

                       
                       Year Ended December 31,
                       
                      Millions

                       
                       2004
                       2003
                       2002
                       
                      Current $106.0 $22.6 $(152.2)
                      Deferred  (59.0) 105.0  163.9 


                       Total income tax provision on pretax earnings $47.0 $127.6 $11.7 


                              Deferred income taxes reflect the net tax effects of temporary differences between the carrying amounts of assets and liabilities for financial reporting purposes and the amounts for tax purposes. Deferred income tax assets and liabilities are shown net in circumstances where a consolidated income


                      tax return is filed. An outline of the significant components of White Mountains' deferred tax assets and liabilities follows:


                       December 31,

                       December 31,
                       
                      Millions

                      Millions

                      Millions

                       
                      2004
                       2003
                      2007
                       2006
                       
                      Deferred income tax assets related to:Deferred income tax assets related to:    Deferred income tax assets related to:     
                      Net operating loss and tax credit carryforwards $102.0 $84.2Discounting of loss reserves $152.7 $155.7 
                      Discounting of loss reserves 152.3 149.5Net unearned insurance and reinsurance premiums 82.9 83.8 
                      Compensation and benefit accruals 219.8 180.0U.S. net operating loss and tax credit carryforwards 75.6 67.2 
                      Unearned insurance and reinsurance premiums 99.5 79.7Non-U.S. net operating losses and tax credit carryforwards 56.9 53.5 
                      Involuntary pool and guaranty fund accruals 5.3 12.2Incentive compensation 55.9 90.9 
                      Fixed assets 2.2 3.6Olympus reimbursement 48.0 48.0 
                      Allowance for doubtful accounts 7.0 12.2Deferred compensation 41.8 31.0 
                      Deferred gain on reinsurance contract 20.7 21.5Deferred gain on reinsurance contract 19.6 20.9 
                      Other items 15.0 49.4Fixed assets 9.2 9.6 
                       
                       
                      Accrued interest 7.1 18.9 
                      Total deferred income tax assets $623.8 $592.3
                      Pension and benefit accruals 3.4 11.0 
                      Allowance for doubtful accounts 2.8 2.8 
                      Involuntary pool and guaranty fund accruals 1.7 4.5 
                      Other items 20.4 22.5 


                      Total gross deferred income tax assetsTotal gross deferred income tax assets $578.0 $620.3 
                      Less valuation allowance (59.2) (67.7)


                      Total net deferred income tax assetsTotal net deferred income tax assets $518.8 $552.6 


                      Deferred income tax liabilities related to:Deferred income tax liabilities related to:    Deferred income tax liabilities related to:     
                      Net unrealized investment gains 176.5 134.6Safety reserve $397.8 $350.8 
                      Foreign currency translation on investments and other assets 14.4 3.8Net unrealized investment gains 99.0 103.2 
                      Equity in unconsolidated insurance affiliates 27.3 36.4Deferred acquisition costs 93.7 89.6 
                      Deferred acquisition costs 100.9 80.6Foreign currency translation on investments 13.0 4.9 
                      Receivable from trust  24.1Investment basis differences 11.4 11.3 
                      Safety reserve 310.6 Purchase accounting 8.4 14.8 
                      Other items 35.6 52.8Other items 12.1 13.5 


                      Total deferred income tax liabilitiesTotal deferred income tax liabilities 665.3 332.3Total deferred income tax liabilities $635.4 $588.1 
                      Net deferred tax asset (liability) before valuation allowance (41.5) 260.0
                      Valuation allowance (3.3) 


                      Net deferred tax asset (liability)Net deferred tax asset (liability) $(44.8)$260.0Net deferred tax asset (liability) $(116.6)$(35.5)


                              At December 31, 2007 and 2006, the total net deferred tax asset related to U.S. operations is $236.6 million and $276.0 million respectively. At December 31, 2007 and 2006, the total net deferred tax liability for non-U.S. operations is $353.2 million and $311.5 million respectively.

                              At December 31, 2007 and 2006, a valuation allowance of $45.4 million and $54.8 million, respectively, was recorded for certain assets applicable to Scandinavian Re (those relating to loss reserve discounting and net operating loss carryforwards). The Company believes that it is more likely than not that these assets will not be realized and has therefore established a full valuation allowance against them. The change in the valuation allowance from 2006 to 2007 primarily relates to the current year reduction in loss reserve discounting of $(7.1) million and the net effect of operating loss carryforwards that were either utilized or expired in 2007 of $(4.5) million.

                              At December 31, 2007 and 2006, a valuation allowance of $13.8 million and $12.9 million, respectively, was established for net deferred tax assets of consolidated insurance reciprocals which file separate consolidated tax returns.

                              The Company believes that it is more likely than not that results of future operations will generate sufficient taxable income to realize the deferred tax asset balances (net of valuation allowance) carried as ofat December 31, 20042007 and 2003. During 2003, the valuation allowance was reduced by $30.0 million due to the expiration of certain foreign tax credits that were previously recorded as deferred tax assets. During 2004, a valuation allowance of $3.3 million was established for net operating loss carryforwards of a consolidated insurance reciprocal.2006.


                              A reconciliation of taxes calculated using the 35% U.S. statutory rate (the tax rate at which the majority of the Company's worldwide operations are taxed) to the income tax provision on pretaxpre-tax earnings follows:


                       Year Ended December 31,
                       
                       Year Ended December 31,
                       
                      Millions

                      Millions

                       Millions

                       
                      2004
                       2003
                       2002
                        2007
                       2006
                       2005
                       
                      Tax provision at the U.S. statutory rateTax provision at the U.S. statutory rate $86.7 $130.3 $41.8 Tax provision at the U.S. statutory rate $238.5 $255.4 $102.6 
                      Differences in taxes resulting from:Differences in taxes resulting from:       Differences in taxes resulting from:       
                      Interest expense—dividends and accretion on preferred stock 16.7 7.8  Interest expense—dividends and accretion on preferred stock 22.9 20.5 18.3 
                      Tax reserve adjustments (7.6) 4.3 15.4 Withholding tax 18.7 6.4 (2.3)
                      Restructuring 16.6   Purchase price adjustments 3.1  (8.0)
                      Non-U.S. earnings, net of foreign taxes (18.5) (11.4) (27.2)Change in valuation allowance 2.5 .2 (9.2)
                      Foreign tax credit (38.8)   Tax reserve adjustments (.4) (15.6) 3.5 
                      Tax exempt interest and dividends (4.1) (4.1) (4.5)Tax exempt interest and dividends (4.2) (20.3) (3.2)
                      Deferred credit amortization and purchase price adjustments (5.0)  (7.0)Non-U.S. earnings, net of foreign taxes (74.1) (147.2) (66.2)
                      Change in valuation allowance 3.3  (10.0)Other, net 3.5 (.5) 1.0 
                      Non deductible interest expense 1.4  4.3   


                      Total income tax provision on pre-tax earningsTotal income tax provision on pre-tax earnings $210.5 $98.9 $36.5 
                      Other, net (3.7) .7 (1.1)  


                      Total income tax provision on pretax earnings $47.0 $127.6 $11.7 


                              The non-U.S. component of pretaxpre-tax earnings was $100.0$324.8 million, $70.5$629.7 million and $97.8$247.6 million for the years ended December 31, 2004, 20032007, 2006 and 2002,2005, respectively.

                              At December 31, 2004,2007, there were U.S. net operating loss carryforwards of approximately $46.3$168.6 million available the majority of which will begin to expire in 2011. TheseIncluded in these tax losses are losses of $43.1 million subject to an annual limitation on utilization under Internal Revenue Code Section 382. In addition, at December 31, 2004, thereAlso included in these losses are net operating losses of $23.3 million related to the insurance reciprocals which file separate consolidated tax returns. There were Swedish$38.7 million of net operating loss carryforwards of approximately $25.1available to reduce Swedish taxable income relating to Scandinavian Re. These net operating loss carryforwards expire as follows: $14.9 million availablein 2008, $23 million in 2009 and $.8 million in 2010. However, on January 30, 2008, Scandinavian Re, which do not expire.is a Bermuda entity, was sold to another White Mountains entity and its income will no longer will be subject to Swedish tax. Therefore, its deferred tax assets and valuation allowance related to Swedish income taxes will be eliminated going forward.

                              At December 31, 2004,2007, there were credits for increasing research activities of $2.3 million which will begin to expire in 2020.

                              At December 31, 2004, there were alternative minimumforeign tax credit carryforwards available of approximately $30.8 million. The alternative minimum tax credit does not expire.

                              Subsequent to the passage$16.5 million, of the Jobs Creation Act of 2004, which extended the carryforward period for utilization of a foreign tax credit, the Company filed amended United States tax returns to claim a credit rather than a deduction for foreign taxes paid. At December 31, 2004, $45.7$11.9 million of the credit remained which will expire in 2010. During 2004,The remaining credit will expire between 2014-2017.

                              On January 1, 2007 the Company adopted FASB Interpretation No. 48,Accounting for Uncertainy in Income Taxes ("FIN 48"). FIN 48 prescribes when the benefit of a given tax position should be recognized and how it should be measured. In connection with the adoption of FIN 48, the Company has recognized a $.2 million decrease in the liability for unrecognized tax benefits, primarily as a result of reductions in its estimates of accrued interest. The effect of adoption has been recorded as an adjustment to opening retained earnings. A reconciliation of the beginning and ending amount of unrecognized tax benefits is as follows:

                      Millions

                        
                      Balance at January 1, 2007 $70.6
                       Additions for tax positions related to the current year  1.1
                       Additions for tax positions of prior years  13.1
                        
                      Balance at December 31, 2007 $84.8
                        

                              If recognized, $70.0 million would be recorded as a reduction to income tax expense. Also included in the balance at December 31, 2007, are $14.8 million of tax positions for which ultimate deductibility is highly certain but the timing of deductibility is uncertain. Because of the impact of deferred tax accounting, other than interest and penalties, the disallowance of the shorter deductibility period would not affect the effective tax rate but would accelerate the payment of cash to the taxing authority to an earlier period.

                              FIN 48 also addresses how interest and penalties should be accrued for uncertain tax positions, requiring that interest expense should be recognized in the first period interest would be accrued under the tax law. The Company classifies all interest and penalties on unrecognized tax benefits as part of income tax expense. During the year ended December 31, 2007 the Company recognized $1.6 million in interest expense, net of federal benefit. The balance of accrued interest at December 31, 2007 is $5.5 million, net of federal benefit.

                              With few exceptions, the Company is no longer subject to U.S. federal, state or non-U.S. income tax examinations by tax authorities for years before 2003. In 2007, the Swedish Tax Agency concluded an income tax audit of the Company's reorganization to align its legal organization with its main operating businesses, certainSwedish subsidiaries were removed from the existing consolidated Federal income tax group, resulting in $16.6 million of income tax.

                              The U.S. federal income tax returns for 2004 and 2005 resulting in an insignificant adjustment. The


                      Internal Revenue Service (IRS) commenced an examination of certain of the Company's U.S. Companiessubsidiaries' income tax returns for 2003 and 2004 in the second quarter of 2006 that is anticipated to be completed by the end of 2008. As of December 31, 2007 the IRS has not proposed any significant adjustments to taxable income. Due to the uncertainty of the outcome of the on-going IRS examination, White Mountains cannot estimate the range of reasonably possible changes to its unrecognized tax benefits at this time. However, White Mountains does not expect to receive any adjustments that would result in a material change to its financial position.

                              Net income tax payments to (receipts from) national governments (primarily the United States) totaled $150.0 million, $(5.3) million and $(14.6) million for the years ended December 31, 2007, 2006 and 2005.

                      NOTE 8. Weather Contracts

                              For the years ended December 31, 2007 and 2006, Galileo recognized $2.0 million and $2.1 million of net losses on its weather and weather contingent derivatives portfolio, excluding unamortized deferred gains of $2.9 million and $4.7 million, respectively. The fair values of Galileo's risk management products are routinely audited by taxing authorities. Insubject to change in the near-term and reflect management's opinion, adequate tax liabilitiesbest estimate based on various factors including, but not limited to, realized and forecasted weather conditions, changes in interest or foreign currency exchange rates and other market factors. Estimating the fair value of derivative instruments that do not have been established for all open tax years. These liabilitiesquoted market prices requires management's judgment in determining amounts that could reasonably be expected to be received from or paid to a third party to settle the contracts. Such amounts could be revisedmaterially different from the amounts that might be realized in an actual transaction to settle the contract with a third party.

                              Galileo's weather risk management contracts are summarized in the future if estimatesfollowing table:

                       
                       Year Ended December 31,
                       
                      Millions

                       
                       2007
                       2006
                       
                      Net liability for weather derivative contracts beginning balance $12.1(1)$ 
                       Net consideration received during the year for new contracts  12.5  12.6 
                       Net payments made on contracts settled during the year  (8.7) (2.6)
                       Net decrease in fair value on settled and unsettled contracts  2.0  2.1 


                      Net liability for weather derivative contracts ending balance $17.9(2)$12.1(1)


                      (1)
                      Amount includes $4.7 million in unamortized deferred gains.

                      (2)
                      Amount includes $2.9 million in unamortized deferred gains.

                              The following table summarizes the maturity of contracts outstanding as of December 31, 2007:

                      Millions

                       < 1 Year
                       1-3 Years
                       3-5 Years
                       > 5 Years
                       Total
                       
                      Net liability for contracts actively quoted $4.2 $ $ $ $4.2 
                      Net liability for contracts using internal pricing models  6.1  7.6      13.7 


                      Total net liability for weather contracts outstanding $10.3 $7.6 $ $ $17.9(1)


                      (1)
                      Amount includes $2.9 million in unamortized deferred gains.

                      NOTE 9. Variable Annuity Reinsurance

                      White Mountains' ultimateMountains has entered into agreements to reinsure death and living benefit guarantees associated with certain variable annuities in Japan through its wholly owned subsidiary, WM Life Re. The accounting for benefit guarantees differs depending on whether or not the guarantee is classified as a derivative or an insurance liability.

                              At December 31, 2007 and 2006, the liability changes.recorded for the variable annuity benefit guarantees which is included in other liabilities, was $12.7 million and $(13.8) million, respectively of which $.4 million and $.1 million, respectively, were life insurance liabilities.

                              At December 31, 2007 and 2006, the fair value of WM Life Re's derivative contracts was $43.7 million and $21.2 million, which are included in other assets. For the years ended December 31, 2007 and 2006, WM Life Re had losses from derivatives of $.7 million and $15.7 million.

                              At December 31, 2007 WM Life Re had $8.5 million of cash and $5.0 million of securities deposited as collateral with counterparties. At December 31, 2006 WM Life Re had $2.2 million of cash and $7.7 million of securities deposited as collateral with counterparties.


                      NOTE 10. Earnings per share

                              Basic earnings per share amounts are based on the weighted average number of common shares outstanding excluding unvested restricted common shares ("Restricted Shares"). Diluted earnings per share amounts are based on the weighted average number of common shares and the net effect of potentially dilutive common shares outstanding, based on the treasury stock method. The following table outlines the Company's computation of earnings per share for the years ended December 31, 2007, 2006 and 2005:

                       
                       Year Ended December 31,
                       
                       
                       2007
                       2006
                       2005
                       
                      Basic earnings per share numerators (in millions):          
                      Income before extraordinary item $407.4 $651.8 $290.1 
                       Extraordinary item—excess of fair value of acquired net assets over cost    21.4   


                      Net income $407.4 $673.2 $290.1 


                      Diluted earnings per share numerators (in millions):          
                      Income before extraordinary item $407.4 $651.8 $290.1 
                       Other effects on diluted earnings(1)      (3.5)


                      Income before extraordinary item $407.4 $651.8 $286.6 


                       Extraordinary item—excess of fair value of acquired net assets over cost    21.4   


                      Adjusted net income $407.4 $673.2 $286.6 


                      Basic earnings per share denominators (in thousands):          
                       Average common shares outstanding during the period  10,784  10,780  10,774 
                       Average unvested Restricted Shares  (52) (11) (13)


                      Basic earnings per share denominator  10,732  10,769  10,761 


                      Diluted earnings per share denominator (in thousands):          
                       Average common shares outstanding during the period  10,784  10,780  10,774 
                       Average unvested Restricted Shares(2)  (46)   (13)
                       Average outstanding dilutive options to acquire common shares(3)  13  23  33 


                      Diluted earnings per share denominator  10,751  10,803  10,794 


                      Basic earnings per share (in dollars):          
                      Income before extraordinary item $37.96 $60.52 $26.96 
                       Extraordinary item—excess of fair value of acquired net assets over cost    1.99   


                      Net income $37.96  62.51 $26.96 


                      Diluted earnings per share (in dollars):          
                      Income before extraordinary item $37.89 $60.33 $26.56 
                       Extraordinary item—excess of fair value of acquired net assets over cost    1.99   


                      Net income $37.89 $62.32 $26.56 


                      (1)
                      The diluted earnings per share numerator for the year ended December 31, 2005 has been adjusted to exclude an income statement credit associated with outstanding options to acquire common shares (see footnote 3 below).

                      (2)
                      Restricted Shares outstanding vest either upon a stated date or upon the occurrence of a specified event. See Note 12. In accordance with FAS No. 123(R), the diluted earnings per share denominator is reduced by the number of Restricted Shares that represent the unamortized compensation cost at December 31, 2007. Such amounts are computed using the treasury stock method.

                      (3)
                      The diluted earnings per share denominator for the year ended December 31, 2007 includes 18,720 common shares issuable upon exercise of incentive options at an average strike price of $162.90 per common share. The diluted earnings per share denominator for the year ended December 31, 2006 includes 32,596 common shares at an average strike price of $154.05 per common share. The diluted earnings per share denominator for the year ended December 31, 2005 includes 42,910 common shares at an average strike price of $145.33 per common share. The non-qualified options were not included in the diluted earnings per share denominator as their inclusion would be anti-dilutive for the periods presented. (See Note 12).


                      NOTE 8.11. Retirement and Postretirement Plans

                              Certain subsidiaries of the Company offer various retirementOneBeacon sponsors a qualified and postretirement benefits to its employees. Under the terms of these plans, White Mountains reserves the right to change, modify or discontinue the plans.


                              Certain subsidiaries of the Company sponsor qualified anda non-qualified, non-contributory, defined benefit planspension plan covering substantially all employees.employees who were employed as of December 31, 2001 and remain actively employed with OneBeacon. Current plans include a OneBeacon qualified pension plan, the "Qualified Plan" and a OneBeacon non-qualified pension plan, and an NFU qualified pension plan. The benefits for the plans are based primarily on years of service and employees' pay near retirement. Participants generally vest after five years of continuous service. White Mountains' funding policy is consistent with"Non-qualified Plan" (collectively the funding requirements of federal laws and regulations.

                              In addition to the defined benefit plans, certain of the Company's subsidiaries have multiple contributory postretirement benefit plans which provide medical and life insurance benefits to pensioners and survivors. White Mountains' funding policy is to make contributions to the plan that are necessary to cover its current obligations.

                              The majority of"Plans"). OneBeacon's pension and retiree medical plans were curtailed in the fourth quarter of 2002. The OneBeacon Insurance Pension Plan willPlans no longer add new participants or increase benefits for existing participants. Non-vested participants already in the plan willparticipants continue to vest during their employment with OneBeacon, which this effectively causes the projected benefit obligation to equal the accumulated benefit obligation. Retirees

                              The benefits for the Plans are also eligible for medical benefits if they meet certain agebased primarily on years of service and service requirements. However, dueemployees' pay through December 31, 2002. Participants generally vest after five years of continuous service. OneBeacon's funding policy is consistent with the funding requirements of Federal laws and regulations.

                              In addition to the curtailment,defined benefit plans, OneBeacon had a contributory postretirement benefit plan which provided medical and life insurance benefits to pensioners and survivors. OneBeacon's funding policy was to make contributions to the plan no longer accepts new retirees afterthat were necessary to cover its current obligations.

                              In the fourth quarter of 2005, OneBeacon settled its postretirement benefit obligation through the funding of an independent trust to provide benefits for covered participants in the amount of $31.2 million. Upon completing the funding of the independent trust, OneBeacon terminated the postretirement benefit plan. OneBeacon's settlement of its postretirement benefit obligation and termination of the plan resulted in recognition of a grace period ended May 31, 2003. The majority of retiree medical costs are capped at defined dollar amounts, with retirees contributing the remainder. OneBeacon uses a December 31st measurement date for its plans.

                              The Medicare Prescription Drug, Improvement, and Modernization Act of 2003 (the "Medicare Act") made significant changes to the federal Medicare Program by increasing coverage for prescription drugs.$53.6 million gain. As a result OneBeacon's retiree medicalof settling and terminating the postretirement benefit plan, disclosure of obligations have been reduced.and funded status as well as various assumptions is not applicable.

                              On July 11, 2007, the Company settled approximately 80% of the Qualified Plan liabilities through the purchase of two group annuity contracts for $398.5 million from Transamerica Life Insurance Company and Hartford Life Insurance Company ("Hartford Life"). In accordance with SFAS No. 88 "Employers' Accounting for Settlements and Curtailments of Defined Benefit Pension Plans and for Termination Benefits", the Qualified Plan's obligations were re-measured in connection with this settlement. As a result of the partial settlement and re-measurement, the Company recognized a gain of $25.6 million through pre-tax income ($6.3 million as a reduction to loss and LAE, allocated to claims department employees, and $19.3 million as a reduction to other underwriting expenses) and a pre-tax loss of $2.5 million through other comprehensive income in the third quarter of 2004, OneBeacon adopted FASB Staff Position No. 106-2 entitled "Accounting and Disclosure Requirements Related2007. The remaining Qualified Plan liabilities are primarily attributable to the Medicare Prescription Drug, Improvement and Modernization Act of 2003", which reduced OneBeacon's accumulated benefit obligationQualified Plan participants who remain actively employed by less than $1 million. Accordingly, the impact of the Medicare Act is immaterial to White Mountains' consolidated financial position.OneBeacon.


                              The following tables set forth the obligations and funded status, assumptions, plan assets and cash flows associated with the various pension plan and postretirement benefits as ofat December 31, 20042007 and 2003:2006:


                      Obligations and Funded Status


                       Pension
                      Benefits

                       Other Postretirement
                      Benefits

                        Pension Benefits
                       
                      Millions

                        
                      2004
                       2003
                       2004
                       2003
                        2007
                       2006
                       
                      Change in projected benefit obligation:              
                      Projected benefit obligation at beginning of year $501.5 $494.6 $69.7 $70.0  $534.1 $507.3 
                      Service cost 1.9 1.9 .1 .2  2.1 2.6 
                      Interest cost 30.7 30.5 3.2 4.6  16.7 27.7 
                      Curtailment      
                      Plan amendments     (13.4)
                      Settlement gain (398.5)  
                      Special termination benefit cost 1.8 1.6 
                      Assumption changes   (.6) 3.5  (4.8) 36.9 
                      Actuarial (gain) loss 40.8 44.5 (12.8) 13.8 
                      Liability net loss     
                      Actuarial loss 1.6 3.3 
                      Benefits and expenses paid, net of participant contributions (49.4) (70.0) (8.7) (9.0) (28.4) (42.2)
                      Benefits paid directly by OneBeacon (3.0) (3.1)


                      Projected benefit obligation at end of year $525.5 $501.5 $50.9 $69.7  $121.6 $534.1 


                      Change in plan assets:              
                      Fair value of plan assets at beginning of year $478.8 $471.1 $ $  $532.7 $488.0 
                      Actual return on plan assets 61.8 82.0    39.7 83.4 
                      Employer contributions 4.2 5.4 8.7 9.0 
                      Special termination benefits (2.9) (9.7)     
                      Benefits and expenses paid, net of participant contributions (49.4) (70.0) (8.7) (9.0) (28.4) (42.2)
                      Settlement gain (398.5)  
                      Other adjustments  3.5 


                      Fair value of plan assets at end of year $492.5 $478.8 $ $  $145.5 $532.7 


                      Funded status $(33.0)$(22.7)$(50.9)$(69.7)
                      Unrecognized net loss(gain) 17.6 6.4 3.3 16.7 
                      Unrecognized prior service benefit   (46.8) (50.9)
                      Funded status at end of year $23.9 $(1.4)


                      Net amount accrued as a liability $(15.4)$(16.3)$(94.4)$(103.9)


                              The funded status of the consolidated pension plans is ($33.0)at December 31, 2007 was $23.9 million, which represents an over-funding of which ($3.8)$51.8 million relates to the qualified pension plans and ($29.2) million is related to the non-qualified planQualified Plan and an under-funding of $27.9 million related to the Non-qualified Plan. The Non-qualified Plan, which is unfunded.unfunded, does not hold any assets. OneBeacon has set aside $18.2 million in irrevocable rabbi trusts for the benefit of Non-qualified Plan participants. In accordance with GAAP, the assets held in the rabbi trusts are not reflected in the funded status of the consolidated pension plans as presented.

                              Amounts recognized in the financial statements consist of:


                       Other Postretirement Benefits
                       
                       
                       Pension Benefits
                       
                      Millions

                       
                       2004
                       2003
                       2004
                       2003
                       
                      Prepaid benefit cost $15.0 $15.4 $ $ 
                      Accrued benefit cost  (34.1) (31.7) (94.4) (103.9)
                      Intangible assets         
                      Accumulated other comprehensive income (pre-tax)  3.7       


                      Net amount accrued as a liability $(15.4)$(16.3)$(94.4)$(103.9)


                       Pension Benefits
                       
                      Millions

                       
                       2007
                       2006
                       
                      Prepaid benefit cost recorded in other assets $51.8 $27.4 
                      Accrued benefit cost recorded in other liabilities  (27.9) (28.8)


                      Net amount accrued in the financial statements $23.9 $(1.4)


                              Because the Plans have been curtailed, the accumulated benefit obligation is equal to the projected benefit obligation. The accumulated benefit obligation and projected benefit obligation for all defined benefit pension plans was $521.2 million and $497.4 millionthe Qualified Plan at December 31, 20042007 and 2003, respectively.

                              Information2006 was $93.6 million and $505.3 million. The accumulated benefit obligation and projected benefit obligation for the OneBeacon non-qualified pension planNon-qualified Plan at December 31, 2007 and 2006 was $27.9 million and $28.8 million. The fair value of the NFU qualified pension plan which had accumulated benefit obligations in excess of plan assets were as follows:for the Qualified Plan at December 31, 2007 and 2006 was $145.5 million and $532.7 million. The Non-qualified Plan did not hold any assets at December 31, 2007 and 2006.

                       
                       December 31,
                      Millions

                       2004
                       2003
                      Projected benefit obligation $57.6 $52.5
                      Accumulated benefit obligation  53.3  48.4
                      Fair value of plan assets  21.1  18.9


                              At December 31, 2006, White Mountains adopted FAS 158 and accordingly recognized the funded status of OneBeacon's defined benefit plans upon adoption. The following summarizes the incremental effect of adoption on individual line items in the statement of financial position:

                      Millions

                       Before Adoption of FAS 158
                       Adjustments
                       After Adoption of FAS 158
                      Prepaid benefit cost recorded in other assets $18.6 $8.8 $27.4
                      Accrued benefit cost recorded in other liabilities  28.8    28.8
                      Deferred federal income taxes  314.6  (3.1) 311.5
                      Net effect of adoption before adjustment for minority interest  n/a  5.7  n/a
                      Minority interest  604.8  (1.6) 603.2
                      Accumulated other comprehensive income  227.7  4.1  231.8


                      Total shareholders' equity $4,451.2 $4.1 $4,455.3


                              The components of net periodic benefit costs for the years ended December 31, 2004, 20032007, 2006 and 20022005 were as follows:


                       Pension Benefits
                       Other Postretirement Benefits
                        Pension Benefits
                       Other Postretirement Benefits
                       
                      Millions

                        
                      2004
                       2003
                       2002
                       2004
                       2003
                       2002
                        2007
                       2006
                       2005
                       2007
                       2006
                       2005
                       
                      Service cost $1.9 $1.9 $14.6 $.1 $.2 $1.8  $2.1 $2.6 $1.1 $�� $ $.1 
                      Interest cost  30.7  30.5  36.3  3.2  4.6  8.3  16.7  27.7 28.5   2.8 
                      Expected return on plan assets  (32.2) (30.5) (38.4)       (17.7) (30.6) (30.6)    
                      Amortization of prior service cost (benefit)      1.5  (4.1) (3.6) (.5)
                      Amortization of prior service benefit       (4.1)
                      Amortization of unrecognized loss        .1  .5    .3  .3 .1    
                      Recognized actuarial loss      .1      .1 


                      Net periodic pension cost before settlements, curtailments and special termination benefits  .4  1.9  14.1  (.7) 1.7  9.7 
                      Settlement expense(gain)    (1.6) 3.5       
                      Curtailment (gain)      (20.7)     (14.4)
                      Net periodic pension cost (income) before settlements, curtailments and special termination benefits 1.4   (.9)   (1.2)
                      Settlement gain (25.6)      
                      Special termination benefits expense(1)  2.9  9.7  3.4        1.8  1.6 2.8    


                      Total settlements, curtailments and special termination benefits  2.9  8.1  (13.8)     (14.4)


                      Total net periodic benefit cost (income) $3.3 $10.0 $.3 $(.7)$1.7 $(4.7) $(22.4)$1.6 $(1.9)$ $ $(1.2)


                      (1)
                      Special termination benefits are additional payments made from the pension plan when a vested participant terminates employment due to a reduction in force.


                      Assumptions

                              The weighted average assumptionsdiscount rate used to determine benefit obligations at December 31, 20042007 and 2003 were:2006 was:

                       
                       Pension Benefits
                       Other Postretirement Benefits
                       
                       
                       2004
                       2003
                       2004
                       2003
                       
                      Discount rate 5.875%6.000%5.875%6.000%
                      Rate of compensation increase(1) 0.190%0.180%0.034%0.026%

                      (1)
                      The rate of compensation increase affects only the NFU qualified pension plan as both the OneBeacon qualified and non-qualified pensions plans are frozen.

                       
                       Pension Benefits
                       
                       
                       2007
                       2006
                       
                      Discount rate 5.750%5.027%

                              The weighted average assumptions used to determine net periodic benefit cost for the years ended December 31, 2004, 20032007 and 20022006 were:

                       
                       Pension Benefits
                       Other Postretirement Benefits
                       
                       
                       2004
                       2003
                       2002
                       2004(1)
                       2003(2)
                       2002
                       
                      Discount rate 6.000%6.500%6.500%6.125%6.250%6.500%
                      Expected long-term rate of return on plan assets 7.000%7.000%7.500%   
                      Rate of compensation increase(3) 0.190%0.206%0.300%0.034%0.026%0.026%


                      (1)
                      The
                       
                       Pension Benefits
                       
                       
                       2007
                       2006
                       
                      Discount rate 5.096%5.500%
                      Expected long-term rate of return on plan assets 5.400%6.500%

                              OneBeacon's discount rate in effect from January 1 through June 30, 2004 was 6.0%. The postretirement health plan was re-measured on June 30 dueassumptions used to plan changes that became effective on July 1. The discount rate was raised to 6.25%account for the re-measurementQualified and remainedNon-qualified Plans reflect the rates at which the benefit obligations could be effectively settled. For 2006, these rates were determined based on consideration of published yields for high quality long-term corporate bonds and U.S. Treasuries, as well quotes on insurance company annuity contracts. For 2007, in effect through December 31, 2004.

                      (2)
                      The discount rate in effect from January 1 through June 30, 2003addition to consideration of published yields for high quality long-term corporate bonds, U.S. Treasuries and quotes on insurance company annuity contracts, consideration was 6.5%. The postretirement health plan was re-measured on June 30 duegiven to plan changes that became effective on July 1. The discount rate was lowered to 6.0% fora cash flow matching analysis utilizing the re-measurementCitigroup Pension Discount Curve and remained in effect through December 31, 2003.

                      (3)
                      The rate of compensation increase affects only the NFU qualified pension plan as both the OneBeacon qualified and non-qualified pensions plans are frozen.
                      Liability Index.

                              OneBeacon performed an analysis of expected long-term rates of return based on the allocation of its pension plan assets as ofat both December 31, 20042007 and December 31, 20032006 to develop expected rates of return for each significant asset class or economic indicator. A range of returns was developed based both on forecasts and on broad-marketbroad market historical benchmarks for expected return, correlation, and volatility for each asset class. Although the expected investment return assumption is long-term in nature, the range of reasonable returns had dropped over the past few years as a consequence of lower inflation and lower bond yields.

                              The assumed health care cost trend rates at December 31, 2004 and 2003 were:

                       
                       2004
                       2003
                       
                      Health care cost trend rate assumed for next year 10.0%9.5%
                      Rate to which the cost trend rate is assumed to decline 5.0%5.0%
                      Year that the rate reaches the ultimate trend rate 2014 2013 

                              Assumed health care cost trend rates typically have a significant effect on the amounts reported for the health care plans. A one-percentage-point change in assumed health care cost trend rates would have the following pre-tax effects:

                      Millions

                       One-
                      Percentage
                      Point
                      Increase

                       One-
                      Percentage
                      Point
                      Decrease

                       
                      Effect on total service and interest cost $ $ 
                      Effect on postretirement benefit obligation  .3  (.2)


                      Plan Assets

                              OneBeacon's pension plans weighted-average asset allocations at December 31, 20042007 and 2003,2006, by asset category were as follows:


                       Plan Assets at December 31,
                        Plan Assets at December 31,
                      Asset Category

                       
                      2004
                       2003
                        2007
                       2006
                      Equity securities 45%44%
                      Debt securities 36%37%
                      Fixed maturity investments 19% 32%
                      Common equity securities 24% 42%
                      Convertible securities 13%11% 50% 20%
                      Cash and cash equivalents 6%8%
                      Cash and short-term investments 7% 6%


                      Total 100%100% 100% 100%


                              The majority of the plans' assets are invested by White MountainsWM Advisors, LLC, a subsidiary of White Mountains Insurance Group, Ltd.Mountains. The investment policy places an emphasis on preserving invested assets through a diversified portfolio of high-quality income producing investments and equity investments.

                              The investment management process integrates the risks and returns available in the investment arena with the risks and returns available to the plan in establishing the proper allocation of invested assets. The asset classes include fixed income, equity, convertible securities, and cash and cash equivalents. The factors examined in establishing the appropriate investment mix include: the outlook for risk and return in the various investment markets and sectors, and the long term need for capital growth.


                      Cash Flows

                              OneBeacon expectsdoes not expect to contribute $4.2 millionmake a contribution to its pension plans and $6.9in 2008. OneBeacon expects to pay $2.8 million of benefit payments in 2008 related to its other postretirement benefits plans in 2005. The majority of OneBeacon's expected pension contributions in 2005 relate tothe non-qualified pension plans,plan, for which OneBeacon has established assets held in rabbi trusts.

                              The following benefit payments, which reflect expected future service, as appropriate, are expected to be paid:

                       
                       Pension Benefits
                       Other Benefits
                      Millions

                       Expected Benefit
                      Payments

                       Expected Benefits
                      Payments

                       Expected Medicare
                      Part D
                      Subsidies

                      2005 $39.1 $6.9 $
                      2006  38.6  6.5  .1
                      2007  38.4  6.1  .1
                      2008  38.1  5.6  .1
                      2009  38.4  5.2  .1
                      2010-2014  184.4  20.7  .4
                      Millions

                       Expected Benefit Payments
                      2008 $5.3
                      2009  5.8
                      2010  6.2
                      2011  6.7
                      2012  7.1
                      2013–2017 $41.2


                      Other Benefit Plans

                              Certain of the Company's subsidiaries sponsor variousOneBeacon sponsors an employee savings plansplan (defined contribution plans)plan) covering the majority of employees. The contributory plans provideplan provides qualifying employees with matching contributions of up to six percent of qualifying employees' salary (subject to federalFederal limits on allowable contributions in a given year). Total expense for the plansplan was $5.8$3.7 million, $5.5$4.9 million and $7.4$4.7 million in 2004, 20032007, 2006 and 2002,2005, respectively.


                      Following the curtailment of the OneBeacon had a post-employment benefit liability of $13.2 millionPension Plan and $14.4 million related to its long-term disability plan at December 31, 2004 and 2003, respectively.

                              Effectiveeffective January 1, 2003, OneBeacon replaced its defined benefit pension plan with an employee stock ownership plan. OneBeacon had a post-employment benefit liability of $9.0 million and $9.6 million related to its long-term disability plan ("ESOP"). See Note 9.at December 31, 2007 and 2006.


                      NOTE 9.12. Employee Share-Based Incentive Compensation Plans

                              White Mountains' share-based incentive compensation expenses, consisting primarily of performance share expense,plans are designed to maximizewith one goal in mind, maximization of shareholder value over long periods of timetime. White Mountains believes that this goal is best pursued by aligningutilizing a pay-for-performance program for its key employees that closely aligns the financial interests of its management with those of its owners. The Board believesshareholders. White Mountains accomplishes this by emphasizing highly variable long-term compensation that share-based compensationis contingent on performance over a number of years rather than entitlements (such as base salary, pensions and employee benefits). To that end, the Company's Compensation Committee has established base salaries and target annual bonuses for its key employees shouldthat tend to be payable in full only iflower than those paid by other property and casualty (re)insurers, while granting the Company achieves superior returns for its owners.bulk of target compensation as long-term, share-based incentive compensation.

                              White Mountains expenses all its share-based compensation, including its outstanding Options.compensation. As a result, the Company'sWhite Mountains' calculation of such returnits owners' returns includes the full expense of all outstanding share-based compensation awards. See Note 1 for a summary of White Mountains' accounting policies regarding its share-based compensation plans.


                      Incentive Compensation Plans

                      White Mountains' Long-Term Incentive Plan (the "Incentive Plan")

                              The Incentive Plan provides for granting various types of share-based and non share-based incentive awards to certain officerskey employees of the Company and certain of its subsidiaries, various types of share-based incentive awards including performance shares, Restricted Shares and Options.subsidiaries. The Incentive Plan was adopted by the Board, and was approved by the Company's sole shareholder in 1985 and was subsequently amended by its shareholders in 1995, 2001, 2003 and 2001.

                      Performance2005. Share-based incentive awards that may be granted under the plan include performance shares, Restricted Shares,

                      Incentive Options and Non-qualified Stock Options ("Non-Qualified Options"). Performance shares are conditional grants of a specified maximum number of Common Sharescommon shares or an equivalent amount of cash. In general, grants are earned,awards vest, subject to the attainment of pre-specified performance goals, at the end of a three-year period or as otherwise determined by the Compensation Committee of the Board and are valued based on the market value of Common Sharescommon shares at the time awards are paid. Results that significantly exceed pre-specified targets can result inCompensation expense is recognized on a performance share payout of up to 200% of value whereas results significantly below target result in no payout. The Company's principal performance share goal is its after-tax corporate return on equity as measured by growth in its intrinsic value per share ("ROE"). The Company calculates intrinsic value per share based on its growth in economic value per share (weighted 50%), growth in tangible GAAP book value per share (weighted 25%) and growth in market value per share (weighted 25%).This proprietary measure is viewed by management andpro rata basis over the Board as being an objective and conservative measurevesting period of the valueawards.

                              The OneBeacon Long-Term Incentive Plan (the "OneBeacon Incentive Plan") provides for granting to key employees of White MountainsOneBeacon Ltd., and includes the projected costcertain of all outstanding compensation awards. At December 31, 2004, 69,250, 75,200 and 53,500its subsidiaries, various types of share-based incentive awards, including performance shares, had beenRestricted Shares, Incentive Options and Non-Qualified Options. In February 2007, all of the outstanding performance shares granted at target under the Incentive Plan forthat were held by OneBeacon employees were replaced with an equivalent value of performance shares from the three-year performance periods beginning 2004, 2003 and 2002, respectively.OneBeacon Incentive Plan whose value is based upon the market price of an underlying OneBeacon Ltd. common share ("OB Performance Shares").

                              During 2004,Certain of White Mountains' subsidiary incentive plans, consisting of the OneBeacon Phantom White Mountains made payments with respect to 63,480Share Plan, the White Mountains Re Performance Plan, the Folksamerica Performance Plan and the Esurance Performance Plan, provide for granting phantom White Mountains performance shares (relating(the "Phantom Share Plans") to certain key employees of OneBeacon, White Mountains Re, Folksamerica and Esurance. The performance goals for full payment of performance shares issued under these plans are identical to those of the 2001-2003 performance period) at an average 137% payout level, amounting to $40.7 million, to its participantsIncentive Plan. Performance shares earned under the Phantom Share Plans are payable solely in cash or by deferral into certain non-qualified compensation plans of the Company or its subsidiaries. During the first quarter of 2003, White Mountains made payments with respect to 39,500 performance shares (relating to the 2000-2002 performance period) at a 200% payout level, amounting to $25.7 million, to its participants in cash or by deferral into certain non-qualified compensation plans of the Company or its subsidiaries. In the second quarter of 2003, White Mountains made payments with respect to 21,725 performance shares, amounting to $13.1 million, in cash or by deferral into certain non-qualified compensation plans of the Company. The performance share payments in the second quarter were the result of an agreed upon cancellation of performance shares held by certain non-employee directors of the Company for performance periods scheduled to end on December 31, 2003, 2004 and 2005. During 2002, White Mountains paid a total of 31,300 performance shares (relating to the 1999-2001 performance period) at a 200% value, amounting to


                      $20.7 million, to its participants in cash, Common Shares or by deferral into certain non-qualified compensation plans of the Company or its subsidiaries.

                              The targeted performance goal for full payment of performance shares granted during 2004 to non-investment personnel is the attainment of an ROE of 13%. At an ROE of 6% or less, no such performance shares would be earned and at an ROE of 20% or more, 200% of such performance shares would be earned. With respect to the 2004 performance shares granted investment personnel, the performance goals for full payment are based in part on the ROE criteria described above and in part on the attainment of an annual return on invested assets of the greater of 1.5% or 150 basis points over the applicable total return on the constant maturity ten-year United States treasury note (the "2004 Treasury Return"). At an annual return on invested assets less than or equal to the greater of 0% or the 2004 Treasury Return, no such performance shares would be earned and at an annual return on invested assets of the greater of 3.25% or 325 basis points over the 2004 Treasury Return, 200% of such performance shares would be earned. With respect to the 2004 performance shares granted to investment personnel, the Compensation Committee of the Board generally retains the authority to weigh each performance goal as they deem appropriate at the end of the cycle.

                              The targeted performance goal for full payment of performance shares granted during 2003 to non-investment personnel is the attainment of an ROE of 11%. At an ROE of 4% or less, no such performance shares would be earned and at an ROE of 21% or more, 200% of such performance shares would be earned. With respect to the 2003 performance shares granted to investment personnel, the performance goals for full payment are based in part on the ROE criteria described above and in part on the attainment of an annual return on invested assets of 150 basis points over the applicable total return on the constant maturity ten-year United States treasury note (the "2003 Treasury Return"). At an annual return on invested assets equal to the 2003 Treasury Return, no such performance shares would be earned and at an annual return on invested assets of 325 basis points over the 2003 Treasury Return, 200% of such performance shares would be earned. With respect to the 2003 performance shares granted to investment personnel, the Compensation Committee of the Board generally retains the authority to weigh each performance goal as they deem appropriate at the end of the cycle.

                              The targeted performance goal for full payment of performance shares granted during 2002 to certain holding company personnel is based on the attainment of an ROE of 12%. At an ROE of 5% or less, no such performance shares would be earned and at an ROE of 23% or more, 200% of such performance shares would be earned. With respect to the 2002 performance shares granted to OneBeacon personnel (including certain officers of the holding company), the targeted performance goal for full payment is based in part on the ROE criteria described above and in part on the attainment of an insurance trade ratio of 102% on OneBeacon's core insurance operations. At a trade ratio of 106% or more, no such performance shares would be earned and at a trade ratio of 96% or less, 200% of such performance shares would be earned. With respect to the 2002 performance shares granted to investment personnel, the performance goals for full payment are based in part on the ROE criteria described above and in part on the attainment of an annual return on invested assets of 150 basis points over the applicable total return on the constant maturity ten-year United States treasury note (the "2002 Treasury Return"). At an annual return on invested assets equal to the 2002 Treasury Return, no such performance shares would be earned and at an annual return on invested assets of 300 basis points over the 2002 Treasury Return, 200% of such performance shares would be earned. With respect to the 2002 performance shares granted to OneBeacon personnel (including certain officers of the holding company) and investment personnel, in general the Compensation Committee of the Board generally retains the authority to weigh each performance goal as they deem appropriate at the end of the cycle.


                      Restricted SharesMountains.

                              In 2001 White Mountains' Compensation Committee issued 94,500 Restricted Shares, of which 21,000 vested in December, 2002 and 73,500 vested in June 2003. During 2002 and 2003,addition, the Company repurchased 20,750 and 34,000, respectively,offers certain types of these Restricted Shares and in return granted an equivalent value in various non-qualified deferredshare-based compensation plans of the Company and its subsidiaries. During 2004 and 2003, certain key officers were awarded 10,000 and 6,000 Restricted Shares, respectively. No Restricted Shares were awarded during 2002. These Restricted Shares vest either ratably or entirely over a three year period from the date of grant and vesting of Restricted Share awards is dependent on continuous service by the employee throughout the award period. There are no other restrictions on the Restricted Shares once they have become fully vested. As of December 31, 2004, the Company had 15,000 Restricted Shares that were unvested.

                      Options

                              At December 31, 2004 and 2003, the Company had 46,530 Options outstanding (10,530 of which were exercisable) and 50,565 Options outstanding (7,365 of which were exercisable), respectively. These Options were issued in 2000 to certain key employees as a one-time incentive and vest ratably over a ten-year period. The Options had a weighted average exercise price of $140.80 and $132.83 per Common Share at December 31, 2004 and 2003, respectively. During 2004 and 2003, 4,035 and 11,400 Options, respectively, were exercised at an average exercise price of $139.58 and $129.01 per Common Share, respectively.


                      OneBeacon Performance Plan

                              OneBeacon's Performance Plan (the "OB Performance Plan") provides for granting of performance shares to certain key employees of OneBeacon. The performance goals for full payment of performance shares issued under the OB Performance Plan are similar to those of the Incentive Plan. The OB Performance Plan was approved by the Board but was not subject to shareholder approval.

                              At December 31, 2004, there were 3,500, none and 150,896 performance shares outstanding under the OB Performance Plan for the three-year performance periods beginning 2004, 2003 and 2002, respectively. During 2004, OneBeacon made payments with respect to 101,802 performance shares (relating to the 2001-2003 performance period) at an average 182% payout level, amounting to $84.6 million, to its participants in cash. No performance shares were paid during 2003 and 2002.


                      Folksamerica Performance Plan

                              Folksamerica's Performance Plan provides for granting of performance shares to certain key employees of Folksamerica. The performance goals for full payment of performance shares issued under the Folksamerica Performance Plan are similar to those of the Incentive Plan. The Folksamerica Performance Plan was approved by the Board but was not subject to shareholder approval.

                              At December 31, 2004, there were 2,000, 4,900 and 9,400 performance shares outstanding under the Folksamerica Performance Plan for the three-year performance periods beginning 2004, 2003 and 2002, respectively. Folksamerica made payments with respect to 2,500 performance shares (relating to the 2001-2003 performance period) at a 93% payout level, amounting to $1.1 million, to its participants in cash. Folksamerica made payments with respect to 5,500 performance shares (relating to the 2000-2002 performance period) at a 200% payout level, amounting to $2.9 million, to its participants in cash. No performance shares were paid during 2002.


                      Other Share-Based Compensation

                      qualified retirement plans. The defined contribution plans of OneBeacon, Folksamerica and FolksamericaEsurance (the "401(k) Plans") offer its participants the ability to invest their balances in several different investment options, including the


                      Company's Common Shares. As of December 31, 2004 and 2003, the 401(k) Plans owned less than 1% of the total Common Shares outstanding. In connection with the OneBeacon Acquisition, during 2001 eligible OneBeacon employees received a one-time contribution of two Common Shares which resulted in the issuance of 11,980 Common Shares.

                              Effective January 1, 2003, OneBeacon adopted ancommon shares. OneBeacon's employee stock ownership plan ("ESOP"), which is a OneBeacon-funded benefit plan. The ESOPplan that provides all of its participants with an annual base contribution in Common Sharescommon shares equal to 3% of their salary, up to the applicable Social Security wage base (or $87,900$97,500 with respect to 2004)2007). Additionally, those participants not otherwise eligible to receive certain other OneBeacon benefits under OneBeacon's Management Incentive Plan can earn a variable contribution up to an additional 6% of their salary, throughup to the ESOP,applicable Social Security wage base, contingent upon OneBeacon's performance.

                      Performance Shares

                              White Mountains' share-based compensation expense consists primarily of performance share expense. Performance shares are designed to reward company-wide performance. The level of payout ranges from zero to two times the number of shares initially granted, depending on the Company's financial performance. Performance shares become payable at the conclusion of a performance cycle (typically three years) if pre-defined financial targets are met.


                              The principal performance measure used for determining performance share payouts is after-tax growth in the Company's intrinsic business value per share. The Compensation Committee historically has considered the growth in intrinsic business value per share to be based on the growth of economic value per share (which is weighted 50%), growth in tangible book value per share (which is weighted 25%) and growth in market value per share (which is weighted 25%), all inclusive of dividends. Economic value is calculated by adjusting the GAAP book value per share for differences between the GAAP carrying values of certain assets and liabilities and the Company's estimate of their underlying economic values (such as for the time value discount in loss reserves).

                              The following summarizes performance share activity for the years ended December 31, 2007, 2006 and 2005 for performance shares granted under the Incentive Plan and Phantom Share Plans:

                       
                       Year Ended December 31,
                       
                       
                       2007
                       2006
                       2005
                       
                      Millions, except share amounts

                       Target Performance Shares Outstanding
                       Accrued Expense
                       Target Performance Shares Outstanding
                       Accrued Expense
                       Target Performance Shares Outstanding
                       Accrued Expense
                       
                      Beginning of period 185,363 $102.4 183,031 $100.5 368,646 $340.0 
                       Payments and deferrals (63,300) (56.0)(1)(64,100) (57.0)(2)(212,611) (234.5)(3)
                       New awards 55,173   71,185   84,617   
                       Forfeitures and cancellations (17,684) (4.6)(4,753) (2.7)(57,621) (27.1)
                       Transfers out(4) (12,810) (4.4)      
                       Expense recognized   9.9   61.6   22.1 


                      Ending December 31, 146,742 $47.3 185,363 $102.4 183,031 $100.5 


                      (1)
                      Performance share payments in 2007 for the 2004-2006 performance cycle range from 145% to 186% of target.

                      (2)
                      Performance share payments in 2006 for the 2003-2005 performance cycle ranged from 142% to 181% of target.

                      (3)
                      Performance share payments in 2005 for the 2002-2004 performance cycle ranged from 160% to 180% of target.

                      (4)
                      In February 2007, the WTM performance shares of OneBeacon employees were replaced with an equivalent value of OB performance shares issued under the OneBeacon Long-Term Incentive Plan

                              If 100% of the outstanding performance shares had been vested on December 31, 2007, the total additional compensation cost to be recognized would have been $30.4 million, based on current accrual factors (common share price and payout assumptions).

                              All performance shares earned for the 2004-2006, 2003-2005, and 2002-2004 performance cycles were settled in cash or by deferral into certain non-qualified deferred compensation plans of the Company or its subsidiaries.

                        Performance shares granted under the Incentive Plan

                              The following summarizes performance shares outstanding and accrued $13.3expense for performance shares awarded under the Incentive Plan at December 31, 2007 for each performance cycle:

                      Millions, except share amounts

                       Target Performance Shares Outstanding
                       Accrued Expense
                       
                      Performance cycle:      
                       2005-2007 40,530 $12.5 
                       2006-2008 49,918  24.4 
                       2007-2009 46,811  8.4 


                       Sub-total 137,259  45.3 
                        Assumed forfeitures (3,432) (1.1)


                      Total at December 31, 2007 133,827 $44.2 


                              The targeted performance goal for full payment of outstanding performance shares granted under the Incentive Plan to non-investment personnel is a 13% growth in intrinsic business value per share. Growth of 6% or less would result in a payout of 0% and growth of 20% or more would result in a payout of 200%.


                              For investment personnel, the targeted performance goal for full payment of outstanding performance shares granted under the Incentive Plan is based in part on growth in intrinsic business value per share (as described above) and in part on achieving a total return on invested assets as measured against metrics based on United States treasury note and/or industry benchmark returns.

                        Phantom Performance Shares granted under Phantom Share Plans

                              The following summarizes performance shares outstanding and accrued expense for awards made under the Phantom Share Plans at December 31, 2007 for each performance cycle:

                      Millions, except share amounts

                       Target Performance Shares Outstanding
                       Accrued Expense
                       
                      Performance cycle:      
                       2005-2007 3,567 $.9 
                       2006-2008 2,139  .9 
                       2007-2009 7,540  1.4 


                       Sub-total 13,246  3.2 
                        Assumed forfeitures (331) (.1)


                      Total at December 31, 2007 12,915 $3.1 


                              The targeted performance goal for full payment of outstanding performance shares granted under the Phantom Share Plans is a 13% growth in intrinsic business value per share. Growth of 6% or less would result in a payout of 0% and growth of 20% or more would result in a payout of 200%.

                      Restricted Shares

                              At December 31, 2007, 2006 and 2005, the Company had 54,000, 10,000 and 13,000 unvested Restricted Shares outstanding under the WTM Incentive Plan. The following outlines the unrecognized compensation cost associated with the outstanding Restricted Share awards under the WTM Incentive Plan for the years ended December 31, 2007, 2006 and 2005:

                       
                       Year Ended December 31,
                       
                       
                       2007
                       2006
                       2005
                       
                      Millions, except share amounts

                       Restricted Shares
                       Unamortized Grant Date Fair Value
                       Restricted Shares
                       Unamortized Grant Date Fair Value
                       Restricted Shares
                       Unamortized Grant Date Fair Value
                       
                      Non-vested, beginning of year 10,000 $.3 13,000 $1.9 15,000 $4.2 
                       Granted 54,000  31.0       
                       Vested (10,000)  (3,000)  (1,000)  
                       Forfeited       (1,000) (0.3)
                       Expense recognized   (4.6)  (1.6)  (2.0)


                      Non-vested at end of year 54,000 $26.7 10,000 $.3 13,000 $1.9 


                              During the first quarter of 2007, White Mountains made the following grants of Restricted Shares to the Company's Chairman and CEO: (1) 35,000 Restricted Shares that vest in equal annual installments over five years, and (2) 15,000 Restricted Shares that vest in the event of a change in control of the Company before January 20, 2012. During the first quarter of 2007, White Mountains also awarded 4,000 Restricted Shares to other employees that cliff vest in February 2010 based on continuous service by the employee throughout the award period. Of the unrecognized compensation cost at December 31, 2007, $18.1 million is expected to be recognized ratably over the remaining vesting periods and $8.6 million is expected to be recognized in the event of a change in control before January 20, 2012. Upon vesting, all restrictions initially placed upon the common shares lapse.

                              On January 1, 2006, White Mountains recorded an adjustment of $1.9 million to reclassify unearned compensation in common shareholders' equity relating to its outstanding Restricted Shares to opening paid-in surplus to reflect the cumulative effect of adoption of FAS 123R.


                      Stock Options

                        Non-Qualified Options

                              In January 2007, the Company issued 200,000 seven-year Non-Qualified Options to the Company's Chairman and CEO that vest in equal annual installments over five years and that have an initial exercise price of $650 per common share that escalates each year by 5% less the annual regular dividend rate (the "Escalator"). The fair value of the Non-Qualified Options at the grant date was estimated using a closed-form option model using an expected volatility assumption of 29.7%, a risk-free interest rate assumption of 1.1% (or 4.7% plus the expected annual regular dividend rate at the date of grant less the Escalator), a forfeiture assumption of 0%, an expected dividend rate assumption of 1.4% and a term assumption of seven years. The fair value of the Non-Qualified Options was $27.2 million at the grant date and will be recognized ratably over the five year vesting period. The Company recognized $5.1 million of expense for the year ended December 31, 2007 associated with its Non-Qualified Options.

                        Incentive Options

                              At December 31, 2007, 2006 and 2005, the Company had 9,900, 29,550 and 34,280 Incentive Options outstanding which were granted to certain key employees on February 28, 2000 (the grant date) under the WTM Incentive Plan. The 81,000 Incentive Options originally granted were issued at an exercise price equal to the market price of the Company's underlying common shares on February 27, 2000. The exercise price escalates by 6% per annum over the life of the Incentive Options. The Incentive Options vest ratably over a ten-year service period. Upon the adoption of FAS 123R, the grant date fair value of the awards as originally disclosed for FAS 123, adjusted for estimated future forfeitures, became the basis for recognition of compensation expense for the Incentive Options. The fair value of each Incentive Option award at the grant date was estimated using a closed-form option model using an expected volatility assumption of 18.5%, a risk-free interest rate assumption of 6.4% and an expected term of ten years.

                              The following summarizes the Company's Incentive Option activity for the years ended December 31, 2007, 2006 and 2005:

                       
                       Year ending December 31,
                       
                      Millions, except share and per share amounts

                       
                       2007
                       2006
                       2005
                       
                      Opening balance—outstanding Options  29,550  34,280  46,530 
                       Forfeited  (8,100) (1,200) (4,500)
                       Exercised  (11,550) (3,530) (7,750)


                      Ending balance—outstanding Options  9,900  29,550  34,280 


                      Opening balance—exercisable Options  11,550  9,080  10,530 
                       Vested  3,300  6,000  6,300 
                       Exercised  (11,550) (3,530) (7,750)


                      Ending balance—exercisable Options  3,300  11,550  9,080 


                      Intrinsic value of Options exercised $4.7 $1.5 $3.4 
                      Exercise price—beginning of year $158.21 $149.25 $140.80 
                      Exercise price—end of year $167.70 $158.21 $149.25 
                      Compensation expense (income) $ $ $(3.5)


                              The total in-the-money value of all outstanding Incentive Options and those Incentive Options currently exercisable at December 31, 2007 was $3.4 million and $1.1 million. The Incentive Options expire in February 2010. White Mountains expects approximately 3,300 Incentive Options to become exercisable in 2008 and will issue common shares when the Incentive Options are exercised.


                      Share-Based Compensation Based on OneBeacon Ltd. Common Shares

                        OB Performance Shares

                              The following summarizes activity for the year ended December 31, 2007 for OB Performance Shares granted under the OB Incentive Plan:

                       
                       December 31, 2007
                       
                      Millions, except share amounts

                       Target
                      Performance
                      Shares
                      Outstanding

                       Accrued
                      Expense

                       
                      Beginning of period  $ 
                       Payments and deferrals    
                       New awards 934,131   
                       Forfeitures and cancellations (158,638) (.2)
                       Transfers from the WTM Incentive Plan(1) 288,197  4.4 
                       Expense recognized   5.1 


                      Ending December 31, 1,063,690 $9.3 


                          (1)
                          In February 2007, the WTM performance shares of OneBeacon employees were replaced with an equivalent value of OB Performance Shares issued under the OneBeacon Long-Term Incentive Plan.

                              If 100% of the outstanding OB Performance Shares had been vested on December 31, 2007, the total additional compensation cost to be recognized would have been $11.7 million, based on December 31, 2007 accrual factors (common share price and payout assumptions).

                              The following summarizes OB Performance Shares outstanding awarded under the OB Incentive Plan at December 31, 2007 for each performance cycle:

                      Millions, except share amounts

                       Target OB
                      Performance
                      Shares
                      Outstanding

                       Accrued
                      Expense

                       
                      Performance cycle:      
                       2005-2007 122,859 $1.8 
                       2006-2008 141,522  1.9 
                       2007-2009 826,395  5.8 


                       Sub-total 1,090,776  9.5 
                        Assumed forfeitures (27,086) (.2)


                      Total at December 31, 2007 1,063,690 $9.3 


                        Non-Qualified Options

                              In November 2006, in connection with its initial public offering, OneBeacon Ltd. issued to its key employees 1,420,000 fixed-price Non-Qualified Options to acquire OneBeacon Ltd. common shares. The Non-Qualified Options have a $30.00 strike price and vest in equal installments on each of the third, fourth and fifth anniversaries of the date of issuance and have a 51/2 year term. The grant date fair value of each Non-Qualified Option award was estimated using a Black-Scholes option pricing model with an expected volatility assumption of 30%, a risk-free interest rate assumption of 4.6%, a forfeiture assumption of 5%, an expected dividend rate assumption of 3.4% and an expected term assumption of 51/2 years. As of December 31, 2007 and 2006, there are 1,324,306 and 1,420,000 options outstanding. For the year ended December 31, 2007 and 2006, OneBeacon Ltd. recognized $1.2 million and $.2 million of expense associated with its Non-Qualified Options.


                      Share-Based Compensation Under Qualified Retirement Plans

                              In April 2007, the ESOP was merged into the 401(k) Plan to form the OneBeacon 401(k) Savings and ESOP Plan. As of December 31, 2007 and 2006, the plans owned less than 1% of either of the Company's or OneBeacon Ltd.'s total common shares outstanding.

                              The variable contribution amounts earned by eligible participants of the ESOP constituted approximately 6%, 6% and 3% of salary for the years ended 2007, 2006 and 2005. OneBeacon recorded $15.4 million, $15.5 million and $7.8 million in compensation expense to pay benefits and allocate common shares of stock to participant's accounts infor the first quarter ofyears ended 2007, 2006 and 2005. The contributions made to the ESOP with respect to the year ended 2005 were made with the Company's common shares and paid $13.2 million in benefitsthe contributions made to allocatethe ESOP with respect to the years ended 2007 and 2006 were made with either the Company's or OneBeacon Ltd.'s common shares, of stock to participant's accounts duringdependent on the first quarter of 2004.employer.


                      NOTE 10.13. Mandatorily Redeemable Preferred Stock of Subsidiaries and Convertible Preference Shares

                      Mandatorily Redeemable Preferred Stock

                              In July 2003, White Mountains adopted the provisions of SFAS 150 and it subsequently adopted FSP 150-3 in November 2003 (See Note 1).        White Mountains has two classes of mandatorily redeemable preferred stock of subsidiaries which were previously classified as minority interests, that fellfall within the scope of SFAS No. 150, "Accounting for Certain Financial Instruments with Characteristics of both Liabilities and Equity" and are considered noncontrolling interests under FSPFASB Staff Position No. 150-3. Upon adoption of SFAS 150 in 2003,Accordingly, White Mountains reclassifiedclassifies these instruments from mezzanine equity toas liabilities and has recorded them at their historical carrying values. In addition, beginning in the third quarter of 2003, allAll dividends and accretion on White Mountains' mandatorily redeemable preferred stock have been recorded as interest expense. During the years ended December 31, 20042007, 2006 and 20032005, White Mountains recorded $47.6$65.4 million, $58.6 million and $22.3$52.4 million respectively as interest expense on preferred stock (of which $17.3 million and $7.2 million, respectively, represented accretion of discount).stock.

                      Berkshire Preferred Stock

                              As part of the financing for the OneBeacon Acquisition, Berkshire invested a total of $300 million in cash, of which (i)(1) $225 million was for the purchase of the Berkshirecumulative non-voting preferred stock of Fund American (the "Berkshire Preferred Stock,Stock"), which has a $300 million redemption value; and (ii)(2) $75 million was for the purchase of warrants to acquire 1,724,200 common shares of the Warrants.Company. The Berkshire Preferred Stock is entitled to a dividend of no less than 2.35% per quarter and is mandatorily redeemable on May 31, 2008. The Berkshire Preferred Stock was initially recorded at $145.2 million, as the aggregate proceeds received from Berkshire of $300 million were originally allocated between the Berkshire Preferred Stock and the Warrants,warrants, based on their relative fair values, in accordance with Accounting Principles Board Opinion No. 14, "Accounting for Convertible Debt and Debt Issued with Stock Purchase Warrants". The difference between the redemption value and the amount initially recorded for the Berkshire Preferred Stock will be accreted through the income statement as interest expense. Through December 31, 2004,2007, the carrying value of the Berkshire Preferred Stock had been accreted up to $191.9$278.4 million.

                      During each of 2004, 2003the years ended December 31, 2007, 2006 and 2002,2005, White Mountains declared and paid dividends of $28.2$28.3 million on the Berkshire Preferred Stock and recorded $17.3 million, $13.6 million and $10.6 million, respectively, of related accretion charges. In accordance with SFAS 150, $28.2 million and $14.1 million, respectively ofStock. During the dividends and $17.3 million and $7.2 million, respectively of the accretion recorded during the yearyears ended December 31, 20042007, 2006 and during2005, White Mountains recorded $36.1 million, $28.3 million and $22.1 million of accretion charges related to the second half of 2003 are presented as interest expense on mandatorily redeemable preferred stock.Berkshire Preferred Stock.

                      Zenith Preferred Stock

                              On June 1, 2001,Also as part of the financing for the OneBeacon Acquisition, Zenith Insurance Company ("Zenith") purchased $20.0 million in cumulative non-voting preferred stock of a subsidiary of the Company (the "Zenith Preferred Stock"). The Zenith


                      Preferred Stock is entitledWhite Mountains' exercised its option to a dividend of no less than a 2.5% per quarter through June 30, 2007 and a dividend of no less than 3.5% per quarter thereafter and is mandatorily redeemable on May 31, 2011. At the Company's option,redeem the Zenith Preferred Stock may be redeemed on June 30, 2007. During 2004, 20032007, 2006 and 2002,2005, White Mountains declared and paid dividends of $2.0$1.0 million, $2.0 million and $2.1$2.0 million respectively, on the Zenith Preferred Stock. In accordance with SFAS 150, $2.0 million and $1.0 million, respectively of the dividends recorded during the year ended December 31, 2004 and during the second half of 2003 are presented as interest expense on mandatorily redeemable preferred stock.

                      Convertible Preference SharesEconomic Defeasance

                              In October of 2002,connection with the OneBeacon Offering, White Mountains sold $200.0 millionestablished two irrevocable grantor trusts to economically defease the Berkshire Preferred Stock and the Zenith Preferred Stock. The assets of convertible preference shares in a private transaction. Investment funds managed by Franklin Mutual Advisers, LLC purchased 677,966 convertible preference shareseach trust are solely dedicated to the satisfaction of the Company atpayment of dividends and redemption amounts on the $300 million liquidation preference of the Berkshire Preferred Stock and the $20 million liquidation preference of the Zenith Preferred Stock. Concurrently with the closing of the OneBeacon Offering, White Mountains funded the trusts with cash that was used to purchase a priceportfolio of $200.0 million ($295.00 per share). Upon shareholder approval atfixed maturity securities issued by the Company's Annual Meeting heldU.S. government or government-sponsored enterprises. The scheduled interest and principal payments of the portfolio of fixed maturity securities in each trust is sufficient to pay when due all amounts required under the terms of the Berkshire Preferred Stock and the Zenith Preferred Stock, including the mandatory redemption of the Berkshire Preferred Stock in May 2008. In connection with the redemption of the Zenith Preferred Stock on May 19, 2003,June 30, 2007, the convertible preference sharesinvestments in the related trust were repurchasedliquidated and cancelled in considerationthe proceeds used for the redemption. As of 677,966 Common Shares. BecauseDecember 31, 2007, the redemptioncarrying value of the convertible preference sharesinvestments held in trust was in excess of the cash received upon their issuance, they were required to be marked-to-market until the date they were converted to shareholders' equity, resulting in a cumulative $68.5 million charge to retained earnings ($49.5 million of which was recognized during the year ended December 31, 2003), with an offsetting increase to paid-in surplus.$305.6 million.


                      NOTE 11.14. Common Shareholders' Equity

                      Common Sharesshares repurchased and retired

                              On October 26, 2007, White Mountains repurchased 282,341 of its common shares for $500 per share, or $141.2 million, in a transaction with an institutional investor. In November 2007, 8,500 shares were repurchased for $4.5 million from another institutional investor. These transactions were the first repurchases under the previously announced share repurchase plan authorized by White Mountains' Board of Directors on November 17, 2006. There are 709,159 shares remaining for future share repurchases under the plan. During 2004, 20032006 and 2002,2005, the Company did not repurchase any common shares. In addition, during 2007, 2006 and 2005 the Company repurchased for cash 97 Common Shares for $.1 million, 284 Common Shares for $.1 million4,465, 0, and 489 Common Shares for $.2 million respectively. In addition, during 2004, 2003 and 2002 the Company repurchased 316 39,274 and 20,750, respectively, outstanding Restricted Shares held by certain key employees who were instead granted the market value of such shares in various non-qualified deferred compensation plans of the Company and its subsidiaries (See Note 9)12). During 2005, the Company cancelled and retired 1,000 Restricted Shares that were forfeited by a former employee. In conformance with Bermuda law, the Company retires all Common Sharescommon shares it repurchases.

                      Common Sharesshares issued

                              On June 29, 2004, Berkshire exercised all of its warrants to purchase 1,724,200 Common Shares of White Mountains for $294 million. As a result, Berkshire now holds approximately 16.0% of White Mountains' outstanding common stock. Berkshire acquired the warrants in connection with the financing of White Mountains' acquisition of OneBeacon in 2001. The warrants were exercisable at any time until May 2008 and callable by the Company on or after May 31, 2005. In consideration for the early exercise of the warrants, Berkshire and the Company agreed to reduce the exercise price by approximately 2%.

                              In addition to the Berkshire warrant exercise, during the year ended December 31, 2004,During 2007, the Company issued a total of 41,807 Common Shares,66,125 common shares, which consisted of 27,77211,550 shares issued to the OneBeacon employee stock ownership plan, 10,000in satisfaction of Options exercised and 54,000 Restricted Shares issued to key management personnel, and 4,035575 shares issued to directors of the Company. During 2006, the Company issued a total of 3,530 common shares, which consisted of shares issued in satisfaction of Options exercised. During 2003,2005, the Company issued a total of 695,366 Common Shares,7,750 common shares, which consisted of 677,966 Common Sharesshares issued in connection with the repurchase and cancellationsatisfaction of Convertible Preference Shares and 17,400 Common Shares issued to employees in connection with various White Mountains share-based compensation plans. During 2002, the Company issued a total of 107,945 Common Shares, which consisted of 84,745 Common Shares issued in a private equity transaction with Highfields for $25.0 million ($295.00 per


                      Common Share) and 23,200 Common Shares issued to employees in connection with various White Mountains share-based compensation plans.Options exercised.

                      Dividends on Common Sharescommon shares

                              During 2004, 20032007, 2006 and 2002,2005, the Company declared and paid cash dividends totalling $9.1$86.2 million (or $1.00$8.00 per Common Share), $8.3 million (or $1.00 per Common Share) and $8.3 million (or $1.00 per Common Share), respectively.common share).


                      NOTE 12.15. Statutory Capital and Surplus

                              White Mountains' insurance and reinsurance operations are subject to regulation and supervision in each of the jurisdictions where they are domiciled and licensed to conduct business. Generally, regulatory authorities have broad supervisory and administrative powers over such matters as licenses, standards of solvency, premium rates, policy forms, investments, security deposits, methods of accounting, form and content of financial statements, reserves for unpaid loss and LAE, reinsurance, minimum capital and surplus requirements, dividends and other distributions to shareholders, periodic examinations and annual and other report filings. In general, such regulation is for the protection of policyholders rather than shareholders. Over the last several years most states have implemented laws that establish standards for current, as well as continued, state accreditation. In addition, the NAIC uses risk-based capital ("RBC") standards for property and casualty insurers as a means of monitoring certain aspects affecting the overall financial condition of insurance companies. At December 31, 2004,2007, White Mountains' active insurance and reinsurance operating subsidiaries met their respective RBC requirements.

                              OneBeacon's consolidated combined policyholders' surplus (which includes Folksamerica and its subsidiaries at December 31, 2003), as reported to various regulatory authorities as of December 31, 20042007 and 2003,2006, was $1,773.4$1,920.9 million and $2,810.8 million, respectively.$2,013.1 million. OneBeacon's consolidated combined statutory net income (loss) for the years ended December 31, 2004, 20032007, 2006 and 20022005 was $314.2$335.2 million, $472.1$372.0 million and $342.6 million, respectively.$212.7 million. The principal differences between OneBeacon's combined statutory amounts and the amounts reported in accordance with GAAP include deferred acquisition costs, deferred taxes, gains recognized under retroactive reinsurance contracts, market value adjustments for debt securities and recognition of pension plan curtailment gains. OneBeacon's insurance subsidiaries' statutory policyholders' surplus at December 31, 20042007 was in excess of the minimum requirements of relevant state insurance regulations.

                              Folksamerica Reinsurance Company's, ("Folksamerica Re")Folksamerica's policyholders' surplus, as reported to various regulatory authorities as of December 31, 20042007 and 2003,2006, was $917.4$926.6 million and $912.8 million, respectively. Folksamerica Re's$1,153.3 million. Folksamerica's statutory net income (loss) for the years ended December 31, 2004, 20032007, 2006 and 20022005 was $(1.0)$62.9 million, $33.0$46.9 million and $58.2 million, respectively.$(81.7) million. The principal differences between Folksamerica Re'sFolksamerica's statutory amounts and the amounts reported in accordance with GAAP include deferred acquisition costs, deferred taxes, gains recognized under retroactive reinsurance contracts and market value adjustments for debt securities. Folksamerica Re'sFolksamerica's statutory policyholders' surplus at December 31, 20042007 was in excess of the minimum requirements of relevant state insurance regulations.

                              In accordance with Swedish regulations, Sirius International holds restricted reserves of $1,023.0 million, which represents 72% of untaxed reserves, as a component of Swedish statutory shareholders' equity. These restricted reserves cannot be paid as dividends. Sirius International's regulatory capital at December 31, 2007 was $1.6 billion.


                              WMRe (Bermuda) is subject to regulation and supervision by the Bermuda Monetary Authority ("BMA"). Generally, the BMA has broad supervisory and administrative powers over such matters as licenses, standards of solvency, investments, methods of accounting, form and content of financial statements, minimum capital and surplus requirements, and annual and other report filings. In general, such regulation is for the protection of policyholders rather than shareholders. As of December 31, 2007, WMRe (Bermuda) had statutory capital and surplus of $767.8 million, which was in excess of the minimum requirements of the BMA.

                      Dividend Capacity

                      Under the insurance laws of the states and jurisdictions under which White Mountains' regulated insurance and reinsurance operating subsidiaries are domiciled, an insurer is restricted with respect to the timing andor the amount of dividends it may pay without prior approval by regulatory authorities. Accordingly, there can be no assurance regarding the amount of such dividends that may be paid by such subsidiaries in the future. Following is a description of the ability of White MountainsMountains' insurance and reinsurance operating


                      subsidiaries to make pay dividends during 2005 to the Company and certain of its intermediate holding companies:

                        OneBeacon:

                              During the year ended December 31, 2007, OneBeacon Ltd. paid $83.7 million of dividends to its common shareholders, $60.3 million of which was paid to an immediate holding company of White Mountains.

                              Generally, OneBeacon's regulated insurance operating subsidiaries have the ability to pay dividends during any 12 month period without the prior approval of regulatory authorities in an amount equal to the greater of prior year statutory net income or 10% of prior year end statutory surplus, subject to the availability of unassigned funds. As a result, based upon 20042007 statutory net income OneBeacon's top tier regulated insurance operating subsidiaries have the ability to pay $325.2approximately $346.1 million of dividends during 20052008 without prior approval of regulatory authorities, subject to the availability of unassigned funds. As ofAt December 31, 2004,2007, OneBeacon's top tier regulated insurance operating subsidiaries had $1.3$1.5 billion of unassigned funds available for dividend distribution.funds.

                              In addition, as of December 31, 2004,2007, OneBeacon had $195.0approximately $380.0 million of net unrestricted cash, fixed maturity and equity investments outside of its regulated insurance operating subsidies available for distribution during 2005.subsidiaries. During 2004,2007, OneBeacon paid $305$393.9 million of cash dividends to Fund American.

                              Fund American's ability to declare or pay dividends is limited by the terms of the Berkshire Preferred Stock. Fund American may not, under certain circumstances, declare or pay any dividend or distribution without the consent of the holders of a majority of outstanding shares of the Berkshire Preferred Stock.

                        White Mountains Re:

                      Folksamerica Re has the ability to pay dividends during any 12 month period without the prior approval of regulatory authorities in an amount equal to the lesser of net investment income, as defined by statute, or 10% of statutory surplus, in both cases as most recently reported to regulatory authorities, subject to the availability of earned surplus. As a result, based upon December 31, 20042007 statutory surplus of $917.4$926.6 million, Folksamerica Re would have the ability to pay approximately $91.7$92.7 million of dividends during 20052008 without prior approval of regulatory authorities, subject to the availability of earned surplus. As of December 31, 2004,2007, Folksamerica Re had $16.8$69.0 million of earned surplus, therefore it cansurplus.

                              Sirius International has the ability to pay dividends of $16.8 million plus additional earned surplus reported during 2005, subject to the $91.7 million limitation discussed above.

                      availability of unrestricted statutory surplus. Historically, Sirius International has allocated the majority of its earnings to the Safety Reserve (see"Safety Reserve" below). As of December 31, 2004, WMU2007, Sirius International had $3.2$52.0 million of cash and investmentsunrestricted statutory surplus, which is available for distribution in 2008. Based on its 2007 results, Sirius International would have the ability to declare and pay additional dividends (on top of the $52.0 million noted above) of up to $60.0 million in 2008 without regulatory approval, if it elects not to allocate its related pre-tax earnings to the Safety Reserve.

                              In accordance with the provisions of Swedish law, Sirius International can voluntarily transfer its pre-tax income, or a portion thereof, subject to certain limitations, to its parent company to minimize taxes. In early 2008, Sirius International will transfer approximately $33.0 million of its 2007 pre-tax income to its parent company.

                              During 2007, White Mountains Re increased the capital of WMRe (Bermuda), as Sirius International first contributed $136.0 million to WMRe (Bermuda), and then White Mountains Re extracted WMRe (Bermuda) from Sirius International and contributed the net proceeds of its May 2007 Preference Share issuance, or approximately $246 million, to WMRe (Bermuda). Additionally, during 2005. In addition, WMUthe fourth quarter of 2007, Folksamerica redeemed $285.0 million of its common shares, after receiving approval from the Insurance Department of the State of New York, $250.0 million of these proceeds were used to further capitalize WMRe (Bermuda). As of December 31, 2007, WMRe (Bermuda)'s capital was $776.5 million.

                              WMRe (Bermuda) has the ability to declare and pay dividends of up to $103.1 million in 2008 without regulatory approval, subject to meeting all appropriate liquidity and solvency requirements.

                              WMRUS has the ability to distribute its 20052008 earnings without restriction. At December 31, 2007, WMRUS had $1.8 million of unrestricted cash. During 2004, WMU2007, WMRUS paid $60.0$8.0 million of cash dividends to its immediate parent.


                              In addition, as of December 31, 2004,2007, White Mountains Re and its intermediate holding companies had approximately $97an additional $57.8 million of net unrestricted cash and fixed maturity investments outside of Folksamerica, Sirius International, WMRE (Bermuda), and WMRUS. During 2007, White Mountains Re paid $392.0 million of cash dividends from the net proceeds of the WMRe Senior Notes and distributed its $54.0 million investment in Symetra warrants to its immediate parent during the first quarter 2007. White Mountains Re paid an additional $20.0 million of dividends to its immediate parent during 2007.

                        Esurance:

                              Generally, Esurance's regulated insurance operating subsidiaries have the ability to pay dividends during any 12 month period without the prior approval of regulatory authorities in an amount equal to the lesser of prior year statutory net income or 10% of prior year end statutory surplus, subject to the availability of unassigned funds. As a result, based on December 31, 2007 statutory net income, Esurance's top tier regulated insurance operating subsidiary has the ability to pay $2.7 million of dividends during 2008 without prior approval of regulatory authorities, subject to the availability of unassigned funds. As of December 31, 2007, Esurance's top tier regulated insurance operating subsidiary had $30.3 million of unassigned funds.

                              In addition, as of December 31, 2007, Esurance had $.4 million of net unrestricted cash and fixed maturity investments outside of its regulated insurance and reinsurance operating subsidiaries available for distribution during 2005.subsidiaries. During 2007, Esurance did not pay any cash dividends to its immediate parent.

                        Other operations:

                              In accordance with Swedish regulations, Sirius International holds restricted reservesAs of $808.1 million, which represents 72% of its untaxed reserves (See Liquidity and Capital Resources within the Management Discussion and Analysis for information). These restrictions are based on stockholder's equity determined on a Swedish statutory basis. These restricted reserves can not be paid as dividends. At December 31, 2004 Sirius International is in compliance with these restrictions. Sirius International's actual statutory surplus2007, White Mountains had $461.8 million of net unrestricted cash, fixed maturity and equity investments at December 31, 2004, which includes Scandinavian Rethe Company and its intermediate holding companies included in its other subsidiaries is $1.3 billion.operations segment.

                      Safety Reserve

                              In accordance with provisions of Swedish law, Sirius International can voluntarilyis permitted to transfer up to the full amount of its pretax earnings, or a portion thereof,pre-tax income, subject to certain limitations, into an untaxed reserve referred to as a safety reserve. The safety reserve, is a Swedish regulatory concept that has no equivalent under GAAP. Accordingly, underwhich amounted to $1.4 billion at December 31, 2007. Under GAAP, an amount equal to Sirius International'sthe safety reserve, of $1.1 billion at December 31, 2004, net of the related deferred tax liability established at the statutory Swedish tax rate of 28%, is classified as shareholders' equity. Generally, this deferred tax liability is only required to be paid by Sirius International if it fails to maintain predetermined levels of premium writings and loss reserves in future years. As a result of the indefinite deferral of these taxes, Swedish regulatory authorities do not apply any taxes to the safety reserve when calculating solvency capital under Swedish insurance regulations. Accordingly, under local statutory requirements, an amount equal to the deferred tax liability on Sirius International's safety reserve ($397.8 million at December 31, 2007) is included in solvency capital.


                      NOTE 13.16. Segment Information

                              White Mountains has determined that its reportable segments are "OneBeacon", "White Mountains Re" (consisting of the operations of Folksamerica, Sirius and WMU), "Esurance" and "Other Operations" (consisting of White Mountains' investments in Montpelier and Symetra warrants, the International American Group, the Company and its intermediate subsidiary holding companies). During 2004,OneBeacon, White Mountains expanded its segment disclosure to includeRe, Esurance as a separate segment. As a result, amounts presented in prior periods have been reclassified to conform with the current presentation.

                      and Other Operations. White Mountains has made its segment determination based on consideration of the following criteria: (i) the nature of the business activities of each of the Company's subsidiaries and affiliates; (ii) the manner in which the Company's subsidiaries and affiliates are organized; (iii) the existence of primary managers responsible for specific subsidiaries and affiliates; and (iv) the organization of information provided to the Board of Directors.

                              OneBeacon's business comprises three major lines of business: specialty, commercial and personal. OneBeacon's specialty lines are a collection of niche insurance business lines including specialty liability products, marine insurance, tuition reimbursement, professional liability and accident & health products. OneBeacon's commercial lines provide property and liability insurance products including multi-peril, auto, workers compensation, general liability umbrella, property and inland marine products to small and middle market businesses. OneBeacon's personal lines underwrite homeowners, personal auto and combination insurance policies. White Mountains Re provides reinsurance coverage for property, casualty, accident & health, agriculture, aviation and space and certain other exposures on a worldwide basis. Esurance writes personal auto insurance through its website and select online agents. Other Operations consists of the Company, the Company's intermediate subsidiary holding companies, the consolidated results of the Tuckerman Funds, the International American Group, WM Advisors and White Mountains' investments in Symetra, Delos and Pentelia.


                              Significant intercompany transactions among White Mountains' segments have been eliminated herein. Certain amounts in theSegment information for all prior periods havehas been reclassified to conform withrestated for the current presentation.effect of the Reorganization (See Note 1). Financial information for White Mountains' segments follows:


                       OneBeacon
                       White
                      Mountains Re

                       Esurance
                       Other
                      Operations

                       Total

                       Millions

                      Year ended December 31, 2004          
                      Millions

                       OneBeacon
                       White Mountains Re
                       Esurance
                       Other Operations
                       Total
                      Year ended December 31, 2007:          
                      Earned insurance and reinsurance premiums $2,378.5 $1,265.5 $176.5 $ $3,820.5 $1,873.6 $1,146.8 $763.3 $ $3,783.7
                      Net investment income 221.4 98.5 3.5 37.5 360.9 208.5 210.5 29.6 84.4 533.0
                      Net realized gains 129.6 29.6 1.1 20.8 181.1
                      Net realized investment gains 173.7 63.7 4.5 21.3 263.2
                      Other revenue 141.8 36.1 2.2 10.4 190.5 17.2 5.0 13.6 118.1 153.9


                      Total revenues 2,871.3 1,429.7 183.3 68.7 4,553.0 2,273.0 1,426.0 811.0 223.8 4,733.8


                      Loss and LAE 1,545.2 918.9 122.4 4.6 2,591.1
                      Losses and LAE 1,089.8 701.0 622.4 (6.8) 2,406.4
                      Insurance and reinsurance acquisition expenses 442.3 271.8 29.4  743.5 318.9 255.0 202.7  776.6
                      Other underwriting expenses 369.2 122.9 27.7 1.5 521.3 329.4 118.5 58.4 2.7 509.0
                      General and administrative expenses 122.2 15.1  172.0 309.3 9.8 26.2 .2 164.3 200.5
                      Accretion of fair value adjustment to loss and LAE reserves  10.1  33.2 43.3 16.0 5.4   21.4
                      Interest expense on debt 1.0 3.8  44.3 49.1 45.2 23.2  4.6 73.0
                      Interest expense—dividends and accretion on preferred stock subject to mandatory redemption    47.6 47.6
                      Interest expense—dividends and accretion on preferred stock 65.4    65.4


                      Total expenses 2,479.9 1,342.6 179.5 303.2 4,305.2 1,874.5 1,129.3 883.7 164.8 4,052.3


                      Pretax earnings (loss) $391.4 $87.1 $3.8 $(234.5)$247.8
                      Pretax income (loss) $398.5 $296.7 $(72.7)$59.0 $681.5


                      Year ended December 31, 2006:          
                      Earned insurance and reinsurance premiums $1,944.0 $1,241.2 $527.5 $ $3,712.7
                      Net investment income 187.6 182.7 18.4 46.8 435.5
                      Net realized investment gains 156.4 59.0 6.9 50.4 272.7
                      Gain on sale of shares through initial public offering of OneBeacon Ltd.     171.3 171.3
                      Other revenue 38.8 47.8 7.4 108.0 202.0


                      Total revenues 2,326.8 1,530.7 560.2 376.5 4,794.2


                      Losses and LAE 1,180.3 884.6 383.9 3.9 2,452.7
                      Insurance and reinsurance acquisition expenses 332.3 287.2 135.3  754.8
                      Other underwriting expenses 360.1 94.7 48.8 1.8 505.4
                      General and administrative expenses 15.3 24.2 .2 178.6 218.3
                      Accretion of fair value adjustment to loss and LAE reserves 23.0 1.5   24.5
                      Interest expense on debt 45.6 1.5  3.0 50.1
                      Interest expense—dividends and accretion on preferred stock 58.6    58.6


                      Total expenses 2,015.2 1,293.7 568.2 187.3 4,064.4


                      Pretax income (loss) $311.6 $237.0 $(8.0)$189.2 $729.8


                      OneBeacon


                      White
                      Mountains Re


                      Esurance


                      Other
                      Operations


                      Total

                       
                       Millions

                      Year ended December 31, 2003               
                      Earned insurance and reinsurance premiums $2,160.3 $845.8 $99.9 $31.7 $3,137.7
                      Net investment income  223.7  50.4  1.3  15.5  290.9
                      Net realized gains (losses)  127.0  7.7  .2  27.7  162.6
                      Other revenue  90.5  75.5  .3  36.3  202.6


                      Total revenues  2,601.5  979.4  101.7  111.2  3,793.8


                      Loss and LAE  1,475.6  557.6  81.0  23.9  2,138.1
                      Insurance and reinsurance acquisition expenses  394.2  198.0  18.8  4.0  615.0
                      Other underwriting expenses  258.7  57.8  20.4  10.2  347.1
                      General and administrative expenses  67.6  19.6    114.6  201.8
                      Accretion of fair value adjustment to loss and LAE reserves        48.6  48.6
                      Interest expense on debt  .3  2.0    46.3  48.6
                      Interest expense—dividends and accretion on preferred stock subject to mandatory redemption        22.3  22.3


                      Total expenses  2,196.4  835.0  120.2  269.9  3,421.5


                      Pretax earnings (loss) $405.1 $144.4 $(18.5)$(158.7)$372.3


                      Year ended December 31, 2002               
                      Earned insurance and reinsurance premiums $2,870.9 $635.0 $40.8 $29.7 $3,576.4
                      Net investment income  314.0  51.5  1.2  (.7) 366.0
                      Net realized gains (losses)  113.0  30.3    12.7  156.0
                      Amortization of deferred credits and other revenue  14.4  53.6  1.6  39.9  109.5


                      Total revenues  3,312.3  770.4  43.6  81.6  4,207.9


                      Loss and LAE  2,131.3  442.2  36.6  28.1  2,638.2
                      Insurance and reinsurance acquisition expenses  629.6  161.2  9.7  3.8  804.3
                      Other underwriting expenses  329.2  41.0  22.4  9.1  401.7
                      General and administrative expenses  22.4  20.6    49.7  92.7
                      Accretion of fair value adjustment to loss and LAE reserves        79.8  79.8
                      Interest expense on debt    2.0    69.8  71.8


                      Total expenses  3,112.5  667.0  68.7  240.3  4,088.5


                      Pretax loss $199.8 $103.4 $(25.1)$(158.7)$119.4


                      Selected Balance Sheet Data


                      OneBeacon


                      White
                      Mountains Re


                      Esurance


                      Other
                      Operations


                      Total

                       
                       Millions

                      December 31, 2004               
                      Total investments $5,391.6 $4,292.2 $111.9 $733.8 $10,529.5
                      Reinsurance recoverable on paid and unpaid losses  2,757.2  1,388.7  .2  (256.7) 3,889.4
                      Total assets  9,979.6  8,152.5  241.7  641.9  19,015.1
                      Loss and LAE reserves  5,475.5  4,170.3  63.0  (310.3) 9,398.5
                      Total liabilities  7,686.8  6,471.1  132.7  840.6  15,131.2
                      Total equity  2,292.2  1,681.4  109.0(1) (198.7) 3,883.9


                      December 31, 2003               
                      Total investments $5,552.3 $1,951.1 $80.9 $963.2 $8,547.5
                      Reinsurance recoverable on paid and unpaid losses  3,048.6  791.5    (244.6) 3,595.5
                      Total assets  11,286.0  3,644.1  195.7  756.2  15,882.0
                      Loss and LAE reserves  6,241.2  1,777.2  39.1  (329.3) 7,728.2
                      Total liabilities  9,064.5  2,611.9  102.7  1,123.7  12,902.8
                      Total equity  2,221.5  1,032.2  93.0  (367.5) 2,979.2


                      (1)
                      Esurance equity includes approximately $44 million of inception to date losses. Total GAAP capital committed from White Mountains to Esurance is approximately $153 million.
                      Millions

                       OneBeacon
                       White Mountains Re
                       Esurance
                       Other Operations
                       Total
                      Year ended December 31, 2005:               
                      Earned insurance and reinsurance premiums $2,118.4 $1,371.6 $306.8 $1.8 $3,798.6
                      Net investment income  242.4  148.9  9.8  90.4  491.5
                      Net realized investment gains (losses)  122.8  76.8  2.1  (89.1) 112.6
                      Other revenue  50.3  33.5  3.0  142.4  229.2


                      Total revenues  2,533.9  1,630.8  321.7  145.5  4,631.9


                      Losses and LAE  1,401.5  1,237.9  206.2  12.6  2,858.2
                      Insurance and reinsurance acquisition expenses  390.7  279.6  90.8  .1  761.2
                      Other underwriting expenses  278.9  107.0  37.2  1.6  424.7
                      General and administrative expenses  8.4  12.4    128.0  148.8
                      Accretion of fair value adjustment to loss and LAE reserves  26.0  10.9      36.9
                      Interest expense on debt  44.1  .4      44.5
                      Interest expense—dividends and accretion on preferred stock  52.4        52.4


                      Total expenses  2,202.0  1,648.2  334.2  142.3  4,326.7


                      Pretax income (loss) $331.9 $(17.4)$(12.5)$3.2 $305.2


                      Selected Balance Sheet Data


                      Millions

                       OneBeacon
                       White
                      Mountains Re

                       Esurance
                       Other
                      Operations

                       Total
                      December 31, 2007:               
                      Total investments $5,169.5 $5,170.2 $754.9 $554.4 $11,649.0
                      Reinsurance recoverable on paid and unpaid losses  2,651.4  842.2  2.2  31.6  3,527.4
                      Total assets  9,533.9  7,361.6  1,013.0  1,197.1  19,105.6
                      Loss and LAE reserves  4,480.3  3,252.1  285.2  44.5  8,062.1
                      Total liabilities  7,627.4  5,132.2  568.0  197.2  13,524.8
                      Minority interest    324.4    543.0  867.4
                      Total common shareholders' equity  1,906.5  1,905.0  445.0  456.9  4,713.4


                      December 31, 2006:               
                      Total investments $5,212.2 $4,568.7 $518.8 $1,033.0 $11,332.7
                      Reinsurance recoverable on paid and unpaid losses  2,875.0  1,269.1  .7  30.3  4,175.1
                      Total assets  9,866.8  7,344.9  723.6  1,508.4  19,443.7
                      Loss and LAE reserves  4,837.7  3,708.8  167.4  63.3  8,777.2
                      Total liabilities  8,089.6  5,239.6  415.1  640.9  14,385.2
                      Minority interest        603.2  603.2
                      Total common shareholders' equity  1,777.2  2,105.3  308.5  264.3  4,455.3


                              The following tables provide net written premiums and earned insurance premiums for OneBeacon's ongoing businesses and in total for the years ended December 31, 2004, 2003,2007, 2006 and 2002:2005:

                      Twelve Months Ended December 31, 2004

                       Specialty
                       Personal
                       Commercial
                       Total(1)
                       
                       Dollars in millions

                      Net written premiums $848.5 $724.7 $807.1 $2,459.1
                      Earned insurance premiums $812.0 $723.8 $703.3 $2,378.5


                      Twelve Months Ended December 31, 2003            
                      Net written premiums $733.7 $676.8 $426.7 $1,972.5
                      Earned insurance premiums $694.9 $744.7 $432.0 $2,160.3


                      Twelve Months Ended December 31, 2002            
                      Net written premiums $696.6 $845.2 $454.6 $2,522.8
                      Earned insurance premiums $564.3 $871.3 $527.4 $2,870.9


                      Millions

                       Specialty
                       Personal
                       Commercial
                       Total(1)
                      Twelve Months Ended December 31, 2007:            
                       Net written premiums $446.2 $690.4 $727.7 $1,864.4
                       Earned insurance premiums $436.4 $725.0 $712.0 $1,873.6

                      Twelve Months Ended December 31, 2006:


                       Net written premiums $437.6 $800.6 $718.3 $1,957.6
                       Earned insurance premiums $432.3 $822.3 $689.3 $1,944.0

                      Twelve Months Ended December 31, 2005:


                       Net written premiums $548.8 $910.2 $654.4 $2,121.1
                       Earned insurance premiums $521.9 $933.7 $654.7 $2,118.4

                      (1)
                      Includes results from reciprocals (consolidated beginning April 1, 2004)runoff operations and run-off operations. Results from reciprocals are net of business assumed by OneBeacon, which is contained in Personal Lines.eliminations between underwriting units.


                      NOTE 14.17. Investments in Unconsolidated Insurance Affiliates

                              White Mountains' investments in unconsolidated insurance affiliates represent operating investments in other insurerscompanies in which White Mountains has a significant voting and economic interest but does not own more than 50.0% ofcontrol the entity. White Mountains' voting percentages and directorships in its unconsolidated affiliates do not provide White Mountains the ability to exercise significant influence over the operating and financial policies of its investees.


                      Investment in Symetra

                              On August 2, 2004, White Mountains invested $194.7 million in Symetra in exchange for 2.0 million common shares and 1.1 million warrants to purchase additional common shares of Symetra (See Note 2).        As of December 31, 2004,2007, White Mountains owned 19% of the total of Symetra's common shares outstanding andowns 24% of Symetra's common shares on a fully-diluted basis.fully converted basis, consisting of 17.4 million common shares and warrants to acquire an additional 9.5 million common shares. White Mountains accounts for its investment in Symetra's common shares of Symetra using the equity method while itof accounting and accounts for its investment in Symetra'Symetra warrants as a derivative instrument, recognizingunder FAS 133, recording the warrants at fair value with changes in the fair value of the warrantsrecognized through the income statement as a realized investment gain or loss.

                              The following table summarizes amounts recorded by White Mountains relating to its investment in Symetra:

                      Millions

                       Common
                      shares

                       Warrants
                       Total
                       
                      Carrying value of investment in Symetra as of January 1, 2005 $267.7 $37.3 $305.0 
                      Equity in earnings of Symetra(1)  28.0    28.0 
                      Net unrealized gains from Symetra's equity portfolio  .6    .6 
                      Net unrealized gains (losses) from Symetra's fixed maturity portfolio  (32.4)   (32.4)
                      Increase in value of warrants    10.5  10.5 


                      Carrying value of investment in Symetra as of December 31, 2005(2) $263.9 $47.8 $311.7 
                      Equity in earnings of Symetra(1)  26.6    26.6 
                      Net unrealized gains from Symetra's equity portfolio  2.7    2.7 
                      Dividends  (15.6)   (15.6)
                      Net unrealized gains (losses) from Symetra's fixed maturity portfolio  (28.3)   (28.3)
                      Increase in value of warrants    6.2  6.2 


                      Carrying value of investment in Symetra as of December 31, 2006(2) $249.3 $54.0 $303.3 
                      Equity in earnings of Symetra(1)  31.6    31.6 
                      Net unrealized gains from Symetra's equity portfolio and other  (6.9)   (6.9)
                      Dividends  (31.2)   (31.2)
                      Net unrealized gains (losses) from Symetra's fixed maturity portfolio  (1.5)   (1.5)
                      Increase in value of warrants    23.3  23.3 


                      Carrying value of investment in Symetra as of December 31, 2007(2) $241.3 $77.3 $318.6 


                      (1)
                      Equity in earnings is net of tax of $0.

                      (2)
                      Includes equity in net unrealized gains (losses) from Symetra's fixed maturity portfolio at December 31, 2007, 2006 and 2005 of $(5.6) million, $(4.1) million and $24.2 million.

                              During 2007 and 2006, White Mountains received cash dividends from Symetra of $31.2 million and $15.6 million on its common share investment which is accounted for as a reduction of White Mountains' investment in Symetra in accordance with equity accounting. During 2007 and 2006, White Mountains also received cash dividends from Symetra of $17.0 million and $8.5 million on its investment in Symetra warrants that was recorded as net investment income.


                              The following table summarizes financial information for Symetra as of December 31, 2007 and 2006:

                      Millions

                       2007
                       2006
                      Symetra balance sheet data:      
                      Total cash and investments $17,161.6 $17,558.6
                      Separate account assets  1,181.9  1,233.9
                      Total assets  19,562.9  20,114.6
                      Funds held under deposit contracts  15,562.0  15,986.2
                      Long-term debt  448.6  298.7
                      Separate account liabilities  1,181.9  1,233.9
                      Total liabilities  18,277.4  18,787.3
                      Common shareholders' equity  1,285.1  1,327.3


                              The following table summarizes financial information for Symetra for the years ended December 31, 2007, 2006 and 2005:

                      Millions

                       2007
                       2006
                       2005
                       
                      Symetra income statement data:          
                      Net premiums earned $530.6 $525.7 $575.5 
                      Net investment income  973.6  984.9  994.2 
                      Total revenues  1,589.7  1,568.4  1,628.2 
                      Policy benefits  1,019.4  1,030.1  1,138.4 
                      Total expenses  1,340.8  1,324.4  1,436.7 
                      Net income  167.3  159.5  145.5 
                      Comprehensive net income (loss)  155.3  22.4  (30.9)


                      Pentelia

                              In April 2007 White Mountains invested $50 million into Pentelia Limited ("PIL") in exchange for 5.0 million common shares. White Mountains has determined that its investment in PIL is a variable interest entity (see Note 18) but it has determined that it is not the primary beneficiary. The investment is accounted for as an equity method investment. As of December 31, 2007 White Mountains investment in PIL totalled $52.4 million.

                              White Mountains also obtained an equity interest of 33% in Pentelia Capital Management ("PCM") for $1.6 million in April 2007. This investment is also accounted for under the equity method. For the year ended December 31, 2007 White Mountains recorded $(.1) million of equity in earnings in PCM. As of December 31, 2007 White Mountains investment in PCM was $1.5 million.

                              The following tables summarizes financial information for PIL as of December 31, 2007:

                      Millions

                       2007
                      Pentelia Limited balance sheet data:   
                      Financial assets, at fair value $274.0
                      Cash and cash equivalents  118.8
                      Total assets  495.3
                      Subscriptions received in advance  92.7
                      Loan payable  75.0
                      Total liabilities  188.1
                      Common shareholders' equity  307.2
                        

                      MSA

                              On October 31, 2006, White Mountains' investment in MSA was restructured. White Mountains received a $70 million cash dividend from MSA, following which White Mountains sold its 50% common stock investment in MSA to the MSA Group for (i) $70.0 million in 9.0% non-voting cumulative perpetual preferred stock of the MSA Group, and (ii) 4.9%, of the common stock of the MSA Group, which was recorded at an initial carrying value of $24.5 million. These transactions resulted in a net after tax realized gain of $8.5 million.

                              Effective October 31, 2006, White Mountains accounts for its remaining investment in the MSA Group in accordance with FAS 115. Prior to the sale, White Mountains owned 50% of the total common shares outstanding of MSA and accounted for this investment using the equity method of accounting. The following table provides summary financial amounts recorded by White Mountains relating to its investment in Symetra:

                       
                       Common
                      Shares

                       Warrants
                       Total
                       
                       Millions

                      Initial value of investment in Symetra at closing, August 2, 2004 $159.3 $35.4 $194.7
                      Extraordinary gain—excess of fair value of acquired net assets over cost  40.7    40.7
                      Equity in earnings of Symetra(1)  10.2    10.2
                      Equity in net unrealized gains from Symetra's equity portfolio  .9    .9
                      Increase in value of warrants    1.9  1.9
                      Equity in net unrealized gains from Symetra's fixed maturity portfolio  56.6    56.6


                      Carrying value of investment in Symetra as of December 31, 2004 $267.7 $37.3 $305.0


                      (1)
                      Equity in earnings is net of tax of $0.

                              The following table summarizes financial information for Symetra for the approximately five-month period ended December 31, 2004:

                       
                       Period ended
                      December 31, 2004

                       
                       $ in millions

                      Symetra balance sheet data:   
                      Total cash and investments $19,430.0
                      Separate account assets  1,228.4
                      Total assets  22,130.1
                      Funds held under deposit contracts  17,541.0
                      Long-term debt  300.0
                      Separate account liabilities  1,228.4
                      Total liabilities  20,704.7
                      Common shareholders' equity  1,425.4
                      Symetra income statement data:   
                      Net premiums earned $263.2
                      Net investment income  410.9
                      Policy benefits  485.3
                      Net income  54.3
                      Comprehensive net income  360.5
                        

                      Investment in MSA

                              At December 31, 2004, 2003 and 2002, White Mountains owned 222,093 shares of the common stock of MSA. This represented 50% of the total shares of MSA common stock outstanding at those times. White Mountains' investment in MSA is accounted for usingunder the equity method. The following


                      table provides summary financial amounts recorded by White Mountainsmethod relating to its investment in MSA common stock:

                       
                       2004
                       2003
                       2002
                       
                       
                       $ in millions

                       
                      Amounts recorded by White Mountains:          
                      Investment in MSA common stock $161.6 $142.8 $128.1 
                      Equity in earnings (losses) from MSA common stock(1)(2)  16.4  12.3  (5.9)
                      Equity in net unrealized investment gains from MSA's investment portfolio(3)  1.3  1.5  3.5 


                      Millions

                       2007
                       2006
                       2005
                       
                      Amounts recorded by White Mountains under the equity method:          
                      Investment in MSA common stock $ $ $168.0 
                      Equity in earnings from MSA common stock(1)    10.3  5.6 
                      Equity in net unrealized investment gains (losses) from MSA's investment portfolio(2)    .3  (4.0)


                      (1)
                      2002 recorded net of related amortization of goodwill.

                      (2)
                      Equity in earnings amounts are net of taxes of $1.2 million, $.9$5.6 million and $(3.2)$3.0 million for the yearsten months ended 2004, 2003October 31, 2006 and 2002, respectively.the year ended December 31, 2005.

                      (3)(2)
                      Recorded directly to shareholders' equity (after-tax) as a component of other comprehensive income.

                              The following table summarizes financial informationDelos

                              On August 3, 2006, White Mountains Re sold its wholly-owned subsidiary, Sirius America, to an investor group led by Lightyear Capital for MSA$138.8 million in cash (See Note 2). As part of the transaction, White Mountains acquired an equity interest of approximately 18% in the acquiring entity, Delos. White Mountains accounts for its investment in Delos under the equity method. For the years ended December 31, 2004, 20032007 and 2002:

                       
                       Period ended December 31,
                       
                       
                       2004
                       2003
                       2002
                       
                       
                       $ in millions

                       
                      MSA balance sheet data:          
                      Total cash and investments $677.6 $589.7 $510.7 
                      Premiums receivable  116.5  109.3  93.1 
                      Total assets  978.1  875.1  759.5 
                      Unearned premium  288.3  264.7  223.9 
                      Loss and lae reserves  325.6  281.3  253.5 
                      Total liabilities  654.8  584.7  505.7 
                      Common shareholders' equity  323.3  290.4  253.8 
                      MSA income statement data:          
                      Net premiums written $454.5 $427.6 $357.3 
                      Net premiums earned  435.6  396.0  334.1 
                      Net investment income  26.4  23.3  22.9 
                      Loss and lae  298.8  263.8  241.9 
                      Net income  29.6  29.3  (13.2)
                      Comprehensive net income  32.1  36.6  (8.5)


                              At December 31, 2004 and 2003,2006, White Mountains' consolidated retained earnings included $51.0 million, $33.4Mountains recorded $1.3 million and $20.2$.2 million respectively, of accumulated undistributedequity in earnings of MSA. No dividends were declared or paid by MSA during 2004, 2003 and 2002.

                      Investmentfrom its investment in Montpelier

                              As of December 31, 2004,Delos. White Mountains' investment in Montpelier consisted of 6.3 million common shares and warrants to acquire 7.2 million common sharesDelos at $16.67 per share that are exercisable until December 6, 2011. Through its holdings of common shares and warrants, White Mountains owns approximately 17% of Montpelier on a fully-converted basis.

                              During the first quarter of 2004, White Mountains sold a portion of its investment in Montpelier common shares to third parties. As a result of this sale, as well as changes to the composition of the


                      Board of Directors of both Montpelier and White Mountains, White Mountains changed the method of accounting for its remaining common share investment in Montpelier as of March 31, 2004 from an equity method investment in an unconsolidated affiliate to a common equity security classified as available for sale and carried at fair value. White Mountains accounts for its warrants in Montpelier as derivative instruments and recognizes changes in the fair value of the warrants during a given period in its income statement as a realized gain or loss. (See Note 5 for details of White Mountains' investment in Montpelier as of December 31, 2004).

                              White Mountains' equity in earnings of Montpelier was $10.8 million, $45.12007 and 2006 totalled $33.8 million and $19.9 million (net of tax of $6.1 million, $24.4 million and $10.7 million) for the years ended 2004, 2003 and 2002, respectively.$32.2 million.


                      Note 15.NOTE 18. Variable Interest Entities

                      New Jersey Skylands
                      Reciprocals

                              As part of a restructuring of its New Jersey personal lines, OneBeacon formed New Jersey Skylands Management LLC andReciprocals are not-for-profit, policyholder owned insurance carriers organized as unincorporated associations. Each policyholder insured by the New Jersey Insurance Department approved the formation of New Jersey Skylands Insurance Association and its wholly owned subsidiary New Jersey Skylands Insurance Company (together, the "Association") during the third quarter of 2002. New Jersey Skylands Insurance Association (the "NJ Skylands Reciprocal"), is a not-for-profit, policyholder-owned reciprocal insurance carrier. A reciprocal is an unincorporated association with each insured sharingshares risk with the others in the association. Thus, each participant in this pool is both an insurer and an insured.other policyholders. Policyholders share profits and losses in the same proportion as the amount of insurance purchased by that member. However, policyholders in the reciprocalbut are not subject to assessmentadditional assessments for losses of the reciprocal.

                              An attorney-in-fact administers the reciprocal. Such administration entails paying losses, investing premium inflow, recruiting new members, underwriting new and renewal business, receiving premiums and exchanging reinsurance contracts. New Jersey Skylands Management LLC is the attorney-in-factOneBeacon has capitalized three reciprocals by loaning money to them in exchange for all the business affairs of the NJ Skylands Reciprocal. Accordingly, New Jersey Skylands Insurance Company, the stock insurance company, has a management agreement with New Jersey Skylands Management LLC to manage its business affairs.

                              The NJ Skylands Reciprocal was capitalized by OneBeacon with a $31.3 million surplus note.notes. Principal and interest on the surplus notenotes are repayable to OneBeacon only with regulatory approval. As defined in the surplus note agreement, the NJ Skylands Reciprocal'sThe obligation to payrepay principal underon the surplus note agreementnotes is subordinated to all other liabilities andincluding obligations to policyholders toand claimants for benefits under contracts of insurance it issued, to all other classes of creditors other than surplus note holders, and to the State of New Jersey and any governmental or quasi-governmental entity. The Association began writing personal automobile coverage for new customers in August 2002.policies.

                              OneBeacon has no ownership interest in the Association. As a result of its adoptionthree reciprocals. However, under the provisions of FIN 46, White Mountains' future economic income derived from46(R), OneBeacon has determined that each of the New Jersey automobile insurance market will differ from the operating resultsreciprocals qualify as a VIE. Further, OneBeacon has determined that it will record on a consolidated GAAP basis. On an economic basis,is the primary beneficiary and is required to consolidate all three reciprocals.

                              In 2002, OneBeacon will realize income from management and service fees charged byformed New Jersey Skylands Management LLC to provide management services for a fee to New Jersey Skylands Insurance Association, a reciprocal, and its wholly owned subsidiary New Jersey Skylands Insurance Company (together, "New Jersey Skylands Insurance"). New Jersey Skylands Insurance was capitalized with a $31.3 million surplus note issued to OneBeacon in 2002. At December 31, 2007 and 2006, consolidated amounts related to New Jersey Skylands Insurance included total assets of $106.0 million and $89.2 million and total liabilities of $124.4 million and $113.7 million. At December 31, 2007, the Association and interest onnet amount of capital at risk is equal to the surplus note. On a consolidated GAAP basis, White Mountains will recognize profits from the insurance operationsnote of the Association until such time that the Association's equity is greater than zero or until$31.3 million less the accumulated losses into date of $18.4 million.


                              In 2004, OneBeacon formed Houston General Management Company to provide management services for a fee to another reciprocal, Houston General Insurance Exchange. During 2004, OneBeacon contributed $2.0 million of capital to Houston General Insurance Exchange. In 2005, OneBeacon contributed one of its subsidiaries, Houston General Insurance Company, with assets of $149.4 million and liabilities of $127.6 million, to Houston General Insurance Exchange (together "Houston General Insurance"). Subsequent to the Association exceed OneBeacon's initialcontribution of Houston General Insurance Company, Houston General Insurance Exchange issued a surplus note investment.of $23.7 million to OneBeacon. At December 31, 2007 and 2006, consolidated amounts related to Houston General Insurance included total assets of $163.3 million and $143.5 million and total liabilities of $174.0 million and $148.8 million. At December 31, 2007 the net amount of capital at risk is equal to the surplus note of $23.7 million.

                              In 2006, Adirondack AIF, LLC, a wholly owned subsidiary of OneBeacon, entered into an agreement to provide management services for a fee to Adirondack Insurance Exchange ("Adirondack Insurance"), a reciprocal. Adirondack Insurance was capitalized with a $70.7 million surplus note issued to OneBeacon in May 2006. At December 31, 2007 and 2006, consolidated amounts related to Adirondack Insurance included total assets of $241.4 million and $124.8 million and total liabilities of $252.9 million and $130.3 million. At December 31, 2007, the net amount of capital at risk is equal to the surplus note of $70.7 million less the accumulated losses to date of $11.5 million.

                      Pentelia

                              In 2007, White Mountains has made an investment in Pentelia Investment Ltd. ("PIL"), a corporation that invests in insurance-related investment assets. White Mountains has determined that the Association qualifies asits investment in PIL is a VIE under the provisions of FIN 46. Upon adoption of FIN 46 on March 31, 2004,variable interest entity. However, White Mountains consolidatedis not the Association, which had total assets and total liabilities with aprimary beneficiary. White Mountains accounts for its interests in PIL as an equity method investment. White Mountains' exposure to loss is limited to the carrying value of $138.5its investment in PIL which was $52.4 million and $111.6 million, respectively. The resulting $26.9 million difference between the carrying values of the total assets and liabilities of the Association was equal to the Marchat December 31, 2004 carrying value of the surplus note investment at OneBeacon. Therefore, the adoption of FIN 46 did not have an effect on the Company's financial condition. The Company's exposure to the New Jersey auto market remains limited to the surplus notes invested in the reciprocal.


                      2007.


                      Prospector Offshore Fund

                              White Mountains has determined that one of its ownership interests in a limited partnership,the Prospector Offshore Fund, Ltd. ("the Prospector Fund"), qualifies as is a VIE underfor which White Mountains is the provisionsprimary beneficiary and is required to consolidate the Prospector Fund. At December 31, 2007 and 2006, White Mountains consolidated total assets of FIN 46. The Company's economic exposure$207.0 million and $211.1 million and total liabilities of $68.8 million and $70.0 million of the Prospector Fund. In addition, at December 31, 2007 and 2006, White Mountains recorded a minority interest liability of $74.4 million and $82.4 million representing the noncontrolling interests in the Prospector Fund. For the years ended December 31, 2007 and 2006, White Mountains recorded $7.1 million and $5.6 million of minority interest expense related to the FundFund. At December 31, 2006, the net amount of capital at risk is equal to $51.1White Mountains' investment in the Fund of $63.7 million, which represents the Company's 49.3%White Mountains' ownership interest of 46.1% in the Fund'sProspector Fund.

                      Tuckerman LP, I

                              White Mountains has determined that Tuckerman Limited Partnership, I ("Tuckerman I") is a VIE for which White Mountains is the primary beneficiary and is required to consolidate Tuckerman I. At December 31, 2007 and 2006, White Mountains consolidated total equity. Any creditorassets of $30.7 million and $35.6 million and total liabilities of $19.1 million and $15.1 million of Tuckerman I. In addition, at December 31, 2007 and 2006, White Mountains recorded a minority interest liability of $(.4) million and $3.5 million representing the Fund would not have recourse againstnoncontrolling interests in Tuckerman I. For the Company beyondyears ended December 31, 2007 and 2006, White Mountains recorded $.9 million and $1.9 million of minority interest expense related to Tuckerman I. At December 31, 2007, the Company's investment.net amount of capital at risk is equal to White Mountains' investment in Tuckerman I of $11.1 million, which represents White Mountains' ownership interest of 96.0% in Tuckerman I.

                      Tuckerman LP, II

                              White Mountains has determined that Tuckerman Limited Partnership, II ("Tuckerman II") is a VIE for which White Mountains is the primary beneficiary and is required to consolidate Tuckerman II. At December 31, 2007 and 2006, White Mountains consolidated total assets of $60.6 million and $65.4 million and total liabilities of $18.9 million and $17.4 million. In addition, at December 31, 2007 and 2006, White Mountains recorded a minority interest liability of $26.2 million and $26.7 million representing the noncontrolling interest in Tuckerman II. For the years ended December 31, 2007 and 2006, White Mountains recorded $3.6 million and $3.6 million of minority interest expense related to Tuckerman II. At December 31, 2007, the net amount of capital at risk is equal to White Mountains' investment in Tuckerman II of $20.7 million, which represents White Mountains' ownership interest of 49.7% in Tuckerman II.


                      NOTE 16.19. Fair Value of Financial Instruments

                              SFAS No. 107, "Disclosure about Fair Value of Financial Instruments" ("SFAS 107"), requires disclosure of fair value information of financial instruments. For certain financial instruments where quoted market prices are not available, other independent valuation techniques and assumptions are used.the fair values of these financial instruments were estimated by discounting future cash flows using current market rates for similar obligations or using quoted market prices. Because considerable judgment is used, these estimates are not necessarily indicative of amounts that could be realized in a current market exchange. SFAS 107 excludes certain financial instruments from disclosure, including insurance contracts, other than financial guarantees and investment contracts. White Mountains carries its financial instruments on its balance sheet at fair value with the exception of its fixed-rate, long-term indebtedness.indebtedness and its mandatorily redeemable preferred stock.

                              The following table summarizes the fair value and carrying value of financial instruments as of December 31, 2007 and 2006:

                       
                       December 31, 2007
                       December 31, 2006
                      Millions

                       Fair
                      Value

                       Carrying
                      Value

                       Fair
                      Value

                       Carrying
                      Value

                      Fund American Senior Notes $703.2 $698.9 $692.7 $698.7
                      WMRe Senior Notes  398.3  398.9    
                      WMRe Preference Shares(1)  219.4  250.0    
                      Berkshire Preferred Stock  307.0  278.3  319.5  242.3
                      Zenith Preferred Stock      20.6  20.0


                      (1)
                      WMRe Preference Shares are recorded as minority interest.

                      NOTE 20. Transactions with Related Persons

                      Prospector

                              Mr. John Gillespie, a director of the Company, is the founder and Managing Member of Prospector. Prospector serves as a discretionary adviser with respect to specified assets, primarily equity securities, managed by WM Advisors on behalf of White Mountains (including, prior to its IPO, OneBeacon) and other clients of WM Advisors. Pursuant to an investment management agreement with WM Advisors (the "WMA Agreement"), through March 1, 2006, Prospector charged WM Advisors fees based on the following schedule: 100 basis points on the first $200 million of assets under management; 50 basis points on the next $200 million; and 15 basis points on amounts over $400 million. Effective March 1, 2006, pursuant to an amendment to the WMA Agreement, Prospector charged WM Advisors fees based on the following schedule: 100 basis points on the first $200 million; 50 basis points on the next $200 million; and 25 basis points on amounts over $400 million. At December 31, 2007, Prospector managed approximately $.9 billion of assets for WM Advisors under this arrangement.

                              Effective November 14, 2006, in connection with the OneBeacon Offering, OneBeacon entered into a separate investment management agreement with Prospector pursuant to which Prospector supervises and directs specified assets, primarily equity securities. Pursuant to this investment management agreement (the "OneBeacon Agreement"), Prospector charged OneBeacon fees based on the following schedule: 100 basis points on the first $200 million; 50 basis points on the next $200 million; and 25 basis points on amounts over $400 million. At December 31, 2007, Prospector managed approximately $1.6 billion of assets for OneBeacon, including the defined benefit and defined contribution plans, under this arrangement.

                              During 2007, Prospector earned $6.7 million in fees pursuant to the WMA Agreement and $5.9 million in fees pursuant to the OneBeacon Agreement.

                              Prospector also advises White Mountains on matters including capital management, asset allocation, private equity investments and mergers and acquisitions. Pursuant to a Consulting Agreement for those services, Prospector was granted 9,600 performance shares for the 2008-2010 performance cycle, 8,000 performance shares for the 2007-2009 performance cycle and 8,400 performance shares for the 2006-2008 performance cycle. In accordance with the terms of the Incentive Plan, performance against target governing the performance shares will be confirmed by the Compensation Committee of the Board following the end of each performance cycle and the number of performance shares actually awarded at that time will range from 0% to 200% of the target number granted. Unless and until the Consulting Agreement has been terminated, and subject to the approval of the Compensation Committee, at the beginning of each performance cycle Prospector is to be granted performance shares with a value of approximately $4.5 million. The Compensation Committee establishes the performance target for such performance shares.


                              Pursuant to a revenue sharing agreement, Prospector has agreed to pay White Mountains 6% of the revenues in excess of $500,000 of certain of Prospector's funds in return for White Mountains having made a founding investment in 1997. White Mountains earned $.8 million during 2007 under this arrangement.

                              At December 31, 20042007, White Mountains had $146.8 million invested in limited partnership investment interests managed by Prospector. This total includes $40.2 million of OneBeacon assets. In addition, Messrs. Barrette and 2003, the fair value of White Mountains' Senior Notes (its only fixed-rate, long-term indebtedness) was $714.0 millionWaters, executive officers and $710.6 million respectively, which compared to a carrying value of $698.3 million and $698.1 million, respectively.

                              At December 31, 2004, the fair valuesdirectors of the BerkshireCompany, George Gillespie and Zenith Preferred Stock were $340.5 million and $22.7 million, respectively, which compared to carrying values of $191.9 million and $20.0 million, respectively.

                              The fair values of these obligations were estimated by discounting future cash flows using current market rates for similar obligations or using quoted market prices. Considerable judgment is required to develop such estimates of fair value. Therefore, the estimate provided herein is not necessarily indicativeJohn Gillespie, directors of the amounts that could be realized in a current market exchange.Company, and Mr. Campbell an executive officer of the Company, owned limited partnership investment interests managed by Prospector as of such date.


                      NOTE 17. Related Party Disclosures

                      Berkshire
                      Keep-Well

                              Berkshire owned approximately 16% of the Common Shares of White Mountains as of December 31, 2004. Berkshire acquired the Common Shares through its June 2004 exercise of warrants to purchase 1,724,200 Common Shares for $294 million. Berkshire bought the warrants in connection with the financing of White Mountains' acquisition of OneBeacon in 2001. The warrants were exercisable at any time until May 2008 and callable by the Company on or after May 31, 2005. Berkshire and the Company agreed to reduce the exercise price by approximately 2% ($6 million) to induce Berkshire's early exercise of the warrants.

                              InOn November 30, 2004, White Mountains completed a significant corporate reorganization, that made the legal organizationthrough which ownership of Folksamerica was transferred to White Mountains' subsidiaries consistent with its main operating businesses.Mountains Re from Fund American. In order to effect the reorganization, White Mountains and Fund American entered into or amended certain agreements with respect to the Series ABerkshire Preferred Stock of Fund American (the "Series A Preferred Stock"), which is owned by subsidiaries of Berkshire.Stock. Under the terms of a Keep-Well Agreement dated November 30, 2004 between White Mountains and Fund American (the "Keep-Well"), White Mountains has agreed to return to Fund American up to approximately $1.1 billion, which equals the amount of net assets transferred out of Fund American as a result of the reorganization, if some or all of that amount is required by Fund American to meet its obligations to Berkshire under the Series ABerkshire Preferred Stock. Additionally, the Keep-Well limits the aggregate amount of distributions that White Mountains may make to its shareholdersshareholders. This distribution limit, which as of December 31, 2007 was $2.4 billion, will increase or decrease by an amount equal to approximately $1.3 billion plus


                      White Mountains' aggregate consolidated net income after September 30, 2004.or loss over the remaining life of the agreement. The Keep-Well will expire upon the earlier of when all obligations of the Series ABerkshire Preferred Stock, which is redeemable in May 2008, have been satisfied or when approximately $1.1 billion has been returned to Fund American.

                              NICOOther relationships and GRC, which have provided the NICO Cover and the GRC Cover to subsidiaries of White Mountains, are wholly-owned subsidiaries of Berkshire (see Note 4). Reinsurance recoverable from, and preferred stock of White Mountains' subsidiaries owned by, Berkshire are shown as separate line items in White Mountains' consolidated balance sheet. In addition, in the ordinary course of its business, White Mountains has, and in the future may, enter into other insurance and reinsurance transactions with Berkshire on arm's length terms and conditions.

                              White Mountains and Berkshire co-led the investor group that acquired Symetra for $1.35 billion on August 2, 2004. See "Symetra" below.


                      Olympus

                              Folksamerica and Sirius have entered into quota share retrocessional arrangements with Olympus. Under these arrangements with Olympus, Folksamerica ceded up to 75%Mr. Berkowitz is the Managing Member of substantially all of its short-tailed excess of loss business, mainly property and marine, and 50% of its proportional property business to Olympus and received an override commission on the premiums ceded to Olympus. Effective April 1, 2004, Sirius International entered into a quota share reinsurance agreement with Olympus. Under this agreement, Sirius International ceded 25% of its new and renewal short-tailed proportional and excess of loss business to Olympus. During 2004, 2003 and 2002, White Mountains ceded $465.6 million, $449.1 million and $229.7 million, respectively, in written premiums and $269.5 million, $107.0 million and $54.4 million, respectively, in losses and LAE to Olympus. White Mountains receives fee income on reinsurance placements referred to Olympus and is entitled to additional fees based on net underwriting profits on referred business. During 2004, 2003 and 2002, White Mountains earned $68.7 million, $98.4 million and $48.9 million of fee income from Olympus. White Mountains does not own or control any common shares of Olympus Holdings.

                              Joseph Steinberg, a directorEast Lane LLC, Managing Member of the Company, is Chairman of Olympus Holdings (the parent company of Olympus) and is President of Leucadia. Leucadia owns approximately 19% of the common shares of Olympus Holdings. Investment funds managed by Franklin Mutual Advisors LLC ("Franklin Mutual"), which own approximately 19% of the common shares of White Mountains, own approximately 13% of Olympus Holdings. Bruce Berkowitz, a director of the Company, is Founderinvestment adviser to The Fairholme Fund, and Managing Member of Fairholme Capital Management, L.L.C., a registered investment adviser. Through Fairholme Capital Management, Mr. Berkowitz controls approximately 11%Ventures II, LLC. On November 21, 2007, the Company repurchased 7,000 of theits common shares owned by the Fairholme Fund and 1,500 of Olympus Holdings. John Gillespie, a director and executive officer of the Company, through investment management arrangements including Prospector, controls approximately .1% of theits common shares owned by Fairholme Ventures II, LLC, at the price of Olympus Holdings. In addition, other directors and executive officers$500 per share for a total of White Mountains (consisting of Jack Byrne, John Cavoores, Steven Fass and Arthur Zankel) own approximately 3% of the common shares of Olympus Holdings.


                      Symetra

                              As of December 31, 2004, through its holdings of common shares and warrants, White Mountains owned approximately 24% of Symetra on a fully-converted basis. Berkshire, who co-led the investor group that acquired Symetra, also owns approximately 24% of Symetra on a fully-converted basis. White Mountains is entitled to appoint three persons to Symetra's eight member board of directors (currently Jack Byrne, John Gillespie and David Foy). In addition, Mr. Foy serves as Chairman of Symetra.

                              In$4.3 million. This purchase was made in connection with the acquisitionCompany's share repurchase authorization announced in November, 2006. On November 20, 2007, the closing sales price of Symetra, the following entities were among the investors in the investor group that was co-led by White Mountains and Berkshire Hathaway. Investment funds


                      managed by Franklin Mutual own approximately 10% ofCompany's common shares of Symetra on a fully converted basis. Bruce Berkowitz, through Fairholme Capital Management controls approximately 2% of the common shares of Symetra on a fully converted basis. John Gillespie, through investment management arrangements including Prospector, controls approximately 3% of the common shares of Symetra on a fully converted basis.was $505.50.


                      Other relationships

                              Mr. Howard Clark, a director of the Company, is Vice Chairman of Lehman.Lehman Brothers, Inc. ("Lehman"). Lehman has, from time to time, provided various services to White Mountains including investment banking services, brokerage services, underwriting of debt and equity securities and financial consulting services. During 2006, Lehman wasserved as sole book-running manager for the lead underwriter of Fund American's $700.0 million Senior Notes.OneBeacon Offering. Also during 2006, Lehman was also the arranger, the administrative agent andserved as a lender under the Old Bank Facility and is a lender underjoint book-running manager for two new revolving credit facilities for White Mountains' current Bank Facility. See Note 6.Mountains.

                              Mr. George Gillespie, a director and Chairman of the Company, is a Partner atserves as Special Counsel to Cravath, Swaine & Moore LLP ("CS&M"), which. CS&M has been retained by White Mountains from time to time to perform legal services.

                              John Gillespie, pursuant to his employment agreement entered into with the Company During 2006, among other services rendered, CS&M acted as of January 1, 2001, may continue his active involvement with Prospector so long as he devotes the requisite time required to fulfill his responsibilities to WM Advisors. The agreement specifies procedures pursuant to which Prospector's funds have the ability to invest first in opportunities generated by Mr. Gillespie that are appropriate for both White Mountains and such funds. In addition, pursuant to a revenue sharing agreement established in connection with his employment by the Company, Mr. Gillespie has agreed to pay White Mountains 33% of certain revenues of Prospector in return for White Mountains agreeing to pay its operational expenses. For 2004, White Mountains' received total revenues of approximately $4.2 million and paid total expenses of approximately $2.8 million undercounsel for the revenue sharing agreement. Pursuant to another revenue sharing agreement with Prospector, Mr. Gillespie has agreed to pay White Mountains 6% of the revenues in excess of $500,000 of certain of Prospector's funds in return for White Mountains having made a founding investment in Prospector in 1997. For 2004, White Mountains' received a payment of approximately $.8 million under the second revenue sharing agreement. Mr. Gillespie's share of Prospector's revenues for 2004 was approximately $4.2 million. Mr. Gillespie's employment contract and the revenue sharing arrangements are filed as exhibits to this Form 10-K.OneBeacon Offering.

                              At December 31, 2004, White Mountains had approximately $115.9 million invested in funds managed by Prospector. In addition, Messrs. Byrne, George Gillespie and John Gillespie owned investments in funds managed by Prospector as of such date.

                              In September 2001, White MountainsWM Advisors entered into a five-year lease at a market-based rate forcurrently leases a building partially owned by Mr. John Gillespie and trusts for the benefit of members of his family (the "Gillespie Trusts"). For 2004,2007, the rental payments attributable to JohnMr. Gillespie's ownership in the building totalled approximately $16,000$17,000 and the rental payments attributable to the Gillespie Trusts' ownership in the building totalled approximately $127,000.

                              John Gillespie indirectly through general and limited partnership interests holds$137,000. In addition, WM Advisors sublet a 44% interest in Dowling & Partners Connecticut Fund III, LP ("Fund III"). OBPP and Folksamerica Specialty Underwriting, Inc. ("FSUI") have borrowed approximately $8 million and $7 million, respectively, from Fund III in connection with an incentive program sponsored byportion of the State of Connecticut known as the Connecticut Insurance Reinvestment Act (the "CIR Act"). The CIR Act provides for Connecticut income tax credits to be granted for qualifying investments made by approved fund managers. The loans made by Fund III to OBPP and FSUI are qualifying investments and, together, have the potential to generate up to $15 million of tax credits that would be shared equally between Fund III on the one


                      hand and OBPP and FSUI on the other. As a result of his interest in Fund III, John Gillespie could realize up to $3.3 millionbuilding it leases from the tax credits, although any such amount would be subjectGillespie Trusts to the revenue sharing agreements with White Mountains described above.

                              Arthur Zankel, a director of the Company, is Senior Managing Member of High Rise CapitalProspector and, for 2007, Prospector paid WM Advisors LLC, which is the General Partner of High Rise Partners II, L.P. and Cedar Bridge Realty Fund, L.P. At December 31, 2004, White Mountains had a total of approximately $80.8 million in investments that were managed by these entities.$52,000.

                              In connection with acquisitions or other transactions led or sponsored by the Company in which it obtains equity financing, entities affiliated with directors from time to time may participate in such financings on the same terms as unaffililated third parties that participate in such financings.


                      NOTE 18.21. Commitments and Contingencies

                              White Mountains leases certain office space under noncancellable operating leases expiring atthat expire on various dates through 2010. Rental expense for all of White Mountains' locations was approximately $46.5$54.8 million, $42.9$49.1 million and $45.9$49.1 million for the years ended December 31, 2004, 20032007, 2006 and 2002, respectively.2005. White Mountains also has various other lease obligations whichthat are immaterial in the aggregate.

                              White Mountains' future annual minimum rental payments required under noncancellable leases, which are primarily for office space, are $41.8$31.8 million, $37.7$25.1 million, $34.1 million, $26.3$20.0 million and $28.6$49.4 million for 2005, 2006, 2007, 2008, 2009, 2010 and 20092011 and thereafter, respectively.


                      Assigned Risks

                              As a condition of its license to do business in certain states, White Mountains' insurance operations are required to participate in mandatory shared market mechanisms. Each state dictates the types of insurance and the level of coverage that must be provided. The total amount of such business an insurer is required to accept is based on its market share of voluntary business in the state. In certain cases, White Mountains is obligated to write business from mandatory shared market mechanisms at some time in the future based on the market share of voluntary policies it is currently writing. Underwriting results related to assigned risk plans are typically adverse and are not subject to the predictability associated with White Mountains' voluntarily written business.

                              Under existing guaranty fund laws in all states, insurers licensed to do business in those states can be assessed for certain obligations of insolvent insurance companies to policyholders and claimants. In accordance with SOP 97-3, White Mountains' insurance subsidiaries record guaranty fund assessments when such assessments are billed by the respective guaranty funds. In addition, each insurance subsidiary's policy is to accrue forMountains accrues any significant insolvencies when the loss is probable and the assessment amount can be reasonably estimated. The actual amount of such assessments will depend upon the final outcome of rehabilitation proceedings and will be paid over several years. At December 31, 2004,2007, the reserve for such assessments at White Mountains' insurance subsidiaries totalled $18.3$16.6 million.

                      General LitigationLegal Contingencies

                              White Mountains, and the insurance and reinsurance industry in general, are subject to litigation and arbitration in the normal course of its business. Other than those items listed below, White Mountains was not a party to any material litigation or arbitration other than as routinely encountered in claims activity, none of which is expected by management to have a material adverse effect on its financial condition and/or cash flowsflows.

                      OneBeacon

                              In August 2004, OneBeacon asserted claims against Liberty Mutual in the Court of Common Pleas in Philadelphia, Pennsylvania (the "Court") for breach of contract and negligence with respect to agreements with Liberty Mutual (the "Liberty Agreements"). The portion of the contract claim relating to OBIC was submitted to arbitration and the Court stayed the remaining claims, including OneBeacon's claims on behalf of its other insurance subsidiaries that were signatories to the Liberty Agreements, pending resolution of the arbitration. In August 2007, the arbitration panel issued an award in favor of OneBeacon on the portion of the breach of contract claim submitted to it finding that Liberty Mutual breached the Liberty Agreements. The panel awarded OneBeacon $4.5 million plus interest.

                              Subsequent to the award, in September 2007, Liberty Mutual filed petitions in the U.S. District Court for the District of Massachusetts ("USDC") and the Court to vacate the arbitral award and dismiss or arbitrate the remaining Court claims. In October 2007, OneBeacon (on behalf of its other insurance subsidiaries that were signatories to the Liberty Agreements) filed suit against Liberty Mutual in Suffolk County Superior Court in Massachusetts to recover damages caused by Liberty Mutual's claims conduct. Concurrently, a demand for arbitration was served on Liberty Mutual to preserve the rights and interests of OneBeacon (on behalf of the same subsidiaries). In December 2007, the Court confirmed the arbitral award. Liberty Mutual has appealed the Court's confirmation of the award to the Pennsylvania Superior Court. Liberty Mutual's motion to vacate the award is still pending in USDC. Resolution of the outstanding motions is expected in the near future.

                              In January 2005, Liberty Mutual initiated arbitration against OneBeacon (the "ULAE Arbitration") seeking payment of approximately $67 million relating to claims-related services under the Liberty Agreements. In September 2006, OneBeacon initiated an arbitration against Liberty Mutual (the "Reinsurance Arbitration") seeking payment of approximately $57 million relating to reinsurance arrangements under the Liberty Agreements. In January 2007, the Reinsurance Arbitration was consolidated into the ULAE Arbitration. In July 2007, the reinsurance payment issues in the Reinsurance Arbitration were favorably resolved. Arbitration hearings regarding ULAE issues and damages related thereto are scheduled to occur in the second and third quarters of 2008, respectively.

                              As of December 31, 2007, OneBeacon believes its loss and LAE reserves are sufficient to cover reasonably anticipated outcomes of all disputes with Liberty Mutual.

                      Esurance

                              On November 29, 2007, Dennis J. Czerwinski filed a lawsuit against Esurance Property and Casualty Insurance Company and Esurance Insurance Company in the U.S. District Court, Eastern District of Wisconsin, Milwaukee Division alleging violations of the Fair Credit Reporting Act ("FCRA") and seeking class certification. Czerwinski alleged that Esurance's accessing of consumer credit reports in connection with prescreened offers of insurance violated the FCRA because the offers allegedly did not qualify as firm offers of insurance. The proposed class consists of all persons in the United States to whom Esurance sent a solicitation in the form of the one mailed to Czerwinski after February 1, 2006 through the date a class is certified. Esurance is disputing the allegations and intends to vigorously defend this action.


                      NOTE 22. Subsequent Events

                      Purchase of Helicon

                              On January 7, 2008, White Mountains Re acquired Helicon Re Holdings, Ltd. for approximately $150.2 million. Helicon Re Holdings Ltd., parent of Helicon Reinsurance Company Ltd., had GAAP shareholders' equity of approximately $154.7 million as of December 31, 2004.2007. In 2006 and 2007, Helicon Re provided quota share retrocessional coverage to White Mountains Re. White Mountains Re did not renew the quota share agreement for 2008 and Helicon was put into runoff.


                      Investment in Answer Financial

                              On May 15, 2002, The Robert Plan Corporation and several of its subsidiaries filed a lawsuit against the Company, certain of its subsidiaries and several individuals employed by such subsidiaries. The suit alleges that the defendants misappropriated confidential information of the plaintiffs and used such information to enter into the New York automobile assigned risk business in direct competition with the plaintiffs. The plaintiffs seek approximately $185 million in damages which they allege represents two years of their lost profits in the subject business. The Company, its named subsidiaries and its named employees do not believe they engaged in any improper or actionable conduct.January 22, 2008, White Mountains acquired 42% of Answer Financial Inc.'s outstanding debt and its subsidiaries have no reasonequity for $30.2 million. Answer Financial is an online personal insurance agency, offering consumers the ability to believe they have any liabilitycompare quotes for automobile and homeowners insurance and to The Robert Plan Corporation and intend to vigorously defend the lawsuit.purchase coverage from multiple insurance carriers. In addition, conjunction with this transaction, Answer Financial will be completing a restructuring.

                      OneBeacon has brought a counterclaim against the plaintiffs that it believes to be meritorious. OneBeacon is seeking compensatory damages of $8.8 million as a result of the breach by the plaintiffs of the LAD servicing contract that OneBeacon had entered into with them.Special Dividend

                              In December 2001, American Centennial filed for arbitration against Gerling,On January 31, 2008, OneBeacon Ltd. declared a reinsurer$200.0 million special dividend, of American Centennial,which White Mountains will receive a portion based on Gerling's failure to pay American Centennial amounts due under a reinsurance contract. Gerling had requested the arbitration panel to rescind the contract asits ownership percentage on March 17, 2008. As of December 31, 2000 based upon, among other things, White Mountains' acquisition of American Centennial in 1999. A preliminary judgement was handed down in December 2003 in which the arbitrator ruled that Gerling had been harmed and they are entitled to a discount on certain amounts that it owes American Centennial under the contract. The impact of this discount is immaterial to White Mountains' financial results. A final judgement handed down in January 2004 confirmed that the reinsurance contract will remain in-force. At December 31, 2003, American Centennial had recorded $22.7 million in recoverables from Gerling under this reinsurance contract, of which $9.8 million was for losses paid by American Centennial. Gerling has subsequently reimbursed American Centennial early in 2004 for the $9.8 million in paid recoverables. The remaining obligation on unpaid recoverables is fully collateralized.

                              In August 2000, Aramarine, a former insurance broker of OneBeacon's, filed a lawsuit alleging that OneBeacon had wrongfully terminated its business relationship with Aramarine. The suit originally claimed $410 million in compensatory damages for lost commissions. However, Aramarine has recently reduced its demand to $158 million. OneBeacon does not believe it has engaged in any actionable conduct. During 2004, OneBeacon prevailed on a motion for summary judgment to dismiss the plaintiff's claim. OneBeacon expects the plaintiff to appeal the summary judgment upon resolution of OneBeacon's counterclaim for return commission.

                              In June 1999,2007, White Mountains sold VGI to Unitrin. As partowned 72.9% of the VGI Sale, White Mountains has provided Unitrin with adverse loss development protection of up to $50.0 million on loss reserves sold to Unitrin. During 2004, White Mountains paid Unitrin $47 million for a full release of its obligation in this matter.OneBeacon Ltd.'s outstanding shares.


                      NOTE 19. Consolidating Financial Information

                              The Company will fully and unconditionally guarantee any debt securities, preference shares or trust preferred securities issued by Fund American pursuant to its December 2001 shelf registration statement, including Fund American's May 2003 issuance of the Senior Notes (see Note 6). The following tables present White Mountains' consolidating balance sheets as of December 31, 2004 and December 31, 2003 and statements of income and cash flows for the years then ended. These financial statements reflect the Company's financial position, results of operations and cash flows on a stand-alone basis, that of Fund American and of the Company's other entities, as well as the necessary adjustments to eliminate intercompany balances and transactions.


                      Consolidating Balance Sheet as of December 31, 2004

                       The Company
                       Other Entities
                       Fund American
                       Eliminations
                       Total
                       
                       (Dollars in Millions)

                      ASSETS               
                      Fixed maturity investments, at fair value $246.8 $3,457.6 $4,195.6 $ $7,900.0
                      Short-term investments, at amortized cost  16.2  632.9  409.1    1,058.2
                      Common equity securities, at fair value    327.7  716.2    1,043.9
                      Other investments    367.0  160.4    527.4


                       Total investments  263.0  4,785.2  5,481.3    10,529.5
                      Cash    195.8  47.3    243.1
                      Reinsurance recoverable on paid and unpaid losses    1,388.9  2,500.5    3,889.4
                      Funds held by ceding companies    943.8      943.8
                      Securities lending collateral     308.4  284.9    593.3
                      Accounts receivable on unsettled investment sales    0.2  19.7    19.9
                      Insurance and reinsurance premiums receivable    392.0  550.2    942.2
                      Investment in unconsolidated insurance affiliates  37.3  267.6  161.7    466.6
                      Deferred tax asset    92.4  179.1    271.5
                      Deferred acquisition costs    108.0  200.2    308.2
                      Ceded unearned premiums    182.5  41.6    224.1
                      Investment income accrued  1.6  41.3  59.5    102.4
                      Investments in subsidiaries  3,665.1      (3,665.1) 
                      Other assets  12.3  87.7  381.1    481.1


                       Total assets $3,979.3 $8,793.8 $9,907.1 $(3,665.1)$19,015.1


                      LIABILITIES AND COMMON SHAREHOLDERS' EQUITY               
                      Loss and LAE reserves $ $4,277.8 $5,120.7 $ $9,398.5
                      Reserves for structured contracts    375.9      375.9
                      Unearned insurance and reinsurance premiums    672.6  1,066.8    1,739.4
                      Securities lending liability    308.4  284.9    593.3
                      Debt    57.0  726.3    783.3
                      Deferred tax liability    316.3      316.3
                      Ceded reinsurance payable    121.4  80.0    201.4
                      Accounts payable on unsettled investment purchases    11.8  19.1    30.9
                      Funds held under reinsurance treaties    149.3  6.1    155.4
                      Other liabilities  95.4  409.8  819.7    1,324.9
                      Preferred stock subject to mandatory redemption    19.9  192.0    211.9


                       Total liabilities  95.4  6,720.2  8,315.6    15,131.2


                      Common shareholders' equity  3,883.9  2,073.6  1,591.5  (3,665.1) 3,883.9


                      Total liabilities and common shareholders' equity $3,979.3 $8,793.8 $9,907.1 $(3,665.1)$19,015.1


                      Consolidating Balance Sheet as of December 31, 2003

                       The Company
                       Other Entities
                       Fund American
                       Eliminations
                       Total
                       
                       (Dollars in Millions)

                      ASSETS               
                      Fixed maturity investments, at fair value $ $71.0 $6,177.1 $ $6,248.1
                      Short-term investments, at amortized cost  11.1  682.2  854.6  (1.3) 1,546.6
                      Common equity securities, at fair value      513.6    513.6
                      Other investments    89.9  149.3    239.2


                       Total investments  11.1  843.1  7,694.6  (1.3) 8,547.5
                      Cash  .3  27.1  62.5    89.9
                      Reinsurance recoverable on paid and unpaid losses    8.8  3,586.7    3,595.5
                      Funds held by ceding companies    5.9  138.2    144.1
                      Securities lending collateral      911.0    911.0
                      Accounts receivable on unsettled investment sales      9.1    9.1
                      Insurance and reinsurance premiums receivable    44.6  744.4  (10.0) 779.0
                      Investment in unconsolidated insurance affiliates    90.5  425.4    515.9
                      Deferred tax asset    (8.2) 361.6  (93.4) 260.0
                      Deferred acquisition costs    3.6  230.0    233.6
                      Ceded unearned premiums    .9  184.4    185.3
                      Investment income accrued      73.0    73.0
                      Investments in subsidiaries  3,021.0      (3,021.0) 
                      Other assets  5.0  80.9  477.9  (25.7) 538.1


                       Total assets $3,037.4 $1,097.2 $14,898.8 $(3,151.4)$15,882.0


                      LIABILITIES AND COMMON SHAREHOLDERS' EQUITY               
                      Loss and LAE reserves $ $75.9 $7,652.3 $ $7,728.2
                      Unearned insurance and reinsurance premiums    23.3  1,386.1    1,409.4
                      Securities lending liability      911.0    911.0
                      Debt    12.9  730.1    743.0
                      Deferred tax liability     .2  .2     .4
                      Ceded reinsurance payable      158.3    158.3
                      Accounts payable on unsettled investment purchases    302.0  69.6    371.6
                      Funds held under reinsurance treaties      211.9    211.9
                      Other liabilities  58.2  318.6  928.1  (130.4) 1,174.5
                      Preferred stock subject to mandatory redemption    20.0  174.5    194.5


                       Total liabilities  58.2  752.9  12,222.1  (130.4) 12,902.8


                      Common shareholders' equity $2,979.2 $344.3 $2,676.7 $(3,021.0)$2,979.2


                      Total liabilities common shareholders' equity $3,037.4 $1,097.2 $14,898.8 $(3,151.4)$15,882.0


                      Consolidating Statement of Income for the Year Ended December 31, 2004

                       The Company
                       Other Entities
                       Fund American
                       Eliminations
                       Total
                       
                       
                       (Dollars in Millions)

                       
                      Earned insurance and reinsurance premiums $ $768.5 $3,052.0 $ $3,820.5 
                      Net investment income  1.8  72.6  286.5    360.9 
                      Net realized investment gains (losses)  1.9  40.9  138.3    181.1 
                      Other revenue    (39.6) 230.1    190.5 


                       Total revenues  3.7  842.4  3,706.9    4,553.0 


                      Loss and LAE    494.1  2,097.0    2,591.1 
                      Insurance and reinsurance acquisition expenses    135.4  608.1    743.5 
                      Other underwriting expenses    55.2  466.1    521.3 
                      General and administrative expenses  65.0  59.5  184.8    309.3 
                      Accretion of fair value adjustment to loss and LAE reserves    10.1  33.2    43.3 
                      Interest expense on debt  0.3  2.7  46.1    49.1 
                      Interest expense on preferred shares    2.0  45.6    47.6 


                       Total expenses  65.3  759.0  3,480.9    4,305.2 


                      Pretax income (loss)  (61.6) 83.4  226.0    247.8 
                      Income tax benefit (provision)  9.3  74.6  (130.9)   (47.0)
                      Equity in earnings of subsidiaries  430.3      (430.3)  
                      Equity in earnings of unconsolidated insurance affiliates    10.0  27.4    37.4 
                      Excess of fair value of acquired net assets over cost  40.7  130.7  9.1    180.5 


                      Net income $418.7 $298.7 $131.6 $(430.3)$418.7 


                      Consolidating Statement of Income for the Year Ended December 31, 2003

                       The Company
                       Other Entities
                       Fund American
                       Eliminations
                       Total
                       
                       
                       (Dollars in millions)

                       
                      Earned insurance and reinsurance premiums $ $78.3 $3,059.4 $ $3,137.7 
                      Net investment income  .2  4.9  285.8    290.9 
                      Net realized investment gains (losses)  (1.1) 34.8  128.9    162.6 
                      Other revenue (loss)  (.5) 80.6  153.2  (30.7) 202.6 


                       Total revenues  (1.4) 198.6  3,627.3  (30.7) 3,793.8 


                      Losses and LAE    53.3  2,084.8    2,138.1 
                      Insurance and reinsurance acquisition expenses    16.9  618.0  (19.9) 615.0 
                      Other underwriting expenses    3.2  343.9    347.1 
                      General and administrative expenses  70.7  22.3  120.8  (12.0) 201.8 
                      Accretion of fair value adjustment to loss and LAE reserves      48.6    48.6 
                      Interest expense on debt    .3  48.3    48.6 
                      Interest expense on preferred shares    1.0  21.3    22.3 


                       Total expenses  70.7  97.0  3,285.7  (31.9) 3,421.5 


                      Pretax income (loss)  (72.1) 101.6  341.6  1.2  372.3 
                      Income tax benefit (provision)  (.1) .2  (126.5) (1.2) (127.6)
                      Accretion and dividends on preferred stock of subsidiaries    (1.0) (20.5)   (21.5)
                      Equity in earnings of subsidiaries  352.8      (352.8)  
                      Equity in earnings of unconsolidated insurance affiliates      57.4    57.4 
                      Cumulative effect of changes in accounting principles           


                      Net income $280.6 $100.8 $252.0 $(352.8)$280.6 


                      Consolidating Statement of Cash Flows
                      for the Year Ended December 31, 2004

                       The Company
                       Other Entities
                       Fund American
                       Total
                       
                       
                       (Dollars in Millions)

                       
                      Net income (loss), excluding undistributed equity in earnings of subsidiaries $(1.4)$288.5 $131.6 $418.7 
                      Charges (credits) to reconcile net income to cash flows from operating activities:             
                       Excess of fair value of acquired net assets over cost  (40.7) (130.7) (9.1) (180.5)
                       Net realized investment gains  (1.9) (40.9) (138.3) (181.1)
                       Undistributed equity in earnings from unconsolidated affiliates, net of tax    (10.0) (27.4) (37.4)
                       Deferred income tax (benefit) provision    (181.8) 122.8  (59.0)
                      Other operating items:             
                       Net Federal income tax payments    (58.8) (27.7) (86.5)
                       Net change in insurance and reinsurance balances receivable    199.9  (109.9) 90.0 
                       Net change in reinsurance recoverable on paid and unpaid losses    121.6  179.2  300.8 
                       Net change in deferred acquisition costs    9.8  (43.3) (33.5)
                       Net change in loss and LAE reserves and reserves for structured contracts    (277.6) (529.1) (806.7)
                       Net change in unearned insurance and reinsurance premiums    (177.0) 123.0  (54.0)
                       Net change in other assets and liabilities, net  (7.8) 293.9  (213.6) 72.5 


                      Net cash flows provided from (used for) operating activities  (51.8) 36.9  (541.8) (556.7)


                      Cash flows from investing activities:             
                      Net (increase) decrease in short-term investments  (5.1) 509.0  264.3  768.2 
                      Sales of fixed maturity investments    921.9  4,983.2  5,905.1 
                      Maturities of fixed maturity investments    560.0  1,001.7  1,561.7 
                      Sales of common equity securities and other investments    268.9  288.4  557.3 
                      Sales of consolidated and unconsolidated affiliates, net of cash sold    (32.6) 253.5  220.9 
                      Purchases of fixed maturity investments  (242.1) (1,430.5) (5,484.7) (7,157.3)
                      Purchases of common equity securities and other investments    (128.0) (250.8) (378.8)
                      Purchases of consolidated and unconsolidated affiliates, net of cash acquired    (516.6) (143.2) (659.8)
                      Net change in unsettled investment purchases and sales    (299.8) (37.4) (337.2)
                      Net acquisitions of property and equipment    (1.1) (12.5) (13.6)


                      Net cash flows provided from (used for) investing activities  (247.2) (148.8) 862.5  466.5 


                      Cash flows from financing activities:             
                      Proceeds from issuance of Common Shares  307.8      307.8 
                      Proceeds from issuance of debt    (27.0) 27.0   
                      Repayments of debt      (25.0) (25.0)
                      Dividends paid on mandatorily redeemable preferred stock of subsidiaries    (2.0) (28.3) (30.3)
                      Dividends paid on Common Shares  (9.1)     (9.1)
                      Intercompany dividends and distributions    309.6  (309.6)  


                      Net cash provided from (used for) financing activities  298.7  280.6  (335.9) 243.4 


                      Net increase (decrease) in cash during period  (.3) 168.7  (15.2) 153.2 
                      Cash balances at beginning of period  .3  27.1  62.5  89.9 


                      Cash balances at end of period $ $195.8 $47.3 $243.1 


                      Consolidating Statement of Cash Flows
                      for the Year Ended December 31, 2003

                       The Company
                       Other Entities
                       Fund American
                       Total
                       
                       
                       (Dollars in Millions)

                       
                      Net income (loss), excluding equity in earnings of subsidiaries $(72.2)$100.8 $252.0 $280.6 
                      Charges (credits) to reconcile net income to cash flows from operating activities:             
                       Net realized investment (gains) losses  1.1  (34.8) (128.9) (162.6)
                       Undistributed equity in earnings from unconsolidated affiliates, net of tax      (57.4) (57.4)
                       Deferred income tax provision (benefit)    47.2  57.8  105.0 
                      Other operating items:             
                       Net Federal income tax receipts (payments)  32.0  (4.6)   27.4 
                       Net change in insurance and reinsurance balances receivable    (6.0) 57.5  51.5 
                       Net change in reinsurance recoverable on paid and unpaid losses    (3.6) 639.8  636.2 
                       Net change in deferred acquisition costs  (.3) (.4) 12.0  11.3 
                       Net change in loss and LAE reserves and reserves for structured contracts    14.5  (1,161.6) (1,147.1)
                       Net change in unearned insurance and reinsurance premiums    6.0  (111.0) (105.0)
                       Net change in other assets and liabilities, net  43.0  (61.5) (129.9) (148.4)


                      Net cash flows (used for) provided from operating activities  3.6  57.6  (569.7) (508.5)


                      Cash flows from investing activities:             
                      Net decrease (increase) in short-term investments  4.5  (460.9) 700.4  244.0 
                      Sales of fixed maturity investments    69.6  17,220.9  17,290.5 
                      Maturities of fixed maturity investments      1,372.0  1,372.0 
                      Sales of common equity securities and other investments      160.1  160.1 
                      Sales of consolidated and unconsolidated affiliates, net of cash sold      25.0  25.0 
                      Purchases of fixed maturity investments    (93.1) (18,155.1) (18,248.2)
                      Purchases of common equity securities and other investments  (.2)   (354.2) (354.4)
                      Net change in unsettled investment purchases and sales    302.0  (273.9) 28.1 
                      Net dispositions (acquisitions) of property and equipment    (.1) 43.5  43.4 


                      Net cash flows provided from (used for) investing activities  4.3  (182.5) 738.7  560.5 


                      Cash flows from financing activities:             
                      Proceeds from issuance of Common Shares  1.5      1.5 
                      Proceeds from issuance of debt      693.4  693.4 
                      Repayments of debt      (739.9) (739.9)
                      Dividends paid on mandatorily redeemable preferred stock of subsidiaries    (2.0) (28.3) (30.3)
                      Dividends paid on Common Shares  (8.3)     (8.3)
                      Intercompany dividends and distributions    112.6  (112.6)  


                      Net cash (used for) provided from financing activities  (6.8) 110.6  (187.4) (83.6)


                      Net (decrease) increase in cash during period  1.1  (14.3) (18.4) (31.6)
                      Cash balances at beginning of period  (.8) 41.4  80.9  121.5 


                      Cash balances at end of period $.3 $27.1 $62.5 $89.9 


                      MANAGEMENT'S RESPONSIBILITY FOR FINANCIAL STATEMENTS

                              Management is responsible for the preparation and fair presentation of the financial statements included in this report. The financial statements have been prepared in conformity with GAAP in the United States. The preparation of financial statements in conformity with GAAP requires management to make estimates and assumptions that affect the reported amounts of assets and liabilities as of the date of the financial statements and the reported amounts of revenues and expenses during the reporting period. Actual results could differ from those estimates.

                              The Audit Committee of the Board, which is comprised entirely of independent, qualified directors, is responsible for the oversight of our accounting policies, financial reporting and internal control including the appointment and compensation of our independent registered public accounting firm. The Audit Committee meets periodically with management, our independent registered public accounting firm and our internal auditors to ensure they are carrying out their responsibilities. The Audit Committee is also responsible for performing an oversight role by reviewing our financial reports. Our independent registered public accounting firm and internal auditors have full and unlimited access to the Audit Committee, with or without management present, to discuss the adequacy of internal control over financial reporting and any other matters which they believe should be brought to their attention.


                      MANAGEMENT'S ANNUAL REPORT ON INTERNAL CONTROL OVER FINANCIAL REPORTING

                              Management is responsible for establishing and maintaining adequate internal control over financial reporting as defined in Rules 13a-15(f) and 15d-15(f) under the Securities Exchange Act of 1934. There are inherent limitations in the effectiveness of any internal control over financial reporting, including the possibility of human error and the circumvention or overriding of internal control. Accordingly, even effective internal control over financial reporting can provide only reasonable assurance with respect to financial statement preparation. Further, an effective internal control environment as of a point in time may become inadequate in the future because of changes in conditions, or deterioration in the degree of compliance with the policies and procedures.

                              We assessed the effectiveness of White Mountains' internal control over financial reporting as of December 31, 2004. Our assessment did not include an assessment of the internal control over financial reporting for certain recent acquisitions. These acquisitions were Sirius, the Sierra group, Tryg-Baltica and Atlantic Specialty which represent 17.0%, 2.4%, .9% and ..5% of White Mountains' total assets as of December 31, 2004, respectively, and 11.3%, .5%, .6%, and 6.1%, respectively, of White Mountains' total revenue for the year ended December 31, 2004.2007. In making our assessment, we used the criteria set forth by the Committee of Sponsoring Organizations of the Treadway Commission (COSO) in Internal Control-Integrated Framework. Based on this assessment, we have concluded that White Mountains maintained effective internal control over financial reporting as of December 31, 2004.2007.

                              PricewaterhouseCoopers LLP, the Company's independent registered public accounting firm, has audited management's assessment of the effectiveness of White Mountains' internal control over financial reporting as of December 31, 20042007 as stated in their report which appears on page F-72.

                      March 1, 2005F-67.

                      /s/ RAYMOND BARRETTE
                      February 28, 2008
                       /s/ DAVID T. FOY

                      Raymond Barrette
                      Director, President/s/  
                      RAYMOND BARRETTE      
                      Chairman and CEO
                      (Principal Executive Officer)


                      David


                      /s/  
                      DAVID T. Foy
                      FOY      

                      Executive Vice President and CFO
                      (Principal Financial Officer)


                      REPORT OF INDEPENDENT REGISTERED PUBLIC ACCOUNTING FIRMReport of Independent Registered Public Accounting Firm

                      To the Board of Directors and Shareholders of White Mountains Insurance Group, Ltd.:

                              We have completed an integrated audit of White Mountains Insurance Group, Ltd.'s 2004 consolidated financial statements and of its internal control over financial reporting as of December 31, 2004 and audits of its 2003 and 2002 consolidated financial statements in accordance with the standards of the Public Company Accounting Oversight Board (United States). Our opinions, based on our audits, are presented below.

                      Consolidated financial statements and financial statement schedules

                              In our opinion, the consolidated financial statements listed in the accompanying index present fairly, in all material respects, the financial position of White Mountains Insurance Group, Ltd. and its subsidiaries at December 31, 20042007 and 2003,2006, and the results of their operations and their cash flows for each of the three years in the period ended December 31, 20042007 in conformity with accounting principles generally accepted in the United States of America. In addition, in our opinion, the financial statement schedules listed in the accompanying index presentpresents fairly, in all material respects, the information set forth therein when read in conjunction with the related consolidated financial statements. TheseAlso in our opinion, the Company maintained, in all material respects, effective internal control over financial statements and financial statement schedules arereporting as of December 31, 2007, based on criteria established in Internal Control—Integrated Framework issued by the responsibilityCommittee of Sponsoring Organizations of the Treadway Commission (COSO). The Company's management. Our responsibilitymanagement is to express an opinion onresponsible for these financial statements and financial statement schedules, for maintaining effective internal control over financial reporting and for its assessment of the effectiveness of internal control over financial reporting, included in the accompanying Management's Annual Report on Internal Control Over Financial Reporting. Our responsibility is to express opinions on these financial statements, on the financial statement schedules, and on the Company's internal control over financial reporting based on our integrated audits. We conducted our audits of these statements in accordance with the standards of the Public Company Accounting Oversight Board (United States). Those standards require that we plan and perform the auditaudits to obtain reasonable assurance about whether the financial statements are free of material misstatement. An auditmisstatement and whether effective internal control over financial reporting was maintained in all material respects. Our audits of the financial statements includesincluded examining, on a test basis, evidence supporting the amounts and disclosures in the financial statements, assessing the accounting principles used and significant estimates made by management, and evaluating the overall financial statement presentation. Our audit of internal control over financial reporting included obtaining an understanding of internal control over financial reporting, assessing the risk that a material weakness exists, and testing and evaluating the design and operating effectiveness of internal control based on the assessed risk. Our audits also included performing such other procedures as we considered necessary in the circumstances. We believe that our audits provide a reasonable basis for our opinion.opinions.

                      Internal control over financial reporting

                              Also, in our opinion, management's assessment, appearing under Item 9A and included in Management's Annual Report on Internal Control Over Financial Reporting appearing on page F-71, that the Company maintained effective internal control over financial reporting as of December 31, 2004 based on criteria established inInternal Control—Integrated Framework issued by the Committee of Sponsoring Organizations of the Treadway Commission (COSO), is fairly stated, in all material respects, based on those criteria. Furthermore, in our opinion, the Company maintained, in all material respects, effective internal control over financial reporting as of December 31, 2004, based on criteria established inInternal Control—Integrated Framework issued by the COSO. The Company's management is responsible for maintaining effective internal control over financial reporting and for its assessment of the effectiveness of internal control over financial reporting. Our responsibility is to express opinions on management's assessment and on the effectiveness of the Company's internal control over financial reporting based on our audit. We conducted our audit of internal control over financial reporting in accordance with the standards of the Public Company Accounting Oversight Board (United States). Those standards require that we plan and perform the audit to obtain reasonable assurance about whether effective internal control over financial reporting was maintained in all material respects. An audit of internal control over financial reporting includes obtaining an understanding of internal control over financial reporting, evaluating management's assessment, testing and evaluating the design and operating effectiveness of internal control, and performing such other procedures as we consider necessary in the circumstances. We believe that our audit provides a reasonable basis for our opinions.


                              A company's internal control over financial reporting is a process designed to provide reasonable assurance regarding the reliability of financial reporting and the preparation of financial statements for external purposes in accordance with generally accepted accounting principles. A company's internal control over financial reporting includes those policies and procedures that (i) pertain to the maintenance of records that, in reasonable detail, accurately and fairly reflect the transactions and dispositions of the assets of the company; (ii) provide reasonable assurance that transactions are recorded as necessary to permit preparation of financial statements in accordance with generally accepted accounting principles, and that receipts and expenditures of the company are being made only in accordance with authorizations of management and directors of the company; and (iii) provide reasonable assurance regarding prevention or timely detection of unauthorized acquisition, use, or disposition of the company's assets that could have a material effect on the financial statements.

                              Because of its inherent limitations, internal control over financial reporting may not prevent or detect misstatements. Also, projections of any evaluation of effectiveness to future periods are subject to the risk that controls may become inadequate because of changes in conditions, or that the degree of compliance with the policies or procedures may deteriorate.

                              As described in Management's Annual Report on Internal Control Over Financial Reporting, management has excluded Sirius, Sierra group, Tryg-Baltica and Atlantic Specialty from its assessment of internal control over financial reporting as of December 31, 2004 because they were acquired by the Company in purchase business combinations during 2004. As a result, we have also excluded Sirius, Sierra group, Tryg-Baltica and Atlantic Specialty from our audit of internal control over financial reporting. Sirius, Sierra group, Tryg-Baltica and Atlantic Specialty are wholly-owned subsidiaries whose total assets and total revenues represent 17.0%, 2.4%, .9%, .5%, and 11.3%, .5%, .6%, 6.1%, respectively, of the related consolidated financial statement amounts as of and for the year ended December 31, 2004.

                      /s/ PricewaterhouseCoopers LLP


                      Boston, Massachusetts
                      March 1, 2005


                      /s/ PricewaterhouseCoopers
                      New York, New York
                      February 29, 2008


                      SELECTED QUARTERLY FINANCIAL DATA

                      (Unaudited)

                              Selected quarterly financial data for 20042007 and 20032006 is shown in the following table. The quarterly financial data includes, in the opinion of management, all recurring adjustments necessary for a fair presentation of the results of operations for the interim periods. Certain reclassifications have been made to prior quarterly results to conform with the 2004 annual presentation.

                       
                       2004 Three Months Ended
                       2003 Three Months Ended
                       
                       
                       Dec. 31
                       Sept. 30
                       June 30
                       Mar. 31
                       Dec. 31
                       Sept. 30
                       June 30
                       Mar. 31
                       
                       
                       Millions, except per share amounts

                       
                      Revenues $1,248.1 $1,163.6 $1,119.1 $1,022.2 $951.3 $911.6 $961.4 $969.5 
                      Expenses  1,132.4  1,241.7  1,022.5  908.6  885.5  875.2  837.3  823.5 


                      Pretax earnings (loss)  115.7  (78.1) 96.6  113.6  65.8  36.4  124.1  146.0 
                      Tax benefit (provision)  18.7(1) 23.6  (44.4) (44.9) (22.4) (14.4) (44.7) (46.1)
                      Equity in earnings of unconsolidated affiliates  10.6  3.7  4.9  18.2  15.1  13.6  15.8  12.9 
                      Accretion and dividends on preferred stock of subsidiaries              (10.8) (10.7)


                      Net income (loss) before accounting changes and extraordinary items $145.0 $(50.8)$57.1 $86.9 $58.5 $35.6 $84.4 $102.1 


                      Net income (loss) before accounting changes and extraordinary items per share:                         
                       Basic $13.48 $(4.72)$6.30 $9.64 $6.50 $3.96 $5.38 $10.94 
                       Diluted  13.48  (4.72) 5.56  8.52  5.75  3.50  4.77  9.92 


                      Fully converted tangible book value per share $342.52 $319.98 $312.82 $309.39 $291.27 $282.24 $280.88 $266.96 


                      (1)
                      Includes $38.8 million related to foreign tax credits that resulted from an extension to the carryforward period under the Jobs Creation Act of 2004.
                       
                       2007 Three Months Ended
                       2006 Three Months Ended
                       
                      Millions, except per share amounts

                       
                       Dec. 31
                       Sept. 30
                       June 30
                       Mar. 31
                       Dec. 31
                       Sept. 30
                       June 30
                       Mar. 31
                       
                      Revenues $1,201.7 $1,155.4 $1,210.6 $1,166.1 $1,349.3 $1,186.2 $1,200.9 $1,057.8 
                      Expenses  1,019.8  963.9  1,034.4  1,034.2  1,036.4  957.7  1,129.3  941.0 


                      Pre-tax earnings (loss)  181.9  191.5  176.2  131.9  312.9  228.5  71.6  116.8 
                      Tax benefit (provision)  (59.2) (64.3) (55.8) (31.2) (32.0) (69.3) 29.3  (26.9)
                      Minority interest in consolidated subsidiaries  (23.6) (24.0) (26.4) (19.0) (10.5) (2.7) .1  (2.9)
                      Equity in earnings of unconsolidated affiliates  2.1  8.2  8.6  10.5  7.5  5.6  14.8  9.0 


                      Income (loss) before extraordinary items $101.2 $111.4 $102.6 $92.2 $277.9 $162.1 $115.8 $96.0 


                      Income (loss) before extraordinary items per share:


                       Basic $9.56 $10.33 $9.51 $8.56 $60.52 $15.05 $10.75 $8.92 
                       Diluted  9.55  10.32  9.49  8.54  60.33  15.01  10.72  8.89 


                       Fully diluted tangible book value per share $444.47 $435.45 $421.83 $414.61 $406.0 $373.33 $355.16 $352.01 


                      SCHEDULE I


                      WHITE MOUNTAINS INSURANCE GROUP, LTD.


                      SUMMARY OF INVESTMENTS—OTHER THAN
                      INVESTMENTS IN RELATED PARTIES

                      At December 31, 20042007

                      Millions

                      Millions

                       Cost
                       Fair
                      Value

                      Millions

                       Cost
                       Carrying
                      Value

                       Fair
                      Value

                      Fixed maturities:    
                      Fixed maturities(1):Fixed maturities(1):      
                      Bonds:    Bonds:      
                       U.S. Government and government agencies and authorities(1) $2,444.7 $2,475.5 U.S. Government and government agencies and authorities $1,556.5 $1,585.3 $1,586.7
                       Corporate bonds and asset-backed securities 4,210.7 4,349.8 Corporate bonds and asset-backed securities(2) 4,978.4 5,029.3 5,029.3
                       States, municipalities and political subdivisions 91.3 92.7 States, municipalities and political subdivisions 11.9 12.4 12.4
                       Convertibles and bonds with warrants attached 84.2 94.3 Convertibles and bonds with warrants attached 484.3 490.6 490.6
                       Foreign governments 780.3 794.2 Foreign governments 792.3 876.3 876.3
                       Redeemable preferred stocks 72.9 93.5 Redeemable preferred stocks 159.5 173.8 173.8


                      Total fixed maturities 7,684.1 7,900.0Total fixed maturities 7,982.9 8,167.7 8,169.1


                      Short-term investmentsShort-term investments 1,058.2 1,058.2Short-term investments 1,327.3 1,327.3 1,327.3

                      Common equity securities:

                      Common equity securities:


                      Common equity securities:


                       Banks, trust and insurance companies 291.2 400.2 Banks, trust and insurance companies 228.6 238.0 238.0
                       Public utilities 138.1 180.4 Public utilities 44.0 61.3 61.3
                       Industrial, miscellaneous and other 346.6 463.3 Industrial, miscellaneous and other 1,061.3 1,251.4 1,251.4


                      Total common equity securities 775.9 1,043.9Total common equity securities 1,333.9 1,550.7 1,550.7
                      Other investmentsOther investments 442.7 527.4
                      Other investments


                      539.2


                      603.3


                      603.3


                      Total investments $9,960.9 $10,529.5 Total investments $11,183.3 $11,649.0 $11,650.4


                      (1)
                      White Mountains' portfolio of fixed maturity investments held for general investment purposes are classified as available for sale and are reported at fair value at December 31, 2007. White Mountains' portfolio of fixed maturity investments held in the segregated trust account are classified at held to maturity and are reported at amortized cost.

                      (2)
                      Includes mortgage-backed securities issued by GNMA, FNMA and FHLMC.

                      Note—fair value was equal to carrying value at December 31, 2004.

                      FS-1


                      SCHEDULE II


                      WHITE MOUNTAINS INSURANCE GROUP, LTD.CONDENSED FINANCIAL INFORMATION OF THE REGISTRANT
                      (Registrant Only)


                      CONDENSED BALANCE SHEETS


                       December 31,

                       December 31,
                      Millions

                      Millions

                      Millions

                      2004
                       2003
                      2007
                       2006
                      Assets:Assets:    Assets:    
                      Common equity securities and other investments $246.8 $Fixed maturity investments, at fair value $19.0 $194.3
                      Short-term investments, at amortized cost 16.2 11.1Short-term investments, at amortized cost 5.2 85.6
                      Other assets 13.9 5.3Other assets 17.5 81.1
                      Investments in consolidated and unconsolidated affiliates 3,702.4 3,021.0Investments in consolidated and unconsolidated affiliates 4,974.5 4,486.2


                       Total assets $3,979.3 $3,037.4 Total assets $5,016.2 $4,847.2


                      Liabilities:Liabilities:    
                      Liabilities:


                      Long-term debt $ $Long-term debt $ $320.0
                      Accounts payable and other liabilities 95.4 58.2Accounts payable and other liabilities 302.8 71.9


                      Total liabilities 95.4 58.2 Total liabilities 302.8 391.9
                      Convertible preference shares  
                      Common shareholders' equityCommon shareholders' equity 3,883.9 2,979.2Common shareholders' equity 4,713.4 4,455.3


                       Total liabilities, convertible preference shares and common shareholders' equity $3,979.3 $3,037.4 Total liabilities and common shareholders' equity $5,016.2 $4,847.2


                      CONDENSED STATEMENTS OF INCOME AND COMPREHENSIVE INCOME

                       
                       Year Ended December 31,
                       
                      Millions

                       
                       2004
                       2003
                       2002
                       
                      Revenues (including realized gains and losses) $3.7 $(1.4)$84.7 
                      Expenses  65.3  70.7  24.9 


                      Pretax income (loss)  (61.6) (72.1) 59.8 
                      Income tax provision  9.3  (.1)  


                      Net income (loss)  (52.3) (72.2) 59.8 
                      Earnings (losses) from consolidated affiliates  430.3  352.8  672.0 
                      Cumulative effect of changes in accounting principles      16.3 
                      Excess of fair value of acquired net assets over cost  40.7     


                      Consolidated net income (loss)  418.7  280.6  748.1 
                      Other comprehensive net income (loss) items, after-tax  176.5  79.0  202.3 


                      Consolidated comprehensive net income (loss) $595.2 $359.6 $950.4 


                      Computation of net income (loss) available to common shareholders:          
                      Consolidated net income (loss) $418.7 $280.6 $748.1 
                      Redemption value adjustment—Convertible Preference Shares    (49.5) (19.0)
                      Dividends on Convertible Preference Shares      (.4)


                      Net income (loss) available to common shareholders $418.7 $231.1 $728.7 


                       Year Ended December 31,
                       
                      Millions

                       
                       2007
                       2006
                       2005
                       
                      Revenues (including realized gains and losses) $.2 $22.9 $47.1 
                      Expenses  41.7  41.1  1.1 


                      Pre-tax income (loss)  (41.5) (18.2) 46.0 
                      Income tax benefit (provision)  1.6  (2.6) (.6)


                      Net income (loss)  (39.9) (20.8) 45.4 
                      Earnings from consolidated affiliates  447.3  694.0  244.7 


                      Consolidated net income  407.4  673.2  290.1 
                      Other comprehensive net income items, after-tax  71.9  32.9  (254.1)


                      Consolidated comprehensive net income $479.3 $706.1 $36.0 


                      Computation of net income available to common shareholders:          
                      Net income available to common shareholders $407.4 $673.2 $290.1 


                      FS-2


                      SCHEDULE II
                      (continued)

                      WHITE MOUNTAINS INSURANCE GROUP, LTD.
                      (Registrant Only)

                      CONDENSED STATEMENTS OF CASH FLOWS

                       
                       Year Ended December 31,
                       
                      Millions

                       
                       2004
                       2003
                       2002
                       
                      Net income (loss) $418.7 $280.6 $748.1 
                      Reconciliation of net income to net cash from operating activities:          
                       Excess of fair value of acquired net assets over cost  (40.7)    
                       Cumulative effect of change in accounting principles      (16.3)
                       Net realized (gains) losses on sales of investments  (1.9) 1.1  (57.9)
                       Undistributed current earnings from consolidated subsidiaries  (420.1) (352.8) (648.7)
                       Net Federal income tax receipts    32.0   
                       Net change in other assets and other liabilities  (7.8) 42.7  17.7 


                      Net cash (used for) provided from operating activities  (51.8) 3.6  42.9 


                      Cash flows from investing activities:          
                       Net (increase) decrease in short-term investments  (5.1) 4.5  39.0 
                       Purchases of investment securities  (242.1) (.2) (.2)
                       Contributions to subsidiaries      (300.0)


                      Net cash (used for) provided from investing activities  (247.2) 4.3  (261.2)


                      Cash flows from financing activities:          
                      Proceeds from issuances of Common Shares and Convertible Preference Shares  307.8  1.5  226.4 
                      Dividends paid on Common Shares  (9.1) (8.3) (8.3)
                      Dividends paid on Convertible Preference Shares      (.4)


                      Net cash provided from (used for) financing activities  298.7  (6.8) 217.7 


                      Net change in cash during year  (.3) 1.1  (.6)
                      Cash balance at beginning of year  .3  (.8) (.2)


                      Cash balance at end of year $ $.3 $(.8)


                       Year Ended December 31,
                       
                      Millions

                       
                       2007
                       2006
                       2005
                       
                      Net income $407.4 $673.2 $290.1 
                      Charges (credits) to reconcile net income to net cash from operations:          
                       Net realized gains on sales of investments  (8.0) (8.6) (8.8)
                       Undistributed current earnings from subsidiaries  (447.2) (694.0) (209.7)
                       Dividends received from subsidiaries  2.7     
                       Net Federal income tax receipts  6.8    11.1 
                       Net change in other assets and other liabilities  (5.0) 15.4  (64.0)


                      Net cash (used for) provided from operations  (43.3) (14.0) 18.7 


                      Cash flows from investing activities:


                       Net decrease (increase) in short-term investments  80.4  (85.2) 15.8 
                       Purchases of investment securities  (54.9) (243.2) (99.3)
                       Sales and maturities of investment securities  312.9  158.8  149.9 
                       Issuance of debt from (to) subsidiaries(1)  315.0  (448.7)  
                       Repayment of debt (to) from subsidiaries(1)  (50.0) 477.3   
                       Contributions to subsidiaries(1)    (87.5)  
                       Net change in unsettled investment purchases and sales  (8.1) 8.1   


                      Net cash provided from (used for) investing activities  595.3  (220.4) 66.4 


                      Cash flows from financing activities:


                       Issuance of debt    460.0   
                       Repayment of debt  (320.0) (140.0)  
                       Proceeds from issuances of common shares  2.2  .6  1.1 
                       Repurchases and retirement of common shares  (148.0)    
                       Dividends paid on common shares  (86.2) (86.2) (86.2)


                      Net cash (used for) provided from financing activities  (552.0) 234.4  (85.1)


                      Net decrease in cash during the year       
                      Cash balance at beginning of year       


                      Cash balance at end of year $ $ $ 


                      (1)
                      Contributions and loans to/from subsidiaries, which were previously reported as a financing activity, have been classified as an investing activity beginning in 2007, with conforming changes to 2006.

                      FS-3


                      SCHEDULE III


                      WHITE MOUNTAINS INSURANCE GROUP, LTD.


                      SUPPLEMENTARY INSURANCE INFORMATION

                      (Millions)

                      Column A
                      Column A
                       Column B
                       Column C
                       Column D
                       Column E
                       Column F
                       Column G
                       Column H
                       Column I
                       Column J
                       Column K
                      Column A

                       Column B
                       Column C
                       Column D
                       Column E
                       Column F
                       Column G
                       Column H
                       Column I
                       Column J
                       Column K
                      Segment

                      Segment

                       Deferred acquisition costs
                       Future policy benefits, losses, claims and loss expenses
                       Unearned premiums
                       Other policy claims and benefits payable
                       Premiums earned
                       Net investment income(1)
                       Benefits, claims, losses, and settlement expenses
                       Amortization of deferred policy acquisition costs
                       Other operating expenses
                       Premiums written
                      Segment

                       Deferred
                      acquisition
                      costs

                       Future policy
                      benefits,
                      losses, claims
                      and loss
                      expenses

                       Unearned
                      premiums

                       Other policy
                      claims and
                      benefits
                      payable

                       Premiums
                      earned

                       Net
                      investment
                      income(1)

                       Benefits,
                      claims,
                      losses, and
                      settlement
                      expenses

                       Amortization
                      of deferred
                      policy
                      acquisition
                      costs

                       Other
                      operating
                      expenses

                       Premiums
                      written

                      Years ended:Years ended:                    Years ended:                    

                      December 31, 2007:

                      December 31, 2007:


                      December 31, 2004:                    OneBeacon $200.0 $4,480.3 $1,005.9 $ $1,873.6 $203.3 $1,089.8 $318.9 $329.4 $1,864.4
                       OneBeacon $200.2 $5,475.5 $1,066.8 $ $2,378.5 $221.4 $1,545.2 $442.3 $369.2 $2,459.1WM Re 86.5 3,252.1 396.0  1,146.8 198.1 701.0 255.0 118.5 1,095.7
                       WM Re 99.1 4,170.3 615.5  1,265.5 98.5 918.9 271.8 122.9 1,246.3Esurance 39.5 285.2 203.3  763.3 29.0 622.4 202.7 58.4 798.5
                       Esurance 8.9 63.0 57.2  176.5 3.5 122.4 29.4 27.7 199.4Other insurance operations  44.5    3.5 (6.8)  2.7 

                      December 31, 2006:

                      December 31, 2006:


                       Other insurance operations  (310.3)    37.5 4.6  1.5 OneBeacon $183.8 $4,837.7 $985.2 $ $1,944.0 $176.1 $1,180.4 $332.2 $360.1 $1,957.6
                      December 31, 2003:                    WM Re 99.8 3,708.8 431.6  1,241.2 182.7 884.6 287.3 94.7 1,290.0
                       OneBeacon $163.3 $6,241.2 $1,035.1 $ $2,160.3 $223.7 $1,475.6 $394.2 $258.7 $1,972.5Esurance 36.6 167.5 168.1  527.5 18.4 383.9 135.3 48.8 595.9
                       WM Re 67.4 1,777.2 326.3  845.8 50.4 557.6 198.0 57.8 885.7Other insurance operations  63.2    1.0 3.9  1.8 

                      December 31, 2005:

                      December 31, 2005:


                       Esurance 1.9 39.1 33.9  99.9 1.3 81.0 18.8 20.4 116.4OneBeacon $180.1 $5,395.9 $960.3 $ $2,118.4 $238.1 $1,401.5 $390.7 $278.9 $2,121.1
                       Other insurance operations 1.0 (329.3) 14.1   31.7 15.5 23.9 4.0 10.2 33.1WM Re 87.2 4,680.3 521.9  1,371.6 148.9 1,237.9 279.6 107.0 1,304.1
                      December 31, 2002:                    Esurance 21.1 94.0 99.8  306.8 9.8 206.2 90.8 37.2 349.1
                       OneBeacon $188.4 $7,626.6 $1,265.1 $ $2,870.9 $314.0 $2,131.3 $629.6 $329.2 $2,522.8Other insurance operations  61.0   1.8 29.4 12.6 .1 1.6 1.8
                       WM Re 55.8 1,693.9 219.8  635.0 51.5 442.2 161.2 41.0 688.2
                       Esurance  15.5 17.4  40.8 1.2 36.6 9.7 22.4 53.0
                       Other insurance operations 0.7 (460.7) 12.1  29.7 (0.7) 28.1 3.8 9.1 29.5

                      (1)
                      The amounts shown exclude net investment income (expense) relating to non-insurance operations of $29.6$99.1 million, $12.7$48.0 million and $(5.7)$65.3 million for the twelve months ended December 31, 2004, 20032007, 2006 and 2002,2005, respectively.

                      FS-4


                      SCHEDULE IV

                      WHITE MOUNTAINS INSURANCE GROUP, LTD.
                      REINSURANCE
                      (Millions)

                      Column A

                       Column B
                       Column C
                       Column D
                       Column E
                       Column F
                       
                      Premiums earned
                      (Millions)

                       Gross
                      amount

                       Ceded to
                      other
                      companies

                       Assumed
                      from other
                      companies

                       Net
                      amount

                       Percentage
                      of amount
                      assumed to net

                       
                      Years ended:               

                      December 31, 2004:


                       OneBeacon $2,253.9 $(206.5)$331.1 $2,378.5 13.9%
                       WM Re  310.4  (670.3) 1,625.4  1,265.5 128.4%
                       Esurance  153.6  (1.5) 24.4  176.5 13.8%
                       Other insurance operations    (.1) .1   %

                      December 31, 2003:


                       OneBeacon $2,234.2 $(443.0)$369.1 $2,160.3 17.1%
                       WM Re  6.5  (462.0) 1,301.3  845.8 153.9%
                       Esurance  69.2    30.7  99.9 30.7%
                       Other insurance operations  39.2  (7.6) .1  31.7 .3%

                      December 31, 2002:


                       OneBeacon $3,181.8 $(815.5)$504.6 $2,870.9 17.6%
                       WM Re  7.1  (294.5) 922.4  635.0 145.3%
                       Esurance  9.9    30.9  40.8 75.7%
                       Other insurance operations  34.8  (5.1)   29.7 %
                      Column A


                       Column F
                       
                       Column B
                       Column C
                       Column D
                        
                       
                       Column E
                       Percentage of amount assumed to net
                       
                      Premiums earned

                       Gross amount
                       Ceded to other companies
                       Assumed from other companies
                       
                       Net amount
                       
                      Years ended:               

                      December 31, 2007:


                       OneBeacon $2,016.6 $(198.7)$55.7 $1,873.6 3.0%
                       WM Re  108.2  (196.6) 1,235.2  1,146.8 107.7%
                       Esurance  736.8  (4.0) 30.5  763.3 4.0%
                       Other insurance operations         %

                      December 31, 2006:


                       OneBeacon $2,007.6 $(129.0)$65.4 $1,944.0 3.4%
                       WM Re  240.2  (447.8) 1,448.8  1,241.2 116.7%
                       Esurance  495.3  (3.5) 35.7  527.5 6.8%
                       Other insurance operations         %

                      December 31, 2005:


                       OneBeacon $2,175.8 $(160.1)$102.7 $2,118.4 4.8%
                       WM Re  347.6  (760.6) 1,784.6  1,371.6 130.1%
                       Esurance  280.1  (2.4) 29.1  306.8 9.5%
                       Other insurance operations    (.1) 1.9  1.8 105.6%

                      FS-5


                      SCHEDULE V

                      WHITE MOUNTAINS INSURANCE GROUP, LTD.
                      VALUATION AND QUALIFYING ACCOUNTS

                      Column A

                      Column A

                       Column B

                       Column C

                       Column D

                       Column E

                      Column A

                       Column B
                       Column C
                       Column D
                       Column E


                       Additions (subtractions)


                       Additions (subtractions)
                        
                        
                      Millions

                      Millions

                       Balance at
                      beginning
                      of period

                       Charged to
                      costs and
                      expenses

                       Charged
                      to other
                      accounts

                       Deductions
                      described(1)

                       Balance
                      at end
                      of period

                      Millions

                       Balance at beginning of period
                       Charged to costs and expenses
                       Charged to other accounts
                       Deductions described(1)
                       Balance at end of period
                      Years ended:Years ended:          Years ended:          

                      December 31, 2004:


                      December 31, 2007:

                      December 31, 2007:


                      Reinsurance recoverable on paid losses:Reinsurance recoverable on paid losses:          
                      Reinsurance recoverable on paid losses:          Allowance for reinsurance balances $37.0 $(1.9)$ $.3 $35.4
                      Property and casualty insurance and reinsurance premiums receivable:Property and casualty insurance and reinsurance premiums receivable:          
                       Allowance for reinsurance balances $15.9 $5.7 $3.2 $15.3(2)$40.1Allowance for uncollectible accounts 22.9 (1.6)  3.2 24.5

                      December 31, 2006:

                      December 31, 2006:


                      Reinsurance recoverable on paid losses:Reinsurance recoverable on paid losses:          
                      Property and casualty insurance and reinsurance premiums receivable:          Allowance for reinsurance balances $41.6 $(16.9)$ $12.3 $37.0
                      Property and casualty insurance and reinsurance premiums receivable:Property and casualty insurance and reinsurance premiums receivable:          
                       Allowance for uncollectible accounts 23.0 (12.1)  12.9(2) 23.8Allowance for uncollectible accounts 20.7 (4.3)  6.5 22.9

                      December 31, 2003:


                      December 31, 2005:

                      December 31, 2005:


                      Reinsurance recoverable on paid losses:Reinsurance recoverable on paid losses:          
                      Reinsurance recoverable on paid losses:          Allowance for reinsurance balances $36.9 $5.0 $(4.6)$4.3 $41.6
                      Property and casualty insurance and reinsurance premiums receivable:Property and casualty insurance and reinsurance premiums receivable:          
                       Allowance for reinsurance balances $18.5 $ $ $(2.6)$15.9Allowance for uncollectible accounts 27.0 1.9 (8.8) .6 20.7
                      Property and casualty insurance and reinsurance premiums receivable:          
                       Allowance for uncollectible accounts 69.1 (26.0)  (20.1) 23.0

                      December 31, 2002:


                      Reinsurance recoverable on paid losses:          
                       Allowance for reinsurance balances $25.2 $(6.1)$ $(.6)$18.5
                      Property and casualty insurance and reinsurance premiums receivable:          
                       Allowance for uncollectible accounts 96.9 (22.0)  (5.8) 69.1

                      (1)
                      Represents net reinstatements (charge-offs) of balances receivables.

                      (2)
                      Includes $17.8 million and $2.2 million of reinsurance recoverable on unpaid losses and property and casualty insurance and reinsurance premiums receivable, respectively, acquired from Sirius.

                      FS-6


                      SCHEDULE VI

                      WHITE MOUNTAINS INSURANCE GROUP, LTD.
                      SUPPLEMENTAL INFORMATION FOR PROPERTY AND CASUALTY INSURANCE UNDERWRITERS
                      (Millions)

                      Column A
                      Column A
                       Column B
                       Column C
                       Column D
                       Column E
                       Column F
                       Column G
                       Column H
                       Column I
                       Column J
                       Column K


                       Claims and Claims Adjustment Expenses Incurred Related to


                       Reserves for
                      Unpaid Claims
                      and Claims
                      Adjustment
                      Expenses


                       Amortization
                      of deferred
                      policy
                      acquisition
                      costs


                       Discount, if
                      any,
                      deducted in
                      Column C


                      Claims and Claims Adjustment Expenses Incurred Related to


                       Claims and Claims Adjustment Expenses Incurred Related to


                      Affiliation with registrant

                      Affiliation with registrant

                       Deferred
                      acquisition
                      costs

                       Unearned
                      Premiums

                       Earned
                      Premiums

                       Net
                      investment
                      income

                       Paid Claims
                      and Claims
                      Adjustment
                      Expenses

                       (1)
                      Current
                      Year

                       Amortization
                      of deferred
                      policy
                      acquisition
                      costs

                       Deferred acquisition costs
                       Reserves for Unpaid Claims and Claims Adjustment Expenses
                       Discount,
                      if any, deducted in Column C

                       Unearned Premiums
                       Earned Premiums
                       Net investment income
                       (1) Current Year
                       (2) Prior Year
                       Amortization of deferred policy acquisition costs
                       Paid Claims and Claims Adjustment Expenses
                       Premiums written
                      OneBeacon:OneBeacon:                                      
                      2004 $200.2 $5,475.5 $259.4(2)$1,066.8 $2,378.5 $221.4 $1,444.9 $100.3 $442.3 $2,085.9
                      2003 163.3 6,241.2 294.5(2) 1,035.1 2,160.3 223.7 1,337.2 138.4 394.2 2,284.5 1,972.5
                      2002 188.4 7,626.6 299.5(2) 1,265.1 2,870.9 314.0 2,064.8 57.4 629.6 2,870.8 2,522.8
                      2007 $200.0 $4,480.3 $395.4(2)$1,005.9 $1,873.6 $203.3 $1,138.1 $(48.3)$318.9 $1,250.1 $1,864.4
                      2006 183.8 4,837.7 461.2(2) 985.2 1,944.0 176.1 1,169.0 11.3 332.2 1,553.0 1,957.6
                      2005 180.1 5,395.9 531.8(2) 960.3 2,118.4 238.1 1,306.5 95.0 390.7 1,839.8 2,121.1

                      WM Re:

                      WM Re:


                      2004 $99.1 $4,170.3 $58.1(3)$615.5 $1,265.5 $98.5 $903.8 $15.1 $271.8 $910.6 $1,246.3
                      2003 67.4 1,777.2  326.3 845.8 50.4 541.7 14.9 198.0 373.8 885.7
                      2002 55.8 1,693.9  219.8 635.0 51.5 440.8 10.5 161.2 341.7 688.2
                      2007 $86.5 $3,252.1 $34.7(3)$396.0 $1,146.8 $198.1 $692.0 $9.1 $255.0 $870.2 $1,095.7
                      2006 99.8 3,708.8 39.1(3) 431.6 1,241.2 182.7 666.6 218.0 287.2 1,070.9 1,290.0
                      2005 87.2 4,680.3 39.5(3) 521.9 1,371.6 148.9 1,186.8 51.0 279.6 1,229.7 1,304.1

                      Esurance:

                      Esurance:


                      2004 $8.9 $63.0  $57.2 $176.5 $3.5 $127.5 $(5.1)$29.4 $96.6 $199.4
                      2003 1.9 39.1  33.9 99.9 1.3 46.9 34.1 18.8 57.4 116.4
                      2002  15.5  17.4 40.8 1.2 36.6  9.7 25.0 53.0
                      2007 $39.5 $285.2 $ $203.3 $763.3 $29.0 $592.9 $29.6 $202.7 $506.1 $798.5
                      2006 36.6 167.5  168.1 527.5 18.4 380.9 3.0 135.3 309.6 595.9
                      2005 21.1 94.0  99.8 306.8 9.8 213.9 (7.7) 90.8 175.0 349.1

                      Other insurance operations:

                      Other insurance operations:


                      2004 $ $(310.3) 361.5(4)$ $ $37.5 $ $4.6 $ $(2.2)$
                      2003 1.0 (329.3) 413.1(4) 14.1 31.7 15.5 23.1 2.0 4.0 15.0 33.1
                      2002 0.7 (460.7) 481.0(4) 12.1 29.7 (0.7) 6.0 22.1 3.8 7.3 29.5

                      50%-or-less owned propertyand casualty investees:(1)


                      2004 $30.8 $162.8  $144.2 $217.8 $13.2 $144.7 $4.7 $60.0 $132.7 $227.3
                      2003 28.2 140.6  132.4 198.0 11.7 127.5 4.4 55.2 119.6 213.8
                      2002 24.5 126.7  112.0 167.0 11.5 113.2 7.8 47.6 106.1 178.7
                      2007 $ $44.5 $ $ $ $3.5 $(.2)$(6.8)$ $11.7 $
                      2006  63.2    1.0 3.9   4.1 
                      2005  61.1   1.8 29.4  12.6 .1 6.5 1.8
                      50%-or-less owned property and casualty investees:(1)                      
                      Delos(4):                      
                      2007 $3.6 $66.0 $ $19.5 $15.7 $2.2 $9.9 $ $.7 $5.8 $25.8
                      2006 .2 68.2  8.8 2.1 .4 1.3   2.1 .7
                      MSA(5):                      
                      2005 31.2 190.2  154.5 233.8 13.6 149.3 18.0 62.8 143.9 240.8

                      (1)
                      The amounts shown represent White Mountains' share of MSA, its 50% owned unconsolidated property and casualty insurance affiliate. Excludes White Mountains' share of Montpelier, its 21% owned unconsolidated property and casualty reinsurance affiliate whose information is available publicly.affiliates.

                      (2)
                      The amounts shown represent OneBeacon's discount on its long-term workers compensation loss and LAE reserves, as such liabilities constitute unpaid but settled claims under which the payment pattern and ultimate costs are fixed and determinable on an individual basis. OneBeacon discounts these reserves using a discount rate which is determined based on the facts and circumstances applicable at the time the claims are settled (4.7%(5.5%,5.3% and 5.0% at December 31, 2004, 20032007, 2006 and 2002)2005).
                      (3)
                      The amount shown excludes unamortized fair value adjustments to reserves of $10.1 million for unpaid claims and claims adjustment expenses made in purchase accounting as a result of White Mountains' purchase of Sirius during 2004.
                      (4)
                      The Also the amounts shown exclude unamortized fair value adjustments to reserves of $43.3 million, $48.6 million and $79.8 million for unpaid claims and claims adjustment expenses made in purchase accounting as a result of White Mountains' purchase of OneBeacon for the years ended December 31, 2004, 20032007, 2006 and 2002,2005, respectively.

                      (3)
                      The amount shown represents unamortized fair value adjustments to reserves for unpaid claims and claims adjustment expenses made in purchase accounting as a result of White Mountains' purchase of Sirius during 2004.

                      (4)
                      On August 3, 2006 White Mountains acquired an equity interest of approximately 18% in Delos. See Note 2.

                      (5)
                      On October 31, 2006 White Mountains restructured its investment in MSA. See Note 2.

                      FS-7


                      QuickLinks

                      SIGNATURES
                      WHITE MOUNTAINS INSURANCE GROUP, LTD. Index to Consolidated Financial Statements and Financial Statement Schedules
                      CONSOLIDATED BALANCE SHEETS
                      CONSOLIDATED STATEMENTS OF INCOME AND COMPREHENSIVE INCOME
                      CONSOLIDATED STATEMENTS OF COMMON SHAREHOLDERS' EQUITY
                      CONSOLIDATED STATEMENTS OF CASH FLOWS
                      NOTES TO CONSOLIDATED FINANCIAL STATEMENTS
                      MANAGEMENT'S RESPONSIBILITY FOR FINANCIAL STATEMENTS
                      MANAGEMENT'S ANNUAL REPORT ON INTERNAL CONTROL OVER FINANCIAL REPORTING
                      Report of Independent Registered Public Accounting Firm
                      SELECTED QUARTERLY FINANCIAL DATA (Unaudited)
                      SCHEDULE I
                      WHITE MOUNTAINS INSURANCE GROUP, LTD. SUMMARY OF INVESTMENTS—OTHER THAN INVESTMENTS IN RELATED PARTIES At December 31, 2007
                      SCHEDULE II
                      CONDENSED FINANCIAL INFORMATION OF THE REGISTRANT CONDENSED BALANCE SHEETS
                      CONDENSED STATEMENTS OF INCOME AND COMPREHENSIVE INCOME
                      CONDENSED STATEMENTS OF CASH FLOWS
                      SCHEDULE III
                      WHITE MOUNTAINS INSURANCE GROUP, LTD. SUPPLEMENTARY INSURANCE INFORMATION (Millions)