deferred policy acquisition and sales
inducement costs, recognition of front-end fee revenues for sales charges on pension products and services and certain market value adjustments to fee revenues.
| | | For the year ended December 31, | | For the year ended December 31, | ||||||||||||||||||
|---|---|---|---|---|---|---|---|---|---|---|---|---|---|---|---|---|---|---|---|---|---|---|
| | | 2004 | 2003 | 2002 | | 2006 | 2005 | 2004 | ||||||||||||||
| | | (in millions) | | (in millions) | ||||||||||||||||||
| Net realized/unrealized capital losses | $ | (104.8 | ) | $ | (63.2 | ) | $ | (374.1 | ) | |||||||||||||
| Net realized/unrealized capital gains (losses) | Net realized/unrealized capital gains (losses) | $ | 44.7 | $ | (11.2 | ) | $ | (104.8 | ) | |||||||||||||
| Certain market value adjustments to fee revenues | Certain market value adjustments to fee revenues | (8.0 | ) | (17.7 | ) | (31.8 | ) | Certain market value adjustments to fee revenues | (1.3 | ) | (12.1 | ) | (8.0 | ) | ||||||||
| Recognition of front-end fee revenues | Recognition of front-end fee revenues | (2.1 | ) | 4.6 | (14.0 | ) | Recognition of front-end fee revenues | 0.8 | 1.1 | (2.1 | ) | |||||||||||
| Net realized/unrealized capital losses, including recognition of front-end fee revenues and certain market value adjustments to fee revenues | (114.9 | ) | (76.3 | ) | (419.9 | ) | Net realized/unrealized capital gains (losses), including recognition of front-end fee revenues and certain market value adjustments to fee revenues | 44.2 | (22.2 | ) | (114.9 | ) | ||||||||||
| Amortization of deferred policy acquisition and sales inducement costs related to net realized capital gains (losses) | Amortization of deferred policy acquisition and sales inducement costs related to net realized capital gains (losses) | 6.2 | 5.1 | 35.4 | Amortization of deferred policy acquisition and sales inducement costs related to net realized capital gains (losses) | 5.4 | (0.7 | ) | 6.2 | |||||||||||||
| Capital (gains) losses distributed | (4.4 | ) | (3.3 | ) | 1.5 | |||||||||||||||||
| Capital gains distributed | Capital gains distributed | (11.8 | ) | (5.8 | ) | (4.4 | ) | |||||||||||||||
| Minority interest capital gains | Minority interest capital gains | (0.3 | ) | (0.1 | ) | — | Minority interest capital gains | (7.7 | ) | (2.5 | ) | (0.3 | ) | |||||||||
| Net realized/unrealized capital losses, including recognition of front-end fee revenues and certain market value adjustments to fee revenues, net of related amortization of deferred policy acquisition costs, capital gains distributed, and minority interest capital gains | (113.4 | ) | (74.6 | ) | (383.0 | ) | Net realized/unrealized capital gains (losses), including recognition of front-end fee revenues and certain market value adjustments to fee revenues, net of related amortization of deferred policy acquisition costs and sales inducement costs, capital gains distributed, and minority interest capital gains | 30.1 | (31.2 | ) | (113.4 | ) | ||||||||||
| Income tax effect | Income tax effect | 51.1 | 25.3 | 135.7 | Income tax effect | (12.1 | ) | 10.6 | 51.1 | |||||||||||||
| Net realized/unrealized capital losses, as adjusted | $ | (62.3 | ) | $ | (49.3 | ) | $ | (247.3 | ) | Net realized/unrealized capital gains (losses), as adjusted | $ | 18.0 | $ | (20.6 | ) | $ | (62.3 | ) | ||||
- (3)
- Corporate overhead allocated to our Mortgage Banking segment does not qualify for discontinued operations treatment
under SFAS 144and was included in our results of continuing operations and segment operating earnings prior to July 1, 2004. - (4)
- For the year ended December 31,
2004,2006, other after-tax adjustments of$123.1$41.2 million included (1) the positive effects of: income from discontinued operations related to (a) a gain on the sale of a real estate property that qualifies for discontinued operations treatment ($30.9 million) and (b) a favorable court ruling on a contested IRS issue for 1991 and later years ($18.8 million) and (2) the negative effect of a contribution to the Principal Financial Group Foundation, Inc. ($8.5 million). For the year ended December 31, 2005, other after-tax adjustments of $59.5 million included (1) the positive effects of: (a)discontinued operationsa release of income tax reserves related tothe sale of Principal Residential Mortgage, Inc.IRS tax matters ($118.8 million) and (b) discontinued operations related to the sale of our Argentine companies ($10.0 million) and (2) the negative effect of a cumulative effect of accounting change related to the implementation of SOP 03-1 ($5.7 million). For the year ended December 31, 2003, other after-tax adjustments of $127.9 million included (1) the positive effects of: (a) income from discontinued operations related to the sale of Principal Residential Mortgage, Inc. ($82.533.8 million); (b)a decrease in income tax reserves establishedgains on sales of real estate properties that qualify forcontested IRS tax audit mattersdiscontinued operations treatment ($28.922.3 million) and (c) a change in the estimated loss on disposal of BT Financial Group ($21.88.4 million) and (2) the negative effectof: (a)from acumulative effectchange in the estimated gain on disposal ofaccounting change related to the implementation of FIN 46Principal Residential Mortgage, Inc. ($3.4 million) and (b) a loss from discontinued operations related to the sale of our Argentine companies ($1.95.0 million). For the year ended December 31,2002,2004, other after-tax adjustments of$189.7$123.1 million included (1) thenegativepositive effects of: (a)a cumulative effect of accounting change related to our implementation of SFAS 142 ($280.9 million); (b) a loss fromthe discontinued operationsof BT Financial Group ($196.7 million); (c) an increase to a loss contingency reserve established for sales practice litigation ($21.6 million);and(d) expenses related to our demutualization ($2.0 million) and (2) the positive effect of: (a) income from discontinued operations related to the saleestimated gain on disposal of Principal Residential Mortgage, Inc. ($169.8118.8 million);and (b) thesettlement of an IRS audit issue ($138.0 million); and (c) income fromdiscontinued operationsrelated to the saleand estimated gain on disposal of our Argentine companies ($3.710.0 million) and (2) the negative effect from a cumulative change in accounting principle related to the implementation of SOP 03-1 ($5.7 million). - (5)
- U.S. Asset Management and Accumulation separate account assets include shares of the Principal Financial Group stock allocated to a separate account, a result of our demutualization. The value of the separate account was
$782.8$768.4 million,$833.9$726.6 million, and$1.0 billion$782.8 million at December 31,2004, 2003,2006, 2005, and2002,2004, respectively. Changes in the fair value of the separate account are reflected in both separate account assets and separate account liabilities. - (6)
- Includes inter-segment elimination amounts related to an internal line of credit and internally generated mortgage
loans, and long-term borrowings.loans. The Corporate and Other segment managed a revolving line of credit used by other segments. The U.S. Asset Management and Accumulation segment and Life and Health Insurance segment reported mortgage loan assets issued for real estate joint ventures. These mortgage loans were reported as liabilities in the Corporate and Other segment.In prior years, the U.S. Asset Management and Accumulation segment had provided a source of funding for the Mortgage Banking segment's mortgage servicing rights.
U.S. Asset Management and Accumulation Segment
Asset Accumulation Trends
Our sales of pension, institutional and other asset accumulation products and services in the U.S. have been affected by overall trends in the U.S. retirement services industry, as our customers rely less on defined benefit retirement plans,
social security and other government programs. Continuing trends in the work environment include a more mobile workforce and the desire of employers to shift the market risk of retirement investments to employees by offering defined contribution plans rather than defined benefit plans. The graying of the population and recent market volatility are also driving growing interest in products generating stable income during retirement. These trends are increasing the demand for defined contribution pension arrangements such as 401(k) plans, mutual funds, annuities and bank IRA's.IRAs. The "baby-boom" generation of U.S. workers has reached an age at which saving for retirement is critical and it continues to seek increased retirement savings using additional tax-advantaged investment products for retirement. Considering these trends, asset accumulation account values increased as of December 31, 2004,2006, primarily due to significant additional gross new deposits, solid performance of the equity markets and retention of assets from existing clients. The interest rate environment continued itsremained relatively low trenddespite an increase in 2004 whileinterest rates that was more pronounced at the shorter durations. The S & P&P 500 posted a 10.9% gain resulting in15.8% total return contributing to a strong increase in total account values and assets under management by the end of 2004.2006.
The following table provides a summary of U.S. Asset Accumulation account values as of December 31, 2004, 20032006, 2005 and 2002:2004:
| As of | U.S. Asset Accumulation Total account values | U.S. Asset Accumulation Total account values | ||||
|---|---|---|---|---|---|---|
| | (in billions) | (in billions) | ||||
| December 31, 2006 | $ | 163.3 | ||||
| December 31, 2005 | 120.3 | |||||
| December 31, 2004 | $ | 108.6 | 108.6 | |||
| December 31, 2003 | 91.7 | |||||
| December 31, 2002 | 73.8 | |||||
Asset Management Trends
Asset management services have been among the most profitable and rapidly growing sectors of the financial services industry, at both the retail and institutional level. We seek to take advantage of current trends, which indicate that both retail and institutional investors embrace specialization, providing increased fees to successful active managers with expertise in specialty and niche areas. We have experienced very good success in winning institutional asset management mandates and expect to see continued growth in this area. Our U.S. third-party assets under management increased $6.4$18.0 billion during 2004.2006.
The following table provides a summary of Principal Global Investors' affiliated and third-party assets under management as of December 31, 2004, 20032006, 2005 and 2002:2004:
| | Principal Global Investors | Principal Global Investors | ||||||||||||||||
|---|---|---|---|---|---|---|---|---|---|---|---|---|---|---|---|---|---|---|
| As of | Affiliated assets under management | Third-party assets under management | Total assets under management | Affiliated assets under management | Third-party assets under management | Total assets under management | ||||||||||||
| | (in billions) | (in billions) | ||||||||||||||||
| December 31, 2006 | $ | 132.3 | $ | 59.1 | $ | 191.4 | ||||||||||||
| December 31, 2005 | 103.4 | 41.1 | 144.5 | |||||||||||||||
| December 31, 2004 | $ | 96.9 | $ | 31.1 | $ | 128.0 | 97.0 | 29.4 | 126.4 | |||||||||
| December 31, 2003 | 88.6 | 24.7 | 113.3 | |||||||||||||||
| December 31, 2002 | 77.7 | 14.6 | 92.3 | |||||||||||||||
U.S. Asset Management and Accumulation Segment Summary Financial Data
The following table presents certain summary financial data relating to the U.S. Asset Management and Accumulation segment for the years indicated:
| | | For the year ended December 31, | | For the year ended December 31, | ||||||||||||||||||||
|---|---|---|---|---|---|---|---|---|---|---|---|---|---|---|---|---|---|---|---|---|---|---|---|---|
| | | 2004 | 2003 | 2002 | | 2006 | 2005 | 2004 | ||||||||||||||||
| | | (in millions) | | (in millions) | ||||||||||||||||||||
| Operating Earnings Data: | Operating Earnings Data: | Operating Earnings Data: | ||||||||||||||||||||||
| Operating revenues(1): | Operating revenues(1): | Operating revenues(1): | ||||||||||||||||||||||
| Premiums and other considerations | $ | 370.1 | $ | 420.0 | $ | 746.5 | Premiums and other considerations | $ | 462.3 | $ | 455.2 | $ | 370.1 | |||||||||||
| Fees and other revenues | 1,016.2 | 833.7 | 681.2 | Fees and other revenues | 1,412.5 | 1,230.9 | 1,035.9 | |||||||||||||||||
| Net investment income | 2,355.6 | 2,368.7 | 2,322.3 | Net investment income | 2,636.8 | 2,447.7 | 2,355.6 | |||||||||||||||||
| Total operating revenues | 3,741.9 | 3,622.4 | 3,750.0 | Total operating revenues | 4,511.6 | 4,133.8 | 3,761.6 | |||||||||||||||||
| Expenses: | Expenses: | Expenses: | ||||||||||||||||||||||
| Benefits, claims and settlement expenses, including dividends to policyholders | 2,099.8 | 2,146.6 | 2,539.9 | Benefits, claims and settlement expenses, including dividends to policyholders | 2,392.1 | 2,265.3 | 2,099.8 | |||||||||||||||||
| Operating expenses | 994.5 | 923.4 | 759.8 | Operating expenses | 1,288.4 | 1,167.9 | 1,014.2 | |||||||||||||||||
| Total expenses | 3,094.3 | 3,070.0 | 3,299.7 | Total expenses | 3,680.5 | 3,433.2 | 3,114.0 | |||||||||||||||||
| Pre-tax operating earnings | 647.6 | 552.4 | 450.3 | |||||||||||||||||||||
| Operating earnings before income taxes | Operating earnings before income taxes | 831.1 | 700.6 | 647.6 | ||||||||||||||||||||
| Income taxes | Income taxes | 148.6 | 129.8 | 89.6 | Income taxes | 186.0 | 162.2 | 148.6 | ||||||||||||||||
| Operating earnings | Operating earnings | 499.0 | 422.6 | 360.7 | Operating earnings | 645.1 | 538.4 | 499.0 | ||||||||||||||||
| Net realized/unrealized capital losses, as adjusted | Net realized/unrealized capital losses, as adjusted | (97.1 | ) | (82.1 | ) | (250.5 | ) | Net realized/unrealized capital losses, as adjusted | (23.1 | ) | (12.8 | ) | (97.1 | ) | ||||||||||
| Other after-tax adjustments | Other after-tax adjustments | (5.0 | ) | 9.5 | 10.2 | Other after-tax adjustments | — | — | (5.0 | ) | ||||||||||||||
| U.S. GAAP Reported: | U.S. GAAP Reported: | U.S. GAAP Reported: | ||||||||||||||||||||||
| Net income | $ | 396.9 | $ | 350.0 | $ | 120.4 | ||||||||||||||||||
| Net income available to common stockholders | Net income available to common stockholders | $ | 622.0 | $ | 525.6 | $ | 396.9 | |||||||||||||||||
- (1)
- Excludes net realized/unrealized capital losses and their impact on recognition of front-end fee revenues and certain market value adjustments to fee revenues.
Year Ended December 31, 20042006 Compared to Year Ended December 31, 20032005
Premiums and other considerations decreased $49.9increased $7.1 million, or 12%2%, to $370.1$462.3 million for the year ended December 31, 2004,2006, from $420.0$455.2 million for the year ended December 31, 2003.2005. The decrease primarilyincrease resulted from a $45.4$44.9 million increase in individual payout annuity business primarily due to increased sales from certain distribution channels. Partially offsetting the overall increase was a $37.8 million decrease in pension full-service payout sales ofprimarily related to single premium group annuities with life contingencies, which are typically used to fund defined benefit plan terminations. The premium income received from these contracts fluctuates due to the variability in the number and size of pension plan terminations, the interest rate environment and the ability to attract new sales.
Fees and other revenues increased $182.5$181.6 million, or 22%15%, to $1,016.2$1,412.5 million for the year ended December 31, 2004,2006, from $833.7$1,230.9 million for the year ended December 31, 2003. Pension full-service2005. Full-service accumulation fees and other revenue increased $132.4$98.9 million primarily due to an increase in feesaccount values stemming from our separate accountscontinued strong net cash flow and due to improvementsstrong performance in the equity markets and net cash flow, which have led to higher account values.markets. Principal Global Investors fees and other revenues increased $34.0$49.0 million primarily due to increased revenue from commercialcontinued growth in management fees related to our real estate, businessfixed income and equity businesses. In addition, our mutual fund fees and other revenue contributed $29.0 million to the segment increase primarily due to higher management fees stemming from an increase in average assets under management which resulted from improvements in the equity markets and net cash flow.increased sales.
Net investment income decreased $13.1increased $189.1 million, or 1%8%, to $2,355.6$2,636.8 million for the year ended December 31, 2004,2006, from $2,368.7$2,447.7 million for the year ended December 31, 2003.2005. The decreaseincrease reflects a decreasean increase in the average annualized yield on invested assets and cash, which was 5.9% for the year ended December 31, 2006, compared to 5.7% for the year ended December 31, 2004, compared to 6.2% for2005. In addition, the year ended December 31, 2003. This reflects lower yields on fixed maturity securities and commercial mortgages due in part to a lower interest rate environment. The decreaseincrease in net investment income due toresulted from a lower yield was partially offset by a $3,085.9$1,860.3 million, or 8%4%, increase in average invested assets and cash for the segment.
Benefits, claims and settlement expenses, including dividends to policyholders, decreased $46.8increased $126.8 million, or 2%6%, to $2,099.8$2,392.1 million for the year ended December 31, 2004,2006, from $2,146.6$2,265.3 million for the year ended December 31, 2003.2005. The decreaseincrease primarily resulted from a $43.1an $82.6 million decreaseincrease in our pension full-service payout business as a result of decreased sales of single premium group annuities with life contingencies. Also contributing to the decrease was a $37.9 million decrease in pension full-service accumulationindividual annuity business due primarily to a decreaseseveral factors, including an increase in cost of interest credited, on our non-participating deposit type businesshigher benefit payments, and to a lesser extent decreases in cost of interest credited on our participating block. Partially offsetting the overall decrease was an increase of $28.0in reserves stemming from an increase in sales related to our payout annuities with life contingencies. In addition, our investment only benefits, claims and settlement expenses increased $68.9 million in our pension
investment-only business primarily due to an increase in cost of interest credited on this block of business as a result of an increase in account values.values and an increase in the rate of interest credited, as a result of market
conditions. Partially offsetting the overall increase was a $35.2 million decrease in our full-service payout business as a result of decreased sales of single premium group annuities with life contingencies.
Operating expenses increased $71.1$120.5 million, or 8%10%, to $994.5$1,288.4 million for the year ended December 31, 2004,2006, from $923.4$1,167.9 million for the year ended December 31, 2003.2005. The increase primarily resulted from a $57.8$66.1 million increase in our pension full-service accumulation operating expenses due to an increase amortization ofincreases in staff related costs, management fees paid and DPAC in 2004 andamortization. In addition, Principal Global Investors operating expenses increased $27.8 million due to an increase in non-deferrable expenses. In addition,expenses associated with growth in average assets under management and, to a lesser extent, the fact that expenses associated with the origination of securitized mortgages are now expensed rather than deferred and recognized as a reduction in securitization revenue, as was the case prior to the U.S. Bank joint venture. Furthermore, individual fixed annuity operating expenses increased $16.4$15.4 million primarily due to strong growth in our block of fixed deferred annuity business.
Income taxes increased $18.8$23.8 million, or 14%15%, to $148.6$186.0 million for the year ended December 31, 2004,2006, from $129.8$162.2 million for the year ended December 31, 2003.2005. The effective income tax rate for this segment was 22% for the year ended December 31, 2006, and 23% for the yearsyear ended December 31, 2004 and 2003.2005. The effective income tax rates for the years ended December 31, 20042006 and 2003,2005, were lower than the corporate income tax rate of 35%, as a result of income tax deductions allowed for corporate dividends received and interest exclusion from taxable income.
As a result of the foregoing factors, operating earnings increased $76.4$106.7 million, or 18%20%, to $499.0$645.1 million for the year ended December 31, 2004,2006, from $422.6$538.4 million for the year ended December 31, 2003.2005.
Net realized/unrealized capital losses, as adjusted, increased $15.0$10.3 million, or 18%80%, to $97.1$23.1 million for the year ended December 31, 2004,2006, from $82.1$12.8 million for the year ended December 31, 2003.2005. The increase in net realized losses was primarily due to highera $24.3 million recovery of previously impaired securities in 2005 as the result of litigation. In addition, the increase was due to fewer gains on commercial mortgages offset by fewer mark to market losses related to hedgingderivatives activities, higher commercial mortgage loan lossesthe recovery of previously impaired securities as the result of a litigation claim received in 2006, more gains from the mark to market and higher losses on the salesales activities of real estate offset byequity securities, and fewer other than temporary declines in the value of certain fixed maturity securities and fewer losses related to credit loss sales of securities.
As a result of the foregoing factors and the inclusion of other after-tax adjustments for the year ended December 31, 2004, net income available to common stockholders increased $46.9$96.4 million, or 13%18%, to $396.9 million from $350.0$622.0 million for the year ended December 31, 2003. For2006, from $525.6 million for the year ended December 31, 2004, net income included the negative effect of other after-tax adjustments totaling $5.0 million related to: (1) a loss from discontinued operations associated with the sale of Principal Residential Mortgage, Inc. ($3.5 million) and (2) a cumulative effect of accounting change due to our implementation of SOP 03-1 ($1.5 million). For the year ended December 31, 2003, net income included the positive effect of other after-tax adjustments totaling $9.5 million related to: (1) the positive effect of income from discontinued operations associated with the sale of Principal Residential Mortgage, Inc. ($11.2 million) and (2) the negative effect of a cumulative effect of accounting change due to our implementation of FIN 46 ($1.7 million).2005.
Year Ended December 31, 20032005 Compared to Year Ended December 31, 20022004
Premiums and other considerations decreased $326.5increased $85.1 million, or 44%23%, to $420.0$455.2 million for the year ended December 31, 2003,2005, from $746.5$370.1 million for the year ended December 31, 2002.2004. The decreaseincrease primarily resulted from a $353.9$61.2 million decreaseincrease in pension full-service payout sales of single premium group annuities with life contingencies, which are typically used to fund defined benefit plan terminations. The premium income received from these contracts fluctuates due to the variability in the number and size of pension plan terminations, the interest rate environment and the ability to attract new sales. In addition, individual fixed annuity premiums and other considerations increased $23.9 million due to increased sales from certain distribution channels and due to higher sales of larger sized contracts in 2005.
Fees and other revenues increased $152.5$195.0 million, or 22%19%, to $833.7$1,230.9 million for the year ended December 31, 2003,2005, from $681.2$1,035.9 million for the year ended December 31, 2002.2004. Full-service accumulation fees and other revenues increased $118.3 million primarily due to continued strong net cash flow, modest performance in the equity markets and our acquisition of Principal Services Trust Company. Also contributing to the overall increase was a $69.4 million increase in Principal Global Investors fees and other revenues, increased $96.8 millionwhich was primarily due to increased management and performanceour acquisition of Columbus Circle, higher real estate transaction fees, from the full consolidation of our newly acquired Post Advisory subsidiary, increased revenues from Spectrum due to growthan increase in assets under management and the inclusion of our asset management offshore operations. Pension full-service accumulation fees and other revenue increased $50.0 million primarily due to an increase in revenue from improvementsloans securitized in the equity markets and net cash flow, which have led to higher account values, and increased revenue from our employer securities group acquisition, BCI Group.2005.
Net investment income increased $46.4$92.1 million, or 2%4%, to $2,368.7$2,447.7 million for the year ended December 31, 2003,2005, from $2,322.3$2,355.6 million for the year ended December 31, 2002.2004. The increase reflects a $3,096.6$1,749.6 million, or 9%4%, increase in average invested assets and cash for the segment. The increase was partially offset by a decrease in the average annualized yield on invested assets and cash which was 6.2%5.7% for the yearyears ended December 31, 2003, compared to 6.7% for the year ended December 31, 2002. This reflects lower yields on fixed maturity securities2005 and commercial mortgages due in part to a lower interest rate environment.2004.
Benefits, claims and settlement expenses, including dividends to policyholders, decreased $393.3increased $165.5 million, or 15%8%, to $2,146.6$2,265.3 million for the year ended December 31, 2003,2005, from $2,539.9$2,099.8 million for the year ended December 31, 2002.2004. The decreaseincrease primarily resulted from a $351.8$73.4 million decreaseincrease in our pension full-service payout business as a result of decreasedincreased sales of single premium group annuities with life contingencies. Also contributing to the decreaseincrease was a $56.0$68.5 million decreaseincrease in pension full-service accumulationinvestment-only business due primarily to decliningan increase in interest credited on this block of business stemming from higher account values. In addition, individual annuity benefits, claims and settlement expenses increased $56.3 million primarily due to an increase in cost of interest credited and amortization related to sale inducements associated with our participating blockdeferred annuity business, higher benefit payments and an increase in reserves stemming from an increase in sales related to our life payout annuity business. Partially offsetting the overall increase was a $32.3 million decrease in full-service accumulation benefits, claims and settlement expenses primarily due to lower interest credited on our non-participating deposit type business.business and, to a lesser extent decreases in cost of interest credited on our participating block.
Operating expenses increased $163.6$153.7 million, or 22%15%, to $923.4$1,167.9 million for the year ended December 31, 2003,2005, from $759.8$1,014.2 million for the year ended December 31, 2002.2004. The increase primarily resulted from a $104.9$92.4 million increase in
increase in full-service accumulation operating expenses due to our acquisition of Principal Services Trust Company, an increase in compensation costs and an increase in amortization of DPAC in 2005. In addition, Principal Global Investors operating expenses increased $46.1 million primarily due to the full consolidationour acquisition of our newly acquired Post Advisory subsidiary, the inclusion of our asset management offshoreColumbus Circle, growth in existing operations and higher incentive compensation accruals. In addition, pension full-service accumulation operating expenses increased $41.3 million due to higher non-deferrable compensation related costs including incentive compensation costs and increasesan increase in employee benefit costs, expenses from employer securities group and increased amortization of DPAC in 2003.allocated expenses.
Income taxes increased $40.2$13.6 million, or 45%9%, to $129.8$162.2 million for the year ended December 31, 2003,2005, from $89.6$148.6 million for the year ended December 31, 2002.2004. The effective income tax rate for this segment was 23% for the yearyears ended December 31, 2003,2005 and 20% for the year ended December 31, 2002.2004. The effective income tax rates for the years ended December 31, 20032005 and 2002,2004, were lower than the corporate income tax rate of 35%, as a result of income tax deductions allowed for corporate dividends received for which an estimated benefit recognition rate decreased during 2003 compared to 2002, and interest exclusion from taxable income.
As a result of the foregoing factors, operating earnings increased $61.9$39.4 million, or 17%8%, to $422.6$538.4 million for the year ended December 31, 2003,2005, from $360.7$499.0 million for the year ended December 31, 2002.2004.
Net realized/unrealized capital losses, as adjusted, decreased $168.4$84.3 million, or 67%87%, to $82.1$12.8 million for the year ended December 31, 2003,2005, from $250.5$97.1 million for the year ended December 31, 2002.2004. The decrease is due to lower capitalfewer other than temporary impairments of fixed maturity securities including a $24.3 million recovery of previously impaired securities received as the result of a litigation settlement, fewer losses related to other than temporary declinesthe mark to market of derivative activities, and gains versus losses on mortgage loans offset in part by losses versus gains on the valuesale of certain fixed maturity securities for the year ended December 31, 2003.securities.
As a result of the foregoing factors and the inclusion of other after-tax adjustments for the year ended December 31, 2003, net income available to common stockholders increased $229.6$128.7 million, or 32%, to $350.0 million from $120.4$525.6 million for the year ended December 31, 2002.2005, from $396.9 million for the year ended December 31, 2004. For the year ended December 31, 2003,2004, net income available to common stockholders included the positivenegative effect of other after-tax adjustments totaling $9.5$5.0 million related to: (1) the positive effect of incomea loss from discontinued operations associated with the sale of Principal Residential Mortgage, Inc. ($11.23.5 million) and (2) the negative effect of a cumulative effect of accounting change due to our implementation of FIN 46SOP 03-1 ($1.71.5 million). For the year ended December 31, 2002, net income included the positive effect of other after-tax adjustments totaling $10.2 million related to income from discontinued operations associated with the sale of Principal Residential Mortgage, Inc.
International Asset Management and Accumulation Segment
Asset Accumulation Trends
Our international asset management and accumulation businesses focus on countries with a trend toward private sector defined contribution pension systems, including privatization of public retirement pension systems requiring employees who join the labor force to contribute to a private pension plan.systems. With variations depending upon the specific country, we have targeted these markets for sales of retirement and related products and services, including defined contribution pension plans, annuities and long-term mutual funds to businesses and individuals. In severalsome of our international markets, we complement our sales of these products with sales of life insurance products.
We have pursued our international strategy through a combination of start-ups, acquisitions and joint ventures, which require infusions of capital consistent with our strategy of long-term growth and profitability.
The following table provides a summary of Principal Internationalour international asset management and accumulation business's assets under management as of December 31, 2004, 20032006, 2005 and 2002:2004:
| As of | Principal International Total assets under management | Principal International Total assets under management | ||||
|---|---|---|---|---|---|---|
| | (in billions) | (in billions) | ||||
| December 31, 2006 | $ | 19.1 | ||||
| December 31, 2005 | 15.4 | |||||
| December 31, 2004 | $ | 10.2 | 10.2 | |||
| December 31, 2003 | 7.5 | |||||
| December 31, 2002 | 4.4 | |||||
International Asset Management and Accumulation Segment Summary Financial Data
The following table presents certain summary financial data of the International Asset Management and Accumulation segment for the years indicated:
| | | For the year ended December 31, | | For the year ended December 31, | |||||||||||||||||||
|---|---|---|---|---|---|---|---|---|---|---|---|---|---|---|---|---|---|---|---|---|---|---|---|
| | | 2004 | 2003 | 2002 | | 2006 | 2005 | 2004 | |||||||||||||||
| | | (in millions) | | (in millions) | |||||||||||||||||||
| Operating Earnings Data: | Operating Earnings Data: | Operating Earnings Data: | |||||||||||||||||||||
| Operating revenues(1): | Operating revenues(1): | Operating revenues(1): | |||||||||||||||||||||
| Premiums and other considerations | $ | 241.0 | $ | 191.7 | $ | 157.9 | Premiums and other considerations | $ | 239.1 | $ | 247.6 | $ | 241.0 | ||||||||||
| Fees and other revenues | 85.9 | 70.4 | 52.6 | Fees and other revenues | 114.0 | 109.2 | 85.9 | ||||||||||||||||
| Net investment income | 191.5 | 137.4 | 138.2 | Net investment income | 252.3 | 247.7 | 191.5 | ||||||||||||||||
| Total operating revenues | 518.4 | 399.5 | 348.7 | Total operating revenues | 605.4 | 604.5 | 518.4 | ||||||||||||||||
| Expenses: | Expenses: | Expenses: | |||||||||||||||||||||
| Benefits, claims and settlement expenses | 357.3 | 263.7 | 238.6 | Benefits, claims and settlement expenses | 399.1 | 409.3 | 357.3 | ||||||||||||||||
| Operating expenses | 112.2 | 97.8 | 84.0 | Operating expenses | 144.5 | 128.7 | 112.2 | ||||||||||||||||
| Total expenses | 469.5 | 361.5 | 322.6 | Total expenses | 543.6 | 538.0 | 469.5 | ||||||||||||||||
| Pre-tax operating earnings | 48.9 | 38.0 | 26.1 | ||||||||||||||||||||
| Income taxes | 8.6 | 3.5 | 6.9 | ||||||||||||||||||||
| Operating earnings before income taxes | Operating earnings before income taxes | 61.8 | 66.5 | 48.9 | |||||||||||||||||||
| Income taxes (benefits) | Income taxes (benefits) | (10.0 | ) | (4.5 | ) | 8.6 | |||||||||||||||||
| Operating earnings | Operating earnings | 40.3 | 34.5 | 19.2 | Operating earnings | 71.8 | 71.0 | 40.3 | |||||||||||||||
| Net realized/unrealized capital gains, as adjusted | Net realized/unrealized capital gains, as adjusted | 17.3 | 4.8 | 9.0 | Net realized/unrealized capital gains, as adjusted | 10.3 | 8.1 | 17.3 | |||||||||||||||
| Other after-tax adjustments | Other after-tax adjustments | 6.7 | 19.9 | (469.3 | ) | Other after-tax adjustments | — | — | 6.7 | ||||||||||||||
| U.S. GAAP Reported: | U.S. GAAP Reported: | U.S. GAAP Reported: | |||||||||||||||||||||
| Net income (loss) | $ | 64.3 | $ | 59.2 | $ | (441.1 | ) | ||||||||||||||||
| Net income available to common stockholders | Net income available to common stockholders | $ | 82.1 | $ | 79.1 | $ | 64.3 | ||||||||||||||||
| Other Data: | |||||||||||||||||||||||
| Operating earnings (loss): | |||||||||||||||||||||||
| Principal International | $ | 40.3 | $ | 34.5 | $ | 21.8 | |||||||||||||||||
| BT Financial Group | — | — | (2.6 | ) | |||||||||||||||||||
| Net income (loss): | |||||||||||||||||||||||
| Principal International | $ | 64.3 | $ | 37.4 | $ | 13.6 | |||||||||||||||||
| BT Financial Group | — | 21.8 | (454.7 | ) | |||||||||||||||||||
- (1)
- Excludes net realized/unrealized capital
losses.gains.
Year Ended December 31, 20042006 Compared to Year Ended December 31, 20032005
Premiums and other considerations increased $49.3decreased $8.5 million, or 26%3%, to $241.0$239.1 million for the year ended December 31, 2004,2006, from $191.7$247.6 million for the year ended December 31, 2003. An increase of $45.52005. The decrease primarily resulted from a $19.5 million decrease in Mexico and Chile was primarily a result of the strengthening of the Chilean peso versus the U.S. dollar and higherdue to decreased sales of single premium annuities with life contingenciescontingencies. Partially offsetting this decrease was an $11.0 million increase in 2004 following a year of decreased salesChile due to market contraction.the strengthening of the peso versus the U.S. dollar.
Fees and other revenues increased $15.5$4.8 million, or 22%4%, to $85.9$114.0 million for the year ended December 31, 2004,2006, from $70.4$109.2 million for the year ended December 31, 2003. An increase of $6.0 million2005. Fees and other revenues in India and Hong Kong was a result ofincreased $4.8 million and $4.1 million, respectively,due to an increase in fees from growth in assets under management. In addition, fees and other revenues in Chile increased $2.2 million primarily due to growth in assets under management and increased fees from universal life insurance. Partially offsetting the increase was a $5.5 million decrease in Mexico primarily due to the acquisitiona refinement of Dao Heng Fund Managementaccrued fee income in 2004. An increase of $4.6 million in Mexico was primarily a result of an increase in the number of retirement plan participants due to the acquisition of AFORE Tepeyac in February 2003 and the acquisition of Principal Genera, S.A. de C.V., Operadora de Fondos de Inversión ("Genera") in July 2003. In addition, an increase of $3.5 million in India was primarily a result of an increase in assets under management ("AUM") caused by record net customer cash flows and accounting for Principal PNB Asset Management Company using the full consolidation method of accounting due to our majority ownership beginning third quarter 2003; prior to third quarter 2003, results were reported using equity method of accounting.2005.
Net investment income increased $54.1$4.6 million, or 39%2%, to $191.5$252.3 million for the year ended December 31, 2004,2006, from $137.4$247.7 million for the year ended December 31, 2003.2005. The increase was primarily due to a $466.8an increase of $367.8 million, or 28%14%, increase in average invested assets and cash, excluding our equity method investments, the strengthening of the Chilean peso and Brazilian real versus the U.S. dollar, and higher earnings from our equity method investments. Partially offsetting the increase was a decrease in the annualized yield on average invested assets and cash, excluding our equity method investments, which was 7.1% for the year ended December 31, 2006, compared to 8.5% for the year ended December 31, 2005.
Benefits, claims and settlement expenses decreased $10.2 million, or 2%, to $399.1 million for the year ended December 31, 2006, from $409.3 million for the year ended December 31, 2005. The decrease primarily resulted from a $23.2 million decrease in Chile as a result of lower interest credited to customers. In addition, the decrease in reserves of $4.4 million in Mexico was a result of decreased sales of single premium annuities with life contingencies. Partially offsetting this decrease is an increase of $17.5 million due to the strengthening of the Chilean peso versus U.S. dollar.
Operating expenses increased $15.8 million, or 12%, to $144.5 million for the year ended December 31, 2006, from $128.7 million for the year ended December 31, 2005. The increase was primarily due to a $5.4 million increase in India due to higher compensation costs in the asset management company coupled with costs from PPIAC. Hong Kong operating expenses increased $2.9 million primarily due to increased incentive compensation costs, commission expenses,
and occupancy costs. Mexico operating expenses increased $1.7 million due to increased amortization related to a refinement of present value of future profits ("PVFP"), higher professional fees expenses and sales compensation in 2006. In addition, Chile operating expenses increased $1.5 million primarily due to increased compensation costs.
Income tax benefits increased $5.5 million to $10.0 million for the year ended December 31, 2006, from $4.5 million for the year ended December 31, 2005. The increase in income tax benefits was primarily due to tax refinements in Mexico and Chile. The increase was partially offset due to a tax benefit associated with the liquidation of the Japan joint venture in 2005 and the benefit from the American Jobs Creation Act in 2005 at International headquarters.
As a result of the foregoing factors, operating earnings increased $0.8 million, or 1%, to $71.8 million for the year ended December 31, 2006, from $71.0 million for the year ended December 31, 2005.
Net realized/unrealized capital gains, as adjusted, increased $2.2 million, or 27%, to $10.3 million for the year ended December 31, 2006, from $8.1 million for the year ended December 31, 2005. The increase was primarily related to a $1.3 million increase in Mexico due to realized gains on fixed maturity securities. In addition, net realized/unrealized capital gains, as adjusted, increased $0.8 million in Chile. Unrealized gains on trading fixed maturities were partially offset by mark-to-market losses in 2006 on derivatives that are held to more effectively match the invested asset portfolio to our policyholder liability risks.
As a result of the foregoing factors net income available to common stockholders increased $3.0 million, or 4%, to $82.1 million for the year ended December 31, 2006, from $79.1 million for the year ended December 31, 2005.
Year Ended December 31, 2005 Compared to Year Ended December 31, 2004
Premiums and other considerations increased $6.6 million, or 3%, to $247.6 million for the year ended December 31, 2005, from $241.0 million for the year ended December 31, 2004. The increase primarily resulted from an $18.4 million increase in Chile and Mexico due to the strengthening of the peso versus the U.S. dollar. Partially offsetting this increase was a $10.6 million decrease in Chile due to decreased sales of single premium annuities with life contingencies.
Fees and other revenues increased $23.3 million, or 27%, to $109.2 million for the year ended December 31, 2005, from $85.9 million for the year ended December 31, 2004. The increase was primarily due to a $15.3 million increase in Mexico resulting from a refinement of accrued fee income, improved net transfers of pension customers from competitors, and the strengthening of the peso versus the U.S. dollar. Futhermore, fees and other revenue in India increased $3.4 million due to an increase in fees from PPIAC that began operations in February 2005 and an increase in fees from growth in assets under management. In addition, fees and other revenue in Chile increased $3.3 million primarily due to an increase in mortgage loan servicing revenue, increased fees caused by growth in assets under management and the strengthening of the peso.
Net investment income increased $56.2 million, or 29%, to $247.7 million for the year ended December 31, 2005, from $191.5 million for the year ended December 31, 2004. The increase was primarily due to an increase of $473.5 million, or 22%, in average invested assets and cash, excluding our equity investments in subsidiaries. In addition, the increase was related to an increase in the annualized yield on average invested assets and cash, excluding our equity investmentinvestments in subsidiaries, which was 8.5% for the year ended December 31, 2005, compared to 8.1% for the year ended December 31, 2004, compared2004.
Benefits, claims and settlement expenses increased $52.0 million, or 15%, to 7.3%$409.3 million for the year ended December 31, 2003.
Benefits, claims and settlement expenses increased $93.6 million, or 35%, to2005, from $357.3 million for the year ended December 31, 2004,2004. The increase primarily resulted from $263.7 million for the year ended December 31, 2003. An $84.6a $54.5 million increase in Chile, was primarily athe result of higher reserve expenses due to the strengthening of the Chilean peso versus the U.S. dollar, and higher interest credited to customers partially offset by a lower change in reserves due to a decrease in sales of single premium annuities with life contingencies in 2004 following a year of decreased sales due to market contraction.2005.
Operating expenses increased $14.4$16.5 million, or 15%, to $128.7 million for the year ended December 31, 2005, from $112.2 million for the year ended December 31, 2004,2004. The increase was primarily due to a $4.3 million increase in Chile and Mexico resulting from $97.8strengthening of the peso versus the U.S. dollar. In addition, Mexico operating expenses increased $3.0 million due to increased marketing efforts and asset retention training for agents and employees. Furthermore, Chile operating expenses increased $2.2 million due to the impact of an impairment of PVFP stemming from declining interest rates. Also, India operating expenses increased $2.3 million due to higher compensation costs in the asset management company coupled with costs from PPIAC, which started operations in February 2005. Finally, Hong Kong operating expenses increased $2.1 million primarily due to increased costs related to consolidation of our mutual fund products, marketing costs, and compensation costs as well as DPAC unlocking.
Income tax benefits increased $13.1 million to an income tax benefit of $4.5 million for the year ended December 31, 2003. An increase of $8.7 million in Mexico was primarily due to DPAC and value of business acquired ("VOBA") unlocking, increased compensation expenses, higher postage and legal expenses to introduce a second investment option for our Mexico AFORE customers and the acquisition of Genera in July 2003. In addition, an increase of $3.8 million in Hong Kong was primarily a result of increased marketing efforts, compensation costs and higher investment management fees caused by an increase in assets under management due to the acquisition of Dao Heng Fund Management in 2004.
Income2005, from income tax expense increased $5.1 million, toof $8.6 million for the year ended December 31, 2004, from $3.52004. A decrease of $8.9 million for the year ended December 31, 2003. An increase of $3.2 millionin Japan was primarily related to an increase in deferred taxes relateddue to a plannedtax benefit associated with the liquidation of the business in 2005. A decrease of $7.3 million at corporate headquarters was due to the benefit from the American Jobs Creation Act in 2005 and foreign dividend from Mexico. In addition, the increase was a result of an increaseactivity that generated tax expense in deferred taxes related to our Brazilian equity method investment. These increases are partially offset as a result of enacted tax rate reductions in Mexico.2004.
As a result of the foregoing factors, operating earnings increased $5.8$30.7 million, or 17%76%, to $71.0 million for the year ended December 31, 2005, from $40.3 million for the year ended December 31, 2004, from $34.5 million for the year ended December 31, 2003.2004.
Net realized/unrealized capital gains, as adjusted, increased $12.5decreased $9.2 million, or 53%, to $8.1 million for the year ended December 31, 2005, from $17.3 million for the year ended December 31, 2004, from $4.82004. The decrease was primarily related to a $4.7 million for the year ended December 31, 2003. An increase of $5.5 milliondecrease in Chile was primarily due to a change in the fair value of non-hedged derivatives. An increase of $4.3 million in Mexico was primarily due tolower realized gains on equity securities while restructuringderivatives that are held to more effectively match the invested asset portfolio to our investment portfolios from equity securities to fixed income securities.policyholder liability risks. In addition, an increase of $2.3India net realized/unrealized capital gains, as adjusted, decreased $2.4 million in India was primarily due to a realized gain in 2004 on recovery of a previously impaired debt security.
As a result of the foregoing factors and the inclusion of other after-tax adjustments, net income available to common stockholders increased $5.1$14.8 million, or 9%23%, to $79.1 million for the year ended December 31, 2005, from $64.3 million for the year ended December 31, 2004, from $59.2 million for the year ended December 31, 2003.2004. For the year ended December 31, 2004, net income included the positive effect of other after-tax adjustments totaling $6.7 million, related to: (1) the positive effect of income from discontinued operations related to the sale of our Argentine companies ($10.0 million) and (2) the negative effect of cumulative effect of an accounting change related to the implementation of SOP 03-1 ($3.3 million). For the year ended December 31, 2003, net income included the positive effect of other after-tax adjustments totaling $19.9 million, related to: (1) the positive effect of the change in the estimated loss on disposal of BT Financial Group ($21.8 million) and (2) the negative effect of the loss from discontinued operations related to the sale of our Argentine companies ($1.9 million).
Year Ended December 31, 2003 Compared to Year Ended December 31, 2002
Premiums and other considerations increased $33.8 million, or 21%, to $191.7 million for the year ended December 31, 2003, from $157.9 million for the year ended December 31, 2002. An increase of $47.3 million in Chile was primarily a result of record sales of single premium annuities with life contingencies in 2003 following a year of decreased sales due to market contraction. Partially offsetting this increase was a decrease of $13.4 million in Mexico primarily due to prolonged government retention of potential annuitants in 2003, additional premiums on a large group annuity contract in 2002, as well as the weakening of the Mexican peso versus the U.S. dollar.
Fees and other revenues increased $17.8 million, or 34%, to $70.4 million for the year ended December 31, 2003, from $52.6 million for the year ended December 31, 2002. An increase of $14.5 million in Mexico was primarily a result of an increase in the number of retirement plan participants due to the acquisition of Zurich AFORE in May 2002 and AFORE Tepeyac in February 2003.
Net investment income decreased $0.8 million, or 1%, to $137.4 million for the year ended December 31, 2003, from $138.2 million for the year ended December 31, 2002.
Benefits, claims and settlement expenses increased $25.1 million, or 11%, to $263.7 million for the year ended December 31, 2003, from $238.6 million for the year ended December 31, 2002. A $33.3 million increase in Chile was primarily a result of higher reserve expenses due to record sales of single premium annuities with life contingencies in 2003 following a year of decreased sales due to market contraction. The increase was partially offset by a $7.4 million decrease in Mexico due to lower reserve expenses related to additional premiums on a large group annuity contract in 2002 and the cancellation of a personal accident product in 2003.
Operating expenses increased $13.8 million, or 16%, to $97.8 million for the year ended December 31, 2003, from $84.0 million for the year ended December 31, 2002. An increase of $8.3 million in Chile was primarily the impact of unlocking of the VOBA amortization stemming from declining interest rates. An increase of $5.7 million in Mexico was primarily due to the acquisition of Zurich AFORE in May 2002 and AFORE Tepeyac in February 2003 and increased
marketing expenses in 2003, offset partially by a net impact of unlocking of DPAC and VOBA. Operating expenses incurred by BT Financial Group were $4.0 million for the year ended December 31, 2002. These expenses represent corporate overhead allocated to BT Financial Group and do not qualify for discontinued operations treatment.
Income tax expense decreased $3.4 million, or 49%, to $3.5 million for the year ended December 31, 2003, from $6.9 million for the year ended December 31, 2002. A decrease of $3.0 million in Mexico was primarily due to income tax adjustments related to inflation.
As a result of the foregoing factors, operating earnings increased $15.3 million, or 80%, to $34.5 million for the year ended December 31, 2003, from $19.2 million for the year ended December 31, 2002.
Net realized/unrealized capital gains, as adjusted, decreased $4.2 million, or 47%, to $4.8 million for the year ended December 31, 2003, from $9.0 million for the year ended December 31, 2002. A decrease of $5.3 million in Chile resulted primarily from losses realized on the sale of fixed maturity securities.
As a result of the foregoing factors and the inclusion of other after-tax adjustments, net income increased $500.3 million to $59.2 million of net income for the year ended December 31, 2003, from $441.1 million of net loss for the year ended December 31, 2002. For the year ended December 31, 2003, net income included the positive effect of other after-tax adjustments totaling $19.9 million, related to: (1) the positive effect of the change in the estimated loss on disposal of BT Financial Group ($21.8 million) and (2) the negative effect of the loss from discontinued operations of PI Argentina ($1.9 million). For the year ended December 31, 2002, net loss included the negative effect of other after-tax adjustments totaling $469.3 million, related to: (1) the negative effects of (a) cumulative effect of accounting change, a result of our implementation of SFAS 142 ($276.3 million) and (b) the loss from discontinued operations of BT Financial Group ($196.7 million) and the positive effect of the income from discontinued operations related to the sale of our Argentine companies ($3.7 million).
Life and Health Insurance Segment
Individual Life Insurance Trends
Our life insurance premiums have been influenced by both economic and industry trends. In addition, we have shiftedcontinued to shift our marketing emphasis to universal and variable universal life insurance products from traditional life insurance products. Due to this shift in marketing emphasis, premiums related to our traditional life insurance products have declined, while fee revenues from our universal and variable universal life insurance products have grown.
The following table provides a summary of our individual universal and variable universal life insurance fee revenues and our individual traditional life insurance premiums for the years ended December 31, 2004, 20032006, 2005 and 2002:2004:
| | Individual life insurance | |||||||||||
|---|---|---|---|---|---|---|---|---|---|---|---|---|
| | Individual life insurance | Individual universal and variable universal life insurance | | |||||||||
| | Individual universal and variable universal life insurance | Individual traditional life insurance | Individual traditional life insurance | |||||||||
| For the year ended | ||||||||||||
| Fee revenues | Premiums | Fee revenues | Premiums | |||||||||
| | (in millions) | (in millions) | ||||||||||
| December 31, 2006 | $ | 225.3 | $ | 624.4 | ||||||||
| December 31, 2005 | 212.6 | 645.2 | ||||||||||
| December 31, 2004 | $ | 182.8 | $ | 675.8 | 182.8 | 675.8 | ||||||
| December 31, 2003 | 140.7 | 710.9 | ||||||||||
| December 31, 2002 | 129.5 | 737.2 | ||||||||||
The following table provides a summary of our individual life insurance policyholder liabilities as of December 31, 2004, 20032006, 2005 and 2002:2004:
| | Individual life insurance | Individual life insurance | ||||||||||
|---|---|---|---|---|---|---|---|---|---|---|---|---|
| | Individual universal and variable universal life insurance | Individual traditional life insurance | Individual universal and variable universal life insurance | Individual traditional life insurance | ||||||||
| As of | Policyholder liabilities(1) | Policyholder liabilities | ||||||||||
| Policyholder liabilities(1) | Policyholder liabilities | |||||||||||
| | (in millions) | (in millions) | ||||||||||
| December 31, 2006 | $ | 3,948.6 | $ | 5,921.5 | ||||||||
| December 31, 2005 | 3,493.8 | 5,955.4 | ||||||||||
| December 31, 2004 | $ | 2,880.0 | $ | 6,042.2 | 2,880.0 | 6,042.2 | ||||||
| December 31, 2003 | 2,269.0 | 6,011.0 | ||||||||||
| December 31, 2002 | 1,900.9 | 5,851.4 | ||||||||||
- (1)
- Includes separate account liabilities for policies with variable investment options.
Tough competitionIn 2006, we experienced good growth in the group medical insurance business has affected premium growth during the past few years. Inforce membership has also been impacted by the decisionand fees and members due to exit the small case medical business in Florida. We
improved pricing and market focus. While we continue to sell group medical business in 35 states plus the District of Columbia. However,Columbia, we have sharpened our focus on 13 selected target states. We also offerPremium revenue has grown due to both price and membership increases. The fee-for-service portion of our business had a drop in medical members and fees because of our competitive position in the market. Our fee-for-service offering is available in all 50 states plus the District of Columbia. Fees and members in the fee-for-service business have been impacted by the acquisition of the Molloy Companies on January 2, 2004.
While group medical membership has declined over the past few years, we have grown in the 13 target states in 2004. Premium revenue has grown due to price increases and to some degree, due to the impact of reinsurance. The medical reinsurance contract was entered into in 2002 and, as such, premiums in 2002 were reduced by $45.4 million of ceded premium. In 2003, the contract was amended and the accounting treatment was changed to the deposit method so no premiums were ceded in 2003 and 2004. The medical reinsurance agreement is not in effect after December 31, 2004, as we did not renew. These changes have impacted the premium trend during the three year period illustrated below.
Our health insurance premium and fees for the years ended December 31, 2004, 20032006, 2005 and 20022004 were as follows:
| | Premium and fees | |||||
|---|---|---|---|---|---|---|
| For the year ended | Group medical insurance(1) | Fee-for-service(2) | ||||
| | (in millions) | |||||
| December 31, 2004 | $ | 1,586.9 | $ | 178.8 | ||
| December 31, 2003 | 1,561.7 | 142.8 | ||||
| December 31, 2002 | 1,532.4 | 129.9 | ||||
(1)Beginning September 1, 2002, we began non-renewing small group medical business in the state of Florida. In addition, our medical reinsurance contract decreased premiums by $45.4 million in 2002 and had no impact on 2003 or 2004.(2)We acquired the Molloy Companies on January 2, 2004, adding approximately $40 million in fee income.
| | Premium and fees | |||||
|---|---|---|---|---|---|---|
| For the year ended | Group medical insurance | Fee-for-service | ||||
| | (in millions) | |||||
| December 31, 2006 | $ | 1,861.4 | $ | 172.5 | ||
| December 31, 2005 | 1,676.5 | 176.6 | ||||
| December 31, 2004 | 1,586.9 | 178.8 | ||||
Our covered members as of December 31, 2004, 20032006, 2005 and 20022004 were as follows:
| | Covered members | |||
|---|---|---|---|---|
| As of | Group medical insurance(1) | Fee-for-service(2) | ||
| | (in thousands) | |||
| December 31, 2004 | 574.8 | 986.6 | ||
| December 31, 2003 | 596.4 | 790.1 | ||
| December 31, 2002 | 635.8 | 767.7 | ||
(1)Beginning September 1, 2002, we began non-renewing small group medical business in the state of Florida.(2)We acquired the Molloy Companies on January 2, 2004, adding about 198,000 fee-for-service members.
| | Covered medical members | |||
|---|---|---|---|---|
| As of | Group medical insurance | Fee-for-service | ||
| | (in thousands) | |||
| December 31, 2006 | 642.5 | 758.0 | ||
| December 31, 2005 | 620.1 | 861.5 | ||
| December 31, 2004 | 574.8 | 986.6 | ||
Specialty Benefits Insurance Trends
Premium and fee growth for our specialty benefits insurance business in 2004 and 2003 is being driven by growing sales and favorablestable retention. This has been a result of growing and more focused distribution supporting these product lines, along withincreasing focus on marketing products to individuals at employer worksites ("voluntary/worksite"), and the introduction of new products.
The following table provides a summary of our specialty benefits insurance premium and fees for the years ended December 31, 2004, 20032006, 2005 and 2002:2004:
| | Premium and Fees | Premium and fees | ||||||||||||||||||||||
|---|---|---|---|---|---|---|---|---|---|---|---|---|---|---|---|---|---|---|---|---|---|---|---|---|
| For the year ended | Group dental and vision insurance | Group life insurance | Group disability insurance | Individual disability insurance | Group dental and vision insurance | Group life insurance | Group disability insurance | Individual disability insurance | ||||||||||||||||
| | (in millions) | (in millions) | ||||||||||||||||||||||
| December 31, 2006 | $ | 496.3 | $ | 310.4 | $ | 254.9 | $ | 141.6 | ||||||||||||||||
| December 31, 2005 | 434.5 | 259.9 | 200.3 | 130.8 | ||||||||||||||||||||
| December 31, 2004 | $ | 383.2 | $ | 239.1 | $ | 170.1 | $ | 113.3 | 383.2 | 239.1 | 170.1 | 113.3 | ||||||||||||
| December 31, 2003 | 352.2 | 216.8 | 140.0 | 102.5 | ||||||||||||||||||||
| December 31, 2002 | 343.7 | 217.9 | 109.9 | 93.7 | ||||||||||||||||||||
Life and Health Insurance Segment Summary Financial Data
The following table presents certain summary financial data relating to the Life and Health Insurance segment for the years indicated:
| | | For the year ended December 31, | | For the year ended December 31, | ||||||||||||||||||||
|---|---|---|---|---|---|---|---|---|---|---|---|---|---|---|---|---|---|---|---|---|---|---|---|---|
| | | 2004 | 2003 | 2002 | | 2006 | 2005 | 2004 | ||||||||||||||||
| | | (in millions) | | (in millions) | ||||||||||||||||||||
| Operating Earnings Data: | Operating Earnings Data: | Operating Earnings Data: | ||||||||||||||||||||||
| Operating Revenues(1): | ||||||||||||||||||||||||
| Operating revenues(1): | Operating revenues(1): | |||||||||||||||||||||||
| Premiums and other considerations | $ | 3,096.6 | $ | 3,019.0 | $ | 2,973.4 | Premiums and other considerations | $ | 3,598.7 | $ | 3,267.1 | $ | 3,096.6 | |||||||||||
| Fees and other revenues | 421.9 | 338.9 | 313.2 | Fees and other revenues | 444.2 | 444.3 | 421.9 | |||||||||||||||||
| Net investment income | 662.8 | 656.4 | 660.2 | Net investment income | 693.3 | 676.1 | 662.8 | |||||||||||||||||
| Total operating revenues | 4,181.3 | 4,014.3 | 3,946.8 | Total operating revenues | 4,736.2 | 4,387.5 | 4,181.3 | |||||||||||||||||
Expenses: | Expenses: | Expenses: | ||||||||||||||||||||||
| Benefits, claims and settlement expenses | 2,514.7 | 2,457.7 | 2,433.4 | Benefits, claims and settlement expenses | 2,910.3 | 2,620.2 | 2,514.7 | |||||||||||||||||
| Dividends to policyholders | 291.8 | 301.0 | 307.0 | Dividends to policyholders | 290.3 | 288.5 | 291.8 | |||||||||||||||||
| Operating expenses | 988.7 | 891.8 | 851.2 | Operating expenses | 1,110.8 | 1,066.3 | 988.7 | |||||||||||||||||
| Total expenses | 3,795.2 | 3,650.5 | 3,591.6 | Total expenses | 4,311.4 | 3,975.0 | 3,795.2 | |||||||||||||||||
| Pre-tax operating earnings | 386.1 | 363.8 | 355.2 | |||||||||||||||||||||
| Operating earnings before income taxes | Operating earnings before income taxes | 424.8 | 412.5 | 386.1 | ||||||||||||||||||||
| Income taxes | Income taxes | 129.9 | 122.6 | 122.1 | Income taxes | 142.3 | 138.1 | 129.9 | ||||||||||||||||
| Operating earnings | Operating earnings | 256.2 | 241.2 | 233.1 | Operating earnings | 282.5 | 274.4 | 256.2 | ||||||||||||||||
Net realized/unrealized capital losses, as adjusted | Net realized/unrealized capital losses, as adjusted | (8.9 | ) | (16.6 | ) | (50.0 | ) | Net realized/unrealized capital losses, as adjusted | (3.4 | ) | (2.3 | ) | (8.9 | ) | ||||||||||
| Other after-tax adjustments | Other after-tax adjustments | (0.9 | ) | — | (4.6 | ) | Other after-tax adjustments | — | — | (0.9 | ) | |||||||||||||
U.S. GAAP Reported: | U.S. GAAP Reported: | U.S. GAAP Reported: | ||||||||||||||||||||||
| Net income | $ | 246.4 | $ | 224.6 | $ | 178.5 | ||||||||||||||||||
| Net income available to common stockholders | Net income available to common stockholders | $ | 279.1 | $ | 272.1 | $ | 246.4 | |||||||||||||||||
- (1)
- Excludes net realized/unrealized capital
gains (losses).losses.
Year Ended December 31, 20042006 Compared to Year Ended December 31, 20032005
Premiums and other considerations increased $77.6$331.6 million, or 3%10%, to $3,096.6$3,598.7 million for the year ended December 31, 2004,2006, from $3,019.0$3,267.1 million for the year ended December 31, 2003.2005. Health insurance premiums increased $185.8 million, primarily from increased covered medical members and higher premium per member. Specialty benefits insurance premiums increased $93.1$180.4 million primarily due to strong sales and favorablestable retention. Health insurance premiums increased $24.6 million, primarily due to rate increases partially offset by the establishment of a premium refund accrual for pending litigation related to a business exited in the 1990's and by a decrease in average covered medical members. Partially offsetting these increases was a decrease of $40.1 million in individual life insurance premiums, primarily a result of a shift in marketing emphasis to universal and variable universal life insurance products from traditional life insurance products. Unlike traditional premium-based products, individual universal and variable universal life insurance premiums are not reported as U.S. GAAP revenue.
Fees and other revenues increased $83.0decreased $0.1 million or 24%, to $421.9$444.2 million for the year ended December 31, 2004,2006, from $338.9$444.3 million for the year ended December 31, 2003. Fee2005. Health insurance fees and other revenues decreased $8.0 million primarily due to a decrease in fee-for-service medical members. In addition, specialty benefits fees and other revenues decreased $2.7 million due to lower dental fees resulting from the sale of the dental offices in June 2006. Partially offsetting the decreases was a $10.6 million increase from our individual life insurance business increased $45.3 million, primarily due to strong sales growth ofin our fee-based universal and variable universal life insurance products. Fee revenues from our health insurance business increased $36.6 million, primarily due to growth in our fee-for-service business resulting from our acquisition of the Molloy Companies effective January 2, 2004.business.
Net investment income increased $6.4$17.2 million, or 1%3%, to $662.8$693.3 million for the year ended December 31, 2004,2006, from $656.4$676.1 million for the year ended December 31, 2003.2005. The increase primarily relates to an increase in the average annualized yield on invested assets and cash and to a $542.2,$118.3 million, or 6%1%, increase in average invested assets and cash for the segment. The increase was partially offset by a decrease in the average annualized yield on average invested assets and cash which was 6.4%6.3% for the year ended December 31, 2004,2006, compared to 6.7%6.2% for the year ended December 31, 2003. This reflects lower yields on invested assets due to a lower interest rate environment.2005.
Benefits, claims and settlement expenses increased $57.0$290.1 million, or 2%11%, to $2,514.7$2,910.3 million for the year ended December 31, 2004,2006, from $2,457.7$2,620.2 million for the year ended December 31, 2003. Specialty2005. Health insurance benefits, claims and settlement expenses increased $155.1 million primarily due to higher claim costs per member and growth, somewhat offset by reserve refinements. Despite generally lower loss ratios, specialty benefits insurance benefits, claims and settlement expenses increased $52.2$115.7 million, primarily due to growth in the business; however, loss ratios generally improved over this period.business.
Dividends to policyholders increased $1.8 million, or 1%, to $290.3 million for the year ended December 31, 2006, from $288.5 million for the year ended December 31, 2005. The increase is primarily related to the dividend scale changes effective in February 2006.
Operating expenses increased $44.5 million, or 4%, to $1,110.8 million for the year ended December 31, 2006, from $1,066.3 million for the year ended December 31, 2005. Specialty benefits insurance operating expenses increased $46.1 million due to growth in the business. Health insurance benefits, claims and settlementoperating expenses increased $34.9$25.5 million, primarily the
primarily due to increased claim costs per member. Theseresult of growth in the insured medical business. Partially offsetting these increases were partially offset bywas a $30.1$27.1 million decrease in the individual life insurance benefits, claims and settlementoperating expenses primarily due to a slower increase in reserves as a result of the continuing shift to universal and variable universal life insurance products from traditional life insurance products andlower DPAC amortization related to lower death claims.single premium sales and changes in claims experience in 2006.
Dividends to policyholders decreased $9.2Income taxes increased $4.2 million, or 3%, to $291.8$142.3 million for the year ended December 31, 2004,2006, from $301.0$138.1 million for the year ended December 31, 2003. The decrease is primarily related to the dividend scale decrease effective in February 2003 and a decrease in the individual life insurance dividend interest crediting rates resulting from a declining interest rate environment.
Operating expenses increased $96.9 million, or 11%, to $988.7 million for the year ended December 31, 2004, from $891.8 million for the year ended December 31, 2003. Individual life insurance operating expenses increased $45.0 million primarily due to increased DPAC amortization resulting from the refinements made to the DPAC valuation models for the individual universal and variable universal life insurance and traditional life insurance businesses in 2003 which reduced DPAC amortization in 2003. Individual life insurance operating expenses also increased as a result of increases in sales. Health insurance operating expenses increased $28.4 million, primarily the result of the acquisition of the Molloy Companies partially offset by lower operating expenses on the insured medical business due to a reduction in members and lower premium taxes. Specialty benefits insurance operating expenses increased $23.5 million due to growth in the business.
Income taxes increased $7.3 million, or 6%, to $129.9 million for the year ended December 31, 2004, from $122.6 million for the year ended December 31, 2003.2005. The effective income tax rate for the segment was 34%33% for the years ended December 31, 20042006 and 2003.2005. The effective income tax rates for the years ended December 31, 20042006 and 2003, were lower than the corporate income tax rate of 35% primarily due to interest exclusion from taxable income.
As a result of the foregoing factors, operating earnings increased $15.0 million, or 6%, to $256.2 million for the year ended December 31, 2004, from $241.2 million for the year ended December 31, 2003.
Net realized/unrealized capital losses, as adjusted, decreased $7.7 million, or 46%, to $8.9 million for the year ended December 31, 2004, from $16.6 million for the year ended December 31, 2003. The decrease resulted from fewer other than temporary declines in the value of certain fixed maturity securities.
As a result of the foregoing factors and the inclusion of an other after-tax adjustment, net income increased $21.8 million, or 10%, to $246.4 million for the year ended December 31, 2004, from $224.6 million for the year ended December 31, 2003. For the year ended December 31, 2004, net income included the negative effect of an other after-tax adjustment of $0.9 million due to a cumulative effect of accounting change, a result of our implementation of SOP 03-1.
Year Ended December 31, 2003 Compared to Year Ended December 31, 2002
Premiums and other considerations increased $45.6 million, or 2%, to $3,019.0 million for the year ended December 31, 2003, from $2,973.4 million for the year ended December 31, 2002. Specialty benefits insurance premiums increased $46.2 million primarily due to increased disability sales and stable retention. Health insurance premiums increased $29.6 million, primarily resulting from a reduction in ceded premium from group medical reinsurance, which was a result of a change in the accounting treatment of the contract, and rate increases. These increases in health insurance premium were partially offset by a decline in insured medical members. Also, partially offsetting these increases was a decrease of $30.2 million in individual life insurance premiums, primarily a result of a shift in marketing emphasis to universal and variable universal life insurance products from traditional life insurance products. Unlike traditional premium-based products, individual universal and variable universal life insurance premiums are not reported as U.S. GAAP revenue.
Fees and other revenues increased $25.7 million, or 8%, to $338.9 million for the year ended December 31, 2003, from $313.2 million for the year ended December 31, 2002. Fee revenues from our individual life insurance business increased $13.0 million, primarily due to a shift in marketing emphasis to fee-based universal and variable universal life insurance products. Fee revenues from our health insurance business increased $12.6 million, primarily due to growth and fee increases in our fee-for-service business.
Net investment income decreased $3.8 million, or 1%, to $656.4 million for the year ended December 31, 2003, from $660.2 million for the year ended December 31, 2002. The decrease primarily relates to a decrease in the average annualized yield on invested assets and cash, which was 6.7% for the year ended December 31, 2003, compared to 7.1% for the year ended December 31, 2002. This reflects lower yields on fixed maturity securities and commercial mortgages due in part to a lower interest rate environment. The decrease was partially offset by a $508.0, or 5%, increase in average invested assets and cash for the segment.
Benefits, claims and settlement expenses increased $24.3 million, or 1%, to $2,457.7 million for the year ended December 31, 2003, from $2,433.4 million for the year ended December 31, 2002. Specialty benefits insurance benefits, claims and settlement expenses increased $20.0 million, primarily due to growth in the business; however, loss ratios generally improved over this period. Health insurance benefits, claims and settlement expenses increased $16.8 million primarily due to a reduction in ceded claims for group medical reinsurance related to a change in the accounting
treatment of the contract and by increased claim costs per member. These increases were partially offset by a decrease in covered members.
Dividends to policyholders decreased $6.0 million, or 2%, to $301.0 million for the year ended December 31, 2003, from $307.0 million for the year ended December 31, 2002. The decrease is primarily related to changes in the individual life insurance dividend scale and a decrease in the dividend interest crediting rates resulting from the declining interest rate environment.
Operating expenses increased $40.6 million, or 5%, to $891.8 million for the year ended December 31, 2003, from $851.2 million for the year ended December 31, 2002. Specialty benefits insurance operating expenses increased $34.4 million due to increases in the loss adjustment expense, employee benefit cost, and non-deferrable expenses associated with growth in the business. Health insurance operating expenses increased $28.2 million, primarily due to increased employee benefit costs, accounting for a group medical reinsurance contract under the deposit method of accounting, and increased premium taxes. Partially offsetting these increases was a $22.0 million decrease in individual life insurance operating expenses primarily due to decreased DPAC amortization related to the implementation of new DPAC valuation models for the individual universal and variable universal life insurance and traditional life insurance businesses.
Income taxes increased $0.5 million to $122.6 million for the year ended December 31, 2003, from $122.1 million for the year ended December 31, 2002. The effective income tax rate for the segment was 34% for the years ended December 31, 2003 and 2002. The effective income tax rates for the years ended December 31, 2003 and 2002,2005, were lower than the corporate income tax rate of 35% primarily due to interest exclusion from taxable income.
As a result of the foregoing factors, operating earnings increased $8.1 million, or 3%, to $241.2$282.5 million for the year ended December 31, 2003,2006, from $233.1$274.4 million for the year ended December 31, 2002.2005.
Net realized/unrealized capital losses, as adjusted, increased $1.1 million, or 48%, to $3.4 million for the year ended December 31, 2006, from $2.3 million for the year ended December 31, 2005. The increase primarily resulted from increased impairments in 2006 as the result of a change in our ability and intent to hold certain fixed maturity securities until recovery due to the need to fund our acquisition of WM Advisors, a $7.5 million recovery of previously impaired securities received in 2005 related to a litigation settlement, and more losses related to derivative activities. These increases were partially offset by gains in 2006 versus losses in 2005 on the sale and call activity of fixed maturity securities, a software impairment in 2005 with no corresponding activity in 2006, the recovery of previously impaired securities as the result of a litigation claim received in 2006, and increased DPAC amortization associated with losses on invested assets.
As a result of the foregoing factors, net income available to common stockholders increased $7.0 million, or 3%, to $279.1 million for the year ended December 31, 2006, from $272.1 million for the year ended December 31, 2005.
Year Ended December 31, 2005 Compared to Year Ended December 31, 2004
Premiums and other considerations increased $170.5 million, or 6%, to $3,267.1 million for the year ended December 31, 2005, from $3,096.6 million for the year ended December 31, 2004. Specialty benefits insurance premiums increased $119.5 million primarily due to strong sales and steady retention. Health insurance premiums increased $94.9 million, primarily resulting from higher premium per member and an increase in average insured medical members. Partially offsetting these increases was a decrease of $43.9 million in individual life insurance premiums, primarily a result of the continuation of a shift in marketing emphasis to universal and variable universal life insurance products from traditional life insurance products and an increase in ceded reinsurance premium. Unlike traditional premium-based products, individual universal and variable universal life insurance premiums are not reported as U.S. GAAP revenue.
Fees and other revenues increased $22.4 million, or 5%, to $444.3 million for the year ended December 31, 2005, from $421.9 million for the year ended December 31, 2004. Fee revenues from our individual life insurance business increased $30.0 million, primarily due to growth in our fee-based universal and variable universal life insurance business. Fee revenues from our health insurance business decreased $7.9 million, primarily due to a decrease in average fee-for-service medical members.
Net investment income increased $13.3 million, or 2%, to $676.1 million for the year ended December 31, 2005, from $662.8 million for the year ended December 31, 2004. The increase primarily relates to a $518.4, or 5%, increase in average invested assets and cash for the segment. The increase was partially offset by a decrease in the average annualized yield on invested assets and cash, which was 6.2% for the year ended December 31, 2005, compared to 6.4% for the year ended December 31, 2004. This reflects lower yields on fixed maturity securities and commercial mortgages due in part to a lower interest rate environment.
Benefits, claims and settlement expenses increased $105.5 million, or 4%, to $2,620.2 million for the year ended December 31, 2005, from $2,514.7 million for the year ended December 31, 2004. Health insurance benefits, claims and settlement expenses increased $66.0 million primarily due to increases in claim costs per member and average members, even though loss ratios decreased. Likewise, despite lower loss ratios, specialty benefits insurance benefits, claims and settlement expenses increased $58.9 million, primarily due to growth in the business.
Dividends to policyholders decreased $3.3 million, or 1%, to $288.5 million for the year ended December 31, 2005, from $291.8 million for the year ended December 31, 2004. The decrease is primarily related to a decrease in the individual life insurance dividend interest crediting rates resulting from a declining interest rate environment.
Operating expenses increased $77.6 million, or 8%, to $1,066.3 million for the year ended December 31, 2005, from $988.7 million for the year ended December 31, 2004. Specialty benefits insurance operating expenses increased $45.7 million due to growth in the business. Health insurance operating expenses increased $29.5 million, primarily due to growth in the insured medical and wellness businesses and additional salary and benefit-related expenses.
Income taxes increased $8.2 million, or 6%, to $138.1 million for the year ended December 31, 2005, from $129.9 million for the year ended December 31, 2004. The effective income tax rate for the segment was 33% for the year ended December 31, 2005 and 34% for the year ended December 31, 2004. The effective income tax rates for the years
ended December 31, 2005 and 2004, were lower than the corporate income tax rate of 35% primarily due to the interest exclusion from taxable income.
As a result of the foregoing factors, operating earnings increased $18.2 million, or 7%, to $274.4 million for the year ended December 31, 2005, from $256.2 million for the year ended December 31, 2004.
Net realized/unrealized capital losses, as adjusted, decreased $33.4$6.6 million, or 67%74%, to $16.6$2.3 million for the year ended December 31, 2003,2005, from $50.0$8.9 million for the year ended December 31, 2002.2004. The decrease resulted from lower realized capitalis due to fewer other than temporary impairments of fixed maturity securities including a $7.5 million recovery of previously impaired securities received as the result of a litigation settlement offset in part by more losses related to other than temporary declines in the valuemark to market of certainderivative activities, a software impairment, and losses versus gains on the sale of fixed maturity securities.
As a result of the foregoing factors and the inclusion of ana 2004 other after-tax adjustment, net income available to common stockholders increased $46.1$25.7 million, or 26%10%, to $224.6$272.1 million for the year ended December 31, 2003,2005, from $178.5$246.4 million for the year ended December 31, 2002.2004. The other after-tax adjustment for the year ended December 31, 2002,2004, had a negative impact on net income of $4.6$0.9 million due to the cumulative effect of accounting change, a result of our implementation of SFAS 142.SOP 03-1.
Mortgage Banking Segment
The following table presents certain summary financial data relating to the Mortgage Banking segment for the years indicated:
| | For the year ended December 31, | |||||||||
|---|---|---|---|---|---|---|---|---|---|---|
| | 2004 | 2003 | 2002 | |||||||
| | (in millions) | |||||||||
| Operating Earnings Data: | ||||||||||
| Total operating revenues | $ | — | $ | — | $ | — | ||||
Total expenses | 16.7 | 29.3 | 27.0 | |||||||
| Pre-tax operating loss | (16.7 | ) | (29.3 | ) | (27.0 | ) | ||||
| Income tax benefits | (6.4 | ) | (11.2 | ) | (10.3 | ) | ||||
| Operating loss | (10.3 | ) | (18.1 | ) | (16.7 | ) | ||||
Net realized/unrealized capital gains (losses), as adjusted | — | — | — | |||||||
| Other after-tax adjustments | 122.3 | 61.3 | 159.6 | |||||||
| U.S. GAAP Reported: | ||||||||||
| Net income | $ | 112.0 | $ | 43.2 | $ | 142.9 | ||||
On July 1, 2004, we closed the sale of Principal Residential Mortgage, Inc. to CitiMortgage, Inc. Our Mortgage Banking segment, which includes Principal Residential Mortgage, Inc., is accounted for as a discontinued operation, under SFAS 144, and therefore the results of operations (excluding corporate overhead) have been removed from our results of continuing operations, cash flows, and segment operating earnings for all periods presented. Corporate overhead allocated to our Mortgage Banking segment does not qualify for discontinued operations treatment under SFAS 144 and was included in our results of continuing operations and segment operating earnings prior to July 1, 2004.
Corporate and Other Segment Summary Financial Data
The following table presents certain summary financial data relating to the Corporate and Other segment for the years indicated:
| | | For the year ended December 31, | | For the year ended December 31, | ||||||||||||||||||
|---|---|---|---|---|---|---|---|---|---|---|---|---|---|---|---|---|---|---|---|---|---|---|
| | | 2004 | 2003 | 2002 | | 2006 | 2005 | 2004 | ||||||||||||||
| | | (in millions) | | (in millions) | ||||||||||||||||||
| Operating Earnings Data: | Operating Earnings Data: | Operating Earnings Data: | ||||||||||||||||||||
| Operating Revenues(1): | Operating Revenues(1): | Operating Revenues(1): | ||||||||||||||||||||
| Total operating revenues | $ | (23.0 | ) | $ | 26.8 | $ | 1.6 | Total operating revenues | $ | (27.4 | ) | $ | (59.1 | ) | $ | (23.0 | ) | |||||
Expenses: | Expenses: | Expenses: | ||||||||||||||||||||
| Total expenses | 47.9 | 55.6 | 50.1 | Total expenses | (11.4 | ) | (6.9 | ) | 47.9 | |||||||||||||
| Pre-tax operating loss | (70.9 | ) | (28.8 | ) | (48.5 | ) | ||||||||||||||||
| Operating loss before income taxes and preferred stock dividends | Operating loss before income taxes and preferred stock dividends | (16.0 | ) | (52.2 | ) | (70.9 | ) | |||||||||||||||
| Income tax benefits | Income tax benefits | (50.5 | ) | (16.3 | ) | (31.5 | ) | Income tax benefits | (21.7 | ) | (48.5 | ) | (50.5 | ) | ||||||||
| Preferred stock dividends | Preferred stock dividends | 33.0 | 17.7 | — | ||||||||||||||||||
| Operating loss | Operating loss | (20.4 | ) | (12.5 | ) | (17.0 | ) | Operating loss | (27.3 | ) | (21.4 | ) | (20.4 | ) | ||||||||
Net realized/unrealized capital gains, as adjusted | 26.4 | 44.6 | 44.2 | |||||||||||||||||||
| Net realized/unrealized capital gains (losses), as adjusted | Net realized/unrealized capital gains (losses), as adjusted | 34.2 | (13.6 | ) | 26.4 | |||||||||||||||||
| Other after-tax adjustments | Other after-tax adjustments | — | 37.2 | 114.4 | Other after-tax adjustments | 41.2 | 64.5 | — | ||||||||||||||
| U.S. GAAP Reported: | U.S. GAAP Reported: | U.S. GAAP Reported: | ||||||||||||||||||||
| Net income | $ | 6.0 | $ | 69.3 | $ | 141.6 | ||||||||||||||||
| Net income available to common stockholders | Net income available to common stockholders | $ | 48.1 | $ | 29.5 | $ | 6.0 | |||||||||||||||
- (1)
- Excludes net realized/unrealized capital gains (losses).
Year Ended December 31, 20042006 Compared to Year Ended December 31, 20032005
Total operating revenues increased $31.7 million, or 54%, to a negative $27.4 million for the year ended December 31, 2006, from a negative $59.1 million for the year ended December 31, 2005. Net investment income increased $35.3 million reflecting an increase in average annualized investment yields as well as a decrease in investment expenses related to a significant variable interest in a coal-based synthetic fuel production facility. The decrease in investment expense from this investment largely corresponds to an increase in income taxes due to fewer estimated synthetic fuel tax credits generated from fuel production. Partially offsetting the increase in total revenues was a decrease of $3.5 million in fee revenue for transitional services provided to CitiMortgage, Inc., in the prior year, related to the sale of Principal Residential Mortgage, Inc., which is mostly offset by a corresponding change in total expense.
Total expenses decreased $4.5 million, or 65%, to a negative $11.4 million for the year ended December 31, 2006, from a negative $6.9 million for the year ended December 31, 2005. The decrease in total expenses was primarily due to a $9.8 million decrease in interest related to federal income tax activities as well as a $3.4 million decrease in transitional services provided to CitiMortgage, Inc., in the prior year, related to the sale of Principal Residential Mortgage, which is mostly offset in total revenue. The decrease in total expenses was largely offset by $12.2 million increase in interest related to the issuance of corporate debt.
Income tax benefits decreased $26.8 million, or 55%, to $21.7 million for the year ended December 31, 2006, from $48.5 million for the year ended December 31, 2005. The decrease was primarily due to a decrease in the estimated synthetic fuel tax credits in 2006, as well as a decrease in operating loss before income taxes and preferred stock dividends.
Preferred stock dividends increased $15.3 million, or 86%, to $33.0 million for the year ended December 31, 2006, from $17.7 million for the year ended December 31, 2005. The preferred stock dividends were a result of issuing preferred stock in June 2005.
As a result of the foregoing factors, operating loss increased $5.9 million, or 28%, to $27.3 million for the year ended December 31, 2006, from $21.4 million for the year ended December 31, 2005.
Net realized/unrealized capital gains, as adjusted, increased $47.8 million to $34.2 million for the year ended December 31, 2006, from $13.6 million net realized/unrealized losses for the year ended December 31, 2005. The increase was primarily due to the gain on sale of stock of an equity method investment, fewer losses on sales of invested assets, and the prior year impairment of an equity partnership interest.
As a result of the foregoing factors and the inclusion of other after-tax adjustments, net income available to common stockholders increased $18.6 million, or 63%, to $48.1 million for the year ended December 31, 2006, from $29.5 million for the year ended December 31, 2005. For the year ended December 31, 2006, net income included other after-tax adjustments totaling $41.2 million related to positive effects of: (1) gains on sales of real estate properties that qualify for discontinued operations treatment ($30.9 million) (2) a favorable court ruling on contested IRS issues for 1991 and later years ($18.8 million) and the negative effect of a contribution to the Principal Financial Group Foundation, Inc. ($8.5 million).
Year Ended December 31, 2005 Compared to Year Ended December 31, 2004
Total operating revenues decreased $49.8$36.1 million to a negative $59.1 million for the year ended December 31, 2005, from a negative $23.0 million for the year ended December 31, 2004, from a positive $26.8 million for the year ended December 31, 2003.2004. Net investment income decreased $50.2$21.5 million largelyprimarily due to a decrease in average annualized investment yields for the segment and unusually high mortgage prepayment income in the prior year. Contributing to the decline in yields is the increase in investment expenses related to the acquisition of a significant variable interest in a coal-based synthetic fuel production facility in June 2004. The increase in investment expense from this investment is more than offset by a decrease in income taxes due to synthetic fuel tax credits generated from the fuel production. In addition, the decrease in total revenues was partially due to a $8.2 million increase in inter-segment eliminations included in this segment, which was offset by a corresponding change in total expenses. Partially offsetting the decrease in total revenue was an increase of $11.1$7.7 million in fee revenue for transitional services that are provided to CitiMortgage, Inc. on a temporary basis, in the prior year, related to the sale of Principal Residential Mortgage, Inc., which is mostly offset by a corresponding change in total expense. Furthermore, the decrease in total revenues was due to a $5.5 million increase in inter-segment eliminations included in this segment, which was offset by a corresponding change in total expenses.
Total expenses decreased $7.7$54.8 million or 14%, to a negative $6.9 million for the year ended December 31, 2005, from a positive $47.9 million for the year ended December 31, 2004, from $55.6 million for the year ended December 31, 2003.2004. The decrease in total expenses was largelypartially due to a $19.3$23.0 million decrease in interest expenserelated to federal income tax audit activities as well as a $13.5 million decrease in interest related to the reduction inof corporate debt. Inter-segment eliminations included in this segment increased $8.2 million, resulting in a decrease in total expenses. TheFurthermore, the decrease in total expenses was offset by an increase of $10.8due to a $7.3 million fordecrease in transitional services that are provided to CitiMortgage, Inc. on a temporary basis, in the prior year, related to the sale of Principal Residential Mortgage, Inc., which is mostly offset in total revenue. In addition,Further contributing to the overall decrease in total expenses was offset by an increase ofa $7.2 million decrease related to a prior year prepayment penalty recognized in 2004 on the redemption of our surplus notes due 2024. In addition, inter-segment eliminations included in this segment increased $5.5 million, resulting in a decrease in total expenses.
Income tax benefits increased $34.2decreased $2.0 million, or 4%, to $48.5 million for the year ended December 31, 2005, from $50.5 million for the year ended December 31, 2004, from $16.32004. The decrease was primarily due to a decrease in operating loss before income taxes and preferred stock dividends, a change in income tax reserves established for IRS tax matters, as well as a tax benefit associated with the sale of a foreign investment in 2004. Largely offsetting these decreases in income tax benefits are a full year of synthetic fuel tax credits.
Preferred stock dividends were $17.7 million for the year ended December 31, 2003.2005, with no corresponding activity for the year ended December 31, 2004. The increase was primarily due to tax credits on our investmentpreferred stock dividends were a result of issuing preferred stock in a synthetic fuel production facility as well as an increase in pre-tax operating loss.June 2005.
As a result of the foregoing factors, operating loss increased $7.9$1.0 million, or 63%5%, to $21.4 million for the year ended December 31, 2005, from $20.4 million for the year ended December 31, 2004, from $12.52004.
Net realized/unrealized capital losses, as adjusted, increased $40.0 million to $13.6 million for the year ended December 31, 2003.
Net2005, from $26.4 million net realized/unrealized capital gains as adjusted, decreased $18.2 million, or 41%, to $26.4 million for the year ended December 31, 2004, from $44.6 million for the year ended December 31, 2003.2004. The decreaseincrease in net realized/unrealized capital losses was primarily due to less mark to market gains on certain seed money investments, and the impact of foreign currency transactions gains and losses. These losses were partially offset by gains on sales of invested assets in 2004 and fewer other than temporary declines in the value of certain fixed maturity securities.
As a result of the foregoing factors and the inclusion of other after-tax adjustments, net income decreased $63.3 million, or 91%, to $6.0 million for the year ended December 31, 2004, from $69.3 million for the year ended December 31, 2003. For the year ended December 31, 2003, net income included the positive effect of other after-tax adjustments totaling $37.2 million related to: (1) a decrease in income tax reserves established for contested IRS tax audit matters ($28.9 million) and (2) the cumulative effect of accounting change, a result of our implementation of FIN 46 ($8.3 million).
Year Ended December 31, 2003 Compared to Year Ended December 31, 2002
Total operating revenues increased $25.2 million to $26.8 million for the year ended December 31, 2003, from $1.6 million for the year ended December 31, 2002. Net investment income increased $17.6 million, reflecting an increase in average invested assets and cash as well as higher average annualized investment yields for the segment. The higher investment yields were primarily driven by the occurrence of unusually high earnings and mortgage prepayment income associated with the sale of certain minority held real estate assets in the current year. The increase in total revenues was also partially due to a $3.1 million decrease in inter-segment eliminations included in this segment, which was primarily offset by a corresponding change in total expenses.
Total expenses increased $5.5 million, or 11%, to $55.6 million for the year ended December 31, 2003, from $50.1 million for the year ended December 31, 2002. An increase of $6.2 million related to interest expense on the 144A debt, largely due to the termination of the hedges that were in place in 2002. An increase of $3.7 million related to an increase in costs associated with operating as a public company. In addition, interest expense also increased $3.2 million, primarily due to interest related to federal income tax audit activities. Inter-segment eliminations included in this segment decreased $3.1 million, resulting in an increase in total expenses. The increases were largely offset by a decrease of $15.0 million related to corporate initiatives funded by this segment.
Income tax benefits decreased $15.2 million, or 48%, to $16.3 million for the year ended December 31, 2003, from $31.5 million for the year ended December 31, 2002. The decrease was primarily due to a decrease in pre-tax operating loss as well as an additional state income tax benefit that was recognized in 2002.
As a result of the foregoing factors, operating loss decreased $4.5 million, or 26%, to $12.5 million for the year ended December 31, 2003, from $17.0 million for the year ended December 31, 2002.
Net realized/unrealized capital gains, as adjusted, increased $0.4 million, or 1%, to $44.6 million for the year ended December 31, 2003, from $44.2 million for the year ended December 31, 2002. Gains on the mark to market of certain seed money investments, reduced losses on sales of invested assets, and the impactimpairment of foreign currency transaction gains in 2003 were substantially offset by lower gains due to the sale of our investment in Coventry in February 2002.an equity partnership interest.
As a result of the foregoing factors and the inclusion of other after-tax adjustments, net income decreased $72.3available to common stockholders increased $23.5 million or 51%, to $69.3$29.5 million for the year ended December 31, 2003,2005, from $141.6$6.0 million for the
year ended December 31, 2002.2004. For the year ended December 31, 2003,2005, net income included the positive effect of other after-tax adjustments totaling $37.2$64.5 million related to: (1) a decrease in income tax reserves established for contestedand associated interest related to IRS tax audit matters ($28.942.2 million) and (2) the cumulative effectgains on sales of accounting change, a result of our implementation of FIN 46real estate properties that qualify for discontinued operations treatment ($8.3 million). For the year ended December 31, 2002, net income included the positive effect of other after-tax adjustments totaling $114.4 million related to: (1) the positive effect of the settlement of an IRS audit issue ($138.0 million) and (2) the negative effects of (a) an increase in our loss contingency reserve for sales practices litigation ($21.6 million) and (b) expenses related to our demutualization ($2.022.3 million).
Liquidity and Capital Resources
Our legal entity organizational structure has an impact on our ability to meet cash flow needs as an organization. Following is a simplified organizational structure.
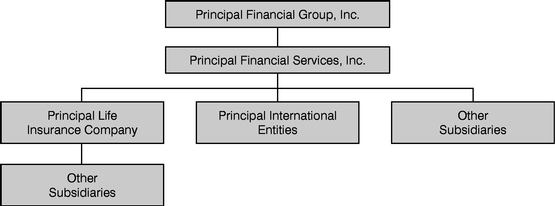
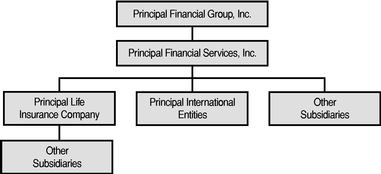
The Holding Companies: Principal Financial Group, Inc. and Principal Financial Services, Inc.
Liquidity describes the ability of a company to generate sufficient cash flows to meet the cash requirements of business operations. Our parent holding company, Principal Financial Group, Inc., is a Delaware business corporation, whose assets primarily consist of the outstanding capital stock of its subsidiaries. As a holding company, Principal
Financial Group Inc.'s ability to meet cash requirements, including the payments of dividends on common stock and the repurchase of stock, substantially depends upon dividends from subsidiaries, primarily Principal Life.
Dividends from Principal Life
The payment of stockholder dividends by Principal Life to its parent company is limited by Iowa laws. Under Iowa laws, Principal Life may pay dividends only from the earned surplus arising from its business and must receive the prior approval of the Insurance Commissioner of the State of Iowa ("the Commissioner") to pay a stockholder dividend if such a stockholder dividend would exceed certain statutory limitations. The current statutory limitation is the greater of:
- •
- 10% of Principal Life's statutory policyholder surplus as of the previous year-end; or
- •
- the statutory net gain from operations from the previous calendar year.
Iowa law gives the Commissioner discretion to disapprove requests for dividends in excess of these limits. Based on this limitation and 20042006 statutory results, Principal Life could pay approximately $591.1$660.4 million in stockholder dividends in 20052007 without exceeding the statutory limitation. Principal Life was able to pay approximately $701.2$630.7 million in statutory dividends in 20042006 based on its 20032005 statutory financial results without being subject to the restrictions on payment of extraordinary stockholder dividends.
On February 28, 2006, Principal Life declared a common stock dividend to its parent company of up to $625.0 million. The ordinary stockholder dividends paid by Principal Life to its parent company in 2006 were $426.2 million. Principal Life requested and received permission from the Commissioner to pay an extraordinary dividend in the amount of $750.0 million. The extraordinary stockholder dividends paid by Principal Life to its parent in 2006 were $750.0 million.
On November 2, 2005, Principal Life declared a dividend of up to $300.0 million. Total stockholder dividends paid by Principal Life to its parent company in 2005 were $200.0 million.
On May 19, 2004, Principal Life declared a dividend of up to $1.2 billion. Total ordinary stockholder dividends paid by Principal Life to its parent company in 2004 were $494.0 million. In March 2004, Principal Life redeemed $200.0 million of its surplus notes at a cost of $207.2 million. Principal Life and the Commissioner have agreed that this $207.2 million will be applied against Principal Life's 2004 ordinary dividend capacity. Principal Life requested and received permission from the Commissioner to pay an extraordinary dividend in the amount of $700.0 million, of which $630.0 million was paid as of December 31,in 2004. Principal Life did not pay a dividend in 2003.
Another source of liquidity is issuance of our common stock. Proceeds from the issuance of our common stock were $41.2 million and $18.3 million in 2004 and 2003, respectively.
In 2004, we paid $166.5 million in dividends to stockholders. We paid a dividend of $0.55 per share on December 17, 2004, to stockholders of record as of November 12, 2004. In 2003, we paid $145.3 million, or $0.45 per share, in dividends to stockholders.Shelf Registration
Our Board of Directors has authorized various repurchase programs under which we are allowed to purchase shares of our outstanding common stock. Shares repurchased under these programs are accounted for as treasury stock, carried at cost and reflected as a reduction to stockholders' equity. The repurchases are made in the open market or through privately negotiated transactions, from time to time, depending on market conditions.
Our Board of Directors authorized a repurchase program of up to $700.0 million of our outstanding common stock in May 2004, a repurchase program of up to $300.0 million of our outstanding common stock in May 2003 and a repurchase program of up to $300.0 million of our outstanding common stock in November 2002. We acquired 21.7 million and 15.0 million shares in the open market at an aggregate cost of $772.0 million and $453.0 million during the years ended December 31, 2004 and 2003, respectively. As of December 31, 2004, $75.0 million remains available for additional repurchases under the May 2004 share repurchase authorization.
Sources of liquidity also include facilities for short-term and long-term borrowing as needed, arranged through our intermediate holding company, Principal Financial Services Inc. ("PFSI"), and its subsidiaries. See "Contractual Obligations and Commercial Commitments" below.
Registration Statement. Although we generate adequate cash flow to meet the needs of our normal operations, periodically the need may arise to issue debt to fund internal expansion, acquisitions, investment opportunities and retirement of existing debt and equity. In December 2003, we filed a shelf registration statement with the Securities and Exchange Commission, which became effective on June 30, 2004. The shelf registration totals $3.0 billion, with the ability to issue debt securities, preferred stock, common stock, warrants, stock purchase contracts and stock purchase units of Principal Financial Group, Inc ("PFG")PFG and trust preferred securities of three subsidiary trusts. If we issue additional securities, we intend to use the proceeds from the sale of the securities offered by this prospectus, including the corresponding junior subordinated debentures issued to the trusts in connection with their investment of all the proceeds from the sale of preferred securities, for general corporate purposes, including working capital, capital expenditures, investments in subsidiaries, share repurchase, acquisitions and refinancing of debt, including commercial paper and other short-term indebtedness. PFSIPrincipal Financial Services, Inc. unconditionally guarantees our obligations with respect to one or more series of debt securities described in the shelf registration statement.
Senior Note Issuance. On October 16 and December 5, 2006, we issued $500.0 million and $100.0 million, respectively, of senior notes from our shelf registration, for net proceeds of $597.5 million. The notes will bear interest at a rate of 6.05% per year. Interest on the notes is payable semi-annually on April 15 and October 15, beginning on April 15, 2007. The notes will mature on October 15, 2036. A portion of the proceeds was used to fund the acquisition of WM Advisors, Inc., with the remaining proceeds being used for general corporate purposes. Following our senior note issuance, we now have the ability to issue up to $1.85 billion of debt securities, preferred stock, common stock, warrants, stock purchase contracts and stock purchase units of PFG and trust preferred securities of three subsidiary trusts, under the shelf registration.
Preferred Stock Issuances. On June 16, 2005, we issued 13.0 million shares of non-cumulative perpetual preferred stock under our shelf registration for net proceeds of $542.0 million. Substantially all of the preferred securities proceeds were used to repurchase shares of outstanding common stock.
Preferred Stock Dividend Restrictions and Payments. The certificates of designations for the preferred stock restrict the declaration of preferred dividends if we fail to meet specified capital adequacy, net income or stockholders' equity levels. As of December 31, 2006, we have no preferred dividend restrictions.
On March 30, 2006, June 30, 2006, October 2, 2006, and January 2, 2007, we paid a dividend of $8.3 million, $8.2 million, $8.3 million and $8.2 million, respectively, equal to $1.39 per share on Series A non-cumulative perpetual preferred stock and equal to $0.41 per share on Series B non-cumulative perpetual preferred stock. Dividends were paid to stockholders of record as of March 15, 2006, June 15, 2006, September 14, 2006, and December 14, 2006, respectively.
On September 30, 2005, and December 30, 2005, we paid a dividend of $9.4 million, and $8.3 million, respectively, equal to $1.59 per share and $1.39 per share, respectively, on Series A non-cumulative perpetual preferred stock and equal to $0.47 per share and $0.41 per share, respectively, on Series B non-cumulative perpetual preferred stock, to stockholders of record as of September 1, 2005, and December 15, 2005, respectively.
Common Stock Issued and Treasury Stock Acquired
Another source of liquidity is issuance of our common stock. Proceeds from the issuance of our common stock were $66.2 million and $59.9 million in 2006 and 2005, respectively.
In 2006, we paid $214.7 million in dividends to common stockholders. We paid a dividend of $0.80 per share on December 15, 2006, to stockholders of record as of November 22, 2006. In 2005, we paid $182.2 million, or $0.65 per share, in dividends to common stockholders. In 2004, we paid $166.5 million, or $0.55 per share, in dividends to common stockholders.
Our Board of Directors has authorized various repurchase programs under which we are allowed to purchase shares of our outstanding common stock. Shares repurchased under these programs are accounted for as treasury stock, carried at cost and reflected as a reduction to stockholders' equity. The repurchases are made in the open market or through privately negotiated transactions, from time to time, depending on market conditions.
On November 28, 2006, our Board of Directors authorized a repurchase program of up to $250.0 million of our outstanding common stock. As of December 31, 2006, no amountspurchases have been issuedmade under this program.
On May 19, 2006, following our shelf registration.Board of Directors' share repurchase authorization, we entered into an accelerated common stock repurchase agreement with a third party investment bank for an aggregate purchase price of $500.0 million. On this date, we paid $500.0 million and received the initial delivery of 7.7 million common shares, while retaining the right to receive additional common shares depending on the volume weighted average share price of our common stock over the program's duration. The program was completed in November 2006. Under this program, we purchased 9.3 million common shares at an average price of $53.59.
In November 2005, our Board of Directors authorized a repurchase program of up to $250.0 million of our outstanding common stock. This program was completed in May 2006. Under this program, we acquired 5.1 million shares in the open market at an aggregate cost of $250.0 million in 2006.
In June 2005, following our Board of Directors authorization of the repurchase of up to 15.0 million shares of our outstanding common stock, we entered into an accelerated stock repurchase agreement with a third party investment banker for approximately 13.7 million shares of our common stock with an initial payment of $542.3 million. This transaction was subject to a market pricing adjustment provision based on the volume weighted average market price over the execution period, which could be settled in shares or cash. On October 3, 2005, we elected to settle in cash. On November 10, 2005, the transaction was completed for an additional payment of $84.0 million. We do not intend to make further purchases under this program.
In March 2005, our Board of Directors authorized a repurchase program of up to $250.0 million of our outstanding common stock. This program began after the completion of the May 2004 repurchase program, which authorized the repurchase of up to $700.0 million of our outstanding common stock. Under the May 2004 and March 2005 repurchase programs, we acquired 8.4 million shares in the open market at an aggregate cost of $325.0 million in 2005. Of that amount, $75.0 million was acquired under the May 2004 repurchase program and $250.0 million was acquired under the March 2005 repurchase program. The share repurchase program announced in March 2005 was completed in May 2005.
Our Board of Directors authorized a repurchase program of up to $700.0 million of our outstanding common stock in May 2004. We acquired 21.7 million common shares in the open market at an aggregate cost of $772.0 million during the year ended December 31, 2004. Of that amount, $625.0 million was acquired under the May 2004 repurchase program and $147.0 million was acquired under the May 2003 repurchase program which was completed in 2004.
Sources of liquidity also include facilities for short-term and long-term borrowing as needed, arranged through our intermediate holding company, Principal Financial Services Inc. ("PFSI"), and its subsidiaries. See "Contractual Obligations and Commercial Commitments" below.
Principal Life
Historically, the primary cash flow sources for Principal Life have been premiums from life and health insurance products, pension and annuity deposits, asset management fee revenues, administrative services fee revenues, income from investments, proceeds from the sales or maturity of investments, long-term debt and short-term borrowings. Cash outflows consist primarily of payment of benefits to policyholders and beneficiaries, income and other taxes, current operating expenses, payment of dividends to policyholders, payments in connection with investments acquired, payments
made to acquire subsidiaries, payment of dividends to parent, and payments relating to policy and contract surrenders, withdrawals, policy loans, interest expense and repayment of short-term borrowings and long-term debt.
Principal Life maintains investment strategies generally intended to provide adequate funds to pay benefits without forced sales of investments. Products having liabilities with longer lives, such as life insurance and full-service payout pension products, are matched with assets having similar estimated lives such as mortgage loans, long-term bonds and private placement bonds. Shorter-term liabilities are matched with investments such as short and medium-term fixed maturities. In addition, highly liquid, high quality short-term investments are held to fund anticipated operating expenses, surrenders, withdrawals and development and maintenance expenses associated with new products and technologies. Our privately placed fixed maturity securities, commercial mortgage loans and real estate investments are generally less liquid than our publicly traded fixed maturity securities. As of December 31, 2004 and 2003, theseThese asset classes represented approximately 42%41% and 40% of the value of our consolidated invested assets.assets as of December 31, 2006 and 2005 respectively. See Item 7A. "Quantitative and Qualitative Disclosures about Market Risk-InterestRisk — Interest Rate Risk" for a discussion of duration matching.
Life insurance companies generally produce a positive cash flow from operations, as measured by the amount by which cash inflows are adequate to meet benefit obligations to policyholders and normal operating expenses as they are incurred. The remaining cash flow is generally used to increase the asset base to provide funds to meet the need for future policy benefit payments and for writing and acquiring new business. It is important to match the investment portfolio maturities to the cash flow demands of the type of annuity, investment or insurance product being provided. Principal Life continuously monitors benefits, surrenders and maturities to provide projections of future cash requirements. As part of this monitoring process, Principal Life performs cash flow testing of many of its assets and liabilities under various scenarios to evaluate the adequacy of reserves. In developing its investment strategy, Principal Life establishes a level of cash and securities which, combined with expected net cash inflows from operations, maturities of fixed maturity investments and principal payments on mortgage-backed securities and commercial mortgage loans, are believed adequate to meet anticipated short-term and long-term benefit and expense payment obligations. There can be no assurance that future experience regarding benefits and surrenders will be similar to historic experience since withdrawal and surrender levels are influenced by such factors as the interest rate environment and the claims paying ability and financial strength ratings of Principal Life.
Principal Life takes into account asset-liability management considerations in the product development and design process. Contract terms of 98% and 97% of Principal Life's universal and variable universal life insurance products as of December 31, 20042006 and 2003, respectively,2005, include surrender and withdrawal provisions which mitigate the risk of losses due to early withdrawals. These provisions generally do one or more of the following: limit the amount of penalty-free withdrawals; limit the circumstances under which withdrawals are permitted; or assess a surrender charge or market value adjustment relating to the underlying assets. The market value adjustment feature in Principal Life's fixed annuity products adjusts
the surrender value of a contract in the event of surrender prior to the end of the contract period to protect Principal Life against losses due to higher interest rates at the time of surrender.
Our GICs and funding agreements contain provisions limiting early surrenders, including penalties for early surrenders and minimum notice requirements.
The following table presents U.S. GAAP reserves for guaranteed investment contracts and funding agreements by withdrawal provisions as of December 31, 20042006 and 2003:2005:
| | | As of December 31, | | December 31, | ||||||||||||||
|---|---|---|---|---|---|---|---|---|---|---|---|---|---|---|---|---|---|---|
| | | 2004 | 2003 | | 2006 | 2005 | ||||||||||||
| | | (in millions) | | (in millions) | ||||||||||||||
| Book Value Out(1) | Book Value Out(1) | Book Value Out(1) | ||||||||||||||||
| Surrenderable: | Surrenderable: | Surrenderable: | ||||||||||||||||
| Book value out without surrender charge | $ | 5.2 | $ | 8.1 | Book value out without surrender charge | $ | 3.1 | $ | 3.7 | |||||||||
| Book value out with surrender charge | 1,701.8 | 1,355.1 | Book value out with surrender charge | 2,322.4 | 2,189.0 | |||||||||||||
| Total surrenderable | 1,707.0 | 1,363.2 | Total surrenderable | 2,325.5 | 2,192.7 | |||||||||||||
| Total book value out | 1,707.0 | 1,363.2 | Total book value out | 2,325.5 | 2,192.7 | |||||||||||||
Market Value Out(2) | Market Value Out(2) | Market Value Out(2) | ||||||||||||||||
| Less than 30 days' notice | Less than 30 days' notice | 0.7 | — | Less than 30 days' notice | — | — | ||||||||||||
| 30 to 89 days' notice | 30 to 89 days' notice | 25.3 | 63.2 | 30 to 89 days' notice | — | 23.8 | ||||||||||||
| 90 to 180 days' notice | 90 to 180 days' notice | 315.3 | 559.2 | 90 to 180 days' notice | 950.1 | 335.7 | ||||||||||||
| More than 180 days' notice | More than 180 days' notice | 3,926.3 | 4,349.3 | More than 180 days' notice | 3,261.1 | 3,591.8 | ||||||||||||
| No active surrender provision | No active surrender provision | 250.9 | 147.7 | No active surrender provision | 314.8 | 252.3 | ||||||||||||
| Total market value out | Total market value out | 4,518.5 | 5,119.4 | Total market value out | 4,526.0 | 4,203.6 | ||||||||||||
| Not puttable or surrenderable | Not puttable or surrenderable | 17,844.1 | 15,721.9 | Not puttable or surrenderable | 19,698.2 | 18,037.3 | ||||||||||||
| Total GICs and funding agreements | $ | 24,069.6 | $ | 22,204.5 | Total GICs and funding agreements | $ | 26,549.7 | $ | 24,433.6 | |||||||||
- (1)
- Book Value Out: The amount equal to the sum of deposits less withdrawals with interest accrued at the contractual interest rate.
- (2)
- Market Value Out: The amount equal to the book value out plus a market value adjustment to adjust for changes in interest rates.
International Asset Management and Accumulation Operations
Our Brazilian, ChileanHong Kong, Indian, and Mexican operations produced positive cash flow from operations for the year ended December 31, 2006. For the years ended December 31, 2005 and 2004, 2003our Chilean, Indian and 2002. Our IndianMexican operations produced positive cash flow from operations for the years ended December 31, 2004 and 2003.operations. These cash flows have been historically maintained at the local country level for strategic expansion purposes and local capital requirements. Our international operations have required infusions of capital primarily to fund acquisitions and to a lesser extent, to meet the cash outflow and capital requirements of certain operations. Our capital funding of these operations is consistent with our long-term strategy to establish viable companies that can sustain future growth from internally generated sources. Based on reviews of our current capital needs and strategic opportunities within our foreign operations, we are considering potential repatriation ofrepatriated a portion of the capital from certain countries in 2005.2006, 2005, and 2004.
Sources and Uses of Cash of Consolidated Operations
Activity, as reported in our consolidated statements of cash flows, provides relevant information regarding our sources and uses of cash. The following discussion of our operating, investing and financing portions of the cash flows excludes cash flows attributable to our discontinued operations, which were as follows:
| | For the year ended December 31, | |||||||||
|---|---|---|---|---|---|---|---|---|---|---|
| Cash flows attributable to discontinued operations: | ||||||||||
| 2006 | 2005 | 2004 | ||||||||
| | (in millions) | |||||||||
| Net cash provided by (used in) operating activities | $ | (1.1 | ) | $ | 125.1 | $ | 627.7 | |||
| Net cash used in investing activities | (0.9 | ) | (125.0 | ) | (473.7 | ) | ||||
| Net cash provided by financing activities | — | — | 600.0 | |||||||
Net cash provided by operating activities was $2,255.9$2,278.5 million, $3,063.9$2,126.2 million and $3,898.4$2,031.5 million for the years ended December 31, 2004, 20032006, 2005, and 2002,2004, respectively. The decreaseincrease in cash provided by our continuing operationsoperating activities in 2004 as2006 compared to 2003 is2005 was primarily duerelated to a decreasethe payment in mortgage escrow balances held2005 of an IRS deficiency related to the examination for 1999 - 2001. Also contributing to the increase in our banking operations that were closed outcash provided by the purchaser (or acquirer) as a result of the sale of Principal Residential Mortgage, Inc. to CitiMortgage, Inc., as well asoperating activities was an increase in proceeds in the net acquisitionmortgage loans held for sale activity, due to the transition of mortgage loans. These decreases were partially offset byour CMBS platform from Principal Commercial Funding I to a newly created entity, Principal Commercial Funding II, which is accounted for under the settlementequity method of intercompany arrangements received as a result of the sale of Principal Residential Mortgage, Inc.accounting. The decreaseincrease in cash provided by operating activities in 20032005 compared to 20022004 is due to an increase in cashpremiums and fees and other revenues received. This increase is partially offset by increased taxes paid for operating expenses as well as intercompany borrowings between our corporate segment and a discontinued segment. These intercompany borrowings were settled on July 1, 2004, in addition2005, largely due to the settlement2005 payment of all other intercompany arrangements and sales proceeds received as a result ofan Internal Revenue Service deficiency related to the sale of Principal Residential Mortgage, Inc. to CitiMortgage Inc.examination for 1999-2001.
Net cash used in investing activities was $3,178.7$3,912.9 million, $3,559.1$1,483.7 million and $3,005.0$3,184.6 million for the years ended December 31, 2006, 2005, and 2004, 2003respectively. The increase in cash used in investing activities in 2006 compared to 2005 was primarily due to a decrease in sales and 2002, respectively.fewer maturities of available-for-sales securities, partially offset by a decrease in purchases of available-for-sale securities. Also contributing to the increase was an increase in mortgage loans acquired and a decrease in mortgage loans sold. The acquisition of WM Advisors in the fourth quarter of 2006 also contributed to the increase in cash used in investing activities. The decrease in cash used in 20042005 for investing activities compared to 20032004 is primarily due to cash received froma decrease in the net acquisitions of available-for-sale securities and mortgage loans. Offsetting this was the sale of subsidiaries, including the sale of Principal Residential Mortgage, Inc. to CitiMortgage, Inc., in addition to an increase2004, with no corresponding activity in net sales of mortgage loans and real estate. Offsetting these was an increase in the net acquisition of available-for-sale securities over the prior year. The increase in cash used in 2003 compared to 2002 is due to the sale in 2002 of substantially all of BT Financial Group as well as the sale of our shares of
Coventry Stock. Also contributing to the increase in cash usage in 2003 was an increase in mortgage loan acquisition activity. Offsetting was an increase in net cash received from available for sale securities activity.2005.
Net cash provided by financing activities was $182.8$1,585.9 million, $546.2 million and $959.9$414.1 million for the years ended December 31, 2006, 2005, and 2004, and 2003, respectively. Net cash used by financing activities was $721.2 million for the year ended December 31, 2002. The decrease in cash provided by financing activities in 2004 compared to 2003 was primarily due to an increase in debt payments in current year, an increase in the cash paid for the repurchase of shares of our common stock, as well as a decrease in bank deposits. This was partially offset by an increase in investment contract deposits, net of withdrawals. The increase in cash provided by financing activities in 20032006 compared to 2002 is2005 was primarily due to the issuance of $600.0 million of senior notes from our shelf registration in the fourth quarter of 2006 in addition to an increase in net deposits of investment contract deposits, netcontracts and a decrease in treasury stock acquisitions in 2006 compared to 2005. Offsetting these increases in cash provided were repayments of withdrawals, anshort-term borrowings, as well as the preferred stock issuance in 2005, with no corresponding activity in 2006. The increase in bank depositscash provided by financing activities in 2005 compared to 2004 was primarily due to a preferred stock issuance in 2005, increases in short term borrowing as well as a reduced amountreduction in long term debt repayments in 2005. These increases were partially offset by a decrease in net deposits of cash paid for the repurchase of shares of our commoninvestment contracts, an increase in treasury stock compared to the prior year.
On October 22, 2004, the American Jobs Creation Act of 2004 ("the "Act") was signed into law. The Act includes a repatriation provision granting U.S. corporations a special deduction of 85% of certain qualifying dividends from their foreign subsidiaries. A company may elect to apply this provision to qualifying earnings that are repatriated in its 2005 tax year. We have begun an evaluation of the effects of this repatriation provision; however, we do not expect to be able to complete our evaluation until Congress, the Treasury Departmentacquisitions and the Internal Revenue Service provide additional clarifying language and/or guidance on certain key elements of the provision. Whether we will ultimately elect to utilize this repatriation provision depends on a number of factors including review of this related guidance. We expect to complete our review and analysis of the effects of the repatriation provision within a reasonable period of time following issuance of the future clarifying language and/or guidance. The range of possible amounts that we are considering for repatriation under this provision is between zero and approximately $54 million. Taking into consideration our current accrual, which does not apply the provisions of the Act, the related potential range of income tax effects of such repatriation under the Act is between zero and a benefit of approximately $1.7 million.
The Internal Revenue Service (the "Service") completed the examination for 1999 - 2000 on December 29, 2004, and issued a notice of deficiency. We paid the deficiency (approximately $444.0 million, including interest) in January 2005 and plan to file claims for refund relating to the disputed adjustments. The majority of the deficiency is attributable to the disallowance of carry-backs of capital losses, net operating losses and foreign tax credits arising in years after 2001; we expect the Service to allow the carry-backs upon completion of the audit of the returns for the years in which the losses and credits arose. The remainder of the deficiency is attributable to both contested issues and adjustments that we have accepted. We believe that we have adequate defenses against, or sufficient provisions for, the contested issues. Consequently, we do not expect the ultimate resolution of issues in tax years 1999 - 2000 to have a material impact on our net income. In order to make the January 2005 payment, we utilized some of our short-term debt capacity as a funding source. Short-term debt capacity and available cash will provide sufficient liquidity for our operations until the longer-term funding strategy is finalized during the first quarter of 2005. While the amount representing the disallowed carry-backs should be refunded within the next year, final settlement on the contested issues could take several years while legal remedies are pursued.accelerated stock repurchase settlement.
Given the historical cash flow of our subsidiaries and the financial results of these subsidiaries, we believe the cash flow from our consolidated operating activities over the next year will provide sufficient liquidity for our operations, as well as satisfy interest payments and any payments related to debt servicing.
Impacts of Income Taxes
The Internal Revenue Service (the "Service") has completed examinations of the U.S. consolidated federal income tax returns for 2003 and prior years. The Service's completion of the examinations for the years 1999 - 2001 resulted in notices of deficiency dated December 29, 2004, and March 1, 2005. We paid the deficiencies (approximately $444.0 million for 1999 and 2000, and $1.3 million for 2001, including interest) in the first quarter of 2005 and have filed, or will file, claims for refund relating to the disputed adjustments. The examination for the years 2002 and 2003 resulted in a refund of approximately $176.7 million (including interest) of which $161.5 million related to deficiencies previously paid as a result of the 1999-2001 examination. We believe that we have adequate defenses against, or sufficient provisions for, the contested issues, but final resolution of the contested issues could take several years while legal remedies are pursued. Consequently, we do not expect the ultimate resolution of issues in tax years 1999 - 2003 to have a material impact on our net income. Similarly, we believe there are adequate defenses against, or sufficient provisions for, any challenges that might arise in tax years subsequent to 2003.
On October 22, 2004, the American Jobs Creation Act of 2004 (the "Act") was signed into law. The Act included a repatriation provision granting U.S. corporations a special deduction of 85% of certain qualifying dividends from their foreign subsidiaries. A company could elect to apply this provision to qualifying earnings that were repatriated in its 2005 tax year. Pursuant to the Act, we implemented two domestic reinvestment plans in 2005. In accordance with the provisions of the Internal Revenue Code, we elected an 85% dividend received deduction on eligible cash dividends totaling $28.8 million.
Ratio of Earnings to Fixed Charges
The ratio of earnings to fixed charges is a measure of our ability to cover fixed costs with current period earnings. A high ratio indicates that earnings are sufficiently covering committed expenses. The following table sets forth, for the years indicated, our ratios of:
- •
- earnings to fixed charges before interest credited on investment products; and
- •
- earnings to fixed charges.
| | For the year ended December 31, | |||||||||
|---|---|---|---|---|---|---|---|---|---|---|
| | 2006 | 2005 | 2004 | 2003 | 2002 | |||||
| Ratio of earnings to fixed charges before interest credited on investment products | 10.2 | 11.1 | 9.5 | 7.5 | 4.5 | |||||
| Ratio of earnings to fixed charges | 2.2 | 2.1 | 2.0 | 1.9 | 1.4 | |||||
We calculate the ratio of "earnings to fixed charges before interest credited on investment products" by dividing the sum of income from continuing operations before income taxes (BT), interest expense (I), interest factor of rental expense (IF) less undistributed income from equity investees (E) by the sum of interest expense (I), interest factor of rental expense (IF), preferred stock dividends by the registrant (PD) and dividends on majority-owned subsidiary redeemable preferred securities (non-intercompany) (D). The formula for this ratio is: (BT+I+IF-E)/(I+IF+PD+D).
We calculate the ratio of "earnings to fixed charges" by dividing the sum of income from continuing operations before income taxes (BT), interest expense (I), interest factor of rental expense (IF) less undistributed income from equity investees (E) and the addition of interest credited on investment products (IC) by interest expense (I), interest factor of rental expense (IF), preferred stock dividends by the registrant (PD), dividends on majority-owned subsidiary redeemable preferred securities (non-intercompany) (D) and interest credited on investment products (IC). The formula for this calculationratio is: (BT+I+IF-E+IC)/(I+IF+PD+D+IC). "Interest credited on investment products" includes interest paid on guaranteed
investment contracts, funding agreements and other investment-only pension products. Similar to debt, these products have a total fixed return and a fixed maturity date.
| | For the year ended December 31, | |||||||||
|---|---|---|---|---|---|---|---|---|---|---|
| | 2004 | 2003 | 2002 | 2001 | 2000 | |||||
| Ratio of earnings to fixed charges before interest credited on investment products | 10.3 | 8.3 | 4.5 | 3.2 | 6.5 | |||||
Ratio of earnings to fixed charges | 2.0 | 2.0 | 1.4 | 1.3 | 1.8 | |||||
Contractual Obligations and Commercial Commitments
The following table presents payments due by period for long-term contractual obligations as of December 31, 2004:2006:
| | | Payments due in year ending | | ||||||||||||||||
|---|---|---|---|---|---|---|---|---|---|---|---|---|---|---|---|---|---|---|---|
| Contractual Obligations(1) | Outstanding at December 31, 2004 | 2005 | 2006- 2007 | 2008- 2009 | 2010 and Thereafter | Indeterminate Maturity | |||||||||||||
| | (in millions) | ||||||||||||||||||
| Balance Sheet: | |||||||||||||||||||
| GICs and funding agreements(2) | $ | 32,183.3 | $ | 6,008.9 | $ | 8,292.0 | $ | 4,842.0 | $ | 9,502.3 | $ | 3,538.1 | |||||||
| Future policy benefits and claims (3) | 16,042.6 | — | — | — | — | 16,042.6 | |||||||||||||
| Long-term debt(4) | 843.5 | 46.1 | 151.9 | 540.6 | 104.9 | — | |||||||||||||
| Separate account liabilities(5) | 51,507.9 | — | — | — | — | 51,507.9 | |||||||||||||
| Certificates of deposit | 716.6 | 337.1 | 128.0 | 251.5 | — | — | |||||||||||||
| Other long-term liabilities(6) | 548.8 | — | — | — | 189.7 | 359.1 | |||||||||||||
Off Balance Sheet: | |||||||||||||||||||
| Long-term debt interest | 548.7 | 64.8 | 122.6 | 84.0 | 277.3 | — | |||||||||||||
| Operating leases(7) | 175.6 | 48.2 | 68.5 | 31.4 | 27.5 | — | |||||||||||||
| Purchase obligations(8) | 125.5 | 84.9 | 37.7 | 2.9 | — | — | |||||||||||||
| Total contractual obligations | $ | 102,692.9 | $ | 6,590.0 | $ | 8,800.7 | $ | 5,752.4 | $ | 10,101.7 | $ | 71,447.7 | |||||||
| | | Payments due in year ending | |||||||||||||
|---|---|---|---|---|---|---|---|---|---|---|---|---|---|---|---|
| Contractual Obligations(1) | Total Payments | 2007 | 2008- 2009 | 2010- 2011 | 2012 and thereafter | ||||||||||
| | (in millions) | ||||||||||||||
| Contractholder funds(2) | $ | 57,615.5 | $ | 8,653.1 | $ | 12,054.9 | $ | 8,661.3 | $ | 28,246.2 | |||||
| Future policy benefits and claims(3) | 38,503.6 | 1,945.2 | 3,231.3 | 3,126.5 | 30,200.6 | ||||||||||
| Long-term debt(4) | 1,553.8 | 143.5 | 94.8 | 578.7 | 736.8 | ||||||||||
| Certificates of deposit(5) | 870.9 | 430.6 | 376.2 | 60.0 | 4.1 | ||||||||||
| Other long-term liabilities(6) | 674.2 | 457.1 | — | — | 217.1 | ||||||||||
| Capital leases | 17.9 | 0.9 | 2.1 | 2.3 | 12.6 | ||||||||||
| Long-term debt interest | 1,624.9 | 104.2 | 184.8 | 164.9 | 1,171.0 | ||||||||||
| Operating leases(7) | 215.5 | 56.4 | 85.1 | 43.8 | 30.2 | ||||||||||
| Purchase obligations(8) | 739.3 | 707.2 | 23.1 | 9.0 | — | ||||||||||
| Total contractual obligations | $ | 101,815.6 | $ | 12,498.2 | $ | 16,052.3 | $ | 12,646.5 | $ | 60,618.6 | |||||
- (1)
- Excludes short-term liabilities, other policyholder funds, taxes and short-term debt as these are not long-term and/or not contractual in nature. Also excludes obligations under our pension and other postretirement benefit plans as benefit payments will be made under a funded plan and will not require company contributions or payments within a five-year period. In addition, separate account liabilities are excluded. Separate account liabilities represent the fair market value of funds that are separately administered by the Company. Generally, the separate account contract owner, rather than the Company, bears the investment risk of these funds. The separate account liabilities are legally segregated and are not subject to claims that arise out of any other business of the Company. Net deposits, net investment income and realized and unrealized capital gains and losses on the separate accounts are not reflected in the consolidated statement of operations. The separate account obligations will be fully funded by cash flows from the separate account assets.
- (2)
- Includes GICs, funding agreements (described below), individual fixed annuities, universal life insurance, and other investment-type contracts.
Our guaranteed investment contracts and funding agreements contain provisions limiting early surrenders, which typically include penalties for early surrenders, and minimum notice requirements.requirements or, in the case of funding agreements with survivor options, minimum pre-death holding periods and specific maximum amounts.
Funding agreements include those issued directly to nonqualified institutional investors, as well as to three separate programs where the funding agreements arehave been issued directly or indirectly to unconsolidated special
purpose entities. Claims for principal and interest under funding agreements are afforded equal priority to claims of life insurance and annuity policyholders under insolvency provisions of Iowa Insurance Laws.
We are authorized to issue up to $4.0 billion of funding agreements under a program established in 1998 to support the prospective issuance of medium term notes by an unaffiliated entity in non-U.S. markets. As of December 31, 20042006 and 2003, $3,867.02005, $3,770.4 million and $3,618.7$3,203.6 million, respectively, of liabilities are being held with respect to the issuance outstanding under this program. We do not anticipate any new issuance activity under this program as we are authorized to issue up to Euro 4.0 billion (approximately USD$5.3 billion) of funding agreements under a program established in 2006 to support the prospective issuance of medium term notes by an unaffiliated entity in non-U.S. markets. The unaffiliated entity is an unconsolidated special purpose vehicle. As of December 31, 2006, $474.1 million of liabilities are outstanding with respect to the issuance outstanding under this new program.
In addition, we are authorized to issue up to $7.0 billion of funding agreements under a program established in 2001 to support the prospective issuance of medium term notes by an unaffiliated entity in both domestic and international markets. As of December 31, 20042006 and 2003, $5,462.32005, $3,747.9 million and $5,613.4$4,744.5 million, respectively, of liabilities arewere being held with respect to the issuance outstanding under this program. We do not anticipate any new issuance activity under this program, given our December 2005 termination of the March, 2004 establishmentdealership agreement for this program and the availability of the SEC-registered program described in the nextfollowing paragraph.
We are authorized to issue up to $4.0 billion of funding agreements under a program established in March 2004 to support the prospective issuance of medium term notes by unaffiliated entities in both domestic and international markets. In recognition of the use of nearly all $4.0 billion of initial issuance authorization, the program was amended in February 2006 to authorize issuance of up to an additional $5.0 billion. Under this program, both the notes and the supporting funding agreements are registered with the U.S. Securities and Exchange Commission.SEC. As of December 31, 2004, $1,831.52006 and 2005, $5,831.4 million and $3,667.9 million, respectively, of liabilities are being held with respect to the issuance outstanding under this program. In contrast with direct funding agreements, GIC issuances and the other two funding agreement-backed medium term note programs described above, Principal Life's payment obligations on each funding agreement issued under this SEC-registered program are guaranteed by Principal Financial Group, Inc.
The GICs and funding agreementsAmounts included in the contractholder funds line item includes a valuereflect estimated cash payments to be made to policyholders. The sum of the cash outflows shown for indeterminate maturity. Thisall years in the table exceeds the corresponding liability amount representsincluded in our universal life insurance productsconsolidated financial statements as of December 31, 2006. The liability amount in our consolidated financial statements reflects estimated cash payments to policyholders, assumptions with regard to the timing of cash payments and other investment-type contracts, as the payments of these liabilities is dependent upon either a customer decision to withdraw funds or death, the payment date is indeterminate.discounting for interest.
- (3)
FutureAmounts included in the future policy benefits and claimsreflect liabilities such as expected death claims, medical claims and disability claims. In general, thisline itemrepresentsreflect estimated cash payments to be made to policyholders. The sum of thecompany'scash outflows shown for all years in the table exceeds the corresponding liability amount included in our consolidated financial statements as of December 31,2006. The liability amount in our consolidated financial statements reflects estimated cash payments to policyholders, reductions for expectedobligation on products that have insurance risk. Duefuture premiums, assumptions with regard tonaturethe timing ofthese liabilities, maturity is event dependentcash payments andtherefore, these have been classified as indeterminate maturity.discounting for interest.- (4)
- The following are included in long-term debt:
On October 16 and December 5, 2006, we issued $500.0 million and $100.0 million, respectively, of senior notes from our shelf registration, which was filed with the SEC in December 2003. The notes will bear interest at a rate of 6.05% per year. Interest on the notes is payable semi-annually on April 15 and October 15, beginning on April 15, 2007. The notes will mature on October 15, 2036. A portion of the proceeds was used to fund the acquisition of WM Advisors, Inc., with the remaining proceeds being used for general corporate purposes.
On November 3, 2005, Principal International de Chile S.A., a wholly owned indirect subsidiary, entered into long-term borrowing agreements with two Chilean banks in the amount of US $93.9 million. This debt is denominated in Unidades de Formento ("UF"), a Chilean inflation-indexed, peso-denominated monetary unit. Of this amount, US $49.0 million of UF +4.59% notes and US $44.9 million of UF +4.93% notes mature on November 3, 2011. Interest on the notes is payable semi-annually on May 3 and November 3 each year. The debt outstanding and interest expense will vary due to fluctuations in the Chilean peso to US dollar exchange rates and Chilean inflation.
On August 25, 1999, Principal Financial Group (Australia) Holdings Pty. Limited, a wholly owned indirect subsidiary, issued $665.0 million of unsecured redeemable long-term debt. Of this amount, $200.0 million of 7.95% notes matured on August 15, 2004, with the remaining $465.0 million in 8.2% notes due August 15, 2009. On December 28, 2001, all of the long-term debt obligations of Principal Financial Group (Australia) Holdings Pty. Limited were assumed by its parent, Principal Financial Services, Inc.
On March 10, 1994, Principal Life issued $300.0$100.0 million of surplus notes including $200.0 million due March 1, 2024, at a 7.875% annual interest rate and the remaining $100.0 million due March 1, 2044, at an 8% annual interest rate. None of our affiliates hold any portion of the notes. Each payment of interest and principal on the notes, however, may be made only with the prior approval of the Commissioner and only to the extent that Principal Life has sufficient surplus earnings to make such payments.
After receiving approval from the Commissioner, the surplus notes due March 1, 2024, were optionally redeemed by Principal Life on March 1, 2004, in whole at a redemption price of approximately 103.6% of par. Total cash paid for the surplus note redemption on March 1, 2004, was $207.2 million.
Subject to Commissioner approval, the notes due March 1, 2044, may be redeemed at Principal Life's election on or after March 1, 2014, in whole or in part at a redemption price of approximately 102.3% of par. The approximate 2.3% premium is scheduled to gradually diminish over the following ten years. These notes may be redeemed on or after March 1, 2024, at a redemption price of 100% of the principal amount plus interest accrued to the date of redemption.
Long-term debt also includes $280.1$298.0 million of mortgages and other notes payable related to real estate developments. We, including certain subsidiaries, had $125.0$135.0 million in credit facilities as of December 31, 2006, with various financial institutions, in addition to obtaining loans with various lenders to finance these developments. Outstanding principal balances as of December 31, 2004,2006, range from $0.4$0.3 million to $98.7$96.2 million per development with interest rates generally ranging from 6.0%5.5% to 8.6%. Outstanding principal balances as of December 31, 2003,2005, range from $0.4$0.3 million to $99.9$97.5 million per development with interest rates generally ranging from 6.0%5.5% to 8.6%. Outstanding debt is secured by the underlying real estate properties, which were reported as real estate on our consolidated statements of financial position with a carrying value of $298.7$246.2 million and $322.1$284.1 million as of December 31, 20042006 and 2003,2005, respectively.
In addition to the mortgages and notes payable noted above, we assumed a long-term debt obligation with the purchase of WM Advisors, Inc. As part of the purchase, we will be bound by a class B share financing agreement previously entered into by WM Advisors, Inc. and a third party, which was assigned a value of $86.9 million at purchase. Load mutual fund shares sold without a front end load are referred to as "B shares". In exchange for paying the selling commission, the company receives fees in the future to recover the up-front commission cost incurred. Prior to our purchase, WM Advisors, Inc. had entered into a purchase and sale agreement whereby the third party would purchase the rights to future cash flow streams in exchange for funding the sales commissions. The fair value of these relinquished fees is reported as a long-term debt liability. There will be no additional sales under this agreement following the effective date of the purchase. Therefore, this liability will be extinguished within eight years, which equates to the contractual term in which the fund can recover fees to cover the upfront commission costs.
- (5)
Separate accountAmounts included in the certificates of deposit line item reflect estimated cash payments to be made, including expected interest payments. Certificates of deposits are reported as other liabilitiesrepresent the fair market value of funds that are separately administered by the Company. Generally, the separate account contract owner, rather than the Company, bears the investment risk of these funds. The separate account liabilities are legally segregated and are not subject to claims that arise out of any other business of the Company. Net deposits, net investment income and realized and unrealized capital gains and lossesonthe Separate Accounts are not reflected in theour consolidated statement ofoperations. As the payment of these liabilities is dependent on a customer decision to withdraw funds, the payment date is indeterminate.financial position.- (6)
- Other long-term liabilities include other
balance sheetliabilities reflected in the consolidated statement of financial position that are contractual, non-cancelable and long-term in nature.Payment of certain liabilities is event driven and the payment date is indeterminate.This line item excludes accruals and short-term items in the amount of$1,984.9$3,209.4 million. - (7)
- As a lessee, we lease office space, data processing equipment and office furniture and equipment under various operating leases.
- (8)
- Purchase obligations include material contracts where we have a non-cancelable commitment to purchase goods and
services.services in addition to commitments to originate loans and purchase investments.
Contractual Commitments
In connection with our banking business, we make additional commitments to extend credit, which are agreements to lend to a customer as long as there is no violation of any conditions established in the contract. Commitments generally have fixed expiration dates or other termination clauses and may require payment of a fee. Since manyA majority of thethese commitments are lines of credit and are expected to expire without being drawn upon,upon. Therefore, the total commitment amounts do not necessarily represent future cash funding requirements. We evaluate each customer's creditworthiness on a case-by-case basis. The total commitments to fund loans were $146.5$135.7 million as of December 31, 2004.2006.
Short-Term Debt
The components of short-term debt as of December 31, 20042006 and 2003,2005 are as follows:
| | | December 31, | | December 31, | ||||||||||
|---|---|---|---|---|---|---|---|---|---|---|---|---|---|---|
| | | 2004 | 2003 | | 2006 | 2005 | ||||||||
| | | (in millions) | | (in millions) | ||||||||||
| Commercial paper | Commercial paper | $ | 75.0 | $ | 399.8 | Commercial paper | $ | — | $ | 349.9 | ||||
| Other recourse short-term debt | Other recourse short-term debt | 56.4 | 27.0 | Other recourse short-term debt | 23.1 | 55.1 | ||||||||
| Non-recourse short-term debt | Non-recourse short-term debt | 150.3 | 276.0 | Non-recourse short-term debt | 61.0 | 71.4 | ||||||||
| Total short-term debt | $ | 281.7 | $ | 702.8 | Total short-term debt | $ | 84.1 | $ | 476.4 | |||||
As of December 31, 2004,2006, we had credit facilities with various financial institutions in an aggregate amount of $1.1 billion.$887.7 million. As of December 31, 20042006 and 2003,2005, we had $281.7$84.1 million and $702.8$476.4 million of outstanding borrowings related to our credit facilities, with $221.3$74.5 million and $333.3$110.6 million of assets pledged as support, respectively. Assets
pledged consisted primarily of commercial mortgages and securities. Our credit facilities also include a $600.0 million back-stop facility to provide 100% support for our commercial paper program, of which there were no outstanding balances as of December 31, 2004.2006.
The weighted-average interest rates on short-term borrowings as of December 31, 20042006 and 2003,2005, were 2.7%5.6% and 1.6%,4.5% respectively.
Off-Balance Sheet Arrangements
Variable Interest Entities. We have relationships with various types of special purpose entities and other entities where we have a variable interest.interest as described in Item 8, "Financial Statements and Supplementary Data, Notes to Consolidated Financial Statements, Note 5 Variable Interest Entities." We do not have a direct or contingent obligation related to our unconsolidated variable interest entities.entities other than described below.
Synthetic Fuel Production Facility. In June 2004, we acquired a significant variable interest in a coal-based synthetic fuel production facility where we are not the primary beneficiary. Our minority ownership interest was acquired in exchange for consideration of $37.0 million, which is primarily comprised of a non-recourse note payable for $36.0 million, as well as a commitment to fund our pro-rata share of the operations. We have also agreed to make additional payments to the seller based on our pro-rata allocation of the tax credits generated by the facility. The synthetic fuel produced at the facility through 2007 qualifies for tax credits pursuant to Section 29 of the Internal Revenue Code (currently credits are not available for fuel produced after 2007). Our obligation to support the entity's future operations is, therefore, limited to the tax benefit we expect to receive.
Retained Interests in Securitized Assets. We, along with other contributors, sell commercial mortgage loans in securitization transactions to trusts. As these trusts are classified as a qualifying special purpose entity, they are not subject to the VIE consolidation rules. We may retain interests in the securitization transaction. At December 31, 2006 and 2005, the fair values of retained interests related to the securitizations of commercial mortgage loans were $345.3 million and $321.0 million, respectively. The investors and the securitization entities have no recourse to our assets for failure of debtors to pay when due. The value of our retained interests is subject primarily to credit risk.
Guarantees and IndemnificationsIndemnifications.
In the normal course of business, we have provided guarantees to third parties primarily related to a former subsidiary, joint ventures and industrial revenue bonds. These agreements generally expire from 2004 through 2019. The maximum exposure under these agreements as of December 31, 2004,2006, was approximately $210.0$180.0 million; however, we believe the likelihood is remote that material payments will be required and therefore have not accrued for a liability on our consolidated statements of financial position. Should we be required to perform under these guarantees, we generally could recover a portion of the loss from third parties through recourse provisions included in agreements with such parties, the sale of assets held as collateral that can be liquidated in the event that performance is required under the guarantees or other recourse generally available to us, minimizing the impact to net income. The fair value ofus. Therefore, such guarantees issued after January 1, 2003, was determined to be insignificant.
In connection with the 2002 sale of BT Financial Group, we agreed to indemnify the purchaser, Westpac, for among other things, the costs associated with potential late filings made by BT Financial Group in New Zealand prior to Westpac's ownership, up to a maximum of A$250.0 million Australian dollars (approximately U.S. $195.0 million as of December 31, 2004). New Zealand securities regulations allow Australian issuers to issue their securities in New Zealand provided that certain documents are appropriately filed with the New Zealand Registrar of Companies. Specifically, the regulations require that any amendments to constitutions and compliance plans be filed in New Zealand. In April 2003, the New Zealand Securities Commission ("the Commission") opined that such late filings would result in certain New Zealand investors having a right to return of their investment plus interest at 10% per annum from the date of
investment. This technical issue affected many in the industry. On April 15, 2004, the New Zealand government enacted legislation that will provide issuers, including BT Financial Group, the opportunity for retroactive relief from such late filing violations. The law allows issuers to apply for judicial validation of non-compliant issuances resulting from late filings. The law further provides that judicial relief is mandatory and unconditional unless an investor was materially prejudiced by the late filing. Such judicial relief has been granted to BT Financial Group and Westpac with regard to the vast majority of affected investors. As a result, we do not believe that this matter will result in a material adverse effect on our business or financial position. It is possible however, that itsuch outcomes could have a material adverse effect onmaterially affect net income in a particular quarter or annual period.
On December 24, 2004, Westpac lodged several warranty and indemnification claims related to the sale The fair value of BT Financial Group. Under the sale agreements, certain warranty claims were required to be lodged by December 31, 2004. The claims aggregate approximately A$50.0 million Australian dollars (approximately U.S. $40.0 million) with the majority of the claims (approximately A$45.0 million Australian dollars, or U.S. $35.0 million) related to fund pricing and accounting issues around a tax asset called future income tax benefit ("FITB"). FITBsuch guarantees is an asset used in calculating unit pricing of funds. Westpac claims that BT Financial Group incorrectly accrued FITB assets in valuing asset portfolios of BT funds in Australia and New Zealand and that as a result fund values were overstated. We intend to vigorously defend against these claims. Although we cannot predict the outcome of this matter or reasonably estimate possible losses, we do not believe that it would result in a material adverse effect on our business or financial position. It is possible, however, that it could have a material adverse effect on net income in a particular quarter or annual period.material.
We are also subject to various other indemnification obligations issued in conjunction with certain transactions, primarily the sale of BT Financial Group, Principal Residential Mortgage, Inc., and other divestitures, acquisitions and financing transactions whose terms range in duration and often are not explicitly defined. Certain portions of these indemnifications may be capped, while other portions are not subject to such limitations; therefore, the overall maximum amount of the obligation under the indemnifications cannot be reasonably estimated. While we are unable to estimate with certainty the ultimate legal and financial liability with respect to these indemnifications, we believe the likelihood is remote that material payments would be required under such indemnifications and therefore such indemnifications would not result in a material adverse effect on our business or financial positionposition. It is possible that such outcomes could materially affect net income in a particular quarter or net income.annual period. The fair value of such indemnifications issued after January 1, 2003, was determined to be insignificant.
Investments
We had total consolidated assets as of December 31, 2004,2006, of $113.8$143.7 billion, of which $56.9$60.3 billion were invested assets. The rest of our total consolidated assets are comprised primarily of separate account assets for which we do not bear investment risk. Because we generally do not bear any investment risk on assets held in separate accounts, the discussion and financial information below does not include such assets. Of our invested assets, $54.4$57.0 billion were held by our U.S. operations and the remaining $2.5$3.3 billion were held by our International Asset Management and Accumulation segment. On July 1, 2004, we closed the sale of Principal Residential Mortgage, Inc. to CitiMortgage, Inc. The invested assets and cash held prior to July 1, 2004 have been reclassified to assets from discontinued operations on the consolidated statements of financial position.
U.S. Investment Operations
Our U.S. invested assets are managed by Principal Global Investors, a subsidiary of Principal Life. Our primary investment objective is to maximize after-tax returns consistent with acceptable risk parameters. We seek to protect policyholders' benefits by optimizing the risk/return relationship on an ongoing basis, through asset/liability matching,
reducing the credit risk, avoiding high levels of investments that may be redeemed by the issuer, maintaining sufficiently liquid investments and avoiding undue asset concentrations through diversification. We are exposed to three primary sources of investment risk:
- •
- credit risk, relating to the uncertainty associated with the continued ability of a given obligor to make timely payments of principal and interest;
- •
- interest rate risk, relating to the market price and/or cash flow variability associated with changes in market yield curves; and
- •
- equity risk, relating to adverse fluctuations in a particular common stock.
Our ability to manage credit risk is essential to our business and our profitability. We devote considerable resources to the credit analysis of each new investment. We manage credit risk through industry, issuer and asset class diversification. Our Investment Committee, appointed by our boardBoard of directors,Directors, is responsible for establishing all investment policies and reviewing and approving or authorizing all investments.investments, except the Executive Committee of the Board must approve any investment transaction exceeding $500.0 million. As of December 31, 2004,2006, there are ten members on the Investment Committee, onetwo of whom is a memberare members of our boardBoard of directors.Directors. The remaining members are senior management members representing various areas of our company.
We also seek to reduce call or prepayment risk arising from changes in interest rates in individual investments. We limit our exposure to investments that are prepayable without penalty prior to maturity at the option of the issuer, and we require additional yield on these investments to compensate for the risk that the issuer will exercise such option. We assess option risk in all investments we make and, when we take that risk, we price for it accordingly.
Our Fixed Income Securities Committee, consisting of fixed income securities senior management members, approves the credit rating for the fixed maturity securities we purchase. Teams of security analysts organized by industry focus either on the public or private markets and analyze and monitor these investments. In addition, we have teams who specialize in residential mortgage-backed securities, commercial mortgage-backed securities, asset-backed securities, and public below investment grade securities. We establish a credit reviewed list of approved public issuers to provide an efficient way for our portfolio managers to purchase liquid bonds for which credit review has already been completed. Issuers remain on the list for one year unless removed by our analysts. Our analysts monitor issuers on the list on a continuous basis with a formal review documented annually or more frequently if material events affect the issuer. The analysis includes both fundamental and technical factors. The fundamental analysis encompasses both quantitative and qualitative analysis of the issuer.
The qualitative analysis includes an assessment of both accounting and management aggressiveness. In addition, technical indicators such as stock price volatility and credit default swap levels are monitored.
Our Fixed Income Securities Committee also reviews private transactions on a continuous basis to assess the quality ratings of our privately placed investments. We regularly review our investments to determine whether we should re-rate them, employing the following criteria:
- •
- material declines in the issuer's revenues or margins;
- •
- significant management or organizational changes;
- •
- significant uncertainty regarding the issuer's industry;
- •
- debt service coverage or cash flow ratios that fall below industry-specific thresholds;
- •
- violation of financial covenants; and
- •
- other business factors that relate to the issuer.
A dedicated risk management team is responsible for centralized monitoring of the commercial mortgage portfolio. We apply a variety of strategies to minimize credit risk in our commercial mortgage loan portfolio. When considering the origination of new commercial mortgage loans, we review the cash flow fundamentals of the property, make a physical assessment of the underlying security, conduct a comprehensive market analysis and compare against industry lending practices. We use a proprietary risk rating model to evaluate all new and a majority of existing loans within the portfolio. The proprietary risk model is designed to stress projected cash flows under simulated economic and market downturns. Our lending guidelines are designed to encourage 75% or less loan-to-value ratios and a debt service coverage ratio of at least 1.2 times. We analyze investments outside of these guidelines based on cash flow quality, tenancy and other factors. The weighted average loan-to-value ratio at origination for brick and mortar commercial mortgages in our portfolio was 66%67% and the debt service coverage ratio at loan inception was 2.31.7 times as of December 31, 2004.2006.
We have limited exposure to equity risk in our common stock portfolio. Equity securities accounted for only 1% of our U.S. invested assets as of December 31, 2004.2006.
Our investment decisions and objectives are a function of the underlying risks and product profiles of each primary business operation. In addition, we diversify our product portfolio offerings to include products that contain features that
will protect us against fluctuations in interest rates. Those features include adjustable crediting rates, policy surrender charges and market value adjustments on liquidations. For further information on our management of interest rate risk, see Item 7A, "Quantitative and Qualitative Disclosures about Market Risk".
Overall Composition of U.S. Invested Assets
U.S. invested assets as of December 31, 2004,2006, were predominantly of high quality and broadly diversified across asset class, individual credit, industry and geographic location. Asset allocation is determined based on cash flow and the risk/return requirements of our products. As shown in the following table, the major categories of U.S. invested assets are fixed maturity securities and commercial mortgages. The remainder is invested in real estate, residential mortgage loans, equity securities and other assets. In addition, policy loans are included in our invested assets. The following discussion analyzes the composition of U.S. invested assets, but excludes invested assets of the participating separate accounts.
| | | December 31, 2004 | December 31, 2003 | | December 31, 2006 | December 31, 2005 | ||||||||||||||||||
|---|---|---|---|---|---|---|---|---|---|---|---|---|---|---|---|---|---|---|---|---|---|---|---|---|
| | | Carrying Amount | % of Total | Carrying Amount | % of Total | | Carrying Amount | % of Total | Carrying Amount | % of Total | ||||||||||||||
| | | ($ in millions) | | ($ in millions) | ||||||||||||||||||||
| Fixed maturity securities | ||||||||||||||||||||||||
| Fixed maturity securities: | Fixed maturity securities: | |||||||||||||||||||||||
| Public | $ | 26,477.1 | 49 | % | $ | 24,785.0 | 48 | % | Public | $ | 28,772.4 | 51 | % | $ | 27,826.3 | 51 | % | |||||||
| Private | 12,749.6 | 23 | 11,343.0 | 22 | Private | 13,651.4 | 24 | 12,289.4 | 23 | |||||||||||||||
| Equity securities | Equity securities | 725.9 | 1 | 657.4 | 1 | Equity securities | 795.7 | 1 | 764.0 | 2 | ||||||||||||||
| Mortgage loans | ||||||||||||||||||||||||
| Mortgage loans: | Mortgage loans: | |||||||||||||||||||||||
| Commercial | 10,224.7 | 19 | 9,630.4 | 19 | Commercial | 10,090.3 | 18 | 9,890.7 | 18 | |||||||||||||||
| Residential | 1,104.0 | 2 | 1,288.1 | 3 | Residential | 1,051.6 | 2 | 1,088.5 | 2 | |||||||||||||||
| Real estate held for sale | Real estate held for sale | 136.1 | — | 513.0 | 1 | Real estate held for sale | 118.2 | — | 133.8 | — | ||||||||||||||
| Real estate held for investment | Real estate held for investment | 885.1 | 2 | 1,003.6 | 2 | Real estate held for investment | 736.6 | 1 | 754.6 | 1 | ||||||||||||||
| Policy loans | Policy loans | 814.5 | 2 | 804.1 | 2 | Policy loans | 850.7 | 1 | 827.7 | 2 | ||||||||||||||
| Other investments | Other investments | 1,339.7 | 2 | 1,198.8 | 2 | Other investments | 972.6 | 2 | 755.3 | 1 | ||||||||||||||
| Total invested assets | 54,456.7 | 100 | % | 51,223.4 | 100 | % | Total invested assets | 57,039.5 | 100 | % | 54,330.3 | 100 | % | |||||||||||
| Cash and cash equivalents | Cash and cash equivalents | 369.5 | 1,121.1 | Cash and cash equivalents | 1,535.8 | 1,583.1 | ||||||||||||||||||
| Total invested assets and cash | $ | 54,826.2 | $ | 52,344.5 | Total invested assets and cash | $ | 58,575.3 | $ | 55,913.4 | |||||||||||||||
U.S. Investment Results
The following tables present the yield and investment income, excluding net realized/unrealized gains and losses for our U.S. invested assets. The annualized yield on U.S. invested assets and on cash and cash equivalents was 5.9% for the year ended December 31, 2006, compared to 5.7% for the year ended December 31, 2004, compared to 6.2% for the year ended December 31, 2003.2005. We calculate annualized yields using a simple average of asset classes at the beginning and end of the reporting period.
U.S. Invested Assets
Investment Income Yields by Asset Type
| | For the year ended December 31, | ||||||||||
|---|---|---|---|---|---|---|---|---|---|---|---|
| | 2004 | 2003 | |||||||||
| | Yield | Amount | Yield | Amount | |||||||
| | ($ in millions) | ||||||||||
| Fixed maturity securities | 5.8 | % | $ | 2,196.4 | 6.3 | % | $ | 2,173.4 | |||
| Equity securities | 6.8 | 46.9 | 8.9 | 45.4 | |||||||
| Mortgage loans — Commercial | 6.9 | 680.7 | 7.6 | 722.9 | |||||||
| Mortgage loans — Residential | 4.2 | 49.9 | 3.8 | 42.9 | |||||||
| Real estate | 6.7 | 85.1 | 6.7 | 91.0 | |||||||
| Policy loans | 6.3 | 51.1 | 6.7 | 54.5 | |||||||
| Cash and cash equivalents | 3.5 | 25.9 | 2.3 | 20.5 | |||||||
| Other investments | 2.2 | 27.4 | 5.1 | 57.2 | |||||||
| Total before investment expenses | 5.9 | 3,163.4 | 6.4 | 3,207.8 | |||||||
| Investment expenses | 0.2 | 128.4 | 0.2 | 111.8 | |||||||
| Net investment income | 5.7 | % | $ | 3,035.0 | 6.2 | % | $ | 3,096.0 | |||
| | For the year ended December 31, | ||||||||||
|---|---|---|---|---|---|---|---|---|---|---|---|
| | 2006 | 2005 | |||||||||
| | Yield | Amount | Yield | Amount | |||||||
| | ($ in millions) | ||||||||||
| Fixed maturity securities | 6.0 | % | $ | 2,478.3 | 5.8 | % | $ | 2,302.5 | |||
| Equity securities | 7.1 | 55.1 | 6.5 | 48.5 | |||||||
| Mortgage loans — commercial | 6.5 | 653.3 | 6.7 | 671.7 | |||||||
| Mortgage loans — residential | 5.1 | 54.9 | 4.7 | 51.9 | |||||||
| Real estate | 7.4 | 64.7 | 7.0 | 64.0 | |||||||
| Policy loans | 6.1 | 50.9 | 6.1 | 50.3 | |||||||
| Cash and cash equivalents | 4.1 | 64.3 | 3.3 | 32.1 | |||||||
| Other investments | 8.9 | 76.4 | 2.4 | 25.0 | |||||||
| Total before investment expenses | 6.1 | 3,497.9 | 5.9 | 3,246.0 | |||||||
| Investment expenses | 0.2 | 132.2 | 0.2 | 133.6 | |||||||
| Net investment income | 5.9 | % | $ | 3,365.7 | 5.7 | % | $ | 3,112.4 | |||
Fixed Maturity Securities
Fixed maturity securities consist of short-term investments, publicly traded debt securities, privately placed debt securities and redeemable preferred stock, and represented 72%75% and 74% of total U.S. invested assets as of December 31, 20042006 and 70% as of December 31, 2003.2005, respectively. The fixed maturity securities portfolio was comprised, based on carrying amount, of 67%68% in publicly traded fixed maturity securities and 33%32% in privately placed fixed maturity securities as of December 31, 20042006 and 69% in publicly traded fixed maturity securities and 31% in privately placed fixed maturity securities as of December 31, 2003.2005. Included in the privately placed category as of December 31, 2004,2006, and December 31, 2003,2005, were $5.8$7.6 billion and $4.3$6.7 billion, respectively, of securities eligible for resale to qualified institutional buyers under Rule 144A under the Securities Act of 1933. Fixed maturity securities were diversified by category of issuer as of December 31, 2004,2006, and December 31, 2003,2005, as shown in the following table:
U.S. Invested Assets
Fixed Maturity Securities by Type of Issuer
| | | December 31, 2004 | December 31, 2003 | | December 31, 2006 | December 31, 2005 | ||||||||||||||||||
|---|---|---|---|---|---|---|---|---|---|---|---|---|---|---|---|---|---|---|---|---|---|---|---|---|
| | | Carrying Amount | % of Total | Carrying Amount | % of Total | | Carrying Amount | % of Total | Carrying Amount | % of Total | ||||||||||||||
| | | ($ in millions) | | ($ in millions) | ||||||||||||||||||||
| U.S. Government and agencies | U.S. Government and agencies | $ | 274.2 | 1 | % | $ | 610.9 | 2 | % | U.S. Government and agencies | $ | 551.6 | 1 | % | $ | 555.5 | 1 | % | ||||||
| States and political subdivisions | States and political subdivisions | 947.0 | 2 | 537.0 | 1 | States and political subdivisions | 1,663.5 | 4 | 1,283.4 | 3 | ||||||||||||||
| Non-U.S. governments | Non-U.S. governments | 490.3 | 1 | 422.4 | 1 | Non-U.S. governments | 420.7 | 1 | 463.0 | 1 | ||||||||||||||
| Corporate — public | Corporate — public | 19,572.4 | 50 | 18,033.4 | 50 | Corporate — public | 19,791.1 | 47 | 19,590.8 | 49 | ||||||||||||||
| Corporate — private | Corporate — private | 10,549.4 | 27 | 9,693.1 | 27 | Corporate — private | 10,596.5 | 25 | 9,901.5 | 25 | ||||||||||||||
| Residential pass-through securities | Residential pass-through securities | 1,536.2 | 4 | 2,070.3 | 6 | Residential pass-through securities | 1,557.6 | 4 | 1,526.0 | 4 | ||||||||||||||
| Commercial mortgage-backed securities | Commercial mortgage-backed securities | 3,472.7 | 9 | 2,917.4 | 8 | Commercial mortgage-backed securities | 4,499.6 | 11 | 4,118.6 | 10 | ||||||||||||||
| Residential collateralized mortgage obligations | Residential collateralized mortgage obligations | 652.4 | 2 | 294.6 | 1 | Residential collateralized mortgage obligations | 940.4 | 2 | 752.5 | 2 | ||||||||||||||
| Asset-backed securities | Asset-backed securities | 1,732.1 | 4 | 1,548.9 | 4 | Asset-backed securities | 2,402.8 | 5 | 1,924.4 | 5 | ||||||||||||||
| Total fixed maturities | $ | 39,226.7 | 100 | % | $ | 36,128.0 | 100 | % | Total fixed maturities | $ | 42,423.8 | 100 | % | $ | 40,115.7 | 100 | % | |||||||
We held $7,393.4$9,400.4 million of mortgage-backed and asset-backed securities as of December 31, 2004,2006, and $6,831.2$8,321.5 million as of December 31, 2003.2005.
We believe that it is desirable to hold residential mortgage-backed pass-through securities due to their credit quality and liquidity as well as portfolio diversification characteristics. Our portfolio is comprised of GNMA, FNMA and FHLMC pass-through securities. In addition, our residential collateralized mortgage obligation portfolio offers structural features that allow cash flows to be matched to our liabilities.
Commercial mortgage-backed securities provide high levels of credit protection, diversification, reduced event risk and enhanced liquidity. Commercial mortgage-backed securities are predominantly comprised of rated large pool securitizations that are individually and collectively diverse by property type, borrower and geographic dispersion.
We purchase asset-backed securities ("ABS") to diversify the overall credit risks of the fixed maturity securities portfolio and to provide attractive returns. The principal risks in holding asset-backed securities are structural and credit risks. Structural risks include the security's priority in the issuer's capital structure, the adequacy of and ability to realize proceeds from the collateral and the potential for prepayments. Credit risks involve issuer/servicer risk where collateral values can become impaired in the event of servicer credit deterioration.
Our ABS portfolio is diversified both by type of asset and by issuer. We actively monitor holdings of asset-backed securities to ensure that the risk profile of each security improves or remains consistent. Prepayments in the ABS portfolio are, in general, insensitive to changes in interest rates or are insulated to such changes by call protection features. In the event that we are subject to prepayment risk, we monitor the factors that impact the level of prepayment and prepayment speed for those asset-backed securities. In addition, we diversify the risks of asset-backed securities by holding a diverse class of securities, which limits our exposure to any one security.
The international exposure in our U.S. fixed maturity securities totaled $5,924.4$8,691.4 million, or 15%20% of total fixed maturity securities, as of December 31, 2004,2006, comprised of corporate and foreign government fixed maturity securities. Of the $5,924.4$8,691.4 million as of December 31, 2004,2006, investments totaled $1,473.3$2,383.1 million in the United Kingdom, $1,587.3$2,232.2 million in the continental European Union, $709.3$1,007.4 million in Asia, $495.8$827.8 million in Australia, $615.3 million in South America, $482.7$401.0 million in AustraliaMexico and $10.4$59.0 million in Japan. The remaining $1,165.6 million is invested in 1517 other countries. All international fixed maturity securities held by our U.S. operations are either denominated in U.S. dollars or have been swapped into U.S. dollar equivalents. Our international investments are analyzed internally by country and industry credit investment professionals. We control concentrations using issuer and country level exposure benchmarks, which are based on the credit quality of the issuer and the country. Our investment policy limits total international fixed maturity securities investments to 18% of total statutory general account assets with a 4% limit in emerging markets.
Exposure to Canada is not included in our international exposure. As of December 31, 2004,2006, our investments in Canada totaled $1,376.8$1,451.6 million.
The following tables present the amortized cost of our top ten exposures including approved counterparty exposure limits as of December 31, 2004,2006, and December 31, 2003.2005.
| | December 31, 2004 | |||
|---|---|---|---|---|
| | Amortized Cost | |||
| | (in millions) | |||
| HSBC Holdings PLC(1) | $ | 446.2 | ||
| Bank of America Corp.(3) | 419.6 | |||
| American International Group Inc.(3) | 394.8 | |||
| MBIA Inc.(2) | 380.2 | |||
| JP Morgan Chase & Co.(3) | 321.2 | |||
| General Electric Co | 313.4 | |||
| Royal Bank of Scotland Group PLC(3) | 296.6 | |||
| Goldman Sachs Group Inc.(3) | 285.5 | |||
| Citigroup Inc.(3) | 280.9 | |||
| Verizon Communications Inc. | 261.5 | |||
| Total Top Ten Exposures | $ | 3,399.9 | ||
| | December 31, 2006 | |||
|---|---|---|---|---|
| | Amortized Cost | |||
| | (in millions) | |||
| HSBC Holdings PLC(1) | $ | 387.1 | ||
| American International Group Inc.(2) | 329.5 | |||
| Bank of America Corp.(2) | 328.3 | |||
| MBIA Inc.(3) | 311.5 | |||
| AT&T Inc. | 272.9 | |||
| JP Morgan Chase & Co.(2) | 271.7 | |||
| Royal Bank of Scotland Group PLC(2) | 255.6 | |||
| Deutsche Bank AG(2) | 255.0 | |||
| General Electric Co | 239.2 | |||
| ABN AMRO Holding NV(2) | 229.6 | |||
| Total top ten exposures | $ | 2,880.4 | ||
- (1)
- Includes a
$238.3$238.0 million investment classified as an equity security for U.S. GAAP. The investment issuer engages in managing investment grade third party bond investments and HSBC paper. All non-HSBC paper has the ultimate benefit of price support protection provided by HSBC Bank, PLC. Since Principal Life Insurance Company has the senior priority in the issuer, we believe many third party bonds could be liquidated to satisfy our claim. While we calculate our exposure on a gross basis, the value we attribute to the underlying collateral is$125$125.0 million. - (2)
- Includes approved counterparty limit. The actual and the stressed potential exposures are less than the approved limit.
- (3)
- MBIA Inc. exposure is predominately comprised of the guarantee of underlying securities that are rated "A-" equivalent or better by the rating agencies on a stand alone basis. The MBIA wrap guarantees performance in the event of default of the underlying securities bringing the combined rating to AAA.
(3)Includes approved counterparty limit. The actual and the stressed potential exposures are less than the approved limit.
| | December 31, 2003 | |||
|---|---|---|---|---|
| | Amortized Cost | |||
| | (in millions) | |||
| HSBC Holdings PLC(1)(3) | $ | 518.7 | ||
| MBIA Inc.(2) | 380.6 | |||
| American International Group Inc.(3) | 363.1 | |||
| Citigroup Inc.(3) | 292.2 | |||
| Bank of America Corp.(3) | 265.6 | |||
| Royal Bank of Scotland Group PLC(3) | 263.3 | |||
| Verizon Communications Inc. | 261.9 | |||
| General Electric Co. | 249.1 | |||
| Morgan Stanley(3) | 228.8 | |||
| Bear Stearns Co. | 223.9 | |||
| Total Top Ten Exposures | $ | 3,047.2 | ||
| | December 31, 2005 | |||
|---|---|---|---|---|
| | Amortized Cost | |||
| | (in millions) | |||
| HSBC Holdings PLC(1) | $ | 381.6 | ||
| Bank of America Corp.(2) | 332.5 | |||
| American International Group Inc.(2) | 330.7 | |||
| JP Morgan Chase & Co.(2) | 316.3 | |||
| Royal Bank of Scotland Group PLC(2) | 315.6 | |||
| MBIA Inc.(3) | 311.6 | |||
| General Electric Co | 247.5 | |||
| Citigroup Inc.(2) | 235.0 | |||
| Banco Santander Central Hispano SA | 227.4 | |||
| AT&T Inc. | 219.9 | |||
| Total top ten exposures | $ | 2,918.1 | ||
- (1)
- Includes a
$238.3$238.2 million investment classified as an equity security for U.S. GAAP. The investment issuer engages in managing investment grade third party bond investments and HSBC paper. All non-HSBC paper has the ultimate benefit of price support protection provided by HSBC Bank, PLC. Since Principal Life Insurance Company has senior priority in the issuer, we believe many third party bonds could be liquidated to satisfy our claim. While we calculate our exposure on a gross basis, the value we attribute to the underlying collateral is$125$125.0 million.
- (2)
- Includes approved counterparty limit. The actual and the stressed potential exposures are less than the approved limit.
- (3)
- MBIA Inc. exposure is predominately comprised of the guarantee of underlying securities which are rated "A-" equivalent or better by the rating agencies on a stand alone basis. The MBIA wrap guarantees performance in the event of a default of the underlying securities bringing the combined rating to AAA.
(3)Includes approved counterparty limit. The actual and the stressed potential exposures are less than the approved limit.
Our top ten exposures were rated an "A" equivalent or better by the rating agencies as of December 31, 20042006 and December 31, 2003.2005. As of December 31, 20042006 and December 31, 2003,2005, no individual non-government issuer represented more than 1% of U.S. invested assets.
Valuation techniques for the fixed maturity securities portfolio vary by security type and the availability of market data. Pricing models and their underlying assumptions impact the amount and timing of unrealized gains and losses recognized, and the use of different pricing models or assumptions could produce different financial results. Interactive Data Corporation ("IDC") or direct broker quotes are our sources for external prices for our public bonds and those private placement securities that are actively traded in the secondary market. In cases where quoted market prices are not available, a matrix pricing valuation approach is used. Securities are grouped into pricing categories that vary by asset class, sector, rating, and average life. Each pricing category is assigned a risk spread based on studies of observable public market data or market clearing data from the investment professionals assigned to specific security classes. The expected cash flows of the security are then discounted back at the current Treasury curve plus the appropriate risk spread. Although the matrix valuation approach provides a fair valuation of each pricing category, the valuation of an individual security within each pricing category may actually be impacted by company specific factors. Certain market events that could impact the valuation of securities include issuer credit ratings, business climate, management changes, litigation, and government actions among others. The resulting prices are then reviewed by pricing analysts. All loans placed on the "watch list" are valued individually by the investment analysts or the analysts that focus on troubled securities ("Workout group"Group"). Although we believe our estimates reasonably reflect the fair value of those securities, the key assumptions about risk premiums, performance of underlying collateral (if any) and other factors involve significant assumptions and may not reflect those of an active market. To the extent that bonds have longer maturity dates, management's estimate of fair value may involve greater subjectivity since they involve judgment about events well into the future. Every month, there is a comprehensive review of all impaired securities and problem loans by a group consisting of the Chief Investment Officer, the Portfolio Managers, and the Workout Group. The valuation of impaired bonds for which there is no quoted price is typically based on the present value of the future cash flows expected to be received. If the company is likely to continue operations, the estimate of future cash flows is typically based on the expected operating cash flows of the company that are available to make payments of the bonds. If the company is likely to liquidate, the estimate of future cash flows is based on an estimate of the liquidation value of its net assets.
The Securities Valuation Office ("SVO") of the NAICNational Association of Insurance Commissioners ("NAIC") evaluates most of the fixed maturity securities that we and other U.S. insurance companies hold. The SVO evaluates the bond investments of insurers for regulatory reporting purposes and assigns securities to one of six investment categories. The NAIC designations closely mirror the nationally recognized securities rating organizations' credit ratings for
marketable bonds. NAIC designations 1 and 2 include bonds considered investment grade by such rating organizations. Bonds are considered investment grade when rated "Baa3" or higher by Moody's, or "BBB-" or higher by Standard & Poor's. NAIC designations 3 through 6 are referred to as below investment grade. Bonds are considered below investment grade when rated "Ba1" or lower by Moody's, or "BB+" or lower by Standard & Poor's. As of December 31, 2004,2006, the percentage, based on estimated fair value, of total publicly traded and privately placed fixed maturity securities that were investment grade with an NAIC designation 1 or 2 was 95%.
We also monitor the credit drift of our corporate fixed maturity securities portfolio. Credit drift is defined as the ratio of the percentage of rating downgrades, including defaults, divided by the percentage of rating upgrades. We measure credit drift once each fiscal year, assessing the changes in our internally developed credit ratings that have occurred during the year. Standard & Poor's annual credit ratings drift ratio measures the credit rating change, within a specific year, of companies that have been assigned ratings by Standard & Poor's. The annual internal credit drift ratio on corporate fixed maturity securities we held in our general account was 0.53a more favorable ratio at 0.55 times compared to the Standard & Poor's drift ratio of 0.900.74 times, as of December 31, 2004.2006.
The following table presents our total fixed maturity securities by NAIC designation and the equivalent ratings of the nationally recognized securities rating organizations as of December 31, 2004,2006, and December 31, 2003,2005, as well as the percentage, based on estimated fair value, that each designation comprises:
U.S. Invested Assets
Fixed Maturity Securities by Credit QualityQuality(1)
| | | December 31, 2004 | December 31, 2003 | | December 31, 2006 | December 31, 2005 | ||||||||||||||||||||||||||||||||
|---|---|---|---|---|---|---|---|---|---|---|---|---|---|---|---|---|---|---|---|---|---|---|---|---|---|---|---|---|---|---|---|---|---|---|---|---|---|---|
| NAIC Rating(1) | Rating Agency Equivalent | Amortized Cost | Carrying Amount | % of Total Carrying Amount | Amortized Cost | Carrying Amount | % of Total Carrying Amount | |||||||||||||||||||||||||||||||
| NAIC Rating | Rating Agency Equivalent | Amortized Cost | Carrying Amount | % of Total Carrying Amount | Amortized Cost | Carrying Amount | % of Total Carrying Amount | |||||||||||||||||||||||||||||||
| | | ($ in millions) | | ($ in millions) | ||||||||||||||||||||||||||||||||||
| 1 | Aaa/Aa/A | $ | 19,807.0 | $ | 20,979.9 | 54 | % | $ | 17,299.2 | $ | 18,415.1 | 51 | % | Aaa/Aa/A | $ | 23,716.0 | $ | 24,231.9 | 57 | % | $ | 21,593.3 | $ | 22,361.9 | 56 | % | ||||||||||||
| 2 | Baa | 14,939.9 | 16,012.2 | 41 | 13,579.3 | 14,657.1 | 41 | Baa | 15,769.9 | 16,205.5 | 38 | 14,978.4 | 15,590.7 | 39 | ||||||||||||||||||||||||
| 3 | Ba | 1,555.9 | 1,698.7 | 4 | 1,998.0 | 2,123.1 | 6 | Ba | 1,586.8 | 1,657.1 | 4 | 1,701.7 | 1,801.6 | 4 | ||||||||||||||||||||||||
| 4 | B | 323.4 | 332.3 | 1 | 517.4 | 514.5 | 1 | B | 290.5 | 302.6 | 1 | 258.5 | 271.2 | 1 | ||||||||||||||||||||||||
| 5 | Caa and lower | 42.2 | 44.2 | — | 230.9 | 225.4 | 1 | Caa and lower | 19.1 | 19.5 | — | 14.3 | 14.4 | — | ||||||||||||||||||||||||
| 6 | In or near default | 160.2 | 159.4 | — | 220.7 | 192.8 | — | In or near default | 5.5 | 7.2 | — | 76.2 | 75.9 | — | ||||||||||||||||||||||||
| Total fixed maturities | $ | 36,828.6 | $ | 39,226.7 | 100 | % | $ | 33,845.5 | $ | 36,128.0 | 100 | % | Total fixed maturities | $ | 41,387.8 | $ | 42,423.8 | 100 | % | $ | 38,622.4 | $ | 40,115.7 | 100 | % | |||||||||||||
- (1)
- Includes
12943 securities with an amortized cost of$1,016.7$505.8 million, gross gains of$55.0$9.6 million, gross losses of$2.6$2.2 million and a carrying amount of$1,069.1$513.2 million as of December 31,2004,2006, that are still pending a review and assignment of a rating by the SVO. Due to the timing of when fixed maturity securities are purchased, legal documents are filed, and the review by the SVO, there will always be securities in our portfolio that are unrated over a reporting period. In these instances, an equivalent rating is assigned based on our fixed income analyst's assessment.
We believe that our long-term fixed maturity securities portfolio is well diversified among industry types and between publicly traded and privately placed securities. Each year, we direct the majority of our net cash inflows into investment grade fixed maturity securities. Our current policy is to limit the percentage of cash flow invested in below investment grade assets to 7% of cash flow. As of December 31, 2004,2006, we had invested 1.9%3.3% of new cash flow for the year in below investment grade assets. While the general account investment returns have improved due to the below investment grade asset class, we manage its growth strategically by limiting it to 10% of the total fixed maturity securities portfolios.
We invest in privately placed fixed maturity securities to enhance the overall value of the portfolio, increase diversification and obtain higher yields than are possible with comparable quality public market securities. Generally, private placements provide broader access to management information, strengthened negotiated protective covenants, call protection features and, where applicable, a higher level of collateral. They are, however, generally not freely tradable because of restrictions imposed by federal and state securities laws and illiquid trading markets.
The following table shows the carrying amount of our corporate fixed maturity securities by Salomon industry category, as well as the percentage of the total corporate portfolio that each Salomon industry category comprises as of December 31, 2004,2006, and December 31, 2003.2005.
U.S. Invested Assets
Corporate Fixed Maturity Securities by Salomon Industry
| | | December 31, 2004 | December 31, 2003 | | December 31, 2006 | December 31, 2005 | ||||||||||||||||||
|---|---|---|---|---|---|---|---|---|---|---|---|---|---|---|---|---|---|---|---|---|---|---|---|---|
| | | Carrying Amount | % of Total | Carrying Amount | % of Total | | Carrying Amount | % of Total | Carrying Amount | % of Total | ||||||||||||||
| | | ($ in millions) | | ($ in millions) | ||||||||||||||||||||
| Industry Class | Industry Class | Industry Class | ||||||||||||||||||||||
| Finance — Bank | Finance — Bank | $ | 3,644.0 | 12 | % | $ | 3,041.9 | 11 | % | Finance — Bank | $ | 3,659.2 | 12 | % | $ | 3,451.0 | 12 | % | ||||||
| Finance — Insurance | Finance — Insurance | 2,604.0 | 9 | 1,718.1 | 6 | Finance — Insurance | 3,119.1 | 10 | 3,010.3 | 10 | ||||||||||||||
| Finance — Other | Finance — Other | 3,838.0 | 13 | 3,337.5 | 12 | Finance — Other | 4,792.2 | 16 | 4,090.1 | 14 | ||||||||||||||
| Industrial — Consumer | Industrial — Consumer | 975.0 | 3 | 879.4 | 3 | Industrial — Consumer | 1,100.0 | 4 | 1,067.2 | 4 | ||||||||||||||
| Industrial — Energy | Industrial — Energy | 2,755.8 | 9 | 2,779.5 | 10 | Industrial — Energy | 2,683.2 | 9 | 2,718.4 | 9 | ||||||||||||||
| Industrial — Manufacturing | Industrial — Manufacturing | 5,594.0 | 19 | 5,729.6 | 21 | Industrial — Manufacturing | 5,518.4 | 18 | 5,223.3 | 18 | ||||||||||||||
| Industrial — Other | Industrial — Other | 135.1 | 1 | 158.7 | 1 | Industrial — Other | 105.3 | — | 106.4 | — | ||||||||||||||
| Industrial — Service | Industrial — Service | 4,623.2 | 15 | 4,503.0 | 16 | Industrial — Service | 4,462.3 | 15 | 4,548.7 | 15 | ||||||||||||||
| Industrial — Transport | Industrial — Transport | 934.0 | 3 | 967.8 | 4 | Industrial — Transport | 836.9 | 3 | 848.6 | 3 | ||||||||||||||
| Utility — Electric | Utility — Electric | 3,052.4 | 10 | 2,751.2 | 10 | Utility — Electric | 2,417.9 | 8 | 2,568.6 | 9 | ||||||||||||||
| Utility — Other | Utility — Other | 56.3 | — | 67.4 | — | Utility — Other | 47.6 | — | 47.9 | — | ||||||||||||||
| Utility — Telecom | Utility — Telecom | 1,910.0 | 6 | 1,792.4 | 6 | Utility — Telecom | 1,645.5 | 5 | 1,811.8 | 6 | ||||||||||||||
| Total | $ | 30,121.8 | 100 | % | $ | 27,726.5 | 100 | % | Total | $ | 30,387.6 | 100 | % | $ | 29,492.3 | 100 | % | |||||||
We monitor any decline in the credit quality of fixed maturity securities through the designation of "problem securities", "potential problem securities" and "restructured securities". We define problem securities in our fixed maturity portfolio as securities: (i) as to which principal and/or interest payments are in default or where default is perceived to be imminent in the near term, or (ii) issued by a company that went into bankruptcy subsequent to the acquisition of such securities. We define potential problem securities in our fixed maturity portfolio as securities included on an internal "watch list" for which management has concerns as to the ability of the issuer to comply with the present debt payment terms and which may result in the security becoming a problem or being restructured. The decision whether to classify a performing fixed maturity security as a potential problem involves significant subjective judgments by our management as to the likely future industry conditions and developments with respect to the issuer. We define restructured securities in our fixed maturity portfolio as securities where a concession has been granted to the borrower related to the borrower's financial difficulties that would not have otherwise been considered. We determine that restructures should occur in those instances where greater economic value will be realized under the new terms than through liquidation or other disposition and may involve a change in contractual cash flows. If at the time of restructure, the present value of the new future cash flows is less than the current cost of the asset being restructured, a realized capital loss is recorded in net income and a new cost basis is established.
We have a process in place to identify securities that could potentially have a credit impairment that is other than temporary. This process involves monitoring market events that could impact issuers' credit ratings, business climate, management changes, litigation and government actions, and other similar factors. This process also involves monitoring late payments, pricing levels, downgrades by rating agencies, key financial ratios, financial statements, revenue forecasts and cash flow projections as indicators of credit issues.
Every month, a group of individuals including the Chief Investment Officer, our Portfolio Managers, members of our Workout Group, and representatives from Investment Accounting review all securities where marketto determine whether an other than temporary decline in value is less than seventy-five percent of amortized cost to determineexists and whether losses should be recognized. The analysis focuses on each issuer's ability to service its debts in a timely fashion and the length of time the security has been trading below cost. Formal documentation of the analysis and the company'sCompany's decision is prepared and approved by management.
We consider relevant facts and circumstances in evaluating whether the credit impairment of a security is other than temporary. Relevant facts and circumstances considered include: (1) the length of time the fair value has been below cost; (2) the financial position and access to capital of the issuer, including the current and future impact of any specific events; and (3) our ability and intent to hold the security to maturity or until it recovers in value. To the extent we determine that a security is deemed to be other than temporarily impaired, the difference between amortized cost and fair value would be charged to earnings.
There are a number of significant risks and uncertainties inherent in the process of monitoring credit impairments and determining if an impairment is other than temporary. These risks and uncertainties include: (1) the risk that our
assessment of an issuer's ability to meet all of its contractual obligations will change based on changes in the credit
characteristics of that issuer, (2) the risk that the economic outlook will be worse than expected or have more of an impact on the issuer than anticipated, (3) the risk that our investment professionals are making decisions based on fraudulent or misstated information in the financial statements provided by issuers and (4) the risk that new information obtained by us or changes in other facts and circumstances lead us to change our intent to hold the security to maturity or until it recovers in value. Any of these situations could result in a charge to earnings in a future period.
The net realized lossesgain relating to other than temporary credit impairments of fixed maturity securities were $44.8was $1.9 million for the year ended December 31, 2004. Following is a summary2006. The single largest other than temporary credit impairment represented less than 0.1% of our material impairments takenU.S. fixed maturity securities as of December 31, 2006. To fund the acquisition of WM Advisors, we also recognized $12.4 million of impairment write-downs for the year ended December 31, 2004:
•$16.7 million on public2006, that resulted from our determination that we no longer had the ability andprivateintent to hold certain fixed maturity securities until they recovered in value. This loss is net ofa U.S. airline. The company has experienced an increasing degree of financial duress due to a high cost structure, increasingly competitive industry landscape and high fuel prices. The extent of this financial duress has pressured the company's liquidity position and increased the probability of a Chapter 11 filing in the future. These impairments are based on market prices for the public bonds and estimated market prices for the private bonds.•$8.8 million on private fixed maturity securities of a Chilean conglomerate. The company is in payment default, with lenders currently exercising legal remedies for enforcement in Chile. These impairments are based on estimatedany recoveryvalues for the private securities.•$7.5 million on private fixed maturity securities of a U.S. prime and sub-prime auto lending company. The company filed Chapter 11 bankruptcy protection during late 2002 and emerged from bankruptcy during September 2003. As operating datarealized on therestructured entity has become available it was determined that a further impairment was warranted. These impairments are based on estimated recovery values for the private securities.•$7.1 million on private fixed maturity securities relating to an Italian dairy and bakery goods producer. The company filed the equivalent of Chapter 11 bankruptcy protection after disclosing massive fraud during December 2003. After additional information has become available as partsubsequent sale of thebankruptcy process it was determined that a further impairment was warranted. These impairments are based on estimated recovery values for the privatesecurities.
For the year ended December 31, 2004,2006, we realized $28.0$30.2 million of gross losses upon disposal of bonds excluding hedging adjustments. Included in this $28.0$30.2 million is $18.9$22.2 million related to sales of twenty-threethirty-two credit impaired and credit related names. We generally intend to hold securities in unrealized loss positions until they mature or recover. However, we do sell bonds under certain circumstances such as when we have evidence of a significant deterioration in the issuer's creditworthiness, when a change in regulatory requirements modifies what constitutes a permissablepermissible investment or the maximum level of investments held or when there is an increase in capital requirements or a change in risk weights of debt securities. Also included in the $30.2 million is $6.3 million resulting from the sale of certain hybrid securities that had a regulatory classification change that resulted in increased capital requirements. Sales generate both gains and losses.
The following tables present our fixed maturity securities available-for-sale by industry category and the associated gross unrealized gains and losses as of December 31, 2004,2006, and December 31, 2003.2005.
U.S. Invested Assets
Fixed Maturity Securities Available-for-Sale by Industry Category
| | | December 31, 2004 | | December 31, 2006 | ||||||||||||||||||||||
|---|---|---|---|---|---|---|---|---|---|---|---|---|---|---|---|---|---|---|---|---|---|---|---|---|---|---|
| | | Amortized Cost | Gross Unrealized Gains | Gross Unrealized Losses | Carrying Amount | | Amortized Amortized Cost | Gross Unrealized Gains | Gross Unrealized Losses | Carrying Amount | ||||||||||||||||
| | | (in millions) | | (in millions) | ||||||||||||||||||||||
| Finance — Bank | Finance — Bank | $ | 3,467.0 | $ | 183.6 | $ | 6.6 | $ | 3,644.0 | Finance — Bank | $ | 3,592.1 | $ | 78.3 | $ | 21.9 | $ | 3,648.5 | ||||||||
| Finance — Insurance | Finance — Insurance | 2,497.1 | 115.6 | 8.7 | 2,604.0 | Finance — Insurance | 3,057.4 | 83.0 | 21.8 | 3,118.6 | ||||||||||||||||
| Finance — Other | Finance — Other | 3,648.0 | 199.2 | 9.2 | 3,838.0 | Finance — Other | 4,661.3 | 166.9 | 36.5 | 4,791.7 | ||||||||||||||||
| Industrial — Consumer | Industrial — Consumer | 916.1 | 60.7 | 1.8 | 975.0 | Industrial — Consumer | 1,082.1 | 29.1 | 11.3 | 1,099.9 | ||||||||||||||||
| Industrial — Energy | Industrial — Energy | 2,504.9 | 259.4 | 8.5 | 2,755.8 | Industrial — Energy | 2,552.2 | 145.5 | 15.7 | 2,682.0 | ||||||||||||||||
| Industrial — Manufacturing | Industrial — Manufacturing | 5,233.4 | 367.1 | 6.5 | 5,594.0 | Industrial — Manufacturing | 5,406.1 | 155.8 | 44.0 | 5,517.9 | ||||||||||||||||
| Industrial — Other | Industrial — Other | 127.4 | 7.9 | 0.2 | 135.1 | Industrial — Other | 104.7 | 1.3 | 0.7 | 105.3 | ||||||||||||||||
| Industrial — Service | Industrial — Service | 4,289.9 | 339.0 | 5.7 | 4,623.2 | Industrial — Service | 4,344.3 | 143.9 | 26.9 | 4,461.3 | ||||||||||||||||
| Industrial — Transport | Industrial — Transport | 871.2 | 73.3 | 10.5 | 934.0 | Industrial — Transport | 796.0 | 46.2 | 5.3 | 836.9 | ||||||||||||||||
| Utility — Electric | Utility — Electric | 2,852.6 | 203.0 | 3.2 | 3,052.4 | Utility — Electric | 2,343.5 | 91.9 | 17.7 | 2,417.7 | ||||||||||||||||
| Utility — Other | Utility — Other | 48.9 | 7.4 | — | 56.3 | Utility — Other | 41.0 | 6.6 | — | 47.6 | ||||||||||||||||
| Utility — Telecom | Utility — Telecom | 1,742.5 | 170.3 | 2.8 | 1,910.0 | Utility — Telecom | 1,569.0 | 87.6 | 11.3 | 1,645.3 | ||||||||||||||||
| Total corporate securities | 28,199.0 | 1,986.5 | 63.7 | 30,121.8 | Total corporate securities | 29,549.7 | 1,036.1 | 213.1 | 30,372.7 | |||||||||||||||||
| U.S. Government and agencies | U.S. Government and agencies | 268.6 | 6.3 | 0.7 | 274.2 | U.S. Government and agencies | 530.8 | 0.8 | 3.8 | 527.8 | ||||||||||||||||
| States and political subdivisions | States and political subdivisions | 894.1 | 53.6 | 0.7 | 947.0 | States and political subdivisions | 1,557.7 | 45.4 | 4.9 | 1,598.2 | ||||||||||||||||
| Non-U.S. governments | Non-U.S. governments | 428.4 | 61.9 | — | 490.3 | Non-U.S. governments | 384.9 | 36.1 | 0.3 | 420.7 | ||||||||||||||||
| Mortgage-backed and other asset-backed securities | Mortgage-backed and other asset-backed securities | 6,952.6 | 371.3 | 23.5 | 7,300.4 | Mortgage-backed and other asset-backed securities | 9,165.6 | 217.4 | 77.8 | 9,305.2 | ||||||||||||||||
| Total fixed maturity securities, available-for-sale | $ | 36,742.7 | $ | 2,479.6 | $ | 88.6 | $ | 39,133.7 | Total fixed maturity securities, available-for-sale | $ | 41,188.7 | $ | 1,335.8 | $ | 299.9 | $ | 42,224.6 | |||||||||
U.S. Invested Assets
Fixed Maturity Securities Available-for-Sale by Industry Category
| | December 31, 2003 | ||||||||||||
|---|---|---|---|---|---|---|---|---|---|---|---|---|---|
| | Amortized Cost | Gross Unrealized Gains | Gross Unrealized Losses(1) | Carrying Amount | |||||||||
| | (in millions) | ||||||||||||
| Finance — Bank | $ | 2,870.2 | $ | 183.3 | $ | 11.6 | $ | 3,041.9 | |||||
| Finance — Insurance | 1,635.1 | 95.3 | 12.3 | 1,718.1 | |||||||||
| Finance — Other | 3,142.7 | 205.2 | 10.4 | 3,337.5 | |||||||||
| Industrial — Consumer | 848.5 | 56.8 | 25.9 | 879.4 | |||||||||
| Industrial — Energy | 2,546.0 | 245.2 | 11.7 | 2,779.5 | |||||||||
| Industrial — Manufacturing | 5,363.5 | 382.0 | 15.9 | 5,729.6 | |||||||||
| Industrial — Other | 147.9 | 11.1 | 0.3 | 158.7 | |||||||||
| Industrial — Service | 4,153.6 | 355.2 | 5.8 | 4,503.0 | |||||||||
| Industrial — Transport | 914.2 | 74.6 | 21.0 | 967.8 | |||||||||
| Utility — Electric | 2,581.4 | 179.1 | 9.3 | 2,751.2 | |||||||||
| Utility — Other | 61.4 | 6.8 | 0.8 | 67.4 | |||||||||
| Utility — Telecom | 1,623.2 | 170.5 | 1.3 | 1,792.4 | |||||||||
| Total corporate securities | 25,887.7 | 1,965.1 | 126.3 | 27,726.5 | |||||||||
| U.S. Government and agencies | 599.0 | 12.9 | 1.0 | 610.9 | |||||||||
| States and political subdivisions | 498.7 | 40.5 | 2.2 | 537.0 | |||||||||
| Non-U.S. governments | 358.2 | 64.2 | — | 422.4 | |||||||||
| Mortgage-backed and other asset-backed securities | 6,406.9 | 343.5 | 22.1 | 6,728.3 | |||||||||
| Total fixed maturity securities, available-for-sale | $ | 33,750.5 | $ | 2,426.2 | $ | 151.6 | $ | 36,025.1 | |||||
(1)Included in the $151.6 million in unrealized losses is $24.8 million that relates to fixed maturity securities that are part of fair value hedging relationships and which have been recognized in net income versus other comprehensive income.
| | December 31, 2005 | ||||||||||||
|---|---|---|---|---|---|---|---|---|---|---|---|---|---|
| | Amortized Cost | Gross Unrealized Gains | Gross Unrealized Losses | Carrying Amount | |||||||||
| | (in millions) | ||||||||||||
| Finance — Bank | $ | 3,354.9 | $ | 110.6 | $ | 14.5 | $ | 3,451.0 | |||||
| Finance — Insurance | 2,915.0 | 111.3 | 16.0 | 3,010.3 | |||||||||
| Finance — Other | 3,932.5 | 181.5 | 23.9 | 4,090.1 | |||||||||
| Industrial — Consumer | 1,038.0 | 36.5 | 7.3 | 1,067.2 | |||||||||
| Industrial — Energy | 2,506.5 | 220.2 | 8.3 | 2,718.4 | |||||||||
| Industrial — Manufacturing | 5,060.9 | 201.4 | 39.0 | 5,223.3 | |||||||||
| Industrial — Other | 104.4 | 2.3 | 0.3 | 106.4 | |||||||||
| Industrial — Service | 4,369.6 | 204.4 | 25.3 | 4,548.7 | |||||||||
| Industrial — Transport | 795.1 | 57.0 | 3.5 | 848.6 | |||||||||
| Utility — Electric | 2,455.3 | 123.8 | 10.5 | 2,568.6 | |||||||||
| Utility — Other | 41.2 | 6.7 | — | 47.9 | |||||||||
| Utility — Telecom | 1,701.8 | 118.6 | 8.6 | 1,811.8 | |||||||||
| Total corporate securities | 28,275.2 | 1,374.3 | 157.2 | 29,492.3 | |||||||||
| U.S. Government and agencies | 557.9 | 1.8 | 4.2 | 555.5 | |||||||||
| States and political subdivisions | 1,222.6 | 45.7 | 3.8 | 1,264.5 | |||||||||
| Non-U.S. governments | 416.2 | 47.2 | 0.4 | 463.0 | |||||||||
| Mortgage-backed and other asset-backed securities | 8,045.5 | 267.8 | 77.9 | 8,235.4 | |||||||||
| Total fixed maturity securities, available-for-sale | $ | 38,517.4 | $ | 1,736.8 | $ | 243.5 | $ | 40,010.7 | |||||
The total unrealized losses on our fixed maturity securities available-for-sale were $88.6$299.9 million and $151.6$243.5 million as of December 31, 20042006 and December 31, 2003,2005, respectively. Of the $88.6$299.9 million in gross unrealized losses as of December 31, 2004,2006, there were $3.8$4.9 million in losses attributed to securities scheduled to mature in one year or less, $20.5$60.9 million is attributed to securities scheduled to mature between one to five years, $16.6$96.3 million is attributed to securities scheduled to mature between five to ten years, $24.2$60.0 million is attributed to securities scheduled to mature after ten years, and $23.5$77.8 million is related to mortgage-backed and other asset-backed securities. The gross unrealized losses as of December 31, 20042006 were concentrated primarily in the Mortgage-backed and other asset-backed securities, Industrial — Manufacturing, Financial — Other, and Industrial — TransportationServices sectors. The gross unrealized losses as of December 31, 20032005 were concentrated primarily in the Industrial — Consumer, Mortgage-backed and other asset-backed securities, Industrial — Transportation, andManufacturing, Industrial — ManufacturingServices, and Financial — Other sectors.
The following tables present our fixed maturity securities available-for-sale by investment grade and below investment grade and the associated gross unrealized gains and losses as of December 31, 2004,2006, and December 31, 2003.2005.
U.S. Invested Assets
Fixed Maturity Securities Available-for-Sale by Quality
| | December 31, 2006 | ||||||||||||
|---|---|---|---|---|---|---|---|---|---|---|---|---|---|
| | Amortized Cost | Gross Unrealized Gains | Gross Unrealized Losses | Carrying Amount | |||||||||
| | (in millions) | ||||||||||||
| Investment Grade: | |||||||||||||
| Public | $ | 26,995.7 | $ | 770.7 | $ | 201.5 | $ | 27,564.9 | |||||
| Private | 12,292.4 | 469.5 | 87.3 | 12,674.6 | |||||||||
| Below Investment Grade: | |||||||||||||
| Public | 1,070.5 | 44.2 | 6.0 | 1,108.7 | |||||||||
| Private | 830.1 | 51.4 | 5.1 | 876.4 | |||||||||
| Total fixed maturity securities, available-for-sale | $ | 41,188.7 | $ | 1,335.8 | $ | 299.9 | $ | 42,224.6 | |||||
| | December 31, 2004 | ||||||||||||
|---|---|---|---|---|---|---|---|---|---|---|---|---|---|
| | Amortized Cost | Gross Unrealized Gains | Gross Unrealized Losses | Carrying Amount | |||||||||
| | (in millions) | ||||||||||||
| Investment Grade: | |||||||||||||
| Public | $ | 23,634.9 | $ | 1,553.5 | $ | 36.8 | $ | 25,151.6 | |||||
| Private | 11,026.1 | 753.2 | 31.8 | 11,747.5 | |||||||||
| Below Investment Grade: | |||||||||||||
| Public | 1,239.2 | 93.1 | 6.7 | 1,325.6 | |||||||||
| Private | 842.5 | 79.8 | 13.3 | 909.0 | |||||||||
| Total fixed maturity securities, available-for-sale | $ | 36,742.7 | $ | 2,479.6 | $ | 88.6 | $ | 39,133.7 | |||||
U.S. Invested Assets
Fixed Maturity Securities Available-for-Sale by Quality
| | | December 31, 2003 | | December 31, 2005 | ||||||||||||||||||||||
|---|---|---|---|---|---|---|---|---|---|---|---|---|---|---|---|---|---|---|---|---|---|---|---|---|---|---|
| | | Amortized Cost | Gross Unrealized Gains | Gross Unrealized Losses | Carrying Amount | | Amortized Cost | Gross Unrealized Gains | Gross Unrealized Losses | Carrying Amount | ||||||||||||||||
| | | (in millions) | | (in millions) | ||||||||||||||||||||||
| Investment Grade: | Investment Grade: | Investment Grade: | ||||||||||||||||||||||||
| Public | $ | 21,733.3 | $ | 1,590.6 | $ | 36.1 | $ | 23,287.8 | Public | $ | 25,638.9 | $ | 1,024.9 | $ | 164.3 | $ | 26,499.5 | |||||||||
| Private | 9,050.2 | 671.7 | 40.3 | 9,681.6 | Private | 10,827.8 | 584.5 | 64.2 | 11,348.1 | |||||||||||||||||
| Below Investment Grade: | Below Investment Grade: | Below Investment Grade: | ||||||||||||||||||||||||
| Public | 1,407.6 | 102.1 | 12.4 | 1,497.3 | Public | 1,263.4 | 54.4 | 9.9 | 1,307.9 | |||||||||||||||||
| Private | 1,559.4 | 61.8 | 62.8 | 1,558.4 | Private | 787.3 | 73.0 | 5.1 | 855.2 | |||||||||||||||||
| Total fixed maturity securities, available-for-sale | Total fixed maturity securities, available-for-sale | $ | 33,750.5 | $ | 2,426.2 | $ | 151.6 | $ | 36,025.1 | Total fixed maturity securities, available-for-sale | $ | 38,517.4 | $ | 1,736.8 | $ | 243.5 | $ | 40,010.7 | ||||||||
U.S. Invested Assets
Unrealized Losses on Investment Grade Fixed Maturity Securities
Available-for-Sale by Aging Category
| | | December 31, 2004 | | December 31, 2006 | ||||||||||||||||||||||||||||||||||
|---|---|---|---|---|---|---|---|---|---|---|---|---|---|---|---|---|---|---|---|---|---|---|---|---|---|---|---|---|---|---|---|---|---|---|---|---|---|---|
| | | Public | Private | Total | | Public | Private | Total | ||||||||||||||||||||||||||||||
| | | Carrying Amount | Gross Unrealized Losses | Carrying Amount | Gross Unrealized Losses | Carrying Amount | Gross Unrealized Losses | | Carrying Amount | Gross Unrealized Losses | Carrying Amount | Gross Unrealized Losses | Carrying Amount | Gross Unrealized Losses | ||||||||||||||||||||||||
| | | (in millions) | | (in millions) | ||||||||||||||||||||||||||||||||||
| Three months or less | Three months or less | $ | 1,608.3 | $ | 9.4 | $ | 620.5 | $ | 4.7 | $ | 2,228.8 | $ | 14.1 | Three months or less | $ | 2,730.4 | $ | 17.6 | $ | 1,471.2 | $ | 9.1 | $ | 4,201.6 | $ | 26.7 | ||||||||||||
| Greater than three to six months | Greater than three to six months | 298.1 | 3.6 | 630.2 | 8.2 | 928.3 | 11.8 | Greater than three to six months | 30.3 | 0.4 | 22.7 | 0.3 | 53.0 | 0.7 | ||||||||||||||||||||||||
| Greater than six to nine months | Greater than six to nine months | 869.6 | 13.1 | 421.6 | 6.1 | 1,291.2 | 19.2 | Greater than six to nine months | 224.8 | 1.6 | 107.1 | 1.3 | 331.9 | 2.9 | ||||||||||||||||||||||||
| Greater than nine to twelve months | Greater than nine to twelve months | 225.1 | 3.8 | 107.1 | 2.7 | 332.2 | 6.5 | Greater than nine to twelve months | 1,502.6 | 28.2 | 549.9 | 8.2 | 2,052.5 | 36.4 | ||||||||||||||||||||||||
| Greater than twelve to twenty-four months | Greater than twelve to twenty-four months | 232.0 | 6.3 | 282.8 | 10.1 | 514.8 | 16.4 | Greater than twelve to twenty-four months | 5,688.9 | 126.0 | 1,938.1 | 52.2 | 7,627.0 | 178.2 | ||||||||||||||||||||||||
| Greater than twenty-four to thirty-six months | Greater than twenty-four to thirty-six months | — | — | — | — | — | — | Greater than twenty-four to thirty-six months | 843.4 | 22.9 | 365.5 | 10.2 | 1,208.9 | 33.1 | ||||||||||||||||||||||||
| Greater than thirty-six months | Greater than thirty-six months | 5.3 | 0.6 | — | — | 5.3 | 0.6 | Greater than thirty-six months | 101.5 | 4.8 | 113.9 | 6.0 | 215.4 | 10.8 | ||||||||||||||||||||||||
| Total fixed maturities, available-for-sale | $ | 3,238.4 | $ | 36.8 | $ | 2,062.2 | $ | 31.8 | $ | 5,300.6 | $ | 68.6 | Total fixed maturities, available-for-sale | $ | 11,121.9 | $ | 201.5 | $ | 4,568.4 | $ | 87.3 | $ | 15,690.3 | $ | 288.8 | |||||||||||||
U.S. Invested Assets
Unrealized Losses on Investment Grade Fixed Maturity Securities
Available-for-Sale by Aging Category
| | | December 31, 2003 | | December 31, 2005 | ||||||||||||||||||||||||||||||||||
|---|---|---|---|---|---|---|---|---|---|---|---|---|---|---|---|---|---|---|---|---|---|---|---|---|---|---|---|---|---|---|---|---|---|---|---|---|---|---|
| | | Public | Private | Total | | Public | Private | Total | ||||||||||||||||||||||||||||||
| | | Carrying Amount | Gross Unrealized Losses | Carrying Amount | Gross Unrealized Losses | Carrying Amount | Gross Unrealized Losses | | Carrying Amount | Gross Unrealized Losses | Carrying Amount | Gross Unrealized Losses | Carrying Amount | Gross Unrealized Losses | ||||||||||||||||||||||||
| | | (in millions) | | (in millions) | ||||||||||||||||||||||||||||||||||
| Three months or less | Three months or less | $ | 1,157.2 | $ | 7.2 | $ | 574.6 | $ | 14.2 | $ | 1,731.8 | $ | 21.4 | Three months or less | $ | 1,907.9 | $ | 11.3 | $ | 774.3 | $ | 6.3 | $ | 2,682.2 | $ | 17.6 | ||||||||||||
| Greater than three to six months | Greater than three to six months | 794.3 | 10.6 | 464.4 | 14.9 | 1,258.7 | 25.5 | Greater than three to six months | 4,332.5 | 79.6 | 1,574.5 | 29.3 | 5,907.0 | 108.9 | ||||||||||||||||||||||||
| Greater than six to nine months | Greater than six to nine months | 417.7 | 13.4 | 209.2 | 8.5 | 626.9 | 21.9 | Greater than six to nine months | 416.3 | 12.9 | 109.5 | 2.8 | 525.8 | 15.7 | ||||||||||||||||||||||||
| Greater than nine to twelve months | Greater than nine to twelve months | 50.8 | 1.5 | 5.1 | 0.3 | 55.9 | 1.8 | Greater than nine to twelve months | 1,032.0 | 22.3 | 212.3 | 5.2 | 1,244.3 | 27.5 | ||||||||||||||||||||||||
| Greater than twelve to twenty-four months | Greater than twelve to twenty-four months | — | — | 19.1 | 2.1 | 19.1 | 2.1 | Greater than twelve to twenty-four months | 1,191.2 | 33.3 | 457.2 | 14.7 | 1,648.4 | 48.0 | ||||||||||||||||||||||||
| Greater than twenty-four to thirty-six months | Greater than twenty-four to thirty-six months | 21.0 | 2.4 | — | — | 21.0 | 2.4 | Greater than twenty-four to thirty-six months | 118.5 | 4.8 | 161.8 | 5.9 | 280.3 | 10.7 | ||||||||||||||||||||||||
| Greater than thirty-six months | Greater than thirty-six months | 25.1 | 1.0 | 27.3 | 0.3 | 52.4 | 1.3 | Greater than thirty-six months | 1.4 | 0.1 | — | — | 1.4 | 0.1 | ||||||||||||||||||||||||
| Total fixed maturities, available-for-sale | $ | 2,466.1 | $ | 36.1 | $ | 1,299.7 | $ | 40.3 | $ | 3,765.8 | $ | 76.4 | Total fixed maturities, available-for-sale | $ | 8,999.8 | $ | 164.3 | $ | 3,289.6 | $ | 64.2 | $ | 12,289.4 | $ | 228.5 | |||||||||||||
U.S. Invested Assets
Unrealized Losses on Below Investment Grade Fixed Maturity Securities
Available-for-Sale by Aging Category
| | | December 31, 2004 | | December 31, 2006 | ||||||||||||||||||||||||||||||||||
|---|---|---|---|---|---|---|---|---|---|---|---|---|---|---|---|---|---|---|---|---|---|---|---|---|---|---|---|---|---|---|---|---|---|---|---|---|---|---|
| | | Public | Private | Total | | Public | Private | Total | ||||||||||||||||||||||||||||||
| | | Carrying Amount | Gross Unrealized Losses | Carrying Amount | Gross Unrealized Losses | Carrying Amount | Gross Unrealized Losses | | Carrying Amount | Gross Unrealized Losses | Carrying Amount | Gross Unrealized Losses | Carrying Amount | Gross Unrealized Losses | ||||||||||||||||||||||||
| | | (in millions) | | (in millions) | ||||||||||||||||||||||||||||||||||
| Three months or less | Three months or less | $ | 3.4 | $ | 1.5 | $ | 50.4 | $ | 2.8 | $ | 53.8 | $ | 4.3 | Three months or less | $ | 64.0 | $ | 0.2 | $ | 83.5 | $ | 0.5 | $ | 147.5 | $ | 0.7 | ||||||||||||
| Greater than three to six months | Greater than three to six months | — | — | 0.9 | 0.1 | 0.9 | 0.1 | Greater than three to six months | — | — | — | — | — | — | ||||||||||||||||||||||||
| Greater than six to nine months | Greater than six to nine months | 16.6 | 0.3 | — | — | 16.6 | 0.3 | Greater than six to nine months | 38.7 | 1.0 | — | — | 38.7 | 1.0 | ||||||||||||||||||||||||
| Greater than nine to twelve months | Greater than nine to twelve months | 39.4 | 0.6 | — | — | 39.4 | 0.6 | Greater than nine to twelve months | 56.6 | 1.3 | — | — | 56.6 | 1.3 | ||||||||||||||||||||||||
| Greater than twelve to twenty-four months | Greater than twelve to twenty-four months | — | — | 6.2 | 1.0 | 6.2 | 1.0 | Greater than twelve to twenty-four months | 152.8 | 3.5 | 117.8 | 3.0 | 270.6 | 6.5 | ||||||||||||||||||||||||
| Greater than twenty-four to thirty-six months | Greater than twenty-four to thirty-six months | 2.4 | 0.1 | 34.7 | 2.8 | 37.1 | 2.9 | Greater than twenty-four to thirty-six months | — | — | 27.3 | 1.5 | 27.3 | 1.5 | ||||||||||||||||||||||||
| Greater than thirty-six months | Greater than thirty-six months | 44.4 | 4.1 | 55.9 | 6.7 | 100.3 | 10.8 | Greater than thirty-six months | — | — | 0.6 | 0.1 | 0.6 | 0.1 | ||||||||||||||||||||||||
| Total fixed maturities, available-for-sale | $ | 106.2 | $ | 6.6 | $ | 148.1 | $ | 13.4 | $ | 254.3 | $ | 20.0 | Total fixed maturities, available-for-sale | $ | 312.1 | $ | 6.0 | $ | 229.2 | $ | 5.1 | $ | 541.3 | $ | 11.1 | |||||||||||||
U.S. Invested Assets
Unrealized Losses on Below Investment Grade Fixed Maturity Securities
Available-for-Sale by Aging Category
| | | December 31, 2003 | | December 31, 2005 | ||||||||||||||||||||||||||||||||||
|---|---|---|---|---|---|---|---|---|---|---|---|---|---|---|---|---|---|---|---|---|---|---|---|---|---|---|---|---|---|---|---|---|---|---|---|---|---|---|
| | | Public | Private | Total | | Public | Private | Total | ||||||||||||||||||||||||||||||
| | | Carrying Amount | Gross Unrealized Losses | Carrying Amount | Gross Unrealized Losses | Carrying Amount | Gross Unrealized Losses | | Carrying Amount | Gross Unrealized Losses | Carrying Amount | Gross Unrealized Losses | Carrying Amount | Gross Unrealized Losses | ||||||||||||||||||||||||
| | | (in millions) | | (in millions) | ||||||||||||||||||||||||||||||||||
| Three months or less | Three months or less | $ | 41.1 | $ | 0.6 | $ | 67.9 | $ | 28.8 | $ | 109.0 | $ | 29.4 | Three months or less | $ | 121.9 | $ | 0.7 | $ | 55.8 | $ | 1.8 | $ | 177.7 | $ | 2.5 | ||||||||||||
| Greater than three to six months | Greater than three to six months | 5.3 | 0.8 | 40.4 | 6.0 | 45.7 | 6.8 | Greater than three to six months | 81.9 | 4.7 | 36.4 | 0.8 | 118.3 | 5.5 | ||||||||||||||||||||||||
| Greater than six to nine months | Greater than six to nine months | 3.5 | 0.1 | 24.1 | 0.1 | 27.6 | 0.2 | Greater than six to nine months | 50.8 | 0.8 | 36.8 | 1.2 | 87.6 | 2.0 | ||||||||||||||||||||||||
| Greater than nine to twelve months | Greater than nine to twelve months | — | — | 0.8 | 0.1 | 0.8 | 0.1 | Greater than nine to twelve months | 49.2 | 1.9 | 18.4 | 0.5 | 67.6 | 2.4 | ||||||||||||||||||||||||
| Greater than twelve to twenty-four months | Greater than twelve to twenty-four months | 26.9 | 0.8 | 68.6 | 9.1 | 95.5 | 9.9 | Greater than twelve to twenty-four months | 36.9 | 1.2 | 8.5 | 0.3 | 45.4 | 1.5 | ||||||||||||||||||||||||
| Greater than twenty-four to thirty-six months | Greater than twenty-four to thirty-six months | 64.2 | 8.8 | 62.6 | 8.2 | 126.8 | 17.0 | Greater than twenty-four to thirty-six months | — | — | 0.6 | 0.1 | 0.6 | 0.1 | ||||||||||||||||||||||||
| Greater than thirty-six months | Greater than thirty-six months | 9.1 | 1.3 | 78.6 | 10.5 | 87.7 | 11.8 | Greater than thirty-six months | 49.9 | 0.6 | 19.8 | 0.4 | 69.7 | 1.0 | ||||||||||||||||||||||||
| Total fixed maturities, available-for-sale | $ | 150.1 | $ | 12.4 | $ | 343.0 | $ | 62.8 | $ | 493.1 | $ | 75.2 | Total fixed maturities, available-for-sale | $ | 390.6 | $ | 9.9 | $ | 176.3 | $ | 5.1 | $ | 566.9 | $ | 15.0 | |||||||||||||
Of total gross unrealized losses as of December 31, 20042006 and December 31, 2003, $68.62005, $288.8 million and $76.4$228.5 million were related to investment grade securities, respectively. Gross unrealized losses related to below investment grade securities were $20.0$11.1 million and $75.2$15.0 million as of December 31, 20042006 and December 31, 2003,2005, respectively.
The following tables present the carrying amount and gross unrealized losses on fixed maturity securities available-for-sale, where the estimated fair value has declined and remained below amortized cost by 20% or more as of December 31, 2004,2006, and December 31, 2003.2005.
U.S. Invested Assets
Unrealized Losses on Fixed Maturity Securities
Available-for-Sale by Aging Category
| | | December 31, 2004 | | December 31, 2006 | ||||||||||||||||||||||||||||||||||
|---|---|---|---|---|---|---|---|---|---|---|---|---|---|---|---|---|---|---|---|---|---|---|---|---|---|---|---|---|---|---|---|---|---|---|---|---|---|---|
| | | Problem, Potential Problem, and Restructured | All Other Fixed Maturity Securities | Total | | Problem, Potential Problem, and Restructured | All Other Fixed Maturity Securities | Total | ||||||||||||||||||||||||||||||
| | | Carrying Amount | Gross Unrealized Losses | Carrying Amount | Gross Unrealized Losses | Carrying Amount | Gross Unrealized Losses | | Carrying Amount | Gross Unrealized Losses | Carrying Amount | Gross Unrealized Losses | Carrying Amount | Gross Unrealized Losses | ||||||||||||||||||||||||
| | | (in millions) | | (in millions) | ||||||||||||||||||||||||||||||||||
| Three months or less | Three months or less | $ | 3.5 | $ | 2.7 | $ | 6.1 | $ | 1.5 | $ | 9.6 | $ | 4.2 | Three months or less | $ | — | $ | — | $ | 0.7 | $ | 0.2 | $ | 0.7 | $ | 0.2 | ||||||||||||
| Greater than three to six months | Greater than three to six months | — | — | — | — | — | — | Greater than three to six months | — | — | 0.3 | 0.2 | 0.3 | 0.2 | ||||||||||||||||||||||||
| Greater than six to nine months | Greater than six to nine months | — | — | — | — | — | — | Greater than six to nine months | — | — | — | — | — | — | ||||||||||||||||||||||||
| Greater than nine to twelve months | Greater than nine to twelve months | — | — | — | — | — | — | Greater than nine to twelve months | — | — | — | — | — | — | ||||||||||||||||||||||||
| Greater than twelve months | Greater than twelve months | 2.0 | 0.9 | — | — | 2.0 | 0.9 | Greater than twelve months | — | — | — | — | — | — | ||||||||||||||||||||||||
| Total fixed maturity securities, available-for-sale | $ | 5.5 | $ | 3.6 | $ | 6.1 | $ | 1.5 | $ | 11.6 | $ | 5.1 | Total fixed maturity securities, available-for-sale | $ | — | $ | — | $ | 1.0 | $ | 0.4 | $ | 1.0 | $ | 0.4 | |||||||||||||
U.S. Invested Assets
Unrealized Losses on Fixed Maturity Securities Available-for-Sale by Aging Category
| | | December 31, 2003 | | December 31, 2005 | ||||||||||||||||||||||||||||||||||
|---|---|---|---|---|---|---|---|---|---|---|---|---|---|---|---|---|---|---|---|---|---|---|---|---|---|---|---|---|---|---|---|---|---|---|---|---|---|---|
| | | Problem, Potential Problem, and Restructured | All Other Fixed Maturity Securities | Total | | Problem, Potential Problem, and Restructured | All Other Fixed Maturity Securities | Total | ||||||||||||||||||||||||||||||
| | | Carrying Amount | Gross Unrealized Losses | Carrying Amount | Gross Unrealized Losses | Carrying Amount | Gross Unrealized Losses | | Carrying Amount | Gross Unrealized Losses | Carrying Amount | Gross Unrealized Losses | Carrying Amount | Gross Unrealized Losses | ||||||||||||||||||||||||
| | | (in millions) | | (in millions) | ||||||||||||||||||||||||||||||||||
| Three months or less | Three months or less | $ | 30.9 | $ | 34.6 | $ | — | $ | — | $ | 30.9 | $ | 34.6 | Three months or less | $ | — | $ | — | $ | 4.2 | $ | 2.1 | $ | 4.2 | $ | 2.1 | ||||||||||||
| Greater than three to six months | Greater than three to six months | — | — | — | — | — | — | Greater than three to six months | — | — | — | — | — | — | ||||||||||||||||||||||||
| Greater than six to nine months | Greater than six to nine months | — | — | — | — | — | — | Greater than six to nine months | — | — | — | — | — | — | ||||||||||||||||||||||||
| Greater than nine to twelve months | Greater than nine to twelve months | 0.5 | 0.1 | — | — | 0.5 | 0.1 | Greater than nine to twelve months | — | — | — | — | — | — | ||||||||||||||||||||||||
| Greater than twelve months | Greater than twelve months | 3.6 | 1.5 | 7.7 | 2.2 | 11.3 | 3.7 | Greater than twelve months | — | — | — | — | — | — | ||||||||||||||||||||||||
| Total fixed maturity securities, available-for-sale | $ | 35.0 | $ | 36.2 | $ | 7.7 | $ | 2.2 | $ | 42.7 | $ | 38.4 | Total fixed maturity securities, available-for-sale | $ | — | $ | — | $ | 4.2 | $ | 2.1 | $ | 4.2 | $ | 2.1 | |||||||||||||
Gross unrealized losses on fixed maturity securities where the estimated fair value has been 20% or more below amortized cost were $5.1$0.4 million as of December 31, 20042006 and $38.4$2.1 million as of December 31, 2003. The2005. There were no gross unrealized losses attributed to those securities considered to be "problem", "potential problem" or "restructured" were $3.6 million and $36.2 million as of December 31, 2004,2006 and December 31, 2003, respectively.2005.
The following table presents the total carrying amount of our fixed maturity portfolio, as well as its problem, potential problem and restructured fixed maturities for the periods indicated:
U.S. Invested Assets
Problem, Potential Problem and Restructured Fixed Maturities at Carrying Amount
| | | December 31, | ||||||||||||||
|---|---|---|---|---|---|---|---|---|---|---|---|---|---|---|---|---|
| | | December 31, 2004 | December 31, 2003 | | 2006 | 2005 | ||||||||||
| | | ($ in millions) | | ($ in millions) | ||||||||||||
| Total fixed maturity securities (public and private) | Total fixed maturity securities (public and private) | $ | 39,226.7 | $ | 36,128.0 | Total fixed maturity securities (public and private) | $ | 42,423.8 | $ | 40,115.7 | ||||||
| Problem fixed maturity securities | Problem fixed maturity securities | $ | 68.5 | $ | 152.5 | Problem fixed maturity securities | $ | 3.5 | $ | 42.0 | ||||||
| Potential problem fixed maturity securities | Potential problem fixed maturity securities | 119.6 | 230.1 | Potential problem fixed maturity securities | 2.2 | 101.6 | ||||||||||
| Restructured fixed maturity securities | Restructured fixed maturity securities | 10.4 | 39.9 | Restructured fixed maturity securities | 11.2 | — | ||||||||||
| Total problem, potential problem and restructured fixed maturity securities | $ | 198.5 | $ | 422.5 | Total problem, potential problem and restructured fixed maturity securities | $ | 16.9 | $ | 143.6 | |||||||
| Total problem, potential problem and restructured fixed maturity securities as a percent of total fixed maturity securities | 1 | % | 1 | % | Total problem, potential problem and restructured fixed maturity securities as a percent of total fixed maturity securities | .04 | % | .36 | % | |||||||
Mortgage Loans
Mortgage loans consist primarily of commercial mortgage loans on real estate. At December 31, 2004,2006, commercial mortgage loans represented $10,224.7aggregated to $10,090.3 million. Commercial mortgage loans on real estate are generally reported at cost adjusted for amortization of premiums and accrual of discounts, computed using the interest method, and net of valuation allowances. Commercial mortgage loans held for sale are carried at the lower of cost or fair value, less cost to sell, and reported as mortgage loans in the statements of financial position.
Commercial mortgages play an important role in our investment strategy by:
- •
- providing strong risk-adjusted relative value in comparison to other investment alternatives;
- •
- enhancing total returns; and
- •
- providing strategic portfolio diversification.
As a result, we have focused on constructing a solid, high quality portfolio of mortgages. Our portfolio is generally comprised of mortgages with conservative loan-to-value ratios, high debt service coverages and general purpose property types with a strong credit tenancy.
Our commercial loan portfolio consists of primarily non-recourse, fixed rate mortgages on fully or near fully leased properties. The mortgage portfolio is comprised of general-purpose industrial properties, manufacturing office properties and credit oriented retail properties.
Credit extensions in the state of California accounted for 19%17% of our commercial mortgage loan portfolio as of December 31, 2004.2006. We are, therefore, exposed to potential losses resulting from the risk of catastrophes, such as earthquakes, that may affect the region. Like other lenders, we generally do not require earthquake insurance for properties on which we make commercial mortgage loans. With respect to California properties, however, we obtain an engineering report specific to each property. The report assesses the building's design specifications, whether it has been upgraded to meet seismic building codes and the maximum loss that is likely to result from a variety of different seismic events. We also obtain a report that assesses, by building and geographic fault lines, the amount of loss our commercial mortgage loan portfolio might suffer under a variety of seismic events.
Our commercial loan portfolio is highly diversified by borrower. As of December 31, 2004, 36%2006, 38% of the U.S. commercial mortgage loan portfolio was comprised of mortgage loans with principal balances of less than $10.0 million. The total number of commercial mortgage loans outstanding as of December 31, 20042006 and December 31, 20032005 was 1,3181,262 and 1,447,1,309, respectively. The average loan size of our commercial mortgage portfolio was $7.8$8.0 million as of December 31, 2004.2006.
We actively monitor and manage our commercial mortgage loan portfolio. Substantially all loans within the portfolio are analyzed regularly and are internally rated, based on a proprietary risk rating cash flow model, in order to monitor the financial quality of these assets and are internally rated.assets. Based on ongoing monitoring, mortgage loans with a likelihood of becoming delinquent are identified and placed on an internal "watch list". Among criteria which would indicate a potential problem are: imbalances in ratios of loan to value or contract rents to debt service, major tenant vacancies or bankruptcies, borrower sponsorship problems, late payments, delinquent taxes and loan relief/restructuring requests.
We review our mortgage loan portfolio and analyze the need for a valuation allowance for any loan which is delinquent for 60 days or more, in process of foreclosure, restructured, on the "watch list", or which currently has a valuation allowance. We categorize loans, which are delinquent, loans in process of foreclosure, and loans to borrowers in
bankruptcy as "problem" loans. Potential problem loans are loans placed on an internal "watch list" for which management has concerns as to the ability of the borrower to comply with the present loan payment terms and which may result in the loan becoming a problem or being restructured. The decision whether to classify a performing loan as a potential problem involves significant subjective judgments by management as to the likely future economic conditions and developments with respect to the borrower. We categorize loans for which the original terms of the mortgages have been modified or for which interest or principal payments have been deferred as "restructured" loans. We also consider matured loans that are refinanced at below market rates as restructured.
The valuation allowance for commercial mortgage loans includes a loan specific allowance for impaired loans and a provision for losses based on past loss experience believed to be adequate to absorb estimated probable credit losses. The changes in this valuation allowance are reported as a net realized/unrealized capital loss on our consolidated statements of operations.
Commercial mortgage loans on real estate are considered impaired when, based on current information and events, it is probable that we will be unable to collect all amounts due according to contractual terms of the loan agreement. When we determine that a loan is impaired, a valuation allowance is established or a direct write-down of the loan is recorded for the difference between the carrying amount of the mortgage loan and the estimated value. Estimated value is based on either the present value of the expected future cash flows discounted at the loan's effective interest rate, the loan's observable market price or fair value of the collateral. When a valuation allowance is established, subsequent recoveries are charged to the valuation allowance and subsequent losses may be charged to the valuation allowance or as a direct write-down of the loan.
The determination of the calculation and the adequacy of the mortgage loan loss provision based on past experience and mortgage impairments areis subjective. Our periodic evaluation and assessment of the adequacy of the provision for losses and the need for mortgage impairments is based on known and inherent risks in the portfolio, adverse situations that may affect the borrower's ability to repay, the estimated value of the underlying collateral, composition of the loan portfolio, current economic conditions, loss experience and other relevant factors. The current portfolio statistics and past loss experience produced a provision for the Principal Life general account totaling $35.9$30.7 million. The evaluation of our impaired loan component of the allowance is subjective, as it requires estimating the amounts and timing of future cash flows expected to be received on impaired loans. Our financial position is sensitive to changes in estimated cash flows from mortgages, the value of the collateral, and changes in the economic environment in general. Decreases in the valuation allowance aggregated to $7.2$1.0 million for the year ended December 31, 2004,2006, and $34.0$9.2 million for the year ended December 31, 2003.
As a result of a change in estimates, we evaluated the adequacy of our provision for losses based on past experience at December 31, 2004 and December 31, 2003, and released $8.5 million and $23.9 million, respectively from the allowance.2005.
The following table represents our commercial mortgage valuation allowance for the periods indicated:
U.S. Invested Assets
Commercial Mortgage Valuation Allowance
| | December 31, | |||||||||||||
|---|---|---|---|---|---|---|---|---|---|---|---|---|---|---|
| | December 31, 2004 | December 31, 2003 | 2006 | 2005 | ||||||||||
| | ($ in millions) | ($ in millions) | ||||||||||||
| Beginning balance | $ | 49.6 | $ | 83.6 | $ | 33.2 | $ | 42.4 | ||||||
| Provision | 14.4 | 1.3 | 1.3 | 6.7 | ||||||||||
| Release | (21.6 | ) | (35.3 | ) | (2.3 | ) | (15.9 | ) | ||||||
| Ending balance | $ | 42.4 | $ | 49.6 | $ | 32.2 | $ | 33.2 | ||||||
| Valuation allowance as % of carrying value before reserves | 1 | % | 1 | % | .32 | % | .33 | % | ||||||
The following table presents the carrying amounts of problem, potential problem and restructured commercial mortgages relative to the carrying amount of all commercial mortgages for the periods indicated:
U.S. Invested Assets
Problem, Potential Problem and Restructured Commercial Mortgages at Carrying Amount
| | | December 31, | ||||||||||||||
|---|---|---|---|---|---|---|---|---|---|---|---|---|---|---|---|---|
| | | December 31, 2004 | December 31, 2003 | | 2006 | 2005 | ||||||||||
| | | ($ in millions) | | ($ in millions) | ||||||||||||
| Total commercial mortgages | Total commercial mortgages | $ | 10,224.7 | $ | 9,630.4 | Total commercial mortgages | $ | 10,090.3 | $ | 9,890.7 | ||||||
| Problem commercial mortgages(1) | Problem commercial mortgages(1) | $ | 38.2 | $ | 45.9 | Problem commercial mortgages(1) | $ | 10.7 | $ | 10.4 | ||||||
| Potential problem commercial mortgages | Potential problem commercial mortgages | 51.2 | 99.3 | Potential problem commercial mortgages | 9.1 | 10.2 | ||||||||||
| Restructured commercial mortgages | Restructured commercial mortgages | 59.3 | 65.3 | Restructured commercial mortgages | 6.8 | 65.1 | ||||||||||
| Total problem, potential problem and restructured commercial mortgages | $ | 148.7 | $ | 210.5 | Total problem, potential problem and restructured commercial mortgages | $ | 26.6 | $ | 85.7 | |||||||
| Total problem, potential problem and restructured commercial mortgages as a percent of total commercial mortgages | 2 | % | 2 | % | Total problem, potential problem and restructured commercial mortgages as a percent of total commercial mortgages | .26 | % | .87 | % | |||||||
- (1)
- Problem commercial mortgages include
nomortgage loans in foreclosure of $10.6 million as of December 31, 2006. This is the same mortgage loan that was in foreclosure as of December 31,2004 and December 31, 2003.2005.
Equity Real Estate
We hold commercial equity real estate as part of our investment portfolio. As of December 31, 2004,2006, and December 31, 2003,2005, the carrying amount of equity real estate investment was $1,021.2$854.8 million and $1,516.6$888.4 million, or 2%1% and 3%1%, of U.S. invested assets, respectively. Our commercial equity real estate is held in the form of wholly owned real estate, real estate acquired upon foreclosure of commercial mortgage loans, and majority owned interests in real estate joint ventures.
Equity real estate is categorized as either "real estate held for investment" or "real estate held for sale". Real estate held for investment totaled $885.1$736.6 million as of December 31, 2004,2006, and $1,003.6$754.6 million as of December 31, 2003.2005. The carrying value of real estate held for investment is generally adjusted for impairment whenever events or changes in circumstances indicate that the carrying amount of the asset may not be recoverable. Such impairment adjustments are recorded as realized investment losses and accordingly, are reflected in our consolidated results of operations. For the years ended December 31, 20042006 and December 31, 2003,2005, there were no such impairment adjustments.
The carrying amount of real estate held for sale as of December 31, 2004,2006, and December 31, 2003,2005, was $136.1$118.2 million and $513.0$133.8 million, net of valuation allowances of $5.8$4.7 million and $19.1$4.2 million, respectively. Once we identify a real estate property to be sold and commence a plan for marketing the property, we classify the property as held for sale. We establish a valuation allowance subject to periodicalperiodic revisions, if necessary, to adjust the carrying value of the property to reflect the lower of its current carrying value or the fair value, less associated selling costs.
We use research, both internal and external, to recommend appropriate product and geographic allocations and changes to the equity real estate portfolio. We monitor product, geographic and industry diversification separately and together to determine the most appropriate mix.
Equity real estate is distributed across geographic regions of the country with larger concentrations in the South Atlantic, Pacific, and West South Central regions of the United States as of December 31, 2004.2006. By property type, there is a concentration in office buildings and industrial sites that represented approximately 39%63% of the equity real estate portfolio as of December 31, 2004.2006.
Other Investments
Our other investments totaled $1,339.7$972.6 million as of December 31, 2004,2006, compared to $1,198.8$755.3 million as of December 31, 2003.2005. Derivatives accounted for $856.8$699.2 million in other investments as of December 31, 2004.2006. The remaining invested assets include minority interests in unconsolidated entities andequity method investments, which include properties owned jointly with venture partners and operated by the partners.
International Investment Operations
As of December 31, 2004,2006, our international investment operations consist of the investments of Principal International comprised of $2.5$3.3 billion in invested assets. Principal Global Investors works withadvises each Principal International affiliate to developon investment policies and strategies that are consistent with the products they offer. Due to the regulatory constraints in each country, each company maintains its own investment policies, which are approved by Principal Global Investors. Each international affiliate is required to submit a compliance report relative to its strategy to Principal Global Investors. Principal Global Investors employees and international affiliate company credit analysts jointly review each corporate credit annually.policies.
Overall Composition of International Invested Assets
As shown in the following table, the major categories of international invested assets as of December 31, 2004,2006, and December 31, 2003,2005, were fixed maturity securities and residential mortgage loans:
| | | December 31, 2004 | December 31, 2003 | | December 31, 2006 | December 31, 2005 | ||||||||||||||||||
|---|---|---|---|---|---|---|---|---|---|---|---|---|---|---|---|---|---|---|---|---|---|---|---|---|
| | | Carrying Amount | % of Total | Carrying Amount | % of Total | | Carrying Amount | % of Total | Carrying Amount | % of Total | ||||||||||||||
| | | ($ in millions) | | ($ in millions) | ||||||||||||||||||||
| Fixed maturity securities | Fixed maturity securities | Fixed maturity securities | ||||||||||||||||||||||
| Public | $ | 1,782.6 | 72 | % | $ | 1,312.3 | 66 | % | Public | $ | 2,303.1 | 69 | % | $ | 2,114.1 | 69 | % | |||||||
| Private | — | — | 81.0 | 4 | Private | — | — | 0.6 | — | |||||||||||||||
| Equity securities | Equity securities | 36.7 | 2 | 41.8 | 2 | Equity securities | 51.9 | 2 | 50.7 | 2 | ||||||||||||||
| Mortgage loans | Mortgage loans | Mortgage loans | ||||||||||||||||||||||
| Residential | 385.8 | 16 | 333.1 | 17 | Residential | 522.0 | 16 | 505.1 | 17 | |||||||||||||||
| Real estate held for investment | Real estate held for investment | 10.8 | — | 9.5 | 1 | Real estate held for investment | 12.2 | — | 11.7 | — | ||||||||||||||
| Other investments | Other investments | 246.0 | 10 | 213.3 | 10 | Other investments | 438.1 | 13 | 358.2 | 12 | ||||||||||||||
| Total invested assets | 2,461.9 | 100 | % | 1,991.0 | 100 | % | Total invested assets | 3,327.3 | 100 | % | 3,040.4 | 100 | % | |||||||||||
| Cash and cash equivalents | Cash and cash equivalents | 83.0 | 71.4 | Cash and cash equivalents | 55.0 | 56.2 | ||||||||||||||||||
| Total invested assets and cash | $ | 2,544.9 | $ | 2,062.4 | Total invested assets and cash | $ | 3,382.3 | $ | 3,096.6 | |||||||||||||||
Item 7A. Quantitative and Qualitative Disclosures About Market Risk
Market Risk Exposures and Risk Management
Market risk is the risk that we will incur losses due to adverse fluctuations in market rates and prices. Our primary market risk exposure is to changes in interest rates, although we also have exposures to changes in equity prices and foreign currency exchange rates.
The active management of market risk is an integral part of our operations. We manage our overall market risk exposure within established risk tolerance ranges by using the following approaches:
- •
- rebalance our existing asset or liability portfolios;
- •
- control the risk structure of newly acquired assets and liabilities; or
- •
- use derivative instruments to modify the market risk characteristics of existing assets or liabilities or assets expected to be purchased.
Interest Rate Risk
Interest rate risk is the risk that we will incur economic losses due to adverse changes in interest rates. Our exposure toOne source of interest rate risk stems largely from our substantial holdingsis the inherent difficulty in obtaining assets that mature or have their rate reset at the exact same time as the liabilities they support. Assets may have to be reinvested or sold in the future to meet the liability cashflows in unknown interest rate environments. Also, there may be timing differences between when new liabilities are priced and when assets are purchased or procured that can cause fluctuations in profitability if interest rates move materially in the interim. A third source of guaranteed fixed rate liabilities in our U.S. Asset Management and Accumulation segment.
We manage the interest rate risk inherent in our assets relative tois the interest rate risk inherent in our liabilities.prepayment options embedded within asset and liability contracts that can alter the cash flow profiles from what was originally expected.
One of the measures we use to quantify thisour exposure to interest rate risk is duration. To calculate duration, we project asset and liability cashflows. These cashflowscash flows are discounted to a net present value basis using a spot yield curve, which is a blend of the spot yield curves for each of the asset types in the portfolio. Duration is calculated by re-calculating these cashflows, and redeterminingre-determining the net present value based upon an alternative level of interest rates, and determining the percentage change in fair value.
We manage interest rate risks in a number of ways. Differences in durations between assets and liabilities are measured and kept within acceptable tolerances. Derivatives are also commonly used to mitigate interest rate risk due to cashflow mismatches and timing differences. Prepayment risk is controlled by limiting our exposure to investments that are prepayable without penalty prior to maturity at the option of the issuer. We also require additional yield on these investments to compensate for the risk the issuer will exercise such option. Prepayment risk is also controlled by limiting the sales of liabilities with features such as puts or other options that can be exercised against the company at inopportune times.
Duration-Managed. Our exposure to interest rate risk stems largely from our substantial holdings of guaranteed fixed rate liabilities in our U.S. Asset Management and Accumulation segment. We actively manage the duration of assets and liabilities in these products by minimizing the difference between the two. We have established a maximum tolerance for this difference and seek to stay within this tolerance.
As of December 31, 2004,2006, the difference between the asset and liability durations on our primary duration managed portfolio was +.05.+.03. This duration gap indicates that, as of this date, the sensitivity of the fair value of our assets to interest rate movements is greater than that of the fair value of our liabilities. Our goal is to minimize the duration gap. Currently, our guidelines indicate that total duration gaps between the asset and liability portfolios should be within +/-0.25. The value of the assets in this portfolio was $31,985.8$33,027.5 million as of December 31, 2004.2006.
Duration-Monitored. For products such as whole life insurance and term life insurance that are less sensitive to interest rate risk, and for other products such as individual single premium deferred annuities, we manage interest rate risk based on a modeling process that considers the target average life, maturities, crediting rates and assumptions of policyholder behavior. As of December 31, 2004,2006, the weighted-average difference between the asset and liability durations on these portfolios was +.44.+.51. This duration gap indicates that, as of this date, the sensitivity of the fair value of our assets to interest rate movements is greater than that of the fair value of our liabilities. We attempt to monitor this duration gap consistent with our overall risk/reward tolerances. The value of the assets in the duration-monitoredthese portfolios was $14,636.1$16,314.3 million as of December 31, 2004.2006.
Non Duration-Managed. We also have a block of participating general account pension business that passes most of the actual investment performance of the assets to the customer. The investment strategy of this block is to maximize investment return to the customer on a "best efforts" basis, and there is little or no attempt to manage the duration of this portfolio since there is little or no interest rate risk. The value of the assets in the non duration-managedthese portfolios was $1,818.3$4,875.7 million as of December 31, 2004.2006.
Using the assumptions and data in effect as of December 31, 2004,2006, we estimate that a 100 basis point immediate, parallel increase in interest rates decreases the net fair value of our portfolio by $81.0approximately $92.5 million. The following table details the estimated changes by risk management strategy. The table also gives the weighted-average duration of the asset portfolio for each category, and the net duration gap (i.e. the weighted averageweighted-average difference between the asset and liability durations).
| | December 31, 2004 | |||||||||||
|---|---|---|---|---|---|---|---|---|---|---|---|---|
| Risk Management Strategy | Value of Total Assets | Duration of Assets | Net Duration Gap | Net Fair Value Change | ||||||||
| | (in millions) | | | (in millions) | ||||||||
| Primary duration-managed | $ | 31,985.8 | 4.01 | .05 | $ | (16.0 | ) | |||||
| Duration-monitored | 14,636.1 | 5.13 | .44 | (65.0 | ) | |||||||
| Non duration-managed | 1,818.3 | 5.94 | N/A | N/A | ||||||||
| Total | $ | 48,440.2 | $ | (81.0 | ) | |||||||
| | December 31, 2006 | ||||||||||
|---|---|---|---|---|---|---|---|---|---|---|---|
| Risk Management Strategy | Value of Total Assets | Duration of Assets | Net Duration Gap | Net Fair Value Change | |||||||
| | (in millions) | | | (in millions) | |||||||
| Primary duration-managed | $ | 33,027.5 | 3.76 | .03 | $ | (9.9 | ) | ||||
| Duration-monitored | 16,314.3 | 4.84 | .51 | (82.6 | ) | ||||||
| Non duration-managed | 4,875.7 | 4.09 | N/A | N/A | |||||||
| Total | $ | 54,217.5 | $ | (92.5 | ) | ||||||
Our selection of a 100 basis point immediate, parallel increase or decrease in interest rates is a hypothetical rate scenario we use to demonstrate potential risk. While a 100 basis point immediate, parallel increase does not represent our view of future market changes, it is a near term reasonably possible hypothetical change that illustrates the potential impact of such events. While these fair value measurements provide a representation of interest rate sensitivity, they are based on our portfolio exposures at a point in time and may not be representative of future market results. These exposures will change as a result of ongoing portfolio transactions in response to new business, management's assessment of changing market conditions and available investment opportunities.
Cash Flow Volatility Debt Issued and Outstanding. As of December 31, 2006, the aggregate fair value of long-term debt was $1,622.7 million. A 100 basis point, immediate, parallel decrease in interest rates would increase the fair value of debt by approximately $124.0 million. Debt is not recorded at fair value on the statement of financial position.
| | December 31, 2006 | |||||||||
|---|---|---|---|---|---|---|---|---|---|---|
| | Fair Value (no accrued interest) | |||||||||
| | -100 Basis Point Change | No Change | +100 Basis Point Change | |||||||
| | (in millions) | |||||||||
| 8.2% notes payable, due 2009 | $ | 509.7 | $ | 497.7 | $ | 486.2 | ||||
| 4.59% notes payable, due 2011 | 57.3 | 54.9 | 52.5 | |||||||
| 4.93% notes payable, due 2011 | 47.4 | 45.4 | 43.5 | |||||||
| 6.05% notes payable, due 2036 | 710.0 | 614.2 | 536.9 | |||||||
| 8% surplus notes payable, due 2044 | 116.7 | 108.3 | 99.6 | |||||||
| Non-recourse mortgages and notes payable | 264.6 | 261.6 | 258.7 | |||||||
| Other mortgages and notes payable | 41.0 | 40.6 | 40.2 | |||||||
| Total long-term debt | $ | 1,746.7 | $ | 1,622.7 | $ | 1,517.6 | ||||
Cash flow volatility arises as a result Use of several factors. One is the inherent difficulty in perfectly matching the cash flows of new asset purchases with that of new liabilities. Another factor is the inherent cash flow volatility of some classes of assets and liabilities. In orderDerivatives to minimize cash flow volatility, we manage differences between expected asset and liability cash flows within pre-established guidelines.
We also seek to minimize cash flow volatility by restricting the portion of securities with redemption features held in our invested asset portfolio. These asset securities include redeemable corporate securities, mortgage-backed securities or other assets with options that, if exercised, could alter the expected future cash inflows. In addition, we limit sales liabilities with features such as puts or other options that may change the cash flow profile of the liability portfolio.
Manage Interest Rate Risk.Derivatives
We use various derivative financial instruments to manage our exposure to fluctuations in interest rates, including interest rate swaps, swaptions, futures, Treasury rate guarantees, interest rate lock commitments andtotal return swaps, mortgage-backed forwards and options. We use interest rate swaps, futures contracts and mortgage-backed forwards to hedge changes in interest rates subsequent to the issuance of an insurance liability, such as a guaranteed investment contract, but prior to the purchase of a supporting asset, or during periods of holding assets in anticipation of near term liability sales. We use interest rate swaps primarily to more closely match the interest rate characteristics of assets and liabilities. They can be used to change the sensitivity to the interest rate of specific assets and liabilities as well as an entire portfolio. We also use these instruments to hedge the interest rate exposure in our commercial mortgage-backed securitization operations. Occasionally, we will sell a callable liability or a liability with attributes similar to a call option. In these cases, weinvestment-type agreement and will use written interest rate swaptions or similar products to hedge the risk of early liability payment thereby transformingtransform the callable liability into a fixed term liability.
We also seek to reduce call or prepayment risk arising from changes in interest rates in individual investments. We limit our exposure to investments that are prepayable without penalty prior to maturity at the option of the issuer, and we require additional yield on these investments to compensate for the risk that the issuer will exercise such option. An example of an investment we limit because of the option risk is residential mortgage-backed securities. We assess option risk in all investments we make and, when we assume such risk, we seek to price for it accordingly to achieve an appropriate return on our investments.
We have increased our credit exposure through credit default swaps by investing in $42.5 million of subordinated tranches of a synthetic collateralized debt obligation. The outstanding notional amount as of December 31, 2004 was $500.0 million and the mark to market value was $11.9 million. We also invested in credit default swaps creating replicated assets with a notional of $448.3 million and mark to market value of $5.3 million as of December 31, 2004.
We also offer a guaranteed fund as an investment option in our defined contribution plans in Hong Kong. This fund contains an embedded option that has been bifurcated and accounted for separately in realized gains (losses). We recognized a $0.1 million pre-tax gain for the year ended December 31, 2004.
The obligation to deliver the underlying securities of certain consolidated grantor trusts to various unrelated trust certificate holders contains an embedded derivative of the forecasted transaction to deliver the underlying securities.
We offer an equity indexed annuity product that contains an embedded derivative that has been bifurcated and accounted for separately in realized gains (losses). We economically hedge the equity indexed annuity product by purchasing options that match the product's profile. For the year ended December 31, 2004, we recognized a $0.5 million pre-tax gain on the call spread options purchased and a $0.2 million pre-tax loss on the change in fair value of the embedded derivatives.
In conjunction with our use of derivatives, we are exposed to counterparty risk, or the risk that the counterparty fails to perform the terms of the derivative contract. We actively manage this risk by:
•establishing exposure limits which take into account non-derivative exposure we have with the counterparty as well as derivative exposure;•performing similar credit analysis prior to approval on each derivatives counterparty that we do when lending money on a long-term basis;•diversifying our risk across numerous approved counterparties;
•limiting exposure to A+ credit or better;•conducting stress-test analysis to determine the maximum exposure created during the life of a prospective transaction;•implementing credit support annex (collateral) agreements with selected counterparties to further limit counterparty exposures; and•daily monitoring of counterparty credit ratings.
All new derivative counterparties are approved by the Investment Committee. We believe the risk of incurring losses due to nonperformance by our counterparties is manageable.
The notional amounts used to express the extent of our involvement in swap transactions represent a standard measurement of the volume of our swap business. Notional amount is not a quantification of market risk or credit risk and it may not necessarily be recorded on the balance sheet. Notional amounts represent those amounts used to calculate contractual flows to be exchanged and are not paid or received, except for contracts such as currency swaps. Actual credit exposure represents the amount owed to us under derivative contracts as of the valuation date. The following tables present our position in, and credit exposure to, derivative financial instruments as of December 31, 2004, and December 31, 2003:
Derivative Financial Instruments — Notional Amounts
| | December 31, 2004 | December 31, 2003 | ||||||||||
|---|---|---|---|---|---|---|---|---|---|---|---|---|
| | Notional Amount | % of Total | Notional Amount | % of Total | ||||||||
| | ($ in millions) | |||||||||||
| Interest rate swaps | $ | 7,481.9 | 49 | % | $ | 5,024.9 | 45 | % | ||||
| Foreign currency swaps | 3,037.5 | 20 | 2,823.4 | 25 | ||||||||
| Credit default swaps | 988.3 | 7 | 863.3 | 8 | ||||||||
| Embedded derivative financial instruments | 894.4 | 6 | 770.5 | 7 | ||||||||
| Interest rate lock commitments | 634.3 | 4 | — | — | ||||||||
| Mortgage-backed forwards and options | 586.8 | 4 | 522.1 | 5 | ||||||||
| Bond forwards | 508.0 | 3 | 467.2 | 4 | ||||||||
| Currency forwards | 441.7 | 3 | 282.0 | 3 | ||||||||
| Swaptions | 429.0 | 3 | 315.0 | 3 | ||||||||
| Call options | 73.0 | 1 | 30.0 | — | ||||||||
| Bond options | 38.5 | — | 17.5 | — | ||||||||
| Futures | 11.8 | — | 27.8 | — | ||||||||
| Other | — | — | 1.5 | — | ||||||||
| Total | $ | 15,125.2 | 100 | % | $ | 11,145.2 | 100 | % | ||||
Derivative Financial Instruments — Credit Exposures
| | December 31, 2004 | December 31, 2003 | ||||||||||
|---|---|---|---|---|---|---|---|---|---|---|---|---|
| | Credit Exposure | % of Total | Credit Exposure | % of Total | ||||||||
| | ($ in millions) | |||||||||||
| Foreign currency swaps | $ | 805.2 | 85 | % | $ | 637.1 | 78 | % | ||||
| Bond forwards | 66.8 | 7 | 52.2 | 6 | ||||||||
| Interest rate swaps | 41.5 | 4 | 68.9 | 9 | ||||||||
| Credit default swaps | 19.3 | 2 | 45.9 | 6 | ||||||||
| Call options | 10.5 | 1 | 6.6 | 1 | ||||||||
| Currency forwards | 7.1 | 1 | 0.3 | — | ||||||||
| Bond options | 0.7 | — | — | — | ||||||||
| Total credit exposure | 951.1 | 100 | % | 811.0 | 100 | % | ||||||
| Less: Collateral received | (396.5 | ) | (334.5 | ) | ||||||||
| Total | $ | 554.6 | $ | 476.5 | ||||||||
The following table shows the interest rate sensitivity of our derivatives measured in terms of fair value. These exposures will change as a result of ongoing portfolio and risk management activities.
| | As of December 31, 2004 | |||||||||||||||
|---|---|---|---|---|---|---|---|---|---|---|---|---|---|---|---|---|
| | | | Fair Value (no accrued interest) | |||||||||||||
| | Notional Amount | Weighted Average Term (Years) | -100 Basis Point Change | No Change | +100 Basis Point Change | |||||||||||
| �� | ($ in millions) | |||||||||||||||
| Interest rate swaps | $ | 7,481.9 | 6.37 | (1) | $ | (299.8 | ) | $ | (58.9 | ) | $ | 156.1 | ||||
| Bond forwards | 508.0 | 1.78 | (4) | 95.6 | 66.8 | 39.6 | ||||||||||
| Swaptions | 429.0 | 9.23 | (3) | (38.3 | ) | (20.4 | ) | (10.8 | ) | |||||||
| Mortgage-backed forwards and options | 586.8 | .04 | (4) | (1.4 | ) | — | 1.3 | |||||||||
| Bond options | 38.5 | 3.25 | (4) | (2.9 | ) | (0.3 | ) | 1.1 | ||||||||
| Futures | 11.8 | .2 | (2) | 2.0 | — | (2.0 | ) | |||||||||
| Total | $ | 9,056.0 | $ | (244.8 | ) | $ | (12.8 | ) | $ | 185.3 | ||||||
(1)Based on maturity date of swap.(2)Based on maturity date.(3)Based on option date of swaption.(4)Based on settlement date.
We use U.S. Treasury futures to manage our over/under commitment position, and our position in these contracts changes daily.
Debt Issued and Outstanding
As of December 31, 2004, the aggregate fair value of long-term debt was $936.8 million. A 100 basis point, immediate, parallel decrease in interest rates would increase the fair value of debt by approximately $38.2 million.
| | As of December 31, 2004 | |||||||||
|---|---|---|---|---|---|---|---|---|---|---|
| | Fair Value (no accrued interest) | |||||||||
| | -100 Basis Point Change | No Change | +100 Basis Point Change | |||||||
| | (in millions) | |||||||||
| 8.2% notes payable, due 2009 | $ | 558.1 | $ | 536.5 | $ | 515.9 | ||||
| 8% surplus notes payable, due 2044 | 120.1 | 109.3 | 99.1 | |||||||
| Non-recourse mortgages and notes payable | 229.2 | 224.1 | 219.1 | |||||||
| Other mortgages and notes payable | 67.6 | 66.9 | 66.2 | |||||||
| Total long-term debt | $ | 975.0 | $ | 936.8 | $ | 900.3 | ||||
Equity Risk
Equity risk is the risk that we will incur economic losses due to adverse fluctuations in a particular common stock. As of December 31, 2004, the fair value of our equity securities was $762.6 million. A 10% decline in the value of the equity securities would result in an unrealized loss of $76.3 million. As of December 31, 2004, a 10% immediate and sustained decline in the equity markets would result in a decrease of asset-based fee revenues of $63.8 million over the next year. The selection of a 10% unfavorable change in the equity markets should not be construed as a prediction by us of future market events, but rather as an illustration of the potential impact of such an event.
Foreign Currency Risk
Foreign currency risk is the risk that we will incur economic losses due to adverse fluctuations in foreign currency exchange rates. This risk arises from foreign currency-denominated funding agreements issued to non-qualified institutional investors in the international market, foreign currency-denominated fixed maturity securities and demand deposits purchased, and our international operations.
We estimate that as of December 31, 2006, a 10% immediate unfavorable change in each of the foreign currency exchange rates to which we are exposed would result in no material change to the net fair value of our foreign currency denominated instruments identified above, including the currency swap agreements, because we effectively hedge foreign currency denominated instruments to minimize exchange rate impacts. The selection of a 10% immediate unfavorable change in all currency exchange rates should not be construed as a prediction by us of future market events, but rather as an illustration of the potential impact of such an event.
Use of Derivatives to Manage Foreign Currency Risk. The foreign currency risk on funding agreements and fixed maturity securities is eliminated by using currency swaps that swap the foreign currency interest and principal payments to our functional currency. The notional amount of our currency swap agreements associated with foreign-denominatedforeign- denominated liabilities as of December 31, 2004,2006, was $2,726.5$3,578.9 million. The notional amount of our currency swap agreements associated with foreign-denominated fixed maturity securities as of December 31, 2004,2006, was $286.9$1,728.2 million.
With regard to our international operations, we attempt to do as much of our business as possible in the functional currency of the country of operation. At times, however, we are unable to do so, and in these cases, we use foreign exchange derivatives to economically hedge the resulting risks. As of December 31, 2006, our operations in Chile had currency swaps with a notional amount of $24.0 million that are used to swap cash flows on U.S. dollar-denominated bonds to a local currency. Chile also utilized currency forwards with a notional amount of $53.5 million in order to mitigate currency exposure related to U.S. dollar-denominated bonds. Additionally, Principal International Corporate headquarters utilized currency forwards with a notional amount of $53.9 million in order to mitigate currency exposure related to planned capital flows for our joint venture company in Malaysia.
Additionally, we may take measures to hedge our net equity investments in our foreign subsidiaries from currency risks. Currently, there are no outstanding net equity investment hedges.
Equity Risk
Equity risk is the risk that we will incur economic losses due to adverse fluctuations in a particular common stock. As of December 31, 2004, we used currency forwards to hedge a portion of our net equity investment in our Mexican operations from currency fluctuations. The outstanding notional amount of2006, the currency forwards relating to these operations was $30.6 million (approximately $350.5 million Mexican pesos) and we recognized a $0.4 million pre-tax loss in other comprehensive income for the year ended December 31, 2004.
We estimate that as of December 31, 2004, a 10% immediate unfavorable change in each of the foreign currency exchange rates to which we are exposed would result in no material change to the net fair value of our foreign currency denominated instruments identified above, includingequity securities was $847.6 million. A 10% decline in the currency swap agreements.value of the equity securities would result in an unrealized loss of $84.8 million. The selection of a 10% immediate unfavorable change in all currency exchange ratesthe equity markets should not be construed as a prediction by us of future market events, but rather as an illustration of the potential impact of such an event.
We also have equity risk associated with (1) fixed deferred annuity products that credit interest to customers based on changes in an external equity index; (2) variable annuity contracts that have a GMWB rider that allows the customer to receive at least the principal deposit back through withdrawals of a specified annual amount, even if the account value is reduced to zero; (3) variable annuity contacts that have a guaranteed minimum death benefit ("GMDB") that allows the death benefit to be paid, even if the account value has fallen below the GMDB amount; (4) investment-type contracts in which the return is tied to an external equity index; and (5) investment-type contracts in which the return is subject to minimum contractual guarantees.
Use of Derivatives to Manage Equity Risk. We economically hedge the fixed deferred annuity product by purchasing options that match the product's profile. We economically hedge the GMWB exposure using futures, options and interest rate swaps. We economically hedge the investment contract exposure to an external equity index using equity call options.
Credit Risk
Credit risk relates to the uncertainty associated with the continued ability of a given obligor to make timely payments of principal and interest. Our ability to manage credit risk is essential to our business and our profitability. See Item 7. "Management's Discussion and Analysis of Financial Condition and Results of Operations, Investments" for additional information about credit risk.
Use of Derivatives to Diversify or Hedge Credit Risk. We sometimes purchase credit default swaps to hedge credit exposures in our investment portfolio. We sell credit default swaps to offer credit protection to investors. If there is an event of default by the referenced name, we are obligated to pay the counterparty the referenced amount of the contract and receive in return the referenced security.
We have increased our credit exposure through credit default swaps by investing in $127.5 million of various tranches of synthetic collateralized debt obligations. The outstanding notional amount as of December 31, 2006 was $565.0 million. We also invested in credit default swaps creating replicated assets with a notional amount of $855.9 million as of December 31, 2006.
In addition, on May 26, 2005, we invested $130.0 million in a secured limited recourse credit linked note issued by a grantor trust. The trust entered into a credit default swap providing credit protection on the first 45% of loss of seven mezzanine tranches totaling $288.9 million of seven synthetic reference portfolios. The risk of loss for the seven referenced mezzanine tranches begins at 4.85% and ends at 10.85% of loss on each of the seven synthetic reference portfolios. Therefore, defaults in an underlying reference portfolio will only affect the credit-linked note if cumulative losses exceed 4.85% of a synthetic reference portfolio. As of December 31, 2006, the credit default swap entered into by the trust had an outstanding notional amount of $130.0 million. The creditors of the grantor trusts have no recourse to the assets of our company.
Derivative Summary
Notional amounts are used to express the extent of our involvement in derivative transactions and represent a standard measurement of the volume of our derivative activity. Notional amount is not a quantification of market risk or credit risk and it may not necessarily be recorded on the balance sheet. Notional amounts represent those amounts used to calculate contractual flows to be exchanged and are not paid or received, except for contracts such as currency swaps. Actual credit exposure represents the amount owed to us under derivative contracts as of the valuation date. The following tables present our position in, and credit exposure to, derivative financial instruments as of December 31, 2006, and December 31, 2005.
Derivative Financial Instruments — Notional Amounts
| | December 31, 2006 | December 31, 2005 | ||||||||||
|---|---|---|---|---|---|---|---|---|---|---|---|---|
| | Notional Amount | % of Total | Notional Amount | % of Total | ||||||||
| | ($ in millions) | |||||||||||
| Interest rate swaps | $ | 12,365.5 | 55 | % | $ | 8,531.3 | 50 | % | ||||
| Foreign currency swaps | 5,331.1 | 24 | 3,854.5 | 23 | ||||||||
| Embedded derivative financial instruments | 1,679.4 | 8 | 1,199.5 | 7 | ||||||||
| Credit default swaps | 1,550.9 | 7 | 1,297.6 | 8 | ||||||||
| Swaptions | 643.4 | 3 | 684.5 | 4 | ||||||||
| Currency forwards | 342.7 | 2 | 566.6 | 4 | ||||||||
| Call options | 314.0 | 1 | 189.8 | 1 | ||||||||
| Futures | 55.0 | — | 58.9 | — | ||||||||
| Bond options | 21.0 | — | 38.5 | — | ||||||||
| Commodity swaps | 20.0 | — | — | — | ||||||||
| Interest rate lock commitments | 8.8 | — | 392.3 | 2 | ||||||||
| Total return swaps | — | — | 100.0 | 1 | ||||||||
| Mortgage-backed forwards and options | — | — | 39.3 | — | ||||||||
| Total | $ | 22,331.8 | 100 | % | $ | 16,952.8 | 100 | % | ||||
Derivative Financial Instruments — Credit Exposures
| | December 31, 2006 | December 31, 2005 | ||||||||||
|---|---|---|---|---|---|---|---|---|---|---|---|---|
| | Credit Exposure | % of Total | Credit Exposure | % of Total | ||||||||
| | ($ in millions) | |||||||||||
| Foreign currency swaps | $ | 564.6 | 75 | % | $ | 339.6 | 72 | % | ||||
| Interest rate swaps | 132.8 | 18 | 89.3 | 19 | ||||||||
| Call options | 30.6 | 4 | 18.0 | 4 | ||||||||
| Credit default swaps | 15.7 | 2 | 14.0 | 3 | ||||||||
| Currency forwards | 7.6 | 1 | 11.4 | 2 | ||||||||
| Commodity swaps | 0.7 | — | — | — | ||||||||
| Bond options | 0.4 | — | 0.6 | — | ||||||||
| Total credit exposure | 752.4 | 100 | % | 472.9 | 100 | % | ||||||
| Less: Collateral received | (197.5 | ) | (97.6 | ) | ||||||||
| Total | $ | 554.9 | $ | 375.3 | ||||||||
The following table shows the interest rate sensitivity of our derivatives measured in terms of fair value. These exposures will change as a result of ongoing portfolio and risk management activities.
| | December 31, 2006 | |||||||||||||||
|---|---|---|---|---|---|---|---|---|---|---|---|---|---|---|---|---|
| | | | Fair Value (no accrued interest) | |||||||||||||
| | Notional Amount | Weighted Average Term (Years) | -100 Basis Point Change | No Change | +100 Basis Point Change | |||||||||||
| | ($ in millions) | |||||||||||||||
| Interest rate swaps | $ | 12,365.5 | 5.70 | (1) | $ | (135.9 | ) | $ | 46.0 | $ | 204.1 | |||||
| Swaptions | 643.4 | 6.64 | (2) | (41.8 | ) | (19.0 | ) | (7.8 | ) | |||||||
| Futures | 38.2 | .21 | (3) | (2.5 | ) | (0.1 | ) | 2.4 | ||||||||
| Bond options | 21.0 | 1.24 | (4) | 0.1 | 0.4 | 0.8 | ||||||||||
| Total | $ | 13,068.1 | $ | (180.1 | ) | $ | 27.3 | $ | 199.5 | |||||||
- (1)
- Based on maturity date of swap.
- (2)
- Based on option date of swaption.
- (3)
- Based on maturity date.
- (4)
- Based on settlement date.
We use U.S. Treasury futures to manage our over/under commitment position, and our position in these contracts changes daily.
Counterparty Risk
In conjunction with our use of derivatives, we are exposed to counterparty risk, or the risk that the counterparty fails to perform the terms of the derivative contract. We actively manage this risk by:
- •
- establishing exposure limits which take into account non-derivative exposure we have with the counterparty as well as derivative exposure;
- •
- performing similar credit analysis prior to approval on each derivatives counterparty that we do when lending money on a long-term basis;
- •
- diversifying our risk across numerous approved counterparties;
- •
- limiting exposure to A+ credit or better;
- •
- conducting stress-test analysis to determine the maximum exposure created during the life of a prospective transaction;
- •
- implementing credit support annex (collateral) agreements with selected counterparties to further limit counterparty exposures; and
- •
- daily monitoring of counterparty credit ratings.
All new derivative counterparties are approved by the Investment Committee. We believe the risk of incurring losses due to nonperformance by our counterparties is manageable.
Effects of Inflation
We do not believe that inflation, in the United States or in the other countries in which we operate, has had a material effect on our consolidated operations over the past five years. In the future, however, we may be affected by inflation to the extent it causes interest rates to rise.
Item 8. Financial Statements and Supplementary Data
| Report of Independent Registered Public Accounting Firm on Internal Control | |||
| Report of Independent Registered Public Accounting Firm | |||
| Audited Consolidated Financial Statements | |||
| Consolidated Statements of Financial Position | |||
| Consolidated Statements of Operations | |||
| Consolidated Statements of Stockholders' Equity | |||
| Consolidated Statements of Cash Flows | |||
| Notes to Consolidated Financial Statements | |||
Report of Independent Registered Public Accounting Firm
on Internal Control Over Financial Reporting
The Board of Directors and Stockholders
Principal Financial Group, Inc.
We have audited management's assessment, included in the accompanying Management's Report on Internal Control Over Financial Reporting, that Principal Financial Group, Inc. ("the Company") maintained effective internal control over financial reporting as of December 31, 2004,2006, based on criteria established in Internal Control — Integrated Framework issued by the Committee of Sponsoring Organizations of the Treadway Commission (the("the COSO criteria)criteria"). Management of Principal Financial Group, Inc. is responsible for maintaining effective internal control over financial reporting and for its assessment of the effectiveness of internal control over financial reporting. Our responsibility is to express an opinion on management's assessment and an opinion on the effectiveness of the Company's internal control over financial reporting based on our audit.
We conducted our audit in accordance with the standards of the Public Company Accounting Oversight Board (United States). Those standards require that we plan and perform the audit to obtain reasonable assurance about whether effective internal control over financial reporting was maintained in all material respects. Our audit included obtaining an understanding of internal control over financial reporting, evaluating management's assessment, testing and evaluating the design and operating effectiveness of internal control, and performing such other procedures as we considered necessary in the circumstances. We believe that our audit provides a reasonable basis for our opinion.
A company's internal control over financial reporting is a process designed to provide reasonable assurance regarding the reliability of financial reporting and the preparation of financial statements for external purposes in accordance with U.S. generally accepted accounting principles. A company's internal control over financial reporting includes those policies and procedures that (1) pertain to the maintenance of records that, in reasonable detail, accurately and fairly reflect the transactions and dispositions of the assets of the company; (2) provide reasonable assurance that transactions are recorded as necessary to permit preparation of financial statements in accordance with U.S. generally accepted accounting principles, and that receipts and expenditures of the company are being made only in accordance with authorizations of management and directors of the company; and (3) provide reasonable assurance regarding prevention or timely detection of unauthorized acquisition, use, or disposition of the company's assets that could have a material effect on the financial statements.
Because of its inherent limitations, internal control over financial reporting may not prevent or detect misstatements. Also, projections of any evaluation of effectiveness to future periods are subject to the risk that controls may become inadequate because of changes in conditions, or that the degree of compliance with the policies or procedures may deteriorate.
In our opinion, management's assessment that Principal Financial Group, Inc. maintained effective internal control over financial reporting as of December 31, 2004,2006, is fairly stated, in all material respects, based on the COSO criteria. Also, in our opinion, Principal Financial Group, Inc. maintained, in all material respects, effective internal control over financial reporting as of December 31, 2004,2006, based on the COSO criteria.
We also have audited, in accordance with the standards of the Public Company Accounting Oversight Board (United States), the consolidated statements of financial position of Principal Financial Group, Inc. as of December 31, 20042006 and 2003,2005, and the related consolidated statements of operations, stockholders' equity and cash flows for each of the three years in the period ended December 31, 2004, of Principal Financial Group, Inc.2006, and our report dated February 16, 200520, 2007 expressed an unqualified opinion thereon.
| /s/ Ernst & Young LLP | ||
Des Moines, Iowa February |
Report of Independent Registered Public Accounting Firm
The Board of Directors and Stockholders
Principal Financial Group, Inc.
We have audited the accompanying consolidated statements of financial position of Principal Financial Group, Inc. ("the Company"), as of December 31, 20042006 and 2003,2005, and the related consolidated statements of operations, stockholders' equity and cash flows for each of the three years in the period ended December 31, 2004.2006. These financial statements are the responsibility of the Company's management. Our responsibility is to express an opinion on these financial statements based on our audits.
We conducted our audits in accordance with the standards of the Public Company Accounting Oversight Board (United States). Those standards require that we plan and perform the audit to obtain reasonable assurance about whether the financial statements are free of material misstatement. An audit includes examining, on a test basis, evidence supporting the amounts and disclosures in the financial statements. An audit also includes assessing the accounting principles used and significant estimates made by management, as well as evaluating the overall financial statement presentation. We believe that our audits provide a reasonable basis for our opinion.
In our opinion, the financial statements referred to above present fairly, in all material respects, the consolidated financial position of Principal Financial Group, Inc. at December 31, 20042006 and 2003,2005, and the consolidated results of its operations and its cash flows for each of the three years in the period ended December 31, 2004,2006, in conformity with U.S. generally accepted accounting principles.
As discussed in Note 1 to the consolidated financial statements, in response to new accounting standards, the Company changed its methods of accounting for discontinued operations, goodwill and other intangible assets effective January 1, 2002, variable interest entities effective July 1, 2003, and certain fixed and variable contract features effective January 1, 2004.2004, certain non-monetary exchanges of similar productive assets (primarily real estate) effective July 1, 2005, and its pension and other post-retirement benefits effective December 31, 2006.
We also have audited, in accordance with the standards of the Public Company Accounting Oversight Board (United States), the effectiveness of the Company's internal control over financial reporting as of December 31, 2004,2006, based on criteria established in Internal Control — Integrated Framework issued by the Committee of Sponsoring Organizations of the Treadway Commission and our report dated February 16, 200520, 2007 expressed an unqualified opinion.opinion thereon.
| /s/ Ernst & Young LLP | ||
Des Moines, Iowa February |
Principal Financial Group, Inc.
Consolidated Statements of Financial Position
| | | December 31, | | December 31, | ||||||||||||
|---|---|---|---|---|---|---|---|---|---|---|---|---|---|---|---|---|
| | | 2004 | 2003 | | 2006 | 2005 | ||||||||||
| | | (in millions) | | (in millions) | ||||||||||||
| Assets | Assets | Assets | ||||||||||||||
| Fixed maturities, available-for-sale | Fixed maturities, available-for-sale | $ | 40,916.3 | $ | 37,418.4 | Fixed maturities, available-for-sale | $ | 44,403.5 | $ | 42,117.2 | ||||||
| Fixed maturities, trading | Fixed maturities, trading | 93.0 | 102.9 | Fixed maturities, trading | 323.4 | 113.2 | ||||||||||
| Equity securities, available-for-sale | Equity securities, available-for-sale | 762.6 | 699.2 | Equity securities, available-for-sale | 666.6 | 724.4 | ||||||||||
| Equity securities, trading | Equity securities, trading | 181.0 | 90.3 | |||||||||||||
| Mortgage loans | Mortgage loans | 11,714.5 | 11,251.6 | Mortgage loans | 11,663.9 | 11,484.3 | ||||||||||
| Real estate | Real estate | 1,032.0 | 1,526.1 | Real estate | 867.0 | 900.1 | ||||||||||
| Policy loans | Policy loans | 814.5 | 804.1 | Policy loans | 850.7 | 827.7 | ||||||||||
| Other investments | Other investments | 1,585.7 | 1,412.1 | Other investments | 1,410.7 | 1,113.5 | ||||||||||
| Total investments | 56,918.6 | 53,214.4 | Total investments | 60,366.8 | 57,370.7 | |||||||||||
| Cash and cash equivalents | Cash and cash equivalents | 452.5 | 1,192.5 | Cash and cash equivalents | 1,590.8 | 1,639.3 | ||||||||||
| Accrued investment income | Accrued investment income | 678.4 | 656.6 | Accrued investment income | 723.5 | 682.3 | ||||||||||
| Premiums due and other receivables | Premiums due and other receivables | 628.5 | 714.9 | Premiums due and other receivables | 1,252.3 | 592.7 | ||||||||||
| Deferred policy acquisition costs | Deferred policy acquisition costs | 1,837.6 | 1,568.9 | Deferred policy acquisition costs | 2,418.9 | 2,174.1 | ||||||||||
| Property and equipment | Property and equipment | 429.4 | 445.2 | Property and equipment | 422.5 | 419.8 | ||||||||||
| Goodwill | Goodwill | 232.9 | 175.8 | Goodwill | 361.9 | 282.3 | ||||||||||
| Other intangibles | Other intangibles | 196.5 | 121.0 | Other intangibles | 981.0 | 202.6 | ||||||||||
| Separate account assets | Separate account assets | 51,507.9 | 43,407.8 | Separate account assets | 73,779.6 | 62,070.0 | ||||||||||
| Assets of discontinued operations | Assets of discontinued operations | — | 5,425.1 | Assets of discontinued operations | — | 103.2 | ||||||||||
| Other assets | Other assets | 915.8 | 832.2 | Other assets | 1,760.8 | 1,498.4 | ||||||||||
| Total assets | $ | 113,798.1 | $ | 107,754.4 | Total assets | $ | 143,658.1 | $ | 127,035.4 | |||||||
Liabilities | Liabilities | Liabilities | ||||||||||||||
| Contractholder funds | Contractholder funds | $ | 32,183.3 | $ | 28,896.4 | Contractholder funds | $ | 36,799.0 | $ | 33,612.1 | ||||||
| Future policy benefits and claims | Future policy benefits and claims | 16,042.6 | 15,450.8 | Future policy benefits and claims | 17,332.6 | 16,825.5 | ||||||||||
| Other policyholder funds | Other policyholder funds | 734.9 | 709.1 | Other policyholder funds | 619.4 | 657.1 | ||||||||||
| Short-term debt | Short-term debt | 281.7 | 702.8 | Short-term debt | 84.1 | 476.4 | ||||||||||
| Long-term debt | Long-term debt | 843.5 | 1,374.3 | Long-term debt | 1,553.8 | 898.8 | ||||||||||
| Income taxes currently payable | Income taxes currently payable | 277.9 | 113.9 | Income taxes currently payable | 4.2 | — | ||||||||||
| Deferred income taxes | Deferred income taxes | 1,131.7 | 1,198.9 | Deferred income taxes | 917.2 | 974.8 | ||||||||||
| Separate account liabilities | Separate account liabilities | 51,507.9 | 43,407.8 | Separate account liabilities | 73,779.6 | 62,070.0 | ||||||||||
| Liabilities of discontinued operations | Liabilities of discontinued operations | — | 4,575.3 | Liabilities of discontinued operations | — | 4.5 | ||||||||||
| Other liabilities | Other liabilities | 3,250.3 | 3,925.5 | Other liabilities | 4,707.4 | 3,709.0 | ||||||||||
| Total liabilities | 106,253.8 | 100,354.8 | Total liabilities | 135,797.3 | 119,228.2 | |||||||||||
Stockholders' equity | Stockholders' equity | Stockholders' equity | ||||||||||||||
| Common stock, par value $.01 per share — 2,500.0 million shares authorized, 379.1 million and 377.4 million shares issued, and 300.6 million and 320.7 million shares outstanding in 2004 and 2003, respectively | 3.8 | 3.8 | ||||||||||||||
| Series A preferred stock, par value $.01 with liquidation preference of $100 per share — 3.0 million shares authorized, issued and outstanding at December 31, 2006 and 2005 | Series A preferred stock, par value $.01 with liquidation preference of $100 per share — 3.0 million shares authorized, issued and outstanding at December 31, 2006 and 2005 | — | — | |||||||||||||
| Series B preferred stock, par value $.01 with liquidation preference of $25 per share — 10.0 million shares authorized, issued and outstanding at December 31, 2006 and 2005 | Series B preferred stock, par value $.01 with liquidation preference of $25 per share — 10.0 million shares authorized, issued and outstanding at December 31, 2006 and 2005 | 0.1 | 0.1 | |||||||||||||
| Common stock, par value $.01 per share — 2,500.0 million shares authorized, 383.6 million and 381.3 million shares issued, and 268.4 million and 280.6 million shares outstanding at December 31, 2006 and 2005, respectively | Common stock, par value $.01 per share — 2,500.0 million shares authorized, 383.6 million and 381.3 million shares issued, and 268.4 million and 280.6 million shares outstanding at December 31, 2006 and 2005, respectively | 3.8 | 3.8 | |||||||||||||
| Additional paid-in capital | Additional paid-in capital | 7,269.4 | 7,153.2 | Additional paid-in capital | 8,141.8 | 8,000.0 | ||||||||||
| Retained earnings | Retained earnings | 1,289.5 | 630.4 | Retained earnings | 2,824.1 | 2,008.6 | ||||||||||
| Accumulated other comprehensive income | Accumulated other comprehensive income | 1,313.3 | 1,171.3 | Accumulated other comprehensive income | 846.9 | 994.8 | ||||||||||
| Treasury stock, at cost (78.5 million and 56.7 million shares in 2004 and 2003, respectively) | (2,331.7 | ) | (1,559.1 | ) | ||||||||||||
| Treasury stock, at cost (115.2 million and 100.7 million shares at December 31, 2006 and 2005, respectively) | Treasury stock, at cost (115.2 million and 100.7 million shares at December 31, 2006 and 2005, respectively) | (3,955.9 | ) | (3,200.1 | ) | |||||||||||
| Total stockholders' equity | 7,544.3 | 7,399.6 | Total stockholders' equity | 7,860.8 | 7,807.2 | |||||||||||
| Total liabilities and stockholders' equity | $ | 113,798.1 | $ | 107,754.4 | Total liabilities and stockholders' equity | $ | 143,658.1 | $ | 127,035.4 | |||||||
See accompanying notes.
Principal Financial Group, Inc.
Consolidated Statements of Operations
| | | For the year ended December 31, | | For the year ended December 31, | ||||||||||||||||||
|---|---|---|---|---|---|---|---|---|---|---|---|---|---|---|---|---|---|---|---|---|---|---|
| | | 2004 | 2003 | 2002 | | 2006 | 2005 | 2004 | ||||||||||||||
| | | (in millions, except per share data) | | (in millions, except per share data) | ||||||||||||||||||
| Revenues | Revenues | Revenues | ||||||||||||||||||||
| Premiums and other considerations | Premiums and other considerations | $ | 3,710.0 | $ | 3,630.7 | $ | 3,877.8 | Premiums and other considerations | $ | 4,305.3 | $ | 3,975.0 | $ | 3,710.0 | ||||||||
| Fees and other revenues | Fees and other revenues | 1,472.0 | 1,185.8 | 950.4 | Fees and other revenues | 1,902.5 | 1,717.8 | 1,491.7 | ||||||||||||||
| Net investment income | Net investment income | 3,226.5 | 3,233.4 | 3,173.1 | Net investment income | 3,618.0 | 3,360.1 | 3,224.0 | ||||||||||||||
| Net realized/unrealized capital losses | (104.8 | ) | (63.2 | ) | (374.1 | ) | ||||||||||||||||
| Net realized/unrealized capital gains (losses) | Net realized/unrealized capital gains (losses) | 44.7 | (11.2 | ) | (104.8 | ) | ||||||||||||||||
| Total revenues | 8,303.7 | 7,986.7 | 7,627.2 | Total revenues | 9,870.5 | 9,041.7 | 8,320.9 | |||||||||||||||
| Expenses | Expenses | Expenses | ||||||||||||||||||||
| Benefits, claims, and settlement expenses | Benefits, claims, and settlement expenses | 4,959.5 | 4,855.8 | 5,197.5 | Benefits, claims, and settlement expenses | 5,692.4 | 5,282.9 | 4,959.5 | ||||||||||||||
| Dividends to policyholders | Dividends to policyholders | 296.7 | 307.9 | 316.6 | Dividends to policyholders | 290.7 | 293.0 | 296.7 | ||||||||||||||
| Operating expenses | Operating expenses | 2,165.9 | 1,998.7 | 1,741.6 | Operating expenses | 2,558.7 | 2,342.1 | 2,185.6 | ||||||||||||||
| Total expenses | 7,422.1 | 7,162.4 | 7,255.7 | Total expenses | 8,541.8 | 7,918.0 | 7,441.8 | |||||||||||||||
| Income from continuing operations before income taxes | Income from continuing operations before income taxes | 881.6 | 824.3 | 371.5 | Income from continuing operations before income taxes | 1,328.7 | 1,123.7 | 879.1 | ||||||||||||||
| Income taxes (benefits) | 179.1 | 177.0 | (74.9 | ) | ||||||||||||||||||
| Income taxes | Income taxes | 295.0 | 232.2 | 178.2 | ||||||||||||||||||
| Income from continuing operations, net of related income taxes (benefits) | 702.5 | 647.3 | 446.4 | |||||||||||||||||||
| Income (loss) from discontinued operations, net of related income taxes | 128.8 | 102.4 | (23.2 | ) | ||||||||||||||||||
| Income from continuing operations, net of related income taxes | Income from continuing operations, net of related income taxes | 1,033.7 | 891.5 | 700.9 | ||||||||||||||||||
| Income from discontinued operations, net of related income taxes | Income from discontinued operations, net of related income taxes | 30.6 | 27.5 | 130.4 | ||||||||||||||||||
| Income before cumulative effect of accounting changes | 831.3 | 749.7 | 423.2 | |||||||||||||||||||
| Cumulative effect of accounting changes, net of related income taxes | (5.7 | ) | (3.4 | ) | (280.9 | ) | ||||||||||||||||
| Income before cumulative effect of accounting change | Income before cumulative effect of accounting change | 1,064.3 | 919.0 | 831.3 | ||||||||||||||||||
| Cumulative effect of accounting change, net of related income taxes | Cumulative effect of accounting change, net of related income taxes | — | — | (5.7 | ) | |||||||||||||||||
| Net income | Net income | $ | 825.6 | $ | 746.3 | $ | 142.3 | Net income | 1,064.3 | 919.0 | 825.6 | |||||||||||
| Preferred stock dividends | Preferred stock dividends | 33.0 | 17.7 | — | ||||||||||||||||||
| Net income available to common stockholders | Net income available to common stockholders | $ | 1,031.3 | $ | 901.3 | $ | 825.6 | |||||||||||||||
| Earnings per common share | Earnings per common share | Earnings per common share | ||||||||||||||||||||
| Basic earnings per common share: | Basic earnings per common share: | Basic earnings per common share: | ||||||||||||||||||||
| Income from continuing operations, net of related income taxes (benefits) | $ | 2.24 | $ | 1.99 | $ | 1.27 | Income from continuing operations, net of related income taxes | $ | 3.67 | $ | 3.03 | $ | 2.24 | |||||||||
| Income (loss) from discontinued operations, net of related income taxes | 0.42 | 0.31 | (0.06 | ) | Income from discontinued operations, net of related income taxes | 0.11 | 0.10 | 0.42 | ||||||||||||||
| Income before cumulative effect of accounting changes | 2.66 | 2.30 | 1.21 | Income before cumulative effect of accounting change | 3.78 | 3.13 | 2.66 | |||||||||||||||
| Cumulative effect of accounting changes, net of related income taxes | (0.02 | ) | (0.01 | ) | (0.80 | ) | Cumulative effect of accounting change, net of related income taxes | — | — | (0.02 | ) | |||||||||||
| Net income | $ | 2.64 | $ | 2.29 | $ | 0.41 | Net income | $ | 3.78 | $ | 3.13 | $ | 2.64 | |||||||||
| Diluted earnings per common share: | Diluted earnings per common share: | Diluted earnings per common share: | ||||||||||||||||||||
| Income from continuing operations, net of related income taxes (benefits) | $ | 2.23 | $ | 1.98 | $ | 1.27 | Income from continuing operations, net of related income taxes | $ | 3.63 | $ | 3.01 | $ | 2.23 | |||||||||
| Income (loss) from discontinued operations, net of related income taxes | 0.41 | 0.31 | (0.06 | ) | Income from discontinued operations, net of related income taxes | 0.11 | 0.10 | 0.41 | ||||||||||||||
| Income before cumulative effect of accounting changes | 2.64 | 2.29 | 1.21 | Income before cumulative effect of accounting change | 3.74 | 3.11 | 2.64 | |||||||||||||||
| Cumulative effect of accounting changes, net of related income taxes | (0.02 | ) | (0.01 | ) | (0.80 | ) | Cumulative effect of accounting change, net of related income taxes | — | — | (0.02 | ) | |||||||||||
| Net income | $ | 2.62 | $ | 2.28 | $ | 0.41 | Net income | $ | 3.74 | $ | 3.11 | $ | 2.62 | |||||||||
See accompanying notes.
Principal Financial Group, Inc.
Consolidated Statements of Stockholders' Equity
| | Common stock | Additional paid-in capital | Retained earnings (deficit) | Accumulated other comprehensive income (loss) | Treasury stock | Total stockholders' equity | Outstanding shares | |||||||||||||||
|---|---|---|---|---|---|---|---|---|---|---|---|---|---|---|---|---|---|---|---|---|---|---|
| | (in millions) | (in thousands) | ||||||||||||||||||||
| Balances at January 1, 2002 | $ | 3.8 | $ | 7,072.5 | $ | (29.1 | ) | $ | 147.5 | $ | (374.4 | ) | $ | 6,820.3 | 360,142.2 | |||||||
| Shares issued, net of put options | — | 22.0 | — | — | — | 22.0 | 904.9 | |||||||||||||||
| Stock-based compensation | — | 10.5 | — | — | — | 10.5 | ||||||||||||||||
| Treasury stock acquired and sold, net | — | 1.3 | — | — | (743.7 | ) | (742.4 | ) | (26,627.8 | ) | ||||||||||||
| Dividends to stockholders | — | — | (83.8 | ) | — | — | (83.8 | ) | ||||||||||||||
| Comprehensive income: | ||||||||||||||||||||||
| Net income | — | — | 142.3 | — | — | 142.3 | ||||||||||||||||
| Net unrealized gains | — | — | — | 618.8 | — | 618.8 | ||||||||||||||||
| Provision for deferred income taxes | — | — | — | (217.1 | ) | — | (217.1 | ) | ||||||||||||||
| Foreign currency translation adjustment | — | — | — | 86.6 | — | 86.6 | ||||||||||||||||
| Comprehensive income | 630.6 | |||||||||||||||||||||
| Balances at December 31, 2002 | 3.8 | 7,106.3 | 29.4 | 635.8 | (1,118.1 | ) | 6,657.2 | 334,419.3 | ||||||||||||||
| Shares issued, net of call options | — | 18.3 | — | — | — | 18.3 | 710.2 | |||||||||||||||
| Stock-based compensation, and additional related tax benefits | — | 25.4 | — | — | — | 25.4 | ||||||||||||||||
| Treasury stock acquired and sold, net | — | 3.2 | — | — | (441.0 | ) | (437.8 | ) | (14,462.0 | ) | ||||||||||||
| Dividends to stockholders | — | — | (145.3 | ) | — | — | (145.3 | ) | ||||||||||||||
| Comprehensive income: | ||||||||||||||||||||||
| Net income | — | — | 746.3 | — | — | 746.3 | ||||||||||||||||
| Net unrealized gains | — | — | — | 703.0 | — | 703.0 | ||||||||||||||||
| Provision for deferred income taxes | — | — | — | (242.7 | ) | — | (242.7 | ) | ||||||||||||||
| Foreign currency translation adjustment | — | — | — | 68.6 | — | 68.6 | ||||||||||||||||
| Minimum pension liability, net of related income taxes | — | — | — | (2.5 | ) | — | (2.5 | ) | ||||||||||||||
| Cumulative effect of accounting change, net of related income taxes | — | — | — | 9.1 | — | 9.1 | ||||||||||||||||
| Comprehensive income | 1,281.8 | |||||||||||||||||||||
| Balances at December 31, 2003 | 3.8 | 7,153.2 | 630.4 | 1,171.3 | (1,559.1 | ) | 7,399.6 | 320,667.5 | ||||||||||||||
| Shares issued | — | 41.2 | — | — | — | 41.2 | 1,630.6 | |||||||||||||||
| Capital transactions of equity method investee, net of related income taxes | — | 20.4 | — | — | — | 20.4 | ||||||||||||||||
| Stock-based compensation, and additional related tax benefits | — | 46.2 | — | — | — | 46.2 | ||||||||||||||||
| Tax benefits related to initial public offering costs | — | 8.4 | — | — | — | 8.4 | ||||||||||||||||
| Treasury stock acquired | — | — | — | — | (772.6 | ) | (772.6 | ) | (21,726.4 | ) | ||||||||||||
| Dividends to stockholders | — | — | (166.5 | ) | — | — | (166.5 | ) | ||||||||||||||
| Comprehensive income: | ||||||||||||||||||||||
| Net income | — | — | 825.6 | — | — | 825.6 | ||||||||||||||||
| Net unrealized gains | — | — | — | 156.8 | — | 156.8 | ||||||||||||||||
| Provision for deferred income taxes | — | — | — | (44.3 | ) | — | (44.3 | ) | ||||||||||||||
| Foreign currency translation adjustment, net of related income taxes | — | — | — | 32.3 | — | 32.3 | ||||||||||||||||
| Minimum pension liability, net of related income taxes | — | — | — | (2.8 | ) | — | (2.8 | ) | ||||||||||||||
| Comprehensive income | 967.6 | |||||||||||||||||||||
| Balances at December 31, 2004 | $ | 3.8 | $ | 7,269.4 | $ | 1,289.5 | $ | 1,313.3 | $ | (2,331.7 | ) | $ | 7,544.3 | 300,571.7 | ||||||||
| | Series A preferred stock | Series B preferred stock | Common stock | Additional paid-in capital | Retained earnings | Accumulated other comprehensive income | Treasury stock | Total stockholders' equity | ||||||||||||||||||
|---|---|---|---|---|---|---|---|---|---|---|---|---|---|---|---|---|---|---|---|---|---|---|---|---|---|---|
| | (in millions) | |||||||||||||||||||||||||
| Balances at January 1, 2004 | $ | — | $ | — | $ | 3.8 | $ | 7,153.2 | $ | 630.4 | $ | 1,171.3 | $ | (1,559.1 | ) | $ | 7,399.6 | |||||||||
| Common stock issued | — | — | — | 41.2 | — | — | — | 41.2 | ||||||||||||||||||
| Capital transactions of equity method investee, net of related income taxes | — | — | — | 20.4 | — | — | — | 20.4 | ||||||||||||||||||
| Stock-based compensation and additional related tax benefits | — | — | — | 46.2 | — | — | — | 46.2 | ||||||||||||||||||
| Tax benefits related to initial public offering costs | — | — | — | 8.4 | — | — | — | 8.4 | ||||||||||||||||||
| Treasury stock acquired | — | — | — | — | — | — | (772.6 | ) | (772.6 | ) | ||||||||||||||||
| Dividends to common stockholders | — | — | — | — | (166.5 | ) | — | — | (166.5 | ) | ||||||||||||||||
| Comprehensive income: | ||||||||||||||||||||||||||
| Net income | — | — | — | — | 825.6 | — | — | 825.6 | ||||||||||||||||||
| Net unrealized gains, net | — | — | — | — | — | 112.5 | — | 112.5 | ||||||||||||||||||
| Foreign currency translation adjustment, net of related income taxes | — | — | — | — | — | 32.3 | — | 32.3 | ||||||||||||||||||
| Minimum pension liability, net of related income taxes | — | — | — | — | — | (2.8 | ) | — | (2.8 | ) | ||||||||||||||||
| Comprehensive income | 967.6 | |||||||||||||||||||||||||
| Balances at December 31, 2004 | — | — | 3.8 | 7,269.4 | 1,289.5 | 1,313.3 | (2,331.7 | ) | 7,544.3 | |||||||||||||||||
| Series A preferred stock issued | — | — | — | 296.0 | — | — | — | 296.0 | ||||||||||||||||||
| Series B preferred stock issued | — | 0.1 | — | 245.9 | — | — | — | 246.0 | ||||||||||||||||||
| Common stock issued | — | — | — | 59.9 | — | — | — | 59.9 | ||||||||||||||||||
| Capital transactions of equity method investee, net of related income taxes | — | — | — | (0.1 | ) | — | — | — | (0.1 | ) | ||||||||||||||||
| Stock-based compensation and additional related tax benefits | — | — | — | 49.1 | — | — | — | 49.1 | ||||||||||||||||||
| Tax benefits related to demutualization | — | — | — | 163.8 | — | — | — | 163.8 | ||||||||||||||||||
| Treasury stock acquired | — | — | — | — | — | — | (868.4 | ) | (868.4 | ) | ||||||||||||||||
| Accelerated stock repurchase settlement | — | — | — | (84.0 | ) | — | — | — | (84.0 | ) | ||||||||||||||||
| Dividends to common stockholders | — | — | — | — | (182.2 | ) | — | — | (182.2 | ) | ||||||||||||||||
| Dividends to preferred stockholders | — | — | — | — | (17.7 | ) | — | — | (17.7 | ) | ||||||||||||||||
| Comprehensive income: | ||||||||||||||||||||||||||
| Net income | — | — | — | — | 919.0 | — | — | 919.0 | ||||||||||||||||||
| Net unrealized losses, net | — | — | — | — | — | (376.0 | ) | — | (376.0 | ) | ||||||||||||||||
| Foreign currency translation adjustment, net of related income taxes | — | — | — | — | — | 63.7 | — | 63.7 | ||||||||||||||||||
| Minimum pension liability, net of related income taxes | — | — | — | — | — | (6.2 | ) | — | (6.2 | ) | ||||||||||||||||
| Comprehensive income | 600.5 | |||||||||||||||||||||||||
| Balances at December 31, 2005 | $ | — | $ | 0.1 | $ | 3.8 | $ | 8,000.0 | $ | 2,008.6 | $ | 994.8 | $ | (3,200.1 | ) | $ | 7,807.2 | |||||||||
Principal Financial Group, Inc.
Consolidated Statements of Stockholders' Equity — (continued)
| | Series A preferred stock | Series B preferred stock | Common stock | Additional paid-in capital | Retained earnings | Accumulated other comprehensive income | Treasury stock | Total stockholders' equity | ||||||||||||||||||
|---|---|---|---|---|---|---|---|---|---|---|---|---|---|---|---|---|---|---|---|---|---|---|---|---|---|---|
| | (in millions) | |||||||||||||||||||||||||
| Balances at January 1, 2006 | $ | — | $ | 0.1 | $ | 3.8 | $ | 8,000.0 | $ | 2,008.6 | $ | 994.8 | $ | (3,200.1 | ) | $ | 7,807.2 | |||||||||
| Common stock issued | — | — | — | 66.2 | — | — | — | 66.2 | ||||||||||||||||||
| Capital transactions of equity method investee, net of related income taxes | — | — | — | 1.7 | — | — | — | 1.7 | ||||||||||||||||||
| Stock-based compensation and additional related tax benefits | — | — | — | 73.9 | (1.1 | ) | — | — | 72.8 | |||||||||||||||||
| Treasury stock acquired | — | — | — | — | — | — | (755.8 | ) | (755.8 | ) | ||||||||||||||||
| Dividends to common stockholders | — | — | — | — | (214.7 | ) | — | — | (214.7 | ) | ||||||||||||||||
| Dividends to preferred stockholders | — | — | — | — | (33.0 | ) | — | — | (33.0 | ) | ||||||||||||||||
| Transition adjustment related to post-retirement benefit obligations, net of related income taxes | — | — | — | — | — | 23.3 | — | 23.3 | ||||||||||||||||||
| Comprehensive income: | ||||||||||||||||||||||||||
| Net income | — | — | — | — | 1,064.3 | — | — | 1,064.3 | ||||||||||||||||||
| Net unrealized losses, net | — | — | — | — | — | (168.9 | ) | — | (168.9 | ) | ||||||||||||||||
| Foreign currency translation adjustment, net of related income taxes | — | — | — | — | — | (5.0 | ) | — | (5.0 | ) | ||||||||||||||||
| Minimum pension liability, net of related income taxes | — | — | — | — | — | 2.7 | — | 2.7 | ||||||||||||||||||
| Comprehensive income | 893.1 | |||||||||||||||||||||||||
| Balances at December 31, 2006 | $ | — | $ | 0.1 | $ | 3.8 | $ | 8,141.8 | $ | 2,824.1 | $ | 846.9 | $ | (3,955.9 | ) | $ | 7,860.8 | |||||||||
See accompanying notes.
Principal Financial Group, Inc.
Consolidated Statements of Cash Flows
| | For the year ended December 31, | ||||||||||
|---|---|---|---|---|---|---|---|---|---|---|---|
| | 2004 | 2003 | 2002 | ||||||||
| | (in millions) | ||||||||||
| Operating activities | |||||||||||
| Net income | $ | 825.6 | $ | 746.3 | $ | 142.3 | |||||
| Adjustments to reconcile net income to net cash provided by operating activities: | |||||||||||
| Loss (income) from discontinued operations, net of related income taxes | (128.8 | ) | (102.4 | ) | 23.2 | ||||||
| Cumulative effect of accounting changes, net of related income taxes | 5.7 | 3.4 | 280.9 | ||||||||
| Amortization of deferred policy acquisition costs | 210.8 | 140.0 | 144.4 | ||||||||
| Additions to deferred policy acquisition costs | (477.7 | ) | (349.7 | ) | (323.0 | ) | |||||
| Accrued investment income | (21.8 | ) | (0.9 | ) | (56.6 | ) | |||||
| Premiums due and other receivables | (24.9 | ) | (65.8 | ) | 21.8 | ||||||
| Contractholder and policyholder liabilities and dividends | 1,981.2 | 1,906.2 | 2,080.4 | ||||||||
| Current and deferred income taxes | 37.5 | 283.6 | 341.2 | ||||||||
| Net realized/unrealized capital losses | 104.8 | 63.2 | 374.1 | ||||||||
| Depreciation and amortization expense | 110.8 | 115.8 | 104.9 | ||||||||
| Mortgage loans held for sale, acquired or originated | (1,142.4 | ) | (898.2 | ) | (941.4 | ) | |||||
| Mortgage loans held for sale, sold or repaid, net of gain | 940.3 | 1,046.0 | 1,001.6 | ||||||||
| Real estate acquired through operating activities | (45.8 | ) | (32.5 | ) | (25.5 | ) | |||||
| Real estate sold through operating activities | 84.7 | 46.0 | 48.2 | ||||||||
| Stock-based compensation | 43.4 | 22.6 | 10.5 | ||||||||
| Other | (247.5 | ) | 140.2 | 671.6 | |||||||
| Net adjustments | 1,430.3 | 2,317.5 | 3,756.3 | ||||||||
| Net cash provided by operating activities | 2,255.9 | 3,063.8 | 3,898.6 | ||||||||
Investing activities | |||||||||||
| Available-for-sale securities: | |||||||||||
| Purchases | (13,613.2 | ) | (10,918.1 | ) | (16,577.3 | ) | |||||
| Sales | 2,327.1 | 2,952.8 | 8,361.8 | ||||||||
| Maturities | 7,722.6 | 5,222.3 | 4,458.4 | ||||||||
| Net cash flows from trading securities | 6.3 | — | (82.4 | ) | |||||||
| Mortgage loans acquired or originated | (2,115.1 | ) | (2,031.9 | ) | (1,376.8 | ) | |||||
| Mortgage loans sold or repaid | 1,854.3 | 1,316.8 | 1,338.2 | ||||||||
| Real estate acquired | (341.9 | ) | (250.8 | ) | (248.3 | ) | |||||
| Real estate sold | 345.6 | 61.9 | 182.0 | ||||||||
| Net purchases of property and equipment | (47.5 | ) | (28.6 | ) | (59.0 | ) | |||||
| Net proceeds from sales of subsidiaries | 694.7 | 40.9 | 500.8 | ||||||||
| Purchases of interest in subsidiaries, net of cash acquired | (128.1 | ) | (136.2 | ) | (54.5 | ) | |||||
| Net change in other investments | 116.5 | 211.8 | 552.1 | ||||||||
| Net cash used in investing activities | (3,178.7 | ) | (3,559.1 | ) | (3,005.0 | ) | |||||
Financing activities | |||||||||||
| Issuance of common stock | 41.2 | 18.3 | 22.0 | ||||||||
| Acquisition and sales of treasury stock, net | (772.6 | ) | (453.0 | ) | (742.4 | ) | |||||
| Proceeds from financing element derivatives | 110.6 | 118.0 | — | ||||||||
| Payments for financing element derivatives | (84.6 | ) | (107.3 | ) | — | ||||||
| Dividends to stockholders | (166.5 | ) | (145.3 | ) | (83.8 | ) | |||||
| Issuance of long-term debt | 12.1 | 34.7 | 64.1 | ||||||||
| Principal repayments of long-term debt | (447.2 | ) | (85.3 | ) | (110.0 | ) | |||||
| Net proceeds (repayments) of short-term borrowings | (291.4 | ) | 151.3 | 53.2 | |||||||
| Investment contract deposits | 6,995.8 | 9,722.0 | 7,117.0 | ||||||||
| Investment contract withdrawals | (5,209.6 | ) | (8,666.2 | ) | (7,225.7 | ) | |||||
| Net increase (decrease) in banking operation deposits | (5.0 | ) | 372.7 | 184.4 | |||||||
| Net cash provided by (used in) financing activities | 182.8 | 959.9 | (721.2 | ) | |||||||
| Net increase (decrease) in cash and cash equivalents | (740.0 | ) | 464.6 | 172.4 | |||||||
| Cash and cash equivalents at beginning of year | 1,192.5 | 727.9 | 555.5 | ||||||||
| Cash and cash equivalents at end of year | $ | 452.5 | $ | 1,192.5 | $ | 727.9 | |||||
| | For the year ended December 31, | ||||||||||
|---|---|---|---|---|---|---|---|---|---|---|---|
| | 2006 | 2005 | 2004 | ||||||||
| | (in millions) | ||||||||||
| Operating activities | |||||||||||
| Net income | $ | 1,064.3 | $ | 919.0 | $ | 825.6 | |||||
| Adjustments to reconcile net income to net cash provided by operating activities: | |||||||||||
| Income from discontinued operations, net of related income taxes | (30.6 | ) | (27.5 | ) | (130.4 | ) | |||||
| Cumulative effect of accounting change, net of related income taxes | — | — | 5.7 | ||||||||
| Amortization of deferred policy acquisition costs | 239.2 | 246.6 | 210.8 | ||||||||
| Additions to deferred policy acquisition costs | (498.9 | ) | (482.1 | ) | (477.7 | ) | |||||
| Accrued investment income | (41.2 | ) | (4.9 | ) | (21.5 | ) | |||||
| Net cash flows from (for) trading securities | (200.3 | ) | (37.3 | ) | 6.3 | ||||||
| Premiums due and other receivables | (419.1 | ) | (70.8 | ) | (24.9 | ) | |||||
| Contractholder and policyholder liabilities and dividends | 1,851.8 | 2,006.8 | 1,749.9 | ||||||||
| Current and deferred income taxes | 169.6 | (453.3 | ) | 38.0 | |||||||
| Net realized/unrealized capital (gains) losses | (44.7 | ) | 11.2 | 104.8 | |||||||
| Depreciation and amortization expense | 105.3 | 99.7 | 105.7 | ||||||||
| Mortgage loans held for sale, acquired or originated | (427.3 | ) | (2,262.0 | ) | (1,142.4 | ) | |||||
| Mortgage loans held for sale, sold or repaid, net of gain | 761.4 | 2,326.8 | 940.3 | ||||||||
| Real estate acquired through operating activities | (82.3 | ) | (44.6 | ) | (45.8 | ) | |||||
| Real estate sold through operating activities | 88.6 | 41.9 | 84.7 | ||||||||
| Stock-based compensation | 71.8 | 48.8 | 43.4 | ||||||||
| Other | (329.1 | ) | (192.1 | ) | (241.0 | ) | |||||
| Net adjustments | 1,214.2 | 1,207.2 | 1,205.9 | ||||||||
| Net cash provided by operating activities | 2,278.5 | 2,126.2 | 2,031.5 | ||||||||
| Investing activities | |||||||||||
| Available-for-sale securities: | |||||||||||
| Purchases | (7,765.4 | ) | (8,955.1 | ) | (10,301.6 | ) | |||||
| Sales | 1,438.9 | 3,300.5 | 2,327.1 | ||||||||
| Maturities | 3,595.8 | 3,903.2 | 4,411.0 | ||||||||
| Mortgage loans acquired or originated | (2,600.2 | ) | (2,485.5 | ) | (2,760.4 | ) | |||||
| Mortgage loans sold or repaid | 2,102.6 | 2,704.5 | 2,499.6 | ||||||||
| Real estate acquired | (29.1 | ) | (92.2 | ) | (341.5 | ) | |||||
| Real estate sold | 174.1 | 319.8 | 345.6 | ||||||||
| Net purchases of property and equipment | (50.5 | ) | (44.4 | ) | (47.5 | ) | |||||
| Net proceeds from sales of subsidiaries | — | — | 694.7 | ||||||||
| Purchases of interest in subsidiaries, net of cash acquired | (769.2 | ) | (58.1 | ) | (128.1 | ) | |||||
| Net change in other investments | (9.9 | ) | (76.4 | ) | 116.5 | ||||||
| Net cash used in investing activities | $ | (3,912.9 | ) | $ | (1,483.7 | ) | $ | (3,184.6 | ) | ||
Principal Financial Group, Inc.
Consolidated Statements of Cash Flows — (continued)
| | For the year ended December 31, | ||||||||||
|---|---|---|---|---|---|---|---|---|---|---|---|
| | 2006 | 2005 | 2004 | ||||||||
| | (in millions) | ||||||||||
| Financing activities | |||||||||||
| Issuance of common stock | $ | 66.2 | $ | 59.9 | $ | 41.2 | |||||
| Issuance of preferred stock | — | 542.0 | — | ||||||||
| Accelerated stock repurchase settlement | — | (84.0 | ) | — | |||||||
| Acquisition and sales of treasury stock, net | (755.8 | ) | (868.4 | ) | (772.6 | ) | |||||
| Proceeds from financing element derivatives | 132.1 | 168.4 | 110.6 | ||||||||
| Payments for financing element derivatives | (141.0 | ) | (123.2 | ) | (84.6 | ) | |||||
| Excess tax benefits from share-based payment arrangements | 8.4 | — | — | ||||||||
| Dividends to common stockholders | (214.7 | ) | (182.2 | ) | (166.5 | ) | |||||
| Dividends to preferred stockholders | (24.7 | ) | (17.7 | ) | — | ||||||
| Issuance of long-term debt | 601.7 | 137.5 | 12.1 | ||||||||
| Principal repayments of long-term debt | (21.0 | ) | (72.6 | ) | (447.2 | ) | |||||
| Net proceeds (repayments) of short-term borrowings | (390.5 | ) | 199.1 | (291.4 | ) | ||||||
| Investment contract deposits | 8,925.7 | 7,250.0 | 7,312.4 | ||||||||
| Investment contract withdrawals | (6,859.4 | ) | (6,504.5 | ) | (5,294.9 | ) | |||||
| Net increase (decrease) in banking operation deposits | 258.9 | 41.9 | (5.0 | ) | |||||||
| Net cash provided by financing activities | 1,585.9 | 546.2 | 414.1 | ||||||||
| Discontinued operations | |||||||||||
| Net cash provided by (used in) operating activities | (1.1 | ) | 125.1 | (627.7 | ) | ||||||
| Net cash used in investing activities | (0.9 | ) | (125.0 | ) | (473.7 | ) | |||||
| Net cash provided by financing activities | — | — | 600.0 | ||||||||
| Net cash provided by (used in) discontinued operations | (2.0 | ) | 0.1 | (501.4 | ) | ||||||
Net increase (decrease) in cash and cash equivalents | (50.5 | ) | 1,188.8 | (1,240.4 | ) | ||||||
| Cash and cash equivalents at beginning of year | 1,641.3 | 452.5 | 1,692.9 | ||||||||
| Cash and cash equivalents at end of year | $ | 1,590.8 | $ | 1,641.3 | $ | 452.5 | |||||
Cash and cash equivalents of discontinued operations included above | |||||||||||
| At beginning of year | $ | 2.0 | $ | 1.9 | $ | 503.3 | |||||
| At end of year | $ | — | $ | 2.0 | $ | 1.9 | |||||
Schedule of noncash transactions | |||||||||||
| Tax benefits related to demutualization | $ | — | $ | 163.8 | $ | — | |||||
See accompanying notes.
Principal Financial Group, Inc.
Notes to Consolidated Financial Statements
December 31, 20042006
1. Nature of Operations and Significant Accounting Policies
Description of Business
Principal Financial Group, Inc. ("the Company"), along with its consolidated subsidiaries is a diversified financial services organization engaged in promoting retirement savings and investment and insurance products and services in the U.S. and selected international markets.
Basis of Presentation
The accompanying consolidated financial statements, which include our majority-owned subsidiaries and subsequent to June 30, 2003, consolidated variable interest entities ("VIEs"), have been prepared in conformity with U.S. generally accepted accounting principles ("U.S. GAAP"). Less than majority-owned entities in which we had at least a 20% interest and LLCs, partnerships and real estate joint ventures in which we had at least a 5% interest, are reported on the equity basis in the consolidated statements of financial position as other investments. Investments in LLCs, partnerships and real estate joint ventures in which we have an ownership percentage of 3% to 5% will be based onare accounted for under the facts and circumstances to determine if equity or cost method will be applied.depending upon the specific facts and circumstances of our ownership and involvement. All significant intercompany accounts and transactions have been eliminated. Information included in the notes to the financial statements excludes information applicable to less than majority-owned entities reported on the equity and cost methods, unless otherwise noted.
Closed Block
Principal Life Insurance Company ("Principal Life") operates a closed block ("Closed Block") for the benefit of individual participating dividend-paying policies in force at the time of a corporate restructuring in 1998.the 1998 mutual insurance holding company ("MIHC") formation. See Note 9, Closed Block, for further details regarding the Closed Block.details.
Use of Estimates in the Preparation of Financial Statements
The preparation of our consolidated financial statements and accompanying notes requires management to make estimates and assumptions that affect the amounts reported and disclosed. These estimates and assumptions could change in the future as more information becomes known, which could impact the amounts reported and disclosed in the consolidated financial statements and accompanying notes.
Recent Accounting Pronouncements
On December 21, 2004, theThe Financial Accounting Standards Board (the "FASB") issued Statement of Financial Accounting Standards ("SFAS") No. 158,Employers' Accounting for Defined Benefit Pension and Other Postretirement Plans, an amendment of FASB Statements No. 87, 88, 106 and 132R ("SFAS 158"), on September 29, 2006. SFAS 158 requires an entity to recognize in its statement of financial position an asset for a defined benefit postretirement plan's overfunded status or a liability for a plan's underfunded status. This statement eliminates the ability to choose a measurement date, by requiring that plan assets and benefit obligations be measured as of the annual balance sheet date. The requirement to recognize the funded status of a defined benefit postretirement plan and the disclosure requirements are effective for fiscal years ending after December 15, 2006, and did not have a material impact on our consolidated financial statements. The requirement to measure plan assets and benefit obligations as of the annual balance sheet date is effective for fiscal years ending after December 15, 2008. See Note 14, Employee and Agent Benefits, for further details.
On September 15, 2006, the FASB issued SFAS No. 157,Fair Value Measurements ("SFAS 157"). This standard, which provides guidance for using fair value to measure assets and liabilities, applies whenever other standards require or permit assets or liabilities to be measured at fair value, but does not expand the use of fair value in any new circumstances. SFAS 157 establishes a fair value hierarchy that gives the highest priority to quoted prices in active markets and the lowest priority to unobservable data, and requires fair value measurements to be separately disclosed by level within the hierarchy. SFAS 157 is effective for financial statements issued for fiscal years beginning after November 15, 2007. We are still evaluating the impact this guidance will have on our consolidated financial statements.
The staff of the United States Securities and Exchange Commission ("SEC") published Staff Accounting Bulletin ("SAB") No. 108,Considering the Effects of Prior Year Misstatements when Quantifying Misstatements in Current Year Financial Statements ("SAB 108"), on September 13, 2006. SAB 108 addresses quantifying the financial statement effects of misstatements, specifically, how the effects of prior year uncorrected errors must be considered in quantifying misstatements in the current year financial statements. Under SAB 108, registrants are required to quantify the effects on the current year financial statements of correcting all misstatements, including both the carryover and reversing effects of
Principal Financial Group, Inc.
Notes to Consolidated Financial Statements — (continued)
1. Nature of Operations and Significant Accounting Policies — (continued)
uncorrected prior year misstatements. After considering all relevant quantitative and qualitative factors, if a misstatement is material, a registrant's prior year financial statements must be restated. SAB 108 offers special transition provisions only for circumstances where its application would have altered previous materiality conclusions. When applying the special transition provisions, instead of restating prior period financial statements, a registrant must record the effect as a cumulative-effect adjustment to beginning-of-year retained earnings. SAB 108 is effective for fiscal years ending after November 15, 2006. SAB 108 did not have a material impact on our consolidated financial statements.
On July 13, 2006, the FASB issued FASB Interpretation ("FIN") No. 48,Accounting for Uncertainty in Income Taxes ("FIN 48"). FIN 48, which is an interpretation of SFAS No. 109,Accounting for Income Taxes, prescribes a recognition threshold and measurement attribute for the financial statement recognition and measurement of a tax position taken, or expected to be taken, in a tax return. FIN 48 requires the affirmative evaluation that it is more likely than not, based on the technical merits of a tax position, that an enterprise is entitled to economic benefits resulting from positions taken in income tax returns. If a tax position does not meet the more-likely-than-not recognition threshold, the benefit of that position is not recognized in the financial statements. FIN 48 also requires companies to disclose additional quantitative and qualitative information in their financial statements about uncertain tax positions. FIN 48 is effective for fiscal years beginning after December 15, 2006, and the cumulative effect of applying this Interpretation shall be reported as an adjustment to the opening balance of retained earnings for that fiscal year. FIN 48 is not expected to have a material impact on our consolidated financial statements.
On March 17, 2006, the FASB issued SFAS No. 156,Accounting for Servicing of Financial Assets("SFAS 156"), which amends SFAS No. 140,Accounting for Transfers and Servicing of Financial Assets and Extinguishments of Liabilities ("SFAS 140"). This Statement (1) requires an entity to recognize a servicing asset or liability each time it undertakes an obligation to service a financial asset by entering into a servicing contract in specified situations, (2) requires all separately recognized servicing assets and liabilities to be initially measured at fair value, (3) for subsequent measurement of each class of separately recognized servicing assets and liabilities, allows an entity to elect either the amortization or fair value measurement method, (4) permits a one-time reclassification of available-for-sale ("AFS") securities to trading securities by an entity with recognized servicing rights, without calling into question the treatment of other AFS securities, provided the AFS securities are identified in some manner as offsetting the entity's exposure to changes in fair value of servicing assets or liabilities that a servicer elects to subsequently measure at fair value, and (5) requires separate presentation of servicing assets and liabilities measured at fair value in the statement of financial position and also requires additional disclosures. The initial measurement requirements of this statement should be applied prospectively to all transactions entered into after the fiscal year beginning after September 15, 2006. The election related to the subsequent measurement of servicing assets and liabilities is also effective the first fiscal year beginning after September 15, 2006. SFAS 156 is not expected to have a material impact on our consolidated financial statements.
On February 16, 2006, the FASB issued SFAS No. 155,Accounting for Certain Hybrid Financial Instruments — an amendment of FASB Statements No. 133 and 140 ("SFAS 155"), which amends SFAS No. 133,Accounting for Derivative Instruments and Hedging Activities ("SFAS 133") and SFAS 140. SFAS 155 (1) permits fair value remeasurement for any hybrid financial instrument that contains an embedded derivative that otherwise would require bifurcation, (2) clarifies which interest-only and principal-only strips are not subject to the requirements of SFAS 133, (3) establishes a requirement to evaluate interests in securitized financial assets to identify interests that are freestanding derivatives or that are hybrid financial instruments that contain an embedded derivative requiring bifurcation, (4) clarifies that concentrations of credit risk in the form of subordination are not embedded derivatives, and (5) amends SFAS 140 to eliminate the prohibition on a qualifying special-purpose entity from holding a derivative financial instrument that pertains to a beneficial interest other than another derivative financial instrument. This Statement is effective for all financial instruments acquired or issued after the beginning of an entity's fiscal year that begins after September 15, 2006. At adoption, the fair value election may also be applied to hybrid financial instruments that have been bifurcated under SFAS 133 prior to adoption of this Statement. Any changes resulting from the adoption of this Statement should be recognized as a cumulative effect adjustment to beginning retained earnings. SFAS 155 is not expected to have a material impact on our consolidated financial statements.
On September 19, 2005, the Accounting Standards Executive Committee ("AcSEC") issued Statement of Position ("SOP") 05-1,Accounting by Insurance Enterprises for Deferred Acquisition Costs in Connection With Modifications or Exchanges of Insurance Contracts ("SOP 05-1"). AcSEC defines an internal replacement as a modification in product benefits, features, rights, or coverages that occurs by the exchange of a contract for a new contract, or by amendment, endorsement, or rider to a contract, or by the election of a feature or coverage within a contract. An internal replacement that is determined to result in a replacement contract that is substantially unchanged from the replaced contract should be accounted for as a continuation of the replaced contract. Contract modifications resulting in a replacement contract
Principal Financial Group, Inc.
Notes to Consolidated Financial Statements — (continued)
1. Nature of Operations and Significant Accounting Policies — (continued)
that is substantially changed from the replaced contract should be accounted for as an extinguishment of the replaced contract and any unamortized deferred policy acquisition costs, unearned revenue liabilities, and deferred sales inducement costs from the replaced contract should be written off and acquisition costs on the new contracts capitalized as appropriate. This SOP is effective for internal replacements occurring in fiscal years beginning after December 15, 2006. SOP 05-1 is not expected to have a material impact on our consolidated financial statements.
On May 30, 2005, the FASB issued SFAS No. 154,Accounting Changes and Error Corrections, a replacement of APB Opinion No. 20 and FASB Statement No. 3 ("SFAS 154"), which changes the requirements for the accounting and reporting of a change in accounting principle. Under SFAS 154, a change in accounting principle should be retrospectively applied to all prior periods, unless it is impracticable to do so. This retrospective application requirement replaces the Accounting Principles Board ("APB") Opinion No. 20,Accounting Changes ("APB 20"), requirement to recognize changes in accounting principle by including the cumulative effect of the change in net income during the current period. SFAS 154 applies to all voluntary changes in accounting principles where we are changing to a more preferable accounting method, as well as to changes required by an accounting pronouncement that does not contain specific transition provisions. SFAS 154 carries forward without change the guidance contained in APB 20 for reporting the correction of an error in previously issued financial statements and a change in accounting estimate. SFAS 154 is effective for accounting changes on or after January 1, 2006. SFAS 154 does not change the transition provisions of any existing accounting pronouncements.
On December 21, 2004, the FASB issued FASB Staff Position ("FSP") No. 109-2,Accounting and Disclosure Guidance for the Foreign Earning Repatriation Provision within the American Jobs Creation Act of 20042004 ("FSP 109-2"). The American Jobs Creation Act of 2004 (the "Act") was enacted on October 22, 2004, and introduces, among other things, a special one-time dividends received deduction on the repatriation of certain foreign earnings to a U.S. taxpayer ("repatriation provision"), provided certain criteria are met. FSP 109-2 was issued to allow additional time for companies to determine whether any foreign earnings will be repatriated under the Act's repatriation provision, given the law was enacted late in the year and certain provisions arewere unclear. Under FSP 109-2, companies that taketook the additional time arewere required to provide disclosures about the status of the company's evaluation and the potential effects of its decision. FSP 109-2 iswas effective for the year ended December 31, 2004. We are still evaluating the effects of the Act. Refer toSee Note 13,Income Taxes,, for further details.
On December 16, 2004, the FASB issued Statement of Financial Accounting Standards ('SFAS")SFAS No. 123 (revised 2004),Share-Based Payment, ("SFAS 123R"). SFAS 123R requires all share-based payments to employees to be recognized at fair value in the financial statements. SFAS 123R replaces SFAS No. 123,Accounting for Stock-Based Compensation ("SFAS 123"), supersedes Accounting Principles Board ("APB")APB Opinion No. 25,Accounting for Stock Issued to Employees ("APB 25"), and SFAS No. 148,Accounting for Stock-Based Compensation — TransitionCompensation-Transition and Disclosure — an Amendment of FASB Statement No. 123 and amends FASB StatementSFAS No. 95,Statement of Cash Flows. On April 14, 2005, the SEC approved a new rule delaying the effective date of SFAS 123R is effective for public companies at the beginning of the first interim orto annual period beginningperiods that begin after June 15, 2005. Accordingly, we will be adoptingadopted SFAS 123R effective JulyJanuary 1, 2005.2006 using the modified-prospective method.
The provisions of our stock awards allow approved retirees to retain all or a portion of their awards if they retire prior to the end of the required service period. SFAS 123R considers this to be a nonsubstantive service condition. Accordingly, it is appropriate to recognize compensation cost either immediately for stock awards granted to retirement eligible employees, or over the period from the grant date to the date retirement eligibility is achieved, if retirement eligibility is expected to occur during the nominal vesting period. Our approach was to follow the widespread practice of recognizing compensation cost over the explicit service period (up to the date of actual retirement). For any awards that are granted after our adoption of SFAS 123R on January 1, 2006, we recognize compensation cost through the period that the employee first becomes eligible to retire and is no longer required to provide service to earn the award. If we had applied the nonsubstantive vesting provisions of SFAS 123R to awards granted prior to January 1, 2006, our consolidated financial statements would not have been materially impacted.
SFAS 123R requires that the benefits of tax deductions in excess of recognized compensation cost be reported as a financing cash flow, rather than as an operating cash flow. This requirement reduces net operating cash flows and increases net financing cash flows in periods after the effective date.
Under the modified-prospective method, any excess income tax deduction realized for awards accounted for under SFAS 123R (regardless of the type of award or the jurisdiction in which the tax benefit is generated) is eligible to absorb write-offs of deferred income tax assets for any awards accounted for under SFAS 123R. SFAS 123R does not require separate pools of excess income tax benefits for separate types of awards, rather the excess income tax benefits of employee and nonemployee awards may be combined in a single pool of excess tax benefits. Our policy is to pool the employee and nonemployee awards together in this manner. Deferred income tax asset write-offs resulting from deficient
Principal Financial Group, Inc.
Notes to Consolidated Financial Statements — (continued)
1. Nature of Operations and Significant Accounting Policies — (continued)
deductions on employee awards may be offset against previous excess income tax benefits arising from nonemployee awards, and vice versa.
This Statement willdid not have a material impact on our consolidated financial statements as we began expensing all stock options using a fair-value based method effective for the year beginning January 1, 2002. In addition, any stock options granted prior to January 1, 2002 were fully vested at the time of adoption of SFAS 123R. We use the Black-Scholes formula to estimate the value of stock options granted to employees. We applied the prospective method of transition as prescribed by SFAS 123.123 when we elected to begin expensing stock-based compensation in 2002. The cumulative effect of the change in accounting principle as a result of adopting SFAS 123R is immaterial. Therefore, the pre-tax cumulative effect of the change in accounting principle is reflected in operating expenses.
See Note 20, Stock-Based Compensation Plans, for further details.
In December, 2004, SFAS No. 153,Exchange of Nonmonetary Assets, an amendment of APB Opinion No. 29 ("SFAS 153"), was issued in December 2004.issued. APB Opinion No. 29,Accounting for Nonmonetary Transactions ("APB 29"), providesprovided the basic principle that exchanges of nonmonetary assets should be measured based on the fair value of the assets exchanged. However, APB 29 includesprovided an exception that allowed certain exceptionsexchanges of similar productive assets to that principle.be recorded at book value. SFAS 153 amends APB 29 to eliminate thethis exception for
nonmonetaryand requires non-monetary exchanges of similar productive assets and replaces it with a general exceptionthat meet certain criteria to be accounted for exchanges of nonmonetary assets that do not have commercial substance.at fair value. We adopted SFAS 153 is effective forand are applying its guidelines to nonmonetary exchanges occurring on or after July 1, 2005. We plan to adopt SFAS 153 on July 1, 2005, and will subsequently recognize gains, resulting from real estate exchanges that meet the commercial substance criteria, as they occur.
On March 9, 2004, the U.S. Securities and Exchange Commission ("SEC")SEC Staff issued Staff Accounting Bulletin ("SAB") 105,SAB No.105,Application of Accounting Principles to Loan Commitments ("SAB 105"), in which the SEC Staff expressed their view that the fair value of recorded loan commitments, including interest rate lock commitments ("IRLCs"), that are required to follow derivative accounting under SFAS No. 133, Accounting for Derivative Instruments and Hedging Activities ("SFAS 133"), should not consider the expected future cash flows related to the associated servicing of the loan. We record IRLCs at zero value at date of issuance with subsequent gains or losses measured by changes in market interest rates. Therefore, this SAB did not have a material impact on our consolidated financial statements.
In March 2004, the Emerging Issues Task Force ("EITF") reached a final consensus on Issue 03-1,The Meaning of Other-Than-Temporary Impairment and its Application to Certain Investments ("EITF 03-1"). EITF 03-1 provides accounting guidance regarding the determination of when an impairment of debt and marketable equity securities and investments accounted for under the cost method should be considered other-than-temporary and recognized in income. This EITF was originally effective for the period beginning July 1, 2004. However, on September 30, 2004, the FASB issued a Staff Position delaying the accounting and measurement provisions of EITF 03-1 until additional clarifying guidance can be issued. Due to the uncertainties that still exist with this guidance, we are unable to estimate the impact EITF 03-1 will have to our consolidated financial statements.
On July 7, 2003, the American Institute of Certified Public AccountantsAcSEC issued Statement of Position ("SOP")SOP 03-1,Accounting and Reporting by Insurance Enterprises for Certain Nontraditional Long-DurationLong Duration Contracts and for Separate Accounts ("SOP 03-1"). This SOP addresses an insurance enterprise's accounting for certain fixed and variable contract features not covered by other authoritative accounting guidance. We adopted SOP 03-1 effective January 1, 2004, and recorded a cumulative effect of accounting change of $(5.7) million, which is net of income tax benefits of $3.0 million. The accounting change impacted our Life and Health Insurance, U.S. Asset Management and Accumulation and International Asset Management and Accumulation segments.
SOP 03-1 addresses the classification of contracts and calculation of an additional liability for contracts that contain significant insurance features. The adoption of the guidance required the recognition of an additional liability in cases where the insurance benefit feature resulted in gains in early years followed by losses in later years. The accrual and release of the additional liability also impacted the amortization of deferred policy acquisition costs ("DPAC"). As of January 1, 2004, we increased future policyholder benefits due to our no lapse guarantee feature of our universal life and variable universal life products within our Life and Health Insurance segment and for variable annuities with guaranteed minimum death benefits in our U.S. Asset Management and Accumulation segment. This resulted in an after-tax cumulative effect of $(0.9) million in the Life and Health Insurance segment and $(1.5) million in the U.S. Asset Management and Accumulation segment.
SOP 03-1 also requires contracts which provide for potential benefits in addition to the account balance that are payable only upon annuitization to establish an additional liability if the present value of the annuitized benefits exceeds the expected account balance at the expected annuitization date. In that regard, we also had an after-tax cumulative effect related to an equity method investment within our International Asset Management and Accumulation segment of $(3.3) million, net of income taxes, as of January 1, 2004, for select deferred annuity products, which include guaranteed annuitization purchase rates.
In addition, the guidance clarifies the accounting and classification for sales inducements. Although the valuation impacts were immaterial, we reclassified $30.3 million of sales inducements from DPAC to other assets.
The FASB issued Interpretation No. 46,Consolidationassets as of Variable Interest Entities ("FIN 46"), in January 2003. FIN 46 applies to certain entities in which equity investors do not have the characteristics of a controlling financial interest, or do not have sufficient equity at risk for the entities to finance their activities without additional subordinated financial support from other parties. FIN 46 requires the consolidation of VIEs in which an enterprise, known as the primary beneficiary, absorbs a majority of the entity's expected losses, receives a majority of the entity's expected residual returns, or both, as a result of ownership, contractual or other financial interests in the entity.
The guidance was effective immediately for all VIEs created after January 31, 2003, and effective July 1, 2003, for all VIEs created before February 1, 2003. We invested in one VIE in April, 2003, and effective July 1, 2003, consolidated VIEs created or acquired prior to February 1, 2003, for which we are the primary beneficiary.
At July 1, 2003, our consolidated financial statements were adjusted to record a cumulative effect of adopting FIN 46, as follows:
| | Net loss | Accumulated other comprehensive income | |||||
|---|---|---|---|---|---|---|---|
| | (in millions) | ||||||
| Adjustment for intercompany gains and carrying value of assets consolidated | $ | (6.1 | ) | $ | 14.1 | ||
| Income tax impact | 2.7 | (5.0 | ) | ||||
| Total | $ | (3.4 | ) | $ | 9.1 | ||
See Note 5 for the disclosures relating to VIEs.
In August 2001, the FASB issued SFAS No. 144,Accounting for the Impairment or Disposal of Long-Lived Assets ("SFAS 144"). This Statement supersedes SFAS No. 121,Accounting for the Impairment of Long-Lived Assets and for Long-Lived Assets to be Disposed of, and amends APB Opinion No. 30,Reporting the Results of Operations — Reporting the Effects of Disposal of a Segment of a Business, and Extraordinary, Unusual and Infrequently Occurring Events and Transactions ("APB 30"), establishing a single accounting model for the disposal of long-lived assets. SFAS 144 generally retains the basic provisions of existing guidance, but broadens the presentation of any discontinued operations to include a component of an entity (rather than a segment of a business as defined in APB 30). We adopted SFAS 144 on January 1, 2002, which did not have a significant impact on our consolidated financial statements as of the adoption date. See Note 3 for transactions reported as discontinued operations.2004.
In June 2001, the FASB issued SFAS No. 142,Goodwill and Other Intangible Assets ("SFAS 142"). SFAS 142, effective January 1, 2002, prohibits the amortization of goodwill and intangible assets with indefinite useful lives. Intangible assets with finite lives will continue to be amortized over their estimated useful lives. Additionally, SFAS 142 requires that goodwill and indefinite-lived intangible assets be reviewed for impairment at least annually, which we do in the fourth quarter each year.
Our initial adoption of SFAS 142 on January 1, 2002, required us to perform a two-step, fair-value based goodwill impairment test. The first step of the test compared the estimated fair value of the reporting unit to its carrying value, including goodwill. If the carrying value exceeded fair value, a second step was performed, which compared the implied fair value of the applicable reporting unit's goodwill with the carrying amount of that goodwill, to measure the goodwill impairment, if any. Additionally, we were required to perform an impairment test on our indefinite-lived intangible assets, which consisted of a comparison of the fair value of an intangible asset with its carrying amount.
Our measurements of fair value were based on evaluations of future discounted cash flows, product level analysis, market performance assumptions and cash flow assumptions. These evaluations utilized the best information available in the circumstances, including reasonable and supportable assumptions and projections. The discounted cash flow evaluations considered earnings scenarios and the likelihood of possible outcomes. Collectively, these evaluations were management's best estimate of projected future cash flows.
As a result of performing the two-step impairment test, we recorded goodwill impairments of $196.5 million, $20.9 million and $4.6 million, net of income taxes, related to our BT Financial Group, Principal International and Life and Health Insurance operations, respectively. Additionally, as a result of performing the indefinite-lived intangible asset impairment test, we recognized an after-tax impairment of $58.9 million to our brand name and management rights intangible asset related to BT Financial Group.
These impairments, recognized January 1, 2002, as a cumulative effect of a change in accounting principle, were reported in our operating segments as follows:
| | International Asset Management and Accumulation | Life and Health Insurance | Consolidated | |||||||
|---|---|---|---|---|---|---|---|---|---|---|
| | (in millions) | |||||||||
| Goodwill | $ | 321.2 | $ | 4.6 | $ | 325.8 | ||||
| Indefinite-lived intangibles | 89.8 | — | 89.8 | |||||||
| Income tax impact | (134.7 | ) | — | (134.7 | ) | |||||
| Total impairment, net of income taxes | $ | 276.3 | $ | 4.6 | $ | 280.9 | ||||
Cash and Cash Equivalents
Cash and cash equivalents include cash on hand, money market instruments and other debt issues with a maturity date of three months or less when purchased.
Principal Financial Group, Inc.
Notes to Consolidated Financial Statements — (continued)
1. Nature of Operations and Significant Accounting Policies — (continued)
Investments
We classify our fixed maturity and equity investments into one of threetwo categories: held-to-maturity, available-for-sale or trading. We determine the appropriate classification of fixed maturity securities at the time of purchase. Fixed maturity securities include bonds, mortgage-backed securities and redeemable preferred stock. We classify fixed maturity securities as either available-for-sale or trading and, accordingly, carry them at fair value. (See Note 17, Fair Value of Financial Instruments, for policies related to the determination of fair value.) Unrealized gains and losses related to available-for-sale securities, excluding those in fair value hedging relationships, are reflected in stockholders' equity, net of adjustments related to DPAC, sales inducements, unearned revenue reserves, policyholder dividend obligation ("PDO"), derivatives in cash flow hedge relationships and applicable income taxes. Unrealized gains and losses related to trading securities and available-for-sale securities in fair value hedging relationships are reflected in net income as net realized/unrealized capital gains (losses).
The cost of fixed maturity securities is adjusted for amortization of premiums and accrual of discounts, both computed using the interest method. The cost of fixed maturity securities is adjusted for declines in value that are other than temporary. Impairments in value deemed to be other than temporary are reported in net income as a component of net realized/unrealized capital gains (losses). For loan-backed and structured securities, we recognize income using a constant effective yield based on currently anticipated prepayments using a tool which models the prepayment behavior of the underlying collateral based on the current interest rate environment.
Equity securities include mutual funds, common stock and nonredeemable preferred stock. The cost of equity securities is adjusted for declines in value that are other than temporary. Impairments in value deemed to be other than temporary are reported in net income as a component of net realized/unrealized capital gains (losses). Equity securities are classified as available-for-sale or trading and, accordingly, are carried at fair value. (See Note 17, Fair Value of Financial Instruments, for policies related to the determination of fair value.) Unrealized gains and losses related to available-for-sale securities are reflected in stockholders' equity, net of related DPAC, sales inducements, unearned revenue reserves, PDO, and applicable income taxes. Unrealized gains and losses related to trading securities are reflected in net income as net realized/unrealized capital gains (losses).
Real estate investments are reported at cost less accumulated depreciation. The initial cost bases of properties acquired through loan foreclosures are the lower of the fair market values of the properties at the time of foreclosure or the outstanding loan balance. Buildings and land improvements are generally depreciated on the straight-line method over the estimated useful life of improvements, and tenant improvement costs are depreciated on the straight-line method over the term of the related lease. We recognize impairment losses for properties when indicators of impairment are present and a property's expected undiscounted cash flows are not sufficient to recover the property's carrying value. In such cases, the cost bases of the properties are reduced to fair value. Real estate expected to be disposed is carried at the lower of cost or fair value, less cost to sell, with valuation allowances established accordingly and depreciation no longer recognized. Any impairment losses and any changes in valuation allowances are reported in net income.
Commercial and residential mortgage loans are generally reported at cost adjusted for amortization of premiums and accrual of discounts, computed using the interest method, net of valuation allowances, and direct write-downs for impairment. Any changes in the valuation allowances are reported in net income as net realized/unrealized capital gains (losses). We measure impairment based upon the present value of expected cash flows discounted at the loan's effective interest rate or the loan's observable market price. If foreclosure is probable, the measurement of any valuation allowance is based upon the fair value of the collateral. We have commercial mortgage loans held-for-sale in the amount of $478.6$77.3 million and $278.1$412.1 million at December 31, 20042006 and 2003,2005, respectively, which are carried at lower of cost or fair value, less cost to sell, and reported as mortgage loans in the statements of financial position.
Net realized capital gains and losses on sales of investments are determined on the basis of specific identification. In general, in addition to realized capital gains and losses on investment sales, unrealized gains and losses related to other than temporary impairments, trading securities, certain seed money investments, fair value hedge ineffectiveness, derivatives not designated as hedges and changes in the mortgage loan allowance are reported in net income as net realized/unrealized capital gains (losses). Investment gains and losses on sales of certain real estate held-for-sale, which do not meet the criteria for classification as a discontinued operation, are reported as net investment income and are excluded from net realized/unrealized capital gains (losses).
Policy loans and other investments, excluding investments in unconsolidated entities, are primarily reported at cost.
Principal Financial Group, Inc.
Notes to Consolidated Financial Statements — (continued)
1. Nature of Operations and Significant Accounting Policies — (continued)
Securitizations
We, along with other contributors, sell commercial mortgage loans to trusts whichthat, in turn, securitize the assets. As these trusts are unconsolidated qualifiedclassified as qualifying special purpose entities which then issue commercial mortgage-backed securities. We retain primary servicing responsibilities and may retain other immaterial interests in("QSPE") pursuant to the trusts by purchasing portionsguidance of SFAS 140, we recognize the securities from the issuance. Gain or lossgain on the salessale of the loans to the trust and the trusts are not required to be consolidated under the provisions of FIN No. 46 (Revised 2003),Consolidation of Variable Interest Entities ("FIN 46R"). There is reportedsignificant judgment used to determine whether a trust is a QSPE. To maintain QSPE status, the trust must continue to meet the QSPE criteria both initially and in subsequent periods. We have analyzed the governing pooling and servicing agreements for each of our securitizations and believe that the terms are industry standard and are consistent with the QSPE criteria. If at any time we determine a trust no longer qualifies as feesa QSPE, each trust will need to be reviewed to determine if there is a need to recognize the commercial mortgage loan asset in the statement of financial position along with the offsetting liability. In addition, certain industry practices related to the qualifying status of QSPE's are being discussed by the FASB and other revenues. The retained interests are thereafter carried at fair value with other fixed maturity investments and classified as available-for-sale.could impact the accounting for existing and/or future transactions.
Derivatives
Overview. Derivatives are recognized asfinancial instruments whose values are derived from interest rates, foreign exchange rates, financial indices or the values of securities. Derivatives generally used by us include interest rate swaps, swaptions, futures, currency swaps, currency forwards, credit default swaps, total return swaps, interest rate lock commitments, bond forwards, mortgage-backed forwards, commodity swaps and options. Derivatives may be exchange traded or contracted in the over-the-counter market. Derivative positions are either assets or liabilities in the consolidated statements of financial position and are measured at fair value. If certain conditions are met, a derivative mayvalue, generally by obtaining quoted market prices or through the use of pricing models. Fair values can be specifically designatedaffected by changes in interest rates, foreign exchange rates, financial indices, values of securities, credit spreads, and market volatility and liquidity.
Accounting and Financial Statement Presentation. We designate derivatives as one of the following:either:
- (a)
- a hedge of the exposure to changes in the fair value of a recognized asset or liability or an unrecognized firm
commitment;commitment, including those denominated in a foreign currency ("fair value" hedge); - (b)
- a hedge of a forecasted transaction or the exposure to
variablevariability of cash flowsofto be received or paid related to aforecasted transaction;recognized asset or liability, including those denominated in a foreign currency ("cash flow" hedge); - (c)
- a hedge of
thea net investment in a foreigncurrency exposure of an unrecognized firm commitment, an available-for-sale securityoperation; or - (d)
- a
foreign-currency-denominated forecasted transaction.derivative not designated as a hedging instrument.
Our accounting for the ongoing changes in fair value of a derivative depends on the intended use of the derivative and the designation, as described above, and is determined when the derivative contract is entered into or at the time of redesignation under SFAS 133. Hedge accounting is used for derivatives that are specifically designated in advance as hedges and that reduce our exposure to an indicated risk by having a high correlation between changes in the value of the derivatives and the items being hedged at both the inception of the hedge and throughout the hedge period.
For derivatives hedging the exposure Fair Value Hedges. When a derivative is designated as a fair value hedge and is determined to be highly effective, changes in its fair value, along with changes in the fair value of a recognizedthe hedged asset, liability or liability,firm commitment attributable to the hedged risk, are reported in net realized/unrealized capital gains (losses). Any difference between the net change in fair value of the derivative is recognized in earnings in the period of change together with the offsetting change in fair value onand the hedged item attributablerepresents hedge ineffectiveness.
Cash Flow Hedges. When a derivative is designated as a cash flow hedge and is determined to the risk being hedged. The effect of such accounting is to reflect in earnings the extent to which the hedge is notbe highly effective, in achieving offsetting changes in fair value.
For derivatives hedging the exposure to variable cash flows, the effective portion of the derivative's change inits fair value is initially deferred and reportedare recorded as a component of other comprehensive income. Any hedge ineffectiveness is recorded immediately in net income. At the time the variability of cash flows being hedged impact net income, and subsequently reclassified into earnings when each variable cash flow occurs and is recognized in earnings. The ineffectivethe related portion of deferred gains or losses on the derivative instrument is reclassified and reported in net income.
Net Investment in a Foreign Operation Hedges. When a derivative is used as a hedge of a net investment in a foreign operation, its change in fair value, is reported in earnings in the period of change. For derivatives that are terminated prior to maturity, any accumulated gain or loss is recognized in earnings immediately if the hedged item is also terminated. If the hedged item is not terminated, then the accumulated gain or loss is amortized into earnings over the remaining life of the hedged item.
For derivatives hedging the exposure to changes in fair value of the foreign currency exposure of an unrecognized firm commitment or an available-for-sale security, the change in fair value of the derivative is recognized in earnings in the period of change together with the offsetting change in fair value on the hedged item attributable to the risk being hedged. The effect of such accounting is to reflect in earnings the extent to which theeffective as a hedge, is not effective in achieving offsetting changes in fair value.
For derivatives hedging the exposure to variable cash flows of the foreign currency exposure of a foreign-currency-denominated unrecognized firm commitment or forecasted transaction, the change in fair value is initially deferred and reportedrecorded as a component of other comprehensive income and subsequentlyincome. Any hedge ineffectiveness is recorded immediately in net income. If the foreign operation is sold or upon complete or substantially complete liquidation, the deferred gains or losses on the derivative instrument are reclassified into earningsnet income.
Non-Hedge Derivatives. If a derivative does not qualify or is not designated for hedge accounting, all changes in fair value are reported in net income without considering the changes in the fair value of the economically associated assets or liabilities.
In our commercial mortgage backed securitization operation, we enter into commitments to fund commercial mortgage loans at specified interest rates and other applicable terms within specified periods of time. These commitments are legally binding agreements to extend credit to a counterparty. Loan commitments that will be held for sale are recognized as derivatives and are recorded at fair value.
Principal Financial Group, Inc.
Notes to Consolidated Financial Statements — (continued)
1. Nature of Operations and Significant Accounting Policies — (continued)
Hedge Documentation and Effectiveness Testing. We formally document all relationships between hedging instruments and hedged items, as well as our risk management objective and strategy for undertaking various hedge transactions. This process includes associating all derivatives designated as fair value or cash flow hedges with specific assets or liabilities on the statement of financial position or with specific firm commitments or forecasted transactions. Effectiveness of the hedge is formally assessed at inception and throughout the life of the hedging relationship. Even if a derivative is highly effective and qualifies for hedge accounting treatment, the hedge might have some ineffectiveness.
We use qualitative and quantitative methods to assess hedge effectiveness. Qualitative methods may include monitoring changes to terms and conditions and counterparty credit ratings. Quantitative methods may include statistical tests including regression analysis and minimum variance and dollar offset techniques. If we determine a derivative is no longer highly effective as a hedge, we prospectively discontinue hedge accounting.
Termination of Hedge Accounting. We prospectively discontinue hedge accounting when (1) the forecasted transaction occurs andcriteria to qualify for hedge accounting is recognizedno longer met, e.g., a derivative is determined to no longer be highly effective in earnings. The ineffective portion ofoffsetting the change in fair value or cash flows of a hedged item; (2) the derivative expires, is reported in earnings insold, terminated or exercised; or (3) we remove the perioddesignation of change.
Regression analysis is usedthe derivative being the hedging instrument for both retrospective and prospective hedge effectiveness testing for thea fair value portfolio hedging strategy engaged in byor cash flow hedge.
If it is determined that a derivative no longer qualifies as an effective hedge, the Principal Life general account and our commercial mortgage banking operation.
Priorderivative will continue to October 1, 2004, minimum variance and dollar offset techniques were used inbe carried on the effectiveness testing for the Principal Life general account portfolio hedges.
For derivatives not designated as a hedging instrument, the changestatement of financial position at its fair value, with changes in fair value is recognized currently in net realized/unrealized capital gains (losses). The asset or liability under a fair value hedge will no longer be adjusted for changes in fair value pursuant to hedging rules and the existing basis adjustment is amortized to the statement of operations line associated with the asset or liability. The component of other comprehensive income related to discontinued cash flow hedges that are no longer highly effective is amortized to the statement of operations consistent with the net income impacts of the original hedged cash flows. If a cash flow hedge is discontinued because a hedged forecasted transaction is no longer probable, the deferred gain or loss is immediately reclassified from other comprehensive income into net income.
Embedded Derivatives. We purchase and issue financial instruments and products that contain a derivative that is embedded in the periodfinancial instrument or product. We assess whether this embedded derivative is clearly and closely related to the asset or liability that serves as its host contract. If we deem that the embedded derivative's terms are not clearly and closely related to the host contract, and a separate instrument with the same terms would qualify as a derivative instrument, the derivative is bifurcated from that contract and held at fair value on the statement of change.financial position, with changes in fair value reported in net income.
Contractholder and Policyholder Liabilities
Contractholder and policyholder liabilities (contractholder funds, future policy benefits and claims and other policyholder funds) include reserves for investment contracts and reserves for universal life, limited payment, participating, traditional and group life insurance, accident and health insurance and disability income policies, as well as a provision for dividends on participating policies.
Investment contracts are contractholders' funds on deposit with us and generally include reserves for pension and annuity contracts. Reserves on investment contracts are equal to the cumulative deposits less any applicable charges and withdrawals plus credited interest. Reserves for universal life insurance contracts are equal to cumulative premiumsdeposits less charges plus credited interest, which represents the account balances that accrue to the benefit of the policyholders.
For our universal life and annuity products weWe hold additional reserves pursuant to SOP 03-1. SOP 03-1 requires that reserves be held on certain long duration contracts where benefit features result in gains in early years followed by losses in later years, universal life/variable universal life contracts that contain no lapse guarantee features, or annuities with guaranteed minimum death benefits.
Reserves for nonparticipating term life insurance and disability income contracts are computed on a basis of assumed investment yield, mortality, morbidity and expenses, including a provision for adverse deviation, which generally varies by plan, year of issue and policy duration. Investment yield is based on our experience. Mortality, morbidity and withdrawal rate assumptions are based on our experience and are periodically reviewed against both industry standards and experience.
Reserves for participating life insurance contracts are based on the net level premium reserve for death and endowment policy benefits. This net level premium reserve is calculated based on dividend fund interest rates and mortality rates guaranteed in calculating the cash surrender values described in the contract.
Principal Financial Group, Inc.
Notes to Consolidated Financial Statements — (continued)
1. Nature of Operations and Significant Accounting Policies — (continued)
Participating business represented approximately 28%20%, 32%24% and 33%28% of our life insurance in force and 64%59%, 67%62% and 76%64% of the number of life insurance policies in force at December 31, 2004, 20032006, 2005 and 2002,2004, respectively. Participating business represented approximately 60%56%, 65%58% and 68%60% of life insurance premiums for the years ended December 31, 2004, 20032006, 2005 and 2002,2004, respectively. The amount of dividends to policyholders is approved annually by Principal Life's Board of Directors. The amount of dividends to be paid to policyholders is determined after consideration of several factors including interest, mortality, morbidity and other expense experience for the year and judgment as to the appropriate level of statutory surplus to be retained by Principal Life. At the end of the reporting period, Principal Life establishes a dividend liability for the pro rata portion of the dividends expected to be paid on or before the next policy anniversary date.
Some of our policies and contracts require payment of fees in advance for services that will be rendered over the estimated lives of the policies and contracts. These payments are established as unearned revenue reserves upon receipt and included in other policyholder funds in the consolidated statements of financial position. These unearned revenue reserves are amortized to operations over the estimated lives of these policies and contracts in relation to the emergence of estimated gross profit margins.
The liability for unpaid accident and health claims is an estimate of the ultimate net cost of reported and unreported losses not yet settled. This liability is estimated using actuarial analyses and case basis evaluations. Although considerable variability is inherent in such estimates, we believe that the liability for unpaid claims is adequate. These estimates are continually reviewed and, as adjustments to this liability become necessary, such adjustments are reflected in current operations.
Recognition of Premiums and Other Considerations, Fees and Other Revenues and Benefits
Traditional individual life insurance products include those products with fixed and guaranteed premiums and benefits and consist principally of whole life and term life insurance policies. Premiums from these products are recognized as premium revenue when due. Related policy benefits and expenses for individual life and annuity products are associated with earned premiums and result in the recognition of profits over the expected term of the policies and contracts.
Immediate annuities with life contingencies include products with fixed and guaranteed annuity considerations and benefits and consist principally of group and individual single premium annuities with life contingencies. Under the guidance for limited payment contracts under SFAS No. 97,Accounting and Reporting by Insurance Enterprises for Certain Long-Duration Contracts and for Realized Gains and Losses from the Sale of Investments, which refers back to SFAS No. 60,Accounting and Reporting by Insurance Enterprises ("SFAS 60"), annuityAnnuity considerations from these products
are recognized as revenue. However, the collection of these annuity considerations does not represent the completion of the earnings process, as we establish annuity reserves, using estimates for mortality and investment assumptions, which include provision for adverse deviation as defined in SFAS 60.required by U.S. GAAP. We anticipate profits to emerge over the life of the annuity products as we earn investment income, pay benefits and release reserves.
Group life and health insurance premiums are generally recorded as premium revenue over the term of the coverage. Certain group contracts contain experience premium refund provisions based on a pre-defined formula that reflects their claim experience. Experience premium refunds are recognized over the term of the coverage and adjusted to reflect current experience. Fees for contracts providing claim processing or other administrative services are recorded over the period the service is provided. Related policy benefits and expenses for group life and health insurance products are associated with earned premiums and result in the recognition of profits over the term of the policies and contracts.
Universal life-type policies are insurance contracts with terms that are not fixed and guaranteed.fixed. Amounts received as payments for such contracts are not reported as premium revenues. Revenues for universal life-type insurance contracts consist of policy charges for the cost of insurance, policy initiation and administration, surrender charges and other fees that have been assessed against policy account values.values and investment income. Policy benefits and claims that are charged to expense include interest credited to contracts and benefit claims incurred in the period in excess of related policy account balances.
Investment contracts do not subject us to significant risks arising from policyholder mortality or morbidity and consist primarily of Guaranteed Investment Contracts ("GICs"), funding agreements and certain deferred annuities. Amounts received as payments for investment contracts are established as investment contract liability balances and are not reported as premium revenues. Revenues for investment contracts consist of investment income and policy administration charges. Investment contract benefits that are charged to expense include benefit claims incurred in the period in excess of related investment contract liability balances and interest credited to investment contract liability balances.
Fees and other revenues are earned for asset management services provided to retail and institutional clients based largely upon contractual rates applied to the market value of the client's portfolio. Additionally, fees and other revenues
Principal Financial Group, Inc.
Notes to Consolidated Financial Statements — (continued)
1. Nature of Operations and Significant Accounting Policies — (continued)
are earned for administrative services performed including recordkeeping and reporting services for retirement savings plans. Fees and other revenues received for performance of asset management and administrative services are recognized as revenue when the service is performed or earned.
Deferred Policy Acquisition Costs
Commissions and other costs (underwriting, issuance and agency expenses )field expenses) that vary with and are primarily related to the acquisition of new and renewal insurance policies and investment contract business are capitalized to the extent recoverable. Maintenance costs and acquisition costs that are not deferrable are charged to operations as incurred.
DPAC for universal life-type insurance contracts, and participating life insurance policies and investment contracts are being amortized over the lives of the policies and contracts in relation to the emergence of estimated gross profit margins. WeFor investment contracts pertaining to individual and group annuities which have separate account investment options, we utilize a mean reversion method (reversion to the mean assumption), a common industry practice, to determine the future domestic equity market growth assumption used for the amortization of DPAC on investment contracts pertaining to individual and group annuities which have separate account investment options.DPAC. This amortization is adjusted in the current period when estimates of estimated gross profit are revised. The DPAC of nonparticipating term life insurance policies are being amortized over the premium-paying period of the related policies using assumptions consistent with those used in computing policyholder liabilities.
DPAC are subject to recoverability testing at the time of policy issue and loss recognition testing at the end of each accounting period.on an annual basis, or when an event occurs that may warrant loss recognition. If loss recognition is necessary, DPAC would be written off to the extent that it is determined that future policy premiums and investment income or gross profit margins wouldprofits are not be adequate to cover related losses and expenses.
Long-Term Debt
Long-term debt includes notes payable, nonrecourse mortgages and other debt with a maturity date greater than one year at the date of issuance. Current maturities of long term debt are classified as long-term debt in our statement of financial position.
Reinsurance
We enter into reinsurance agreements with other companies in the normal course of business. We may assume reinsurance from or cede reinsurance to other companies. Assets and liabilities related to reinsurance ceded are reported on a gross basis. Premiums and expenses are reported net of reinsurance ceded, except for the medical reinsurance agreement, which is accounted for using the deposit method of accounting. Our medical reinsurance agreement is no longer in effect after December 31, 2004, as we did not renew.ceded. We are contingently liable with respect to reinsurance ceded to other companies in the event the reinsurer is unable to meet the obligations it has assumed. At December 31, 2004, 20032006, 2005 and 2002,2004, respectively, we had reinsured $20.1$21.7 billion, $19.4$21.2 billion and $17.8$20.1 billion of life insurance in force, representing 13%, 14%, 14% and 13%14%, respectively, of total net life insurance in force through a single third-party reinsurer. To minimize the possibility of losses, we regularly evaluate the financial condition of our reinsurers and monitor concentrations of credit risk.
The effects of reinsurance on premiums and other considerations and policy and contract benefits were as follows:
| | | For the year ended December 31, | | For the year ended December 31, | ||||||||||||||||||
|---|---|---|---|---|---|---|---|---|---|---|---|---|---|---|---|---|---|---|---|---|---|---|
| | | 2004 | 2003 | 2002 | | 2006 | 2005 | 2004 | ||||||||||||||
| | | (in millions) | | (in millions) | ||||||||||||||||||
| Premiums and other considerations: | Premiums and other considerations: | Premiums and other considerations: | ||||||||||||||||||||
| Direct | $ | 3,934.8 | $ | 3,801.8 | $ | 4,075.3 | Direct | $ | 4,468.8 | $ | 4,214.6 | $ | 3,934.8 | |||||||||
| Assumed | 67.0 | 118.8 | 130.6 | Assumed | 117.3 | 56.6 | 67.0 | |||||||||||||||
| Ceded | (291.8 | ) | (289.9 | ) | (328.1 | ) | Ceded | (280.8 | ) | (296.2 | ) | (291.8 | ) | |||||||||
| Net premiums and other considerations | Net premiums and other considerations | $ | 3,710.0 | $ | 3,630.7 | $ | 3,877.8 | Net premiums and other considerations | $ | 4,305.3 | $ | 3,975.0 | $ | 3,710.0 | ||||||||
| Benefits, claims and settlement expenses: | Benefits, claims and settlement expenses: | Benefits, claims and settlement expenses: | ||||||||||||||||||||
| Direct | $ | 5,099.0 | $ | 4,962.2 | $ | 5,313.8 | Direct | $ | 5,871.3 | $ | 5,472.3 | $ | 5,099.0 | |||||||||
| Assumed | 83.2 | 129.3 | 135.6 | Assumed | 141.8 | 77.0 | 83.2 | |||||||||||||||
| Ceded | (222.7 | ) | (235.7 | ) | (251.9 | ) | Ceded | (320.7 | ) | (266.4 | ) | (222.7 | ) | |||||||||
| Net benefits, claims and settlement expenses | Net benefits, claims and settlement expenses | $ | 4,959.5 | $ | 4,855.8 | $ | 5,197.5 | Net benefits, claims and settlement expenses | $ | 5,692.4 | $ | 5,282.9 | $ | 4,959.5 | ||||||||
Principal Financial Group, Inc.
Notes to Consolidated Financial Statements — (continued)
1. Nature of Operations and Significant Accounting Policies — (continued)
Separate Accounts
The separate account assets and liabilities presented in the consolidated financial statements represent the fair market value of funds that are separately administered by us for contracts with equity, real estate and fixed-income investments. Generally, theThe separate account contract owner, rather than us, bears the investment risk of these funds. The separate account assets are legally segregated and are not subject to claims that arise out of any of our other business of ours.business. We receive a feefees for mortality, withdrawal, and expense risks, as well as administrative, maintenance and investment advisory services, that isare included in the consolidated statements of operations. Net deposits, net investment income and realized and unrealized capital gains and losses on the separate accounts are not reflected in the consolidated statements of operations.
At December 31, 20042006 and 2003,2005, the separate accounts include a separate account valued at $782.8$768.4 million and $833.9$726.6 million, respectively, which primarily includes shares of our stock that were allocated and issued to eligible participants of qualified employee benefit plans administered by us as part of the policy credits issued under our 2001 demutualization. These shares are included in both basic and diluted earnings per share calculations. The separate account shares are recorded at fair value and are reported as separate account assets and separate account liabilities in the consolidated statements of financial position. Changes in fair value of the separate account shares are reflected in both the separate account assets and separate account liabilities and doesdo not impact our results of operations.
Income Taxes
We file a U.S. consolidated income tax return that includes all of our qualifying subsidiaries. Our policy of allocating income tax expenses and benefits to companies in the group is generally based upon pro rata contribution of taxable income or operating losses. We are taxed at corporate rates on taxable income based on existing tax laws. Current income taxes are charged or credited to operations based upon amounts estimated to be payable or recoverable as a result of
taxable operations for the current year. Deferred income taxes are provided for the tax effect of temporary differences in the financial reporting and income tax bases of assets and liabilities and net operating losses using enacted income tax rates and laws. The effect on deferred income tax assets and deferred income tax liabilities of a change in tax rates is recognized in operations in the period in which the change is enacted.
Foreign Exchange
Assets and liabilities of our foreign subsidiaries and affiliates denominated in non-U.S. dollars are translated into U.S. dollar equivalents at the year-end spot foreign exchange rates. Resulting translation adjustments are reported as a component of stockholders' equity, along with any related hedge and tax effects. Revenues and expenses for these entities are translated at the weighted-average exchange rates for the year. Revenue, expense and other foreign currency transaction and translation adjustments for foreign subsidiaries and affiliates with the U.S. dollar as the functional currency that affect cash flows are reported in current operations, along with related hedge and tax effects.
Goodwill and Other Intangibles
Goodwill and other intangibles include the cost of acquired subsidiaries in excess of the fair value of the net tangible assets recorded in connection with acquisitions. Due to the adoption of SFAS 142,Goodwill and indefinite-lived intangible assets are not amortized. Rather, goodwill and indefinite-lived intangible assets are no longer amortized. Goodwill and indefinite-lived intangible assets not subject to amortization are tested for impairment at one level below our operating segments on an annual basis during the fourth quarter each year, or more frequently if events or changes in circumstances indicate that the asset might be impaired. Goodwill impairment testing involves a two-step process described further in the Recent Accounting Pronouncements section within Note 1. Impairment testing for indefinite-lived intangible assets consists of a comparison of the fair value of the intangible asset with its carrying value.
Intangible assets with a finite useful life continue to beare amortized on a straight-line basis generallyas related benefits emerge over a period of 51 to 30 years and are reviewed periodically for indicators of impairment in value. If facts and circumstances suggest possible impairment, the sum of the estimated undiscounted future cash flows expected to result from the use of the asset is compared to the current carrying value of the asset. If the undiscounted future cash flows are less than the carrying value, an impairment loss is recognized for the excess of the carrying amount of assets over their fair value.
Earnings Per Common Share
Basic earnings per common share is calculated by dividing income available to common stockholders by the weighted-average number of common shares outstanding for the period and excludes the dilutive effect of stock options.equity awards. Diluted earnings per common share reflects the potential dilution that could occur if dilutive securities, such as options and non-vested stock grants, were exercised or resulted in the issuance of common stock.
Principal Financial Group, Inc.
Notes to Consolidated Financial Statements — (continued)
1. Nature of Operations and Significant Accounting Policies — (continued)
Stock-Based Compensation
At December 31, 2004,2006, we have fourseveral stock-based compensation plans, which are described more fully in Note 20.20, Stock-Based Compensation Plans. We apply the fair value method to all stock-based awards granted subsequent to January 1, 2002. For stock-based awards granted prior to this date, we used the intrinsic value method.
Awards under our plans vest over periods ranging from one year to three years. Therefore, theThe cost related to stock-based compensation included in the determination of net income for 2002 through 2004 is less than that which would have been recognized if the fair value based method had been applied to all awards since the inception of our stock-based compensation plans. Had compensation expense for our stock option awards and employees' purchase rights been determined based upon fair values at the grant dates for awards under the plans in accordance with SFAS 123, our net
income and earnings per share would have been reduced to the pro forma amounts indicated below. For the purposes of pro forma disclosures, the estimated fair value of the options is amortized to expense over the options' vesting period.
| | For the year ended December 31, | ||||||||||
|---|---|---|---|---|---|---|---|---|---|---|---|
| | 2004 | 2003 | 2002 | ||||||||
| | (in millions, except per share data) | ||||||||||
| Net income, as reported | $ | 825.6 | $ | 746.3 | $ | 142.3 | |||||
| Add: Stock-based compensation expense included in reported net income, net of related tax effects | 29.2 | 20.1 | 11.8 | ||||||||
| Deduct: Total stock-based compensation expense determined under fair value based method for all awards, net of related tax effects | 32.3 | 23.4 | 15.1 | ||||||||
| Pro forma net income | $ | 822.5 | $ | 743.0 | $ | 139.0 | |||||
| Earnings per share: | |||||||||||
| Basic: | |||||||||||
| As reported | $ | 2.64 | $ | 2.29 | $ | 0.41 | |||||
| Pro forma | $ | 2.63 | $ | 2.28 | $ | 0.40 | |||||
| Diluted: | |||||||||||
| As reported | $ | 2.62 | $ | 2.28 | $ | 0.41 | |||||
| Pro forma | $ | 2.61 | $ | 2.27 | $ | 0.40 | |||||
| | For the year ended December 31, | ||||||||||
|---|---|---|---|---|---|---|---|---|---|---|---|
| | 2006 | 2005 | 2004 | ||||||||
| | (in millions, except per share data) | ||||||||||
| Net income available to common stockholders, as reported | $ | 1,031.3 | $ | 901.3 | $ | 825.6 | |||||
| Add: Stock-based compensation expense included in reported net income, net of related tax effects | 42.1 | 33.1 | 29.2 | ||||||||
| Deduct: Total stock-based compensation expense determined under fair value based method for all awards, net of related tax effects | 42.1 | 33.1 | 32.3 | ||||||||
| Pro forma net income available to common stockholders | $ | 1,031.3 | $ | 901.3 | $ | 822.5 | |||||
| Earnings per common share | |||||||||||
| Basic earnings per common share: | |||||||||||
| As reported | $ | 3.78 | $ | 3.13 | $ | 2.64 | |||||
| Pro forma | $ | 3.78 | $ | 3.13 | $ | 2.63 | |||||
| Diluted earnings per common share: | |||||||||||
| As reported | $ | 3.74 | $ | 3.11 | $ | 2.62 | |||||
| Pro forma | $ | 3.74 | $ | 3.11 | $ | 2.61 | |||||
Reclassifications
Reclassifications have been made to the 20032005 and 20022004 consolidated financial statements to conform to the 20042006 presentation.
2. Goodwill and Other Intangible AssetsAcquisition
Amortized intangible assets were as follows:On December 31, 2006, we completed the purchase of WM Advisors, Inc., a leading mutual fund manager, for a total cost of $741.1 million in cash, subject to closing adjustments. The acquisition represents a strategic fit for us by adding scale to one of our key asset accumulation businesses, further strengthening our global asset management capability and increasing our presence with independent financial advisors.
| | December 31, 2004 | December 31, 2003 | ||||||||||||||||
|---|---|---|---|---|---|---|---|---|---|---|---|---|---|---|---|---|---|---|
| | Gross carrying amount | Accumulated amortization | Net carrying amount | Gross carrying amount | Accumulated amortization | Net carrying amount | ||||||||||||
| | (in millions) | |||||||||||||||||
| Value of insurance in force acquired | $ | 118.3 | $ | 29.9 | $ | 88.4 | $ | 116.6 | $ | 22.9 | $ | 93.7 | ||||||
| Other | 116.3 | 10.0 | 106.3 | 29.4 | 3.9 | 25.5 | ||||||||||||
| Total amortized intangibles | $ | 234.6 | $ | 39.9 | $ | 194.7 | $ | 146.0 | $ | 26.8 | $ | 119.2 | ||||||
Principal Financial Group, Inc.
Notes to Consolidated Financial Statements — (continued)
2. Acquisition — (continued)
Unamortized intangibleA summary of the fair values of the net assets wereacquired as follows:
| | December 31, | |||||
|---|---|---|---|---|---|---|
| | 2004 | 2003 | ||||
| | Net carrying amount | Net carrying amount | ||||
| | (in millions) | |||||
| Other indefinite-lived intangible assets | $ | 1.8 | $ | 1.8 | ||
The amortization expense for intangible assets with finite useful lives was $12.2 million, $16.5 million and $2.6 million for 2004, 2003 and 2002, respectively. Atof December 31, 2004,2006, based upon the estimated amortization expense for the next five yearscurrent valuation estimates, is as follows (in millions):
| Year ending December 31: | |||
| 2005 | $ | 10.7 | |
| 2006 | 10.4 | ||
| 2007 | 10.3 | ||
| 2008 | 9.9 | ||
| 2009 | 9.9 |
| Assets | |||||
| Cash and cash equivalents | $ | 9.1 | |||
| Premiums due and other receivables | 26.0 | ||||
| Property, plant, and equipment | 0.4 | ||||
| Goodwill | 62.7 | ||||
| Other intangibles | 751.9 | ||||
| Other assets | 0.5 | ||||
| Total assets acquired | 850.6 | ||||
| Liabilities | |||||
| Long-term debt | 86.9 | ||||
| Other liabilities | 22.6 | ||||
| Total liabilities assumed | 109.5 | ||||
| Net assets acquired | $ | 741.1 | |||
Of the $751.9 million of acquired intangible assets, $608.0 million was assigned to investment management contracts that are not subject to amortization. The remainder of the acquired intangibles will be subject to amortization and consist of: $86.9 million of customer-based intangibles (eight-year useful life); $51.0 million of asset management contracts (three-year useful life); $5.0 million ascribed to the distribution channel (18-year useful life); and $1.0 million ascribed to non-compete agreements (one-year useful life).
Consistent with the acquired intangibles, the $62.7 million of goodwill was assigned to the U.S. Asset Management and Accumulation segment and will be deductible for tax purposes. The allocation of the purchase price is preliminary and could change when final information becomes available.
The changes infollowing (unaudited) pro forma consolidated results of operations have been prepared as if the carrying amountacquisition of goodwill reported in our operating segmentsWM Advisors, Inc., had occurred as of January 1, 2004:
| | For the year ended December 31, | ||||||||
|---|---|---|---|---|---|---|---|---|---|
| | 2006 | 2005 | 2004 | ||||||
| | (in millions, except per share data) | ||||||||
| Total revenues | $ | 10,148.2 | $ | 9,353.6 | $ | 8,541.9 | |||
| Net income | 1,092.5 | 947.6 | 849.1 | ||||||
| Basic earnings per common share | 3.88 | 3.23 | 2.71 | ||||||
| Diluted earnings per common share | 3.85 | 3.21 | 2.70 | ||||||
The pro forma information is presented for 2003informational purposes only and 2004 wereis not necessarily indicative of the results of operations that actually would have been achieved had the acquisition been consummated as follows:of that time, nor is it intended to be a projection of future results.
| | U.S. Asset Management and Accumulation | International Asset Management and Accumulation | Life and Health Insurance | Consolidated | |||||||||
|---|---|---|---|---|---|---|---|---|---|---|---|---|---|
| | (in millions) | ||||||||||||
| Balances at January 1, 2003 | $ | 23.2 | $ | 30.8 | $ | 44.1 | $ | 98.1 | |||||
| Goodwill from acquisitions | 30.5 | 15.7 | 25.1 | 71.3 | |||||||||
| Foreign currency translation | — | 6.4 | — | 6.4 | |||||||||
| Balances at December 31, 2003 | 53.7 | 52.9 | 69.2 | 175.8 | |||||||||
| Goodwill from acquisitions | 38.1 | 4.4 | 19.3 | 61.8 | |||||||||
| Goodwill disposed of during the year | — | (7.5 | ) | — | (7.5 | ) | |||||||
| Foreign currency translation | — | 2.8 | — | 2.8 | |||||||||
| Balances at December 31, 2004 | $ | 91.8 | $ | 52.6 | $ | 88.5 | $ | 232.9 | |||||
3. Discontinued Operations
Real Estate Investments
In 2005 and 2006, we sold certain real estate properties previously held for investment purposes. These properties qualify for discontinued operations treatment. Therefore, the income from discontinued operations has been removed from our results of continuing operations for all periods presented. The gains on disposal are reported as other after-tax adjustments in our Corporate and Other segment. All assets, including cash, and liabilities of the discontinued operations have been reclassified to separate discontinued asset and liability line items on the consolidated statements of financial position. We have separately disclosed the operating, investing and financing portions of the cash flows attributable to our discontinued operations in our consolidated statements of cash flows. Additionally, the information included in the notes to the financial statements excludes information applicable to these properties, unless otherwise noted.
Principal Financial Group, Inc.
Notes to Consolidated Financial Statements — (continued)
3. Discontinued Operations — (continued)
The properties were sold to take advantage of positive real estate market conditions in specific geographic locations and to further diversify our real estate portfolio.
Selected financial information for the discontinued operations is as follows:
| | December 31, | ||||||
|---|---|---|---|---|---|---|---|
| | 2006 | 2005 | |||||
| | (in millions) | ||||||
| Assets | |||||||
| Real estate | $ | — | $ | 99.3 | |||
| All other assets | — | 3.9 | |||||
| Total assets | $ | — | $ | 103.2 | |||
| Liabilities | |||||||
| All other liabilities | $ | — | $ | 4.5 | |||
| Total liabilities | $ | — | $ | 4.5 | |||
| | For the year ended December 31, | |||||||||
|---|---|---|---|---|---|---|---|---|---|---|
| | 2006 | 2005 | 2004 | |||||||
| | (in millions) | |||||||||
| Total revenues | $ | (0.5 | ) | $ | 2.8 | $ | 2.5 | |||
| Income from discontinued operations: | ||||||||||
| Income (loss) before income taxes | $ | (0.5 | ) | $ | 2.8 | $ | 2.5 | |||
| Income taxes (benefits) | (0.2 | ) | 1.0 | 0.9 | ||||||
| Gain on disposal of discontinued operations | 47.5 | 34.3 | — | |||||||
| Income taxes on disposal | 16.6 | 12.0 | — | |||||||
| Net income | $ | 30.6 | $ | 24.1 | $ | 1.6 | ||||
Principal International Argentina S.A.
On July 2, 2004, we closed the sale of Principal International Argentina S.A. ("PI Argentina"), our subsidiary in Argentina, and its wholly owned subsidiaries, Principal Life Compañía de Seguros, S.A. and Principal Retiro Compañía de Seguros de Retiro, S.A. Our total after-tax proceeds from the sale were approximately U.S. $29.2 million.
The decision to sell PI Argentina was made with a view toward focusing our resources, executing in core strategic priorities and markets and meeting stockholders expectations. Changing market dynamics since the 2001 economic crisis in Argentina led us to conclude that the interests of Principal Financial Group, Inc.'sour stockholders would best be served by our exit of this market.
PI Argentina qualifiesqualified for discontinued operations treatment, under SFAS 144, therefore, the results ofincome from discontinued operations havehas been removed from our results of continuing operations cash flows and segment operating earnings for all periods presented.presented in our International Asset Management and Accumulation segment. We have separately disclosed the operating, investing and financing portions of the cash flows attributable to our discontinued operations in our consolidated statements of cash flows. Additionally, the information included in the notes to the financial statements excludes information applicable to PI Argentina, unless otherwise noted.
Principal Financial Group, Inc.
Notes to Consolidated Financial Statements — (continued)
3. Discontinued Operations — (continued)
Selected financial information for the discontinued operations of PI Argentina is as follows:
| | December 31, | ||||||
|---|---|---|---|---|---|---|---|
| | 2004 | 2003 | |||||
| | (in millions) | ||||||
| Assets | |||||||
| Total investments | $ | — | $ | 31.3 | |||
| All other assets | — | 10.9 | |||||
| Total assets | $ | — | $ | 42.2 | |||
| Liabilities | |||||||
| Policyholder liabilities | $ | — | $ | 31.1 | |||
| All other liabilities | — | 2.1 | |||||
| Total liabilities | $ | — | $ | 33.2 | |||
| | For the year ended December 31, | |||||||||
|---|---|---|---|---|---|---|---|---|---|---|
| | 2004 | 2003 | 2002 | |||||||
| | (in millions) | |||||||||
| Total revenues | $ | 5.8 | $ | 10.1 | $ | 28.5 | ||||
| Income (loss) from discontinued operations: | ||||||||||
| Income (loss) before income taxes | $ | 0.3 | $ | (1.7 | ) | $ | 5.6 | |||
| Income taxes | 0.1 | 0.2 | 1.9 | |||||||
| Income (loss) from discontinued operations, net of related income taxes(1) | 0.2 | (1.9 | ) | 3.7 | ||||||
| Income on disposal of discontinued operations, net of related income taxes | 9.8 | — | — | |||||||
| Net income (loss) | $ | 10.0 | $ | (1.9 | ) | $ | 3.7 | |||
| | For the year ended December 31, | ||||||||||
|---|---|---|---|---|---|---|---|---|---|---|---|
| | 2006 | 2005 | 2004 | ||||||||
| | (in millions) | ||||||||||
| Total revenues | $ | — | $ | — | $ | 5.8 | |||||
| Income from discontinued operations: | |||||||||||
| Income before income taxes(1) | $ | — | $ | — | $ | 0.3 | |||||
| Income taxes(1) | — | — | 0.1 | ||||||||
| Loss on disposal of discontinued operations | — | — | (15.9 | ) | |||||||
| Income tax benefits on disposal | — | — | (25.7 | ) | |||||||
| Net income | $ | — | $ | — | $ | 10.0 | |||||
- (1)
- The 2004 summary results of operations information is for the six months ended prior to the July 2, 2004, sale of PI Argentina and, accordingly, there is no statement of operations data to present subsequent to the date of the sale.
Principal Residential Mortgage, Inc.
On July 1, 2004, we closed the sale of Principal Residential Mortgage, Inc. to CitiMortgage, Inc. Our total after-tax proceeds from the sale were approximately U.S. $620.0 million. Our Mortgage Banking segment, which included Principal Residential Mortgage, Inc., is accounted for as a discontinued operation, under SFAS 144 and therefore, the results ofincome from discontinued operations (excluding corporate overhead) havehas been removed from our results of continuing operations cash flows and segment operating earnings for all periods presented. We have separately disclosed the operating, investing and financing portions of the cash flows attributable to our discontinued operations in our consolidated statements of cash flows. Corporate overhead allocated to our Mortgage Banking segment does not qualify for discontinued operations treatment under SFAS 144 and is included in our results of continuing operations and segment operating earnings for all periods prior to July 1, 2004. Additionally, the information included in the notes to the financial statements excludes information applicable to Principal Residential Mortgage, Inc., unless otherwise noted.
The decision to sell Principal Residential Mortgage, Inc. was made with a view toward intensifying our strategic focus on our core retirement and risk protection business as well as achieving our longer-term financial objectives. In addition, the sale was also viewed as a positive move for our stockholders as we goit enabled us to move forward from an improved capital position, with better financial flexibility and greater stability of earnings.
Principal Financial Group, Inc.
Notes to Consolidated Financial Statements — (continued)
3. Discontinued Operations — (continued)
Selected financial information for the discontinued operations of our Mortgage Banking segment is as follows:
| | December 31, | ||||||
|---|---|---|---|---|---|---|---|
| | 2004 | 2003 | |||||
| | (in millions) | ||||||
| Assets | |||||||
| Mortgage loans | $ | — | $ | 2,256.5 | |||
| Mortgage loan servicing rights | — | 1,951.9 | |||||
| Cash and cash equivalents | — | 674.6 | |||||
| All other assets | — | 675.8 | |||||
| Total assets | $ | — | $ | 5,558.8 | |||
| Liabilities | |||||||
| Short-term debt | $ | — | $ | 1,450.9 | |||
| Long-term debt | — | 1,393.0 | |||||
| All other liabilities | — | 2,242.8 | |||||
| Total liabilities | $ | — | $ | 5,086.7 | |||
| | For the year ended December 31, | ||||||||||
|---|---|---|---|---|---|---|---|---|---|---|---|
| | 2004 | 2003 | 2002 | ||||||||
| | (in millions) | ||||||||||
| Total revenues | $ | 446.1 | $ | 1,396.8 | $ | 1,153.0 | |||||
| Loss from continuing operations, net of related income taxes (represents corporate overhead) | $ | (10.3 | ) | $ | (18.1 | ) | $ | (16.7 | ) | ||
| Income from discontinued operations: | |||||||||||
| Income before income taxes | 48.3 | 113.6 | 271.8 | ||||||||
| Income taxes | 18.3 | 42.3 | 112.2 | ||||||||
| Income from discontinued operations(1) | 30.0 | 71.3 | 159.6 | ||||||||
| Income on disposal of discontinued operations, net of related income taxes | 92.3 | — | — | ||||||||
| Cumulative effect of accounting change, net of related income taxes | — | (10.0 | ) | — | |||||||
| Net income | $ | 112.0 | $ | 43.2 | $ | 142.9 | |||||
| | For the year ended December 31, | ||||||||||
|---|---|---|---|---|---|---|---|---|---|---|---|
| | 2006 | 2005 | 2004 | ||||||||
| | (in millions) | ||||||||||
| Total revenues | $ | — | $ | — | $ | 446.1 | |||||
| Loss from continuing operations, net of related income taxes (represents corporate overhead) | $ | — | $ | — | $ | (10.3 | ) | ||||
| Income from discontinued operations | |||||||||||
| Income before income taxes(1) | — | — | 48.3 | ||||||||
| Income taxes(1) | — | — | 18.3 | ||||||||
| Gain (loss) on disposal of discontinued operations | — | (1.7 | ) | 134.7 | |||||||
| Income taxes on disposal | — | 3.3 | 42.4 | ||||||||
| Income (loss) from discontinued operations, net of related income taxes | — | (5.0 | ) | 122.3 | |||||||
| Net income (loss) | $ | — | $ | (5.0 | ) | $ | 112.0 | ||||
- (1)
- The 2004 summary results of operations information is for the six months ended prior to the July 1, 2004, sale of Principal Residential Mortgage, Inc. and, accordingly, there is no statement of operations data to present subsequent to the date of the sale.
Our U.S. Asset Management and Accumulation segment held $804.8 million of residential mortgage banking escrow deposits (reported as other liabilities) as of December 31, 2003. The purchaser (or acquirer) closed out the banking escrow deposit accounts as a result of the sale. U.S. Asset Management and Accumulation total revenues from this arrangement reclassified to discontinued operations for the yearsyear ended December 31, 2004 2003 and 2002 werewas $(5.6) million, $28.6 million and $30.5 million, respectively. Income (loss)million. Loss from discontinued operations net of related income taxes, for the yearsyear ended December 31, 2004 2003 and 2002 were $(3.5) million, $11.2 million and $10.2 million, respectively.was $3.5 million.
BT Financial Group
On October 31, 2002, we sold substantially all of BT Financial Group to Westpac Banking Corporation ("Westpac"). As of December 31, 2004, we have received proceeds of A$958.9 million Australian dollars ("A$") (U.S. $537.4 million) from Westpac. Our total after-tax proceeds from the sale were approximately U.S. $890.0$900.0 million. This amount includes cash proceeds from Westpac, expected tax benefits and a gain from unwinding the hedged asset associated with our investment in BT Financial Group.
The decision to sell BT Financial Group was made with a view toward focusing our resources, executing on core strategic priorities and meeting stockholder expectations. Changing market dynamics since our acquisition of BT Financial Group, including industry consolidation, led us to conclude that the interests of BT Financial Group clients and staff would be best served under Westpac's ownership.
BTChanges to the loss on discontinued operations due to the close of a tax audit resulted in an increase to net income of $8.4 million in 2005. We have separately disclosed the operating, investing and financing portions of the cash flows attributable to our discontinued operations in our consolidated statements of cash flows.
Principal Financial Group, is accounted for as a discontinued operationInc.
Notes to Consolidated Financial Statements — (continued)
4. Goodwill and therefore,Other Intangible Assets
The changes in the resultscarrying amount of operations (excluding corporate overhead) have been removed from our results of continuing operations, cash flows and segment operating earnings for all periods presented. Corporate overhead allocated to BT Financial Group does not qualify for discontinued operations treatment under SFAS 144, and therefore is still includedgoodwill reported in our results of continuing operationsoperating segments for 2005 and segment operating earnings2006 were as follows:
| | U.S. Asset Management and Accumulation | International Asset Management and Accumulation | Life and Health Insurance | Corporate and Other | Consolidated | |||||||||||
|---|---|---|---|---|---|---|---|---|---|---|---|---|---|---|---|---|
| | (in millions) | |||||||||||||||
| Balances at January 1, 2005 | $ | 91.8 | $ | 52.6 | $ | 88.5 | $ | — | $ | 232.9 | ||||||
| Goodwill from acquisitions | 46.5 | — | — | — | 46.5 | |||||||||||
| Foreign currency translation | — | 2.9 | — | — | 2.9 | |||||||||||
| Other | — | — | (0.1 | ) | 0.1 | — | ||||||||||
| Balances at December 31, 2005 | 138.3 | 55.5 | 88.4 | 0.1 | 282.3 | |||||||||||
| Goodwill from acquisitions | 81.2 | — | — | — | 81.2 | |||||||||||
| Foreign currency translation | — | (1.6 | ) | — | — | (1.6 | ) | |||||||||
| Balances at December 31, 2006 | $ | 219.5 | $ | 53.9 | $ | 88.4 | $ | 0.1 | $ | 361.9 | ||||||
Amortized intangible assets were as follows:
| | December 31, | |||||||||||||||||
|---|---|---|---|---|---|---|---|---|---|---|---|---|---|---|---|---|---|---|
| | 2006 | 2005 | ||||||||||||||||
| | Gross carrying amount | Accumulated amortization | Net carrying amount | Gross carrying amount | Accumulated amortization | Net carrying amount | ||||||||||||
| | (in millions) | |||||||||||||||||
| Present value of future profits | $ | 172.8 | $ | 66.1 | $ | 106.7 | $ | 125.1 | $ | 41.3 | $ | 83.8 | ||||||
| Other | 288.7 | 26.4 | 262.3 | 131.8 | 16.9 | 114.9 | ||||||||||||
| Total amortized intangibles | $ | 461.5 | $ | 92.5 | $ | 369.0 | $ | 256.9 | $ | 58.2 | $ | 198.7 | ||||||
The amortization expense for all periods prior to Octoberintangible assets with finite useful lives was $22.6 million, $17.5 million and $12.2 million for 2006, 2005 and 2004, respectively. At December 31, 2002. Additionally,2006, the information included in the notes to the financial statements excludes information applicable to BT Financial Group, unless otherwise noted.
Selected financial informationestimated amortization expense for the discontinued operationsnext five years is as follows:follows (in millions):
| | For the year ended December 31, | ||||||||||
|---|---|---|---|---|---|---|---|---|---|---|---|
| | 2004 | 2003 | 2002 | ||||||||
| | (in millions) | ||||||||||
| Total revenues | $ | — | $ | — | $ | 139.7 | |||||
| Loss from continuing operations, net of related income taxes (represents corporate overhead) | $ | — | $ | — | $ | (2.6 | ) | ||||
| Income (loss) from discontinued operations: | |||||||||||
| Income before income taxes | — | — | 17.7 | ||||||||
| Income taxes | — | — | 5.7 | ||||||||
| Income from discontinued operations(1) | — | — | 12.0 | ||||||||
| Income (loss) on disposal, net of related income taxes(2) | — | 21.8 | (208.7 | ) | |||||||
| Income (loss) from discontinued operations, net of related income taxes | — | 21.8 | (196.7 | ) | |||||||
| Cumulative effect of accounting change, net of related income taxes | — | — | (255.4 | ) | |||||||
| Net income (loss) | $ | — | $ | 21.8 | $ | (454.7 | ) | ||||
| Year ending December 31: | ||||
| 2007 | $ | 33.7 | ||
| 2008 | 31.0 | |||
| 2009 | 30.9 | |||
| 2010 | 13.9 | |||
| 2011 | 13.6 | |||
(1)The 2002 summary resultsPresent value of
operations information is forfuture profits ("PVFP") represents the10 months ended October 31, 2002,present value of estimated future profits to be generated from existing insurance contracts in-force at the date ofsale of BTacquisition and is amortized over the expected policy or contract duration. Interest rates used to calculate the estimated interest accruals were 9.00% for all years related to PVFP generated from Mexico acquisitions and 6.43% declining to 6.36% in 2006, 6.51% declining to 6.43% in 2005 and 6.51% for 2004, related to PVFP generated from Chile acquisitions.Principal Financial Group, Inc.
Notes to Consolidated Financial Statements — (continued)
4. Goodwill and
accordingly, thereOther Intangible Assets — (continued)The changes in the carrying amount of present value of future profits reported in our operating segments for 2004, 2005 and 2006 were as follows (in millions):
International
Asset Management
and AccumulationBalance at January 1, 2004 $ 93.7 Interest accrued 7.7 Amortization (13.8 ) Foreign currency translation 0.8 Balance at December 31, 2004 88.4 Interest accrued 7.8 Amortization (14.7 ) Impairments (2.3 ) Foreign currency translation 4.3 Other 0.3 Balance at December 31, 2005 83.8 Interest accrued 7.3 Amortization (18.4 ) Impairments (2.0 ) Foreign currency translation (1.5 ) Other 37.5 Balance at December 31, 2006 $ 106.7 At December 31, 2006, the estimated amortization expense related to PVFP for the next five years is
no statementas follows (in millions):Year ending December 31: 2007 $ 6.5 2008 4.8 2009 4.6 2010 4.5 2011 4.7 The net carrying amount of
operations data to present for 2003 or 2004.(2)Net of related income tax benefits of $14.6unamortized indefinite-lived intangible assets were $612.0 million and$89.6$3.9 millionin 2003as of December 31, 2006 and2002,2005, respectively.
4. Other Divestitures
On February 1, 2002, Due to the December 31, 2006, acquisition of WM Advisors, Inc., we sold our remainingassigned $608.0 million to investment of 15.1 million shares in Coventry Health Care, Inc. common stock and a warrant, exercisable for 3.1 million shares of Coventry Health Care, Inc. common stock. Total proceeds from the completion of this transaction were $325.4 million, which resulted in a realized capital gain of $114.5 million, net of income tax.management contracts that are not subject to amortization. See Note 2, Acquisitions.
5. Variable Interest Entities
We have relationships with various types of special purpose entities and other entities where we have a variable interest. The following serves as a discussion of investments in entities that meet the definition of a VIE under FASB Interpretation No. 46 (Revised 2003):Consolidation of Variable Interest Entities ("FIN 46R").VIE.
Consolidated Variable Interest Entities
Synthetic Collateralized Debt Obligation. On May 26, 2005, we invested $130.0 million in a secured limited recourse credit linked note issued by a grantor trust. The trust entered into a credit default swap providing credit protection on the first 45% of loss of seven mezzanine tranches totaling $288.9 million of seven synthetic reference portfolios. Our risk of loss for the seven referenced mezzanine tranches begins at 4.85% and ends at 10.85% of loss on each of the seven synthetic reference portfolios. Therefore, defaults in an underlying reference portfolio will only affect the credit-linked note if cumulative losses exceed 4.85% of a synthetic reference portfolio.
We have determined that this grantor trust is a variable interest entity and that we are the primary beneficiary of the trust due to our interest in the variable interest entity and management of the synthetic reference portfolios. Upon consolidation of the trust, as of December 31, 2006 and 2005, our consolidated statements of financial position include $130.3 million and $130.0 million, respectively, of available-for-sale fixed maturity securities, which represent the collateral held by the trust. As of December 31, 2006 and 2005, the credit default swap entered into by the trust has an outstanding notional amount of $130.0 million. During the years ended December 31, 2006 and 2005, the credit default swaps had a change in fair value that resulted in a $4.4 million pre-tax gain and a $0.4 million pre-tax loss, respectively. The creditors of the grantor trusts have no recourse to our assets.
Principal Financial Group, Inc.
Notes to Consolidated Financial Statements — (continued)
5. Variable Interest Entities — (continued)
Grantor Trusts. We contributed undated subordinated floating rate notes to three grantor trusts. The trusts separated the cash flows of the underlying notes by issuing an interest-only certificate and a residual certificate related to each note contributed. Each interest-only certificate entitles the holder to interest on the stated note for a specified term while the residual certificate entitles the holder to interest payments subsequent to the term of the interest-only certificate and to all principal payments. We retained the interest-only certificate and the residual certificates were subsequently sold to a third party.
We have determined that these grantor trusts are VIEs as in the event of a default or prepayment on the underlying notes, which is the main risk of loss, our interest-only certificates are exposed to the majority of the risk of loss. The restricted interest periods end between 2016 and 2020 and, at that time, the residual certificate holders' certificates are redeemed by the trust in return for the notes. We have determined that it will be necessary for us to consolidate these entities until the expiration of the interest-only period. As of December 31, 20042006 and 2003,2005, our consolidated statements of financial position include $369.8$366.2 million and $351.8$364.1 million, respectively, of undated subordinated floating rate notes of the grantor trusts, which are classified as available-for-sale fixed maturity securities.securities and represent the collateral held by the trust. The obligation to deliver the underlying securities to the residual certificate holders of $138.1million$156.8 million and $103.9$147.4 million as of December 31, 20042006 and 2003,2005, respectively, is classified as an other liability and contains an embedded derivative of the forecasted transaction to deliver the underlying securities. The creditors of the grantor trusts have no recourse to the assets of our company.assets.
Other. In addition to the entities above, we have a number of relationships with a disparate group of entities, which meet the FIN 46R criteria for VIEs. Due to the nature of our direct investment in the equity and/or debt of these VIEs, we are the primary beneficiary of such entities, which requires us to consolidate them. These entities include threeseven private investment trusts, a financial services companies,company and a private investment trust and two real estate joint ventures.hedge fund. The consolidation of these VIEs did not have a material effect on either our consolidated statement of financial position as of December 31, 2006 or 2005, or results of operations as of and for the years ended December 31, 20042006, 2005 and 2003.2004. For the majority of these entities, the creditors have no recourse to the assets of our company.assets.
The carrying amount and classification of consolidated VIE assets that are collateral the VIEs have designated for their own obligations and the VIEs' obligationsdebt of the VIEs are as follows:
| | | December 31, | | December 31, | ||||||||||
|---|---|---|---|---|---|---|---|---|---|---|---|---|---|---|
| | | 2004 | 2003 | | 2006 | 2005 | ||||||||
| | | (in millions) | | (in millions) | ||||||||||
| Fixed maturity securities, available-for-sale | Fixed maturity securities, available-for-sale | $ | 56.9 | $ | 55.3 | Fixed maturity securities, available-for-sale | $ | 178.0 | $ | 88.3 | ||||
| Fixed maturity securities, trading | Fixed maturity securities, trading | 14.0 | — | |||||||||||
| Equity securities, available-for-sale | Equity securities, available-for-sale | 16.9 | 15.5 | Equity securities, available-for-sale | — | 39.6 | ||||||||
| Equity securities, trading | Equity securities, trading | 59.5 | — | |||||||||||
| Real estate | Real estate | 62.3 | 53.9 | Real estate | — | 12.4 | ||||||||
| Cash and other assets | Cash and other assets | 55.2 | 0.3 | Cash and other assets | 83.2 | 71.6 | ||||||||
| Total assets pledged as collateral | $ | 191.3 | $ | 125.0 | Total assets pledged as collateral | $ | 334.7 | $ | 211.9 | |||||
| Long-term debt | Long-term debt | $ | 72.1 | $ | 65.0 | Long-term debt | $ | 206.4 | $ | 123.9 | ||||
As of December 31, 2004, $191.32006 and 2005, $334.7 million and $211.9 million, respectively, of assets arewere pledged as collateral for the VIE entities' other obligationsobligations. Additionally, as of December 31, 2006 and 2005, these entities had long-term debt of $186.8$206.4 million and $123.9 million, respectively, of which $114.7$206.4 million and $110.6 million, respectively, was issued by these VIE entities to affiliates and, therefore, eliminated upon consolidation.
As of December 31, 2003, $125.0 million of assets are pledged as collateral for the VIE entities' long-term debt of $124.5 million, of which $59.5 million was issued by these VIE entities toour affiliates and, therefore, eliminated upon consolidation.
Significant Unconsolidated Variable Interest Entities
We hold a significant variable interest in a number of VIEs where we are not the primary beneficiary. These entities include private investment trusts and custodial relationships that have issued trust certificates or custodial receipts that are recorded as available-for-sale fixed maturity securities in the consolidated financial statements.
Principal Financial Group, Inc.
Notes to Consolidated Financial Statements — (continued)
5. Variable Interest Entities — (continued)
On June 21, 2006, we invested $285.0 million in a secured limited recourse note issued by a segregated portfolio company. The note represents Class B notes. Class A notes are senior and Class C through Class F notes are subordinated to Class B notes. The entity entered into a credit default swap with a third party providing credit protection in exchange for a fee. Defaults in an underlying reference portfolio will only affect the note if cumulative losses of a synthetic reference portfolio exceed the loss attachment point on the portfolio. We have determined we are not the primary beneficiary, as we do not hold the majority of the risk of loss. Our maximum exposure to loss as a result of our involvement with this entity is our recorded investment of $285.3 million as of December 31, 2006.
Between October 3, 1996 and September 21, 2001, we entered into seven separate but similar transactions where various third parties transferred funds to either a custodial account or a trust. The custodians or trusts purchased shares of specific money market funds and then separated the cash flows of the money market shares into share receipts and dividend receipts. The dividend receipts entitle the holder to dividends paid for a specified term while the share receipts, purchased at a discount, entitle the holder to dividend payments subsequent to the term of the dividend receipts and the rights to the underlying shares. We have purchased the share receipts. After the restricted dividend period ends between 2017 and 2021, we, as the share receipt holder, have the right to terminate the custodial account or trust agreement and will receive the underlying money market fund shares. Upon adoption of FIN 46R, weWe determined the primary beneficiary is the dividend receipt holder, which has the majority of the risk of loss. Our maximum exposure to loss as a result of our involvement with these entities is our recorded investment of $203.1$235.7 million and $180.8$224.5 million as of December 31, 20042006 and 2003,2005, respectively.
On June 20, 1997, we entered into a transaction in which we purchased a residual trust certificate. The trust separated the cash flows of an underlying security into an interest-only certificate that entitles the third party certificate holder to the stated interest on the underlying security through May 15, 2017, and into a residual certificate entitling the holder to interest payments subsequent to the term of the interest-only certificates and any principal payments. Subsequent to the restricted interest period, we, as the residual certificate holder, have the right to terminate the trust agreement and will receive the underlying security. Upon adoption of FIN 46R, weWe determined the primary beneficiary is the interest-only certificate holder, which has the majority of the risk of loss. Our maximum exposure to loss as a result of our involvement with this entity is our recorded investment of $68.9$78.7 million and $56.2$77.0 million as of December 31, 20042006 and 2003,2005, respectively.
Principal Financial Group, Inc.
Notes to Consolidated Financial Statements — (continued)
6. Investments
Fixed Maturities and Equity Securities
The cost, gross unrealized gains and losses and fair value of fixed maturities and equity securities available-for-sale as of December 31, 20042006 and 2003,2005, are summarized as follows:
| | Cost | Gross unrealized gains | Gross unrealized losses | Fair value | |||||||||
|---|---|---|---|---|---|---|---|---|---|---|---|---|---|
| | (in millions) | ||||||||||||
| December 31, 2004 | |||||||||||||
| Fixed maturities, available-for-sale: | |||||||||||||
| U.S. government and agencies | $ | 271.7 | $ | 6.3 | $ | 0.6 | $ | 277.4 | |||||
| Non-U.S. governments | 777.2 | 93.6 | 2.3 | 868.5 | |||||||||
| States and political subdivisions | 894.1 | 53.6 | 0.7 | 947.0 | |||||||||
| Corporate — public | 19,252.4 | 1,408.9 | 33.9 | 20,627.4 | |||||||||
| Corporate — private | 9,935.2 | 649.4 | 35.2 | 10,549.4 | |||||||||
| Mortgage-backed and other asset-backed securities | 7,288.7 | 381.6 | 23.7 | 7,646.6 | |||||||||
| Total fixed maturities, available-for-sale | $ | 38,419.3 | $ | 2,593.4 | $ | 96.4 | $ | 40,916.3 | |||||
| Total equity securities, available-for-sale | $ | 748.4 | $ | 25.3 | $ | 11.1 | $ | 762.6 | |||||
| December 31, 2003 | |||||||||||||
| Fixed maturities, available-for-sale: | |||||||||||||
| U.S. government and agencies | $ | 599.3 | $ | 12.9 | $ | 1.0 | $ | 611.2 | |||||
| Non-U.S. governments | 623.1 | 116.9 | 0.1 | 739.9 | |||||||||
| States and political subdivisions | 498.7 | 40.5 | 2.2 | 537.0 | |||||||||
| Corporate — public | 17,296.4 | 1,371.8 | 33.0 | 18,635.2 | |||||||||
| Corporate — private | 9,251.9 | 618.7 | 96.5 | 9,774.1 | |||||||||
| Mortgage-backed and other asset-backed securities | 6,795.8 | 347.4 | 22.2 | 7,121.0 | |||||||||
| Total fixed maturities, available-for-sale | $ | 35,065.2 | $ | 2,508.2 | $ | 155.0 | $ | 37,418.4 | |||||
| Total equity securities, available-for-sale | $ | 678.7 | $ | 26.5 | $ | 6.0 | $ | 699.2 | |||||
| | Cost | Gross unrealized gains | Gross unrealized losses | Fair value | |||||||||
|---|---|---|---|---|---|---|---|---|---|---|---|---|---|
| | (in millions) | ||||||||||||
| December 31, 2006 | |||||||||||||
| Fixed maturities, available-for-sale: | |||||||||||||
| U.S. government and agencies | $ | 530.8 | $ | 0.8 | $ | 3.8 | $ | 527.8 | |||||
| Non-U.S. governments | 766.0 | 135.0 | 0.4 | 900.6 | |||||||||
| States and political subdivisions | 1,557.7 | 45.4 | 4.9 | 1,598.2 | |||||||||
| Corporate — public | 20,742.1 | 852.1 | 145.9 | 21,448.3 | |||||||||
| Corporate — private | 10,287.9 | 373.9 | 75.7 | 10,586.1 | |||||||||
| Mortgage-backed and other asset-backed securities | 9,199.1 | 221.2 | 77.8 | 9,342.5 | |||||||||
| Total fixed maturities, available-for-sale | $ | 43,083.6 | $ | 1,628.4 | $ | 308.5 | $ | 44,403.5 | |||||
| Total equity securities, available-for-sale | $ | 657.7 | $ | 13.5 | $ | 4.6 | $ | 666.6 | |||||
| December 31, 2005 | |||||||||||||
| Fixed maturities, available-for-sale: | |||||||||||||
| U.S. government and agencies | $ | 557.9 | $ | 1.8 | $ | 4.2 | $ | 555.5 | |||||
| Non-U.S. governments | 804.6 | 110.8 | 0.8 | 914.6 | |||||||||
| States and political subdivisions | 1,222.6 | 45.7 | 3.8 | 1,264.5 | |||||||||
| Corporate — public | 20,297.3 | 1,014.3 | 117.1 | 21,194.5 | |||||||||
| Corporate — private | 9,470.1 | 484.3 | 52.3 | 9,902.1 | |||||||||
| Mortgage-backed and other asset-backed securities | 8,093.3 | 270.7 | 78.0 | 8,286.0 | |||||||||
| Total fixed maturities, available-for-sale | $ | 40,445.8 | $ | 1,927.6 | $ | 256.2 | $ | 42,117.2 | |||||
| Total equity securities, available-for-sale | $ | 704.1 | $ | 26.1 | $ | 5.8 | $ | 724.4 | |||||
The cost and fair value of fixed maturities available-for-sale at December 31, 2004,2006, by expected maturity, were as follows:
| | Cost | Fair value | Cost | Fair value | ||||||||
|---|---|---|---|---|---|---|---|---|---|---|---|---|
| | (in millions) | (in millions) | ||||||||||
| Due in one year or less | $ | 2,283.9 | $ | 2,323.9 | $ | 2,282.7 | $ | 2,282.7 | ||||
| Due after one year through five years | 8,352.0 | 8,698.4 | 9,313.6 | 9,491.8 | ||||||||
| Due after five years through ten years | 9,701.1 | 10,449.7 | 11,222.2 | 11,402.5 | ||||||||
| Due after ten years | 10,793.6 | 11,797.7 | 11,066.0 | 11,883.9 | ||||||||
| 31,130.6 | 33,269.7 | 33,884.5 | 35,060.9 | |||||||||
| Mortgage-backed and other asset-backed securities | 7,288.7 | 7,646.6 | 9,199.1 | 9,342.6 | ||||||||
| Total | $ | 38,419.3 | $ | 40,916.3 | $ | 43,083.6 | $ | 44,403.5 | ||||
The above summarized activity is based on expected maturities. Actual maturities may differ because borrowers may have the right to call or prepay obligations.
Corporate private placement bonds represent a primary area of credit risk exposure. The corporate private placement bond portfolio is diversified by issuer and industry. We monitor the restrictive bond covenants, which are intended to regulate the activities of issuers and control their leveraging capabilities.
Principal Financial Group, Inc.
Notes to Consolidated Financial Statements — (continued)
6. Investments — (continued)
Net Investment Income
Major categories of net investment income are summarized as follows:
| | For the year ended December 31, | For the year ended December 31, | ||||||||||||||||||
|---|---|---|---|---|---|---|---|---|---|---|---|---|---|---|---|---|---|---|---|---|
| | 2004 | 2003 | 2002 | 2006 | 2005 | 2004 | ||||||||||||||
| | (in millions) | (in millions) | ||||||||||||||||||
| Fixed maturities, available-for-sale | $ | 2,317.2 | $ | 2,255.0 | $ | 2,211.7 | $ | 2,620.4 | $ | 2,453.1 | $ | 2,317.2 | ||||||||
| Fixed maturities, trading | 9.4 | 10.1 | 5.2 | 16.0 | 7.6 | 9.4 | ||||||||||||||
| Equity securities, available-for-sale | 50.0 | 47.0 | 27.6 | 55.5 | 50.8 | 46.9 | ||||||||||||||
| Equity securities, trading | 2.5 | 4.9 | 3.1 | |||||||||||||||||
| Mortgage loans | 761.7 | 788.4 | 783.6 | 744.0 | 764.1 | 762.5 | ||||||||||||||
| Real estate | 85.6 | 91.5 | 85.7 | 64.5 | 63.9 | 82.3 | ||||||||||||||
| Policy loans | 51.1 | 54.5 | 57.6 | 50.9 | 50.3 | 51.1 | ||||||||||||||
| Cash and cash equivalents | 25.9 | 20.6 | 28.5 | 64.4 | 32.1 | 25.9 | ||||||||||||||
| Derivatives | 17.5 | 12.4 | (15.3 | ) | 40.2 | 17.9 | 17.5 | |||||||||||||
| Other | 36.9 | 65.9 | 87.6 | 92.0 | 49.4 | 36.9 | ||||||||||||||
| Total | 3,355.3 | 3,345.4 | 3,272.2 | 3,750.4 | 3,494.1 | 3,352.8 | ||||||||||||||
| Less investment expenses | (128.8 | ) | (112.0 | ) | (99.1 | ) | (132.4 | ) | (134.0 | ) | (128.8 | ) | ||||||||
| Net investment income | $ | 3,226.5 | $ | 3,233.4 | $ | 3,173.1 | $ | 3,618.0 | $ | 3,360.1 | $ | 3,224.0 | ||||||||
Net Realized/Unrealized Capital Gains and Losses
The major components of net realized/unrealized capital lossesgains (losses) on investments are summarized as follows:
| | | For the year ended December 31, | | For the year ended December 31, | ||||||||||||||||||
|---|---|---|---|---|---|---|---|---|---|---|---|---|---|---|---|---|---|---|---|---|---|---|
| | | 2004 | 2003 | 2002 | | 2006 | 2005 | 2004 | ||||||||||||||
| | | (in millions) | | (in millions) | ||||||||||||||||||
| Fixed maturities, available-for-sale: | Fixed maturities, available-for-sale: | Fixed maturities, available-for-sale: | ||||||||||||||||||||
| Gross gains | $ | 65.3 | $ | 75.7 | $ | 153.4 | Gross gains | $ | 42.9 | $ | 114.5 | $ | 58.9 | |||||||||
| Gross losses | (93.1 | ) | (301.2 | ) | (538.5 | ) | Gross losses | (65.0 | ) | (87.3 | ) | (86.0 | ) | |||||||||
| Fixed maturities, trading: | ||||||||||||||||||||||
| Gross gains | 1.5 | 3.5 | 4.0 | Hedging (net) | (14.6 | ) | (45.8 | ) | (0.7 | ) | ||||||||||||
| Gross losses | (2.6 | ) | (0.3 | ) | (0.1 | ) | ||||||||||||||||
| Fixed maturities, trading | Fixed maturities, trading | 1.0 | (2.4 | ) | (1.1 | ) | ||||||||||||||||
| Equity securities, available-for-sale: | Equity securities, available-for-sale: | Equity securities, available-for-sale: | ||||||||||||||||||||
| Gross gains | 21.3 | 9.8 | 4.1 | Gross gains | 2.5 | 9.1 | 17.1 | |||||||||||||||
| Gross losses | (11.8 | ) | (5.5 | ) | (32.7 | ) | Gross losses | (0.9 | ) | (8.8 | ) | (12.0 | ) | |||||||||
| Equity securities, trading | Equity securities, trading | 21.8 | 6.6 | 4.4 | ||||||||||||||||||
| Mortgage loans | Mortgage loans | (12.5 | ) | (2.2 | ) | (10.3 | ) | Mortgage loans | 2.4 | 1.3 | (12.5 | ) | ||||||||||
| Derivatives | Derivatives | (101.4 | ) | 107.2 | (73.3 | ) | Derivatives | (4.7 | ) | 17.2 | (101.4 | ) | ||||||||||
| Other | Other | 28.5 | 49.8 | 119.3 | Other | 59.3 | (15.6 | ) | 28.5 | |||||||||||||
| Net realized/unrealized capital losses | $ | (104.8 | ) | $ | (63.2 | ) | $ | (374.1 | ) | |||||||||||||
| Net realized/unrealized capital gains (losses) | Net realized/unrealized capital gains (losses) | $ | 44.7 | $ | (11.2 | ) | $ | (104.8 | ) | |||||||||||||
Proceeds from sales of investments (excluding call and maturity proceeds) in fixed maturities were $1.5 billion, $2.6 billion and $1.9 billion $2.9 billionin 2006, 2005 and $8.2 billion in 2004, 2003 and 2002, respectively. The proceeds set forth above include amounts related to sales of mortgage-backed securities of $0.5 billion, $0.1 billion and $4.3 billion in 2004, 2003 and 2002, respectively. Gross gains of $0.5 million, $0.6 million and $88.2 million and gross losses of zero, $0.9 million and $11.6 million in 2004, 2003 and 2002, respectively, were realized on sales of mortgage-backed securities.
We recognize impairment losses for fixed maturities and equity securities when declines in value are other than temporary. RealizedGross realized losses related to other than temporary impairments of fixed maturity securities were $52.9$14.6 million, $157.2$28.6 million and $357.0$60.6 million in 2006, 2005 and 2004, 2003,respectively. As a result of the need to fund our acquisition of WM Advisors, Inc. we also recognized $17.2 million of write-downs in 2006 that resulted from our determination that we no longer had the ability and 2002,intent to hold certain fixed maturity securities until they recovered in value. We also recognized gross realized losses as the result of credit triggered sales of $22.2 million, $30.8 million and $18.9 million in 2006, 2005 and 2004, respectively. In 2005, we also recognized an $11.0 million loss related to a large investment that was called from us.
Principal Financial Group, Inc.
Notes to Consolidated Financial Statements — (continued)
6. Investments — (continued)
Gross Unrealized Losses for Fixed Maturities and Equity Securities
For fixed maturities and equity securities available-for-sale with unrealized losses as of December 31, 20042006 and 2003,2005, the gross unrealized losses and fair value, aggregated by investment category and length of time that individual securities have been in a continuous unrealized loss position are summarized as follows:
| | December 31, 2004 | ||||||||||||||||||
|---|---|---|---|---|---|---|---|---|---|---|---|---|---|---|---|---|---|---|---|
| | Less than twelve months | Greater than or equal to twelve months | Total | ||||||||||||||||
| | Carrying value | Gross unrealized losses | Carrying value | Gross unrealized losses | Carrying value | Gross unrealized losses | |||||||||||||
| | (in millions) | ||||||||||||||||||
| Fixed maturities, available-for-sale: | |||||||||||||||||||
| U.S. government and agencies | $ | 72.3 | $ | 0.6 | $ | — | $ | — | $ | 72.3 | $ | 0.6 | |||||||
| Non-U.S. governments | 7.3 | 2.3 | — | — | 7.3 | 2.3 | |||||||||||||
| States and political subdivisions | 54.2 | 0.3 | 21.5 | 0.4 | 75.7 | 0.7 | |||||||||||||
| Corporate — public | 1,978.1 | 24.8 | 181.8 | 9.1 | 2,159.9 | 33.9 | |||||||||||||
| Corporate — private | 1,426.3 | 17.6 | 335.8 | 17.6 | 1,762.1 | 35.2 | |||||||||||||
| Mortgage-backed and other asset-backed securities | 1,488.7 | 19.0 | 102.6 | 4.7 | 1,591.3 | 23.7 | |||||||||||||
| Total fixed maturities, available-for-sale | $ | 5,026.9 | $ | 64.6 | $ | 641.7 | $ | 31.8 | $ | 5,668.6 | $ | 96.4 | |||||||
| Total equity securities, available-for-sale | $ | 68.3 | $ | 10.2 | $ | 250.7 | $ | 0.9 | $ | 319.0 | $ | 11.1 | |||||||
| | December 31, 2006 | ||||||||||||||||||
|---|---|---|---|---|---|---|---|---|---|---|---|---|---|---|---|---|---|---|---|
| | Less than twelve months | Greater than or equal to twelve months | Total | ||||||||||||||||
| | Carrying value | Gross unrealized losses | Carrying value | Gross unrealized losses | Carrying value | Gross unrealized losses | |||||||||||||
| | (in millions) | ||||||||||||||||||
| Fixed maturities, available-for-sale: | |||||||||||||||||||
| U.S. government and agencies | $ | 32.0 | $ | 0.2 | $ | 320.8 | $ | 3.6 | $ | 352.8 | $ | 3.8 | |||||||
| Non-U.S. governments | 45.9 | 0.1 | 13.8 | 0.3 | 59.7 | 0.4 | |||||||||||||
| States and political subdivisions | 278.1 | 0.7 | 347.0 | 4.2 | 625.1 | 4.9 | |||||||||||||
| Corporate — public | 2,697.0 | 35.9 | 4,617.8 | 110.0 | 7,314.8 | �� | 145.9 | ||||||||||||
| Corporate — private | 1,635.2 | 11.4 | 2,375.8 | 64.3 | 4,011.0 | 75.7 | |||||||||||||
| Mortgage-backed and other asset-backed securities | 1,349.3 | 9.7 | 2,751.6 | 68.1 | 4,100.9 | 77.8 | |||||||||||||
| Total fixed maturities, available-for-sale | $ | 6,037.5 | $ | 58.0 | $ | 10,426.8 | $ | 250.5 | $ | 16,464.3 | $ | 308.5 | |||||||
| Total equity securities, available-for-sale | $ | 4.5 | $ | 0.3 | $ | 134.0 | $ | 4.3 | $ | 138.5 | $ | 4.6 | |||||||
As of December 31, 2004,2006, we held $5,668.6$16,464.3 million in available-for-sale fixed maturity securities with unrealized losses of $96.4$308.5 million. Of these amounts, Principal Life's general accountconsolidated portfolio represented $5,555.5$16,224.8 million in available-for-sale fixed maturity securities with unrealized losses of $88.6$299.7 million. Principal Life's general accountconsolidated portfolio consists of fixed maturity securities where 97%98% are investment grade (rated AAA through BBB-) with an average price of 98%98 (carrying value/amortized cost).
For those securities that have been in a loss position for less than twelve months, Principal Life's general accountconsolidated portfolio holds 557643 securities with a carrying value of $4,913.8$5,831.9 million and unrealized losses of $56.8$49.8 million reflecting an average price of 99. Of this portfolio, 98.5%97% was investment grade (rated AAA through BBB-) at December 31, 2004,2006, with associated unrealized losses of $51.8$48.3 million. The losses on these securities can primarily be attributed to changes in market interest rates and changes in credit spreads since the securities were acquired.
For those securities that have been in a continuous loss position greater than or equal to twelve months, Principal Life's general accountconsolidated portfolio holds 801,186 securities with a carrying value of $641.7$10,392.9 million and unrealized losses of $31.8$249.9 million. The average rating of this portfolio is BBB-A with an average price of 9598 at December 31, 2004. The Corporate-Public2006. Of the $249.9 million in unrealized losses, the Corporate-public and Corporate-PrivateCorporate-private sectors account for $26.7 million of the $31.8$173.9 million in unrealized losses.losses with an average price of 98 and an average credit rating of BBB+. The remaining unrealized losses consist primarily of $68.1 million in unrealized losses within the mortgage-backed and other asset-backed securities sector. The average price of the corporate sectors is 95 and the average credit rating is BBB+. Included in the mortgage-backed and other asset-backed securities sector is one previously impaired security with a carrying value of $2.0 million98 and a current unrealized loss of $0.9 million.the average credit
| | December 31, 2003 | ||||||||||||||||||
|---|---|---|---|---|---|---|---|---|---|---|---|---|---|---|---|---|---|---|---|
| | Less than twelve months | Greater than or equal to twelve months | Total | ||||||||||||||||
| | Carrying value | Gross unrealized losses | Carrying value | Gross unrealized losses | Carrying value | Gross unrealized losses | |||||||||||||
| | (in millions) | ||||||||||||||||||
| Fixed maturities, available-for-sale: | |||||||||||||||||||
| U.S. government and agencies | $ | 293.7 | $ | 1.0 | $ | — | $ | — | $ | 293.7 | $ | 1.0 | |||||||
| Non-U.S. governments | 1.5 | 0.1 | — | — | 1.5 | 0.1 | |||||||||||||
| States and political subdivisions | 50.3 | 1.2 | 20.5 | 1.0 | 70.8 | 2.2 | |||||||||||||
| Corporate — public | 883.7 | 23.8 | 77.7 | 9.2 | 961.4 | 33.0 | |||||||||||||
| Corporate — private | 1,269.3 | 69.3 | 228.1 | 27.2 | 1,497.4 | 96.5 | |||||||||||||
| Mortgage-backed and other asset-backed securities | 1,381.2 | 15.0 | 83.2 | 7.2 | 1,464.4 | 22.2 | |||||||||||||
| Total fixed maturities, available-for-sale | $ | 3,879.7 | $ | 110.4 | $ | 409.5 | $ | 44.6 | $ | 4,289.2 | $ | 155.0 | |||||||
| Total equity securities, available-for-sale | $ | 98.6 | $ | 3.2 | $ | 241.7 | $ | 2.8 | $ | 340.3 | $ | 6.0 | |||||||
Principal Financial Group, Inc.
Notes to Consolidated Financial Statements — (continued)
6. Investments — (continued)
rating is AA+. The losses on these securities can primarily be attributed to changes in market interest rates and changes in credit spreads since the securities were acquired.
| | December 31, 2005 | ||||||||||||||||||
|---|---|---|---|---|---|---|---|---|---|---|---|---|---|---|---|---|---|---|---|
| | Less than twelve months | Greater than or equal to twelve months | Total | ||||||||||||||||
| | Carrying value | Gross unrealized losses | Carrying value | Gross unrealized losses | Carrying value | Gross unrealized losses | |||||||||||||
| | (in millions) | ||||||||||||||||||
| Fixed maturities, available-for-sale: | |||||||||||||||||||
| U.S. government and agencies | $ | 411.1 | $ | 3.7 | $ | 43.5 | $ | 0.5 | $ | 454.6 | $ | 4.2 | |||||||
| Non-U.S. governments | 23.7 | 0.5 | 15.1 | 0.3 | 38.8 | 0.8 | |||||||||||||
| States and political subdivisions | 374.2 | 2.9 | 55.2 | 0.9 | 429.4 | 3.8 | |||||||||||||
| Corporate — public | 4,912.6 | 92.9 | 890.0 | 24.2 | 5,802.6 | 117.1 | |||||||||||||
| Corporate — private | 2,298.0 | 36.3 | 488.9 | 16.0 | 2,786.9 | 52.3 | |||||||||||||
| Mortgage-backed and other asset-backed securities | 2,853.4 | 53.8 | 797.9 | 24.2 | 3,651.3 | 78.0 | |||||||||||||
| Total fixed maturities, available-for-sale | $ | 10,873.0 | $ | 190.1 | $ | 2,290.6 | $ | 66.1 | $ | 13,163.6 | $ | 256.2 | |||||||
| Total equity securities, available-for-sale | $ | 145.3 | $ | 2.6 | $ | 287.7 | $ | 3.2 | $ | 433.0 | $ | 5.8 | |||||||
As of December 31, 2003,2005, we held $4,289.2$13,163.6 million in available-for-sale fixed maturity securities with unrealized losses of $155.0$256.2 million. Of these amounts, Principal Life's general accountconsolidated portfolio represented $3,786.2$12,822.1 million in available-for-sale fixed maturity securities with unrealized losses of $147.3$243.0 million. Principal Life's general accountconsolidated portfolio consistsconsisted of fixed maturity securities where 89%97% are investment grade (rated AAA through BBB-) with an average price of 9598 (carrying value/amortized cost). Of the $155.0 million total gross unrealized losses, $24.8 million is related to fixed maturity securities that are part of a fair value hedging relationship that have been recognized in net income as of December 31, 2003. These securities are included in the less than twelve months Corporate-Private category.
For those securities that havehad been in a loss position for less than twelve months, Principal Life's general accountconsolidated portfolio holds 349held 1,199 securities with a carrying value of $3,386.4$10,550.8 million and unrealized losses of $102.8$177.1 million reflecting an average price of 97.98. Of this portfolio, 95.7%97% was investment grade (rated AAA through BBB-) at December 31, 2003,2005, with associated unrealized losses of $67.5$167.1 million. The losses on these securities can primarily be attributed to changes in market interest rates and changes in credit spreads since the securities were acquired.
For those securities that havehad been in a continuous loss position greater than or equal to twelve months, Principal Life's general account holds 60consolidated portfolio held 337 securities with a carrying value of $399.8$2,271.3 million and unrealized losses of $44.5$66.0 million. The average rating of this portfolio is BBB-was A+ with an average price of 9097 at December 31, 2003. The Corporate-Public2005. Of the $66.0 million in unrealized losses, the Corporate-public and Corporate-PrivateCorporate-private sectors account for $36.4 million of the $44.5$40.1 million in unrealized losses.losses with an average price of 97 and an average credit rating of BBB+. The remaining unrealized losses consist primarily of $24.2 million in unrealized losses within the mortgage-backed and other asset-backed securities sector. The average price of the
corporate sectors mortgage-backed and other asset-backed securities sector is 8997 and the average credit rating is BB/BB-. Included in the Corporate-Private sector and Mortgage-backed and other asset-backed securities sector are three previously impaired securities with a carrying value of $9.0 million and $2.0 million, respectively, and a current unrealized loss of $1.0 million and $0.8 million, respectively.AA+.
We closely monitor our below investment grade holdings and those investment grade names where we have concerns. While we are in an unrealized loss position on these securities, all securities except those identified as previously impaired continue to make payments. We consider relevant facts and circumstances in evaluating whether the impairment of a security is other than temporary. Relevant facts and circumstances considered include: (1) the length of time the fair value has been below cost; (2) the financial position and access to capital of the issuer, including the current and future impact of any specific events; and (3) our ability and intent to hold the security to maturity or until it recovers in value. To the extent we determine that a security is deemed to be other than temporarily impaired, the difference between amortized cost and fair value is charged to earnings.
Principal Financial Group, Inc.
Notes to Consolidated Financial Statements — (continued)
6. Investments — (continued)
Net Unrealized Gains and Losses on Available-for-Sale Securities
The net unrealized gains and losses on investments in fixed maturities and equity securities available-for-sale are reported as a separate component of stockholders' equity, reduced by adjustments to DPAC, sales inducements, unearned revenue reserves and PDO that would have been required as a charge or credit to operations had such amounts been realized, and a provision for deferred income taxes.
equity. The cumulative amount of net unrealized gains and losses on available-for-sale securities was as follows:
| | | December 31, | December 31, | ||||||||||||
|---|---|---|---|---|---|---|---|---|---|---|---|---|---|---|---|
| | | 2004 | 2003 | 2006 | 2005 | ||||||||||
| | | (in millions) | (in millions) | ||||||||||||
| Net unrealized gains on fixed maturities, available-for-sale(1) | Net unrealized gains on fixed maturities, available-for-sale(1) | $ | 2,504.8 | $ | 2,413.5 | $ | 1,321.1 | $ | 1,670.8 | ||||||
| Net unrealized gains on equity securities, available-for-sale | Net unrealized gains on equity securities, available-for-sale | 14.0 | 18.1 | 8.9 | 20.3 | ||||||||||
| Adjustments for assumed changes in amortization patterns: | |||||||||||||||
| Deferred policy acquisition costs | (242.9 | ) | (274.4 | ) | |||||||||||
| Sales inducements | 0.5 | — | |||||||||||||
| Unearned revenue reserves | 11.5 | 15.3 | |||||||||||||
| Net unrealized losses on derivative instruments | (2.0 | ) | (90.9 | ) | |||||||||||
| Adjustments for assumed changes in amortization patterns | (128.1 | ) | (136.2 | ) | |||||||||||
| Net unrealized gains on derivative instruments | 46.4 | 39.6 | |||||||||||||
| Net unrealized losses on policyholder dividend obligation | Net unrealized losses on policyholder dividend obligation | (118.5 | ) | (99.0 | ) | — | (33.7 | ) | |||||||
| Net unrealized losses on equity method subsidiaries and minority interest adjustments | (40.1 | ) | (12.1 | ) | |||||||||||
| Net unrealized gains (losses) on equity method subsidiaries and minority interest adjustments | 6.8 | (19.9 | ) | ||||||||||||
| Provision for deferred income taxes | Provision for deferred income taxes | (723.4 | ) | (679.1 | ) | (396.1 | ) | (513.0 | ) | ||||||
| Net unrealized gains on available-for-sale securities | Net unrealized gains on available-for-sale securities | $ | 1,403.9 | $ | 1,291.4 | $ | 859.0 | $ | 1,027.9 | ||||||
- (1)
- Excludes net unrealized gains (losses) on fixed maturities, available-for-sale included in fair value hedging relationships.
Principal Financial Group, Inc.
Notes to Consolidated Financial Statements — (continued)
6. Investments — (continued)
Commercial Mortgage Loans
Commercial mortgage loans represent a primary area of credit risk exposure. At December 31, 20042006 and 2003,2005, the commercial mortgage portfolio is diversified by geographic region and specific collateral property type as follows:
| | December 31, | December 31, | ||||||||||||||||||||
|---|---|---|---|---|---|---|---|---|---|---|---|---|---|---|---|---|---|---|---|---|---|---|
| | 2004 | 2003 | 2006 | 2005 | ||||||||||||||||||
| | Carrying amount | Percent of total | Carrying amount | Percent of total | Carrying amount | Percent of total | Carrying amount | Percent of total | ||||||||||||||
| | (dollars in millions) | ($ in millions) | ||||||||||||||||||||
| Geographic distribution | ||||||||||||||||||||||
| New England | $ | 426.8 | 4.2 | % | $ | 398.9 | 4.1 | % | $ | 397.6 | 3.9 | % | $ | 353.0 | 3.6 | % | ||||||
| Middle Atlantic | 1,916.8 | 18.7 | 1,686.8 | 17.5 | 1,817.4 | 18.0 | 1,822.3 | 18.4 | ||||||||||||||
| East North Central | 913.0 | 8.9 | 945.7 | 9.8 | 847.0 | 8.4 | 775.2 | 7.8 | ||||||||||||||
| West North Central | 419.8 | 4.1 | 336.4 | 3.5 | 525.6 | 5.2 | 458.3 | 4.6 | ||||||||||||||
| South Atlantic | 2,419.8 | 23.7 | 2,285.2 | 23.7 | 2,550.9 | 25.3 | 2,531.2 | 25.7 | ||||||||||||||
| East South Central | 341.3 | 3.3 | 312.1 | 3.2 | 285.6 | 2.8 | 348.0 | 3.5 | ||||||||||||||
| West South Central | 726.9 | 7.1 | 662.1 | 6.9 | 682.4 | 6.8 | 674.1 | 6.8 | ||||||||||||||
| Mountain | 819.7 | 8.0 | 702.0 | 7.3 | 845.5 | 8.4 | 823.7 | 8.3 | ||||||||||||||
| Pacific | 2,283.0 | 22.4 | 2,350.8 | 24.5 | 2,170.5 | 21.5 | 2,138.1 | 21.6 | ||||||||||||||
| Valuation allowance | (42.4 | ) | (0.4 | ) | (49.6 | ) | (0.5 | ) | (32.2 | ) | (0.3 | ) | (33.2 | ) | (0.3 | ) | ||||||
| Total | $ | 10,224.7 | 100.0 | % | $ | 9,630.4 | 100.0 | % | $ | 10,090.3 | 100.0 | % | $ | 9,890.7 | 100.0 | % | ||||||
| Property type distribution | ||||||||||||||||||||||
| Office | $ | 3,383.5 | 33.1 | % | $ | 3,545.2 | 36.8 | % | $ | 2,672.3 | 26.5 | % | $ | 2,706.5 | 27.4 | % | ||||||
| Retail | 2,984.7 | 29.1 | 2,706.4 | 28.1 | 2,808.8 | 27.7 | 3,036.5 | 30.6 | ||||||||||||||
| Industrial | 2,826.4 | 27.6 | 2,708.8 | 28.1 | 2,740.1 | 27.2 | 2,812.3 | 28.4 | ||||||||||||||
| Apartments | 885.4 | 8.7 | 545.9 | 5.7 | 1,440.3 | 14.3 | 1,078.5 | 10.9 | ||||||||||||||
| Hotel | 48.0 | 0.5 | 52.8 | 0.5 | 41.7 | 0.4 | 44.8 | 0.5 | ||||||||||||||
| Mixed use/other | 139.1 | 1.4 | 120.9 | 1.3 | 419.3 | 4.2 | 245.3 | 2.5 | ||||||||||||||
| Valuation allowance | (42.4 | ) | (0.4 | ) | (49.6 | ) | (0.5 | ) | (32.2 | ) | (0.3 | ) | (33.2 | ) | (0.3 | ) | ||||||
| Total | $ | 10,224.7 | 100.0 | % | $ | 9,630.4 | 100.0 | % | $ | 10,090.3 | 100.0 | % | $ | 9,890.7 | 100.0 | % | ||||||
Commercial Mortgage Loan Loss Allowance
Mortgage loans on real estate are considered impaired when, based on current information and events, it is probable that we will be unable to collect all amounts due according to contractual terms of the loan agreement. When we determine that a loan is impaired, a provision for lossvaluation allowance is established equal to the difference between the carrying amount of the mortgage loan and the estimated value. Estimated value is based on either the present value of the expected future cash flows discounted at the loan's effective interest rate, the loan's observable market price or fair value of the collateral. The provision for losseschange in the valuation allowance is included in net realized/unrealized capital lossesgains (losses) on our consolidated statements of operations. Mortgage loans deemed to be impaired are directly charged against the asset or charged against the allowance for losses, and subsequent recoveries are credited to the allowance for losses.
The allowance for losses is maintained at a level believed adequate by management to absorb estimated probable credit losses. Management's periodic evaluation and assessment of the adequacy of the allowance for losses and the need for mortgage impairments is based on known and inherent risks in the portfolio, adverse situations that may affect thea borrower's ability to repay, the estimated value of the underlying collateral, composition of the loan portfolio, current economic conditions and other relevant factors. The evaluation of our loan specific reserve component is also subjective,
Principal Financial Group, Inc.
Notes to Consolidated Financial Statements — (continued)
6. Investments — (continued)
as it requires estimating the amounts and timing of future cash flows expected to be received on impaired loans. Impaired mortgage loans, along with the related allowance for losses, were as follows:
| | December 31, | December 31, | ||||||||||||
|---|---|---|---|---|---|---|---|---|---|---|---|---|---|---|
| | 2004 | 2003 | 2006 | 2005 | ||||||||||
| | (in millions) | (in millions) | ||||||||||||
| Impaired loans | $ | 105.4 | $ | 135.1 | $ | 0.1 | $ | 23.8 | ||||||
| Allowance for losses | (6.5 | ) | (12.5 | ) | — | (2.3 | ) | |||||||
| Net impaired loans | $ | 98.9 | $ | 122.6 | $ | 0.1 | $ | 21.5 | ||||||
The average recorded investment in impaired mortgage loans and the interest income recognized on impaired mortgage loans were as follows:
| | For the year ended December 31, | For the year ended December 31, | ||||||||||||||||
|---|---|---|---|---|---|---|---|---|---|---|---|---|---|---|---|---|---|---|
| | 2004 | 2003 | 2002 | 2006 | 2005 | 2004 | ||||||||||||
| | (in millions) | (in millions) | ||||||||||||||||
| Average recorded investment in impaired loans | $ | 105.2 | $ | 81.6 | $ | 69.5 | $ | 4.3 | $ | 51.6 | $ | 105.2 | ||||||
| Interest income recognized on impaired loans | 7.0 | 12.0 | 7.1 | 0.5 | 5.1 | 7.0 | ||||||||||||
AllWhen it is determined that a loan is impaired, interest accruals are stopped and all interest income on impaired commercial mortgage loans wasis recognized on the cash basis of income recognition.basis.
A summary of the changes in the commercial mortgage loan allowance for losses is as follows:
| | For the year ended December 31, | For the year ended December 31, | ||||||||||||||||||
|---|---|---|---|---|---|---|---|---|---|---|---|---|---|---|---|---|---|---|---|---|
| | 2004 | 2003 | 2002 | 2006 | 2005 | 2004 | ||||||||||||||
| | (in millions) | (in millions) | ||||||||||||||||||
| Balance at beginning of year | $ | 49.6 | $ | 83.6 | $ | 89.0 | $ | 33.2 | $ | 42.4 | $ | 49.6 | ||||||||
| Provision for losses | 14.4 | 1.3 | 33.5 | 1.3 | 6.7 | 14.4 | ||||||||||||||
| Releases due to write-downs, sales and foreclosures | (21.6 | ) | (35.3 | ) | (38.9 | ) | (2.3 | ) | (15.9 | ) | (21.6 | ) | ||||||||
| Balance at end of year | $ | 42.4 | $ | 49.6 | $ | 83.6 | $ | 32.2 | $ | 33.2 | $ | 42.4 | ||||||||
Real Estate
Depreciation expense on invested real estate was $37.1 million, $34.4 million, $28.0 million and $31.8$32.0 million in 2004, 20032006, 2005 and 2002,2004, respectively. Accumulated depreciation was $202.8$228.3 million and $199.6$199.7 million as of December 31, 20042006 and 2003,2005, respectively.
Other Investments
Other investments include minority interests in unconsolidated entities, domestic and international joint ventures and partnerships and properties owned jointly with venture partners and operated by the partners. Such investments are generally accounted for using the equity method. In applying the equity method, we record our share of income or loss reported by the equity investees. Changes in the value of our investment in equity investees attributable to capital transactions of the investee, such as an additional offering of stock, are recorded directly to stockholders' equity. Total assets of the unconsolidated entities amounted to $6,838.3were $12,010.2 million and $4,285.1$9,331.6 million at December 31, 20042006 and 2003,2005, respectively. Total revenues of the unconsolidated entities were $2,174.1 million, $1,785.6 million and $1,302.7 million $752.9in 2006, 2005 and 2004, respectively. During 2006, 2005 and 2004, we included $94.3 million, $89.3 million and $618.8 million in 2004, 2003 and 2002, respectively. During 2004, 2003 and 2002, we included $61.0 million, $40.3 million and $19.2 million, respectively, in net investment income representing our share of current year net income of the unconsolidated entities. At December 31, 20042006 and 2003,2005, our net investment in unconsolidated entities was $288.3$387.0 million and $99.4$321.7 million, respectively, which primarily included our minority interests in domestic and international joint ventures and partnerships.respectively.
In the ordinary course of our business and as part of our investment operations, we have also entered into long term contracts to make and purchase mortgage loansinvestments aggregating $1,268.9$677.2 million and $1,012.0$882.8 million at December 31, 20042006 and 2003,2005, respectively.
Principal Financial Group, Inc.
Notes to Consolidated Financial Statements — (continued)
6. Investments — (continued)
DerivativesDerivative assets are reflected on our consolidated statements of financial positioncarried at fair value and reported as a component of other investments. Certain seed money investments are carried at fair value with changes in fair value included in net income as net realized/unrealized capital gains or losses.
7. Securitization Transactions
Commercial Mortgage Loans
We, along with other contributors, sell commercial mortgage loans in securitization transactions to trusts. As these trusts are classified as a qualifying special purpose entity, pursuant to the guidance of SFAS No. 140,Accounting for Transfers and Servicing of Financial Assets and Extinguishments of Liabilities-A Replacements of FASB Statement 125,they are not requiredsubject to be consolidated under the provisions of FIN 46R.VIE consolidation rules. We retainpurchase primary servicing responsibilities and may retain other immaterial interests. We receive annual servicing fees approximating 0.01%, which approximates cost. The investors and the securitization entities have no recourse to our other assets for failure of debtors to pay when due. The value of our retained interests is subject primarily to credit risk.
In 2006, 2005, and 2004, 2003, and 2002,we recognized gains of $14.4$13.6 million, $16.4$39.8 million and $17.2$14.4 million, respectively, on the securitization of commercial mortgage loans.
Key economic assumptions used in measuring the other retained interests at the date of securitization resulting from transactions completed included a cumulative foreclosure rate between 2% and 10% during 2006, 5% and 18% during 2005, and 4% and 10% during 2004, 5% and 12% during 2003, and 6% and 11% during 2002.2004. The assumed range of the loss severity, as a percentage of defaulted loans, was between 2% and 31% during 2006, 3% and 29% during 2005, and 13% and 31% during 2004, 14% and 33% during 2003, and 12% and 32% during 2002.2004. The low end of the loss severity range relates to a portfolio of seasoned loans. The high end of the loss severity range relates to a portfolio of newly issued loans.
At December 31, 20042006 and 2003,2005, the fair values of other retained interests related to the securitizations of commercial mortgage loans were $304.3$345.3 million and $255.4$321.0 million, respectively. Only $0.5 million in 2006 and $0.8 million in 2005 represented equity investments. All other interests are classified as available-for-sale securities and are carried at fair value. At December 31, 2006 and 2005, respectively, $156.2 million and $181.3 million of these available-for-sale securities were interest-only investments. Cash flows are continuously monitored for adverse deviations from original expectations and impairments are recorded when necessary. Key economic assumptions and the sensitivity of the current fair values of residual cash flows were tested to one and two standard deviations from the expected rates. The changes in the fair values at December 31, 20042006 and 2003,2005, as a result of these assumptionsthis sensitivity analysis were not significant.
Securitization Transactions Cash Flows
The table below summarizes cash flows for securitization transactions:
| | For the year ended December 31, | For the year ended December 31, | ||||||||||||||||
|---|---|---|---|---|---|---|---|---|---|---|---|---|---|---|---|---|---|---|
| | 2004 | 2003 | 2002 | 2006 | 2005 | 2004 | ||||||||||||
| | (in millions) | (in millions) | ||||||||||||||||
| Proceeds from new securitizations | $ | 871.1 | $ | 998.0 | $ | 1,067.6 | $ | 698.6 | $ | 2,270.4 | $ | 871.1 | ||||||
| Servicing fees received | 1.1 | 0.9 | 0.7 | 1.3 | 1.1 | 1.1 | ||||||||||||
| Other cash flows received on retained interests | 31.1 | 30.7 | 26.8 | 37.4 | 36.0 | 31.1 | ||||||||||||
8. Derivative Financial Instruments
Derivatives are generally used to hedge or reduce exposure to market risks (primarily interest rate and foreign currency risks) associated with assets held or expected to be purchased or sold and liabilities incurred or expected to be incurred. Derivatives are used to change the characteristics of our asset/liability mix consistent with our risk management activities. Additionally, derivatives are also used in asset replication strategies. We do not buy, sell or hold these investments for trading purposes.
Types of Derivative Instruments
Interest rate swaps are contracts in which we agree with other parties to exchange, at specified intervals, the difference between fixed rate and floating rate interest amounts based upon designated market rates or rate indices and an agreed upon notional principal amount. Generally, no cash is exchanged at the outset of the contract and no principal payments are made by either party. Cash is paid or received based on the terms of the swap. These transactions are entered into pursuant to master agreements that provide for a single net payment to be made by one counterparty at each due date. We use interest rate swaps primarily to more closely match the interest rate characteristics of assets and liabilities arising from timing mismatches between assets and liabilities (including duration mismatches). We also use interest rate swaps to hedge against changes in the value of assets we anticipate acquiring and other anticipated transactions and commitments. Interest rate swaps are used to hedge against changes in the value of the guaranteed minimum withdrawal benefit ("GMWB") liability. The GMWB rider on our variable annuity products provides for guaranteed minimum withdrawal benefits regardless of the actual performance of various equity and/or fixed income funds available with the product.
Principal Financial Group, Inc.
Notes to Consolidated Financial Statements — (continued)
8. Derivative Financial Instruments — (continued)
In exchange-traded futures transactions, we agree to purchase or sell a specified number of contracts, the values of which are determined by the values of designated classes of securities, and to post variation margin on a daily basis in an amount equal to the difference in the daily market values of those contracts. We enter into exchange-traded futures with regulated futures commissions merchants who are members of a trading exchange. In a mortgage-backed securities ("MBS") forward transaction, we agree to purchase or sell a specified MBS on a future date. We have used exchange-traded futures and MBS forwards to reduce market risks from changes in interest rates, to alter mismatches between the assets in a portfolio and the liabilities supported by those assets, and to hedge against changes in the value of securities we own or anticipate acquiring or selling. We use exchange-traded futures to hedge against changes in the value of the GMWB liability related to the GMWB rider on our variable annuity product, as previously explained.
A swaption is an option to enter into an interest rate swap at a future date. We write these options and receive a premium in order to transform our callable liabilities into fixed term liabilities. In addition, we may sell an investment-type contract with attributes tied to market indices (an embedded derivative as noted below), in which case we write an equity call option to convert the overall contract into a fixed-rate liability, essentially eliminating the equity component altogether. Equity call spreads are purchased to fund the equity participation rates promised to contractholders in conjunction with our fixed deferred annuity products that credit interest based on changes in an external equity index. Equity put options are used to hedge against changes in the value of the GMWB liability related to the GMWB rider on our variable annuity products, as previously explained.
Total return swaps are contracts in which we agree with other parties to exchange, at specified intervals, an amount determined by the difference between the previous spread and the current spread on referenced indices based upon an agreed upon notional principal amount plus an additional amount determined by the financing spread. Generally, no cash is exchanged at the outset of the contract and no principal payments are made by either party. Cash is paid or received based on the terms of the swap. These transactions are entered into pursuant to master agreements that provide for a single net payment to be made by one counterparty at each due date. These derivatives have been used in our commercial mortgage securitization operation to hedge its long spread position.
Currency forwards are contracts in which we agree with other parties to deliver a specified amount of an identified currency at a specified future date. Typically, the price is agreed upon at the time of the contract and payment for such a contract is made at the specified future date. Currency swaps are contracts in which we agree with other parties to exchange, at specified intervals, the difference between one currency and another at a forward exchange rate as calculated by reference to an agreed principal amount. Generally, the principal amount of each currency is exchanged at the beginning and termination of the currency swap by each party. These transactions are entered into pursuant to master agreements that provide for a single net payment to be made by one counterparty for payments made in the same currency at each due date. We use currency forwards and currency swaps to reduce market risks from changes in currency exchange rates with respect to investments or liabilities denominated in foreign currencies that we either hold or intend to acquire or sell. We have also used currency forwards to hedge the currency risk associated with net investments in foreign operations and anticipated earnings of our foreign operations.
We use credit default swaps to enhance the return on our investment portfolio by providing comparable exposure to fixed income securities that might not be available in the primary market. They are also occasionally used to hedge credit exposures in our investment portfolio. Credit derivatives are used to sell or buy credit protection on an identified name or names on an unfunded or synthetic basis in return for receiving or paying a quarterly premium. At the same time we enter into these synthetic transactions, we buy a quality cash bond to match against the credit default swap. The premium generally corresponds to a referenced name's credit spread at the time the agreement is executed. When selling protection, if there is an event of default by the referenced name, as defined by the agreement, we are obligated to pay the counterparty the referenced amount of the contract and receive in return the referenced security in an amount equal to the notional value of the credit default swap.
In our commercial mortgage backed securitization operation, we enter into commitments to fund commercial mortgage loans at specified interest rates and other applicable terms within specified periods of time. These commitments are legally binding agreements to extend credit to a counterparty. Loan commitments that will be held for sale are recognized as interest rate lock commitment derivatives that are recorded at fair value. Fair value is determined by discounting the expected total cash flows using market rates that are applicable to the yield, credit quality and maturity of each commitment. Loan commitments that are related to the origination of mortgage loans that will be held for investment are not accounted for as derivatives and, accordingly, are not recognized in our financial statements.
Principal Financial Group, Inc.
Notes to Consolidated Financial Statements — (continued)
8. Derivative Financial Instruments — (continued)
Commodity swaps are used to sell or buy protection on commodity prices in return for receiving or paying a quarterly premium. We purchased a AAA rated secured limited recourse note from a VIE that is consolidated in our financial results. This VIE uses a commodity swap to enhance the return on an investment portfolio by selling protection on a static portfolio of commodity trigger swaps, each referencing a base or precious metal. The portfolio of commodity trigger swaps is a portfolio of deep out-of-the-money European puts on various base or precious metals. The VIE provides mezzanine protection that the average spot rate will not fall below a certain trigger price on each commodity trigger swap in the portfolio and receives guaranteed quarterly premiums in return until maturity. At the same time the VIE enters into this synthetic transaction, it buys a quality cash bond to match against the commodity swap.
Exposure
Our risk of loss is typically limited to the fair value of our derivative instruments and not to the notional or contractual amounts of these derivatives. Risk arises from changes in the fair value of the underlying instruments. We are also exposed to credit losses in the event of nonperformance of the counterparties. Our current credit exposure is limited to the value of derivatives that have become favorable to us. This credit risk is minimized by purchasing such agreements from financial institutions with high credit ratings and by establishing and monitoring exposure limits. We also utilize various credit enhancements, including collateral and credit triggers to reduce the credit exposure to our derivative instruments.
Our derivative transactions are generally documented under International Swaps and Derivatives Association, Inc. Master Agreements. Management believes that such agreements provide for legally enforceable set-off and close-out netting of exposures to specific counterparties. Under such agreements, in connection with an early termination of a transaction, we are permitted to set off our receivable from a counterparty against our payables to the same counterparty arising out of all included transactions.
Prior to the application of the aforementioned credit enhancements, the gross exposure to credit risk with respect to these derivative instruments was $951.1$752.4 million and $811.0$472.9 million at December 31, 20042006 and 2003,2005, respectively. Subsequent to the application of such credit enhancements, the net exposure to credit risk was $554.6$554.9 million and $476.5$375.3 million at December 31, 20042006 and 2003,2005, respectively.
Principal Financial Group, Inc.
Notes to Consolidated Financial Statements — (continued)
8. Derivative Financial Instruments — (continued)
The notional amounts and credit exposure of our derivative financial instruments by type were as follows:
| | December 31, | December 31, | ||||||||||
|---|---|---|---|---|---|---|---|---|---|---|---|---|
| | 2004 | 2003 | 2006 | 2005 | ||||||||
| | (in millions) | (in millions) | ||||||||||
| Notional amounts of derivative instruments with regard to U.S. operations | ||||||||||||
| Interest rate swaps | $ | 7,481.9 | $ | 5,024.9 | $ | 12,365.5 | $ | 8,531.3 | ||||
| Foreign currency swaps | 3,013.4 | 2,823.4 | 5,307.0 | 3,830.4 | ||||||||
| Credit default swaps | 988.3 | 863.3 | 1,550.9 | 1,297.6 | ||||||||
| Interest rate lock commitments | 634.3 | — | ||||||||||
| Mortgage-backed forwards and options | 586.8 | 522.1 | ||||||||||
| Bond forwards | 508.0 | 467.2 | ||||||||||
| Embedded derivative financial instruments | 499.1 | 455.9 | 1,277.6 | 802.5 | ||||||||
| Swaptions | 429.0 | 315.0 | 643.4 | 684.5 | ||||||||
| Call options | 314.0 | 189.8 | ||||||||||
| Currency forwards | 356.4 | 282.0 | 235.3 | 509.2 | ||||||||
| Call options | 73.0 | 30.0 | ||||||||||
| Futures | 55.0 | 58.9 | ||||||||||
| Bond options | 38.5 | 17.5 | 21.0 | 38.5 | ||||||||
| Futures | 11.8 | 27.8 | ||||||||||
| Other | — | 1.5 | ||||||||||
| Commodity swaps | 20.0 | — | ||||||||||
| Interest rate lock commitments | 8.8 | 392.3 | ||||||||||
| Total return swaps | — | 100.0 | ||||||||||
| Mortgage-backed forwards and options | — | 39.3 | ||||||||||
| 14,620.5 | 10,830.6 | 21,798.5 | 16,474.3 | |||||||||
| Notional amounts of derivative instruments with regard to international operations | ||||||||||||
| Embedded derivative financial instruments | 395.3 | 314.6 | 401.8 | 397.0 | ||||||||
| Currency forwards | 85.3 | — | 107.4 | 57.4 | ||||||||
| Foreign currency swaps | 24.1 | — | 24.1 | 24.1 | ||||||||
| Total notional amounts at end of year | $ | 15,125.2 | $ | 11,145.2 | $ | 22,331.8 | $ | 16,952.8 | ||||
| Net credit exposure of derivative instruments with regard to U.S. operations | ||||||||||||
Gross credit exposure of derivative instruments with regard to U.S. operations | ||||||||||||
| Foreign currency swaps | $ | 803.4 | $ | 637.1 | $ | 560.5 | $ | 338.4 | ||||
| Bond forwards | 66.8 | 52.2 | ||||||||||
| Interest rate swaps | 41.5 | 68.9 | 132.8 | 89.3 | ||||||||
| Call options | 30.6 | 18.0 | ||||||||||
| Credit default swaps | 19.3 | 45.9 | 15.7 | 14.0 | ||||||||
| Call options | 10.5 | 6.6 | ||||||||||
| Commodity swaps | 0.7 | — | ||||||||||
| Bond options | 0.4 | 0.6 | ||||||||||
| Currency forwards | 1.6 | 0.3 | 0.3 | 1.6 | ||||||||
| Bond options | 0.7 | — | ||||||||||
| Total credit exposure at end of year | 943.8 | 811.0 | 741.0 | 461.9 | ||||||||
| Net credit exposure of derivative instruments with regard to international operations | ||||||||||||
Gross credit exposure of derivative instruments with regard to international operations | ||||||||||||
| Currency forwards | 5.5 | — | 7.3 | 9.8 | ||||||||
| Foreign currency swaps | 1.8 | — | 4.1 | 1.2 | ||||||||
| Total credit exposure at end of year | $ | 951.1 | $ | 811.0 | $ | 752.4 | $ | 472.9 | ||||
The net interest effect of interest rate swap, currency swap and credit default swap transactions is recorded as an adjustment to net investment income or interest expense, as appropriate, over the periods covered by the agreements.
The fair value of our derivative instruments related to investment hedges and classified as other invested assets at December 31, 20042006 and 2003,2005, was $864.2$710.6 million and $736.4$430.3 million, respectively.respectively, and was reported with other investments on the consolidated statements of financial position. The fair value of derivative instruments classified as liabilities at December 31, 20042006 and 2003,2005, was $195.9$269.0 million and $124.5$190.1 million, respectively, and was reported with other liabilities on the consolidated statements of financial position.
Principal Financial Group, Inc.
Notes to Consolidated Financial Statements — (continued)
8. Derivative Financial Instruments — (continued)
Fair Value Hedges
We use fixed-to-floating rate interest rate swaps to more closely align the interest rate characteristics of certain assets and liabilities. In general, these swaps are used in asset and liability management to modify duration.
We also enter into currency exchange swap agreements to convert certain foreign denominated assets and liabilities into U.S. dollar floating-rate denominated instruments to eliminate the exposure to future currency volatility on those items.
We use interest rates swaps and have used total return swaps to hedge interest rate and spread risk in our commercial mortgage securitization operations.
We also sell callable investment-type agreements and use written interest rate swaptions to transform the callable liability into a fixed term liability.
We recognized a pre-tax net lossgain (loss) of $4.7 million, $(11.8) million and $(28.7) million $(9.5) millionin 2006, 2005 and $(20.4) million in 2004, 2003 and 2002, respectively, relating to the ineffective portion of our fair value investment hedges, which was reported with net realized/unrealized capital lossesgains (losses) on our consolidated statements of operations. All gains or losses on derivatives were included in the assessment of hedge effectiveness.
Cash Flow Hedges
We also utilize floating-to-fixed rate interest rate swaps to matcheliminate the variability in cash flows.flows of recognized financial assets and liabilities and forecasted transactions.
We entered into currency exchange swap agreements to convert both principal and interest payments of certain foreign denominated assets and liabilities into U.S. dollar denominated fixed-rate instruments to eliminate the exposure to future currency volatility on those items.
At December 31,In 2006, 2005 and 2004, we had hedged the exposure to variable cash flows of $46.7 million of unrecognized firm commitments. These firm commitments are scheduled to fund in first quarter 2005.
In 2004, 2003 and 2002, we recognized a $57.8$4.4 million, $49.6$27.0 million and $(74.5)$57.8 million after-tax increase (decrease) in value, respectively, related to cash flow hedges in accumulated other comprehensive income. During this time period, none of our cash flow hedges have been discontinued because it was probable that the original forecasted transaction would not occur by the end of the originally specified time period. We reclassified $0.7 million, $21.3 million, and $5.2 million and $54.6 millionin net losses from accumulated comprehensive income into earningsnet income during 2006, 2005, and 2004 respectively, which are the portion of deferred losses related to the variability in cash flows that were hedged and 2003, respectively, and weimpacted net income in those periods. We expect to reclassify $21.3 million net losses of $3.6 million in the next 12 months.
In most cases, zero hedge ineffectiveness for cash flow hedges is assumed becauseFor the derivative instrument was constructed such that all termsyears ended December 31, 2006, 2005 and 2004, we recognized a pre-tax gain of the derivative match the hedged risk in the hedged item. As a result, we have recognized an immaterial amount$2.5 million, $1.2 million, and $1.9 million in net income due to cash flow ineffectiveness, respectively. All gains or losses on derivatives were included in the assessment of hedge ineffectiveness.effectiveness.
The maximum length of time that we are hedging our exposure to the variability in future cash flows for forecasted transactions, excluding those related to the payments of variable interest on existing financial assets and liabilities, is 12.5 years.
Net Investment in Foreign Operations Hedges
From time to time, we may take measures to hedge our net investments in our foreign subsidiaries from currency risks. In 2005, we used currency forwards to hedge a portion of our net investment in our Mexican operations and our net investment in our Chilean operations. We did not use any currency forwards during 2006 and did not have any currency forwards outstanding at December 31, 2006 to hedge our net investment in foreign operations. We recognized a $2.7 million pre-tax loss in other comprehensive income from these contracts for the years ended December 31, 2005. There was no ineffectiveness recorded for the year ended December 31, 2005. All gains or losses on derivatives were included in the assessment of hedge effectiveness.
Derivatives Not Designated as Hedging Instruments
We attempt to match the timingOur use of when interest rates are committed on insurance productsfutures, MBS forwards, certain swaptions and other new investments. However, timing differences may occur and can expose us to fluctuating interest rates. To offset this risk, we use mortgage-backed forwards, over-the-counter options on mortgage-backed securities, U.S. Treasury futures contracts, options on Treasury futures, Treasury rate guarantees and interest rate floors to economically hedge anticipated transactions and to manage interest rate risk. Futures contracts are marked to market and settled daily, which minimizes the counterparty risk. Forward contracts are marked to market no less than quarterly.
Occasionally, we will sell a callable investment-type contract and may use interest rate swaptions or similar instruments to transform the callable liability into a fixed term liability. In addition, we may sell an investment-type contract with attributes tied to market indices, in which case we write answaps, equity call option to convert the overall contract into a fixed-rate liability, essentially eliminating the equity component altogether. We have also entered into credit default swaps to exchange the credit default swap risk of oneoptions, bond for that of another. We have also entered intooptions, currency forward agreementsforwards, and swaps to reduce the exposure to future currency volatility in certain short-term foreign cash equivalents and available-for-sale securities.
We also have interest rate lock commitments that are done as part of our commercial mortgage loan securitization operation. Fair value is determined by discounting the expected total cash flows using market rates that are applicable to the yield, credit quality and maturity of each commitment.
Although the above-mentioned derivatives are effective hedges from an economic standpoint, but they dohave not meet the requirements for hedge accounting treatmentbeen designated as hedges under SFAS 133. As such, periodic changes in the market value of these instruments flow directly into net income. InFor the years ended December 31, 2006, 2005 and 2004, 2003 and 2002, gains (losses) of $(58.6)$11.1 million, $68.5$13.1 million and $13.2$(59.0) million, respectively, were recognized in income from market value changes of derivatives not receiving hedge accounting treatment.
Principal Financial Group, Inc.
Notes to Consolidated Financial Statements — (continued)
8. Derivative Financial Instruments — (continued)
Embedded Derivatives
We may purchase or issue financial instruments or products that contain a derivative instrument that is embedded in the financial instrument or products.product. When it is determined that the embedded derivative possesses economic characteristics that are not clearly or closely related to the economic characteristics of the host contract and a separate instrument with the same terms would qualify as a derivative instrument, the embedded derivative is bifurcated from the host for measurement purposes. The embedded derivative, which is reported with the host instrument in the consolidated balance sheets,statements of financial position, is carried at fair value with changes in fair value reported in net income.
In 2002,We sell investment-type liability contracts in which the return is tied to an external equity index, a leveraged inflation index or leveraged reference swap. These returns are embedded options that are bifurcated from the host investment-type contract and accounted for separately. We economically hedge the embedded equity derivative by writing equity call options with identical features to convert the overall contract into a fixed-rate liability, effectively eliminating the equity component altogether. For the years ended December 31, 2006, 2005 and 2004, respectively, we entered into anrecognized a $3.1 million, $1.0 million and $3.2 million pre-tax gain on the purchased equity call options and a $3.1 million, $1.0 million and $3.2 million pre-tax loss on the change in fair value of the embedded derivatives. We economically hedge the leveraged embedded derivatives with interest rate swapswaps and currency swaps to convert them to a fixed-rate liability or floating rate U.S. dollar liability. For the year ended December 31, 2006, we recognized a $2.6 million pre-tax loss on the swaps and a $6.0 million pre-tax gain on the change in fair value of the embedded derivatives.
We offer a guaranteed fund as partan investment option in our defined contribution plans in Hong Kong. This fund contains an embedded option that has been bifurcated and accounted for separately, with changes in fair value reported in net realized/unrealized gains (losses). There was no pre-tax gain or loss recognized for the years ended December 31, 2006 and 2005, because the fair value of the guarantees has been less than the fair value of the benefits. We recognized a $0.1 million pre-tax gain for the year ended December 31, 2004.
We contributed undated subordinated floating rate notes to three grantor trusts. The trusts separated the cash flows of the underlying notes by issuing an interest-only certificate and a residual certificate related to each note contributed. We retained the interest-only certificates and the residual certificates were subsequently sold to a third party. We have determined these grantor trusts are variable interest entities and it is necessary for us to consolidate these entities. The obligation to deliver the underlying securities to residual certificate holders of $156.8 million as of December 31, 2006, and $147.4 million as of December 31, 2005 is classified as an other liability and contains an embedded derivative of the forecasted transaction to deliver the underlying securities. For the years ended December 31, 2006, 2005 and 2004, respectively, we recognized a $7.2 million pre-tax gain, a $2.7 million pre-tax gain and a $28.2 million pre-tax loss on the change in fair value of the obligation, which is reflected in accumulated other comprehensive income on the consolidated statements of financial position.
During 2005, we purchased existing Class A units of a structuring processtrust that represent interest payments on the underlying security within the trust. The trust also issued Class B units representing the residual interests in the underlying security. We have determined that this trust is a variable interest entity and subsequent to this purchase it is necessary for us to consolidate this entity. The obligation to deliver the underlying security to the Class B unit holder of $12.0 million and $10.5 million as of December 31, 2006 and 2005, respectively, is classified as an investment grade collateralized debt obligation ("CDO") issuance. Dueother liability and contains an embedded derivative of the forecasted transaction to market conditions,deliver the CDO was never issued. Theunderlying security. For the years ended December 31, 2006 and 2005, respectively, we recognized a $0.5 million and $0.4 million pre-tax loss realized on the terminationchange in fair value of the obligation, which is reflected in accumulated other comprehensive income on the consolidated statements of financial position.
We offer a fixed deferred annuity product that credits interest based on changes in an external equity index. It contains an embedded derivative that has been bifurcated and accounted for separately, with changes in fair value reported in net realized/unrealized gains (losses). We economically hedge the fixed deferred annuity product by purchasing options that match the product's profile. For the years ended December 31, 2006, 2005 and 2004, respectively, we recognized a $5.3 million, $1.5 million and $0.5 million pre-tax gain on the call spread options purchased and a $6.1 million, $2.3 million and $0.2 million pre-tax loss on the change in fair value of the embedded derivatives.
Principal Financial Group, Inc.
Notes to Consolidated Financial Statements — (continued)
8. Derivative Financial Instruments — (continued)
We offer certain variable annuity products with a GMWB rider. The GMWB provides that the contractholder will receive at least their principal deposit back through withdrawals of up to a specified annual amount, even if the account value is reduced to zero. The GMWB represents an embedded derivative in the variable annuity contract that is required to be reported separately from the host variable annuity contract. Declines in the equity market may increase our exposure to benefits under contracts with the GMWB. We economically hedge the GMWB exposure using futures, options and interest rate swap was $17.3 million.
swaps. For the years ended December 31, 2006, and 2005, respectively, we recognized in net income a $4.2 million and $0.5 million pre-tax loss on the hedging instruments and a $2.8 million pre-tax gain and $0.2 million pre-tax loss on the change in fair value of the embedded derivatives, respectively.
9. Closed Block
In connection with the 1998 mutual insurance holding company ("MIHC")MIHC formation, Principal Life formed a Closed Block to provide reasonable assurance to policyholders included therein that, after the formation of the MIHC, assets would be available to maintain dividends in aggregate in accordance with the 1997 policy dividend scales, if the experience underlying such scales continued. Assets of Principal Life were allocated to the Closed Block in an amount that produces cash flows which, together with anticipated revenue from policies and contracts included in the Closed Block, were expected to be sufficient to support the Closed Block policies, including, but not limited to, provisions for payment of claims, certain expenses, charges and taxes, and to provide for continuation of policy and contract dividends in aggregate in accordance with the 1997 dividend scales, if the experience underlying such scales continues, and to allow for appropriate adjustments in such scales, if such experience changes. Due to adjustable life policies being included in the Closed Block, the Closed Block is charged with amounts necessary to properly fund for certain adjustments, such as face amount and premium increases, that are made to these policies after the Closed Block inception date. These amounts are referred to as Funding Adjustment Charges and are treated as capital transfers from the Closed Block.
Assets allocated to the Closed Block inure solely to the benefit of the holders of policies included in the Closed Block. Closed Block assets and liabilities are carried on the same basis as other similar assets and liabilities. Principal Life will continue to pay guaranteed benefits under all policies, including the policies within the Closed Block, in accordance with their terms. If the assets allocated to the Closed Block, the investment cash flows from those assets and the revenues from the policies included in the Closed Block, including investment income thereon, prove to be insufficient to pay the benefits guaranteed under the policies included in the Closed Block, Principal Life will be required to make such payments from their general funds. No additional policies were added to the Closed Block, nor was the Closed Block affected in any other way, as a result of the demutualization.
A PDO is required to be established for earnings in the Closed Block that are not available to stockholders. A model of the Closed Block was established to produce the pattern of expected earnings in the Closed Block (adjusted to eliminate the impact of related amounts in accumulated other comprehensive income).
If actual cumulative earnings of the Closed Block are greater than the expected cumulative earnings of the Closed Block, only the expected cumulative earnings will be recognized in income with the excess recorded as a PDO. This PDO represents undistributed accumulated earnings that will be paid to Closed Block policyholders as additional policyholder dividends unless offset by future performance of the Closed Block that is less favorable than originally expected. If actual cumulative performance is less favorable than expected, only actual earnings will be recognized in income. At December 31, 20042006 and 2003,2005, cumulative actual earnings have been less than cumulative expected earnings. As of December 31, 2006, cumulative net unrealized gains were not greater than expected. Therefore, there was no PDO liability as of December 31, 2006. However, cumulative net unrealized gains were greater than expected, resulting in the recognition of a PDO of $118.5$33.7 million, and $99.0$118.5 million as of December 31, 20042005 and 2003,2004, respectively.
Principal Financial Group, Inc.
Notes to Consolidated Financial Statements — (continued)
9. Closed Block — (continued)
Closed Block liabilities and assets designated to the Closed Block were as follows:
| | | December 31, | | December 31, | |||||||||||
|---|---|---|---|---|---|---|---|---|---|---|---|---|---|---|---|
| | | 2004 | 2003 | | 2006 | 2005 | |||||||||
| | | (in millions) | | (in millions) | |||||||||||
| Closed Block liabilities | Closed Block liabilities | Closed Block liabilities | |||||||||||||
| Future policy benefits and claims | Future policy benefits and claims | $ | 5,409.0 | $ | 5,401.7 | Future policy benefits and claims | $ | 5,376.0 | $ | 5,387.1 | |||||
| Other policyholder funds | Other policyholder funds | 28.8 | 30.7 | Other policyholder funds | 26.4 | 27.3 | |||||||||
| Policyholder dividends payable | Policyholder dividends payable | 364.3 | 371.3 | Policyholder dividends payable | 357.4 | 361.0 | |||||||||
| Policyholder dividend obligation | Policyholder dividend obligation | 118.5 | 99.0 | Policyholder dividend obligation | — | 33.7 | |||||||||
| Other liabilities | Other liabilities | 42.6 | 42.9 | Other liabilities | 61.5 | 57.0 | |||||||||
| Total Closed Block liabilities | 5,963.2 | 5,945.6 | Total Closed Block liabilities | 5,821.3 | 5,866.1 | ||||||||||
Assets designated to the Closed Block | Assets designated to the Closed Block | Assets designated to the Closed Block | |||||||||||||
| Fixed maturities, available-for-sale | Fixed maturities, available-for-sale | 3,057.5 | 2,864.1 | Fixed maturities, available-for-sale | 3,023.7 | 2,989.8 | |||||||||
| Equity securities, available-for-sale | Equity securities, available-for-sale | 74.9 | 80.7 | Equity securities, available-for-sale | 65.9 | 71.5 | |||||||||
| Mortgage loans | Mortgage loans | 754.5 | 849.9 | Mortgage loans | 640.3 | 716.4 | |||||||||
| Real estate | 1.7 | 1.9 | |||||||||||||
| Policy loans | Policy loans | 751.2 | 757.8 | Policy loans | 755.2 | 754.6 | |||||||||
| Other investments | Other investments | 19.9 | 26.8 | Other investments | 84.4 | 47.7 | |||||||||
| Total investments | 4,659.7 | 4,581.2 | Total investments | 4,569.5 | 4,580.0 | ||||||||||
| Cash and cash equivalents (deficit) | 0.4 | (6.0 | ) | ||||||||||||
| Cash and cash equivalents | Cash and cash equivalents | 50.9 | 34.3 | ||||||||||||
| Accrued investment income | Accrued investment income | 72.9 | 74.1 | Accrued investment income | 70.8 | 71.0 | |||||||||
| Deferred income tax asset | Deferred income tax asset | 78.9 | 70.1 | Deferred income tax asset | 72.8 | 73.6 | |||||||||
| Premiums due and other receivables | Premiums due and other receivables | 22.8 | 28.1 | Premiums due and other receivables | 17.7 | 20.2 | |||||||||
| Other assets | Other assets | 18.8 | 22.3 | Other assets | 42.3 | 35.9 | |||||||||
| Total assets designated to the Closed Block | 4,853.5 | 4,769.8 | Total assets designated to the Closed Block | 4,824.0 | 4,815.0 | ||||||||||
| Excess of Closed Block liabilities over assets designated to the Closed Block | Excess of Closed Block liabilities over assets designated to the Closed Block | 1,109.7 | 1,175.8 | Excess of Closed Block liabilities over assets designated to the Closed Block | 997.3 | 1,051.1 | |||||||||
| Amounts included in other comprehensive income | Amounts included in other comprehensive income | 63.0 | 74.6 | Amounts included in other comprehensive income | 55.7 | 61.5 | |||||||||
| Maximum future earnings to be recognized from Closed Block assets and liabilities | Maximum future earnings to be recognized from Closed Block assets and liabilities | $ | 1,172.7 | $ | 1,250.4 | Maximum future earnings to be recognized from Closed Block assets and liabilities | $ | 1,053.0 | $ | 1,112.6 | |||||
Principal Financial Group, Inc.
Notes to Consolidated Financial Statements — (continued)
9. Closed Block — (continued)
Closed Block revenues and expenses were as follows:
| | | For the year ended December 31, | | For the year ended December 31, | ||||||||||||||||||
|---|---|---|---|---|---|---|---|---|---|---|---|---|---|---|---|---|---|---|---|---|---|---|
| | | 2004 | 2003 | 2002 | | 2006 | 2005 | 2004 | ||||||||||||||
| | | (in millions) | | (in millions) | ||||||||||||||||||
| Revenues | Revenues | Revenues | ||||||||||||||||||||
| Premiums and other considerations | Premiums and other considerations | $ | 648.7 | $ | 684.3 | $ | 710.0 | Premiums and other considerations | $ | 596.7 | $ | 617.7 | $ | 648.7 | ||||||||
| Net investment income | Net investment income | 301.6 | 306.6 | 309.9 | Net investment income | 293.2 | 294.4 | 301.6 | ||||||||||||||
| Net realized/unrealized capital losses | (4.1 | ) | (6.6 | ) | (40.8 | ) | ||||||||||||||||
| Net realized/unrealized capital gains (losses) | Net realized/unrealized capital gains (losses) | (0.9 | ) | 2.3 | (4.1 | ) | ||||||||||||||||
| Total revenues | 946.2 | 984.3 | 979.1 | Total revenues | 889.0 | 914.4 | 946.2 | |||||||||||||||
| Expenses | Expenses | Expenses | ||||||||||||||||||||
| Benefits, claims and settlement expenses | Benefits, claims and settlement expenses | 515.1 | 557.4 | 583.3 | Benefits, claims and settlement expenses | 497.0 | 518.8 | 515.1 | ||||||||||||||
| Dividends to policyholders | Dividends to policyholders | 289.1 | 298.6 | 305.2 | Dividends to policyholders | 287.0 | 285.3 | 289.1 | ||||||||||||||
| Operating expenses | Operating expenses | 11.6 | 8.3 | 12.3 | Operating expenses | 5.5 | 9.1 | 11.6 | ||||||||||||||
| Total expenses | 815.8 | 864.3 | 900.8 | Total expenses | 789.5 | 813.2 | 815.8 | |||||||||||||||
| Closed Block revenue, net of Closed Block expenses, before income taxes | Closed Block revenue, net of Closed Block expenses, before income taxes | 130.4 | 120.0 | 78.3 | Closed Block revenue, net of Closed Block expenses, before income taxes | 99.5 | 101.2 | 130.4 | ||||||||||||||
| Income taxes | Income taxes | 42.6 | 39.5 | 25.2 | Income taxes | 32.2 | 32.4 | 42.6 | ||||||||||||||
| Closed Block revenue, net of Closed Block expenses and income taxes | Closed Block revenue, net of Closed Block expenses and income taxes | 87.8 | 80.5 | 53.1 | Closed Block revenue, net of Closed Block expenses and income taxes | 67.3 | 68.8 | 87.8 | ||||||||||||||
| Funding adjustment charges | Funding adjustment charges | (10.1 | ) | (31.9 | ) | (3.5 | ) | Funding adjustment charges | (7.7 | ) | (8.7 | ) | (10.1 | ) | ||||||||
| Closed Block revenue, net of Closed Block expenses, income tax and funding adjustment charges | Closed Block revenue, net of Closed Block expenses, income tax and funding adjustment charges | $ | 77.7 | $ | 48.6 | $ | 49.6 | Closed Block revenue, net of Closed Block expenses, income tax and funding adjustment charges | $ | 59.6 | $ | 60.1 | $ | 77.7 | ||||||||
The change in maximum future earnings of the Closed Block was as follows:
| | For the year ended December 31, | For the year ended December 31, | ||||||||||||||||||
|---|---|---|---|---|---|---|---|---|---|---|---|---|---|---|---|---|---|---|---|---|
| | 2004 | 2003 | 2002 | 2006 | 2005 | 2004 | ||||||||||||||
| | (in millions) | (in millions) | ||||||||||||||||||
| Beginning of year | $ | 1,250.4 | $ | 1,299.0 | $ | 1,348.6 | $ | 1,112.6 | $ | 1,172.7 | $ | 1,250.4 | ||||||||
| End of year | 1,172.7 | 1,250.4 | 1,299.0 | 1,053.0 | 1,112.6 | 1,172.7 | ||||||||||||||
| Change in maximum future earnings | $ | (77.7 | ) | $ | (48.6 | ) | $ | (49.6 | ) | $ | (59.6 | ) | $ | (60.1 | ) | $ | (77.7 | ) | ||
Principal Life charges the Closed Block with federal income taxes, payroll taxes, state and local premium taxes and other state or local taxes, licenses and fees as provided in the plan of reorganization.
10. Deferred Policy Acquisition Costs
Policy acquisition costs deferred and amortized in 2004, 20032006, 2005 and 20022004 were as follows:
| | For the year ended December 31, | For the year ended December 31, | ||||||||||||||||||
|---|---|---|---|---|---|---|---|---|---|---|---|---|---|---|---|---|---|---|---|---|
| | 2004 | 2003 | 2002 | 2006 | 2005 | 2004 | ||||||||||||||
| | (in millions) | (in millions) | ||||||||||||||||||
| Balance at beginning of year | $ | 1,568.9 | $ | 1,409.5 | $ | 1,357.2 | $ | 2,174.1 | $ | 1,837.6 | $ | 1,568.9 | ||||||||
| Cost deferred during the year | 477.7 | 349.7 | 323.0 | 498.9 | 482.1 | 477.7 | ||||||||||||||
| Amortized to expense during the year | (210.8 | ) | (140.0 | ) | (144.4 | ) | (239.2 | ) | (246.6 | ) | (210.8 | ) | ||||||||
| Effect of unrealized gains | 32.1 | (50.3 | ) | (126.3 | ) | |||||||||||||||
| Effect of unrealized gains (losses) | (14.9 | ) | 101.0 | 32.1 | ||||||||||||||||
| Other(1) | (30.3 | ) | — | — | — | — | (30.3 | ) | ||||||||||||
| Balance at end of year | $ | 1,837.6 | $ | 1,568.9 | $ | 1,409.5 | $ | 2,418.9 | $ | 2,174.1 | $ | 1,837.6 | ||||||||
- (1)
- Due to the January 1, 2004 adoption of SOP 03-1, we reclassified $30.3 million of sales inducements from DPAC to other assets.
Principal Financial Group, Inc.
Notes to Consolidated Financial Statements — (continued)
11. Insurance Liabilities
Contractholder Funds
Major components of contractholder funds in the consolidated statements of financial position are summarized as follows:
| | | December 31, | | December 31, | ||||||||||
|---|---|---|---|---|---|---|---|---|---|---|---|---|---|---|
| | | 2004 | 2003 | | 2006 | 2005 | ||||||||
| | | (in millions) | | (in millions) | ||||||||||
| Liabilities for investment-type contracts: | Liabilities for investment-type contracts: | Liabilities for investment-type contracts: | ||||||||||||
| GICs | $ | 12,803.3 | $ | 12,868.3 | GICs | $ | 12,307.3 | $ | 12,601.6 | |||||
| Funding agreements | 11,266.3 | 9,336.2 | Funding agreements | 14,242.4 | 11,832.0 | |||||||||
| Other investment-type contracts | 1,528.3 | 1,563.4 | Other investment-type contracts | 1,277.8 | 1,362.9 | |||||||||
| Total liabilities for investment-type contracts | Total liabilities for investment-type contracts | 25,597.9 | 23,767.9 | Total liabilities for investment-type contracts | 27,827.5 | 25,796.5 | ||||||||
Liabilities for individual annuities | Liabilities for individual annuities | 4,547.2 | 3,486.2 | Liabilities for individual annuities | 6,429.1 | 5,414.0 | ||||||||
| Universal life and other reserves | Universal life and other reserves | 2,038.2 | 1,642.3 | Universal life and other reserves | 2,542.4 | 2,401.6 | ||||||||
| Total contractholder funds | Total contractholder funds | $ | 32,183.3 | $ | 28,896.4 | Total contractholder funds | $ | 36,799.0 | $ | 33,612.1 | ||||
Our GICs and funding agreements contain provisions limiting early surrenders, which typically include penalties for early surrenders, and minimum notice requirements.requirements or, in the case of funding agreements with survivor options, minimum pre-death holding periods and specific maximum amounts.
Funding agreements include those issued directly to nonqualified institutional investors, as well as to three separate programs where the funding agreements arehave been issued directly or indirectly to unconsolidated special purpose entities. Claims for principal and interest under funding agreements are afforded equal priority to claims of life insurance and annuity policyholders under insolvency provisions of Iowa Insurance Laws.
We are authorized to issue up to $4.0 billion of funding agreements under a program established in 1998 to support the prospective issuance of medium term notes by an unaffiliated entity in non-U.S. markets. As of December 31, 20042006 and 2003, $3,867.02005, $3,770.4 million and $3,618.7$3,203.6 million, respectively, of liabilities are being heldoutstanding with respect to the issuance outstanding under this program. We do not anticipate any new issuance activity under this program as we are authorized to issue up to Euro 4.0 billion (approximately USD$5.3 billion) of funding agreements under a program established in 2006 to support the prospective issuance of medium term notes by an unaffiliated entity in non-U.S. markets. The unaffiliated entity is an unconsolidated special purpose vehicle. As of December 31, 2006, $474.1 million of liabilities are outstanding with respect to the issuance outstanding under this new program.
In addition, we arewere authorized to issue up to $7.0 billion of funding agreements under a program established in 2001 to support the prospective issuance of medium term notes by an unaffiliated entity in both domestic and international markets. The unaffiliated entity is an unconsolidated qualifying special purpose entity. As of December 31, 20042006 and 2003, $5,462.32005, $3,747.9 million and $5,613.4$4,744.5 million, respectively, of liabilities are being held with respect to the issuance outstanding under this program. We do not anticipate any new issuance activity under this program, given our December 2005 termination of the March 2004 establishmentdealership agreement for this program and the availability of the SEC-registered program described in the nextfollowing paragraph.
We arewere authorized to issue up to $4.0 billion of funding agreements under a program established in March 2004 to support the prospective issuance of medium term notes by unaffiliated entities in both domestic and international
markets. In recognition of the use of nearly all $4.0 billion of initial issuance authorization, this program was amended in February 2006 to authorize issuance of up to an additional $5.0 billion. Under this program, both the notes and the supporting funding agreements are registered with the SEC. As of December 31, 2004, $1,831.52006 and 2005, $5,831.4 million and $3,667.9 million, respectively, of liabilities are being held with respect to the issuance outstanding under this program. In contrast with direct funding agreements, GIC issuances and the other two funding agreement-backed medium term note programs described above, Principal Life's payment obligations on each funding agreement issued under this SEC-registered program are guaranteed by Principal Financial Group, Inc.
Principal Financial Group, Inc.
Notes to Consolidated Financial Statements — (continued)
11. Insurance Liabilities — (continued)
Future Policy Benefits and Claims
Activity in the liability for unpaid accident and health claims, which is included with future policy benefits and claims in the consolidated statements of financial position, is summarized as follows:
| | | For the year ended December 31, | | For the year ended December 31, | |||||||||||||||||
|---|---|---|---|---|---|---|---|---|---|---|---|---|---|---|---|---|---|---|---|---|---|
| | | 2004 | 2003 | 2002 | | 2006 | 2005 | 2004 | |||||||||||||
| | | (in millions) | | (in millions) | |||||||||||||||||
| Balance at beginning of year | Balance at beginning of year | $ | 705.8 | $ | 699.3 | $ | 714.8 | Balance at beginning of year | $ | 814.8 | $ | 747.6 | $ | 719.5 | |||||||
Incurred: | Incurred: | Incurred: | |||||||||||||||||||
Current year | 1,634.2 | 1,572.3 | 1,588.3 | Current year | 2,047.5 | 1,787.0 | 1,682.9 | ||||||||||||||
| Prior years | 19.9 | (24.7 | ) | 0.6 | Prior years | (37.5 | ) | (22.0 | ) | (28.8 | ) | ||||||||||
| Total incurred | Total incurred | 1,654.1 | 1,547.6 | 1,588.9 | Total incurred | 2,010.0 | 1,765.0 | 1,654.1 | |||||||||||||
Payments: | Payments: | Payments: | |||||||||||||||||||
| Current year | 1,381.6 | 1,304.6 | 1,333.2 | Current year | 1,666.9 | 1,444.0 | 1,376.2 | ||||||||||||||
| Prior years | 247.6 | 236.5 | 271.2 | Prior years | 280.7 | 253.8 | 249.8 | ||||||||||||||
| Total payments | Total payments | 1,629.2 | 1,541.1 | 1,604.4 | Total payments | 1,947.6 | 1,697.8 | 1,626.0 | |||||||||||||
Balance at end of year: | Balance at end of year: | Balance at end of year: | |||||||||||||||||||
Current year | 252.6 | 267.7 | 255.1 | Current year | 380.6 | 343.0 | 306.7 | ||||||||||||||
| Prior years | 478.1 | 438.1 | 444.2 | Prior years | 496.6 | 471.8 | 440.9 | ||||||||||||||
| Total balance at end of year | Total balance at end of year | $ | 730.7 | $ | 705.8 | $ | 699.3 | Total balance at end of year | $ | 877.2 | $ | 814.8 | $ | 747.6 | |||||||
The activity summary in the liability for unpaid accident and health claims shows an increase (decrease)a decrease of $19.9$37.5 million, $(24.7)$22.0 million and $0.6$28.8 million for the years ended December 31, 2004, 20032006, 2005 and 2002,2004, respectively, relating to prior years. Such liability adjustments, which affected current operations during 2004, 20032006, 2005 and 2002,2004, respectively, resulted in part from developed claims for prior years being different than were anticipated when the liabilities for unpaid accident and health claims were originally estimated. In addition, in 2003 we established a premium deficiency reserve on our medical conversion business that was included in our incurred but not reported claim reserve in prior years. These trends have been considered in establishing the current year liability for unpaid accident and health claims. We also had claim adjustment expensesexpense liabilities of $28.3$33.4 million, $27.7$30.6 million and $23.0$28.3 million, and related reinsurance recoverables of $4.9 million, $3.5 million and $3.6 million $2.5 millionin 2006, 2005 and $2.0 million in 2004, 2003 and 2002, respectively, which are not included in the rollforward above.
12. Debt
Short-Term Debt
The components of short-term debt as of December 31, 20042006 and 2003,2005, were as follows:
| | December 31, | December 31, | ||||||||||
|---|---|---|---|---|---|---|---|---|---|---|---|---|
| | 2004 | 2003 | 2006 | 2005 | ||||||||
| | (in millions) | (in millions) | ||||||||||
| Commercial paper | $ | 75.0 | $ | 399.8 | $ | — | $ | 349.9 | ||||
| Other recourse short-term debt | 56.4 | 27.0 | 23.1 | 55.1 | ||||||||
| Nonrecourse short-term debt | 150.3 | 276.0 | 61.0 | 71.4 | ||||||||
| Total short-term debt | $ | 281.7 | $ | 702.8 | $ | 84.1 | $ | 476.4 | ||||
As of December 31, 2004,2006, we had credit facilities with various financial institutions in an aggregate amount of $1.1 billion.$887.7 million. As of December 31, 20042006 and 2003,2005, we had $281.7$84.1 million and $702.8$476.4 million of outstanding borrowings related to our credit facilities, with $221.3$74.5 million and $333.3$110.6 million of assets pledged as support, respectively. Assets pledged consisted primarily of commercial mortgages and securities. Our credit facilities also include a $600.0 million back-stop facility to provide 100% support for our commercial paper program, of which there were no outstanding balances as of December 31, 2004.2006.
The weighted-average interest rates on short-term borrowings as of December 31, 20042006 and 2003,2005, were 2.7%5.6% and 1.6%,4.5% respectively.
Principal Financial Group, Inc.
Notes to Consolidated Financial Statements — (continued)
12. Debt — (continued)
Long-Term Debt
The components of long-term debt as of December 31, 20042006 and 2003,2005, were as follows:
| | December 31, | December 31, | ||||||||||
|---|---|---|---|---|---|---|---|---|---|---|---|---|
| | 2004 | 2003 | 2006 | 2005 | ||||||||
| | (in millions) | (in millions) | ||||||||||
| 7.95% notes payable, due 2004 | $ | — | $ | 200.0 | ||||||||
| 8.2% notes payable, due 2009 | 464.2 | 464.0 | $ | 464.5 | $ | 464.3 | ||||||
| 7.875% surplus notes payable, due 2024 | — | 199.0 | ||||||||||
| 4.59% notes payable, due 2011 | 49.7 | 51.6 | ||||||||||
| 4.93% notes payable, due 2011 | 40.5 | 47.3 | ||||||||||
| 6.05% notes payable, due 2036 | 601.9 | — | ||||||||||
| 8% surplus notes payable, due 2044 | 99.2 | 99.2 | 99.2 | 99.2 | ||||||||
| Nonrecourse mortgages and notes payable | 213.2 | 340.7 | 258.0 | 184.0 | ||||||||
| Other mortgages and notes payable | 66.9 | 71.4 | 40.0 | 52.4 | ||||||||
| Total long-term debt | $ | 843.5 | $ | 1,374.3 | $ | 1,553.8 | $ | 898.8 | ||||
The amounts included above are net of the discount and direct costspremium associated with issuing these notes, which are being amortized to expense over their respective terms using the interest method.
On October 16 and December 5, 2006, we issued $500.0 million and $100.0 million, respectively, of senior notes from our shelf registration, which was filed with the SEC in December 2003. The notes will bear interest at a rate of 6.05% per year. Interest on the notes is payable semi-annually on April 15 and October 15, beginning on April 15, 2007. The notes will mature on October 15, 2036. A portion of the proceeds was used to fund the acquisition of WM Advisors, Inc., with the remaining proceeds being used for general corporate purposes.
On November 3, 2005, Principal International de Chile S.A., a wholly owned indirect subsidiary, entered into long-term borrowing agreements with two Chilean banks in the amount of US $93.9 million. This debt is denominated in Unidades de Formento ("UF"), a Chilean inflation-indexed, peso-denominated monetary unit. Of this amount, US $49.0 million of UF +4.59% notes and US $44.9 million of UF +4.93% notes mature on November 3, 2011. Interest on the notes is payable semi-annually on May 3 and November 3 each year. The debt outstanding and interest expense will vary due to fluctuations in the Chilean peso to US dollar exchange rates and Chilean inflation.
On August 25, 1999, Principal Financial Group (Australia) Holdings Pty. Limited, a wholly owned indirect subsidiary, issued $665.0 million of unsecured redeemable long-term debt. Of this amount, $200.0 million of 7.95% notes matured on August 15, 2004, with the remaining $465.0 million in 8.2% notes due August 15, 2009. Interest on the notes is payable semiannually on February 15 and August 15 of each year. Principal Financial Group (Australia) Holdings Pty. Limited used the net proceeds from the notes to partially fund the purchase of the outstanding stock of several companies affiliated with Bankers Trust Australia Group. On December 28, 2001, all of the long-term debt obligations of Principal Financial Group (Australia) Holdings Pty. Limited were assumed by its parent, Principal Financial Services, Inc.
On March 10, 1994, Principal Life issued $300.0$100.0 million of surplus notes including $200.0 million due March 1, 2024, at a 7.875% annual interest rate and the remaining $100.0 million due March 1, 2044, at an 8% annual interest rate. None of our affiliates hold any portion of the notes. Each payment of interest and principal on the notes, however, may be made only with the prior approval of the Commissioner of Insurance of the State of Iowa (the "Commissioner") and only to the extent that Principal Life has sufficient surplus earnings to make such payments. Interest of $10.6 million for the year ended December 31, 2004, and $23.8 million for each of the years ended December 31, 20032006, 2005 and 2002,2004 of $8.0 million, $8.0 million and $10.6 million, respectively, was approved by the Commissioner, and charged to expense.
After receiving approval from the Commissioner, the surplus notes due March 1, 2024, were optionally redeemed by Principal Life on March 1, 2004, in whole at a redemption price of approximately 103.6% of par. Total cash paid for the surplus note redemption on March 1, 2004, was $207.2 million.
Subject to Commissioner approval, the notes due March 1, 2044, may be redeemed at Principal Life's election on or after March 1, 2014, in whole or in part at a redemption price of approximately 102.3% of par. The approximate 2.3% premium is scheduled to gradually diminish over the following ten years. These notes may be redeemed on or after March 1, 2024, at a redemption price of 100% of the principal amount plus interest accrued to the date of redemption.
The non-recourse mortgages, other mortgages and other notes payable are primarily financings for real estate developments. We, including certain subsidiaries, had $125.0$135.0 million in credit facilities as of December 31, 2006, with various financial institutions, in addition to obtaining loans with various lenders to finance these developments. Outstanding principal balances as of December 31, 2004,2006, range from $0.4$0.3 million to $98.7$96.2 million per development with interest rates generally ranging from 6.0%5.5% to 8.6%. Outstanding principal balances as of December 31, 2003,2005, range from $0.4$0.3 million to $99.9$97.5 million per development with interest rates generally ranging from 6.0%5.5% to 8.6%. Outstanding debt is secured by the underlying real estate properties, which were reported as real estate on our consolidated statements of financial position with a carrying value of $298.7$246.2 million and $322.1$284.1 million as of December 31, 20042006 and 2003,2005, respectively.
Principal Financial Group, Inc.
Notes to Consolidated Financial Statements — (continued)
12. Debt — (continued)
Also included in non-recourse mortgages and notes payable is a long-term debt obligation we assumed with the purchase of WM Advisors, Inc. As part of the purchase, we will be bound by a class B share financing agreement previously entered into by WM Advisors, Inc. and a third party, which was assigned a value of $86.9 million at purchase. Load mutual fund shares sold without a front end load are referred to as "B shares". In exchange for paying the selling commission, the company receives fees in the future to recover the up-front commission cost incurred. Prior to our purchase, WM Advisors, Inc. had entered into a purchase and sale agreement whereby the third party would purchase the rights to future cash flow streams in exchange for funding the sales commissions. The fair value of these relinquished fees is reported as a long-term debt liability. There will be no additional sales under this agreement following the effective date of the purchase. Therefore, this liability will be extinguished within eight years, which equates to the contractual term in which the fund can recover fees to cover the upfront commission costs.
At December 31, 2004,2006, future annual maturities of the long-term debt were as follows (in millions):
| Year ending December 31: | ||||
| 2005 | $ | 46.1 | ||
| 2006 | 42.5 | |||
| 2007 | 109.4 | |||
| 2008 | 76.0 | |||
| 2009 | 464.6 | |||
| Thereafter | 104.9 | |||
| Total future maturities of the long-term debt | $ | 843.5 | ||
| Year ending December 31: | ||||
| 2007 | $ | 143.5 | ||
| 2008 | 79.8 | |||
| 2009 | 15.0 | |||
| 2010 | 13.7 | |||
| 2011 | 565.0 | |||
| Thereafter | 736.8 | |||
| Total future maturities of the long-term debt | $ | 1,553.8 | ||
Cash paid for interest for 2006, 2005 and 2004, 2003 and 2002, was $102.2$83.6 million, $110.6$138.9 million and $101.0$102.5 million, respectively. These amounts include interest paid on taxes during these years.
13. Income Taxes
Our income tax expense (benefit) from continuing operations was as follows:
| | For the year ended December 31, | ||||||||||
|---|---|---|---|---|---|---|---|---|---|---|---|
| | 2004 | 2003 | 2002 | ||||||||
| | (in millions) | ||||||||||
| Current income taxes (benefits): | |||||||||||
| U.S. federal | $ | 244.0 | $ | 104.2 | $ | (99.7 | ) | ||||
| State and foreign | 39.3 | 39.2 | 40.4 | ||||||||
| Net realized/unrealized capital gains (losses) | 4.2 | (118.6 | ) | (76.1 | ) | ||||||
| Total current income taxes (benefits) | 287.5 | 24.8 | (135.4 | ) | |||||||
| Deferred income taxes (benefits) | (108.4 | ) | 152.2 | 60.5 | |||||||
| Total income taxes (benefits) | $ | 179.1 | $ | 177.0 | $ | (74.9 | ) | ||||
| | For the year ended December 31, | ||||||||||
|---|---|---|---|---|---|---|---|---|---|---|---|
| | 2006 | 2005 | 2004 | ||||||||
| | (in millions) | ||||||||||
| Current income taxes: | |||||||||||
| U.S. federal | $ | 210.9 | $ | 135.0 | $ | 245.1 | |||||
| State and foreign | 52.8 | 44.2 | 41.7 | ||||||||
| Total current income taxes | 263.7 | 179.2 | 286.8 | ||||||||
| Deferred income taxes (benefits) | 31.3 | 53.0 | (108.6 | ) | |||||||
| Total income taxes | $ | 295.0 | $ | 232.2 | $ | 178.2 | |||||
Our provision for income taxes may not have the customary relationship of taxes to income. Differences between the prevailing corporate income tax rate of 35% times the pre-tax income and our effective tax rate on pre-tax income are generally due to inherent differences between income for financial reporting purposes and income for tax purposes and the establishment of adequate provisions for any challenges of the tax filings and tax payments to the various taxing
jurisdictions. A reconciliation between the corporate income tax rate and the effective tax rate from continuing operations is as follows:
| | For the year ended December 31, | For the year ended December 31, | ||||||||||||
|---|---|---|---|---|---|---|---|---|---|---|---|---|---|---|
| | 2004 | 2003 | 2002 | 2006 | 2005 | 2004 | ||||||||
| Statutory corporate tax rate | 35 | % | 35 | % | 35 | % | 35 | % | 35 | % | 35 | % | ||
| Dividends received deduction | (9 | ) | (7 | ) | (19 | ) | (8 | ) | (7 | ) | (9 | ) | ||
| Interest exclusion from taxable income | (2 | ) | (2 | ) | (3 | ) | (1 | ) | (2 | ) | (2 | ) | ||
| Federal tax settlement for prior years | — | (3 | ) | (31 | ) | (1 | ) | (1 | ) | — | ||||
| Section 29 fuel tax credits | (2 | ) | — | — | ||||||||||
| Synthetic fuel tax credits | (1 | ) | (3 | ) | — | |||||||||
| Other | (2 | ) | (2 | ) | (2 | ) | (2 | ) | (1 | ) | (4 | ) | ||
| Effective tax rate | 20 | % | 21 | % | (20 | )% | 22 | % | 21 | % | 20 | % | ||
Principal Financial Group, Inc.
Notes to Consolidated Financial Statements — (continued)
13. Income Taxes — (continued)
Significant components of our net deferred income taxes were as follows:
| | | December 31, | | December 31, | ||||||||||||||
|---|---|---|---|---|---|---|---|---|---|---|---|---|---|---|---|---|---|---|
| | | 2004 | 2003 | | 2006 | 2005 | ||||||||||||
| | | (in millions) | | (in millions) | ||||||||||||||
| Deferred income tax assets (liabilities): | Deferred income tax assets (liabilities): | Deferred income tax assets (liabilities): | ||||||||||||||||
| Insurance liabilities | $ | 390.9 | $ | 426.7 | Insurance liabilities | $ | 299.4 | $ | 322.6 | |||||||||
| Other deferred tax assets | 88.9 | 86.0 | Other deferred tax assets | 88.6 | 124.3 | |||||||||||||
| Total deferred tax assets | 479.8 | 512.7 | Total deferred tax assets | 388.0 | 446.9 | |||||||||||||
| Deferred policy acquisition costs | (578.6 | ) | (511.6 | ) | Deferred policy acquisition costs | (732.8 | ) | (651.5 | ) | |||||||||
| Net unrealized gains on available-for-sale securities | (723.4 | ) | (679.1 | ) | Net unrealized gains on available-for-sale securities | (395.8 | ) | (512.9 | ) | |||||||||
| Other deferred tax liabilities | (289.0 | ) | (501.7 | ) | Other deferred tax liabilities | (161.8 | ) | (247.7 | ) | |||||||||
| Total deferred tax liabilities | (1,591.0 | ) | (1,692.4 | ) | Total deferred tax liabilities | (1,290.4 | ) | (1,412.1 | ) | |||||||||
| Total net deferred income tax liabilities | Total net deferred income tax liabilities | $ | (1,111.2 | ) | $ | (1,179.7 | ) | Total net deferred income tax liabilities | $ | (902.4 | ) | $ | (965.2 | ) | ||||
At December 31, 20042006 and 2003,2005, respectively, our net deferred tax liability is comprisedincludes international net deferred tax liabilities of $162.6 million and $115.4 million and U.S. net deferred tax liabilities of $754.6 million and $859.4 million, which have been included in deferred income taxes in the consolidated statements of financial position. In addition, at December 31, 2006, and 2005, respectively, our net deferred tax liability included international net deferred tax assets of $20.5$10.2 million and $19.2$9.6 million and U.S. net state deferred tax assets of $4.6 million and $0.0 million, which have been included in other assets and $1,131.7 million and $1,198.9 million of U.S. net deferred tax liabilities, which have been included in deferred income taxes in the consolidated statements of financial position.
The Internal Revenue Service (the "Service") has completed examinations of the U.S. consolidated federal income tax returns for 20002003 and prior years. The Service continues to review our 2001 tax return and has also started to examine returns for 2002 and 2003. The Service's completion of the examinationexaminations for the years 1999 - 20002001 resulted in a noticenotices of deficiency that was issued ondated December 29, 2004.2004, and March 1, 2005. We paid the deficiencydeficiencies (approximately $444.0 million for 1999 and 2000, and $1.3 million for 2001, including interest) in Januarythe first quarter of 2005 and plan tohave filed, or will file, claims for refund relating to the disputed adjustments. The majority of the deficiency is attributable to the disallowance of carrybacks of capital losses, net operating losses and foreign tax credits arising in years after 2001; we expect the Service to allow the carrybacks upon completion of the audit of the returnsexamination for the years 2002 and 2003 resulted in a refund of approximately $176.7 million (including interest) of which the losses and credits arose. The remainder$161.5 million related to deficiencies previously paid as a result of the deficiency is attributable to both contested issues and adjustments that we have accepted.1999 through 2001 examination. We believe that we have adequate defenses against, or sufficient provisions for, the contested issues.issues, but final resolution of the contested issues could take several years while legal remedies are pursued. Consequently, we do not expect the ultimate resolution of issues in tax years 1999 - 20002003 to have a material impact on our net income. Similarly, we believe that there are adequate defenses against, or sufficient provisions for, any challenges that might arise in tax years subsequent to 2000.2003.
U.S. Federal and state income taxes have not been provided on approximately $130.8$247.8 million of accumulated but undistributed earnings from operations of foreign subsidiaries. Such earnings are considered to be indefinitely reinvested in the business. DeterminingIt is not practical to determine the amount of the unrecognized deferred tax liability that would arise if these earnings were remitted is not practicable due to foreign tax credits and exclusions that may become available at the time of remittance. A tax liability will be recognized when we no longer plan to indefinitely reinvest the earnings or when we plan to sell all or a portion of our ownership interest.
Principal Financial Group, Inc.
Notes to Consolidated Financial Statements — (continued)
13. Income Taxes — (continued)
On October 22, 2004, theThe American Jobs Creation Act of 2004 (the "Act") was signed into law. The American Jobs Creation Act includesof 2004 included a repatriation provision granting U.S. corporations a special deduction of 85% of certain qualifying dividends from their foreign subsidiaries. A company maycould elect to apply this provision to qualifying earnings that are repatriated in its 2005 tax year. We have begun an evaluationPursuant to The American Jobs Creation Act of the effects of this repatriation provision; however,2004, we do not expect to be able to complete our evaluation until Congress, the Treasury Department and the Internal Revenue Service provide additional clarifying language and/or guidance on certain key elements of the provision. Whether we will ultimately elect to utilize this repatriation provision depends on a number of factors including review of this related guidance. We expect to complete our review and analysis of the effects of the repatriation provision within a reasonable period of time following issuance of the future clarifying language and/or guidance. The range of possible amounts that we are considering for repatriation under this provision is between zero and approximately $54.0 million. Taking into consideration our current accrual, which does not applyimplemented two domestic reinvestment plans in 2005. In accordance with the provisions of the Act, the related potential range of income tax effects of such repatriation under the Act is between zero and a benefit of approximately $1.7Internal Revenue Code, we elected an 85% dividend received deduction on eligible cash dividends totaling $28.8 million.
Net cash paid for income taxes was $139.5 million in 2006, which included a $155.1 million audit refund pertaining to prior tax years; $638.1 million in 2005, primarily due to the notices of deficiency noted above; and $599.3 million in 2004, was $599.3 million, of which $444.3 million was attributable to the sale of Principal Residential Mortgage, Inc. Net cash received for income taxes in 2003 and 2002 was $72.0 million and $189.3 million, respectively, primarily due to refunds for the 2002 loss on the sale of BT Financial Group, 2001 capital losses and the favorable settlement of an Internal Revenue Service audit issue.
14. Employee and Agent Benefits
We have defined benefit pension plans covering substantially all of our employees and certain agents. Some of these plans provide supplemental pension benefits to employees with salaries and/or pension benefits in excess of the qualified plan limits imposed by federal tax law. The employees and agents are generally first eligible for the pension plans when they reach age 21. For plan participants employed prior to January 1, 2002, the pension benefits are based on the greater of a final average pay benefit or a cash balance benefit. The final average pay benefit is based on the years of service and generally the employee's or agent's average annual compensation during the last five years of employment. Partial benefit accrual of final average pay benefits is recognized from first eligibility until retirement based on attained service divided by potential service to age 65 with a minimum of 35 years of potential service. The cash balance portion of the plan started on January 1, 2002. An employee's account will be credited with an amount based on the employee's salary, age and service. These credits will accrue with interest. For plan participants hired on and after January 1, 2002, only the cash balance plan applies. Our policy is to fund the cost of providing pension benefits in the years that the employees and agents are providing service to us. Our funding policy for the qualified defined benefit plan is to contribute an amount annually at least equal to the minimum annual contribution required under the Employee Retirement Income Security Act ("ERISA"), and, generally, not greater than the maximum amount that can be deducted for federal income tax purposes. Our funding policy for the non-qualified benefit plan is to fund the plan in the years that the employees are providing service to us using a methodology similar to the calculation of the net periodic benefit cost under U.S. GAAP, but using long-term assumptions. However, if the U.S. GAAP funded status is positive, no deposit is made. While we funddesignate assets to cover the computed liability of this plan, the assets are not included as part of the asset balances presented in this footnote as they do not qualify as plan assets under SFAS No. 87,Employers' Accounting for Pensions, ("SFAS 87"), however, they are included in our consolidated statements of financial position.accordance with U.S. GAAP.
We also provide certain health care, life insurance and long-term care benefits for retired employees. Subsidized retiree health benefits are provided for employees hired prior to January 1, 2002. Employees hired after December 31, 2001, will have access to retiree health benefits but will needare intended to pay for the full cost of the coverage. The health care plans are contributory with participants' contributions adjusted annually; the contributions are based on the number of years of service and age at retirement for those hired prior to January 1, 2002. As part of the substantive plan, the retiree health contributions are assumed to be adjusted in the future as claim levels change. The life insurance plans are contributory for a small group of previously grandfathered participants that have elected supplemental coverage and dependent coverage.
Covered employees are first eligible for the medical and life postretirement benefits when they reach age 57 and have completed ten years of service with us. Retiree long-term care benefits are provided for employees whose retirement was effective prior to July 1, 2000. Partial benefit accrual of these health, life and long-term care benefits is recognized from the employee's date of hire until retirement based on attained service divided by potential service to age 65 with a minimum of 35 years of potential service. Our policy is to fund the cost of providing retiree benefits in the years that the employees are providing service to us using a methodology similar to the calculation of the net periodic benefit cost under U.S. GAAP, but using long-term assumptions. However, if the U.S. GAAP funded status is positive, no deposit is made.
We use a measurement date of October 1 for the pension and other postretirement benefit plans.
Principal Financial Group, Inc.
Notes to Consolidated Financial Statements — (continued)
14. Employee and Agent Benefits — (continued)
Obligations and Funded Status
The plans' combined funded status, reconciled to amounts recognized in the consolidated statements of financial position and consolidated statements of operations, was as follows:
| | Pension benefits | Other postretirement benefits | Pension benefits | Other postretirement benefits | ||||||||||||||||||||||
|---|---|---|---|---|---|---|---|---|---|---|---|---|---|---|---|---|---|---|---|---|---|---|---|---|---|---|
| | December 31, | December 31, | December 31, | December 31, | ||||||||||||||||||||||
| | 2004 | 2003 | 2004 | 2003 | 2006 | 2005 | 2006 | 2005 | ||||||||||||||||||
| | (in millions) | (in millions) | ||||||||||||||||||||||||
| Change in benefit obligation | ||||||||||||||||||||||||||
| Benefit obligation at beginning of year | $ | (1,191.4 | ) | $ | (1,046.4 | ) | $ | (253.3 | ) | $ | (280.2 | ) | $ | (1,441.7 | ) | $ | (1,312.1 | ) | $ | (287.3 | ) | $ | (287.8 | ) | ||
| Service cost | (49.6 | ) | (49.0 | ) | (8.7 | ) | (12.3 | ) | (47.0 | ) | (49.7 | ) | (9.5 | ) | (10.0 | ) | ||||||||||
| Interest cost | (73.8 | ) | (66.9 | ) | (15.4 | ) | (17.9 | ) | (81.6 | ) | (77.4 | ) | (16.2 | ) | (16.9 | ) | ||||||||||
| Actuarial gain (loss) | (62.6 | ) | (65.5 | ) | (22.3 | ) | 55.0 | 43.0 | (121.1 | ) | 47.1 | 19.8 | ||||||||||||||
| Participant contributions | — | — | (2.9 | ) | (2.5 | ) | — | — | (4.1 | ) | (3.6 | ) | ||||||||||||||
| Benefits paid | 42.2 | 38.1 | 10.9 | 9.7 | 47.3 | 44.7 | 13.0 | 11.2 | ||||||||||||||||||
| Curtailment gain | 25.1 | — | 3.9 | — | ||||||||||||||||||||||
| Special termination benefits | (1.8 | ) | — | — | — | |||||||||||||||||||||
| Plan amendments | (0.6 | ) | 73.9 | — | — | |||||||||||||||||||||
| Other | (0.2 | ) | (1.7 | ) | — | (5.1 | ) | — | — | (0.9 | ) | — | ||||||||||||||
| Benefit obligation at end of year | $ | (1,312.1 | ) | $ | (1,191.4 | ) | $ | (287.8 | ) | $ | (253.3 | ) | $ | (1,480.6 | ) | $ | (1,441.7 | ) | $ | (257.9 | ) | $ | (287.3 | ) | ||
| Change in plan assets | ||||||||||||||||||||||||||
| Fair value of plan assets at beginning of year | $ | 1,033.5 | $ | 893.3 | $ | 378.8 | $ | 354.0 | $ | 1,297.8 | $ | 1,156.4 | $ | 448.9 | $ | 408.5 | ||||||||||
| Actual return on plan assets | 124.8 | 140.5 | 36.3 | 31.5 | 129.8 | 165.7 | 26.2 | 47.5 | ||||||||||||||||||
| Employer contribution | 40.3 | 37.8 | 1.4 | 0.5 | 29.8 | 20.4 | 0.5 | 0.5 | ||||||||||||||||||
| Participant contributions | — | — | 2.9 | 2.5 | — | — | 4.1 | 3.6 | ||||||||||||||||||
| Benefits paid | (42.2 | ) | (38.1 | ) | (10.9 | ) | (9.7 | ) | (47.3 | ) | (44.7 | ) | (13.0 | ) | (11.2 | ) | ||||||||||
| Fair value of plan assets at end of year | $ | 1,156.4 | $ | 1,033.5 | $ | 408.5 | $ | 378.8 | $ | 1,410.1 | $ | 1,297.8 | $ | 466.7 | $ | 448.9 | ||||||||||
| Funded (underfunded) status | $ | (155.7 | ) | $ | (157.9 | ) | $ | 120.7 | $ | 125.5 | ||||||||||||||||
| Unrecognized net actuarial loss | 165.9 | 165.6 | 20.2 | 7.3 | ||||||||||||||||||||||
| Unrecognized prior service cost (benefit) | 4.0 | 6.0 | (19.9 | ) | (24.4 | ) | ||||||||||||||||||||
| Unamortized transition asset | — | (0.1 | ) | — | — | |||||||||||||||||||||
Reconciliation of funded status to amount recognized | ||||||||||||||||||||||||||
| Funded (under funded) status | $ | — | $ | (143.9 | ) | $ | — | $ | 161.6 | |||||||||||||||||
| Unrecognized net actuarial (gain) loss | — | 201.2 | — | (18.3 | ) | |||||||||||||||||||||
| Unrecognized prior service benefit | — | (71.3 | ) | — | (17.2 | ) | ||||||||||||||||||||
| Net prepaid benefit asset | $ | 14.2 | $ | 13.6 | $ | 121.0 | $ | 108.4 | ||||||||||||||||||
| Net prepaid benefit asset (benefit obligation) | $ | — | $ | (14.0 | ) | $ | — | $ | 126.1 | |||||||||||||||||
| Amounts recognized in statement of financial position consist of | ||||||||||||||||||||||||||
| Amounts recognized in statement of financial position (Pre-SFAS 158) consist of | ||||||||||||||||||||||||||
| Prepaid benefit cost | $ | 185.7 | $ | 166.7 | $ | 121.3 | $ | 109.0 | $ | — | $ | 172.3 | $ | — | $ | 126.1 | ||||||||||
| Accrued benefit liability including minimum liability | (179.6 | ) | (157.0 | ) | (0.3 | ) | (0.6 | ) | ||||||||||||||||||
| Accrued benefit liability, including minimum liability | — | (203.9 | ) | — | — | |||||||||||||||||||||
| Accumulated other comprehensive income | 8.1 | 3.9 | — | — | — | 17.6 | — | — | ||||||||||||||||||
| Net amount recognized | $ | 14.2 | $ | 13.6 | $ | 121.0 | $ | 108.4 | $ | — | $ | (14.0 | ) | $ | — | $ | 126.1 | |||||||||
| Amount recognized in statement of financial position (Post-SFAS 158) | ||||||||||||||||||||||||||
| Other assets | $ | 205.1 | $ | — | $ | 208.9 | $ | — | ||||||||||||||||||
| Other liabilities | (275.6 | ) | — | (0.1 | ) | — | ||||||||||||||||||||
| Total | $ | (70.5 | ) | $ | — | $ | 208.8 | $ | — | |||||||||||||||||
| Amount recognized in accumulated other comprehensive income (Post-SFAS 158) | ||||||||||||||||||||||||||
| Total net actuarial (gain) loss | $ | 113.5 | $ | — | $ | (59.5 | ) | $ | — | |||||||||||||||||
| Prior service benefit | (61.7 | ) | — | (14.6 | ) | — | ||||||||||||||||||||
| Pre-tax accumulated other comprehensive income (gain) loss | $ | 51.8 | $ | — | $ | (74.1 | ) | $ | — | |||||||||||||||||
Prior to SFAS 158, a company booked on its statement of financial position the net prepaid benefit asset or benefit obligation for the fiscal year end. Under SFAS 158, a company now recognizes the over funded or under funded status of the pension and postretirement plans as an asset or liability in its statement of financial position.
Principal Financial Group, Inc.
Notes to Consolidated Financial Statements — (continued)
14. Employee and Agent Benefits — (continued)
The incremental effect of applying SFAS 158 on individual line items in the statement of financial position as of December 31, 2006, is as follows:
| | Before application of SFAS 158 | Adjustment flows through accumulated other comprehensive income | After application of SFAS 158 | |||||||
|---|---|---|---|---|---|---|---|---|---|---|
| | (in millions) | |||||||||
| Assets for pension plans | $ | 184.2 | $ | 20.9 | $ | 205.1 | ||||
| Assets for other post-retirement benefit plans | 134.8 | 74.1 | 208.9 | |||||||
| Liability for pension plans | (203.0 | ) | (72.6 | ) | (275.6 | ) | ||||
| Liability for other post-retirement benefit plans | — | (0.1 | ) | (0.1 | ) | |||||
| Additional minimum pension liability | (13.4 | ) | 13.4 | — | ||||||
| Pre-tax accumulated other comprehensive income | (13.4 | ) | 35.7 | 22.3 | ||||||
Employer contributions to the pension plans include contributions made directly to the qualified pension plan assets and contributions from corporate assets to pay nonqualified pension benefits. Benefits paid from the pension plans include both qualified and nonqualified plan benefits. Nonqualified pension plan assets are not included as part of the asset balances presented in this footnote,footnote. The nonqualified pension plan assets are held in a Rabbi trust for the benefit of all nonqualified plan participants. The assets held in a Rabbi trust are available to satisfy the claims of general creditors only in the event of bankruptcy. Therefore, these assets are fully consolidated in our consolidated statements of financial position and are not reflected in our funded status as they do not qualify as plan assets. The market value of assets held in these trusts was $216.0 million as of December 31, 2006, and $198.3 million as of December 31, 2005.
Pension Plan Changes and Plan Gains/Losses
As of January 1, 2006, changes were made to our retirement program, including the Principal Select Saving Plan ("401(k)"), the Principal Pension Plan ("Pension Plan") and to the corresponding nonqualified plans. The qualified and nonqualified pension plan changes include a reduction to the traditional and cash balance formulas, a change in the early retirement factors, and the removal of the cost of living adjustments for traditional benefits earned after January 1, 2006. The qualified and nonqualified 401(k) plan's company match increased from 50% of a contribution rate up to a maximum of 3% of the participant's compensation to 75% of a contribution rate up to a maximum of 6% of the participant's compensation. Employees who were at least 47 years old, with a minimum of 10 years of service as of December 31, 2005, were given the choice to remain under SFAS 87. Benefits paid fromthe current pension and 401(k) arrangement or move to the new plan design. The vast majority of this group chose to remain under the current pension and 401(k) arrangement. The Pension Plan changes were recognized as a prior service benefit and resulted in a reduction of liabilities of $73.9 million.
For the year ended December 31, 2006, the pension plans include both qualifiedhad an actuarial gain of $43.0 million, this gain was primarily due to the increase in the discount rate and nonqualified plan benefits.was partially offset by greater than expected salary increases. For the year ended December 31, 2005, the pension plans had an actuarial loss of $121.1 million, which was primarily due to the decrease in the discount rate.
The accumulated benefit obligation for all defined benefit pension plans was $1,274.3 million and $1,239.2 million at December 31, 2006, and 2005, respectively.
The Principal Residential Mortgage, Inc. divestiture in 2004 resulted in a curtailment under SFAS No. 88,"Employers' Accounting for Settlements and Curtailments of Defined Benefit Pension Plans and for Termination Benefits", for the plans that provided benefits to the Principal Residential Mortgage, Inc. participants. A mid-year remeasurementre-measurement to reflect the curtailment occurred as of the date of sale, July 1, 2004. Curtailment gains of $25.1 million and $3.9 million occurred under the pension and other postretirement benefit plans, respectively.respectively in 2004. This did not affect the pension plans or other postretirement benefit plans covering agents and managers. In addition, this did not affect the long-term care plan because these plans consist of only retired participants.
Due to the Principal Residential Mortgage, Inc. divestiture, we provided for contractual termination benefits in connection with termination of employment for a select group of Principal Residential Mortgage, Inc. management employees. The pension plan recognized $1.8 million in special termination benefits liability.liability in 2004.
Principal Financial Group, Inc.
The pension plans' gainsNotes to Consolidated Financial Statements — (continued)
14. Employee and losses are amortized using a straight-line amortization method over the average remaining service period of employees. For the qualified pension plan, there is no corridor recognized in determining the amount to amortize; for the nonqualified pension plans, the corridor allowed under SFAS 87 is used.Agent Benefits — (continued)
Other Post Retirement Plan Changes and Plan Gains/Losses
On December 8, 2003, the Medicare Prescription Drug, Improvement and Modernization Act of 2003 (the "Medicare Modernization Act") was signed into law. The Medicare Modernization Act introduced a prescription drug benefit under Medicare ("Medicare Part D") as well as a federal subsidy to sponsors of retiree medical benefit plans. The prescription drug benefits offered by the sponsor must be at least actuarially equivalent to benefits offered under Medicare Part D to qualify for the subsidy. This subsidy is effective in 2006 and would only apply to benefits paid for qualifying retirees who have not enrolled in Medicare Part D.
An actuarial gain of $47.1 million occurred during 2006 for the other postretirement benefit plans. This was due to a less than assumed increase in health care claim costs and trend assumption, as well as an increase in the discount rate. Retiree contributions also increased more than health care claim costs. An actuarial gain of $19.8 million occurred during 2005 for the other postretirement benefit plans. This was due to a less than assumed increase in health care claim costs and trend assumption, as well as a refinement in the recognition of Medicare Part D government subsidy. The gain was partially offset by a decrease in the discount rate.
On July 26, 2004, the Centers of Medicare and Medicaid Services ("CMS") issued proposed regulations that provided guidance on the definition of actuarially equivalent retiree prescription drug coverage. These regulations aided in our third quarter of 2004 determination that the majority of our retiree prescription drug benefit coverage is actuarially equivalent to Medicare's Part D prescription drug plan and thus makes us eligible for the tax-free subsidy beginning in 2006. Accordingly, we conducted a mid-year remeasurementre-measurement during third quarter of 2004 of our retiree medical plans to reflect the recognition of the Medicare Modernization Act in accordance with FASB Staff Position FASFSP No. 106-2, "Accounting and Disclosure Requirements Related to the Medicare Prescription Drug, Improvement and Modernization Act of 2003". This caused an actuarial gain of approximately $22.5 million for the medical plans. In addition, it also caused the net periodic benefit cost for 2004 to change for the fourth quarter. The 2004 service cost decreased by approximately $0.2 million, interest cost decreased approximately $0.4 million and the actuarial loss amortization decreased by $0.1 million.
Effective During 2006, the total Medicare subsidies we received and accrued for 2004, we moved to a 100% self insured medical plan for both the active and retiree participants. A co-pay structure that varies by benefit type and a coinsurance provision were added to the plans. Due to the changes, the premium structures and associated participant contribution rates changed.
These changes were reflected in 2003 and increased the accumulated postretirement benefit obligation by $5.1$0.9 million.
Also effective January 1, 2004, a $1.0 million cap on active and retiree employer-provided life insurance was implemented. This cap only affected a small group of previously grandfathered employees. For those currently over the $1.0 million amount, their cap will be set equal to their coverage level as of January 1, 2004. This change was reflected in 2003 and resulted in a decrease in the accumulated postretirement benefit obligation by $0.1 million.
�� There was an aggregate actuarial liability loss of $22.3 million during 2004 for the other postretirement benefit plans. Of this, $44.8 million was due to an actuarial liability loss experience primarily due to the 25 basis point drop in the discount rate and an increase in the health care cost trend rate. However, this loss was partially offset by the $22.5 million in actuarial liability gain due to the recognition of the Medicare Modernization Act.
An actuarial liability gain of $55.0 million occurred during 2003 for the other postretirement benefit plans. This was due to the demographic experience of the active employees (higher turnover rates than expected), a change in demographic assumptions including an increase in the turnover rates, which more appropriately reflects past experience and our expectations for the future and only a slight increase in our claim cost per capita assumptions from the previous
year. Claim costs are developed by looking at the plan's actual experience. Slightly offsetting these gains was a loss created by a lower discount rate assumption.
The accumulated benefit obligation for all defined benefit pension plans was $1,098.6 million and $976.8 million at December 31, 2004, and 2003, respectively.
Information for pension plans with an accumulated benefit obligation in excess of plan assets:
The obligations below relate only to the nonqualified pension plan liabilities. TheAs noted previously, the nonqualified plans have assets that are houseddeposited in trusts that fail to meet the requirements to be included in plan assets under SFAS 87,assets; however, these assets are included in our consolidated statements of financial position.position.
| | December 31, | December 31, | ||||||||||
|---|---|---|---|---|---|---|---|---|---|---|---|---|
| | 2004 | 2003 | 2006 | 2005 | ||||||||
| | (in millions) | (in millions) | ||||||||||
| Projected benefit obligation | $ | 233.3 | $ | 224.0 | $ | 275.6 | $ | 255.7 | ||||
| Accumulated benefit obligation | 179.6 | 157.0 | 216.4 | 203.9 | ||||||||
Information for other postretirement benefit plans with an accumulated postretirement benefit obligation in excess of plan assets:
| | December 31, | December 31, | ||||||||||
|---|---|---|---|---|---|---|---|---|---|---|---|---|
| | 2004 | 2003 | 2006 | 2005 | ||||||||
| | (in millions) | (in millions) | ||||||||||
| Accumulated postretirement benefit obligation | $ | 92.7 | $ | 88.3 | $ | 2.1 | $ | 2.3 | ||||
| Fair value of plan assets | 90.3 | 84.6 | 2.0 | 1.6 | ||||||||
Principal Financial Group, Inc.
Notes to Consolidated Financial Statements — (continued)
14. Employee and Agent Benefits — (continued)
Components of net periodic benefit cost (in millions):cost:
| | Pension benefits | Other postretirement benefits | ||||||||||||||||||||||||||||||||||||
|---|---|---|---|---|---|---|---|---|---|---|---|---|---|---|---|---|---|---|---|---|---|---|---|---|---|---|---|---|---|---|---|---|---|---|---|---|---|---|
| | Pension benefits | Other postretirement benefits | For the year ended December 31, | |||||||||||||||||||||||||||||||||||
| | For the year ended December 31, | For the year ended December 31, | 2006 | 2005 | 2004 | 2006 | 2005 | 2004 | ||||||||||||||||||||||||||||||
| | 2004 | 2003 | 2002 | 2004 | 2003 | 2002 | (in millions) | |||||||||||||||||||||||||||||||
| Service cost | $ | 49.6 | $ | 49.0 | $ | 36.5 | $ | 8.7 | $ | 12.3 | $ | 9.4 | $ | 47.0 | $ | 49.7 | $ | 49.6 | $ | 9.5 | $ | 10.0 | $ | 8.7 | ||||||||||||||
| Interest cost | 73.8 | 66.9 | 63.0 | 15.4 | 17.9 | 17.8 | 81.6 | 77.4 | 73.8 | 16.2 | 16.9 | 15.4 | ||||||||||||||||||||||||||
| Expected return on plan assets | (87.4 | ) | (74.8 | ) | (84.6 | ) | (27.6 | ) | (25.8 | ) | (32.8 | ) | (105.4 | ) | (96.2 | ) | (87.4 | ) | (32.4 | ) | (29.4 | ) | (27.6 | ) | ||||||||||||||
| Amortization of prior service cost (benefit) | 1.8 | 1.7 | 1.7 | (2.8 | ) | (3.2 | ) | (2.7 | ) | (9.0 | ) | 1.3 | 1.8 | (2.6 | ) | (2.6 | ) | (2.8 | ) | |||||||||||||||||||
| Amortization of transition (asset) obligation | (0.1 | ) | (0.5 | ) | (2.2 | ) | — | — | — | |||||||||||||||||||||||||||||
| Recognized net actuarial (gain) loss | 14.1 | 17.9 | (7.9 | ) | 0.5 | 2.7 | 0.2 | |||||||||||||||||||||||||||||||
| Amortization of transition asset | — | — | (0.1 | ) | — | — | — | |||||||||||||||||||||||||||||||
| Recognized net actuarial loss | 20.4 | 16.4 | 14.1 | 0.2 | 0.5 | 0.5 | ||||||||||||||||||||||||||||||||
| Special termination and benefits | 1.8 | — | — | — | — | — | — | — | 1.8 | — | — | — | ||||||||||||||||||||||||||
| Curtailment gain | (13.8 | ) | — | — | (5.4 | ) | — | — | — | — | (13.8 | ) | — | — | (5.4 | ) | ||||||||||||||||||||||
| Net periodic benefit cost (income) | $ | 39.8 | $ | 60.2 | $ | 6.5 | $ | (11.2 | ) | $ | 3.9 | $ | (8.1 | ) | $ | 34.6 | $ | 48.6 | $ | 39.8 | $ | (9.1 | ) | $ | (4.6 | ) | $ | (11.2 | ) | |||||||||
The pension plans' actuarial gains and losses are amortized using a straight-line amortization method over the average remaining service period of employees. For the qualified pension plan, there is no corridor recognized in determining the amount to amortize; for the nonqualified pension plans, the corridor allowed under SFAS 87 is used.
| | Pension benefits | Other postretirement benefits | ||||||||||
|---|---|---|---|---|---|---|---|---|---|---|---|---|
| | For the year ended December 31, | |||||||||||
| | 2006 | 2005 | 2006 | 2005 | ||||||||
| | (in millions) | |||||||||||
| Other changes recognized in accumulated other comprehensive income (Post-SFAS 158) | ||||||||||||
| Net actuarial (gain)/loss | $ | 113.5 | $ | — | $ | (59.5 | ) | $ | — | |||
| Prior service benefit | (61.7 | ) | — | (14.6 | ) | — | ||||||
| Total recognized in accumulated other comprehensive income | $ | 51.8 | $ | — | $ | (74.1 | ) | $ | — | |||
| Total recognized in net periodic benefit cost and accumulated other comprehensive income | $ | 86.4 | $ | — | $ | (83.2 | ) | $ | — | |||
For 2006, net actuarial (gain) loss and net prior service benefits are immediately recognized in accumulated other comprehensive income.
The estimated net actuarial loss and prior service (benefit) that will be amortized from accumulated other comprehensive income into net periodic benefit cost for the pension benefits during the 2007 fiscal year are $10.0 million and $(8.3) million, respectively. The estimated net actuarial (gain) and prior service (benefit) for the postretirement benefits that will be amortized from accumulated other comprehensive income into net periodic benefit cost during the 2007 fiscal year are $(1.9) million and $(2.6) million, respectively.
Principal Financial Group, Inc.
Notes to Consolidated Financial Statements — (continued)
14. Employee and Agent Benefits — (continued)
Additional information:
| | Pension benefits | Other postretirement benefits | ||||||||
|---|---|---|---|---|---|---|---|---|---|---|
| | For the year ended December 31, | |||||||||
| | 2004 | 2003 | 2004 | 2003 | ||||||
| | (in millions) | |||||||||
| Increase in minimum liability included in other comprehensive income | $ | 4.3 | $ | 3.9 | N/A | N/A | ||||
| | Pension benefits | Other postretirement benefits | ||||||||
|---|---|---|---|---|---|---|---|---|---|---|
| | For the year ended December 31, | |||||||||
| | 2006 | 2005 | 2006 | 2005 | ||||||
| | (in millions) | |||||||||
| Increase (decrease) in minimum liability included in other comprehensive income (Pre-SFAS 158) | $ | (4.2 | ) | $ | 9.5 | $— | $— | |||
Assumptions:
Weighted-average assumptions used to determine benefit obligations as disclosed under the Obligations and Funded Status section
| | Pension benefits | Other postretirement benefits | Pension benefits | Other postretirement benefits | |||||||||||||
|---|---|---|---|---|---|---|---|---|---|---|---|---|---|---|---|---|---|
| | December 31, | For the year ended December 31, | |||||||||||||||
| | 2004 | 2003 | 2004 | 2003 | 2006 | 2005 | 2006 | 2005 | |||||||||
| Discount rate | 6.00% | 6.25% | 6.00% | 6.25% | 6.15 | % | 5.75 | % | 6.15 | % | 5.75 | % | |||||
| Rate of compensation increase | 5.00% | 5.00% | 5.00% | 5.00% | 5.00 | % | 5.00 | % | 5.00 | % | 5.00 | % | |||||
Weighted-average assumptions used to determine net periodic benefit cost
| | Pension benefits | Other postretirement benefits | Pension benefits | Other postretirement benefits | ||||||||||||||||||||
|---|---|---|---|---|---|---|---|---|---|---|---|---|---|---|---|---|---|---|---|---|---|---|---|---|
| | For the year ended December 31, | For the year ended December 31, | ||||||||||||||||||||||
| | 2004 | 2003 | 2002 | 2004 | 2003 | 2002 | 2006 | 2005 | 2004 | 2006 | 2005 | 2004 | ||||||||||||
| Discount rate | 6.25%/6.50%* | 6.50% | 7.50% | 6.25%/6.50%* | 6.50% | 7.50% | 5.75% | 6.00% | 6.25%/6.50%* | 5.75% | 6.00% | 6.25%/6.50%* | ||||||||||||
| Expected long-term return on plan assets | 8.50% | 8.50% | 9.00% | 7.31% | 7.36% | 9.11% | 8.25% | 8.50% | 8.50% | 7.30% | 7.30% | 7.31% | ||||||||||||
| Rate of compensation increase | 5.00% | 5.00% | 5.00% | 5.00% | 5.00% | 5.00% | 5.00% | 5.00% | 5.00% | 5.00% | 5.00% | 5.00% | ||||||||||||
- *
- The discount rate used to calculate the benefit expense for the first three quarters of 2004 expense
forrelated to the home office pension and other postretirement benefit plans and retiree medical planswere based on awas 6.25%. The discountrate. Therate used to calculate the benefit expense for the last quarter of 2004 wasbased on a6.50%discount rate. The change in rates occurred due to the third quarter 2004 remeasurement for the Principal Residential Mortgage, Inc. divestiture and Medicare Modernization Act. A remeasurement did not occur on the agents and managers pension and other non-medical postretirement benefit plans.
For other postretirement benefits, the 7.31%7.30% rate for 20042006 is based on the weighted average expected long-term asset returns for the medical, life and long-term care plans. The expected long-term rates for the medical, life and long-term care plans are 7.25%, 7.75% and 7.75%5.85%, respectively.
The expected return on plan assets is the long-term rate we expect to be earned based on the plans' investment strategy. Historical and expected future returns of multiple asset classes were analyzed to develop a risk free rate of return and risk premiums for each asset class. The overall rate for each asset class was developed by combining a long-term inflation component, the risk free real rate of return and the associated risk premium. A weighted average rate was developed based on those overall rates and the target asset allocation of the plans. Based on a review in 2005, the long term expected return on plan assets was lowered for the 2006 pension expense calculation.
Principal Financial Group, Inc.
Notes to Consolidated Financial Statements — (continued)
14. Employee and Agent Benefits — (continued)
Assumed health care cost trend rates
| | For the year ended December 31, | December 31, | |||||||
|---|---|---|---|---|---|---|---|---|---|
| | 2004 | 2003 | 2006 | 2005 | |||||
| Health care cost trend rate assumed for next year under age 65 | 14.45% | 12.50% | 12.0 | % | 13.0 | % | |||
| Health care cost trend rate assumed for next year age 65 and over | 12.75% | 12.50% | 11.0 | % | 13.0 | % | |||
| Rate to which the cost trend rate is assumed to decline (the ultimate trend rate) | 5.0% | 5.0% | 5.0 | % | 5.0 | % | |||
| Year that the rate reaches the ultimate trend rate | 2016 | 2010 | 2018 | 2017 | |||||
Assumed health care cost trend rates have a significant effect on the amounts reported for the health care plans. A one-percentage-point change in assumed health care cost trend rates would have the following effects:
| | 1-percentage- point increase | 1-percentage- point decrease | 1-percentage- point increase | 1-percentage- point decrease | ||||||||||
|---|---|---|---|---|---|---|---|---|---|---|---|---|---|---|
| | (in millions) | (in millions) | ||||||||||||
| Effect on total of service and interest cost components | $ | 5.1 | $ | (3.2 | ) | $ | 5.5 | $ | (4.3 | ) | ||||
| Effect on accumulated postretirement benefit obligation | 45.9 | (37.5 | ) | (44.8 | ) | 36.6 | ||||||||
Pension Plan Assets
The qualified pension plan's weighted-average asset allocations by asset category as of the two most recent measurement dates are as follows:
| | | October 1, | | October 1, | ||||||||
|---|---|---|---|---|---|---|---|---|---|---|---|---|
| Asset category | Asset category | Asset category | ||||||||||
| 2004 | 2003 | 2006 | 2005 | |||||||||
| Domestic equity securities | Domestic equity securities | 57 | % | 58 | % | Domestic equity securities | 54 | % | 54 | % | ||
| International equity securities | International equity securities | 10 | 10 | International equity securities | 14 | 14 | ||||||
| Domestic debt securities | Domestic debt securities | 25 | 27 | Domestic debt securities | 23 | 23 | ||||||
| Real estate | Real estate | 8 | 5 | Real estate | 9 | 9 | ||||||
| Total | 100 | % | 100 | % | Total | 100 | % | 100 | % | |||
Our investment strategy is to achieve the following:
- •
- Obtain a reasonable long-term return consistent with the level of risk assumed and at a cost of operation within prudent levels. Performance benchmarks are monitored.
- •
- Ensure
thatsufficientcash is on handliquidity to meet the emerging benefit liabilities for the plan. - •
- Provide for diversification of assets in an effort to avoid the risk of large losses and maximize the investment return to the pension plan consistent with market and economic risk.
In administering the qualified pension plan's asset allocation strategy, we consider the projected liability stream of benefit payments, the relationship between current and projected assets of the plan and the projected actuarial liabilities streams, the historical performance of capital markets adjusted for the perception of future short- and long-term capital market performance and the perception of future economic conditions.
The overall target asset allocation for the qualified plan assets is:
| Asset category | Target allocation | |
|---|---|---|
| Domestic equity securities | 40% - 60% | |
| International equity securities | 5% - 15% | |
| Domestic debt securities | 20% - 30% | |
| International debt securities | 0% - 7% | |
| Real estate | 3% - 10% | |
| Other | 0% - 7% |
Principal Financial Group, Inc.
Notes to Consolidated Financial Statements — (continued)
14. Employee and Agent Benefits — (continued)
For 20042006 and 2003,2005, respectively, the plan assets include $26.6 million and $66.8 millionnone of our stock. Prior to April 30, 2005, the plan held our stock in Principal Financial Group stock held under a separate account under an annuity contract. These assets were received in the qualified defined benefit plan as a result of the 2001 demutualization. We have a plan in place to liquidate theseThese holdings which we are planning to complete inwere liquidated as of April 30, 2005.
Other Postretirement Benefit Plans'Plan Assets
The other postretirement benefit plans' weighted-average asset allocations by asset category as of the two most recent measurement dates are as follows:
| | | October 1, | | October 1, | ||||||||
|---|---|---|---|---|---|---|---|---|---|---|---|---|
| Asset category | Asset category | Asset category | ||||||||||
| 2004 | 2003 | 2006 | 2005 | |||||||||
| Equity securities | Equity securities | 50 | % | 47 | % | Equity securities | 58 | % | 55 | % | ||
| Debt securities | Debt securities | 50 | 53 | Debt securities | 42 | 45 | ||||||
| Total | 100 | % | 100 | % | Total | 100 | % | 100 | % | |||
The weighted average target asset allocation for the other postretirement benefit plans is:
| Asset category | Target allocation | ||
|---|---|---|---|
| Equity securities | 50 - | % | |
| Debt securities | 30 - | % |
The investment strategies and policies for the other postretirement benefit plans are similar to those employed by the qualified pension plan.
Contributions
We expect to contribute roughly $1.5approximately $1.0 million to our other postretirement benefit plans in 2005.2007. Our funding policy for the qualified pension plan is to fund the plan annually in an amount at least equal to the minimum annual contribution required under ERISA and, generally, not greater than the maximum amount that can be deducted for federal income tax purposes. We don'tdo not anticipate that we will be required to fund a minimum annual contribution under ERISA for the qualified pension plan. At this time, it is too early to estimate the amount that may be contributed, but it is possible that we may fund the plans in 20052007 in the range of $10-$20-$50 million. This includes funding for both our qualified and nonqualified pension plans.
Estimated Future Benefit Payments
The following benefit payments, which reflect expected future service, expected to be paid and the amount of tax-free subsidy receipts under Medicare Part D expected to be received are:
| | Pension benefits | Other postretirement benefits (gross benefit payments, including prescription drug benefits) | Amount of Medicare part D subsidy receipts | ||||||
|---|---|---|---|---|---|---|---|---|---|
| | (in millions) | ||||||||
| Year ending December 31: | |||||||||
| 2005 | $ | 40.7 | $ | 16.8 | $ | 0.0 | |||
| 2006 | 42.8 | 18.5 | 0.9 | ||||||
| 2007 | 45.6 | 20.7 | 0.9 | ||||||
| 2008 | 49.5 | 23.0 | 1.0 | ||||||
| 2009 | 54.1 | 25.8 | 1.2 | ||||||
| 2010 - 2014 | 341.1 | 175.2 | 8.4 | ||||||
| | Pension benefits | Other postretirement benefits (gross benefit payments, including prescription drug benefits) | Amount of Medicare Part D subsidy receipts | |||||||
|---|---|---|---|---|---|---|---|---|---|---|
| | (in millions) | |||||||||
| Year ending December 31: | ||||||||||
| 2007 | $ | 51.5 | $ | 18.7 | $ | 1.0 | ||||
| 2008 | 55.1 | 20.5 | 1.2 | |||||||
| 2009 | 59.1 | 22.6 | 1.3 | |||||||
| 2010 | 63.9 | 25.0 | 1.5 | |||||||
| 2011 | 69.7 | 27.7 | 1.7 | |||||||
| 2012-2016 | 448.4 | 182.0 | 12.2 | |||||||
The above table reflects the total estimated future benefits to be paid from the plan, including both our share of the benefit cost and the participants' share of the cost, which is funded by their contributions to the plan.
The assumptions used in calculating the estimated future benefit payments are the same as those used to measure the benefit obligation for the year ended December 31, 2004.2006.
Principal Financial Group, Inc.
Notes to Consolidated Financial Statements — (continued)
14. Employee and Agent Benefits — (continued)
The information that follows shows supplemental information for our defined benefit pension plans. Certain key summary data is shown separately for qualified and non-qualified plans.
| | For the year ended December 31, | For the year ended December 31, | ||||||||||||||||||||||||||||||||||||
|---|---|---|---|---|---|---|---|---|---|---|---|---|---|---|---|---|---|---|---|---|---|---|---|---|---|---|---|---|---|---|---|---|---|---|---|---|---|---|
| | 2004 | 2003 | 2006 | 2005 | ||||||||||||||||||||||||||||||||||
| | Qualified plan | Nonqualified plans | Total | Qualified plan | Nonqualified plans | Total | Qualified plan | Nonqualified plans | Total | Qualified plan | Nonqualified plans | Total | ||||||||||||||||||||||||||
| | (in millions) | (in millions) | ||||||||||||||||||||||||||||||||||||
| Reconciliation of funded status to amount recognized | ||||||||||||||||||||||||||||||||||||||
| Benefit obligation, end of the year | $ | (1,078.8 | ) | $ | (233.3 | ) | $ | (1,312.1 | ) | $ | (967.4 | ) | $ | (224.0 | ) | $ | (1,191.4 | ) | $ | — | $ | — | $ | — | $ | (1,186.0 | ) | $ | (255.7 | ) | $ | (1,441.7 | ) | |||||
| Fair value of plan assets, end of the year | 1,156.4 | — | 1,156.4 | 1,033.5 | — | 1,033.5 | — | — | — | 1,297.8 | — | 1,297.8 | ||||||||||||||||||||||||||
| Funded (underfunded) status | 77.6 | (233.3 | ) | (155.7 | ) | 66.1 | (224.0 | ) | (157.9 | ) | — | — | — | 111.8 | (255.7 | ) | (143.9 | ) | ||||||||||||||||||||
| Unrecognized net actuarial loss | 97.6 | 68.3 | 165.9 | 85.5 | 80.1 | 165.6 | — | — | — | 111.5 | 89.7 | 201.2 | ||||||||||||||||||||||||||
| Unrecognized prior service cost (benefit) | 10.5 | (6.5 | ) | 4.0 | 15.3 | (9.3 | ) | 6.0 | ||||||||||||||||||||||||||||||
| Unrecognized transition (asset) liability | — | — | — | (0.2 | ) | 0.1 | (0.1 | ) | ||||||||||||||||||||||||||||||
| Unrecognized prior service benefit | — | — | — | (51.0 | ) | (20.3 | ) | (71.3 | ) | |||||||||||||||||||||||||||||
| Net amount recognized | $ | 185.7 | $ | (171.5 | ) | $ | 14.2 | $ | 166.7 | $ | (153.1 | ) | $ | 13.6 | $ | — | $ | — | $ | — | $ | 172.3 | $ | (186.3 | ) | $ | (14.0 | ) | ||||||||||
| Amounts recognized in statement of financial position | ||||||||||||||||||||||||||||||||||||||
| Amounts recognized in statement of financial position (Pre-SFAS 158) | ||||||||||||||||||||||||||||||||||||||
| Prepaid benefit cost | $ | 185.7 | $ | — | $ | 185.7 | $ | 166.7 | $ | — | $ | 166.7 | $ | — | $ | — | $ | — | $ | 172.3 | $ | — | $ | 172.3 | ||||||||||||||
| Accrued benefit liability including minimum liability | — | (179.6 | ) | (179.6 | ) | — | (157.0 | ) | (157.0 | ) | — | — | — | — | (203.9 | ) | (203.9 | ) | ||||||||||||||||||||
| Accumulated other comprehensive income | — | 8.1 | 8.1 | — | 3.9 | 3.9 | — | — | — | — | 17.6 | 17.6 | ||||||||||||||||||||||||||
| Net amount recognized | $ | 185.7 | $ | (171.5 | ) | $ | 14.2 | $ | 166.7 | $ | (153.1 | ) | $ | 13.6 | $ | — | $ | — | $ | — | $ | 172.3 | $ | (186.3 | ) | $ | (14.0 | ) | ||||||||||
| Amount recognized in statement of financial position (Post-SFAS 158) | ||||||||||||||||||||||||||||||||||||||
| Other assets | $ | 205.1 | $ | — | $ | 205.1 | $ | — | $ | — | $ | — | ||||||||||||||||||||||||||
| Other liabilities | — | (275.6 | ) | (275.6 | ) | — | — | — | ||||||||||||||||||||||||||||||
| Total | $ | 205.1 | $ | (275.6 | ) | $ | (70.5 | ) | $ | — | $ | — | $ | — | ||||||||||||||||||||||||
| Amount recognized in accumulated other comprehensive income (Post-SFAS 158) | ||||||||||||||||||||||||||||||||||||||
| Total net actuarial loss | $ | 24.2 | $ | 89.3 | $ | 113.5 | $ | — | $ | — | $ | — | ||||||||||||||||||||||||||
| Prior service benefit | (45.1 | ) | (16.6 | ) | (61.7 | ) | — | — | — | |||||||||||||||||||||||||||||
| Total accumulated other comprehensive income (not adjusted for applicable tax) | $ | (20.9 | ) | $ | 72.7 | $ | 51.8 | $ | — | $ | — | $ | — | |||||||||||||||||||||||||
| Components of net periodic benefit cost | ||||||||||||||||||||||||||||||||||||||
| Service cost | $ | 40.4 | $ | 9.2 | $ | 49.6 | $ | 41.5 | $ | 7.5 | $ | 49.0 | $ | 39.3 | $ | 7.7 | $ | 47.0 | $ | 41.9 | $ | 7.8 | $ | 49.7 | ||||||||||||||
| Interest cost | 59.9 | 13.9 | 73.8 | 55.4 | 11.5 | 66.9 | 67.2 | 14.4 | 81.6 | 63.7 | 13.7 | 77.4 | ||||||||||||||||||||||||||
| Expected return on plan assets | (87.4 | ) | — | (87.4 | ) | (74.8 | ) | — | (74.8 | ) | (105.4 | ) | — | (105.4 | ) | (96.2 | ) | — | (96.2 | ) | ||||||||||||||||||
| Amortization of prior service cost (benefit) | 3.7 | (1.9 | ) | 1.8 | 3.7 | (2.0 | ) | 1.7 | (5.9 | ) | (3.1 | ) | (9.0 | ) | 2.8 | (1.5 | ) | 1.3 | ||||||||||||||||||||
| Amortization of transition (asset) obligation | (0.2 | ) | 0.1 | (0.1 | ) | (1.6 | ) | 1.1 | (0.5 | ) | ||||||||||||||||||||||||||||
| Recognized net actuarial loss | 7.8 | 6.3 | 14.1 | 14.3 | 3.6 | 17.9 | 12.9 | 7.5 | 20.4 | 11.2 | 5.2 | 16.4 | ||||||||||||||||||||||||||
| Special termination benefits | — | 1.8 | 1.8 | — | — | — | ||||||||||||||||||||||||||||||||
| Curtailment gain | (13.2 | ) | (0.6 | ) | (13.8 | ) | — | — | — | |||||||||||||||||||||||||||||
| Net periodic benefit cost | $ | 11.0 | $ | 28.8 | $ | 39.8 | $ | 38.5 | $ | 21.7 | $ | 60.2 | $ | 8.1 | $ | 26.5 | $ | 34.6 | $ | 23.4 | $ | 25.2 | $ | 48.6 | ||||||||||||||
| Total recognized in net periodic benefit cost and accumulated other comprehensive income | $ | (12.8 | ) | $ | 99.2 | $ | 86.4 | $ | — | $ | — | $ | — | |||||||||||||||||||||||||
In addition, we have defined contribution plans that are generally available to all employees and agents who are 21 or older.agents. Eligible participants could not contribute more than $13,000$15,000 of their compensation to the plans in 2004. We match2006. Effective January 1, 2006, we made several changes to the participant'sretirement programs. In general, the pension and supplemental executive retirement plan benefit formulas were reduced, and the 401(k) matching contribution was increased. Employees who were age 47 or older
Principal Financial Group, Inc.
Notes to Consolidated Financial Statements — (continued)
14. Employee and Agent Benefits — (continued)
with at least ten years of service on December 31, 2005, could elect to retain the prior benefit provisions and forgo receipt of the additional matching contributions. The employees who elected to retain the prior benefit provisions are referred to as "Grandfathered Choice Participants". In 2006, we matched the Grandfathered Choice Participant's contribution at a 50% contribution rate up to a maximum contribution of 3% of the participant's compensation. For all other participants, we matched the participant's contributions at a 75% contribution rate up to a maximum of 6% of the participant's compensation. The defined contribution plans allow employees to choose among various investment options, including our common stock. Effective September 1, 2002, the employer stock fund was converted to an employee stock ownership plan. We contributed $36.4 million, $19.0 million and $18.6 million $18.5 millionin 2006, 2005, and $20.2 million in 2004, 2003, and 2002 respectively, to our qualified defined contribution plans.
We also have a nonqualified defined contribution plan available to select employees and agents who are age 21 and over which allows them to contribute amounts in excess of limits imposed by federal tax law. We matchIn 2006, we matched the participant's contributionGrandfathered Choice Participant's Contribution at a 50% contribution rate up to a maximum contribution of 3% of the participant's compensation. For all other participants, we matched the participant's contributions at a 75% contribution rate up to a maximum contribution of 6% of the participant's compensation. We contributed $8.0 million, $4.8 million and $4.5 million $3.7 millionin 2006, 2005, and $3.5 million in 2004, 2003, and 2002, respectively, to our nonqualified defined contribution plans.
As a result of the demutualization, the defined contribution plans received $19.7 million in compensation, which was allocated to participant accounts.
15. Contingencies, Guarantees and Indemnifications
Litigation
We are regularly involved in litigation, both as a defendant and as a plaintiff, but primarily as a defendant. Litigation naming us as a defendant ordinarily arises out of our business operations as a provider of asset management and accumulation products and services, life, health and disability insurance. Some of the lawsuits are class actions, or purport to be, and some include claims for punitive damages. In addition, regulatory bodies, such as state insurance departments, the SEC, the National Association of Securities Dealers, Inc., the Department of Labor and other regulatory bodies regularly make inquiries and conduct examinations or investigations concerning our compliance with, among other things, insurance laws, securities laws, ERISA and laws governing the activities of broker-dealers.
Several lawsuits have been filed against other insurance companies and insurance brokers alleging improper conduct relating to the payment and non-disclosure of contingent compensation and bid-rigging activity. Several of these suits were filed as purported class actions. Several state attorneys general and insurance regulators have initiated industry-wide inquiries or other actions relating to compensation arrangements between insurance brokers and insurance companies. Wecompanies and other industry issues. Beginning in March of 2005, we have received a subpoena on March 3, 2005subpoenas and interrogatories from the Officeoffices of the AttorneyAttorneys General of the State of New York and Connecticut seeking information onrelated to compensation agreements associated with brokers and agents and the sale of retirement products.products and services. We will cooperate fullyare cooperating with these inquiries. To date, none of these Attorneys General investigations has resulted in any action against us. We are, however, engaged in discussions with the inquiry.Connecticut and New York Attorney General's Office with respect to broker payments relating to sales of our single premium group annuity products, which primarily fund terminating defined benefit plans. At this point, we cannot predict the outcome of these discussions. We have received other requests from regulators and will continueother governmental authorities relating to cooperate with regulators regarding any inquiries about our business practices.other industry issues and may receive additional such requests, including subpoenas and interrogatories, in the future.
On December 23, 2004, a lawsuit was filed in Iowa state court against us and our wholly owned subsidiaries, Principal Life and Principal Financial Services, Inc., on behalf of a proposed class comprised of the settlement class in the Principal Life sales practices class action settlement, which was approved in April 2001 by the United States District Court for the Southern District of Iowa. This newmore recent lawsuit claims that the treatment of the settlement costs of that sales practices litigation in relation to the allocation of demutualization consideration to Principal Life policyholders was inappropriate. Demutualization allocation was done pursuant to the terms of a plan of demutualization approved by the policyholders in July 2001 and Insurancethe Commissioner of the State of Iowa in August 2001. The lawsuit further claims that such allocation was not accurately described to policyholders during the demutualization process and is a breach of the sales practices settlement. On January 27, 2005, we filed a notice to remove the action from the state court to the United States District Court for the Southern District of Iowa. We intendOn July 22, 2005, the plaintiff's motion to vigorouslyremand the action to state court was denied, and our motion to dismiss the lawsuit was granted. On September 21, 2005, the plaintiff's motion to alter or amend the judgment was denied. On October 4, 2005, the plaintiff filed a notice of appeal to the United States Court of Appeals for the Eighth Circuit. Oral argument was held on April 20, 2006. On October 20, 2006, the Court of Appeals affirmed our motion to dismiss.
On November 8, 2006, a trustee of Fairmount Park Inc. Retirement Savings Plan filed a putative class action lawsuit in the United States District Court for the Southern District of Illinois against Principal Life. The complaint alleges, among other things, that Principal Life breached its alleged fiduciary duties while performing services to 401(k) plans by failing to disclose, or adequately disclose, to employers or plan participants the fact that Principal Life receives "revenue sharing fees from mutual funds that are included in its pre-packaged 401(k) plans" and allegedly failed to use the revenue to defray the expenses of the services provided to the plans. Principal Life has filed its Answer and a Motion to Transfer and intends to aggressively defend this matter.the lawsuit. Plaintiff further alleges that these acts constitute prohibited transactions under ERISA. Plaintiff seeks to certify a class of all retirement plans to which Principal Life was a service provider and for which Principal Life received and retained "revenue sharing" fees from mutual funds. Plaintiff seeks declaratory, injunctive and monetary relief. Principal Life intends to aggressively defend the lawsuit.
Principal Financial Group, Inc.
Notes to Consolidated Financial Statements — (continued)
15. Contingencies, Guarantees and Indemnifications — (continued)
While the outcome of any pending or future litigation cannot be predicted, management does not believe that any pending litigation will have a material adverse effect on our business or financial position or net income.position. The outcome of litigation is always uncertain, and unforeseen results can occur. It is possible that such outcomes could materially affect net income in a particular quarter or annual period.
Guarantees and Indemnifications
In the normal course of business, we have provided guarantees to third parties primarily related to a former subsidiary, joint ventures and industrial revenue bonds. These agreements generally expire from 2004 through 2019. The maximum exposure under these agreements as of December 31, 2004,2006, was approximately $210.0$180.0 million; however, we believe the likelihood is remote that material payments will be required and therefore have not accrued for a liability on our consolidated statements of financial position. Should we be required to perform under these guarantees, we generally could recover a portion of the loss from third parties through recourse provisions included in agreements with such parties, the sale of assets held as collateral that can be liquidated in the event that performance is required under the guarantees or other recourse generally available to us, minimizing the impact to net income. The fair value oftherefore, such guarantees issued after January 1, 2003, was determined to be insignificant.
In connection with the 2002 sale of BT Financial Group, we agreed to indemnify the purchaser, Westpac, for among other things, the costs associated with potential late filings made by BT Financial Group in New Zealand prior to Westpac's ownership, up to a maximum of A$250.0 million Australian dollars (approximately U.S. $195.0 million as of December 31, 2004). New Zealand securities regulations allow Australian issuers to issue their securities in New Zealand provided that certain documents are appropriately filed with the New Zealand Registrar of Companies. Specifically, the regulations require that any amendments to constitutions and compliance plans be filed in New Zealand. In April 2003, the New Zealand Securities Commission ("the Commission") opined that such late filings would result in certain New Zealand investors having a right to return of their investment plus interest at 10% per annum from the date of investment. This technical issue affected many in the industry. On April 15, 2004, the New Zealand government enacted legislation that will provide issuers, including BT Financial Group, the opportunity for retroactive relief from such late filing violations. The law allows issuers to apply for judicial validation of non-compliant issuances resulting from late filings. The law further provides that judicial relief is mandatory and unconditional unless an investor was materially prejudiced by the late filing. Such judicial relief has been granted to BT Financial Group and Westpac with regard to the vast majority of affected investors. As a result, we do not believe that this matter will result in a material adverse effect on
our business or financial position. It is possible, however, that it could have a material adverse effect on net income in a particular quarter or annual period.
On December 24, 2004, Westpac lodged several warranty and indemnification claims related to the sale of BT Financial Group. Under the sale agreements, certain warranty claims were required to be lodged by December 31, 2004. The claims aggregate approximately A$50.0 million Australian dollars (approximately U.S. $40.0 million) with the majority of the claims (approximately A$45.0 million Australian dollars, or U.S. $35.0 million) related to fund pricing and accounting issues around a tax asset called future income tax benefit ("FITB"). FITB is an asset used in calculating unit pricing of funds. Westpac claims that BT Financial Group incorrectly accrued FITB assets in valuing asset portfolios of BT funds in Australia and New Zealand and that as a result fund values were overstated. We intend to vigorously defend against these claims. Although we cannot predict the outcome of this matter or reasonably estimate possible losses, we do not believe that it would result in a material adverse effect on our business or financial position. It is possible however, that itsuch outcomes could have a material adverse effect onmaterially affect net income in a particular quarter or annual period. The fair value of such guarantees is not material.
We are also subject to various other indemnification obligations issued in conjunction with certain transactions, primarily the sale of BT Financial Group, Principal Residential Mortgage, Inc., and other divestitures, acquisitions and financing transactions whose terms range in duration and often are not explicitly defined. Certain portions of these indemnifications may be capped, while other portions are not subject to such limitations; therefore, the overall maximum amount of the obligation under the indemnifications cannot be reasonably estimated. While we are unable to estimate with certainty the ultimate legal and financial liability with respect to these indemnifications, we believe the likelihood is remote that material payments would be required under such indemnifications and therefore such indemnifications would not result in a material adverse effect on our business or financial positionposition. It is possible that such outcomes could materially affect net income in a particular quarter or net income.annual period. The fair value of such indemnifications issued after January 1, 2003, was determined to be insignificant.
Operating Leases
As a lessee, we lease office space, data processing equipment, office furniture and office equipment under various operating leases. Rental expense for the year ended December 31, 2006, 2005 and 2004, respectively, was $47.5 million, $52.1 million and $46.2 million.
At December 31, 2006, the future minimum lease payments are $201.5 million. The following represents payments due by period for operating lease obligations as of December 31, 2006 (in millions).
| Year ending December 31: | ||||
| 2007 | $ | 56.4 | ||
| 2008 | 47.8 | |||
| 2009 | 37.3 | |||
| 2010 | 26.8 | |||
| 2011 | 17.0 | |||
| 2012 and thereafter | 30.2 | |||
| 215.5 | ||||
| Less future sublease rental income on noncancelable leases | 14.0 | |||
| Total future minimum lease payments | $ | 201.5 | ||
Principal Financial Group, Inc.
Notes to Consolidated Financial Statements — (continued)
15. Contingencies, Guarantees and Indemnifications — (continued)
Capital Lease
As a lessee, we lease an aircraft under a capital lease. As of December 31, 2006 and 2005, respectively, the aircraft had a gross asset balance of $14.4 million and accumulated depreciation of $1.1 million and $0.5 million. Depreciation expense for both the years ended December 31, 2006 and 2005, was $0.6 million.
At December 31, 2006, the future minimum lease payments are $17.9 million. The following represents payments due by period for capital lease obligations as of December 31, 2006 (in millions).
| Year ending December 31: | |||||
| 2007 | $ | 0.9 | |||
| 2008 | 1.0 | ||||
| 2009 | 1.1 | ||||
| 2010 | 1.1 | ||||
| 2011 | 1.2 | ||||
| 2012 and thereafter | 12.6 | ||||
| Total | $ | 17.9 | |||
Securities Posted as Collateral
We posted $364.9$484.5 million in securities under collateral agreements at December 31, 2004,2006, to satisfy collateral requirements primarily associated with our derivatives credit support agreements and a reinsurance arrangement with our U.S. Asset Management and Accumulation segment.
16. Stockholders' Equity
Preferred Stock
As of December 31, 2006, we had 13.0 million shares of preferred stock authorized, issued and outstanding under the two series described below. Preferred stockholders have dividend and liquidation priority over common stockholders.
Series A. On June 16, 2005, we issued 3.0 million shares of fixed rate, non-cumulative, Series A Perpetual Preferred Stock ("Series A Preferred Stock"), at an initial offering price of $100 per share. We received net proceeds of $296.0 million after offering costs. Dividends on the Series A Preferred Stock are non-cumulative and are payable quarterly when, and if, declared by our Board of Directors. Dividends commenced on September 30, 2005, at a rate of 5.563% per annum of the liquidation preference. On or after the dividend payment date in June 2015, the Series A initial distribution rate will become a floating rate, subject to reset, at our option, subject to certain conditions and parameters. If reset, the rate may be at fixed or floating rates. On or after the dividend payment date in June 2015, we may, at our option, redeem the shares at a price of $100 per share, or $300.0 million in the aggregate, plus accrued and unpaid dividends for the then current dividend period to the date of redemption, if any.
The Series A Preferred Stock has no stated maturity and is not convertible into any other of our securities. Series A Preferred Stock will have no voting rights, except with respect to certain fundamental changes in the terms of the shares and in the case of certain dividend non-payments.
Series B. On June 16, 2005, we issued 10.0 million shares of fixed rate, non-cumulative, Series B Perpetual Preferred Stock ("Series B Preferred Stock"), at an initial offering price of $25 per share. We received net proceeds of $246.0 million after offering costs. Dividends on the Series B Preferred Stock are non-cumulative and are payable quarterly when, and if, declared by the Board of Directors. Dividends commenced on September 30, 2005, at a rate of 6.518% per annum of the liquidation preference. On or after the dividend payment date in June 2035, the Series B initial distribution rate will become a floating rate, subject to reset, at our option, subject to certain conditions and parameters. If reset, the rate may be at fixed or floating rates. On or after the dividend payment date in June 2015, we may, at our option, redeem the shares at a price of $25 per share, or $250.0 million in the aggregate, plus accrued and unpaid dividends for the then current dividend period to the date of redemption, if any.
The Series B Preferred Stock has no stated maturity and is not convertible into any other of our securities. Series B Preferred Stock will have no voting rights, except with respect to certain fundamental changes in the terms of the shares and in the case of certain dividend non-payments.
Principal Financial Group, Inc.
Notes to Consolidated Financial Statements — (continued)
16. Stockholders' Equity — (continued)
Dividend Restrictions and Payments
The certificates of designations for the Series A and B Preferred Stock restrict the declaration of preferred dividends if we fail to meet specified capital adequacy, net income or stockholders' equity levels. As of December 31, 2006, we have no preferred dividend restrictions.
On March 30, 2006, June 30, 2006, October 2, 2006, and January 2, 2007, we paid a dividend of $8.3 million, $8.2 million, $8.3 million and $8.2 million, respectively, equal to $1.39 per share on Series A non-cumulative perpetual preferred stock and equal to $0.41 per share on Series B non-cumulative perpetual preferred stock. Dividends were paid to stockholders of record as of March 15, 2006, June 15, 2006, September 14, 2006, and December 14, 2006, respectively.
On September 30, 2005, and December 30, 2005, we paid a dividend of $9.4 million, and $8.3 million, respectively, equal to $1.59 per share and $1.39 per share, respectively, on Series A non-cumulative perpetual preferred stock and equal to $0.47 per share and $0.41 per share, respectively, on Series B non-cumulative perpetual preferred stock, to stockholders of record as of September 1, 2005, and December 15, 2005, respectively.
Common Stock
On December 15, 2006, we paid an annual dividend of $214.7 million, equal to $0.80 per share, to stockholders of record as of November 22, 2006. On December 16, 2005, we paid an annual dividend of $182.2 million, equal to $0.65 per share, to stockholders of record as of November 17, 2005. On December 17, 2004, we paid an annual dividend of $166.5 million, equal to $0.55 per share, to stockholders of record as of November 12, 2004.
On December 8, 2003,May 19, 2006, following our Board of Directors' share repurchase authorization, we entered into an accelerated common stock repurchase agreement with a third party investment bank for an aggregate purchase price of $500.0 million. On this date, we paid $500.0 million and received the initial delivery of 7.7 million common shares, while retaining the right to receive additional common shares depending on the volume weighted average share price of our common stock over the program's duration. The program was completed in November 2006. Under this program, we purchased 9.3 million common shares at an annual dividendaverage price of $145.3$53.59.
In June 2005, following our Board of Directors' share repurchase authorization of up to 15.0 million equalshares, we entered into an accelerated stock repurchase agreement with a third party investment bank for approximately 13.7 million shares of our common stock with an initial payment of $542.3 million, using cash proceeds from the preferred stock issuance. The transaction was subject to $0.45 per share,a market price adjustment provision based on the volume weighted average market price over the execution period, which could be settled in shares or cash. On October 3, 2005, we elected to stockholderssettle in cash. On November 10, 2005, the transaction was completed for an additional payment of record as of November 7, 2003. On December 9, 2002, we paid an annual dividend of $83.8 million, equal to $0.25 per share, to stockholders of record as of November 8, 2002.$84.0 million.
In the last twothree years, our Board of Directors has authorized various repurchase programs under which we are allowed to purchase shares of our outstanding common stock. Shares repurchased under these programs are accounted for as treasury stock, carried at cost and reflected as a reduction to stockholders' equity.
In May 2004,November 2006, our Board of Directors authorized a repurchase program of up to $700.0$250.0 million of our outstanding common stock. The repurchases have been made in the open market or through privately negotiated transactions, from time to time, depending on market conditions. As of December 31, 2004, $75.0 million remains outstanding2006, no purchases have been made under this repurchase program.
Principal Financial Group, Inc.
Notes to Consolidated Financial Statements — (continued)
16. Stockholders' Equity — (continued)
Reconciliation of Outstanding Shares
| | Series A Preferred Stock | Series B Preferred Stock | Common Stock | ||||
|---|---|---|---|---|---|---|---|
| | (in millions) | ||||||
| Outstanding shares at January 1, 2004 | — | — | 320.7 | ||||
| Shares issued | — | — | 1.6 | ||||
| Treasury stock acquired | — | — | (21.7 | ) | |||
| Outstanding shares at December 31, 2004 | — | — | 300.6 | ||||
| Shares issued | 3.0 | 10.0 | 2.2 | ||||
| Treasury stock acquired | — | — | (22.2 | ) | |||
| Outstanding shares at December 31, 2005 | 3.0 | 10.0 | 280.6 | ||||
| Shares issued | — | — | 2.3 | ||||
| Treasury stock acquired | — | — | (14.5 | ) | |||
| Outstanding shares at December 31, 2006 | 3.0 | 10.0 | 268.4 | ||||
Accumulated Other Comprehensive Income (Loss)
Comprehensive income (loss) includes all changes in stockholders' equity during a period except those resulting from investments by stockholders and distributions to stockholders.
The components of accumulated other comprehensive income were as follows:
| | Net unrealized gains (losses) on available- for-sale securities | Net unrealized gains (losses) on derivative instruments | Foreign currency translation adjustment | Minimum pension liability | Accumulated other comprehensive income | ||||||||||||
|---|---|---|---|---|---|---|---|---|---|---|---|---|---|---|---|---|---|
| | (in millions) | ||||||||||||||||
| Balances at January 1, 2002 | $ | 454.4 | $ | (34.1 | ) | $ | (272.8 | ) | $ | — | $ | 147.5 | |||||
| Net change in unrealized gains (losses) on fixed maturities, available-for-sale | 844.4 | — | — | — | 844.4 | ||||||||||||
| Net change in unrealized gains (losses) on equity securities, available-for-sale | 45.1 | — | — | — | 45.1 | ||||||||||||
| Net change in unrealized gains (losses) on equity method subsidiaries and minority interest adjustments | (7.3 | ) | — | — | — | (7.3 | ) | ||||||||||
| Adjustments for assumed changes in amortization pattern: | |||||||||||||||||
| Deferred policy acquisition costs | (121.6 | ) | — | — | — | (121.6 | ) | ||||||||||
| Unearned revenue reserves | 6.4 | — | — | — | 6.4 | ||||||||||||
| Net change in unrealized gains (losses) on derivative instruments | — | (114.6 | ) | — | — | (114.6 | ) | ||||||||||
| Net change in unrealized gains (losses) on policyholder dividend obligation | (33.6 | ) | — | — | — | (33.6 | ) | ||||||||||
| Provision for deferred income tax benefit (expense) | (257.2 | ) | 40.1 | — | — | (217.1 | ) | ||||||||||
| Change in net foreign currency translation adjustment | — | — | 86.6 | — | 86.6 | ||||||||||||
| Balances at December 31, 2002 | $ | 930.6 | $ | (108.6 | ) | $ | (186.2 | ) | $ | — | $ | 635.8 | |||||
| | Net unrealized gains on available-for-sale securities | Net unrealized losses on derivative instruments | Foreign currency translation adjustment | Minimum pension liability | Accumulated other comprehensive income | |||||||||||
|---|---|---|---|---|---|---|---|---|---|---|---|---|---|---|---|---|
| | (in millions) | |||||||||||||||
| Balances at January 1, 2004 | $ | 1,350.4 | $ | (59.0 | ) | $ | (117.6 | ) | $ | (2.5 | ) | $ | 1,171.3 | |||
| Net change in unrealized gains on fixed maturities, available-for-sale | 91.3 | — | — | — | 91.3 | |||||||||||
| Net change in unrealized gains on equity securities, available-for-sale | (4.1 | ) | — | — | — | (4.1 | ) | |||||||||
| Net change in unrealized gains on equity method subsidiaries and minority interest adjustments | (28.0 | ) | — | — | — | (28.0 | ) | |||||||||
| Adjustments for assumed changes in amortization pattern | 28.2 | — | — | — | 28.2 | |||||||||||
| Net change in unrealized losses on derivative instruments | — | 88.9 | — | — | 88.9 | |||||||||||
| Net change in unrealized gains on policyholder dividend obligation | (19.5 | ) | — | — | — | (19.5 | ) | |||||||||
| Change in net foreign currency translation adjustment | — | — | 32.8 | — | 32.8 | |||||||||||
| Change in minimum pension liability adjustment | — | — | — | (4.3 | ) | (4.3 | ) | |||||||||
| Net change in provision for deferred income tax benefit (expense) | (13.2 | ) | (31.1 | ) | (0.5 | ) | 1.5 | (43.3 | ) | |||||||
| Balances at December 31, 2004 | $ | 1,405.1 | $ | (1.2 | ) | $ | (85.3 | ) | $ | (5.3 | ) | $ | 1,313.3 | |||
| | Net unrealized gains (losses) on available- for-sale securities | Net unrealized gains (losses) on derivative instruments | Foreign currency translation adjustment | Minimum pension liability | Accumulated other comprehensive income | ||||||||||||
|---|---|---|---|---|---|---|---|---|---|---|---|---|---|---|---|---|---|
| | (in millions) | ||||||||||||||||
| Balances at January 1, 2003 | $ | 930.6 | $ | (108.6 | ) | $ | (186.2 | ) | $ | — | $ | 635.8 | |||||
| Net change in unrealized gains (losses) on fixed maturities, available-for-sale | 728.0 | — | — | — | 728.0 | ||||||||||||
| Net change in unrealized gains (losses) on equity securities, available-for-sale | 18.4 | — | — | — | 18.4 | ||||||||||||
| Net change in unrealized gains (losses) on equity method subsidiaries and minority interest adjustments | (7.8 | ) | — | — | — | (7.8 | ) | ||||||||||
| Adjustments for assumed changes in amortization pattern: | |||||||||||||||||
| Deferred policy acquisition costs | (48.2 | ) | — | — | — | (48.2 | ) | ||||||||||
| Unearned revenue reserves | 1.6 | — | — | — | 1.6 | ||||||||||||
| Net change in unrealized gains (losses) on derivative instruments | — | 76.3 | — | — | 76.3 | ||||||||||||
| Net change in unrealized gains (losses) on policyholder dividend obligation | (65.3 | ) | — | — | — | (65.3 | ) | ||||||||||
| Provision for deferred income tax benefit (expense) | (216.0 | ) | (26.7 | ) | — | 1.4 | (241.3 | ) | |||||||||
| Change in net foreign currency translation adjustment | — | — | 68.6 | — | 68.6 | ||||||||||||
| Change in minimum pension liability adjustment | — | — | — | (3.9 | ) | (3.9 | ) | ||||||||||
| Cumulative effect of accounting change, net of related income taxes | 9.1 | — | — | — | 9.1 | ||||||||||||
| Balances at December 31, 2003 | $ | 1,350.4 | $ | (59.0 | ) | $ | (117.6 | ) | $ | (2.5 | ) | $ | 1,171.3 | ||||
Principal Financial Group, Inc.
Notes to Consolidated Financial Statements — (continued)
16. Stockholders' Equity — (continued)
| | Net unrealized gains on available-for-sale securities | Net unrealized gains (losses) on derivative instruments | Foreign currency translation adjustment | Minimum pension liability | Accumulated other comprehensive income | |||||||||||
|---|---|---|---|---|---|---|---|---|---|---|---|---|---|---|---|---|
| | (in millions) | |||||||||||||||
| Balances at January 1, 2005 | $ | 1,405.1 | $ | (1.2 | ) | $ | (85.3 | ) | $ | (5.3 | ) | $ | 1,313.3 | |||
| Net change in unrealized gains on fixed maturities, available-for-sale | (834.0 | ) | — | — | — | (834.0 | ) | |||||||||
| Net change in unrealized gains on equity securities, available-for-sale | 6.3 | — | — | — | 6.3 | |||||||||||
| Net change in unrealized gains on equity method subsidiaries and minority interest adjustments | 20.2 | — | — | — | 20.2 | |||||||||||
| Adjustments for assumed changes in amortization pattern | 94.7 | — | — | — | 94.7 | |||||||||||
| Net change in unrealized losses on derivative instruments | — | 41.6 | — | — | 41.6 | |||||||||||
| Net change in unrealized gains on policyholder dividend obligation | 84.7 | — | — | — | 84.7 | |||||||||||
| Change in net foreign currency translation adjustment | — | — | 62.1 | — | 62.1 | |||||||||||
| Change in minimum pension liability adjustment | — | — | — | (9.5 | ) | (9.5 | ) | |||||||||
| Net change in provision for deferred income tax benefit | 227.0 | (16.5 | ) | 1.6 | 3.3 | 215.4 | ||||||||||
| Balances at December 31, 2005 | $ | 1,004.0 | $ | 23.9 | $ | (21.6 | ) | $ | (11.5 | ) | $ | 994.8 | ||||
| | Net unrealized gains (losses) on available- for-sale securities | Net unrealized gains (losses) on derivative instruments | Foreign currency translation adjustment | Minimum pension liability | Accumulated other comprehensive income | ||||||||||||
|---|---|---|---|---|---|---|---|---|---|---|---|---|---|---|---|---|---|
| | (in millions) | ||||||||||||||||
| Balances at January 1, 2004 | $ | 1,350.4 | $ | (59.0 | ) | $ | (117.6 | ) | $ | (2.5 | ) | $ | 1,171.3 | ||||
| Net change in unrealized gains (losses) on fixed maturities, available-for-sale | 91.3 | — | — | — | 91.3 | ||||||||||||
| Net change in unrealized gains (losses) on equity securities, available-for-sale | (4.1 | ) | — | — | — | (4.1 | ) | ||||||||||
| Net change in unrealized gains (losses) on equity method subsidiaries and minority interest adjustments | (28.0 | ) | — | — | — | (28.0 | ) | ||||||||||
| Adjustments for assumed changes in amortization pattern: | |||||||||||||||||
| Deferred policy acquisition costs | 31.5 | — | — | — | 31.5 | ||||||||||||
| Sales inducements | 0.5 | — | — | — | 0.5 | ||||||||||||
| Unearned revenue reserves | (3.8 | ) | — | — | — | (3.8 | ) | ||||||||||
| Net change in unrealized gains (losses) on derivative instruments | — | 88.9 | — | — | 88.9 | ||||||||||||
| Net change in unrealized gains (losses) on policyholder dividend obligation | (19.5 | ) | — | — | — | (19.5 | ) | ||||||||||
| Provision for deferred income tax benefit (expense) | (13.2 | ) | (31.1 | ) | (0.5 | ) | 1.5 | (43.3 | ) | ||||||||
| Change in net foreign currency translation adjustment | — | — | 32.8 | — | 32.8 | ||||||||||||
| Change in minimum pension liability | — | — | — | (4.3 | ) | (4.3 | ) | ||||||||||
| Balances at December 31, 2004 | $ | 1,405.1 | $ | (1.2 | ) | $ | (85.3 | ) | $ | (5.3 | ) | $ | 1,313.3 | ||||
Principal Financial Group, Inc.
Notes to Consolidated Financial Statements — (continued)
16. Stockholders' Equity — (continued)
| | Net unrealized gains on available-for-sale securities | Net unrealized gains on derivative instruments | Foreign currency translation adjustment | Unrecognized post-retirement benefit obligations | Minimum pension liability | Accumulated other comprehensive income | |||||||||||||
|---|---|---|---|---|---|---|---|---|---|---|---|---|---|---|---|---|---|---|---|
| | (in millions) | | |||||||||||||||||
| Balances at January 1, 2006 | $ | 1,004.0 | $ | 23.9 | $ | (21.6 | ) | $ | — | $ | (11.5 | ) | $ | 994.8 | |||||
| Net change in unrealized gains on fixed maturities, available-for-sale | (349.7 | ) | — | — | — | — | (349.7 | ) | |||||||||||
| Net change in unrealized gains on equity securities, available-for-sale | (11.4 | ) | — | — | — | — | (11.4 | ) | |||||||||||
| Net change in unrealized gains on equity method subsidiaries and minority interest adjustments | 26.7 | — | — | — | — | 26.7 | |||||||||||||
| Adjustments for assumed changes in amortization pattern | 8.1 | — | — | — | — | 8.1 | |||||||||||||
| Net change in unrealized gains on derivative instruments | — | 6.8 | — | — | — | 6.8 | |||||||||||||
| Net change in unrealized gains on policyholder dividend obligation | 33.7 | — | — | — | — | 33.7 | |||||||||||||
| Change in net foreign currency translation adjustment | — | — | (1.1 | ) | — | — | (1.1 | ) | |||||||||||
| Change in minimum pension liability | — | — | — | — | 4.2 | 4.2 | |||||||||||||
| Transition adjustment related to post-retirement benefit obligations | — | — | — | 22.3 | 13.4 | 35.7 | |||||||||||||
| Net change in provision for deferred income tax benefit (expense) | 119.3 | (2.4 | ) | (3.9 | ) | (7.8 | ) | (6.1 | ) | 99.1 | |||||||||
| Balances at December 31, 2006 | $ | 830.7 | $ | 28.3 | $ | (26.6 | ) | $ | 14.5 | $ | — | $ | 846.9 | ||||||
The following table sets forth the adjustments necessary to avoid duplication of items that are included as part of net income for a year that had been part of other comprehensive income in prior years:
| | For the year ended December 31, | |||||||||
|---|---|---|---|---|---|---|---|---|---|---|
| | 2004 | 2003 | 2002 | |||||||
| | (in millions) | |||||||||
| Unrealized gains on available-for-sale securities arising during the year | $ | 122.6 | $ | 604.9 | $ | 654.2 | ||||
| Adjustment for realized losses on available-for-sale securities included in net income | (10.1 | ) | (135.5 | ) | (252.5 | ) | ||||
| Unrealized gains on available-for-sale securities, as adjusted | $ | 112.5 | $ | 469.4 | $ | 401.7 | ||||
| | For the year ended December 31, | |||||||||
|---|---|---|---|---|---|---|---|---|---|---|
| | 2006 | 2005 | 2004 | |||||||
| | (in millions) | |||||||||
| Unrealized gains (losses) on available-for-sale securities arising during the year | $ | (164.7 | ) | $ | (366.8 | ) | $ | 122.6 | ||
| Adjustment for realized losses on available-for-sale securities included in net income | (4.2 | ) | (9.2 | ) | (10.1 | ) | ||||
| Unrealized gains (losses) on available-for-sale securities, as adjusted | $ | (168.9 | ) | $ | (376.0 | ) | $ | 112.5 | ||
The above table is presented net of income tax, derivatives in cash flow hedge relationships, PDO and related changes in the amortization patterns of DPAC, sales inducements and unearned revenue reserves.
Principal Financial Group, Inc.
Notes to Consolidated Financial Statements — (continued)
16. Stockholders' Equity — (continued)
Dividend Limitations
Under Iowa law, Principal Life may pay stockholder dividends only from the earned surplus arising from its business and must receive the prior approval of the Commissioner to pay a stockholder dividend if such a stockholder dividend would exceed certain statutory limitations. The current statutory limitation is the greater of 10% of Principal Life's policyholder surplus as of the preceding year-end or the net gain from operations from the previous calendar year. Based on this limitation and 20042006 statutory results, Principal Life could pay approximately $591.1$660.4 million in stockholder dividends in 20052007 without exceeding the statutory limitation.
17. Fair Value of Financial Instruments
The following discussion describes the methods and assumptions we utilize in estimating our fair value disclosures for financial instruments. Certain financial instruments, particularly policyholder liabilities other than investment-type contracts, are excluded from these fair value disclosure requirements. The techniques utilized in estimating the fair values of financial instruments are affected by the assumptions used, including discount rates and estimates of the amount and timing of future cash flows. Care should be exercised in deriving conclusions about our business, its value or financial position based on the fair value information of financial instruments presented below. The estimates shown are not necessarily indicative of the amounts that would be realized in a one-time, current market exchange of all of our financial instruments.
We define fair value as the quoted market prices for those instruments that are actively traded in financial markets. In cases where quoted market prices are not available, fair values are estimated using present value or other valuation techniques. The fair value estimates are made at a specific point in time, based on available market information and judgments about the financial instrument, including estimates of timing, amount of expected future cash flows and the credit standing of counterparties. Such estimates do not consider the tax impact of the realization of unrealized gains or losses. In many cases, the fair value estimates cannot be substantiated by comparison to independent markets. In addition, the disclosed fair value may not be realized in the immediate settlement of the financial instrument.
Fair values of public debt and equity securities have been determined by us from public quotations, when available. Private placement securities and other fixed maturities and equity securities are valued by discounting the expected total cash flows. Market rates used are applicable to the yield, credit quality and average maturity of each security.
Fair values of commercial and residential mortgage loans are determined by discounting the expected total cash flows using market rates that are applicable to the yield, credit quality and maturity of each loan.
Fair values of policy loans are estimated by discounting expected cash flows using a risk-free rate based on the U.S. Treasury curve.
The fair values for assets classified as policy loans, other investments excluding equity investments in subsidiaries and cash and cash equivalents and accrued investment income in the accompanying consolidated statements of financial position approximate their carrying amounts.
The fair values of our reserves and liabilities for investment-type insurance contracts are estimated using discounted cash flow analyses based on current interest rates being offered for similar contracts with maturities consistent with those remaining for the investment-type contracts being valued. Investment-type insurance contracts include insurance, annuity and other policy contracts that do not involve significant mortality or morbidity risk and that are only a portion of the policyholder liabilities appearing in the consolidated statements of financial position. Insurance contracts include insurance, annuity and other policy contracts that do involve significant mortality or morbidity risk. The fair values for our insurance contracts, other than investment-type contracts, are not required to be disclosed. We do consider, however, the various insurance and investment risks in choosing investments for both insurance and investment-type contracts.
Fair values for debt issues are estimated using discounted cash flow analysis based on our incremental borrowing rate for similar borrowing arrangements.
Principal Financial Group, Inc.
Notes to Consolidated Financial Statements — (continued)
17. Fair Value of Financial Instruments — (continued)
The carrying amounts and estimated fair values of our financial instruments were as follows:
| | December 31, | December 31, | ||||||||||||||||||||||||
|---|---|---|---|---|---|---|---|---|---|---|---|---|---|---|---|---|---|---|---|---|---|---|---|---|---|---|
| | 2004 | 2003 | 2006 | 2005 | ||||||||||||||||||||||
| | Carrying amount | Fair value | Carrying amount | Fair value | Carrying amount | Fair value | Carrying amount | Fair value | ||||||||||||||||||
| | (in millions) | (in millions) | ||||||||||||||||||||||||
| Assets (liabilities) | ||||||||||||||||||||||||||
| Fixed maturities, available-for-sale | $ | 40,916.3 | $ | 40,916.3 | $ | 37,418.4 | $ | 37,418.4 | $ | 44,403.5 | $ | 44,403.5 | $ | 42,117.2 | $ | 42,117.2 | ||||||||||
| Fixed maturities, trading | 93.0 | 93.0 | 102.9 | 102.9 | 323.4 | 323.4 | 113.2 | 113.2 | ||||||||||||||||||
| Equity securities, available-for-sale | 762.6 | 762.6 | 699.2 | 699.2 | 666.6 | 666.6 | 724.4 | 724.4 | ||||||||||||||||||
| Equity securities, trading | 181.0 | 181.0 | 90.3 | 90.3 | ||||||||||||||||||||||
| Mortgage loans | 11,714.5 | 12,771.2 | 11,251.6 | 12,419.0 | 11,663.9 | 12,166.7 | 11,484.3 | 12,319.7 | ||||||||||||||||||
| Policy loans | 814.5 | 814.5 | 804.1 | 804.1 | 850.7 | 930.7 | 827.7 | 925.6 | ||||||||||||||||||
| Other investments | 1,373.9 | 1,373.9 | 1,272.6 | 1,272.6 | 1,094.7 | 1,094.7 | 855.5 | 855.5 | ||||||||||||||||||
| Cash and cash equivalents | 452.5 | 452.5 | 1,192.5 | 1,192.5 | 1,590.8 | 1,590.8 | 1,639.3 | 1,639.3 | ||||||||||||||||||
| Investment-type insurance contracts | (30,145.1 | ) | (30,170.9 | ) | (27,254.1 | ) | (28,299.8 | ) | (34,256.6 | ) | (33,654.2 | ) | (31,210.5 | ) | (31,120.6 | ) | ||||||||||
| Short-term debt | (281.7 | ) | (281.7 | ) | (702.8 | ) | (702.8 | ) | (84.1 | ) | (84.1 | ) | (476.4 | ) | (476.4 | ) | ||||||||||
| Long-term debt | (843.5 | ) | (936.8 | ) | (1,374.3 | ) | (1,491.3 | ) | (1,553.8 | ) | (1,622.7 | ) | (898.8 | ) | (969.5 | ) | ||||||||||
18. Statutory Insurance Financial Information
Principal Life, the largest indirect subsidiary of Principal Financial Group, Inc., prepares statutory financial statements in accordance with the accounting practices prescribed or permitted by the Insurance Division of the Department of Commerce of the State of Iowa (the "State of Iowa"). The State of Iowa recognizes only statutory accounting practices prescribed or permitted by the State of Iowa for determining and reporting the financial condition and results of operations of an insurance company to determine its solvency under the Iowa Insurance Law. The National Association of Insurance Commissioners' ("NAIC")Accounting Practices and Procedures Manual has been adopted as a component of prescribed or permitted practices by the State of Iowa. The Commissioner has the right to permit other specific practices that deviate from prescribed practices.
In 2003 and 2002, Principal Life received written approval from the State of Iowa to recognize as admitted assets those assets pledged by Principal Life on behalf of a wholly owned subsidiary instead of nonadmitting such assets. At December 31, 2003, the statutory surplus of Principal Life was $707.0 million greater than it would have been if NAIC Statutory Accounting Principles had been followed for this transaction. This permitted practice has no effect on Principal Life's net income for the years then ended. As of December 31, 2004, there were no pledged assets on behalf of a wholly owned subsidiary.
Life and health insurance companies are subject to certain risk-based capital ("RBC") requirements as specified by the NAIC. Under those requirements, the amount of capital and surplus maintained by a life and health insurance company is to be determined based on the various risk factors related to it. At December 31, 2004,2006, Principal Life meets the minimum RBC requirements.
Statutory net income and statutory surplus of Principal Life were as follows:
| | As of or for the year ended December 31, | As of or for the year ended December 31, | ||||||||||||||||
|---|---|---|---|---|---|---|---|---|---|---|---|---|---|---|---|---|---|---|
| | 2004 | 2003 | 2002 | 2006 | 2005 | 2004 | ||||||||||||
| | (in millions) | (in millions) | ||||||||||||||||
| Statutory net income | $ | 512.7 | $ | 577.1 | $ | 402.1 | $ | 684.9 | $ | 666.2 | $ | 512.7 | ||||||
| Statutory surplus | 3,044.3 | 3,859.4 | 3,336.7 | 3,595.7 | 3,657.8 | 3,044.3 | ||||||||||||
19. Segment Information
We provide financial products and services through the following segments: U.S. Asset Management and Accumulation, International Asset Management and Accumulation and Life and Health Insurance. In addition, there is a Mortgage Banking (discontinued operations) and Corporate and Other segment. The segments are managed and reported separately because they provide different products and services, have different strategies or have different markets and distribution channels.
The U.S. Asset Management and Accumulation segment provides retirement and related financial products and services primarily to businesses, their employees and other individuals and provides asset management services to our asset accumulation business, the life and health insurance operations, the Corporate and Other segment and third-party clients.
Principal Financial Group, Inc.
Notes to Consolidated Financial Statements — (continued)
19. Segment Information — (continued)
The International Asset Management and Accumulation segment offers retirement products and services, annuities, long-term mutual funds and life insurance throughconsists of Principal International operations in Chile, Mexico, Hong Kong, Brazil, India, JapanChina, and Malaysia. On July 2, 2004, we closed the sale of all the stock of our Argentine companies, described further in Note 3. Prior to October 31, 2002, the operating segment included BT Financial Group, an Australia based asset manager. We sold substantially all of BT Financial Group effective October 31, 2002, described further in Note 3. Consequently, the results offocus on countries with favorable demographics and a trend toward private sector defined contribution pension systems. We entered these countries through acquisitions, start-up operations (excluding corporate overhead) for PI Argentina and BT Financial Group are reported as other after-tax adjustments for all periods presented.joint ventures.
The Life and Health insurance segment provides individual life insurance, group health insurance and specialty benefits, which consists of group dental and vision insurance, individual and group disability insurance and group life insurance, throughout the U.S.United States.
On July 1, 2004, we closed the sale of Principal Residential Mortgage, Inc. to CitiMortgage, Inc. The results of operations (excluding corporate overhead) for our Mortgage Banking segment, which includes Principal Residential Mortgage, Inc., are reported as other after-tax adjustments for all periods presented. See Note 3, Discontinued Operations, for further explanation.
The Corporate and Other segment manages the assets representing capital that has not been allocated to any other segment. Financial results of the Corporate and Other segment primarily reflect our financing activities (including
interest expense), income on capital not allocated to other segments, intersegmentinter-segment eliminations, income tax risks and certain income, expenses and other after-tax adjustments not allocated to the segments based on the nature of such items.
Management uses segment operating earnings for goal setting, determining employee compensation and evaluating performance on a basis comparable to that used by securities analysts. We determine segment operating earnings by adjusting U.S. GAAP net income available to common stockholders for net realized/unrealized capital gains and losses, as adjusted, and other after-tax adjustments which management believes are not indicative of overall operating trends. Net realized/unrealized capital gains and losses, as adjusted, are net of income taxes, related changes in the amortization pattern of DPAC and sales inducements, recognition of front-end fee revenues for sales charges on pension products and services, net realized capital gains and losses distributed, minority interest capital gains and losses and certain market value adjustments to fee revenues. Segment operating revenues exclude net realized/unrealized capital gains and their impact on recognition of front-end fee revenues and certain market value adjustments to fee revenues. While these items may be significant components in understanding and assessing the consolidated financial performance, management believes the presentation of segment operating earnings enhances the understanding of our results of operations by highlighting earnings attributable to the normal, ongoing operations of the business.
The accounting policies of the segments are consistent with the accounting policies for the consolidated financial statements, with the exception of capital allocation and income tax allocation. The Corporate and Other segment functions to absorb the risk inherent in interpreting and applying tax law. The segments are allocated tax adjustments consistent with the positions we took on tax returns. The Corporate and Other segment results reflect any differences between the tax returns and the estimated resolution of any disputes.
Principal Financial Group, Inc.
Notes to Consolidated Financial Statements — (continued)
19. Segment Information — (continued)
The following tables summarize selected financial information on a continuing basis by segment and reconcile segment totals to those reported in the consolidated financial statements:
| | | December 31, | | December 31, | ||||||||||
|---|---|---|---|---|---|---|---|---|---|---|---|---|---|---|
| | | 2004 | 2003 | | 2006 | 2005 | ||||||||
| | | (in millions) | | (in millions) | ||||||||||
| Assets: | Assets: | Assets: | ||||||||||||
| U.S. Asset Management and Accumulation | U.S. Asset Management and Accumulation | $ | 94,394.6 | $ | 83,904.8 | U.S. Asset Management and Accumulation | $ | 117,950.0 | $ | 103,506.1 | ||||
| International Asset Management and Accumulation | International Asset Management and Accumulation | 3,642.0 | 3,011.4 | International Asset Management and Accumulation | 8,101.0 | 6,856.2 | ||||||||
| Life and Health Insurance | Life and Health Insurance | 13,185.4 | 12,171.8 | Life and Health Insurance | 14,364.5 | 14,080.2 | ||||||||
| Mortgage Banking | — | 5,558.8 | ||||||||||||
| Corporate and Other | Corporate and Other | 2,576.1 | 3,107.6 | Corporate and Other | 3,242.6 | 2,592.9 | ||||||||
| Total consolidated assets | $ | 113,798.1 | $ | 107,754.4 | Total consolidated assets | $ | 143,658.1 | $ | 127,035.4 | |||||
| | | For the year ended December 31, | | For the year ended December 31, | ||||||||||||||||||
|---|---|---|---|---|---|---|---|---|---|---|---|---|---|---|---|---|---|---|---|---|---|---|
| | | 2004 | 2003 | 2002 | | 2006 | 2005 | 2004 | ||||||||||||||
| | | (in millions) | | (in millions) | ||||||||||||||||||
| Operating revenues by segment: | Operating revenues by segment: | Operating revenues by segment: | ||||||||||||||||||||
| U.S. Asset Management and Accumulation | U.S. Asset Management and Accumulation | $ | 3,741.9 | $ | 3,622.4 | $ | 3,750.0 | U.S. Asset Management and Accumulation | $ | 4,511.6 | $ | 4,133.8 | $ | 3,761.6 | ||||||||
| International Asset Management and Accumulation | International Asset Management and Accumulation | 518.4 | 399.5 | 348.7 | International Asset Management and Accumulation | 605.4 | 604.5 | 518.4 | ||||||||||||||
| Life and Health Insurance | Life and Health Insurance | 4,181.3 | 4,014.3 | 3,946.8 | Life and Health Insurance | 4,736.2 | 4,387.5 | 4,181.3 | ||||||||||||||
| Corporate and Other | Corporate and Other | (23.0 | ) | 26.8 | 1.6 | Corporate and Other | (27.4 | ) | (59.1 | ) | (23.0 | ) | ||||||||||
| Total segment operating revenues | 8,418.6 | 8,063.0 | 8,047.1 | Total segment operating revenues | 9,825.8 | 9,066.7 | 8,438.3 | |||||||||||||||
| Net realized/unrealized capital losses, including recognition of front-end fee revenues and certain market value adjustments to fee revenues | (114.9 | ) | (76.3 | ) | (419.9 | ) | ||||||||||||||||
| Add: | Add: | |||||||||||||||||||||
| Net realized/unrealized capital gains (losses), including recognition of front-end fee revenues and certain market value adjustments to fee revenues | 44.2 | (22.2 | ) | (114.9 | ) | |||||||||||||||||
| Subtract: | Subtract: | |||||||||||||||||||||
| Operating revenues from discontinued real estate investments | (0.5 | ) | 2.8 | 2.5 | ||||||||||||||||||
| Total revenues per consolidated statements of operations | $ | 8,303.7 | $ | 7,986.7 | $ | 7,627.2 | Total revenues per consolidated statements of operations | $ | 9,870.5 | $ | 9,041.7 | $ | 8,320.9 | |||||||||
| Operating earnings (loss) by segment, net of related income taxes: | Operating earnings (loss) by segment, net of related income taxes: | Operating earnings (loss) by segment, net of related income taxes: | ||||||||||||||||||||
| U.S. Asset Management and Accumulation | U.S. Asset Management and Accumulation | $ | 499.0 | $ | 422.6 | $ | 360.7 | U.S. Asset Management and Accumulation | $ | 645.1 | $ | 538.4 | $ | 499.0 | ||||||||
| International Asset Management and Accumulation | International Asset Management and Accumulation | 40.3 | 34.5 | 19.2 | International Asset Management and Accumulation | 71.8 | 71.0 | 40.3 | ||||||||||||||
| Life and Health Insurance | Life and Health Insurance | 256.2 | 241.2 | 233.1 | Life and Health Insurance | 282.5 | 274.4 | 256.2 | ||||||||||||||
| Mortgage Banking | Mortgage Banking | (10.3 | ) | (18.1 | ) | (16.7 | ) | Mortgage Banking | — | — | (10.3 | ) | ||||||||||
| Corporate and Other | Corporate and Other | (20.4 | ) | (12.5 | ) | (17.0 | ) | Corporate and Other | (27.3 | ) | (21.4 | ) | (20.4 | ) | ||||||||
| Total segment operating earnings, net of related income taxes | 764.8 | 667.7 | 579.3 | Total segment operating earnings, net of related income taxes | 972.1 | 862.4 | 764.8 | |||||||||||||||
| Net realized/unrealized capital losses, as adjusted | (62.3 | ) | (49.3 | ) | (247.3 | ) | ||||||||||||||||
| Net realized/unrealized capital gains (losses), as adjusted | Net realized/unrealized capital gains (losses), as adjusted | 18.0 | (20.6 | ) | (62.3 | ) | ||||||||||||||||
| Other after-tax adjustments(1) | Other after-tax adjustments(1) | 123.1 | 127.9 | (189.7 | ) | Other after-tax adjustments(1) | 41.2 | 59.5 | 123.1 | |||||||||||||
| Net income per consolidated statements of operations | $ | 825.6 | $ | 746.3 | $ | 142.3 | Net income available to common stockholders per consolidated statements of operations | $ | 1,031.3 | $ | 901.3 | $ | 825.6 | |||||||||
- (1)
- In 2006, other after-tax adjustments of $41.2 million included (1) the positive effect of: (a) gain on sales of real estate properties that qualify for discontinued operations treatment ($30.9 million) and (b) a favorable court ruling on a contested IRS issue for 1991 and later years ($18.8 million) and (2) the negative effect from a contribution to the Principal Financial Group, Inc. Foundation ($8.5 million).
In 2005, other after-tax adjustments of $59.5 million included (1) the positive effect of: (a) a decrease in income tax reserves established for IRS tax matters ($33.8 million); (b) gains on sales of real estate properties that qualify for discontinued operations treatment ($22.3 million); and (c) a change in the estimated loss on disposal of BT Financial Group ($8.4 million) and (2) the negative effect from a change in the estimated gain on disposal of Principal Residential Mortgage, Inc. ($5.0 million).
Principal Financial Group, Inc.
Notes to Consolidated Financial Statements — (continued)
19. Segment Information — (continued)
(1)The dilutive effect of the restricted stock units was less than 0.1 million shares in 2002 and 2003.- (1)
- The Employee Stock Purchase Plan, the
Principal Financial Group, Inc.Stock Incentive Plan, the Long-Term Performance Plan and thePrincipal Financial Group, Inc.Directors StockPlan.Plan were each approved by the Company's sole stockholder, Principal Mutual Holding Company, prior to the Company's initial public offering of Common Stock on October 22, 2001. TheCompany proposes to submit for the approval of stockholders at the 2005 annual meeting a new stock incentive plan and a new directors stock plan. The information called for by Item 12 pertaining to equity compensation is set forth in the Proxy Statement under the caption "Adoption of the Principal Financial Group, Inc.2005 Stock Incentive Plan— Equityand the 2005 Directors Stock Plan were each approved by the Company's stockholders on May 17, 2005. - (2)
- Includes 8,376,213 options outstanding under the employee stock incentive plans, 99,775 options outstanding under the directors stock plans, 793,149 performance shares under the employee stock incentive plans, 816,944 restricted stock units under the employee stock incentive plans, 18,712 restricted stock units under the directors stock plans, 61,670 units deferred in shares of Common Stock under the Long-Term Performance Plan, and 24,668 other stock-based awards under the Directors 2005 Stock Plan for obligations under the Deferred Compensation Plan
Information,"for Non-Employee Directors of Principal Financial Group, Inc. - (3)
- The weighted-average exercise price relates only to outstanding stock options, not to outstanding performance shares, restricted stock units, units deferred in shares of Common Stock under the Long-Term Performance Plan, or other stock-based awards.
- (4)
- This number includes 3,322,616 shares remaining for issuance under the Employee Stock Purchase Plan, 21,227,757 shares available for issuance in respect of future awards of stock options, stock appreciation rights, restricted stock, restricted stock units, performance shares, performance units, and
is incorporated herein by reference.other stock-based awards under the 2005 Stock Incentive Plan and 433,477 shares available for issuance in respect of future awards of stock options, restricted stock, restricted stock units, and other stock-based awards under the 2005 Directors Stock Plan. - a.
- Documents filed as part of this report.
- 1.
- Financial Statements (see Item 8. Financial Statements and Supplementary Data)
Report of Independent Registered Public Accounting Firm on Internal Control over Financial Reporting
Report of Independent Registered Public Accounting Firm
Audited Consolidated Financial Statements
Consolidated Statements of Financial Position
Consolidated Statements of Operations
Consolidated Statements of Stockholders' Equity
Consolidated Statements of Cash Flows
Notes to Consolidated Financial Statements - 2.
- Report of Independent Registered Public Accounting Firm on Schedules
Schedule I — Summary of Investments — Other Than Investments in Related Parties
Schedule II — Condensed Financial Information of Registrant (Parent Only)
Schedule III — Supplementary Insurance Information
Schedule IV — Reinsurance
- All other schedules for which provision is made in the applicable accounting regulation of the Securities and Exchange Commission are not required under the related instructions or are inapplicable and therefore have been omitted.
- 3.
- Exhibits
1(1)- Incorporated by reference to exhibit filed with Principal Financial Group, Inc.'s Registration Statement on Form S-1, as amended (Commission File No. 333-62558).
2(2)- Incorporated by reference to exhibit filed with Principal Financial Group, Inc.'s Quarterly Report on Form 10-Q for the quarter ended June 30, 2004 (Commission File No. 1-16725).
3(3)- Incorporated by reference to exhibit filed with Principal Financial Group, Inc.'s Quarterly Report on Form 10-Q for the quarter ended September 30, 2006 (Commission File No. 1-16725).
- (4)
- Incorporated by reference to exhibit filed with Principal Financial Group, Inc.'s Current Report on Form 8-K filed on June 17, 2005 (Commission File No. 1-16725).
- (5)
- Incorporated by reference to exhibit filed with Principal Financial Group, Inc.'s Current Report on Form 8-K filed on October 16, 2006 (Commission File No. 1-16725).
- (6)
- Incorporated by reference to exhibit filed with Principal Financial Group, Inc.'s Current Report on Form 8-K filed on December 6, 2006 (Commission File No. 1-16725).
- (7)
- Incorporated by reference to the exhibit filed with Principal Financial Group, Inc.'s Annual Report on Form 10-K for the year ended December 31, 2002 (Commission File No. 1-16725).
4(8)- Incorporated by reference to exhibit filed with Principal Financial Group, Inc.'s Annual Report on Form 10-K for the year ended December 31, 2004 (Commission File No. 1-16725).
- (9)
- Incorporated by reference to exhibit filed with Principal Financial Group, Inc.'s Quarterly Report on Form 10-Q for the quarter ended June 30, 2003 (Commission File No. 1-16725).
5(10)- Incorporated by reference to exhibit filed with Principal Financial Group, Inc.'s Current Report on Form 8-K filed on March 7, 2005 (Commission File No. 1-16725).
- (11)
- Incorporated by reference to exhibit filed with Principal Financial Group, Inc.'s Quarterly Report on Form 10-Q for the quarter ended June 30, 2005 (Commission File No. 1-16725).
- (12)
- Incorporated by reference to exhibit filed with Principal Financial Group, Inc.'s Quarterly Report on Form 10-Q for the quarter ended March 31, 2003 (Commission File No. 1-16725).
- (13)
- Incorporated by reference to the written description of such arrangement included in Principal Financial Group, Inc.'s Current Report on Form 8-K filed on August 28, 2006 (Commission File 1-16725).
6(14)- Incorporated by reference to exhibit filed with Principal Financial Group, Inc.'s Annual Report on Form 10-K for the year ended December 31, 2005 (Commission File No. 1-16725).
- (15)
- Incorporated by reference to exhibit filed with Principal Group, Inc.'s Quarterly Report on Form 10-Q for the quarter ended March 31, 2004 (Commission File No. 1-16725).
7(16)- Incorporated by reference to exhibit filed with Principal Financial Group, Inc.'s Quarterly Report on Form 10-Q for the quarter ended March 31, 2006 (Commission File No. 1-16725).
- (17)
- Incorporated by reference to exhibit filed with Principal Financial Group, Inc.'s Quarterly Report on Form 10-Q for the quarter ended March 31, 2002 (Commission File No. 1-16725).
b.Reports on Form 8-K
c.See Item 15(a)3.d.See Item 15(a)2.- (1)
- The amount shown in the Statement of Financial Position for mortgage loans differs from cost as mortgage loans are generally reported at cost adjusted for amortization of premiums and accrual of discounts, computed using the interest method, and net of valuation allowances.
- (2)
- The amounts shown in the Statement of Financial Position for real estate differ from cost due to properties which were determined to be impaired. The cost bases of these properties are reduced to fair value. Real estate expected to be disposed is carried at the lower of cost or fair value, less cost to sell, with valuation allowances established.
- (3)
- The amount shown in the Statement of Financial Position for other investments differs from cost due to accumulated earnings from minority interests in unconsolidated entities and properties owned jointly with venture partners and operated by the partners. Other investments also includes derivatives and certain seed money investments, which are reported at fair value.
- (1)
- Allocations of net investment income and certain operating expenses are based on a number of assumptions and estimates, and reported operating results would change by segment if different methods were applied.
- (1)
- Incorporated by reference to exhibit filed with Principal Financial Group, Inc.'s Registration Statement on Form S-1, as amended (Commission File No. 333-62558).
- (2)
- Incorporated by reference to exhibit filed with Principal Financial Group, Inc.'s Quarterly Report on Form 10-Q for the quarter ended June 30, 2004 (Commission File No. 1-16725).
- (3)
- Incorporated by reference to exhibit filed with Principal Financial Group, Inc.'s Quarterly Report on Form 10-Q for the quarter ended September 30, 2006 (Commission File No. 1-16725).
- (4)
- Filed herewith.
- (5)
- Incorporated by reference to exhibit filed with Principal Financial Group, Inc.'s Current Report on Form 8-K filed on June 17, 2005 (Commission File No. 1-16725).
- (6)
- Incorporated by reference to exhibit filed with Principal Financial Group, Inc.'s Current Report on Form 8-K filed on October 16, 2006 (Commission File No. 1-16725).
- (7)
- Incorporated by reference to exhibit filed with Principal Financial Group, Inc.'s Current Report on Form 8-K filed on December 6, 2006 (Commission File No. 1-16725).
- (8)
- Incorporated by reference to the exhibit filed with Principal Financial Group, Inc.'s Annual Report on Form 10-K for the year ended December 31, 2002 (Commission File No. 1-16725).
(4)(9)Filed herewith.Incorporated by reference to exhibit filed with Principal Financial Group, Inc.'s Annual Report on Form 10-K for the year ended December 31, 2004 (Commission File No. 1-16725).(5)(10)- Incorporated by reference to exhibit filed with Principal Financial Group, Inc.'s Quarterly Report on Form 10-Q for the quarter ended June 30, 2003 (Commission File No. 1-16725).
(6)(11)- Incorporated by reference to exhibit filed with Principal Financial Group, Inc.'s Current Report on Form 8-K filed on March 7, 2005 (Commission File No. 1-16725).
- (12)
- Incorporated by reference to exhibit filed with Principal Financial Group, Inc.'s Quarterly Report on Form 10-Q for the quarter ended June 30, 2005 (Commission File No. 1-16725).
- (13)
- Incorporated by reference to exhibit filed with Principal Financial Group, Inc.'s Quarterly Report on Form 10-Q for the quarter ended March 31, 2003 (Commission File No. 1-16725).
(7)(14)- Incorporated by reference to the written description of such arrangement included in Principal Financial Group, Inc.'s Current Report on Form 8-K filed on August 28, 2006 (Commission File 1-16725).
- (15)
- Incorporated by reference to the exhibit filed with Principal Financial Group, Inc.'s Annual Report on Form 10-K for the year ended December 31, 2005 (Commission File 1-16725).
- (16)
- Incorporated by reference to exhibit filed with Principal Financial Group, Inc.'s Quarterly Report on Form 10-Q for the quarter ended March 31, 2004 (Commission File No. 1-16725).
(8)(17)- Incorporated by reference to exhibit filed with Principal Financial Group, Inc.'s Quarterly Report on Form 10-Q for the quarter ended March 31, 2006 (Commission File No. 1-16725).
- (18)
- Incorporated by reference to exhibit filed with Principal Financial Group, Inc.'s Quarterly Report on Form 10-Q for the quarter ended March 31, 2002 (Commission File No. 1-16725).
In 2004, other after-tax adjustments of $123.1 million included (1) the positive effect of: (a) the discontinued operations and estimated gain on disposal of Principal Residential Mortgage, Inc. ($118.8 million) and (b) the discontinued operations and estimated gain on disposal of our Argentine companies ($10.0 million) and (2) the negative effect from a cumulative change in accounting principle related to the implementation of SOP 03-1 ($5.7 million).
In 2003, other after-tax adjustments of $127.9 million included (1) the positive effect of: (a) income from discontinued operations related to Principal Residential Mortgage, Inc. ($82.5 million); (b) a decrease in income tax reserves established for contested IRS tax audit matters ($28.9 million); and (c) a change in the estimated loss on disposal of BT Financial Group ($21.8 million) and (2) the negative effect of: (a) a cumulative effect of accounting change related to the implementation of FIN 46 ($3.4 million) and (b) a loss from discontinued operations related to our Argentine companies ($1.9 million).
In 2002, other after-tax adjustments of ($189.7) million included (1) the negative effects of: (a) a cumulative effect of accounting change related to the implementation of SFAS 142 ($280.9 million); (b) a loss from the discontinued operations and estimated loss on disposal of BT Financial Group ($196.7 million); (c) an increase to a loss contingency reserve established for sales practice litigation ($21.6 million); and (d) expenses related to the demutualization ($2.0 million) and (2) the positive effect of: (a) income from discontinued operations related to Principal Residential Mortgage, Inc. ($169.8 million); (b) the settlement of an IRS audit issue ($138.0 million); and (c) income from discontinued operations related to our Argentine companies ($3.7 million).
The following is a summary of income tax expense (benefit) allocated to our segments for purposes of determining operating earnings. Segment income taxes are reconciled to income taxes reported on our consolidated statements of operations.
| | | For the year ended December 31, | | For the year ended December 31, | ||||||||||||||||||
|---|---|---|---|---|---|---|---|---|---|---|---|---|---|---|---|---|---|---|---|---|---|---|
| | | 2004 | 2003 | 2002 | | 2006 | 2005 | 2004 | ||||||||||||||
| | | (in millions) | | (in millions) | ||||||||||||||||||
| Income tax expense (benefit) by segment: | Income tax expense (benefit) by segment: | Income tax expense (benefit) by segment: | ||||||||||||||||||||
| U.S. Asset Management and Accumulation | U.S. Asset Management and Accumulation | $ | 148.6 | $ | 129.8 | $ | 89.6 | U.S. Asset Management and Accumulation | $ | 186.0 | $ | 162.2 | $ | 148.6 | ||||||||
| International Asset Management and Accumulation | International Asset Management and Accumulation | 8.6 | 3.5 | 6.9 | International Asset Management and Accumulation | (10.0 | ) | (4.5 | ) | 8.6 | ||||||||||||
| Life and Health Insurance | Life and Health Insurance | 129.9 | 122.6 | 122.1 | Life and Health Insurance | 142.3 | 138.1 | 129.9 | ||||||||||||||
| Mortgage Banking | Mortgage Banking | (6.4 | ) | (11.2 | ) | (10.3 | ) | Mortgage Banking | — | — | (6.4 | ) | ||||||||||
| Corporate and Other | Corporate and Other | (50.5 | ) | (16.3 | ) | (31.5 | ) | Corporate and Other | (21.7 | ) | (48.5 | ) | (50.5 | ) | ||||||||
| Total segment income taxes from operating earnings | 230.2 | 228.4 | 176.8 | Total segment income taxes from operating earnings | 296.6 | 247.3 | 230.2 | |||||||||||||||
| Taxes related to net realized/unrealized capital losses, as adjusted | (51.1 | ) | (25.3 | ) | (135.7 | ) | ||||||||||||||||
| Taxes related to other after-tax adjustments | — | (26.1 | ) | (116.0 | ) | |||||||||||||||||
| Add: | Add: | |||||||||||||||||||||
| Tax expense (benefits) related to net realized/unrealized capital gains (losses), as adjusted | Tax expense (benefits) related to net realized/unrealized capital gains (losses), as adjusted | 12.1 | (10.6 | ) | (51.1 | ) | ||||||||||||||||
| Tax benefits related to other after-tax adjustments | (13.9 | ) | (3.5 | ) | — | |||||||||||||||||
| Subtract: | Subtract: | |||||||||||||||||||||
| Income tax expense (benefit) from discontinued real estate | (0.2 | ) | 1.0 | 0.9 | ||||||||||||||||||
| Total income tax expense (benefit) per consolidated statements of operations | $ | 179.1 | $ | 177.0 | $ | (74.9 | ) | |||||||||||||||
| Total income tax expense per consolidated statements of operations | $ | 295.0 | $ | 232.2 | $ | 178.2 | ||||||||||||||||
Principal Financial Group, Inc.
Notes to Consolidated Financial Statements — (continued)
19. Segment Information — (continued)
The following table summarizes operating revenues for our products and services:
| | For the year ended December 31, | |||||||||||
|---|---|---|---|---|---|---|---|---|---|---|---|---|
| | 2004 | 2003 | 2002 | |||||||||
| | (in millions) | |||||||||||
| U.S. Asset Management and Accumulation: | ||||||||||||
| Full-service accumulation | $ | 1,168.7 | $ | 1,099.5 | $ | 1,076.5 | ||||||
| Full-service payout | 811.8 | 862.5 | 1,191.8 | |||||||||
| Investment only | 931.6 | 905.9 | 886.4 | |||||||||
| Total pension | 2,912.1 | 2,867.9 | 3,154.7 | |||||||||
| Individual annuities | 393.8 | 354.9 | 303.8 | |||||||||
| Mutual funds | 182.1 | 121.1 | 113.8 | |||||||||
| Other and eliminations | (30.8 | ) | 7.7 | 1.7 | ||||||||
| Total U.S. Asset Accumulation | 3,457.2 | 3,351.6 | 3,574.0 | |||||||||
| Principal Global Investors | 343.4 | 313.4 | 216.4 | |||||||||
| Eliminations | (58.7 | ) | (42.6 | ) | (40.4 | ) | ||||||
| Total U.S. Asset Management and Accumulation | 3,741.9 | 3,622.4 | 3,750.0 | |||||||||
International Asset Management and Accumulation | 518.4 | 399.5 | 348.7 | |||||||||
Life and Health Insurance: | ||||||||||||
| Individual life insurance | 1,370.4 | 1,360.1 | 1,381.3 | |||||||||
| Health insurance | 1,806.9 | 1,746.7 | 1,708.3 | |||||||||
| Specialty benefits insurance | 1,004.0 | 907.5 | 857.2 | |||||||||
| Total Life and Health Insurance | 4,181.3 | 4,014.3 | 3,946.8 | |||||||||
Corporate and Other | (23.0 | ) | 26.8 | 1.6 | ||||||||
Total operating revenues | $ | 8,418.6 | $ | 8,063.0 | $ | 8,047.1 | ||||||
Total operating revenues | $ | 8,418.6 | $ | 8,063.0 | $ | 8,047.1 | ||||||
| Net realized/unrealized capital losses, including recognition of front-end fee revenues and certain market value adjustments to fee revenues | (114.9 | ) | (76.3 | ) | (419.9 | ) | ||||||
| Total U.S. GAAP revenues | $ | 8,303.7 | $ | 7,986.7 | $ | 7,627.2 | ||||||
| | For the year ended December 31, | |||||||||||
|---|---|---|---|---|---|---|---|---|---|---|---|---|
| | 2006 | 2005 | 2004 | |||||||||
| | (in millions) | |||||||||||
| U.S. Asset Management and Accumulation: | ||||||||||||
| Full-service accumulation | $ | 1,383.6 | $ | 1,267.4 | $ | 1,177.2 | ||||||
| Mutual funds | 344.9 | 206.6 | 182.1 | |||||||||
| Individual annuities | 582.8 | 471.6 | 393.8 | |||||||||
| Bank and trust services | 53.0 | 38.8 | 33.7 | |||||||||
| Eliminations | (168.8 | ) | (62.6 | ) | (53.3 | ) | ||||||
| Total Accumulation | 2,195.5 | 1,921.8 | 1,733.5 | |||||||||
| Investment only | 1,080.7 | 1,002.3 | 931.6 | |||||||||
| Full-service payout | 830.8 | 863.5 | 811.8 | |||||||||
| Total Guaranteed | 1,911.5 | 1,865.8 | 1,743.4 | |||||||||
| Total U.S. Asset Accumulation | 4,107.0 | 3,787.6 | 3,476.9 | |||||||||
| Principal Global Investors | 488.1 | 417.3 | 343.4 | |||||||||
| Eliminations | (83.5 | ) | (71.1 | ) | (58.7 | ) | ||||||
| Total U.S. Asset Management and Accumulation | 4,511.6 | 4,133.8 | 3,761.6 | |||||||||
| International Asset Management and Accumulation | 605.4 | 604.5 | 518.4 | |||||||||
| Life and Health Insurance: | ||||||||||||
| Individual life insurance | 1,344.7 | 1,361.7 | 1,370.4 | |||||||||
| Health insurance | 2,077.7 | 1,894.3 | 1,806.9 | |||||||||
| Specialty benefits insurance | 1,316.0 | 1,131.5 | 1,004.0 | |||||||||
| Eliminations | (2.2 | ) | — | — | ||||||||
| Total Life and Health Insurance | 4,736.2 | 4,387.5 | 4,181.3 | |||||||||
| Corporate and Other | (27.4 | ) | (59.1 | ) | (23.0 | ) | ||||||
| Total operating revenues | $ | 9,825.8 | $ | 9,066.7 | $ | 8,438.3 | ||||||
| Total operating revenues | $ | 9,825.8 | $ | 9,066.7 | $ | 8,438.3 | ||||||
| Net realized/unrealized capital gains (losses), including recognition of front-end fee revenues and certain market value adjustments to fee revenues | 44.2 | (22.2 | ) | (114.9 | ) | |||||||
| Operating revenues from discontinued real estate investments | 0.5 | (2.8 | ) | (2.5 | ) | |||||||
| Total revenues per consolidated statements of operations | $ | 9,870.5 | $ | 9,041.7 | $ | 8,320.9 | ||||||
Principal Financial Group, Inc.
Notes to Consolidated Financial Statements — (continued)
20. Stock-Based Compensation Plans
As of December 31, 2004,2006, we sponsorhave the 2005 Stock Incentive Plan, the Employee Stock Purchase Plan, the 2005 Directors Stock Plan, the Stock Incentive Plan, the Directors Stock Plan and the Long-Term Performance Plan ("Stock-Based Compensation Plans"). As of May 17, 2005, no new grants will be made under the Stock PurchaseIncentive Plan, and Long Termthe Directors Stock Plan or the Long-Term Performance Plan.
Under the terms of the 2005 Stock Incentive Plan, grants may be nonqualified stock options, incentive stock options qualifying under Section 422 of the Internal Revenue Code, restricted stock, restricted stock units, or stock appreciation rights.rights, performance shares, performance units, or other stock based awards. The 2005 Directors Stock Plan provides for the grant of nonqualified stock options, restricted stock, restricted stock units, or other stock-based awards to our nonemployee directors. To date, we have not granted any incentive stock options, restricted stock, or performance units.
As of December 31, 2006, the maximum number of new shares of common stock that were available for grant under the 2005 Stock Incentive Plan and the 2005 Directors Stock Plan was 21.7 million.
For awards with graded vesting, we use an accelerated expense attribution method. The compensation cost that was charged against income for the Stock-Based Compensation Plans is as follows:
| | For the year ended December 31, | ||||||||
|---|---|---|---|---|---|---|---|---|---|
| | 2006 | 2005 | 2004 | ||||||
| | (in millions) | ||||||||
| Compensation cost | $ | 65.5 | $ | 52.2 | $ | 47.5 | |||
| Related income tax benefit | 21.3 | 16.9 | 15.1 | ||||||
| Capitalized as part of an asset | 3.4 | 1.6 | 2.6 | ||||||
Nonqualified Stock Options
Nonqualified stock options were granted to certain employees under the 2005 Stock Incentive Plan and the Stock Incentive Plan. Total options granted under this planthe 2005 Stock Incentive Plan and the Stock Incentive Plan were 2.1 million, 2.7 million and 2.4 million 2.2 millionfor the year ended December 31, 2006, 2005 and 1.5 million in 2004, 2003 and 2002, respectively. Options outstanding under the 2005 Stock Incentive Plan and the Stock Incentive Plan were granted at aan exercise price equal to the fair market value of our common stock on the date of grant, and expire ten years after the grant date. Options grantedThese options have graded or cliff vesting over a three-year period.period, except in the case of approved retirement.
Beginning in 2003, restrictedNonqualified stock units were issued to certain employees pursuant to the Stock Incentive Plan. In 2004 and 2003, 344,818 and 281,492 restricted stock units were granted, respectively. The weighted-average award prices were $36.32 and $32.33 for 2004 and 2003, respectively. Units awarded have graded or cliff vesting over a three-year period.
Beginning in 2003, stock appreciation rights were issued to agents meeting certain production requirements. The stock appreciation rights vest ratably over a three-year-period. We granted 28,466 and 26,727 stock appreciation rights during 2004 and 2003, respectively. For the years ended December 31, 2004 and 2003, we recorded compensation expense of $0.3 million and $0.1 million, respectively, related to the stock appreciation rights.
The Directors Stock Plan provides for the grant of nonqualified stock options restricted stock or restricted stock units to our nonemployee directors. The total number of shares to be issued under this plan may not exceed 500,000 shares. Options granted under the Directors Stock Planstock plans have an exercise price equal to the fair market value of theour common stock on the date of the grant and a contractual term equal to the earlier of five years from the date the participant ceases to provide service or the tenth anniversary of the date the option was granted. Since no options were to become exercisable for directors earlier than eighteen months following October 26, 2001, the date of demutualization, option grants made in 2002 under this plan cliff-vested one year from grant date. Beginning with the 2003 grant, options become exercisable in four approximately equal installments on the three, six and nine month anniversaries of the grant date, and on the date that the Director's full term of office expires. OptionsThere were no options granted during the years ended December 31, 2006 and 2005.
As of December 31, 2006, there were $12.6 million of total unrecognized compensations costs related to nonvested stock options. The cost is expected to be recognized over a weighted-average service period of approximately 1.8 years.
The fair value of stock options is estimated using the Black-Scholes option pricing model that uses the assumptions noted in the following table. Expected volatilities are based on historical volatility of our stock and other factors. Due to our limited public company history, we use peer data to estimate option exercise and employee termination within the valuation model. Separate groups of employees that have similar historical exercise behavior are considered separately for valuation purposes. The expected term of options granted is estimated based on peer data and represents the period of time that options granted are expected to be outstanding. The risk-free rate for periods within the expected life of the option is based on the U.S. Treasury risk-free interest rate in effect at the time of grant. The dividend yield is based on historical dividend distributions compared to the closing price of our common shares on the grant date.
Cash received from stock options exercised under this plan amountedthese share-based payment arrangements during 2006 was $37.7 million. The actual tax benefits realized for the tax deductions for option exercise of the share-based payment arrangements during 2006 was $12.7 million.
Principal Financial Group, Inc.
Notes to 22,620, 25,155Consolidated Financial Statements — (continued)
20. Stock-Based Compensation Plans — (continued)
The following is a summary of assumptions for the stock options granted during the period:
| | For the year ended December 31, | ||||||
|---|---|---|---|---|---|---|---|
| Options | |||||||
| 2006 | 2005 | 2004 | |||||
| Dividend yield | 1.32 | % | 1.41 | % | 1.26 | % | |
| Expected volatility | 16.2 | % | 19.1 | % | 39.2 | % | |
| Risk-free interest rate | 4.6 | % | 4.1 | % | 3.3 | % | |
| Expected life (in years) | 6 | 6 | 6 | ||||
Using the Black-Scholes option valuation model, the weighted-average estimated fair value of stock options granted was $11.41, $9.18 and 52,000$13.56 per share during 2006, 2005 and 2004, respectively.
The following is a summary of the status of all of our stock option plans for the year ended December 31, 2006:
| | Number of options | Weighted- average exercise price | Intrinsic Value | ||||||
|---|---|---|---|---|---|---|---|---|---|
| | (in millions) | | (in millions) | ||||||
| Options outstanding at January 1, 2006 | 7.8 | $ | 33.06 | ||||||
| Granted | 2.1 | 49.28 | |||||||
| Exercised | 1.3 | 28.64 | |||||||
| Canceled | 0.1 | 40.43 | |||||||
| Options outstanding at December 31 2006 | 8.5 | $ | 37.65 | $ | 178.4 | ||||
| Options vested or expected to vest at December 31, 2006 | 8.3 | $ | 37.27 | $ | 178.6 | ||||
| Options exercisable at December 31, 2006 | 4.1 | $ | 31.70 | $ | 111.7 | ||||
The total intrinsic value of stock options inexercised was $39.7 million, $29.5 million and $13.9 million during 2006, 2005 and 2004, 2003respectively.
The following is a summary of weighted-average remaining contractual lives for stock options outstanding and 2002, respectively.the range of exercise prices on the stock options as of December 31, 2006:
| Range of exercise prices | Number of options outstanding | Weighted-average remaining contractual life | ||
|---|---|---|---|---|
| | (in millions) | | ||
| $22.33 - $30.50 | 2.1 | 5 | ||
| $31.04 - $38.74 | 1.9 | 7 | ||
| $39.02 - $47.23 | 2.5 | 8 | ||
| $48.60 - $57.42 | 2.0 | 9 | ||
| $22.33 - $57.42 | 8.5 | 7 | ||
The weighted-average remaining contractual lives for stock options exercisable is approximately 7 years as of December 31, 2006.
Performance Share Awards
Beginning in 2002, 16,6412006, we granted performance share awards to certain employees under the 2005 Stock Incentive Plan. The performance share awards are treated as an equity award and are paid in shares. Whether the performance shares are earned depends upon the participant's continued employment through the performance period (except in the case of an approved retirement) and our performance against three-year goals set at the beginning of the performance period. A return on equity objective and an earnings per share objective must be achieved for any of the performance shares to be earned. If the performance requirements are not met, the performance shares will be forfeited and no compensation cost
Principal Financial Group, Inc.
Notes to Consolidated Financial Statements — (continued)
20. Stock-Based Compensation Plans — (continued)
is recognized and any previously recognized compensation cost is reversed. There is no maximum contractual term on these awards. As of December 31, 2006, there were $17.6 million of total unrecognized compensation costs related to nonvested performance share awards granted. The cost is expected to be recognized over a weighted-average service period of approximately 2.0 years.
The fair value of performance share awards is determined based on the closing stock price of our shares on the grant date. The weighted-average grant-date fair value of performance share awards granted during 2006 was $49.40. Because no performance share awards vested or were paid out, the intrinsic value of performance share awards vested and the actual tax benefits realized for tax deductions for performance share award payouts are $0.0 million in 2006.
The following is a summary of activity for the nonvested performance share awards for the year ended December 31, 2006:
| | Number of performance share awards | Weighted-average grant-date fair value | ||||
|---|---|---|---|---|---|---|
| | (in millions) | | ||||
| Nonvested performance share awards at January 1, 2006 | — | $ | — | |||
| Granted | 0.4 | 49.40 | ||||
| Vested | — | — | ||||
| Forfeited | — | — | ||||
| Nonvested performance share awards at December 31, 2006 | 0.4 | $ | 49.40 | |||
Performance share awards above represent initial target awards and do not reflect potential increases or decreases resulting from the final performance objectives to be determined at the end of the respective performance period. The actual number of shares to be awarded at the end of each performance period will range between 0% and 200% of the initial target awards.
Restricted Stock Units
We issue restricted stock units under the 2005 Stock Incentive Plan, 2005 Directors Stock Plan, Stock Incentive Plan, and Directors Stock Plan. Restricted stock units are treated as an equity award. The fair value of restricted stock units is determined based on the closing stock price of our common shares on the grant date. There is no maximum contractual term on these awards.
Restricted stock units were issued to certain employees and agents pursuant to the Stock Incentive Plan and 2005 Stock Incentive Plan. Under these plans, awards have a graded or cliff vesting over a three-year service period. When service for the Company ceases (except in the case of an approved retirement), all vesting stops and unvested units are forfeited.
Beginning in 2005, pursuant to the 2005 Directors Stock Plan, restricted stock units are now granted to each non-employee director in office immediately following each annual meeting of stockholders and to each person who becomes a member of the Board other than on the date of the annual meeting of stockholders. Prior to this time, awards of restricted stock units were issuedgranted pursuant to the Directors Stock Plan at a weighted-average award price of $28.02 to all directors in office. In 2003, 10,400 restricted stock units were issued at a weighted-average award price of $30.27. In 2004, 9,059 restricted stock units were issued at a weighted-average award price of $34.57. The number received by each director is prorated with respect to the amount of time remaining in the director's term. Restrictions on the sale or transfer of restricted stock units shall lapse in installments from the date of grant toeach Board member's election or re-election date. Under the date of2005 Directors Stock Plan, awards are granted on an annual basis and cliff vest over the end ofone-year service period. Non-vested awards under the director's term.prior plan have graded vesting over a three-year service period. When service to the companyCompany ceases, all vesting stops and unvested units are forfeited. The unamortized deferred compensation was $0.3
In 2006, 2005 and 2004, 0.2 million, $0.30.4 million and $0.10.4 million at December 31,restricted stock units were granted, respectively. The weighted-average grant-date fair value of restricted stock units granted during 2006, 2005 and 2004 2003was $50.42, $39.55 and 2002,$36.28, respectively.
We also maintainThe actual tax benefits realized for the Long Term Performance Plan, which provides the opportunitytax deductions for eligible executives to receive additional rewards if specified minimum corporate performance objectives are achieved over a three-year period. This planrestricted stock units payouts under these share-based payment arrangements for 2006 was amended in May 2001, to utilize stock as an option for payment starting with payments in 2003. For the years ended December 31, 2004, 2003 and 2002, we recorded compensation expense of $5.1 million, $7.1 million and $4.4 million, respectively, related to the plan.$5.4 million.
The maximum number of shares of common stock we may issue under the Stock Incentive Plan, together with an excess plan (a nonqualified defined contribution retirement plan), the Directors Stock Plan, the Long Term Performance Plan and any new plan awarding our common stock is limited. As of December 31, 2004 and 2003, a2006, there were $10.3 million of total of 13,353,121 and 15,382,192 shares, respectively, were availableunrecognized compensation costs related to nonvested restricted stock unit awards granted under these plans. The cost is expected to be made issuable by usrecognized over a weighted-average period of approximately 1.6 years. The total intrinsic value of restricted stock units vested was $16.7 million, $1.3 million and $1.2 million during 2006, 2005 and 2004, respectively.
Principal Financial Group, Inc.
Notes to Consolidated Financial Statements — (continued)
20. Stock-Based Compensation Plans — (continued)
The following is a summary of activity for these plans.the nonvested restricted stock units in 2006:
| | Number of restricted stock units | Weighted-average grant-date fair value | ||||
|---|---|---|---|---|---|---|
| | (in millions) | | ||||
| Nonvested restricted stock units at January 1, 2006 | 0.9 | $ | 36.89 | |||
| Granted | 0.2 | 50.42 | ||||
| Vested | 0.3 | 34.52 | ||||
| Forfeited | — | — | ||||
| Nonvested restricted stock units at December 31, 2006 | 0.8 | $ | 41.47 | |||
Employee Stock Purchase Plan
Under our Employee Stock Purchase Plan, participating employees have the opportunity to purchase shares of our common stock on a quarterly basis. For 2002 and 2003, the maximum amount an employee could contribute during any plan year was the lesser of $10,000, or such greater or lesser amount as determined by the plan administrator, and 10% of the employee's salary. Effective January 1, 2004, employeesEmployees may purchase up to $25,000 worth of company stock each year. Employees may purchase shares of our common stock at a price equal to 85% of the share'sshares' fair market value as of the beginning or end of the quarter, whichever is lower. Under the Employee Stock Purchase Plan, employees purchased 822,799, 639,5240.7 million, 0.7 million and 713,8850.8 million shares during 2006, 2005 and 2004, 2003respectively.
We recognize compensation expense for the fair value of the discount granted to employees participating in the employee stock purchase plan in the quarter of grant. Shares of the Employee Stock Purchase Plan are treated as an equity award. The weighted-average fair value of the discount on the stock purchased was $10.39, $8.00 and 2002,$7.17 during 2006, 2005 and 2004, respectively. InThe total intrinsic value of the Employee Stock Purchase Plan settled was $6.9 million, $5.8 million and $5.9 million during 2006, 2005 and 2004, 2003 and 2002, an additional 22,838, 14,634 and 5,415respectively.
Cash received from shares respectively, were purchased from dividends and reinvested into participants' accounts.issued under these share-based payment arrangements for 2006 was $28.5 million. The actual tax benefits realized for the tax deductions for the settlement of the share-based payment arrangements for 2006 was $0.8 million.
The maximum number of shares of common stock that we may issue under the Employee Stock Purchase Plan is 2% of the number of shares outstanding immediately following the completion of the Initial Public Offering. As of December 31, 2004, 2003 and 2002,2006, a total of 4,719,505, 5,542,303 and 6,181,8263.3 million of new shares respectively, are available to be made issuable by us for this plan.
The compensation cost that has been charged against incomeLong-Term Performance Plan
We also maintain the Long-Term Performance Plan, which provides the opportunity for eligible executives to receive additional awards if specified minimum corporate performance objectives are achieved over a three-year period. This plan utilizes stock as an option for payment and is treated as a liability award during vesting and a liability award or equity award subsequent to vesting, based on the participant payment election. Effective with stockholder approval of the 2005 Stock Incentive Plan, Directors Stockno further grants will be made under the Long-Term Performance Plan, and any future awards paid under the Long-Term Performance Plan will be issued under the 2005 Stock PurchaseIncentive Plan. As of December 31, 2005, all awards under this plan were fully vested and no awards were granted under this plan in 2006 or 2005. There is no maximum contractual term on these awards.
The amount of cash used to settle Long-Term Performance Plan units granted was $42.4$10.8 million $22.7for 2006. The total intrinsic value of Long-Term Performance Plan units settled was $11.2 million, $6.5 million and $10.5$8.3 million forduring 2006, 2005 and 2004, 2003 and 2002, respectively. For awards with graded vesting, we use an accelerated expense attribution method.
Principal Financial Group, Inc.
The weighted-average estimated fair value of stock options granted during 2004, 2003 and 2002, using the Black-Scholes option valuation model was $13.56, $10.66 and $10.19 per share, respectively.Notes to Consolidated Financial Statements — (continued)
20. Stock-Based Compensation Plans — (continued)
The fair value of Long-Term Performance Plan liability units is determined as of each option was estimatedreporting period based on the date of grant using the Black-Scholes option pricing model andthat uses the assumptions noted in the following assumptions:table:
| | 2004 | 2003 | 2002 | ||||
|---|---|---|---|---|---|---|---|
| Dividend yield | 1.26 | % | .91 | % | .91 | % | |
| Expected volatility | 39.2 | % | 38.6 | % | 32.5 | % | |
| Risk-free interest rate | 3.3 | % | 3.1 | % | 4.7 | % | |
| Expected life (in years) | 6 | 6 | 6 | ||||
| Long-Term Performance Plan | For the year ended December 31, 2006 | ||
|---|---|---|---|
| Dividend yield | — | % | |
| Expected volatility | 11.2 | % | |
| Risk-free interest rate | 4.8 | % | |
| Expected life (in years) | 2 | ||
The following is a summary of the status of all of our stock option plans as of and for the years ended December 31, 2004, 2003 and 2002:
| | Number of shares | Weighted-average exercise price | ||||
|---|---|---|---|---|---|---|
| Options outstanding at January 1, 2002 | 3,638,200 | $ | 22.33 | |||
| Granted | 1,492,905 | 27.59 | ||||
| Exercised | 600 | 22.33 | ||||
| Canceled | 993,380 | 23.08 | ||||
| Options outstanding at December 31, 2002 | 4,137,125 | 24.05 | ||||
| Granted | 2,235,820 | 27.64 | ||||
| Exercised | 13,869 | 26.18 | ||||
| Canceled | 476,718 | 23.77 | ||||
| Options outstanding at December 31, 2003 | 5,882,358 | 25.43 | ||||
| Granted | 2,358,441 | 35.79 | ||||
| Exercised | 806,249 | 23.71 | ||||
| Canceled | 722,263 | 26.12 | ||||
| Options outstanding at December 31, 2004 | 6,712,287 | $ | 29.20 | |||
| Options exercisable at December 31, 2002 | 22,000 | $ | 22.33 | |||
| Options exercisable at December 31, 2003 | 515,254 | $ | 27.13 | |||
| Options exercisable at December 31, 2004 | 2,893,379 | $ | 25.07 | |||
At December 31, 2004, we had 6.7 million stock options outstanding with a weighted-average remaining contractual life of 8.0 years, and the range of exercise prices on the stock options was $22.33 to $38.74.
21. Earnings Per Common Share
The computations of the basic and diluted per share amounts for our continuing operations were as follows:
| | | For the year ended December 31, | | For the year ended December 31, | ||||||||||||||||||
|---|---|---|---|---|---|---|---|---|---|---|---|---|---|---|---|---|---|---|---|---|---|---|
| | | 2004 | 2003 | 2002 | | 2006 | 2005 | 2004 | ||||||||||||||
| | | (in millions, except per share data) | | (in millions, except per share data) | ||||||||||||||||||
| Income from continuing operations, net of related income taxes | Income from continuing operations, net of related income taxes | $ | 702.5 | $ | 647.3 | $ | 446.4 | Income from continuing operations, net of related income taxes | $ | 1,033.7 | $ | 891.5 | $ | 700.9 | ||||||||
| Subtract: | Subtract: | |||||||||||||||||||||
| Preferred stock dividends | 33.0 | 17.7 | — | |||||||||||||||||||
| Income from continuing operations available to common stockholders, net of related income taxes | Income from continuing operations available to common stockholders, net of related income taxes | $ | 1,000.7 | $ | 873.8 | $ | 700.9 | |||||||||||||||
| Weighted-average shares outstanding: | Weighted-average shares outstanding: | Weighted-average shares outstanding: | ||||||||||||||||||||
| Basic | 313.3 | 326.0 | 350.2 | Basic | 272.9 | 287.9 | 313.3 | |||||||||||||||
| Dilutive effects: | Dilutive effects: | |||||||||||||||||||||
| Stock options | 1.1 | 0.5 | 0.4 | Stock options | 2.0 | 1.4 | 1.1 | |||||||||||||||
| Long term performance plan | 0.2 | 0.3 | 0.1 | Long term performance plan | — | 0.2 | 0.2 | |||||||||||||||
| Restricted stock units(1) | 0.1 | — | — | Restricted stock units | 0.6 | 0.4 | 0.1 | |||||||||||||||
| Diluted | 314.7 | 326.8 | 350.7 | Diluted | 275.5 | 289.9 | 314.7 | |||||||||||||||
| Income from continuing operations per share: | ||||||||||||||||||||||
| Income from continuing operations per common share: | Income from continuing operations per common share: | |||||||||||||||||||||
| Basic | $ | 2.24 | $ | 1.99 | $ | 1.27 | Basic | $ | 3.67 | $ | 3.03 | $ | 2.24 | |||||||||
| Diluted | 2.23 | 1.98 | 1.27 | Diluted | $ | 3.63 | $ | 3.01 | $ | 2.23 | ||||||||||||
Principal Financial Group, Inc.
Notes to Consolidated Financial Statements — (continued)
22. Quarterly Results of Operations (Unaudited)
The following is a summary of unaudited quarterly results of operations for 20042006 and 2003:2005:
| | For the three months ended | |||||||||||||
|---|---|---|---|---|---|---|---|---|---|---|---|---|---|---|
| | March 31 | June 30 | September 30 | December 31 | ||||||||||
| | (in millions, except per share data) | |||||||||||||
| 2004 | ||||||||||||||
| Total revenues | $ | 1,996.7 | $ | 1,979.7 | $ | 2,088.6 | $ | 2,238.7 | ||||||
| Total expenses | 1,788.9 | 1,816.6 | 1,853.3 | 1,963.3 | ||||||||||
| Income from continuing operations, net of related income taxes | 163.4 | 128.9 | 194.6 | 215.6 | ||||||||||
| Income (loss) from discontinued operations, net of related income taxes | 35.9 | (9.2 | ) | 104.2 | (2.1 | ) | ||||||||
| Net income | 193.6 | 119.7 | 298.8 | 213.5 | ||||||||||
| Basic earnings per share for income from continuing operations, net of related income taxes | $ | 0.51 | $ | 0.41 | $ | 0.62 | $ | 0.71 | ||||||
| Basic earnings per share for net income | 0.60 | 0.38 | 0.96 | 0.70 | ||||||||||
| Diluted earnings per share for income from continuing operations, net of related income taxes | 0.51 | 0.40 | 0.62 | 0.71 | ||||||||||
| Diluted earnings per share for net income | 0.60 | 0.37 | 0.95 | 0.70 | ||||||||||
2003 | ||||||||||||||
| Total revenues | $ | 1,889.8 | $ | 1,951.5 | $ | 1,972.1 | $ | 2,173.3 | ||||||
| Total expenses | 1,760.1 | 1,749.4 | 1,747.6 | 1,905.3 | ||||||||||
| Income from continuing operations, net of related income taxes | 98.6 | 152.1 | 168.7 | 227.9 | ||||||||||
| Income (loss) from discontinued operations, net of related income taxes | 57.1 | 50.1 | 19.2 | (24.0 | ) | |||||||||
| Net income | 155.7 | 202.2 | 184.5 | 203.9 | ||||||||||
| Basic earnings per share for income from continuing operations, net of related income taxes | $ | 0.30 | $ | 0.46 | $ | 0.52 | $ | 0.71 | ||||||
| Basic earnings per share for net income | 0.47 | 0.62 | 0.57 | 0.63 | ||||||||||
| Diluted earnings per share for income from continuing operations, net of related income taxes | 0.30 | 0.46 | 0.52 | 0.70 | ||||||||||
| Diluted earnings per share for net income | 0.47 | 0.62 | 0.57 | 0.63 | ||||||||||
| | For the three months ended | ||||||||||||
|---|---|---|---|---|---|---|---|---|---|---|---|---|---|
| | December 31 | September 30 | June 30 | March 31 | |||||||||
| | (in millions, except per share data) | ||||||||||||
| 2006 | |||||||||||||
| Total revenues | $ | 2,558.9 | $ | 2,449.6 | $ | 2,459.8 | $ | 2,402.2 | |||||
| Total expenses | 2,231.0 | 2,118.7 | 2,163.2 | 2,028.9 | |||||||||
| Income from continuing operations, net of related income taxes | 262.3 | 258.8 | 218.9 | 293.7 | |||||||||
| Income (loss) from discontinued operations, net of related income taxes | 30.1 | 0.4 | (0.1 | ) | 0.2 | ||||||||
| Preferred stock dividends | 8.3 | 8.2 | 8.3 | 8.2 | |||||||||
| Net income available to common stockholders | 284.1 | 251.0 | 210.5 | 285.7 | |||||||||
| Basic earnings per common share for income from continuing operations, net of related income taxes | 0.94 | 0.93 | 0.77 | 1.02 | |||||||||
| Basic earnings per common share for net income available to common stockholders | 1.05 | 0.93 | 0.77 | 1.02 | |||||||||
| Diluted earnings per common share for income from continuing operations, net of related income taxes | 0.93 | 0.92 | 0.76 | 1.01 | |||||||||
| Diluted earnings per common share for net income available to common stockholders | 1.04 | 0.92 | 0.76 | 1.01 | |||||||||
| 2005 | |||||||||||||
| Total revenues | $ | 2,455.6 | $ | 2,228.0 | $ | 2,207.9 | $ | 2,150.2 | |||||
| Total expenses | 2,180.1 | 1,941.7 | 1,925.6 | 1,870.6 | |||||||||
| Income from continuing operations, net of related income taxes | 244.2 | 219.2 | 223.2 | 204.9 | |||||||||
| Income from discontinued operations, net of related income taxes | 11.0 | 0.2 | 15.7 | 0.6 | |||||||||
| Preferred stock dividends | 8.3 | 9.4 | — | — | |||||||||
| Net income available to common stockholders | 246.9 | 210.0 | 238.9 | 205.5 | |||||||||
| Basic earnings per common share for income from continuing operations, net of related income taxes | 0.84 | 0.75 | 0.78 | 0.68 | |||||||||
| Basic earnings per common share for net income available to common stockholders | 0.88 | 0.75 | 0.83 | 0.69 | |||||||||
| Diluted earnings per share for income from continuing operations, net of related income taxes | 0.83 | 0.74 | 0.77 | 0.68 | |||||||||
| Diluted earnings per common share for net income available to common stockholders | 0.87 | 0.74 | 0.82 | 0.68 | |||||||||
23. Condensed Consolidating Financial Information
Principal Life has established special purpose entities to issue secured medium-term notes. Under the program, the payment obligations of principal and interest on the notes are secured by funding agreements issued by Principal Life. Principal Life's payment obligations on the funding agreements are fully and unconditionally guaranteed by Principal Financial Group, Inc. All of the outstanding stock of Principal Life is indirectly owned by Principal Financial Group, Inc. and Principal Financial Group, Inc. is the only guarantor of the payment obligations of the funding agreements.
We received a subpoena on March 31, 2005 from the Attorney General of West Virginia for documents and other information relating to funding agreement-backed securities, special purpose vehicles related to funding agreement-backed securities, and related subjects. A response has been sent. We understand that other U.S.-based life insurers that have funding agreement-backed note programs such as our on-going programs have received similar subpoenas from the Attorney General of West Virginia. Other than the subpoena, we have received no notification of any pending or threatened investigation or other proceeding by West Virginia governmental authorities involving funding agreement-backed securities.
Principal Financial Group, Inc.
Notes to Consolidated Financial Statements — (continued)
23. Condensed Consolidating Financial Information — (continued)
The following tables set forth condensed consolidating financial information of Principal Life and Principal Financial Group, Inc. as of December 31, 20042006 and 2003,2005, and for the years ended December 31, 2004, 20032006, 2005 and 2002.2004.
Condensed Consolidating Statements of Financial Position
December 31, 20042006
| | | Principal Financial Group, Inc. Parent Only | Principal Life Insurance Company Only | Principal Financial Services, Inc. and Other Subsidiaries Combined | Eliminations | Principal Financial Group, Inc. Consolidated | | Principal Financial Group, Inc. Parent Only | Principal Life Insurance Company Only | Principal Financial Services, Inc. and Other Subsidiaries Combined | Eliminations | Principal Financial Group, Inc. Consolidated | ||||||||||||||||||||||
|---|---|---|---|---|---|---|---|---|---|---|---|---|---|---|---|---|---|---|---|---|---|---|---|---|---|---|---|---|---|---|---|---|---|---|
| | | (in millions) | | (in millions) | ||||||||||||||||||||||||||||||
| Assets | Assets | Assets | ||||||||||||||||||||||||||||||||
| Investments, excluding investment in unconsolidated entities | $ | — | $ | 52,248.2 | $ | 5,716.8 | $ | (1,260.7 | ) | $ | 56,704.3 | |||||||||||||||||||||||
| Fixed maturities, available-for-sale | Fixed maturities, available-for-sale | $ | — | $ | 40,330.8 | $ | 4,858.5 | $ | (785.8 | ) | $ | 44,403.5 | ||||||||||||||||||||||
| Fixed maturities, trading | Fixed maturities, trading | — | 90.4 | 233.0 | — | 323.4 | ||||||||||||||||||||||||||||
| Equity securities, available-for-sale | Equity securities, available-for-sale | — | 640.7 | 25.9 | — | 666.6 | ||||||||||||||||||||||||||||
| Equity securities, trading | Equity securities, trading | — | 10.2 | 170.8 | — | 181.0 | ||||||||||||||||||||||||||||
| Mortgage loans | Mortgage loans | — | 9,661.6 | 2,237.7 | (235.4 | ) | 11,663.9 | |||||||||||||||||||||||||||
| Real estate | Real estate | — | 308.7 | 558.3 | — | 867.0 | ||||||||||||||||||||||||||||
| Policy loans | Policy loans | — | 850.7 | — | — | 850.7 | ||||||||||||||||||||||||||||
| Investment in unconsolidated entities | Investment in unconsolidated entities | 7,469.0 | 277.3 | 5,961.3 | (13,493.3 | ) | 214.3 | Investment in unconsolidated entities | 8,191.4 | 235.0 | 4,480.5 | (12,608.8 | ) | 298.1 | ||||||||||||||||||||
| Other investments | Other investments | 3.6 | 3,057.1 | 235.5 | (2,183.6 | ) | 1,112.6 | |||||||||||||||||||||||||||
| Cash and cash equivalents | Cash and cash equivalents | 75.4 | 31.8 | 410.0 | (64.7 | ) | 452.5 | Cash and cash equivalents | 30.9 | 1,399.8 | 261.1 | (101.0 | ) | 1,590.8 | ||||||||||||||||||||
| Accrued investment income | Accrued investment income | — | 677.0 | 51.6 | (5.1 | ) | 723.5 | |||||||||||||||||||||||||||
| Premiums due and other receivables | Premiums due and other receivables | — | 857.7 | 512.8 | (118.2 | ) | 1,252.3 | |||||||||||||||||||||||||||
| Deferred policy acquisition costs | Deferred policy acquisition costs | — | 2,265.9 | 153.0 | — | 2,418.9 | ||||||||||||||||||||||||||||
| Property and equipment | Property and equipment | — | 394.2 | 28.3 | — | 422.5 | ||||||||||||||||||||||||||||
| Goodwill | Goodwill | — | 77.2 | 284.7 | — | 361.9 | ||||||||||||||||||||||||||||
| Other intangibles | Other intangibles | — | 5.5 | 191.0 | — | 196.5 | Other intangibles | — | 38.4 | 942.6 | — | 981.0 | ||||||||||||||||||||||
| Separate account assets | Separate account assets | — | 50,722.4 | 785.5 | — | 51,507.9 | Separate account assets | — | 69,451.7 | 4,327.9 | — | 73,779.6 | ||||||||||||||||||||||
| All other assets | 1.6 | 4,214.0 | 687.3 | (180.3 | ) | 4,722.6 | ||||||||||||||||||||||||||||
| Other assets | Other assets | 256.1 | 1,327.0 | 382.9 | (205.2 | ) | 1,760.8 | |||||||||||||||||||||||||||
| Total assets | $ | 7,546.0 | $ | 107,499.2 | $ | 13,751.9 | $ | (14,999.0 | ) | $ | 113,798.1 | Total assets | $ | 8,482.0 | $ | 131,674.1 | $ | 19,745.1 | $ | (16,243.1 | ) | $ | 143,658.1 | |||||||||||
| Liabilities | Liabilities | Liabilities | ||||||||||||||||||||||||||||||||
| Contractholder funds | Contractholder funds | $ | — | $ | 32,353.1 | $ | 8.4 | $ | (178.2 | ) | $ | 32,183.3 | Contractholder funds | $ | — | $ | 37,001.4 | $ | 16.3 | $ | (218.7 | ) | $ | 36,799.0 | ||||||||||
| Future policy benefits and claims | Future policy benefits and claims | — | 14,284.8 | 1,757.8 | — | 16,042.6 | Future policy benefits and claims | — | 15,005.3 | 2,328.4 | (1.1 | ) | 17,332.6 | |||||||||||||||||||||
| Other policyholder funds | Other policyholder funds | — | 731.2 | 3.7 | — | 734.9 | Other policyholder funds | — | 613.0 | 6.4 | — | 619.4 | ||||||||||||||||||||||
| Short-term debt | Short-term debt | — | — | 527.4 | (245.7 | ) | 281.7 | Short-term debt | — | — | 199.1 | (115.0 | ) | 84.1 | ||||||||||||||||||||
| Long-term debt | Long-term debt | — | 215.0 | 929.9 | (301.4 | ) | 843.5 | Long-term debt | 601.9 | 143.9 | 1,350.1 | (542.1 | ) | 1,553.8 | ||||||||||||||||||||
| Income taxes currently payable | Income taxes currently payable | — | 247.3 | 48.3 | (17.7 | ) | 277.9 | Income taxes currently payable | (1.2 | ) | (270.7 | ) | 23.3 | 252.8 | 4.2 | |||||||||||||||||||
| Deferred income taxes | Deferred income taxes | — | 937.5 | 207.8 | (13.6 | ) | 1,131.7 | Deferred income taxes | 1.1 | 629.5 | 292.1 | (5.5 | ) | 917.2 | ||||||||||||||||||||
| Separate account liabilities | Separate account liabilities | — | 50,722.4 | 785.5 | — | 51,507.9 | Separate account liabilities | — | 69,451.7 | 4,327.9 | — | 73,779.6 | ||||||||||||||||||||||
| Other liabilities | Other liabilities | 1.7 | 1,351.6 | 2,014.1 | (117.1 | ) | 3,250.3 | Other liabilities | 19.4 | 2,298.7 | 3,010.1 | (620.8 | ) | 4,707.4 | ||||||||||||||||||||
| Total liabilities | $ | 1.7 | $ | 100,842.9 | $ | 6,282.9 | $ | (873.7 | ) | $ | 106,253.8 | Total liabilities | 621.2 | 124,872.8 | 11,553.7 | (1,250.4 | ) | 135,797.3 | ||||||||||||||||
| Stockholders' equity | Stockholders' equity | Stockholders' equity | ||||||||||||||||||||||||||||||||
| Series A preferred stock | Series A preferred stock | — | — | — | — | — | ||||||||||||||||||||||||||||
| Series B preferred stock | Series B preferred stock | 0.1 | — | — | — | 0.1 | ||||||||||||||||||||||||||||
| Common stock | Common stock | $ | 3.8 | $ | 2.5 | $ | — | $ | (2.5 | ) | $ | 3.8 | Common stock | 3.8 | 2.5 | — | (2.5 | ) | 3.8 | |||||||||||||||
| Additional paid-in capital | Additional paid-in capital | 7,269.4 | 5,112.7 | 6,860.9 | (11,973.6 | ) | 7,269.4 | Additional paid-in capital | 8,141.8 | 5,515.3 | 7,688.1 | (13,203.4 | ) | 8,141.8 | ||||||||||||||||||||
| Retained earnings (deficit) | Retained earnings (deficit) | 1,289.5 | 238.3 | (705.3 | ) | 467.0 | 1,289.5 | Retained earnings (deficit) | 2,824.1 | 670.9 | (339.5 | ) | (331.4 | ) | 2,824.1 | |||||||||||||||||||
| Accumulated other comprehensive income | Accumulated other comprehensive income | 1,313.3 | 1,302.8 | 1,313.4 | (2,616.2 | ) | 1,313.3 | Accumulated other comprehensive income | 846.9 | 612.6 | 842.8 | (1,455.4 | ) | 846.9 | ||||||||||||||||||||
| Treasury stock, at cost. | (2,331.7 | ) | — | — | — | (2,331.7 | ) | |||||||||||||||||||||||||||
| Treasury stock, at cost | Treasury stock, at cost | (3,955.9 | ) | — | — | — | (3,955.9 | ) | ||||||||||||||||||||||||||
| Total stockholders' equity | 7,544.3 | 6,656.3 | 7,469.0 | (14,125.3 | ) | 7,544.3 | Total stockholders' equity | 7,860.8 | 6,801.3 | 8,191.4 | (14,992.7 | ) | 7,860.8 | |||||||||||||||||||||
| Total liabilities and stockholders' equity | $ | 7,546.0 | $ | 107,499.2 | $ | 13,751.9 | $ | (14,999.0 | ) | $ | 113,798.1 | Total liabilities and stockholders' equity | $ | 8,482.0 | $ | 131,674.1 | $ | 19,745.1 | $ | (16,243.1 | ) | $ | 143,658.1 | |||||||||||
Principal Financial Group, Inc.
Notes to Consolidated Financial Statements — (continued)
23. Condensed Consolidating Financial Information — (continued)
Condensed Consolidating Statements of Financial Position
December 31, 20032005
| | | Principal Financial Group, Inc. Parent Only | Principal Life Insurance Company Only | Principal Financial Services, Inc. and Other Subsidiaries Combined | Eliminations | Principal Financial Group, Inc. Consolidated | | Principal Financial Group, Inc. Parent Only | Principal Life Insurance Company Only | Principal Financial Services, Inc. and Other Subsidiaries Combined | Eliminations | Principal Financial Group, Inc. Consolidated | ||||||||||||||||||||||
|---|---|---|---|---|---|---|---|---|---|---|---|---|---|---|---|---|---|---|---|---|---|---|---|---|---|---|---|---|---|---|---|---|---|---|
| | | (in millions) | | (in millions) | ||||||||||||||||||||||||||||||
| Assets | Assets | Assets | ||||||||||||||||||||||||||||||||
| Investments, excluding investment in unconsolidated entities | $ | — | $ | 48,156.9 | $ | 6,247.5 | $ | (1,357.2 | ) | $ | 53,047.2 | |||||||||||||||||||||||
| Fixed maturities, available-for-sale | Fixed maturities, available-for-sale | $ | — | $ | 38,886.6 | $ | 3,896.5 | $ | (665.9 | ) | $ | 42,117.2 | ||||||||||||||||||||||
| Fixed maturities, trading | Fixed maturities, trading | — | 18.9 | 94.3 | — | 113.2 | ||||||||||||||||||||||||||||
| Equity securities, available-for-sale | Equity securities, available-for-sale | — | 658.8 | 65.6 | — | 724.4 | ||||||||||||||||||||||||||||
| Equity securities, trading | Equity securities, trading | — | — | 90.3 | — | 90.3 | ||||||||||||||||||||||||||||
| Mortgage loans | Mortgage loans | — | 9,448.9 | 2,365.5 | (330.1 | ) | 11,484.3 | |||||||||||||||||||||||||||
| Real estate | Real estate | — | 313.5 | 586.6 | — | 900.1 | ||||||||||||||||||||||||||||
| Policy loans | Policy loans | — | 827.7 | — | — | 827.7 | ||||||||||||||||||||||||||||
| Investment in unconsolidated entities | Investment in unconsolidated entities | 7,234.0 | 793.8 | 5,693.3 | (13,553.9 | ) | 167.2 | Investment in unconsolidated entities | 7,784.2 | 275.6 | 5,515.1 | (13,311.0 | ) | 263.9 | ||||||||||||||||||||
| Other investments | Other investments | — | 2,041.8 | 129.6 | (1,321.8 | ) | 849.6 | |||||||||||||||||||||||||||
| Cash and cash equivalents | Cash and cash equivalents | 173.8 | 640.5 | 684.2 | (306.0 | ) | 1,192.5 | Cash and cash equivalents | 21.6 | 1,259.9 | 542.3 | (184.5 | ) | 1,639.3 | ||||||||||||||||||||
| Accrued investment income | Accrued investment income | — | 638.4 | 48.5 | (4.6 | ) | 682.3 | |||||||||||||||||||||||||||
| Premiums due and other receivables | Premiums due and other receivables | — | 589.2 | 112.7 | (109.2 | ) | 592.7 | |||||||||||||||||||||||||||
| Deferred policy acquisition costs | Deferred policy acquisition costs | — | 2,069.9 | 104.2 | — | 2,174.1 | ||||||||||||||||||||||||||||
| Property and equipment | Property and equipment | — | 397.2 | 22.6 | — | 419.8 | ||||||||||||||||||||||||||||
| Goodwill | Goodwill | — | 50.4 | 231.9 | — | 282.3 | ||||||||||||||||||||||||||||
| Other intangibles | Other intangibles | — | 4.5 | 116.5 | — | 121.0 | Other intangibles | — | 39.2 | 163.4 | — | 202.6 | ||||||||||||||||||||||
| Separate account assets | Separate account assets | — | 42,753.4 | 632.2 | 22.2 | 43,407.8 | Separate account assets | — | 58,670.7 | 3,415.5 | (16.2 | ) | 62,070.0 | |||||||||||||||||||||
| Assets of discontinued operations | Assets of discontinued operations | — | — | 5,601.1 | (176.0 | ) | 5,425.1 | Assets of discontinued operations | — | 103.1 | — | 0.1 | 103.2 | |||||||||||||||||||||
| All other assets | 1.7 | 3,825.7 | 766.6 | (200.4 | ) | 4,393.6 | ||||||||||||||||||||||||||||
| Other assets | Other assets | 3.5 | 1,360.0 | 258.1 | (123.2 | ) | 1,498.4 | |||||||||||||||||||||||||||
| Total assets | $ | 7,409.5 | $ | 96,174.8 | $ | 19,741.4 | $ | (15,571.3 | ) | $ | 107,754.4 | Total assets | $ | 7,809.3 | $ | 117,649.8 | $ | 17,642.7 | $ | (16,066.4 | ) | $ | 127,035.4 | |||||||||||
| Liabilities | Liabilities | Liabilities | ||||||||||||||||||||||||||||||||
| Contractholder funds | Contractholder funds | $ | — | $ | 29,040.4 | $ | 5.8 | $ | (149.8 | ) | $ | 28,896.4 | Contractholder funds | $ | — | $ | 33,797.0 | $ | 13.5 | $ | (198.4 | ) | $ | 33,612.1 | ||||||||||
| Future policy benefits and claims | Future policy benefits and claims | — | 14,025.3 | 1,425.5 | — | 15,450.8 | Future policy benefits and claims | — | 14,650.3 | 2,175.2 | — | 16,825.5 | ||||||||||||||||||||||
| Other policyholder funds | Other policyholder funds | — | 706.2 | 2.9 | — | 709.1 | Other policyholder funds | — | 654.1 | 3.0 | — | 657.1 | ||||||||||||||||||||||
| Short-term debt | Short-term debt | — | — | 888.8 | (186.0 | ) | 702.8 | Short-term debt | — | — | 565.6 | (89.2 | ) | 476.4 | ||||||||||||||||||||
| Long-term debt | Long-term debt | — | 423.3 | 1,237.7 | (286.7 | ) | 1,374.3 | Long-term debt | — | 151.3 | 1,223.8 | (476.3 | ) | 898.8 | ||||||||||||||||||||
| Income taxes currently payable | Income taxes currently payable | — | 160.0 | 28.2 | (74.3 | ) | 113.9 | Income taxes currently payable | — | 0.1 | 0.3 | (0.4 | ) | — | ||||||||||||||||||||
| Deferred income taxes | Deferred income taxes | 8.2 | 974.0 | 221.8 | (5.1 | ) | 1,198.9 | Deferred income taxes | — | 753.1 | 237.1 | (15.4 | ) | 974.8 | ||||||||||||||||||||
| Separate account liabilities | Separate account liabilities | — | 42,753.4 | 632.2 | 22.2 | 43,407.8 | Separate account liabilities | — | 58,670.7 | 3,415.5 | (16.2 | ) | 62,070.0 | |||||||||||||||||||||
| Liabilities of discontinued operations | Liabilities of discontinued operations | — | — | 4,834.1 | (258.8 | ) | 4,575.3 | Liabilities of discontinued operations | — | 95.5 | — | (91.0 | ) | 4.5 | ||||||||||||||||||||
| Other liabilities | Other liabilities | 1.7 | 1,226.1 | 3,230.4 | (532.7 | ) | 3,925.5 | Other liabilities | 2.1 | 1,795.1 | 2,224.5 | (312.7 | ) | 3,709.0 | ||||||||||||||||||||
| Total liabilities | 9.9 | 89,308.7 | 12,507.4 | (1,471.2 | ) | 100,354.8 | Total liabilities | 2.1 | 110,567.2 | 9,858.5 | (1,199.6 | ) | 119,228.2 | |||||||||||||||||||||
| Stockholders' equity | Stockholders' equity | Stockholders' equity | ||||||||||||||||||||||||||||||||
| Series A preferred stock | Series A preferred stock | — | — | — | — | — | ||||||||||||||||||||||||||||
| Series B preferred stock | Series B preferred stock | 0.1 | — | — | — | 0.1 | ||||||||||||||||||||||||||||
| Common stock | Common stock | 3.8 | 2.5 | — | (2.5 | ) | 3.8 | Common stock | 3.8 | 2.5 | — | (2.5 | ) | 3.8 | ||||||||||||||||||||
| Additional paid-in capital | Additional paid-in capital | 7,153.2 | 5,052.1 | 6,796.9 | (11,849.0 | ) | 7,153.2 | Additional paid-in capital | 8,000.0 | 5,354.8 | 7,071.3 | (12,426.1 | ) | 8,000.0 | ||||||||||||||||||||
| Retained earnings (deficit) | Retained earnings (deficit) | 630.4 | 594.6 | (734.3 | ) | 139.7 | 630.4 | Retained earnings (deficit) | 2,008.6 | 870.4 | (281.9 | ) | (588.5 | ) | 2,008.6 | |||||||||||||||||||
| Accumulated other comprehensive income | Accumulated other comprehensive income | 1,171.3 | 1,216.9 | 1,171.4 | (2,388.3 | ) | 1,171.3 | Accumulated other comprehensive income | 994.8 | 854.9 | 994.8 | (1,849.7 | ) | 994.8 | ||||||||||||||||||||
| Treasury stock, at cost. | (1,559.1 | ) | — | — | — | (1,559.1 | ) | |||||||||||||||||||||||||||
| Treasury stock, at cost | Treasury stock, at cost | (3,200.1 | ) | — | — | — | (3,200.1 | ) | ||||||||||||||||||||||||||
| Total stockholders' equity | 7,399.6 | 6,866.1 | 7,234.0 | (14,100.1 | ) | 7,399.6 | Total stockholders' equity | 7,807.2 | 7,082.6 | 7,784.2 | (14,866.8 | ) | 7,807.2 | |||||||||||||||||||||
| Total liabilities and stockholders' equity | $ | 7,409.5 | $ | 96,174.8 | $ | 19,741.4 | $ | (15,571.3 | ) | $ | 107,754.4 | Total liabilities and stockholders' equity | $ | 7,809.3 | $ | 117,649.8 | $ | 17,642.7 | $ | (16,066.4 | ) | $ | 127,035.4 | |||||||||||
Principal Financial Group, Inc.
Notes to Consolidated Financial Statements — (continued)
23. Condensed Consolidating Financial Information — (continued)
Condensed Consolidating Statements of Operations
For the year ended December 31, 2006
| | Principal Financial Group, Inc. Parent Only | Principal Life Insurance Company Only | Principal Financial Services, Inc. and Other Subsidiaries Combined | Eliminations | Principal Financial Group, Inc. Consolidated | |||||||||||
|---|---|---|---|---|---|---|---|---|---|---|---|---|---|---|---|---|
| | (in millions) | |||||||||||||||
| Revenues | ||||||||||||||||
| Premiums and other considerations | $ | — | $ | 4,043.9 | $ | 261.4 | $ | — | $ | 4,305.3 | ||||||
| Fees and other revenues | — | 1,316.9 | 965.7 | (380.1 | ) | 1,902.5 | ||||||||||
| Net investment income | 11.9 | 3,124.6 | 506.2 | (24.7 | ) | 3,618.0 | ||||||||||
| Net realized/unrealized capital gains (losses) | — | (84.0 | ) | 134.3 | (5.6 | ) | 44.7 | |||||||||
| Total revenues | 11.9 | 8,401.4 | 1,867.6 | (410.4 | ) | 9,870.5 | ||||||||||
| Expenses | ||||||||||||||||
| Benefits, claims, and settlement expenses | — | 5,298.4 | 409.4 | (15.4 | ) | 5,692.4 | ||||||||||
| Dividends to policyholders | — | 290.7 | — | — | 290.7 | |||||||||||
| Operating expenses | 18.2 | 1,932.9 | 937.7 | (330.1 | ) | 2,558.7 | ||||||||||
| Total expenses | 18.2 | 7,522.0 | 1,347.1 | (345.5 | ) | 8,541.8 | ||||||||||
| Income (loss) from continuing operations before income taxes | (6.3 | ) | 879.4 | 520.5 | (64.9 | ) | 1,328.7 | |||||||||
| Income taxes (benefits) | (2.2 | ) | 203.0 | 92.5 | 1.7 | 295.0 | ||||||||||
| Equity in the net income of subsidiaries, excluding discontinued operations | 1,037.8 | 270.6 | 609.8 | (1,918.2 | ) | — | ||||||||||
| Income from continuing operations, net of related income taxes | 1,033.7 | 947.0 | 1,037.8 | (1,984.8 | ) | 1,033.7 | ||||||||||
| Income from discontinued operations, net of related income taxes | 30.6 | 30.6 | 30.6 | (61.2 | ) | 30.6 | ||||||||||
| Net income | 1,064.3 | 977.6 | 1,068.4 | (2,046.0 | ) | 1,064.3 | ||||||||||
| Preferred stock dividends | 33.0 | — | — | — | 33.0 | |||||||||||
| Net income available to common stockholders | $ | 1,031.3 | $ | 977.6 | $ | 1,068.4 | $ | (2,046.0 | ) | $ | 1,031.3 | |||||
Principal Financial Group, Inc.
Notes to Consolidated Financial Statements — (continued)
23. Condensed Consolidating Financial Information — (continued)
Condensed Consolidating Statements of Operations
For the year ended December 31, 2005
| | Principal Financial Group, Inc. Parent Only | Principal Life Insurance Company Only | Principal Financial Services, Inc. and Other Subsidiaries Combined | Eliminations | Principal Financial Group, Inc. Consolidated | ||||||||||||
|---|---|---|---|---|---|---|---|---|---|---|---|---|---|---|---|---|---|
| | (in millions) | ||||||||||||||||
| Revenues | |||||||||||||||||
| Premiums and other considerations | $ | — | $ | 3,705.7 | $ | 269.3 | $ | — | $ | 3,975.0 | |||||||
| Fees and other revenues | — | 1,198.8 | 786.3 | (267.3 | ) | 1,717.8 | |||||||||||
| Net investment income | 2.3 | 3,009.8 | 343.3 | 4.7 | 3,360.1 | ||||||||||||
| Net realized/unrealized capital gains (losses) | — | (34.5 | ) | 33.3 | (10.0 | ) | (11.2 | ) | |||||||||
| Total revenues | 2.3 | 7,879.8 | 1,432.2 | (272.6 | ) | 9,041.7 | |||||||||||
| Expenses | |||||||||||||||||
| Benefits, claims, and settlement expenses | — | 4,874.5 | 419.4 | (11.0 | ) | 5,282.9 | |||||||||||
| Dividends to policyholders | — | 293.0 | — | — | 293.0 | ||||||||||||
| Operating expenses | 10.6 | 1,787.8 | 774.8 | (231.1 | ) | 2,342.1 | |||||||||||
| Total expenses | 10.6 | 6,955.3 | 1,194.2 | (242.1 | ) | 7,918.0 | |||||||||||
| Income (loss) from continuing operations before income taxes | (8.3 | ) | 924.5 | 238.0 | (30.5 | ) | 1,123.7 | ||||||||||
| Income taxes (benefits) | (3.8 | ) | 221.4 | 16.8 | (2.2 | ) | 232.2 | ||||||||||
| Equity in the net income of subsidiaries, excluding discontinued operations | 896.0 | 104.9 | 674.7 | (1,675.6 | ) | — | |||||||||||
| Income from continuing operations, net of related income taxes | 891.5 | 808.0 | 895.9 | (1,703.9 | ) | 891.5 | |||||||||||
| Income from discontinued operations, net of related income taxes | 27.5 | 24.1 | 27.4 | (51.5 | ) | 27.5 | |||||||||||
| Net income | 919.0 | 832.1 | 923.3 | (1,755.4 | ) | 919.0 | |||||||||||
| Preferred stock dividends | 17.7 | — | — | — | 17.7 | ||||||||||||
| Net income available to common stockholders | $ | 901.3 | $ | 832.1 | $ | 923.3 | $ | (1,755.4 | ) | $ | 901.3 | ||||||
Principal Financial Group, Inc.
Notes to Consolidated Financial Statements — (continued)
23. Condensed Consolidating Financial Information — (continued)
Condensed Consolidating Statements of Operations
For the year ended December 31, 2004
| | | Principal Financial Group, Inc. Parent Only | Principal Life Insurance Company Only | Principal Financial Services, Inc. and Other Subsidiaries Combined | Eliminations | Principal Financial Group, Inc. Consolidated | | Principal Financial Group, Inc. Parent Only | Principal Life Insurance Company Only | Principal Financial Services, Inc. and Other Subsidiaries Combined | Eliminations | Principal Financial Group, Inc. Consolidated | ||||||||||||||||||||||
|---|---|---|---|---|---|---|---|---|---|---|---|---|---|---|---|---|---|---|---|---|---|---|---|---|---|---|---|---|---|---|---|---|---|---|
| | | (in millions) | | (in millions) | ||||||||||||||||||||||||||||||
| Revenues | Revenues | Revenues | ||||||||||||||||||||||||||||||||
| Premiums and other considerations | Premiums and other considerations | $ | — | $ | 3,450.9 | $ | 259.1 | $ | — | $ | 3,710.0 | Premiums and other considerations | $ | — | $ | 3,450.9 | $ | 259.1 | $ | — | $ | 3,710.0 | ||||||||||||
| Fees and other revenues | Fees and other revenues | — | 1,046.4 | 668.3 | (242.7 | ) | 1,472.0 | Fees and other revenues | — | 1,066.1 | 668.3 | (242.7 | ) | 1,491.7 | ||||||||||||||||||||
| Net investment income | Net investment income | 4.8 | 2,907.7 | 292.2 | 21.8 | 3,226.5 | Net investment income | 4.8 | 2,905.2 | 292.2 | 21.8 | 3,224.0 | ||||||||||||||||||||||
| Net realized/unrealized capital losses | Net realized/unrealized capital losses | — | (76.5 | ) | (33.9 | ) | 5.6 | (104.8 | ) | Net realized/unrealized capital losses | — | (76.5 | ) | (33.9 | ) | 5.6 | (104.8 | ) | ||||||||||||||||
| Total revenues | 4.8 | 7,328.5 | 1,185.7 | (215.3 | ) | 8,303.7 | Total revenues | 4.8 | 7,345.7 | 1,185.7 | (215.3 | ) | 8,320.9 | |||||||||||||||||||||
| Expenses | Expenses | Expenses | ||||||||||||||||||||||||||||||||
| Benefits, claims, and settlement expenses | Benefits, claims, and settlement expenses | — | 4,602.7 | 367.1 | (10.3 | ) | 4,959.5 | Benefits, claims, and settlement expenses | — | 4,602.7 | 367.1 | (10.3 | ) | 4,959.5 | ||||||||||||||||||||
| Dividends to policyholders | Dividends to policyholders | — | 296.7 | — | — | 296.7 | Dividends to policyholders | — | 296.7 | — | — | 296.7 | ||||||||||||||||||||||
| Operating expenses | Operating expenses | 10.5 | 1,637.7 | 730.6 | (212.9 | ) | 2,165.9 | Operating expenses | 10.5 | 1,657.4 | 730.6 | (212.9 | ) | 2,185.6 | ||||||||||||||||||||
| Total expenses | 10.5 | 6,537.1 | 1,097.7 | (223.2 | ) | 7,422.1 | ||||||||||||||||||||||||||||
| Total expenses | Total expenses | 10.5 | 6,556.8 | 1,097.7 | (223.2 | ) | 7,441.8 | |||||||||||||||||||||||||||
| Income (loss) from continuing operations before income taxes | Income (loss) from continuing operations before income taxes | (5.7 | ) | 791.4 | 88.0 | 7.9 | 881.6 | Income (loss) from continuing operations before income taxes | (5.7 | ) | 788.9 | 88.0 | 7.9 | 879.1 | ||||||||||||||||||||
| Income taxes (benefits) | Income taxes (benefits) | (2.2 | ) | 186.6 | (8.7 | ) | 3.4 | 179.1 | Income taxes (benefits) | (2.2 | ) | 185.7 | (8.7 | ) | 3.4 | 178.2 | ||||||||||||||||||
| Equity in the net income of subsidiaries, excluding discontinued operations and cumulative effect of accounting change. | 706.0 | 168.7 | 609.3 | (1,484.0 | ) | — | ||||||||||||||||||||||||||||
| Equity in the net income of subsidiaries, excluding discontinued operations and cumulative effect of accounting change | Equity in the net income of subsidiaries, excluding discontinued operations and cumulative effect of accounting change | 704.4 | 168.7 | 607.7 | (1,480.8 | ) | — | |||||||||||||||||||||||||||
| Income from continuing operations, net of related income taxes | Income from continuing operations, net of related income taxes | 702.5 | 773.5 | 706.0 | (1,479.5 | ) | 702.5 | Income from continuing operations, net of related income taxes | 700.9 | 771.9 | 704.4 | (1,476.3 | ) | 700.9 | ||||||||||||||||||||
| Income (loss) from discontinued operations, net of related income taxes | Income (loss) from discontinued operations, net of related income taxes | 128.8 | (3.3 | ) | 128.8 | (125.5 | ) | 128.8 | Income (loss) from discontinued operations, net of related income taxes | 130.4 | (1.7 | ) | 130.4 | (128.7 | ) | 130.4 | ||||||||||||||||||
| Income before cumulative effect of accounting change | Income before cumulative effect of accounting change | 831.3 | 770.2 | 834.8 | (1,605.0 | ) | 831.3 | Income before cumulative effect of accounting change | 831.3 | 770.2 | 834.8 | (1,605.0 | ) | 831.3 | ||||||||||||||||||||
| Cumulative effect of accounting change, net of related income taxes | Cumulative effect of accounting change, net of related income taxes | (5.7 | ) | (2.5 | ) | (5.7 | ) | 8.2 | (5.7 | ) | Cumulative effect of accounting change, net of related income taxes | (5.7 | ) | (2.5 | ) | (5.7 | ) | 8.2 | (5.7 | ) | ||||||||||||||
| Net income | Net income | $ | 825.6 | $ | 767.7 | $ | 829.1 | $ | (1,596.8 | ) | $ | 825.6 | Net income | $ | 825.6 | $ | 767.7 | $ | 829.1 | $ | (1,596.8 | ) | $ | 825.6 | ||||||||||
Principal Financial Group, Inc.
Notes to Consolidated Financial Statements — (continued)
23. Condensed Consolidating Financial Information — (continued)
Condensed Consolidating Statements of OperationsCash Flows
For the year ended December 31, 20032006
| | Principal Financial Group, Inc. Parent Only | Principal Life Insurance Company Only | Principal Financial Services, Inc. and Other Subsidiaries Combined | Eliminations | Principal Financial Group, Inc. Consolidated | |||||||||||||
|---|---|---|---|---|---|---|---|---|---|---|---|---|---|---|---|---|---|---|
| | (in millions) | |||||||||||||||||
| Revenues | ||||||||||||||||||
| Premiums and other considerations | $ | — | $ | 3,423.7 | $ | 207.0 | $ | — | $ | 3,630.7 | ||||||||
| Fees and other revenues | — | 827.3 | 534.2 | (175.7 | ) | 1,185.8 | ||||||||||||
| Net investment income | 3.5 | 2,948.9 | 269.6 | 11.4 | 3,233.4 | |||||||||||||
| Net realized/unrealized capital gains (losses) | — | (83.5 | ) | 64.0 | (43.7 | ) | (63.2 | ) | ||||||||||
| Total revenues | 3.5 | 7,116.4 | 1,074.8 | (208.0 | ) | 7,986.7 | ||||||||||||
| Expenses | ||||||||||||||||||
| Benefits, claims, and settlement expenses | — | 4,590.2 | 273.5 | (7.9 | ) | 4,855.8 | ||||||||||||
| Dividends to policyholders | — | 307.9 | — | — | 307.9 | |||||||||||||
| Operating expenses | 10.8 | 1,488.1 | 657.4 | (157.6 | ) | 1,998.7 | ||||||||||||
| Total expenses | 10.8 | 6,386.2 | 930.9 | (165.5 | ) | 7,162.4 | ||||||||||||
| Income (loss) from continuing operations before income taxes | (7.3 | ) | 730.2 | 143.9 | (42.5 | ) | 824.3 | |||||||||||
| Income taxes (benefits) | (2.7 | ) | 138.9 | 54.1 | (13.3 | ) | 177.0 | |||||||||||
| Equity in the net income of subsidiaries, excluding discontinued operations and cumulative effect of accounting change | 651.9 | 74.5 | 562.1 | (1,288.5 | ) | — | ||||||||||||
| Income from continuing operations, net of related income taxes | 647.3 | 665.8 | 651.9 | (1,317.7 | ) | 647.3 | ||||||||||||
| Income (loss) from discontinued operations, net of related income taxes | 102.4 | (6.6 | ) | 102.4 | (95.8 | ) | 102.4 | |||||||||||
| Income before cumulative effect of accounting change | 749.7 | 659.2 | 754.3 | (1,413.5 | ) | 749.7 | ||||||||||||
| Cumulative effect of accounting change, net of related income taxes | (3.4 | ) | — | (3.4 | ) | 3.4 | (3.4 | ) | ||||||||||
| Net income | $ | 746.3 | $ | 659.2 | $ | 750.9 | $ | (1,410.1 | ) | $ | 746.3 | |||||||
| | Principal Financial Group, Inc. Parent Only | Principal Life Insurance Company Only | Principal Financial Services, Inc. and Other Subsidiaries Combined | Eliminations | Principal Financial Group, Inc. Consolidated | ||||||||||||
|---|---|---|---|---|---|---|---|---|---|---|---|---|---|---|---|---|---|
| | (in millions) | ||||||||||||||||
| Operating activities | |||||||||||||||||
| Net cash provided by operating activities | $ | 7.2 | $ | 2,001.8 | $ | 115.3 | $ | 154.2 | $ | 2,278.5 | |||||||
| Investing activities | |||||||||||||||||
| Available-for-sale securities: | |||||||||||||||||
| Purchases | — | (6,585.5 | ) | (1,203.7 | ) | 23.8 | (7,765.4 | ) | |||||||||
| Sales | — | 1,075.6 | 363.3 | — | 1,438.9 | ||||||||||||
| Maturities | — | 3,406.8 | 189.0 | — | 3,595.8 | ||||||||||||
| Mortgage loans acquired or originated | — | (2,198.7 | ) | (455.1 | ) | 53.6 | (2,600.2 | ) | |||||||||
| Mortgage loans sold or repaid | — | 1,985.9 | 265.0 | (148.3 | ) | 2,102.6 | |||||||||||
| Real estate acquired | — | (12.4 | ) | (16.7 | ) | — | (29.1 | ) | |||||||||
| Real estate sold | — | 142.9 | 31.2 | — | 174.1 | ||||||||||||
| Net purchases of property and equipment | — | (31.3 | ) | (19.2 | ) | — | (50.5 | ) | |||||||||
| Purchases of interest in subsidiaries, net of cash acquired | — | — | (769.2 | ) | — | (769.2 | ) | ||||||||||
| Dividends received from (contributions to) unconsolidated entities | 331.1 | (511.9 | ) | 1,182.3 | (1,001.5 | ) | — | ||||||||||
| Net change in other investments | — | (7.1 | ) | (92.7 | ) | 89.9 | (9.9 | ) | |||||||||
| Net cash provided by (used in) investing activities | $ | 331.1 | $ | (2,735.7 | ) | $ | (525.8 | ) | $ | (982.5 | ) | $ | (3,912.9 | ) | |||
Principal Financial Group, Inc.
Notes to Consolidated Financial Statements — (continued)
23. Condensed Consolidating Financial Information — (continued)
Condensed Consolidating Statements of OperationsCash Flows (continued)
For the year ended December 31, 20022006
| | Principal Financial Group, Inc. Parent Only | Principal Life Insurance Company Only | Principal Financial Services, Inc. and Other Subsidiaries Combined | Eliminations | Principal Financial Group, Inc. Consolidated | ||||||||||||
|---|---|---|---|---|---|---|---|---|---|---|---|---|---|---|---|---|---|
| | (in millions) | ||||||||||||||||
| Revenues | |||||||||||||||||
| Premiums and other considerations | $ | — | $ | 3,705.1 | $ | 172.7 | $ | — | $ | 3,877.8 | |||||||
| Fees and other revenues | — | 707.8 | 421.1 | (178.5 | ) | 950.4 | |||||||||||
| Net investment income | 4.0 | 2,923.1 | 221.9 | 24.1 | 3,173.1 | ||||||||||||
| Net realized/unrealized capital gains (losses) | — | (528.1 | ) | 120.2 | 33.8 | (374.1 | ) | ||||||||||
| Total revenues | 4.0 | 6,807.9 | 935.9 | 120.6 | 7,627.2 | ||||||||||||
| Expenses | |||||||||||||||||
| Benefits, claims, and settlement expenses | — | 4,955.9 | 248.3 | (6.7 | ) | 5,197.5 | |||||||||||
| Dividends to policyholders | — | 316.6 | — | — | 316.6 | ||||||||||||
| Operating expenses | 7.1 | 1,361.4 | 520.2 | (147.1 | ) | 1,741.6 | |||||||||||
| Total expenses | 7.1 | 6,633.9 | 768.5 | (153.8 | ) | 7,255.7 | |||||||||||
| Income (loss) from continuing operations before income taxes | (3.1 | ) | 174.0 | 167.4 | 33.2 | 371.5 | |||||||||||
| Income taxes (benefits) | (1.3 | ) | (139.4 | ) | 53.8 | 12.0 | (74.9 | ) | |||||||||
| Equity in the net income of subsidiaries, excluding discontinued operations and cumulative effect of accounting change | 448.2 | 247.5 | 334.6 | (1,030.3 | ) | — | |||||||||||
| Income from continuing operations, net of related income taxes | 446.4 | 560.9 | 448.2 | (1,009.1 | ) | 446.4 | |||||||||||
| Loss from discontinued operations, net of related income taxes | (23.2 | ) | (8.8 | ) | (23.2 | ) | 32.0 | (23.2 | ) | ||||||||
| Income before cumulative effect of accounting change | 423.2 | 552.1 | 425.0 | (977.1 | ) | 423.2 | |||||||||||
| Cumulative effect of accounting change, net of related income taxes | (280.9 | ) | — | (280.9 | ) | 280.9 | (280.9 | ) | |||||||||
| Net income | $ | 142.3 | $ | 552.1 | $ | 144.1 | $ | (696.2 | ) | $ | 142.3 | ||||||
| | Principal Financial Group, Inc. Parent Only | Principal Life Insurance Company Only | Principal Financial Services, Inc. and Other Subsidiaries Combined | Eliminations | Principal Financial Group, Inc. Consolidated | ||||||||||||
|---|---|---|---|---|---|---|---|---|---|---|---|---|---|---|---|---|---|
| | (in millions) | ||||||||||||||||
| Financing activities | |||||||||||||||||
| Issuance of common stock | $ | 66.2 | $ | — | $ | — | $ | — | $ | 66.2 | |||||||
| Acquisition of treasury stock, net | (755.8 | ) | — | — | — | (755.8 | ) | ||||||||||
| Proceeds from financing element derivatives | — | 132.1 | — | — | 132.1 | ||||||||||||
| Payments for financing element derivatives | — | (141.0 | ) | — | — | (141.0 | ) | ||||||||||
| Excess tax benefits from share-based payment arrangements | — | 6.0 | 2.4 | — | 8.4 | ||||||||||||
| Dividends to common stockholders | (214.7 | ) | — | — | — | (214.7 | ) | ||||||||||
| Dividends to preferred stockholders | (24.7 | ) | — | — | — | (24.7 | ) | ||||||||||
| Issuance of long-term debt | 600.0 | 6.4 | 85.0 | (89.7 | ) | 601.7 | |||||||||||
| Principal repayments of long-term debt | — | (13.7 | ) | (7.3 | ) | — | (21.0 | ) | |||||||||
| Net repayments of short-term borrowings | — | — | (390.5 | ) | — | (390.5 | ) | ||||||||||
| Capital received from (dividends paid to) parent | — | (1,182.3 | ) | 180.8 | 1,001.5 | — | |||||||||||
| Investment contract deposits | — | 8,925.7 | — | — | 8,925.7 | ||||||||||||
| Investment contract withdrawals | — | (6,859.4 | ) | — | — | (6,859.4 | ) | ||||||||||
| Net increase in banking operation deposits | — | — | 258.9 | — | 258.9 | ||||||||||||
| Net cash provided by (used in) financing activities | (329.0 | ) | 873.8 | 129.3 | 911.8 | 1,585.9 | |||||||||||
| Discontinued operations | |||||||||||||||||
| Net cash used in operating activities | — | (1.1 | ) | — | — | (1.1 | ) | ||||||||||
| Net cash used in investing activities | — | (0.9 | ) | — | — | (0.9 | ) | ||||||||||
| Net cash used in financing activities | — | — | — | — | — | ||||||||||||
| Net cash used in discontinued operations | — | (2.0 | ) | — | — | (2.0 | ) | ||||||||||
| Net increase (decrease) in cash and cash equivalents | 9.3 | 137.9 | (281.2 | ) | 83.5 | (50.5 | ) | ||||||||||
| Cash and cash equivalents at beginning of year | 21.6 | 1,261.9 | 542.3 | (184.5 | ) | 1,641.3 | |||||||||||
| Cash and cash equivalents at end of year | $ | 30.9 | $ | 1,399.8 | $ | 261.1 | $ | (101.0 | ) | $ | 1,590.8 | ||||||
| Cash and cash equivalents of discontinued operations included above | |||||||||||||||||
| At beginning of year | $ | — | $ | 2.0 | $ | — | $ | — | $ | 2.0 | |||||||
| At end of year | $ | — | $ | — | $ | — | $ | — | $ | — | |||||||
Principal Financial Group, Inc.
Notes to Consolidated Financial Statements — (continued)
23. Condensed Consolidating Financial Information — (continued)
Condensed Consolidating Statements of Cash Flows
For the year ended December 31, 2005
| | Principal Financial Group, Inc. Parent Only | Principal Life Insurance Company Only | Principal Financial Services, Inc. and Other Subsidiaries Combined | Eliminations | Principal Financial Group, Inc. Consolidated | ||||||||||||
|---|---|---|---|---|---|---|---|---|---|---|---|---|---|---|---|---|---|
| | (in millions) | ||||||||||||||||
| Operating activities | |||||||||||||||||
| Net cash provided by (used in) operating activities | $ | (4.5 | ) | $ | 1,797.8 | $ | 441.8 | $ | (108.9 | ) | $ | 2,126.2 | |||||
| Investing activities | |||||||||||||||||
| Available-for-sale securities: | |||||||||||||||||
| Purchases | — | (7,218.1 | ) | (1,892.8 | ) | 155.8 | (8,955.1 | ) | |||||||||
| Sales | — | 2,443.2 | 857.3 | — | 3,300.5 | ||||||||||||
| Maturities | — | 3,688.3 | 214.9 | — | 3,903.2 | ||||||||||||
| Mortgage loans acquired or originated | — | (2,112.2 | ) | (533.0 | ) | 159.7 | (2,485.5 | ) | |||||||||
| Mortgage loans sold or repaid | — | 2,475.9 | 359.6 | (131.0 | ) | 2,704.5 | |||||||||||
| Real estate acquired | — | (27.4 | ) | (64.8 | ) | — | (92.2 | ) | |||||||||
| Real estate sold | — | 249.5 | 70.3 | — | 319.8 | ||||||||||||
| Net purchases of property and equipment | — | (34.6 | ) | (9.8 | ) | — | (44.4 | ) | |||||||||
| Purchases of interest in subsidiaries, net of cash acquired | — | — | (58.1 | ) | — | (58.1 | ) | ||||||||||
| Dividends received from (contributions to) unconsolidated entities | 501.1 | (787.3 | ) | 166.1 | 120.1 | — | |||||||||||
| Net change in other investments | — | 44.6 | (93.7 | ) | (27.3 | ) | (76.4 | ) | |||||||||
| Net cash provided by (used in) investing activities | $ | 501.1 | $ | (1,278.1 | ) | $ | (984.0 | ) | $ | 277.3 | $ | (1,483.7 | ) | ||||
Principal Financial Group, Inc.
Notes to Consolidated Financial Statements — (continued)
23. Condensed Consolidating Financial Information — (continued)
Condensed Consolidating Statements of Cash Flows (continued)
For the year ended December 31, 2005
| | Principal Financial Group, Inc. Parent Only | Principal Life Insurance Company Only | Principal Financial Services, Inc. and Other Subsidiaries Combined | Eliminations | Principal Financial Group, Inc. Consolidated | |||||||||||
|---|---|---|---|---|---|---|---|---|---|---|---|---|---|---|---|---|
| | (in millions) | |||||||||||||||
| Financing activities | ||||||||||||||||
| Issuance of common stock | $ | 59.9 | $ | — | $ | — | $ | — | $ | 59.9 | ||||||
| Issuance of preferred stock | 542.0 | — | — | — | 542.0 | |||||||||||
| Accelerated stock repurchase settlement | (84.0 | ) | — | — | — | (84.0 | ) | |||||||||
| Acquisition of treasury stock, net | (868.4 | ) | — | — | — | (868.4 | ) | |||||||||
| Proceeds from financing element derivatives | — | 168.4 | — | — | 168.4 | |||||||||||
| Payments for financing element derivatives | — | (123.2 | ) | — | — | (123.2 | ) | |||||||||
| Dividends to common stockholders | (182.2 | ) | — | — | — | (182.2 | ) | |||||||||
| Dividends to preferred stockholders | (17.7 | ) | — | — | — | (17.7 | ) | |||||||||
| Issuance of long-term debt | — | 52.3 | 258.8 | (173.6 | ) | 137.5 | ||||||||||
| Principal repayments of long-term debt | — | (7.3 | ) | (65.3 | ) | — | (72.6 | ) | ||||||||
| Net proceeds of short-term borrowings | — | 40.7 | 152.9 | 5.5 | 199.1 | |||||||||||
| Capital received from (dividends paid to) parent | — | (166.1 | ) | 286.2 | (120.1 | ) | — | |||||||||
| Investment contract deposits | — | 7,250.0 | — | — | 7,250.0 | |||||||||||
| Investment contract withdrawals | — | (6,504.5 | ) | — | — | (6,504.5 | ) | |||||||||
| Net increase in banking operation deposits | — | — | 41.9 | — | 41.9 | |||||||||||
| Net cash provided by (used in) financing activities | (550.4 | ) | 710.3 | 674.5 | (288.2 | ) | 546.2 | |||||||||
| Discontinued operations | ||||||||||||||||
| Net cash provided by operating activities | — | 125.1 | — | — | 125.1 | |||||||||||
| Net cash used in investing activities | — | (125.0 | ) | — | — | (125.0 | ) | |||||||||
| Net cash used in financing activities | — | — | — | — | — | |||||||||||
| Net cash provided by discontinued operations | — | 0.1 | — | — | 0.1 | |||||||||||
| Net increase (decrease) in cash and cash equivalents | (53.8 | ) | 1,230.1 | 132.3 | (119.8 | ) | 1,188.8 | |||||||||
| Cash and cash equivalents at beginning of year | 75.4 | 31.8 | 410.0 | (64.7 | ) | 452.5 | ||||||||||
| Cash and cash equivalents at end of year | $ | 21.6 | $ | 1,261.9 | $ | 542.3 | $ | (184.5 | ) | $ | 1,641.3 | |||||
| Cash and cash equivalents of discontinued operations included above | ||||||||||||||||
| At beginning of year | $ | — | $ | 1.9 | $ | — | $ | — | $ | 1.9 | ||||||
| At end of year | $ | — | $ | 2.0 | $ | — | $ | — | $ | 2.0 | ||||||
| Schedule of noncash transactions | ||||||||||||||||
| Tax benefits related to demutualization | $ | — | $ | 163.8 | $ | — | $ | — | $ | 163.8 | ||||||
Principal Financial Group, Inc.
Notes to Consolidated Financial Statements — (continued)
23. Condensed Consolidating Financial Information — (continued)
Condensed Consolidating Statements of Cash Flows
For the year ended December 31, 2004
| | | Principal Financial Group, Inc. Parent Only | Principal Life Insurance Company Only | Principal Financial Services, Inc. and Other Subsidiaries Combined | Eliminations | Principal Financial Group, Inc. Consolidated | | Principal Financial Group, Inc. Parent Only | Principal Life Insurance Company Only | Principal Financial Services, Inc. and Other Subsidiaries Combined | Eliminations | Principal Financial Group, Inc. Consolidated | ||||||||||||||||||||||
|---|---|---|---|---|---|---|---|---|---|---|---|---|---|---|---|---|---|---|---|---|---|---|---|---|---|---|---|---|---|---|---|---|---|---|
| | | (in millions) | | (in millions) | ||||||||||||||||||||||||||||||
| Operating activities | Operating activities | Operating activities | ||||||||||||||||||||||||||||||||
| Net cash provided by (used in) operating activities | Net cash provided by (used in) operating activities | $ | (1.1 | ) | $ | 2,233.3 | $ | (469.6 | ) | $ | 493.3 | $ | 2,255.9 | Net cash provided by (used in) operating activities | $ | (1.1 | ) | $ | 2,009.8 | $ | (463.3 | ) | $ | 486.1 | $ | 2,031.5 | ||||||||
Investing activities | Investing activities | Investing activities | ||||||||||||||||||||||||||||||||
| Available-for-sale securities: | Available-for-sale securities: | Available-for-sale securities: | ||||||||||||||||||||||||||||||||
| Purchases | — | (8,881.3 | ) | (4,548.4 | ) | (183.5 | ) | (13,613.2 | ) | Purchases | — | (8,881.3 | ) | (1,236.8 | ) | (183.5 | ) | (10,301.6 | ) | |||||||||||||||
| Sales | — | 1,227.5 | 1,099.6 | — | 2,327.1 | Sales | — | 1,227.5 | 1,099.6 | — | 2,327.1 | |||||||||||||||||||||||
| Maturities | — | 3,936.5 | 3,786.1 | — | 7,722.6 | Maturities | — | 3,936.5 | 474.5 | — | 4,411.0 | |||||||||||||||||||||||
| Net cash flows from trading securities | — | — | 6.3 | — | 6.3 | |||||||||||||||||||||||||||||
| Mortgage loans acquired or originated | Mortgage loans acquired or originated | — | (2,148.6 | ) | (76.4 | ) | 109.9 | (2,115.1 | ) | Mortgage loans acquired or originated | — | (2,708.7 | ) | (161.6 | ) | 109.9 | (2,760.4 | ) | ||||||||||||||||
| Mortgage loans sold or repaid | Mortgage loans sold or repaid | — | 1,763.5 | 182.1 | (91.3 | ) | 1,854.3 | Mortgage loans sold or repaid | — | 2,323.6 | 267.3 | (91.3 | ) | 2,499.6 | ||||||||||||||||||||
| Real estate acquired | Real estate acquired | — | (240.2 | ) | (101.7 | ) | — | (341.9 | ) | Real estate acquired | — | (239.8 | ) | (101.7 | ) | — | (341.5 | ) | ||||||||||||||||
| Real estate sold | Real estate sold | — | 261.2 | 84.4 | — | 345.6 | Real estate sold | — | 261.2 | 84.4 | — | 345.6 | ||||||||||||||||||||||
| Net purchases of property and equipment | Net purchases of property and equipment | — | (37.7 | ) | (9.8 | ) | — | (47.5 | ) | Net purchases of property and equipment | — | (37.7 | ) | (9.8 | ) | — | (47.5 | ) | ||||||||||||||||
| Net proceeds from sales of subsidiaries | Net proceeds from sales of subsidiaries | — | — | 694.7 | — | 694.7 | Net proceeds from sales of subsidiaries | — | — | 694.7 | — | 694.7 | ||||||||||||||||||||||
| Purchases of interest in subsidiaries, net of cash acquired | Purchases of interest in subsidiaries, net of cash acquired | — | — | (128.1 | ) | — | (128.1 | ) | Purchases of interest in subsidiaries, net of cash acquired | — | — | (128.1 | ) | — | (128.1 | ) | ||||||||||||||||||
| Dividends received from unconsolidated entities | Dividends received from unconsolidated entities | 800.6 | 208.7 | 489.3 | (1,498.6 | ) | — | Dividends received from unconsolidated entities | 800.6 | 705.3 | 1,124.0 | (2,629.9 | ) | — | ||||||||||||||||||||
| Net change in other investments | Net change in other investments | — | 589.6 | (34.1 | ) | (439.0 | ) | 116.5 | Net change in other investments | — | 93.0 | (28.9 | ) | 52.4 | 116.5 | |||||||||||||||||||
| Net cash provided by (used in) investing activities | Net cash provided by (used in) investing activities | $ | 800.6 | $ | (3,320.8 | ) | $ | 1,444.0 | $ | (2,102.5 | ) | $ | (3,178.7 | ) | Net cash provided by (used in) investing activities | $ | 800.6 | $ | (3,320.4 | ) | $ | 2,077.6 | $ | (2,742.4 | ) | $ | (3,184.6 | ) | ||||||
Principal Financial Group, Inc.
Notes to Consolidated Financial Statements — (continued)
23. Condensed Consolidating Financial Information — (continued)
Condensed Consolidating Statements of Cash Flows (continued)
For the year ended December 31, 2004
| | Principal Financial Group, Inc. Parent Only | Principal Life Insurance Company Only | Principal Financial Services, Inc. and Other Subsidiaries Combined | Eliminations | Principal Financial Group, Inc. Consolidated | |||||||||||
|---|---|---|---|---|---|---|---|---|---|---|---|---|---|---|---|---|
| | (in millions) | |||||||||||||||
| Financing activities | ||||||||||||||||
| Issuance of common stock | $ | 41.2 | $ | — | $ | — | $ | — | $ | 41.2 | ||||||
| Acquisition of treasury stock | (772.6 | ) | — | — | — | (772.6 | ) | |||||||||
| Proceeds from financing element derivatives | — | 110.6 | — | — | 110.6 | |||||||||||
| Payments for financing element derivatives | — | (84.6 | ) | — | — | (84.6 | ) | |||||||||
| Dividends to stockholders | (166.5 | ) | — | — | — | (166.5 | ) | |||||||||
| Issuance of long-term debt | — | 7.7 | 4.4 | — | 12.1 | |||||||||||
| Principal repayments of long-term debt | — | (217.1 | ) | (215.5 | ) | (14.6 | ) | (447.2 | ) | |||||||
| Net repayments of short-term borrowings | — | — | (231.9 | ) | (59.5 | ) | (291.4 | ) | ||||||||
| Dividends paid to parent | — | (1,124.0 | ) | (800.6 | ) | 1,924.6 | — | |||||||||
| Investment contract deposits | — | 6,995.8 | — | — | 6,995.8 | |||||||||||
| Investment contract withdrawals | — | (5,209.6 | ) | — | — | (5,209.6 | ) | |||||||||
| Net increase in bank deposits | — | — | (5.0 | ) | — | (5.0 | ) | |||||||||
| Net cash provided by (used in) financing activities | (897.9 | ) | 478.8 | (1,248.6 | ) | 1,850.5 | 182.8 | |||||||||
| Net decrease in cash and cash equivalents | (98.4 | ) | (608.7 | ) | (274.2 | ) | 241.3 | (740.0 | ) | |||||||
| Cash and cash equivalents at beginning of year | 173.8 | 640.5 | 684.2 | (306.0 | ) | 1,192.5 | ||||||||||
| Cash and cash equivalents at end of year | $ | 75.4 | $ | 31.8 | $ | 410.0 | $ | (64.7 | ) | $ | 452.5 | |||||
Condensed Consolidating Statements of Cash FlowsFor the year ended December 31, 2003
| | Principal Financial Group, Inc. Parent Only | Principal Life Insurance Company Only | Principal Financial Services, Inc. and Other Subsidiaries Combined | Eliminations | Principal Financial Group, Inc. Consolidated | ||||||||||||
|---|---|---|---|---|---|---|---|---|---|---|---|---|---|---|---|---|---|
| | (in millions) | ||||||||||||||||
| Operating activities | |||||||||||||||||
| Net cash provided by (used in) operating activities | $ | (3.3 | ) | $ | 2,194.7 | $ | 710.2 | $ | 162.2 | $ | 3,063.8 | ||||||
Investing activities | |||||||||||||||||
| Available-for-sale securities: | |||||||||||||||||
| Purchases | — | (9,550.3 | ) | (1,782.1 | ) | 414.3 | (10,918.1 | ) | |||||||||
| Sales | — | 2,273.8 | 1,018.6 | (339.6 | ) | 2,952.8 | |||||||||||
| Maturities | — | 4,380.2 | 842.1 | — | 5,222.3 | ||||||||||||
| Net cash flows from trading securities | — | — | 2.0 | (2.0 | ) | — | |||||||||||
| Mortgage loans acquired or originated | — | (1,544.2 | ) | (537.1 | ) | 49.4 | (2,031.9 | ) | |||||||||
| Mortgage loans sold or repaid | — | 1,088.1 | 276.0 | (47.3 | ) | 1,316.8 | |||||||||||
| Real estate acquired | — | (221.3 | ) | (29.5 | ) | — | (250.8 | ) | |||||||||
| Real estate sold | — | 30.6 | 31.3 | — | 61.9 | ||||||||||||
| Net purchases of property and equipment | — | (21.8 | ) | (6.8 | ) | — | (28.6 | ) | |||||||||
| Net proceeds from sales of subsidiaries | — | 18.4 | 40.9 | (18.4 | ) | 40.9 | |||||||||||
| Purchases of interest in subsidiaries, net of cash acquired | — | (26.1 | ) | (110.1 | ) | — | (136.2 | ) | |||||||||
| Dividends received from (contributions to) unconsolidated entities | 425.0 | 189.2 | (172.0 | ) | (442.2 | ) | — | ||||||||||
| Net change in other investments | — | 159.5 | (44.0 | ) | 96.3 | 211.8 | |||||||||||
| Net cash provided by (used in) investing activities | $ | 425.0 | $ | (3,223.9 | ) | $ | (470.7 | ) | $ | (289.5 | ) | $ | (3,559.1 | ) | |||
Condensed Consolidating Statements of Cash Flows (continued)For the year ended December 31, 2003
| | Principal Financial Group, Inc. Parent Only | Principal Life Insurance Company Only | Principal Financial Services, Inc. and Other Subsidiaries Combined | Eliminations | Principal Financial Group, Inc. Consolidated | |||||||||||
|---|---|---|---|---|---|---|---|---|---|---|---|---|---|---|---|---|
| | (in millions) | |||||||||||||||
| Financing activities | ||||||||||||||||
| Issuance of common stock | $ | 18.3 | $ | — | $ | — | $ | — | $ | 18.3 | ||||||
| Acquisition and sales of treasury stock, net | (453.0 | ) | — | — | — | (453.0 | ) | |||||||||
| Proceeds from financing element derivatives | — | 118.0 | 118.0 | |||||||||||||
| Payments for financing element derivatives | — | (107.3 | ) | (107.3 | ) | |||||||||||
| Dividends to stockholders | (145.3 | ) | — | — | — | (145.3 | ) | |||||||||
| Issuance of long-term debt | — | 31.6 | 34.7 | (31.6 | ) | 34.7 | ||||||||||
| Principal repayments of long-term debt | — | (14.1 | ) | (100.7 | ) | 29.5 | (85.3 | ) | ||||||||
| Net proceeds of short-term borrowings | — | — | 171.1 | (19.8 | ) | 151.3 | ||||||||||
| Dividends paid to parent | — | — | (425.0 | ) | 425.0 | — | ||||||||||
| Investment contract deposits | — | 9,722.0 | — | — | 9,722.0 | |||||||||||
| Investment contract withdrawals | — | (8,666.2 | ) | — | — | (8,666.2 | ) | |||||||||
| Net increase in bank deposits | — | — | 372.7 | — | 372.7 | |||||||||||
| Net cash provided by (used in) financing activities | (580.0 | ) | 1,084.0 | 52.8 | 403.1 | 959.9 | ||||||||||
| Net increase (decrease) in cash and cash equivalents | (158.3 | ) | 54.8 | 292.3 | 275.8 | 464.6 | ||||||||||
| Cash and cash equivalents at beginning of year | 332.1 | 585.7 | 391.9 | (581.8 | ) | 727.9 | ||||||||||
| Cash and cash equivalents at end of year | $ | 173.8 | $ | 640.5 | $ | 684.2 | $ | (306.0 | ) | $ | 1,192.5 | |||||
Condensed Consolidating Statements of Cash FlowsFor the year ended December 31, 2002
| | Principal Financial Group, Inc. Parent Only | Principal Life Insurance Company Only | Principal Financial Services, Inc. and Other Subsidiaries Combined | Eliminations | Principal Financial Group, Inc. Consolidated | ||||||||||||
|---|---|---|---|---|---|---|---|---|---|---|---|---|---|---|---|---|---|
| | (in millions) | ||||||||||||||||
| Operating activities | |||||||||||||||||
| Net cash provided by operating activities | $ | 7.2 | $ | 2,832.8 | $ | 1,264.8 | $ | (206.2 | ) | $ | 3,898.6 | ||||||
Investing activities | |||||||||||||||||
| Available-for-sale securities: | |||||||||||||||||
| Purchases | — | (14,517.3 | ) | (2,341.0 | ) | 281.0 | (16,577.3 | ) | |||||||||
| Sales | — | 8,094.4 | 267.4 | — | 8,361.8 | ||||||||||||
| Maturities | — | 3,629.2 | 829.2 | — | 4,458.4 | ||||||||||||
| Net cash flows from trading securities | — | — | (84.4 | ) | 2.0 | (82.4 | ) | ||||||||||
| Mortgage loans acquired or originated | — | (960.0 | ) | (135.9 | ) | (280.9 | ) | (1,376.8 | ) | ||||||||
| Mortgage loans sold or repaid | — | 1,368.5 | 56.0 | (86.3 | ) | 1,338.2 | |||||||||||
| Real estate acquired | — | (204.7 | ) | (43.6 | ) | — | (248.3 | ) | |||||||||
| Real estate sold | — | 168.9 | 13.1 | — | 182.0 | ||||||||||||
| Net purchases of property and equipment | — | (52.9 | ) | (6.1 | ) | — | (59.0 | ) | |||||||||
| Net proceeds from sale of subsidiaries | — | — | 500.8 | — | 500.8 | ||||||||||||
| Purchases of interest in subsidiaries, net of cash acquired | — | — | (54.5 | ) | — | (54.5 | ) | ||||||||||
| Dividends received from unconsolidated entities | 1,100.0 | 206.0 | (194.4 | ) | (1,111.6 | ) | — | ||||||||||
| Net change in other investments | — | 79.5 | 950.3 | (477.7 | ) | 552.1 | |||||||||||
| Net cash provided by (used in) investing activities | $ | 1,100.0 | $ | (2,188.4 | ) | $ | (243.1 | ) | $ | (1,673.5 | ) | $ | (3,005.0 | ) | |||
Condensed Consolidating Statements of Cash Flows (continued)For the year ended December 31, 2002
| | Principal Financial Group, Inc. Parent Only(2) | Principal Life Insurance Company Only | Principal Financial Services, Inc. and Other Subsidiaries Combined | Eliminations | Principal Financial Group, Inc. Consolidated | | Principal Financial Group, Inc. Parent Only | Principal Life Insurance Company Only | Principal Financial Services, Inc. Other and Subsidiaries Combined | Eliminations | Principal Financial Group, Inc. Consolidated | ||||||||||||||||||||||
|---|---|---|---|---|---|---|---|---|---|---|---|---|---|---|---|---|---|---|---|---|---|---|---|---|---|---|---|---|---|---|---|---|---|
| | (in millions) | | (in millions) | ||||||||||||||||||||||||||||||
| Financing activities | Financing activities | ||||||||||||||||||||||||||||||||
| Issuance of common stock | $ | 22.0 | $ | — | $ | — | $ | — | $ | 22.0 | Issuance of common stock | $ | 41.2 | $ | — | $ | — | $ | — | $ | 41.2 | ||||||||||||
| Acquisition and sales of treasury stock, net | (750.4 | ) | — | 8.0 | — | (742.4 | ) | Acquisition and sales of treasury stock, net | (772.6 | ) | — | — | — | (772.6 | ) | ||||||||||||||||||
| Dividends to stockholders | (83.8 | ) | — | — | — | (83.8 | ) | ||||||||||||||||||||||||||
| Proceeds from financing element derivatives | Proceeds from financing element derivatives | — | 110.6 | — | — | 110.6 | |||||||||||||||||||||||||||
| Payments for financing element derivatives | Payments for financing element derivatives | — | (84.6 | ) | — | — | (84.6 | ) | |||||||||||||||||||||||||
| Dividends to common stockholders | Dividends to common stockholders | (166.5 | ) | — | — | — | (166.5 | ) | |||||||||||||||||||||||||
| Issuance of long-term debt | — | 0.1 | 64.0 | — | 64.1 | Issuance of long-term debt | — | 7.7 | 4.4 | — | 12.1 | ||||||||||||||||||||||
| Principal repayments of long-term debt | — | (91.3 | ) | (81.8 | ) | 63.1 | (110.0 | ) | Principal repayments of long-term debt | — | (224.3 | ) | (215.5 | ) | (7.4 | ) | (447.2 | ) | |||||||||||||||
| Net proceeds of short-term borrowings | — | — | 15.1 | 38.1 | 53.2 | ||||||||||||||||||||||||||||
| Net repayments of short-term borrowings | Net repayments of short-term borrowings | — | — | (231.9 | ) | (59.5 | ) | (291.4 | ) | ||||||||||||||||||||||||
| Dividends paid to parent | — | (590.2 | ) | (1,100.0 | ) | 1,690.2 | — | Dividends paid to parent | — | (1,124.0 | ) | (1,440.5 | ) | 2,564.5 | — | ||||||||||||||||||
| Investment contract deposits | — | 7,117.0 | — | — | 7,117.0 | Investment contract deposits | — | 7,312.4 | — | — | 7,312.4 | ||||||||||||||||||||||
| Investment contract withdrawals | — | (7,225.7 | ) | — | — | (7,225.7 | ) | Investment contract withdrawals | — | (5,294.9 | ) | — | — | (5,294.9 | ) | ||||||||||||||||||
| Net increase in bank deposits | — | — | 184.4 | — | 184.4 | ||||||||||||||||||||||||||||
| Net decrease in banking operation deposits | Net decrease in banking operation deposits | — | — | (5.0 | ) | — | (5.0 | ) | |||||||||||||||||||||||||
| Net cash used in financing activities | (812.2 | ) | (790.1 | ) | (910.3 | ) | 1,791.4 | (721.2 | ) | ||||||||||||||||||||||||
| Net cash provided by (used in) financing activities | Net cash provided by (used in) financing activities | (897.9 | ) | 702.9 | (1,888.5 | ) | 2,497.6 | 414.1 | |||||||||||||||||||||||||
| Discontinued operations | Discontinued operations | ||||||||||||||||||||||||||||||||
| Net cash used in operating activities | Net cash used in operating activities | — | (0.6 | ) | (594.6 | ) | (32.5 | ) | (627.7 | ) | |||||||||||||||||||||||
| Net cash used in investing activities | Net cash used in investing activities | — | (0.4 | ) | (681.7 | ) | 208.4 | (473.7 | ) | ||||||||||||||||||||||||
| Net cash provided by financing activities | Net cash provided by financing activities | — | — | 600.0 | — | 600.0 | |||||||||||||||||||||||||||
| Net increase (decrease) in cash and cash equivalents | 295.0 | (145.7 | ) | 111.4 | (88.3 | ) | 172.4 | ||||||||||||||||||||||||||
| Net cash used in discontinued operations | Net cash used in discontinued operations | — | (1.0 | ) | (676.3 | ) | 175.9 | (501.4 | ) | ||||||||||||||||||||||||
| Net decrease in cash and cash equivalents | Net decrease in cash and cash equivalents | (98.4 | ) | (608.7 | ) | (950.5 | ) | 417.2 | (1,240.4 | ) | |||||||||||||||||||||||
| Cash and cash equivalents at beginning of year | 37.1 | 731.4 | 280.5 | (493.5 | ) | 555.5 | Cash and cash equivalents at beginning of year | 173.8 | 640.5 | 1,360.5 | (481.9 | ) | 1,692.9 | ||||||||||||||||||||
| Cash and cash equivalents at end of year | $ | 332.1 | $ | 585.7 | $ | 391.9 | $ | (581.8 | ) | $ | 727.9 | Cash and cash equivalents at end of year | $ | 75.4 | $ | 31.8 | $ | 410.0 | $ | (64.7 | ) | $ | 452.5 | ||||||||||
| Cash and cash equivalents of discontinued operations included above | Cash and cash equivalents of discontinued operations included above | ||||||||||||||||||||||||||||||||
| At beginning of year | $ | — | $ | 2.9 | $ | 676.3 | $ | (175.9 | ) | $ | 503.3 | ||||||||||||||||||||||
| At end of year | $ | — | $ | 1.9 | $ | — | $ | — | $ | 1.9 | |||||||||||||||||||||||
Principal Financial Group, Inc.
Notes to Consolidated Financial Statements — (continued)
23. Condensed Consolidating Financial Information — (continued)
On June 30, 2004,2005, our shelf registration statement with the SECSecurities and Exchange Commission was declared effective. WeFollowing our October and November 2006 issuances of debt securities under the shelf registration, we now have the ability to issue up to $3.0$1.85 billion of debt securities, preferred stock, common stock, warrants, stock purchase contracts and stock purchase units of Principal Financial Group, IncInc. and trust preferred securities of three subsidiary trusts. If we issue additional securities, we intend to use the proceeds from the sale of the securities offered by the prospectus, including the corresponding junior subordinated debentures issued to the trusts in connection with their investment of all the proceeds from the sale of preferred securities, for general corporate purposes, including working capital, capital expenditures, investments in subsidiaries, share repurchase, acquisitions and refinancing of debt, including commercial paper and other short-term indebtedness. Principal Financial Services, Inc. unconditionally guarantees our obligations with respect to one or more series of debt securities described in the shelf registration statement.
The following tables set forth condensed consolidating financial information of Principal Financial Services, Inc. and Principal Financial Group, Inc. as of December 31, 20042006 and 2003,2005, and for the years ended December 31, 2004, 20032006, 2005 and 2002.2004.
Condensed Consolidating Statements of Financial Position
December 31, 20042006
| | Principal Financial Group, Inc. Parent Only | Principal Financial Services, Inc. | Principal Life Insurance Company and Other Subsidiaries Combined | Eliminations | Principal Financial Group, Inc. Consolidated | ||||||||||||
|---|---|---|---|---|---|---|---|---|---|---|---|---|---|---|---|---|---|
| | (in millions) | ||||||||||||||||
| Assets | |||||||||||||||||
| Investments, excluding investment in unconsolidated entities | $ | — | $ | 24.0 | $ | 56,680.3 | $ | — | $ | 56,704.3 | |||||||
| Investment in unconsolidated entities | 7,469.0 | 7,668.4 | 214.3 | (15,137.4 | ) | 214.3 | |||||||||||
| Cash and cash equivalents | 75.4 | 551.9 | (207.4 | ) | 32.6 | 452.5 | |||||||||||
| Other intangibles | — | — | 196.5 | — | 196.5 | ||||||||||||
| Separate account assets | — | — | 51,507.9 | — | 51,507.9 | ||||||||||||
| All other assets | 1.6 | 17.4 | 4,725.9 | (22.3 | ) | 4,722.6 | |||||||||||
| Total assets | $ | 7,546.0 | $ | 8,261.7 | $ | 113,117.5 | $ | (15,127.1 | ) | $ | 113,798.1 | ||||||
| Liabilities | |||||||||||||||||
| Contractholder funds | $ | — | $ | — | $ | 32,183.3 | $ | — | $ | 32,183.3 | |||||||
| Future policy benefits and claims | — | — | 16,042.6 | — | 16,042.6 | ||||||||||||
| Other policyholder funds | — | — | 734.9 | — | 734.9 | ||||||||||||
| Short-term debt | — | 75.0 | 206.7 | — | 281.7 | ||||||||||||
| Long-term debt | — | 464.2 | 379.3 | — | 843.5 | ||||||||||||
| Income taxes currently payable | — | 9.1 | 274.4 | (5.6 | ) | 277.9 | |||||||||||
| Deferred income taxes | — | 12.4 | 1,130.7 | (11.4 | ) | 1,131.7 | |||||||||||
| Separate account liabilities | — | — | 51,507.9 | — | 51,507.9 | ||||||||||||
| Other liabilities | 1.7 | 232.0 | 2,989.3 | 27.3 | 3,250.3 | ||||||||||||
| Total liabilities | 1.7 | 792.7 | 105,449.1 | 10.3 | 106,253.8 | ||||||||||||
| Stockholders' equity | |||||||||||||||||
| Common stock | 3.8 | — | 16.8 | (16.8 | ) | 3.8 | |||||||||||
| Additional paid-in capital | 7,269.4 | 6,860.9 | 5,950.6 | (12,811.5 | ) | 7,269.4 | |||||||||||
| Retained earnings (deficit) | 1,289.5 | (705.3 | ) | 389.2 | 316.1 | 1,289.5 | |||||||||||
| Accumulated other comprehensive income | 1,313.3 | 1,313.4 | 1,311.8 | (2,625.2 | ) | 1,313.3 | |||||||||||
| Treasury stock, at cost | (2,331.7 | ) | — | — | — | (2,331.7 | ) | ||||||||||
| Total stockholders' equity | 7,544.3 | 7,469.0 | 7,668.4 | (15,137.4 | ) | 7,544.3 | |||||||||||
| Total liabilities and stockholders' equity | $ | 7,546.0 | $ | 8,261.7 | $ | 113,117.5 | $ | (15,127.1 | ) | $ | 113,798.1 | ||||||
| | Principal Financial Group, Inc. Parent Only | Principal Financial Services, Inc. Only | Principal Life Insurance Company and Other Subsidiaries Combined | Eliminations | Principal Financial Group, Inc. Consolidated | |||||||||||
|---|---|---|---|---|---|---|---|---|---|---|---|---|---|---|---|---|
| | (in millions) | |||||||||||||||
| Assets | ||||||||||||||||
| Fixed maturities, available-for-sale | $ | — | $ | 14.1 | $ | 44,389.4 | $ | — | $ | 44,403.5 | ||||||
| Fixed maturities, trading | — | 1.2 | 322.2 | — | 323.4 | |||||||||||
| Equity securities, available-for-sale | — | 0.9 | 665.7 | — | 666.6 | |||||||||||
| Equity securities, trading | — | 1.3 | 179.7 | — | 181.0 | |||||||||||
| Mortgage loans | — | — | 11,663.9 | — | 11,663.9 | |||||||||||
| Real estate | — | — | 867.0 | — | 867.0 | |||||||||||
| Policy loans | — | — | 850.7 | — | 850.7 | |||||||||||
| Investment in unconsolidated entities | 8,191.4 | 8,701.7 | 298.1 | (16,893.1 | ) | 298.1 | ||||||||||
| Other investments | 3.6 | 4.4 | 1,109.0 | (4.4 | ) | 1,112.6 | ||||||||||
| Cash and cash equivalents | 30.9 | 129.2 | 2,031.3 | (600.6 | ) | 1,590.8 | ||||||||||
| Accrued investment income | — | 0.3 | 723.2 | — | 723.5 | |||||||||||
| Premiums due and other receivables | — | 353.5 | 898.8 | — | 1,252.3 | |||||||||||
| Deferred policy acquisition costs | — | — | 2,418.9 | — | 2,418.9 | |||||||||||
| Property and equipment | — | — | 422.5 | — | 422.5 | |||||||||||
| Goodwill | — | — | 361.9 | — | 361.9 | |||||||||||
| Other intangibles | — | — | 981.0 | — | 981.0 | |||||||||||
| Separate account assets | — | — | 73,779.6 | — | 73,779.6 | |||||||||||
| Other assets | 256.1 | 9.2 | 1,749.3 | (253.8 | ) | 1,760.8 | ||||||||||
| Total assets | $ | 8,482.0 | $ | 9,215.8 | $ | 143,712.2 | $ | (17,751.9 | ) | $ | 143,658.1 | |||||
Principal Financial Group, Inc.
Notes to Consolidated Financial Statements — (continued)
23. Condensed Consolidating Financial Information — (continued)
Condensed Consolidating Statements of Financial Position (continued)
December 31, 2006
| | Principal Financial Group, Inc. Parent Only | Principal Financial Services, Inc. Only | Principal Life Insurance Company and Other Subsidiaries Combined | Eliminations | Principal Financial Group, Inc. Consolidated | ||||||||||||
|---|---|---|---|---|---|---|---|---|---|---|---|---|---|---|---|---|---|
| | (in millions) | ||||||||||||||||
| Liabilities | |||||||||||||||||
| Contractholder funds | $ | — | $ | — | $ | 36,799.0 | $ | — | $ | 36,799.0 | |||||||
| Future policy benefits and claims | — | — | 17,332.6 | — | 17,332.6 | ||||||||||||
| Other policyholder funds | — | — | 619.4 | — | 619.4 | ||||||||||||
| Short-term debt | — | — | 435.3 | (351.2 | ) | 84.1 | |||||||||||
| Long-term debt | 601.9 | 464.5 | 487.4 | — | 1,553.8 | ||||||||||||
| Income taxes currently payable | (1.2 | ) | (2.0 | ) | 2.4 | 5.0 | 4.2 | ||||||||||
| Deferred income taxes | 1.1 | 12.3 | 909.7 | (5.9 | ) | 917.2 | |||||||||||
| Separate account liabilities | — | — | 73,779.6 | — | 73,779.6 | ||||||||||||
| Other liabilities | 19.4 | 549.6 | 4,645.1 | (506.7 | ) | 4,707.4 | |||||||||||
| Total liabilities | 621.2 | 1,024.4 | 135,010.5 | (858.8 | ) | 135,797.3 | |||||||||||
| Stockholders' equity | |||||||||||||||||
| Series A preferred stock | — | — | — | — | — | ||||||||||||
| Series B preferred stock | 0.1 | — | — | — | 0.1 | ||||||||||||
| Common stock | 3.8 | — | 17.1 | (17.1 | ) | 3.8 | |||||||||||
| Additional paid-in capital | 8,141.8 | 7,688.2 | 6,918.2 | (14,606.4 | ) | 8,141.8 | |||||||||||
| Retained earnings (deficit) | 2,824.1 | (339.5 | ) | 924.2 | (584.7 | ) | 2,824.1 | ||||||||||
| Accumulated other comprehensive income | 846.9 | 842.7 | 844.2 | (1,686.9 | ) | 846.9 | |||||||||||
| Treasury stock, at cost | (3,955.9 | ) | — | (2.0 | ) | 2.0 | (3,955.9 | ) | |||||||||
| Total stockholders' equity | 7,860.8 | 8,191.4 | 8,701.7 | (16,893.1 | ) | 7,860.8 | |||||||||||
| Total liabilities and stockholders' equity | $ | 8,482.0 | $ | 9,215.8 | $ | 143,712.2 | $ | (17,751.9 | ) | $ | 143,658.1 | ||||||
Principal Financial Group, Inc.
Notes to Consolidated Financial Statements — (continued)
23. Condensed Consolidating Financial Information — (continued)
Condensed Consolidating Statements of Financial Position
December 31, 20032005
| | | Principal Financial Group, Inc. Parent Only | Principal Financial Services, Inc. Only | Principal Life Insurance Company and Other Subsidiaries Combined | Eliminations | Principal Financial Group, Inc. Consolidated | | Principal Financial Group, Inc. Parent Only | Principal Financial Services, Inc. Only | Principal Life Insurance Company and Other Subsidiaries Combined | Eliminations | Principal Financial Group, Inc. Consolidated | ||||||||||||||||||||||
|---|---|---|---|---|---|---|---|---|---|---|---|---|---|---|---|---|---|---|---|---|---|---|---|---|---|---|---|---|---|---|---|---|---|---|
| | | (in millions) | | (in millions) | ||||||||||||||||||||||||||||||
| Assets | Assets | Assets | ||||||||||||||||||||||||||||||||
| Investments, excluding investment in unconsolidated entities | $ | — | $ | 150.5 | $ | 52,896.7 | $ | — | $ | 53,047.2 | ||||||||||||||||||||||||
| Fixed maturities, available-for-sale | Fixed maturities, available-for-sale | $ | — | $ | 14.7 | $ | 42,102.5 | $ | — | $ | 42,117.2 | |||||||||||||||||||||||
| Fixed maturities, trading | Fixed maturities, trading | — | — | 113.2 | — | 113.2 | ||||||||||||||||||||||||||||
| Equity securities, available-for-sale | Equity securities, available-for-sale | — | 1.0 | 723.4 | — | 724.4 | ||||||||||||||||||||||||||||
| Equity securities, trading | Equity securities, trading | — | — | 90.3 | — | 90.3 | ||||||||||||||||||||||||||||
| Mortgage loans | Mortgage loans | — | — | 11,484.3 | — | 11,484.3 | ||||||||||||||||||||||||||||
| Real estate | Real estate | — | — | 900.1 | — | 900.1 | ||||||||||||||||||||||||||||
| Policy loans | Policy loans | — | — | 827.7 | — | 827.7 | ||||||||||||||||||||||||||||
| Investment in unconsolidated entities | Investment in unconsolidated entities | 7,234.0 | 7,771.7 | 167.2 | (15,005.7 | ) | 167.2 | Investment in unconsolidated entities | 7,784.2 | 8,168.9 | 263.8 | (15,953.0 | ) | 263.9 | ||||||||||||||||||||
| Other investments | Other investments | — | 8.4 | 841.2 | — | 849.6 | ||||||||||||||||||||||||||||
| Cash and cash equivalents | Cash and cash equivalents | 173.8 | 872.7 | 369.7 | (223.7 | ) | 1,192.5 | Cash and cash equivalents | 21.6 | 701.3 | 1,820.4 | (904.0 | ) | 1,639.3 | ||||||||||||||||||||
| Accrued investment income | Accrued investment income | — | 0.2 | 682.1 | — | 682.3 | ||||||||||||||||||||||||||||
| Premiums due and other receivables | Premiums due and other receivables | — | 2.3 | 590.4 | — | 592.7 | ||||||||||||||||||||||||||||
| Deferred policy acquisition costs | Deferred policy acquisition costs | — | — | 2,174.1 | — | 2,174.1 | ||||||||||||||||||||||||||||
| Property and equipment | Property and equipment | — | — | 419.8 | — | 419.8 | ||||||||||||||||||||||||||||
| Goodwill | Goodwill | — | — | 282.3 | — | 282.3 | ||||||||||||||||||||||||||||
| Other intangibles | Other intangibles | — | — | 121.0 | — | 121.0 | Other intangibles | — | — | 202.6 | — | 202.6 | ||||||||||||||||||||||
| Separate account assets | Separate account assets | — | — | 43,407.8 | — | 43,407.8 | Separate account assets | — | — | 62,070.0 | — | 62,070.0 | ||||||||||||||||||||||
| Assets of discontinued operations | Assets of discontinued operations | — | — | 5,425.1 | — | 5,425.1 | Assets of discontinued operations | — | — | 103.2 | — | 103.2 | ||||||||||||||||||||||
| All other assets | 1.7 | 186.1 | 4,223.3 | (17.5 | ) | 4,393.6 | ||||||||||||||||||||||||||||
| Other assets | Other assets | 3.5 | 15.0 | 1,498.4 | (18.5 | ) | 1,498.4 | |||||||||||||||||||||||||||
| Total assets | $ | 7,409.5 | $ | 8,981.0 | $ | 106,610.8 | $ | (15,246.9 | ) | $ | 107,754.4 | Total assets | $ | 7,809.3 | $ | 8,911.8 | $ | 127,189.8 | $ | (16,875.5 | ) | $ | 127,035.4 | |||||||||||
| Liabilities | Liabilities | Liabilities | ||||||||||||||||||||||||||||||||
| Contractholder funds | Contractholder funds | $ | — | $ | — | $ | 28,896.4 | $ | — | $ | 28,896.4 | Contractholder funds | $ | — | $ | — | $ | 33,612.1 | $ | — | $ | 33,612.1 | ||||||||||||
| Future policy benefits and claims | Future policy benefits and claims | — | — | 15,450.8 | — | 15,450.8 | Future policy benefits and claims | — | — | 16,825.5 | — | 16,825.5 | ||||||||||||||||||||||
| Other policyholder funds | Other policyholder funds | — | — | 709.1 | — | 709.1 | Other policyholder funds | — | — | 657.1 | — | 657.1 | ||||||||||||||||||||||
| Short-term debt | Short-term debt | — | 399.9 | 313.6 | (10.7 | ) | 702.8 | Short-term debt | — | 349.9 | 774.1 | (647.6 | ) | 476.4 | ||||||||||||||||||||
| Long-term debt | Long-term debt | — | 664.0 | 710.3 | — | 1,374.3 | Long-term debt | — | 464.3 | 434.5 | — | 898.8 | ||||||||||||||||||||||
| Income taxes currently payable | — | 14.1 | 100.5 | (0.7 | ) | 113.9 | ||||||||||||||||||||||||||||
| Deferred income taxes | Deferred income taxes | 8.2 | 20.7 | 1,170.0 | — | 1,198.9 | Deferred income taxes | — | 7.0 | 983.8 | (16.0 | ) | 974.8 | |||||||||||||||||||||
| Separate account liabilities | Separate account liabilities | — | — | 43,407.8 | — | 43,407.8 | Separate account liabilities | — | — | 62,070.0 | — | 62,070.0 | ||||||||||||||||||||||
| Liabilities of discontinued operations | Liabilities of discontinued operations | — | — | 4,575.3 | — | 4,575.3 | Liabilities of discontinued operations | — | — | 4.5 | — | 4.5 | ||||||||||||||||||||||
| Other liabilities | Other liabilities | 1.7 | 648.3 | 3,505.3 | (229.8 | ) | 3,925.5 | Other liabilities | 2.1 | 306.4 | 3,659.3 | (258.8 | ) | 3,709.0 | ||||||||||||||||||||
| Total liabilities | 9.9 | 1,747.0 | 98,839.1 | (241.2 | ) | 100,354.8 | ||||||||||||||||||||||||||||
| Total liabilities | Total liabilities | 2.1 | 1,127.6 | 119,020.9 | (922.4 | ) | 119,228.2 | |||||||||||||||||||||||||||
| Stockholders' equity | Stockholders' equity | Stockholders' equity | ||||||||||||||||||||||||||||||||
| Series A preferred stock | Series A preferred stock | — | — | — | — | — | ||||||||||||||||||||||||||||
| Series B preferred stock | Series B preferred stock | 0.1 | — | — | — | 0.1 | ||||||||||||||||||||||||||||
| Common stock | Common stock | 3.8 | — | 64.4 | (64.4 | ) | 3.8 | Common stock | 3.8 | — | 16.8 | (16.8 | ) | 3.8 | ||||||||||||||||||||
| Additional paid-in capital | Additional paid-in capital | 7,153.2 | 6,796.9 | 5,851.8 | (12,648.7 | ) | 7,153.2 | Additional paid-in capital | 8,000.0 | 7,071.3 | 6,108.7 | (13,180.0 | ) | 8,000.0 | ||||||||||||||||||||
| Retained earnings (deficit) | Retained earnings (deficit) | 630.4 | (734.3 | ) | 685.6 | 48.7 | 630.4 | Retained earnings (deficit) | 2,008.6 | (281.9 | ) | 1,050.1 | (768.2 | ) | 2,008.6 | |||||||||||||||||||
| Accumulated other comprehensive income | Accumulated other comprehensive income | 1,171.3 | 1,171.4 | 1,169.9 | (2,341.3 | ) | 1,171.3 | Accumulated other comprehensive income | 994.8 | 994.8 | 995.3 | (1,990.1 | ) | 994.8 | ||||||||||||||||||||
| Treasury stock, at cost | Treasury stock, at cost | (1,559.1 | ) | — | — | — | (1,559.1 | ) | Treasury stock, at cost | (3,200.1 | ) | — | (2.0 | ) | 2.0 | (3,200.1 | ) | |||||||||||||||||
| Total stockholders' equity | 7,399.6 | 7,234.0 | 7,771.7 | (15,005.7 | ) | 7,399.6 | Total stockholders' equity | 7,807.2 | 7,784.2 | 8,168.9 | (15,953.1 | ) | 7,807.2 | |||||||||||||||||||||
| Total liabilities and stockholders' equity | $ | 7,409.5 | $ | 8,981.0 | $ | 106,610.8 | $ | (15,246.9 | ) | $ | 107,754.4 | Total liabilities and stockholders' equity | $ | 7,809.3 | $ | 8,911.8 | $ | 127,189.8 | $ | (16,875.5 | ) | $ | 127,035.4 | |||||||||||
Principal Financial Group, Inc.
Notes to Consolidated Financial Statements — (continued)
23. Condensed Consolidating Financial Information — (continued)
Condensed Consolidating Statements of Operations
For the year ended December 31, 2006
| | Principal Financial Group, Inc. Parent Only | Principal Financial Services, Inc. Only | Principal Life Insurance Company and Other Subsidiaries Combined | Eliminations | Principal Financial Group, Inc. Consolidated | |||||||||||
|---|---|---|---|---|---|---|---|---|---|---|---|---|---|---|---|---|
| | (in millions) | |||||||||||||||
| Revenues | ||||||||||||||||
| Premiums and other considerations | $ | — | $ | — | $ | 4,305.3 | $ | — | $ | 4,305.3 | ||||||
| Fees and other revenues | — | — | 1,905.8 | (3.3 | ) | 1,902.5 | ||||||||||
| Net investment income | 11.9 | 12.5 | 3,593.5 | 0.1 | 3,618.0 | |||||||||||
| Net realized/unrealized capital gains (losses) | — | (0.6 | ) | 45.3 | — | 44.7 | ||||||||||
| Total revenues | 11.9 | 11.9 | 9,849.9 | (3.2 | ) | 9,870.5 | ||||||||||
| Expenses | ||||||||||||||||
| Benefits, claims, and settlement expenses | — | — | 5,692.4 | — | 5,692.4 | |||||||||||
| Dividends to policyholders | — | — | 290.7 | — | 290.7 | |||||||||||
| Operating expenses | 18.2 | 42.9 | 2,500.8 | (3.2 | ) | 2,558.7 | ||||||||||
| Total expenses | 18.2 | 42.9 | 8,483.9 | (3.2 | ) | 8,541.8 | ||||||||||
| Income (loss) from continuing operations before income taxes | (6.3 | ) | (31.0 | ) | 1,366.0 | — | 1,328.7 | |||||||||
| Income taxes (benefits) | (2.2 | ) | (10.4 | ) | 307.6 | — | 295.0 | |||||||||
| Equity in the net income of subsidiaries, excluding discontinued operations | 1,037.8 | 1,058.4 | — | (2,096.2 | ) | — | ||||||||||
| Income from continuing operations, net of related income taxes | 1,033.7 | 1,037.8 | 1,058.4 | (2,096.2 | ) | 1,033.7 | ||||||||||
| Income from discontinued operations, net of related income taxes | 30.6 | 30.6 | 30.6 | (61.2 | ) | 30.6 | ||||||||||
| Net income | 1,064.3 | 1,068.4 | 1,089.0 | (2,157.4 | ) | 1,064.3 | ||||||||||
| Preferred stock dividends | 33.0 | — | — | — | 33.0 | |||||||||||
| Net income available to common stockholders | $ | 1,031.3 | $ | 1,068.4 | $ | 1,089.0 | $ | (2,157.4 | ) | $ | 1,031.3 | |||||
Principal Financial Group, Inc.
Notes to Consolidated Financial Statements — (continued)
23. Condensed Consolidating Financial Information — (continued)
Condensed Consolidating Statements of Operations
For the year ended December 31, 2005
| | Principal Financial Group, Inc. Parent Only | Principal Financial Services, Inc. Only | Principal Life Insurance Company and Other Subsidiaries Combined | Eliminations | Principal Financial Group, Inc. Consolidated | ||||||||||||
|---|---|---|---|---|---|---|---|---|---|---|---|---|---|---|---|---|---|
| | (in millions) | ||||||||||||||||
| Revenues | |||||||||||||||||
| Premiums and other considerations | $ | — | $ | — | $ | 3,975.0 | $ | — | $ | 3,975.0 | |||||||
| Fees and other revenues | — | — | 1,717.9 | (0.1 | ) | 1,717.8 | |||||||||||
| Net investment income | 2.3 | 7.3 | 3,350.5 | — | 3,360.1 | ||||||||||||
| Net realized/unrealized capital losses | — | (1.1 | ) | (10.1 | ) | — | (11.2 | ) | |||||||||
| Total revenues | 2.3 | 6.2 | 9,033.3 | (0.1 | ) | 9,041.7 | |||||||||||
| Expenses | |||||||||||||||||
| Benefits, claims, and settlement expenses | — | — | 5,282.9 | — | 5,282.9 | ||||||||||||
| Dividends to policyholders | — | — | 293.0 | — | 293.0 | ||||||||||||
| Operating expenses | 10.6 | 39.2 | 2,292.5 | (0.2 | ) | 2,342.1 | |||||||||||
| Total expenses | 10.6 | 39.2 | 7,868.4 | (0.2 | ) | 7,918.0 | |||||||||||
| Income (loss) from continuing operations before income taxes | (8.3 | ) | (33.0 | ) | 1,164.9 | 0.1 | 1,123.7 | ||||||||||
| Income taxes (benefits) | (3.8 | ) | (15.7 | ) | 251.7 | — | 232.2 | ||||||||||
| Equity in the net income of subsidiaries, excluding discontinued operations | 896.0 | 913.2 | — | (1,809.2 | ) | — | |||||||||||
| Income from continuing operations, net of related income taxes | 891.5 | 895.9 | 913.2 | (1,809.1 | ) | 891.5 | |||||||||||
| Income from discontinued operations, net of related income taxes | 27.5 | 27.5 | 18.9 | (46.4 | ) | 27.5 | |||||||||||
| Net income | 919.0 | 923.4 | 932.1 | (1,855.5 | ) | 919.0 | |||||||||||
| Preferred stock dividends | 17.7 | — | — | — | 17.7 | ||||||||||||
| Net income available to common stockholders | $ | 901.3 | $ | 923.4 | $ | 932.1 | $ | (1,855.5 | ) | $ | 901.3 | ||||||
Principal Financial Group, Inc.
Notes to Consolidated Financial Statements — (continued)
23. Condensed Consolidating Financial Information — (continued)
Condensed Consolidating Statements of Operations
For the year ended December 31, 2004
| | | Principal Financial Group, Inc. Parent Only | Principal Financial Services, Inc. Only | Principal Life Insurance Company and Other Subsidiaries Combined | Eliminations | Principal Financial Group, Inc. Consolidated | | Principal Financial Group, Inc. Parent Only | Principal Financial Services, Inc. Only | Principal Life Insurance Company and Other Subsidiaries Combined | Eliminations | Principal Financial Group, Inc. Consolidated | ||||||||||||||||||||||
|---|---|---|---|---|---|---|---|---|---|---|---|---|---|---|---|---|---|---|---|---|---|---|---|---|---|---|---|---|---|---|---|---|---|---|
| | | (in millions) | | (in millions) | ||||||||||||||||||||||||||||||
| Revenues | Revenues | Revenues | ||||||||||||||||||||||||||||||||
| Premiums and other considerations | Premiums and other considerations | $ | — | $ | — | $ | 3,710.0 | $ | — | $ | 3,710.0 | Premiums and other considerations | $ | — | $ | — | $ | 3,710.0 | $ | — | $ | 3,710.0 | ||||||||||||
| Fees and other revenues | Fees and other revenues | — | — | 1,472.6 | (0.6 | ) | 1,472.0 | Fees and other revenues | — | — | 1,495.3 | (3.6 | ) | 1,491.7 | ||||||||||||||||||||
| Net investment income | Net investment income | 4.8 | 8.1 | 3,213.1 | 0.5 | 3,226.5 | Net investment income | 4.8 | 8.1 | 3,210.6 | 0.5 | 3,224.0 | ||||||||||||||||||||||
| Net realized/unrealized capital losses | Net realized/unrealized capital losses | — | (30.9 | ) | (73.9 | ) | — | (104.8 | ) | Net realized/unrealized capital losses | — | (30.9 | ) | (73.9 | ) | — | (104.8 | ) | ||||||||||||||||
| Total revenues | 4.8 | (22.8 | ) | 8,321.8 | (0.1 | ) | 8,303.7 | Total revenues | 4.8 | (22.8 | ) | 8,342.0 | (3.1 | ) | 8,320.9 | |||||||||||||||||||
| Expenses | Expenses | Expenses | ||||||||||||||||||||||||||||||||
| Benefits, claims, and settlement expenses | Benefits, claims, and settlement expenses | — | — | 4,959.5 | — | 4,959.5 | Benefits, claims, and settlement expenses | — | — | 4,959.5 | — | 4,959.5 | ||||||||||||||||||||||
| Dividends to policyholders | Dividends to policyholders | — | — | 296.7 | — | 296.7 | Dividends to policyholders | — | — | 296.7 | — | 296.7 | ||||||||||||||||||||||
| Operating expenses | Operating expenses | 10.5 | 52.1 | 2,103.4 | (0.1 | ) | 2,165.9 | Operating expenses | 10.5 | 52.2 | 2,126.0 | (3.1 | ) | 2,185.6 | ||||||||||||||||||||
| Total expenses | 10.5 | 52.1 | 7,359.6 | (0.1 | ) | 7,422.1 | Total expenses | 10.5 | 52.2 | 7,382.2 | (3.1 | ) | 7,441.8 | |||||||||||||||||||||
| Income (loss) from continuing operations before income taxes | Income (loss) from continuing operations before income taxes | (5.7 | ) | (74.9 | ) | 962.2 | — | 881.6 | Income (loss) from continuing operations before income taxes | (5.7 | ) | (75.0 | ) | 959.8 | — | 879.1 | ||||||||||||||||||
| Income taxes (benefits) | Income taxes (benefits) | (2.2 | ) | (32.6 | ) | 213.9 | — | 179.1 | Income taxes (benefits) | (2.2 | ) | (32.6 | ) | 213.0 | — | 178.2 | ||||||||||||||||||
| Equity in the net income of subsidiaries, excluding discontinued operations and cumulative effect of accounting change | Equity in the net income of subsidiaries, excluding discontinued operations and cumulative effect of accounting change | 706.0 | 748.3 | — | (1,454.3 | ) | — | Equity in the net income of subsidiaries, excluding discontinued operations and cumulative effect of accounting change | 704.4 | 746.8 | — | (1,451.2 | ) | — | ||||||||||||||||||||
| Income from continuing operations, net of related income taxes | Income from continuing operations, net of related income taxes | 702.5 | 706.0 | 748.3 | (1,454.3 | ) | 702.5 | Income from continuing operations, net of related income taxes | 700.9 | 704.4 | 746.8 | (1,451.2 | ) | 700.9 | ||||||||||||||||||||
| Income from discontinued operations, net of related income taxes | Income from discontinued operations, net of related income taxes | 128.8 | 128.8 | 113.0 | (241.8 | ) | 128.8 | Income from discontinued operations, net of related income taxes | 130.4 | 130.4 | 114.6 | (245.0 | ) | 130.4 | ||||||||||||||||||||
| Income before cumulative effect of accounting change | Income before cumulative effect of accounting change | 831.3 | 834.8 | 861.3 | (1,696.1 | ) | 831.3 | Income before cumulative effect of accounting change | 831.3 | 834.8 | 861.4 | (1,696.2 | ) | 831.3 | ||||||||||||||||||||
| Cumulative effect of accounting change, net of related income taxes | Cumulative effect of accounting change, net of related income taxes | (5.7 | ) | (5.7 | ) | (5.7 | ) | 11.4 | (5.7 | ) | Cumulative effect of accounting change, net of related income taxes | (5.7 | ) | (5.7 | ) | (5.7 | ) | 11.4 | (5.7 | ) | ||||||||||||||
| Net income | Net income | $ | 825.6 | $ | 829.1 | $ | 855.6 | $ | (1,684.7 | ) | $ | 825.6 | Net income | $ | 825.6 | $ | 829.1 | $ | 855.7 | $ | (1,684.8 | ) | $ | 825.6 | ||||||||||
Principal Financial Group, Inc.
Notes to Consolidated Financial Statements — (continued)
23. Condensed Consolidating Financial Information — (continued)
Condensed Consolidating Statements of OperationsCash Flows
For the year ended December 31, 20032006
| | Principal Financial Group, Inc. Parent Only | Principal Financial Services, Inc. Only | Principal Life Insurance Company and Other Subsidiaries Combined | Eliminations | Principal Financial Group, Inc. Consolidated | ||||||||||||
|---|---|---|---|---|---|---|---|---|---|---|---|---|---|---|---|---|---|
| | (in millions) | ||||||||||||||||
| Revenues | |||||||||||||||||
| Premiums and other considerations | $ | — | $ | — | $ | 3,630.7 | $ | — | $ | 3,630.7 | |||||||
| Fees and other revenues | — | — | 1,186.8 | (1.0 | ) | 1,185.8 | |||||||||||
| Net investment income | 3.5 | 21.9 | 3,207.2 | 0.8 | 3,233.4 | ||||||||||||
| Net realized/unrealized capital gains (losses) | — | 22.6 | (85.8 | ) | — | (63.2 | ) | ||||||||||
| Total revenues | 3.5 | 44.5 | 7,938.9 | (0.2 | ) | 7,986.7 | |||||||||||
| Expenses | |||||||||||||||||
| Benefits, claims, and settlement expenses | — | — | 4,855.8 | — | 4,855.8 | ||||||||||||
| Dividends to policyholders | — | — | 307.9 | — | 307.9 | ||||||||||||
| Operating expenses | 10.8 | 65.1 | 1,923.0 | (0.2 | ) | 1,998.7 | |||||||||||
| Total expenses | 10.8 | 65.1 | 7,086.7 | (0.2 | ) | 7,162.4 | |||||||||||
| Income (loss) from continuing operations before income taxes | (7.3 | ) | (20.6 | ) | 852.2 | — | 824.3 | ||||||||||
| Income taxes (benefits) | (2.7 | ) | (23.3 | ) | 203.0 | — | 177.0 | ||||||||||
| Equity in the net income of subsidiaries, excluding discontinued operations and cumulative effect of accounting change | 651.9 | 649.2 | — | (1,301.1 | ) | — | |||||||||||
| Income from continuing operations, net of related income taxes | 647.3 | 651.9 | 649.2 | (1,301.1 | ) | 647.3 | |||||||||||
| Income from discontinued operations, net of related income taxes | 102.4 | 102.4 | 43.3 | (145.7 | ) | 102.4 | |||||||||||
| Income before cumulative effect of accounting change | 749.7 | 754.3 | 692.5 | (1,446.8 | ) | 749.7 | |||||||||||
| Cumulative effect of accounting change, net of related income taxes | (3.4 | ) | (3.4 | ) | (3.4 | ) | 6.8 | (3.4 | ) | ||||||||
| Net income | $ | 746.3 | $ | 750.9 | $ | 689.1 | $ | (1,440.0 | ) | $ | 746.3 | ||||||
| | Principal Financial Group, Inc. Parent Only | Principal Financial Services, Inc. Only | Principal Life Insurance Company and Other Subsidiaries Combined | Eliminations | Principal Financial Group, Inc. Consolidated | ||||||||||||
|---|---|---|---|---|---|---|---|---|---|---|---|---|---|---|---|---|---|
| | (in millions) | ||||||||||||||||
| Operating activities | |||||||||||||||||
| Net cash provided by (used in) operating activities | $ | 7.2 | $ | (377.7 | ) | $ | 2,621.1 | $ | 27.9 | $ | 2,278.5 | ||||||
| Investing activities | |||||||||||||||||
| Available-for-sale securities: | |||||||||||||||||
| Purchases | — | (2.3 | ) | (7,763.1 | ) | — | (7,765.4 | ) | |||||||||
| Sales | — | 3.7 | 1,435.2 | — | 1,438.9 | ||||||||||||
| Maturities | — | — | 3,595.8 | — | 3,595.8 | ||||||||||||
| Mortgage loans acquired or originated | — | — | (2,600.2 | ) | — | (2,600.2 | ) | ||||||||||
| Mortgage loans sold or repaid | — | — | 2,102.6 | — | 2,102.6 | ||||||||||||
| Real estate acquired | — | — | (29.1 | ) | — | (29.1 | ) | ||||||||||
| Real estate sold | — | — | 174.1 | — | 174.1 | ||||||||||||
| Net purchases of property and equipment | — | — | (50.5 | ) | — | (50.5 | ) | ||||||||||
| Purchases of interest in subsidiaries, net of cash acquired | — | — | (769.2 | ) | — | (769.2 | ) | ||||||||||
| Dividends received from unconsolidated entities | 331.1 | 456.1 | — | (787.2 | ) | — | |||||||||||
| Net change in other investments | — | 29.2 | (18.2 | ) | (20.9 | ) | (9.9 | ) | |||||||||
| Net cash provided by (used in) investing activities | $ | 331.1 | $ | 486.7 | $ | (3,922.6 | ) | $ | (808.1 | ) | $ | (3,912.9 | ) | ||||
Principal Financial Group, Inc.
Notes to Consolidated Financial Statements — (continued)
23. Condensed Consolidating Financial Information — (continued)
Condensed Consolidating Statements of OperationsCash Flows (continued)
For the year ended December 31, 20022006
| | Principal Financial Group, Inc. Parent Only | Principal Financial Services, Inc. Only | Principal Life Insurance Company and Other Subsidiaries Combined | Eliminations | Principal Financial Group, Inc. Consolidated | ||||||||||||
|---|---|---|---|---|---|---|---|---|---|---|---|---|---|---|---|---|---|
| | (in millions) | ||||||||||||||||
| Revenues | |||||||||||||||||
| Premiums and other considerations | $ | — | $ | — | $ | 3,877.8 | $ | — | $ | 3,877.8 | |||||||
| Fees and other revenues | — | — | 951.3 | (0.9 | ) | 950.4 | |||||||||||
| Net investment income | 4.0 | 16.3 | 3,151.9 | 0.9 | 3,173.1 | ||||||||||||
| Net realized/unrealized capital gains (losses) | — | 10.0 | (384.1 | ) | — | (374.1 | ) | ||||||||||
| Total revenues | 4.0 | 26.3 | 7,596.9 | — | 7,627.2 | ||||||||||||
| Expenses | |||||||||||||||||
| Benefits, claims, and settlement expenses | — | — | 5,197.5 | — | 5,197.5 | ||||||||||||
| Dividends to policyholders | — | — | 316.6 | — | 316.6 | ||||||||||||
| Operating expenses | 7.1 | 62.4 | 1,672.1 | — | 1,741.6 | ||||||||||||
| Total expenses | 7.1 | 62.4 | 7,186.2 | — | 7,255.7 | ||||||||||||
| Income (loss) from continuing operations before income taxes | (3.1 | ) | (36.1 | ) | 410.7 | — | 371.5 | ||||||||||
| Income tax benefits | (1.3 | ) | (17.6 | ) | (56.0 | ) | — | (74.9 | ) | ||||||||
| Equity in the net income of subsidiaries, excluding discontinued operations and cumulative effect of accounting change | 448.2 | 466.7 | — | (914.9 | ) | — | |||||||||||
| Income from continuing operations, net of related income taxes | 446.4 | 448.2 | 466.7 | (914.9 | ) | 446.4 | |||||||||||
| Loss from discontinued operations, net of related income taxes | (23.2 | ) | (23.2 | ) | (182.5 | ) | 205.7 | (23.2 | ) | ||||||||
| Income before cumulative effect of accounting change | 423.2 | 425.0 | 284.2 | (709.2 | ) | 423.2 | |||||||||||
| Cumulative effect of accounting change, net of related income taxes | (280.9 | ) | (280.9 | ) | (280.9 | ) | 561.8 | (280.9 | ) | ||||||||
| Net income | $ | 142.3 | $ | 144.1 | $ | 3.3 | $ | (147.4 | ) | $ | 142.3 | ||||||
| | Principal Financial Group, Inc. Parent Only | Principal Financial Services, Inc. Only | Principal Life Insurance Company and Other Subsidiaries Combined | Eliminations | Principal Financial Group, Inc. Consolidated | ||||||||||||
|---|---|---|---|---|---|---|---|---|---|---|---|---|---|---|---|---|---|
| | (in millions) | ||||||||||||||||
| Financing activities | |||||||||||||||||
| Issuance of common stock | $ | 66.2 | $ | — | $ | — | $ | — | $ | 66.2 | |||||||
| Acquisition of treasury stock, net | (755.8 | ) | — | — | — | (755.8 | ) | ||||||||||
| Proceeds from financing element derivatives | — | — | 132.1 | — | 132.1 | ||||||||||||
| Payments for financing element derivatives | — | — | (141.0 | ) | — | (141.0 | ) | ||||||||||
| Excess tax benefits from share-based payment arrangements | — | — | 8.4 | — | 8.4 | ||||||||||||
| Dividends to common stockholders | (214.7 | ) | — | — | — | (214.7 | ) | ||||||||||
| Dividends to preferred stockholders | (24.7 | ) | — | — | — | (24.7 | ) | ||||||||||
| Issuance of long-term debt | 600.0 | — | 1.7 | — | 601.7 | ||||||||||||
| Principal repayments of long-term debt | — | — | (21.0 | ) | — | (21.0 | ) | ||||||||||
| Net repayments of short-term borrowings | — | (350.0 | ) | (336.9 | ) | 296.4 | (390.5 | ) | |||||||||
| Dividends paid to parent | — | (331.1 | ) | (456.1 | ) | 787.2 | — | ||||||||||
| Investment contract deposits | — | — | 8,925.7 | — | 8,925.7 | ||||||||||||
| Investment contract withdrawals | — | — | (6,859.4 | ) | — | (6,859.4 | ) | ||||||||||
| Net increase in banking operation deposits | — | — | 258.9 | — | 258.9 | ||||||||||||
| Net cash provided by (used in) financing activities | (329.0 | ) | (681.1 | ) | 1,512.4 | 1,083.6 | 1,585.9 | ||||||||||
| Discontinued operations | |||||||||||||||||
| Net cash used in operating activities | — | — | (1.1 | ) | — | (1.1 | ) | ||||||||||
| Net cash used in investing activities | — | — | (0.9 | ) | — | (0.9 | ) | ||||||||||
| Net cash used in financing activities | — | — | — | — | — | ||||||||||||
| Net cash used in discontinued operations | — | — | (2.0 | ) | — | (2.0 | ) | ||||||||||
| Net increase (decrease) in cash and cash equivalents | 9.3 | (572.1 | ) | 208.9 | 303.4 | (50.5 | ) | ||||||||||
| Cash and cash equivalents at beginning of year | 21.6 | 701.3 | 1,822.4 | (904.0 | ) | 1,641.3 | |||||||||||
| Cash and cash equivalents at end of year | $ | 30.9 | $ | 129.2 | $ | 2,031.3 | $ | (600.6 | ) | $ | 1,590.8 | ||||||
| Cash and cash equivalents of discontinued operations included above | |||||||||||||||||
| At beginning of year | $ | — | $ | — | $ | 2.0 | $ | — | $ | 2.0 | |||||||
| At end of year | $ | — | $ | — | $ | — | $ | — | $ | — | |||||||
Principal Financial Group, Inc.
Notes to Consolidated Financial Statements — (continued)
23. Condensed Consolidating Financial Information — (continued)
Condensed Consolidating Statements of Cash Flows
For the year ended December 31, 2005
| | Principal Financial Group, Inc. Parent Only | Principal Financial Services, Inc. Only | Principal Life Insurance Company and Other Subsidiaries Combined | Eliminations | Principal Financial Group, Inc. Consolidated | ||||||||||||
|---|---|---|---|---|---|---|---|---|---|---|---|---|---|---|---|---|---|
| | (in millions) | ||||||||||||||||
| Operating activities | |||||||||||||||||
| Net cash provided by (used in) operating activities | $ | (4.5 | ) | $ | 51.4 | $ | 2,189.0 | $ | (109.7 | ) | $ | 2,126.2 | |||||
| Investing activities | |||||||||||||||||
| Available-for-sale securities: | |||||||||||||||||
| Purchases | — | (11.2 | ) | (8,943.9 | ) | — | (8,955.1 | ) | |||||||||
| Sales | — | 8.6 | 3,291.9 | — | 3,300.5 | ||||||||||||
| Maturities | — | — | 3,903.2 | — | 3,903.2 | ||||||||||||
| Mortgage loans acquired or originated | — | — | (2,485.5 | ) | — | (2,485.5 | ) | ||||||||||
| Mortgage loans sold or repaid | — | — | 2,704.5 | — | 2,704.5 | ||||||||||||
| Real estate acquired | — | — | (92.2 | ) | — | (92.2 | ) | ||||||||||
| Real estate sold | — | — | 319.8 | — | 319.8 | ||||||||||||
| Net purchases of property and equipment | — | — | (44.4 | ) | — | (44.4 | ) | ||||||||||
| Purchases of interest in subsidiaries, net of cash acquired | — | — | (58.1 | ) | — | (58.1 | ) | ||||||||||
| Dividends received from (contributions to) unconsolidated entities | 501.1 | 318.4 | (93.0 | ) | (726.5 | ) | — | ||||||||||
| Net change in other investments | — | 8.3 | (87.0 | ) | 2.3 | (76.4 | ) | ||||||||||
| Net cash provided by (used in) investing activities | $ | 501.1 | $ | 324.1 | $ | (1,584.7 | ) | $ | (724.2 | ) | $ | (1,483.7 | ) | ||||
Principal Financial Group, Inc.
Notes to Consolidated Financial Statements — (continued)
23. Condensed Consolidating Financial Information — (continued)
Condensed Consolidating Statements of Cash Flows (continued)
For the year ended December 31, 2005
| | Principal Financial Group, Inc. Parent Only | Principal Financial Services, Inc. Only | Principal Life Insurance Company and Other Subsidiaries Combined | Eliminations | Principal Financial Group, Inc. Consolidated | |||||||||||
|---|---|---|---|---|---|---|---|---|---|---|---|---|---|---|---|---|
| | (in millions) | |||||||||||||||
| Financing activities | ||||||||||||||||
| Issuance of common stock | $ | 59.9 | $ | — | $ | — | $ | — | $ | 59.9 | ||||||
| Issuance of preferred stock | 542.0 | — | — | — | 542.0 | |||||||||||
| Accelerated stock repurchase settlement | (84.0 | ) | — | — | — | (84.0 | ) | |||||||||
| Acquisition of treasury stock, net | (868.4 | ) | — | — | — | (868.4 | ) | |||||||||
| Proceeds from financing element derivatives | — | — | 168.4 | — | 168.4 | |||||||||||
| Payments for financing element derivatives | — | — | (123.2 | ) | — | (123.2 | ) | |||||||||
| Dividends to common stockholders | (182.2 | ) | — | — | — | (182.2 | ) | |||||||||
| Dividends to preferred stockholders | (17.7 | ) | — | — | — | (17.7 | ) | |||||||||
| Issuance of long-term debt | — | — | 137.7 | (0.2 | ) | 137.5 | ||||||||||
| Principal repayments of long-term debt | — | — | (72.6 | ) | — | (72.6 | ) | |||||||||
| Net proceeds of short-term borrowings | — | 275.0 | 24.7 | (100.6 | ) | 199.1 | ||||||||||
| Dividends paid to parent | — | (501.1 | ) | (225.4 | ) | 726.5 | — | |||||||||
| Investment contract deposits | — | — | 7,250.0 | — | 7,250.0 | |||||||||||
| Investment contract withdrawals | — | — | (6,504.5 | ) | — | (6,504.5 | ) | |||||||||
| Net increase in banking operation deposits | — | — | 41.9 | — | 41.9 | |||||||||||
| Net cash provided by (used in) financing activities | (550.4 | ) | (226.1 | ) | 697.0 | 625.7 | 546.2 | |||||||||
| Discontinued operations | ||||||||||||||||
| Net cash provided by operating activities | — | — | 125.1 | — | 125.1 | |||||||||||
| Net cash used in investing activities | — | — | (125.0 | ) | — | (125.0 | ) | |||||||||
| Net cash used in financing activities | — | — | — | — | — | |||||||||||
| Net cash provided by discontinued operations | — | — | 0.1 | — | 0.1 | |||||||||||
| Net increase (decrease) in cash and cash equivalents | (53.8 | ) | 149.4 | 1,301.4 | (208.2 | ) | 1,188.8 | |||||||||
| Cash and cash equivalents at beginning of year | 75.4 | 551.9 | 521.0 | (695.8 | ) | 452.5 | ||||||||||
| Cash and cash equivalents at end of year | $ | 21.6 | $ | 701.3 | $ | 1,822.4 | $ | (904.0 | ) | $ | 1,641.3 | |||||
| Cash and cash equivalents of discontinued operations included above | ||||||||||||||||
| At beginning of year | $ | — | $ | — | $ | 1.9 | $ | — | $ | 1.9 | ||||||
| At end of year | $ | — | $ | — | 2.0 | $ | — | $ | 2.0 | |||||||
| Schedule of noncash transactions | ||||||||||||||||
| Tax benefits related to demutualization | $ | — | $ | — | $ | 163.8 | $ | — | $ | 163.8 | ||||||
Principal Financial Group, Inc.
Notes to Consolidated Financial Statements — (continued)
23. Condensed Consolidating Financial Information — (continued)
Condensed Consolidating Statements of Cash Flows
For the year ended December 31, 2004
| | | Principal Financial Group, Inc. Parent Only | Principal Financial Services, Inc. Only | Principal Life Insurance Company and Other Subsidiaries Combined | Eliminations | Principal Financial Group, Inc. Consolidated | | Principal Financial Group, Inc. Parent Only | Principal Financial Services, Inc. Only | Principal Life Insurance Company and Other Subsidiaries Combined | Eliminations | Principal Financial Group, Inc. Consolidated | ||||||||||||||||||||||
|---|---|---|---|---|---|---|---|---|---|---|---|---|---|---|---|---|---|---|---|---|---|---|---|---|---|---|---|---|---|---|---|---|---|---|
| | | (in millions) | | (in millions) | ||||||||||||||||||||||||||||||
| Operating activities | Operating activities | Operating activities | ||||||||||||||||||||||||||||||||
| Net cash provided by (used in) operating activities | Net cash provided by (used in) operating activities | $ | (1.1 | ) | $ | (162.9 | ) | $ | 2,209.2 | $ | 210.7 | $ | 2,255.9 | Net cash provided by (used in) operating activities | $ | (1.1 | ) | $ | (195.3 | ) | $ | 1,706.8 | $ | 521.1 | $ | 2,031.5 | ||||||||
Investing activities | Investing activities | Investing activities | ||||||||||||||||||||||||||||||||
| Available-for-sale securities: | Available-for-sale securities: | Available-for-sale securities: | ||||||||||||||||||||||||||||||||
| Purchases | — | (222.0 | ) | (13,391.2 | ) | — | (13,613.2 | ) | Purchases | — | (222.0 | ) | (10,079.6 | ) | — | (10,301.6 | ) | |||||||||||||||||
| Sales | — | 172.9 | 2,154.2 | — | 2,327.1 | Sales | — | 172.9 | 2,154.2 | — | 2,327.1 | |||||||||||||||||||||||
| Maturities | — | — | 7,722.6 | — | 7,722.6 | Maturities | — | — | 4,411.0 | — | 4,411.0 | |||||||||||||||||||||||
| Net cash flows from trading securities | — | — | 6.3 | — | 6.3 | |||||||||||||||||||||||||||||
| Mortgage loans acquired or originated | Mortgage loans acquired or originated | — | — | (2,115.1 | ) | — | (2,115.1 | ) | Mortgage loans acquired or originated | — | — | (2,760.4 | ) | — | (2,760.4 | ) | ||||||||||||||||||
| Mortgage loans sold or repaid | Mortgage loans sold or repaid | — | — | 1,854.3 | — | 1,854.3 | Mortgage loans sold or repaid | — | — | 2,499.6 | — | 2,499.6 | ||||||||||||||||||||||
| Real estate acquired | Real estate acquired | — | — | (341.9 | ) | — | (341.9 | ) | Real estate acquired | — | — | (341.5 | ) | — | (341.5 | ) | ||||||||||||||||||
| Real estate sold | Real estate sold | — | — | 345.6 | — | 345.6 | Real estate sold | — | — | 345.6 | — | 345.6 | ||||||||||||||||||||||
| Net purchases of property and equipment | Net purchases of property and equipment | — | — | (47.5 | ) | — | (47.5 | ) | Net purchases of property and equipment | — | — | (47.5 | ) | — | (47.5 | ) | ||||||||||||||||||
| Net proceeds from sales of subsidiaries | Net proceeds from sales of subsidiaries | — | 10.5 | 684.2 | — | 694.7 | Net proceeds from sales of subsidiaries | — | 10.5 | 684.2 | — | 694.7 | ||||||||||||||||||||||
| Purchases of interest in subsidiaries, net of cash acquired | Purchases of interest in subsidiaries, net of cash acquired | — | (25.7 | ) | (102.4 | ) | — | (128.1 | ) | Purchases of interest in subsidiaries, net of cash acquired | — | (25.7 | ) | (102.4 | ) | — | (128.1 | ) | ||||||||||||||||
Dividends received from unconsolidated entities | Dividends received from unconsolidated entities | 800.6 | 1,099.8 | 5.8 | (1,906.2 | ) | — | Dividends received from unconsolidated entities | 800.6 | 1,147.0 | 5.8 | (1,953.4 | ) | — | ||||||||||||||||||||
| Net change in other investments | Net change in other investments | — | 132.2 | (3.4 | ) | (12.3 | ) | 116.5 | Net change in other investments | — | 117.4 | (3.4 | ) | 2.5 | 116.5 | |||||||||||||||||||
| Net cash provided by (used in) investing activities | Net cash provided by (used in) investing activities | 800.6 | 1,167.7 | (3,228.5 | ) | (1,918.5 | ) | (3,178.7 | ) | Net cash provided by (used in) investing activities | 800.6 | 1,200.1 | (3,234.4 | ) | (1,950.9 | ) | (3,184.6 | ) | ||||||||||||||||
Financing activities | Financing activities | Financing activities | ||||||||||||||||||||||||||||||||
| Issuance of common stock | Issuance of common stock | 41.2 | — | — | — | 41.2 | Issuance of common stock | 41.2 | — | — | — | 41.2 | ||||||||||||||||||||||
| Acquisition of treasury stock, | (772.6 | ) | — | — | — | (772.6 | ) | |||||||||||||||||||||||||||
| Acquisition and sales of treasury stock, net | Acquisition and sales of treasury stock, net | (772.6 | ) | — | — | — | (772.6 | ) | ||||||||||||||||||||||||||
| Proceeds from financing element derivatives | Proceeds from financing element derivatives | — | — | 110.6 | — | 110.6 | Proceeds from financing element derivatives | — | — | 110.6 | — | 110.6 | ||||||||||||||||||||||
| Payments for financing element derivatives | Payments for financing element derivatives | — | — | (84.6 | ) | — | (84.6 | ) | Payments for financing element derivatives | — | — | (84.6 | ) | — | (84.6 | ) | ||||||||||||||||||
| Dividends to stockholders | (166.5 | ) | — | — | — | (166.5 | ) | |||||||||||||||||||||||||||
| Dividends to common stockholders | Dividends to common stockholders | (166.5 | ) | — | — | — | (166.5 | ) | ||||||||||||||||||||||||||
| Issuance of long-term debt | Issuance of long-term debt | — | — | 12.1 | — | 12.1 | Issuance of long-term debt | — | — | 12.1 | — | 12.1 | ||||||||||||||||||||||
| Principal repayments of long-term debt | Principal repayments of long-term debt | — | (200.0 | ) | (247.2 | ) | — | (447.2 | ) | Principal repayments of long-term debt | — | (200.0 | ) | (247.2 | ) | — | (447.2 | ) | ||||||||||||||||
| Net proceeds (repayments) of short-term borrowings | Net proceeds (repayments) of short-term borrowings | — | (325.0 | ) | 22.9 | 10.7 | (291.4 | ) | Net proceeds (repayments) of short-term borrowings | — | (325.0 | ) | 368.8 | (335.2 | ) | (291.4 | ) | |||||||||||||||||
| Dividends paid to parent | Dividends paid to parent | — | (800.6 | ) | (1,152.8 | ) | 1,953.4 | — | Dividends paid to parent | — | (800.6 | ) | (1,152.8 | ) | 1,953.4 | — | ||||||||||||||||||
| Investment contract deposits | Investment contract deposits | — | — | 6,995.8 | — | 6,995.8 | Investment contract deposits | — | — | 7,312.4 | — | 7,312.4 | ||||||||||||||||||||||
| Investment contract withdrawals | Investment contract withdrawals | — | — | (5,209.6 | ) | — | (5,209.6 | ) | Investment contract withdrawals | — | — | (5,294.9 | ) | — | (5,294.9 | ) | ||||||||||||||||||
| Net increase in bank deposits | — | — | (5.0 | ) | — | (5.0 | ) | |||||||||||||||||||||||||||
| Net decrease in banking operation deposits | Net decrease in banking operation deposits | — | — | (5.0 | ) | — | (5.0 | ) | ||||||||||||||||||||||||||
| Net cash provided by (used in) financing activities | Net cash provided by (used in) financing activities | (897.9 | ) | (1,325.6 | ) | 442.2 | 1,964.1 | 182.8 | Net cash provided by (used in) financing activities | $ | (897.9 | ) | $ | (1,325.6 | ) | $ | 1,019.4 | $ | 1,618.2 | $ | 414.1 | |||||||||||||
| Net decrease in cash and cash equivalents | (98.4 | ) | (320.8 | ) | (577.1 | ) | 256.3 | (740.0 | ) | |||||||||||||||||||||||||
| Cash and cash equivalents at beginning of year | 173.8 | 872.7 | 369.7 | (223.7 | ) | 1,192.5 | ||||||||||||||||||||||||||||
| Cash and cash equivalents at end of year | $ | 75.4 | $ | 551.9 | $ | (207.4 | ) | $ | 32.6 | $ | 452.5 | |||||||||||||||||||||||
Principal Financial Group, Inc.
Notes to Consolidated Financial Statements — (continued)
23. Condensed Consolidating Financial Information — (continued)
Condensed Consolidating Statements of Cash Flows (continued)
For the year ended December 31, 20032004
| | Principal Financial Group, Inc. Parent Only | Principal Financial Services, Inc. Only | Principal Life Insurance Company and Other Subsidiaries Combined | Eliminations | Principal Financial Group, Inc. Consolidated | ||||||||||||
|---|---|---|---|---|---|---|---|---|---|---|---|---|---|---|---|---|---|
| | (in millions) | ||||||||||||||||
| Operating activities | |||||||||||||||||
| Net cash provided by (used in) operating activities | $ | (3.3 | ) | $ | (132.4 | ) | $ | 2,901.5 | $ | 298.0 | $ | 3,063.8 | |||||
Investing activities | |||||||||||||||||
| Available-for-sale securities: | |||||||||||||||||
| Purchases | — | 525.6 | (11,104.1 | ) | (339.6 | ) | (10,918.1 | ) | |||||||||
| Sales | — | (139.8 | ) | 2,753.0 | 339.6 | 2,952.8 | |||||||||||
| Maturities | — | — | 5,222.3 | — | 5,222.3 | ||||||||||||
| Mortgage loans acquired or originated | — | — | (2,031.9 | ) | — | (2,031.9 | ) | ||||||||||
| Mortgage loans sold or repaid | — | — | 1,316.8 | — | 1,316.8 | ||||||||||||
| Real estate acquired | — | — | (250.8 | ) | — | (250.8 | ) | ||||||||||
| Real estate sold | — | — | 61.9 | — | 61.9 | ||||||||||||
| Net purchases of property and equipment | — | — | (28.6 | ) | — | (28.6 | ) | ||||||||||
| Net proceeds from sales of subsidiaries | — | — | 40.9 | — | 40.9 | ||||||||||||
| Purchases of interest in subsidiaries, net of cash acquired | — | (8.2 | ) | (128.0 | ) | — | (136.2 | ) | |||||||||
| Dividends received from (contributions to) unconsolidated entities | 425.0 | (57.1 | ) | 142.5 | (510.4 | ) | — | ||||||||||
| Net change in other investments | — | (110.6 | ) | 220.3 | 102.1 | 211.8 | |||||||||||
| Net cash provided by (used in) investing activities | 425.0 | 209.9 | (3,785.7 | ) | (408.3 | ) | (3,559.1 | ) | |||||||||
Financing activities | |||||||||||||||||
| Issuance of common stock | 18.3 | — | — | — | 18.3 | ||||||||||||
| Acquisition and sales of treasury stock, net | (453.0 | ) | — | — | — | (453.0 | ) | ||||||||||
| Proceeds from financing element derivatives | — | — | 118.0 | — | 118.0 | ||||||||||||
| Payments for financing element derivatives | — | — | (107.3 | ) | — | (107.3 | ) | ||||||||||
| Dividends to stockholders | (145.3 | ) | — | — | — | (145.3 | ) | ||||||||||
| Issuance of long-term debt | — | 0.2 | 34.7 | (0.2 | ) | 34.7 | |||||||||||
| Principal repayments of long-term debt | — | — | (85.5 | ) | 0.2 | (85.3 | ) | ||||||||||
| Net proceeds (repayments) of short-term borrowings | — | 242.3 | (80.4 | ) | (10.6 | ) | 151.3 | ||||||||||
| Dividends paid to parent | — | (425.0 | ) | (44.8 | ) | 469.8 | — | ||||||||||
| Investment contract deposits | — | — | 9,722.0 | — | 9,722.0 | ||||||||||||
| Investment contract withdrawals | — | — | (8,666.2 | ) | — | (8,666.2 | ) | ||||||||||
| Net increase in bank deposits | — | — | 372.7 | — | 372.7 | ||||||||||||
| Net cash provided by (used in) financing activities | (580.0 | ) | (182.5 | ) | 1,263.2 | 459.2 | 959.9 | ||||||||||
| Net increase (decrease) in cash and cash equivalents | (158.3 | ) | (105.0 | ) | 379.0 | 348.9 | 464.6 | ||||||||||
| Cash and cash equivalents at beginning of year | 332.1 | 977.7 | (9.3 | ) | (572.6 | ) | 727.9 | ||||||||||
| Cash and cash equivalents at end of year | $ | 173.8 | $ | 872.7 | $ | 369.7 | $ | (223.7 | ) | $ | 1,192.5 | ||||||
Condensed Consolidating Statements of Cash FlowsFor the year ended December 31, 2002
| | Principal Financial Group, Inc. Parent Only | Principal Financial Services, Inc. Only | Principal Life Insurance Company and Other Subsidiaries Combined | Eliminations | Principal Financial Group, Inc. Consolidated | ||||||||||||
|---|---|---|---|---|---|---|---|---|---|---|---|---|---|---|---|---|---|
| | (in millions) | ||||||||||||||||
| Operating activities | |||||||||||||||||
| Net cash provided by operating activities | $ | 7.2 | $ | 465.0 | $ | 3,733.4 | $ | (307.0 | ) | $ | 3,898.6 | ||||||
Investing activities | |||||||||||||||||
| Available-for-sale securities: | |||||||||||||||||
| Purchases | — | (352.4 | ) | (16,224.9 | ) | — | (16,577.3 | ) | |||||||||
| Sales | — | 7.1 | 8,354.7 | — | 8,361.8 | ||||||||||||
| Maturities | — | — | 4,458.4 | — | 4,458.4 | ||||||||||||
| Net cash flows from trading securities | — | — | (82.4 | ) | — | (82.4 | ) | ||||||||||
| Mortgage loans acquired or originated | — | — | (1,376.8 | ) | — | (1,376.8 | ) | ||||||||||
| Mortgage loans sold or repaid | — | — | 1,338.2 | — | 1,338.2 | ||||||||||||
| Real estate acquired | — | — | (248.3 | ) | — | (248.3 | ) | ||||||||||
| Real estate sold | — | — | 182.0 | — | 182.0 | ||||||||||||
| Net purchases of property and equipment | — | — | (59.0 | ) | — | (59.0 | ) | ||||||||||
| Net proceeds from sales of subsidiaries | — | — | 500.8 | — | 500.8 | ||||||||||||
| Purchases of interest in subsidiaries, net of cash acquired | — | — | (54.5 | ) | — | (54.5 | ) | ||||||||||
| Dividends received from (contributions to) unconsolidated entities | 1,100.0 | (480.4 | ) | 130.0 | (749.6 | ) | — | ||||||||||
| Net change in other investments | — | 1,402.0 | (135.4 | ) | (714.5 | ) | 552.1 | ||||||||||
| Net cash provided by (used in) investing activities | 1,100.0 | 576.3 | (3,217.2 | ) | (1,464.1 | ) | (3,005.0 | ) | |||||||||
Financing activities | |||||||||||||||||
| Issuance of common stock | 22.0 | — | — | — | 22.0 | ||||||||||||
| Acquisition and sales of treasury stock, net | (750.4 | ) | — | 8.0 | — | (742.4 | ) | ||||||||||
| Dividends to stockholders | (83.8 | ) | — | — | — | (83.8 | ) | ||||||||||
| Issuance of long-term debt | — | 0.2 | 64.1 | (0.2 | ) | 64.1 | |||||||||||
| Principal repayments of long-term debt | — | — | (110.2 | ) | 0.2 | (110.0 | ) | ||||||||||
| Net proceeds (repayment) of short-term borrowings | — | (42.3 | ) | 95.5 | — | 53.2 | |||||||||||
| Dividends paid to parent | — | (1,100.0 | ) | (590.2 | ) | 1,690.2 | — | ||||||||||
| Investment contract deposits | — | — | 7,117.0 | — | 7,117.0 | ||||||||||||
| Investment contract withdrawals | — | — | (7,225.7 | ) | — | (7,225.7 | ) | ||||||||||
| Net increase in bank deposits | — | — | 184.4 | — | 184.4 | ||||||||||||
| Net cash used in financing activities | (812.2 | ) | (1,142.1 | ) | (457.1 | ) | 1,690.2 | (721.2 | ) | ||||||||
| Net increase (decrease) in cash and cash equivalents | 295.0 | (100.8 | ) | 59.1 | (80.9 | ) | 172.4 | ||||||||||
| Cash and cash equivalents at beginning of year | 37.1 | 1,078.5 | (68.4 | ) | (491.7 | ) | 555.5 | ||||||||||
| Cash and cash equivalents at end of year | $ | 332.1 | $ | 977.7 | $ | (9.3 | ) | $ | (572.6 | ) | $ | 727.9 | |||||
| | Principal Financial Group, Inc. Parent Only | Principal Financial Services, Inc. Only | Principal Life Insurance Company and Other Subsidiaries Combined | Eliminations | Principal Financial Group, Inc. Consolidated | ||||||||||||
|---|---|---|---|---|---|---|---|---|---|---|---|---|---|---|---|---|---|
| | (in millions) | ||||||||||||||||
| Discontinued operations | |||||||||||||||||
| Net cash used in operating activities | $ | — | $ | — | $ | (627.7 | ) | $ | — | $ | (627.7 | ) | |||||
| Net cash used in investing activities | — | — | (473.7 | ) | — | (473.7 | ) | ||||||||||
| Net cash provided by financing activities | — | — | 600.0 | — | 600.0 | ||||||||||||
| Net cash used in discontinued operations | — | — | (501.4 | ) | — | (501.4 | ) | ||||||||||
| Net decrease in cash and cash equivalents | (98.4 | ) | (320.8 | ) | (1,009.6 | ) | 188.4 | (1,240.4 | ) | ||||||||
| Cash and cash equivalents at beginning of year | 173.8 | 872.7 | 1,530.6 | (884.2 | ) | 1,692.9 | |||||||||||
| Cash and cash equivalents at end of year | $ | 75.4 | $ | 551.9 | $ | 521.0 | $ | (695.8 | ) | $ | 452.5 | ||||||
| Cash and cash equivalents of discontinued operations included above: | |||||||||||||||||
| At beginning of year | $ | — | $ | — | $ | 503.3 | $ | — | $ | 503.3 | |||||||
| At end of year | $ | — | $ | — | $ | 1.9 | $ | — | $ | 1.9 | |||||||
Item 9. Changes in and Disagreements with Accountants on Accounting and Financial Disclosure
None.
Item 9A. Controls and Procedures
Management's Report on Internal Control Over Financial Reporting
Management of Principal Financial Group, Inc. is responsible for establishing and maintaining adequate internal control over financial reporting for the Company. A company's internal control over financial reporting is a process designed to provide reasonable assurance regarding the reliability of financial reporting and the preparation of financial statements for external purposes in accordance with U.S. generally accepted accounting principles. A company's internal control over financial reporting includes those policies and procedures that (1) pertain to the maintenance of records that, in reasonable detail, accurately and fairly reflect the transactions and dispositions of the assets of the company; (2) provide reasonable assurance that transactions are recorded as necessary to permit preparation of financial statements in accordance with U.S. generally accepted accounting principles, and that receipts and expenditures of the company are being made only in accordance with authorizations of management and directors of the company; and (3) provide reasonable assurance regarding prevention or timely detection of unauthorized acquisition, use, or disposition of the company's assets that could have a material effect on the financial statements.
Because of its inherent limitations, internal control over financial reporting may not prevent or detect misstatements. Also, projections of any evaluation of effectiveness to future periods are subject to the risk that controls may become inadequate because of changes in conditions, or that the degree of compliance with the policies or procedures may deteriorate.
Under the supervision and with the participation of management, including our Chief Executive Officer, J. Barry Griswell, and our Chief Financial Officer, Michael H. Gersie, we conducted an evaluation of the effectiveness of our internal control over financial reporting based on criteria established inInternal Controls — Integrated Framework issued by the Committee of Sponsoring Organizations of the Treadway Commission. Based on our evaluation, management has concluded that Principal Financial Group, Inc.'s internal control over financial reporting was effective as of December 31, 2004.2006.
Ernst & Young LLP, the independent registered public accounting firm that audited our financial statements included in this annual report on Form 10-K, has issued an attestation report on management's assessment of ourregarding internal control over financial reporting. The attestation report is included in Ernst & Young's Report of Independent Registered Public Accounting Firm on Internal Control Over Financial Reporting, included in Item 8. Financial, "Financial Statements and Supplementary Data."
Changes in Internal Control Over Financial Reporting
There was no change in our internal control over financial reporting during our last fiscal quarter that has materially affected, or is reasonably likely to materially affect, our internal control over financial reporting.
Disclosure Controls and Procedures
In order to ensure that the information that we must disclose in our filings with the SEC is recorded, processed, summarized and reported on a timely basis, we have adopted disclosure controls and procedures. Disclosure controls and procedures include, without limitation, controls and procedures designed to ensure that information required to be disclosed by us in the reports that we file with or submit to the SEC is accumulated and communicated to our management, including our Chief Executive Officer and our Chief Financial Officer, as appropriate to allow timely decisions regarding required disclosure.
Our Chief Executive Officer, J. Barry Griswell, and our Chief Financial Officer, Michael H. Gersie, have reviewed and evaluated our disclosure controls and procedures as of December 31, 2004,2006, and have concluded that our disclosure controls and procedures are effective.
None
Item 10. Directors, and Executive Officers of the Registrantand Corporate Governance
The information called for by Item 10 pertaining to directors is set forth in Principal Financial Group, Inc.'s proxy statement relating to the 20052007 annual stockholders meeting (the "Proxy Statement") which will be filed with the SEC on or about March 31, 2005,April 9, 2007, under the captions, "Election of Directors," "Governance of the Company — Audit Committee" and Director Candidates Recommended by Shareholders" and "Security Ownership of Certain Beneficial Owners and Management — Section 16(a) Beneficial Ownership Reporting Compliance." Such information is incorporated herein by reference. The information called for by Item 10 pertaining to executive officers can be found in Part I of this Form 10-K under the caption, "Executive Officers of the Registrant." The Company has adopted a code of ethics that applies to our principal executive officer, principal financial officer and principal accounting officer. The code of ethics has been posted on our Internet website, found atwww.principal.com. We intend to satisfy disclosure requirements regarding amendments to, or waivers from, any provision of our code of ethics on our website.
Item 11. Executive Compensation
The information called for by Item 11 pertaining to executive compensation is set forth in the Proxy Statement under the caption,captions, "Executive Compensation," "Compensation Committee Interlocks and Insider Participation," and "Report of the Human Resources Committee," all of which is incorporated herein by reference.
Item 12. Security Ownership of Certain Beneficial Owners and Management and Related StockStockholder Matters
The information called for by Item 12 pertaining to security ownership of certain beneficial owners and management is set forth in the Proxy Statement under the caption, "Security Ownership of Certain Beneficial Owners and Management," and is incorporated herein by reference.
Equity Compensation Plan Information
In general, the Company currently has fourthree compensation plans under which its equity securities are authorized for issuance to employees or directors:directors (not including the Principal Financial Group, Inc.Company's tax qualified pension plans): the 2005 Stock Incentive Plan, the Principal Financial Group, Inc.Employee Stock Purchase Plan, and the 2005 Directors Stock Plan. As of May 17, 2005, no new grants will be made under the Stock Incentive Plan, the Directors Stock Plan or the Long-Term Performance Plan. The following table shows the number of shares of Common Stock issuable upon exercise of share-based awards outstanding at December 31, 2006, the weighted average exercise price of those awards, and the number of shares of Common Stock remaining available for future issuance at December 31, 2006, excluding shares issuable upon exercise of outstanding share-based awards.
| | (a) | (b) | (c) | |||||
|---|---|---|---|---|---|---|---|---|
| Plan Category | Number of securities to be issued upon exercise of outstanding options, warrants and rights | Weighted-average exercise price of outstanding options, warrants and rights | Number of securities remaining available for future issuance under equity compensation plans (excluding securities reflected in column (a)) | |||||
| Equity compensation plans approved by the Company's stockholders(1) | 10,191,131 | (2) | $ | 37.65 | (3) | 24,983,850 | (4) | |
| Equity compensation plans not approved by the Company's stockholders | -0- | n/a | -0- | |||||
Item 13. Certain Relationships and Related Transactions, and Director Independence
The information called for by Item 13 pertaining to certain relationships and related transactions is set forth in the Proxy Statement under the captions, "Governance of the Company — Human Resources Committee — Compensation Committee Interlocks"Director Independence," and Insider Participation" and "Governance of the Company — Certain"Certain Relationships and Related Transactions," and is incorporated herein by reference.
Item 14. Principal AccountantAccounting Fees and Services
The information called for by Item 14 pertaining to principal accountantaccounting fees and services is set forth in the Proxy Statement under the caption, "Ratification of Appointment of Independent Auditors" and is incorporated herein by reference.
Item 15. Exhibits and Financial Statement Schedules and Reports on Form 8-K
Exhibits filed herewith
| Amendment No. 1 and Waiver, dated as of December 29, 2006, to the | ||
| July 25, 2006, by and among Washington Mutual, Inc., New American Capital, Inc., Principal Financial Group, Inc. | ||
| 12 | Computation of Earnings to Fixed Charges Ratio | |
| 21 | Principal Financial Group, Inc. Member Companies as of December 31, | |
| 23 | Consent of Independent Registered Public Accounting Firm | |
| 31.1 | Certification of J. Barry Griswell | |
| 31.2 | Certification of Michael H. Gersie | |
| 32.1 | Certification Pursuant to Section 1350 of Chapter 63 of Title 18 of the United States Code — J. Barry Griswell | |
| 32.2 | Certification Pursuant to Section 1350 of Chapter 63 of Title 18 of the United States Code — Michael H. Gersie |
Exhibits incorporated by reference
| Exhibit Number | Description | |
|---|---|---|
| 2.1 | Plan of | |
| 2.2 | Share Sale Deed, dated as of June 17, 1999, among BT Investments (Australia) LLC, BT Foreign Investment Corporation, BT New Zealand Limited, BT International (Delaware), Inc., BT Nominees (H.K.) Limited, Deutsche Bank AG, Bankers Trust Corporation, Principal Financial Group (Australia) Pty Limited and Principal Financial Services, Inc. | |
| 2.3 | Deed to Amend the Share Sale Deed, dated as of August 31, 1999, among BT Investments (Australia) LLC, BT Foreign Investment Corporation, BT New Zealand Limited, BT International (Delaware), Inc., BT Nominees (H.K.) Limited, Deutsche Bank AG, Bankers Trust Corporation, Principal Financial Group (Australia) Pty Limited and Principal Financial Services, Inc. | |
| 2.4 | Second Amendment to the Share Sale Deed, dated as of March 14, 2001, among BT Investments (Australia) LLC, BT Foreign Investment Corporation, Deutsche New Zealand Limited (formerly called BT New Zealand Limited), BT International (Delaware), Inc., DB Nominees (H.K.) Limited (formerly called BT Nominees (H.K.) Limited), Deutsche Bank AG, Bankers Trust Corporation, Principal Financial Group (Australia) Pty Limited and Principal Financial Services, Inc. | |
| 2.5 | Stock Purchase Agreement dated as of May 11, 2004 by and between Principal Holding Company and CitiMortgage, Inc. | |
| 2.6 | Stock Purchase Agreement among Washington Mutual, Inc., New American Capital, Inc., Principal Financial Group, Inc., and Principal Management Corporation for the purchase and sale of the outstanding capital stock of WM Advisors, Inc., dated as of July 25, 2006.(3) | |
| 3.1 | Form of Amended and Restated Certificate of Incorporation of Principal Financial Group, Inc. | |
| 3.2 | Form of By-Laws of Principal Financial Group, Inc. (included in Exhibit 2.1) | |
| 4.1 | Form of Certificate for the Common Stock of Principal Financial Group, Inc., par value $0.01 per | |
| 4.1.1 | Certificate of Designations of the Company's Series A Non-Cumulative Perpetual Preferred Stock, dated June 16, 2005.(4) | |
| 4.1.2 | Certificate of Designations of the Company's Series B Non-Cumulative Perpetual Preferred Stock, dated June 16, 2005.(4) | |
| 4.1.3 | Specimen Stock Certificate for the Company's Series A Non-Cumulative Perpetual Preferred Stock.(4) | |
| 4.1.4 | Specimen Stock Certificate for the Company's Series B Non-Cumulative Perpetual Preferred Stock.(4) | |
| 4.1.5 | Senior Indenture, dated as of October 11, 2006, between Principal Financial Group, Inc. and The Bank of New York, as Trustee.(5) | |
| 4.1.6 | First Supplemental Indenture, dated as of October 16, 2006, among Principal Financial Group, Inc., Principal Financial Services, Inc. and The Bank of New York, as Trustee.(5) | |
| 4.1.7 | 6.05% Senior Note ($500,000,000) due October 15, 2036.(5) | |
| 4.1.8 | 6.05% Senior Note ($100,000,000) due October 15, 2036.(6) | |
| 4.1.9 | Guarantee, dated as of October 16, 2006, by Principal Financial Services, Inc.(5) | |
| 4.2 | Amended and Restated Stockholder Rights Agreement, dated as of October 22, | |
| 4.2.1 | Amendment to the Amended and Restated Rights Agreement, dated as of January 17, 2005(8) | |
| 10.1 | Principal Financial Group, Inc. Stock Incentive | |
| 10.1.1 | Form of Restricted Stock Unit Award Agreement(10) | |
| 10.1.2 | Form of Stock Option Award Agreement(10) | |
| 10.1.3 | Principal Financial Group, Inc. 2005 Stock Incentive Plan(11) | |
| 10.2 | Principal Financial Group Long-Term Performance | |
| 10.3 | Resolution of the Human Resources Committee of the Board of Directors of Principal Financial Group, Inc. amending the Principal Financial Group Long-Term Performance Plan as of October 31, | |
| 10.4 | Principal Financial Group Incentive Pay Plan (PrinPay), amended and restated effective January 1, | |
| 10.5 | Principal Financial Group, Inc. Annual Incentive Plan(8) | |
| 10.6 | Summary of Standard Compensatory Arrangement for Non-Employee Members of the Principal Financial Group, Inc. Board of Directors(8) | |
| 10.6.1 | Revised Summary of Standard Compensatory Arrangement for Non-Employee Directors of the Principal Financial Group, Inc. Board of Directors.(13) | |
| 10.7 | Principal Financial Group, Inc. Directors Stock | |
| 10.7.1 | Principal Financial Group, Inc. 2005 Directors Stock Plan(11) | |
| 10.8 | Deferred Compensation Plan for Non-Employee Directors of Principal Financial Group, Inc.(14) | |
| 10.9 | Principal Select Savings Excess Plan, restated as of January 1, | |
| 10.9.1 | Amendment No. 1 to Principal Select Savings Excess Plan.(14) | |
| 10.10 | Supplemental Executive Retirement Plan for Employees, restated as of January 1, | |
| 10.10.1 | Amendment No. 1 to the Principal Supplemental Executive Retirement Plan for Employees.(14) | |
| 10.11 | Employment Agreement, dated as of April 1, 2004, by and between, Principal Financial Group, Inc., Principal Financial Services, Inc., Principal Life Insurance Company and J. Barry | |
| 10.12 | Change-of-Control Supplement and Amendment to Employment Agreement, dated as of April 1, 2004 by and between Principal Financial Group, Inc., Principal Financial Services, Inc., Principal Life Insurance Company and J. Barry | |
| 10.12.1 | Change-of-Control Supplement to Employment Agreement, dated as of February 28, 2006, by and among Principal Financial Group, Inc., Principal Financial Services, Inc., Principal Life Insurance Company and J. Barry Griswell.(16) | |
| 10.13 | Form of Principal Mutual Holding Company and Principal Life Insurance Company Change of Control Employment Agreement (Tier One Executives) among Principal Mutual Holding Company, Principal Financial Group, Inc., Principal Financial Services, Inc., Principal Life Insurance Company and an | |
| 10.13.1 | Form of Principal Financial Group, Inc. and Principal Life Insurance Company Change-of-Control Employment Agreement (Tier One Executives), dated as of February 28, 2006, by and among Principal Financial Group, Inc., Principal Financial Services, Inc., Principal Life Insurance Company and an Executive.(16) | |
| 10.14 | Compensatory Arrangement, dated as of March 14, 2002, between Principal Life Insurance Company and James P. McCaughan. | |
| 10.15 | Fiscal Agency Agreement, dated as of August 25, 1999, among Principal Financial Group (Australia) Holdings Pty Limited, Principal Financial Services, Inc. and U.S. Bank Trust National |
The Current Report on Form 8-K (Item 7.01), dated October 14, 2004, was furnished October 15, 2004.The Current Report on Form 8-K (Item 2.02), dated November 1, 2004, was furnished November 2, 2004.The Current Report on Form 8-K (Item 1.01), dated November 30, 2004, was filed December 3, 2004.
Pursuant to the requirements of Section 13 or 15(d) of the Securities Exchange Act of 1934, the Registrant has duly caused this report to be signed on its behalf by the undersigned, thereunto duly authorized.
| PRINCIPAL FINANCIAL GROUP, INC. | |||
Dated: | /s/ MICHAEL H. GERSIE Michael H. Gersie Executive Vice President and Chief Financial Officer | ||
Pursuant to the requirements of the Securities Exchange Act of 1934, this report has been signed below by the following persons on behalf of the Registrant and in the capacities and on the date indicated.
Dated: March 3, 2005February 27, 2007
| By | J. Barry Griswell Chairman, Officer and Director | By | President, Chief Operating Officer and Director | |||
By | /s/ MICHAEL H. GERSIE Michael H. Gersie Executive Vice President and Chief Financial Officer (Principal Financial Officer and Chief Accounting Officer) | By | Director | |||
By | Betsy J. Bernard Director | By | William T. Kerr Director | |||
By | Jocelyn Carter-Miller Director | By | Richard L. Keyser Director | |||
By | Gary E. Costley Director | By | Arjun K. Mathrani Director | |||
By | Director | By | ||||
Elizabeth E. Tallett Director | ||||||
By | /s/ Director | By | /s/ Therese M. Vaughan Director | |||
By | /s/ C. DANIEL GELATT, JR. C. Daniel Gelatt, Jr. Director |
Report of Independent Registered Public Accounting Firm on Schedules
The Board of Directors and Stockholders
Principal Financial Group, Inc.
We have audited the consolidated financial statements of Principal Financial Group, Inc. (the Company)("the Company") as of December 31, 20042006 and 2003,2005, and for each of the three years in the period ended December 31, 2004,2006, and have issued our report thereon dated February 16, 200520, 2007 (included elsewhere in this Form 10-K). Our audits also included the financial statement schedules listed in the Index at Item 15.a.2. of this Form 10-K. These schedules are the responsibility of the Company's management. Our responsibility is to express an opinion based on our audits.
In our opinion, the financial statement schedules referred to above, when considered in relation to the basic financial statements taken as a whole, present fairly in all material respects the information set forth therein. As discussed in Note 1 to the consolidated financial statements, in response to new accounting standards, the Company changed its methods of accounting for discontinued operations, goodwill and other intangible assets effective January 1, 2002, variable interest entities effective July 1, 2003, and certain fixed and variable contract features effective January 1, 2004.2004, certain non-monetary exchanges of similar productive assets (primarily real estate) effective July 1, 2005, and its pension and other post-retirement benefits effective December 31, 2006.
/s/ Ernst & Young LLP
Des Moines, Iowa
February 16, 200520, 2007
Schedule I — Summary of Investments — Other Than Investments in Related Parties
As of December 31, 2004
2006
| Type of Investment | Type of Investment | Cost | Value | Amount as shown in the Statement of Financial Position | Type of Investment | Cost | Value | Amount as shown in the Statement of Financial Position | ||||||||||||||
|---|---|---|---|---|---|---|---|---|---|---|---|---|---|---|---|---|---|---|---|---|---|---|
| | | (in millions) | | (in millions) | ||||||||||||||||||
| Fixed maturities, available-for-sale: | Fixed maturities, available-for-sale: | Fixed maturities, available-for-sale: | ||||||||||||||||||||
| U.S. Treasury securities and obligations of U.S. government corporations and agencies | $ | 271.7 | $ | 277.4 | $ | 277.4 | U.S. Treasury securities and obligations of U.S. government corporations and agencies | $ | 530.8 | $ | 527.8 | $ | 527.8 | |||||||||
| States, municipalities and political subdivisions | 894.1 | 947.0 | 947.0 | States, municipalities and political subdivisions | 1,557.7 | 1,598.2 | 1,598.2 | |||||||||||||||
| Foreign governments | 777.2 | 868.5 | 868.5 | Foreign governments | 766.0 | 900.6 | 900.6 | |||||||||||||||
| Public utilities | 3,605.4 | 3,879.5 | 3,879.5 | Public utilities | 3,212.6 | 4,330.5 | 4,330.5 | |||||||||||||||
| Redeemable preferred | 375.6 | 384.1 | 384.1 | Redeemable preferred | 268.9 | 272.9 | 272.9 | |||||||||||||||
| All other corporate bonds | 25,206.6 | 26,913.2 | 26,913.2 | All other corporate bonds | 27,548.5 | 27,431.0 | 27,431.0 | |||||||||||||||
| Mortgage-backed and other asset-backed securities | Mortgage-backed and other asset-backed securities | 7,288.7 | 7,646.6 | 7,646.6 | Mortgage-backed and other asset-backed securities | 9,199.1 | 9,342.5 | 9,342.5 | ||||||||||||||
| Total fixed maturities, available-for-sale | 38,419.3 | 40,916.3 | 40,916.3 | Total fixed maturities, available-for-sale | 43,083.6 | 44,403.5 | 44,403.5 | |||||||||||||||
| Fixed maturities, trading | Fixed maturities, trading | 86.0 | 93.0 | 93.0 | Fixed maturities, trading | 323.4 | 323.4 | 323.4 | ||||||||||||||
| Equity securities, available-for-sale: | Equity securities, available-for-sale: | Equity securities, available-for-sale: | ||||||||||||||||||||
| Common stocks: | ||||||||||||||||||||||
| Banks, trust and insurance companies | 39.8 | 25.6 | 25.6 | Common stocks: | ||||||||||||||||||
| Industrial, miscellaneous and all other | 60.9 | 67.6 | 67.6 | Banks, trust and insurance companies | 20.2 | 21.1 | 21.1 | |||||||||||||||
| Public utilities | 1.2 | 11.4 | 11.4 | Public utilities | 0.4 | 0.2 | 0.2 | |||||||||||||||
| Non-redeemable preferred stock | 646.5 | 658.0 | 658.0 | |||||||||||||||||||
| Industrial, miscellaneous and all other | 12.5 | 19.5 | 19.5 | |||||||||||||||||||
| Total equity securities, available-for-sale | 748.4 | 762.6 | 762.6 | Non-redeemable preferred stock | 624.6 | 625.8 | 625.8 | |||||||||||||||
| Total equity securities, available-for-sale | 657.7 | 666.6 | 666.6 | |||||||||||||||||||
| Equity securities, trading | Equity securities, trading | 181.0 | 181.0 | 181.0 | ||||||||||||||||||
| Mortgage loans(1) | Mortgage loans(1) | 11,760.5 | xxxx | 11,714.5 | Mortgage loans(1) | 11,700.4 | xxxx | 11,663.9 | ||||||||||||||
Real estate, net: | Real estate, net: | Real estate, net: | ||||||||||||||||||||
| Real estate acquired in satisfaction of debt | 33.2 | xxxx | 33.2 | Real estate acquired in satisfaction of debt | 12.4 | xxxx | 12.6 | |||||||||||||||
| Other real estate(2) | 1,004.6 | xxxx | 998.8 | Other real estate(2) | 859.0 | xxxx | 854.4 | |||||||||||||||
| Policy loans | Policy loans | 814.5 | xxxx | 814.5 | Policy loans | 850.7 | xxxx | 850.7 | ||||||||||||||
| Other investments(3) | Other investments(3) | 1,331.9 | xxxx | 1,585.7 | Other investments(3) | 973.1 | xxxx | 1,410.7 | ||||||||||||||
| Total investments | $ | 54,198.4 | xxxx | $ | 56,918.6 | Total investments | $ | 58,641.3 | xxxx | $ | 60,366.8 | |||||||||||
Schedule II — Condensed Financial Information of Registrant (Parent Only)StatementStatements of Financial Position
| | | December 31, | | December 31, | ||||||||||||||
|---|---|---|---|---|---|---|---|---|---|---|---|---|---|---|---|---|---|---|
| | | 2004 | 2003 | | 2006 | 2005 | ||||||||||||
| | | (in millions) | | | (in millions) | |||||||||||||
| Assets: | ||||||||||||||||||
| Assets | Assets | |||||||||||||||||
| Cash | Cash | $ | 75.4 | $ | 173.8 | Cash | $ | 30.9 | $ | 21.6 | ||||||||
| Other investments | Other investments | 3.6 | — | |||||||||||||||
| Income taxes receivable | Income taxes receivable | 1.6 | 1.7 | Income taxes receivable | 1.2 | 3.5 | ||||||||||||
| Amounts receivable from subsidiary | Amounts receivable from subsidiary | 250.0 | — | |||||||||||||||
| Other assets | Other assets | 6.1 | — | |||||||||||||||
| Investment in subsidiary | Investment in subsidiary | 7,469.0 | 7,234.0 | Investment in subsidiary | 8,191.4 | 7,784.2 | ||||||||||||
| Total assets | $ | 7,546.0 | $ | 7,409.5 | Total assets | $ | 8,483.2 | $ | 7,809.3 | |||||||||
Liabilities and stockholders' equity: | ||||||||||||||||||
| Liabilities: | ||||||||||||||||||
| Liabilities | Liabilities | |||||||||||||||||
| Amounts payable to subsidiary | Amounts payable to subsidiary | $ | 1.7 | $ | 1.7 | Amounts payable to subsidiary | $ | 2.6 | $ | 2.1 | ||||||||
| Long-term debt | Long-term debt | 601.9 | — | |||||||||||||||
| Deferred income taxes | Deferred income taxes | — | 8.2 | Deferred income taxes | 1.1 | — | ||||||||||||
| Preferred stock dividend payable | Preferred stock dividend payable | 8.2 | — | |||||||||||||||
| Accrued interest payable | Accrued interest payable | 7.6 | — | |||||||||||||||
| Other liabilities | Other liabilities | 1.0 | — | |||||||||||||||
| Total liabilities | 1.7 | 9.9 | Total liabilities | 622.4 | 2.1 | |||||||||||||
Stockholders' equity: | ||||||||||||||||||
| Common stock, par value $.01 per share — 2,500.0 million shares authorized, 379.1 million and 377.4 million shares issued, 300.6 million and 320.7 million shares outstanding in 2004 and 2003, respectively | 3.8 | 3.8 | ||||||||||||||||
| Stockholders' equity | Stockholders' equity | |||||||||||||||||
| Series A preferred stock, par value $.01 with liquidation preference of $100 per share — 3.0 million shares authorized, issued and outstanding at December 31, 2006 and 2005 | Series A preferred stock, par value $.01 with liquidation preference of $100 per share — 3.0 million shares authorized, issued and outstanding at December 31, 2006 and 2005 | — | — | |||||||||||||||
| Series B preferred stock, par value $.01 with liquidation preference of $25 per share — 10.0 million shares authorized, issued and outstanding at December 31, 2006 and 2005 | Series B preferred stock, par value $.01 with liquidation preference of $25 per share — 10.0 million shares authorized, issued and outstanding at December 31, 2006 and 2005 | 0.1 | 0.1 | |||||||||||||||
| Common stock, par value $.01 per share — 2,500.0 million shares authorized, 383.6 million and 381.3 million shares issued, and 268.4 million and 280.6 million shares outstanding in 2006 and 2005, respectively | Common stock, par value $.01 per share — 2,500.0 million shares authorized, 383.6 million and 381.3 million shares issued, and 268.4 million and 280.6 million shares outstanding in 2006 and 2005, respectively | 3.8 | 3.8 | |||||||||||||||
| Additional paid-in capital | Additional paid-in capital | 7,269.4 | 7,153.2 | Additional paid-in capital | 8,141.8 | 8,000.0 | ||||||||||||
| Retained earnings | Retained earnings | 1,289.5 | 630.4 | Retained earnings | 2,824.1 | 2,008.6 | ||||||||||||
| Accumulated other comprehensive income | Accumulated other comprehensive income | 1,313.3 | 1,171.3 | Accumulated other comprehensive income | 846.9 | 994.8 | ||||||||||||
| Treasury stock, at cost (78.5 million and 56.7 million shares in 2004 and 2003, respectively) | (2,331.7 | ) | (1,559.1 | ) | ||||||||||||||
| Treasury stock, at cost (115.2 million and 100.7 million shares at December 31, 2006 and 2005, respectively) | Treasury stock, at cost (115.2 million and 100.7 million shares at December 31, 2006 and 2005, respectively) | (3,955.9 | ) | (3,200.1 | ) | |||||||||||||
| Total stockholders' equity | 7,544.3 | 7,399.6 | Total stockholders' equity | 7,860.8 | 7,807.2 | |||||||||||||
| Total liabilities and stockholders' equity | $ | 7,546.0 | $ | 7,409.5 | Total liabilities and stockholders' equity | $ | 8,483.2 | $ | 7,809.3 | |||||||||
See accompanying notes.
Statements of Operations
| | For the year ended December 31, | ||||||||||
|---|---|---|---|---|---|---|---|---|---|---|---|
| | 2006 | 2005 | 2004 | ||||||||
| | (in millions) | ||||||||||
| Revenues | |||||||||||
| Net investment income | $ | 11.9 | $ | 2.3 | $ | 4.8 | |||||
| Total revenues | 11.9 | 2.3 | 4.8 | ||||||||
| Expenses | |||||||||||
| Other operating costs and expenses | 18.2 | 10.6 | 10.5 | ||||||||
| Total expenses | 18.2 | 10.6 | 10.5 | ||||||||
| Loss before income taxes | (6.3 | ) | (8.3 | ) | (5.7 | ) | |||||
| Income tax benefits | (2.2 | ) | (3.8 | ) | (2.2 | ) | |||||
| Equity in the net income of subsidiaries, excluding discontinued operations and cumulative effect of accounting changes | 1,037.8 | 896.4 | 704.4 | ||||||||
| Income from continuing operations, net of related income taxes | 1,033.7 | 891.9 | 700.9 | ||||||||
| Income from discontinued operations, net of related income taxes | 30.6 | 27.1 | 130.4 | ||||||||
| Income before cumulative effect of accounting change | 1,064.3 | 919.0 | 831.3 | ||||||||
| Cumulative effect of accounting change, net of related income taxes | — | — | (5.7 | ) | |||||||
| Net income | 1,064.3 | 919.0 | 825.6 | ||||||||
| Preferred stock dividends | 33.0 | 17.7 | — | ||||||||
| Net income available to common stockholders | $ | 1,031.3 | $ | 901.3 | $ | 825.6 | |||||
See accompanying notes.
Schedule II — Condensed Financial InformationStatements of Registrant (Parent Only) — (continued)Statement of Operations
Cash Flows
| | For the year ended December, | ||||||||||
|---|---|---|---|---|---|---|---|---|---|---|---|
| | 2004 | 2003 | 2002 | ||||||||
| | (in millions) | ||||||||||
| Revenues: | |||||||||||
| Net investment income | $ | 4.8 | $ | 3.5 | $ | 4.0 | |||||
| Total revenues | 4.8 | 3.5 | 4.0 | ||||||||
Expenses: | |||||||||||
| Other operating costs and expenses | 10.5 | 10.8 | 7.1 | ||||||||
| Total expenses | 10.5 | 10.8 | 7.1 | ||||||||
| Loss before income taxes | (5.7 | ) | (7.3 | ) | (3.1 | ) | |||||
| Income tax benefits | (2.2 | ) | (2.7 | ) | (1.3 | ) | |||||
| Equity in the net income of subsidiaries, excluding discontinued operations and cumulative effect of accounting change | 706.0 | 651.9 | 448.2 | ||||||||
| Income from continuing operations, net of related income taxes | 702.5 | 647.3 | 446.4 | ||||||||
| Income from discontinued operations, net of related income taxes | 128.8 | 102.4 | (23.2 | ) | |||||||
| Income before cumulative Effect of accounting changes | 831.3 | 749.7 | 423.2 | ||||||||
| Cumulative effect of accounting changes, net of related income taxes | (5.7 | ) | (3.4 | ) | (280.9 | ) | |||||
| Net income | $ | 825.6 | $ | 746.3 | $ | 142.3 | |||||
| | For the year ended December 31, | |||||||||||
|---|---|---|---|---|---|---|---|---|---|---|---|---|
| | 2006 | 2005 | 2004 | |||||||||
| | (in millions) | |||||||||||
| Net income | $ | 1,064.3 | $ | 919.0 | $ | 825.6 | ||||||
| Adjustments to reconcile net income to net cash provided by (used in) operating activities: | ||||||||||||
| Income from discontinued operations, net of related income taxes | (30.6 | ) | (27.1 | ) | (130.4 | ) | ||||||
| Cumulative effect of accounting change, net of related income taxes | — | — | 5.7 | |||||||||
| Equity in the net income of subsidiary | (1,037.8 | ) | (896.4 | ) | (704.4 | ) | ||||||
| Increase (decrease) in income taxes | 1.4 | (1.3 | ) | 1.3 | ||||||||
| Stock-based compensation | 2.1 | 0.9 | 1.1 | |||||||||
| Other | 7.8 | 0.4 | — | |||||||||
| Net cash provided by (used in) operating activities | 7.2 | (4.5 | ) | (1.1 | ) | |||||||
| Cash flows from investing activities: | ||||||||||||
| Dividend received from subsidiary | 331.1 | 501.1 | 800.6 | |||||||||
| Net cash provided by investing activities | 331.1 | 501.1 | 800.6 | |||||||||
| Cash flows from financing activities: | ||||||||||||
| Issuance of common stock | 66.2 | 59.9 | 41.2 | |||||||||
| Issuance of preferred stock | — | 542.0 | — | |||||||||
| Accelerated stock repurchase settlement | — | (84.0 | ) | — | ||||||||
| Acquisition of treasury stock | (755.8 | ) | (868.4 | ) | (772.6 | ) | ||||||
| Dividends to common stockholders | (214.7 | ) | (182.2 | ) | (166.5 | ) | ||||||
| Dividends to preferred stockholders | (24.7 | ) | (17.7 | ) | — | |||||||
| Issuance of long-term debt | 600.0 | — | — | |||||||||
| Net cash used in financing activities | (329.0 | ) | (550.4 | ) | (897.9 | ) | ||||||
| Net decrease in cash and cash equivalents | 9.3 | (53.8 | ) | (98.4 | ) | |||||||
| Cash and cash equivalents at beginning of period | 21.6 | 75.4 | 173.8 | |||||||||
| Cash and cash equivalents at end of year | $ | 30.9 | $ | 21.6 | $ | 75.4 | ||||||
See accompanying notes.
Schedule II — Condensed Financial Information of Registrant (Parent Only) — (continued)Statement of Cash Flows
| | For the year ended December 31, | |||||||||||
|---|---|---|---|---|---|---|---|---|---|---|---|---|
| | 2004 | 2003 | 2002 | |||||||||
| | (in millions) | |||||||||||
| Net income | $ | 825.6 | $ | 746.3 | $ | 142.3 | ||||||
| Adjustments to reconcile net income (loss) to net cash provided by operating activities: | ||||||||||||
| Loss (income) from discontinued operations, net of related income taxes | (128.8 | ) | (102.4 | ) | 23.2 | |||||||
| Cumulative effect of accounting changes, net of related income taxes | 5.7 | 3.4 | 280.9 | |||||||||
| Equity in the net income of subsidiary | (706.0 | ) | (651.9 | ) | (448.2 | ) | ||||||
| Increase in amounts payable to Subsidiary | — | 0.1 | 1.4 | |||||||||
| Increase in income taxes | 1.3 | 0.5 | 7.2 | |||||||||
| Stock-based compensation | 1.1 | 0.7 | 0.4 | |||||||||
| Net cash provided by (used in) operating activities | (1.1 | ) | (3.3 | ) | 7.2 | |||||||
| Cash flows from investing activities: | ||||||||||||
| Dividend received from subsidiary | 800.6 | 425.0 | 1,100.0 | |||||||||
| Net cash provided by (used in) investing activities | 800.6 | 425.0 | 1,100.0 | |||||||||
| Cash flows from financing activities: | ||||||||||||
| Issuance of common stock | 41.2 | 18.3 | 22.0 | |||||||||
| Dividends to stockholders | (166.5 | ) | (145.3 | ) | (83.8 | ) | ||||||
| Acquisition of treasury stock | (772.6 | ) | (453.0 | ) | (750.4 | ) | ||||||
| Net cash provided by (used in) financing activities | (897.9 | ) | (580.0 | ) | (812.2 | ) | ||||||
| Net increase (decrease) in cash and cash equivalents | (98.4 | ) | (158.3 | ) | 295.0 | |||||||
| Cash and cash equivalents at beginning of period | 173.8 | 332.1 | 37.1 | |||||||||
| Cash and cash equivalents at end of year | $ | 75.4 | $ | 173.8 | $ | 332.1 | ||||||
See accompanying notes.
Schedule II — Condensed Financial Information of Registrant (Parent Only) — (continued)
Notes to Condensed Financial Statements
(1) Basis of Presentation
The accompanying condensed financial statements should be read in conjunction with the consolidated financial statements and notes thereto of Principal Financial Group, Inc.
In the parent company only financial statements, our investments in subsidiaries are stated at cost plus equity in undistributed earnings of subsidiaries.
(2) Cash Dividends from Subsidiary
The parent company received cash dividends totaling $331.1 million, $501.1 million and $800.6 million $425.0 millionin 2006, 2005 and $1,100.0 million in 2004 2003 and 2002, respectively, from its subsidiary.
Schedule III — Supplementary Insurance Information
As of December 31, 2004, 20032006, 2005 and 20022004 and for each of the years then ended
| Segment | Segment | Deferred Policy Acquisition Costs | Future Policy Benefits and Claims | Contractholder and Other Policyholder Funds | Segment | Deferred Policy Acquisition Costs | Future Policy Benefits and Claims | Contractholder and Other Policyholder Funds | ||||||||||||||
|---|---|---|---|---|---|---|---|---|---|---|---|---|---|---|---|---|---|---|---|---|---|---|
| | | (in millions) | ||||||||||||||||||||
| 2006: | 2006: | |||||||||||||||||||||
| U.S. Asset Management and Accumulation | U.S. Asset Management and Accumulation | $ | 985.6 | $ | 7,719.3 | $ | 34,570.0 | |||||||||||||||
| International Asset Management and Accumulation | International Asset Management and Accumulation | 153.0 | 2,328.4 | 22.1 | ||||||||||||||||||
| Life and Health Insurance | Life and Health Insurance | 1,280.3 | 7,282.2 | 3,045.0 | ||||||||||||||||||
| Corporate and Other | Corporate and Other | — | 2.7 | (218.7 | ) | |||||||||||||||||
| Total | $ | 2,418.9 | $ | 17,332.6 | $ | 37,418.4 | ||||||||||||||||
| 2005: | 2005: | |||||||||||||||||||||
| U.S. Asset Management and Accumulation | U.S. Asset Management and Accumulation | $ | 889.5 | $ | 7,516.7 | $ | 31,527.5 | |||||||||||||||
| International Asset Management and Accumulation | International Asset Management and Accumulation | 104.3 | 2,175.2 | 16.5 | ||||||||||||||||||
| Life and Health Insurance | Life and Health Insurance | 1,180.3 | 7,130.1 | 2,923.6 | ||||||||||||||||||
| Corporate and Other | Corporate and Other | — | 3.5 | (198.4 | ) | |||||||||||||||||
| Total | $ | 2,174.1 | $ | 16,825.5 | $ | 34,269.2 | ||||||||||||||||
| | | (in millions) | ||||||||||||||||||||
| 2004: | 2004: | 2004: | ||||||||||||||||||||
| U.S. Asset Management and Accumulation | U.S. Asset Management and Accumulation | $ | 738.3 | $ | 7,298.7 | $ | 30,434.6 | U.S. Asset Management and Accumulation | $ | 738.3 | $ | 7,298.7 | $ | 30,434.6 | ||||||||
| International Asset Management and Accumulation | International Asset Management and Accumulation | 66.7 | 1,757.9 | 12.2 | International Asset Management and Accumulation | 66.7 | 1,757.9 | 12.2 | ||||||||||||||
| Life and Health Insurance | Life and Health Insurance | 1,032.6 | 6,983.2 | 2,649.6 | Life and Health Insurance | 1,032.6 | 6,983.2 | 2,649.6 | ||||||||||||||
| Mortgage Banking | — | — | — | |||||||||||||||||||
| Corporate and Other | Corporate and Other | — | 2.8 | (178.2 | ) | Corporate and Other | — | 2.8 | (178.2 | ) | ||||||||||||
| Total | $ | 1,837.6 | $ | 16,042.6 | $ | 32,918.2 | Total | $ | 1,837.6 | $ | 16,042.6 | $ | 32,918.2 | |||||||||
2003: | ||||||||||||||||||||||
| U.S. Asset Management and Accumulation | $ | 615.4 | $ | 7,146.4 | $ | 27,502.9 | ||||||||||||||||
| International Asset Management and Accumulation | 49.3 | 1,425.4 | 8.7 | |||||||||||||||||||
| Life and Health Insurance | 904.2 | 6,876.1 | 2,243.7 | |||||||||||||||||||
| Mortgage Banking | — | — | — | |||||||||||||||||||
| Corporate and Other | — | 2.9 | (149.8 | ) | ||||||||||||||||||
| Total | $ | 1,568.9 | $ | 15,450.8 | $ | 29,605.5 | ||||||||||||||||
2002: | ||||||||||||||||||||||
| U.S. Asset Management and Accumulation | $ | 501.7 | $ | 6,956.3 | $ | 24,985.6 | ||||||||||||||||
| International Asset Management and Accumulation | 35.1 | 1,084.6 | 12.5 | |||||||||||||||||||
| Life and Health Insurance | 872.7 | 6,675.6 | 2,024.2 | |||||||||||||||||||
| Mortgage Banking | — | — | — | |||||||||||||||||||
| Corporate and Other | — | 3.0 | (77.1 | ) | ||||||||||||||||||
| Total | $ | 1,409.5 | $ | 14,719.5 | $ | 26,945.2 | ||||||||||||||||
Schedule III — Supplementary Insurance Information — (continued)As of December 31, 2004, 2003 and 2002 and for each of the years then ended
| Segment | Segment | Premiums and Other Considerations | Net Investment Income(1) | Benefits, Claims and Settlement Expenses | Amortization of Deferred Policy Acquisition Costs | Other Operating Expenses(1) | Segment | Premiums and Other Considerations | Net Investment Income(1) | Benefits, Claims and Settlement Expenses | Amortization of Deferred Policy Acquisition Costs | Other Operating Expenses(1) | |||||||||||||||||||||
|---|---|---|---|---|---|---|---|---|---|---|---|---|---|---|---|---|---|---|---|---|---|---|---|---|---|---|---|---|---|---|---|---|---|
| | | (in millions) | |||||||||||||||||||||||||||||||
| 2006: | 2006: | ||||||||||||||||||||||||||||||||
| U.S. Asset Management and Accumulation | U.S. Asset Management and Accumulation | $ | 462.3 | $ | 2,635.8 | $ | 2,391.3 | $ | 170.6 | $ | 1,124.9 | ||||||||||||||||||||||
| International Asset Management and Accumulation | International Asset Management and Accumulation | 239.1 | 252.3 | 399.1 | 2.4 | 142.3 | |||||||||||||||||||||||||||
| Life and Health Insurance | Life and Health Insurance | 3,598.7 | 692.5 | 2,910.3 | 66.2 | 1,040.0 | |||||||||||||||||||||||||||
| Corporate and Other | Corporate and Other | 5.2 | 37.4 | (8.3 | ) | — | 12.3 | ||||||||||||||||||||||||||
| Total | $ | 4,305.3 | $ | 3,618.0 | $ | 5,692.4 | $ | 239.2 | $ | 2,319.5 | |||||||||||||||||||||||
2005: | 2005: | ||||||||||||||||||||||||||||||||
| U.S. Asset Management and Accumulation | U.S. Asset Management and Accumulation | $ | 455.2 | $ | 2,451.0 | $ | 2,260.4 | $ | 148.7 | $ | 1,022.1 | ||||||||||||||||||||||
| International Asset Management and Accumulation | International Asset Management and Accumulation | 247.6 | 247.7 | 409.3 | 7.7 | 121.1 | |||||||||||||||||||||||||||
| Life and Health Insurance | Life and Health Insurance | 3,267.1 | 677.2 | 2,620.2 | 90.2 | 976.3 | |||||||||||||||||||||||||||
| Corporate and Other | Corporate and Other | 5.1 | (15.8 | ) | (7.0 | ) | — | (24.0 | ) | ||||||||||||||||||||||||
| Total | $ | 3,975.0 | $ | 3,360.1 | $ | 5,282.9 | $ | 246.6 | $ | 2,095.5 | |||||||||||||||||||||||
| | | (in millions) | |||||||||||||||||||||||||||||||
| 2004: | 2004: | 2004: | |||||||||||||||||||||||||||||||
| U.S. Asset Management and Accumulation | U.S. Asset Management and Accumulation | $ | 370.1 | $ | 2,354.0 | $ | 2,094.8 | $ | 112.0 | $ | 878.7 | U.S. Asset Management and Accumulation | $ | 370.1 | $ | 2,354.0 | $ | 2,094.8 | $ | 112.0 | $ | 898.4 | |||||||||||
| International Asset Management and Accumulation | International Asset Management and Accumulation | 241.0 | 191.5 | 357.3 | 3.1 | 109.0 | International Asset Management and Accumulation | 241.0 | 191.5 | 357.3 | 3.1 | 109.0 | |||||||||||||||||||||
| Life and Health Insurance | Life and Health Insurance | 3,096.6 | 662.3 | 2,514.7 | 95.7 | 890.7 | Life and Health Insurance | 3,096.6 | 662.3 | 2,514.7 | 95.7 | 890.7 | |||||||||||||||||||||
| Mortgage Banking | Mortgage Banking | — | — | — | — | 16.7 | Mortgage Banking | — | — | — | — | 16.7 | |||||||||||||||||||||
| Corporate and Other | Corporate and Other | 2.3 | 18.7 | (7.3 | ) | — | 60.0 | Corporate and Other | 2.3 | 16.2 | (7.3 | ) | — | 60.0 | |||||||||||||||||||
| Total | $ | 3,710.0 | $ | 3,226.5 | $ | 4,959.5 | $ | 210.8 | $ | 1,955.1 | Total | $ | 3,710.0 | $ | 3,224.0 | $ | 4,959.5 | $ | 210.8 | $ | 1,974.8 | ||||||||||||
2003: | |||||||||||||||||||||||||||||||||
| U.S. Asset Management and Accumulation | $ | 420.0 | $ | 2,369.0 | $ | 2,139.7 | $ | 82.5 | $ | 839.7 | |||||||||||||||||||||||
| International Asset Management and Accumulation | 191.7 | 137.4 | 263.6 | (4.0 | ) | 101.8 | |||||||||||||||||||||||||||
| Life and Health Insurance | 3,019.0 | 656.5 | 2,457.7 | 61.5 | 826.5 | ||||||||||||||||||||||||||||
| Mortgage Banking | — | — | — | — | 29.3 | ||||||||||||||||||||||||||||
| Corporate and Other | — | 70.5 | (5.2 | ) | — | 61.4 | |||||||||||||||||||||||||||
| Total | $ | 3,630.7 | $ | 3,233.4 | $ | 4,855.8 | $ | 140.0 | $ | 1,858.7 | |||||||||||||||||||||||
2002: | |||||||||||||||||||||||||||||||||
| U.S. Asset Management and Accumulation | $ | 746.5 | $ | 2,322.3 | $ | 2,530.3 | $ | 57.1 | $ | 684.1 | |||||||||||||||||||||||
| International Asset Management and Accumulation | 157.9 | 138.2 | 238.6 | 3.3 | 80.7 | ||||||||||||||||||||||||||||
| Life and Health Insurance | 2,973.4 | 660.2 | 2,433.4 | 84.0 | 750.4 | ||||||||||||||||||||||||||||
| Mortgage Banking | — | — | — | — | 27.0 | ||||||||||||||||||||||||||||
| Corporate and Other | — | 52.4 | (4.8 | ) | — | 55.0 | |||||||||||||||||||||||||||
| Total | $ | 3,877.8 | $ | 3,173.1 | $ | 5,197.5 | $ | 144.4 | $ | 1,597.2 | |||||||||||||||||||||||
Schedule IV — Reinsurance
As of December 31, 2004, 20032006, 2005 and 20022004 and for each of the years then ended
| | | Gross Amount | Ceded to Other Companies | Assumed from Other Companies | Net Amount | Percentage of Amount Assumed to Net | ||||||||||||||||||||||||||||
|---|---|---|---|---|---|---|---|---|---|---|---|---|---|---|---|---|---|---|---|---|---|---|---|---|---|---|---|---|---|---|---|---|---|---|
| | | (in millions) | ||||||||||||||||||||||||||||||||
| 2006: | 2006: | |||||||||||||||||||||||||||||||||
| Life insurance in force | Life insurance in force | $ | 218,946.9 | $ | 53,313.8 | $ | 3,078.9 | $ | 168,712.0 | 1.8 | % | |||||||||||||||||||||||
| Premiums: | Premiums: | |||||||||||||||||||||||||||||||||
| Life insurance | $ | 1,541.7 | $ | 98.7 | $ | 117.2 | $ | 1,560.2 | 7.5 | % | ||||||||||||||||||||||||
| Accident and health insurance | 2,927.1 | 182.1 | 0.1 | 2,745.1 | — | % | ||||||||||||||||||||||||||||
| Total | $ | 4,468.8 | $ | 280.8 | $ | 117.3 | $ | 4,305.3 | 2.7 | % | ||||||||||||||||||||||||
2005: | 2005: | |||||||||||||||||||||||||||||||||
| Life insurance in force | Life insurance in force | $ | 197,690.2 | $ | 49,934.4 | $ | 2,895.1 | $ | 150,650.9 | 1.9 | % | |||||||||||||||||||||||
| Premiums: | Premiums: | |||||||||||||||||||||||||||||||||
| Life insurance | $ | 1,571.7 | $ | 82.7 | $ | 56.6 | $ | 1,545.6 | 3.7 | % | ||||||||||||||||||||||||
| Accident and health insurance | 2,642.9 | 213.5 | — | 2,429.4 | — | % | ||||||||||||||||||||||||||||
| | | Gross Amount | Ceded to Other Companies | Assumed from Other Companies | Net Amount | Percentage of Amount Assumed to Net | Total | $ | 4,214.6 | $ | 296.2 | $ | 56.6 | $ | 3,975.0 | 1.4 | % | |||||||||||||||||
| | | (in millions) | ||||||||||||||||||||||||||||||||
| 2004: | 2004: | 2004: | ||||||||||||||||||||||||||||||||
| Life insurance in force | Life insurance in force | $ | 180,343.5 | $ | 41,765.8 | $ | 2,566.2 | $ | 141,143.9 | 1.8 | % | Life insurance in force | $ | 180,343.5 | $ | 41,765.8 | $ | 2,566.2 | $ | 141,143.9 | 1.8 | % | ||||||||||||
Premiums: | Premiums: | Premiums: | ||||||||||||||||||||||||||||||||
| Life insurance | $ | 1,479.3 | $ | 69.2 | $ | 67.0 | $ | 1,477.1 | 4.5 | % | Life insurance | $ | 1,479.3 | $ | 69.2 | $ | 67.0 | $ | 1,477.1 | 4.5 | % | |||||||||||||
| Accident and health insurance | 2,455.5 | 222.6 | — | 2,232.9 | — | % | Accident and health insurance | 2,455.5 | 222.6 | — | 2,232.9 | — | % | |||||||||||||||||||||
| Total | $ | 3,934.8 | $ | 291.8 | $ | 67.0 | $ | 3,710.0 | 1.8 | % | Total | $ | 3,934.8 | $ | 291.8 | $ | 67.0 | $ | 3,710.0 | 1.8 | % | |||||||||||||
2003: | ||||||||||||||||||||||||||||||||||
| Life insurance in force | $ | 166,910.7 | $ | 33,934.0 | $ | 2,317.0 | $ | 135,293.7 | 1.7 | % | ||||||||||||||||||||||||
Premiums: | ||||||||||||||||||||||||||||||||||
| Life insurance | $ | 1,442.0 | $ | 64.7 | $ | 118.8 | $ | 1,496.1 | 7.9 | % | ||||||||||||||||||||||||
| Accident and health insurance | 2,359.8 | 225.2 | — | 2,134.6 | — | % | ||||||||||||||||||||||||||||
| Total | $ | 3,801.8 | $ | 289.9 | $ | 118.8 | $ | 3,630.7 | 3.3 | % | ||||||||||||||||||||||||
2002: | ||||||||||||||||||||||||||||||||||
| Life insurance in force | $ | 165,307.4 | $ | 30,763.8 | $ | 1,885.7 | $ | 136,429.3 | 1.4 | % | ||||||||||||||||||||||||
Premiums: | ||||||||||||||||||||||||||||||||||
| Life insurance | $ | 1,746.4 | $ | 56.9 | $ | 130.6 | $ | 1,820.1 | 7.2 | % | ||||||||||||||||||||||||
| Accident and health insurance | 2,328.9 | 271.2 | — | 2,057.7 | — | % | ||||||||||||||||||||||||||||
| Total | $ | 4,075.3 | $ | 328.1 | $ | 130.6 | $ | 3,877.8 | 3.4 | % | ||||||||||||||||||||||||
| Exhibit Number | Description | Page | ||
|---|---|---|---|---|
| 2.1 | Plan of Conversion(1) | |||
| 2.2 | Share Sale Deed, dated as of June 17, 1999, among BT Investments (Australia) LLC, BT Foreign Investment Corporation, BT New Zealand Limited, BT International (Delaware), Inc., BT Nominees (H.K.) Limited, Deutsche Bank AG, Bankers Trust Corporation, Principal Financial Group (Australia) Pty Limited and Principal Financial Services, Inc.(1) | |||
| 2.3 | Deed to Amend the Share Sale Deed, dated as of August 31, 1999, among BT Investments (Australia) LLC, BT Foreign Investment Corporation, BT New Zealand Limited, BT International (Delaware), Inc., BT Nominees (H.K.) Limited, Deutsche Bank AG, Bankers Trust Corporation, Principal Financial Group (Australia) Pty Limited and Principal Financial Services, Inc.(1) | |||
| 2.4 | Second Amendment to the Share Sale Deed, dated as of March 14, 2001, among BT Investments (Australia) LLC, BT Foreign Investment Corporation, Deutsche New Zealand Limited (formerly called BT New Zealand Limited), BT International (Delaware), Inc., DB Nominees (H.K.) Limited (formerly called BT Nominees (H.K.) Limited), Deutsche Bank AG, Bankers Trust Corporation, Principal Financial Group (Australia) Pty Limited and Principal Financial Services, Inc.(1) | |||
| 2.5 | Stock Purchase Agreement dated as of May 11, 2004 by and between Principal Holding Company and CitiMortgage, Inc.(2) | |||
| 2.6 | Stock Purchase Agreement among Washington Mutual, Inc., New American Capital, Inc., Principal Financial Group, Inc., and Principal Management Corporation for the purchase and sale of the outstanding capital stock of WM Advisors, Inc., dated as of July 25, 2006.(3) | |||
| 2.6.1 | Amendment No. 1 and Waiver, dated as of December 29, 2006, to the Stock Purchase Agreement, dated as of July 25, 2006, by and among Washington Mutual, Inc., New American Capital, Inc., Principal Financial Group, Inc., and Principal Management Corporation for the purchase and sale of the outstanding capital stock of WM Advisors, Inc.(4) | |||
| 2.6.2 | Memorandum of Understanding dated as of December 29, 2006, amending and modifying the Stock Purchase Agreement by and among Washington Mutual, Inc., New American Capital, Inc., Principal Financial Group, Inc., and Principal Management Corporation for the purchase and sale of the outstanding capital stock of WM Advisors, Inc.(4) | |||
| 3.1 | Form of Amended and Restated Certificate of Incorporation of Principal Financial Group, Inc. (included in Exhibit 2.1) | |||
| 3.2 | Form of By-Laws of Principal Financial Group, Inc. | |||
| 4.1 | Form of Certificate for the Common Stock of Principal Financial Group, Inc., par value $0.01 per share(1) | |||
| 4.1.1 | Certificate of Designations of the Company's Series A Non-Cumulative Perpetual Preferred Stock, dated June 16, 2005.(5) | |||
| 4.1.2 | Certificate of Designations of the Company's Series B Non-Cumulative Perpetual Preferred Stock, dated June 16, 2005.(5) | |||
| 4.1.3 | Specimen Stock Certificate for the Company's Series A Non-Cumulative Perpetual Preferred Stock.(5) | |||
| 4.1.4 | Specimen Stock Certificate for the Company's Series B Non-Cumulative Perpetual Preferred Stock.(5) | |||
| 4.1.5 | Senior Indenture, dated as of October 11, 2006, between Principal Financial Group, Inc. and The Bank of New York, as Trustee.(6) | |||
| 4.1.6 | First Supplemental Indenture, dated as of October 16, 2006, among Principal Financial Group, Inc., Principal Financial Services, Inc. and The Bank of New York, as Trustee.(6) | |||
| 4.1.7 | 6.05% Senior Note ($500,000,000) due October 15, 2036.(6) | |||
| 4.1.8 | 6.05% Senior Note ($100,000,000) due October 15, 2036.(7) | |||
| 4.1.9 | Guarantee, dated as of October 16, 2006, by Principal Financial Services, Inc.(6) | |||
| 4.2 | Amended and Restated Stockholder Rights Agreement, dated as of October 22, | |||
| 4.2.1 | Amendment to the Amended and Restated Rights Agreement, dated as of January 17, | |||
| 10.1 | Principal Financial Group, Inc. Stock Incentive | |||
| 10.1.1 | Form of Restricted Stock Unit Award Agreement(11) | |||
| 10.1.2 | Form of Stock Option Award Agreement(11) | |||
| 10.1.3 | Principal Financial Group, Inc. 2005 Stock Incentive Plan(12) | |||
| 10.2 | Principal Financial Group Long-Term Performance Plan(1) | |||
| 10.3 | Resolution of Human Resources Committee of the Board of Directors of Principal Financial Group, Inc. amending the Principal Financial Group Long-Term Performance Plan as of October 31, | |||
| 10.4 | Principal Financial Group Incentive Pay Plan (PrinPay), amended and restated effective January 1, | |||
| 10.5 | Principal Financial Group, Inc. Annual Incentive | |||
| 10.6 | Summary of Standard Compensatory Arrangement for Non-Employee Members of the Principal Financial Group, Inc. Board of | |||
| 10.6.1 | Revised Summary of Standard Compensatory Arrangement for Non-Employee Directors of the Principal Financial Group, Inc. Board of Directors.(14) | |||
| 10.7 | Principal Financial Group, Inc. Directors Stock Plan(1) | |||
| 10.7.1 | Principal Financial Group, Inc. 2005 Directors Stock Plan(12) | |||
| 10.8 | Deferred Compensation Plan for Non-Employee Directors of Principal Financial Group, Inc. | |||
| 10.9 | Principal Select Savings Excess Plan, restated as of January 1, | |||
| 10.9.1 | Amendment No. 1 to Principal Select Savings Excess Plan(15) | |||
| 10.10 | Supplemental Executive Retirement Plan for Employees, restated as of January 1, | |||
| 10.10.1 | Amendment No. 1 to the Principal Supplemental Executive Retirement Plan for Employees(15) | |||
| 10.11 | Employment Agreement, dated as of April 1, 2004, by and between Principal Financial Group, Inc., Principal Financial Services, Inc., Principal Life Insurance Company and J. Barry Griswell(2) | |||
| 10.12 | Change-of-Control Supplement and Amendment to Employment Agreement, dated as of April 1, 2004 by and between Principal Financial Group, Inc., Principal Financial Services, Inc., Principal Life Insurance Company and J. Barry Griswell(2) | |||
| 10.12.1 | Change-of-Control Supplement to Employment Agreement, dated as of February 28, 2006, by and among Principal Financial Group, Inc., Principal Financial Services, Inc., Principal Life Insurance Company and J. Barry Griswell.(17) | |||
| 10.13 | Form of Principal Mutual Holding Company and Principal Life Insurance Company Change of Control Employment Agreement (Tier One Executives) among Principal Mutual Holding Company, Principal Financial Group, Inc., Principal Financial Services, Inc., Principal Life Insurance Company and an Executive(1) | |||
| 10.13.1 | Form of Principal Financial Group, Inc. and Principal Life Insurance Company Change-of-Control Employment Agreement (Tier One Executives), dated as of February 28, 2006, by and among Principal Financial Group, Inc., Principal Financial Services, Inc., Principal Life Insurance Company and an Executive.(17) | |||
| 10.14 | Compensatory Arrangement, dated as of March 14, 2002, between Principal Life Insurance Company and James P. McCaughan. | |||
| 10.15 | Fiscal Agency Agreement, dated as of August 25, 1999, among Principal Financial Group (Australia) Holdings Pty Limited, Principal Financial Services, Inc. and U.S. Bank Trust National Association(1) | |||
| 10.16 | Employment Agreement dated as of June 1, 2006, by and between Principal Financial Group, Inc., Principal Financial Services, Inc., Principal Life Insurance Company, and Larry D. Zimpleman.(4) | |||
| 12 | Computation of Earnings to Fixed Charges Ratio(4) | |||
| 21 | Principal Financial Group, Inc. Member Companies as of December 31, | |||
| 23 | Consent of Independent Registered Public Accounting Firm(4) | |||
| 31.1 | Certification of J. Barry Griswell(4) | |||
| 31.2 | Certification of Michael H. Gersie(4) | |||
| 32.1 | Certification Pursuant to Section 1350 of Chapter 63 of Title 18 of the United States | |||
| 32.2 | Certification Pursuant to Section 1350 of Chapter 63 of |
PRINCIPAL FINANCIAL GROUP, INC. TABLE OF CONTENTS
- PART I
Item 1. Business
- Item 1A. Risk Factors
- Item 1B. Unresolved Staff Comments
Item 2. Properties
Item 3. Legal Proceedings
Item 4. Submission of Matters to a Vote of Security Holders
PART II
Item 5. Market for Registrant's Common Equity, Related Stockholder Matters and Issuer Purchases of Equity Securities
- Item 6. Selected Financial Data
- Item 7. Management's Discussion and Analysis of Financial Condition and Results of Operations
U.S. Invested Assets Investment Income Yields by Asset Type
U.S. Invested Assets Fixed Maturity Securities by Type of Issuer
U.S. Invested Assets Fixed Maturity Securities by Credit Quality(1)
U.S. Invested Assets Corporate Fixed Maturity Securities by Salomon Industry
U.S. Invested Assets Fixed Maturity Securities Available-for-Sale by Industry Category
U.S. Invested Assets Fixed Maturity Securities Available-for-Sale by Industry Category
U.S. Invested Assets Fixed Maturity Securities Available-for-Sale by Quality
U.S. Invested Assets Fixed Maturity Securities Available-for-Sale by Quality
U.S. Invested Assets Unrealized Losses on Investment Grade Fixed Maturity Securities Available-for-Sale by Aging Category
U.S. Invested Assets Unrealized Losses on Investment Grade Fixed Maturity Securities Available-for-Sale by Aging Category
U.S. Invested Assets Unrealized Losses on Below Investment Grade Fixed Maturity Securities Available-for-Sale by Aging Category
U.S. Invested Assets Unrealized Losses on Below Investment Grade Fixed Maturity Securities Available-for-Sale by Aging Category
U.S. Invested Assets Unrealized Losses on Fixed Maturity Securities Available-for-Sale by Aging Category
U.S. Invested Assets Unrealized Losses on Fixed Maturity Securities Available-for-Sale by Aging Category
U.S. Invested Assets Problem, Potential Problem and Restructured Fixed Maturities at Carrying Amount
U.S. Invested Assets Commercial Mortgage Valuation Allowance
U.S. Invested Assets Problem, Potential Problem and Restructured Commercial Mortgages at Carrying Amount
International Invested Assets
- Item 7A. Quantitative and Qualitative Disclosures About Market Risk
Derivative Financial Instruments — Credit Exposures
- Item 8. Financial Statements and Supplementary Data
Condensed Consolidating Statements of Financial Position December 31, 2006
Condensed Consolidating Statements of Financial Position December 31, 2005
Condensed Consolidating Statements of Operations For the year ended December 31,
Condensed Consolidating Statements of Operations For the year ended December 31, 2005
Condensed Consolidating Statements of Operations For the year ended December 31, 2004
Condensed Consolidating Statements of Cash Flows For the year ended December 31, 2006
Condensed Consolidating Statements of Cash Flows (continued) For the year ended December 31, 2006
Condensed Consolidating Statements of Cash Flows For the year ended December 31, 2005
Condensed Consolidating Statements of Cash Flows (continued) For the year ended December 31, 2005
Condensed Consolidating Statements of Cash Flows For the year ended December 31, 2004
Condensed Consolidating Statements of Cash Flows (continued) For the year ended December 31, 2004
Condensed Consolidating Statements of Financial Position December 31, 2006
Condensed Consolidating Statements of Financial Position (continued) December 31, 2006
Condensed Consolidating Statements of Financial Position December 31, 2005
Condensed Consolidating Statements of Operations For the year ended December 31, 2006
Condensed Consolidating Statements of Operations For the year ended December 31, 2005
Condensed Consolidating Statements of Operations For the year ended December 31, 2004
Condensed Consolidating Statements of Cash Flows For the year ended December 31, 2006
Condensed Consolidating Statements of Cash Flows (continued) For the year ended December 31, 2006
Condensed Consolidating Statements of Cash Flows For the year ended December 31, 2005
Condensed Consolidating Statements of Cash Flows (continued) For the year ended December 31, 2005
Condensed Consolidating Statements of Cash Flows For the year ended December 31, 2004
Condensed Consolidating Statements of Cash Flows (continued) For the year ended December 31, 2004
- Item 9. Changes in and Disagreements with Accountants on Accounting and Financial Disclosure
Item 9A. Controls and Procedures
Item 9B. Other Information
PART III
Item 10. Directors,
Item 11. Executive Compensation
Item 12. Security Ownership of Certain Beneficial Owners and Management and Related
Item 13. Certain Relationships and Related Transactions, and Director Independence
Item 14. Principal
- PART IV
Item 15. Exhibits and Financial Statement Schedules
Schedule IV — Reinsurance As of December 31,
Exhibit Index