Use these links to rapidly review the documentCARREKER CORPORATION Index
Item 8. Financial Statements and Supplementary Data.
UNITED STATES
SECURITIES AND EXCHANGE COMMISSION
Washington, D.C. 20549
Form 10-K
| (Mark One) | |
ý | ANNUAL REPORT PURSUANT TO SECTION 13 OR 15(d) OF THE SECURITIES EXCHANGE ACT OF 1934 |
For the fiscal year ended January 31, | |
OR | |
o | TRANSITION REPORT PURSUANT TO SECTION 13 OR 15(d) OF THE SECURITIES EXCHANGE ACT OF 1934 |
For the transition period from to | |
Commission file number 0-24201
CARREKER CORPORATION
(Exact name of registrant as specified in its charter)
| Delaware (State or other jurisdiction of incorporation or organization) | 75-1622836 (I.R.S. Employer Identification No.) | |
4055 Valley View Lane #1000 Dallas, Texas 75244 (Address of principal executive offices) | 75244 (Zip Code) |
Registrant's telephone number, including area code:(972) 458-1981
SECURITIES REGISTERED PURSUANT TO SECTION 12(b) OF THE ACT:
None
SECURITIES REGISTERED PURSUANT TO SECTION 12(g) OF THE ACT:
Common Stock, par value $0.01 per share
(Title of class)
Indicate by check mark if the registrant is a well-known seasoned issuer, as defined in Rule 405 of the Securities Act. Yes o No ý
Indicate by check mark if the registrant is not required to file reports pursuant to Section 13 or Section 15(d) of the Exchange Act. Yes o No ý
Indicate by check mark whether the registrant (1) has filed all reports required to be filed by Section 13 or 15(d) of the Securities Exchange Act of 1934 during the preceding 12 months (or for such shorter period that the registrant was required to file such reports), and (2) has been subject to such filing requirements for the past 90 days. Yes ý No o
Indicate by check mark if disclosure of delinquent filers pursuant to Item 405 of Regulation S-K is not contained herein, and will not be contained, to the best of registrant's knowledge, in definitive proxy or information statements incorporated by reference in Part III of this Form 10-K or any amendment to this Form 10-K. o
Indicate by check mark whether the registrant is a large accelerated filer, an accelerated filer, or a non-accelerated filer. See definition of "accelerated filer and large accelerated filer" in Rule 12b-2 of the Exchange Act. (Check one)
Large Accelerated Filer o Accelerated Filer ý Non-Accelerated Filer o
Indicate by check mark whether the registrant is an accelerated filera shell company (as defined in Rule 12b-2 of the Exchange Act Rule 12b-2)Act). Yes ýo No oý
The aggregate market value on July 31, 20042005 of the voting and non-voting common equity held by non-affiliates of the registrant was $202,239,992.$130,729,257.
Number ofThere were 25,328,615 shares of registrant'sour Common Stock, par value $0.01 per share, outstanding as of March 31, 2005: 24,859,5032006.
DOCUMENTS INCORPORATED BY REFERENCE
Selected portions of the registrant'sour definitive Proxy Statement for the 20052006 Annual Meeting of Stockholders are incorporated by reference into Part III hereof.
Index
| | | ||
|---|---|---|---|
| PART I: | |||
| Item 1. | Business | ||
| Item 1A. | Risk Factors | ||
| Item 1B. | Unresolved Staff Comments | ||
| Item 2. | Properties | ||
| Item 3. | Legal Proceedings | ||
| Item 4. | Submission of Matters to A Vote of Security Holders | ||
PART II: | |||
| Item 5. | Market for Registrant's Common Equity, Related Stockholder Matters and Issuer Purchases of Equity Securities | ||
| Item 6. | Selected Financial Data | ||
| Item 7. | Management's Discussion and Analysis of Financial Condition and Results of Operations | ||
| Item 7A. | Quantitative and Qualitative Disclosures about Market Risk | ||
| Item 8. | Financial Statements and Supplementary Data | ||
| Item 9. | Changes in and Disagreements with Accountants on Accounting and Financial Disclosure | ||
| Item 9A. | Controls and Procedures | ||
| Item 9B. | Other Information | ||
PART III: | |||
| Item 10. | Directors and Executive Officers of the Registrant | ||
| Item 11. | Executive Compensation | ||
| Item 12. | Security Ownership of Certain Beneficial Owners and Management and Related Stockholder Matters | ||
| Item 13. | Certain Relationships and Related Transactions | ||
| Item | Principal | ||
PART IV: | |||
| Item 15. | Exhibits and Financial Statement Schedules | ||
SIGNATURES | |||
Unless the context otherwise requires, the term "we," "us," "our," "Company," "Carreker," or "Carreker Corporation" when used in this Form 10-K ("Report") and in the Annual Report to the Stockholders refers to Carreker Corporation, a Delaware corporation organized in 1998, and its consolidated subsidiaries and predecessors. Our Internet Website address iswww.Carreker.com. www.Carreker.com. Our annual reports on Form 10-K, quarterly reports on Form 10-Q, current reports on Form 8-K, and amendments to such reports are available, free of charge, on our Internet Website under "Investor Relations (IR)—SEC Filings" as soon as reasonably practicable after we file electronically such material with, or furnish it to, the United States Securities and Exchange Commission, or SEC. Information on our Internet Website does not constitute a part of this Report. This Report contains some forward-looking statements within the meaning of the federal securities laws. When used in this Report, the words "expects," "plans," "believes," "anticipating," "estimates," and similar expressions are intended to identify forward looking statements. Actual results and the timing of some events could differ materially from those projected in or contemplated by the forward looking statements due to a number of factors, including without limitation those set forth under "Forward Looking Statements and Risk"Risk Factors" below.
Our Business Focus
For the last 2728 years Carreker Corporation has designed, developed, sold and delivered payments-related software and consulting solutions to financial institutions and financial service providers. More recently, we have introduced a business process outsourcing solution to our customers. Our products and services address a broad spectrum of payment activities and are designed to help our clients enhance the performance of their payments businesses; improve operational efficiency in payments processing; enhance revenue and profitability from payments-oriented products and services; reduce losses associated with fraudulent payment transactions; facilitate compliance with risk-related laws and regulations; and/or maximize clients' customer income streams by aligning their customer interactions and products with customer needs.
We are organized into three primary operating divisions: Global Payments Technologies ("GPT"), Revenue Enhancement ("RevE") and Global Payments Consulting ("GPC"). These operating divisions are operated in discrete yet synergistic ways to bring value to our clients. In addition we have established As of January 31, 2006, Carreker employed a joint venture named Carretek LLC to address the payments outsourcing arena.total of 495 employees.
Products and Services
The products and services of our three primary operating divisions are described below in this sequence: Global Payments Technologies ("GPT"), Revenue Enhancement ("RevE") and, Global Payments Consulting ("GPC") and Carretek LLC ("Carretek").
Global Payments Technologies Solutions. Carreker's technology solutions help financial institutions address the needs of some critical payment services and delivery functions that impact overall operating revenues and costs and risk management. These functions include presentment of checks in paper and electronic form, identification and mitigation of fraudulent payments, handling irregular items such as checks returned unpaid (exceptions), maintaining a record of past transactions (archiving), responding to related customer inquiries (research), and correcting any errors that are discovered (adjustments). Global Payments Technologies ("GPT") solutions address these and other key functions in the context of improving operational efficiency and a gradual transition from paper to electronic-based payment systems. In addition,GPT offers Risk Management solutions that mitigate depository account risk through profiling and advanced analytics technology. GPT Risk solutions leverage transaction monitoring and filtering capabilities for AML and OFAC compliance. Finally, we offer technology solutions that optimize the inventory management of a bank's cash stock levels and logistical service requirements, including managing how much is needed, when it is needed and where it is needed. Our solutions reduce the amount of cash banks need to hold in reserve accounts and as cash-on-hand while ensuring a high level of customer service through timely replenishment of ATM cash supplies at minimal logistical services cost.
Specific solutions in the GPT group include:
| Solution | Description | Products Offered | ||
|---|---|---|---|---|
| Risk Solutions: | ||||
Fraud Mitigation and Anti-Money Laundering Compliance | Automated fraud detection and prevention solutions that reduce incidents of check fraud, deposit fraud, check kiting, and electronic fraud. Anti-money laundering solutions screen names and related data against industry blacklists, local high-risk lists and other customized databases. | FraudLink On-Us, FraudLink Deposit, FraudLink Deposit—Branch Access Option, Kite, FraudLink Positive Pay, FraudLink eTracker, FraudLink ACHeCK, FraudLink PC, | ||
Payment Solutions: | ||||
Management | Products that bring new efficiencies to back-office operations through leading-edge image, workflow, and RECO (character recognition) technologies. | Adjustments/Express, Exceptions/Express, Express Capture, Express Decision, Input/Express, Inbound Returns/Express, and All Transactions File | ||
Remittance and Payments Processing | Both host and client/server-based platforms for improved productivity in processing retail and wholesale remittance transactions for financial institutions and payments processing for a wide variety of cross-industry applications. | NeXGen Remittance | ||
Conventional Check Capture | An extensive array of enhancement products that add flexibility and usability to IBM's Check Processing Control System (CPCS) and the IBM 3890/XP series of Document Processors. | Conventional Capture Products, CPCS Enhancements Products, XP/Productivity Tools, Platform Emulation, NeXGen Settlement, NeXGen Balancing, and LTA (Large Table Access) | ||
Check Image Capture | Products and services related to the centralized and distributed capture, quality and inspection assurance, storage and delivery of check images. Distributed capture solutions come in web-based thin client and thick client. Distributed capture branch solution serves as core component to full bank branch image enablement. | ALS & CIMS Products (MVS, AIX, Windows), NeXGen Image Processor, Image Enhancement Products, Reject Repair, RECO Technology, Image POD, Image Delivery Products, Delivery Express QAS Image Inspector, NeXGen Capture, Source Capture Web, Source Capture Corporate and Source Capture Branch | ||
Check Image Archive Management | Comprehensive array of check image archive management products that may be tailored to a bank's unique requirements based on their operational environments and volumes. Carreker offers archive technology for both in-house solutions and shared outsource providers. | Check Image Archive-AIX, Check Image Archive-MVS, Check Image Archive Load | ||
Other Check Image Applications | An array of solutions that address revenue enhancement, risk reduction, and expense reduction issues through the application of image, workflow and RECO technologies. | Image Statements, CDRom Delivery, Input/Express, Express Capture, Payee Name Verification, and Amount Encoding Verification | ||
Receive Sentry and Trackpoint | ||||
eMetrics | Performance-measurement software suite that uses historical data to generate key performance indicators, item processing volume data, productivity statistics and quality control benchmarks. | Lumen, ProModel, eiMICR, eiStats, eiQuality, eiPerform | ||
Electronic Check Presentment and Image Exchange | Enables banks to transition from paper-based to electronic payment systems by automating key elements of the processing stream, creation of image replacement documents ("IRD") Aided by Check 21 legislation, these solutions are designed to reduce and eventually eliminate the movement of paper payments through the system, improving productivity, reducing errors, increasing customer satisfaction and reducing fraud. | ExchgLink, IRD Create, IRD Author, Image Inspector, CheckLink, CheckLink PC, Deposit Manager, Branch Truncation Manager and Cnotes | ||
Cash & Cash Logistic Solutions: | ||||
ATM Solutions | Advanced ATM monitoring and management, improving ATM availability and ensuring service levels are met. These solutions include an automated ATM monitoring and dispatching system for maximizing network availability; and a real-time Internet-based system for efficient handling of ATM service requests and responses. | eiManager, | ||
Cash Solutions | A product suite, now optimized through Web-based software solutions, that dramatically reduces the amount of cash banks, financial institutions and companies need to hold as cash-on-hand throughout vault, branch and ATM networks. These solutions also enable automation and standardization of the cash ordering process and optimization of transportation. Consulting solutions can drive further efficiency and automation in vault, branch and ATM operations. | iCom, ReserveLink, |
Revenue Enhancement. The Revenue Enhancement division includes two business units: RevE and Customer Value Enhancement ("CVE"RevE"), formerly known as EnAct. RevE is a highly specialized division that provides consulting services focused on tactical methods of increasing banks' fee income. The scope and depth of this practice has expanded throughout its 14 year history and now includes retail, small business, and commercial deposits, treasury management, consumer and commercial lending, credit card lending and trust and investment services. Our solutions involve developing strategies that enable our clients to take advantage of electronification trends, often gaining first mover advantages for our clients. In addition to developing strategies, our business model ensures that we continue to translate those strategies into tactical implementations with measurable revenue streams. Our client base has continued to expand with very high penetration rates in the markets in which we operate. Thus, we have experienced a trend of becoming longer term strategic partners with our clients.
Another component of our Revenue EnhancementRevE offering is our CVE solutions that includes EnActinclude software, proprietary sales management methodologies and sales training programs. Our CVE solutions assist financial institutions in leveraging central intelligence with local insight.insight, translating strategy into specific actions to achieve sustained organizational performance. This enables our clients to recognizeimprove their identification of those customers and prospects representing the greatest value or potential.potential, while aligning internal processes and behaviors with management's focus. Our approach is unique and complementary to many CRM investments that banks have made in recent years and is designed to focus their activities such that they can actually attain increased returns on these CRM investments.
Global Payments Consulting. Our Global Payments Consulting (GPC)("GPC") division helps financial institutions proactively plan, prepare and optimize for the regulatory, competitive and technological impacts affecting the financial payments environment. The division provides strategic planning, program management, specialized tools, business applications and implementation advisory services for financial institutions and otherspecialized payments clients. These planning and implementationThe focus areas for these services include:
The GPC division also contains the license, maintenance and services revenue of our for two product areas:
Outsourcing. Carretek LLC is a transformational business outsourcer for payment and transaction processing jointly owned by Carreker Corporation (51%) and Majesco Software Inc. (49%), the U.S. subsidiary of Mastek Limited, a leading Indian outsourcing company with global operations. Carretek was formed in fiscal 2003. While the venture has signed its first contract, it is still in the developmental phase and its results are contained in the Corporate-Unallocated business segment.
Carretek's mission is to enable financial institutions and their processors to realize the benefits of transformational offshore-centric outsourcing ("offshoring") of their business processes. The benefits to
clients could include reduction in operating costs, improvements in productivity, and enhancement of quality.
Initially, Carretek is focused on offshoring payments-related business processes. Through Carretek, financial institutions can leverage the global work force at this critical period when Check 21 and other payment electronification trends are pressuring financial institutions to reduce their payment per item costs beyond the power of traditional cost management practices. Carretek has designed and built specific product offerings targeted at payment and transaction processing functions for this express purpose. Within this area of expertise, the Carretek offering includes a flexible array of offshore outsourcing services to financial institutions.
The Carreker Solution
The products and services offered by our divisions are designed to address our clients' needs to adapt to an ever-changing landscape in the payments businesses for financial institutions. These solutions combine consulting and professional services with software applications to enable financial institutions to identifydesign and implement payment solutions, increase revenues, reduce costs and enhance delivery of customer services. The key characteristics of our solutions include:
Integrated and Consultative Approach. We combine our consulting expertise and software applications to serve as a single-source provider of fully-integrated payments solutions. This approach sets us apart from providers of partial solutions that require financial institutions to seek multiple solution providers and costly additional expertise or implementation services to attain a complete solution. By offering this integration, we can streamline the buying decisions, simplify the implementation efforts and accelerate results when compared to a multiple supplier approach.
Comprehensive Delivery Model. We deliver our software and consulting solutions in a variety of delivery models to meet our clients' specific needs. These delivery methods include strategic stand-alone consulting, traditional software licensing and associated consulting,professional services, third party web-hosting and licensing software for use by multiple banks in a shared operating environment. Our ability to deliver products and services in a variety of methods allows us to provide solutions to a wider range of clients.
Compelling Business Proposition for Clients. Our solutions reduce investment risk for our clients by increasing revenues or reducing costs in a concrete and measurable way and in a relatively short period of time. In addition, in appropriate circumstances, we value-price certain of our solutions, whereby we receive a percentage of the amount of additional revenues or reduced costs achieved by the customer. These arrangements allow banks to fund their investments in our solutions with the benefits derived from their implementation.
Broad Array of Services and Technology. We believe that ourOur offerings provide the broadesta broad footprint of solutions from a single supplier of payments solutions into the banking industry. This array of products enables us to provide a financial institution with a very targeted solution for a narrow area of its operations or to address a broad range of its operational requirements.
Carreker's direct market is the financial services industry. Within that huge sector, we focus mainly on large banks and mainly in the U.S. However, our market also includes:
At present, we serve all of the top 20 banks in the U.S., plus 75 of the next 100 banks, and many smaller banks. We also serve the six largest financial institutions in Canada, 75% of the largest banks in the UK, the four largest in the UK, the two largest in Ireland, the fivesix largest in Australia and New Zealand, and three of the four largest in South Africa. We have a smalleran emerging presence in other European and Latin American countries.
Most of the major bank processing companies are our clients, and we have alliance and/or reseller relationships with many of them to maximize distribution of our products and services.
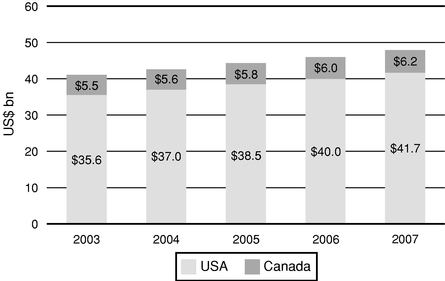
Banks are expected to continue spending heavily on Information Technology ("IT") this year. TowerGroupyear as indicated in the chart below.
IT Spending By North American Banks
Source: A North American Perspective: IT Spending at U.S. and Canadian Banks—Celent both forecast approximately a four percent increase. According to Celent, "Areas such as security, payments, multi-channel integration, and branch automation will be highlighted in 2005, as banks push towards increasing strategic investments in new technology."(February 2005)
Significant new regulatory, competitive, technological, human capital and behavioral forces are acting on the payments industry now in ways that seem likely to impact virtually all participants in this market space. The forces include the following:
Regulatory Change. There are a number of legislative and regulatory changes impacting the form, structure, process and controls around paper, electronic and currency-based financial payments. We believe financial institutions around the world will need to invest in the understanding, planning and implementation activities related to these changes. Three of the more important areas of legislative/regulatory changeschange to note are as follows:
credit risk and to introduce explicit treatment of operational risk. These changes will stipulate significant new capital and operational risk management requirements for banks. Whether in terms of new redundancy requirements for payments infrastructure or new business continuity practices for banks, we believe additional opportunities to leverage our technology and our operations consulting expertise may result from banks' efforts to achieve compliance.
Disintermediation of the Financial Institution.Institution Role in Payments. We believe the market share of financial institutions in the payments business has been declining over the last 20 years as new non-bank providers offer a competitive alternativealternatives to banks as financial intermediaries. We believe financialFinancial institutions are intimately aware of this trend and its implications on the positioning offor their client relationship,relationships, their value proposition,propositions, their revenues and their profits. We believe these financialFinancial institutions are and will be developing and executing strategies to protect and expand their market share of the payments business by investing in new value propositions, new products and new services in various payment arenas.
Convergence of Payment Vehicles. We believe that the front-end and the back-end of the presentment, processing and settlement aspects of the paper and electronic payment types will converge driven by customer demand and delivery efficiency. Although we believe the total number of payment transactions will increase for the foreseeable future, we believe paper-based payments will decline in number with the increase in electronic payments more than offsetting this decline. We believe over time the systems and operations infrastructure for payments, which is in silos today by payment type, will tend to converge and result in next generation payment technologies that will need to be developed. These technologies will be more real-time than traditional batch technologies. Straight through processing service offerings will be specifically tailored to communities of interest (e.g. casinos, healthcare or small retail) and payment related information services (e.g. loyalty programs and cross-sell programs) will be developed.
Mergers and Consolidations. Mergers and consolidations of financial institutions have been on the rise in the US recently. We believe these mergers will result in significant investments in business, system and operations integration for long-term shareholder value. We believe consulting and software solutions supporting the integration activities of the surviving financial institutions will be important offerings in the future.
Electronification. Technologies for electronification of check workflows continue to be refined and to gain further industry adoption. Many of our key customers are defining strategies now for the electronification of checks at the earliest point of receipt and for exchanging images between banks as a basis for financial settlement. Such practices would significantly reduce check-related operating expenses for banks and position banks to deliver more robust payment services to their customers. We believe we are positioned, through our broad suite of check imaging products, to benefit from the continued adoption of check imaging.
At the same time, practices are emerging for conversion of checks at the point of sale or at lockbox processing locations to alternative electronic payment types, such as ACH or debit transactions. In these cases, transactions are less likely to be processed through Carreker's current suite of technology solutions. We are developingcontinuing our development of enhancements to selected products that will address these electronic payment types.
As a third point, integration Integration between banks and the point of salepayment transaction or origination will increasingly lead to more real time verification and guarantee of transactions at the point of sale.payment
transactions. We are engaged now with key customers and partners in trying to define next-generation fraud mitigation solutions, and see this as an area of opportunity for technology growth.
Importance of Fraud/Risk Mitigation. We believe transaction fraud losses have continued to increase for financial institutions and their customers as electronic payment vehicles have grown in
availability and adoption. Further, we believe compliance costs and penalties for non-compliance with new regulations designed to mitigate global risks through controls on electronic and currency-based financial transactions will continue to increase. We believe significant investments in processes, procedures and technologies will continue to be made to detect and prevent fraud losses and improve compliance, while minimizing the intrusion of controls on customer activities.
Convergence of Payment Vehicles. We believe that the front-end and the back-end of the presentment, processing and settlement aspects of the paper and electronic payment types will converge, driven by customer demand and delivery efficiency. We believe paper-based payments will decline in number, and that the increase in electronic payments will more than offset this decline. We believe that over time the separate systems and operations for different payment types will tend to converge and result in next generation payment and synergistic technologies yet to be developed. These technologies will be more real-time than traditional batch technologies. Straight through processing service offerings will be specifically tailored to communities of interest (e.g. casinos, healthcare or small retail), and payment related information services (e.g. loyalty programs, spend management and cross-sell programs) will be developed.
Globalization of Payments Work. As the important work of processing payments becomes more electronic, the opportunities for financial institutions to leverage workforces around the world to achieve cost and quality advantages will proliferate.proliferate, and we have demonstrated expertise and success in this arena. We believe financial institutions will gradually at first, and more rapidly later, source and process components of their payments work in secure, low cost countries around the globe. We are already seeing a significant growth in the awareness of the importance of strategic sourcing and a lessening of the social and political obstacles to offshoring.
Customers
A majority of our revenues are generated from contracts with banks maintaining assets in excess of $5.0 billion. We currently provide services or products to each of the 20 largest banks in the United States,U.S., as measured by total assets by Sheshunoff Information Services. Our five largest customers accounted for approximately 31%36%, 28%31% and 34%28% of total revenues during the fiscal years ended January 31, 2006, 2005 2004 and 2003,2004, respectively. Wells Fargo accounted for approximately 13% of total revenues during the year ended January 31, 2006, and accounted for approximately 14% of total revenues during the year ended January 31, 2005. No single customer accounted for more than 10% of total revenues during the year ended January 31, 2004. U.S. Bank, N.A. accounted for approximately 10% of total revenues during the year ended January 31, 2003. Please see Note 11 of our Notes to Consolidated Financial Statements for further information about our non-U.S. customers.customers and markets.
Solutions Development
Our solutions development activities focus on identifying specific bank and end user needs and the shared needs of the banking industry, prototyping and developing promising applications, test marketing new products, developing sales strategies and coordinating distribution and on-going maintenance for each of our solutions. In certain instances, we have contracted with third party software development companies to develop our solutions.
We frequently receive customer requests for new services and/or software. We strive to develop solutions in response to these requests and historically have been able to partner with our customers and share some or all of the development costs. In addition to customer-funded solutions development,
we have invested significant amounts in solutions development, including expenditures (inclusive of amounts capitalized) of $10.4 million, $11.2 million, $8.5 million, and $11.4$8.5 million for research and development in the years ended January 31, 2006, 2005 2004 and 2003,2004, respectively. Further, some of our key product introductions have resulted from the adaptation of products developed for customers to address a wider market. In exchange for either a one-time payment and/or on-going royalties, we are often able to obtain the right to develop, enhance and market these modified products.
Technology
Our software products incorporate open systems architecture and protocols to provide scalability and functionality to interface with a bank's current and legacy systems. Our core proprietary technologies, for both our client/server and mainframe software products, are primarily directed at using a standard set of components, drivers, and application interfaces, andwhile leveraging the quality and productivity benefits of reusable component development.
Many of our newer products operate on Windows or Unix platforms, support industry-standard Web browsers such as Microsoft Internet Explorer and AOL Netscape, and databases such as Oracle, DB2, or SQL, and can be delivered as an Application Service Provider ("ASP") or standard packaged product.
We continue to enhance our second-generation computer systems, which are primarily IBM mainframe-based or client server applications, and use common computer tools to integrate the data from these computer programs into our new products.
Sales and Marketing
We have developed strong relationships with many senior bank executives as a result of our delivery of solutions to many of the largest banks in the United States for over 2728 years. As of January 31, 2005, we had 14We leverage an Account Relationship Managers who are responsiblemodel for managing our day-to-daylargest customer relationships with our customers. 13 are responsible forin North American bank relationships, and 1 is responsible for the International bank relationships.America. Our Account Relationship Managers' responsibilities include identifying customers' needs and assisting our business unit teams in presenting their solutions and concluding sales. Our Account Relationship Managers work closely with our executive officers, some of whom serve as Executive Relationship Managers to our customers. We also employ applicableleverage business segmentunit sales and technical sales support staff, who are familiar with our technology and who participate in opportunitiesspecific solutions to sell technology-based solutions.drive the bulk of the respective solutions sales process.
We derive a significant portion of our business through existing customers and customer referrals. In addition, we market our services through a variety of media, including:
AsBacklog
At the end of January 31,fiscal 2005, we employedour backlog was $63.6 million, including deferred revenues of $19.2 million. At the end of fiscal 2004, our backlog was $63.2 million, including deferred revenue of
$24.2 million. We do not believe that backlog is a marketing staffmeaningful indicator of 8 individuals, including graphics designers, writers, administrative coordinatorssales that can be expected for any period, and a Web master.there can be no assurance that backlog at any point in time will translate into revenue in any subsequent period.
Competition
We operate in a highly competitive and rapidly changing global marketplace and compete with a variety of organizations that offer products and services competitive with those we offer. In our consulting and revenue enhancement businesses our clients retain us on a non-exclusive basis. In addition, a client may choose to use its own resources rather than engage us for these consulting services. Our competitors in the consulting business space include strategic consulting firms and full-service consulting services, as well as niche consulting providers. Increasingly, the global information technology service firms are offering a full range of consulting services. Further, the niche financial institution processing companies are increasingly creating and offering consulting services as an additional value-added service to their IT processing offerings. In the Revenue Enhancement business our competitors are almost exclusively niche providers that are typically small and medium-sized private organizations. However, we also face competition from bank internal revenue enhancement departments. In our Carretek business line, we primarily compete against large global outsourcing providers and our customers' internally built and operated alternatives.
In our global payments technology business segment, our competitors are generally the global information technology service firms and the smaller niche application providers. In each of our major software product suites a range of competitors exists. The global IT services firms compete in some of our software product suites. At the same time, differing groups of application and niche application
competitors focus on one or more of our other product suites. Some of these competitors have significantly greater financial, technical, marketing and other resources than we do.
In addition to competing with a variety of third parties, we experience competition from our customers and potential customers when they develop, implement and maintain their own services and applications. In addition, customers or potential customers could enter into strategic relationships with one or more of our competitors to develop, market and sell competing services or products.
Government Regulation
Our primary customers are banks. Although the services we currently offer have not been subject to any material industry-specific government regulation, the banking industry is heavily regulated. Our products and services must allow our banking customers to comply with all applicable regulations, and as a result, we must understand the intricacies and application of many government regulations. The regulations most applicable to our provision of solutions to banks include regulations governing information and data security of customer accounts, establishing minimum reserve requirements, governing funds availability and the collection and return of checks, and establishing rights, liabilities and responsibilities of parties in electronic funds transfers. For example, some of our consulting services assist banks with minimizing their reserves while complying with requirements of the Board of Governors of the Federal Reserve System ("Federal Reserve"). In addition, the expedited availability and check return requirements imposed by funds availability regulations have increased fraud opportunities dramatically, and our Global Payments Technologies products and services address this concern while complying with such regulations.
While we are not directly subject to the federal orand state regulations specifically applicable to financial institutions, such as banks, thrifts and credit unions, the Federal Reserve, the Federal Deposit Insurance Corporation, the National Credit Union Administration, the Office of Thrift Supervision, the Office of the Comptroller of the Currency, and various state regulatory authorities typically assert the right to observe the operations of companies to which certain functions of financial institutions (such as data processing) are outsourced. These regulators may from time to time also claim the right to observe the operations of
companies like us that provide software and other products or services to financial institutions. In addition, financial institutions with whomwhich we do business may from time to timeoften require, by contract or otherwise, that evaluations of our internal controls be performed by independent auditors or by the financial institutions themselves.
Proprietary Rights
We rely upon a combination of patent, copyright, trademark and trade secret laws, including the use of confidentiality agreements with employees, independent contractors and third parties and physical security devices to protect our proprietary technology and information. We have a number of issued patents and registered trademarks and have filed applications for additional patents and trademarks in the United States. We defend our proprietary rights.
We enter into invention assignment and confidentiality agreements with our employees and independent contractors and confidentiality agreements with certain customers. We also limit access to the source codes for our software and other proprietary information. We believe that due to the rapid pace of innovation within the software industry, factors such as the technological and creative expertise of our personnel, the quality of our solutions, the quality of our technical support and training services and the frequency of release of technology enhancements are important to establishing and maintaining a technology leadership in addition to the various legal protections available for our technology.
We are not aware that we are infringing on any proprietary rights of third parties. We rely upon certain software that we license from third parties, including software that is integrated with our internally developed software and used in our solutions to perform key functions. We are not aware
that any third-partythird party software being re-sold by us is infringing upon proprietary rights of other third parties.parties and have proper indemnities in place to mitigate our risk.
Employees
As of January 31, 2005,2006, we had 541495 employees. Of theseThese employees 106 provided consultingare broken down into the following categories: Global Payments Technologies ("GPT") had 284 employees, Revenue Enhancement ("RevE") had 86 employees, Global Payments Consulting ("GPC") had 23 employees, Carretek had 2 U.S. based employees (along with 121 offshore personnel of Mastek Limited that perform services 212 provided technologyfor Carretek on a contract basis), Corporate Sales and implementation functions, 114 performed salesMarketing had 18 employees, and marketing, product management, customer relationsCorporate Staff which includes Executive Management, Legal, Finance and business development functionsAccounting, Human Resources, Facilities and 109 persons performed corporate, finance and administrative functions.IT had 82 employees. We have no unionized employees, and we believe that our employee relations are good.
Executive Officers of the Company
The following table sets forth information regarding the Company's current executive officers.
| Name | Age | Position | ||
|---|---|---|---|---|
| John D. Carreker, Jr. | Chairman of the Board, President, Chief Executive Officer and Director | |||
| Lisa K. Peterson | Executive Vice President, Treasurer and Chief Financial Officer | |||
| John D. Carreker III | Executive Vice President and President, Global Payments Technologies | |||
| Executive Vice President, | ||||
| Suzette L. Massie | Executive Vice President and President, Global Payments Consulting | |||
| Blake A. Williams | Executive Vice President and President, Revenue Enhancement | |||
John D. Carreker, Jr. has served as Chairman of the Board of Directors and Chief Executive Officer since the Company's formation in 1978. John D. Carreker, Jr. and James D. Carreker, a director of the company, are brothers. John D. Carreker III is the son of John D. Carreker, Jr.
Lisa K. Peterson has served as Executive Vice President, Treasurer and Chief Financial Officer since October 2003. From August 1999 to February 2003, Ms. Peterson served as Chief Financial and Administrative Officer for Monarch Dental Corporation, a dental group practice management company. Prior to that time, Ms. Peterson served as Chief Financial Officer for Viacom Retail Stores, Inc., a start-up division of Viacom, Inc. For the six years prior to that time, Ms. Peterson worked for Pearle Vision, Inc. in various capacities culminating in the position of Vice President and Controller.
John D. Carreker III has served as Executive Vice President and President, Global Payments Technologies since November 2002. Since June 1991, Mr. Carreker has served in various management positions with the Company. John D. Carreker III is the son of John D. Carreker, Jr. and the nephew of James D. Carreker.
Michael J. InmanJohn S. Davis has served as Executive Vice President, General Counsel and Secretary to the Company since June 2005. From June 2004 to June 2005, Mr. Davis was engaged in private legal practice. Prior to that time, he served as Senior Vice President and General Counsel of Relationship Management since September 2002Dave & Busters, Inc., a restaurant and entertainment company for three years, and as Vice President & General Counsel of Cameron Ashley Building Products, Inc., a corporate officer since December 2004.building products distributor, for seven years. Prior thereto, Mr. Inman has been with the Company for ten years in various management and consulting roles.Davis served as Associate General Counsel of Electronic Data Systems Corporation ("EDS"), a global information technology service company.
Suzette L. Massie has served as Executive Vice President and President, Global Payments Consulting since December 2004. ForDuring the last five years,year period prior to joining the Company, Ms. Massie was a partner with Accenture, a global management consulting company in the Financial Services practice focusing on Top 20 Banks in the U.S.
Robert M. Olson, Jr. has served as Executive Vice President since July 1998 and as President and CEO of Carretek since October 2004.
Blake A. Williams has served as Executive Vice President and President, Revenue Enhancement since November 2002. Mr. Williams has been with the Company for 14 years in various management and consulting roles.
Forward Looking Statements Statements in this Report and the Annual Report to the Stockholders that are not purely historical facts including statements about our expected future financial position, sales, results of operations, cash flows or backlog as well as other statements including words such as "anticipate," "believe," "plan," "estimate," "expect," "intend," "should," "could," "goal," "target," "designated," "on track," "comfortable with," "optimistic" and other similar expressions, constitute forward looking statements within the meaning of Section 27A of the Securities Act of 1933, as amended, and Section 21E of the Securities Exchange Act of 1934, as amended. Actual results and the timing of some events could differ materially from those projected in or contemplated by the forward looking statements due to a number of factors, including, without limitation, those set forth below and elsewhere in this Report. Readers are cautioned not to place undue reliance on forward looking statements, for no assurances can be given with respect to any forward looking statements. In addition to the other information in this Report, the following factors, which may affect our current position and future prospects, should be considered carefully in evaluating us and an investment in our common stock. We desire to take advantage of the "safe harbor" provisions of the Private Securities Litigation Reform Act of 1995. Many of the following important factors discussed below have been discussed in our prior filings with the Securities and Exchange Commission. In addition to the other information in this report, readers should carefully consider that the following important factors, among others, in some cases have affected, and in the future could affect, our actual results and could cause our actual consolidated results of operations for the fiscal year ending January 31, 2007 (and the individual fiscal quarters therein) and beyond, to differ materially from those expressed in any forward-looking statements made by us, or on our behalf. Risks Related to Our Business Our performance depends on the banking industry, and any change in the banking industry's demand for our solutions could reduce our revenues and have a material adverse effect on our business. We derive substantially all of our revenues from solutions provided to banks and other participants in the banking industry. Accordingly, our future success significantly depends upon this industry's continued demand for our solutions. We believe that an important factor in our growth has been substantial changes in the banking industry in recent years, as manifested by continuing consolidation, regulatory change, technological innovation, the emergence of the Internet and other trends. If this environment of change were to slow, we could experience reduced demand for our solutions. In addition, the banking industry is sensitive to changes in economic conditions and is highly susceptible to unforeseen events, such as domestic or foreign political instability, recession, inflation or other adverse occurrences that may result in a significant decline in the utilization of bank services. Furthermore, due to concerns regarding data security and other factors, banks have been and may in the future be Our future success depends on our ability to develop and license new technologies and services to meet the changing needs of our current and future customers, and our inability to introduce new solutions could negatively impact our ability to do business and maintain our financial condition. We regularly undertake new projects and initiatives in order to meet the changing needs of our customers. In so doing, we invest substantial resources with no assurance of their ultimate success. We believe our future success will depend, in part, upon our ability to: There can be no assurance that future advances in technology will be beneficial to, or compatible with, our business or that we will be able to incorporate such advances into our business. In addition, keeping abreast of technological advances in our business may require substantial expenditures and lead-time. There can be no assurance that we will be successful in using new technologies, adapting our solutions to emerging industry standards or developing, introducing and marketing solution enhancements or new solutions, or that we will not experience difficulties that could delay or prevent the successful development, introduction or marketing of these solutions. If we incur increased costs or are unable, for technical or other reasons, to develop and introduce new solutions or enhancements of existing solutions in a timely manner in response to changing market conditions or customer requirements, our business, financial condition and results of operations could be materially and adversely affected. Our inability to respond to a decline in check volumes and to respond to rapid technological change or changes in industry standards could reduce our revenues and have a material adverse effect on our business. We have in the past derived a significant portion of our revenues from check related products and services. A decline in check volumes could have a material adverse effect on our business. If banks and merchants decide to use pricing incentives to further stimulate a decline in check usage, this decline in usage could accelerate. Our future success depends on our ability to leverage existing competencies to support emerging payments types, and to define and develop new solutions addressing those payment types. If we are unable to capitalize on these competencies to generate new revenues to offset any loss of revenues arising as a result of a decline in check usage or other changes in technology or industry standards, then our business could be adversely affected. Our quarterly operating results fluctuate and may not accurately predict our future performance. Additionally, our fixed costs may lead to operating results below analyst or investor expectations if our revenues are below anticipated levels, which could adversely affect the market price of our common stock. A significant percentage of our expenses, particularly personnel and facilities costs, are relatively fixed and based in part on anticipated revenue levels. In recent years, we experienced a decline in revenues with certain of our licensed software products and consulting offerings. A decline in revenues without a corresponding and timely reduction in expenses would negatively affect our business. Significant revenue shortfalls in any quarter may cause significant declines in operating results since we may be unable to reduce spending in a timely manner. Our quarterly results of operations have varied significantly and probably will continue to do so in the future as a result of a variety of factors, many of which are outside our control. These factors include: As a result of these factors, our quarterly revenues and operating results are difficult to forecast. It is possible that our future quarterly results of operations from time to time will not meet the expectations of securities analysts or investors, which could have a material adverse effect on the market price of our common stock. Our mix of products and services could have a significant effect on our results of operations and the market price of our common stock. The gross margins for our products and services vary considerably. If our mix of products and services in any given period does not match our expectations, our results of operations and the market price of our common stock could be significantly affected. Although a material portion of our revenue comes from annually renewable maintenance agreements, we do not typically enter into long-term agreements with our customers, which makes it more difficult to plan and efficiently allocate our resources, and any deferral, modification or cancellation of a customer project can adversely affect our operating results. We typically provide services to customers on a project-by-project basis without long-term agreements. When a customer defers, modifies or cancels a project, we must be able to rapidly re-deploy our personnel to other projects in order to minimize the under-utilization of our personnel and the resulting adverse impact on operating results. In addition, our operating expenses are relatively fixed and cannot be reduced on short notice to compensate for unanticipated variations in the number or size of projects in progress. As a result, any delay, modification or cancellation of a customer project, or any disruption of our business relationships with any of our significant customers or with a number of smaller customers could have a material adverse effect on our business, financial condition and results of operations. Additionally, if we do not successfully renew our maintenance agreements with our software customers, our business may be adversely affected. If a substantial number of our software customers declined to renew these agreements, our revenues and profits would be materially adversely affected, especially within the GPT business segment. Our future success significantly depends on the experience of our key personnel, and the loss of any one of them could impair our ability to do business. Our future success depends, in significant part, upon the continued services of John D. Carreker, Jr., our Chairman of the Board and Chief Executive Officer, as well as other executive officers and key personnel. The loss of services of Mr. Carreker or one or more of our other executive officers or key employees could have a material adverse effect on our business, financial condition and results of operations, and there can be no assurance that we will be able to retain our executive officers or key personnel. We do not maintain key-man life insurance covering any of our executive officers or other key personnel. We may be unable to fully benefit from our strategic alliances and acquisitions, which could negatively affect our business and hinder our ability to realize expected benefits. We regularly evaluate opportunities and may enter into strategic alliances, or make acquisitions of other businesses, product or technologies. Risks inherent in alliances may include, among others: Acquisitions involve numerous risks, including: There can be no assurance that we will be successful in identifying and entering into strategic alliances or making acquisitions, if at all, and any inability to do so could have a material adverse effect on our business, financial condition and results of operations. We expect that future acquisitions, if any, could provide for consideration to be paid in cash, shares of our common stock, or a combination of cash and our common stock. If the consideration for an acquisition transaction is paid in common stock, this could further dilute existing stockholders. Any impairment of a significant amount of goodwill or other assets resulting from an acquisition transaction could materially impact our operating results and financial condition. Our focus on providing business process outsourcing, or BPO, with a significant offshore component subjects us to risks associated with new markets, new competition, cross border and geopolitical risks and a dependence on Our BPO business model gives rise to numerous risks, particularly risks related to our dependence on third party providers operating in distant geographic regions and those associated with entering a new market with competitors who may have significantly more resources than we do. The success of our BPO model partially depends on the performance of our offshore third party service provider partner's parent company with whom we have contracted to provide BPO services to our clients. In addition, we have to compete on the basis of a number of factors including the attractiveness and breadth of the business strategy and services that we offer, pricing, technological innovation, quality of service, ability to invest in or acquire assets of potential customers, and our scale in certain industries or geographic regions. Because some of these factors are outside of our control and because many of our competitors may have greater financial resources, larger customer bases, and larger technical, sales and marketing resources, we cannot be sure that we will compete successfully against them in the future. If we fail to compete successfully against our competitors with respect to these or other factors, our BPO business, financial condition, and results of operations could be materially and adversely affected. There is competition in our industry for qualified banking professionals and technical and managerial personnel, and our failure to attract and retain these people could affect our ability to respond to banking and technological change and to increase our revenues. Our future success depends upon our continuing ability to attract and retain highly qualified banking, technical and managerial personnel. Competition for such personnel has at times caused difficulties in attracting the desired number of such individuals. Further, our employees have left us to work in-house with our customers and with our competitors. There can be no assurance that we will be able to attract or retain a sufficient number of highly qualified employees or independent contractors in the future. If we are unable to attract personnel in key positions, our business, financial condition and results of operations could be materially and adversely affected. A small number of customers accounts for a substantial portion of our business, so the loss of any one of them could have an adverse impact on our business and financial condition. Our five largest customers accounted for approximately have changed from period to period. However, a significant portion of our current revenues is derived from customers who were major customers in prior years, and we are therefore dependent to a significant degree on our ability to maintain our existing relationships with these customers. There can be no assurance that we will be successful in maintaining our existing customer relationships or in securing additional customers, and there can be no assurance that we can retain or increase the volume of business that we do with such customers. In particular, continuing consolidation within the banking industry may result in the loss of one or more significant customers and/or potential customers. Any failure by us to retain one or more of our large customers, maintain or increase the volume of business done for such customers or establish profitable relationships with additional customers could have a material adverse effect on our business, financial condition and results of operations. We face increased competition that could result in price reductions, fewer customer orders and loss of market share, any of which could materially and adversely affect our business. We compete with respond more quickly to new or emerging technologies and changes in customer requirements or to devote greater resources to the development, promotion and sale of their products than we can. Also, some of our current and potential competitors have greater name recognition and larger customer bases that such competitors could leverage to increase market share at our expense. We expect to face increased competition as other established and emerging companies enter the banking services market. Increased competition could result in price reductions, fewer customer orders and loss of market share, any of which could materially and adversely affect our business, financial condition and results of operations. There can be no assurance that we will be able to compete successfully against current or future competitors, and the failure to do so In addition to competing with a variety of third parties, we experience competition from our customers and potential customers. From time to time, these potential customers develop, implement and maintain their own services and applications for revenue enhancements, cost reductions and/or enhanced customer services, rather than purchasing services and related products from third parties. There can be no assurance that these customers or other potential customers will perceive sufficient value in our solutions to justify investing in them. In addition, customers or potential customers could enter into strategic relationships with one or more of our competitors to develop, market and sell competing services or products. Our inability to protect adequately our proprietary technology or to prevent its unauthorized use could divert our financial resources and cause significant expenditures, which could materially harm our business. Our success significantly depends upon our proprietary technology, intellectual property and information, including customer information. We rely upon a combination of patent, copyright, trademark and trade secret laws and confidentiality procedures to protect our proprietary technology and information. We have a number of issued patents and registered trademarks. We also limit customer use of our intellectual property by entering into license and other agreements which limit the customer's use of the intellectual property. There can be no assurance that the steps we have taken to protect our services and products are adequate to prevent misappropriation of our technology or that our competitors independently will not develop technologies that are substantially equivalent or superior to our technology. Furthermore, it is very difficult to police unauthorized use of our software due to the nature of software. Any such misappropriation of our proprietary technology or information or the development of competitive technologies could have a material adverse effect on our business, financial condition and results of operations. In addition, the laws of some countries in which our software is distributed do not protect our intellectual property rights to the same extent as the laws of the United States. For example, the laws of a number of foreign jurisdictions in which we license our software protect trademarks solely on the basis of the first to register. We currently do not possess any trademark registrations in foreign jurisdictions, although we do have copyright protection of our software under the provisions of various international conventions. Accordingly, intellectual property protection of our services and products may be ineffective in many foreign countries. In summary, there can be no assurance that the protection provided by the laws of the United States or such foreign jurisdictions will be sufficient to protect our proprietary technology or information. Infringement claims by third parties can subject us to substantial liability and expenses and can impair our ability to sell our solutions. We may need to litigate claims against third parties to enforce our intellectual property rights, protect our trade secrets, determine the validity and scope of the proprietary rights of others or defend against claims of infringement or invalidity. We may also be subject to claims from our customers for indemnification against third party claims for infringement or other similar claims. We may be required to incur significant costs in reaching a resolution to the asserted claims, or any other claims that may be asserted against us. We depend on third parties for some of our technology licenses, and if we cannot obtain satisfactory licenses our business could suffer. Some technology used in our current software and software in development includes technology licensed from third parties. These licenses generally require us to pay royalties and to fulfill confidentiality obligations. The termination of any such licenses, or the failure of the third party licensors to adequately maintain or update their products, could result in delays in our ability to implement solutions or in delays in the introduction of our new or enhanced solutions while we search for similar technology from alternative sources, if any, which could prove costly. Any need to implement alternative technology could prove to be very expensive for us, and any delay in solution implementation could result in a material adverse effect on the business, financial condition and results of our operations. It may also be necessary or desirable in the future to obtain additional licenses for use of We may face liability claims related to the use of our solutions and the defense of these claims could have a negative effect on our business, results of operations or financial condition. As a result of our suite of solutions that address critical functions of bank operations, we are exposed to possible liability claims from banks and their customers. Although we attempt to mitigate liability in our contracts and have not experienced any material liability claims to date, there can be no assurance that we will not become subject to such claims in the future. A liability claim against us could have a material adverse effect on our business, financial condition and results of operations. Our solutions at times in the past have been, and in the future may be, incompatible with the operating environments of our customers or inappropriate to address their needs, resulting in additional costs being incurred by us in rendering services to our customers. Further, like other software products, our software occasionally has contained undetected errors, or "bugs," which become apparent through use of the software. Because our new or enhanced software initially is installed at a limited number of sites and operated by a limited number of users, such errors and/or incompatibilities may not be detected for a number of months after delivery of the software. The foregoing errors in the past have resulted in the deployment of our personnel and funds to cure errors, occasionally resulting in cost overruns and delays in solutions development and enhancement. Moreover, solutions with substantial errors could be rejected by or result in damages to customers, which could have a material adverse effect on our business, financial condition and results of operations. There can be no assurance that errors or defects will not be discovered in the future, potentially causing delays in solution implementation or additional development costs such as requiring design modifications that could adversely affect our business, financial condition and results of operations. Information and data security requirements placed upon us by our customers necessitates investment and improvement in our information technology infrastructure and processes and a failure to adequately protect such information could adversely affect our business. Our business requires the storage and transmission of sensitive business information of our customers. Significant capital and investment in other resources is required to protect against the threat of security breaches or computer viruses, or to alleviate problems caused by breaches or viruses. To the extent that our activities or the activities of our customers require the storage and transmission of confidential information, such as banking records or credit information, security breaches and viruses could expose us to claims, litigation or other possible liabilities. We face risks in connection with the expansion of our international operations, which could have a negative impact on our business, financial condition and results of operations. We provide solutions to banks outside the United States, and a key component of our growth strategy is to broaden our international operations. In addition, our Some of our international sales are denominated in local currencies, and the impact of future exchange rate fluctuations on our financial condition and results of operations cannot be accurately predicted. There can be no assurance that fluctuations in currency exchange rates in the future will not have a material adverse effect on revenue from international sales and thus our business, financial condition and results of operations. Government regulation and legal uncertainties could force us to change our operations, which could have a material adverse effect on our ability to maintain our current Our primary customers are banks. Although the solutions that we currently offer have not been subject to any material, specific government regulation, the banking industry is regulated heavily, and we expect that such regulation will affect the relative demand for our solutions. While we are not directly subject to federal or state regulations specifically applicable to financial institutions, such as banks, thrifts and credit unions, the Federal Reserve, the Federal Deposit Insurance Corporation, the National Credit Union Administration, the Office of Thrift Supervision, the Office of the Comptroller of the Currency, and various state regulatory authorities typically assert the right to observe the operations of companies to which certain functions of financial institutions (such as data processing) are outsourced. These regulators may from time to time also claim the right to observe the operations of companies like us that provide software to financial institutions. In addition, financial institutions with whom we do business may from time to time require, by contract or otherwise, that evaluations of our internal controls be performed by independent auditors or by the financial institutions themselves. There can be no assurance that federal, state or foreign governmental authorities will not adopt new statutes or regulations, and any adoption of new Our intangible assets could become impaired and adversely affect our future results of operations and financial position. In June 2001, the Financial Accounting Standards Board issued Statement of Financial Accounting Standards No. 142,Goodwill and Other Intangible Assets ("SFAS 142"), effective for fiscal years beginning after December 15, 2001. Under SFAS 142, goodwill and intangible assets deemed to have indefinite lives will no longer be amortized but will be subject to annual impairment tests in accordance with the Statement. There can be no assurance that such tests will not result in a determination that these assets have been impaired. If at any time it is determined that an impairment has occurred, we will be required to reflect the impaired value as a charge resulting in a reduction in earnings in the quarter such impairment is identified and a corresponding reduction in our net asset value. We recorded a goodwill impairment charge of $46.0 million in the quarterly period ended January 31, 2003. The fair values used in this evaluation were estimated based upon the consideration of a number of fair value estimation techniques, including a discounted cash flow analysis and consideration of the market price of our stock. Goodwill that remains recorded at January 31, 2006 was $20.8 million. Declines in market conditions, increases in interest rates and changes in projections with respect to the Global Payments Technologies reporting unit in which goodwill is allocated could result in additional impairment charges in the future. In addition to the Goodwill discussed above, we have other intangible assets which are currently being amortized. These intangible assets are as follows: Declines in either current or projected demand for our software product offerings could result in non-cash impairment charges in the future. The ultimate realization of revenue from contracted sales, potential sales, backlog and deferred revenues cannot be predicted with a high degree of accuracy. From time to time management provides information regarding our contracted sales, potential sales and our backlog for contracted services, contracted contingent services, contracted licenses and contracted maintenance. Management also provides our expectations with regard to the realization of revenue from such contracted sales, potential sales and backlog. These expectations can be influenced by many factors, some of which are beyond our control, and include but are not limited to the following: The ultimate resolution of the class action lawsuit may have a material adverse effect on our business. Although we have reached an agreement to settle the shareholder class action lawsuit described under "Item 3. Legal Proceedings," we are unable to predict with certainty the final outcome of the lawsuit or the effect of the lawsuit on our financial results, our business or our management. Counsel for the plaintiffs and defendants have executed a stipulation of settlement, but the stipulation of settlement is subject to final court approval. At this time, there can be no assurance that the stipulation of settlement will receive final court approval. If this does not occur, the potential outcome or resolution of the class action lawsuit could include judgments against us or settlements that could require substantial payments by us. In addition, the timing of the final resolution of these matters is uncertain. We believe that a material adverse outcome with respect to the class action lawsuit could have a material adverse effect on our financial results, our business or our management. Risks Related to Our Common Stock Our stock price has fluctuated significantly, sometimes for reasons unrelated to our performance. Historically there has been significant volatility in the market price of our common stock, as well as in the market price of securities of many companies in the technology sector. We believe that factors such as quarterly fluctuations in financial results or announcements by us, our competitors, banks and other bank industry participants could cause the market price of our common stock to fluctuate substantially. Other factors which may have a significant impact on the market price of our common stock include, but are not limited to; changes in earnings estimates or recommendations by securities analysts and the outcome of the securities litigation (see "Item 3. Legal Proceedings.) In addition, the stock market may experience extreme price and volume fluctuations that often are unrelated to the operating performance of specific companies. Market fluctuations or perceptions regarding the banking industry and general economic or political conditions may adversely affect the market price of the common stock. Our Our certificate of incorporation and bylaws contain provisions that may have the effect of delaying, deterring or preventing a potential takeover of us, which potential investors in our We are subject to additional risks in light of the As described under "Management's Discussion and Analysis of Financial Tod V. Mongan has served as Senior Vice President and Secretary since December 2001 and as General Counsel to the Company since February 2001. For the five years prior to that time Mr. Mongan served as Senior Vice President, General Counsel, Secretary and Chief Administrative Officer for BancTec, Inc., a worldwide systems integration, manufacturing and services company.Forward Looking Statements and
Item 1A. Risk FactorsFactors.Risk FactorsBusiness Riskshesitantslow to adopt electronic solutions, which can adversely affect the demand for our solutions. Any event that results in decreased consumer or corporate use of bank services, or increased pressures on banks towards the in-house development and implementation of revenue enhancement or cost reduction measures, could have a material adverse effect on our business, financial condition and results of operations.Our inability to respond to a decline in check volumes could reduce our revenues and have a material adverse effect on our business. We have in the past derived a significant portion of our revenues from check related products and services. A decline in check volumes could have a material adverse effect on our business. If banks and merchants decide to use pricing incentives to further stimulate a decline in check usage, this decline in usage could accelerate. Our future success depends on our ability to leverage existing competencies to support emerging payments types, and to define and develop new solutions addressing those payment types. If we are unable to capitalize on these competencies to generate new revenues to offset any lossof revenues arising as a result of a decline in check usage, then our business could be adversely affected.Various factors, some beyond our control, could cause fluctuations in our operating results. We have experienced in the past, and expect to experience in the future, significant fluctuations in quarterly operating results. Such fluctuations may be caused by many factors, including but not limited to the timing of contract execution and revenue recognition and our mix of revenues derived from consulting and management service fees on the one hand, and software-related fees on the other. Risks over which we have little or no control, including customer budget cycles and priorities, can also significantly affect operating results. As a result of these factors, our quarterly revenues and operating results are difficult to forecast. It is possible that our future quarterly results of operations from time to time will not meet the expectations of securities analysts or investors, which could have a material adverse effect on the market price of our common stock.We do not typically enter into long-term agreements with our customers, which makes it more difficult to plan and efficiently allocate our resources, and any deferral, modification or cancellation of a customer project can adversely affect our operating results. We typically provide services to customers on a project-by-project basis without long-term agreements. When a customer defers, modifies or cancels a project, we must be able to rapidly re-deploy our personnel to other projects in order to minimize the under-utilization of our personnel and the resulting adverse impact on operating results. In addition, our operating expenses are relatively fixed and cannot be reduced on short notice to compensate for unanticipated variations in the number or size of projects in progress. As a result, any delay, modification or cancellation of a customer project, or any disruption of our business relationships with any of our significant customers or with a number of smaller customers could have a material adverse effect on our business, financial condition and results of operations.Our future success significantly depends on the experience of our key personnel, and the loss of any one of them could impair our ability to do business. Our future success depends, in significant part, upon the continued services of John D. Carreker, Jr., our Chairman of the Board and Chief Executive Officer, as well as other executive officers and key personnel. The loss of services of Mr. Carreker or one or more of our other executive officers or key employees could have a material adverse effect on our business, financial condition and results of operations, and there can be no assurance that we will be able to retain our executive officers or key personnel. We do not maintain key-man life insurance covering any of our executive officers or other key personnel.third-partythird party providers.31%36%, 28%31% and 34%28% of total revenues during the fiscal years ended January 31, 2006, 2005 2004 and 2003,2004, respectively. Our significant customersthird-partythird party providers of services and software products to the banking industry that include consulting firms and software companies. Some of our competitors have significantly greater financial, technical, marketing and other resources than we do. Our competitors may be able towouldcould have a material adverse effect upon our business, financial condition and results of operations.These types of claims commonly increase as technology providers develop new product offerings. There can be no assurance that the resolution of a claim against us would not require us to pay damages or obtain a license to the third party's intellectual property rights in order to continue licensing our software as currently offered or, if such a third-partythird party license is required, that it would be available on terms acceptable to us. There can also be no assurance that we will be successful in pursuing litigation to protect our intellectual property or trade secrets, or that we will be able to recover the legal costs associated with preserving our proprietary rights. The resolution of intellectual property claims may also divert our management resources. If we cannot adequately protect our proprietary rights, it could have a material adverse effect on our business, operating results and financial condition.third-partythird party products in our solutions, and there can be no assurance that we will be able to do so on commercially reasonable terms, if at all. In additionOur software and solutions may contain defects or errors, which could adversely affect our business and subject us to liability claims.ItAlthough remote, it is also possible that errors or defects in our solutions could give rise to liability claims against us. Our inability to prevent security breaches or computer viruses could also cause our customers to lose confidence in our solutions and terminate their relationships with us.provision of business process outsourcing business segment involves a significant offshore component. Our international operations are subject to risks inherent in the conduct of international business, including unexpected changes in regulatory requirements, fluctuations in exchange rates and devaluations of foreign currencies, export license requirements, restrictions on the export of critical technology, difficulties in staffing international projects, longer accounts receivable cycles and difficulties in collecting payments.business.business, and make our business more expensive to operate.regulationsrules could require us to modify our current or future solutions.solutions or subject us to more direct supervision or examination. The adoption of laws or regulations affecting us or our customers' businesses could reduce our growth rate or could otherwise have a material adverse effect on our business, financial condition and results of operations.intangible assets could become impairedgoverning documents and adversely affectapplicable Delaware law contain provisions that may have the effect of discouraging a potential takeover of us.future resultscommon stock should consider. Our certificate of operationsincorporation and financial position.bylaws provide for a classified board of directors serving staggered terms of three years, prevent stockholders from calling a special meeting of stockholders and prohibit stockholder action by written consent. Our certificate of incorporation also authorizes only the board of directors to fill vacancies on our board of directors, including newly-created directorships, and states that directors of the Company may be removed only for cause and only by the affirmative vote of holders of at least two-thirds of the outstanding shares of the voting stock, voting together as a single class. Section 203 of the Delaware General Corporation Law, which is applicable to us, contains provisions that restrict certain business combinations with interested stockholders, which may have the effect of inhibiting a non-negotiated merger or other business combination involving us. In June 2001,Other RisksFinancial Accounting Standards Board issued Statementrestatement of our prior period consolidated financial statements.Accounting Standards No. 142,GoodwillCondition and Other Intangible Assets ("SFAS 142"), effective for fiscal years beginning after December 15, 2001. Under SFAS 142, goodwillResults of Operations—Restatement" and intangible assets deemed to have indefinite lives will no longer be amortized but will be subject to annual impairment tests in accordance with the Statement. There can be no assurance that such tests will not result in a determination that these assets have been impaired. If at any time it is determined that an impairment has occurred, we will be required to reflect the impaired value as a charge resulting in a reduction in earnings in the quarter such impairment is identified and a corresponding reduction in the net asset valueNote 3 of the Company. The Company recorded a goodwill impairment charge of $46.0 million inNotes to Consolidated Financial Statements, we have restated our consolidated financial statements for the quarterly periodyear ended January 31, 2003. The fair values used in this evaluation were estimated based upon the consideration of a number of fair value estimation techniques including a discounted cash flow analysis2004 and consideration of the market price of the Company's stock. Goodwill that remains recordedour consolidated balance sheet at January 31, 2005 was $20.8 million. Declines in market conditions, increases in interest rates and changes in projections with respect to the Global Payments Technologies reporting unit in which goodwill is allocated could result in additional impairment charges in the future.
In addition to the Goodwill discussed above, we have other intangible assets which are currently being amortized. These intangible assets are as follows:
Declines in both current and projected demand for our software product offerings could result in impairment charges in the future.
The ultimate realization of revenue from contracted sales, potential sales and backlog cannot always be predicted with a high degree of accuracy.
From time to time management provides information regarding our contracted sales, potential sales and our backlog for contracted services, contracted contingent services, contracted licenses and contracted maintenance. Management also provides our expectations with regard to the realization of revenue from such contracted sales, potential sales and backlog. These expectations can be influenced by many factors, some of which are beyond our control, and include but are not limited to the following:
Changes in the Accounting Treatment of Stock Options and Other Share-Based Compensation Could Adversely Affect Our Results of Operations.
We currently account for share-based payments to employees (which include stock options) using the intrinsic value method of APB No. 25, "Accounting for Stock Issued to Employees" and, as such, generally recognize no compensation cost for employee stock options. In December 2004, the Financial Accounting Standards Board issued Statement of Financial Accounting Standards No. 123 (revised 2004),"Share-Based Payments," ("SFAS 123(R)"). SFAS 123(R) requires companies to adopt the fair-value methodology of valuing stock options and other share-based compensation and recognize that valuation in theconsolidated financial statements from the date of grant. Adoption is required for all interim and annual periods beginning after June 15, 2005. This change in accounting treatment of employee stock options will likely have a material and adverse effect on our results of operations, as the share-based compensation expense will be charged directly against our earnings. Furthermore, adoption of SFAS 123(R) will require us to make certain assumptions and judgments in the valuation of stock options that we may grant in the future. A change in any of those assumptions or judgments could change the compensation expense that is charged against our earnings and, consequently, adversely affect our results of operations.
The ultimate resolution of the class action lawsuits may have a material adverse effect on our business.
We are unable to predict or determine the final outcome of the class action lawsuits described under "Item 3. Legal Proceedings," and the effect of these proceedings on our financial results, our business or our management. In addition, it is not feasible to estimate the amounts or potential range of losses with respect thereto. The potential outcomes or resolutions of the class action lawsuits could include judgments against us or settlements that could require substantial payments bynegatively affect us. In addition, the timing of the final resolution of these matters is uncertain. We believe that material adverse outcomes with respect to the class action lawsuits could have a material adverse effect on our financial results, our business or our management.
We cannot predict every event and circumstance which may impact our business and, therefore, the risks and uncertainties discussed above may not be the only ones you should consider.
The risks and uncertainties discussed above are in addition to those that apply to most businesses generally. In addition, as we continue to grow our business, we may encounter other risks of which we are not aware at this time. These additional risks may cause serious damage to our business in the future, the impact of which we cannot estimate at this time.
Item 1B. Unresolved Staff Comments.Not applicable.
Our principal executive office is a leased facility with approximately 72,433 square feet of space in Dallas, Texas. The lease agreement for this space expires on May 31, 2010. We also lease approximately 22,491 square feet in Memphis, Tennessee pursuant to a lease agreement which expires August 31, 2010; approximately 40,307 square feet in Charlotte, North Carolina pursuant to a lease agreement which expires December 31, 2008 and 4,111 square feet in London, England pursuant to a lease agreement which expires September 30, 2006. We believe that our facilities are well maintained and in good operating condition and are adequate for our present and anticipated levels of operations.
Shareholder Derivative Suit.
On June 15, 2004, by mutual agreement between the parties,Smith v. Carreker Corporation, et. al, Civil Action No. 303CV1211-M was reinstated in the United States District Court for the Northern District of Texas, Dallas Division. This action was originally filed on May 29, 2003, in the United States District Court for the Northern District of Texas, Dallas Division as Civil Action no. 303CV1211-D. On January 15, 2004, the Court, acting upon the joint motion of the parties, dismissed the action without prejudice. This action was brought as a shareholders' derivative action pursuant to Rule 23.1, Fed.R.Civ.P. for the benefit of Nominal Defendant Carreker Corporation against certain of its current and former officers and directors,i.e., John D. Carreker, Jr., James D. Carreker, Richard R. Lee, Jr., James L. Fischer, Donald L. House, David K. Sias, Terry L. Gage, James R. Erwin, Ronald G. Steinhart and Ronald Antinori, seeking to remedy their individual breaches of fiduciary duty, including their knowing violations of Generally Accepted Accounting Principles ("GAAP"), knowing violations of federal and state securities laws, acts of bad faith and other breaches of fiduciary duty. The plaintiff seekssought redress (the form of which includes, among others, unspecified amounts of compensatory damages, interest and costs, including legal fees) for injuries to the Company and its shareholders caused by Defendants' misfeasance and/or malfeasance during the period from May 20, 1998 through December 10, 2002. The District Court has preliminarily approved a settlement of the derivative claims brought in this action. Under the proposed settlement, the Company has agreed to adopt certain
On June 2, 2003, incorporate governance enhancements and cover plaintiffs' counsel's attorney's fees and litigation expenses up to $300,000. Neither the Company nor any of its current or former officers and directors made any admission of wrongdoing. When the settlement is approved by the Court and is made final, the derivative litigation against the Company's current and former officers and directors will be terminated. A final settlement hearing will be scheduled before the District Court Dallas County, Texas, Walter Evans brought a shareholders' derivative action, for the benefitpurpose of Nominal Defendant Carreker Corporation against James D. Carreker, John D. Carreker, Jr., James R. Erwin, James L. Fischer, Michael D. Hansen, Donald L. House, Richard R. Lee, Jr., David K. Sias, Ronald J. Steinhart,determining whether the proposed settlement should be approved as fair, reasonable and Ernst & Young, LLPadequate. The settlement is subject to conditions, including final court approval. At this time, there can be no assurance that those conditions will be met and Carreker Corporation, Nominal Defendant (Cause No. 0305505). The complaint alleges that the director defendants breached their fiduciary duty to the company. In addition the complaint makes certain allegations against the Company's independent auditors Ernst & Young LLP. The complaint seeks unspecified amounts of compensatory damages, as well as interest and costs, including legal fees from the director defendants.settlement will receive final court approval.
Shareholder Class Action.
On April 16, 2003 the United States District Court for the Northern District of Texas, Dallas Division, issued an order consolidating a number of purported class action lawsuits against the Company, John D. Carreker Jr. and Terry L. Gage into a Consolidated Action styledIn re Carreker Corporation Securities Litigation, Civil Action No. 303CV0250-M. Also, on March 3,On October 14, 2003 Claude Alton Coulterthe plaintiffs filed a purported class action lawsuit (Civiltheir Consolidated Class Action No. 503-CV-5-Q) against the Company, John D. Carreker Jr. and Terry L. Gage in the United States District Court for the Eastern District of Texas, Texarkana Division. These complaints,Complaint. The complaint, filed on behalf of purchasers of the Company's common stock between May 20, 1998 and December 10, 2002, inclusive, allegealleged violations of Section 10(b) of the Securities Exchange Act of 1934 and Rule 10b-5 against all defendants (the Company, John D. Carreker Jr., Ronald Antinori, Terry L. Gage and Ernst & Young, the Company's auditors), violations of Section 20(a) of the Exchange Act against the individual defendants. These complaintsdefendants, and violation of Section 20A of the Securities Exchange Act against defendants John D. Carreker, Jr. and Ronald Antinori. The complaint also allege,alleges, among other things, that defendants artificially inflated the value of the Company'sCarreker stock by knowingly or recklessly misrepresenting the Company's financial results during the purported class period. On March 22, 2005 the Court dismissed the action without prejudice and allowed the plaintiffs 60 days in which to file an amended complaint. Also the Court dismissed, with prejudice, all claims by shareholders relating to periods prior to July 31, 1999.
On May 31, 2005, the plaintiffs filed an Amended Consolidated Class Action Complaint on behalf of purchasers of the Company's common stock between July 30, 1999 and December 10, 2002, inclusive, which reiterates the allegations in the first complaint, and alleges violations of Section 10(b) of the Securities Exchange Act of 1934 and Rule 10b-5 against all defendants (the Company, John D. Carreker Jr., Ronald Antinori and Terry L. Gage) except Ernst & Young LLP, violations of Section 20(a) of the Exchange Act against the individual defendants, and violations of Section 20A of the Securities Exchange Act against defendants John D. Carreker, Jr. and Ronald Antinori. The plaintiffs are seeking unspecified amounts of compensatory damages, interest and costs, including legal fees.
On March 22, 2005,April 21, 2006, counsel for the plaintiffs and defendants executed and submitted to the Court dismissed claimsa stipulation of settlement whereby they have agreed to settle the class action litigation for a payment of $5,250,000. The proposed settlement is subject to final court approval. At this time, there can be no assurance that the settlement will receive final court approval.
The proposed settlement payments in both the shareholder derivative suit and the class action are fully covered by purchasers of the Company's common stock prior to July 30, 1999.
The Companydirectors and individual defendants deny the allegations in these complaints and intend to defend themselves vigorously. It is not possible at this time to predict whether the Company will incur any liability or to estimate the damages, or the range of damages, if any, that the Company might incur in connection with these lawsuits. The ultimate resolution of these lawsuits could have a material adverse effect on the Company's business, results of operations, financial condition and cash flows.officer's insurance policies.
The Company is periodically involved in various other legal actions and claims which arise in the normal course of business. In the opinion of management, the final disposition of these matters areis not expected to have a material adverse effect on the Company's financial position or results of operations.
Item 4. Submission of Matters to A Vote of Security Holders.
No matter was submitted to a vote of our stockholders during the quarterly period ended January 31, 2005.2006.
Item 5. Market for Registrant's Common Equity, Related Stockholder Matters and Issuer Purchases of Equity Securities.
Our Common Stock has traded on the NASDAQ National Market under the symbol "CANI" since May 20, 1998, the date of our initial public offering. At March 31, 2005,2006, there were approximately 413883 record holders (388 are employees holding restricted common shares) of our Common Stock, although we believe that the number of beneficial owners of our Common Stock is substantially greater. The table below sets forth for the fiscal quarters indicated the high and low closing prices for the Common Stock, as reported by the NASDAQ National Market.
| | High | Low | ||||||
|---|---|---|---|---|---|---|---|---|
| Quarterly Period Ending | ||||||||
| January 31, 2005 | $ | 8.88 | $ | 7.40 | (1) | |||
| October 31, 2004 | 10.56 | 7.28 | ||||||
| July 31, 2004 | 10.20 | 6.49 | ||||||
| April 30, 2004 | 15.01 | 7.28 | ||||||
| January 31, 2004 | 16.76 | 9.36 | ||||||
| October 31, 2003 | 10.25 | 4.30 | ||||||
| July 31, 2003 | 5.50 | 3.75 | ||||||
| April 30, 2003 | 3.76 | 2.01 | ||||||
| | High | Low | |||||
|---|---|---|---|---|---|---|---|
| Fiscal 2006 | |||||||
| Q1 2006 (QTD through March 31, 2006) | $ | 6.55 | $ | 5.38 | |||
Fiscal 2005 | |||||||
| Q4 2005 | $ | 5.65 | $ | 4.75 | |||
| Q3 2005 | 7.18 | 5.49 | |||||
| Q2 2005 | 6.14 | 4.47 | |||||
| Q1 2005 | 7.92 | 4.16 | |||||
Fiscal 2004 | |||||||
| Q4 2004 | $ | 8.88 | $ | 7.40 | |||
| Q3 2004 | 10.56 | 7.28 | |||||
| Q2 2004 | 10.20 | 6.49 | |||||
| Q1 2004 | 15.01 | 7.28 | |||||
We have not paid a cash dividend on shares of our common stock since our incorporation. We currently intend to retain our earnings in the future to support operations, and finance our growth and therefore,possibly to repurchase some shares of our common stock. Therefore, we do not intend to pay cash dividends on the common stock in the foreseeable future. Any payment of cash dividends in the future will be at the discretion of the board of directors and subject to some limitations under the Delaware General Corporation Law. However, our revolving credit agreement, which is described in Note 45 of our Notes to Consolidated Financial Statements, currently prohibits the payment of any cash dividends without approval from the banks from whichwith whom we entered into the revolving credit agreement was entered into.agreement.
Please see "Item 12. Security Ownership of Certain Beneficial Owners and Management and Related Stockholder Matters" for information about our equity compensation plans.
Under a share repurchase program approved by the Board of Directors of Carreker Corporation on April 18, 2005, the Company was authorized to repurchase up to $5.0 million of its common stock through October 14, 2005. The repurchase program was designed to comply with Rules 10b5-1 and 10b-18 under the Securities Exchange Act of 1934 under which an agent appointed by the Company determined the time, amount, and price at which purchases of common stock would be made, subject to certain parameters established in advance by the Company. The Company purchased $3.2 million of
its common stock under the program, which expired on October 14, 2005. The repurchases are reflected in the following table:
| Period | Total Number of Shares Purchased | Average Price Paid Per Share | Total Number of Shares Purchased as part of Publicly Announced Plans or Programs | Maximum Number of Shares that may yet be Purchased under the Plans or Programs | |||||||
|---|---|---|---|---|---|---|---|---|---|---|---|
| Q1 2005 | 70,000 | $ | 4.98 | 70,000 | |||||||
| Q2 2005 | 560,511 | 5.04 | 560,511 | ||||||||
| Q3 2005 | 900 | 6.02 | 900 | ||||||||
| Total | 631,411 | $ | 5.03 | 631,411 | (1 | ) | |||||
Item 6. Selected Financial Data.
SELECTED CONSOLIDATED FINANCIAL DATA
The following consolidated statements of operations data for each of the three years in the period ended January 31, 20052006 and the consolidated balance sheet data as of January 31, 2005 and 20042006 have been derived from our audited consolidated financial statements which are included elsewhere in this Report. As a result of the restatement of our consolidated financial statements as of January 31, 2005 and 2004 and for the year ended January 31, 2004, the indicated data set forth below has been restated from that which was reported previously in the Company's reports on Form 10-K for these periods. See Note 3 of the Notes to Consolidated Financial Statements. The consolidated balance sheet data as of January 31, 2003 2002, and 2001,2002, and the consolidated statement of operations data for the years ended January 31, 20022003 and 2001,2002, have been derived from our audited consolidated financial statements not included in this Report. The selected financial data set forth below should also be read in conjunction with "Management's
"Management's Discussion and Analysis of Financial Condition and Results of Operations" and the Consolidated Financial Statements and Notes thereto appearing elsewhere in this Report.
| | | Year Ended January 31, | ||||||||||||||||||||||||||||||||||
|---|---|---|---|---|---|---|---|---|---|---|---|---|---|---|---|---|---|---|---|---|---|---|---|---|---|---|---|---|---|---|---|---|---|---|---|---|
| | | 2006 | 2005 | 2004 | 2003 | 2002(2) | ||||||||||||||||||||||||||||||
| | | (in thousands, except per share data) | ||||||||||||||||||||||||||||||||||
| | | YEAR ENDED JANUARY 31, | | | | (As restated) (1) | | | ||||||||||||||||||||||||||||
| Consolidated Statements of Operations Data: | Consolidated Statements of Operations Data: | 2005 | 2004 | 2003 | 2002(1) | 2001 | Consolidated Statements of Operations Data: | |||||||||||||||||||||||||||||
| | (in thousands, except per share data) | |||||||||||||||||||||||||||||||||||
| Revenues: | Revenues: | Revenues: | ||||||||||||||||||||||||||||||||||
| Consulting fees | $ | 37,193 | $ | 34,064 | $ | 39,204 | $ | 42,342 | $ | 71,715 | Consulting | $ | 33,244 | $ | 37,193 | $ | 34,064 | $ | 39,204 | $ | 42,342 | |||||||||||||||
| Software license fees | 20,429 | 27,365 | 37,946 | 25,153 | 17,765 | Software license | 18,277 | 20,429 | 27,365 | 37,946 | 25,153 | |||||||||||||||||||||||||
| Software maintenance fees | 43,293 | 45,122 | 41,858 | 25,908 | 11,223 | Software maintenance | 42,442 | 43,293 | 43,081 | 41,858 | 25,908 | |||||||||||||||||||||||||
| Software implementation fees | 14,799 | 18,103 | 24,310 | 20,723 | 9,245 | Software implementation and other services | 18,457 | 14,799 | 18,103 | 24,310 | 20,723 | |||||||||||||||||||||||||
| Outsourcing service fees | 139 | — | — | — | — | Outsourcing services | 1,038 | 139 | — | — | — | |||||||||||||||||||||||||
| Out-of-pocket expense reimbursements | 3,038 | 4,254 | 6,458 | 9,611 | 11,265 | Out-of-pocket expense reimbursements | 3,126 | 3,038 | 4,254 | 6,458 | 9,611 | |||||||||||||||||||||||||
| Total revenues | 118,891 | 128,908 | 149,776 | 123,737 | 121,213 | Total revenues | 116,584 | 118,891 | 126,867 | 149,776 | 123,737 | |||||||||||||||||||||||||
Cost of revenues: | Cost of revenues: | Cost of revenues: | ||||||||||||||||||||||||||||||||||
| Consulting fees | 18,989 | 20,470 | 25,067 | 34,322 | 38,197 | Consulting | 17,186 | 18,989 | 20,470 | 25,067 | 34,322 | |||||||||||||||||||||||||
| Software license fees | 7,960 | 8,020 | 7,701 | 6,510 | 5,215 | Software license | 7,962 | 7,960 | 8,020 | 7,701 | 6,510 | |||||||||||||||||||||||||
| Write-off of capitalized software costs and prepaid software royalties(2) | — | — | 954 | 15,031 | — | Write-off of capitalized software costs and prepaid software royalties(3) | — | — | — | 954 | 15,031 | |||||||||||||||||||||||||
| Software maintenance fees | 14,771 | 13,420 | 10,773 | 8,311 | 2,811 | Software maintenance | 14,209 | 14,771 | 13,420 | 10,773 | 8,311 | |||||||||||||||||||||||||
| Software implementation fees | 14,747 | 17,901 | 19,496 | 15,328 | 5,498 | Software implementation and other services | 13,334 | 14,747 | 17,901 | 19,496 | 15,328 | |||||||||||||||||||||||||
| Outsourcing service fees | 616 | — | — | — | — | Outsourcing services | 1,914 | 616 | — | — | — | |||||||||||||||||||||||||
| Out-of-pocket expenses | 3,087 | 4,335 | 7,248 | 10,899 | 11,494 | Out-of-pocket expenses | 3,103 | 3,087 | 4,335 | 7,248 | 10,899 | |||||||||||||||||||||||||
| Total cost of revenues | 60,170 | 64,146 | 71,239 | 90,401 | 63,215 | Total cost of revenues | 57,708 | 60,170 | 64,146 | 71,239 | 90,401 | |||||||||||||||||||||||||
| Gross profit | Gross profit | 58,721 | 64,762 | 78,537 | 33,336 | 57,998 | Gross profit | 58,876 | 58,721 | 62,721 | 78,537 | 33,336 | ||||||||||||||||||||||||
Operating costs and expenses: | Operating costs and expenses: | Operating costs and expenses: | ||||||||||||||||||||||||||||||||||
| Selling, general and administrative | 46,524 | 49,733 | 50,326 | 50,112 | 31,743 | Selling, general and administrative | 45,527 | 46,524 | 49,733 | 50,326 | 50,112 | |||||||||||||||||||||||||
| Research and development | 8,644 | 7,471 | 11,307 | 10,843 | 6,055 | Research and development | 9,617 | 8,644 | 7,471 | 11,307 | 10,843 | |||||||||||||||||||||||||
| Amortization of customer relationships and goodwill | 1,400 | 1,400 | 1,400 | 4,339 | — | Amortization of customer relationships | 1,400 | 1,400 | 1,400 | 1,400 | 4,339 | |||||||||||||||||||||||||
| Goodwill impairment(4) | — | — | 46,000 | — | — | Goodwill impairment(5) | — | — | — | 46,000 | — | |||||||||||||||||||||||||
| Restructuring and other charges(5) | 3,682 | 1,901 | 2,945 | 22,464 | — | Restructuring and other charges(6) | 918 | 3,682 | 1,901 | 2,945 | 22,464 | |||||||||||||||||||||||||
| Total operating costs and expenses | 60,250 | 60,505 | 111,978 | 87,758 | 37,798 | Total operating costs and expenses | 57,462 | 60,250 | 60,505 | 111,978 | 87,758 | |||||||||||||||||||||||||
| Income (loss) from operations | Income (loss) from operations | (1,529 | ) | 4,257 | (33,441 | ) | (54,422 | ) | 20,200 | Income (loss) from operations | 1,414 | (1,529 | ) | 2,216 | (33,441 | ) | (54,422 | ) | ||||||||||||||||||
| Other income (expense): | Other income (expense): | Other income (expense): | ||||||||||||||||||||||||||||||||||
| Interest income | 306 | 266 | 414 | 1,564 | 1,954 | Interest income | 716 | 306 | 266 | 414 | 1,564 | |||||||||||||||||||||||||
| Interest expense | (442 | ) | (1,218 | ) | (2,583 | ) | (2,216 | ) | (97 | ) | Interest expense | (440 | ) | (442 | ) | (1,218 | ) | (2,583 | ) | (2,216 | ) | |||||||||||||||
| Other income (expense) | 1,037 | 601 | 505 | (144 | ) | (135 | ) | Other income (expense) | 814 | 1,037 | 601 | 505 | (144 | ) | ||||||||||||||||||||||
| Total other income (expense), net | Total other income (expense), net | 901 | (351 | ) | (1,664 | ) | (796 | ) | 1,722 | Total other income (expense), net | 1,090 | 901 | (351 | ) | (1,664 | ) | (796 | ) | ||||||||||||||||||
| Income (loss) before provision (benefit) for income taxes | Income (loss) before provision (benefit) for income taxes | (628 | ) | 3,906 | (35,105 | ) | (55,218 | ) | 21,922 | Income (loss) before provision (benefit) for income taxes | 2,504 | (628 | ) | 1,865 | (35,105 | ) | (55,218 | ) | ||||||||||||||||||
| Provision (benefit) for income taxes(3) | 568 | 200 | (1,475 | ) | (1,842 | ) | 8,330 | |||||||||||||||||||||||||||||
| Provision (benefit) for income taxes(4) | Provision (benefit) for income taxes(4) | 435 | 568 | 200 | (1,475 | ) | (1,842 | ) | ||||||||||||||||||||||||||||
| Net income (loss) | Net income (loss) | $ | (1,196 | ) | $ | 3,706 | $ | (33,630 | ) | $ | (53,376 | ) | $ | 13,592 | Net income (loss) | $ | 2,069 | $ | (1,196 | ) | $ | 1,665 | $ | (33,630 | ) | $ | (53,376 | ) | ||||||||
| Basic earnings (loss) per share | Basic earnings (loss) per share | $ | (0.05 | ) | $ | 0.16 | $ | (1.45 | ) | $ | (2.44 | ) | $ | 0.70 | Basic earnings (loss) per share | $ | 0.09 | $ | (0.05 | ) | $ | 0.07 | $ | (1.45 | ) | $ | (2.44 | ) | ||||||||
| Diluted earnings (loss) per share | Diluted earnings (loss) per share | $ | (0.05 | ) | $ | 0.15 | $ | (1.45 | ) | $ | (2.44 | ) | $ | 0.67 | Diluted earnings (loss) per share | $ | 0.08 | $ | (0.05 | ) | $ | 0.07 | $ | (1.45 | ) | $ | (2.44 | ) | ||||||||
| Shares used in computing basic earnings (loss) per share | Shares used in computing basic earnings (loss) per share | 24,295 | 23,736 | 23,198 | 21,853 | 19,305 | Shares used in computing basic earnings (loss) per share | 24,092 | 24,295 | 23,736 | 23,198 | 21,853 | ||||||||||||||||||||||||
| Shares used in computing diluted earnings (loss) per share | Shares used in computing diluted earnings (loss) per share | 24,295 | 24,384 | 23,198 | 21,853 | 20,429 | Shares used in computing diluted earnings (loss) per share | 24,478 | 24,295 | 24,384 | 23,198 | 21,853 | ||||||||||||||||||||||||
| | January 31, | ||||||||||||||||||||||||||||||
|---|---|---|---|---|---|---|---|---|---|---|---|---|---|---|---|---|---|---|---|---|---|---|---|---|---|---|---|---|---|---|---|
| | | JANUARY 31, | 2006 | 2005 | 2004 | 2003 | 2002(1) | ||||||||||||||||||||||||
| | | 2005 | 2004 | 2003 | 2002(1) | 2001 | (in thousands, except per share data) | ||||||||||||||||||||||||
| | | (in thousands, except per share data) | | (As restated) (1) | (As restated) (1) | | | ||||||||||||||||||||||||
| Balance Sheet Data: | Balance Sheet Data: | ||||||||||||||||||||||||||||||
| Cash and cash equivalents and short-term investments | $ | 34,516 | $ | 28,605 | $ | 26,986 | $ | 25,674 | $ | 78,505 | |||||||||||||||||||||
| Working capital | 12,598 | 11,939 | 17,432 | 4,130 | 107,935 | ||||||||||||||||||||||||||
| Total assets(4) | 93,019 | 104,530 | 110,108 | 184,899 | 142,646 | ||||||||||||||||||||||||||
| Long-term debt | — | 6,250 | 25,000 | 44,000 | — | ||||||||||||||||||||||||||
| Total stockholders' equity | 57,362 | 56,318 | 48,598 | 70,628 | 121,238 | ||||||||||||||||||||||||||
| Cash and cash equivalents and marketable securities | $ | 34,384 | $ | 34,516 | $ | 28,605 | $ | 26,986 | $ | 25,674 | |||||||||||||||||||||
| Working capital | 17,915 | 10,271 | 9,898 | 17,432 | 4,130 | ||||||||||||||||||||||||||
| Total assets(5) | 87,125 | 93,305 | 104,530 | 110,108 | 184,899 | ||||||||||||||||||||||||||
| Long-term debt | — | — | 6,250 | 25,000 | 44,000 | ||||||||||||||||||||||||||
| Total stockholders' equity | 55,491 | 55,321 | 54,277 | 48,598 | 70,628 | ||||||||||||||||||||||||||
| Year Ended January 31, 2002 | |||
| Capitalized X-Port Vault product costs | $ | 2,942 | |
| Write-off of prepaid software royalties with Exchange Applications, Inc. | 12,089 | ||
| Total recorded in the year ended January 31, 2002 | $ | 15,031 | |
| Year Ended January 31, 2003 | |||
| Capitalized eiManager product costs | $ | 586 | |
| Write-off of prepaid software royalties with Actuate Corporation. | 368 | ||
| Total recorded in the year ended January 31, 2003 | $ | 954 | |
During the quarterly period ended July 31, 2001, in connection with our periodic impairment review of our portfolio of software products, the Vault software acquired in the X-Port business combination in May 2000 was deemed to be impaired. Based on our calculation of the expected cash flows of the product, a $2.9 million non-cash charge was recorded. The charge resulted from the loss of two key transactions and the projected changes in the approach to selling and delivering the software and related services under a time or usage model.
Effective March 31, 2001, we entered into an alliance with Exchange Applications, Inc. ("Xchange"). As part of this alliance we became the exclusive provider of the EnAct customer relationship software and methodology to the banking industry. Under the EnAct agreement, we became obligated for guaranteed royalty payments of $12.5 million. Based on our periodic evaluation of the future cash flows associated with this product, a liability for the remaining $2.5 million obligation was accrued at October 31, 2001, and the carrying value of the prepaid software royalties, at that time, of $9.6 million was reduced to zero. This resulted in a charge of $12.1 million to costs of revenue during the quarterly period ended October 31, 2001.
During the quarterly period ended January 31, 2003, in connection with our periodic impairment review of our portfolio of software products, the eiManager product acquired in the AIS business combination in January 2000 was deemed to be impaired. Based on the Company's calculation of the expected future cash flows of the product, a $586,000 non-cash charge was recorded.
Effective June 2001, we entered into a software license agreement with Actuate Corporation in which the Company would integrate Actuate Corporation's software with our Global Tracking and Cash Solutions within the Global Payments Technologies business segment. We prepaid $400,000 for 40 copies of the software.
Based on the expected sales forecasts of this product a $368,000 non-cash charge was recorded in the quarterly period ended January 31, 2003.
On March 7, 2002, the federal tax law changed to allow net operating losses for taxable years ended in 2001 and 2002 to be carried back an additional three years. The impact from this change in tax law, including any reduction in the valuation allowance as a result of the expanded carryback period, was reflected in our tax provision for the quarterly period ended April 30, 2002. This resulted in a tax benefit of approximately $1.9 million in fiscal 2002 which was partially offset by state and foreign taxes.
At January 31, 2005,2006, we had available net operating loss carryforwards of approximately $33.1$34.0 million, of which begin to$5.7 million expire in 2022.2023 and $28.3 million expire in 2024.
| | January 31, | ||||||||
|---|---|---|---|---|---|---|---|---|---|
| | 2003 | 2002 | |||||||
| Workforce reductions | $ | 5,408 | $ | 633 | $ | 5,408 | |||
| Charges relating to the discontinuance of our CheckFlow suite | 14,018 | — | 14,018 | ||||||
| In-process research and development | 2,300 | — | 2,300 | ||||||
| Legal and professional fees | 2,312 | — | |||||||
| Facility closures | 440 | — | 440 | ||||||
| Other | 298 | — | 298 | ||||||
| Total | $ | 22,464 | $ | 2,945 | $ | 22,464 | |||
Item 7. Management's Discussion and Analysis of Financial Condition and Results of Operations.
The following discussion contains forward looking statements that involve risks and uncertainties. Our actual results could differ materially from those discussed in the forward looking statements as a result of various factors, including those set forth under "Business—Forward Looking Statements and Risk"Risk Factors," elsewhere in this Report or in the information incorporated by reference in this Report. You should read the following discussion and analysis in conjunction with "Selected Consolidated Financial Data" included in this Report, as well as our consolidated financial statements and related notes thereto appearing elsewhere in this Report.
Our fiscal year ends on January 31. References contained in this Report to a given fiscal year refer to the twelve-month period ended January 31 of the succeeding year. For example, our fiscal year ended January 31, 20052006 is referred to in this Report as "fiscal 2004.2005."
Overview
For the last 27 yearsSince 1978, Carreker Corporation has designed, developed, sold and delivered payments-related software and consulting solutions to financial institutions and financial service providers. More recently, we have introduced a business process outsourcing solution to our customers. Our products and services address a broad spectrum of payment activities and are designed to help our clients enhance the performance of their payments businesses; improve operational efficiency in payments processing; enhance revenue and profitability from payments-oriented products and services; reduce losses associated with fraudulent payment transactions; facilitate compliance with risk-related laws and regulations; and/or maximize clients' customer income streams by aligning their customer interactions and products with customer needs. Carreker employed a total of 495 employees at January 31, 2006.
We are organized into three primaryfour business unit operating divisions: Global Payments Technologies ("GPT"), Revenue Enhancement ("RevE") and, Global Payments Consulting ("GPC"). and a Business Process Outsourcing business which is delivered through a majority-owned subsidiary named Carretek LLC ("Carretek") to address the payments outsourcing arena. These operating divisions are operated in discretedistinct yet increasingly synergistic ways to bring value to our clients. In addition we have established a joint venture named Carretek LLC to address the payments outsourcing arena.
Global Payments Technologies. This division is responsible for design, development, sales, and support of our technology solutions. The division has three lines of business with distinct solution offerings: Payments Solutions, Risk Solutions, and Cash & Logistics solutions. Revenue is primarily derived from license fees, implementation fees and maintenance fees. As of January 31, 2006, GPT had 284 employees.
Revenue Enhancement. This highly specialized practice groupdivision provides consulting and software solutions focused on increasing clients' revenue streams. Areas of expertise include fee income, market segmentation, management of customer price structures, account retention, account acquisitions and profitability. A majority of the revenue generated by this division is through benefit-sharing agreements with our customers, recorded as consulting revenue along with license fees, maintenance fees and implementation fees from our CVE software offering. As of January 31, 2006, RevE had 86 employees.
Global Payments Consulting. The objective of this professional services division is to provide our clients with "applied thought leadership" related to the business of payments. Revenue in the GPC division is primarily derived through the delivery of consulting services offered primarily on a time and materials basis to our clients, along with the license fees, maintenance fees and services fees associated with our Float Pricing System software offering and Payments Clearing Model product offering. As of January 31, 2006, GPC had 23 employees.
Carretek. In addition to these three divisions, in fiscal 2003 we formed Carretek LLC.Carretek. Carretek is a transformational business outsourcer for payment and transaction processing jointly owned by Carreker Corporation and Majesco Software, Inc., the U.S. subsidiary of Mastek Limited, a leading Indian outsourcing company with
global operations. As of January 31, 2006, Carretek had 2 U.S. based employees along with 121 offshore personnel of Mastek Limited which perform services for Carretek on a contract basis.
Cost of Revenues and Gross Margins. We strive to control our cost of revenues and thereby maintain or improve our gross margins. The major items impacting cost of consulting, cost of software maintenance and cost of software implementation are driven by personnel, overhead and related expenses. The major items impacting cost of software licenses are amortization of both capitalized and acquired software and also software royalties for software from third parties. While the amortization expense is relatively fixed, the third party royalty expense can vary significantly based on the relative product mix.
Operating Expenses. Operating expenses, including selling, general and administrative and research and development, are substantially driven by personnel and overhead expenses. Other significant operating expenses that we monitor include professional fees, use of contractors, travel, insurance and office services expenses. Additionally in fiscal 2004,As of January 31, 2006, the settlement ofCorporate Account Relationship Management and Marketing staff had 18 employees, and the EPG legal action along with associated legal fees was recorded on the RestructuringCorporate staff which includes Executive Management, Legal, Finance and Other Charges financial statement caption on the Consolidated Statement of Operations.Accounting, Human Resources, Facilities and IT had 82 employees.
Liquidity and Cash Flows. Cash and cash equivalents at January 31, 2006 and January 31, 2005 totaled $29.7 million and 2004 totaled $34.5 million, and $28.6 million, respectively. During fiscal 2004,In addition, we generated $15.3 million in cash from operating activities, used $5.9had $4.7 million of cash for investing activitiesmarketable debt securities at January 31, 2006, as compared to none at January 31, 2005. At January 31, 2006 and used $3.5 million for financing activities. Our primary utilization of cash in fiscal 2004 was to reduce our debt2005, there were no borrowings outstanding under our revolving credit agreement,agreement.
Restatement
We have restated our consolidated financial statements for the year ended January 31, 2004, and our consolidated balance sheet at January 31, 2005, to investcorrect an error identified in deferred revenue resulting primarily from the duplicate recording of a customer software maintenance contract in connection with an accounting system conversion that occurred in October 2002. Based on our development lab infrastructure along withanalysis, software maintenance revenue related to this contract was erroneously recognized twice during the development costs associated with building several new product offerings, especially within our GPT business segment.year ended January 31, 2004. Therefore, the consolidated financial statements as of and for the fiscal year ended January 31, 2004 have been restated to reflect a $2.0 million reduction in software maintenance revenue, and the consolidated balance sheets at January 31, 2004 and 2005 have been restated to reflect a corresponding $2.0 million increase in deferred revenue and accumulated deficit.
Executive Summary
In fiscal 2004, we generated revenueOur consolidated revenues declined 1.9% to $116.6 million in the year ended January 31 2006. We earned net income of $118.9$2.1 million andin the year ended January 31, 2006, compared to a net loss of $1.2 million. Through continuing efforts to improve qualitymillion in the year ended January 31, 2005. The increase in net income was primarily the result of increased consultant utilization and efficiency throughout the company, we generated $15.3 million of cash from operating activities during fiscal 2004. This cash flow allowed us to pay down the remaining $6.3 million of our $30.0 million revolving credit agreement, along with making several investments which enhance and expand our current product offerings. Additionally, we have upgraded both the hardware and software within our development lab in Charlotte, North Carolina.
While we have made progress in reducing bothlowered our cost of revenues and SG&Aa reduction in restructuring and other charges. Our cash balance declined $4.8 million during the year ended January 31, 2006 due to our investment in $4.7 million of marketable debt securities. We also utilized cash to buy back 631,411 shares of our common stock for $3.2 million.
The decline in our revenue was primarily associated with our GPT business segment. Revenue within this segment declined $3.3 million or 4.4% for the year ended January 31, 2006. The decline is primarily in software license revenue within the Payments group. The Payments group includes such products as Image Archive and Exception Management Applications as well as Source Capture, ExchgLink and Image Replacement Document ("IRD") solutions. The decline was primarily the result of continued technology investment delays by our customers and the intensification of competition in this particular space. Additionally, in the year ended January 31, 2005, the Payments group of GPT derived $3.4 million from a software license sale to a single customer of our legacy Check Image Archive product, while the year ended January 31, 2006 did not include any large single sales of this
magnitude. However, GPT's initial Source Capture installation was accepted by our customer and as a result, we recognized $1.6 million or 8.6% of software license revenue in the year ended January 31, 2006.
In absolute dollars, our cost of revenues declined approximately $2.5 million in the year ended January 31, 2006, which allowed our gross margin percentage to increase to 50.5% as compared to 49.4% for the year ended January 31, 2005. Cost savings initiatives, primarily related to a reduction in personnel, resulted in both GPC's cost of consulting and GPT's cost of services being lower in the year ended January 31, 2006. Additionally, during the year ended January 31, 2006, we recorded $4.6 million of amortization of acquired developed technology within cost of revenues—software license. This amortization is primarily associated with the purchase of Check Solutions, Inc. in June 2001 and will be fully amortized in June 2007.
Operating expenses includes selling, general and administrative, research and development, amortization of customer relationships and restructuring and other charges. These expenses declined approximately $2.8 million in the year ended January 31, 2006. Selling, general and administrative expenses have declined approximately $1.0 million for the year ended January 31, 2006. The reductions within selling, general and administrative were primarily related to cost savings from reductions in personnel in our profitability was hamperedcorporate sales function and D&O insurance costs. These reductions have been partially offset by the unfavorable jury verdict awarded to Earnings Performance Group ("EPG") in May 2004. The ultimate settlement andincreased legal fees, totaleddecreased bad debt expense recoveries and increased contract labor and professional fees associated with our ERP system upgrade, which began in the quarter ended April 30, 2005.
In the year ended January 31, 2006, we recorded $918,000 of restructuring and other charges of which $780,000 was associated with the severance and other personnel costs for 29 employees terminated on August 31, 2005, primarily within the GPT business segment. The reductions were implemented in an effort to position GPT for improved long-term profitability. We expect an annual benefit of approximately $3.4 million.$2.4 million from this action. In addition,the year ended January 31, 2005, restructuring and other charges were $3.7 million and included a $1.7 million EPG litigation settlement, approximately $1.7 million of legal costs and $1.5 million of severance, which was partially offset by a $1.2 million reduction in our CheckFlow customer settlement reserve. In the same year, we increasedrecorded $1.4 million related to the amortization of customer relationships associated with the acquisition of Check Solutions, Inc. in June 2001. This customer relationship intangible will be fully amortized in June 2007.
We continue to focus on increasing research and development, particularly within GPT, to enhance our levelexisting product offerings and develop new product offerings, and incurred research and development expenses of Research$9.6 million in the year ended January 31, 2006 compared with $8.6 million in the year ended January 31, 2005. In the year ended January 31, 2006, Source Capture along with several new Cash and Development expenses approximately $1.2 millionRisk solutions were introduced along with a Payments modeling product developed within GPC.
We anticipate revenue growth during the year ended January 31, 2007 due to the availability and anticipated acceptance of several new products and service offerings that were developed during the year ended January 31, 2006 and from new products and services expected to be offered in the year ending January 31, 2007. However, due to a lengthened decision cycle associated with some of the new products, the growth in overall annual revenue is anticipated to be in the latter half of the year. We believe we are well positioned for profitability in the year ending January 31, 2007 as a result of the anticipated revenue growth coupled with ongoing cost containment efforts.
Comparison of Year Ended January 31, 2006 ("Fiscal 2005") to Year Ended January 31, 2005 ("Fiscal 2004") and Year Ended January 31, 2004 ("Fiscal 2003")
Revenues
Revenues by Segment ($ in thousands):
| | | | | 2005 vs. 2004 | 2004 vs. 2003 | |||||||||||||||
|---|---|---|---|---|---|---|---|---|---|---|---|---|---|---|---|---|---|---|---|---|
| | FY 2005 | FY 2004 | FY2003 | $ | % | $ | % | |||||||||||||
| Revenue Enhancement | $ | 37,421 | $ | 37,404 | $ | 38,544 | $ | 17 | — | % | $ | (1,140 | ) | (3.0 | )% | |||||
| Global Payments Technologies | 73,217 | 76,564 | 84,222 | (3,347 | ) | (4.4 | ) | (7,658 | ) | (9.1 | ) | |||||||||
| Global Payments Consulting | 4,908 | 4,784 | 4,101 | 124 | 2.6 | 683 | 16.6 | |||||||||||||
| Business Process Outsourcing | 1,038 | 139 | — | 899 | 646.8 | 139 | — | |||||||||||||
| Total Revenues | $ | 116,584 | $ | 118,891 | $ | 126,867 | $ | (2,307 | ) | (1.9 | )% | $ | (7,976 | ) | (6.3 | )% | ||||
Our decline in total revenues of 1.9% in fiscal 2005, as compared to fiscal 2004, and the decline of 6.3% in fiscal 2004, as compared to fiscal 2003.2003, is concentrated primarily within the GPT segment.
WithinThe decline in revenue within GPT that began in fiscal 2003 has carried through to fiscal 2005. The market's adoption of post-Check 21 related technology has been much slower than expected. We experienced isolated success with our Revenue Enhancement ("RevE")ExchgLink solution while our IRD authoring software and remote Source Capture have experienced greater success with several major banks and the Federal Reserve. For instance, GPT gained acceptance of its initial Source Capture installation and recognized $1.6 million of software license revenue in the quarter ended January 31, 2006. However, widespread adoption of our Check 21 product offerings, generally at smaller financial institutions, has progressed much slower than anticipated.
Our RevE segment we experienced $1.8 million, or 5.5%, growth within ourrevenues were essentially flat in fiscal 2005, as compared to fiscal 2004, and declined 3% in fiscal 2004, as compared to fiscal 2003. In fiscal 2005, traditional RevE contingent consulting revenues; however, we experiencedrevenues declined $3.1 million, or 9.2%, due primarily to a decline of $2.7 million, or 57.9%,in consulting revenues in our foreign markets. This decline in consulting revenues was completely offset by an increase in software license and software implementation services within our Customer Value Enhancement ("CVE")CVE software and proprietary sales management revenue. Traditional consultingoffering, particularly within our foreign markets. In fiscal 2004, CVE software and services revenues increased in both the domestic and international markets. The CVE decline was primarily the result ofdeclined $2.7 million, or 57.9%, as compared to fiscal 2003, as the market softeningsoftened for traditional Customer Relationship Management ("CRM")CRM perpetual license sales, and insales. In response, we have reformulated the CVE business modelproduct offering to reflect term software license arrangements as opposed to traditional perpetual license arrangements. This change in strategy appears to be gaininggained acceptance and in November 2004 the CVE group entered into a 6-year term license with a Top 15 U.S. bank that will increase software and maintenance revenue beginningat several large customers in fiscal 2005. Additionally, in early fiscal 2005, we also contracted with a large international bank for a similar multi-year engagement.
Fiscal 2004 was a year of transition for the Global Payments Technology ("GPT") segment. Several new products were launched such as ExchgLink, Image Inspector and IRD Author. However, we had to shift our image technology strategyWe increased revenues modestly within GPC during the middle of fiscal 2004 because of a change in our market's approach to image exchange and our target customers' timing on implementing these solutions. Additionally in fiscal 2004, we were late to market with our anti-money laundering technology. We just recently introduced the latest components of our CORE (Carreker Online Risk Expert) solution suite. CORE Fraud Manager is a platform that integrates enterprise level risk management for compliance monitoring and fraud detection. The new products are CORE Fraud Manager Wires and CORE Fraud Manager AML. These factors had a negative effect on GPT revenues. For fiscal 2004, total GPT revenues declined $9.7 million, or 11.2%, as compared to fiscal 2003.
Our Global Payments Consulting ("GPC") segment experienced revenue growth of approximately $680,000, or 16.6%, in fiscal 2004. These results reflect an expanded sales focus in this segment as we repositioned this business to focus on Check 21 enterprise-wide payment electronification strategies; image enablement planning and integration and enterprise risk. New leadership has helped refine our consulting offerings with a clear value proposition.
Finally, Carretek is our 51% owned business outsourcer for payment and transaction processing. Carretek was formed in fiscal 2003 and signed its first agreement in the second quarter of fiscal 2004. Fiscal 2004 revenues have been minimal, however in late January 2005, we expanded the scope of our outsourcing engagement with this single customer to include a second set of transaction processing functions. Even with this expanded scope, we do not expect this business to be profitable until the scope with this single customer is expanded to its full capacity or until additional customers are added.
We have continued throughout fiscal 2004 to focus on reducing general and administrative costs to help fund increasing sales and marketing costs in both GPT and GPC, along with increasing research and development costs to enhance our existing product offerings and more importantly, develop new product offerings. We managed to these objectives, however with the increase in our Restructuring and Other Charges, which included the EPG settlement noted above, our total operating costs were essentially flat in fiscal 2004, as compared to fiscal 2003. We are continually evaluating overall expense levels and remain focused on cost containment initiatives.
Comparison of Year Ended January 31, 2005 (Fiscal 2004) to Year Ended January 31, 2004 (Fiscal 2003) and Year Ended January 31, 2003 (Fiscal 2002)
Revenues
Revenues by Segment ($ in thousands):
| | | | | 2004 vs. 2003 | 2003 vs. 2002 | |||||||||||||||
|---|---|---|---|---|---|---|---|---|---|---|---|---|---|---|---|---|---|---|---|---|
| | FY 2004 | FY 2003 | FY2002 | $ | % | $ | % | |||||||||||||
| Revenue Enhancement | $ | 37,404 | $ | 38,544 | $ | 37,176 | $ | (1,140 | ) | (3.0 | )% | $ | 1,368 | 3.7 | % | |||||
| Global Payments Technologies | 76,564 | 86,263 | 100,612 | (9,699 | ) | (11.2 | ) | (14,349 | ) | (14.3 | ) | |||||||||
| Global Payments Consulting | 4,784 | 4,101 | 11,988 | 683 | 16.6 | (7,887 | ) | (65.8 | ) | |||||||||||
| Outsourcing Revenue | 139 | — | — | 139 | — | — | — | |||||||||||||
| Total Revenues | $ | 118,891 | $ | 128,908 | $ | 149,776 | $ | (10,017 | ) | (7.8 | )% | $ | (20,868 | ) | (13.9 | )% | ||||
The decline in revenue within our RevE segment in fiscal 2004, as compared to fiscal 2003, was primarily the result of a $2.7 million, or 57.9%, decline in our CVE software and proprietary sales management revenue. In fiscal 2004, the market softened for traditional CRM license sales and in response we have reformulated the CVE business model to reflect term software license arrangements as opposed to traditional perpetual license arrangements. This change in strategy appears to be gaining acceptance as the CVE group signed one large term license engagement late in fiscal 2004 and have signed another similar engagement internationally in earlythrough fiscal 2005. TheThis increase in revenue within the RevE segment in fiscal 2003, as compared to fiscal 2002, was the result of increased demand for our CVE software offering. CVE revenue increased $1.4 million, or 43.5%, in fiscal 2003. This demand was being driven by the trend among our customers to expend investments in branch locations, resulting in pressure to show greater returns on these branch investments through profitable sales growth, which our CVE solution helps generate.
The declines in revenue within GPT that began in fiscal 2003 also carried over into fiscal 2004. The lack of a strong backlog of contracted sales from fiscal 2003 and reduced contracted sales activity in Q1 and Q3 2004 contributed to the reduced revenue. The decline in sales activity was primarily related to delays in our delivery of new solutions to the market and to unanticipated delays in technology investments by our customers. We also believe some of these delays are due to the fact that we bundle our solutions, which cause a slower sales cycle but typically provides a better value for our customers and the Company. The decline in revenue within the GPT segment in fiscal 2003, as compared to fiscal 2002, was primarily the result of four factors: (i) Fiscal 2002 had a number of transactions for software included inreflects the results for the year that did not involve implementation services and hence revenue was recognized immediately increasing software license revenue in fiscal 2002; (ii) Decisions on technology investments and services projects were delayed out of fiscal 2003 by several of our customers due to the announcement of several mergers involving our customers; (iii) Customer decisions on technology investments were delayed generally out of fiscal 2003 as the industry, our customers, other key constituencies (e.g. Federal Reserve and key processors) and our competitors focused on Check 21 readiness and opportunities; and (iv) The loss of a few opportunities to competitors as these competitors dramatically improved their software offerings and services and offered aggressive pricing proposals.
The increased revenues within GPC in fiscal 2004, as compared to fiscal 2003, reflects the result of expandedintensified sales focus as we completed the repositioning of this business to focus on Check 21 enterprise-wide payment electronification strategies;strategies, image enablement planning and integration and enterprise risk.risk mitigation. Additionally, new leadership in this business was introduced in Q4late fiscal 2004 to capitalize on
the synergistic nature of the GPC and GPT business segments and refine our solutions with a clear value proposition. The declineAdditionally, with the rise in revenues within our GPC segment in fiscal 2003, as compared to fiscal 2002, was the result of three primary factors. In fiscal 2002, the majority of the consulting work performed by GPC was the result of bank consolidation and staff augmentation assignments. Theinterest rates, there has been renewed demand for both of these types of workour Float Analysis and Management Systems and related services which drove modest increases in license and software implementation revenues in late fiscal 2005. Finally, GPC has declined significantly. Late in fiscal 2002, we began to reposition this segment to address enterprise-wide payment electronification strategiesdeveloped a new Payments Financial Modeling application that has gained acceptance at one major customer and image enablement planning and integration. The timeframe to accomplish these objectives has been longer than anticipated, and carried over into fiscal 2004.licensed to another with revenue expected to be recognized in mid-fiscal 2006.
Our outsourcing revenue is derived through Carretek, our 51% owned business which offers outsourcing for payment and transaction processing. Carretek was formed in fiscal 2003 and signed its
first agreement in the second quarter of fiscal 2004. The fiscal 2004 revenues have beenwere minimal; however in late Januaryfiscal 2005, we increased staffing under our initial contract and expanded our scope with this single customer to include a second and third set of transaction processing functions.
Overall, as we look across our three major business segments along with Carretek, we believe that we are well positioned, and have a competitive advantage, to capitalize on the significant changes brought about by the Check 21 legislation, USA Patriot Act and Basel II through our subject matter expertise in the impacted areas. Based on this outlook, we anticipate contracted sales will improve in fiscal 2005 as an expanded array of new products are available and have solid references.
Consulting Fees ($ in thousands):
| | | | | 2004 vs. 2003 | 2003 vs. 2002 | |||||||||||||||
|---|---|---|---|---|---|---|---|---|---|---|---|---|---|---|---|---|---|---|---|---|
| | FY 2004 | FY 2003 | FY2002 | $ | % | $ | % | |||||||||||||
| Consulting Fees | $ | 37,193 | $ | 34,064 | $ | 39,204 | $ | 3,129 | 9.2 | % | $ | (5,140 | ) | (13.1 | )% | |||||
| | | | | 2005 vs. 2004 | 2004 vs. 2003 | |||||||||||||||
|---|---|---|---|---|---|---|---|---|---|---|---|---|---|---|---|---|---|---|---|---|
| | FY 2005 | FY 2004 | FY2003 | $ | % | $ | % | |||||||||||||
| Consulting | $ | 33,244 | $ | 37,193 | $ | 34,064 | $ | (3,949 | ) | (10.6 | )% | $ | 3,129 | 9.2 | % | |||||
Most of our consulting revenues are derived from our RevE business segment. Consulting revenues derived from our RevE segment declined 9.2% to $30.9 million in fiscal 2005, as compared to fiscal 2004, and increased 5.5% to $34.0 million in fiscal 2004 from $32.3 million in fiscal 2003, and increased 1.0% in fiscal 2003 from $31.9 million in fiscal 2002.2003. Within RevE, we continue to focus on maximizing the value to our existing customer base while expanding our expertise to new customers, both domestically and internationally. In fiscal 2004, we had 31 revenue producing engagementsThe fluctuations over the three year period are primarily the result of which 5 were international and these international engagements yielded 28.6% of RevE'sfluctuating contingent consulting revenues. This compares to 22 active engagements of which 3 were international in fiscal 2003 and 28 active engagements of which 7 were international in fiscal 2002. Additionally, RevE consulting revenuerevenues derived from our international customers increased to $9.7 million in fiscal 2004 from $8.1 million in fiscal 2003markets that were negatively influenced by customer mergers and increased from $7.1 million in fiscal 2002. We anticipate thatacquisitions. Domestically, RevE consulting revenues inhave remained relatively flat between $24.0 and $25.0 million for each fiscal 2005 will be higher than fiscal 2004 levels.year.
Consulting revenues derived from our GPC segment declined 15.7% to $2.3 million in fiscal 2005 and increased 72.6% to $2.8 million in fiscal 2004 from $1.6 million in fiscal 2003, and decreased 76.9%2003. The decline in fiscal 2003 from $6.9 million2005 was primarily attributable to customer scheduling and project prioritization delays on engagements in fiscal 2002.which revenue is recognized on a percent-complete basis. The increase in consulting revenue in fiscal 2004 iswas attributable to the momentum gained as we completed our repositioning of this business to focus on Check 21 enterprise-wide payment strategies and image enablement planning and integration. The decline in consulting revenue in fiscal 2003, as compared to fiscal 2002, was due to the fact that the majority of work performed by GPC in fiscal 2002 and prior years was related to banks consolidating and reducing redundant operations, and to staff augmentation assignments. During fiscal 2002, the demand for this type of work declined significantly and in fiscal 2003 we took the necessary steps to reposition this business as described above. While we have gained some momentum in these areas, we continue to be cautiously optimistic about the future prospects of the GPC segment.
Software License Fees ($ in thousands):
| | | | | 2004 vs. 2003 | 2003 vs. 2002 | |||||||||||||||
|---|---|---|---|---|---|---|---|---|---|---|---|---|---|---|---|---|---|---|---|---|
| | FY 2004 | FY 2003 | FY2002 | $ | % | $ | % | |||||||||||||
| Software License Fees | $ | 20,429 | $ | 27,365 | $ | 37,946 | $ | (6,936 | ) | (25.3 | )% | $ | (10,581 | ) | (27.9 | )% | ||||
| | | | | 2005 vs. 2004 | 2004 vs. 2003 | |||||||||||||||
|---|---|---|---|---|---|---|---|---|---|---|---|---|---|---|---|---|---|---|---|---|
| | FY 2005 | FY 2004 | FY2003 | $ | % | $ | % | |||||||||||||
| Software License | $ | 18,277 | $ | 20,429 | $ | 27,365 | $ | (2,152 | ) | (10.5 | )% | $ | (6,936 | ) | (25.3 | )% | ||||
The majorityMost of our software license revenues are derived from our GPT business segment. Software license revenues from our GPT business segment decreased 15.3% to $17.0 million in fiscal 2005 and decreased 18.6% to $20.1 million in fiscal 2004 from $24.7 million in fiscal 2003 and decreased 31.7% in fiscal 2003 from $36.1 million in fiscal 2002.2003.
License revenues peaked during the first two quarters of fiscal 2002 due to sales of $7.5 million of software expansion licenses which did not require any implementation services and therefore were recognized immediately. In the latter half of fiscal 2002, the number and dollar amount of our software license arrangements began to decline. The decline was in part due to the uncertainty of our special review and ultimate financial statement restatement; however, ourOur customers also began to delay their Payment solution purchasing decisions primarily due to both economic and legislative changes within the banking industry, namely Check 21, which was ultimately signed into law in October 2003 and went into effect in October 2004. Check 21 permits U.S. banks to accept digital images of checks the same way they accept a paper check. SeveralWe have introduced several new product initiatives were launchedPayment solution products to compete in the latter half of fiscal 2003 and continued into fiscal 2004. While these products can operate independently and eventhis space such as ExchgLink, our solution for exchanging images with other vendor software, these products were developedbanks, IRD Author which generates and processes substitute checks often referred to be bundled togetheras image replacement documents ("IRD"), Image Inspector which ensures image quality and finally, Source Capture which allows customers to provide one total solution to our customers which we believe provides increased value. This bundling also tends to delaycapture deposits at branches, ATM's and bank customer sites. The decline in paper checks over the sales cycle. We believe that our customers' investment decisionspast three years has been moderate and the timing of these decisionsmost banks have become increasingly visible in the latter half of fiscal 2004. Combining these factors, we are cautiously optimistic about deriving license revenue growth for fiscal 2005, as compared to fiscal 2004 levels.not fully implemented image exchange.
Software license revenues from our CVE product line,offering, within the RevE business segment, increased 218.2% to $1.0 million in fiscal 2005 and decreased 87.5% to $326,000 in fiscal 2004 from $2.6 million in fiscal 2003 and increased 171.9% in fiscal 2003 from $959,000 in fiscal 2002.2003. The decline in fiscal 2004 and the increase over fiscal 2002 was primarily the result of two large international
engagements performedcompleted in fiscal 2003. Also in fiscal 2003 and carrying over until fiscal 2004, this group lacked sales leadership and capacity. Two new sales persons were hired in the quarterly period ended October 31, 2004, and in November 2004market softened for traditional CRM perpetual license sales. In response, we reformulated the CVE groupbusiness model to reflect term software license arrangements as opposed to traditional, one-time perpetual license arrangements. This change in strategy gained acceptance and two multi-year contracts were signed a multi-year contractin fiscal 2005 to provide software, services and maintenance to a large domestic bank. However, the impact on fiscal 2004 was negligible.maintenance.
Software Maintenance Fees ($ in thousands):
| | | | | 2004 vs. 2003 | 2003 vs. 2002 | |||||||||||||||
|---|---|---|---|---|---|---|---|---|---|---|---|---|---|---|---|---|---|---|---|---|
| | FY 2004 | FY 2003 | FY2002 | $ | % | $ | % | |||||||||||||
| Software Maintenance Fees | $ | 43,293 | $ | 45,122 | $ | 41,858 | $ | (1,829 | ) | (4.1 | )% | $ | 3,264 | 7.8 | % | |||||
| | | | | 2005 vs. 2004 | 2004 vs. 2003 | |||||||||||||||
|---|---|---|---|---|---|---|---|---|---|---|---|---|---|---|---|---|---|---|---|---|
| | FY 2005 | FY 2004 | FY2003 | $ | % | $ | % | |||||||||||||
| Software Maintenance | $ | 42,442 | $ | 43,293 | $ | 43,081 | $ | (851 | ) | (2.0 | )% | $ | 212 | 0.5 | % | |||||
As with software license fees, the majoritymost of our maintenance fees are derived from our GPT business segment. Software maintenance fees are paid pursuant to annually renewable product and telephone support agreements with our software customers. The annual maintenance fee is generally paid by the customer at the beginning of the maintenance period and we recognize this maintenance revenue ratably over the term of the related contract. If the annual maintenance fee is not paid at the beginning of the maintenance period, we defer revenue recognition until the time that the maintenance fee is paid by the customer. When the payment is received, maintenance revenue is recognized for the period that maintenance revenue was previously deferred. Also, maintenance contracts usually carry annual maintenance fee escalation clauses typically based on an index, such as the consumer price
index. While we did increase the maintenance fees for selected customers and products in each of the last two fiscal 2004,years, these increases were offset by maintenance cancellations caused by major bank mergers and also multi-year declines in new software license revenue described above. Finally, during the quarter ended January 31, 2006, three large maintenance customers did not pay $6.5 million of maintenance by January 31, 2006 which had a major customer that gave noticenegative effect of their intent to not renew their $2.5 million maintenance contract forapproximately $540,000 on the quarter and fiscal 2004. The increase in maintenance fees in fiscal 2003 is due primarily to the expanded product installation base of the products acquired in the Check Solutions acquisition in fiscal 2001. We are projecting a flat to slightly higher maintenance revenue in fiscal 2005 over fiscal 2004 maintenance revenue levels.year.
Software Implementation Feesand Other Services ($ in thousands):
| | | | | 2004 vs. 2003 | 2003 vs. 2002 | |||||||||||||||
|---|---|---|---|---|---|---|---|---|---|---|---|---|---|---|---|---|---|---|---|---|
| | FY 2004 | FY 2003 | FY2002 | $ | % | $ | % | |||||||||||||
| Software Implementation Fees | $ | 14,799 | $ | 18,103 | $ | 24,310 | $ | (3,304 | ) | (18.3 | )% | $ | (6,207 | ) | (25.5 | )% | ||||
| | | | | 2005 vs. 2004 | 2004 vs. 2003 | |||||||||||||||
|---|---|---|---|---|---|---|---|---|---|---|---|---|---|---|---|---|---|---|---|---|
| | FY 2005 | FY 2004 | FY 2003 | $ | % | $ | % | |||||||||||||
| Software Implementation and Other Services | $ | 18,457 | $ | 14,799 | $ | 18,103 | $ | 3,658 | 24.7 | % | $ | (3,304 | ) | (18.3 | )% | |||||
In the majority of our software customer arrangements, installation services are provided to the customer. The majority of our software implementation fees are derived from our GPT business segment. InHowever, the majority24.7% increase in software implementation and other services in fiscal 2005, as compared to fiscal 2004, was primarily the result of a $2.7 million or 403.5% increase in service revenue related to our customer arrangements, installationCVE product offering within the RevE business segment. GPT services are provided to the customer.increased $595,000 or 4.4% and GPC services increased $348,000 or 46.3%. In fiscal 2004, andas compared to fiscal 2003, the decline in software implementation fees paralleledreflect the decline in software license fees. We estimate modest growth in fiscal 2005 for software implementation revenue consistent with our anticipated modest increase in software license revenue.fees within GPT.
Outsourcing Service FeesServices ($ in thousands):
| | | | | 2004 vs. 2003 | 2003 vs. 2002 | |||||||||||||||
|---|---|---|---|---|---|---|---|---|---|---|---|---|---|---|---|---|---|---|---|---|
| | FY 2004 | FY 2003 | FY2002 | $ | % | $ | % | |||||||||||||
| Outsourcing Service Fees | $ | 139 | $ | — | $ | — | $ | 139 | — | % | $ | — | — | % | ||||||
| | | | | 2005 vs. 2004 | 2004 vs. 2003 | |||||||||||||||
|---|---|---|---|---|---|---|---|---|---|---|---|---|---|---|---|---|---|---|---|---|
| | FY 2005 | FY 2004 | FY2003 | $ | % | $ | % | |||||||||||||
| Outsourcing Services | $ | 1,038 | $ | 139 | $ | — | $ | 899 | 646.8 | % | $ | 139 | — | % | ||||||
Our outsourcing service revenue is derived through Carretek, our 51% owned business which outsources payment and transaction processing. Carretek was formed in fiscal 2003 and signed its first agreement in the second quarter of fiscal 2004. The fiscal 2004 revenues have beenwere minimal; however in late Januaryfiscal 2005, we expanded our scope of business with this customer to include a second and third set of transaction processing functions. GivenWhile we continue to pursue opportunities to expand the scope of the services we provide to our current outlook,existing customer, we believe that the revenues derived from this business will increase significantly on a percentage basis over fiscal 2004 levels and increase modestlydo not expect significant growth on an absolute dollar basis.basis until additional outsourcing customers are obtained.
Out-of-Pocket Expense Reimbursements ($ in thousands):
| | | | | 2004 vs. 2003 | 2003 vs. 2002 | |||||||||||||||
|---|---|---|---|---|---|---|---|---|---|---|---|---|---|---|---|---|---|---|---|---|
| | FY 2004 | FY 2003 | FY2002 | $ | % | $ | % | |||||||||||||
| Out-of-Pocket Expense Reimbursements | $ | 3,038 | $ | 4,254 | $ | 6,458 | $ | (1,216 | ) | (28.6 | )% | $ | (2,204 | ) | (34.1 | )% | ||||
| | | | | 2005 vs. 2004 | 2004 vs. 2003 | |||||||||||||||
|---|---|---|---|---|---|---|---|---|---|---|---|---|---|---|---|---|---|---|---|---|
| | FY 2005 | FY 2004 | FY 2003 | $ | % | $ | % | |||||||||||||
| Out-of-Pocket Expense Reimbursements | $ | 3,126 | $ | 3,038 | $ | 4,254 | $ | 88 | 2.9 | % | $ | (1,216 | ) | (28.6 | )% | |||||
These reimbursements were relatively flat on a consolidated basis in fiscal 2005, as compared to fiscal 2004. The decrease in these reimbursements in fiscal 2004, as compared to fiscal 2003, is the result of the decline in implementation engagements within the GPT business segment. The decrease in these reimbursements in fiscal 2003, as compared to fiscal 2002, is primarily due to the decline in the volume within our GPC business segment. The majority of these GPC engagements in fiscal 2002 was related to staff augmentation assignments which required our employees to be at the customer location for extended periods of time, which gives rise to higher out-of-pocket expense reimbursements. In fiscal 2005, we expect these reimbursements to increase modestly with our anticipated increases in both software implementation and consulting revenues.
Cost of Revenues
Cost of Revenues by Segment ($ in thousands):
| | | | | | 2004 vs. 2003 | 2003 vs. 2002 | | | | | 2005 vs. 2004 | 2004 vs. 2003 | ||||||||||||||||||||||||||||||
|---|---|---|---|---|---|---|---|---|---|---|---|---|---|---|---|---|---|---|---|---|---|---|---|---|---|---|---|---|---|---|---|---|---|---|---|---|---|---|---|---|---|---|
| | | FY 2004 | FY 2003 | FY2002 | $ | % | $ | % | | FY 2005 | FY 2004 | FY 2003 | $ | % | $ | % | ||||||||||||||||||||||||||
| Revenue Enhancement | Revenue Enhancement | $ | 17,818 | $ | 19,024 | $ | 17,855 | $ | (1,206 | ) | (6.3 | )% | $ | 1,169 | 6.6 | % | Revenue Enhancement | $ | 19,385 | $ | 17,818 | $ | 19,024 | $ | 1,567 | 8.8 | % | $ | (1,206 | ) | (6.3 | )% | ||||||||||
| % of revenue | 47.6 | % | 49.4 | % | 48.0 | % | % of revenue | 51.8 | % | 47.6 | % | 49.4 | % | |||||||||||||||||||||||||||||
| Global Payments Technologies | Global Payments Technologies | $ | 36,612 | $ | 38,551 | $ | 40,439 | $ | (1,939 | ) | (5.0 | )% | $ | (1,888 | ) | (4.7 | )% | Global Payments Technologies | $ | 32,847 | $ | 36,612 | $ | 38,551 | $ | (3,765 | ) | (10.3 | )% | $ | (1,939 | ) | (5.0 | )% | ||||||||
| % of revenue | 47.8 | % | 44.7 | % | 40.2 | % | % of revenue | 44.9 | % | 47.8 | % | 45.8 | % | |||||||||||||||||||||||||||||
| Global Payments Consulting | Global Payments Consulting | $ | 5,124 | $ | 6,571 | $ | 12,945 | $ | (1,447 | ) | (22.0 | )% | $ | (6,374 | ) | (49.2 | )% | Global Payments Consulting | $ | 3,562 | $ | 5,124 | $ | 6,571 | $ | (1,562 | ) | (30.5 | )% | $ | (1,447 | ) | (22.0 | )% | ||||||||
| % of revenue | 107.1 | % | 160.2 | % | 108.0 | % | % of revenue | 72.6 | % | 107.1 | % | 160.2 | % | |||||||||||||||||||||||||||||
| Outsourcing Services | $ | 616 | $ | — | $ | — | $ | 616 | — | % | $ | — | — | % | ||||||||||||||||||||||||||||
| Business Process Outsourcing | Business Process Outsourcing | $ | 1,914 | $ | 616 | $ | — | $ | 1,298 | 210.7 | % | $ | 616 | — | % | |||||||||||||||||||||||||||
| % of revenue | 443.2 | % | — | % | — | % | % of revenue | 184.4 | % | 443.2 | % | — | % | |||||||||||||||||||||||||||||
| Total Cost of Revenues | Total Cost of Revenues | $ | 60,170 | $ | 64,146 | $ | 71,239 | $ | (3,976 | ) | (6.2 | )% | $ | (7,093 | ) | (10.0 | )% | Total Cost of Revenues | $ | 57,708 | $ | 60,170 | $ | 64,146 | $ | (2,462 | ) | (4.1 | )% | $ | (3,976 | ) | (6.2 | )% | ||||||||
| % of revenue | 50.6 | % | 49.8 | % | 47.6 | % | % of revenue | 49.5 | % | 50.6 | % | 50.6 | % | |||||||||||||||||||||||||||||
The decrease in total cost of revenues of $2.5 million in fiscal 2005, as compared to fiscal 2004, was primarily the result of lower personnel and personnel related costs within both GPT and GPC business segments, partially offset by increased personnel and third party contractor costs to service our several large CVE contracts within the RevE segment and increased costs to service our outsourcing customer. The decreased costs within GPT are primarily the result of expense reduction initiatives which began in late fiscal 2004 and continued in the quarter ended October 31, 2005 when GPT further reduced its workforce by 29 employees to further reduce costs and improve utilization. The decrease in total cost of revenues in absolute dollars of $4.0 million in fiscal 2004, as compared to fiscal 2003, was primarily the result of lower personnel and personnel related costs within all three of our majorRevE, GPT and GPC business segments. These savings were partially offset by the costs of Carretek, our 51% owned business process outsourcer which only has one customer and has not achieved the anticipated economies of scale. The total cost of revenues was 50.6% of total revenue in fiscal 2004. In fiscal 2005, we expect cost of revenues in absolute dollars to increase slightly; however, the total cost of revenues as a percentage of total revenues is expected to decline.outsourcer.
The decrease in total cost of revenues in absolute dollars of $7.1 million in fiscal 2003, as compared to fiscal 2002, was primarily the result of lower personnel and outside independent contractor and consulting costs within the GPC business segment.
Cost of Consulting ($ in thousands):
| | | | | 2004 vs. 2003 | 2003 vs. 2002 | ||||||||||||||||
|---|---|---|---|---|---|---|---|---|---|---|---|---|---|---|---|---|---|---|---|---|---|
| | FY 2004 | FY 2003 | FY2002 | $ | % | $ | % | ||||||||||||||
| Cost of Consulting | $ | 18,989 | $ | 20,470 | $ | 25,067 | $ | (1,481 | ) | (7.2 | )% | $ | (4,597 | ) | (18.3 | )% | |||||
| % of consulting revenue | 51.1 | % | 60.1 | % | 63.9 | % | |||||||||||||||
| | | | | 2005 vs. 2004 | 2004 vs. 2003 | ||||||||||||||||
|---|---|---|---|---|---|---|---|---|---|---|---|---|---|---|---|---|---|---|---|---|---|
| | FY 2005 | FY 2004 | FY 2003 | $ | % | $ | % | ||||||||||||||
| Cost of Consulting | $ | 17,186 | $ | 18,989 | $ | 20,470 | $ | (1,803 | ) | (9.5 | )% | $ | (1,481 | ) | (7.2 | )% | |||||
| % of consulting revenue | 51.7 | % | 51.1 | % | 60.1 | % | |||||||||||||||
The cost of consulting consists primarily of personnel costs related to our consulting engagements within both our Revenue EnhancementRevE and GPC business segments. The decline in absolute dollars of $1.8 million in fiscal 2005, as compared to fiscal 2004, was primarily the result of a $1.3 million decline in cost of consulting within our GPC business segment. The cost reduction efforts within our GPC business segment that began in late fiscal 2002 continued throughout the reported periods to bring costs, especially personnel and related costs, more in line with expected consulting revenues. The decline in absolute dollars of $1.5 million in fiscal 2004, along with the decline in consulting costs as a percentage of consulting revenue in fiscal 2004, as compared to fiscal 2003, was primarily the result of a $1.3 million, or 25.8%, decline in the cost of consulting within our GPC business segment. The cost reduction efforts within our GPC business segment that began in late fiscal 2002 continued into fiscal 2004 to bring costs, especially personnel and related costs, more in line with the expected consulting revenues.discussed above. RevE's cost of consulting slightly declined by $491,000 or 3.3% in fiscal 2005 and remained flat in fiscal 2004, as compared to fiscal 2003. The decline in absolute dollars of $4.6 million along with the decline in consulting costs as a percentage of consulting revenue in fiscal 2003 as compared to fiscal 2002 is the result of a $4.7 million or 48.2% decline in the consulting costs within the GPC business segment. These cost reduction efforts were primarily lower personnel and independent contractor costs in response to less demand for our bank consolidation and staff augmentation services.
Cost of Software Licenses ($ in thousands):
| | | | | 2004 vs. 2003 | 2003 vs. 2002 | ||||||||||||||||
|---|---|---|---|---|---|---|---|---|---|---|---|---|---|---|---|---|---|---|---|---|---|
| | FY 2004 | FY 2003 | FY2002 | $ | % | $ | % | ||||||||||||||
| Cost of Software Licenses | $ | 7,960 | $ | 8,020 | $ | 7,701 | $ | (60 | ) | (0.8 | )% | $ | 319 | 4.1 | % | ||||||
| % of software license revenue | 39.0 | % | 29.3 | % | 20.3 | % | |||||||||||||||
| | | | | 2005 vs. 2004 | 2004 vs. 2003 | ||||||||||||||||
|---|---|---|---|---|---|---|---|---|---|---|---|---|---|---|---|---|---|---|---|---|---|
| | FY 2005 | FY 2004 | FY 2003 | $ | % | $ | % | ||||||||||||||
| Cost of Software Licenses | $ | 7,962 | $ | 7,960 | $ | 8,020 | $ | 2 | — | % | $ | (60 | ) | (0.8 | )% | ||||||
| % of software license revenue | 43.6 | % | 39.0 | % | 29.3 | % | |||||||||||||||
The cost of software licenses consists principally of amortization of capitalized and acquired software costs along with royalties payable to third parties. The cost of software licenses was relatively flat in fiscal 2004, as compared to fiscal 2003. The decrease in royalty expense, due to a lower volume of software contracts, was offset by increased amortization expense related to our ExchgLink product offering and the acquired developed technology related to the purchase of an anti-money laundering software solution purchased for $1.5 million in the third quarter of fiscal 2003. The increase in absolute dollars of $319,000 in fiscal 2003, as compared to fiscal 2002, is primarily the result of increased royalty expense.all three annual periods. The increase in the cost of software licenses, as a percentage of software license revenue, is primarily the result of a 27.9%33.2% decline in software license revenue experienced infrom fiscal 2003.2003 through fiscal 2005.
In connection with software license, maintenance and certain consulting agreements entered into with certain banks and purchase agreements with vendors under which we acquiredacquire software technology used in products sold to our customers, we are required to pay royalties on sales of certain software products. Under these arrangements, we recognize royalty expense when the associated revenue is recognized. The royalty percentages generally range from 20% to 50% of the associated revenue. Approximately $1.9$2.0 million, $2.5$1.9 million and $2.5 million of royalty expense was recorded under these agreements and charged to cost of software licenses in the fiscal years ended January 31, 2006, 2005 2004 and 2003,2004, respectively. Depending on our future product mix, our margins from software license fees may be negatively impacted by increased software royalty expense.
Write-off of Capitalized Software Costs and Prepaid Software Royalties: During the quarterly period ended January 31, 2003, in connection with our periodic impairment review of our portfolio of software products, the eiManager product acquired in the AIS business combination in January 2000 was deemed to be impaired. Based on the Company's calculation of the expected future cash flows of the product, a $586,000 non-cash charge was recorded.
Effective June 2001, we entered into a software license agreement with Actuate Corporation in which the Company would integrate Actuate Corporation's software with our Global Tracking and Cash Solutions within the Global Payments Technologies business segment. We prepaid $400,000 for 40 copies of the software. Based on the expected sales forecasts of this product a $368,000 non-cash charge was recorded in the quarterly period ended January 31, 2003.
These costs are summarized below (in thousands):
| | Write-off of Capitalized Software Costs and Prepaid Software Royalties | ||
|---|---|---|---|
| Year Ended January 31, 2003 | |||
| Capitalized eiManager product costs | $ | 586 | |
| Write-off of prepaid software royalties with Actuate Corporation. | 368 | ||
| Total recorded in the year ended January 31, 2003 | $ | 954 | |
In fiscal 2005, we do not expect any additional impairments of capitalized software or prepaid software royalties. However, if market conditions deteriorate or demand for software solutions in which we have capitalized software, or acquired developed technology is not what we expected, these assets may become impaired and subject to a charge to earnings.
Cost of Software Maintenance ($ in thousands):
| | | | | 2004 vs. 2003 | 2003 vs. 2002 | ||||||||||||||||
|---|---|---|---|---|---|---|---|---|---|---|---|---|---|---|---|---|---|---|---|---|---|
| | FY 2004 | FY 2003 | FY2002 | $ | % | $ | % | ||||||||||||||
| Cost of Software Maintenance | $ | 14,771 | $ | 13,420 | $ | 10,773 | $ | 1,351 | 10.1 | % | $ | 2,647 | 24.6 | % | |||||||
| % of software maintenance revenue | 34.1 | % | 29.7 | % | 25.7 | % | |||||||||||||||
| | | | | 2005 vs. 2004 | 2004 vs. 2003 | ||||||||||||||||
|---|---|---|---|---|---|---|---|---|---|---|---|---|---|---|---|---|---|---|---|---|---|
| | FY 2005 | FY 2004 | FY2003 | $ | % | $ | % | ||||||||||||||
| Cost of Software Maintenance | $ | 14,209 | $ | 14,771 | $ | 13,420 | $ | (562 | ) | (3.8 | )% | $ | 1,351 | 10.1 | % | ||||||
| % of software maintenance revenue | 33.5 | % | 34.1 | % | 31.2 | % | |||||||||||||||
Cost of maintenance consists primarily of personnel and facility costs to provide telephone support, product defect support and other enhancements to our existing products which are not significant enough to extend the product's life cycle, or substantially increase its marketability. These costs are primarily contained within our GPT business segment. The increasedecline in costs of maintenance in absolute dollars of $1.4 million$562,000 or 3.8% in fiscal 2005, as compared to fiscal 2004, is primarily the result of reduced personnel and $2.6personnel related costs within the GPT business segment. This reduction in costs was primarily in the last half of fiscal 2005 and was the result of the personnel reductions carried out at the beginning of the quarter ended October 31, 2005. The increase in cost of maintenance in absolute dollars of $1.4 million in fiscal 2004, andas compared to fiscal 2003, iswas the result of traditional research and development employees working on software maintenance projects that integrated and enhanced our legacy products in preparation for new technology and new product offerings.
The annual maintenance fee is generally paid by the customer at the beginning of the maintenance period and we recognize this maintenance revenue ratably over the term of the related contract. If the annual maintenance fee is not paid at the beginning of the maintenance period, we defer revenue recognition until the time that the maintenance fee is paid by the customer. When the payment is received, maintenance revenue is recognized for the period that maintenance revenue was previously deferred. As a result, our cost of software maintenance as a percentage of related maintenance revenue will also fluctuate.
Cost of Software Implementation and Other Services ($ in thousands):
| | | | | 2004 vs. 2003 | 2003 vs. 2002 | ||||||||||||||||
|---|---|---|---|---|---|---|---|---|---|---|---|---|---|---|---|---|---|---|---|---|---|
| | FY 2004 | FY 2003 | FY2002 | $ | % | $ | % | ||||||||||||||
| Cost of Software Implementation | $ | 14,747 | $ | 17,901 | $ | 19,496 | $ | (3,154 | ) | (17.6 | )% | $ | (1,595 | ) | (8.2 | )% | |||||
| % of software implementation revenue | 99.7 | % | 98.9 | % | 80.2 | % | |||||||||||||||
| | | | | 2005 vs. 2004 | 2004 vs. 2003 | ||||||||||||||||
|---|---|---|---|---|---|---|---|---|---|---|---|---|---|---|---|---|---|---|---|---|---|
| | FY 2005 | FY 2004 | FY2003 | $ | % | $ | % | ||||||||||||||
| Cost of Software Implementation and Other Services | $ | 13,334 | $ | 14,747 | $ | 17,901 | $ | (1,413 | ) | (9.6 | )% | $ | (3,154 | ) | (17.6 | )% | |||||
| % of software implementation and other services revenue | 72.2 | % | 99.6 | % | 98.9 | % | |||||||||||||||
CostsCost of software implementation consistconsists primarily of personnel and facility costs to provide software implementation and project management support to customer software implementations primarily within our GPT business segment. The continued decline in costs of software implementation and other services of $1.4 million or 9.6% in fiscal 2005, as compared to fiscal 2004, was the result of additional reductions in personnel and personnel related costs within GPT. GPT reduced cost of software implementation and other services costs by $3.0 million or 22.7% in fiscal 2005, as compared to fiscal 2004. These personnel reductions began in late fiscal 2004 and continued through the quarter ended October 31, 2005. These GPT cost reductions dramatically decreased the overall percentage of the costs of software implementation and other services as a percentage of software implementation and other service revenue to 72.2% in fiscal 2005 from 99.6% in fiscal 2004. The declines in cost of software implementation and other services in absolute dollars created by GPT in fiscal 2005 described above were partially offset by increased costs within RevE's CVE group of $1.7 million or 195.3%; however, these costs drove increased CVE services revenue of $2.7 million in fiscal 2005. The decline in cost of software implementation and other services in absolute dollars of $3.2 million in fiscal 2004, as compared to fiscal 2003, was primarily driven by a $2.1 million, or 13.8%, decline in these costs within the GPT business segment and a $1.2 million decline within the CVE software groupproduct offering contained
in the RevE business segment. In both cases, the decline in these costs was the result of a reduction in new software license and implementation projects contracted in fiscal 2004. The decline in costs iswas mostly attributable to a reduction in personnel who were either terminated or reassigned within the Company. The decline in costs of software implementation in absolute dollars of $1.6 million in fiscal 2003, as compared to fiscal 2002, was primarily driven by a $1.0 million decline in the fourth quarter of fiscal 2003, as a result of the decline in new software license and implementation projects contracted and also the completion of an implementation project at the Federal Reserve. The increase in the percentage of software implementation costs, as a percentage of software implementation revenue, is the result of the decline of software implementation revenue discussed above.personnel.
Cost of Outsourcing Services FeesService ($ in thousands):
| | | | | 2004 vs. 2003 | 2003 vs. 2002 | ||||||||||||||||
|---|---|---|---|---|---|---|---|---|---|---|---|---|---|---|---|---|---|---|---|---|---|
| | FY 2004 | FY 2003 | FY2002 | $ | % | $ | % | ||||||||||||||
| Cost of Outsourcing Services Fees | $ | 616 | $ | — | $ | — | $ | 616 | — | % | $ | — | — | % | |||||||
| % of outsourcing services revenue | 443.2 | % | — | % | — | % | |||||||||||||||
| | | | | 2005 vs. 2004 | 2004 vs. 2003 | ||||||||||||||||
|---|---|---|---|---|---|---|---|---|---|---|---|---|---|---|---|---|---|---|---|---|---|
| | FY 2005 | FY 2004 | FY2003 | $ | % | $ | % | ||||||||||||||
| Cost of Outsourcing Service | $ | 1,914 | $ | 616 | $ | — | $ | 1,298 | 210.7 | % | $ | 616 | — | % | |||||||
| % of outsourcing services revenue | 184.4 | % | 443.2 | % | — | % | |||||||||||||||
The increase in the cost of outsourcing service fees iswas due to the creation and continuing operation of Carretek, our 51% owned business outsourcer for payment and transaction processing. In fiscal 2005 and 2004, this business only had a single customer. InHowever, in fiscal 2005, we anticipate theexpanded our scope with this single customer from outsourcing service fees cost of revenues, on an absolute dollar basisone function to increase and as a percentage of outsourcing service fee revenue,three functions, which resulted in increased costs in this area due to decline as we expand the scope of this work.more contract personnel costs incurred with our offshore partner's parent company, Mastek Limited.
Out-of-Pocket Expenses ($ in thousands):
| | | | | 2004 vs. 2003 | 2003 vs. 2002 | ||||||||||||||||
|---|---|---|---|---|---|---|---|---|---|---|---|---|---|---|---|---|---|---|---|---|---|
| | FY 2004 | FY 2003 | FY2002 | $ | % | $ | % | ||||||||||||||
| Cost of Out-of-Pocket Expenses | $ | 3,087 | $ | 4,335 | $ | 7,248 | $ | (1,248 | ) | (28.8 | )% | $ | (2,913 | ) | (40.2 | )% | |||||
| % of out-of-pocket expense reimbursements | 101.6 | % | 101.9 | % | 112.2 | % | |||||||||||||||
| | | | | 2005 vs. 2004 | 2004 vs. 2003 | ||||||||||||||||
|---|---|---|---|---|---|---|---|---|---|---|---|---|---|---|---|---|---|---|---|---|---|
| | FY 2005 | FY 2004 | FY2003 | $ | % | $ | % | ||||||||||||||
| Cost of Out-of-Pocket Expenses | $ | 3,103 | $ | 3,087 | $ | 4,335 | $ | 16 | 0.5 | % | $ | (1,248 | ) | (28.8 | )% | ||||||
| % of out-of-pocket expense reimbursements | 99.3 | % | 101.6 | % | 101.9 | % | |||||||||||||||
These costs represent travel, meals and other sundry expenses incurred by our employees. These costs are invoiced to the customer, without mark-up, usually on a monthly basis. Certain customer contracts do contain expense maximums, soThe costs have remained relatively flat in certain cases not all expenses incurred can be passed along to the customer.fiscal 2005. The declines in these costs for both fiscal 2004 and fiscal 2003 arewas primarily the result of the decline in new consulting projects contracted for within the GPC business segment and the decline in new implementation projects contracted for within the GPT business segment. In fiscal 2005, we anticipate these costsaddition, certain customer contracts contain expense maximums, so in certain cases not all expenses incurred can be passed along to the customer without contractual revisions or the customer's express written approval, which can increase consistent with the expected increase involatility of the cost of out-of-pocket expense reimbursement revenue.as a percentage of out-of-pocket expense reimbursements.
Operating Costs and Expenses ($ in thousands):Expenses:
Selling, General and Administrative Expenses ($ in thousands):
| | | | | 2004 vs. 2003 | 2003 vs. 2002 | ||||||||||||||||
|---|---|---|---|---|---|---|---|---|---|---|---|---|---|---|---|---|---|---|---|---|---|
| | FY 2004 | FY 2003 | FY2002 | $ | % | $ | % | ||||||||||||||
| Selling, General and Administrative Expenses | $ | 46,524 | $ | 49,733 | $ | 50,326 | $ | (3,209 | ) | (6.5 | )% | $ | (593 | ) | (1.2 | )% | |||||
| % of total revenue | 39.1 | % | 38.6 | % | 33.6 | % | |||||||||||||||
| | | | | 2005 vs. 2004 | 2004 vs. 2003 | ||||||||||||||||
|---|---|---|---|---|---|---|---|---|---|---|---|---|---|---|---|---|---|---|---|---|---|
| | FY 2005 | FY 2004 | FY2003 | $ | % | $ | % | ||||||||||||||
| Selling, General and Administrative Expenses | $ | 45,527 | $ | 46,524 | $ | 49,733 | $ | (997 | ) | (2.1 | )% | $ | (3,209 | ) | (6.5 | )% | |||||
| % of total revenue | 39.1 | % | 39.1 | % | 39.2 | % | |||||||||||||||
Selling, general and administrative expenses generally consist of personnel costs such as salaries, commissions and other incentive compensation along with travel associated with selling, marketing, general management and software management. Additionally, the provision for doubtful accounts, insurance, including directors and officers insurance, as well as professional services, such as legal and accounting expenses, and other related costs are classified within selling, general and administrative expense. In fiscal 2005, selling, general and administrative costs further declined $1.0 million or 2.1%,
as compared to fiscal 2004, and selling, general and administrative costs remained a constant 39.1% of revenue.
The largest declines in costs in fiscal 2005 were in corporate sales and marketing, which declined $2.9 million, and reductions in premiums for our directors and officers liability insurance coverage of approximately $900,000. These declines were partially offset by a $500,000 increase in sales-related costs within the three business segments, along with an increase of approximately $800,000 in professional services primarily related to increased legal fees related to lawsuits in which we are asserting certain claims and to increased professional fees related to our ERP system upgrade. Additionally, bad debt expense was approximately $89,000 in fiscal 2005, as compared to recoveries of approximately $782,000 in fiscal 2004. Finally, relocation and recruiting expense increased approximately $240,000 in fiscal 2005, as compared to fiscal 2004.
The fiscal 2004 selling, general and administrative costs declined $3.2 million, as compared to fiscal 2003, as we lowered our expense base to better align our cost structure with our current revenue levels. In fiscal 2004, we expanded our sales capacity in all three business segments and sales costs increased approximately $1.4 million. These increased sales costs were offset bythere was a decline in general and administrative expenses of $4.6 million achieved through operating efficiencies and consolidation efforts. Some of the major declines were personnel and contract labor reductions of $2.6 million, office service and facilities reductions of $2.0 million and better accounts receivable management whichthat reduced our bad debt charges by $724,000. These general and administrative savings were partially offset by $903,000 of professional services related to increased accounting and third party consulting fees for Sarbanes-Oxley compliance. These decreased general and administrative costs were partially offset by the expansion of our sales capacity in all three business segments and sales costs increased approximately $1.4 million. Even with the overall decreased expense levels, the selling, general and administrative expenses, as a percentage of revenue, increaseddecreased slightly in fiscal 2004, as compared to fiscal 2003, to 39.1%, from 38.6%39.2%, due to the decline in total revenue.
The fiscal 2003 selling, general and administrative costs remained relatively flat, as compared to fiscal 2002. The increase in the selling, general and administrative expenses, as a percentage of total
revenue, was primarily the result of the decrease in total revenue from fiscal 2003, as compared to fiscal 2002.
In fiscal 2005, we expect to continue to increase our selling expenses; however, we anticipate that any increases in selling expenses should be balanced with planned continued decreases within our general and administrative areas to maintain overall selling, general and administrative costs at a level that is expected to be consistent with fiscal 2004 levels, exclusive of any expenses related to the expensing of stock options.
Research and Development ($ in thousands):
| | | | | 2004 vs. 2003 | 2003 vs. 2002 | ||||||||||||||||
|---|---|---|---|---|---|---|---|---|---|---|---|---|---|---|---|---|---|---|---|---|---|
| | FY 2004 | FY 2003 | FY2002 | $ | % | $ | % | ||||||||||||||
| Research and Development Expenses | $ | 8,644 | $ | 7,471 | $ | 11,307 | $ | 1,173 | 15.7 | % | $ | (3,836 | ) | (33.9 | )% | ||||||
| % of total revenue | 7.3 | % | 5.8 | % | 7.6 | % | |||||||||||||||
| | | | | 2005 vs. 2004 | 2004 vs. 2003 | ||||||||||||||||
|---|---|---|---|---|---|---|---|---|---|---|---|---|---|---|---|---|---|---|---|---|---|
| | FY 2005 | FY 2004 | FY2003 | $ | % | $ | % | ||||||||||||||
| Research and Development Expenses | $ | 9,617 | $ | 8,644 | $ | 7,471 | $ | 973 | 11.3 | % | $ | 1,173 | 15.7 | % | |||||||
| % of total revenue | 8.2 | % | 7.3 | % | 5.9 | % | |||||||||||||||
Research and development expenses consist primarily of personnel, contract labor, travel and facilities expenses incurred by our research and development organization. In fiscal 2004, research and development costs increased as a result of increased new product development. In fiscal 2003, research and development costs decreased as compared to fiscal 2002 as a result of a concentration of projects classified as cost of software maintenance which integrated and enhanced our legacy products in preparation for new technology and new product offerings.expenses. Research and development costs are typically limited to development of new software products, or enhancements to existing software products, which extend the product's life cycle and/or substantially increase its marketability.
In accordance with SFAS No. 86, "Accounting for Costs of Software to be Sold, Leased or Otherwise Marketed," we capitalized $2.6 million in fiscal 2004 as compared to $1.0 million in fiscal 2003 and $103,000 in fiscal 2002. In fiscal 2005 and 2004, research and development costs increased as a result of increased new product development particularly within our GPT business segment. In fiscal 2005 through 2003, the majority of our capitalization isresearch and development expenses are related to the development of products needed to address the changing market environment due to the Check 21 legislation whichthat went into effect in October 2004. These development initiatives consisted of ExchgLink, an application to send and receive check images, Express Research, an image-enabled back office application, Source Capture which enables customers to capture check images at corporate sites, bank branches and ATM's, an anti-money laundering applicationIRD Author which generates and otherprocesses substitute checks often referred to as image replacement documents ("IRD"), and Image Inspector which ensures the quality of payment images. In addition to these Check 21 products, we have also developed a transaction monitoring fraud mitigation solution with multiple fraud detection products.modules. Finally, in fiscal 2005, we also developed two new Cash solutions. Matchpoint verifies cash logistic invoices with automated precision and a second product, Trackpoint, is an internet based track and trace system that streamlines the cash delivery management process.
In accordance with SFAS No. 86, "Accounting for Costs of Software to be Sold, Leased or Otherwise Marketed," we capitalized $776,000 of software development costs in fiscal 2005 as compared to $2.6 million in fiscal 2004 and $1.0 million in fiscal 2003. Software development costs of a product are capitalized from the time technological feasibility is reached until the general release of the product. We establish technological feasibility through the process of creating a detailed program design and reviewing the detailed program design for any high risk development issues or through the creation of a working model. Capitalization only occurs if we believe costs capitalized are recoverable through future sales of the software product under development.
In fiscal 2005, we expect this volume of development activity to continue and anticipate that research and development expense will be slightly higher on an absolute dollar basis.
Amortization of Intangible Assets:Customer Relationships: Amortization of intangible assetscustomer relationships was $1.4 million in each of fiscal 2005, 2004 2003 and 2002.2003. The amortization results from the periodic recognition of amortization expense of intangible customer relationships acquired in the Check Solutions acquisition in fiscal 2001.
Goodwill Impairment: During the fourth quarter of fiscal 2002, we performed our annual evaluation for goodwill impairment resulting in a charge of $46.0 million. The impairment charge was recorded to the Global Payments Technologies ("GPT") segment as all of the Company's goodwill has been assigned to the GPT segment. The fair value of the reporting unit to which goodwill is assigned was determined to be less than its carrying amount. Thus, an allocation of the estimated fair value of the reporting unit to all of the assets2001, and liabilities of the reporting unit was made to determine the
excess of fair value over amounts allocated to net assets. The excess represents the estimated fair value of the goodwill which was compared to recorded goodwill as of the evaluation date of November 1, 2002 and resulted in an impairment charge of $46.0 million. The fair values used in this evaluation were estimated based upon the consideration of a number of fair value estimation techniques including a discounted cash flow analysis and consideration of the market price of our stock. The assumptions in the discounted cash flow analysis include future revenue volume levels, price levels and rates of increases in operating expenses to compute projected cash flows for the reporting unit and other intangible assets within the reporting unit. A discount rate of 26% was applied to determine discounted cash flows.
During the fourth quarter of fiscal 2004 and 2003, we performed our annual evaluation for goodwill impairment. No impairment resulted from these assessments. We believe that our assumptions used to estimate future cash flows for these evaluations are reasonable. However, if market conditions deteriorate or if changes occur in the estimated projections with respect to GPT business, we may be required to record additional impairment charges in the future, the amount of which could be material to our results of operations.amortization will continue until May 2007.
Restructuring and Other Charges: We recorded various restructuring and other charges during the fiscal years ended January 31, 2006, 2005 2004 and 20032004 as follows (in thousands):
| | Workforce Reductions | Charges/ Credits relating to CheckFlow Suite | Facility Closures | EPG Litigation Settlement | Legal and Professional Fees | Other | Total | ||||||||||||||||
|---|---|---|---|---|---|---|---|---|---|---|---|---|---|---|---|---|---|---|---|---|---|---|---|
| Fiscal Year Ended January 31, 2003: | |||||||||||||||||||||||
| Quarterly period ended January 31, 2003 | $ | 633 | $ | — | $ | — | $ | — | $ | 2,312 | $ | — | $ | 2,945 | |||||||||
| Total year ended January 31, 2003 | $ | 633 | $ | — | $ | — | $ | — | $ | 2,312 | $ | — | $ | 2,945 | |||||||||
| Fiscal Year Ended January 31, 2004: | |||||||||||||||||||||||
| Quarterly period ended April 30, 2003 | $ | 545 | $ | — | $ | — | $ | — | $ | 139 | $ | — | $ | 684 | |||||||||
| Quarterly period ended July 31, 2003 | 648 | — | — | — | 130 | — | 778 | ||||||||||||||||
| Quarterly period ended October 31, 2003 | (251 | ) | — | (119 | ) | — | 141 | — | (229 | ) | |||||||||||||
| Quarterly period ended January 31, 2004 | 390 | — | — | — | 181 | 97 | 668 | ||||||||||||||||
| Total year ended January 31, 2004 | $ | 1,332 | $ | — | $ | (119 | ) | $ | — | $ | 591 | $ | 97 | $ | 1,901 | ||||||||
| Fiscal Year Ended January 31, 2005: | |||||||||||||||||||||||
| Quarterly period ended April 30, 2004 | $ | 308 | $ | — | $ | — | $ | 1,686 | $ | 521 | $ | — | $ | 2,515 | |||||||||
| Quarterly period ended July 31, 2004 | 192 | (1,215 | ) | — | 14 | 1,206 | — | 197 | |||||||||||||||
| Quarterly period ended October 31, 2004 | 246 | — | — | — | 20 | — | 266 | ||||||||||||||||
| Quarterly period ended January 31, 2005 | 727 | (67 | ) | 44 | — | — | — | 704 | |||||||||||||||
| Total year ended January 31, 2005 | $ | 1,473 | $ | (1,282 | ) | $ | 44 | $ | 1,700 | $ | 1,747 | $ | — | $ | 3,682 | ||||||||
Fiscal Year Ended January 31, 2003
During the quarterly period ended January 31, 2003, we recorded a charge of $633,000 relating to a reduction in the workforce for 44 employees that were terminated. Additionally, we recorded a charge for approximately $2.3 million for legal and professional fees related to the special investigation and restatement efforts.
| | Workforce Reductions | EPG Litigation Settlement | Legal and Professional Fees | Charges/Credits relating to CheckFlow Suite | Other | Total | ||||||||||||||
|---|---|---|---|---|---|---|---|---|---|---|---|---|---|---|---|---|---|---|---|---|
| Fiscal Year Ended January 31, 2004: | ||||||||||||||||||||
Quarterly period ended April 30, 2003 | $ | 545 | $ | — | $ | 139 | $ | — | $ | — | $ | 684 | ||||||||
| Quarterly period ended July 31, 2003 | 648 | — | 130 | — | — | 778 | ||||||||||||||
| Quarterly period ended October 31, 2003 | (251 | ) | — | 141 | — | (119 | ) | (229 | ) | |||||||||||
| Quarterly period ended January 31, 2004 | 390 | — | 181 | — | 97 | 668 | ||||||||||||||
| Total year ended January 31, 2004 | $ | 1,332 | $ | — | $ | 591 | $ | — | $ | (22 | ) | $ | 1,901 | |||||||
Fiscal Year Ended January 31, 2005: | ||||||||||||||||||||
Quarterly period ended April 30, 2004 | $ | 308 | $ | 1,686 | $ | 521 | $ | — | $ | — | $ | 2,515 | ||||||||
| Quarterly period ended July 31, 2004 | 192 | 14 | 1,206 | (1,215 | ) | — | 197 | |||||||||||||
| Quarterly period ended October 31, 2004 | 246 | — | 20 | — | — | 266 | ||||||||||||||
| Quarterly period ended January 31, 2005 | 727 | — | — | (67 | ) | 44 | 704 | |||||||||||||
| Total year ended January 31, 2005 | $ | 1,473 | $ | 1,700 | $ | 1,747 | $ | (1,282 | ) | $ | 44 | $ | 3,682 | |||||||
Fiscal Year Ended January 31, 2006: | ||||||||||||||||||||
Quarterly period ended April 30, 2005 | $ | 127 | $ | — | $ | — | $ | — | $ | (32 | ) | $ | 95 | |||||||
| Quarterly period ended July 31, 2005 | 28 | — | — | — | — | 28 | ||||||||||||||
| Quarterly period ended October 31, 2005 | 780 | — | — | — | — | 780 | ||||||||||||||
| Quarterly period ended January 31, 2006 | 15 | — | — | — | — | 15 | ||||||||||||||
| Total year ended January 31, 2006 | $ | 950 | $ | — | $ | — | $ | — | $ | (32 | ) | $ | 918 | |||||||
Fiscal Year Ended January 31, 2004
We recorded $545,000 in restructuring and other charges during the three month period ended April 30, 2003, principally associated with the separation of 17 employees, within both the Corporate and Global Payments Consulting ("GPC") business segments. During the quarterly period ended April 30, 2003, we recorded a charge of $139,000 relating to legal and professional fees relating to our
restatement efforts and the shareholder legal actions described in Note 10 of our Notes to Consolidated Financial Statements.
We recorded $648,000 in restructuring and other charges during the three month period ended July 31, 2003, principally associated with the separation of 9 employees, within both the Corporate and GPC business segments. During the quarterly period ended July 31, 2003, we recorded a charge of $130,000 relating to legal fees relating to the shareholder legal actions described in Note 10 of our Notes to Consolidated Financial Statements.
As part of our settlement with one of the CheckFlow Suite customers, the customer agreed to pay us for the replacement product and installation. These payments were recorded directly to this reserve and all future expenditures to install the replacement product have been charged against this reserve. During the quarterly period ended July 31, 2003, $366,000 was received from this customer.
We recorded $170,000 in restructuring and other charges during the three month period ended October 31, 2003, principally associated with the separation of 3 employees within the Corporate business segment. During the quarterly period ended October 31, 2003, we recorded a charge of $141,000 relating to legal fees relating to the shareholder legal actions described in Note 10 of our Notes to Consolidated Financial Statements.
Additionally, during the three months ended October 31, 2003, we reversed $421,000 primarily related to the true-up of termination benefits as actual costs were lower than estimated amounts. Additionally, $119,000 was reversed when estimated costs to close certain facilities were lower than our original estimates. The effect of these revisions in estimates, net of tax, was $0.02 per share on a fully diluted basis, for the year ended January 31, 2004.
We recorded $390,000 of restructuring and other charges during the three months ended January 31, 2004, principally associated with the separation of 11 employees. We also discontinued the marketing of one of our software offerings and recorded a $97,000 charge. Finally, we recorded a charge of $181,000 relating to legal fees related to the shareholder legal actions described in Note 10 of our Notes to Consolidated Financial Statements.
Fiscal Year Ended January 31, 2005
We recorded $308,000 in restructuring and other charges during the three month period ended April 30, 2004, principally associated with the separation of 10 employees. During the three month period ended April 30, 2004, the Companywe recorded a charge of $521,000 relating to legal and professional fees relating to our legal actions described in Note 10 of our Notes to Consolidated Financial Statements.
The CompanyWe expensed approximately $1.7 million for compensatory damages to EPG after the jury returned a verdict in favor of EPG on one claim and Carreker on three claims.
We recorded $192,000 in restructuring and other charges during the three month period ended July 31, 2004, principally associated with the separation of 8 employees. During the three months ended July 31, 2004, we recorded a charge of $36,000 relating to legal and professional fees relating to our shareholder legal actions described in Note 10 of our Notes to Consolidated Financial Statements.
An additional $14,000 was expensed and the entire $1.7 million EPG settlement was paid to the plaintiff. Additionally, we recorded a charge for the litigation costs related to this legal action totaling $1.2 million during the three month period ended July 31, 2004.
We received a final payment of $455,000 from a customer in the settlement with one of our original CheckFlow Suite customers. This payment was recorded directly to this reserve. Concurrently, based on revised cost estimates, we lowered our estimate of the cost to develop and install any
additional software, or software modifications, with these customers and reversed approximately $1.2 million of this reserve during the three month period ended July 31, 2004.
We recorded $246,000 in restructuring and other charges during the three month period ended October 31, 2004, principally associated with the separation of 6 employees. Additionally, we recorded
a charge of $20,000 relating to legal and professional fees relating to the Company's shareholder legal actions described in Note 10 of our Notes to Consolidated Financial Statements.
We recorded $727,000 in restructuring and other charges during the three month period ended January 31, 2005, principally associated with the separation of 16 employees. Based on revised cost estimates, we lowered by $67,000 our estimate of the cost to develop and install additional software, or modify software for our original CheckFlow customers. Finally, we recorded a charge of $44,000 related to the closure of our facility in Atlanta, Georgia.
Fiscal Year Ended January 31, 2006
We recorded $127,000 in restructuring and other charges during the three month period ended April 30, 2005, principally associated with the separation of 6 employees. We also lowered our estimate by $32,000 for the costs associated with the discontinuance of one of our software offerings, originally recorded in January 2004.
We recorded $28,000 in restructuring and other charges during the three month period ended July 31, 2005, principally associated with the separation of 2 employees.
We recorded $780,000 in restructuring and other charges during the three month period ended October 31, 2005, principally associated with the separation of 29 employees primarily within the GPT business segment.
We recorded $15,000 in restructuring and other charges during the three month period ended January 31, 2006, principally associated with the separation of 1 employee.
The activity related to the accrued merger and restructuring charge reserve balance during the years ended January 31, 2006, 2005 2004 and 20032004 is as follows (in thousands):
| | Workforce Reductions | Charges relating to CheckFlow Suite | Facility Closures | Other | Total | ||||||||||||||||||||||||||||
|---|---|---|---|---|---|---|---|---|---|---|---|---|---|---|---|---|---|---|---|---|---|---|---|---|---|---|---|---|---|---|---|---|---|
| Reserve balance at January 31, 2002 | $ | 3,670 | $ | 7,213 | $ | 367 | $ | — | $ | 11,250 | |||||||||||||||||||||||
| Additions to reserve balance: | |||||||||||||||||||||||||||||||||
| Severance charges | 633 | — | — | — | 633 | ||||||||||||||||||||||||||||
| Reductions to reserve balances: | |||||||||||||||||||||||||||||||||
| Cash paid | (3,222 | ) | (6,068 | ) | (243 | ) | — | (9,533 | ) | ||||||||||||||||||||||||
| | Workforce Reductions | CheckFlow Suite | Facility Closures | Other | Total | ||||||||||||||||||||||||||||
| Reserve balance at January 31, 2003 | 1,081 | 1,145 | 124 | — | 2,350 | Reserve balance at January 31, 2003 | $ | 1,081 | $ | 1,145 | $ | 124 | $ | — | $ | 2,350 | |||||||||||||||||
Additions to reserve balance: | Additions to reserve balance: | ||||||||||||||||||||||||||||||||
| Severance charges | 1,753 | — | — | — | 1,753 | Severance charges | 1,753 | — | — | — | 1,753 | ||||||||||||||||||||||
| Discontinuation of software product | — | — | — | 97 | 97 | Discontinuation of software product | — | — | — | 97 | 97 | ||||||||||||||||||||||
| Cash received from customer | — | 366 | — | — | 366 | Cash received from customer | — | 366 | — | — | 366 | ||||||||||||||||||||||
| Reductions to reserve balances: | Reductions to reserve balances: | ||||||||||||||||||||||||||||||||
| Change in estimate | (421 | ) | — | (119 | ) | — | (540 | ) | Change in estimate | (421 | ) | — | (119 | ) | — | (540 | ) | ||||||||||||||||
| Cash paid | (1,913 | ) | (215 | ) | — | — | (2,128 | ) | Cash paid | (1,913 | ) | (215 | ) | — | — | (2,128 | ) | ||||||||||||||||
| Reserve balance at January 31, 2004 | 500 | 1,296 | 5 | 97 | 1,898 | Reserve balance at January 31, 2004 | 500 | 1,296 | 5 | 97 | 1,898 | ||||||||||||||||||||||
Additions to reserve balance: | Additions to reserve balance: | �� | |||||||||||||||||||||||||||||||
| Severance charges | 1,473 | — | — | — | 1,473 | Severance charges | 1,473 | — | — | — | 1,473 | ||||||||||||||||||||||
| Cash received from customer | — | 455 | — | 47 | 502 | Cash received from customer | — | 455 | — | 47 | 502 | ||||||||||||||||||||||
| Facility closure charge for Atlanta, GA | — | — | 44 | — | 44 | Facility closure charge for Atlanta, GA | — | — | 44 | — | 44 | ||||||||||||||||||||||
| Reductions to reserve balances: | Reductions to reserve balances: | ||||||||||||||||||||||||||||||||
| Change in estimate | — | (1,282 | ) | — | — | (1,282 | ) | Change in estimate | — | (1,282 | ) | — | — | (1,282 | ) | ||||||||||||||||||
| Cash paid | (1,321 | ) | (269 | ) | — | (41 | ) | (1,631 | ) | Cash paid | (1,321 | ) | (269 | ) | — | (41 | ) | (1,631 | ) | ||||||||||||||
| Reserve balance at January 31, 2005 | $ | 652 | $ | 200 | $ | 49 | $ | 103 | $ | 1,004 | Reserve balance at January 31, 2005 | $ | 652 | $ | 200 | $ | 49 | $ | 103 | $ | 1,004 | ||||||||||||
Additions to reserve balance: | Additions to reserve balance: | ||||||||||||||||||||||||||||||||
| Severance charges | 950 | — | — | — | 950 | ||||||||||||||||||||||||||||
| Reductions to reserve balances: | Reductions to reserve balances: | ||||||||||||||||||||||||||||||||
| Change in estimate | — | — | — | (32 | ) | (32 | ) | ||||||||||||||||||||||||||
| Cash paid | (1,515 | ) | — | (49 | ) | (24 | ) | (1,588 | ) | ||||||||||||||||||||||||
| Reserve balance at January 31, 2006 | Reserve balance at January 31, 2006 | $ | 87 | $ | 200 | $ | — | $ | 47 | $ | 334 | ||||||||||||||||||||||
We anticipate that the remaining reserve accruals at January 31, 20052006 will be paid or remaining customer obligations completed within the next 12-156 months.
Other Income (Expense):
Interest Income ($ in thousands):
| | | | | 2004 vs. 2003 | 2003 vs. 2002 | |||||||||||||||
|---|---|---|---|---|---|---|---|---|---|---|---|---|---|---|---|---|---|---|---|---|
| | FY 2004 | FY 2003 | FY2002 | $ | % | $ | % | |||||||||||||
| Interest Income | $ | 306 | $ | 266 | $ | 414 | $ | 40 | 15.0 | % | $ | (148 | ) | (35.7 | )% | |||||
| | | | | 2005 vs. 2004 | 2004 vs. 2003 | |||||||||||||||
|---|---|---|---|---|---|---|---|---|---|---|---|---|---|---|---|---|---|---|---|---|
| | FY 2005 | FY 2004 | FY 2003 | $ | % | $ | % | |||||||||||||
| Interest Income | $ | 716 | $ | 306 | $ | 266 | $ | 410 | 134.0 | % | $ | 40 | 15.0 | % | ||||||
Interest income consists of interest earned on marketable securities and cash and cash equivalents. InterestThe increase in interest income increased 15.0% to $306,000 in fiscal 2005, as compared to fiscal 2004, from $266,000is primarily the result of higher average invested balances in fiscal 20032005 and decreased 35.7% from $414,000 in fiscal 2002.higher yields on these investments. The increase in interest income in fiscal 2004, as compared to fiscal 2003, is primarily the result of higher average cash and cash equivalent balances during fiscal 2004. The decrease in fiscal 2003, as compared to fiscal 2002, primarily resulted from lower interest rates.
Interest Expense ($ in thousands):
| | | | | 2004 vs. 2003 | 2003 vs. 2002 | |||||||||||||||
|---|---|---|---|---|---|---|---|---|---|---|---|---|---|---|---|---|---|---|---|---|
| | FY 2004 | FY 2003 | FY2002 | $ | % | $ | % | |||||||||||||
| Interest Expense | $ | 442 | $ | 1,218 | $ | 2,583 | $ | (776 | ) | (63.7 | )% | $ | (1,365 | ) | (52.8 | )% | ||||
| | | | | 2005 vs. 2004 | 2004 vs. 2003 | |||||||||||||||
|---|---|---|---|---|---|---|---|---|---|---|---|---|---|---|---|---|---|---|---|---|
| | FY 2005 | FY 2004 | FY2003 | $ | % | $ | % | |||||||||||||
| Interest Expense | $ | 440 | $ | 442 | $ | 1,218 | $ | (2 | ) | — | % | $ | (776 | ) | (63.7 | )% | ||||
Interest expense is primarily the result of borrowings used to fund the Check Solutions acquisition in June 2001. Interest expense decreased 63.7% to $442,000 in fiscal 2004 from $1.2 million in fiscal 2003 and decreased 52.8% from $2.6 million in fiscal 2002. The decline in interest expense in fiscal 2004 and fiscal 2003 was primarily due to continued debt reductions in both fiscal 2004 and fiscal 2003. There is no balance outstanding undercommitment fees associated with the maintenance of our $30.0 million revolving credit agreement at January 31, 2005. The majority of the interest expense incurred in fiscal 2004 consisted ofagreement. Additionally, the amortization of the deferred loan costs and the fees involved to keep the revolvingis also included in interest expense. There have been no borrowings outstanding under this credit agreement active.since the quarter ended April 30, 2004.
Other income ($ in thousands):
| | | | | 2004 vs. 2003 | 2003 vs. 2002 | | | | 2005 vs. 2004 | 2004 vs. 2003 | ||||||||||||||||||||||||||||||
|---|---|---|---|---|---|---|---|---|---|---|---|---|---|---|---|---|---|---|---|---|---|---|---|---|---|---|---|---|---|---|---|---|---|---|---|---|---|---|---|---|
| | FY 2004 | FY 2003 | FY2002 | $ | % | $ | % | FY 2005 | FY 2004 | FY2003 | $ | % | $ | % | ||||||||||||||||||||||||||
| Gain on sale of Cash Services Australia Pty. Limited | $ | 539 | $ | — | $ | — | $ | 539 | — | % | $ | — | — | % | $ | — | $ | 539 | $ | — | $ | (539 | ) | (100.0 | )% | $ | 539 | — | % | |||||||||||
| Equity in earnings of Cash Services Australia Pty. Limited | (17 | ) | 172 | 81 | (189 | ) | (109.9 | ) | 91 | 112.3 | — | (17 | ) | 172 | 17 | 100.0 | (189 | ) | (109.9 | ) | ||||||||||||||||||||
| Minority share of net loss of Carretek LLC | 794 | 263 | — | 531 | 201.9 | 263 | — | 1,021 | 794 | 263 | 227 | 28.6 | 531 | 201.9 | ||||||||||||||||||||||||||
| Foreign exchange gains (losses) | (279 | ) | 185 | 324 | (464 | ) | (250.8 | ) | (139 | ) | (42.9 | ) | ||||||||||||||||||||||||||||
| Foreign exchange (losses)/gains | (222 | ) | (279 | ) | 185 | 57 | 20.4 | (464 | ) | (250.8 | ) | |||||||||||||||||||||||||||||
| Other | — | (19 | ) | 100 | 19 | 100.0 | (119 | ) | (119.0 | ) | 15 | — | (19 | ) | 15 | 100.0 | 19 | 100.0 | ||||||||||||||||||||||
| Total | $ | 1,037 | $ | 601 | $ | 505 | $ | 436 | 72.5 | % | 96 | 19.0 | % | $ | 814 | $ | 1,037 | $ | 601 | $ | (223 | ) | (21.5 | )% | $ | 436 | 72.5 | % | ||||||||||||
Other income (expense) is comprised of our share of income and expense in both our investments in Cash Services Australia Pty Ltd. and Carretek LLC, along with foreign exchange gains and losses. Other income (expense) increased 72.5% to $1.0 million in fiscal 2004 from $601,000 in fiscal 2003 and increased 19.0% from $505,000 in fiscal 2002. The increase in fiscal 2004 was the result of the increase in the minority share of the net loss of Carretek LLC. Additionally inIn April 2004, we sold our 25% interest in Cash Services Australia PtyPty. Limited. The carrying value of our investment was approximately $383,000 and we received $922,000 in proceeds.proceeds collected in May 2004. As a result of this transaction, we recorded a $539,000 gain. These two increases were offset by foreign exchange
We own a 51% interest in Carretek LLC ("Carretek"), through which we offer financial institutions offshore-centric outsourcing of their business processes. Carretek has generated approximately $2.1 million, $1.6 million and $537,000 in losses of approximately $280,000. Infor fiscal 2005, fiscal 2004 and fiscal 2003, respectively. Accordingly, the increase was primarily49% share relating to the result of the $263,000 recorded as minority interest in the net loss of Carretek LLC operations.these losses held by Majesco Software, Inc., or $1.0 million, $794,000 and $263,000 was recorded in other income (expense) in fiscal 2005, fiscal 2004 and fiscal 2003, respectively.
Provision (Benefit) for Income Taxes: The provision (benefit) for income taxes is based on the estimated annual effective tax rate, and includes federal, state and foreign income taxes. In fiscal 2005, 2004 and 2003, the majority of our tax provision consisted of foreign taxes incurred that could not be offset with U.S. tax benefits. Our effective income tax rate was 5.1% in fiscal 2003 and 4.2% in fiscal 2002. The lower tax rate in fiscal 2003 was primarily due to net operating losses offsetting the taxable income generated. The lower tax rate in fiscal 2002 was due to losses we incurred from which we have not yet obtained a tax benefit. For us to realize the benefit of our net operating loss carryforward and other deferred tax assets recorded as of January 31, 2005,2006, we must generate substantial future taxable income. Due to losses incurred in fiscal 2004, fiscal 2002our inconsistent history of generating profitable operations and 2001,taxable income, we concluded that the "more likely than not" criteria required for recognition of deferred tax assets under Statement of Financial Accounting Standards No. 109,Accounting for Income Taxes ("SFAS 109") was not met at both January 31, 2005 and 2004. Thus,maintain a valuation allowance was recorded to fully reserve the net deferred tax assets which resulted in the unbenefitted losses.assets.
On March 7, 2002, the federal tax law changed to allow net operating losses for taxable years ended in 2001 and 2002 to be carried back an additional three years. Consistent with the requirements of SFAS No. 109, the impact of this change in tax law and related five year carryback was not used in the determination of the Company's tax provision and related deferred tax valuation allowance for the year ended January 31, 2002. The impact from this change in tax law, including any reduction in the valuation allowance as a result of the expanded carryback period, was reflected in our tax provision for the quarterly period ended April 30, 2002. This resulted in a tax benefit of approximately $1.9 million in fiscal 2002 which was partially offset by state and foreign taxes.
At January 31, 2005,2006, we had available net operating loss carryforwards of approximately $33.1$36.0 million, whichthat begin to expire in 2022.2023.
Selected Consolidated Quarterly Results of OperationsData (unaudited)
The following table sets forth unaudited quarterly data for each of our last eight quarters ended January 31, 2005.2006. We believe all material adjustments necessary to present fairly the results of operations of the Company have been made. Immediately following this table, we have also set forth the impact of the restatement on our consolidated balance sheet described under "—Restatement."
| | | Three Months Ended | ||||||||||||||||||||||||||||
|---|---|---|---|---|---|---|---|---|---|---|---|---|---|---|---|---|---|---|---|---|---|---|---|---|---|---|---|---|---|---|
| | | Jan. 31, 2006 | Oct. 31, 2005 | July 31, 2005 | April 30, 2005 | |||||||||||||||||||||||||
| | | Three Months Ended | | (in thousands, except per share data) | ||||||||||||||||||||||||||
| Statement of Operations Data: | Statement of Operations Data: | Jan. 31, 2005 | Oct. 31, 2004 | July 31, 2004 | April 30, 2004 | Statement of Operations Data: | ||||||||||||||||||||||||
| | (in thousands, except per share data) | |||||||||||||||||||||||||||||
| Revenues: | Revenues: | Revenues: | ||||||||||||||||||||||||||||
| Consulting fees | $ | 9,692 | $ | 7,930 | $ | 10,514 | $ | 9,057 | Consulting | $ | 8,704 | $ | 6,720 | $ | 9,502 | $ | 8,318 | |||||||||||||
| Software license fees | 4,295 | 5,701 | 4,577 | 5,856 | Software license | 5,814 | 5,322 | 3,782 | 3,359 | |||||||||||||||||||||
| Software maintenance fees | 10,486 | 11,491 | 10,232 | 11,084 | Software maintenance | 9,732 | 10,822 | 10,576 | 11,312 | |||||||||||||||||||||
| Software implementation fees | 3,656 | 4,622 | 3,642 | 2,879 | Software implementation and other services | 4,846 | 4,585 | 4,892 | 4,134 | |||||||||||||||||||||
| Outsourcing service fees | 79 | 50 | 10 | — | Outsourcing services | 320 | 220 | 241 | 257 | |||||||||||||||||||||
| Out-of-pocket expense reimbursements | 673 | 813 | 662 | 890 | Out-of-pocket expense reimbursements | 680 | 701 | 927 | 818 | |||||||||||||||||||||
| Total revenues | 28,881 | 30,607 | 29,637 | 29,766 | Total revenues | 30,096 | 28,370 | 29,920 | 28,198 | |||||||||||||||||||||
| Cost of revenues: | Cost of revenues: | Cost of revenues: | ||||||||||||||||||||||||||||
| Consulting fees | 4,823 | 4,555 | 5,082 | 4,529 | Consulting | 4,299 | 4,369 | 4,277 | 4,241 | |||||||||||||||||||||
| Software license fees | 2,189 | 2,503 | 1,670 | 1,598 | Software license | 2,443 | 2,155 | 1,828 | 1,536 | |||||||||||||||||||||
| Software maintenance fees | 3,822 | 3,765 | 3,386 | 3,798 | Software maintenance | 3,210 | 3,588 | 3,436 | 3,975 | |||||||||||||||||||||
| Software implementation fees | 3,566 | 4,002 | 3,810 | 3,369 | Software implementation and other services | 3,117 | 3,562 | 3,682 | 2,973 | |||||||||||||||||||||
| Outsourcing service fees | 380 | 222 | 14 | — | Outsourcing services | 477 | 424 | 434 | 579 | |||||||||||||||||||||
| Out-of-pocket expenses | 754 | 738 | 652 | 943 | Out-of-pocket expenses | 804 | 701 | 808 | 790 | |||||||||||||||||||||
| Total cost of revenues | 15,534 | 15,785 | 14,614 | 14,237 | Total cost of revenues | 14,350 | 14,799 | 14,465 | 14,094 | |||||||||||||||||||||
| Gross profit | Gross profit | 13,347 | 14,822 | 15,023 | 15,529 | Gross profit | 15,746 | 13,571 | 15,455 | 14,104 | ||||||||||||||||||||
| Operating costs and expenses: | Operating costs and expenses: | Operating costs and expenses: | ||||||||||||||||||||||||||||
| Selling, general and administrative(4) | 11,041 | 11,320 | 11,971 | 12,192 | Selling, general and administrative | 11,839 | 11,191 | 11,593 | 10,904 | |||||||||||||||||||||
| Research and development | 2,542 | 2,520 | 1,874 | 1,708 | Research and development | 2,136 | 2,444 | 2,516 | 2,521 | |||||||||||||||||||||
| Amortization of customer relationships | 350 | 350 | 350 | 350 | Amortization of customer relationships | 350 | 350 | 350 | 350 | |||||||||||||||||||||
| Restructuring and other charges(2) | 704 | 266 | 197 | 2,515 | Restructuring and other charges(1) | 15 | 780 | 28 | 95 | |||||||||||||||||||||
| Total operating costs and expenses | 14,637 | 14,456 | 14,392 | 16,765 | Total operating costs and expenses | 14,340 | 14,765 | 14,487 | 13,870 | |||||||||||||||||||||
| Income (loss) from operations | Income (loss) from operations | (1,290 | ) | 366 | 631 | (1,236 | ) | Income (loss) from operations | 1,406 | (1,194 | ) | 968 | 234 | |||||||||||||||||
Other income (expense): | Other income (expense): | Other income (expense): | ||||||||||||||||||||||||||||
| Interest income | Interest income | 100 | 92 | 66 | 48 | Interest income | 221 | 185 | 166 | 144 | ||||||||||||||||||||
| Interest expense | Interest expense | (107 | ) | (106 | ) | (121 | ) | (108 | ) | Interest expense | (106 | ) | (122 | ) | (107 | ) | (105 | ) | ||||||||||||
| Other income | Other income | 305 | 275 | (27 | ) | 484 | Other income | 96 | 283 | 129 | 306 | |||||||||||||||||||
| Total other income (expense), net | Total other income (expense), net | 298 | 261 | (82 | ) | 424 | Total other income (expense), net | 211 | 346 | 188 | 345 | |||||||||||||||||||
| Income (loss) before provision (benefit) for income taxes | (992 | ) | 627 | 549 | (812 | ) | ||||||||||||||||||||||||
| Provision (benefit) for income taxes(3) | 104 | 114 | 350 | — | ||||||||||||||||||||||||||
| Income (loss) before provision for income taxes | Income (loss) before provision for income taxes | 1,617 | (848 | ) | 1,156 | 579 | ||||||||||||||||||||||||
| Provision for income taxes(2) | Provision for income taxes(2) | 150 | 102 | 102 | 81 | |||||||||||||||||||||||||
| Net income (loss) | Net income (loss) | $ | (1,096 | ) | $ | 513 | $ | 199 | $ | (812 | ) | Net income (loss) | $ | 1,467 | $ | (950 | ) | $ | 1,054 | $ | 498 | |||||||||
| Basic earnings (loss) per share | Basic earnings (loss) per share | $ | (0.04 | ) | $ | 0.02 | $ | 0.01 | $ | (0.03 | ) | Basic earnings (loss) per share | $ | 0.06 | $ | (0.04 | ) | $ | 0.04 | $ | 0.02 | |||||||||
| Diluted earnings (loss) per share | Diluted earnings (loss) per share | $ | (0.04 | ) | $ | 0.02 | $ | 0.01 | $ | (0.03 | ) | Diluted earnings (loss) per share | $ | 0.06 | $ | (0.04 | ) | $ | 0.04 | $ | 0.02 | |||||||||
| Shares used in computing basic earnings per share | 24,414 | 24,821 | 24,671 | 24,376 | ||||||||||||||||||||||||||
| Shares used in computing basic earnings (loss) per share | Shares used in computing basic earnings (loss) per share | 23,911 | 23,906 | 24,127 | 24,425 | |||||||||||||||||||||||||
| Shares used in computing diluted earnings per share | 24,414 | 25,589 | 25,481 | 24,376 | ||||||||||||||||||||||||||
| Shares used in computing diluted earnings (loss) per share | Shares used in computing diluted earnings (loss) per share | 24,122 | 23,906 | 24,421 | 24,867 | |||||||||||||||||||||||||
| | Three Months Ended | ||||||||||||||
|---|---|---|---|---|---|---|---|---|---|---|---|---|---|---|---|
| Statement of Operations Data: | Jan. 31, 2004 | Oct. 31, 2003 | July 31, 2003 | April 30, 2003 | |||||||||||
| | (in thousands, except per share data) | ||||||||||||||
| Revenues: | |||||||||||||||
| Consulting fees | $ | 12,715 | $ | 6,396 | $ | 8,202 | $ | 6,751 | |||||||
| Software license fees | 5,410 | 7,026 | 8,351 | 6,578 | |||||||||||
| Software maintenance fees | 10,358 | 11,770 | 14,284 | 8,710 | |||||||||||
| Software implementation fees | 3,718 | 4,983 | 4,508 | 4,894 | |||||||||||
| Outsourcing service fees | — | — | — | — | |||||||||||
| Out-of-pocket expense reimbursements | 887 | 1,228 | 816 | 1,323 | |||||||||||
| Total revenues | 33,088 | 31,403 | 36,161 | 28,256 | |||||||||||
Cost of revenues: | |||||||||||||||
| Consulting fees | 5,277 | 4,936 | 5,288 | 4,969 | |||||||||||
| Software license fees | 2,357 | 2,037 | 1,905 | 1,721 | |||||||||||
| Software maintenance fees(1) | 3,511 | 3,600 | 3,133 | 3,176 | |||||||||||
| Software implementation fees(1) | 3,503 | 4,485 | 5,058 | 4,855 | |||||||||||
| Outsourcing service fees | — | — | — | — | |||||||||||
| Out-of-pocket expenses | 922 | 1,122 | 1,038 | 1,253 | |||||||||||
| Total cost of revenues | 15,570 | 16,180 | 16,422 | 15,974 | |||||||||||
| Gross profit | 17,518 | 15,223 | 19,739 | 12,282 | |||||||||||
| Operating costs and expenses: | |||||||||||||||
| Selling, general and administrative(1) | 13,465 | 11,797 | 12,538 | 11,933 | |||||||||||
| Research and development(1) | 1,950 | 1,876 | 1,779 | 1,866 | |||||||||||
| Amortization of customer relationships | 350 | 350 | 350 | 350 | |||||||||||
| Restructuring and other charges(2) | 668 | (229 | ) | 778 | 684 | ||||||||||
| Total operating costs and expenses | 16,433 | 13,794 | 15,445 | 14,833 | |||||||||||
| Income (loss) from operations | 1,085 | 1,429 | 4,294 | (2,551 | ) | ||||||||||
Other income (expense): | |||||||||||||||
| Interest income | 44 | 69 | 73 | 80 | |||||||||||
| Interest expense | (227 | ) | (234 | ) | (339 | ) | (418 | ) | |||||||
| Other income | 330 | 219 | 36 | 16 | |||||||||||
| Total other income (expense), net | 147 | 54 | (230 | ) | (322 | ) | |||||||||
| Income (loss) before provision (benefit) for income taxes | 1,232 | 1,483 | 4,064 | (2,873 | ) | ||||||||||
| Provision (benefit) for income taxes(3) | (173 | ) | 146 | 133 | 94 | ||||||||||
| Net income (loss) | $ | 1,405 | $ | 1,337 | $ | 3,931 | $ | (2,967 | ) | ||||||
| Basic earnings (loss) per share | $ | 0.06 | $ | 0.06 | $ | 0.17 | $ | (0.13 | ) | ||||||
| Diluted earnings (loss) per share | $ | 0.05 | $ | 0.05 | $ | 0.17 | $ | (0.13 | ) | ||||||
| Shares used in computing basic earnings per share | 24,036 | 23,812 | 23,547 | 23,547 | |||||||||||
| Shares used in computing diluted earnings per share | 25,979 | 24,645 | 23,723 | 23,547 | |||||||||||
| | Three Months Ended | ||||||||||||||
|---|---|---|---|---|---|---|---|---|---|---|---|---|---|---|---|
| | Jan. 31, 2005 | Oct. 31, 2004 | July 31, 2004 | April 30, 2004 | |||||||||||
| | (in thousands, except per share data) | ||||||||||||||
| Statement of Operations Data: | |||||||||||||||
Revenues: | |||||||||||||||
| Consulting | $ | 9,692 | $ | 7,930 | $ | 10,514 | $ | 9,057 | |||||||
| Software license | 4,295 | 5,701 | 4,577 | 5,856 | |||||||||||
| Software maintenance | 10,486 | 11,491 | 10,232 | 11,084 | |||||||||||
| Software implementation and other services | 3,656 | 4,622 | 3,642 | 2,879 | |||||||||||
| Outsourcing services | 79 | 50 | 10 | — | |||||||||||
| Out-of-pocket expense reimbursements | 673 | 813 | 662 | 890 | |||||||||||
| Total revenues | 28,881 | 30,607 | 29,637 | 29,766 | |||||||||||
| Cost of revenues: | |||||||||||||||
| Consulting | 4,823 | 4,555 | 5,082 | 4,529 | |||||||||||
| Software license | 2,189 | 2,503 | 1,670 | 1,598 | |||||||||||
| Software maintenance | 3,822 | 3,765 | 3,386 | 3,798 | |||||||||||
| Software implementation and other services | 3,566 | 4,002 | 3,810 | 3,369 | |||||||||||
| Outsourcing services | 380 | 222 | 14 | — | |||||||||||
| Out-of-pocket expenses | 754 | 738 | 652 | 943 | |||||||||||
| Total cost of revenues | 15,534 | 15,785 | 14,614 | 14,237 | |||||||||||
| Gross profit | 13,347 | 14,822 | 15,023 | 15,529 | |||||||||||
| Operating costs and expenses: | |||||||||||||||
| Selling, general and administrative(3) | 11,041 | 11,320 | 11,971 | 12,192 | |||||||||||
| Research and development | 2,542 | 2,520 | 1,874 | 1,708 | |||||||||||
| Amortization of customer relationships | 350 | 350 | 350 | 350 | |||||||||||
| Restructuring and other charges(1) | 704 | 266 | 197 | 2,515 | |||||||||||
| Total operating costs and expenses | 14,637 | 14,456 | 14,392 | 16,765 | |||||||||||
| Income (loss) from operations | (1,290 | ) | 366 | 631 | (1,236 | ) | |||||||||
Other income (expense): | |||||||||||||||
| Interest income | 100 | 92 | 66 | 48 | |||||||||||
| Interest expense | (107 | ) | (106 | ) | (121 | ) | (108 | ) | |||||||
| Other income | 305 | 275 | (27 | ) | 484 | ||||||||||
| Total other income (expense), net | 298 | 261 | (82 | ) | 424 | ||||||||||
| Income (loss) before provision for income taxes | (992 | ) | 627 | 549 | (812 | ) | |||||||||
| Provision for income taxes(2) | 104 | 114 | 350 | — | |||||||||||
| Net income (loss) | $ | (1,096 | ) | $ | 513 | $ | 199 | $ | (812 | ) | |||||
| Basic earnings (loss) per share | $ | (0.04 | ) | $ | 0.02 | $ | 0.01 | $ | (0.03 | ) | |||||
| Diluted earnings (loss) per share | $ | (0.04 | ) | $ | 0.02 | $ | 0.01 | $ | (0.03 | ) | |||||
| Shares used in computing basic earnings per share | 24,414 | 24,821 | 24,671 | 24,376 | |||||||||||
| Shares used in computing diluted earnings per share | 24,414 | 25,589 | 25,481 | 24,376 | |||||||||||
Our quarterly results may vary significantly depending primarily on factors, such as:
Risks over which we have little or no control, including customer budget cycles and priorities, can significantly affect operating results. Because of the above factors, along with items such as restructuring and other charges, the results of any particular quarter may not be indicative of the results for the full year.
The following summarized quarterly balance sheet information reflects the impact on our consolidated balance sheet arising as a result of the restatement of our consolidated financial statements, as described above under "—Restatement."
| | Quarter Ended October 31, 2005 | Quarter Ended July 31, 2005 | Quarter Ended April 30, 2005 | ||||||||||||||||
|---|---|---|---|---|---|---|---|---|---|---|---|---|---|---|---|---|---|---|---|
| | As reported | As restated | As reported | As restated | As reported | As restated | |||||||||||||
| Balance Sheet Data: | |||||||||||||||||||
Deferred revenue | $ | 16,960 | $ | 19,001 | $ | 20,361 | $ | 22,402 | $ | 23,981 | $ | 26,022 | |||||||
| Total liabilities | 28,746 | 30,787 | 31,221 | 33,262 | 35,554 | 37,595 | |||||||||||||
| Accumulated deficit | (53,274 | ) | (55,315 | ) | (52,324 | ) | (54,365 | ) | (53,378 | ) | (55,419 | ) | |||||||
| Total stockholders' equity | $ | 55,783 | $ | 53,742 | $ | 56,216 | $ | 54,175 | $ | 57,691 | $ | 55,650 | |||||||
Quarter Ended January 31, 2005 | Quarter Ended October 31, 2004 | Quarter Ended July 31, 2004 | Quarter Ended April 30, 2004 | ||||||||||||||||||||||
|---|---|---|---|---|---|---|---|---|---|---|---|---|---|---|---|---|---|---|---|---|---|---|---|---|---|
| | As reported | As restated | As reported | As restated | As reported | As restated | As reported | As restated | |||||||||||||||||
| Balance Sheet Data: | |||||||||||||||||||||||||
Deferred revenue | $ | 22,181 | $ | 24,222 | $ | 17,566 | $ | 19,607 | $ | 24,725 | $ | 26,766 | $ | 28,475 | $ | 30,516 | |||||||||
| Total liabilities | 35,657 | 37,984 | 30,447 | 32,488 | 37,839 | 39,880 | 43,395 | 45,436 | |||||||||||||||||
| Accumulated deficit | (53,876 | ) | (55,917 | ) | (52,780 | ) | (54,821 | ) | (53,293 | ) | (55,334 | ) | (53,492 | ) | (55,533 | ) | |||||||||
| Total stockholders' equity | $ | 57,362 | $ | 55,321 | $ | 58,180 | $ | 56,139 | $ | 57,205 | $ | 55,164 | $ | 55,916 | $ | 53,875 | |||||||||
Liquidity and Capital Resources
Historically, we have funded our operations and cash expenditures primarily with cash generated from operating activities. At January 31, 2005,2006, we had working capital of $12.6$17.9 million compared to $11.9$10.3 million at January 31, 2004.2005. We had $29.7 million in cash and cash equivalents at January 31, 2006, a decrease of $4.8 million from $34.5 million in cash and cash equivalents at January 31, 2005, an increase2005. However, we also had $4.7 million of $5.9 million from $28.6 million in cash and cash equivalents"available for sale" marketable securities at January 31, 2004.2006, compared to no marketable securities at January 31, 2005. At January 31, 2006 and January 31, 2005, we did not have any long-term debt as compared to $6.3 million at January 31, 2004.borrowings outstanding under our revolving line of credit. We expect that existing cash, marketable securities and cash generated from operating activities will be sufficient to meet our presently anticipated requirements for the foreseeable future.
Cash provided by operating activities was $4.5 million in fiscal 2005 compared to $15.3 million in fiscal 2004 compared toand $20.6 million in fiscal 2003 and $12.3 million2003. The decline in fiscal 2002. Operating2005, as compared to fiscal 2004, was primarily the result of the timing of the collection of 2006 calendar year maintenance billings as compared to the collection of the 2005 calendar year maintenance billings. A decreased percentage of these calendar 2006 maintenance renewals was collected by January 31, 2006 and therefore, the cash that was received was less in fiscal 2005 as opposed to fiscal 2004. The operating cash flows decreased duringin fiscal 2004 primarily as a result of the net loss of $1.2 million in fiscal 2004, as compared to the net income of $3.7$1.7 million in fiscal 2003. The increase in cash generated from operating activities in fiscal 2003, as compared to fiscal 2002, primarily reflected our need to pay a $6.7 million obligation, assumed during the Check Solutions acquisition in fiscal 2001, to certain former employees of Check Solutions and other incentive compensation accrued at January 31, 2002, which caused the decline in accounts payable and accrued expenses. The increases in both accounts receivable and income taxes payable were offset by the decline in deferred revenue.
Average days' sales outstanding fluctuate for a variety of reasons, including the timing of billings specified by contractual agreement, and receivables for expense reimbursements. The following table contains the quarterly days' sales outstanding (DSO):
| Quarter ended | DSO | |
|---|---|---|
| January 31, 2006 | 37 | |
| October 31, 2005 | 42 | |
| July 31, 2005 | 49 | |
| April 30, 2005 | 35 | |
| 35 | ||
Cash used in investing activities during fiscal 2005 was $8.0 million, and was primarily related to the purchase of $4.7 million (net) of marketable securities and $2.5 million of property and equipment purchases including $902,000 of capitalized internal use software related to our ERP reimplementation project. Cash used in investing activities during fiscal 2004 was $5.9 million, and was primarily related to $3.3 million of routine purchases of property and equipment, mainly computer equipment and the replacement of certain developmental hardware and software within our development lab based in Charlotte, North Carolina, along with $2.6 million of capitalized software costs. Cash used in investing activities during fiscal 2003 was $3.7 million, and was primarily related to $1.2 million of routine purchases of property and equipment along with $1.0 million of capitalized software costs and a $1.5 million purchase of acquired developed software related to an anti-money laundering product. Cash used in investing activities during fiscal 2002 was $3.6 million, and was primarily related to the purchases of property and equipment. We do not expect significant changes in the purchases of property and equipment in fiscal 2005. However, we believe that capitalized software development costs will slightly increase.
Financing activities used cash of $1.4 million in fiscal 2005, $3.5 million in fiscal 2004 and $15.2 million in fiscal 20032003. During fiscal 2005, we purchased a total of $3.2 million of treasury stock under the program described in Part II, Item 5.Market for Registrant's Common Equity, Related Stockholder Matters and $7.4Issuer Purchases of Equity. These treasury stock purchases were offset by $1.3 million in fiscal 2002. The cash used in financing activities in fiscal 2004 was comprised of payments on long term debt offsetequity contributions by the minority shareholder of Carretek LLC and $578,000 related to the proceeds from the exercise of employeestock options. During fiscal 2004, we made a $6.3 million debt payment, which was offset by $1.8 million of proceeds related to stock options and cash received from$923,000 equity contributions by the minority shareholder inof Carretek LLC. The cash used in financing activities in fiscal 2003 was comprised of $18.8 million of payments on our revolving credit agreement offset by $3.9 million of stock option exercise proceeds. In addition, we incurred $456,000 of deferred loan costs when the revolving credit agreement was amended in July 2003. The cash used in financing activities during fiscal 2002 was comprised of $19.0 million of payments on our revolving credit agreement offset by $2.3 million of stock option proceeds and proceeds from
We are a private placement of our common stock on April 5, 2002. The net proceeds from the private placement of $9.3 million were usedparty to satisfy
obligations due certain employees of Check Solutions of approximately $6.7 million with the remainder used for working capital.
On June 6, 2001, we entered into a three-year revolving credit agreement with a group of banks in an amount not to exceed $60.0 million to fund the acquisition of Check Solutions. On July 31, 2003, the revolving credit agreement was amended to reduce theproviding for a commitment amount toof $30.0 million and to extend thea maturity date of the outstanding borrowings to July 31, 2006. At January 31, 2005, we had no outstanding borrowings2006 and at January 31, 2004, we had $6.3 million outstanding under2005, the credit agreement.Company did not have any borrowings outstanding. Borrowings under the credit agreement currently bear interest equal to either the greater of prime or federal funds rate plus a margin ranging from 1.25% to 2.25% depending on our ratio of funded debt to Earnings Before Interest, Taxes, Depreciation and Amortization ("EBITDA"); or London Interbank Offered Rate ("LIBOR") plus a margin equal to 2.75% to 3.75% depending on our ratio of funded debt to EBITDA. Interest payments are due quarterly. We are required to pay aan annual commitment fee equal to 0.50% on the unused amount of the revolving credit agreement. The revolving credit agreement contains customary affirmative and negative covenants, some of which have been amended, including financial covenants requiring the maintenance of specified interest coverage, ratio of EBITDA to funded debt, and ratio of 80% of accounts receivable, cash and short-termshort term investments to funded debt. Additionally, the payment of dividends and the purchase of treasury stock is precluded subject to the approval of the banks. We obtained a written waiver to this covenant in April 2005 when we announced our stock repurchase program. Also, we were granted a waiver from our noncompliance with the provisions of our revolving credit agreement arising as a result of the restatement of our financial statements, as described above under "—Restatement." Substantially all of our assets collateralize this revolving credit agreement. As of January 31, 2005,2006, we are in compliance with the covenants of the revolving credit agreement, as amended.
Additionally, we are currently discussing the renewal of our credit facility with our existing lenders. The terms of any renewal are not expected to be significantly different than the current terms should we renew the facility with our existing lenders. Any renewal is expected to be complete by July 31, 2006.
At January 31, 2005,2006, we had material commitments for our operating leases, as described in Note 8 in our Notes to Consolidated Financial Statements, including commitments of approximately $3.6$3.4 million in fiscal 2005.2006. The following summarizes our contractual obligations at January 31, 20052006 and the effect these contractual obligations are expected to have on our liquidity and cash flows in future periods (in thousands):
| | Payments Due by Period | ||||||||||||||
|---|---|---|---|---|---|---|---|---|---|---|---|---|---|---|---|
| | Total | 1 Year or Less | Years 2-3 | Years 4-5 | After 5 Years | ||||||||||
| Revolving credit agreement | $ | — | $ | — | $ | — | $ | — | $ | — | |||||
| Operating leases | 15,529 | 3,607 | 6,126 | 4,980 | 816 | ||||||||||
| $ | 15,529 | $ | 3,607 | $ | 6,126 | $ | 4,980 | $ | 816 | ||||||
On April 5, 2002, we sold 1,282,214 shares of our common stock to a group of investors in a private transaction. We utilized the approximately $9.3 million of net proceeds that were received from the sale to satisfy existing obligations due to certain former employees of Check Solutions, with the remainder being used for working capital. See Note 6 in Notes to our Consolidated Financial Statements.
| | Payments Due by Period | ||||||||||||||
|---|---|---|---|---|---|---|---|---|---|---|---|---|---|---|---|
| | Total | 1 Year or Less | Years 2-3 | Years 4-5 | After 5 Years | ||||||||||
| Operating leases | $ | 12,179 | $ | 3,436 | $ | 5,825 | $ | 2,918 | $ | — | |||||
| $ | 12,179 | $ | 3,436 | $ | 5,825 | $ | 2,918 | $ | — | ||||||
We believe that current cash balances and marketable securities and expected future cash flows will be sufficient to meet our anticipated cash needs for working capital and routine capital expenditures and other activities during fiscal 2005.2006. However, if current sources are not sufficient to meet our needs, we
may seek additional equity or debt financing. There can be no assurance that additional financing would be available on acceptable terms, if at all. The Company isWe are presently involved in a number of lawsuits. While we do not expect any significant negative outcomes, the final resolutions of the lawsuits including a shareholder class action lawsuit.are unknown, and could include judgments against us, or settlements that could require additional substantial payments by us. See Note 10 in our Notes to Consolidated Financial Statements. The timing of the final resolution of these matters is uncertain. We believe that a material adverse outcome or outcomes with respect to the lawsuits could have a material adverse effect on our financial results, our business or our management including but not limited to, significantly impacting our liquidity in a negative manner as well as causing covenant violations under our revolving credit agreement, possibly resulting in a default thereunder. Further, we may in the future pursue acquisitions of businesses, products or technologies
that could complement or expand our business and product offerings, and could change our financing needs. Our forecast of the likely outcomes of the lawsuits to which we are a party and the period of time through which our financial resources will be adequate to support our operations is aare forward looking statementstatements that involvesinvolve risks and uncertainties, and actual results could vary. The failure to secure additional financing when needed could have a material adverse effect on our business, financial condition and results of operations.
We are going to adopt SFAS No. 123(R), which requires all share-based payments to employees including grants for stock options to be recognized in the Statement of Operations based on their fair values on February 1, 2006. During the fourth quarter of fiscal 2005, we accelerated the vesting of all unvested stock options with a grant price in excess of $7.50, except those options granted to the CEO. This acceleration was performed to reduce the stock option expense in future years. This acceleration will result in approximately a $1.9 million expense savings in future years. As of January 31, 2006, the future expense related to unvested options granted to date is as follows for the indicated fiscal years ending January 31, (in thousands):
| Year | Amount | ||
|---|---|---|---|
| 2007 | $ | 976 | |
| 2008 | 453 | ||
| 2009 | 198 | ||
| 2010 | 10 | ||
Critical Accounting Policies
In preparing our consolidated financial statements in conformity with accounting principles generally accepted in the United States, we use certain estimates and assumptions that affect the reported amounts and related disclosures and our estimates may vary from actual results. We consider the following seven accounting policies the most important to the portrayal of our financial condition and those that require the most subjective judgment. Although we believe that our estimates and assumptions are reasonable, actual results may differ, and such differences could be significant to our financial results.
Revenue Recognition
OurThe Company's revenue recognition policies are in accordance with Statement of Position ("SOP") 97-2,"Software Revenue Recognition," as amended by SOP 98-9, ""Modification of SOP 97-2, Software Revenue Recognition with Respect to Certain Transactions," and Staff Accounting Bulletin ("SAB") No. 104,"Revenue Recognition," and Emerging Issues Task Force ("EITF") No. 00-21,"Revenue Arrangements with Multiple Deliverables." In the case of software arrangements that require significant production, modification, or customization of software, or the license agreement requires usthe Company to provide implementation services that are determined to be essential to other elements of the arrangement, we followthe Company follows the guidance in SOP 81-1,"Accounting for Performance of Construction—Type and Certain Production—Type Contracts."
In the case of non-software arrangements, we apply EITF No. 00-21 and revenues related to arrangements with multiple elements are allocated to each element based on the element's relative fair value. Revenue allocated to separate elements is recognized for each element in accordance with our accounting policies described below. If we cannot account for items included in a multiple-element arrangement as separate units of accounting, they are combined and accounted for as a single unit of accounting and generally recognized as the undelivered items or services are provided to the customer.
Consulting Fees.Consulting. We employThe Company employs three primary pricing methods in connection with ourits delivery of consulting services. First, wethe Company may price ourits delivery of consulting services on the basis of time and materials, in which case the customer is charged agreed-upon daily rates for services performed and out-of-pocket expenses. In this case, we arethe Company is generally paid fees and related amounts usually on a monthly basis, and we recognizethe Company recognizes revenues as the services are performed. Second, wethe Company may deliver consulting services on a fixed-price basis. In this case, we are generallythe Company is paid on a monthly basis or pursuant to an agreed upon payment schedule, and we recognizethe Company recognizes revenues on a proportionate performance basis. We believeThe Company believes that this method is appropriate because of ourits ability to determine performance milestones and determine dependable estimates of ourits costs applicable to each phase of a contract. Because financial reporting of these contracts depends on estimates, which are assessed continually during the term of the contract, costs are subject to revisions as the contract progresses. Anticipated losses on fixed-pricedfixed-price contracts are recognized when estimable. Third, wethe Company may deliver consulting services pursuant to a value-priced contract with the customer. In this case, we arethe Company is paid, on an agreed upon basis with the customer, either a specified percentage of (1) the projected increased revenues and/or decreased costs that are expected to be derived by the customer generally over a period of up to twelve months following implementation of ourits solution or (2) the actual increased revenues and/or decreased costs experienced by the customer generally over a period of up to twelve months following implementation of ourits solution, subject in either case to a maximum, if any is agreed to, on the total amount of payments to be made to us. Wethe Company. The Company must first commit time and resources to develop projections associated with value-pricing contracts before a bankcustomer will commit to purchase ourits solutions, and wethe Company therefore assumeassumes the risk of making these commitments with no assurance that the customer will purchase the solution. Costs associated with these value-pricing contracts are expensed as incurred.incurred. These contracts typically include payments to be made to usthe Company pursuant to an agreed upon schedule ranging from one to twelve months in length. We recognizeThe Company recognizes revenues generated from consulting services in connection with value-priced contracts based upon projected results only upon
completion of all services and agreement upon the actual fee to be paid (even though billings for these services may be delayed by mutual agreement for periods not to exceed twelve months). In an effort to allow customers to more closely match expected benefits from our services with payments to us, we maythe Company, the Company on occasion, may offer payment terms which extend beyond 12 months. When we enterthe Company enters into an agreement thatwhich has a significant component of the total amount payable under the agreement due beyond 12 months or if it is determined payments are not fixed and determinable at the date the agreement iswas entered into, revenue under the arrangement will be recognized as payments become due and payable. When fees are to be paid based on a percentage of actual revenues and/or savings to our customers, we recognizethe Company recognizes revenues only upon completion of all services and as the amounts of actual revenues or savings are confirmed by the customer with a fixed payment date.
Costs associated with time and materials, fixed-priced and value-priced consulting fee arrangements are expensed as incurred and are included as a component of the cost of consulting fees.
We expectThe Company expects that value-pricedvalue-pricing contracts will continue to account for a significant portion of ourits revenues in the future. As a consequence of the use of value-pricedvalue-pricing contracts and due to the revenue recognition policy associated with those contracts, ourthe Company's results of operations will likely fluctuate significantly from period to period.
Regardless of the pricing method employed by usthe Company in a given contract, we arethe Company is typically reimbursed on a monthly basis for out-of-pocket expenses incurred on behalf of ourits customers.
Software License Fees.License. A perpetual software license is sold either together with implementation services or on a stand-alone basis. We areThe Company is usually paid software license fees in one or more installments, as provided in the customer's contract but not to exceed 12twelve months. We recognizeThe Company recognizes software license revenue upon execution of a contract and delivery of the software, provided that the license fee is fixed and determinable, no significant production, modification or customization of the software is required and collection is considered probable by management. When the software license arrangement requires usthe Company to provide implementation services that are essential to the functionality of the software or significant production, customization or modification of the software is required, both the product license revenue and implementation fees are recognized as services are performed. A term software license is sold either together with implementation services and/or with maintenance services. These term licenses are usually paid in annual installments over the term of the license. If the term software license is sold without essential implementation services, the revenue is recognized ratably over the non-cancelable license term. If the term license is sold with essential implementation services, the license revenue is recognized as the lesser of the amount of license revenue recognized as services are performed or on a ratable basis.
In certain instances, especially with recently developed software, we deferthe Company defers software license revenue recognition until the earlier of the product being determined to be generally available and subject to revenue recognition or when the services are completed and the project is accepted by the customer. This practice is followed for the first two installations of a recently developed software product. After two successful implementations, the product is considered generally available ("GA").
Software licenses are often sold as part of a multiple element arrangement that may include maintenance, implementation or consulting. We determineThe Company determines whether there is vendor specific objective evidence of fair value ("VSOEFV") for each element identified in the arrangement to determine whether the total arrangement fees can be allocated to each element. If VSOEFV exists for each element, the total arrangement fee is allocated based on the relative fair value of each element. In cases where there is not VSOEFV for each element, or if it is determined services are essential to the functionality of the software being delivered, or if significant production, modification or customization of the software is required, wethe Company initially deferdefers revenue recognition of the software license fees until VSOEFV is established or the services are performed. However, if VSOEFV is determinable for all of the undelivered elements, and assuming the undelivered elements are not essential to the delivered elements, wethe Company will defer recognition of the full fair value related to the undelivered elements and recognize the remaining portion of the arrangement value through application of the residual method. Where VSOEFV has not been established for certain undelivered elements, revenue for all elements is deferred until those elements have been delivered or their fair values have been determined. Evidence of VSOEFV is determined for software products based on actual sales prices for the product sold to a similar class of customer and based on pricing strategies set forth in ourthe Company's price book. Evidence of
VSOEFV for services (installation, implementation(implementation and consulting) is based upon standard billing rates and the estimated level of effort for individuals expected to perform the related services. We establishThe Company establishes VSOEFV for maintenance agreements using the percentage method such that VSOEFV for maintenance is a percentage of the license fee charged annually for a specific software product, which in most instances is 20% of the portion of arrangement fees allocated to the software license element.
Although substantially all of ourthe Company's current software licenses provide for a fixed-pricefixed price license fee, some licenses instead provide for the customer to pay a monthly license fee based on the actual use of the software product. The level of license fees earned by usthe Company under this arrangementthese arrangements will vary based on the actual amount of use by the customer. Revenue under these arrangements is recognized on a monthly basis as the usage becomes determinable.
Software Maintenance Fees.Maintenance. In connection with ourthe sale of a software license, a customer may elect to purchase software maintenance services. Most of the customers that purchase software licenses from usthe Company also purchase software maintenance services, which typically are renewed annually. We chargeThe Company charges an annual maintenance fee, which is typically a percentage of the initial software license fee. The annual maintenance fee generally is paid to usthe Company at the beginning of the maintenance period, and we recognizethe Company recognizes these revenues ratably over the term of the related contract. If the annual maintenance fee is not paid at the beginning of the maintenance period, we deferthe Company defers revenue recognition until the time that the maintenance fee is paid by the customer. WeThe Company normally continuecontinues to provide maintenance service while awaiting payment from customers. When the payment is received, revenue is recognized for the period that revenue was previously deferred. This may result in volatility in software maintenance revenue from period-to-period.period to period.
Software Implementation Fees.and Other Services. In connection with the sale of a software license, a customer may elect to purchase software implementation services, including software enhancements and other software services. Most of the customers that purchase software licenses from usthe Company also purchase software implementation services. We price ourThe Company prices its implementation services on a time-and-materialtime-and-materials or on a fixed-price basis, and we recognizethe Company recognizes the related revenues as services are performed. Costs associated with these engagements are expensed as incurred.
Outsourcing Services Fees.Services. While outsourcing revenue has been minimal to date, we currently recognize revenue based on the number of items processed multiplied by the contracted price per item.processed. These services are billed currently billed on a monthly basis.
Our Return Provisions. The Company's contracts typically do not include right of return clauses, and as a result, we dothe Company does not record a provision for returns.
Royalties
InWe are required to pay royalties in connection with software license, maintenance and maintenanceconsulting agreements entered into with certain banks and purchase agreements with vendorscustomers under which we acquired third party software technology or other intellectual property used in products and services sold to its customers, we are required to pay royalties on sales of certain software products.our customers. Under these arrangements, we accrue royalty expense when the associated revenue is recognized. For current product offerings, the royalty percentages generally range from 20%-50% of the associated revenues. Royalty expense is primarily included as a component of the cost of software license feesrevenues; however, certain amounts are also included in cost of consulting and cost of software maintenance fees in the accompanying condensed consolidated statementstatements of operations.
Allowance for Doubtful Accounts
A large proportion of our revenues and receivables are attributable to our customers in the banking industry. Our trade accounts receivable balance is recorded net of allowances for amounts not expected to be collected from our customers. Because our accounts receivable are typically unsecured, we periodically evaluate the collectibility of our accounts based on a combination of factors, including a particular customer's ability to pay as well as the age of receivables. In cases where the evidence
suggests a customer may not be able to satisfy its obligation to us or if the collection of the receivable becomes doubtful due to a dispute that arises subsequent to the delivery of our products and services, we set up a specific reserve in an amount we determine appropriate for the perceived risk. If circumstances change, such as higher than expected defaults or an unexpected material adverse change in a customer's ability to meet their financial obligations to us, our estimates of recoverability of amounts due us could be reduced by a material amount.
Software Costs Capitalized, Acquired Developed Technology, Goodwill, Other Intangible Assets and Other Long-Lived Assets
Software costs capitalized include developed technology acquired in acquisitions and costs incurred by us in developing our products that qualify for capitalization. We capitalize our software development costs, other than costs for internal-use software, in accordance with Statement of Financial Accounting Standards No. 86, ""Accounting for Costs of Computer Software to be Sold, Leased or Otherwise Marketed" ("SFAS 86"). Our policy is to capitalize software development costs incurred in developing a product once technological feasibility of the product has been established. Software development costs capitalized also include amounts paid for purchased software on products that have reached technological feasibility. Technological feasibility of the product is determined after completion of a detailed program design and a determination has been made that any uncertainties related to high-risk development issues have been resolved. If the process of developing the product does not include a detailed program design, technological feasibility is determined only after completion of a working model. All capitalized software development costs are amortized using an amount determined as the greater of: (1) the ratio that current gross revenues for a capitalized software project bears to the total of current and future projected gross revenues for that project or (2) the straight-line method over the estimated remaining economic life of the product (generally three to six years). We continually monitor the net realizable value of the software capitalized and acquired developed technology for factors that would indicate impairment, such as a decline in the demand or loss of a significant customer. During the quarterly period ended January 31, 2005,2006, we performed our annual formal evaluation for impairment and determined that the carrying amount of these assets werewas not impaired and have noted no subsequent factors that would indicate impairment.
Goodwill is assessed on an annual basis for impairment at the reporting unit level by applying a fair value based test. We performedtest utilizing the initial impairment testresults of goodwill at February 1, 2002 and a follow up test at November 1, 2002 to determine if an impairment charge should be recognized under SFAS 142. The initial impairment analysis did not result in any write-down of capitalized costs.third party appraisal. We perform an annual impairment assessment on November 1st1st of each year or when factors indicate that other long-lived assetsgoodwill should be evaluated for possible impairment. We use an estimate of undiscounted future net cash flows over the remaining life of the asset to determine if impairment has occurred. Assets are grouped at the lowest level for which there are identifiable cash flows that are largely independent from other asset groups. An impairment in the carrying value of an asset is assessed when the undiscounted, expected future operating cash flows derived from the asset are less than its carrying value. Management believes that assumptions used to determine cash flows are reasonable, but actual future cash flows may differ from those estimated. If we determine an asset has been impaired, the impairment is recorded based on the estimated fair value of the impaired asset. During the period ended January 31, 2003, we recorded an impairment charge of $46.0 million due to a decline in our market valuation. During the quarterly period ended January 31, 2006 and 2005, we performed our annual evaluation for goodwill impairment and determined that the carrying amount of goodwill was not impaired and have not noted any factors subsequent that would indicate impairment. Goodwill at January 31, 2006 and 2005 totaled $20.8 million. Any deterioration in market conditions, increases in interest rates and changes in our projections with respect to the Global Payments Technologies reporting unit to which goodwill is allocated would result in additional impairment charges in the future.
Restructuring and Other Charges
During fiscal year 2001, we recorded reserves in connection with our acquisition of Check Solutions and subsequentThese operational restructurings. Additional reserves were recorded during fiscal 2002, 2003 and 2004. Theserestructuring reserves contain significant estimates pertaining to work force reductions, and the settlement of contractual obligations resulting from our actions. In the quarterly period ended July 31, 2004, we revised our estimate to reflect our remaining costs to develop and install any additional software, or software modifications, with two customers and reversed approximately $1.2 million of our reserve, and in the quarterly period ended January 31, 2005 revised this estimate again and reversed $67,000. Although we do not anticipate any significant changes in the future, the actual costs may differ from these estimates.
Contingencies
We are subject to proceedings, lawsuits and other claims. We are required to assess the likelihood of any adverse judgments ofor outcomes to these matters as well as potential ranges of probable losses. A determination of the amount or reserves required, if any, for these contingencies is made after careful analysis of each individual issue. The required reserves may change in the future due to new developments in each matter or changes in insurance coverage or approach such as change in settlement strategy.
Income Taxes
We recognize deferred tax assets or liabilities for the expected future tax consequences of temporary differences between the book and tax basis of assets and liabilities. We review our deferred tax assets for recoverability and establish a valuation allowance based on historical taxable income,
projected future taxable income and the expected timing of the reversals of existing temporary differences. As a result of our cumulative net lossesrecent history of inconsistent profitability, we have provided a full valuation allowance against our net deferred tax assets. In addition, we expect to provide a full valuation allowance of any future tax benefits until we can sustain a level of profitability that demonstrates our ability to utilize these assets.
Recently Issued Accounting Standards
See "Recently Issued Accounting Standards" in Note 2 of the Notes to Consolidated Financial Statements.
Item 7A. Quantitative and Qualitative Disclosures about Market Risk.
Interest Rate Risk
We invest our cash in a variety of financial instruments. The vast majority of these investments are denominated in U.S. dollars and maintained with nationally recognized financial institutions.
Investments in both fixed rate and floating rate interest earning instruments carry a degree of interest rate risk. Fixed rate securities may have their fair market value adversely impacted due to a rise in interest rates, while floating rate securities may produce less income than expected if interest rates fall. Due in part to these factors, our future investment income may fall short of expectations due to changes in interest rates, or we may suffer losses in principal if forced to sell securities which have seen a decline in market value due to changes in interest rates. Our investment securities are held for purposes other than trading. At January 31, 2005,2006, we did not hold any fixed-rate investments.held $4.7 million of auction rate securities. The interest rate for these notes will adjust to the current market interest rate at each interest reset date, which is typically on at least a monthly basis.
We had no outstanding borrowings under our revolving credit agreement at January 31, 2005.2006. As described in Note 45 of our Notes to Consolidated Financial Statements, the interest rate under the revolving credit agreement is variable.
Foreign Currency Risk
We currently have sales and marketing operations in several international locations including Canada, United Kingdom, South Africa and Australia. As a result, we have assets and liabilities outside the United States that are subject to fluctuations in foreign currency exchange rates. Due to the nature of these operations, we currently utilize the U.S. Dollar as the functional currency for all international operations. Within Carretek LLC, our 51% owned subsidiary which offers financial institutions offshore-centric outsourcing of their business processes, the majority of the labor costs is denominated in Indian Rupees while the revenues from this operation are denominated in U.S. Dollars. As our operations increase, fluctuating labor costs may increase our foreign currency risk.
An insignificant portion of our accounts receivable balance at January 31, 2005,2006 was denominated in a foreign currency. Our exposure to adverse movements in foreign exchange rates is typically not significant. Therefore, weWe do not currently hedge our foreign currency exposure; however, we do try to limit our foreign currency exposure by negotiating these foreign contracts in U.S. Dollars. However, inIn the future we may change this practice. We will continue to evaluate the need to adopt a hedge strategy in the future and may implement a formal strategy if our business transacted in foreign currencies increases.future periods.
Foreign exchange losses were $222,000 and $279,000 in the years ended January 31, 2006 and 2005, respectively. Foreign exchange gains were $185,000 in the year ended January 31, 2005. Foreign exchange gains were $185,000 and $324,000 in the years ended January 31, 2004 and 2003, respectively.2004.
Item 8. Financial Statements and Supplementary Data.
CARREKER CORPORATION
INDEX TO CONSOLIDATED FINANCIAL STATEMENTS
REPORT OF ERNST & YOUNG LLP, INDEPENDENT REGISTERED PUBLIC ACCOUNTING FIRM
The Board of Directors and Stockholders
Carreker Corporation
We have audited the accompanying consolidated balance sheets of Carreker Corporation and subsidiaries (the Company) as of January 31, 20052006 and 2004,2005, and the related consolidated statements of operations, stockholders' equity, and cash flows for each of the three years in the period ended January 31, 2005.2006. These financial statements are the responsibility of the Company's management. Our responsibility is to express an opinion on these financial statements based on our audits.
We conducted our audits in accordance with the standards of the Public Company Accounting Oversight Board (United States). Those standards require that we plan and perform the audit to obtain reasonable assurance about whether the financial statements are free of material misstatement. An audit includes examining, on a test basis, evidence supporting the amounts and disclosures in the financial statements. An audit also includes assessing the accounting principles used and significant estimates made by management, as well as evaluating the overall financial statement presentation. We believe that our audits provide a reasonable basis for our opinion.
In our opinion, the financial statements referred to above present fairly, in all material respects, the consolidated financial position of Carreker Corporation at January 31, 20052006 and 2004,2005, and the consolidated results of their operations and their cash flows for each of the three years in the period ended January 31, 2005,2006, in conformity with U.S. generally accepted accounting principles.
The consolidated financial statements, as of January 31, 2005 and 2004 and for the year ended January 31, 2004, have been restated as discussed in Note 3.
We have also audited, in accordance with the standards of the Public Company Accounting Oversight Board (United States), the effectiveness of the Company's internal control over financial reporting as of January 31, 2005,2006, based on criteria established in Internal Control-Integrated Framework issued by the Committee of Sponsoring Organizations of the Treadway Commission and our report dated April 6, 200526, 2006 expressed an unqualified opinion thereon.on management's assessment and an adverse opinion on the effectiveness of internal control over financial reporting.
/s/ ERNST & YOUNG LLP
Dallas, Texas
April 6, 200526, 2006
CARREKER CORPORATION
CONSOLIDATED BALANCE SHEETS
(In thousands, except per share amounts)
| | | January 31, | | January 31, | ||||||||||||
|---|---|---|---|---|---|---|---|---|---|---|---|---|---|---|---|---|
| | | 2005 | 2004 | | 2006 | 2005 | ||||||||||
| | | | (As restated) See Note 3 | |||||||||||||
| ASSETS | ASSETS | |||||||||||||||
| Current assets | Current assets | Current assets | ||||||||||||||
| Cash and cash equivalents | $ | 34,516 | $ | 28,605 | Cash and cash equivalents | $ | 29,684 | $ | 34,516 | |||||||
| Accounts receivable, net of allowance of $529 and $1,512 at January 31, 2005 and January 31, 2004, respectively | 11,144 | 21,751 | Marketable securities | 4,700 | — | |||||||||||
| Prepaid expenses and other current assets | 2,595 | 3,545 | Accounts receivable, net of allowance of $601 and $529 at January 31, 2006 and January 31, 2005, respectively | 12,225 | 11,144 | |||||||||||
| Prepaid expenses and other current assets | 2,940 | 2,595 | ||||||||||||||
| Total current assets | Total current assets | 48,255 | 53,901 | Total current assets | 49,549 | 48,255 | ||||||||||
Property and equipment, net of accumulated depreciation of $20,194 and $17,140 at January 31, 2005 and January 31, 2004, respectively | 6,604 | 6,690 | ||||||||||||||
| Capitalized software costs, net of accumulated amortization of $12,426 and $11,050 at January 31, 2005 and January 31, 2004, respectively | 3,245 | 2,028 | ||||||||||||||
| Acquired developed technology, net of accumulated amortization of $15,773 and $11,153 at January 31, 2005 and January 31, 2004, respectively | 9,927 | 14,547 | ||||||||||||||
| Goodwill, net of accumulated amortization of $3,405 at January 31, 2005 and January 31, 2004 | 20,765 | 21,193 | ||||||||||||||
| Customer relationships, net of accumulated amortization of $5,133 and $3,733 at January 31, 2005 and January 31, 2004, respectively | 3,267 | 4,667 | ||||||||||||||
| Deferred loan costs, net of accumulated amortization of $1,300 and $1,028 at January 31, 2005 and January 31, 2004, respectively | 407 | 680 | ||||||||||||||
| Property and equipment, net of accumulated depreciation of $23,050 and $20,194 at January 31, 2006 and January 31, 2005, respectively | Property and equipment, net of accumulated depreciation of $23,050 and $20,194 at January 31, 2006 and January 31, 2005, respectively | 5,947 | 6,604 | |||||||||||||
| Capitalized software costs, net of accumulated amortization of $13,686 and $12,426 at January 31, 2006 and January 31, 2005, respectively | Capitalized software costs, net of accumulated amortization of $13,686 and $12,426 at January 31, 2006 and January 31, 2005, respectively | 2,761 | 3,245 | |||||||||||||
| Acquired developed technology, net of accumulated amortization of $20,393 and $15,773 at January 31, 2006 and January 31, 2005, respectively | Acquired developed technology, net of accumulated amortization of $20,393 and $15,773 at January 31, 2006 and January 31, 2005, respectively | 5,307 | 9,927 | |||||||||||||
| Goodwill, net of accumulated amortization of $3,405 at January 31, 2006 and January 31, 2005 | Goodwill, net of accumulated amortization of $3,405 at January 31, 2006 and January 31, 2005 | 20,765 | 20,765 | |||||||||||||
| Customer relationships, net of accumulated amortization of $6,533 and $5,133 at January 31, 2006 and January 31, 2005, respectively | Customer relationships, net of accumulated amortization of $6,533 and $5,133 at January 31, 2006 and January 31, 2005, respectively | 1,867 | 3,267 | |||||||||||||
| Deferred loan costs, net of accumulated amortization of $1,571 and $1,300 at January 31, 2006 and January 31, 2005, respectively | Deferred loan costs, net of accumulated amortization of $1,571 and $1,300 at January 31, 2006 and January 31, 2005, respectively | 136 | 407 | |||||||||||||
| Other assets | Other assets | 549 | 824 | Other assets | 793 | 835 | ||||||||||
| Total assets | Total assets | $ | 93,019 | $ | 104,530 | Total assets | $ | 87,125 | $ | 93,305 | ||||||
LIABILITIES AND STOCKHOLDERS' EQUITY | LIABILITIES AND STOCKHOLDERS' EQUITY | LIABILITIES AND STOCKHOLDERS' EQUITY | ||||||||||||||
| Current liabilities | Current liabilities | Current liabilities | ||||||||||||||
| Accounts payable | $ | 992 | $ | 913 | Accounts payable | $ | 1,168 | $ | 992 | |||||||
| Accrued compensation and benefits | 7,818 | 9,219 | Accrued compensation and benefits | 6,153 | 7,818 | |||||||||||
| Other accrued expenses | 3,323 | 4,621 | Other accrued expenses | 4,608 | 3,609 | |||||||||||
| Income tax payable | 339 | 80 | Income tax payable | 220 | 339 | |||||||||||
| Deferred revenue | 22,181 | 25,231 | Deferred revenue | 19,151 | 24,222 | |||||||||||
| Accrued merger and restructuring costs | 1,004 | 1,898 | Accrued merger and restructuring costs | 334 | 1,004 | |||||||||||
| Total current liabilities | Total current liabilities | 35,657 | 41,962 | Total current liabilities | 31,634 | 37,984 | ||||||||||
| Long-term debt | — | 6,250 | ||||||||||||||
| Total liabilities | 35,657 | 48,212 | ||||||||||||||
Commitments and Contingencies | Commitments and Contingencies | Commitments and Contingencies | ||||||||||||||
Stockholders' equity | Stockholders' equity | Stockholders' equity | ||||||||||||||
| Preferred stock, $.01 par value: 2,000 shares authorized; no shares issued or outstanding | — | — | Preferred stock, $.01 par value: 2,000 shares authorized; no shares issued or outstanding | — | — | |||||||||||
| Common stock, $.01 par value: 100,000 shares authorized; 24,852 and 24,357 shares issued at January 31, 2005 and January 31, 2004, respectively | 249 | 244 | Common stock, $.01 par value: 100,000 shares authorized; 25,319 and 24,852 shares issued at January 31, 2006 and January 31, 2005, respectively | 254 | 249 | |||||||||||
| Additional paid-in capital | 110,992 | 108,757 | Additional paid-in capital | 112,316 | 110,992 | |||||||||||
| Accumulated deficit | (53,876 | ) | (52,680 | ) | Accumulated deficit | (53,848 | ) | (55,917 | ) | |||||||
| Less treasury stock, at cost: 1 common shares at January 31, 2005 and January 31, 2004 | (3 | ) | (3 | ) | Less treasury stock, at cost: 641 and 1 common shares at January 31, 2006 and January 31, 2005, respectively | (3,231 | ) | (3 | ) | |||||||
| Total stockholders' equity | Total stockholders' equity | 57,362 | 56,318 | Total stockholders' equity | 55,491 | 55,321 | ||||||||||
| Total liabilities and stockholders' equity | Total liabilities and stockholders' equity | $ | 93,019 | $ | 104,530 | Total liabilities and stockholders' equity | $ | 87,125 | $ | 93,305 | ||||||
See accompanying notes.
CARREKER CORPORATION
CONSOLIDATED STATEMENTS OF OPERATIONS
(In thousands, except per share amounts)
| | | Year Ended January 31, | ||||||||||||||||||||||
|---|---|---|---|---|---|---|---|---|---|---|---|---|---|---|---|---|---|---|---|---|---|---|---|---|
| | | Year Ended January 31, | | 2006 | 2005 | 2004 | ||||||||||||||||||
| | | 2005 | 2004 | 2003 | | | | (As restated) See Note 3 | ||||||||||||||||
| Revenues: | Revenues: | Revenues: | ||||||||||||||||||||||
| Consulting fees | $ | 37,193 | $ | 34,064 | $ | 39,204 | Consulting | $ | 33,244 | $ | 37,193 | $ | 34,064 | |||||||||||
| Software license fees | 20,429 | 27,365 | 37,946 | Software license | 18,277 | 20,429 | 27,365 | |||||||||||||||||
| Software maintenance fees | 43,293 | 45,122 | 41,858 | Software maintenance | 42,442 | 43,293 | 43,081 | |||||||||||||||||
| Software implementation fees | 14,799 | 18,103 | 24,310 | Software implementation and other services | 18,457 | 14,799 | 18,103 | |||||||||||||||||
| Outsourcing service fees | 139 | — | — | Outsourcing services | 1,038 | 139 | — | |||||||||||||||||
| Out-of-pocket expense reimbursements | 3,038 | 4,254 | 6,458 | Out-of-pocket expense reimbursements | 3,126 | 3,038 | 4,254 | |||||||||||||||||
| Total revenues | 118,891 | 128,908 | 149,776 | Total revenues | 116,584 | 118,891 | 126,867 | |||||||||||||||||
Cost of revenues: | Cost of revenues: | Cost of revenues: | ||||||||||||||||||||||
| Consulting fees | 18,989 | 20,470 | 25,067 | Consulting | 17,186 | 18,989 | 20,470 | |||||||||||||||||
| Software license fees | 7,960 | 8,020 | 7,701 | Software license | 7,962 | 7,960 | 8,020 | |||||||||||||||||
| Write-off of capitalized software costs and prepaid software royalties | — | — | 954 | Software maintenance | 14,209 | 14,771 | 13,420 | |||||||||||||||||
| Software maintenance fees | 14,771 | 13,420 | 10,773 | Software implementation and other services | 13,334 | 14,747 | 17,901 | |||||||||||||||||
| Software implementation fees | 14,747 | 17,901 | 19,496 | Outsourcing services | 1,914 | 616 | — | |||||||||||||||||
| Outsourcing service fees | 616 | — | — | Out-of-pocket expenses | 3,103 | 3,087 | 4,335 | |||||||||||||||||
| Out-of-pocket expenses | 3,087 | 4,335 | 7,248 | |||||||||||||||||||||
| Total cost of revenues | 57,708 | 60,170 | 64,146 | |||||||||||||||||||||
| Total cost of revenues | 60,170 | 64,146 | 71,239 | |||||||||||||||||||||
| Gross profit | Gross profit | 58,721 | 64,762 | 78,537 | Gross profit | 58,876 | 58,721 | 62,721 | ||||||||||||||||
Operating costs and expenses: | Operating costs and expenses: | Operating costs and expenses: | ||||||||||||||||||||||
| Selling, general and administrative | 46,524 | 49,733 | 50,326 | |||||||||||||||||||||
| Research and development | 8,644 | 7,471 | 11,307 | Selling, general and administrative | 45,527 | 46,524 | 49,733 | |||||||||||||||||
| Amortization of customer relationships | 1,400 | 1,400 | 1,400 | Research and development | 9,617 | 8,644 | 7,471 | |||||||||||||||||
| Goodwill impairment | — | — | 46,000 | Amortization of customer relationships | 1,400 | 1,400 | 1,400 | |||||||||||||||||
| Restructuring and other charges | 3,682 | 1,901 | 2,945 | Restructuring and other charges | 918 | 3,682 | 1,901 | |||||||||||||||||
| Total operating costs and expenses | 60,250 | 60,505 | 111,978 | Total operating costs and expenses | 57,462 | 60,250 | 60,505 | |||||||||||||||||
| Income (loss) from operations | Income (loss) from operations | (1,529 | ) | 4,257 | (33,441 | ) | Income (loss) from operations | 1,414 | (1,529 | ) | 2,216 | |||||||||||||
Other income (expense): | Other income (expense): | Other income (expense): | ||||||||||||||||||||||
| Interest income | 306 | 266 | 414 | Interest income | 716 | 306 | 266 | |||||||||||||||||
| Interest expense | (442 | ) | (1,218 | ) | (2,583 | ) | Interest expense | (440 | ) | (442 | ) | (1,218 | ) | |||||||||||
| Other income | 1,037 | 601 | 505 | Other income | 814 | 1,037 | 601 | |||||||||||||||||
| Total other income (expense), net | 901 | (351 | ) | (1,664 | ) | Total other income (expense), net | 1,090 | 901 | (351 | ) | ||||||||||||||
| Income (loss) before provision (benefit) for income taxes | (628 | ) | 3,906 | (35,105 | ) | |||||||||||||||||||
| Provision (benefit) for income taxes | 568 | 200 | (1,475 | ) | ||||||||||||||||||||
| Income (loss) before provision for income taxes | Income (loss) before provision for income taxes | 2,504 | (628 | ) | 1,865 | |||||||||||||||||||
| Provision for income taxes | Provision for income taxes | 435 | 568 | 200 | ||||||||||||||||||||
| Net income (loss) | Net income (loss) | $ | (1,196 | ) | $ | 3,706 | $ | (33,630 | ) | Net income (loss) | $ | 2,069 | $ | (1,196 | ) | $ | 1,665 | |||||||
| Basic earnings (loss) per share | Basic earnings (loss) per share | $ | (0.05 | ) | $ | 0.16 | $ | (1.45 | ) | Basic earnings (loss) per share | $ | 0.09 | $ | (0.05 | ) | $ | 0.07 | |||||||
| Diluted earnings (loss) per share | Diluted earnings (loss) per share | $ | (0.05 | ) | $ | 0.15 | $ | (1.45 | ) | Diluted earnings (loss) per share | $ | 0.08 | $ | (0.05 | ) | $ | 0.07 | |||||||
| Shares used in computing basic earnings (loss) per share | Shares used in computing basic earnings (loss) per share | 24,295 | 23,736 | 23,198 | Shares used in computing basic earnings (loss) per share | 24,092 | 24,295 | 23,736 | ||||||||||||||||
| Shares used in computing diluted earnings (loss) per share | Shares used in computing diluted earnings (loss) per share | 24,295 | 24,384 | 23,198 | Shares used in computing diluted earnings (loss) per share | 24,478 | 24,295 | 24,384 | ||||||||||||||||
See accompanying notes.
CARREKER CORPORATION
CONSOLIDATED STATEMENTS OF STOCKHOLDERS' EQUITY
(In thousands, except per share amounts)
| | | Common Stock | | | Treasury Stock | | | Common Stock | | | | | | |||||||||||||||||||||||||||||||
|---|---|---|---|---|---|---|---|---|---|---|---|---|---|---|---|---|---|---|---|---|---|---|---|---|---|---|---|---|---|---|---|---|---|---|---|---|---|---|---|---|---|---|---|---|
| | | Additional Paid-In Capital | Accumulated Deficit | Total Stockholders' Equity | | | | Treasury Stock | | |||||||||||||||||||||||||||||||||||
| | | Shares | Amount | Shares | Amount | | Unrestricted Shares | Restricted Shares | | Additional Paid-In Capital | Accumulated Deficit | Total Stockholders' Equity | ||||||||||||||||||||||||||||||||
| Balance at January 31, 2002 | 21,924 | $ | 219 | $ | 93,680 | $ | (22,756 | ) | 27 | $ | (515 | ) | $ | 70,628 | ||||||||||||||||||||||||||||||
| Sale of common stock | 1,282 | 13 | 9,310 | — | — | — | 9,323 | |||||||||||||||||||||||||||||||||||||
| Issuance of shares of common stock upon exercises of stock options | 368 | 4 | 2,273 | — | — | — | 2,277 | |||||||||||||||||||||||||||||||||||||
| Net loss | — | — | — | (33,630 | ) | — | — | (33,630 | ) | |||||||||||||||||||||||||||||||||||
| | Unrestricted Shares | Restricted Shares | Amount | Additional Paid-In Capital | Accumulated Deficit | Shares | Amount | Total Stockholders' Equity | ||||||||||||||||||||||||||||||||||||
| Balance at January 31, 2003 | 23,574 | 236 | 105,263 | (56,386 | ) | 27 | (515 | ) | 48,598 | |||||||||||||||||||||||||||||||||||
| Balance at January 31, 2003 | Balance at January 31, 2003 | 23,574 | — | $ | 236 | 105,263 | $ | (56,386 | ) | 27 | $ | (515 | ) | $ | 48,598 | |||||||||||||||||||||||||||||
Reissuance of treasury stock as restricted stock | Reissuance of treasury stock as restricted stock | — | — | (512 | ) | — | (26 | ) | 512 | — | Reissuance of treasury stock as restricted stock | — | 26 | — | (512 | ) | — | (26 | ) | 512 | — | |||||||||||||||||||||||
| Cancellation of restricted stock | Cancellation of restricted stock | (10 | ) | — | — | — | — | — | — | Cancellation of restricted stock | — | (10 | ) | — | — | — | — | — | — | |||||||||||||||||||||||||
| Compensation expense related to issuance of restricted stock | Compensation expense related to issuance of restricted stock | 218 | 2 | 135 | — | — | — | 137 | Compensation expense related to issuance of restricted stock | — | 219 | 2 | 135 | — | — | — | 137 | |||||||||||||||||||||||||||
| Issuance of shares of common stock upon exercises of stock options | Issuance of shares of common stock upon exercises of stock options | 575 | 6 | 3,871 | — | — | — | 3,877 | Issuance of shares of common stock upon exercises of stock options | 548 | — | 6 | 3,871 | — | — | — | 3,877 | |||||||||||||||||||||||||||
| Net income | — | — | — | 3,706 | — | — | 3,706 | |||||||||||||||||||||||||||||||||||||
| Net income (As restated—See Note 3) | Net income (As restated—See Note 3) | — | — | — | — | 1,665 | — | — | 1,665 | |||||||||||||||||||||||||||||||||||
| Balance at January 31, 2004 | 24,357 | 244 | 108,757 | $ | (52,680 | ) | 1 | (3 | ) | 56,318 | Balance at January 31, 2004 | 24,122 | 235 | $ | 244 | 108,757 | $ | (54,721 | ) | 1 | $ | (3 | ) | $ | 54,277 | |||||||||||||||||||
Cancellation of restricted stock | Cancellation of restricted stock | (83 | ) | (1 | ) | (64 | ) | — | — | — | (65 | ) | Cancellation of restricted stock | — | (83 | ) | (1 | ) | (64 | ) | — | — | — | (65 | ) | |||||||||||||||||||
| Compensation expense related to issuance of restricted stock | Compensation expense related to issuance of restricted stock | 273 | 3 | 491 | — | — | — | 494 | Compensation expense related to issuance of restricted stock | — | 273 | 3 | 491 | — | — | — | 494 | |||||||||||||||||||||||||||
| Issuance of shares of common stock upon exercises of stock options | Issuance of shares of common stock upon exercises of stock options | 305 | 3 | 1,808 | — | — | — | 1,811 | Issuance of shares of common stock upon exercises of stock options | 305 | — | 3 | 1,808 | — | — | — | 1,811 | |||||||||||||||||||||||||||
| Net loss | Net loss | — | — | — | (1,196 | ) | — | — | (1,196 | ) | Net loss | — | — | — | — | (1,196 | ) | — | — | (1,196 | ) | |||||||||||||||||||||||
| Balance at January 31, 2005 | 24,852 | $ | 249 | $ | 110,992 | $ | (53,876 | ) | 1 | $ | (3 | ) | $ | 57,362 | Balance at January 31, 2005 | 24,427 | 425 | $ | 249 | $ | 110,992 | $ | (55,917 | ) | 1 | $ | (3 | ) | $ | 55,321 | ||||||||||||||
| Cancellation of restricted stock | Cancellation of restricted stock | — | (65 | ) | — | (85 | ) | — | — | — | (85 | ) | ||||||||||||||||||||||||||||||||
| Compensation expense related to issuance of restricted stock | Compensation expense related to issuance of restricted stock | — | 424 | 4 | 832 | — | — | — | 836 | |||||||||||||||||||||||||||||||||||
| Issuance of shares of common stock upon exercises of stock options | Issuance of shares of common stock upon exercises of stock options | 117 | — | 1 | 577 | — | — | — | 578 | |||||||||||||||||||||||||||||||||||
| Restricted shares withheld for payroll taxes | Restricted shares withheld for payroll taxes | — | (9 | ) | — | — | — | 9 | (49 | ) | (49 | ) | ||||||||||||||||||||||||||||||||
| Conversion of restricted common stock to unrestricted | Conversion of restricted common stock to unrestricted | 43 | (43 | ) | — | — | — | — | — | — | ||||||||||||||||||||||||||||||||||
| Common stock repurchases | Common stock repurchases | — | — | — | — | — | 631 | (3,179 | ) | (3,179 | ) | |||||||||||||||||||||||||||||||||
| Net income | Net income | — | — | — | — | 2,069 | — | — | 2,069 | |||||||||||||||||||||||||||||||||||
| Balance at January 31, 2006 | 24,587 | 732 | $ | 254 | $ | 112,316 | $ | (53,848 | ) | 641 | $ | (3,231 | ) | $ | 55,491 | |||||||||||||||||||||||||||||
See accompanying notes.
CARREKER CORPORATION
CONSOLIDATED STATEMENTS OF CASH FLOWS
(In thousands)
| | Year Ended January 31, | ||||||||||||||||||||||||
|---|---|---|---|---|---|---|---|---|---|---|---|---|---|---|---|---|---|---|---|---|---|---|---|---|---|
| Operating Activities: | 2005 | 2004 | 2003 | ||||||||||||||||||||||
| Net income (loss) | $ | (1,196 | ) | $ | 3,706 | $ | (33,630 | ) | | Year Ended January 31, | |||||||||||||||
| Adjustments to reconcile net income (loss) to net cash provided by (used in) operating activities: | | 2006 | 2005 | 2004 | |||||||||||||||||||||
| Depreciation and amortization of property and equipment | 3,364 | 3,443 | 4,361 | | | | (As restated) See Note 3 | ||||||||||||||||||
| Operating Activities: | Operating Activities: | ||||||||||||||||||||||||
| Net income (loss) | Net income (loss) | $ | 2,069 | $ | (1,196 | ) | $ | 1,665 | |||||||||||||||||
| Adjustments to reconcile net income (loss) to net cash provided by operating activities: | Adjustments to reconcile net income (loss) to net cash provided by operating activities: | ||||||||||||||||||||||||
| Amortization of capitalized software costs and acquired developed technology | 5,994 | 5,311 | 5,882 | Depreciation and amortization of property and equipment | 3,180 | 3,364 | 3,443 | ||||||||||||||||||
| Amortization of customer relationships | 1,400 | 1,400 | 1,400 | Amortization of capitalized software costs | 1,260 | 1,374 | 1,025 | ||||||||||||||||||
| Goodwill impairment | — | — | 46,000 | Amortization of acquired developed technology | 4,620 | 4,620 | 4,286 | ||||||||||||||||||
| Compensation earned under employee/director stock awards | 429 | 137 | — | Amortization of customer relationships | 1,400 | 1,400 | 1,400 | ||||||||||||||||||
| Minority share of loss in Carretek LLC | (794 | ) | (263 | ) | — | Compensation earned under employee/director stock awards | 751 | 429 | 137 | ||||||||||||||||
| Gain on sale of Cash Services Australia Pty Limited | (539 | ) | — | — | Minority share of loss in Carretek LLC | (1,021 | ) | (794 | ) | (263 | ) | ||||||||||||||
| Change in estimate related to restructuring and other charges | (1,282 | ) | (540 | ) | — | Gain on sale of Cash Services Australia Pty Limited | — | (539 | ) | — | |||||||||||||||
| Write-off of capitalized software costs and prepaid software royalties | — | — | 954 | Change in estimate related to restructuring and other charges | (32 | ) | (1,282 | ) | (540 | ) | |||||||||||||||
| Provision (credit) for doubtful accounts | (729 | ) | (60 | ) | 630 | Provision (credit) for doubtful accounts | 78 | (729 | ) | (60 | ) | ||||||||||||||
| Amortization of deferred loan costs | 273 | 352 | 432 | Amortization of deferred loan costs | 271 | 273 | 352 | ||||||||||||||||||
| Loss on sale of assets | 6 | — | 1 | Loss on sale of assets | 4 | 6 | — | ||||||||||||||||||
| Changes in operating assets and liabilities: | Changes in operating assets and liabilities: | ||||||||||||||||||||||||
| Accounts receivable | 11,336 | 1,068 | 13,632 | Accounts receivable | (1,159 | ) | 11,336 | 1,068 | |||||||||||||||||
| Prepaid expenses and other assets | 1,634 | 5 | 939 | Prepaid expenses and other assets | (60 | ) | 1,634 | 5 | |||||||||||||||||
| Accounts payable and accrued expenses | (1,702 | ) | (1,062 | ) | (22,755 | ) | Accounts payable and accrued expenses | (1,641 | ) | (1,702 | ) | (1,062 | ) | ||||||||||||
| Income taxes payable/receivable | 158 | 241 | 4,823 | Income taxes payable/receivable | (119 | ) | 158 | 241 | |||||||||||||||||
| Deferred revenue | (3,050 | ) | 6,814 | (10,330 | ) | Deferred revenue | (5,071 | ) | (3,050 | ) | 8,855 | ||||||||||||||
| Net cash provided by operating activities | Net cash provided by operating activities | 15,302 | 20,552 | 12,339 | Net cash provided by operating activities | 4,530 | 15,302 | 20,552 | |||||||||||||||||
Investing Activities: | Investing Activities: | Investing Activities: | |||||||||||||||||||||||
| Purchases of property and equipment | (3,284 | ) | (1,158 | ) | (3,527 | ) | Purchases of property and equipment | (2,527 | ) | (3,284 | ) | (1,158 | ) | ||||||||||||
| Software costs capitalized | (2,591 | ) | (1,043 | ) | (103 | ) | Purchases of marketable securities | (6,200 | ) | — | — | ||||||||||||||
| Purchase of acquired developed software | — | (1,500 | ) | — | Sales of marketable securities | 1,500 | — | — | |||||||||||||||||
| Proceeds from disposition of assets | — | — | 3 | Software costs capitalized | (776 | ) | (2,591 | ) | (1,043 | ) | |||||||||||||||
| Purchase of acquired developed software | — | — | (1,500 | ) | |||||||||||||||||||||
| Net cash used in investing activities | Net cash used in investing activities | (5,875 | ) | (3,701 | ) | (3,627 | ) | Net cash used in investing activities | (8,003 | ) | (5,875 | ) | (3,701 | ) | |||||||||||
Financing Activities: | Financing Activities: | Financing Activities: | |||||||||||||||||||||||
| Payments on long-term debt | (6,250 | ) | (18,750 | ) | (19,000 | ) | Payments on long-term debt | — | (6,250 | ) | (18,750 | ) | |||||||||||||
| Payment of deferred loan costs | — | (456 | ) | — | Payment of deferred loan costs | — | — | (456 | ) | ||||||||||||||||
| Proceeds from exercises of stock options | 1,811 | 3,877 | 2,277 | Proceeds from exercises of stock options | 578 | 1,811 | 3,877 | ||||||||||||||||||
| Proceeds from sale of common stock | — | — | 9,323 | Purchase of treasury stock | (3,228 | ) | — | — | |||||||||||||||||
| Proceeds of minority shareholder loan to Carretek LLC | 923 | 97 | — | Proceeds of minority shareholder equity contributions to Carretek LLC | 1,291 | 923 | 97 | ||||||||||||||||||
| Net cash used in financing activities | Net cash used in financing activities | (3,516 | ) | (15,232 | ) | (7,400 | ) | Net cash used in financing activities | (1,359 | ) | (3,516 | ) | (15,232 | ) | |||||||||||
| Net increase in cash and cash equivalents | 5,911 | 1,619 | 1,312 | ||||||||||||||||||||||
| Net increase (decrease) in cash and cash equivalents | Net increase (decrease) in cash and cash equivalents | (4,832 | ) | 5,911 | 1,619 | ||||||||||||||||||||
| Cash and cash equivalents at beginning of year | Cash and cash equivalents at beginning of year | 28,605 | 26,986 | 25,674 | Cash and cash equivalents at beginning of year | 34,516 | 28,605 | 26,986 | |||||||||||||||||
| Cash and cash equivalents at end of year | Cash and cash equivalents at end of year | $ | 34,516 | $ | 28,605 | $ | 26,986 | Cash and cash equivalents at end of year | $ | 29,684 | $ | 34,516 | $ | 28,605 | |||||||||||
| Supplemental disclosures of cash flow information: | Supplemental disclosures of cash flow information: | Supplemental disclosures of cash flow information: | |||||||||||||||||||||||
| Cash paid for interest | $ | 185 | $ | 950 | $ | 2,206 | Cash paid for interest | $ | 153 | $ | 185 | $ | 950 | ||||||||||||
| Cash paid (received) for income taxes, net | $ | 377 | $ | 259 | $ | (6,071 | ) | Cash paid for income taxes, net | $ | 582 | $ | 377 | $ | 259 | |||||||||||
See accompanying notes.notes
CARREKER CORPORATION
NOTES TO CONSOLIDATED FINANCIAL STATEMENTS
1. Description of BusinessOrganization
For the last 28 years, Carreker Corporation ("the Company," "Carreker," "our," "we") provideshas designed, developed, sold and delivered payments-related software consulting and business process outsourcingconsulting solutions to financial institutions and financial service providers. These solutionsMore recently, we have introduced a business process outsourcing solution to our customers. Our products and services address a broad spectrum of payment activities and are designed to help our clients enhance the Company's customers set winning strategies inperformance of their paymentpayments businesses; improve operational efficiency in how payments are processed;processing; enhance revenue and profitability from payments-oriented products and services; reduce losses associated with fraudulent payment transactions; facilitate compliance with risk-related laws and regulations; and/or improve the alignment of product offeringsmaximize clients' customer income streams by aligning their customer interactions and products with customer needs. See Note 11 for a description of our business segments.
2. Summary of Significant Accounting Procedures
Principles of Consolidation and Presentation
The consolidated financial statements include the accounts of the Company and its wholly owned subsidiaries. All significant intercompany balances and transactions have been eliminated in consolidation.
In the years ended January 31, 2006, 2005 and 2004, the consolidated financial statements also containreflect the operations of Carretek LLC, which is a 51% owned subsidiary. The minority interest and minority interest in income (loss)share of net loss of Carretek LLC represent the 49% minority stockholders'stockholder's investment and share of the loss of this consolidated subsidiary for the years ended January 31, 2006, 2005 and 2004. The minority interest is currently classified in other accrued expenses in the accompanying consolidated balance sheets and the minority share of net loss of Carretek LLC is recorded in other income in the accompanying consolidated statements of operations.
Use of Estimates
Certain prior year amounts have been reclassified to conform toThe accompanying consolidated financial statements were prepared in accordance with generally accepted accounting principles in the current year presentation. For the year ended January 31, 2004, selling, general and administrative expenses have been reduced by $836,000, while costUnited States of sales-software maintenance fees, cost of sales-software implementation fees and research and development expenses increased $370,000, $185,000 and $281,000, respectively. The reclassification was made to conform the presentation of certain information technology costs to the presentation used for the years ended January 31, 2005 and 2003.
America ("GAAP"). The preparation of our financial statements in conformity with accounting principles generally accepted in the United StatesGAAP requires the use of estimates and assumptions that affect the amounts reported in the financial statements and accompanying notes. As discussed below, the Company makesus to make significant estimates and assumptions in the areas of accounts receivable, impairment of intangibles and revenue recognition. Although the Company believeswe believe that the estimates and assumptions are reasonable, actual results may differ, and such differences could be significant to the Company'sour financial results.
Cash and Cash Equivalents
The Company considers all highly liquid investments with original maturities of three months or less when purchased to be cash equivalents. Cash and cash equivalents consist primarily of demand deposit accounts and shares in a demand money market account comprised of domestic and foreign commercial paper, certificates of deposit and U.S. government obligations which are maintainedaccounts with nationally recognized financial institutions.institutions, along with domestic commercial paper.
Marketable Securities
We classify our investments in marketable securities as "available-for-sale" in accordance with the provisions of Statement of Financial Accounting Standards No. 115,"Accounting for Certain Investments
in Debt and Equity Securities" ("SFAS 115"). We currently have no investments that we intend to hold for more than one year and therefore all investments are classified as short term investments.
Available-for-sale securities are carried at fair value with the unrealized gain or loss, net of tax, reported in other comprehensive income. Held-to-maturity securities are recorded at amortized cost. Unrealized losses considered to be "other-than-temporary" are recognized currently in earnings. The cost of securities sold is based on the specific identification method. The fair value of most investment securities is determined by currently available market prices. Where quoted market prices are not available, we use the market price of similar types of securities that are traded in the market to estimate fair value.
Marketable securities at January 31, 2006 consist of guaranteed student loan backed debt securities with a cost of $4.7 million which approximates fair value.
All original maturities of debt securities classified as available for sale at January 31, 2006 were due after 10 years. All the debt securities are auction rate securities and the interest rate for these investments will adjust to current market rates at each interest reset date, which is typically on at least a monthly basis.
Comprehensive Income
The Company has no other comprehensive income; accordingly, comprehensive income is the same as net income for all periods presented.
Foreign Currency Translation
The Company considers the U.S. Dollar to be the functional currency for its international subsidiaries. All remeasurement adjustments are recorded in the consolidated statementstatements of operations.
Accounts Receivable and Concentration of Credit Risk
Financial instruments which potentially subject the Company to concentration of credit risk consist principally of temporary cash investments such as short term commercial paper and marketable debt securities along with accounts receivable. The Company places temporary cash investments with major banks and limits its exposure with any one financial institution.institution, commercial issuer, municipal issuer or government agency issuer. The Company has not experienced any material credit losses on these investments.
A significant portion of the Company's business consists of providing consulting services and licensing software to major domestic and international banks, which gives rise to a concentration of credit risk in receivables. Because the Company's accounts receivable are typically unsecured, the Company periodically evaluates the collectibility of its accounts based on a combination of factors, including a particular customer's ability to pay as well as the age of receivables. In cases where the evidence suggests a customer may not be able to satisfy its obligation to the Company or if the collection of the receivable becomes doubtful due to a dispute that arises subsequent to the delivery of the Company's products and services, the Company sets up a reserve in an amount determined appropriate for the perceived risk. Most of the Company's contracts include multiple payment milestones, some of which occur in advance of revenue recognition, which mitigates the risk both in
terms of collectibility and adjustments to recorded revenue. Write-offs of receivables during the three years ended January 31, 2006, 2005 and 2004 were $6,000, $254,000 and 2003 were $254,000, $189,000, and $1.2 million, respectively.
The fair value of accounts receivable approximates the carrying amount of accounts receivable.
Accounts receivable, net of related deferred revenue and allowances, consist of the following (in thousands):
| | January 31, | ||||||
|---|---|---|---|---|---|---|---|
| | 2005 | 2004 | |||||
| Gross accounts receivable | $ | 47,000 | $ | 56,909 | |||
| Less related deferred revenue | (35,327 | ) | (33,646 | ) | |||
| Less allowance for doubtful accounts | (529 | ) | (1,512 | ) | |||
| Net accounts receivable | $ | 11,144 | $ | 21,751 | |||
Property and Equipment
Property and equipment are stated at cost. Depreciation is calculated using the straight-line method over the estimated useful lives of the respective assets, generally from threetwo to five years. Leasehold improvements are amortized using the straight-line method over the shorter of the terms of
the related leases or the respective useful lives of the assets. The components of property and equipment are as follows (in thousands):
| | January 31, | |||||||
|---|---|---|---|---|---|---|---|---|
| | 2005 | 2004 | ||||||
| Furniture | $ | 5,089 | $ | 5,070 | ||||
| Equipment and software | 20,440 | 17,686 | ||||||
| Leasehold improvements | 1,269 | 1,074 | ||||||
| Total cost | 26,798 | 23,830 | ||||||
| Less accumulated depreciation and amortization | (20,194 | ) | (17,140 | ) | ||||
| Net property and equipment | $ | 6,604 | $ | 6,690 | ||||
The Company accounts for the costs of computer software developed or obtained for internal use in accordance with Statement of Position 98-1,"Accounting for the Costs of Computer Software Developed or Obtained for Internal Use". The Company capitalizes software costs incurred after the preliminary project stage is complete, the Company has committed to the project and it is probable that the software will be used to perform the function intended. Capitalized software costs are amortized on an individual basis using the estimated economic life of consultants, and payroll and payroll-related costs for employees incurred in developing internal-use computer software.the product on a straight-line basis, generally three to five years. These capitalized software costs are included in "Equipment and Software". Costs incurred during preliminary project and post-implementation stages are charged to expense.
The components of property and equipment are as follows (in thousands):
| | January 31, | |||||||
|---|---|---|---|---|---|---|---|---|
| | 2006 | 2005 | ||||||
| Furniture | $ | 5,070 | $ | 5,069 | ||||
| Equipment and software | 22,643 | 20,446 | ||||||
| Leasehold improvements | 1,284 | 1,283 | ||||||
| Total cost | 28,997 | 26,798 | ||||||
| Less accumulated depreciation and amortization | (23,050 | ) | (20,194 | ) | ||||
| Net property and equipment | $ | 5,947 | $ | 6,604 | ||||
Long Lived Assets
The Company accounts for goodwill and other intangible assets in accordance with Statement of Financial Accounting Standards No. 142,"Goodwill and Other Intangible Assets,"Assets" ("SFAS 142"). Under the provisions of SFAS 142, an annual assessment of goodwill impairment is performed. This assessment involves the use of estimates related to fair market values of the Company's reporting units with which the goodwill is associated. The assessment of goodwill impairment in the future will be impacted if future operating cash flows of the Company's reporting units decline significantly, which wouldcould result in decreases in the related estimate of fair market value. The Company performs its annual impairment analysis as of November 1st of each year and whenever facts and circumstances indicate impairment may exist. No indicators of impairment were evident during our review for the year ended January 31, 2006.
The Company accounts for long lived assets in accordance with Statement of Financial Accounting Standards No. 144,"Accounting for the Impairment or Disposal of Long-Lived Assets,"Assets" ("SFAS 144"). Under the provisions of SFAS 144, long-lived assets, such as property, plant and equipment and purchased intangibles subject to amortization, are tested for recoverability whenever events or changes in circumstances indicate that the carrying amount of an asset may not be recoverable. Recoverability of assets to be held and used is measured by a comparison of the carrying amount of an asset to estimated undiscounted future cash flows expected to be generated by the asset. If the carrying amount of an asset exceeds its estimated future cash flows, an impairment charge is recognized by the amount by which the carrying amount of the assets exceeds the estimated fair value of the asset.
Deferred Loan Costs
Deferred loan costs consist of loan closing costs and other administrative expenses associated with the Revolving Credit Agreement. On July 31, 2003, the Revolving Credit Agreement was amended as described in Note 4. In connection with this amendment, the Company incurred approximately
$456,000 of deferred loan costs. These costs, along with the net book value of the original deferred loan costs are being amortized to interest expense over the 36 month life of the Revolving Credit Agreement.Agreement and are to be fully amortized by July 31, 2006.
Capitalized Software Costs and Acquired Developed Technology
The Company capitalizes the development costs of software, other than internal-use software, in accordance with Statement of Financial Accounting Standards No. 86,"Accounting for Costs of Computer Software to be Sold, Leased or Otherwise Marketed" ("SFAS 86"). The Company's policy is to capitalize software development costs incurred in developing a product once technological feasibility of the product has been established. Technological feasibility of the product is determined after completion of a detailed program design and a determination has been made that any uncertainties related to high-risk development issues have been resolved. If the process of developing the product does not include a detail program design, technological feasibility is determined only after completion of a working model. All capitalized software development costs capitalized are amortized using an amount determined as the greater of: (1) the ratio that current gross revenues for a capitalized software project bears to the total of current and estimated future gross revenues for that project or (2) the straight-line method over the estimated remaining economic life of the product (generally three to five years). The Company capitalized $776,000, $2.6 million and $1.0 million and $103,000 in the years ended January 31, 2006, 2005 2004 and 2003,2004, respectively. The Company developed software for sending and receiving check images, and is currently developinghas developed software for distributed capture of checks and check images and extending the functionality of theits anti-money laundering software discussed below.and other Risk solutions. The Company has also recently completed the development of a product to verify cash logistic invoices with automated precision and an internet-based track and trace system that streamlines the cash delivery management process.
The Company recorded amortization relating to capitalized software development costs capitalized of $1.3 million, $1.4 million $1.0 million, and $2.4$1.0 million in the years ended January 31, 2006, 2005 2004 and 2003,2004, respectively. Amortization expense is recorded as a component of cost of software license fees in the accompanying consolidated statementstatements of operations.
Acquired developed technology includes purchased technology intangible assets associated with acquisitions. These purchased technology intangibles are initially recorded based on the fair value ascribed at the time of acquisition.
In October 2003, the Company purchased an anti-money laundering software solution designed to help banks protect both their customers and their corporate reputations from the growing risk of financial fraud and to comply with a growing number of laws and regulations. The $1.5 million purchase price was recorded in acquired developed technology in the accompanying consolidated balance sheets and is being amortized over a 3-year period.
Acquired developed technology with a useful life of 3-6 years is amortized on a straight-line basis, resulting in amortization expense of $4.6 million, $4.6 million and $4.3 million and $4.1 million forin the years ended January 31, 2006, 2005 2004 and 2003,2004, respectively. Amortization expense is recorded as a component of cost of software license fees in the accompanying consolidated statements of operations.
The following table sets forth the estimated amortization expense of capitalized software costs and acquired developed technology for the indicated fiscal years ending January 31 (in thousands):
| Year | Capitalized Software Costs | Acquired Developed Technology | Capitalized Software Costs | Acquired Developed Technology | ||||||||
|---|---|---|---|---|---|---|---|---|---|---|---|---|
| 2006 | $ | 517 | $ | 4,620 | ||||||||
| 2007 | 407 | 4,107 | $ | 1,224 | $ | 4,107 | ||||||
| 2008 | 258 | 1,200 | 830 | 1,200 | ||||||||
| 2009 | 331 | — | ||||||||||
The table does not include the estimated amortization expense for $2.1 million$376,000 of capitalized software products that are currently being developed, and for which amortization has not commenced.
The Company continually monitors the net realizable value of software capitalized and acquired developed technology for factors that would indicate impairment such as a decline in demand or a loss of a significant customer. During the quarterly period ended January 31, 2005, the Company performed its annual formal evaluation for impairmentcustomer and determined that the carrying amount of these assets was not impaired and has subsequently noted no factors that would indicate impairment.
Revenue Recognition
The Company's revenue recognition policies are in accordance with Statement of Position ("SOP") 97-2,"Software Revenue Recognition," as amended by SOP 98-9, "Modification of SOP 97-2, Software Revenue Recognition with Respect to Certain Transactions," Staff Accounting Bulletin ("SAB") No. 104,"Revenue Recognition"Recognition," and Emerging Issues Task Force ("EITF") No. 00-21,"Revenue Arrangements with Multiple Deliverables." In the case of software arrangements that require significant production, modification, or customization of software, or the license agreement requires the Company to provide implementation services that are determined to be essential to other elements of the arrangement, the Company follows the guidance in SOP 81-1,"Accounting for Performance of Construction-Type and Certain Production-Type Contracts."
In the case of non-software arrangements, we apply EITF No. 00-21 and revenues related to arrangements with multiple elements are allocated to each element based on the element's relative fair value. Revenue allocated to separate elements is recognized for each element in accordance with our accounting policies described below. If we cannot account for items included in a multiple-element arrangement as separate units of accounting, they are combined and accounted for as a single unit of accounting and generally recognized as the undelivered items or services are provided to the customer.
Consulting Fees.Consulting. The Company employs three primary pricing methods in connection with its delivery of consulting services. First, the Company may price its delivery of consulting services on the basis of time and materials, in which case the customer is charged agreed-upon daily rates for services performed and out-of-pocket expenses. In this case, the Company is generally paid fees and related amounts usually on a monthly basis, and the Company recognizes revenues as the services are performed. Second, the Company may deliver consulting services on a fixed-price basis. In this case, the
Company is paid on a monthly basis or pursuant to an agreed upon payment schedule, and the Company recognizes revenues on a proportionate performance basis. The Company believes that this method is appropriate because of its ability to determine performance milestones and determine dependable estimates of its costs applicable to each phase of a contract. Because financial reporting of these contracts depends on estimates, which are assessed continually during the term of the contract, costs are subject to revisions as the contract progresses. Anticipated losses on fixed-price contracts are recognized when estimatable.estimable. Third, the Company may deliver consulting services pursuant to a value-priced contract with the customer. In this case, the Company is paid, on an agreed upon basis with the customer, either a specified percentage of (1) the projected increased revenues and/or decreased costs that are expected to be derived by the customer generally over a period of up to twelve months
following implementation of its solution or (2) the actual increased revenues and/or decreased costs experienced by the customer generally over a period of up to twelve months following implementation of its solution, subject in either case to a maximum, if any is agreed to, on the total amount of payments to be made to the Company. The Company must first commit time and resources to develop projections associated with value-pricing contracts before a customer will commit to purchase its solutions, and the Company therefore assumes the risk of making these commitments with no assurance that the customer will purchase the solution. Costs associated with these value-pricing contracts are expensed as incurred. These contracts typically include payments to be made to the Company pursuant to an agreed upon schedule ranging from one to twelve months in length. The Company recognizes revenues generated from consulting services in connection with value-priced contracts based upon projected results only upon completion of all services and agreement upon the actual fee to be paid (even though billings for these services may be delayed by mutual agreement for periods not to exceed twelve months). In an effort to allow customers to more closely match expected benefits from services with payments to the Company, the Company on occasion, may offer payment terms which extend beyond 12 months. When the Company enters into an agreement which has a significant component of the total amount payable under the agreement due beyond 12 months or if it is determined payments are not fixed and determinable at the date the agreement was entered into, revenue under the arrangement will be recognized as payments become due and payable. When fees are to be paid based on a percentage of actual revenues and/or savings to customers, the Company recognizes revenues only upon completion of all services and as the amounts of actual revenues or savings are confirmed by the customer with a fixed payment date.
Costs associated with time and materials, fixed-priced and value-priced consulting fee arrangements are expensed as incurred and are included as a component of the cost of consulting fees.
The Company expects that value-pricing contracts will continue to account for a significant portion of its revenues in the future. As a consequence of the use of value-pricing contracts and due to the revenue recognition policy associated with those contracts, the Company's results of operations will likely fluctuate significantly from period to period.
Regardless of the pricing method employed by the Company in a given contract, the Company is typically reimbursed on a monthly basis for out-of-pocket expenses incurred on behalf of its customers.
Software License Fees.License. A perpetual software license is sold either together with implementation services or on a stand-alone basis. The Company is usually paid software license fees in one or more installments, as provided in the customer's contract but not to exceed twelve months. The Company recognizes software license revenue upon execution of a contract and delivery of the software, provided
that the license fee is fixed and determinable, no significant production, modification or customization of the software is required and collection is considered probable by management. When the software license arrangement requires the Company to provide implementation services that are essential to the functionality of the software or significant production, customization or modification of the software is required, both the product license revenue and implementation fees are recognized as services are performed. A term software license is sold either together with implementation services and/or with maintenance services. These term licenses are usually paid in annual installments over the term of the license. If the term software license is sold without essential implementation services, the revenue is recognized ratably over the non-cancelable license term. If the term license is sold with essential implementation services, the license revenue is recognized as the lesser of the amount of license revenue recognized as services are performed or on a ratable basis.
In certain instances, especially with recently developed software, the Company defers software license revenue recognition until the earlier of the product being determined to be generally available and subject to revenue recognition or when the services are completed and the project is accepted by
the customer. This practice is followed for the first two installations of a recently developed software product. After two successful implementations, the product is considered generally available ("GA").
Software licenses are often sold as part of a multiple element arrangement that may include maintenance, implementation or consulting. The Company determines whether there is vendor specific objective evidence of fair value ("VSOEFV") for each element identified in the arrangement to determine whether the total arrangement fees can be allocated to each element. If VSOEFV exists for each element, the total arrangement fee is allocated based on the relative fair value of each element. In cases where there is not VSOEFV for each element, or if it is determined services are essential to the functionality of the software being delivered, or if significant production, modification or customization of the software is required, the Company initially defers revenue recognition of the software license fees until VSOEFV is established or the services are performed. However, if VSOEFV is determinable for all of the undelivered elements, and assuming the undelivered elements are not essential to the delivered elements, the Company will defer recognition of the full fair value related to the undelivered elements and recognize the remaining portion of the arrangement value through application of the residual method. Where VSOEFV has not been established for certain undelivered elements, revenue for all elements is deferred until those elements have been delivered or their fair values have been determined. Evidence of VSOEFV is determined for software products based on actual sales prices for the product sold to a similar class of customer and based on pricing strategies set forth in the Company's price book. Evidence of VSOEFV for services (implementation and consulting) is based upon standard billing rates and the estimated level of effort for individuals expected to perform the related services. The Company establishes VSOEFV for maintenance agreements using the percentage method such that VSOEFV for maintenance is a percentage of the license fee charged annually for a specific software product, which in most instances is 20% of the portion of arrangement fees allocated to the software license element.
Although substantially all of the Company's current software licenses provide for a fixed price license fee, some licenses instead provide for the customer to pay a monthly license fee based on actual use of the software product. The level of license fees earned by the Company under these arrangements will vary based on the actual amount of use by the customer. Revenue under these arrangements is recognized on a monthly basis as the usage becomes determinable.
Software Maintenance Fees.Maintenance. In connection with the sale of a software license, a customer may elect to purchase software maintenance services. Most of the customers that purchase software licenses from the Company also purchase software maintenance services, which typically are renewed annually. The Company charges an annual maintenance fee, which is typically a percentage of the initial software license fee. The annual maintenance fee generally is paid to the Company at the beginning of the maintenance period, and the Company recognizes these revenues ratably over the term of the related contract. If the annual maintenance fee is not paid at the beginning of the maintenance period, the Company defers revenue recognition until the time that the maintenance fee is paid by the customer. The Company normally continues to provide maintenance service while awaiting payment from customers. When the payment is received, revenue is recognized for the period that revenue was previously deferred. This may result in volatility in software maintenance revenue from period to period.
Software Implementation Fees.and Other Services. In connection with the sale of a software license, a customer may elect to purchase software implementation services, including software enhancements and other software services. Most of the customers that purchase software licenses from the Company also purchase software implementation services. The Company prices its implementation services on a time-and-materials or on a fixed-price basis, and the Company recognizes the related revenues as services are performed. Costs associated with these engagements are expensed as incurred.
Outsourcing Services Fees.Services. While outsourcing revenue has been minimal to date, weWe currently recognize revenue based on the number of items processed multiplied by the contracted price per item.processed. These services are billed currently billed on a monthly basis.
Return Provisions. The Company's contracts typically do not include right of return clauses, and as a result, the Company does not record a provision for returns.
Royalties
InThe Company is required to pay royalties in connection with software license, maintenance, and consulting agreements entered into with certain banks and purchase agreements with vendorscustomers under which the Company acquired third party software technology or other intellectual property used in products and services sold to its customers, the Company is required to pay royalties on sales of certain software products.customers. Under these arrangements, the Company recognizes royalty expense when the associated revenue is recognized. For current product offerings, the royalty percentages generally range from 20% to 50% of the associated revenues. Approximately $2.4 million, $2.3 million $2.6 million and $2.5$2.6 million of royalty expense was recorded under these agreements in the years ended January 31, 2006, 2005 2004 and 2003,2004, respectively. Royalty expense is primarily included as a component of the cost of consulting fees,software license revenues; however, certain amounts are also included in cost of software license feesconsulting revenues and cost of software maintenance feesrevenues in the accompanying consolidated statements of operations.
Deferred Revenue
Deferred revenue represents amounts paid by customers under terms specified in consulting, software licensing, and maintenance contracts for which completion of contractual terms or delivery of the software has not occurred.
Deferred revenue and advance payments from customers consistconsists of the following (in thousands):
| | January 31, | |||||||||||||
|---|---|---|---|---|---|---|---|---|---|---|---|---|---|---|
| | January 31, | 2006 | 2005 | |||||||||||
| | 2005 | 2004 | | (As restated) See Note 3 | ||||||||||
| Deferred software maintenance fees | $ | 33,850 | $ | 35,917 | $ | 39,343 | $ | 35,891 | ||||||
| Deferred software implementation and license fees | 23,658 | 22,960 | 15,769 | 23,658 | ||||||||||
| 57,508 | 58,877 | 55,112 | 59,549 | |||||||||||
| Less related accounts receivable | (35,327 | ) | (33,646 | ) | ||||||||||
| Less amounts not yet collected | (35,961 | ) | (35,327 | ) | ||||||||||
| Net deferred revenue | $ | 19,151 | $ | 24,222 | ||||||||||
| $ | 22,181 | $ | 25,231 | |||||||||||
Research and Development Costs
Research and development costs which are not subject to capitalization under Statement of Financial Accounting Standards No. 86,"Accounting for the Cost of Computer Software to be Sold, Leased, or Otherwise Marketed,"Marketed" ("SFAS 86"), are expensed as incurred and relate mainly to the development of new products, new applications, new features or enhancements for existing products or applications. Sustaining maintenance activities are expensed as incurred and charged to cost of revenues-softwarerevenues—software maintenance fees.
Other income (expense)
Other income (expense) is comprised of the following (in thousands):
| | | Year Ended January 31, | | Year Ended January 31, | |||||||||||||||||
|---|---|---|---|---|---|---|---|---|---|---|---|---|---|---|---|---|---|---|---|---|---|
| | | 2005 | 2004 | 2003 | | 2006 | 2005 | 2004 | |||||||||||||
| Gain on sale of Cash Services Australia Pty. Limited. | Gain on sale of Cash Services Australia Pty. Limited. | $ | 539 | $ | — | $ | — | Gain on sale of Cash Services Australia Pty. Limited. | $ | — | $ | 539 | $ | — | |||||||
| Equity in earnings of Cash Services Australia Pty. Limited. | Equity in earnings of Cash Services Australia Pty. Limited. | (17 | ) | 172 | 81 | Equity in earnings of Cash Services Australia Pty. Limited. | — | (17 | ) | 172 | |||||||||||
| Minority share of net loss of Carretek LLC | Minority share of net loss of Carretek LLC | 794 | 263 | — | Minority share of net loss of Carretek LLC | 1,021 | 794 | 263 | |||||||||||||
| Foreign exchange gains (losses) | (279 | ) | 185 | 324 | |||||||||||||||||
| Foreign exchange (losses)/gains | Foreign exchange (losses)/gains | (222 | ) | (279 | ) | 185 | |||||||||||||||
| Other | Other | — | (19 | ) | 100 | Other | 15 | — | (19 | ) | |||||||||||
| Total | $ | 1,037 | $ | 601 | $ | 505 | Total | $ | 814 | $ | 1,037 | $ | 601 | ||||||||
In April 2004, the Company sold its 25% interest in Cash Services Australia Pty. Limited. The carrying value of this investment was approximately $383,000 and the Company received $922,000 in proceeds collected in May 2004. As a result of this transaction, the Company recorded a $539,000 gain.
During fiscal 2003, theThe Company formedowns a 51% interest in Carretek LLC ("Carretek"), in which the Company owns a 51% interest, to offeroffers financial institutions offshore-centric outsourcing of their business processes. The minority interest in this loss was recorded in other income (expense) and was $1.0 million, $794,000 and $263,000 for the years ended January 31, 2006, 2005 and 2004.
Income Taxes
The Company accounts for income taxes using the liability method, whereby deferred tax assets and liabilities are determined based on differences between financial reporting and the tax basis of assets and liabilities measured using enacted tax rates and laws that will be in effect when the differences are expected to reverse. The measurement of deferred tax assets is adjusted by a valuation allowance, if necessary, to recognize the extent to which, based on available evidence, it is more likely than not that the future tax benefits will not be realized.
Earnings Per Share
Basic earnings per share is computed, in accordance with the provisions of SFAS No. 128,"Earnings per Share," ("SFAS 128") using the weighted average number of shares of common stock outstanding during each period. Diluted earnings per share is computed using the weighted average number of shares of common stock outstanding during each period and common equivalent shares consisting of stock options and unvested restricted stock (using the treasury stock method), if such stock options and unvested restricted stock have a dilutive effect.
Stock-Based Compensation
The Company has elected to follow Accounting Principles Board ("APB") Opinion No. 25, "Accounting for Stock Issued to Employees," in accounting for its employee and director stock options. Under APB 25, if the exercise price of a stock option equals or exceeds the market price of the underlying stock on the date of grant, no compensation expense is recognized. In October 1995, the Financial Accounting Standards Board ("FASB") issued Statement of Financial Accounting Standards ("SFAS") 123, ""Accounting for Stock-Based Compensation."Compensation." SFAS 123 allows the Company to continue to follow the present APB Opinion 25 guidelines, but requires pro-forma disclosures of net income and earnings per share as if the Company had adopted the provisions of the Statement. In December 2002, the FASB issued SFAS 148,"Accounting for Stock-Based Compensation—Transition and Disclosure—an Amendment of FASB Statement No.123," which provides alternative methods of transition for an entity that voluntarily changes to the fair value based method of accounting for stock-based employee compensation. The Company continuescontinued to account for stock-based compensation under the provisions of APB Opinion 25 using the intrinsic value method.method until the adoption of SFAS 123(R) on February 1, 2006 (See Note 2—Recently Issued Accounting Standards).
The stock compensation expense recorded under the intrinsic value method is primarily the result of restricted common stock issued to employees and officers in fiscal years 2004 and 2003, respectively.officers. The Company is amortizing the compensation expense on a straight line basis over the period that the restrictions on the common stock lapse.
The Company recorded $751,000, $429,000 and $137,000 of compensation expense related to the restricted common stock during the years ended January 31, 2006, 2005 and 2004, respectively. 425,070As of January 31, 2006, 732,416 unvested restricted common shares remain outstanding atoutstanding.
In the quarter ended January 31, 2005.2006, the Company accelerated the vesting of all unvested stock options, except those options granted to the CEO, with a grant price in excess of $7.50. This acceleration was accomplished to reduce the stock option expense in future years. This acceleration resulted in approximately $1.9 million of expense savings in future years and is included in proforma stock compensation expense for the year ended January 31, 2006, presented in the table below.
On March 10, 2006, the Compensation Committee of the Board of Directors of the Company (the "Committee") voted to provide for the automatic accelerated vesting of all outstanding stock options and restricted stock of the Company upon the occurrence of certain specified triggering events deemed
to constitute a change of control of the Company. This provision will require the Company to accelerate unrecognized stock-based compensation expense if a change in control event occurs prior to the original vesting schedule of the stock options or restricted stock.
Had compensation cost for stock-based compensation plans been determined based on the fair value at the grant dates for awards under those plans in accordance with the provisions of SFAS 123, net income (loss) and net income (loss) per share would have been as follows (in thousands, except per share data):
| | Year Ended January 31, | |||||||||||||||||||
|---|---|---|---|---|---|---|---|---|---|---|---|---|---|---|---|---|---|---|---|---|
| | Year Ended January 31, | 2006 | 2005 | 2004 | ||||||||||||||||
| | 2005 | 2004 | 2003 | | | (As restated) See Note 3 | ||||||||||||||
| Net income (loss), as reported | $ | (1,196 | ) | $ | 3,706 | $ | (33,630 | ) | $ | 2,069 | $ | (1,196 | ) | $ | 1,665 | |||||
| Stock compensation expense recorded under the intrinsic value method | 429 | 137 | — | 751 | 429 | 137 | ||||||||||||||
| Pro forma stock compensation expense computed under the fair value method | (4,525 | ) | (4,147 | ) | (5,108 | ) | ||||||||||||||
| Stock compensation expense computed under the fair value method | (5,679 | ) | (4,525 | ) | (4,147 | ) | ||||||||||||||
| Pro forma net income (loss) | $ | (5,292 | ) | $ | (304 | ) | $ | (38,738 | ) | |||||||||||
| Pro forma net loss | $ | (2,859 | ) | $ | (5,292 | ) | $ | (2,345 | ) | |||||||||||
| Basic earnings (loss) per common share, as reported | $ | (0.05 | ) | $ | 0.16 | $ | (1.45 | ) | $ | 0.09 | $ | (0.05 | ) | $ | 0.07 | |||||
| Diluted earnings (loss) per common share, as reported | $ | (0.05 | ) | $ | 0.15 | $ | (1.45 | ) | $ | 0.08 | $ | (0.05 | ) | $ | 0.07 | |||||
| Pro forma basic earnings (loss) per common share | $ | (0.22 | ) | $ | (0.01 | ) | $ | (1.67 | ) | |||||||||||
| Pro forma basic loss per common share | $ | (0.12 | ) | $ | (0.22 | ) | $ | (0.10 | ) | |||||||||||
| Pro forma diluted earnings (loss) per common share | $ | (0.22 | ) | $ | (0.01 | ) | $ | (1.67 | ) | |||||||||||
| Pro forma diluted loss per common share | $ | (0.12 | ) | $ | (0.22 | ) | $ | (0.10 | ) | |||||||||||
The pro forma net loss for the years ended January 31, 2004 and 2003 has been revised to eliminate the tax benefit previously recognized for the pro forma stock compensation expenses. This
revision was necessary to conform with the Company's position of providing a full valuation allowance for its net deferred tax assets.
The Company calculated the estimated fair value of each stock option using the Black-Scholes option-pricing model and utilized the following assumptions:
| | Year Ended January 31, | Year Ended January 31, | ||||||||||||||||||
|---|---|---|---|---|---|---|---|---|---|---|---|---|---|---|---|---|---|---|---|---|
| | 2005 | 2004 | 2003 | 2006 | 2005 | 2004 | ||||||||||||||
| Volatility | 0.780 | 0.953 | 1.014 | 0.858 | 0.780 | 0.953 | ||||||||||||||
| Weighted-average expected lives | 5.250 | 4.500 | 4.500 | 4.330 | 5.250 | 4.500 | ||||||||||||||
| Expected dividend yields | — | — | — | — | — | — | ||||||||||||||
| Weighted-average risk-free interest rates | 3.96 | % | 2.56 | % | 4.0 | % | 3.98 | % | 3.96 | % | 2.56 | % | ||||||||
| Weighted-average fair value of options granted | $ | 6.12 | $ | 3.20 | $ | 4.49 | $ | 5.95 | $ | 6.12 | $ | 3.20 | ||||||||
Risks and Uncertainties
The Company's future results of operations and financial condition could be impacted by the following factors, among others: dependence on the banking industry, decline in check volumes, fluctuations in operating results, relatively fixed costs, product and service mix, lack of long-term agreements, dependence on key personnel, rapid technological change and dependence on new products, strategic alliances or acquisitions, focus on providing business process outsourcing with a significant offshore component, ability to attract and retain qualified personnel, customer concentration, competition, proprietary rights, infringement claims, dependence on third parties for technology
licenses, liability claims, defects in our software and solutions, our ability to protect our information and data security requirements,technology infrastructure, international operations, changing government and tax regulations, stock price fluctuations, impairment of goodwill or intangible assets, realization of revenue from contracted sales, potential sales, backlog and backlog, changes in the accounting treatment of stock options and other share-based compensation anddeferred revenue, pending class action lawsuits. Negative trends inlawsuit, anti-takeover provisions, and the Company's operating results could result in noncompliance withrestatement of prior period consolidated financial covenants related to its revolving credit agreement, which could impair the Company's future liquidity. See description of the Company's revolving credit agreement and related financial covenants in Note 4.statements.
Financial Guarantees
In November 2002, the FASB issued Interpretation No. 45 ("FIN 45"),"Guarantor's Accounting and Disclosure Requirements for Guarantees, Including Indirect Guarantees of Indebtedness of Others." FIN 45 requires that a guarantor recognize, at the inception of a guarantee, a liability for the fair value of the obligation undertaken in issuing the guarantee or indemnification. FIN 45 also requires additional disclosure by a guarantor in its interim and annual consolidated financial statements about its obligations under certain guarantees and indemnifications. The following is a summary of the agreements that the Company has determined are within the scope of FIN 45:
Under the terms of the majority of the Company's software license agreements with its customers, the Company agrees that in the event the software sold infringes upon any patent, copyright, trademark, or any other proprietary right of a third party, it will indemnify its customer licensee against any loss, expense, or liability from any damages that may be awarded against its customer. The Company includes this infringement indemnification in allmost of its software license agreements. In the event the customer cannot use the software or service due to infringement and the Company cannot
obtain the right to use, replace or modify the license or service in a commercially feasible manner so that it no longer infringes, then the Company may generally terminate the license and provide the customer a pro-rata refund of the fees paid by the customer for the infringing license or service. The Company has recorded no liability associated with this indemnification, as it is not aware of any pending or threatened infringement actions that are probable losses. The Company believes the estimated fair value of these intellectual property indemnification clauses is minimal.
The Company has agreed to indemnify members of the board of directors, officers and certain key employees of the Company if they are made a party or are threatened to be made a party to any proceeding (other than an action by or in the right of the Company) by reason of the fact that they are acting in their capacities on behalf of the Company, or by reason of anything done or not done by them in any such capacities. The indemnity is for any and all expenses and liabilities of any type whatsoever (including but not limited to, judgments, fines and amounts paid in settlement) actually and reasonably incurred by the directors, or officers and key employees in connection with the investigation, defense, settlement or appeal of such proceeding, provided they acted in good faith. The Company maintains insurance coverage for directors and officers liability ("D&O insurance"). No maximum liability is stipulated in these agreements that include indemnifications of members of the board of directors, officers and certain key employees of the Company. The Company has recorded no liability associated with these indemnifications as it is not aware of any pending or threatened actions or claims against the members of its board of directors or officers that are probable losses in excess of amounts covered by its D&O insurance. As a result of the insurance policy coverage, the Company believes the estimated fair value of these indemnification agreements is minimal.
Recently Issued Accounting Standards
On December 16, 2004, the Financial Accounting Standards Board issued SFAS No. 123 (revised 2004),"Share-Based Payment," which is a revision of SFAS No. 123. SFAS No. 123 (R)123(R) supersedes APB No. 25, and amends SFAS No. 95,"Statement of Cash Flows." Generally, the approach in SFAS No. 123 (R)123(R) is similar to the approach described in SFAS No. 123. However, SFAS No. 123 (R)123(R) requires all share-based payments to employees, including grants of employee stock options, to be recognized in the statement of operations based on their fair values. Pro forma disclosure is no longer an alternative. The Company expects towill adopt SFAS No. 123 (R)123(R) in the thirdfirst quarter of fiscal 2005.2006. SFAS No. 123 (R)123(R) permits companies to adopt its requirements using one of two methods:
The Company is still assessing the appropriate transition method.
As permitted by SFAS No. 123, the Company currently accounts for share-based payments to employees using the APB No. 25 intrinsic value method and, as such, generally recognizes no compensation cost for employee stock options. Accordingly, the adoption of SFAS No. 123 (R)123(R)'s fair value method will have a significant impact on our results of operations, although it will have no impact on our overall financial position and cash flows. Had we adopted SFAS No. 123 (R)123(R) in prior periods, the impact of that standard would have approximated the impact of SFAS No. 123 as described in the disclosure of pro forma net income and earnings per share contained in Note 2 above under the captionStock Based Compensation. Statement No. 123 (R)123(R) also requires the benefits of tax deductions in excess of recognized compensation cost to be reported as a financing cash flow, rather than as an operating cash flow. This requirement currently does not have an effect on the Company as all of our deferred tax benefits are fully reserved with a valuation allowance.
In the quarter ended January 2003,31, 2006, the Financial Accounting Standards Board issued StatementCompany accelerated the vesting of all unvested stock options, except those options granted to the CEO, with a grant price in excess of $7.50. This acceleration was accomplished to reduce the stock option expense in future years. This acceleration will result in approximately $1.9 million of expense savings in future years.
As of January 31, 2006, the expense related to unvested options granted to date is as follows for the indicated fiscal years ending January 31 (in thousands):
| Year | Amount | ||
|---|---|---|---|
| 2007 | $ | 976 | |
| 2008 | 453 | ||
| 2009 | 198 | ||
| 2010 | 10 | ||
3. Restatement of Financial Accounting Standards Board Interpretation No. 46,Statements"Consolidation of Variable Interest Entities, an Interpretation of ARB No. 41 ("FIN 46")." In December 2003, the FASB modified FIN 46 to make certain technical corrections and address certain implementation issues that had arisen subsequently referred to as "FIN 46R". FIN 46 and FIN 46R provide a new framework for identifying variable interest entities ("VIEs") and determining when a company should include these assets, liabilities, non-controlling interests and results of activities of a VIE in
The Company has restated its consolidated financial statements.
In general, a VIE is a corporation, partnership, limited liability corporation, trust or any other legal structure usedstatements for the year ended January 31, 2004, and the consolidated balance sheet at January 31, 2005, to conduct activities or hold assets that either (1) hascorrect an insufficient amount of equity to carry out its principal activities without additional subordinated financial support, (2) has a group of equity owners that are unable to make significant decisions about its activities, or (3) has a group of equity owners that do not haveerror identified in deferred revenue resulting primarily from the obligation to absorb losses or the right to receive returns generated by its operations.
The Company adopted the provisions of FIN 46 and FIN 46R as of April 30, 2004. The effect of adopting the provisions of FIN 46 and FIN 46R was not material.
In November 2002, the EITF reached a consensus on Issue 00-21,"Multiple Deliverable Revenue Arrangements." EITF 00-21 addresses certain aspects of the accounting by a vendor for arrangements under which it will perform multiple revenue-generating activities. It also addresses when and how an arrangement involving multiple deliverables should be divided into separate units of accounting. The guidance in EITF 00-21 is effective for revenue arrangements entered into in fiscal periods beginning after June 15, 2003, with early application permitted. Companies may elect to report the change in accounting as a cumulative effectduplicate recording of a changecustomer software maintenance contract in connection with an accounting principlesystem conversion that occurred in accordance with APB Opinion 20,"Accounting Changes" and SFAS 3, "Reporting Accounting Changes in Interim Financial Statements (an amendment of APB Opinion No. 28)." The adoption of EITF 00-21 did not have a significant impactOctober 2002. Based on the Company's accountinganalysis, software maintenance revenue related to this contract was erroneously recognized twice during the year ended January 31, 2004. Therefore, the consolidated financial statements as of and for multiple element arrangements.the fiscal year ended January 31, 2004 have been restated to reflect a $2.0 million reduction in software maintenance revenue, and the consolidated balance sheets at January 31, 2004 and 2005 have been restated to reflect a corresponding $2.0 million increase in deferred revenue and accumulated deficit.
The Company's consolidated financial statements and related financial information have been restated as follows:
| | Year Ended January 31, 2005 | Year Ended January 31, 2004 | |||||||||||
|---|---|---|---|---|---|---|---|---|---|---|---|---|---|
| | As reported | Restated | As reported | Restated | |||||||||
| Operations Data: | |||||||||||||
Total revenues | $ | 118,891 | $ | 118,891 | $ | 128,908 | $ | 126,867 | |||||
| Software maintenance revenue | 43,293 | 43,293 | 45,122 | 43,081 | |||||||||
| Income (loss) before provision (benefit) for income taxes | (628 | ) | (628 | ) | 3,906 | 1,865 | |||||||
| Net income (loss) | (1,196 | ) | (1,196 | ) | 3,706 | 1,665 | |||||||
| Basic earnings (loss) per share | $ | (0.05 | ) | $ | (0.05 | ) | $ | 0.16 | $ | 0.07 | |||
| Diluted earnings (loss) per share | $ | (0.05 | ) | $ | (0.05 | ) | $ | 0.15 | $ | 0.07 | |||
Balance Sheet Data: | |||||||||||||
Deferred revenue | $ | 22,181 | $ | 24,222 | $ | 25,231 | $ | 27,272 | |||||
| Total liabilities | 35,657 | 37,984 | 48,212 | 50,253 | |||||||||
| Accumulated deficit | (53,876 | ) | (55,917 | ) | (52,680 | ) | (54,721 | ) | |||||
| Total stockholders equity | $ | 57,362 | $ | 55,321 | $ | 56,318 | $ | 54,277 | |||||
3.4. Goodwill and Intangible Assets
Goodwill and intangible assets deemed to have indefinite lives are no longernot amortized but are subject to annual impairment tests. Other intangible assets, which include acquired developed technology and customer relationships, are amortized over their estimated useful lives.
Customer relationships with definitefinite useful lives are amortized on a straight-line basis, which resulted in amortization expense of $1.4 million during the years ended January 31, 2006, 2005 and 2004, and 2003, respectively.
The following table sets forth the estimated amortization expense of customer relationships for the indicated fiscal years ending January 31 (in thousands):
| Year | Amount | Amount | ||||
|---|---|---|---|---|---|---|
| 2006 | $ | 1,400 | ||||
| 2007 | 1,400 | $ | 1,400 | |||
| 2008 | 467 | 467 | ||||
Certain accrued liabilities were recorded during the acquisition of Check Solutions Company in June 2001. During the year ended January 31, 2005, these estimates were revised and $428,000 of these accrued liabilities were reversed and recorded as a reduction of goodwill.
During the fourth quarters of the years ended January 31, 20052006 and 2004,2005, the Company performed its annual evaluation for goodwill impairment and determined that the carrying amount of goodwill was not impaired.
During the fourth quarter of the year ended January 31, 2003, the Company performed its annual evaluation for goodwill impairment resulting in a charge of $46.0 million. The impairment charge was recorded to the Global Payments Technologies ("GPT") segment as all of the Company's goodwill has been assigned to the GPT segment. The fair value of the reporting unit to which goodwill is assigned was determined to be less than its carrying amount. Thus, an allocation of the estimated fair value of the reporting unit to all of the assets and liabilities of the reporting unit was made to determine the excess of fair value over amounts allocated to net assets. The excess represents the estimated fair value of the goodwill which was compared to recorded goodwill as of the evaluation date of November 1, 2002 and resulted in an impairment charge of $46.0 million. The fair values used in this evaluation were estimated based upon the consideration of a number of fair value estimation techniques including a discounted cash flow analysis and consideration of the market price of the Company's stock. The assumptions in the discounted cash flow analysis include future revenue volume levels, price levels and rates of increases in operating expenses to compute projected cash flows for the reporting unit and other intangible assets within the reporting unit. A discount rate of 26% was applied to determine discounted cash flows.
4.5. Revolving Credit Agreement
The Company is a party to a revolving credit agreement with a group of banks providing for a commitment amount of $30.0 million and a maturity date of July 31, 2006. The Company did not have any borrowings outstanding under the revolving credit agreement at January 31, 2006 and 2005. Borrowings under the credit agreement currently bear interest equal to either the greater of prime or federal funds rate plus a margin ranging from 1.25% to 2.25% depending on the Company's ratio of funded debt to Earnings before Interest, Taxes, Depreciation and Amortization ("EBITDA"), or LIBOR plus a margin equal to 2.75% to 3.75% depending on the Company's ratio of funded debt to EBITDA. Interest payments are due quarterly. The Company is required to pay aan annual commitment fee equal to 0.50% on the unused amount of the revolving credit agreement. The revolving credit agreement contains customary affirmative and negative covenants, including financial covenants requiring the maintenance of specified
interest coverage, ratio of EBITDA to funded debt, and ratio of 80% of accounts receivable, cash and short-termshort term investments to funded debt. Additionally, the payment of dividends and the purchase of treasury stock is precluded except uponand subject to the approval of the banks. We obtained a written waiver to this covenant in April 2005 when we announced our stock repurchase program. Also, the Company was granted a waiver from its noncompliance with the provisions of its revolving credit agreement arising as a result of the restatement of its financial statements, as described above in Note 3. Substantially all of the Company's assets collateralize the revolving credit agreement. As of January 31, 2005,2006, the Company is in compliance with the covenants of the revolving credit agreement.agreement as amended.
The Company did not have any borrowings outstanding under the revolving credit agreement at January 31, 2005. Interest expense, including the commitment fee and exclusive of the amortization of deferred loan costs on the credit agreement, was $168,000, $169,000 $864,000 and $2.1 million$864,000 for the years ended January 31, 2006, 2005 and 2004, and 2003, respectively.
5.6. Provision (Benefit) for Income Taxes
The Company's provision (benefit) for income taxes consists of the following (in thousands):
| | | Year Ended January 31, | | Year Ended January 31, | |||||||||||||||||
|---|---|---|---|---|---|---|---|---|---|---|---|---|---|---|---|---|---|---|---|---|---|
| | | 2005 | 2004 | 2003 | | 2006 | 2005 | 2004 | |||||||||||||
| Federal: | Federal: | Federal: | |||||||||||||||||||
| Current | $ | (101 | ) | $ | 170 | $ | (2,409 | ) | Current | $ | 15 | $ | (101 | ) | $ | 170 | |||||
| Deferred | — | — | — | Deferred | — | — | — | ||||||||||||||
| (101 | ) | 170 | $ | (2,409 | ) | 15 | (101 | ) | 170 | ||||||||||||
State and Foreign: | State and Foreign: | State and Foreign: | |||||||||||||||||||
| Current | 669 | 30 | 934 | Current | 420 | 669 | 30 | ||||||||||||||
| Deferred | — | — | — | Deferred | — | — | — | ||||||||||||||
| 669 | 30 | 934 | 420 | 669 | 30 | ||||||||||||||||
| $ | 568 | $ | 200 | $ | (1,475 | ) | $ | 435 | $ | 568 | $ | 200 | |||||||||
The provisions (benefit) for income taxes differ from the amounts computed by applying the statutory United States federal income tax rate to income before provision (benefit) for income taxes as follows (in thousands):
| | Year Ended January 31, | |||||||||||||||||||
|---|---|---|---|---|---|---|---|---|---|---|---|---|---|---|---|---|---|---|---|---|
| | Year Ended January 31, | 2006 | 2005 | 2004 | ||||||||||||||||
| | 2005 | 2004 | 2003 | | | (As restated) See Note 3 | ||||||||||||||
| Provision (benefit) for income taxes at statutory rate | $ | (220 | ) | $ | 1,328 | $ | (11,935 | ) | $ | 877 | $ | (220 | ) | $ | 634 | |||||
| State and foreign income taxes, net of U.S. federal benefit | 451 | 20 | 785 | |||||||||||||||||
| Impact of state and foreign income taxes | (57 | ) | 451 | 20 | ||||||||||||||||
| Nondeductible expenses | 234 | 245 | 319 | 106 | 234 | 245 | ||||||||||||||
| Change in valuation allowance | 229 | (1,581 | ) | 9,356 | (281 | ) | 229 | (887 | ) | |||||||||||
| Other, net | (126 | ) | 188 | — | (210 | ) | (126 | ) | 188 | |||||||||||
| Provision (benefit) for income taxes | $ | 568 | $ | 200 | $ | (1,475 | ) | |||||||||||||
| Provision for income taxes | $ | 435 | $ | 568 | $ | 200 | ||||||||||||||
During the quarterly period ended April 30, 2002, a tax benefit of approximately $1.9 million was generated by additional tax loss carrybacks available to the Company as a result of new tax legislation passed under the Job Creation and Workers Assistance Act of 2002.
On October 22, 2004, the American Jobs Creation Act of 2004 ("the Act") was signed into law, which provides for a special one-time tax deduction for certain foreign earnings that are repatriated in 2005. Based on the Company's review of the repatriation provisions of this Act and our current tax position, the Company believes the repatriation provisions of the Act willwere not be material.
Deferred income taxes reflect the net tax effects of temporary differences between the carrying amounts of assets and liabilities for financial reporting purposes and the amounts used for income tax purposes. The Company's deferred tax assets and liabilities are as follows (in thousands):
| | | January 31, | | January 31, | ||||||||||||
|---|---|---|---|---|---|---|---|---|---|---|---|---|---|---|---|---|
| | | 2005 | 2004 | | 2006 | 2005 | ||||||||||
| Deferred tax assets: | Deferred tax assets: | Deferred tax assets: | ||||||||||||||
| Accruals not currently deductible | $ | 1,403 | $ | 1,619 | ||||||||||||
| Allowance for doubtful accounts | 191 | 545 | Accruals not currently deductible | $ | 1,181 | $ | 1,403 | |||||||||
| Accrued merger and restructuring costs | 312 | 682 | Allowance for doubtful accounts | 216 | 191 | |||||||||||
| Deferred revenue | — | 3,088 | Accrued merger and restructuring costs | 110 | 312 | |||||||||||
| Net operating loss | 11,914 | 5,346 | Net operating loss carryforwards | 12,987 | 12,649 | |||||||||||
| Intangible assets | 17,649 | 18,064 | Intangible assets | 17,151 | 17,649 | |||||||||||
| Previously taxed income from foreign subsidiaries | 235 | — | Other | 19 | — | |||||||||||
| Less valuation allowance | (29,969 | ) | (28,432 | ) | Less valuation allowance | (30,188 | ) | (30,469 | ) | |||||||
| Total deferred tax assets | Total deferred tax assets | 1,735 | 912 | Total deferred tax assets | 1,476 | 1,735 | ||||||||||
Deferred tax liabilities: | Deferred tax liabilities: | Deferred tax liabilities: | ||||||||||||||
| Depreciation of property and equipment | 523 | 153 | Depreciation of property and equipment | 482 | 523 | |||||||||||
| Capitalized software costs | 1,168 | 730 | Capitalized software costs | 994 | 1,168 | |||||||||||
| Other | 44 | 29 | Other | — | 44 | |||||||||||
| Total deferred tax liabilities | Total deferred tax liabilities | 1,735 | 912 | Total deferred tax liabilities | 1,476 | 1,735 | ||||||||||
| Net deferred tax liabilities | Net deferred tax liabilities | $ | — | $ | — | Net deferred tax liabilities | $ | — | $ | — | ||||||
At January 31, 2005,2006, the Company had available to it Federal net operating loss carryforwards of approximately $33.1$36.0 million, whichthat begin to expire in 2022. The2023. Due to the Company's inconsistent history of generating profitable operations and taxable income, the Company has establishedmaintains a valuation allowance to fully reserve itsthe net deferred tax assets at January 31, 2005 and 2004 because the more likely than not criteria for future realization of the Company's net deferred tax assets specified in SFAS No. 109 "Accounting for Income Taxes", were not met.
6. Common Stock Offering
On April 5, 2002, the Company sold 1,282,214 shares to a group of institutional investors in a private transaction. In connection with this transaction, the Company filed a registration statement on Form S-3 following the filing of its annual report on Form 10-K for the year ended January 31, 2002 seeking to register the resale of such shares. The Form S-3 was deemed effective on May 15, 2002. On April 5, 2002, the Company utilized the approximately $9.3 million of net proceeds that were received from the sale to satisfy obligations due to certain former employees of Check Solutions described in Note 14, with the remainder being used for working capital.assets.
7. Benefit Plans
Stock Option Plans
Effective October 7, 1994, the Company adopted the 1994 Long Term Incentive Plan ("the Long Term Incentive Plan") under which all employees, consultants, officers and non-employee directors may be granted awards in the form of incentive stock options, non-qualified stock options and restricted shares. The exercise price per share for the common stock issued pursuant to stock options under the Long Term Incentive Plan shall be no less than 100% of the fair market value on the date the option is granted. Options granted under the Long Term Incentive Plan become exercisable and vest as determined by the Committee. To date, options granted under the Long Term Incentive Plan fully vest within three to five years from the date of grant. The term of each option granted under the Long Term Incentive Plan shall be as the Committee determines, but in no event shall any option have a term of longer than ten years from the date of grant. Options may be granted pursuant to the Long Term Incentive Plan through July 19, 2010.
The Company has a Director Stock Option Plan ("the Director Plan") under which non-employee members of the Company's Board of Directors may be granted options to purchase shares of the Company's Common Stock. Effective July 19, 2001, options granted under the Director Plan are granted at fair market value as of the grant date, vest at the rate of 25% per calendar quarter, and expire if not exercised ten years from the date of grant or at an earlier date as determined by the Committee and specified in the applicable stock option agreement. Prior to July 19, 2001, options granted under the Director Plan were granted at 50% of the fair market value on the grant date, became exercisable one year from the date of the grant or in one or more installments and expired fifteen years from the date of grant or at an earlier date as determined by the Committee and specified in the applicable stock option agreement. During the years ended January 31, 2006, 2005 2004 and 2003,2004, options to purchase 131,310 shares, 93,135 shares 70,968 shares and 56,23170,968 shares, respectively, of common stock were granted to Directors. Options granted to the Company's Board of Directors in the year ended January 31, 20052006 were granted from the Long Term Incentive Plan.
Stock option transactions under all plans for the years ended January 31, 2006, 2005 2004 and 2003,2004, are as follows (in thousands, except per share amounts):
| | | 2005 | 2004 | 2003 | | 2006 | 2005 | 2004 | ||||||||||||||||||||||||
|---|---|---|---|---|---|---|---|---|---|---|---|---|---|---|---|---|---|---|---|---|---|---|---|---|---|---|---|---|---|---|---|---|
| | | Number of Options | Weighted Average Exercise Price | Number of Options | Weighted Average Exercise Price | Number of Options | Weighted Average Exercise Price | | Number of Options | Weighted Average Exercise Price | Number of Options | Weighted Average Exercise Price | Number of Options | Weighted Average Exercise Price | ||||||||||||||||||
| Options outstanding at beginning of year | Options outstanding at beginning of year | 4,167 | $ | 8.46 | 4,543 | $ | 9.29 | 4,363 | $ | 10.49 | Options outstanding at beginning of year | 4,151 | $ | 8.95 | 4,167 | $ | 8.46 | 4,543 | $ | 9.29 | ||||||||||||
| Granted | 800 | 9.79 | 1,131 | 4.61 | 1,462 | 6.05 | Granted | 398 | 5.95 | 800 | 9.79 | 1,131 | 4.61 | |||||||||||||||||||
| Exercised | (305 | ) | 5.96 | (575 | ) | 6.74 | (368 | ) | 6.18 | Exercised | (118 | ) | 4.85 | (305 | ) | 5.96 | (575 | ) | 6.74 | |||||||||||||
| Forfeited | (511 | ) | 8.05 | (932 | ) | 8.89 | (914 | ) | 11.08 | Forfeited | (650 | ) | 10.77 | (511 | ) | 8.05 | (932 | ) | 8.89 | |||||||||||||
| Options outstanding at end of year | Options outstanding at end of year | 4,151 | 8.95 | 4,167 | 8.46 | 4,543 | 9.29 | Options outstanding at end of year | 3,781 | 8.44 | 4,151 | 8.95 | 4,167 | 8.46 | ||||||||||||||||||
| Options exercisable at end of year | Options exercisable at end of year | 2,336 | $ | 9.92 | 1,918 | $ | 10.41 | 1,908 | $ | 9.75 | Options exercisable at end of year | 3,004 | $ | 9.25 | 2,336 | $ | 9.92 | 1,918 | $ | 10.41 | ||||||||||||
Information related to options outstanding at January 31, 20052006 is summarized below (in thousands, except per share amounts):
| Range of Exercise Price | Options Outstanding at January 31, 2005 | Weighted Average Remaining Contractual Life | Weighted Average Exercise Price | Options Exercisable at January 31, 2005 | Weighted Average Exercise Price | |||||||
|---|---|---|---|---|---|---|---|---|---|---|---|---|
| $ 2.97 to $4.97 | 1,273 | 5.70 | $ | 4.62 | 486 | $ | 4.67 | |||||
| $ 5.06 to $8.90 | 963 | 5.18 | 7.84 | 736 | 7.90 | |||||||
| $ 9.19 to $11.00 | 1,099 | 4.92 | 9.99 | 434 | 10.01 | |||||||
| $11.05 to $25.44 | 816 | 6.12 | 15.61 | 680 | 15.80 | |||||||
| 4,151 | 2,336 | |||||||||||
| Range of Exercise Price | Options Outstanding at January 31, 2006 | Weighted Average Remaining Contractual Life | Weighted Average Exercise Price | Options Exercisable at January 31, 2006 | Weighted Average Exercise Price | |||||||
|---|---|---|---|---|---|---|---|---|---|---|---|---|
| $2.97 to $4.97 | 1,088 | 4.78 | $ | 4.62 | 639 | $ | 4.67 | |||||
| $5.06 to $8.90 | 1,167 | 5.06 | 7.33 | 857 | 7.78 | |||||||
| $9.19 to $11.00 | 945 | 3.85 | 9.97 | 927 | 9.97 | |||||||
| $11.05 to $25.44 | 581 | 5.28 | 15.32 | 581 | 15.32 | |||||||
| 3,781 | 4.71 | $ | 8.44 | 3,004 | $ | 9.25 | ||||||
As of January 31, 2005,2006, the Company has reserved for issuance under the Long Term Incentive Plan 4,943,7834,885,464 shares of common stock, of which 3,958,0743,587,569 shares are subject to currently outstanding options to employees and directors, and 985,7091,297,895 shares are reserved for future awards. As of January 31, 2005,2006, the Company has reserved for issuance under the Director Plan 195,314 shares of Common Stock, of which 193,094 shares are subject to currently outstanding options, and 2,220 shares are reserved for future awards.
401(k) Plan
The Company has adopted a plan pursuant to Section 401(k) of the Internal Revenue Code ("the Code") whereby participants may contribute a percentage of compensation not in excess of the maximum allowed under the Code. The plan provides for a matching contribution by the Company which was reinstated, after a period of suspension, as of January 31, 2004. Employer matching contributions amounted to $1.2 million, $457,000 $53,000 and $0$53,000 for the fiscal years ended January 31, 2006, 2005 2004 and 2003,2004, respectively. The Company may make additional contributions at the discretion of the Board of Directors. No discretionary contributions were made during the fiscal years ended January 31, 2006, 2005, 2004, or 2003.2004.
Incentive Compensation Plans
Effective May 3, 2004, the variable compensation plan was terminated. The Company did not record expense under this plan for the years ended January 31, 2005 and 2004; however, the Company recorded expense of $1.5 million for the year ended January 31, 2003.
The Carreker Incentive Bonus Plan ("CIBP") awards employees bonuses based on the Company's or the applicable business unit's operating results. Substantially all employees are eligible to receive cash awards under the CIBP. Awards from this plan are paid to employees subsequent to the end of the fiscal year. The Company's Compensation Committee of the Board of Directors has the authority to determine the final amount of the bonus that is ultimately paid to the officers of the Company. In the fiscal year ended January 31, 2006, 2005 2004 and 2003,2004, the Company recorded expense under this plan of approximately $575,000, $1.8 million and $2.6 million, and $1.6 million, respectively. At January 31, 2005, approximately $1.8 million of incentive bonus was accrued.
The Company pays discretionary bonuses to key employees based primarily on the extent to which individuals meet agreed-upon objectives for the year. The Company recorded discretionary bonus expense of approximately $857,000, $1.1 million $958,000 and $853,000$958,000 for the fiscal years ended January 31, 2006, 2005 2004 and 2003,2004, respectively.
8. Lease Commitments
The Company leases office facilities and certain equipment under operating leases for various periods. Leases that expire are generally expected to be renewed or replaced by other leases. The Company's corporate office lease agreement in Dallas, Texas has average minimum annual rent payments of $1.7 million and expires in 2010. Rental expense under operating leases for the fiscal years ended January 31, 2006, 2005 2004 and 20032004 was approximately $3.8 million, $4.5 million $4.8 million and $4.9$4.8 million, respectively. Future minimum base rents under terms of non-cancelable operating leases are as follows (in thousands):
Year ending January 31:
| 2006 | $ | 3,607 | |
| 2007 | 3,239 | ||
| 2008 | 2,887 | ||
| 2009 | 2,875 | ||
| 2010 | 2,105 | ||
| Thereafter | 816 | ||
| Total | $ | 15,529 | |
| Year ending January 31: | ||||
| 2007 | $ | 3,436 | ||
| 2008 | 2,950 | |||
| 2009 | 2,875 | |||
| 2010 | 2,104 | |||
| 2011 | 814 | |||
| Total | $ | 12,179 | ||
9. Earnings Per Share
The following table sets forth the computation of basic and diluted earnings (loss) per share (in thousands, except per share amounts):
| | | Year Ended January 31, | |||||||||||||||||||
|---|---|---|---|---|---|---|---|---|---|---|---|---|---|---|---|---|---|---|---|---|---|
| | | Year Ended January 31, | | 2006 | 2005 | 2004 | |||||||||||||||
| | | 2005 | 2004 | 2003 | | | | (As restated) See Note 3 | |||||||||||||
| Basic earnings (loss) per share: | Basic earnings (loss) per share: | Basic earnings (loss) per share: | |||||||||||||||||||
| Net income (loss) | $ | (1,196 | ) | $ | 3,706 | $ | (33,630 | ) | Net income (loss) | $ | 2,069 | $ | (1,196 | ) | $ | 1,665 | |||||
| Weighted average shares outstanding | 24,295 | 23,736 | 23,198 | Weighted average shares outstanding | 24,092 | 24,295 | 23,736 | ||||||||||||||
| Basic earnings (loss) per share | $ | (0.05 | ) | $ | 0.16 | $ | (1.45 | ) | Basic earnings (loss) per share | $ | 0.09 | $ | (0.05 | ) | $ | 0.07 | |||||
| Diluted earnings (loss) per share: | Diluted earnings (loss) per share: | Diluted earnings (loss) per share: | |||||||||||||||||||
| Net income (loss) | $ | (1,196 | ) | $ | 3,706 | $ | (33,630 | ) | Net income (loss) | $ | 2,069 | $ | (1,196 | ) | $ | 1,665 | |||||
| Weighted average shares outstanding | 24,295 | 23,736 | 23,198 | Weighted average shares outstanding | 24,092 | 24,295 | 23,736 | ||||||||||||||
| Assumed conversion of employee stock options and unvested restricted stock | — | 648 | — | Assumed conversion of employee stock options and unvested restricted stock | 386 | — | 648 | ||||||||||||||
| Shares used in diluted earnings per share calculation | 24,295 | 24,384 | 23,198 | Shares used in diluted earnings per share calculation | 24,478 | 24,295 | 24,384 | ||||||||||||||
| Diluted earnings (loss) per share | $ | (0.05 | ) | $ | 0.15 | $ | (1.45 | ) | |||||||||||||
| Diluted earnings (loss) per share | $ | 0.08 | $ | (0.05 | ) | $ | 0.07 | ||||||||||||||
Options totaling 2,687,787, 4,151,168 2,705,293 and 4,543,4442,705,293 in fiscal years ending January 31, 2006, 2005 2004 and 20032004 respectively, have been excluded from the diluted earnings per share computation, as the options were anti-dilutive.
10. Commitments and Contingencies
Shareholder Derivative Suit.
On June 15, 2004, by mutual agreement between the parties,Smith v. Carreker Corporation, et. al, Civil Action No. 303CV1211-M was reinstated in the United States District Court for the Northern District of Texas, Dallas Division. This action was originally filed on May 29, 2003, in the United States District Court for the Northern District of Texas, Dallas Division as Civil Action no. 303CV1211-D. On January 15, 2004, the Court, acting upon the joint motion of the parties, dismissed the action without prejudice. This action was brought as a shareholders' derivative action pursuant to Rule 23.1, Fed.R.Civ.P. for the benefit of Nominal Defendant Carreker Corporation against certain of its current and former officers and directors, i.e., John D. Carreker, Jr., James D. Carreker, Richard R. Lee, Jr., James L. Fischer, Donald L. House, David K. Sias, Terry L. Gage, James R. Erwin, Ronald G. Steinhart and Ronald Antinori, seeking to remedy their individual breaches of fiduciary duty, including their knowing violations of Generally Accepted Accounting Principles ("GAAP"), knowing violations of federal and state securities laws, acts of bad faith and other breaches of fiduciary duty. The plaintiff seekssought redress (the form of which includes, among others, unspecified amounts of compensatory damages, interest and costs, including legal fees) for injuries to the Company and its shareholders caused by Defendants' misfeasance and/or malfeasance during the period from May 20, 1998 through December 10, 2002.
On June 2, 2003, The District Court has preliminarily approved a settlement of the derivative claims brought in this action. Under the proposed settlement, the Company has agreed to adopt certain corporate governance enhancements and cover plaintiffs' counsel's attorney's fees and litigation expenses up to $300,000. Neither the Company nor any of its current or former officers and directors made any admission of wrongdoing. When the settlement is approved by the Court and is made final, the derivative litigation against the Company's current and former officers and directors will be terminated. A final settlement hearing will be scheduled before the District Court Dallas County, Texas, Walter Evans brought a shareholders' derivative action, for the benefitpurpose of Nominal Defendant Carreker Corporation against James D. Carreker, John D. Carreker, Jr., James R. Erwin, James L. Fischer, Michael D. Hansen, Donald L. House, Richard R. Lee, Jr., David K. Sias, Ronald J. Steinhart,determining whether the proposed settlement should be approved as fair, reasonable and Ernst & Young, LLPadequate. The settlement is subject to conditions, including final court approval. At this time, there can be no assurance that those conditions will be met and Carreker Corporation, Nominal Defendant (Cause No. 0305505). The complaint alleges that the director defendants breached their fiduciary duty to the company. In addition the complaint makes certain allegations against the Company's independent registered public accounting firm Ernst & Young LLP. The complaint seeks unspecified amounts of compensatory damages, as well as interest and costs, including legal fees from the director defendants.settlement will receive final court approval.
Shareholder Class Action.
On April 16, 2003 the United States District Court for the Northern District of Texas, Dallas Division, issued an order consolidating a number of purported class action lawsuits against the Company, John D. Carreker Jr. and Terry L. Gage into a Consolidated Action styledIn re Carreker Corporation Securities Litigation, Civil Action No. 303CV0250-M. Also, on March 3,On October 14, 2003 Claude Alton Coulterthe plaintiffs filed a purported class action lawsuit (Civiltheir Consolidated Class Action No. 503-CV-5-Q) against the Company, John D. Carreker Jr. and Terry L. Gage in the United States District Court for the Eastern District of Texas, Texarkana Division. These complaints,Complaint. The complaint, filed on behalf of purchasers of the Company's common stock between May 20, 1998 and December 10, 2002, inclusive, allegealleged violations of Section 10(b) of the Securities Exchange Act of 1934 and Rule 10b-5 against all defendants (the Company, John D. Carreker Jr., Ronald Antinori, Terry L. Gage and Ernst & Young, the Company's auditors), violations of Section 20(a) of the Exchange Act against the individual defendants. These complaintsdefendants, and violation of Section 20A of the Securities Exchange Act against defendants John D. Carreker, Jr. and Ronald Antinori. The complaint also allege,alleges, among other things, that defendants artificially inflated the value of the Company'sCarreker stock by knowingly or recklessly misrepresenting the Company's financial results during the purported class period. On March 22, 2005 the Court dismissed the action without prejudice and allowed the plaintiffs 60 days in which to file an amended complaint. Also the Court dismissed, with prejudice, all claims by shareholders relating to periods prior to July 31, 1999.
On May 31, 2005, the plaintiffs filed an Amended Consolidated Class Action Complaint on behalf of purchasers of the Company's common stock between July 30, 1999 and December 10, 2002, inclusive, which reiterates the allegations in the first complaint, and alleges violations of Section 10(b) of the Securities Exchange Act of 1934 and Rule 10b-5 against all defendants (the Company, John D. Carreker Jr., Ronald Antinori and Terry L. Gage) except Ernst & Young LLP, violations of Section 20(a) of the Exchange Act against the individual defendants, and violations of Section 20A of the Securities Exchange Act against defendants John D. Carreker, Jr. and Ronald Antinori. The plaintiffs are seeking unspecified amounts of compensatory damages, interest and costs, including legal fees.
On March 22, 2005,April 21, 2006, counsel for the plaintiffs and defendants executed and submitted to the Court dismissed claimsa stipulation of settlement whereby they have agreed to settle the class action litigation for a payment of $5,250,000. The proposed settlement is subject to final court approval. At this time, there can be no assurance that the settlement will receive final court approval.
The proposed settlement payments in both the shareholder derivative suit and the class action are fully covered by purchasers of the Company's common stock prior to July 30, 1999.
The Companydirectors and individual defendants deny the allegations in these complaints and intend to defend themselves vigorously. It is not possible at this time to predict whether the Company will incur any liability or to estimate the damages, or the range of damages, if any, that the Company might incur in connection with these lawsuits. The ultimate resolution of these lawsuits could have a material adverse effect on the Company's business, results of operations, financial condition and cash flows.officer's insurance policies.
The Company is periodically involved in various other legal actions and claims which arise in the normal course of business. In the opinion of management, the final disposition of these matters areis not expected to have a material adverse effect on the Company's financial position or results of operations.
11. Business Segments and Revenue Concentration
The tables below show revenues and income (loss) from operations for the periods indicated for our threefour reportable business segments: Revenue Enhancement, Global Payments Technologies, and Global Payments Consulting.Consulting and Business Process Outsourcing. Certain prior year amounts have been reclassified to conform with the current year business segment presentation. Our customer projects are sold on a solution basis, so it is necessary to break them down by segment and allocate accordingly. Included in "Corporate Unallocated" are costs related to selling and marketing, and certain unallocated corporate overhead expense such as executive management, finance, accounting, human resources, legal and general software management.certain IT and facility functions. Business segment results, which include costs for research and development as well as product royalty expense, the amortization and impairment of goodwill and intangible assets, the write-off of capitalized software costs and restructuring and other charges, were as follows (in thousands):
| | | Year ended January 31, 2005 | | Year ended January 31, 2006 | ||||||||||||||||||||||||||||||||||
|---|---|---|---|---|---|---|---|---|---|---|---|---|---|---|---|---|---|---|---|---|---|---|---|---|---|---|---|---|---|---|---|---|---|---|---|---|---|---|
| | | Revenue Enhancement | Global Payments Technologies | Global Payments Consulting | Corporate Unallocated | Total | | Revenue Enhancement | Global Payments Technologies | Global Payments Consulting | Business Process Outsourcing | Corporate Unallocated | Total | |||||||||||||||||||||||||
| Revenues: | ||||||||||||||||||||||||||||||||||||||
| Revenues | Revenues | |||||||||||||||||||||||||||||||||||||
| Consulting fees | $ | 34,015 | $ | 425 | $ | 2,753 | $ | — | $ | 37,193 | Consulting | $ | 30,870 | $ | 53 | $ | 2,321 | $ | — | $ | — | $ | 33,244 | |||||||||||||||
| Software license fees | 326 | 20,070 | 33 | — | 20,429 | Software license | 1,037 | 16,991 | 249 | — | — | 18,277 | ||||||||||||||||||||||||||
| Software maintenance fees | 992 | 41,445 | 856 | — | 43,293 | Software maintenance | 674 | 40,933 | 835 | — | — | 42,442 | ||||||||||||||||||||||||||
| Software implementation fees | 673 | 13,373 | 753 | — | 14,799 | Software implementation and other services | 3,389 | 13,967 | 1,101 | — | — | 18,457 | ||||||||||||||||||||||||||
| Outsourcing services fees | — | — | — | 139 | 139 | Outsourcing services | — | — | — | 1,038 | — | 1,038 | ||||||||||||||||||||||||||
| Out-of-pocket expense reimbursements | 1,398 | 1,251 | 389 | — | 3,038 | Out-of-pocket expense reimbursements | 1,451 | 1,273 | 402 | — | — | 3,126 | ||||||||||||||||||||||||||
| Total revenues | $ | 37,404 | $ | 76,564 | $ | 4,784 | $ | 139 | $ | 118,891 | Total revenues | $ | 37,421 | $ | 73,217 | $ | 4,908 | $ | 1,038 | $ | — | $ | 116,584 | |||||||||||||||
| Income (loss) from operations before amortization of customer relationships and restructuring and other charges | Income (loss) from operations before amortization of customer relationships and restructuring and other charges | $ | 17,379 | $ | 13,909 | $ | (1,900 | ) | $ | (25,835 | ) | $ | 3,553 | Income (loss) from operations before amortization of customer relationships and restructuring and other charges | $ | 15,616 | $ | 11,830 | $ | (217 | ) | $ | (2,052 | ) | $ | (21,445 | ) | $ | 3,732 | |||||||||
| Amortization of customer relationships | — | 1,400 | — | — | 1,400 | |||||||||||||||||||||||||||||||||
| Restructuring and other charges (credits) | 1,837 | (468 | ) | 248 | 2,065 | 3,682 | ||||||||||||||||||||||||||||||||
| Amortization of customer relationships | Amortization of customer relationships | — | 1,400 | — | — | — | 1,400 | |||||||||||||||||||||||||||||||
| Restructuring and other charges (credits) | Restructuring and other charges (credits) | — | 923 | (25 | ) | — | 20 | 918 | ||||||||||||||||||||||||||||||
| Income (loss) from operations | Income (loss) from operations | $ | 15,542 | $ | 12,977 | $ | (2,148 | ) | $ | (27,900 | ) | $ | (1,529 | ) | Income (loss) from operations | $ | 15,616 | $ | 9,507 | $ | (192 | ) | $ | (2,052 | ) | $ | (21,465 | ) | $ | 1,414 | ||||||||
| | Year ended January 31, 2004 | |||||||||||||||
|---|---|---|---|---|---|---|---|---|---|---|---|---|---|---|---|---|
| | Revenue Enhancement | Global Payments Technologies | Global Payments Consulting | Corporate Unallocated | Total | |||||||||||
| Revenues: | ||||||||||||||||
| Consulting fees | $ | 32,247 | $ | 222 | $ | 1,595 | $ | — | $ | 34,064 | ||||||
| Software license fees | 2,608 | 24,667 | 90 | — | 27,365 | |||||||||||
| Software maintenance fees | 1,141 | 43,091 | 890 | — | 45,122 | |||||||||||
| Software implementation fees | 984 | 16,204 | 915 | — | 18,103 | |||||||||||
| Out-of-pocket expense reimbursements | 1,564 | 2,244 | 446 | — | 4,254 | |||||||||||
| Intercompany revenue | — | (165 | ) | 165 | — | — | ||||||||||
| Total revenues | $ | 38,544 | $ | 86,263 | $ | 4,101 | $ | — | $ | 128,908 | ||||||
| Income (loss) from operations before amortization of customer relationships and merger, restructuring and other charges | $ | 18,414 | $ | 23,245 | $ | (3,781 | ) | $ | (30,320 | ) | $ | 7,558 | ||||
| Amortization of customer relationships | — | 1,400 | — | — | 1,400 | |||||||||||
| Restructuring and other charges (credits) | — | (529 | ) | 571 | 1,859 | 1,901 | ||||||||||
| Income (loss) from operations | $ | 18,414 | $ | 22,374 | $ | (4,352 | ) | $ | (32,179 | ) | $ | 4,257 | ||||
| | Year ended January 31, 2003 | |||||||||||||||||
|---|---|---|---|---|---|---|---|---|---|---|---|---|---|---|---|---|---|---|
| | Revenue Enhancement | Global Payments Technologies | Global Payments Consulting | Corporate Unallocated | Total | |||||||||||||
| Revenues: | ||||||||||||||||||
| Consulting fees | $ | 31,909 | $ | 402 | $ | 6,893 | $ | — | $ | 39,204 | ||||||||
| Software license fees | 959 | 36,133 | 854 | — | 37,946 | |||||||||||||
| Software maintenance fees | 651 | 40,354 | 853 | — | 41,858 | |||||||||||||
| Software implementation fees | 1,688 | 21,482 | 1,140 | — | 24,310 | |||||||||||||
| Out-of-pocket expense reimbursements | 1,969 | 2,720 | 1,769 | — | 6,458 | |||||||||||||
| Intercompany revenue | — | (479 | ) | 479 | — | — | ||||||||||||
| Total revenues | $ | 37,176 | $ | 100,612 | $ | 11,988 | $ | — | $ | 149,776 | ||||||||
| Income (loss) from operations before amortization and impairment of goodwill and customer relationships and merger, restructuring and other charges | $ | 16,846 | $ | 32,564 | $ | (1,486 | ) | $ | (30,066 | ) | $ | 17,858 | ||||||
| Amortization of customer relationships | — | 1,400 | — | — | 1,400 | |||||||||||||
| Goodwill impairment | — | 46,000 | — | — | 46,000 | |||||||||||||
| Write-off of capitalized software costs and prepaid software royalties | — | 954 | — | — | 954 | |||||||||||||
| Restructuring and other charges | 20 | 445 | 133 | 2,347 | 2,945 | |||||||||||||
| Income (loss) from operations | $ | 16,826 | $ | (16,235 | ) | $ | (1,619 | ) | $ | (32,413 | ) | $ | (33,441 | ) | ||||
| | Year ended January 31, 2005 | ||||||||||||||||||||
|---|---|---|---|---|---|---|---|---|---|---|---|---|---|---|---|---|---|---|---|---|---|
| | Revenue Enhancement | Global Payments Technologies | Global Payments Consulting | Business Process Outsourcing | Corporate Unallocated | Total | |||||||||||||||
| Revenues | |||||||||||||||||||||
| Consulting | $ | 34,015 | $ | 425 | $ | 2,753 | $ | — | $ | — | $ | 37,193 | |||||||||
| Software license | 326 | 20,070 | 33 | — | — | 20,429 | |||||||||||||||
| Software maintenance | 992 | 41,445 | 856 | — | — | 43,293 | |||||||||||||||
| Software implementation and other services | 673 | 13,373 | 753 | — | — | 14,799 | |||||||||||||||
| Outsourcing services | — | — | — | 139 | — | 139 | |||||||||||||||
| Out-of-pocket expense reimbursements | 1,398 | 1,251 | 389 | — | — | 3,038 | |||||||||||||||
| Total revenues | $ | 37,404 | $ | 76,564 | $ | 4,784 | $ | 139 | $ | — | $ | 118,891 | |||||||||
| Income (loss) from operations before amortization of customer relationships and restructuring and other charges | $ | 17,379 | $ | 13,909 | $ | (1,900 | ) | $ | (1,803 | ) | $ | (24,032 | ) | $ | 3,553 | ||||||
| Amortization of customer relationships | — | 1,400 | — | — | — | 1,400 | |||||||||||||||
| Restructuring and other charges (credits) | 1,837 | (468 | ) | 248 | 24 | 2,041 | 3,682 | ||||||||||||||
| Income (loss) from operations | $ | 15,542 | $ | 12,977 | $ | (2,148 | ) | $ | (1,827 | ) | $ | (26,073 | ) | $ | (1,529 | ) | |||||
| | Year ended January 31, 2004 | |||||||||||||||||||
|---|---|---|---|---|---|---|---|---|---|---|---|---|---|---|---|---|---|---|---|---|
| | Revenue Enhancement | Global Payments Technologies | Global Payments Consulting | Business Process Outsourcing | Corporate Unallocated | Total | ||||||||||||||
| | (As restated) See Note 3 | |||||||||||||||||||
| Revenues | ||||||||||||||||||||
| Consulting | $ | 32,247 | $ | 222 | $ | 1,595 | $ | — | $ | — | $ | 34,064 | ||||||||
| Software license | 2,608 | 24,667 | 90 | — | — | 27,365 | ||||||||||||||
| Software maintenance | 1,141 | 41,050 | 890 | — | — | 43,081 | ||||||||||||||
| Software implementation | 984 | 16,204 | 915 | — | — | 18,103 | ||||||||||||||
| Out-of-pocket expense reimbursements | 1,564 | 2,244 | 446 | — | — | 4,254 | ||||||||||||||
| Intercompany revenue | — | (165 | ) | 165 | — | — | — | |||||||||||||
| Total revenues | $ | 38,544 | $ | 84,222 | $ | 4,101 | $ | — | $ | — | $ | 126,867 | ||||||||
| Income (loss) from operations before amortization of customer relationships and merger, restructuring and other charges | $ | 18,414 | $ | 21,204 | $ | (3,781 | ) | $ | (537 | ) | $ | (29,783 | ) | $ | 5,517 | |||||
| Amortization of customer relationships | — | 1,400 | — | — | — | 1,400 | ||||||||||||||
| Restructuring and other charges (credits) | — | (529 | ) | 571 | — | 1,859 | 1,901 | |||||||||||||
| Income (loss) from operations | $ | 18,414 | $ | 20,333 | $ | (4,352 | ) | $ | (537 | ) | $ | (31,642 | ) | $ | 2,216 | |||||
During the three months ended July 31, 2003, the Company formed Carretek LLC (Carretek), a 51% jointly owned company to offer financial institutions offshore-centric outsourcing of their business processes and IT services needs. During July 2004, Carretek signed its first contract to perform outsourced services with a customer. As this outsourcing business is in the development phase and its operations immaterial, the financial results for the fiscal years 2004 and 2003 are contained in the Corporate-Unallocated business segment in the tables above.
For the fiscal yearthree years ended January 31, 2006, 2005 and 2004, Carretek recorded revenue of $1.0 million, $139,000 of revenueand $0, respectively, and recorded expense of $3.1 million, $1.8 million.million and $537,000, respectively. Accordingly, the 49% share or $794,000, ofrelating to the minority interest in this lossthese losses, which was $1.0 million, $794,000 and $263,00 for the years ended January 31, 2006, 2005 and 2004, respectively, was recorded in other income in the accompanying consolidated statements of operations. The Company and its partner have funded Carretek to date with anin the aggregate amount of $2.1$4.5 million from both partners consisting of $100,000equity. Carretek's operations are included in equity and $2.0 million in the form of notes payable.
For the fiscal year 2003, Carretek did not record any revenue and incurred expense of $537,000. Accordingly, the 49% share or $263,000 of the minority interest in this loss was recorded in other income in the accompanying consolidated statements of operations.our business process outsourcing segment.
The following table summarizes revenues, exclusive of out-of-pocket expense reimbursements, derived from the Company's largest customer and top five customers during the periods indicated.
| | Year Ended January 31, | |||||||||||||
|---|---|---|---|---|---|---|---|---|---|---|---|---|---|---|
| | Year Ended January 31, | 2006 | 2005 | 2004 | ||||||||||
| | 2005 | 2004 | 2003 | | | (As restated) See Note 3 | ||||||||
| Single customer | 14 | % | 9 | % | 10 | % | 13 | % | 14 | % | 9 | % | ||
| Top five customers | 31 | % | 28 | % | 34 | % | 36 | % | 31 | % | 28 | % | ||
Wells Fargo accounted for approximately 13% of total revenues during the year ended January 31, 2006 and approximately 14% of total revenues during the year ended January 31, 2005, no2005. No single customer accounted for greater than 10% of total revenues during the year ended January 31, 2004 and U.S. Bank, N.A. accounted for approximately 10% of total revenues during the year ended January 31, 2003.2004.
The Company markets its solutions in several foreign countries. Revenues, exclusive of out-of-pocket expense reimbursements, for fiscal years ended indicated attributed to countries based on the location of the customers were as follows (in thousands):
| | | Year Ended January 31, | ||||||||||||||||||||||||||||||||
|---|---|---|---|---|---|---|---|---|---|---|---|---|---|---|---|---|---|---|---|---|---|---|---|---|---|---|---|---|---|---|---|---|---|---|
| | | Year Ended January 31, | | 2006 | 2005 | 2005 | ||||||||||||||||||||||||||||
| | | 2005 | 2004 | 2003 | | Amount | Percent of total revenues | Amount | Percent of total revenues | Amount | Percent of total revenues | |||||||||||||||||||||||
| | | Amount | Percent of total revenues | Amount | Percent of total revenues | Amount | Percent of total revenues | | | | | | (As restated) See Note 3 | |||||||||||||||||||||
| United States | United States | $ | 88,643 | 76 | % | $ | 94,202 | 75 | % | $ | 116,018 | 81 | % | United States | $ | 84,946 | 75 | % | $ | 88,643 | 76 | % | $ | 92,161 | 75 | % | ||||||||
| Europe | Europe | 11,206 | 10 | 14,949 | 12 | 9,794 | 7 | Europe | 9,197 | 8 | 11,206 | 10 | 14,949 | 12 | ||||||||||||||||||||
| Canada | Canada | 6,227 | 6 | 5,395 | 5 | 6,234 | 5 | |||||||||||||||||||||||||||
| Asia Pacific | Asia Pacific | 4,103 | 3 | 4,508 | 4 | 4,880 | 3 | Asia Pacific | 5,806 | 5 | 4,103 | 3 | 4,508 | 4 | ||||||||||||||||||||
| Canada | 5,395 | 5 | 6,234 | 5 | 8,711 | 6 | ||||||||||||||||||||||||||||
| South Africa | South Africa | 5,738 | 5 | 3,996 | 3 | 3,634 | 3 | South Africa | 4,771 | 4 | 5,738 | 5 | 3,996 | 3 | ||||||||||||||||||||
| Other | Other | 768 | 1 | 765 | 1 | 281 | — | Other | 2,511 | 2 | 768 | 1 | 765 | 1 | ||||||||||||||||||||
| Total revenues | $ | 115,853 | 100 | % | $ | 124,654 | 100 | % | $ | 143,318 | 100 | % | Total revenues | $ | 113,458 | 100 | % | $ | 115,853 | 100 | % | $ | 122,613 | 100 | % | |||||||||
12. Restructuring and Other Charges
The Company recorded various restructuring and other charges (credits) during the fiscal years ended January 31, 2006, 2005 2004 and 20032004 as follows (in thousands):
| | Workforce Reductions | Charges/ Credits relating to CheckFlow Suite | Facility Closures | EPG Litigation Settlement | Legal and Professional Fees | Other | Total | ||||||||||||||||
|---|---|---|---|---|---|---|---|---|---|---|---|---|---|---|---|---|---|---|---|---|---|---|---|
| Fiscal Year Ended January 31, 2003: | |||||||||||||||||||||||
| Quarterly period ended January 31, 2003 | $ | 633 | $ | — | $ | — | $ | — | $ | 2,312 | $ | — | $ | 2,945 | |||||||||
| Total year ended January 31, 2003 | $ | 633 | $ | — | $ | — | $ | — | $ | 2,312 | $ | — | $ | 2,945 | |||||||||
| Fiscal Year Ended January 31, 2004: | |||||||||||||||||||||||
| Quarterly period ended April 30, 2003 | $ | 545 | $ | — | $ | — | $ | — | $ | 139 | $ | — | $ | 684 | |||||||||
| Quarterly period ended July 31, 2003 | 648 | — | — | — | 130 | — | 778 | ||||||||||||||||
| Quarterly period ended October 31, 2003 | (251 | ) | — | (119 | ) | — | 141 | — | (229 | ) | |||||||||||||
| Quarterly period ended January 31, 2004 | 390 | — | — | — | 181 | 97 | 668 | ||||||||||||||||
| Total year ended January 31, 2004 | $ | 1,332 | $ | — | $ | (119 | ) | $ | — | $ | 591 | $ | 97 | $ | 1,901 | ||||||||
| Fiscal Year Ended January 31, 2005: | |||||||||||||||||||||||
| Quarterly period ended April 30, 2004 | $ | 308 | $ | — | $ | — | $ | 1,686 | $ | 521 | $ | — | $ | 2,515 | |||||||||
| Quarterly period ended July 31, 2004 | 192 | (1,215 | ) | — | 14 | 1,206 | — | 197 | |||||||||||||||
| Quarterly period ended October 31, 2004 | 246 | — | — | — | 20 | — | 266 | ||||||||||||||||
| Quarterly period ended January 31, 2005 | 727 | (67 | ) | 44 | — | — | — | 704 | |||||||||||||||
| Total year ended January 31, 2005 | $ | 1,473 | $ | (1,282 | ) | $ | 44 | $ | 1,700 | $ | 1,747 | $ | — | $ | 3,682 | ||||||||
Fiscal Year Ended January 31, 2003
During the quarterly period ended January 31, 2003, the Company recorded a charge of $633,000 related to severance costs for 44 employees that were terminated. Additionally, the Company recorded a charge for approximately $2.3 million for legal and professional fees related to the special investigation and restatement efforts.
| | Workforce Reductions | EPG Litigation Settlement | Legal and Professional Fees | Charges/Credits relating to CheckFlow Suite | Other | Total | ||||||||||||||
|---|---|---|---|---|---|---|---|---|---|---|---|---|---|---|---|---|---|---|---|---|
| Fiscal Year Ended January 31, 2004: | ||||||||||||||||||||
| Quarterly period ended April 30, 2003 | $ | 545 | $ | — | $ | 139 | $ | — | $ | — | $ | 684 | ||||||||
| Quarterly period ended July 31, 2003 | 648 | — | 130 | — | — | 778 | ||||||||||||||
| Quarterly period ended October 31, 2003 | (251 | ) | — | 141 | — | (119 | ) | (229 | ) | |||||||||||
| Quarterly period ended January 31, 2004 | 390 | — | 181 | — | 97 | 668 | ||||||||||||||
| Total year ended January 31, 2004 | $ | 1,332 | $ | — | $ | 591 | $ | — | $ | (22 | ) | $ | 1,901 | |||||||
| Fiscal Year Ended January 31, 2005: | ||||||||||||||||||||
| Quarterly period ended April 30, 2004 | $ | 308 | $ | 1,686 | $ | 521 | $ | — | $ | — | $ | 2,515 | ||||||||
| Quarterly period ended July 31, 2004 | 192 | 14 | 1,206 | (1,215 | ) | — | 197 | |||||||||||||
| Quarterly period ended October 31, 2004 | 246 | — | 20 | — | — | 266 | ||||||||||||||
| Quarterly period ended January 31, 2005 | 727 | — | — | (67 | ) | 44 | 704 | |||||||||||||
| Total year ended January 31, 2005 | $ | 1,473 | $ | 1,700 | $ | 1,747 | $ | (1,282 | ) | $ | 44 | $ | 3,682 | |||||||
| Fiscal Year Ended January 31, 2006: | ||||||||||||||||||||
| Quarterly period ended April 30, 2005 | $ | 127 | $ | — | $ | — | $ | — | $ | (32 | ) | $ | 95 | |||||||
| Quarterly period ended July 31, 2005 | 28 | — | — | — | — | 28 | ||||||||||||||
| Quarterly period ended October 31, 2005 | 780 | — | — | — | — | 780 | ||||||||||||||
| Quarterly period ended January 31, 2006 | 15 | — | — | — | — | 15 | ||||||||||||||
| Total year ended January 31, 2006 | $ | 950 | $ | — | $ | — | $ | — | $ | (32 | ) | $ | 918 | |||||||
Fiscal Year Ended January 31, 2004
The Company recorded $545,000 in restructuring and other charges during the three month period ended April 30, 2003, principally associated with the separation of 17 employees, within both the Corporate and Global Payments Consulting ("GPC") business segments. During the quarterly period ended April 30, 2003, the Company recorded a charge of $139,000 relating to legal and professional fees relating to the Company's restatement efforts and the shareholder legal actions described in Note 10.
The Company recorded $648,000 in restructuring and other charges during the three month period ended July 31, 2003, principally associated with the separation of 9 employees, within both the Corporate and GPC business segments. During the quarterly period ended July 31, 2003, the Company recorded a charge of $130,000 relating to legal fees relating to the shareholder legal actions described in Note 10.
As part of the Company's settlement with one of the CheckFlow Suite customers, the customer agreed to pay the Company for the replacement product and installation. These payments were recorded directly to this reserve and all future expenditures to install the replacement product have
been charged against this reserve. During the quarterly period ended July 31, 2003, $366,000 was received from this customer.
The Company recorded $170,000 in restructuring and other charges during the three month period ended October 31, 2003, principally associated with the separation of 3 employees within the Corporate business segment. During the quarterly period ended October 31, 2003, the Company recorded a charge of $141,000 relating to legal fees relating to the shareholder legal actions described in Note 10.
Additionally, during the three months ended October 31, 2003, the Company reversed $421,000 primarily related to the true-up of termination benefits as actual costs were lower than estimated amounts. Additionally, $119,000 was reversed when estimated costs to close certain facilities were lower than our original estimates. The effect of these revisions in estimates, net of tax, was $0.02 per share on a fully diluted basis, for the year ended January 31, 2004.
The Company recorded $390,000 of restructuring and other charges during the three months ended January 31, 2004, principally associated with the separation of 11 employees. The Company also discontinued the marketing of one of our software offerings and recorded a $97,000 charge. Finally, the Company recorded a charge of $181,000 relating to legal fees related to the shareholder legal actions described in Note 10.
Fiscal Year Ended January 31, 2005
The Company recorded $308,000 in restructuring and other charges during the three month period ended April 30, 2004, principally associated with the separation of 10 employees. During the quarterly period ended April 30, 2004, the Company recorded a charge of $521,000 relating to legal and professional fees relating to the Company's legal actions described in Note 10.
The Company expensed $1.686$1.7 million for compensatory damages to EPG after the jury returned a verdict in favor of EPG on one claim and Carreker on three claims.
The Company recorded $192,000 in restructuring and other charges during the three month period ended July 31, 2004, principally associated with the separation of 8 employees. During the quarter ended July 31, 2004, the Company recorded a charge of $36,000 relating to legal and professional fees relating to the Company's shareholder legal actions described in Note 10.
An additional $14,000 was expensed and the entire $1.7 million EPG settlement was paid to the plaintiff. Additionally, the Company recorded a charge for the litigation costs related to this legal action totaling $1.2 million during the three month period ended July 31, 2004.
The Company received a final payment of $455,000 from a customer in the settlement with one of its original CheckFlow Suite customers. This payment was recorded directly to this reserve. Concurrently, based on revised cost estimates, the Company lowered its estimate of the cost to develop and install any additional software, or software modifications, with these customers and reversed approximately $1.2 million of this reserve during the three month period ended July 31, 2004.
The Company recorded $246,000 in restructuring and other charges during the three month period ended October 31, 2004, principally associated with the separation of 6 employees. During the quarter ended October 31, 2004, the Company recorded a charge of $20,000 relating to legal and professional fees relating to the Company's shareholder and other legal actions described in Note 10.
The Company recorded $727,000 in restructuring and other charges during the three month period ended January 31, 2005, principally associated with the separation of 16 employees. Based on revised cost estimates, the Company lowered by $67,000 the estimate of the cost to develop and install
additional software, or modify software for the original CheckFlow customers. Finally, the Company recorded a charge of $44,000 related to the closure of the facility in Atlanta, Georgia.
Fiscal Year Ended January 31, 2006
The Company recorded $127,000 in restructuring and other charges during the three month period ended April 30, 2005, principally associated with the separation of 6 employees. The Company also lowered its estimate by $32,000 for the costs associated with the discontinuance of one of its software offerings originally recorded in January 2004.
The Company recorded $28,000 in restructuring and other charges during the three month period ended July 31, 2005, principally associated with the separation of 2 employees.
The Company recorded $780,000 in restructuring and other charges during the three month period ended October 31, 2005, principally associated with the separation of 29 employees primarily within the GPT business segment.
The Company recorded $15,000 in restructuring and other charges during the three month period ended January 31, 2006, principally associated with the separation of 1 employee.
The activity related to the accrued merger and restructuring charge reserve balance during the years ended January 31, 2006, 2005 2004 and 20032004 is as follows (in thousands):
| | Workforce Reductions | Charges relating to CheckFlow Suite | Facility Closures | Other | Total | ||||||||||||||||||||||||||||
|---|---|---|---|---|---|---|---|---|---|---|---|---|---|---|---|---|---|---|---|---|---|---|---|---|---|---|---|---|---|---|---|---|---|
| Reserve balance at January 31, 2002 | $ | 3,670 | $ | 7,213 | $ | 367 | $ | — | $ | 11,250 | |||||||||||||||||||||||
Additions to reserve balance: | |||||||||||||||||||||||||||||||||
| Severance charges | 633 | — | — | — | 633 | ||||||||||||||||||||||||||||
| Reductions to reserve balances: | |||||||||||||||||||||||||||||||||
| Cash paid | (3,222 | ) | (6,068 | ) | (243 | ) | — | (9,533 | ) | ||||||||||||||||||||||||
| | Workforce Reductions | CheckFlow Suite | Facility Closures | Other | Total | ||||||||||||||||||||||||||||
| Reserve balance at January 31, 2003 | 1,081 | 1,145 | 124 | — | 2,350 | Reserve balance at January 31, 2003 | $ | 1,081 | $ | 1,145 | $ | 124 | $ | — | $ | 2,350 | |||||||||||||||||
Additions to reserve balance: | Additions to reserve balance: | ||||||||||||||||||||||||||||||||
| Severance charges | 1,753 | — | — | — | 1,753 | Severance charges | 1,753 | — | — | — | 1,753 | ||||||||||||||||||||||
| Discontinuation of software product | — | — | — | 97 | 97 | Discontinuation of software product | — | — | — | 97 | 97 | ||||||||||||||||||||||
| Cash received from customer | — | 366 | — | — | 366 | Cash received from customer | — | 366 | — | — | 366 | ||||||||||||||||||||||
| Reductions to reserve balances: | Reductions to reserve balances: | ||||||||||||||||||||||||||||||||
| Change in estimate | (421 | ) | — | (119 | ) | — | (540 | ) | Change in estimate | (421 | ) | — | (119 | ) | — | (540 | ) | ||||||||||||||||
| Cash paid | (1,913 | ) | (215 | ) | — | — | (2,128 | ) | Cash paid | (1,913 | ) | (215 | ) | — | — | (2,128 | ) | ||||||||||||||||
| Reserve balance at January 31, 2004 | 500 | 1,296 | 5 | 97 | 1,898 | Reserve balance at January 31, 2004 | 500 | 1,296 | 5 | 97 | 1,898 | ||||||||||||||||||||||
Additions to reserve balance: | Additions to reserve balance: | ||||||||||||||||||||||||||||||||
| Severance charges | 1,473 | — | — | — | 1,473 | Severance charges | 1,473 | — | — | — | 1,473 | ||||||||||||||||||||||
| Cash received from customer | — | 455 | — | 47 | 502 | Cash received from customer | — | 455 | — | 47 | 502 | ||||||||||||||||||||||
| Facility closure charge for Atlanta, GA | — | — | 44 | — | 44 | Facility closure charge for Atlanta, GA | — | — | 44 | — | 44 | ||||||||||||||||||||||
| Reductions to reserve balances: | Reductions to reserve balances: | ||||||||||||||||||||||||||||||||
| Change in estimate | — | (1,282 | ) | — | — | (1,282 | ) | Change in estimate | — | (1,282 | ) | — | — | (1,282 | ) | ||||||||||||||||||
| Cash paid | (1,321 | ) | (269 | ) | — | (41 | ) | (1,631 | ) | Cash paid | (1,321 | ) | (269 | ) | — | (41 | ) | (1,631 | ) | ||||||||||||||
| Reserve balance at January 31, 2005 | $ | 652 | $ | 200 | $ | 49 | $ | 103 | $ | 1,004 | Reserve balance at January 31, 2005 | $ | 652 | $ | 200 | $ | 49 | $ | 103 | $ | 1,004 | ||||||||||||
| Additions to reserve balance: | Additions to reserve balance: | ||||||||||||||||||||||||||||||||
| Severance charges | Severance charges | 950 | — | — | — | 950 | |||||||||||||||||||||||||||
| Reductions to reserve balances: | Reductions to reserve balances: | ||||||||||||||||||||||||||||||||
| Change in estimate | — | — | — | (32 | ) | (32 | ) | ||||||||||||||||||||||||||
| Cash paid | (1,515 | ) | — | (49 | ) | (24 | ) | (1,588 | ) | ||||||||||||||||||||||||
| Reserve balance at January 31, 2006 | Reserve balance at January 31, 2006 | $ | 87 | $ | 200 | $ | — | $ | 47 | $ | 334 | ||||||||||||||||||||||
The Company anticipates the remaining reserve accruals at January 31, 20052006 will be paid or remaining customer obligations completed within the next 12-156 months.
13. Write-off of Capitalized Software Costs and Prepaid Software Royalties
During the quarterly period ended January 31, 2003 in connection with the Company's periodic impairment review of its portfolio of software products, the eiManager product acquired in the AIS business combination in January 2000 was deemed to be impaired. Based on the Company's calculation
of the expected future cash flows of the product, a $586,000 non-cash charge was recorded in cost of revenues.
Effective June 2001, the Company entered into a software license agreement with Actuate Corporation in which the Company would integrate Actuate Corporation's software with the Company's Global Tracking and Cash solutions within the Global Payments Technologies business segment. The Company prepaid $400,000 for 40 copies of the software. Based on the expected sales forecasts of this product a $368,000 non-cash charge was recorded in the quarterly period ended January 31, 2003.
These costs are summarized below (in thousands):
| | Write-off of Capitalized Software Costs and Prepaid Software Royalties | ||
|---|---|---|---|
| Year Ended January 31, 2003: | |||
| Capitalized eiManager product costs | $ | 586 | |
| Write-off of prepaid software royalties with Actuate Corporation. | 368 | ||
| Total recorded in the year ended January 31, 2003 | $ | 954 | |
14. Related Party Transactions
In March 2001, the Company loaned $500,000 to a former officer of the Company pursuant to a Limited Recourse Promissory Note ("Note") collateralized solely by shares of Exchange Applications, Inc. common stock. The principal was due in full on March 30, 2004. In January 2002, the Note was adjusted to its estimated fair value of $125,000 resulting in a charge to earnings of $375,000. During the year ended January 31, 2003, the Note was deemed worthless resulting in a charge to earnings of $125,000.
In connection with the completion of the Check Solutions acquisition, the Company assumed a $10.0 million obligation to certain employees of Check Solutions. During the quarterly period ended January 31, 2002, $3.3 million of this obligation was paid and during the quarterly period ended April 30, 2002 the remaining $6.7 million was paid.
Item 9. Changes in and Disagreements with Accountants on Accounting and Financial Disclosure.
None.
Item 9A. Controls and Procedures.
Disclosure Controls and Procedures
We maintain disclosure controls and procedures designed to ensure that we are able to collect the information we are required to disclose in the reports we file under the Securities Exchange Act of 1934 ("Exchange Act"), and to process, summarize and disclose this information within the time periods specified in the rules under the Exchange Act.
Our management, under the supervision and with the participation of our Chief Executive and Chief Financial Officers, is responsible for evaluating the effectiveness of our disclosure controls and procedures (as defined in Rules 13a-15(e) and 15d-15(e) of the Exchange Act). As of January 31, 2005,2006, they carried out an evaluation of our disclosure controls and procedures,procedures. Based on their evaluation and the identification of the material weakness in internal control over financial reporting described below related to deferred software maintenance, the Chief Executive Officer and Chief Financial Officers believeOfficer concluded that, these controls and procedures are effective to ensure that we are able to collect, process and disclose the information we are required to disclose in the reports we file with the SEC within the required time periods.
In designing and evaluating theas of January 31, 2006, our disclosure controls and procedures management recognizedwere ineffective.
As more fully described in "Management's Discussion and Analysis of Financial Condition and Results of Operations—Restatement" and in Note 3 to the Consolidated Financial Statements, we have restated our audited consolidated financial statements for the years ended January 31, 2005 and 2004. Notwithstanding the existence of the material weakness described below, we believe that any controlsthe consolidated financial statements in this Form 10-K fairly present, in all material respects, our financial condition as of January 31, 2006 and procedures, no matter how well designed2005 and operated, can provide only reasonable assuranceour results of achievingoperations and cash flows for the desired control objectives,years ended January 31, 2006, 2005 and management necessarily was required to apply its judgment2004, in evaluating the cost-benefit relationship of possible controls and procedures.conformity with U.S. generally accepted accounting principles ("GAAP").
Management's Report on Internal Control over Financial Reporting
Our management isWe are responsible for establishing and maintaining adequate internal control over financial reporting. Our internal control over financial reporting (as defined in Rules 13a-15(f) and 15d-15(f) of the Exchange Act). Underis a process, under the supervision and with the participation of management, including our Chief Executive Officer and Chief Financial Officer, wedesigned to provide reasonable assurance regarding the reliability of financial reporting and the preparation of our financial statements for external reporting purposes in accordance with GAAP.
Because of its inherent limitations, internal control over financial reporting may not prevent or detect misstatements. Also, projections of any evaluation of effectiveness to future periods are subject to the risk that controls may become inadequate because of changes in conditions, or that the degree of compliance with the policies or procedures may deteriorate.
Our management conducted an evaluationassessment of the effectiveness of our internal control over financial reporting as of January 31, 20052006 based on the criteria set forthestablished inInternal Control—Integrated Framework issued by the Committee of Sponsoring Organizations of the Treadway Commission (COSO)("COSO"). Based on
A material weakness is a control deficiency, or a combination of control deficiencies, that evaluation,results in more than a remote likelihood that a material misstatement of our management concluded that our internalannual or interim financial statements will not be prevented or detected. In connection with the assessment described above, we identified control over financial reporting was effectivedeficiencies as of January 31, 2006 in controls over deferred software maintenance reconciliations as described below.
Controls Over Deferred Software Maintenance Reconciliations—We did not maintain effective controls over the preparation and review of our deferred software maintenance reconciliations.
Specifically, accounting personnel did not perform accurate reconciliations and did not properly identify and resolve reconciling items. As a result of this material weakness, software maintenance revenue and deferred maintenance revenue were over and understated, respectively, by $2.0 million for the year ended January 31, 2004, and accumulated deficit and deferred maintenance revenue were over and understated, respectively, by $2.0 million for the year ended January 31, 2005. We have restated our audited consolidated financial statements for the years ended January 31, 2005 and 2004 to correct these errors.
Management's assessment of the effectiveness of our internal control over financial reporting as of January 31, 20052006 has been audited by Ernst & Young LLP, an independent registered public accounting firm, whose report appears below.
Remediation of Material Weakness in Internal Control Over Financial Reporting
We have established specific processes and controls and have modified others to provide reasonable assurance that reconciliations are performed as a part of standardized procedures and reconciling items are properly identified and reported on a periodic basis. Management believes that these measures, when effectively implemented and maintained, will remediate the material weakness discussed above.
Changes in Internal Control over Financial Reporting
There have been no changes in our internal control over financial reporting during our most recently completed fiscal quarter that hashave materially affected, or isare reasonably likely to materially affect, our internal control over financial reporting.
REPORT OF INDEPENDENT REGISTERED PUBLIC ACCOUNTING FIRM
ON INTERNAL CONTROL OVER FINANCIAL REPORTING
The Board of Directors and Stockholders
Carreker Corporation
We have audited management's assessment, included in the accompanying Management's Report on Internal Control over Financial Reporting, that Carreker Corporation maintaineddid not maintain effective internal control over financial reporting as of January 31, 2005,2006, because of the effect of a material weakness related to deferred software maintenance revenue, based on criteria established in Internal Control—Integrated Framework issued by the Committee of Sponsoring Organizations of the Treadway Commission (the COSO criteria). Carreker Corporation's management is responsible for maintaining effective internal control over financial reporting and for its assessment of the effectiveness of internal control over financial reporting. Our responsibility is to express an opinion on management's assessment and an opinion on the effectiveness of the company's internal control over financial reporting based on our audit.
We conducted our audit in accordance with the standards of the Public Company Accounting Oversight Board (United States). Those standards require that we plan and perform the audit to obtain reasonable assurance about whether effective internal control over financial reporting was maintained in all material respects. Our audit included obtaining an understanding of internal control over financial reporting, evaluating management's assessment, testing and evaluating the design and operating effectiveness of internal control, and performing such other procedures as we considered necessary in the circumstances. We believe that our audit provides a reasonable basis for our opinion.
A company's internal control over financial reporting is a process designed to provide reasonable assurance regarding the reliability of financial reporting and the preparation of financial statements for external purposes in accordance with generally accepted accounting principles. A company's internal control over financial reporting includes those policies and procedures that (1) pertain to the maintenance of records that, in reasonable detail, accurately and fairly reflect the transactions and dispositions of the assets of the company; (2) provide reasonable assurance that transactions are recorded as necessary to permit preparation of financial statements in accordance with generally accepted accounting principles, and that receipts and expenditures of the company are being made only in accordance with authorizations of management and directors of the company; and (3) provide reasonable assurance regarding prevention or timely detection of unauthorized acquisition, use, or disposition of the company's assets that could have a material effect on the financial statements.
Because of its inherent limitations, internal control over financial reporting may not prevent or detect misstatements. Also, projections of any evaluation of effectiveness to future periods are subject to the risk that controls may become inadequate because of changes in conditions, or that the degree of compliance with the policies or procedures may deteriorate.
A material weakness is a control deficiency, or combination of control deficiencies, that results in more than a remote likelihood that a material misstatement of the annual or interim financial statements will not be prevented or detected. The following material weakness has been identified and included in management's assessment: management identified a material weakness related to ineffective controls over the preparation and review of deferred software maintenance reconciliations. Specifically, accounting personnel did not perform accurate reconciliations and did not properly identify and resolve reconciling items. As a result, software maintenance revenue and deferred maintenance revenue were over and understated, respectively, by $2.0 million for the year ended January 31, 2004, and accumulated deficit and deferred maintenance revenue were over and understated, respectively, by $2.0 million for the year ended January 31, 2005. The company restated its audited consolidated financial statements for the years ended January 31, 2005 and 2004 to correct these errors. This
material weakness was considered in determining the nature, timing, and extent of audit tests applied in our audit of the fiscal 2005 financial statements, and this report does not affect our report dated April 26, 2006 on those financial statements.
In our opinion, management's assessment that Carreker Corporation did not maintain effective internal control over financial reporting as of January 31, 2006, is fairly stated, in all material respects, based on the COSO control criteria. Also, in our opinion, because of the effect of the material weakness described above on the achievement of the objectives of the control criteria, Carreker Corporation has not maintained effective internal control over financial reporting as of January 31, 2005, is fairly stated, in all material respects,2006, based on the COSO criteria. Also, in our opinion, Carreker Corporation maintained, in all material respects, effective internal control over financial reporting as of January 31, 2005, based on the COSO criteria.
We also have audited, in accordance with the standards of the Public Company Accounting Oversight Board (United States), the consolidated balance sheets of Carreker Corporation and subsidiaries as of January 31, 2005 and 2004, and the related consolidated statements of operations, stockholders' equity, and cash flows for each of the three years in the period ended January 31, 2005 of Carreker Corporation and our report dated April 6, 2005 expressed an unqualified opinion thereon.
/s/ ERNST & YOUNG LLP
Dallas, Texas
April 6, 200526, 2006
Not applicable.
Item 10. Directors and Executive Officers of the Registrant.
The information required by this item is partially contained under the heading "Executive Officers of the Company" in Part I Item 1 of this Annual Report on Form 10-K, and the remainder is contained in our proxy statement for our 20052006 Annual Stockholders Meeting (the "Proxy Statement") under the heading "Election of Directors," and is incorporated herein by reference. Information relating to certain filings on Forms 3, 4, and 5 is contained in our Proxy Statement under the heading "Section 16(a) Beneficial Ownership Reporting Compliance," and is incorporated herein by reference. Information required by this item pursuant to Items 401(h), 401(i), and 401(j) of Regulation S-K relating to an audit committee financial expert, the identification of the audit committee of our board of directors and procedures of security holders to recommend nominees to our board of directors is contained in our Proxy Statement under the heading "Corporate Governance" and is incorporated herein by reference.
Code of Ethics
We have adopted a Code of Ethics and Business Conduct that applies to all directors, officers and employees of the Company. A copy of the Code can be found on our web site at www.carreker.com. We intend to satisfy the disclosure requirements of the Securities and Exchange Commission regarding amendments to, or waivers from, the Code by posting such information on the same web site or in a report on Form 8-K.
10b5-1 Trading Plans
Our Insider Trading Policy allows directors, officers and other employees covered under the policy to establish, under limited circumstances contemplated by Rule 10b5-1 under the Securities Exchange Act of 1934, written programs that permit automatic trading of our stock or trading of our stock by an independent person (such as an investment bank) who is not aware of material inside information at the time of the trade. As of the filing date of this report, some of our executive officers, including John D. Carreker, Jr., Chairman and Chief Executive Officer, Robert M. Olson, Jr., Executive Vice President, and Blake A. Williams, Executive Vice President, each a Section 16 officer, have adopted a Rule 10b5-1 trading plan. In addition, Connie Carreker, the wife of our Chairman, together with Mr. Carreker has adopted a 10b5-1 trading plan for the Carreker Family Limited Partnership. We believe that additional directors, officers and employees may establish such programs.
Item 11. Executive Compensation.
Information regarding Executive Compensation is hereby incorporated by reference from the section entitled "Executive Compensation and Other Matters" in the Proxy Statement.
Item 12. Security Ownership of Certain Beneficial Owners and Management and Related Stockholder Matters.
Information regarding Security Ownership of Certain Beneficial Owners and Management is hereby incorporated by reference from the section entitled "Beneficial Ownership of Common Stock" in the Proxy Statement.
Information regarding Equity Compensation Plan Information is hereby incorporated by reference from the section entitled "Equity Compensation Plan Information" in the Proxy Statement.
Item 13. Certain Relationships and Related Transactions.
To the extent that any disclosure is required, information regarding Certain Relationships and Related Transactions is hereby incorporated by reference from the section entitled "Certain Transactions and Business Relationships" in the Proxy Statement.
Item 14. Principal AccountingAccountant Fees and Services.
Information regarding fees and services is hereby incorporated by reference from the section entitled "Accounting Fees and Services" in the Proxy Statement.
Item 15. Exhibits and Financial Statement Schedules.
| (a) | 1. | The following financial statements are filed as part of this report: | ||||
Report of Ernst & Young LLP, Independent Registered Public Accounting Firm | ||||||
Consolidated Balance Sheets as of January 31, | ||||||
Consolidated Statements of Operations for the years ended January 31, 2006, 2005 | ||||||
Consolidated Statements of Stockholders' Equity for the years ended January 31, 2006, 2005 | ||||||
Consolidated Statements of Cash Flows for the years ended January 31, 2006, 2005 | ||||||
Notes to Consolidated Financial Statements | ||||||
2. | Consolidated Financial Statement Schedules | |||||
Financial Statement Schedules for which provision is made in the applicable accounting regulations of the Securities and Exchange Commission have been excluded, as they are not required under the related instructions or the information required has been included in the Company's Consolidated Financial Statements. | ||||||
3. | Exhibits |
| Exhibit Number | Description of Exhibit | |
|---|---|---|
| 3.1 | Amended and Restated Certificate of Incorporation of the Company (incorporated by reference to Exhibit 3.1 to the Company's Registration Statement on Form S-1 (Registration No. 333-48399)). | |
3.2 | Bylaws of the Company (incorporated by reference to Exhibit 3.2 to the Company's Registration Statement on Form S-1 (Registration No. 333-48399)). | |
4.1 | Specimen Stock Certificate (incorporated by reference to Exhibit 4.1 to the Company's Registration Statement on Form S-1 (Registration No. 333-48399)). | |
4.2 | Amended and Restated Certificate of Incorporation and Bylaws of the Company (incorporated by reference to Exhibit 4.2 to the Company's Registration Statement on Form S-1 (Registration No. 333-48399)). | |
10.1 | Credit Agreement, dated June 6, 2001, among the Company as Borrower, J.P. Morgan Chase Bank (formerly known as The Chase Manhattan Bank) as Administrative Agent and Issuing Bank, and Compass Bank as Syndication Agent (incorporated by reference to Exhibit 10.1 of the Current Report on Form 8-K filed June 8, 2001). | |
10.2 | Second Amendment to Credit Agreement effective October 31, 2001 among Carreker Corporation as Borrower, J.P. Morgan Chase Bank (formerly known as The Chase Manhattan Bank) as Administrative Agent and Issuing Bank, and Compass Bank as Syndication Agent (incorporated by reference to Exhibit 10.1 of the Quarterly Report on Form 10-Q filed December 14, 2001). | |
10.3 | Third Amendment to Credit Agreement effective July 31, 2002 among Carreker Corporation as Borrower, J.P. Morgan Chase Bank (formerly known as The Chase Manhattan Bank) as Administrative Agent and Issuing Bank, and Compass Bank as Syndication Agent (incorporated by reference to Exhibit 10.17 to the Company's Annual Report on Form 10-K for the fiscal year ended January 31, 2003). | |
10.4 | Fourth Amendment to Credit Agreement effective July 31, 2003 among Carreker Corporation as Borrower, J.P. Morgan Chase Bank (formerly known as The Chase Manhattan Bank) as Administrative Agent and Issuing Bank, and Comerica Bank as Syndication Agent (incorporated by reference to Exhibit 10.1 of the Quarterly Report on Form 10-Q filed September 11, 2003). | |
10.5 | Office Lease between Granite Tower, Ltd. And the Company dated as of March 31, 1999 (incorporated by reference to Exhibit 10.26 of the Annual Report on Form 10-K for fiscal year ended January 31, 1999). | |
10.6 | Office Lease between Granite Tower, Ltd. And the Company dated August 31, 1999 (incorporated by reference to Exhibit 10.16 of the Annual Report on Form 10-K for fiscal year ended January 31, 2000). | |
†10.7 | Carreker Corporation Third Amended and Restated 1994 Long Term Incentive Plan (incorporated by reference to Appendix B to the Company's Definitive Proxy Statement filed on May 30, 2001). | |
†10.8 | Carreker Corporation Director Stock Option Plan (incorporated by reference to Appendix C to the Company's Definitive Proxy Statement filed on May 30, 2001). | |
10.9 | Form of Indemnification Agreement between the Company and its Officers (incorporated by reference to Exhibit 10.6 to the Company's Annual Report on Form 10-K for the fiscal year ended January 31, 2003). | |
10.10 | Form of Indemnification Agreement between the Company and its Directors (incorporated by reference to Exhibit 10.7 to the Company's Annual Report on Form 10-K for the fiscal year ended January 31, 2003). | |
Agreement and Release dated November 2, 2001 by and between the Company and Pegasystems, Inc. (incorporated by reference to Exhibit 10.10 to the Company's Annual Report on Form 10-K for fiscal year ended January 31, 2002). | ||
† | Employment Agreement dated January 31, 1997 between the Company and John D. Carreker, Jr. (incorporated by reference to Exhibit 10.1 to the Company's Registration Statement on Form S-1 (Registration No. 333-48399)) | |
† | Employment Agreement dated October 6, 2003 between the Company and Lisa Peterson (incorporated by reference to Exhibit 10.1 | |
Employment Agreement dated November 15, 2004 between the Company and Suzette L. | ||
†10.15 | Form of Restricted Stock Agreement between the Company and its Employees (incorporated by reference to Exhibit 10.1 to the Company's Quarterly Report on Form 10-Q filed June 8, 2005). | |
†10.16 | Form of Restricted Stock Agreement for Executive Officers (incorporated by reference to Exhibit 10.2 to the Company's Quarterly Report on Form 10-Q filed December 7, 2005). | |
†10.17 | Form of Stock Option Agreement for Executive Officers (incorporated by reference to Exhibit 10.1 to the Company's Quarterly Report on Form 10-Q filed December 7, 2005). | |
*21.1 | Subsidiaries of the Company. | |
(a) Carreker, Ltd. (b) Carreker Holdings Australia Pty, Ltd. (c) Carreker Canada, Inc. (d) Carretek LLC (e) Carreker SAS (f) Mastek Carreker Pvt. Limited | ||
*23.1 | Consent of Ernst & Young LLP, Independent Registered Public Accounting Firm. | |
*24.1 | Power of Attorney (included on first signature page). | |
*31.1 | Certification Pursuant to Section 302 of the Sarbanes-Oxley Act of 2002 | |
*31.2 | Certification Pursuant to Section 302 of the Sarbanes-Oxley Act of 2002 | |
*32.1 | Certification Pursuant to 18 U.S.C. Section 1350, as Adopted Pursuant to Section 906 of the Sarbanes-Oxley Act of 2002 | |
*32.2 | Certification Pursuant to 18 U.S.C. Section 1350, as Adopted Pursuant to Section 906 of the Sarbanes-Oxley Act of 2002 |
KNOW ALL MEN BY THESE PRESENTS that each of Carreker Corporation, a Delaware corporation, and the undersigned directors and officers of Carreker Corporation hereby constitutes and appoints John D. Carreker, Jr. and Lisa K. Peterson, or any one of them, its or his true and lawful attorney-in-fact and agent, for it or him and in its or his name, place and stead, in any and all capacities, with full power to act alone, to sign any and all amendments to this Report, and to file each such amendment to the Report, with all exhibits thereto, and any and all other documents in connection therewith, with the Securities and Exchange Commission, hereby granting unto said attorney-in-fact and agent full power and authority to do and perform any and all acts and things requisite and necessary to be done in and about the premises as fully to all intents and purposes as it or he might or could do in person, hereby ratifying and confirming all that said attorney-in-fact and agent may lawfully do or cause to be done by virtue hereof.
Pursuant to the requirements of Section 13 or 15(d) of the Securities Exchange Act of 1934, the Company has duly caused this Report to be signed on its behalf by the undersigned, thereunto duly authorized.
| CARREKER CORPORATION | |||
By: | /s/ JOHN D. CARREKER, JR. John D. Carreker, Jr. Chairman of the Board and Chief Executive Officer | ||
Dated: April 11, 2005May 2, 2006
Pursuant to the requirements of the Securities Exchange Act of 1934, this Report has been signed below by the following persons on behalf of the Company in the capacities indicated on April 11, 2005.May 2, 2006.
| Signatures | Title | |
|---|---|---|
| /s/ JOHN D. CARREKER, JR. John D. Carreker, Jr. | Chairman of the Board and Chief Executive Officer (Principal Executive Officer) | |
/s/ LISA K. PETERSON Lisa K. Peterson | Executive Vice President and Chief Financial Officer (Principal Financial and Accounting Officer) | |
/s/ JAMES D. CARREKER James D. Carreker | Director | |
/s/ J. COLEY CLARK J. Coley Clark | Director | |
Webb Edwards | Director | |
/s/ JAMES R. ERWIN James R. Erwin | Director | |
/s/ DONALD L. HOUSE Donald L. House | ||
Director | ||
/s/ RICHARD R. LEE, JR. Richard R. Lee, Jr. | Director | |
/s/ DAVID K. SIAS David K. Sias | Director | |
/s/ | ||
Gregory B. Tomlinson | Director | |
Jeffrey D. Watkins | Director |