

QuickLinks-- Click hereUse these links to rapidly navigate through thisreview the document
Table of Contents
TABLE OF CONTENTS
UNITED STATES
SECURITIES AND EXCHANGE COMMISSION
Washington, D.C. 20549
FORM 10-K
| ý | ANNUAL REPORT PURSUANT TO SECTION 13 OR 15(d) OF THE SECURITIES EXCHANGE ACT OF 1934 | |
For the fiscal year ended December 31, | ||
OR | ||
o | TRANSITION REPORT PURSUANT TO SECTION 13 OR 15(d) OF THE SECURITIES EXCHANGE ACT OF 1934 | |
For the transition period from to | ||
Commission File No. 1-2217
(Exact name of Registrant as specified in its charter)
| DELAWARE (State or other jurisdiction of incorporation or organization) | 58-0628465 (IRS Employer Identification No.) | |
One Coca-Cola Plaza Atlanta, Georgia (Address of principal executive offices) | 30313 (Zip Code) |
Registrant's telephone number, including area code: (404) 676-2121
Securities registered pursuant to Section 12(b) of the Act:
Title of each class | Name of each exchange on which registered | |
|---|---|---|
| COMMON STOCK, $0.25 PAR VALUE | NEW YORK STOCK EXCHANGE |
Securities registered pursuant to Section 12(g) of the Act: None
Indicate by check mark if the Registrant is a well-known seasoned issuer, as defined in Rule 405 of the Securities Act. Yes ý No o
Indicate by check mark if the Registrant is not required to file reports pursuant to Section 13 or Section 15(d) of the Exchange Act. Yes o No ý
Indicate by check mark whether the Registrant (1) has filed all reports required to be filed by Section 13 or 15(d) of the Securities Exchange Act of 1934 during the preceding 12 months and (2) has been subject to such filing requirements for the past 90 days. Yes ý No o
Indicate by check mark whether the Registrant has submitted electronically and posted on its corporate Web site, if any, every Interactive Data File required to be submitted and posted pursuant to Rule 405 of Regulation S-T during the preceding 12 months (or for such shorter period that the Registrant was required to submit and post such files). Yes ý No o
Indicate by check mark if disclosure of delinquent filers pursuant to Item 405 of Regulation S-K is not contained herein, and will not be contained, to the best of Registrant's knowledge, in definitive proxy or information statements incorporated by reference in Part III of this Form 10-K or any amendment to this Form 10-K. o
Indicate by check mark whether the Registrant is a large accelerated filer, an accelerated filer, a non-accelerated filer, or a non-accelerated filer.smaller reporting company. See definitionthe definitions of "large accelerated filer," "accelerated filer" or "large accelerated filer"and "smaller reporting company" in Rule 12b-2 of the Exchange Act. (Check one):
| Large accelerated filer ý | Accelerated filer o | Non-accelerated filer o | Smaller reporting company o | |||
| (Do not check if a smaller reporting company) | ||||||
Indicate by check mark if the Registrant is a shell company (as defined in Rule 12b-2 of the Exchange Act). Yes o No ý
The aggregate market value of the common equity held by non-affiliates of the Registrant (assuming for these purposes, but without conceding, that all executive officers and Directors are "affiliates" of the Registrant) as of June 30, 2006,July 3, 2009, the last business day of the Registrant's most recently completed second fiscal quarter, was $95,705,925,512$107,556,224,589 (based on the closing sale price of the Registrant's Common Stock on that date as reported on the New York Stock Exchange).
The number of shares outstanding of the Registrant's Common Stock as of February 20, 200722, 2010 was 2,315,288,508.2,305,123,938.
DOCUMENTS INCORPORATED BY REFERENCE
Portions of the Company's Proxy Statement for the Annual Meeting of Shareowners to be held on April 18, 2007,21, 2010, are incorporated by reference in Part III.
| | | Page | ||||
|---|---|---|---|---|---|---|
Forward-Looking Statements | ||||||
Part I | ||||||
Item | Business | 1 | ||||
Item 1A. | Risk Factors | 12 | ||||
Item 1B. | Unresolved Staff Comments | 19 | ||||
Item 2. | Properties | 20 | ||||
Item 3. | Legal Proceedings | 20 | ||||
Item 4. | Submission of Matters to a Vote of Security Holders | 22 | ||||
Item X. | Executive Officers of the Company | 22 | ||||
Part II | ||||||
Item 5. | Market for Registrant's Common Equity, Related Stockholder Matters and Issuer Purchases of Equity Securities | |||||
25 | ||||||
Item 6. | Selected Financial Data | 28 | ||||
Item 7. | Management's Discussion and Analysis of Financial Condition and Results of Operations | 28 | ||||
Item 7A. | Quantitative and Qualitative Disclosures About Market Risk | 65 | ||||
Item 8. | Financial Statements and Supplementary Data | 66 | ||||
Item 9. | Changes in and Disagreements with Accountants on Accounting and Financial Disclosure | 128 | ||||
Item 9A. | Controls and Procedures | 128 | ||||
Item 9B. | Other Information | 128 | ||||
Part III | ||||||
Item 10. | Directors, Executive Officers and Corporate Governance | |||||
128 | ||||||
Item 11. | ||||||
Executive Compensation | 129 | |||||
Item 12. | Security Ownership of Certain Beneficial Owners and Management and | 129 | ||||
Item 13. | Certain Relationships and Related Transactions, and Director Independence | 129 | ||||
Item 14. | Principal Accountant Fees and Services | 129 | ||||
Part IV | ||||||
Item 15. | Exhibits and Financial Statement Schedules | |||||
130 | ||||||
Signatures | 139 | |||||
This report contains information that may constitute "forward-looking statements." Generally, the words "believe," "expect," "intend," "estimate," "anticipate," "project," "will" and similar expressions identify forward-looking statements, which generally are not historical in nature. However, the absence of these words or similar expressions does not mean that a statement is not forward-looking. All statements that address operating performance, events or developments that we expect or anticipate will occur in the future—future — including statements relating to volume growth, share of sales and earnings per share growth, and statements expressing general views about future operating results—results — are forward-looking statements. Management believes that these forward-looking statements are reasonable as and when made. However, caution should be taken not to place undue reliance on any such forward-looking statements because such statements speak only as of the date when made. Our Company undertakes no obligation to publicly update or revise any forward-looking statements, whether as a result of new information, future events or otherwise.otherwise, except as required by law. In addition, forward-looking statements are subject to certain risks and uncertainties that could cause actual results to differ materially from our Company's historical experience and our present expectations or projections. These risks and uncertainties include, but are not limited to, those described in Part I, "Item 1A. Risk Factors" and elsewhere in this report and those described from time to time in our future reports filed with the Securities and Exchange Commission.
In this report, the terms "The Coca-Cola Company," "Company," "we," "us" and "our" mean The Coca-Cola Company and all entities included in our consolidated financial statements.
General
The Coca-Cola Company is the world's leading owner and marketer of nonalcoholic beverage brands and the world's largest manufacturer, distributor and marketer of nonalcoholic beverage concentrates and syrups in the world.used to produce nonalcoholic beverages. We own or license and market more than 500 nonalcoholic beverage brands, primarily sparkling beverages but also a variety of still beverages such as waters, enhanced waters, juices and juice drinks, ready-to-drink teas and coffees, and energy and sports drinks. Finished beverage products bearing our trademarks, sold in the United States since 1886, are now sold in more than 200 countries. Along with Coca-Cola, which is recognized as the world's most valuable brand, we own and market four of the world's top five nonalcoholic sparkling beverage brands, including Diet Coke, Fanta and Sprite. In this report, the terms "Company," "we," "us" or "our" mean The Coca-Cola Company and all entities included in our consolidated financial statements.
Our business is nonalcoholic beverages—principally sparkling beverages, but also a variety of still beverages. We manufacture beverage concentrates and syrups, which we sell to authorized bottling and canning operations (to which we typically refer as our "bottlers" or our "bottling partners") who use the concentrates and syrups to produce finished beverage products. We also manufacture, or authorize bottling partners to manufacture, fountain wholesalers and some fountain retailers, as well as some finished beverages,syrups, which we sell primarily to distributors. Our Company ownsfountain retailers such as restaurants and convenience stores which use the fountain syrups to produce finished beverages for immediate consumption, or licenses more than 400 brands, including dietto fountain wholesalers or bottlers, which in turn sell and lightdistribute the fountain syrups to fountain retailers. In addition, we manufacture certain finished beverages, waters, juicesuch as juices and juice drinks teas, coffees, and energywater products, which we sell to retailers directly or through wholesalers or other distributors, including bottling partners.
While most of our branded beverage products are manufactured, sold and sports drinks.distributed by independently owned and managed bottling partners, from time to time we do acquire or take control of bottling or canning operations, often, but not always, in underperforming markets where we believe we can use our resources and expertise to improve performance. In addition, we have noncontrolling ownership interests in numerous beverage joint ventures, bottling partners and canning operations, although mostemerging beverage companies.
We make our branded beverage products available to consumers throughout the world through our network of these operations are independently ownedbottling partners, distributors, wholesalers and managed.retailers — the world's largest beverage distribution system.
We were incorporated in September 1919 under the laws of the State of Delaware and succeeded to the business of a Georgia corporation with the same name that had been organized in 1892.
Our Company is one of numerous competitors in the commercial beverages market. Of the approximately 5254 billion beverage servings of all types consumed worldwide every day, beverages bearing trademarks owned by or licensed to us account for more than 1.4approximately 1.6 billion.
We believe that our success depends on our ability to connect with consumers by providing them with a wide variety of choices to meet their desires, needs and lifestyle choices. Our success further depends on the ability of our people to execute effectively, every day.
Our goal is to use our Company's assets—assets — our brands, financial strength, unrivaled distribution system, global reach and the talent and strong commitment of our management and employees—associates — to become more competitive and to accelerate growth in a manner that creates value for our shareowners.
Operating Segments
The Company's operating structure is the basis for our Company's internal financial reporting. As of December 31, 2006,2009, our operating structure included the following operating segments, the first sevensix of which are sometimes referred to as "operating groups" or "groups:""groups":
Our operating structure as of December 31, 2006, reflected changes we made during the first quarter of 2006, primarily to establish a separate internal organization for our consolidated bottling operations and our unconsolidated bottling investments. As a result of such changes, we began reporting Bottling Investments as a new operating segment beginning with the first quarter of 2006.
Effective January 1, 2007, we combined the Eurasia and Middle East Division, and the Russia, Ukraine and Belarus Division, both of which were previously included in the North Asia, Eurasia and Middle East operating segment, with the India Division, previously included in the East, South Asia and Pacific Rim operating segment, to form the Eurasia operating segment; and we combined the China Division and the Japan Division, previously included in the North Asia, Eurasia and Middle East operating segment, with the remaining East, South Asia and Pacific Rim operating segment to form the Pacific operating segment. As a result, beginning with the first quarter of 2007, we will report the following operating segments: Africa; Eurasia; European Union; Latin America; North America; Pacific; Bottling Investments; and Corporate.
Except to the extent that differences among operating segments are material to an understanding of our business taken as a whole, the description of our business in this report is presented on a consolidated basis.
For financial information about our operating segments and geographic areas, refer to Note 6 and Note 2018 of Notes to Consolidated Financial Statements set forth in Part II, "Item 8. Financial Statements and Supplementary Data" of this report, incorporated herein by reference. For certain risks attendant to our non-U.S. operations, refer to "Item 1A. Risk Factors," below.
Products and Distribution
Our Company manufactures and sells beverage concentrates, sometimes referred to as "beverage bases," and syrups, including fountain syrups, and some finished beverages.
As used in this report:
We sell the concentrates and syrups for bottled and canned sparkling and flavored still beverages to authorized bottling and canning operations. In addition to concentrates and syrups for sparkling beverages and flavored still beverages, we also sell concentrates (in powder form) for purified water products such as Dasani to authorizedOur bottling operations.
Authorized bottlers and cannerspartners either combine our syrups with sparkling water or combine our concentrates with sweeteners (depending on the product), still water andand/or sparkling water to produce finished sparkling beverages. The finished sparkling beverages are packaged in authorized containers bearing our trademarks—trademarks or trademarks licensed to us — such as cans and refillable and nonrefillable glass and plastic bottles ("bottle/can products")—and are then sold to retailers ("bottle/can retailers")directly or, in some cases, wholesalers.through wholesalers or bottlers.
For our fountain products in the United States, we manufacture fountain syrups and sell them to fountain retailers or to authorized fountain wholesalers and someor bottling partners who resell the fountain syrups to fountain retailers. TheIn the United States, we authorize wholesalers are authorized to sell the Company'sresell our fountain syrups by athrough nonexclusive appointment from usappointments that neither restrictsrestrict us in setting the prices at which we sell fountain syrups to the wholesalers nor restrictsrestrict the territoryterritories in which the wholesalers may resell in the United States. Outside the United States, fountain syrups typically are manufactured by authorized bottlers from concentrates sold to them by the Company. The bottlers then typically sell the fountain syrups to wholesalers or directly to fountain retailers.
Finished beverages manufactured by us includeWe also manufacture a variety of sparklingstill beverages, such as juices and still beverages. We sell most of these beverages to authorized bottlers or distributors, who in turn sell these products to retailers or, in some cases, wholesalers. We manufacture and sell juice and juice-drink productsdrinks and certain water products, which we sell to retailers and wholesalers in the United States and numerous other countries, both directly and through a network of business partners, including certain Coca-Cola bottlers.bottling partners. In addition, our Company-owned or consolidated bottling operations manufacture finished products, primarily sparkling beverages, which they sell to other bottlers, distributors or wholesalers, or directly to retailers.
Our beverage products include Coca-Cola, Coca-Cola Classic, caffeine free Coca-Cola, caffeine free Coca-Cola Classic, Cherry Coke, Diet Coke (sold under the trademarkas Coca-Cola Light in many countries other than the United States), caffeine free Diet Coke, Diet Coke Sweetened with Splenda, Diet Coke with Lime, Diet Cherry Coke, Black Cherry Vanilla Diet Coke, Coca-Cola Zero (sold under the trademarkas Coke Zero in some countries), Fanta, brand sparkling beverages, Sprite, Diet Sprite/Sprite Zero (sold under the trademarkas Sprite Light in many countries other than the United States), Sprite Remix, Pibb Xtra, Mello Yello, Tab, Fresca brandand Barq's sparkling beverages, Barq's, Powerade, Minute Maid brand sparkling beverages, Aquarius, Sokenbicha, Ciel, Bonaqa/Bonaqua, Dasani, Dasani brand flavored waters, Georgia ready-to-drink coffees (sold primarily in Japan), Lift, Thums Up, Kinley, Eight O'Clock, Qoo, Mother, Vault, NOS, Full Throttle and other products developed for specific countries (including Georgia brand ready-to-drink coffees).countries. Our beverage products also include enhanced water products such as glacéau vitaminwater and smartwater, Fuze fortified beverages, tea-flavored beverages and fruit drinks sold in the United States, and Matte Leao herbal beverages sold in Brazil. In many countries (excluding the United States, among others), our Company's beverage products also include Schweppes, Canada Dry, Dr Pepper and Crush. Our Company produces, distributes and markets juice and juice-drink products, including Minute Maid Premium juicejuices and juice drinks, Simply juices and juice drinks, Cappy juices, Odwalla nourishing health beverages, Five Alive refreshment beverages and Bacardi mixers concentrate (manufactured and marketed under license agreements from Bacardi & Company Limited) and Hi-C ready-to-serve juice drinks.. We have a license to manufacture and sell concentrates for Seagram's mixers, a line of sparkling drinks,beverages, in the United States and certain other countries. Our Company is the exclusive master
distributor of Evian bottled waterIn addition, in the United States we market Nestea and Canada, andEnviga products under a sublicense agreement with a subsidiary of Rockstar, an energy drink, in most of the United States and in Canada.Nestlé S.A. ("Nestlé"). Multon, a Russian juice business ("Multon") operated as a joint venture with Coca-Cola Hellenic Bottling Company S.A. ("Coca-Cola HBC"Hellenic"), manufactures, markets and sells juice products under various trademarks, including Dobriy, Rich and Nico Biotime, in Russia, Ukraine and Belarus. Beverage Partners Worldwide ("BPW"), the Company's joint venture with Nestlé S.A. ("Nestlé") and certain of its subsidiaries,, markets ready-to-drink tea products under thevarious trademarks, Enviga, Gold Peak,including Nestea, Belté,Enviga, Yang Guang, Nagomi, Heaven and Earth, Frestea, Ten Ren, Modern Tea Workshop, Café Zu, ShizenYuan Ye, Tian Yu Di (Heaven & Earth), Nestea Vitao and Tian Tey,Nestea Cool, in various markets worldwide, other than the United States and ready-to-drink coffee productsJapan. We manufacture, market and sell packaged juices, nectars and fruit-flavored beverages under the trademarks Nescafédel Valle trademark through joint ventures with our bottling partners in Mexico and Brazil. Ilko Coffee International, S.r.l. ("Ilko"), Taster's Choicea joint venture with illycaffè S.p.A., and Georgia Club.Ilko Hellenic
Partners GmbH, a joint venture between Ilko and Coca-Cola Hellenic, manufacture, market and sell ready-to-drink coffees under the illy issimo brand.
Consumer demand determines the optimal menu of Company product offerings. Consumer demand can vary from one locale to another and can change over time within a single locale. Employing our business strategy, and with special focus on core brands, our Company seeks to build its existing brands and, at the same time, to broaden its historical family of brands, products and services in order to create and satisfy consumer demand locale by locale.
OurDuring 2009, our Company introduced a variety of new brands, brand extensions and new beverage products in 2006.products. Among numerous examples, in North America, we launched Cascal, a fermented fruit beverage, in the CompanyUnited States, and glacéau smartwater in Canada. In Latin America, we launched Hugo, a combination of fruit juice and milk protein offered in several flavors, in Chile, and Valle Frut, a fruit pulp juice beverage in Mango, Guayaba, Strawberry, Tamarindo, Orange and Citrus Punch flavors, in Brazil, Colombia, Ecuador, Costa Rica, Mexico, Nicaragua and Panama. In addition, during 2009, we expanded our water product offerings in Latin America by acquiring, jointly with Coca-Cola Blak, a new FEMSA S.A.B. de C.V. ("Coca-Cola and coffee fusion beverage designed to appeal to adult consumers, Black Cherry Vanilla Coca-Cola and Black Cherry Vanilla Diet Coke, Vault Zero, Tab Energy, Full Throttle Fury, Simply Lemonade and Limeade. In collaboration with Godiva Chocolatier, Inc.FEMSA"), the Company alsoBrisa water business in Colombia and by acquiring two water brands, Mineragua and Vital, from our bottling partner in Bolivia. In Europe, we launched a new line of premium blended indulgent beverages called Godiva Belgian Blends. BPW, our joint venture with Nestlé, launched both Enviga,sparkling beverage, Schuss Gaseosa, in Spain, and Lift Pear, a sparkling green tea product,beverage with real fruit juice, in Poland and Gold Peak, a premium ready-to-drink iced teaBulgaria. In Africa and Eurasia, new launches included Schweppes Dark Malt Beverage in five flavors. The Company introduced Dasani Sparkling in KenyaGhana; four new Mazoe dilutable juice drinks (in Orange, Naartjie, Peach and Mauritius; Five Alive and Coca-Cola Light in Kenya; Powerade Balance, Five Alive, Fanta Free and Bonaqua flavored watersLime) in South Africa; Cappy Lemonade, a premium lemonade, in Turkey; and Burn in Nigeria, Ghana and Morocco. We introduced Karada Meguri Cha in Japan and Healthworks in China. Multon, our joint ventureDobry Lemonade, a line of sparkling beverages with Coca-Cola HBC, introduced new Diva juicetraditional Russian flavors, in Russia. In addition,Pacific, we launched Cokea new water brand in Japan, I LOHAS, which is available in a polyethylene terephthalate ("PET") bottle that can be twisted and crushed easily into a compact size for recycling; and in China, we launched Minute Maid Pulpy Super Milky, which fuses fruit juice, milk powder, whey protein and coconut bits. We also expanded our glacéau brands internationally in 2009 with the launch of vitaminwater in South Africa, France, South Korea, Japan, Belgium, Portugal, Hong Kong, China, Sweden and Macau.
In keeping with our commitment to sustainability, during 2009, we launched our innovative PlantBottle packaging, a PET bottle made partially from plants. The PlantBottle packaging, like our existing PET bottles, is 100 percent recyclable. Coca-Cola, Coca-Cola Light and Coca-Cola Zero in Australia500 milliliter and Korea, Haru Tea2 liter sizes are now available in Korea,PlantBottle packaging to consumers in Denmark, and Schweppes Clear Lemonadecertain products are available in Serbia, RomaniaPlantBottle packaging in selected markets in Western Canada and Bulgaria.Western United States. In Europe, the Company launchedaddition, in 2009, we unveiled our new Coca-Cola Zero/Coke ZeroFreestyle fountain dispenser in selected locations in the United Kingdom, Germany, Spain, Norway, Belgium, the NetherlandsStates. Coca-Cola Freestyle allows consumers to select from more than 100 different regular and Luxembourg; Burn in Norway; and Chaudfontaine (alow-calorie branded beverages, including a variety of still and sparkling water) in Belgium, the Netherlands and Luxembourg. In Latin America, the products launched included Minute Maid Forte, Ciel Naturae (a sparkling flavored water) and Coca-Cola Light Caffeine Free. The Company unveiled Far Coast, a new brand of premium brewed beverages, and Chaqwa, a line of brewed beverages for quick service restaurants and convenience stores, in Canada and Singapore.beverages.
Our Company measuresWe measure the volume of Company beverage products sold in two ways: (1) unit cases of finished products and (2) gallons.concentrate sales. As used in this report, "unit case" means a unit of measurement equal to 192 U.S. fluid ounces of finished beverage (24 eight-ounce servings); and "unit case volume" means the number of unit cases (or unit case equivalents) of Company beverage products directly or indirectly sold by the Company and its bottling partners ("Coca-Cola(the "Coca-Cola system") to customers. Unit case volume primarily consists of beverage products bearing Company trademarks. Also included in unit case volume are certain products licensed to, or distributed by, our Company, and brands owned by Coca-Cola system bottlers for which our Company provides marketing support and from the sale of which it derives income.we derive economic benefit. Such products licensed to, or distributed by, our Company orand brands owned by Coca-Cola system bottlers account for a minimal portion of our total unit case volume. In addition, unit case volume includes sales by joint ventures in which the Company is a partner.has an equity interest. Although most of our Company's revenues are not based directly on unit case volume, we believe unit case volume is one of the measures of the underlying strength of the Coca-Cola system because it measures trends at the consumer level. The unit case volume numbers used in this report are derived based on estimates received by the Company from its bottling partners and distributors. As used in this report, "gallon" means a unitConcentrate sales volume represents the amount of measurement for concentrates (sometimes referred to as "beverage bases"),and syrups, finished beverages and powders (in all cases expressed in equivalent gallons of syrup)unit cases) sold by, ouror used in finished beverages sold by, the Company to its bottling partners or other customers. Most of our revenues are based on gallonconcentrate sales, a primarily "wholesale"wholesale activity. Unit case volume and gallonconcentrate sales growth
rates are not necessarily equal during any given period. ItemsFactors such as seasonality, bottlers' inventory practices, supply point changes, timing of price increases, new product introductions and changes in product mix can impact unit case volume and gallonconcentrate sales and can create differences between unit case volume and gallonconcentrate sales growth rates.
In 2006,addition to the items mentioned above, the impact of unit case volume from certain joint ventures, in which the Company has an equity interest, but to which the Company does not sell concentrates or syrups, may give rise to differences between unit case volume and syrupsconcentrate sales growth rates.
The Coca-Cola system sold approximately 24.4 billion, 23.7 billion and 22.7 billion unit cases of our products in 2009, 2008 and 2007, respectively. Sparkling beverages represented approximately 77 percent, 78 percent and 80 percent of our worldwide unit case volume for beverages bearing the trademark "Coca-Cola" or including the trademark "Coke" ("2009, 2008 and 2007, respectively. Trademark Coca-Cola Trademark Beverages")Beverages accounted for approximately 5551 percent, 51 percent and 53 percent of the Company's total gallon sales.our worldwide unit case volume for 2009, 2008 and 2007, respectively.
In 2006, gallon2009, concentrate sales in the United States ("U.S. gallonconcentrate sales") represented approximately 2622 percent of the Company's worldwide gallonconcentrate sales. Approximately 5451 percent of U.S. gallonconcentrate sales for 20062009 was attributable to sales of beverage concentrates and syrups to 7674 authorized bottler ownership groups in 393 licensed territories. Those bottlers prepare and sell finished beverages bearing our trademarksCompany Trademark Beverages for the food store and vending machine distribution channels and for other distribution channels supplying products for home and immediate consumption. Approximately 34 percent of 20062009 U.S. gallonconcentrate sales was attributable to fountain syrups sold to fountain retailers and to 507451 authorized fountain wholesalers, some of which are authorized bottlers. The remaining approximately 1215 percent of 20062009 U.S. gallonconcentrate sales was attributable to sales by the Company of finished beverages, including juices and juice and juice-drinkdrink products and certain water products. Coca-Cola Enterprises Inc., including its bottling subsidiaries and divisions ("CCE"), accounted for approximately 5147 percent of the Company's U.S. gallonconcentrate sales in 2006.2009. At December 31, 2006,2009, our Company held an ownership interest of approximately 3534 percent in CCE, which is the world's largest bottler of Company Trademark Beverages.
In 2006, gallon2009, concentrate sales outside the United States represented approximately 7478 percent of the Company's worldwide gallonconcentrate sales. The countries outside the United States in which our gallonconcentrate sales were the largest in 20062009 were Mexico, China, Brazil China and Japan, which together accounted for approximately 2731 percent of our worldwide gallonconcentrate sales. Approximately 9089 percent of non-U.S. unit case volume for 20062009 was attributable to sales of beverage concentrates and syrups to authorized bottlers together with sales by the Company of finished beverages, other than juice and juice-drink products, in 535464 licensed territories. Approximately 5 percent of 20062009 non-U.S. unit case volume was attributable to fountain syrups. The remaining approximately 56 percent of 20062009 non-U.S. unit case volume was attributable to juice and juice-drink products.
In addition to conducting our own independent advertising and marketing activities, we may provide promotional and marketing services or funds to our bottlers. In most cases, we do this on a discretionary basis under the terms of commitment letters or agreements, even though we are not obligated to do so under the terms of the bottling or distribution agreements between our Company and the bottlers. Also, on a discretionary basis in most cases, our Company may develop and introduce new products, packages and equipment to assist its bottlers. Likewise, in many instances, we provide promotional and marketing services and/or funds and/or dispensing equipment and repair services to fountain and bottle/can retailers, typically pursuant to marketing agreements. The aggregate amount of funds provided by our Company to bottlers, resellers or other customers of our Company's products, principally for participation in promotional and marketing programs, was approximately $3.8$4.5 billion in 2006.2009.
Bottler's Agreements and Distribution Agreements
Most of our products are manufactured and sold by our bottling partners. We typically sell concentrates and syrups to our bottling partners, who convert them into finished packaged products which they sell to distributors and other customers. Separate contracts ("Bottler's Agreements") exist between our Company and each of our bottling partners regarding the manufacture and sale of Company products. Subject to specified terms and conditions and certain variations, the Bottler's Agreements generally authorize the bottlers to prepare specified Company Trademark Beverages, to package the same in authorized containers, and to distribute and sell the same in (but, subject to applicable local law, generally only in) an identified territory. The bottler is obligated to
purchase its entire requirement of concentrates or syrups for the designated Company Trademark Beverages from the Company or Company-authorized suppliers. We typically agree to refrain from selling or distributing, or from authorizing third parties to sell or distribute, the designated Company Trademark Beverages throughout the identified territory in the particular authorized containers; however, we typically reserve for ourselves or our designee the right (1) to prepare and package such beverages in such containers in the territory for sale outside the territory, and (2) to prepare, package, distribute and sell such beverages in the territory in any other manner or form. Territorial restrictions on bottlers vary in some cases in accordance with local law.
Being a bottler does not create a legal partnership or joint venture between us and our bottlers. Our bottlers are independent contractors and are not our agents.
The Bottler's Agreements between us and our authorized bottlers in the United States differ in certain respects from those in the other countries in which Company Trademark Beverages are sold. As further discussed below, the principal differences involve the duration of the agreements; the inclusion or exclusion of canned beverage production rights; the inclusion or exclusion of authorizations to manufacture and distribute fountain syrups; in some cases, the degree of flexibility on the part of the Company to determine the pricing of syrups and concentrates; and the extent, if any, of the Company's obligation to provide marketing support.
Outside the United States
The Bottler's Agreements between us and our authorized bottlers outside the United States generally are of stated duration, subject in some cases to possible extensions or renewals of the term of the contract. Generally, these contracts are subject to termination by the Company following the occurrence of certain designated events. These events include defined events of default and certain changes in ownership or control of the bottler.
In certain parts of the world outside the United States, we have not granted comprehensive beverage production rights to the bottlers. In such instances, we or our authorized suppliers sell Company Trademark Beverages to the bottlers for sale and distribution throughout the designated territory, often on a nonexclusive basis. A majority of the Bottler's Agreements in force between us and bottlers outside the United States authorize the bottlers to manufacture and distribute fountain syrups, usually on a nonexclusive basis.
Our Company generally has complete flexibility to determine the price and other terms of sale of the concentrates and syrups we sell to bottlers outside the United States. In some instances, however, we have agreed or may in the future agree with thea bottler with respect to concentrate pricing on a prospective basis for specified time periods. In some markets, in an effort to allow our Company and our bottling partners to grow together through shared value, aligned incentives and the flexibility necessary to meet consumers' always changing needs and tastes, we worked with our bottling partners to develop and implement an incidence-based pricing model for sparkling and still beverages. Under this model, the concentrate price we charge is impacted by a number of factors, including, but not limited to, bottler pricing, the channels in which the finished products are sold and package mix. Outside the United States, in most cases, we have no obligation to provide marketing support to the bottlers. Nevertheless, we may, at our discretion, contribute toward bottler expenditures for advertising and marketing. We may also elect to undertake independent or cooperative advertising and marketing activities.
Within the United States
In the United States, with certain very limited exceptions, the Bottler's Agreements for Trademark Coca-Cola Trademark Beverages and other cola-flavored beverages have no stated expiration date. Our standard contracts for other sparkling beverage flavors and for still beverages are of stated duration, subject to bottler renewal rights. The Bottler's Agreements in the United States are subject to termination by the Company for nonperformance or upon the occurrence of certain defined events of default that may vary from contract to contract. The "1987 Contract," described below, is terminable by the Company upon the occurrence of certain events, including:
Under the terms of the Bottler's Agreements, bottlers in the United States are authorized to manufacture and distribute Company Trademark Beverages in bottles and cans. However, these bottlers generally are not authorized to manufacture fountain syrups. Rather, as described above, our Company manufactures and sells fountain syrups to authorized fountain wholesalers (including certain authorized bottlers) and some fountain retailers. These wholesalers in turn sell the syrups or deliver them on our behalf to restaurants and other retailers.
In the United States, the form of Bottler's Agreement for cola-flavored sparkling beverages that covers the largest amount of U.S. gallonconcentrate sales (the "1987 Contract") gives us complete flexibility to determine the price and other terms of sale of concentrates and syrups for Company Trademark Beverages. In some instances, we have agreed or may in the future agree with thea bottler with respect to concentrate pricing on a prospective basis for specified time periods. Bottlers operating under the 1987 Contract accounted for approximately 9091.9 percent of our Company's total U.S. gallonconcentrate sales for bottled and canned beverages in 2006,2009, excluding direct sales by the Company of juice and juice-drink products and other finished beverages ("U.S. bottle/can gallonconcentrate sales"). Certain other forms of U.S. Bottler's Agreements, entered into prior to 1987, provide for concentrates or syrups for certain Trademark Coca-Cola Trademark Beverages and other cola-flavored Company Trademark Beverages to be priced pursuant to a stated formula. Bottlers accounting for approximately 9.87.8 percent of U.S. bottle/can gallonconcentrate sales in 20062009 have contracts for certain Trademark Coca-Cola Trademark Beverages and other cola-flavored Company Trademark Beverages with pricing formulas that generally provide for a baseline price. This baseline price may be adjusted periodically by the Company, up to a maximum indexed ceiling price, and is adjusted quarterly based upon changes in certain sugar or sweetener prices, as applicable. Bottlers accounting for the remaining approximately 0.20.3 percent of U.S. bottle/can gallonconcentrate sales in 20062009 operate under our oldest form of contract, which provides for a fixed price for Coca-Cola syrup used in bottles and cans. This price is subject to quarterly adjustments to reflect changes in the quoted price of sugar.
We have standard contracts with bottlers in the United States for the sale of concentrates and syrups for non-cola-flavored sparkling beverages and certain still beverages in bottles and cans;cans, and, in certain cases, for the sale of finished still beverages in bottles and cans. All of these standard contracts give the Company complete flexibility to determine the price and other terms of sale.
In an effort to allow our Company and our bottling partners to grow together through shared value, aligned incentives and the flexibility necessary to meet consumers' always changing needs and tastes, we worked with the majority of our bottling partners to develop and implement an incidence-based pricing model, primarily for sparkling beverages. Under this model, the concentrate price we charge is impacted by a number of factors, including, but not limited to, bottler pricing, the channels in which the finished products are sold and package mix. We expect to use an incidence-based pricing model in 2010 for most of our bottlers operating under the 1987 Contract.
Under the 1987 Contract and most of our other standard beverage contracts with bottlers in the United States, our Company has no obligation to participate with bottlers in expenditures for advertising and marketing. Nevertheless, at our discretion, we may contribute toward such expenditures and undertake independent or cooperative advertising and marketing activities. Some U.S. Bottler's Agreements that predate the 1987 Contract impose certain marketing obligations on us with respect to certain Company Trademark Beverages.
As a practical matter, our Company's ability to exercise its contractual flexibility to determine the price and other terms of sale of its syrups, concentrates and finished beverages under various agreements described above is subject, both outside and within the United States, to competitive market conditions.
Significant Equity Method Investments and Company Bottling Operations
Our Company maintains business relationships with three types of bottlers:
In 2006,2009, bottling operations in which we had no ownership interest produced and distributed approximately 2523 percent of our worldwide unit case volume. We haveDuring 2009, we had equity positions in 5238 unconsolidated bottling, canning and distribution operations for our products worldwide. These cost or equity method investees produced and distributed approximately 5856 percent of our worldwide unit case volume in 2006. Controlled and2009. Company-owned or consolidated bottling operations produced and distributed approximately 711 percent of our worldwide unit case volume in 2006.2009. The remaining approximately 10 percent of our worldwide unit case volume in 20062009 was produced and distributed by our fountain operations and our juice and juice drink, sports drink and other finished beverage operations.
We make equity investments in selected bottling operations with the intention of maximizing the strength and efficiency of the Coca-Cola system's production, distribution and marketing systemscapabilities around the world. These investments are
intended to result in increases in unit case volume, net revenues and profits at the bottler level, which in turn generate increased gallonconcentrate sales for our Company's concentrate and syrup business. When this occurs, both we and our bottling partners benefit from long-term growth in volume, improved cash flows and increased shareowner value.
The level of our investment generally depends on the bottler's capital structure and its available resources at the time of the investment. Historically, in certain situations, we have viewed it as advantageous to acquire a controlling interest in a bottling operation, often on a temporary basis. Owning such a controlling interest has allowed us to compensate for limited local resources and has enabled us to help focus the bottler's sales and marketing programs and assist in the development of the bottler's business and information systems and the establishment of appropriate capital structures.
In line with our long-term bottling strategy, we may periodically consider options for reducing our ownership interest in a bottler. One such option is to combine our bottling interests with the bottling interests of others to form strategic business alliances. Another option is to sell our interest in a bottling operation to one of our equity method investee bottlers. In both of these situations, our Company continues to participate in the bottler's results of operations through our share of the strategic business alliances' or equity method investees' earnings or losses.
In cases where our investments in bottlers represent noncontrolling interests, our intention is to provide expertise and resources to strengthen those businesses.
Significant investees in which we have noncontrolling ownership interests include the following:
Coca-Cola Enterprises Inc. ("CCE"). Our ownership interest in CCE was approximately 3534 percent at December 31, 2006.2009. CCE is the world's largest bottler of the Company's beverage products.Company Trademark Beverages. In 2006,2009, sales of concentrates, syrups, mineral waters, juices, sweeteners and finished products by the Company to CCE were approximately $5.4$6.5 billion. CCE estimates that the territories in which it markets beverage products to retailers (which include portions of 46 states and the District of Columbia in the United States, the United StatesU.S. Virgin Islands and certain other Caribbean islands, Canada, Great Britain, continental France, the Netherlands, Luxembourg, Belgium and Monaco) contain approximately 7978 percent of the United States population, 98 percent of the population of Canada, and 100 percent of the populations of Great Britain, continental France, the Netherlands, Luxembourg, Belgium and Monaco. In 2006,2009, CCE's net operating revenues were approximately $19.8$21.6 billion. Excluding fountain products, in 2006,2009, approximately 60 percent of the unit case volume of CCE consisted of Trademark Coca-Cola Trademark Beverages,Beverages; approximately 33 percent of its unit case volume consisted of other Company Trademark BeveragesBeverages; and approximately 7 percent of its unit case volume consisted of beverage products of other companies.
Coca-Cola Hellenic Bottling Company S.A. ("Coca-Cola HBC"Hellenic"). At December 31, 2006, ourOur ownership interest in Coca-Cola HBCHellenic was approximately 23 percent.percent at December 31, 2009. Coca-Cola HBCHellenic has bottling and distribution rights, through direct ownership or joint ventures, in Armenia, Austria, Belarus, Bosnia-Herzegovina, Bulgaria, Croatia, Cyprus, the Czech Republic, Estonia, the Former YugoslavianYugoslav Republic of Macedonia, Greece, Hungary, Italy, Latvia, Lithuania, Moldova, Montenegro, Nigeria, Northern Ireland, Poland, Republic of Ireland, Romania, Russia,
Serbia, and Montenegro, Slovakia, Slovenia, Switzerland and Ukraine. Coca-Cola HBCHellenic estimates that the territoriesarea in these 28 countries which it markets beverage products contain approximately 67 percent of the population of Italy and 100 percent of the populations of the other countries named above in which Coca-Cola HBC hasserves through its bottling and distribution rights.rights has a combined population of 560 million people. In 2006,2009, Coca-Cola HBC'sHellenic's net sales of beverage products were approximately $7$10 billion. In 2006,2009, approximately 4442 percent of the unit case volume of Coca-Cola HBCHellenic consisted of Trademark Coca-Cola Trademark Beverages,Beverages; approximately 4953 percent of its unit case volume consisted of other Company Trademark BeveragesBeverages; and approximately 75 percent of its unit case volume consisted of beverage products of Coca-Cola HBCHellenic or other companies.
Coca-Cola FEMSA, S.A.B. de C.V. ("Coca-Cola FEMSA"). Our ownership interest in Coca-Cola FEMSA was approximately 32 percent at December 31, 2006.2009. Coca-Cola FEMSA is a Mexican holding company with bottling subsidiaries in a substantial part of central Mexico, including Mexico City and southeastern Mexico; greater São Paulo, Campinas, Santos, the state of Matto Grosso do Sul, the state of Minas Gerais and part of the state of Goias in Brazil; central Guatemala; most of Colombia; all of Costa Rica, Nicaragua, Panama and Venezuela; and greater Buenos Aires, Argentina. Coca-Cola FEMSA estimates that the territories in which it markets beverage products contain approximately 4847 percent of the population of Mexico, 1625 percent of the population of Brazil, 98 percent of the population of Colombia, 4748 percent of the population of Guatemala, 100 percent of the populations of Costa Rica, Nicaragua, Panama and Venezuela, and 3031 percent of the population of Argentina. In 2006,2009, Coca-Cola FEMSA's net sales of beverage products were approximately $5.2$8 billion. In 2006,2009, approximately 6263 percent of the unit case volume of Coca-Cola FEMSA consisted of Trademark Coca-Cola Trademark Beverages, 34Beverages; approximately 36 percent of its unit case volume
consisted of other Company Trademark BeveragesBeverages; and 4approximately 1 percent of its unit case volume consisted of beverage products of Coca-Cola FEMSA or other companies.
Coca-Cola Amatil Limited ("Coca-Cola Amatil"). At December 31, 2006, ourOur Company's ownership interest in Coca-Cola Amatil was approximately 32 percent.30 percent at December 31, 2009. Coca-Cola Amatil has bottling and distribution rights, through direct ownership or joint ventures, in Australia, New Zealand, Fiji, Papua New Guinea Indonesia and South Korea.Indonesia. Coca-Cola Amatil estimates that the territories in which it markets beverage products contain 100 percent of the populations of Australia, New Zealand, Fiji South Korea and Papua New Guinea, and 98 percent of the population of Indonesia. In 2006,2009, Coca-Cola Amatil's net sales of beverage products were approximately $3$3.1 billion. In 2006,2009, approximately 5048 percent of the unit case volume of Coca-Cola Amatil consisted of Trademark Coca-Cola Trademark Beverages,Beverages; approximately 4041 percent of its unit case volume consisted of other Company Trademark BeveragesBeverages; and approximately 1011 percent of its unit case volume consisted of beverage products of Coca-Cola Amatil.
Other Interests. BPW, our joint venture with Nestlé and certain of its subsidiaries, is focused upon the ready-to-drink tea and coffee businesses. BPW products were sold in the United States and 63Amatil or other countries during the year ended December 31, 2006. BPW serves as the exclusive vehicle through which our Company and Nestlé participate in the ready-to-drink tea and coffee businesses worldwide, except in Japan. In November 2006, our Company and Nestlé jointly announced an agreement to refocus BPW's activities on black tea beverages and Enviga. The implementation of this agreement, which is subject to certain regulatory approvals, would allow our Company and Nestlé to independently develop, produce and market ready-to-drink coffee and non-black tea-based beverages, other than Enviga. Multon, a Russian juice business operated as a joint venture with Coca-Cola HBC, generated revenues from sales of juice products in Russia, Ukraine and Belarus in 2006.
Seasonality
Sales of our ready-to-drink nonalcoholic beverages are somewhat seasonal, with the second and third calendar quarters accounting for the highest sales volumes. The volume of sales in the beverages business may be affected by weather conditions.
Competition
Our Company competes in the nonalcoholic beverages segment of the commercial beverages industry. Based on internally available data and a variety of industry sources, we believe that, in 2006, worldwide sales of Company products accounted for approximately 10 percent of total worldwide sales of nonalcoholic beverage products. The nonalcoholic beverages segment of the commercial beverages industry is highly competitive, consisting of numerous firms. These include firms that, like our Company, compete in multiple geographic areas, as well as firms that are primarily regional or local in operation. Competitive products include numerous nonalcoholic sparkling beverages; various water products, including packaged, water;flavored and enhanced waters; juices and nectars; fruit drinks and dilutables (including syrups and powdered drinks); coffees and teas; energy and sports and other performance-enhancing drinks; dairy-based drinks; functional beverages; and various other nonalcoholic beverages. These competitive beverages are sold to consumers in both ready-to-drink and not-ready-to-drinkother than ready-to-drink form. In many of the countries in which we do business, including the United States, PepsiCo, Inc., is one of our primary competitors. Other significant competitors include, but are not limited to, Nestlé, Cadbury Schweppes plc,Dr Pepper Snapple Group, Inc., Groupe Danone, and Kraft Foods Inc. and Unilever. In certain markets, our competition includes beer companies. We also compete against numerous regional and local firms and, in various geographic areas in which we operate.some markets, against retailers that have developed their own store or private label beverage brands.
Competitive factors impacting our business include, but are not limited to, pricing, advertising, sales promotion programs, product innovation, increased efficiency in production techniques, the introduction of new packaging, new vending and dispensing equipment, and brand and trademark development and protection.
Our competitive strengths include powerfulleading brands with a high level of consumer acceptance; a worldwide network of bottlers and distributors of Company products; sophisticated marketing capabilities; and a talented group of dedicated employees.associates. Our competitive challenges include strong competition in all geographic regions and, in many countries, a concentrated retail sector with powerful buyers able to freely choose among Company products, products of competitive beverage suppliers and individual retailers' own store-brand beverages.store or private label beverage brands.
Raw Materials
TheWater is a main ingredient in substantially all of our products. While historically we have not experienced significant water supply difficulties, water is a limited resource in many parts of the world and our Company recognizes water availability, quality and the sustainability of that natural resource for both our operations and also the communities where we operate as one of the key challenges facing our business.
In addition to water, the principal raw materials used by our business are nutritive and non-nutritive sweeteners. In the United States, the principal nutritive sweetener is high fructose corn syrup ("HFCS"), a form of sugar, which is available from numerous domestic sources and is historically subject to fluctuations in its market price. The principal nutritive sweetener used by our business outside the United States is sucrose, another form of sugar, which is also available from numerous sources and is historically subject to fluctuations in its market price. Our Company generally has not experienced any difficulties in obtaining its requirements for nutritive sweeteners. In the United States, we
purchase high fructose corn syrupHFCS to meet our and our bottlers' requirements with the assistance of Coca-Cola Bottlers' Sales & Services Company LLC ("CCBSS"). CCBSS is a limited liability company that is owned by authorized Coca-Cola bottlers doing business in the United States. Among other things, CCBSS provides procurement services to our Company for the purchase of various goods and services in the United States, including high fructose corn syrup.HFCS.
The principal non-nutritive sweeteners we use in our business are aspartame, acesulfame potassium, saccharin, cyclamate and sucralose. Generally, these raw materials are readily available from numerous sources. However, our Company purchases aspartame, an important non-nutritive sweetener that is used alone or in combination with other important non-nutritive sweeteners such as saccharin or acesulfame potassium in our low-calorie sparkling beverage products, primarily from The NutraSweet Company and Ajinomoto Co., Inc., which we consider to be our only viableprimary sources for the supply of this product. We currently purchase acesulfame potassium from Nutrinova Nutrition Specialties & Food Ingredients GmbH, which we consider to be our only
viableprimary source for the supply of this product.product, and from two additional suppliers. Our Company generally has not experienced any difficulties in obtaining its requirements for non-nutritive sweeteners.
Our Company sells a number of products sweetened with sucralose, a non-nutritive sweetener. We work closely with Tate & Lyle, our sucralose supplier, to maintain continuity of supply. Although Tate & Lyle is our single source for sucralose, we do not anticipate difficulties in obtaining our requirements for sucralose.
With regard to juice and juice-drink products, citrus fruit, particularly orange juice concentrate, is our principal raw material. The citrus industry is subject to the variability of weather conditions. In particular, freezing weather or hurricanes in central Florida may result in shortages and higher prices for orange juice concentrate throughout the industry. Due to our ability to also source orange juice concentrate from the Southern Hemisphere (particularly from Brazil), we normally have an adequate supply of orange juice concentrate that meets our Company's standards.
Our Company-owned or consolidated bottling and canning operations and our finished products business also purchase various other raw materials including, but not limited to, PET resin, preforms and bottles; glass and aluminum bottles; aluminum and steel cans; plastic closures; aseptic fiber packaging; labels; cartons; cases; post-mix packaging; and carbon dioxide. We generally purchase these raw materials from multiple suppliers and historically have not experienced material shortages.
Patents, Copyrights, Trade Secrets and Trademarks
Our Company owns numerous patents, copyrights and trade secrets, as well as substantial know-how and technology, which we collectively refer to in this report as "technology." This technology generally relates to our Company's products and the processes for their production; the packages used for our products; the design and operation of various processes and equipment used in our business; and certain quality assurance software. Some of the technology is licensed to suppliers and other parties. Our sparkling beverage and other beverage formulae are among the important trade secrets of our Company.
We own numerous trademarks that are very important to our business. Depending upon the jurisdiction, trademarks are valid as long as they are in use and/or their registrations are properly maintained. Pursuant to our Bottler's Agreements, we authorize our bottlers to use applicable Company trademarks in connection with their manufacture, sale and distribution of Company products. In addition, we grant licenses to third parties from time to time to use certain of our trademarks in conjunction with certain merchandise and food products.
Governmental Regulation
Our Company is required to comply, and it is our policy to comply, with applicable laws in the numerous countries throughout the world in which we do business. In many jurisdictions, compliance with competition laws is of special importance to us, and our operations may come under special scrutiny by competition law authorities due to our competitive position in those jurisdictions.
The production, distribution and sale in the United States of many of our Company's products are subject to the Federal Food, Drug, and Cosmetic Act,Act; the Federal Trade Commission Act,Act; the Lanham Act,Act; state consumer protection laws, the Occupational Safetylaws; federal, state and Health Act,local workplace health and safety laws; various federal, state and local environmental statutes;protection laws; and various other federal, state and local statutes and regulations applicable to the production, transportation, sale, safety, advertising, labeling and ingredients of such products. Outside the United States, the production,
distribution and sale of our many products and related operations are also subject to numerous similar and other statutes and regulations.
A California law requires that a specific warning appear on any product that contains a componentsubstance listed by the state as having been found to cause cancer or birth defects. TheThis law exposes all food and beverage producers to the possibility of having to provide warnings on their products. This isproducts because the lawit recognizes no generally applicable quantitative thresholds below which a warning is not required. Consequently, the detection of even a trace amountsamount of a listed componentssubstance can exposesubject an affected productsproduct to the prospectrequirement of a warning labels.label. Products containing listed substances that occur naturally or that are contributed to such products solely by a municipal water supply are generally exempt from the warning requirement. NoThe Company beverages produced for sale in California areis not currently required to display warnings under this law. However, we are unable to predict whether a component foundlaw on any Company beverages produced for sale in aCalifornia. In the future, however, caffeine and other substances detectable in Company product mightproducts may be added to the California list inpursuant to this law and the future.related regulations as they currently exist, or as they may be amended. Furthermore, we are also unable to predict when or whether the increasing sensitivity of detection methodology that may become applicable
under this law and related regulations as they currently exist, or as they may be amended, might result in the detection of an infinitesimal quantity of a listed substance in a Company beverage produced for sale in California.
Bottlers of our beverage products presently offer and use nonrefillable, recyclable containers in the United States and various other markets around the world. Some of these bottlers also offer and use refillable containers, which are also recyclable. Legal requirements have been enactedapply in various jurisdictions in the United States and overseas requiring that deposits or certain ecotaxes or fees be charged for the sale, marketing and use of certain nonrefillable beverage containers. The precise requirements imposed by these measures vary. Other types of statutes and regulations relating to beverage container–related deposit,container deposits, recycling, ecotaxecotaxes and/or product stewardship proposals have been introducedalso apply in various jurisdictions in the United States and overseas. We anticipate that additional, similar legislation or regulationslegal requirements may be proposed or enacted in the future at local, state and federal levels, both in the United States and elsewhere.
All of our Company's facilities and other operations in the United States and elsewhere around the world are subject to various environmental lawsprotection statutes and regulations.regulations, including those relating to the use of water resources and the discharge of wastewater. Our policy is to comply with all such legal requirements. Compliance with these provisions has not had, and we do not expect such compliance to have, any material adverse effect on our Company's capital expenditures, net income or competitive position.
Employees
We refer to our employees as "associates." As of December 31, 20062009 and 2005,2008, our Company had approximately 71,00092,800 and 55,000 employees,92,400 associates, respectively, of which 13,600approximately 17,900 and 9,800,16,500, respectively, were employed by consolidated variable interest entities that we have consolidated under the Financial Accounting Standards Board Interpretation No. 46 (revised December 2003), "Consolidation of Variable Interest Entities" ("Interpretation No. 46(R)"VIEs"). AtThe increase in the endtotal number of 2006associates in 2009 was primarily due to an increase in the Latin America operating group driven by its finished product business, as well as an increase in the Bottling Investments operating group. These increases were partially offset by the impact of the Company's ongoing productivity initiatives. As of December 31, 2009 and 2005,2008, our Company had approximately 12,20011,700 and 10,400 employees,13,000 associates, respectively, located in the United States, including Puerto Rico, of which approximately 1,200190 and none,90, respectively, were employed by entities that we have consolidated under Interpretation No. 46(R). The increase in the number of employees in 2006 was primarily due to the acquisitions and the consolidation of certain bottling operations, mainly in China and the United States.VIEs.
Our Company, through its divisions and subsidiaries, has entered into numerous collective bargaining agreements. We currently expect that we will be able to renegotiate such agreements on satisfactory terms when they expire. The Company believes that its relations with its employeesassociates are generally satisfactory.
Securities Exchange Act Reports
The Company maintains an interneta website at the following address: www.thecoca-colacompany.com. The information on the Company's website is not incorporated by reference in this annual report on Form 10-K.
We make available on or through our website certain reports and amendments to those reports that we file with or furnish to the Securities and Exchange Commission (the "SEC") in accordance with the Securities Exchange Act of 1934, as amended (the "Exchange Act"). These include our annual reports on Form 10-K, our quarterly reports on Form 10-Q and our current reports on Form 8-K, and Section 16 filings.8-K. We make this information available on our website free of charge as soon as reasonably practicable after we electronically file the information with, or furnish it to, the SEC.
In addition to the other information set forth in this report, you should carefully consider the following factors, which could materially affect our business, financial condition or results of operations in future results.periods. The risks described below are not the only risks facing our Company. Additional risks and uncertainties not currently known to us or that we currently deem to be immaterial also may materially adversely affect our business, financial condition or results of operations.operations in future periods.
Obesity and other health concerns may reduce demand for some of our products.
Consumers, public health officials and government officials are becoming increasingly aware of and concerned about the public health consequences associated with obesity, particularly among young people. In addition, press reports indicate that lawyerssome researchers, health advocates and consumer advocates have publicly threateneddietary guidelines are encouraging consumers to instigate litigation against companies in our industry,reduce consumption of sugar-sweetened beverages, including us, alleging unfair and/those sweetened with HFCS or deceptive practices related to contracts to sell sparkling and other beverages in schools.nutritive sweeteners. Increasing public awarenessconcern about these issuesissues; possible new taxes and governmental regulations concerning the marketing, labeling or availability of our beverages; and negative publicity resulting from actual or threatened legal actions against us or other companies in our industry relating to the marketing, labeling or sale of sugar-sweetened beverages may reduce demand for our sparkling beverages, which could affect our profitability.
Water scarcity and poor quality could negatively impact the Coca-Cola system's production costs and capacity.
Water is the main ingredient in substantially all of our products. It is also a limited resource in many parts of the world, facing unprecedented challenges from overexploitation, increasing pollution, poor management and poor management.climate change. As demand for water continues to increase around the world, and as water becomes scarcer and the quality of available water deteriorates, our system may incur increasing production costs or face capacity constraints which could adversely affect our profitability or net operating revenues in the long run.
Changes in the nonalcoholic beverages business environment could impact our financial results.
The nonalcoholic beverages business environment is rapidly evolving as a result of, among other things, changes in consumer preferences, including changes based on health and nutrition considerations and obesity concerns,concerns; shifting consumer tastes and needs,needs; changes in consumer lifestyles, increased consumer informationlifestyles; and competitive product and pricing pressures. In addition, theour industry is being affected by the trend toward consolidation in the retail channel, particularly in Europe and the United States. If we are unable to successfully adapt to this rapidly changing environment, our net income, share of sales, and volume growth and overall financial results could be negatively affected.
The recent global credit crisis and its effects on credit and equity market conditions may adversely affect our financial performance.
The global credit markets experienced unprecedented disruptions during the past two years, and while they improved during 2009, the improvement has not been uniform. The cost and availability of credit varies by market and is subject to changes in the global economic environment. If the current conditions in the credit markets continue or worsen, our ability to access credit markets on favorable terms may be negatively affected, which could increase our cost of borrowing. In addition, the current credit conditions may make it more difficult for our bottling partners to access financing on terms comparable to those obtained historically, which would affect the Coca-Cola system's profitability as well as our share of the income of bottling partners in which we have equity method investments. The current global credit market conditions and their actual or perceived effects on our and our major bottling partners' results of operations and financial condition, along with the current unfavorable economic environment in the United States and much of the world, may increase the likelihood that the major independent credit agencies will downgrade our credit ratings, which could have a negative effect on our borrowing costs.
The significant decline in the equity markets and in the valuation of other assets precipitated by the recent global credit crisis and related financial system instability affected the value of our pension plan assets. In spite of improving asset values in 2009, the fair value of our plan assets remains lower than pre-crisis levels, and this could lead to higher pension expense in the future. As a result of the decline in the fair value of our pension plan assets and a decrease in the discount rate used to calculate pension benefit obligations, we made contributions of $269 million to our U.S. and international pension plans in 2009 and will consider making additional contributions in 2010 and beyond.
In addition, the major financial institutions remain fragile, and the counterparty risk associated with our existing derivative financial instruments remains higher than pre-crisis levels. Therefore, we may be unable to secure creditworthy counterparties for derivative transactions in the future or may incur higher than anticipated costs in our hedging activities. The decrease in availability of consumer credit resulting from the financial crisis, as well as general unfavorable economic conditions, may also cause consumers to reduce their discretionary spending, which would reduce the demand for our beverages and negatively affect our net revenues and the Coca-Cola system's profitability.
Increased competition could hurt our business.
The nonalcoholic beverages segment of the commercial beverages industry is highly competitive. We compete with major international beverage companies that, like our Company, operate in multiple geographic areas, as well as numerous firms that are primarily local in operation. In many countries in which we do business, including the United States, PepsiCo, Inc., is a primary competitor. Other significant competitors include, but are not limited to, Nestlé, Cadbury Schweppes plc,Dr Pepper Snapple Group, Inc., Groupe Danone, and Kraft Foods Inc. and Unilever. In certain markets, our competition includes major beer companies. Our beverage products also compete against local or regional brands as well as against store or private label brands developed by retailers, some of which are Coca-Cola system customers. Our ability to gain or maintain share of sales or gross margins in the global market or in various local markets may be limited as a result of actions by competitors.
If we are unable to expand our operations in developing and emerging markets, our growth rate could be negatively affected.
Our success depends in part on our ability to grow our business in developing and emerging markets, which in turn depends on economic and political conditions in those markets and on our ability to acquire or form strategic business alliances with local bottlers and to make necessary infrastructure enhancements to production facilities, distribution networks, sales equipment and technology. Moreover, the supply of our products in developing and emerging markets must match customers'consumers' demand for those products. Due to product price, limited purchasing power and cultural differences, there can be no assurance that our products will be accepted in any particular developing or emerging market.
Fluctuations in foreign currency exchange and interest rates could affect our financial results.
We earn revenues, pay expenses, own assets and incur liabilities in countries using currencies other than the U.S. dollar, including the euro, the Japanese yen, the Brazilian real and the Mexican peso. In 2006,2009, we used 63
71 functional currencies in addition to the U.S. dollar and derived approximately 7274 percent of our net operating revenues from operations outside of the United States. Because our consolidated financial statements are presented in U.S. dollars, we must translate revenues, income and expenses, as well as assets and liabilities, into U.S. dollars at exchange rates in effect during or at the end of each reporting period. Therefore, increases or decreases in the value of the U.S. dollar against other major currencies will affect our net operating revenues, operating income and the value of balance sheet items denominated in foreign currencies. In addition, unexpected and dramatic devaluations of currencies in developing or emerging markets, such as the recent devaluation of the Venezuelan bolivar, could negatively affect the value of our earnings from, and of the assets located in, those markets. Because of the geographic diversity of our operations, weaknesses in some currencies might be offset by strengths in others over time. We also use derivative financial instruments to further reduce our net exposure to currency exchange rate fluctuations. However, we cannot assure you that fluctuations in foreign currency exchange rates, particularly the strengthening of the U.S. dollar against major currencies or the currencies of large developing countries, would not materially affect our financial results. In addition,
If interest rates increase, our net income could be negatively affected.
We maintain levels of debt that we are exposedconsider prudent based on our cash flows, interest coverage ratio and percentage of debt to capital. We use debt financing to lower our cost of capital, which increases our return on shareowners' equity. This exposes us to adverse changes in interest rates. When appropriate, we use derivative financial instruments to reduce our exposure to interest rate risks. We cannot assure you, however, that our financial risk management program will be successful in reducing the risks inherent in exposures to interest rate fluctuations. Our interest expense may also be affected by our credit ratings. In assessing our credit strength, credit rating agencies consider our capital structure and financial policies as well as the aggregate balance sheet and other financial information for the Company and certain major bottlers. It is our expectation that the credit rating agencies will continue using this methodology. If our
credit ratings were to be downgraded as a result of changes in our capital structure; our major bottlers' financial performance; changes in the credit rating agencies' methodology in assessing our credit strength; the credit agencies' perception of the impact of the continuing unfavorable credit conditions on our or our major bottlers' current or future financial performance and financial condition; or for any other reason, our cost of borrowing could increase. Additionally, if the credit ratings of certain bottlers in which we have equity method investments were to be downgraded, such bottlers' interest expense could increase, which would reduce our equity income.
We rely on our bottling partners for a significant portion of our business. If we are unable to maintain good relationships with our bottling partners, our business could suffer.
We generate a significant portion of our net operating revenues by selling concentrates and syrups to bottlers in which we do not have any ownership interest or in which we have a noncontrolling ownership interest.independent bottling partners. In 2006,2009, approximately 8379 percent of our worldwide unit case volume was produced and distributed by bottling partners in which the Company did not have a controlling interests.interest. As independent companies, our bottling partners, some of which are publicly traded companies, make their own business decisions that may not always align with our interests. In addition, many of our bottling partners have the right to manufacture or distribute their own products or certain products of other beverage companies. If we are unable to provide an appropriate mix of incentives to our bottling partners through a combination of pricing and marketing and advertising support, they may take actions that, while maximizing their own short-term profits, may be detrimental to our Company or our brands, or they may devote more of their energy and resources to business opportunities or products other than those of the Company. Such actions could, in the long run, have an adverse effect on our profitability. In addition, the loss of one or more major customers by one of our major bottling partners, or disruptions of bottling operations that may be caused by strikes, work stoppages or labor unrest affecting such bottlers, could indirectly affect our results.
If our bottling partners' financial condition deteriorates, our business and financial results could be affected.
TheWe derive a significant portion of our net operating revenues from sales of concentrates and syrups to our bottling partners and, therefore, the success of our business depends on theour bottling partners' financial strength and viability of our bottling partners. Our bottling partners' financial condition is affected in large part by conditions and events that are beyond our control, including competitive and general market conditions in the territories in which they operate and the availability of capital and other financing resources on reasonable terms.profitability. While under our bottlers'bottling partners' agreements we generally have the right to unilaterally change the prices we charge for our concentrates and syrups, our ability to do so may be materially limited by theour bottling partners' financial condition of the applicable bottlers and their ability to pass price increases along to their customers. In addition, because we have investments in certain of our bottling partners, which we account for under the equity method, and our operating results include our proportionate share of such bottling partners' income or loss. Also, aOur bottling partners' financial condition is affected in large part by conditions and events that are beyond our and their control, including competitive and general market conditions in the territories in which they operate, the availability of capital and other financing resources on reasonable terms, loss of major customers, or disruptions of bottling operations that may be caused by strikes, work stoppages, labor unrest or natural disasters. A deterioration of the financial condition or results of operations of one or more of our major bottling partners could adversely affect our net operating revenues from sales of concentrates and syrups; could result in which we have investmentsa decrease in our equity income; and could negatively affect the carrying values of suchour investments in bottling partners, resulting in asset write-offs.
Increases in income tax rates or changes in income tax laws could have a material adverse impact on our financial results.
We are subject to income tax in the United States and result in write-offs. Therefore,numerous other jurisdictions in which we generate net operating revenues. Increases in income tax rates could reduce our after-tax income from affected jurisdictions. In addition, there have been proposals to reform U.S. tax laws that could significantly impact how U.S. multinational corporations are taxed on foreign earnings. We earn a significant deteriorationsubstantial portion of our bottling partners' financial conditionincome in foreign countries. Although we cannot predict whether or in what form these proposals will pass, if enacted several of the proposals being considered could adverselyhave a material adverse impact on our tax expense and cash flow.
Increased or new indirect taxes in the United States or in one or more of our other major markets could negatively affect our financial results.business.
Our business operations are subject to numerous duties or taxes that are not based on income, sometimes referred to as "indirect taxes," including import duties, excise taxes, sales or value-added taxes, property taxes and payroll taxes, in many of the jurisdictions in which we operate, including indirect taxes imposed by state and local governments. In addition, in early 2009, as part of the proposed health care reform legislation, the United States Congress considered imposing a federal excise tax on beverages sweetened with sugar, HFCS or other nutritive sweeteners to offset part of the cost of implementing the proposed legislation. The proposed federal excise tax would have applied to our sparkling,
juice and juice-drink and sports beverages. While this proposal has not been included in the health care bills currently before the United States Congress, there is no assurance that it will not be reintroduced in the future. In addition, as federal, state and local governments experience significant budget deficits, some lawmakers have proposed singling out beverages among a plethora of revenue-raising items. Increases in or the imposition of new indirect taxes on our business operations or products would increase the cost of products or, to the extent levied directly on consumers, make our products less affordable.
If we are unable to renew collective bargaining agreements on satisfactory terms, or we or our bottling partners experience strikes, or work stoppages or labor unrest, our business could suffer.
Many of our employeesassociates at our key manufacturing locations and bottling plants are covered by collective bargaining agreements. If we are unable to renew such agreements on satisfactory terms, our labor costs could increase, which would affect our profit margins. In addition, strikesmany of our bottling partners' employees are represented by labor unions. Strikes, work stoppages or work stoppagesother forms of labor unrest at any of our major manufacturing facilities or at our major bottlers' plants could impair our ability to supply concentrates and syrups to our bottling partners or our bottlers' ability to supply finished beverages to customers, which would reduce our revenues and could expose us to customer claims.
Increase in the cost, disruption of supply or shortage of energy could affect our profitability.
Our Company-owned bottling operationsWe and our bottling partners operate a large fleet of trucks and other motor vehicles.vehicles to distribute and deliver beverage products to customers. In addition, we and our bottlers use a significant amount of electricity, natural gas and other energy sources to operate our concentrate and bottling plants. An increase in the price, disruption of supply or shortage of fuel and other energy sources that may be caused by increasing demand or by events such as natural disasters, power outages or the like would increase our and the Coca-Cola system's operating costs and, therefore, could negatively impact our profitability.
Increase in the cost, disruption of supply or shortage of rawingredients or packaging materials could harm our business.
We and our bottling partners use various raw materialsingredients in our business, including high fructose corn syrup,HFCS, sucrose, aspartame, saccharin, acesulfame potassium, sucralose, ascorbic acid, citric acid, phosphoric acid and orange and other fruit juice concentrate.concentrates, as well as packaging materials such as PET for bottles and aluminum for cans. The prices for these rawingredients and packaging materials fluctuate depending on market conditions. Substantial increases in the prices forof our rawor our bottling partners' ingredients and packaging materials, to the extent they cannot be recouped through increases in the prices of finished beverage products, would increase our and the Coca-Cola system's operating costs and could reduce our profitability. Increases in the prices of our finished products resulting from higher rawingredient and packaging material costs could affect affordability in some markets and reduce Coca-Cola system sales. In addition, some of these raw materials,ingredients, such as aspartame, acesulfame potassium, sucralose, saccharin and sucralose,ascorbic acid, as well as some of the packaging containers, such as aluminum cans, are available from a limited number of suppliers.suppliers, some of which are located in countries experiencing political or other risks. We cannot assure you that we and our bottling partners will be able to maintain favorable arrangements and relationships with these suppliers. An increase in the cost, or a sustained interruption in the supply, or a shortage of some of these rawingredients, packaging materials or cans and other containers that may be caused by a deterioration of our or our bottling partners' relationships with supplierssuppliers; by supplier quality and reliability issues; or by events such as natural disasters, power outages, labor strikes, political uncertainties or governmental instability, or the like, could negatively impact our net revenues and profits.
Changes in laws and regulations relating to beverage containers and packaging could increase our costs and reduce demand for our products.
We and our bottlers currently offer nonrefillable, recyclable containers in the United States and in various other markets around the world. Legal requirements have been enacted in various jurisdictions in the United States and overseas requiring that deposits or certain ecotaxes or fees be charged for the sale, marketing and use of certain nonrefillable beverage containers. Other proposals relating to beverage container-related deposit,container deposits, recycling, ecotax and/or product stewardship proposals have been introduced in various jurisdictions in the United States and overseas, and we anticipate that similar legislation or regulations may be proposed in the future at local, state and federal levels, both in the United States and elsewhere. Consumers' increased concerns and changing attitudes about solid waste streams and environmental responsibility and related publicity could result in the adoption of such legislation or regulations. If these
types of requirements are adopted and implemented on a large scale in any of the major markets in which we operate, they could affect our costs or require changes in our distribution model, which could reduce our net operating revenues or profitability. In addition, container-deposit laws, or regulations that impose additional burdens on retailers, could cause a shift away from our products to retailer-proprietary brands, which could impact the demand for our products in the affected markets.
Significant additional labeling or warning requirements may inhibit sales of affected products.
Various jurisdictions may seek to adopt significant additional product labeling or warning requirements relating to the chemical content or perceived adverse health consequences of certain of our products. TheseIf these types of requirements if they become applicable to one or more of our major products under current or future
environmental or health laws or regulations, they may inhibit sales of such products. InOne such law, which is in effect in California, a law requires that a specific warning appear on any product that contains a componentsubstance listed by the state as having been found to cause cancer or birth defects. This law recognizes noexposes all food and beverage producers to the possibility of having to provide warnings on their products because it does not recognize any generally applicable quantitative thresholds below which a warning is not required. Consequently, the detection of even a trace amount of a listed substance can subject an affected product to the requirement of a warning label. The Company is not currently required to display warnings under this law on any Company beverages produced for sale in California. In the future, however, caffeine and other substances detectable in Company products may be added to the list pursuant to this law and the related regulations as they currently exist or as they may be amended. If a componentsubstance found in one of our products is added to the list, or if the increasing sensitivity of detection methodology that may become available under this law and related regulations as they currently exist, or as they may be amended, results in the detection of an infinitesimal quantity of a listed substance in one of our beverages produced for sale in California, the resulting warning requirements or adverse publicity could negatively affect our sales.
Unfavorable general economic conditions in the United States or in other major markets could negatively impact our financial performance.
Unfavorable general economic conditions, such as a recession or economic slowdown in the United States or in one or more of our other major markets, could negatively affect the affordability of, and consumer demand for, some of our beverages. Under difficult economic conditions, consumers may seek to reduce discretionary spending by forgoing purchases of our products or by shifting away from our beverages to lower-priced products offered by other companies. Softer consumer demand for our beverages in the United States or in other major markets could reduce the Coca-Cola system's profitability and could negatively affect our financial performance.
Unfavorable economic and political conditions in international markets could hurt our business.
We derive a significant portion of our net operating revenues from sales of our products in international markets. In 2006,2009, our operations outside of the United States accounted for approximately 7274 percent of our net operating revenues. Unfavorable economic and political conditions in certain of our international markets, including civil unrest and governmental changes, could undermine consumer confidence and reduce the consumers' purchasing power, thereby reducing demand for our products. In addition, product boycotts resulting from political activism could reduce demand for our products, while restrictions on our ability to transfer earnings or capital across borders thatwhich may be imposed or expanded as a result of political and economic instability could impact our profitability. Without limiting the generality of the preceding sentence,sentences, the unfavorable business environment in Venezuela, the current unstable economic and political conditions and civil unrest and political activism in the Middle East, India, Pakistan or the Philippines, the unstable situation in Iraq or the continuation or escalation of terrorist activities could adversely impact our international business.
Changes in commercial and market practices within the European Economic Area may affect the sales of our products.
We and our bottlers are subject to an Undertaking, rendered legally binding in June 2005 by a decision of the European Commission, pursuant to which we committed to make certain changes in our commercial and market practices in the European Economic Area Member States. The Undertaking potentially applies in any of the listed 27 countries and in all channelswhich certain of distribution where our sparkling beverages account for over 40 percent of national sales and twice the nearest competitor's share. The commitments we and our bottlers made in the Undertaking relate broadly to exclusivity, percentage–basedpercentage-based purchasing commitments, transparency, target rebates, tying, assortment or range commitments, and agreements concerning products of other suppliers. The Undertaking also applies to shelf space commitments in
agreements with take-home customers and to financing and availability agreements in the on-premise channel. In addition, the Undertaking includes commitments that are applicable to commercial arrangements concerning the installation and use of technical equipment (such as coolers, fountain equipment and vending machines). Adjustments to our business model in the European Economic Area Member States as a result of these commitments or of future interpretations of European Union competition laws and regulations could adversely affect our sales in the European Economic Area markets.
Litigation or legal proceedings could expose us to significant liabilities and damage our reputation.
We are party to various litigation claims and legal proceedings. We evaluate these litigation claims and legal proceedings to assess the likelihood of unfavorable outcomes and to estimate, if possible, the amount of potential losses. Based on these assessments and estimates, we establish reserves and/or disclose the relevant litigation claims or legal proceedings, as appropriate. These assessments and estimates are based on the information available to management at the time and involve a significant amount of management judgment. We caution you that actual outcomes or losses may differ materially from those envisioned by our current assessments and estimates. In addition, we have bottling and other business operations in emerging or developing markets with high riskhigh-risk legal compliance environments. Our policies and procedures require strict
compliance by our employeesassociates and agents with all United States and local laws and regulations applicable to our business operations, including those prohibiting improper payments to government officials. Nonetheless, we cannot assure you that our policies, procedures and related training programs will always ensure full compliance by our employeesassociates and agents with all applicable legal requirements. Improper conduct by our employeesassociates or agents could damage our reputation in the United States and internationally or lead to litigation or legal proceedings that could result in civil or criminal penalties, including substantial monetary fines, as well as disgorgement of profits.
Adverse weather conditions could reduce the demand for our products.
The sales of our products are influenced to some extent by weather conditions in the markets in which we operate. Unusually cold or rainy weather during the summer months may have a temporary effect on the demand for our products and contribute to lower sales, which could have an adverse effect on our results of operations for thosesuch periods.
If we are unable to maintain our brand image and product quality, or if we encounter other product issues such as product recalls,corporate reputation, our business may suffer.
Our success depends on our ability to maintain brand image for our existing products and effectively build up brand image for new products and brand extensions. We cannot assure you, however, that additional expenditures and our renewedcontinuing commitment to advertising and marketing will have the desired impact on our products' brand image and on consumer preferences. Changes in consumers' media preferences, such as the shift away from traditional mass media to the Internet, may undermine the effectiveness of our media advertising campaigns in reaching consumers and may increase our marketing costs. Product quality issues, realactual or imagined,perceived, or allegations of product contamination, even when false or unfounded, could tarnish the image of the affected brands and may cause consumers to choose other products. In addition, because of changing government regulations or implementation thereof, allegationsAllegations of product contamination, or lack of consumer interest in certain products, weeven if untrue, may be requiredrequire us from time to time to recall products entirelya beverage or other product from specific markets.all of the markets in which the affected production was distributed. Product recalls could negatively affect our profitability and could negatively affect brand image. In some emerging markets, the production and sale of counterfeit or "spurious" products, which we and our bottling partners may not be able to fully combat, may damage the image and reputation of our products. Also, adverse publicity surrounding obesity and health concerns related to our products, water usage, labor relations and the like, and campaigns by activists attempting to connect our system to environmental issues, water shortages or workplace or human rights violations in certain countries in which we operate, could negatively affect our Company's overall reputation and our products' acceptance by consumers.
Changes in the legal and regulatory environment in the countries in which we operate could increase our costs or reduce our net operating revenues.
Our Company's business is subject to various laws and regulations in the numerous countries throughout the world in which we do business, including laws and regulations relating to competition, product safety, advertising and labeling, container deposits, recycling or stewardship, the protection of the environment, and employment and labor practices. In the United States, the production, distribution and sale of many of our products are subject to, among others, the Federal Food, Drug, and Cosmetic Act, the Federal Trade Commission Act, the Lanham Act, state consumer protection
laws, the Occupational Safety and Health Act, various environmental statutes, as well as various state and local statutes and regulations. Outside the United States, the production, distribution, sale, advertising and labeling of many of our products are also subject to various laws and regulations. Changes in applicable laws or regulations or evolving interpretations thereof, could, in certain circumstancesincluding increased government regulations to limit carbon dioxide and other greenhouse gas emissions as a result of concern over climate change, may result in increased compliance costs, or capital expenditures and other financial obligations for us and our bottling partners, which could affect our profitability or impede the production or distribution of our products, which could affect our net operating revenues.
Changes in accounting standards and taxation requirements could affect our reported financial results.
New accounting standards or pronouncements that may become applicable to our Company from time to time, or changes in the interpretation of existing standards and pronouncements, could have a significant effect on our reported results for the affected periods. We are also subject to income tax in the numerous jurisdictions in which we generate net operating revenues. In addition, our products are subject to import and excise duties
and/or sales or value-added taxes in many jurisdictions in which we operate. Increases in income tax rates could reduce our after-tax income from affected jurisdictions, while increases in indirect taxes could affect our products' affordability and therefore reduce demand for our products.
If we are not able to achieve our overall long termlong-term goals, the value of an investment in our Company could be negatively affected.
We have established and publicly announced certain long-term growth objectives. These objectives were based on our evaluation of our growth prospects, which are generally based on volume and sales potential of many product types, some of which are more profitable than others, and on an assessment of the potential level or mix ofprice and product sales.mix. There can be no assurance that we will achieve the required volume or revenue growth or the mix of products necessary to achieve our long-term growth objectives.
If we are unable to protect our information systems against data corruption, cyber-based attacks or network security breaches, our operations could be disrupted.
We are increasingly dependentrely on information technology networks and systems, including the Internet, to process, transmit and store electronic information. In particular, we depend on our information technology infrastructure for digital marketing activities and electronic communications among our locations around the world and between Company personnel and our bottlers and other customers and suppliers. Security breaches of this infrastructure can create system disruptions, shutdowns or unauthorized disclosure of confidential information. If we are unable to prevent such breaches, our operations could be disrupted, or we may suffer financial damage or loss because of lost or misappropriated information.
We may be required to recognize additional impairment charges.charges which could materially affect our financial results.
We assess our goodwill, trademarks and other intangible assets andas well as our other long-lived assets as and when required by accounting principles generally accepted accounting principles in the United States to determine whether they are impaired. In 2006,impaired and, if they are, we record appropriate impairment charges. Our equity method investees also perform impairment tests, and we record our proportionate share of impairment charges recorded by them adjusted, as appropriate, for the impact of items such as basis differences, deferred taxes and deferred gains. We also record our proportionate share of restructuring charges recorded by equity method investees. For example, in 2009 we recorded charges of approximately $40 million related to asset impairments due to a change in the expected useful life of an intangible asset and a change in disposal strategy related to a building that is no longer occupied; charges of approximately $86 million to equity income (loss) — net, representing our proportionate share of impairment and restructuring charges recorded by certain equity investees, and charges of approximately $27 million to other income (loss) — net due to an other-than-temporary decline in the fair value of a cost method investment; in 2008 we recorded charges of approximately $1.6 billion to equity income (loss) — net, representing our proportionate share of impairment charges recorded by CCE, and a charge of approximately $602$81 million to other income (loss) — net related to other-than-temporary declines in the fair value of certain available-for-sale securities; and in 2007 we recorded net charges of approximately $150 million to equity income resulting from the impact(loss) — net, representing our proportionate share of impairment and restructuring charges, net of our proportionate share of an impairment chargebenefits related to tax rate changes, recorded by CCE, and impairment charges of approximately $41 million primarily related to trademarks for beverages sold in the Philippines and Indonesia; in 2005, we recorded impairment charges of approximately $89 million primarily related to our operations and investments in the Philippines; and in 2004, we recorded impairment charges of approximately $374 million primarily related to franchise rights at Coca-Cola Erfrischungsgetraenke AG ("CCEAG"). If market conditions in North America, India, Indonesia or the Philippines do not improve or deteriorate further,certain equity investees. It is possible that we may be required to record additionalsignificant impairment charges. In addition, unexpected declinescharges or our proportionate share of significant charges recorded by equity investees in the future and, if we do so, our operating results and structural changes or divestitures in these and other markets may also result in impairment charges. Additional impairment charges would reduce our reported earnings for the periods in which they are recorded.equity income could be materially adversely affected.
If we do not successfully integrate and manage our Company-owned or controlled bottling operations, our results could suffer.
While we primarily manufacture, market and sell concentrates and syrups to our bottling partners, from time to time we do acquire or take control of bottling operations. Often, though not always, thesewe acquire or take control of bottling operations are in underperforming markets where we believe we can use our resources and expertise to improve performance. We may incur unforeseen liabilities and obligations in connection with acquiring, taking control of or managing such bottling operations and may encounter unexpected difficulties and costs in restructuring and integrating them into our Company's operating and internal control structures. We may also experience delays in extending our Company's internal control over financial reporting to newly acquired or controlled bottling operations, which may increase the risk of failure to prevent misstatements in such operations' financial records and in our consolidated financial statements. In addition,2009, net operating revenues generated by Company-owned or controlled bottling operations (which are included in the Bottling Investments operating segment) represented approximately 26 percent of our Company's consolidated net operating revenues. Therefore, our financial performance and the strength and efficiency of the Coca-Cola system dependdepends in large part on how well we can manage and improve the performance of Company-owned or controlled bottling operations. We cannot assure you, however, that we will be able to achieve our strategic and financial objectives for such bottling operations. If we are unable to achieve such objectives, our consolidated results could be negatively affected.
Climate change may negatively affect our business.
There is increasing concern that a gradual increase in global average temperatures due to increased concentration of carbon dioxide and other greenhouse gases in the atmosphere will cause significant changes in weather patterns around the globe and an increase in the frequency and severity of natural disasters. Decreased agricultural productivity in certain regions as a result of changing weather patterns may limit availability or increase the cost of key agricultural commodities, such as sugarcane, corn, beets, citrus, coffee and tea, which are important ingredients for our products. Increased frequency or duration of extreme weather conditions could also impair production capabilities, disrupt our supply chain or impact demand for our products. Climate change may also exacerbate water scarcity and cause a further deterioration of water quality in affected regions, which could limit water availability for our system's bottling operations. In addition, public expectations for reductions in greenhouse gas emissions could result in increased energy, transportation and raw material costs and may require us and our bottling partners to make additional investments in facilities and equipment. As a result, the effects of climate change could have a long-term adverse impact on our business and results of operations.
Global or regional catastrophic events could impact our operations and financial results.
Because of our global presence and worldwide operations, our business can be affected by large-scale terrorist acts, especially those directed against the United States or other major industrialized countries; the outbreak or escalation of armed hostilities; major natural disasters; or widespread outbreaks of infectious diseases such as H1N1 influenza, avian influenza or severe acute respiratory syndrome (generally known as SARS). Such events could impair our ability to manage our business around the world, could disrupt our supply of raw materials, and could impact production, transportation and delivery of concentrates, syrups and finished products. In addition, such events could cause disruption of regional or global economic activity, which can affect consumers' purchasing power in the affected areas and, therefore, reduce demand for our products.
ITEM 1B. UNRESOLVED STAFF COMMENTS
None.Not applicable.
Our worldwide headquarters is located on a 35-acre office complex in Atlanta, Georgia. The complex includes the approximately 621,000 square foot headquarters building, the approximately 870,000 square foot Coca-Cola North America ("CCNA") building and the approximately 264,000 square foot Coca-Cola Plaza building. The complex also includes several other buildings, including technical and engineering facilities, a learning center and a reception center. Our Company leases approximately 250,000 square feet of office space at 10 Glenlake Parkway, Atlanta, Georgia, which we currently sublease to third parties. In addition, we lease approximately 218,000223,000 square feet of office space at Northridge Business Park, Dunwoody, Georgia. The North America operating segment owns and occupies an office building located in Houston, Texas, that contains approximately 330,000 square feet. The Company has facilities for administrative operations, manufacturing, processing, packaging, packing, storage and warehousing throughout the United States.
As of December 31, 2006, our Company owned and operated 32 principal beverage concentrate and/or syrup manufacturing plants located throughout the world. In addition, we own, hold a majority interest in or otherwise consolidate under applicable accounting rules 37 operations with 95 principal beverage bottling and canning plants located outside the United States. We also own four bottled water production facilities and lease one such facility in the United States.
Our North America operating segment operates nine still beverage production facilities, in addition to the bottled water facilities mentioned above, located throughout the United States and Canada. It also utilizes a system of contract packers to produce and/or distribute certain products where appropriate. In addition, our North America operating segment owns a facility that manufactures juice concentrates for foodservice use.
We own or lease additional real estate, including a Company-owned office and retail building at 711 Fifth Avenue in New York, New York,York. These properties are primarily included in the Corporate operating segment.
We own or lease additional facilities and approximately 315,000 square feetreal estate throughout the world which we use for administrative operations, manufacturing, processing, packaging, packing, storage, warehousing and retail operations. These properties are generally included in the geographic operating segment in which they are located. In North America, we own nine still beverage production facilities, 10 principal beverage concentrate and/or syrup manufacturing plants and four bottled water facilities. We also lease one bottled water facility and own a facility that manufactures juice concentrates for foodservice use. Also included in the North America operating segment is a portion of Company-ownedthe Atlanta office complex. Additionally, as of December 31, 2009, our Company owned and technical spaceoperated 20 principal beverage concentrate manufacturing plants outside of North America, of which seven are included in Brussels, Belgium. Additional ownedthe Pacific operating segment, five are included in the Eurasia and Africa operating segment, five are included in the Latin America operating segment and three are included in the Europe operating segment.
We own or leased real estatehold a majority interest in or otherwise consolidate under applicable accounting rules bottling operations that own 112 principal beverage bottling and canning plants located throughout the world is used by the Company as office space; for bottling operations, warehouse or retail operations; or,world. These plants are included in the case of some owned property, is leased to others.
Bottling Investments operating segment.
Management believes that our Company's facilities for the production of our products are suitable and adequate, that they are being appropriately utilized in line with past experience, and that they have sufficient production capacity for their present intended purposes. The extent of utilization of such facilities varies based upon seasonal demand for our products. It is not possible to measure with any degree of certainty or uniformity the productive capacity and extent of utilization of these facilities. However, management believes that additional production can be obtained at the existing facilities by adding personnel and capital equipment and, at some facilities, by adding shifts of personnel or expanding the facilities. We continuously review our anticipated requirements for facilities and, on the basis of that review, may from time to time acquire additional facilities and/or dispose of existing facilities.
On October 27, 2000, a class action lawsuit (Carpenters Health & Welfare FundThe Company is involved in various legal proceedings, including the proceedings specifically discussed below. Management of Philadelphia & Vicinity v. The Coca-Cola Company, et al.) was filed in the United States District Court for the Northern District of Georgia alleging that the Company M. Douglas Ivester, Jack L. Stahl and James E. Chestnut violated antifraud provisions of the federal securities laws by making misrepresentations or material omissions relatingbelieves that any liability to the Company'sCompany that may arise as a result of these proceedings will not have a material adverse effect on the financial condition and prospects in late 1999 and early 2000. A second, largely identical lawsuit (Gaetan LaValla v. The Coca-Cola Company, et al.) was filed in the same court on November 9, 2000. The complaints allege thatof the Company and the individual named officers: (1) forced certain Coca-Cola system bottlers to accept "excessive, unwanted and unneeded" sales of concentrate during the third and fourth quarters of 1999, thus creatingits subsidiaries taken as a misleading sense of improvement in our Company's performance in those quarters; (2) failed to write down the value of impaired assets in Russia, Japan and elsewhere on a timely basis, again resulting in the presentation of misleading interim financial results in the third and fourth quarters of 1999; and (3) misrepresented the reasons for Mr. Ivester's departure from the Company and then misleadingly reassured the financial community that there would be no changes in the Company's core business strategy or financial outlook following that departure. Damages in an unspecified amount are sought in both complaints.whole.
Aqua-Chem Litigation
On January 8, 2001, an order was entered by the United States District Court for the Northern District of Georgia consolidating the two cases for all purposes. The Court also ordered the plaintiffs to file a Consolidated Amended Complaint. On July 25, 2001, the plaintiffs filed a Consolidated Amended Complaint, which largely repeated the allegations made in the original complaints and added Douglas N. Daft as an additional defendant.
On September 25, 2001, the defendants filed a Motion to Dismiss all counts of the Consolidated Amended Complaint. On August 20, 2002, the Court granted in part and denied in part the defendants' Motion to Dismiss. The Court also granted the plaintiffs' Motion for Leave to Amend the Complaint. On September 4, 2002, the defendants filed a Motion for Partial Reconsideration of the Court's August 20, 2002 ruling. The motion was denied by the Court on April 15, 2003.
On June 2, 2003, the plaintiffs filed an Amended Consolidated Complaint. The defendants moved to dismiss the Amended Complaint on June 30, 2003. On March 31, 2004, the Court granted in part and denied in part the defendants' Motion to Dismiss the Amended Complaint. In its order, the Court dismissed a number of the plaintiffs' allegations, including the claim that the Company made knowingly false statements to financial analysts. The Court permitted the remainder of the allegations to proceed to discovery. The Court denied the plaintiffs' request for leave to further amend and replead their complaint. Discovery commenced on May 14, 2004, and is ongoing. The fact discovery cutoff currently is March 23, 2007.
The Company believes it has substantial legal and factual defenses to the plaintiffs' claims.
On December 20, 2002, the Company filed a lawsuit (The Coca-Cola Company v. Aqua-Chem, Inc., Civil Action No. 2002CV631-50) in the Superior Court, Fulton County, Georgia (the "Georgia Case"), seeking a declaratory judgment that the Company has no obligation to its former subsidiary, Aqua-Chem, Inc., now known as Cleaver-Brooks, Inc. ("Aqua-Chem"), for any past, present or future liabilities or expenses in connection with any claims or lawsuits against Aqua-Chem. Subsequent to the Company's filing but on the same day,
Aqua-Chem filed a lawsuit (Aqua-Chem, Inc. v. The Coca-Cola Company, Civil Action No. 02CV012179) in the Circuit Court, Civil Division of Milwaukee County, Wisconsin (the "Wisconsin Case"). In the Wisconsin Case, Aqua-Chem sought a declaratory judgment that the Company is responsible for all liabilities and expenses not covered by insurance in connection with certain of Aqua-Chem's general and product liability claims arising from occurrences prior to the Company's sale of Aqua-Chem in 1981, and a judgment for breach of contract in an amount exceeding $9 million for costs incurred by Aqua-Chem to date in connection with such claims. The Wisconsin Case initially was stayed, pending final resolution of the Georgia Case, and later was voluntarily dismissed without prejudice by Aqua-Chem.
The Company owned Aqua-Chem from 1970 to 1981. During that time, the Company purchased over $400 million of insurance coverage, of which approximately $350 million is still available to cover Aqua-Chem's costs for certain product liability and other claims. The Company sold Aqua-Chem to Lyonnaise American Holding, Inc., in 1981 under the terms of a stock sale agreement. The 1981 agreement, and a subsequent 1983 settlement agreement, outlined the parties' rights and obligations concerning past and future claims and lawsuits involving Aqua-Chem. Cleaver Brooks,Cleaver-Brooks, a division of Aqua-Chem, manufactured boilers, some of which contained asbestos gaskets. Aqua-Chem was first named as a defendant in asbestos lawsuits in or around 1985 and currently has more than 100,000 claims pending against it.
The parties agreed in 2004 to stay the Georgia Case pending the outcome of insurance coverage litigation filed by certain Aqua-Chem insurers on March 26, 2004. In the coverage action, five plaintiff insurance companies filed suit (Century Indemnity Company, et al. v. Aqua-Chem, Inc., The Coca-Cola Company, et al., Case No. 04CV002852) in the Circuit Court, Civil Division of Milwaukee County, Wisconsin, against the Company, Aqua-Chem and 16 insurance companies. Several of the policies that arewere the subject of the coverage action werehad been issued to the Company during the period (1970 to 1981) when the Company owned Aqua-Chem. The complaint seekssought a determination of the respective rights and obligations under the insurance policies issued with regard to asbestos-related claims against Aqua-Chem. The action also seekssought a monetary judgment reimbursing any amounts paid by the plaintiffs in excess of their obligations. Two of the insurers, one with a $15 million policy limit and one with a $25 million policy limit, have asserted cross-claims against the Company, alleging that the Company and/or its insurers are responsible for Aqua-Chem's asbestos liabilities before any obligation is triggered on the part of thatthe cross-claimant insurers to pay for thosesuch costs under their policies.
Aqua-Chem and the Company filed and obtained a partial summary judgment determination in the coverage action that the insurers for Aqua-Chem and the Company were jointly and severally liable for coverage amounts, but reserving judgment on other defenses that might apply. During the course of the Wisconsin coverage litigation, Aqua-Chem and the Company subsequently reached settlements with sixseveral of the insurers, in the Wisconsin insurance coverage litigation, and those insurersincluding plaintiffs, who have paid or will pay funds into an escrow account for payment of costs arising from the asbestos claims against Aqua-Chem. Aqua-Chem also has reachedOn July 24, 2007, the Wisconsin trial court entered a settlement with an additional insurerfinal declaratory judgment regarding paymentthe rights and obligations of that insurer's policy proceeds for Aqua-Chem's asbestos claims. Aqua-Chem and the Company continue to negotiate their claims for coverage withparties under the insurance policies issued by the remaining defendant insurers, which judgment was not appealed. The judgment directs, among other things, that are partieseach insurer whose policy is triggered is jointly and severally liable for 100 percent of Aqua-Chem's losses up to policy limits.
The court's judgment concluded the Wisconsin insurance coverage case. To the extent that these negotiations do not result in settlements, the Company believes that there are substantial legal and factual arguments supporting the position that the insurance policies at issue provide coverage for the asbestos-related claims against Aqua-Chem, and both the Company and Aqua-Chem have asserted these arguments in responselitigation. The Georgia Case remains subject to the complaint. stay agreed to in 2004. There were no material developments in this case during 2009.
European Union Parallel Trade Matter
The Company also believes it has substantial legal and factual defenses to the claims of the cross-claimant insurer.
The Company is discussinghad discussions with the Competition Directorate of the European Commission (the "European Commission") about issues relating to parallel trade within the European Union arising out of comments received by the European Commission from third parties. The Company is fully cooperatingcooperated with the European Commission and is providingprovided information on these issues and the measures taken and to be taken to address them. As the Company has not received any issues raised. The Company is unable to predict at this time with any reasonable degree of certainty what action, if any,communication for several years from the European Commission will take with respect to these issues.
In May and July 2005, two putative class action lawsuits(Selbst v. The Coca-Cola Company and Douglas N. Daft andAmalgamated Bank, et al. v. The Coca-Cola Company, Douglas N. Daft, E. Neville Isdell, Steven J. Heyer and Gary P. Fayard) alleging violations of the anti-fraud provisions of the federal securities laws were filed in the United States District Court for the Northern District of Georgia againstthis matter, the Company and certain current and former executive officers. These cases were subsequently consolidated, and an amended and consolidated complaint was filed in September 2005. The purported class consists of persons, except the defendants, who purchased Company stock between January 30, 2003, and September 15, 2004, and were damaged thereby. The amended and consolidated complaint alleges, among other things, that during the class period the defendants made false and misleading statements about (a) the Company's new business strategy/model, (b) the Company's execution of its new business strategy/model, (c) the state of the Company's critical bottler relationships, (d) the Company's North American business, (e) the Company's European operations, with a particular emphasis on Germany, (f) the Company's marketing and introduction of new products, particularly Coca-Cola C2, and (g) the Company's forecast for growth going forward. The plaintiffs claim that as a result of these allegedly false and misleading statements, the price of the Company stock increased dramatically during the purported class period. The amended and consolidated complaint also alleges that in September and November of 2004, the Company and E. Neville Isdell acknowledged that the Company's performance had been below expectations, that various corrective actions were needed, that the Company was lowering its forecasts, and that there would be no quick fixes. In addition, the amended and consolidated complaint alleges that the charge announced by the Company in November 2004 should have been taken early in 2003 and that, as a result, the Company's financial statements were materially misstated during 2003 and the first three quarters of 2004. The plaintiffs, on behalf of the putative class, seek compensatory damages in an amount to be proved at trial, extraordinary, equitable and/or injunctive relief as permitted by law to assure that the class has an effective remedy, award of reasonable costs and expenses, including counsel and expert fees, and such other further relief as the Court may deem just and proper. On November 21, 2005, the Company and the individual parties filed a motion to dismiss the amended and consolidated complaint. The plaintiffs filed their response to that motion on January 27, 2006. On September 29, 2006, the Court entered its order granting the Company's motion to dismiss the amended complaint in its entirety and granted the plaintiffs 20 days from its date of entry within which to seek leave to file a second amended complaint to attempt to correct deficiencies noted therein. On October 23, 2006, plaintiffs advised the court that they would not seek leave to file a second amended complaint thereby concludingconsiders this matter.matter concluded.
Chapman
On June 30, 2005, Maryann Chapman filed a purported shareholder derivative action (Chapman v. Isdell, et al.) in the Superior Court of Fulton County, Georgia, alleging violations of state law by certain individual current and former members of the Board of Directors of the Company and senior management, including breaches of fiduciary duties, abuse of control, gross mismanagement, waste of corporate assets and unjust enrichment, between January 2003 and the date of filing of the complaint that have caused substantial losses to the Company and other damages, such as to its reputation and goodwill. The defendants named in the lawsuit include Neville Isdell, Douglas Daft, Gary Fayard, Ronald Allen, Cathleen Black, Warren Buffett, Herbert Allen, Barry Diller, Donald McHenry, Sam Nunn, James Robinson, Peter Ueberroth, James Williams, Donald Keough, Maria Lagomasino, Pedro Reinhard, Robert Nardelli and Susan Bennett King. The Company is also named a nominal defendant. The complaint further alleges that the September 2004 earnings warning issued by the Company resulted from factors known by the individual defendants as early as January 2003 that were not adequately disclosed to the investing public until the earnings warning. The factors
cited in the complaint include (i) a flawed business strategy and a business model that was not working; (ii) a workforce so depleted by layoffs that it was unable to properly react to changing market conditions; (iii) impaired relationships with key bottlers; and (iv) the fact that the foregoing conditions would lead to diminished earnings. The plaintiff, purportedly on behalf of the Company, seeks damages in an unspecified amount, extraordinary equitable and/or injunctive relief, restitution and disgorgement of profits, reimbursement for costs and disbursements of the action, and such other and further relief as the Court deems just and proper. The Company's motion to dismiss the complaint and the plaintiff's response were filed and fully briefed. The Court heard oral argument on the
Company's motion to dismiss on June 6, 2006. Following the hearing, the Court took the matter under advisement and the parties are awaiting a ruling. There were no material developments in this case during 2009.
The Company intends to vigorously defend its interests in this matter.
During May, June and July 2005, three similar putative class action lawsuits(Pedraza v. The Coca-Cola Company, et al., Shamrey, et al. v. The Coca-Cola Company, et al. andJackson v. The Coca-Cola Company, et al.) were filed in the United States District Court for the Northern District of Georgia by participants in the Company's Thrift & Investment Plan (the "Plan") alleging breach of fiduciary duties under the Employee Retirement Income Security Act of 1974 by the Company, certain current and former executive officers, and the Company's Benefits Committee. The purported class in each of these cases consists of the Plan and persons who were participants in or beneficiaries of the Plan between May 13, 1997 and April 18, 2005 and whose accounts included investments in Company stock. The complaints allege that, among other things, the defendants failed to exercise the required care, skill, prudence and diligence in managing the Plan and its assets; take steps to eliminate or reduce the amount of Company stock in the Plan; adequately diversify the Plan's investments in Company stock, appoint qualified administrators and properly monitor their and the Plan's performance; and disclose accurate information about the Company. The plaintiffs, on behalf of the putative class, seek, among other things, declaratory relief, damages for Plan losses and lost profits, imposition of constructive trust as a remedy for unjust enrichment, injunctive relief, costs and attorneys' fees, equitable restitution and other appropriate equitable and monetary relief. By order of the Court, an amended complaint was filed in theJackson case on September 16, 2005. The amended complaint supplements the detailed allegations of the original complaint and names specific individual defendants who served on the Benefits Committee. Identical amended complaints were also filed inPedraza andShamrey. In each of the three cases, the plaintiff voluntarily dismissed three individual defendants. The Company filed motions to dismiss all claims in each case.
On September 29, 2006, the Court dismissed all but one claim against the Benefits Committee and its members. The Court ordered plaintiffs to replead the remaining claim against the Benefits Committee with specificity within 20 days. On November 14, 2006, the Court entered a stipulation and order to dismiss the remaining claim with prejudice thereby concluding this matter.
In February 2006, the International Brotherhood of Teamsters, a purported shareholder of CCE, filed a derivative suit(International Brotherhood of Teamsters v. The Coca-Cola Company, et al.) in the Delaware Court of Chancery for New Castle County naming the Company and current and former CCE board members, including certain current and former Company officers who serve or served on CCE's board, as defendants. The plaintiff alleged that the Company breached fiduciary duties owed to CCE shareholders based upon alleged control of CCE by the Company. The complaint also alleged that the Company had actual control over CCE and that the Company abused its control by maximizing its own financial condition at the expense of CCE's financial condition. Subsequently, two lawsuits virtually identical toTeamsters were filed in the same court:Lang v. The Coca-Cola Company, et al., filed March 30, 2006, andGordon v. The Coca-Cola Company, et al., filed April 10, 2006. On April 6, 2006, the Company moved to dismissTeamsters or, in the alternative, for a stay of discovery (the "Dismissal Motion"). On May 19, 2006, the Chancery Court entered an order consolidatingTeamsters, Lang andGordon under the captionIn re Coca-Cola Enterprises, Inc. Shareholders Litigation and requiring the plaintiffs to file an amended consolidated complaint in the consolidated action as soon as practicable.
On September 29, 2006, plaintiffs filed their Consolidated Amended Shareholders' Derivative Complaint (the "Amended Complaint"). The Amended Complaint omits certain former Company officers from the group of individual defendants and defines the "relevant time period" for purposes of the claims as October 15, 2003, through the date of the filing. The original complaint did not identify any specific dates. The Amended Complaint also includes additional allegations about the conduct of the Company and certain of its executive officers, including new allegations about the Company's purported control over CCE and allegations of improper conduct in connection with the establishment of a warehouse delivery system to supply Powerade to a major customer. On December 7, 2006, the Company filed its motion to dismiss the amended complaint and accompanying brief. The plaintiffs' reply brief was filed on January 22, 2007.
The Company believes it has substantial factual and legal defenses to the plaintiffs' claims and intends to defend itself vigorously.
In February 2006, two largely identical cases were filed against the Company and CCE, one in the Circuit Court of Jefferson County, Alabama (Coca-Cola Bottling Company United, et al. v. The Coca-Cola Company and Coca-Cola Enterprises Inc.), and the other in the United States District Court for the Western District of Missouri, Southern Division (Ozarks Coca-Cola/Dr Pepper Bottling Company, et al. v. The Coca-Cola Company and Coca-Cola Enterprises Inc.) by bottlers that collectively represented approximately 10 percent of the Company's U.S. unit case volume for 2005. The plaintiffs in these lawsuits allege, among other things, that the Company and CCE are acting in concert to establish a warehouse delivery system to supply Powerade to a major customer, which the plaintiffs contend would be detrimental to their interests as authorized distributors of this product. The plaintiffs claim that the alleged conduct constitutes breach of contract, implied covenant of good faith and fair dealing, and expressed covenant of good faith by the Company and CCE. In addition, the plaintiffs seek remedies against the Company and CCE on a promissory estoppel theory. The plaintiffs seek actual and punitive damages, interest, and costs and attorneys' fees, as well as permanent injunctive relief, in the Alabama case, and preliminary and permanent injunctive relief in the federal case. The Company and CCE filed motions to dismiss the plaintiffs' complaint in the Alabama case, and the Court scheduled a hearing on these motions for early May 2006. In the federal case, the Court granted the Company's and CCE's motion to change venue to the United States District Court for the Northern District of Georgia. Shortly thereafter, the plaintiffs in the federal case withdrew their request for preliminary injunctive relief. The Company and CCE also filed motions to dismiss the plaintiffs' complaint in the federal case.
During the third quarter of 2006, a motion by Coca-Cola Bottling Co. Consolidated ("Consolidated") to intervene in the federal case was granted, and the plaintiffs in both cases amended their pleadings to add claims challenging warehouse delivery programs for Dasani and Minute Maid juices. Also, during the fourth quarter of 2006, the parties engaged in a temporary "slow-down" of the litigation in order to explore business discussions that might lead to resolution of the issues in the case. As a result of these discussions, the parties have agreed to work together to develop and test new customer service and distribution systems to supplement their direct store delivery system. Pursuant to that agreement, as of February 13, 2007, all but five of the plaintiffs in these lawsuits have signed settlement agreements and will dismiss their lawsuits without prejudice. CCE and Consolidated have also signed agreements in which they have committed to participate in the new customer service and delivery systems as part of the settlement arrangements.
In the event settlement is not reached with the remaining plaintiffs in these lawsuits, the Company believes that it has substantial factual and legal defenses to the remaining plaintiffs' claims and intends to defend the cases vigorously.
The Company is involved in various other legal proceedings. Management of the Company believes that any liability to the Company that may arise as a result of these proceedings, including the proceedings specifically discussed above, will not have a material adverse effect on the financial condition of the Company and its subsidiaries taken as a whole.
ITEM 4. SUBMISSION OF MATTERS TO A VOTE OF SECURITY HOLDERS
Not applicable.
ITEM X. EXECUTIVE OFFICERS OF THE COMPANY
�� The following are the executive officers of our Company as of February 20, 2007:26, 2010:
Harry L. Anderson, 47, is Senior Vice President, Global Business and Technology Services of the Company. Mr. Anderson joined the Company in 2001 as Senior Vice President, Coca-Cola Ventures. In 2002, he was named Director of Supply Chain and Manufacturing Management. Mr. Anderson served as Chief Financial Officer of Coca-Cola North America from 2004 until 2007. In 2007, he was appointed Vice President and Controller of the Company. Prior to joining the Company, Mr. Anderson served as Executive Vice President, Finance and Operations, Turner Entertainment Group; Executive Vice President, Finance and Administration, Turner Sales and Distribution Group; and Vice President and Group Controller, Turner Sales and Distribution Group. Before joining Turner Broadcasting, Mr. Anderson was with Price Waterhouse in Audit and Accounting Services.
Ahmet C. Bozer, 46,49, is President of the Eurasia and Africa Group. Mr. Bozer joined the Company in 1990 as a Financial Control Manager for Coca-Cola USA and held a number of other roles in the finance organization. In 1994, he joined Coca-Cola Bottlers of Turkey (now Coca-Cola Icecek A.S.), a joint venture betweenamong the Company, The
Anadolu Group and Özgörkey Companies, as Chief Financial Officer and was later named Managing Director in 1998. In 2000, Mr. Bozer was named President of the Eurasia Division of the Company. At the end of 2002, that division was reorganized to include the Middle East Division and was renamed the Eurasia and Middle East Division. During the period between 2000 until 2006, the Eurasia &and Middle East Division was expanded to include 34 countries and, in 2006, he was givenMr. Bozer assumed the additional leadership responsibility for the Russia, Ukraine and Belarus Division. HeMr. Bozer was appointed to his current position,President of the Company's former Eurasia Group effective January 1, 2007.
Alexander B. Cummings, 50, is President of the Africa Group. Mr. Cummings joined the Company in 1997 as Deputy Region Manager, Nigeria, based in Lagos, Nigeria. In 1998, he was made Managing Director/Region Manager, Nigeria. In 2000, Mr. Cummings2007, and became President of the North WestEurasia and Africa Division based in MoroccoGroup when it was formed effective July 1, 2008, by combining the former Eurasia Group (other than the Adriatic and in 2001 becameBalkans business unit) with the former Africa Group.
Alexander B. Cummings, Jr., 53, is Executive Vice President and Chief Administrative Officer of the Africa Group overseeing the entire African continent.Company. Mr. Cummings startedbegan his career in 1982 with The Pillsbury Company and held various positions within Pillsbury, the last position being Vice President of Finance and Chief Financial Officer for all of Pillsbury's international businesses. Mr. Cummings joined the Company in 1997 as Deputy Region Manager, Nigeria, based in Lagos, Nigeria. In 1998, Mr. Cummings was named Managing Director/Region Manager, Nigeria, and in 2000, he became President of the North West Africa Division based in Morocco. In March 2001, Mr. Cummings became President of the Africa Group overseeing the Company's business in the entire African continent, and served in this capacity until June 2008. Mr. Cummings was appointed to his current position in March 2001.Chief Administrative Officer of the Company effective July 1, 2008, and was elected Executive Vice President of the Company effective October 15, 2008.
J. Alexander M. Douglas, Jr., 45,48, is Senior Vice President and President of the North America Group. Mr. Douglas joined the Company in January 1988 as a District Sales Manager for the Foodservice Division of Coca-Cola USA. In May 1994, he was named Vice President of Coca-Cola USA, initially assuming leadership of the CCE Sales &and Marketing Group and eventually assuming leadership of the entire North American Field Sales and Marketing Groups. In January 2000, Mr. Douglas was appointed President of the North American Division within the North America operating group.Group. He served as Senior Vice President and Chief Customer Officer of the Company from February 2003 until August 2006.2006 and continued serving as
Senior Vice President until April 2007. Mr. Douglas was elected to his current positionappointed President of the North America Group in August 2006.
Ceree Eberly, 47, is Chief People Officer of the Company, with responsibility for leading the Company's global People Function (formerly Human Resources). Ms. Eberly joined the Company in February 1990, serving in staffing, compensation and other roles supporting the Company's business units around the world. From October 1998 until January 2003, she served as Human Resources Director for the Latin Center Business Unit. From February 2003 until June 2007, Ms. Eberly served as Vice President of the McDonald's Division. She was appointed Group Human Resources Director for Europe in July 2007 and served in that capacity until she was appointed Chief People Officer effective December 1, 2009. Ms. Eberly was elected Senior Vice President of the Company effective April 1, 2010.
Gary P. Fayard, 54,57, is Executive Vice President and Chief Financial Officer of the Company. Mr. Fayard joined the Company in April 1994. In July 1994, he was elected Vice President and Controller. In December 1999, he was elected Senior Vice President and Chief Financial Officer. Mr. Fayard was elected Executive Vice President of the Company in February 2003.
Irial Finan, 49,52, is Executive Vice President of the Company and President, Bottling Investments and Supply Chain. Mr. Finan joined the Coca-Cola system in 1981 with Coca-Cola Bottlers Ireland, Ltd., where for several years he held a variety of accounting positions. From 1987 until 1990, Mr. Finan served as Finance Director of Coca-Cola Bottlers Ireland, Ltd. From 1991 to 1993, he served as Managing Director of Coca-Cola Bottlers Ulster, Ltd. He was Managing Director of Coca-Cola Bottlers in Romania and Bulgaria until late 1994. From 1995 to 1999, he served as Managing Director of Molino Beverages, with responsibility for expanding markets, including the Republic of Ireland, Northern Ireland, Romania, Moldova, Russia and Nigeria. Mr. Finan served from May 2001 until 2003 as Chief Executive Officer of Coca-Cola HBC. In August 2004,Hellenic. Mr. Finan joined the Company and was named President, Bottling Investments.Investments in August 2004. He was elected Executive Vice President of the Company in October 2004.
E. Neville Isdell, 63, is Chairman of the Board of Directors and Chief Executive Officer of the Company. Mr. Isdell joined the Coca-Cola system in 1966 with the local bottling company in Zambia. In 1972, he became General Manager of Coca-Cola Bottling of Johannesburg, the largest Coca-Cola bottler in South Africa at the time. Mr. Isdell was named Region Manager for Australia in 1980. In 1981, he became President of Coca-Cola Bottlers Philippines, Inc., the bottling joint venture between the Company and San Miguel Corporation in the Philippines. Mr. Isdell was appointed President of the Central European Division of the Company in 1985. In January 1989, he was elected Senior Vice President of the Company and was appointed President of the Northeast Europe/Africa Group, which was renamed the Northeast Europe/Middle East Group in 1992. In 1995, Mr. Isdell was named President of the Greater Europe Group. From July 1998 to September 2000, he was Chairman and Chief Executive Officer of Coca-Cola Beverages Plc in Great Britain, where he oversaw that company's merger with Hellenic Bottling and the formation of Coca-Cola HBC, one of the Company's largest bottlers. Mr. Isdell served as Chief Executive Officer of Coca-Cola HBC from September 2000 until May 2001 and served as Vice Chairman of Coca-Cola HBC from May 2001 until December 2001. From January 2002 to
May 2004, Mr. Isdell was an international consultant to the Company. He was elected to his current positions on June 1, 2004.
Glenn G. Jordan S., 50,53, is President of the Pacific Group. Mr. Jordan joined the Company in 1978 as a field representative for Coca-Cola de Colombia where, for several years, he held various positions, including Region Manager from 1985 to 1989. Mr. Jordan served as Marketing Operations Manager, Pacific Group from 1989 to 1990 and as Vice President of Coca-Cola International and Executive Assistant to the Pacific Group President from 1990 to 1991. Mr. Jordan served as Senior Vice President, Marketing and Operations, for the Brazil Division from 1991 to 1995, as President of the River Plate Division, which comprised Argentina, Uruguay and Paraguay, from 1995 to 2000, and as President of the South Latin America Division, comprising Argentina, Bolivia, Chile, Ecuador, Paraguay, Peru and Uruguay, from 2000 to 2003. In February 2003, Mr. Jordan was appointed Executive Vice President and Director of Operations for the Latin America Group and served in that capacity until February 2006. Mr. Jordan was appointed President of the East, South Asia and Pacific Rim Group in February 2006. The East, South Asia and Pacific Rim Group was reconfigured and renamed the Pacific Group, effective January 1, 2007.
Geoffrey J. Kelly,, 62, 65, is Senior Vice President and General Counsel of the Company. Mr. Kelly joined the Company in 1970 in Australia as manager of the Legal Department for the Australasia Area. Since then he hasFrom 1970 until 2000, Mr. Kelly held a number of key roles, including Senior Counsel for the Pacific Group and subsequently for the Middle and Far East Group. In 2000, Mr. Kelly was appointed Senior Counsel for International Operations. He became Chief Deputy General Counsel in 2003 and was elected Senior Vice President of the Company in February 2004. In January 2005, he assumed the role of Acting General Counsel to the Company, and in July 2005, he was elected General Counsel of the Company.
Muhtar Kent, 54,57, is President, Chief Executive Officer and Chief Operating OfficerChairman of the Board of Directors of the Company. Mr. Kent joined the Company in 1978 and held a variety of marketing and operations roles throughout his career with the Company. In 1985, he was appointed General Manager of Coca-Cola Turkey and Central Asia. From 1989 to 1995, Mr. Kent served as President of the East Central Europe Division and Senior Vice President of Coca-Cola International. Between 1995 and 1998, he served as Managing Director of Coca-Cola Amatil-Europe,Amatil Limited — Europe, and from 1999 until 2005, he served as President and Chief Executive Officer of Efes Beverage Group and as a board member of Coca-Cola Icecek. Mr. Kent rejoined the Company in May 2005 as President, North Asia, Eurasia and Middle East Group, was appointed President, Coca-Cola International in January 2006 and was elected Executive Vice President of the Company in February 2006. He was elected to his current positions in December 2006.
Thomas G. Mattia, 58, is Senior Vice President of the Company and Director of Worldwide Public Affairs and Communications. Prior to joining the Company, Mr. Mattia served since 2000 as Vice President of Global Communications at technology services leader EDS, where he was responsible for a wide range of activities from brand management and media relations to advertising and on-line marketing and communications. From 1995 to 2000, Mr. Mattia held a variety of executive positions with Ford Motor Company, including head of International Public Affairs, Vice President of Lincoln Mercury and Director of North American Public Affairs. Mr. Mattia was appointed Director of Worldwide Public Affairs and Communications effective January 20, 2006, and was elected Senior Vice President of the Company in February 2006.
Cynthia P. McCague, 56, is Senior Vice President of the Company and Director of Human Resources. Ms. McCague initially joined the Company in 1982, and since then has worked across the Coca-Cola business system in a variety of human resources and business roles in Europe and the United States. In 1998, she was appointed to lead the human resources function for Coca-Cola Beverages Plc in Great Britain, which in 2000 became Coca-Cola HBC, a large publicly traded Coca-Cola bottler. Ms. McCague rejoined the Company in June 2004 as Director of Human Resources. She was elected Senior Vice President in July 2004.
Mary E. Minnick, 47, is Executive Vice President of the Company and President, Marketing, Strategy and Innovation. Ms. Minnick joined the Company in 1983 and spent 10 years working in Fountain Sales and the Bottle/Can Division of Coca-Cola USA. In 1993, she joined Corporate Marketing. In 1996, she was appointed
Vice President and Director, Middle and Far East Marketing, and served in that capacity until 1997 when she was appointed President of the South Pacific Division. In 2000, she was named President of Coca-Cola (Japan) Company, Limited. Ms. Minnick served as President and Chief Operating Officer of the Asia-Pacific Group from January 2002 until May 2005. SheCompany in December 2006 and was elected to the Board of Directors in April 2008. Mr. Kent was elected Chief Executive Vice PresidentOfficer
of the Company effective July 1, 2008. Mr. Kent was elected Chairman of the Board of Directors of the Company in February 2002 and was appointed President, Marketing, Strategy and Innovation in May 2005. On January 18, 2007, the Company announced that Ms. Minnick will be leaving the Company, effective February 28, 2007.April 2009.
Dominique Reiniche,, 51, 54, is President of the European UnionEurope Group. Ms. Reiniche joined the Company in May 2005 as President of the European Union Group, which was reconfigured effective July 1, 2008, to include the Adriatic and was appointed to her current position at that time.Balkans business unit and renamed the Europe Group. Prior to joining the Company, she held a number of marketing, sales and general management positions with CCE. From May 1998 until December 2002, she served as General Manager of France for CCE, and from January 2003 until May 2005, Ms. Reiniche was President of CCE Europe. Before joining the Coca-Cola system, she was Director of Marketing and Strategy with Kraft Jacobs-Suchard.
José Octavio Reyes, 54,57, is President of the Latin America Group. HeMr. Reyes began his career with The Coca-Cola Company in 1980 at Coca-Cola de México as Manager of Strategic Planning. In 1987, he was appointed Manager of the Sprite and Diet Coke brands at Corporate Headquarters. In 1990, he was appointed Marketing Director for the Brazil Division, and later became Marketing and Operations Vice President for the Mexico Division. Mr. Reyes assumed the role of Deputy Division President for the Mexico Division in January 1996 and was named Division President for the Mexico Division in May 1996. He assumed his position as President of the Latin America Group in December 2002.
Danny L. Strickland,Joseph V. Tripodi, 58,54, is Executive Vice President and Chief Marketing and Commercial Officer of the Company. Prior to joining the Company, Mr. Tripodi served as Senior Vice President and Chief Marketing Officer for Allstate Insurance Co. Prior to joining Allstate in November 2003, Mr. Tripodi was Chief Marketing Officer for The Bank of New York. From 1999 until April 2002, he served as Chief Marketing Officer for Seagram Spirits & Wine Group. From 1989 to 1998, he was the Executive Vice President for Global Marketing, Products and Services for MasterCard International. Previously, Mr. Tripodi spent seven years with the Mobil Oil Corporation in roles of increasing responsibility in planning, marketing, business development and operations in New York, Paris, Hong Kong and Guam. Mr. Tripodi joined the Company as Chief Marketing and Commercial Officer effective September 2007 and was elected Senior Vice President of the Company in October 2007, a capacity in which he served until July 2009 when he was elected Executive Vice President of the Company.
Jerry S. Wilson, 55, is Senior Vice President and Chief Innovation/ResearchCustomer and DevelopmentCommercial Officer of the Company. Mr. Strickland joined the Company in April 2003 and was elected Senior Vice President in June 2003. Prior to joining the Company, Mr. StricklandWilson held various positions in roles of increasing responsibility in distribution, district management, franchise leadership and brand management within Volkswagen of America from 1981 to 1988. Mr. Wilson joined the Company in 1988 as an Area Account Executive for the Foodservice Division of Coca-Cola USA. From 1990 to 1992, he served as Manager of Account Executives, and from 1992 to 1994, he served as Manager of Sales Development. Mr. Wilson was promoted to Director of Sales Operations in 1994 and later that year became Director of Strategic Marketing. In 1995, Mr. Wilson was named Director of Strategic Planning for Coca-Cola USA. In 1996, he was promoted to Vice President, Coca-Cola USA Foodservice, West Area, and in 1999, Mr. Wilson was named Vice President of the USA operations within the McDonald's Division. In April 2003, he was promoted to global Chief Operating Officer of the McDonald's Division, and in November 2005, Mr. Wilson was elected Vice President of the Company and appointed President of the global McDonald's Division. Mr. Wilson was elected Senior Vice President Innovation, Technology & Quality at General Mills, Inc. from January 1997 untilof the Company in October 2006 and was appointed Chief Customer and Commercial Officer effective March 2003. There he was responsible for building a strong product pipeline, innovation culture and organization. Prior to his position with General Mills, Mr. Strickland held several research and development, innovation, engineering, quality and strategy roles in the United States and abroad with Johnson & Johnson from March 1993 until December 1996, Kraft Foods Inc. from February 1988 until March 1993, and the Procter & Gamble Company from June 1970 until February 1988.1, 2009.
All executive officers serve at the pleasure of the Board of Directors. There is no family relationship between any of the directorsDirectors or executive officers of the Company.
ITEM 5. MARKET FOR REGISTRANT'S COMMON EQUITY, RELATED STOCKHOLDER MATTERS AND ISSUER PURCHASES OF EQUITY SECURITIES
In theThe principal United States market in which the Company's common stock is listed and traded onis the New York Stock Exchange (the principal market for our common stock) and is traded on the Boston, Chicago, National and Philadelphia stock exchanges.Exchange.
The following table sets forth, for the calendarquarterly periods indicated, the high and low salesmarket prices per share for the Company's common stock, as reported on the New York Stock Exchange composite tape, and dividend per share information:
| Common Stock Market Price | |||||||
| High | Low | Dividends Declared | |||||
| 2006 | |||||||
| Fourth quarter | $ 49.35 | $ 43.72 | $ 0.31 | ||||
| Third quarter | 45.40 | 42.37 | 0.31 | ||||
| Second quarter | 44.76 | 40.86 | 0.31 | ||||
| First quarter | 42.99 | 39.36 | 0.31 | ||||
2005 | |||||||
| Fourth quarter | $ 43.60 | $ 40.31 | $ 0.28 | ||||
| Third quarter | 44.75 | 41.39 | 0.28 | ||||
| Second quarter | 45.26 | 40.74 | 0.28 | ||||
| First quarter | 44.15 | 40.55 | 0.28 | ||||
| Common Stock Market Prices | Dividends | |||||||||
| High | Low | Declared | ||||||||
2009 | ||||||||||
Fourth quarter | $ 59.45 | $ 52.71 | $ 0.41 | |||||||
Third quarter | 54.12 | 47.42 | 0.41 | |||||||
Second quarter | 49.94 | 42.00 | 0.41 | |||||||
First quarter | 46.00 | 37.44 | 0.41 | |||||||
2008 | ||||||||||
Fourth quarter | $ 55.00 | $ 40.29 | $ 0.38 | |||||||
Third quarter | 55.84 | 49.44 | 0.38 | |||||||
Second quarter | 61.84 | 51.83 | 0.38 | |||||||
First quarter | 65.59 | 56.49 | 0.38 | |||||||
While we have historically paid dividends to holders of our common stock, the declaration and payment of future dividends will depend on many factors, including, but not limited to, our earnings, financial condition, business development needs and regulatory considerations, and is at the discretion of our Board of Directors.
As of February 20, 2007,22, 2010, there were approximately 315,505268,741 shareowner accounts of record. This figure does not include a substantially greater number of "street name" holders or beneficial holders of our common stock, whose shares are held of record by banks, brokers and other financial institutions.
The information under the principal heading "EQUITY COMPENSATION PLAN INFORMATION" in the Company's definitive Proxy Statement for the Annual Meeting of Shareowners to be held on April 18, 2007,21, 2010, to be filed with the SECSecurities and Exchange Commission (the "Company's 20072010 Proxy Statement"), is incorporated herein by reference.
During the fiscal year ended December 31, 2006,2009, no equity securities of the Company were sold by the Company that were not registered under the Securities Act of 1933, as amended.
The following table presents information with respect to purchases of common stock of the Company made during the three months ended December 31, 2006,2009, by the Company or any "affiliated purchaser" of the Company as defined in Rule 10b-18(a)(3) under the Exchange Act.
| Period | Total Number of Shares Purchased | 1 | Average Price Paid Per Share | Total Number of Shares Purchased as Part of Publicly Announced Plans or Programs | 2 | Maximum Number of Shares That May Yet Be Purchased Under the Publicly Announced Plans or Programs | 3 | ||
| September 30, 2006 through October 27, 2006 | 0 | $ 0.00 | 0 | 35,444,540 | |||||
| October 28, 2006 through November 24, 2006 | 6,530,640 | $ 46.91 | 6,530,640 | 293,469,360 | |||||
| November 25, 2006 through December 31, 2006 | 20,586,137 | $ 48.09 | 20,586,137 | 272,883,223 | |||||
| Total | 27,116,777 | $ 47.81 | 27,116,777 | ||||||
Period | Total Number of Shares Purchased | 1 | Average Price Paid Per Share | Total Number of Shares Purchased as Part of Publicly Announced Plans or Programs | 2 | Maximum Number of Shares That May Yet Be Purchased Under the Publicly Announced Plans or Programs | |||
October 3, 2009 through October 30, 2009 | 234,569 | $ 54.35 | 200,000 | 215,810,958 | |||||
October 31, 2009 through November 27, 2009 | 5,670,253 | 56.92 | 5,665,000 | 210,145,958 | |||||
November 28, 2009 through December 31, 2009 | 16,057,187 | 58.20 | 15,800,000 | 194,345,958 | |||||
Total | 21,962,009 | $ 57.83 | 21,665,000 | ||||||
1 | The total number of shares purchased | |||||||||
| On | |||||||||
Comparison of Five-Year Cumulative Total Return Among
The Coca-Cola Company, the Peer Group Index and the S&P 500 Index
Total Return
Stock Price Plus Reinvested Dividends
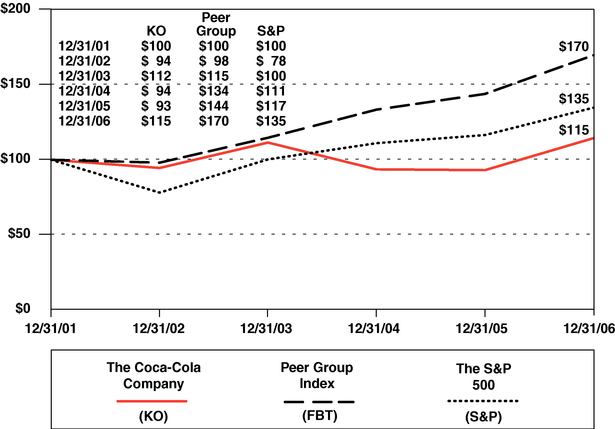
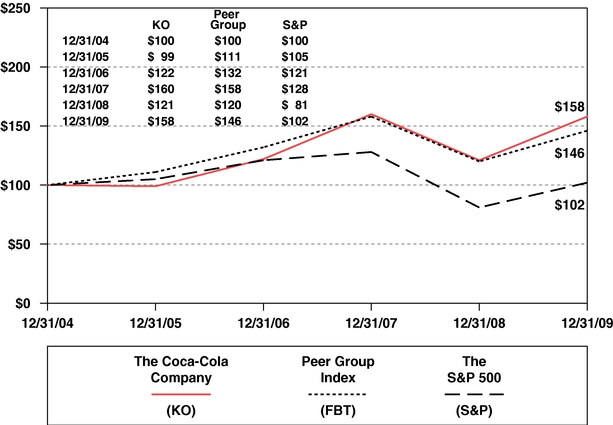
The total return assumes that dividends were reinvested quarterly and is based on a $100 investment on December 31, 2001.2004.
The Peer Group Index is a self-constructed peer group of companies that are included in the Dow Jones Food and Beverage Group and the Dow Jones Tobacco GroupsGroup of companies, as published inThe Wall Street Journal, from which the Company has been excluded.
The Peer Group Index consists of the following companies: Altria Group, Inc., Anheuser-Busch Companies, Inc., Archer-Daniels-Midland Company, Brown-Forman Corporation (Class B Stock), Bunge Limited, Campbell Soup Company, LoewsCentral European Distribution Corporation, (Carolina Group tracking stock), Chiquita Brands International, Inc., Coca-Cola Enterprises Inc., ConAgra Foods, Inc., Constellation Brands, Inc., Corn Products International, Inc., Darling International, Inc., Dean Foods Company, Del Monte Foods Company, Dr Pepper Snapple Group, Inc., Flowers Foods, Inc., Fresh Del Monte Produce, Inc., General Mills, Inc., Green Mountain Coffee Roasters, Inc., Hansen Natural Corporation, Herbalife Ltd., H.J. Heinz Company, Hormel Foods Corporation, Kellogg Company, Kraft Foods, Inc., Lancaster Colony Corporation, Lorillard, Inc., Martek Biosciences Corporation, McCormick & Company, Incorporated,Inc., Mead Johnson Nutrition Company, Molson Coors Brewing Company, Monsanto Company, NBTY, Inc., Nu Skin Enterprises, Inc., Nutrisystem, Inc., PepsiAmericas, Inc., PepsiCo, Inc., Philip Morris International, Inc., Ralcorp Holdings, Inc., Reynolds American, Inc., Sara Lee Corporation, Smithfield Foods, Inc., The Hain Celestial Group, Inc., The Hershey Company, The J.M. Smucker Company, The Pepsi Bottling Group, Inc., Tootsie Roll Industries, Inc., TreeHouse Foods, Inc., Tyson Foods, Inc., and Universal Corporation, UST Inc., Weight Watchers International, Inc.Corporation.
Companies included in the Dow Jones Food and Wm. Wrigley Jr. Company.The Wall Street Journal periodically changesBeverage Group and the companies reported as a part of the Food, Beverage andDow Jones Tobacco Groups of companies.Group change periodically. This year, the Groupsgroups include Hansen Natural Corporation, Herbalife Ltd.Green Mountain Coffee Roasters, Inc., Nu Skin Enterprises, Inc. and Nutrisystem, Inc.,Mead Johnson Nutrition Company, which were not included in the Groupsgroups last year. Dreyer's Grand Ice Cream Holdings,Additionally, this year, the groups do not include Nutrisystem, Inc., UST Inc., and Weight Watchers International, Inc., all of which waswere included in the Groupsgroups last year, is not included in the Groups this year.
ITEM 6. SELECTED FINANCIAL DATA
The following selected financial data should be read in conjunction with "Item 7. Management's Discussion and Analysis of Financial Condition and Results of Operations" and consolidated financial statements and notes thereto contained in "Item 8. Financial Statements and Supplementary Data" of this report.
| Year Ended December 31, | 2006 | 1 | 2005 | 2 | 2004 | 2,3 | 2003 | 2002 | 4,5 | |||
(In millions except per share data) | ||||||||||||
| SUMMARY OF OPERATIONS | ||||||||||||
| Net operating revenues | $ 24,088 | $ 23,104 | $ 21,742 | $ 20,857 | $ 19,394 | |||||||
| Cost of goods sold | 8,164 | 8,195 | 7,674 | 7,776 | 7,118 | |||||||
| Gross profit | 15,924 | 14,909 | 14,068 | 13,081 | 12,276 | |||||||
| Selling, general and administrative expenses | 9,431 | 8,739 | 7,890 | 7,287 | 6,818 | |||||||
| Other operating charges | 185 | 85 | 480 | 573 | — | |||||||
| Operating income | 6,308 | 6,085 | 5,698 | 5,221 | 5,458 | |||||||
| Interest income | 193 | 235 | 157 | 176 | 209 | |||||||
| Interest expense | 220 | 240 | 196 | 178 | 199 | |||||||
| Equity income — net | 102 | 680 | 621 | 406 | 384 | |||||||
| Other income (loss) — net | 195 | (93 | ) | (82 | ) | (138 | ) | (353 | ) | |||
| Gains on issuances of stock by equity investees | — | 23 | 24 | 8 | — | |||||||
| Income before income taxes and changes in accounting principles | 6,578 | 6,690 | 6,222 | 5,495 | 5,499 | |||||||
| Income taxes | 1,498 | 1,818 | 1,375 | 1,148 | 1,523 | |||||||
| Net income before changes in accounting principles | $ 5,080 | $ 4,872 | $ 4,847 | $ 4,347 | $ 3,976 | |||||||
| Net income | $ 5,080 | $ 4,872 | $ 4,847 | $ 4,347 | $ 3,050 | |||||||
| Average shares outstanding | 2,348 | 2,392 | 2,426 | 2,459 | 2,478 | |||||||
| Average shares outstanding assuming dilution | 2,350 | 2,393 | 2,429 | 2,462 | 2,483 | |||||||
PER SHARE DATA | ||||||||||||
| Net income before changes in accounting principles — basic | $ 2.16 | $ 2.04 | $ 2.00 | $ 1.77 | $ 1.60 | |||||||
| Net income before changes in accounting principles — diluted | 2.16 | 2.04 | 2.00 | 1.77 | 1.60 | |||||||
| Basic net income | 2.16 | 2.04 | 2.00 | 1.77 | 1.23 | |||||||
| Diluted net income | 2.16 | 2.04 | 2.00 | 1.77 | 1.23 | |||||||
| Cash dividends | 1.24 | 1.12 | 1.00 | 0.88 | 0.80 | |||||||
| Market price on December 31 | 48.25 | 40.31 | 41.64 | 50.75 | 43.84 | |||||||
TOTAL MARKET VALUE OF COMMON STOCK | $ 111,857 | $ 95,504 | $ 100,325 | $ 123,908 | $ 108,328 | |||||||
BALANCE SHEET DATA | ||||||||||||
| Cash, cash equivalents and current marketable securities | $ 2,590 | $ 4,767 | $ 6,768 | $ 3,482 | $ 2,345 | |||||||
| Property, plant and equipment — net | 6,903 | 5,831 | 6,091 | 6,097 | 5,911 | |||||||
| Depreciation | 763 | 752 | 715 | 667 | 614 | |||||||
| Capital expenditures | 1,407 | 899 | 755 | 812 | 851 | |||||||
| Total assets | 29,963 | 29,427 | 31,441 | 27,410 | 24,470 | |||||||
| Long-term debt | 1,314 | 1,154 | 1,157 | 2,517 | 2,701 | |||||||
| Shareowners' equity | 16,920 | 16,355 | 15,935 | 14,090 | 11,800 | |||||||
NET CASH PROVIDED BY OPERATING ACTIVITIES | $ 5,957 | $ 6,423 | $ 5,968 | $ 5,456 | $ 4,742 | |||||||
Year Ended December 31, | 2009 | 2008 | 2007 | 1 | 2006 | 2005 | 2 | |||||||||
(In millions except per share data) | ||||||||||||||||
SUMMARY OF OPERATIONS | ||||||||||||||||
Net operating revenues | $ 30,990 | $ 31,944 | $ 28,857 | $ 24,088 | $ 23,104 | |||||||||||
Net income attributable to shareowners of The Coca-Cola Company | 6,824 | 5,807 | 5,981 | 5,080 | 4,872 | |||||||||||
PER SHARE DATA | ||||||||||||||||
Basic net income | $ 2.95 | $ 2.51 | $ 2.59 | $ 2.16 | $ 2.04 | |||||||||||
Diluted net income | 2.93 | 2.49 | 2.57 | 2.16 | 2.04 | |||||||||||
Cash dividends | 1.64 | 1.52 | 1.36 | 1.24 | 1.12 | |||||||||||
BALANCE SHEET DATA | ||||||||||||||||
Total assets | $ 48,671 | $ 40,519 | $ 43,269 | $ 29,963 | $ 29,427 | |||||||||||
Long-term debt | 5,059 | 2,781 | 3,277 | 1,314 | 1,154 | |||||||||||
1 | In | ||||||||||||||||
2 | |||||||||||||||||
ITEM 7. MANAGEMENT'S DISCUSSION AND ANALYSIS OF FINANCIAL CONDITION AND RESULTS OF OPERATIONS
Overview
The following Management's Discussion and Analysis of Financial Condition and Results of Operations ("MD&A") is intended to help the reader understand The Coca-Cola Company, our operations and our present business environment. MD&A is provided as a supplement to—to — and should be read in conjunction with—with — our consolidated financial statements and the accompanying notes thereto contained in "Item 8. Financial Statements and Supplementary Data" of this report. This overview summarizes the MD&A, which includes the following sections:
General
We areThe Coca-Cola Company is the world's leading owner and marketer of nonalcoholic beverage brands and the world's largest manufacturer, distributor and marketer of nonalcoholic beverage concentrates and syrups in the world.used to produce nonalcoholic beverages. We own or license and market more than 500 nonalcoholic beverage brands, primarily sparkling beverages but also a variety of still beverages such as waters, enhanced waters, juices and juice drinks, ready-to-drink teas and coffees, and energy and sports drinks. Along with Coca-Cola, which is recognized as the world's most valuable brand, we own and market four of the world's top five nonalcoholic sparkling beverage brands, including Diet Coke, Fanta and Sprite. Our Company owns or licenses more than 400 brands, including diet and light beverages, waters, juice and juice drinks, teas, coffees, and energy and sports drinks. Through the world's largest beverage distribution system, consumers in more than 200 countries enjoy the Company's beverages at a rate exceeding 1.4of approximately 1.6 billion servings each day. Our Company generates revenues, income and cash flows by selling beverage concentrates and syrups as well as some finished beverages. We generally sell these products to bottling and canning operations, fountain wholesalers and some fountain retailers, and, in the case of finished products, to distributors. Our bottlers sell our branded products to businesses and institutions including retail chains, supermarkets, restaurants, small neighborhood grocers, sports and entertainment venues, and schools and colleges. We continue to expand our marketing presence and increase our unit case volume in mostdeveloped, developing and emerging markets. Our strong and stable system helps us to capture growth by manufacturing, distributing and marketing existing, enhanced and new innovative products to our consumers throughout the world.
We have three types of bottling relationships: bottlers in which our Company has no ownership interest, bottlers in which our Company has a noncontrolling ownership interest and bottlers in which our Company has a controlling ownership interest. We authorize our bottling partners to manufacture and package products made from our concentrates and syrups into branded finished products that they then distribute and sell. While we primarily manufacture, market and sell concentrates and syrups to our bottling partners, from time to time we have viewed it as advantageous to acquire a controlling interest in a bottling operation, often on a temporary basis. Often, though not always, these acquired bottling operations are in underperforming markets where we believe we can use our resources and expertise to improve performance. Owning such a controlling interest has allowed us to compensate for limited local resources and has enabled us to help focus the bottler's sales and marketing programs and assist in the development of the bottler's business and information systems and the establishment of appropriate capital structures. Acquisitions or consolidation of bottling operations during 2008 and 2007 resulted in a substantial increase in the number of bottling plants included in our consolidated financial statements and in the number of our associates. Refer to Note 17 of Notes to Consolidated Financial Statements. In 2006,2009, net operating revenues generated by Company-owned or consolidated bottling operations (which are included in the Bottling Investments operating segment) represented approximately 26 percent of our Company's consolidated net operating revenues and distributed approximately 11 percent of our worldwide unit case volume. In 2009, bottling partners in which our Company has no ownership interest or a noncontrolling ownership interest produced and distributed approximately 8379 percent of our worldwide unit case volume. The remaining approximately 10 percent of our worldwide unit case volume in 2009 was produced by our fountain operations and our juice and juice drink, sports drink and other finished beverage operations.
We make significant marketing expenditures in support of our brands, including expenditures for advertising, sponsorship fees and special promotional events. As part of our marketing activities, we, at our discretion, provide retailers and distributors with promotions and point-of-sale displays; our bottling partners with advertising support and funds designated for the purchase of cold-drink equipment; and our consumers with coupons, discounts and promotional incentives. These marketing expenditures help to enhance awareness of and increase consumer preference for our brands. We believe that greater awareness and preference promotespromote long-term growth in unit case volume, per capita consumption and our share of worldwide nonalcoholic beverage sales.
The Nonalcoholic Beverages Segment of the Commercial Beverages Industry
We operate in the highly competitive nonalcoholic beverages segment of the commercial beverages industry. We face strong competition from numerous other general and specialty beverage companies. We, along with other beverage companies, are affected by a number of factors, including, but not limited to, cost to manufacture and distribute products, consumer spending, economic conditions, availability and quality of water, consumer preferences, inflation, political climate, local and national laws and regulations, foreign currency exchange fluctuations, fuel prices and weather patterns.
Our objective is to use our formidable assets—assets — brands, financial strength, unrivaled distribution system, global reach, and a strong commitment by our management and employees worldwide—associates worldwide — to achieve long-term sustainable growth. Our vision for sustainable growth includes the following:
Areas of FocusStrategic Priorities
We intend to continue to strengthen our capabilities in consumer marketing, customer and commercial leadership, and franchise leadershiphave four strategic priorities designed to create long-term sustainable growth for our Company and the Coca-Cola system and value for our shareowners. These strategic priorities are driving global beverage leadership; accelerating innovation; leveraging our balanced geographic portfolio; and leading the Coca-Cola system for growth. To enable the entire Coca-Cola system so that we can deliver on these strategic priorities, we must further enhance our core capabilities of consumer marketing; commercial leadership; and franchise leadership.
Core Capabilities
Consumer Marketing
Marketing investments are designed to enhance consumer awareness of and increase consumer preference for our brands. This produces long-term growth in unit case volume, per capita consumption and our share of worldwide nonalcoholic beverage sales. We heighten consumer awareness of and product appeal for our brands using integrated marketing programs. Through our relationships with our bottling partners and those who sell our products in the marketplace, we create and implement integrated marketing programs, both globally and locally.locally, that are designed to heighten consumer awareness of and product appeal for our brands. In developing a strategy for a Company brand, we conduct product and packaging research, establish brand positioning, develop precise consumer communications and solicit consumer feedback. Our integrated global and local marketing programsactivities include, activities such asbut are not limited to, advertising, point-of-sale merchandising and sales promotions.
We have disciplined marketing strategies that focus on driving volume in emerging markets, increasing our brand value in developing markets and growing profit in our most developed markets. In emerging markets, we are investing in infrastructure programs that drive volume through increased access to consumers. In developing markets, where consumer access has largely been established, our focus is on differentiating our brands. In our most developed markets, we continue to invest in brands and infrastructure programs, but at a slower rate than revenue growth.
We are focused on affordability and ensuring we are communicating the appropriate message based on the current economic environment.
Customer and Commercial Leadership
The Coca-Cola system has millions of customers around the world who sell or serve our products directly to consumers. We focus on enhancing value for our customers and providing solutions to grow their beverage businesses. Our approach includes understanding each customer's business and needs, whether that customer is a sophisticated retailer in a developed market or a kiosk owner in an emerging market. We focus on ensuring that our customers have the right product and package offerings and the right promotional tools to deliver enhanced value to themselves and the Company. We are constantly looking to build new beverage consumption occasions in our customers' outlets through unique and innovative consumer experiences, product availability and delivery systems, and beverage merchandising and displays. We participate in joint brand-building initiatives with our customers in order to drive customer preference for
our brands. Through our commercial leadership initiatives, we embed ourselves further into our retail customers' businesses while developing strategies for better execution at the point of sale.
Franchise Leadership
We are renewingmust continue to improve our franchise leadership capabilities to give our Company and our bottling partners the ability to grow together through shared values, aligned incentives and a sense of urgency and flexibility that supports consumers' always changing needs and tastes. The financial health and success of our bottling partners are critical components of the Company's success. We work with our bottling partners to continuously look for waysidentify system requirements that enable us to improve system economics,quickly achieve scale and efficiencies, and we share best practices throughout the bottling system. Our system leadership allows us to leverage recent acquisitions to expand our volume base and enhance margins. With our bottling partners, we work to produce differentiated beverages and packages that are appropriate for the right channels and consumers. We also design business models for sparkling and still beverages in specific markets to ensure that we appropriately share the value created by these beverages with our bottling partners. We will continue to build a supply chain network that leverages the size and scale of the Coca-Cola system to gain a competitive advantage.
Challenges and Risks
Being a global company provides unique opportunities for our Company. Challenges and risks accompany those opportunities.
Our management has identified certain challenges and risks that demand the attention of the nonalcoholic beverages segment of the commercial beverages industry and our Company. Of these, four key challenges and risks are discussed below.
Obesity and Inactive Lifestyles. Increasing awarenessconcern among consumers, public health professionals and government agencies of the potential health problems associated with obesity and inactive lifestyles represents a significant challenge to our industry. We recognize that obesity is a complex public health problem. Our commitment to consumers begins with our broad product line, which includes a wide selection of diet and light beverages, juicejuices and juice drinks, sports drinks and water products. Our commitment also includes adhering to responsible policies in schools and in the marketplace; supporting programs to encourage physical activity and promote nutrition education; and continuously meeting changing consumer needs through beverage innovation, choice and variety. We are committed to playing an appropriate role in helping address this issue in cooperation with governments, educators and consumers through science-based solutions and programs.
Water Quality and Quantity. Water quality and quantity is an issue that increasingly requires our Company's attention and collaboration with the nonalcoholic beverages segment of the commercial beverages industry, governments, nongovernmental organizations and communities where we operate. Water is the main ingredient in substantially all of our products. It is also a limited natural resource facing unprecedented challenges from overexploitation, increasing pollution and poor management. Our Company is in an excellent position to share the water-related knowledge we have developed in the communities we serve—water-resourceserve — water resource management, water treatment, wastewater treatment systems, and models for working with communities and partners in addressing water and sanitation needs. We are actively engaged in assessing the specific water-related risks that we and many of our bottling partners face and have implemented a formal water risk management program. We are working with our global partners to develop water sustainability projects. We are actively encouraging improved water efficiency and conservation efforts throughout our system. As demand for water
continues to increase around the world, we expect commitment and continued action on our part will be crucial in the successful long-term stewardship of this critical natural resource.
Evolving Consumer Preferences. Consumers want more choices. We are impacted by shifting consumer demographics and needs, on-the-go lifestyles, aging populations in developed markets and consumers who are empowered with more information than ever. We are committed to generating new avenues for growth through our core brands with a focus on diet and light products. We are also committed to continuing to expand the variety of choices we provide to consumers to meet their needs, desires and lifestyle choices.
Increased Competition and Capabilities in the Marketplace. Our Company is facing strong competition from some well-established global companies and many local players.participants. We must continue to selectively expand into other
profitable segments of the nonalcoholic beverages segment of the commercial beverages industry and strengthen our capabilities in marketing and innovation in order to maintain our brand loyalty and market share.
All four of these challenges and risks—risks — obesity and inactive lifestyles, water quality and quantity, evolving consumer preferences, and increased competition and capabilities in the marketplace—marketplace — have the potential to have a material adverse effect on the nonalcoholic beverages segment of the commercial beverages industry and on our Company; however, we believe our Company is well positioned to appropriately address these challenges and risks.
See also "Item 1A. Risk Factors" in Part I of this report for additional information about risks and uncertainties facing our Company.
Critical Accounting Policies and Estimates
Our consolidated financial statements are prepared in accordance with accounting principles generally accepted accounting principles in the United States, which require management to make estimates, judgments and assumptions that affect the amounts reported in the consolidated financial statements and accompanying notes. We believe that our most critical accounting policies and estimates relate to the following:
Management has discussed the development, selection and disclosure of critical accounting policies and estimates with the Audit Committee of the Company's Board of Directors. While our estimates and assumptions are based on our knowledge of current events and actions we may undertake in the future, actual results may ultimately differ from these estimates and assumptions. For a discussion of the Company's significant accounting policies, refer to Note 1 of Notes to Consolidated Financial Statements.
Basis of Presentation and Consolidation
In December 2003,Our consolidated financial statements are prepared in accordance with accounting principles generally accepted in the Financial Accounting Standards Board ("FASB") issued Interpretation No. 46(R). We adopted Interpretation No. 46(R) effective April 2, 2004. Refer to Note 1 of Notes to Consolidated Financial Statements.
Our Company consolidates all entities that we control by ownership of a majority voting interest as well as variable interest entities for which our Company is the primary beneficiary. Our judgment in determining if we are the primary beneficiary of the variable interest entities includes assessing our Company's level of involvement in setting up the entity, determining if the activities of the entity are substantially conducted on
behalfUnited States. The preparation of our Company, determining whetherconsolidated financial statements requires us to make estimates and assumptions that affect the Company provides more than halfreported amounts of assets, liabilities, revenues and expenses and the subordinateddisclosure of contingent assets and liabilities in our consolidated financial support tostatements and accompanying notes. Although these estimates are based on our knowledge of current events and actions we may undertake in the entity,future, actual results may ultimately differ from estimates and determiningassumptions. Furthermore, when testing assets for impairment in future periods, if we absorb the majority of the entity's expected lossesmanagement uses different assumptions or returns.if different conditions occur, impairment charges may result.
We use the equity method to account for investments for which we havein companies if our investment provides us with the ability to exercise significant influence over operating and financial policies.policies of the investee. Our consolidated net income includes our Company's proportionate share of the net earningsincome or loss of these companies. The carrying values of our equity method investments are increased or decreased by our proportionate share of the net income or loss and other comprehensive income (loss) ("OCI") of these companies. The carrying values of our equity method investments are also decreased by dividends we receive from the investees. Our judgment regarding the level of influence over each equity method investment includes considering key factors such as our ownership interest, representation on the board of directors, participation in policy-making decisions and material intercompany transactions.
We use the cost method to account for investments in companies that we do not control and for which we do not have the ability to exercise significant influence over operating and financial policies. In accordance with the cost method, these investments are recorded at cost or fair value, as appropriate. We record dividend income when applicable dividends are declared.
Our Company eliminateseliminate from our financial results all significant intercompany transactions, including the intercompany transactions with consolidated VIEs and the intercompany portion of transactions with equity method investees.
Accounting principles generally accepted in the United States provide entities the option to measure many financial instruments and certain other items at fair value, with the change in fair value being included in the determination of
net income. The Company has currently chosen not to elect the fair value option; and therefore, we only measure assets and liabilities at fair value if required under other accounting guidance.
Certain amounts in the prior years' consolidated financial statements and notes have been revised to conform to the current year presentation.
Principles of Consolidation
Our Company consolidates all entities that we control by ownership of a majority voting interest as well as VIEs of which our Company is the primary beneficiary. Generally, we consolidate only business enterprises that we control by ownership of a majority voting interest. However, there are situations in which consolidation is required even though the usual condition (ownership of a majority voting interest) of consolidation does not apply. These situations generally occur when one entity has a controlling financial interest in another business enterprise that was achieved through arrangements that do not involve voting interests, which results in a disproportionate relationship between such entity's voting interests in, and its exposure to the economic risks and potential rewards of, the other business enterprise. This disproportionate relationship results in what is known as a variable interest, and the entity in which we have the variable interest is referred to as a VIE.
In accordance with accounting principles generally accepted in the United States as of December 31, 2009, the best evidence of control of a VIE is not necessarily voting interests. The entity that holds a majority of the variable interests in a VIE is deemed to be the primary beneficiary and therefore to control the entity. Upon consolidation, the primary beneficiary is generally required to include assets, liabilities and noncontrolling interests at fair value and subsequently account for the variable interest as if it were consolidated based on a majority voting interest.
Our Company holds interests in certain entities, primarily bottling operations, that are considered VIEs. These variable interests relate to profit guarantees or subordinated financial support for these entities. Our Company's investments, plus any loans and guarantees, related to these VIEs totaled approximately $708 million and $604 million at December 31, 2009, and 2008, respectively, representing our maximum exposures to loss. Creditors of the VIEs do not have recourse against the general credit of the Company as a result of including these VIEs in our consolidated financial statements. The Company's investment, plus any loans and guarantees, related to VIEs was not significant to the Company's consolidated financial statements. In addition, assets and liabilities of VIEs for which we are the primary beneficiary were not significant to the Company's consolidated financial statements. We do not have any significant variable interests in entities for which we were not determined to be the primary beneficiary.
In June 2009, the Financial Accounting Standards Board ("FASB") amended its guidance on accounting for VIEs. The new accounting guidance resulted in a change in our accounting policy effective January 1, 2010. Among other things, the new guidance requires more qualitative than quantitative analyses to determine the primary beneficiary of a VIE, requires continuous assessments of whether an enterprise is the primary beneficiary of a VIE, enhances disclosures about an enterprise's involvement with a VIE, and amends certain guidance for determining whether an entity is a VIE. Under the new guidance, a VIE must be consolidated if the enterprise has both (a) the power to direct the activities of the VIE that most significantly impact the entity's economic performance, and (b) the obligation to absorb losses or the right to receive benefits from the VIE that could potentially be significant to the VIE.
Beginning January 1, 2010, we deconsolidated certain entities as a result of this change in accounting policy. These entities are primarily bottling operations and had previously been consolidated due to certain loan guarantees and/or other financial support given by the Company. These financial arrangements, although not significant to our consolidated financial statements, resulted in a disproportionate relationship between our voting interests in these entities and our exposure to the economic risks and potential rewards of the entities. As a result, we determined that we held a majority of the variable interests in these entities and, therefore, were deemed to be the primary beneficiary. The loan guarantees and/or other financial support given by the Company to these entities are included in the calculation of our maximum exposure to loss discussed above. Although these financial arrangements resulted in us holding a majority of the variable interests in these VIEs, the majority of these arrangements did not empower us to direct the activities of the VIEs that most significantly impact the VIEs' economic performance. Consequently, subsequent to the change in accounting policy, the Company deconsolidated the majority of these VIEs.
The entities that have been deconsolidated accounted for less than 1 percent of net income attributable to shareowners of The Coca-Cola Company in 2009, and we have accounted for these entities under the equity method of accounting since January 1, 2010. Although the deconsolidation of these entities will impact individual line items in our consolidated financial statements, the impact on net income attributable to shareowners of The Coca-Cola Company in future periods will be nominal. The equity method of accounting is intended to be a single line consolidation and, therefore, generally should result in the same net income attributable to the investor as would be the case if the investee had been consolidated. The main impact on our consolidated financial statements beginning in 2010 will be that instead of these entities' results of operations and balance sheets affecting our consolidated line items, our proportionate share of net income or loss from these entities will be reported in equity income (loss) — net, in our consolidated income statements, and our investment in these entities will be reported as equity method investments in our consolidated balance sheets. Refer to the heading "Operations Review" for the estimated impact that the deconsolidation of these entities will have on individual line items in our consolidated income statements in future periods.
Recoverability of Noncurrent Assets
We perform recoverability and impairment tests of noncurrent assets in accordance with accounting principles generally accepted in the United States. For certain assets, recoverability and/or impairment tests are required only when conditions exist that indicate the carrying value may not be recoverable. For other assets, impairment tests are required at least annually, or more frequently, if events or circumstances indicate that an asset may be impaired.
Our equity method investees also perform such recoverability and/or impairment tests. If an impairment charge was recorded by one of our equity method investees, the Company would record its proportionate share of such charge as a reduction of equity income (loss) — net in our consolidated income statements. However, the actual amount we record with respect to our proportionate share of such charges may be impacted by items such as basis differences, deferred taxes and deferred gains.
Management's assessments of the recoverability and impairment tests of noncurrent assets involve critical accounting estimates. These assessments reflect management's best assumptions, which, when appropriate,estimates require significant management judgment, include inherent uncertainties and are consistent with the assumptions that we believe hypothetical marketplace participants would use.often interdependent; therefore, they do not change in isolation. Factors that management must estimate when performing recoverability and impairment tests include, among others, the economic life of the asset, sales volume, prices, inflation, cost of capital, marketing spending, foreign currency exchange rates, tax rates and capital spending. These factors are often interdependent and therefore do not change in isolation. These factors include inherent uncertainties, and significant management judgment is involved in estimating their impact. However,even more difficult to predict when appropriate, the assumptionsglobal financial markets are highly volatile. The estimates we use for financial reporting purposeswhen assessing the recoverability of noncurrent assets are consistent with those we use in our internal planning andplanning. When performing impairment tests, we estimate the fair values of the assets using management's best assumptions, which we believe arewould be consistent with those thatwhat a hypothetical marketplace participant would use. Management periodically evaluatesEstimates and updates the estimates based on the conditions that influenceassumptions used in these factors.tests are evaluated and updated as appropriate. The variability of these factors depends on a number of conditions, including uncertainty about future events, and thus our accounting estimates may change from period to period. If other assumptions and estimates had been used in the current period, the balances for noncurrent assetswhen these tests were performed, impairment charges could have been materially impacted.resulted. As mentioned above, these factors do not change in isolation; and therefore, we do not believe it is practicable to present the impact of changing a single factor. Furthermore, if management uses different assumptions or if different conditions occur in future periods, future operating resultsimpairment charges could be materially impacted.result.
Our Company faces many uncertainties and risks related to various economic, political and regulatory environments in the countries in which we operate.operate, particularly in developing or emerging markets. Refer to the heading "Our Business—Business — Challenges and Risks," above, and "Item 1A. Risk Factors" in Part I of this report. As a result, management must make numerous assumptions which involve a significant amount of judgment when determining thecompleting recoverability and impairment tests of noncurrent assets in various regions around the world.
ForInvestments in Equity and Debt Securities
The carrying values of our investments in equity securities are determined using the noncurrent assets listed inequity method, the table below, we perform testscost method or the fair value method. Refer to the heading "Basis of impairment as appropriate. For applicable assets, we perform these tests when certain conditions exist that indicatePresentation," above, for information related to how the carrying values of our equity method investments are determined. We account for investments in companies that we do not control or account for under the equity method either at fair value may notor under the cost method, as applicable. Investments in equity securities are carried at fair value, if the fair value of the security is readily determinable. Equity investments
be recoverable. Forcarried at fair value are classified as either trading or available-for-sale securities. Realized and unrealized gains and losses on trading securities and realized gains and losses on available-for-sale securities are included in net income. Unrealized gains and losses, net of deferred taxes, on available-for-sale securities are included in our consolidated balance sheets as a component of accumulated other comprehensive income (loss) ("AOCI"). Trading securities are reported as marketable securities in our consolidated balance sheets. Securities classified as available-for-sale are reported as either marketable securities or other investments in our consolidated balance sheets, depending on the length of time we intend to hold the investment. Investments in equity securities that do not qualify for fair value accounting are accounted for under the cost method. In accordance with the cost method, our initial investment is recorded at cost and we record dividend income when applicable assets, we perform these testsdividends are declared. Cost method investments are reported as other investments in our consolidated balance sheets.
Our investments in debt securities are carried at least annuallyeither amortized cost or more frequently if events or circumstances indicatefair value. Investments in debt securities that an asset may be impaired:
| December 31, 2006 | Carrying Value | Percentage of Total Assets | |||||
(In millions except percentages) | |||||||
Tested for impairment when conditions exist that indicate carrying value may be impaired: | |||||||
| Equity method investments | $ 6,310 | 21 | % | ||||
| Cost method investments, principally bottling companies | 473 | 2 | |||||
| Other assets | 2,701 | 9 | |||||
| Property, plant and equipment, net | 6,903 | 23 | |||||
| Amortized intangible assets, net (various, principally trademarks) | 198 | 0 | |||||
| Total | $ 16,585 | 55 | % | ||||
Tested for impairment at least annually or when events indicate that an asset may be impaired: | |||||||
| Trademarks with indefinite lives | $ 2,045 | 7 | % | ||||
| Goodwill | 1,403 | 5 | |||||
| Bottlers' franchise rights | 1,359 | 5 | |||||
| Other intangible assets not subject to amortization | 130 | 0 | |||||
| Total | $ 4,937 | 17 | % | ||||
Many of the noncurrent assets listed aboveCompany has the positive intent and ability to hold to maturity are locatedcarried at amortized cost and classified as held-to-maturity. Investments in marketsdebt securities that we consider to be developing or to have changing political environments. These markets include, but are not limited to,classified as held-to-maturity are carried at fair value and classified as either trading or available-for-sale.
The following table presents the Middle East and Egypt, where political and civil unrest continues; the Philippines, where affordability and availabilitycarrying values of beverages in the marketplace continue to impact operating results; India, where affordability issues remain; and certain markets in Latin America, Asia and Africa, where local economic and political conditions are unstable. We have bottling assets andour investments in many of these markets. The table below reflectsequity and debt securities (in millions):
December 31, 2009 | Carrying Value | Percentage of Total Assets | |||||
Equity method investments | $ 6,217 | 13 | % | ||||
Securities classified as available-for-sale | 398 | * | |||||
Cost method investments | 149 | * | |||||
Securities classified as held-to-maturity | 199 | * | |||||
Securities classified as trading | 61 | * | |||||
Total | $ 7,024 | 14 | % | ||||
* Accounts for less than 1 percent of the Company's total assets. | |||||||
Investments classified as trading securities are not assessed for impairment, since they are carried at fair value with the Company's carryingchange in fair value of noncurrent assetsincluded in these markets.
| December 31, 2006 | Carrying Value | Percentage of Applicable Line Item Above | |||||
(In millions except percentages) | |||||||
Tested for impairment when conditions exist that indicate carrying value may be impaired: | |||||||
| Equity method investments | $ 533 | 8 | % | ||||
| Cost method investments, principally bottling companies | 123 | 26 | |||||
| Other assets | 83 | 3 | |||||
| Property, plant and equipment, net | 2,150 | 31 | |||||
| Amortized intangible assets, net (various, principally trademarks) | 11 | 6 | |||||
| Total | $ 2,900 | 17 | |||||
Tested for impairment at least annually or when events indicate that an asset may be impaired: | |||||||
| Trademarks with indefinite lives | $ 394 | 19 | % | ||||
| Goodwill | — | 0 | |||||
| Bottlers' franchise rights | 52 | 4 | |||||
| Other intangible assets not subject to amortization | 23 | 18 | |||||
| Total | $ 469 | 9 | |||||
Equity Method and Cost Method Investments
net income. We review our investments in equity and debt securities that are accounted for using the equity method or cost method investments in everyor that are classified as available-for-sale or held-to-maturity each reporting period to determine whether a significant event or change in circumstances has occurred that may have an adverse effect on the fair value of each investment. When such events or changes occur, we evaluate the fair value compared to our cost basis in the carrying value of the related investment. We also perform this evaluation every reporting period for each investment for which the carrying valueour cost basis has exceeded the fair value in the prior period. The fair values of most of our Company's investments in publicly traded companies are often readily available based on quoted market prices. For investments in nonpublicly traded companies, management's assessment of fair value is based on valuation methodologies including discounted cash flows, estimates of sales proceeds and external appraisals, as appropriate. We consider the assumptions that we believe hypothetical marketplace participants would use in evaluating estimated future cash flows when employing the discounted cash flow or estimateestimates of sales proceeds valuation methodologies. The ability to accurately predict future cash flows, especially in developing and unstableemerging markets, may impact the determination of fair value.
In the event a decline inthe fair value of an investment occurs,declines below our cost basis, management may beis required to determine if the decline in fair value is other than temporary. If management determines the decline is other than temporary, an impairment charge is recorded. Management's assessment as to the nature of a decline in fair value is based on, among other things, the valuation methodologies discussed above,length of time and the extent to which the market value has been less than our cost basis, the financial condition and near-term prospects of the issuer, and our intent and ability and intent to holdretain the investment and whether evidence indicatingin the cost of the investment is recoverable withinissuer for a reasonable period of time outweighs evidencesufficient to allow for any anticipated recovery in market value.
As of December 31, 2009, the contrary. We consider most ofCompany had several investments classified as available-for-sale securities in which our equity method investees to be strategic long-term investments. Ifcost basis had exceeded the fair value of anthe investment. Unrealized gains and losses on available-for-sale securities, as of December 31, 2009, were approximately $176 million and $21 million, respectively. Management assessed each individual investment is less than its carrying value andwith unrealized losses to determine if the decline in fair value is consideredwas other than temporary. Based on these assessments, management determined that the decline in fair value of each of these investments was temporary
in nature. We will continue to bemonitor these investments in future periods. Refer to Note 2 of Notes to Consolidated Financial Statements.
During the first quarter of 2009, the Company recorded a charge of approximately $27 million in other income
(loss) — net as a result of an other-than-temporary decline in the fair value of a cost method investment. As of December 31, 2008, the estimated fair value of this investment approximated the Company's carrying value in the investment. However, during the first quarter of 2009, the Company was informed by the investee of its intent to reorganize its capital structure in 2009, which would result in the Company's shares in the investee being canceled. As a result, the Company determined that the decline in fair value of this cost method investment was other than temporary. This impairment charge impacted the Corporate operating segment. Refer to the heading "Operations Review — Other Income (Loss) — Net," and Note 13 and Note 14 of Notes to Consolidated Financial Statements.
As of December 31, 2008, the Company had several investments classified as available-for-sale securities in which our cost basis exceeded the fair value of the investment, each of which initially occurred between the end of the second quarter and the beginning of the third quarter of 2008. Management assessed each individual investment to determine if the decline in fair value was other than temporary. Based on these assessments, management determined that the decline in fair value of each investment was other than temporary based on a write-down is recorded. Management's assessmentsnumber of factors, including, but not limited to, uncertainty regarding our intent to hold certain of these investments for a period of time that would be sufficient to recover our cost basis in the event of a market recovery; the fact that the fair value representof each investment had continued to decline since the time that our best estimates ascost basis initially exceeded its fair value; and the Company's uncertainty around the near-term prospects for certain of the timeinvestments. As a result of the other-than-temporary decline in fair value of these investments, the Company recognized impairment reviewcharges of approximately $81 million during the fourth quarter of 2008. Certain of these investments are classified as marketable securities, while others are classified as other investments in the consolidated balance sheets. These impairment charges were recorded to other income (loss) — net in the consolidated statement of income. Refer to the heading "Operations Review — Other Income (Loss) — Net," and are consistent with the assumptions that we believe hypothetical marketplace participants would use. If different assessments were made, this could have a material impact on our consolidated financial statements.Note 2 and Note 14 of Notes to Consolidated Financial Statements.
The following table presents the difference between calculated fair values, based on quoted closing prices of publicly traded shares, and our Company's carrying values for significant investmentscost basis in publicly traded bottlers accounted for as equity method investeesinvestments (in millions):
| December 31, 2006 | Fair Value | Carrying Value | Difference | |||
| Coca-Cola Enterprises Inc. | $ 3,450 | $ 1,312 | 1 | $ 2,138 | ||
| Coca-Cola Hellenic Bottling Company S.A. | 2,247 | 1,251 | 996 | |||
| Coca-Cola FEMSA, S.A.B. de C.V. | 2,172 | 835 | 1,337 | |||
| Coca-Cola Amatil Limited | 1,456 | 817 | 639 | |||
| Coca-Cola Icecek A.S. | 372 | 110 | 262 | |||
| Grupo Continental, S.A. | 327 | 165 | 162 | |||
| Coca-Cola Embonor S.A. | 228 | 189 | 39 | |||
| Coca-Cola Bottling Company Consolidated | 170 | 68 | 102 | |||
| Embotelladoras Polar S.A. | 93 | 59 | 34 | |||
| $ 10,515 | $ 4,806 | $ 5,709 | ||||
December 31, 2009 | Fair Value | Carrying Value | Difference | ||||
Coca-Cola FEMSA, S.A.B. de C.V. | $ 3,892 | $ 1,062 | $ 2,830 | ||||
Coca-Cola Enterprises Inc.1 | 3,582 | 25 | 3,557 | ||||
Coca-Cola Amatil Limited | 2,348 | 868 | 1,480 | ||||
Coca-Cola Hellenic Bottling Company S.A. | 1,959 | 1,406 | 553 | ||||
Coca-Cola Icecek A.S. | 502 | 160 | 342 | ||||
Grupo Continental, S.A.B. | 401 | 169 | 232 | ||||
Coca-Cola Embonor S.A. | 289 | 258 | 31 | ||||
Coca-Cola Bottling Co. Consolidated | 134 | 72 | 62 | ||||
Embotelladoras Coca-Cola Polar S.A. | 108 | 94 | 14 | ||||
| $ 13,215 | $ 4,114 | $ 9,101 | |||||
1 | ||||||||
Other Assets
Our Company invests in infrastructure programs with our bottlers that are directed at strengthening our bottling system and increasing unit case volume. Additionally, our Company advances payments to certain customers to fund future marketing activities intended to generate profitable volume and expenses such payments over the periods benefited. Advance payments are also made to certain customers for distribution rights. Payments under these programs are generally capitalized and reported as other assets in our consolidated
balance sheets. Management evaluates the recoverabilityAs of December 31, 2009, the carrying value of these assets whenwas approximately $1,976 million, or 4 percent of our total assets. When facts and circumstances indicate that the carrying value of these assets may not be recoverable, management assesses the
recoverability of the carrying value by preparing estimates of sales volume and the resulting gross profit and cash flows. If the carrying value of these assets is assessed to be recoverable, it is amortized over the periods benefited. If the carrying value of these assets is considered to be not recoverable, an impairment is recognized, resulting in a write-down of assets.
Property, Plant and Equipment
Certain events or changes in circumstances may indicate that the recoverability of the carrying amount of property, plant and equipment should be assessed. Such events or changes may include a significant decrease in market value, a significant change in the business climate in a particular market, or a current-period operating or cash flow loss combined with historical losses or projected future losses. If an event occurs or changes in circumstances are present, we estimate theThese estimated future cash flows expected to result from theare consistent with those we use of the asset and its eventual disposition.in our internal planning. If the sum of the expected future cash flows (undiscounted and without interest charges) is less than the carrying amount, we recognize an impairment loss. The impairment loss recognized is the amount by which the carrying amount exceeds the fair value.
Property, Plant and Equipment
As of December 31, 2009, the carrying value of our property, plant and equipment, net of depreciation, was approximately $9,561 million, or 20 percent of our total assets. Certain events or changes in circumstances may indicate that the recoverability of the carrying amount of property, plant and equipment should be assessed, including, among others, a significant decrease in market value, a significant change in the business climate in a particular market, or a current period operating or cash flow loss combined with historical losses or projected future losses. When such events or changes in circumstances are present, we estimate the future cash flows expected to result from the use of the asset (or asset group) and its eventual disposition. These estimated future cash flows are consistent with those we use in our internal planning. If the sum of the expected future cash flows (undiscounted and without interest charges) is less than the carrying amount, we recognize an impairment loss. The impairment loss recognized is the amount by which the carrying amount exceeds the fair value. We use a variety of methodologies to determine the fair value of property, plant and equipment, including appraisals and discounted cash flow models, which are consistent with the assumptions we believe hypothetical marketplace participants would use.
In 2007, our Company recorded a charge of approximately $99 million in equity income (loss) — net. This charge was primarily related to our proportionate share of asset impairments recorded by Coca-Cola Bottlers Philippines, Inc., ("CCBPI") due to excess and obsolete bottles and cases. These charges impacted the Bottling Investments operating segment. Refer to the heading "Operations Review — Equity Income (Loss) — Net," and Note 14 of Notes to Consolidated Financial Statements.
Goodwill, Trademarks and Other Intangible Assets
Statement of Financial Accounting Standards ("SFAS") No. 142, "Goodwill and Other Intangible Assets," classifies intangible assets are classified into one of three categories: (1) intangible assets with definite lives subject to amortization; (2) intangible assets with indefinite lives not subject to amortization; and (3) goodwill. For intangible assets with definite lives, tests for impairment must be performed if conditions exist that indicate the carrying value may not be recoverable. For intangible assets with indefinite lives and goodwill, tests for impairment must be performed at least annually or more frequently if events or circumstances indicate that assets might be impaired. Our equity method investees also perform such tests for impairment for
The following table presents the carrying values of intangible assets and/or goodwill. If an impairment charge was recorded by one ofincluded in our equity method investees, the Company would record its proportionate share of such charge.consolidated balance sheet (in millions):
In 2006, our Company recorded a charge of approximately $602 million in the line item equity income—net resulting from the impact of our proportionate share of an impairment charge recorded by CCE, which impacted Bottling Investments. Refer to the heading "Operations Review—Equity Income—Net"
December 31, 2009 | Carrying Value | Percentage of Total Assets | |||||
Trademarks with indefinite lives | $ 6,183 | 13 | % | ||||
Goodwill | 4,224 | 9 | |||||
Bottlers' franchise rights | 1,953 | 4 | |||||
Definite-lived intangible assets, net | 344 | * | |||||
Other intangible assets not subject to amortization | 124 | * | |||||
Total | $ 12,828 | 26 | % | ||||
* Accounts for less than 1 percent of the Company's total assets. | |||||||
When facts and Note 3 of Notes to Consolidated Financial Statements.
Our trademarks and other intangible assets determined to have definite lives are amortized over their useful lives. In accordance with SFAS No. 142, if conditions existcircumstances indicate that indicate the carrying value of definite-lived intangible assets may not be recoverable, management assesses the recoverability of the carrying value by preparing estimates of sales volume and the resulting gross profit and cash flows. These estimated future cash flows are consistent with those we review such trademarksuse in our internal planning. If the sum of the expected future cash flows (undiscounted and other intangiblewithout interest charges) is less than the carrying amount, we recognize an impairment loss. The impairment loss recognized is the amount by which the carrying amount exceeds the fair value. We use a variety of methodologies to determine the fair value of these assets, including discounted cash flow models, which are consistent with definite lives for impairment to ensure they are appropriately valued. Such conditions may include an economic downturn in a market or a change in the assessment of future operations. Trademarks and otherassumptions we believe hypothetical marketplace participants would use.
We test intangible assets determined to have indefinite useful lives, are not amortized. We test suchincluding trademarks, franchise rights and other intangible assets with indefinite useful livesgoodwill, for impairment annually, or more frequently if events or circumstances indicate that assets might be impaired. GoodwillOur Company performs these annual impairment reviews as of the first day of our third fiscal quarter. We use a variety of methodologies in conducting impairment assessments of indefinite-lived intangible assets, including, but not limited to, discounted cash flow models, which are based on the assumptions we believe hypothetical marketplace participants would use. For indefinite-lived intangible assets, other than goodwill, if the carrying amount exceeds the fair value, an impairment charge is not amortized. recognized in an amount equal to that excess.
We also perform impairment tests for impairment of goodwill annually, or more frequently if events or circumstances indicate it might be impaired. All goodwillat our reporting unit level, which is assigned to reporting units, which are one level below our operating segments. Our operating segments are primarily based on geographic responsibility, which is consistent with the way management runs our business. Our operating segments are subdivided into smaller geographic regions or territories that we sometimes refer to as business units. These business units are also our reporting units. The Bottling Investments operating segment includes all Company-owned or consolidated bottling operations, regardless of geographic location. Generally, each Company-owned or consolidated bottling operation within our Bottling Investments operating segment is its own reporting unit. Goodwill is assigned to the reporting unit or units that benefitsbenefit from the synergies arising from each business combination. We perform our impairment tests of goodwill athad no changes to our reporting unit level. Impairment tests forunits in 2009.
The goodwill include comparingimpairment test consists of a two-step process, if necessary. The first step is to compare the fair value of the respectivea reporting unit withto its carrying value, including goodwill. We typically use a variety of methodologies in conducting these impairment assessments, includingdiscounted cash flow analyses that, when appropriate,models to determine the fair value of a reporting unit. The assumptions used in these models are consistent with the assumptionsthose we believe hypothetical marketplace participants would use, estimatesuse. If the fair value of sales proceeds and independent appraisals. Where applicable, we usethe reporting unit is less than its carrying value, the second step of the impairment test must be performed in order to determine the amount of impairment loss, if any. The second step compares the implied fair value of the reporting unit goodwill with the carrying amount of that goodwill. If the carrying amount of the reporting unit's goodwill exceeds its implied fair value, an appropriate discount rateimpairment charge is recognized in an amount equal to that excess. The loss recognized cannot exceed the carrying amount of goodwill.
Intangible assets acquired in recent transactions are naturally more susceptible to impairment, primarily due to the fact that they are recorded at fair value based on recent operating plans and macroeconomic conditions present at the Company'stime of acquisition. Consequently, if operating results and/or macroeconomic conditions deteriorate shortly after an acquisition, it could result in the impairment of the acquired assets. A deterioration of macroeconomic conditions may not only negatively impact the estimated operating cash flows used in our cash flow models, but may also negatively impact other assumptions used in our analyses, including, but not limited to, the estimated cost of capital rate and/or location-specific economic factors.
In 2006,discount rates. Additionally, as discussed above, in accordance with accounting principles generally accepted in the United States, we are required to ensure that assumptions used to determine fair value in our analyses are consistent with the assumptions a hypothetical marketplace participant would use. As a result, the cost of capital and/or discount rates used in our analyses may increase or decrease based on market conditions and trends, regardless of whether our Company's actual cost of capital has changed. Therefore, our Company recordedmay recognize an impairment charges of an intangible asset or assets in spite of realizing actual cash flows that are approximately $41 million primarily relatedequal to trademarks for beverages soldor greater than our previously forecasted amounts. The Company has acquired significant intangible assets in the Philippinespast several years through asset acquisitions and Indonesia. The Philippinesbusiness combinations, including, among others, the acquisition of brands and Indonesia are componentslicenses in Denmark and Finland from Carlsberg Group Beverages ("Carlsberg"); 18 German bottling and distribution operations; Energy Brands Inc., also known as glacéau; and CCBPI. Refer to Note 17 of East, South Asia and Pacific Rim. TheNotes to Consolidated Financial Statements for more detailed information about recently acquired intangible assets.
As of our most recent annual impairment review, the Company had no significant impairments of its intangible assets, individually or in the aggregate. In addition, as of December 31, 2009, we did not have any reporting units with a material amount of thesegoodwill for which it is reasonably likely that they will fail step one of a goodwill impairment charges was determined by comparingtest in the fair valuesnear term. However, if macroeconomic conditions continue to worsen, it is possible that we may experience significant impairments of thesome of our intangible assets, which would require us to their respective carrying values. The fair values were determined using discounted cash flow analyses. Because the fair values were less than the carrying values of the assets, we recordedrecognize impairment charges to reduce the carrying values of the assets to their respective fair values. These impairment charges were recorded in the line item other operating charges in the consolidated statement of income.
In December 2006, the Company entered into a purchase agreement with San Miguel Corporation and two of its subsidiaries (collectively, "SMC") to acquire all of the shares of capital stock of Coca-Cola Bottlers Philippines, Inc. ("CCBPI") held by SMC, representing 65 percent of all the issued and outstanding capital stock of CCBPI. CCBPI is the Company's authorized bottler in the Philippines. The transaction is subject to certain conditions. Upon the closing of this transaction, the Company will own 100 percent of the issued and outstanding capital stock of CCBPI.charges. Management will continue to monitor the Philippines and conduct impairment reviews as required.
In 2005, our Company recorded impairment charges of approximately $84 million related to intangible assets. These intangible assets related to trademarks for beverages sold in the Philippines. The carryingfair value of our trademarksintangible assets in future periods.
In 2009, the Company recognized a $23 million impairment charge due to a change in the Philippines, priorexpected useful life of an intangible asset, which was previously determined to have an indefinite life. Refer to the recordingheading "Operations Review — Other Operating Charges," and Note 13 of Notes to Consolidated Financial Statements.
As previously mentioned, the impairment charges in 2005, was approximately $268 million. The impairments were the result of our revised outlook for the Philippines, which had been unfavorably impacted by declines in volume and income before income taxes resulting from the continued lack of an affordable package offering and the continued limited availability of these trademark beverages in the marketplace. We determined the amounts of the impairment charges by comparing the fair values of the intangible assetsCompany is required to their then carrying values. Fair values were derived using discounted cash flow analyses with a number of scenarios that were weighted based on the probability of different outcomes. Because the fair values were less than the carrying values of the assets, we recorded impairment charges to reduce the carrying values of the assets to fair values. In addition, in 2005, we recorded an impairment charge of approximately $4 million in the line item equity income—net related to ourrecord its proportionate share of a write-down of intangible assetsimpairment charges recorded by our equity method investee bottlerinvestees. In 2008, we recorded our proportionate share of approximately $7.6 billion pretax ($4.9 billion after-tax) of charges recorded by CCE due to impairments of its North American franchise rights in the Philippines.
In 2004, our Company recorded impairmentsecond quarter and fourth quarter of 2008. The Company's proportionate share of these charges related to intangible assetswas approximately $1.6 billion. The decline in the estimated fair value of approximately $374 million, primarily related toCCE's North American franchise rights at CCEAG. CCEAG is a component of Bottling Investments. The CCEAG impairment charges wereduring the second quarter was the result of our revised outlookseveral factors including, but not limited to, (1) challenging macroeconomic conditions which contributed to lower than anticipated volume for the German market, which was unfavorably impacted by volume declines resulting from market shifts related to the deposit law on nonrefillable beveragehigher-margin packages and the corresponding lackcertain higher-margin beverage categories; (2) increases in raw material costs including significant increases in aluminum, HFCS and resin; and (3) increased delivery costs as a result of availability of our productshigher fuel costs. The decline in the discount retail channel. The deposit law in Germany had led to discount chains creating proprietary nonrefillable packages that could only be returned to their own stores. We determined the amount of the impairment by comparing theestimated fair value of CCE's North American franchise rights during the intangible assets to its then carrying value. Fair values were derived using discounted cash flow analyses with a number of scenarios that were weighted based on the probability of different outcomes. Because the fair valuefourth quarter was less than the carrying valueprimarily driven by financial market conditions as of the assets, we recorded an impairmentmeasurement date that caused (1) a dramatic increase in market debt rates, which impacted the capital charge, to reduce the carrying value of the assets to fair value. These impairment charges were recordedand (2) a significant decline in the line item other operatingfunded status of CCE's defined benefit pension plans. In addition, the market price of CCE's common stock declined by more than 50 percent between the date of CCE's interim impairment test (May 23, 2008) and the date of CCE's annual impairment test (October 24, 2008). Our proportionate share of these charges was recorded to equity income (loss) — net in our consolidated statement of income for 2004. Atand impacted the end of 2004, the German government passed an amendmentBottling Investments operating segment. Refer to the mandatory deposit legislation that requires retailers, including discount chains,heading "Operations Review — Equity Income (Loss) — Net" and Note 14 of Notes to accept returns of each type of nonrefillable beverage package they sell, regardless of where the beverage package type was purchased. In addition, the mandatory deposit requirement was expanded to other beverage categories.Consolidated Financial Statements.
In August 2006, the Company announced that it had reached an agreement in principle with its independent bottlers in Germany regarding the creation of a single bottler. A non-binding letter of intent was signed containing the financial framework and the key conditions under which CCEAG and the seven independent bottlers will become one bottler. We currently expect that this consolidation will occur in 2007. The Company will be the majority owner of the consolidated bottling operation in Germany. The Company has
considered and will continue to consider the effect of these future structural changes on the recoverability of noncurrent assets and investments in bottling operations in Germany.
Revenue Recognition
We recognize revenue when persuasive evidence of an arrangement exists, delivery of products has occurred, the sales price is fixed or determinable, and collectibility is reasonably assured. For our Company, this generally means that we recognize revenue when title to our products is transferred to our bottling partners, resellers or other customers. In particular, title usually transfers upon shipment to or receipt at our customers' locations, as determined by the specific sales terms of each transaction. Our sales terms do not allow for a right of return except for matters related to any manufacturing defects on our part.
In addition, ourOur customers can earn certain incentives, which are included in deductions from revenue, a component of net operating revenues in the consolidated statements of income. These incentives include, but are not limited to, cash discounts, funds for promotional and marketing activities, volume-based incentive programs and support for infrastructure programs. Refer to Note 1 of Notes to Consolidated Financial Statements. The aggregate deductions from revenue recorded by the Company in relation to these programs, including amortization expense on infrastructure programs, waswere approximately $3.8$4.5 billion, $3.7$4.4 billion and $3.6$4.1 billion for the years ended December 31, 2006, 20052009, 2008 and 2004,2007, respectively. In preparing the financial statements, management must make estimates related to the contractual terms, customer performance and sales volume to determine the total amounts recorded as deductions from revenue. Management also considers past results in making such estimates. The actual amounts ultimately paid may be different from our estimates. Such differences are recorded once they have been determined, and have historically not been significant.
Income Taxes
In July 2006, the FASB issued FASB Interpretation No. 48, "Accounting for Uncertainty in Income Taxes" ("Interpretation No. 48"). Interpretation No. 48 clarifiesaccounting guidance that clarified the accounting for uncertainty in income taxes recognized in an enterprise's financial statements in accordance with FASB Statement No. 109, "Accounting for Income Taxes." Interpretation No. 48statements. This guidance prescribes a recognition threshold and measurement attribute for the financial statement recognition and measurement of a tax position taken or expected to be taken in a tax return. Interpretation No. 48It also provides guidance on derecognition, classification, interest and penalties, accounting in interim periods, disclosure and transition. ForOur Company adopted the provisions of this accounting guidance and changed our Company, Interpretation No. 48accounting policy effective January 1, 2007. As a result, we recorded an approximate $65 million increase in accrued income taxes in our consolidated balance sheet for unrecognized tax benefits, which was effective beginningaccounted for as a cumulative effect adjustment to the January 1, 2007, and the cumulative effect adjustment will be recorded in the first quarterbalance of 2007. We believe that the adoption of Interpretation No. 48 will not have a material impact on our consolidated financial statements.reinvested earnings.
Our annual tax rate is based on our income, statutory tax rates and tax planning opportunities available to us in the various jurisdictions in which we operate. Significant judgment is required in determining our annual tax expense and in evaluating our tax positions. We establish reserves to remove some or all of the tax benefit of any of our tax positions at the time we determine itthat the positions become uncertain based upon one of the following: (1) the tax position is probablenot "more likely than not" to be sustained, (2) the tax position is "more likely than not" to be sustained, but for a lesser amount, or (3) the tax position is "more likely than not" to be sustained, but not in the financial period in which
the tax position was originally taken. For purposes of evaluating whether or not a tax position is uncertain, (1) we presume the tax position will be liableexamined by the relevant taxing authority that has full knowledge of all relevant information, (2) the technical merits of a tax position are derived from authorities such as legislation and statutes, legislative intent, regulations, rulings and case law and their applicability to pay additional taxes related to certain matters.the facts and circumstances of the tax position, and (3) each tax position is evaluated without considerations of the possibility of offset or aggregation with other tax positions taken. We adjust these reserves, including any impact on the related interest and penalties, in light of changing facts and circumstances, such as the progress of a tax audit.
A number of years may elapse before a particular matter for which we have established a reserve is audited and finally resolved. The number of years with open tax audits varies depending on the tax jurisdiction. While it is often difficultThe tax benefit that has been previously reserved because of a failure to predictmeet the final outcome or the timing of resolution of any particular"more likely than not" recognition threshold would be recognized in our income tax matter, we record a reserve when we determine the likelihood of loss is probable. Such liabilities are recordedexpense in the line item accrued income taxes infirst interim period when the Company's consolidated balance sheets.uncertainty disappears under any one of the following conditions: (1) the tax position is "more likely than not" to be sustained, (2) the tax position, amount, and/or timing is ultimately settled through negotiation or litigation, or (3) the statute of limitations for the tax position has expired. Settlement of any particular issue would usually require the use of cash. Favorable resolutions of tax matters for which we have previously established reserves are recognized as a reduction to our income tax expense when the amounts involved become known.
Tax law requires items to be included in the tax return at different times than when these items are reflected in the consolidated financial statements. As a result, the annual tax rate reflected in our consolidated financial statements is different than that reported in our tax return (our cash tax rate). Some of these differences are permanent, such as expenses that are not deductible in our tax return, and some differences reverse over time, such as depreciation expense. These timing differences create deferred tax assets and liabilities. Deferred tax assets and liabilities are determined based on temporary differences between the financial reporting and tax
bases of assets and liabilities. The tax rates used to determine deferred tax assets or liabilities are the enacted tax rates in effect for the year and manner in which the differences are expected to reverse. Based on the evaluation of all available information, the Company recognizes future tax benefits, such as net operating loss carryforwards, to the extent that realizing these benefits is considered more likely than not.
We evaluate our ability to realize the tax benefits associated with deferred tax assets by analyzing our forecasted taxable income using both historical and projected future operating results, the reversal of existing taxable temporary differences, taxable income in prior carryback years (if permitted) and the availability of tax planning strategies. A valuation allowance is required to be established unless management determines that it is more likely than not that the Company will ultimately realize the tax benefit associated with a deferred tax asset.
Additionally, undistributed earnings of a subsidiary are accounted for as a temporary difference, except that deferred tax liabilities are not recorded for undistributed earnings of a foreign subsidiary that are deemed to be indefinitely reinvested in the foreign jurisdiction. The Company has formulated a specific plan for reinvestment of undistributed earnings of its foreign subsidiaries which demonstrates that such earnings will be indefinitely reinvested in the applicable tax jurisdictions. Should we change our plans, we would be required to record a significant amount of deferred tax liabilities.
The American Jobs Creation Act of 2004 (the "Jobs Creation Act") was enacted in October 2004. Among other things, it provided a one-time benefit related to foreign tax credits generated by equity investments in prior years. In 2004, the Company recorded an income tax benefit of approximately $50 million as a result of this new law. The Jobs Creation Act also included a temporary incentive for U.S. multinationals to repatriate foreign earnings at an approximate 5.25 percent effective tax rate. During 2005, the Company repatriated approximately $6.1 billion in previously unremitted foreign earnings, with an associated tax liability of approximately $315 million. The reinvestment requirements of this repatriation are expected to be fulfilled by 2008 and are not expected to require any material change in the nature, amount or timing of future expenditures from what was otherwise expected. Refer to Note 1 and Note 17 of Notes to Consolidated Financial Statements.
The Company's effective tax rate is expected to be approximately 2323.0 percent to 23.5 percent in 2007.2010. This estimated tax rate does not reflect the impact of any unusual or special items that may affect our tax rate in 2007.2010.
Contingencies
Our Company is subject to various claims and contingencies, mostly related to legal proceedings.proceedings and tax matters (both income taxes and indirect taxes). Due to their nature, such legal proceedings and tax matters involve inherent uncertainties including, but not limited to, court rulings, negotiations between affected parties and governmental actions. Management assesses the probability of loss for such contingencies and accrues a liability and/or discloses the relevant circumstances, as appropriate. Management believes that any liability to the Company that may arise as a result of currently pending legal proceedings, tax matters or other contingencies will not have a material adverse effect on the financial condition of the Company taken as a whole. Refer to Note 138 of Notes to Consolidated Financial Statements.
Recent Accounting Standards and Pronouncements
Refer to Note 1 of Notes to Consolidated Financial Statements for a discussion of recent accounting standards and pronouncements.
Operations Review
We manufacture, distribute and market nonalcoholic beverage concentrates and syrups. We also manufacture, distribute and market some finished beverages. Our organizational structure as of December 31, 20062009, consisted of the following operating segments, the first sevensix of which are sometimes referred to as "operating groups" or "groups": Eurasia and Africa; East, South Asia and Pacific Rim; European Union;Europe; Latin America; North America; North Asia, Eurasia and Middle East;Pacific; Bottling Investments; and Corporate. For further information regarding our operating segments, including a discussion of changes made to our operating segments during 2006, refer to Note 2018 of Notes to Consolidated Financial Statements.
Beverage Volume
We measure our salesthe volume of Company beverage products sold in two ways: (1) unit cases of finished products and (2) gallons. Aconcentrate sales. As used in this report, "unit case" ismeans a unit of measurement equal to 192 U.S. fluid ounces of finished beverage (24 eight-ounce servings). Unit; and "unit case volume representsvolume" means the number of unit cases (or unit case equivalents) of Company beverage products directly or indirectly sold by the Company and its bottling partners ("Coca-Cola(the "Coca-Cola system") to consumers.customers. Unit case volume primarily consists of beverage products bearing Company trademarks. Also included in unit case volume are certain products licensed to, or distributed by, our Company, and brands owned by Coca-Cola system bottlers for which our Company provides marketing support and from the sale of which it derives income.we derive economic benefit. Such products licensed to, or distributed by, our Company orand brands owned by Coca-Cola system bottlers account for a minimal portion of our total unit case volume. In addition, unit case volume includes sales by joint ventures in which the Company is a partner. Unithas an equity interest. Although most of our Company's revenues are not based directly on unit case volume, we believe unit case volume is one of the measures of the underlying strength of the Coca-Cola system because it measures trends at the consumer level. The unit case volume numbers used in this report are derived based on estimates suppliedreceived by ourthe Company from its bottling partners and distributors. A "gallon" is a unitConcentrate sales volume represents the amount of measurement for concentrates syrups, beverage bases, finished beverages and powderssyrups, (in all cases expressed in equivalent gallons of syrup)unit cases) sold by, or used in finished beverages sold by, the Company to its bottling partners or other customers. Most of our revenues are based on gallonconcentrate sales, a primarily wholesale activity, as discussed under "Item 1. Business" in Part I of this report and the heading "Net Operating Revenues," below.activity. Unit case volume and gallonconcentrate sales growth rates are not necessarily equal during any given period. ItemsFactors such as seasonality, bottlers' inventory practices, supply point changes, timing of price increases, and new product introductions and changes in product mix can impact unit case volume and gallonconcentrate sales and can create differences between unit case volume and gallonconcentrate sales growth rates. In addition to the items mentioned above, the impact of unit case volume from certain joint ventures, in which the Company has an equity interest, but to which the Company does not sell concentrates or syrups, may give rise to differences between unit case volume and concentrate sales growth rates.
Information about our volume growth by operating segment is as follows:
| Percentage Change | |||||||||
| 2006 vs. 2005 | 2005 vs. 2004 | ||||||||
| Year Ended December 31, | Unit Cases | 1,2 | Gallons | Unit Cases | 1,2 | Gallons | |||
| Worldwide | 4 | % | 4 | % | 4 | % | 3 | % | |
International | 6 | 5 | 5 | 4 | |||||
Africa | 4 | 3 | 6 | 7 | |||||
| East, South Asia and Pacific Rim | (5 | ) | (4 | ) | (4 | ) | (6 | ) | |
| European Union | 6 | 4 | — | — | |||||
| Latin America | 7 | 7 | 6 | 6 | |||||
| North America | — | — | 2 | 1 | |||||
| North Asia, Eurasia and Middle East | 11 | 7 | 15 | 10 | |||||
Bottling Investments | 16 | N/A | 6 | N/A | |||||
| Percent Change | |||||||||||||
| 2009 vs. 2008 | 2008 vs. 2007 | ||||||||||||
Year Ended December 31, | Unit Cases | 1,2 | Concentrate Sales | Unit Cases | 1,2 | Concentrate Sales | |||||||
Worldwide | 3 | % | 3 | % | 5 | % | 4 | % | |||||
Eurasia & Africa | 4 | % | 5 | % | 7 | % | 7 | % | |||||
Europe | (1 | ) | (2 | ) | 3 | — | |||||||
Latin America | 6 | 7 | 8 | 6 | |||||||||
North America | (2 | ) | (2 | ) | (1 | ) | (2 | ) | |||||
Pacific | 7 | 7 | 8 | 8 | |||||||||
Bottling Investments | 2 | N/A | 14 | N/A | |||||||||
1 | Bottling Investments operating segment data reflects unit case volume growth for consolidated bottlers only. | |||||||||||||
| Geographic segment data reflects unit case volume growth for all bottlers in the applicable geographic areas, both consolidated and unconsolidated. | |||||||||||||
Although most of our Company's revenues are not based directly on unit case volume, we believe unit case volume is one of the measures of the underlying strength of the Coca-Cola system because it measures our product trends at the consumer level. The Coca-Cola system sold approximately 21.424.4 billion unit cases of our products in 2006,2009, approximately 20.623.7 billion unit cases in 2005,2008 and approximately 19.822.7 billion unit cases in 2004.2007.
Year Ended December 31, 2009, versus Year Ended December 31, 2008
In Eurasia and Africa, unit case volume increased 4 percent, which consisted of 3 percent growth in 2006 compared to 2005, reflectingsparkling beverages and 8 percent growth across the majority of divisions, which was partially offset by a slight decline in Nigeria primarily related to affordability issues and competitive and economic pressure.still beverages. The group's unit case volume increasegrowth was primarily attributable to 31 percent growth in India, led by 32 percent growth in sparkling beverages. This growth was largely due to double-digit growth in Trademarks Thums Up, Sprite, Maaza, Fanta and Coca-Cola. Still beverages in India grew 28 percent. The group also benefited from 6 percent volume growth in North and West Africa wasand 10 percent volume growth in East and Central Africa. The group's unit case volume growth also partially offset
by an industrywide temporary shortageincluded the impact of a 14 percent volume decline in Russia, primarily due to the supply of carbon dioxide incontinued challenging economic environment. In addition, South Africa in the fourth quarter of 2006.and Turkey each experienced a 1 percent unit case volume decline.
Unit case volume in East, South Asia and Pacific RimEurope decreased 51 percent, in 2006 versus 2005, primarily due to a double-digit decline in the Philippines, which was mainly driven by the continued impact of affordability and availability issues. In December 2006, the Company and SMC entered into an agreement for the Company to acquire, subjectattributable to the fulfillmentongoing difficult macroeconomic conditions throughout most of certainEurope. These difficult macroeconomic conditions the 65 percent ownership interest in CCBPI held by SMC. Upon the closingimpacted a number of the acquisition, the Company will own 100 percent of the issuedkey markets and outstanding capital stock of CCBPI. The transaction is expected to close during the first quarter of 2007. The Company expects performance in the Philippines to remain weak during 2007. Performance in this operating segment was also impacted by a 5 percent decline in India primarily due to price increases in the second half of 2005 and steps taken to drive revenue growth and improve operating and working capital efficiency. The results in India reflected high single-digit declines in sparkling beverages which was partially offset by growth in still beverages. Continued investment in marketing initiatives around the quality and safety of our products and focus on execution in the consolidated bottling operations delivered positive results during the second half of 2006, despite the renewed unfounded allegations of unsafe pesticide levels in the Company's products.
Unit case volume in the European Union increased 6 percent in 2006 compared to 2005, primarily due to solid growth across all divisions driven by successful marketing campaigns, launches of Coca-Cola Zero in nine countries and favorable weather in the second half of 2006. In addition, the acquisition of Apollinaris GmbH, a German premium source water brand ("Apollinaris"), and the joint acquisition of Fonti del Vulture S.r.l., also known as Traficante, an Italian mineral water company, with Coca-Cola HBC during 2006 contributed approximately 2 percentage points of unit case volume growth in 2006. Unit case volume in Germany increased 5 percent in 2006 versus 2005, and reflected strong growth of Trademark Coca-Cola in 2006 compared to 2005. The results were driven by improved marketplace execution capabilities, the launch of Coca-Cola Zero in July 2006, increased availability in the discounter channel and generally favorable weather. As mentioned above, the acquisition of Apollinaris also contributed to unit case volume growthdeclines of 8 percent in South and Eastern Europe, 4 percent in Iberia and 2 percent in Germany. The Company expects stabilizing trendsvolume declines in Germany to continue during 2007. Unit case volume in Northwest Europe increased 3 percent in 2006 versus 2005 as performance stabilized. The results reflected 3these markets were partially offset by 6 percent unit case volume growth in sparkling beverages,France and 4 percent growth in Great Britain. The unit case volume growth in both France and Great Britain was led by growth of Trademark Coca-Cola, and solid growth in still beverages. In addition, the successful launch of Coca-Cola Zero in Great Britain at the end of June 2006 and generally favorable weather during the second half of the year contributed to the performance. Unit case volume in Iberia increased 6 percent in 2006 versus 2005, led by strong growth in Spain.Coca-Cola.
In Latin America, unit case volume increased 76 percent, in 2006 versus 2005, primarily due towhich consisted of 3 percent growth in sparkling beverages led by growth of Trademark Coca-Cola. This performance was seen in all key markets, especially Brazil, Mexico and Argentina. In Mexico, the increase in unit case volume was driven by strong24 percent growth in Trademark Coca-Cola. In Brazil,still beverages. The group benefited from strong marketing and bottler execution led to unit case volume growth in sparkling beverages. Inkey markets, including 6 percent in Mexico, 4 percent in Brazil, 2 percent in Argentina consumer marketing activities and bottler execution drovedouble-digit growth in Colombia. Acquisitions contributed 1 percentage point of the group's total unit case volume growth. Additionally,The group's sparkling beverage volume growth was primarily attributable to 4 percent growth in December 2006, the Company and Coca-Cola FEMSA entered into an agreement to jointly acquirebrand Coca-Cola. The successful integration of Jugos del Valle, S.A.B. de C.V., the second largest producer of packaged juices, nectars and fruit-flavored beverages in Mexico and the largest producer of such products in Brazil. ("Jugos del Valle") drove still beverage volume growth.
Unit case volume in North America decreased 2 percent, which reflected the impact of a continuing difficult U.S. economic environment and a competitive pricing environment. The effect of the economic environment and pricing environment was even in 2006 versus 2005. Foodservicepartially offset by the impact of strong customer and Hospitalityconsumer programs. North America's unit case volume increaseddecline consisted of a 3 percent decline in sparkling beverages, partially offset by 1 percent in 2006, reflecting growth in all key beverage categories. Unit case volumestill beverages. The decline in Retail decreased 1 percent primarily drivensparkling beverages was partly attributable to the significant price increase taken by weak sparkling beverage trendsbottlers in the second halffourth quarter of 2006, declines in the warehouse-delivered water business resulting from the strategic decision to refocus resources behind the more profitable Dasani business and declines in the warehouse-delivered juice business as a result of price increases to cover higher ingredient costs. These declines in Retail were2008. The decline was partially offset by the continued successstrong performance of Dasani, Coca-Cola Zero, and Powerade, as well as the introduction of Black Cherry Vanilla Coca-Cola and the national rollout of Vault. In February 2007, our Company entered into an agreement to purchase Fuze
Beverage, LLC, maker of Fuze enhanced juices, teas, waters and energy drinks. The Company expects performance in North America to be weak during 2007.
In North Asia, Eurasia and Middle East,which had unit case volume grew 11 percent in 2006 compared to 2005, led by double-digit growth in China, Russia and Turkey, partially offset by a 3 percent decline in Japan. The increase inof 19 percent. Still beverage unit case volume in Chinagrowth was led by significant growth in both sparklingprimarily due to the strong performance of Fuze Beverage, LLC ("Fuze"), Trademark Simply and still beverages.tea. The unit case volume growth in Russiastill beverages was reduced by a double-digit volume decline in the North American water businesses, including Trademark Dasani, primarily due to the slowing water category and Turkey was the result of improving macroeconomic trends, strong bottler execution and successful marketing programs. UnitCompany's decision to not pursue unprofitable volume opportunities in bulk water/case packs in North America.
In Pacific, unit case volume increased 7 percent, which consisted of growth in Russia also benefited from the full-year impactsparkling and still beverages of the joint acquisition of Multon, compared to a partial year6 percent and 8 percent, respectively. Sparkling beverage growth in 2005.Pacific included 14 percent growth in Trademark Sprite and 5 percent growth in Trademark Coca-Cola. The Companygroup's volume growth was led by 16 percent growth in China, which reflected 11 percent growth in sparkling beverages and Coca-Cola HBC jointly acquired Multon, a Russian juice company,30 percent growth in April 2005.still beverages. China's sparkling beverage volume growth was led by double-digit growth in Trademark Sprite and 6 percent growth in Trademark Coca-Cola. China's still beverage volume growth was led by double-digit growth in Minute Maid. The decrease in unit case volume growth in China was partially offset by a 2 percent volume decline in Japan, primarily due to the continued severe economic challenges and unfavorable weather conditions during what are traditionally high-volume months. Sparkling beverage volume in Japan was primarily dueeven, while still beverages declined 3 percent. The decline in still beverages included the impact of a 5 percent volume decline in Aquarius and a 3 percent decline in Georgia Coffee. Due to weakness across core brands including Trademark Coca-Cola,the weak economy, Georgia Coffee and our green tea brands. However, resultswas negatively impacted by shifts away from the at-work vending channel. The group's volume increase also included a 1 percent increase in Japan gradually improved during 2006 and position Japan for growth in 2007.the Philippines.
Unit case volume for Bottling Investments increased 16 percent in 2006 versus 2005, primarily due to the acquisition of Kerry Beverages Limited, which was subsequently renamed Coca-Cola China Industries Limited ("CCCIL"), and the acquisitions of TJC Holdings (Pty) Ltd., a South African bottling company ("TJC"), and Apollinaris. The Company intends to sell a portion of its investment in TJC to Black Economic Empowerment entities at a future date. Unit case volume for Bottling Investments also increased due to the consolidation of Brucephil, Inc. ("Brucephil"), the parent company of The Philadelphia Coca-Cola Bottling Company. In the third quarter of 2006, our Company signed agreements with J. Bruce Llewellyn and Brucephil for the potential purchase of the remaining shares of Brucephil not currently owned by the Company. The agreements provide for the Company's purchase of the shares upon the election of Mr. Llewellyn or the election of the Company. Based on the terms of these agreements, the Company concluded that it must consolidate Brucephil under Interpretation No. 46(R). Brucephil's financial statements were consolidated effective September 29, 2006. The acquisition of the German bottling company Bremer Erfrischungsgetraenke GmbH ("Bremer") during the third quarter of 2005 also contributed to unit case volume increases in 2006, reflecting the impact of full-year unit case volume in 2006 for Bremer compared to a partial year in 2005. The unit case volume increase was partially offset by a decline in India.
In Africa, unit case volume increased 6 percent in 2005 compared to 2004. This increase was driven by growth in core sparkling beverages as well as still beverages across all divisions in this operating segment.
In East, South Asia and Pacific Rim, unit case volume decreased 4 percent in 2005 compared to 2004, primarily due to declines in India and the Philippines. The decline in India was related to the impact of price increases to cover rising raw material and distribution costs and the lingering effects of the 2003 pesticide allegations. The decline in the Philippines was primarily related to affordability and availability issues.
Unit case volume in the European Union was even in 2005 versus 2004, primarily due to strong growth in Spain and Central Europe partially offset by declines primarily in Germany and Northwest Europe. Unit case volume in Germany declined 2 percent in 2005 due to the continued impact of the mandatory deposit legislation on the availability of nonrefillable packages and the corresponding limited availability of our products in the discount retail channel, along with overall industry weakness. In the second half of 2005, the Company achieved availability of a limited range of its products in most discounters. Results in Germany stabilized in the second half of 2005. Unit case volume in Northwest Europe declined 3 percent in 2005, primarily due to the soft economic environment and declines in sparkling beverages, which was associated with a decrease in competitors' prices at retailers, and the discount channel becoming a larger part of the retail market, together with a shift in consumer preferences away from regular sparkling beverages driven by health and wellness trends and the associated public opinion, media and government attention.
Unit case volume for Latin America increased 6 percent in 2005 versus 2004, reflecting strong growth in Brazil, Argentina and Mexico, primarily due to growth in sparkling beverages. The increase in Brazil and Mexico was primarily due to strong marketing, execution and package innovation.
In North America, unit case volume in Retail increased 2 percent in 2005 versus 2004, reflecting improved performance in the bottler-delivered business primarily related to Dasani, Coca-Cola Zero and still beverages, along with growth in the warehouse juice and warehouse water operations. Foodservice and Hospitality had a 1 percent increase in 2005 compared to 2004, reflecting improved trends in restaurant traffic and the impact of a new customer conversion partially offset by the impact of higher fuel costs and Hurricane Katrina on consumer restaurant spending.
In North Asia, Eurasia and Middle East, unit case volume grew 15 percent in 2005 versus 2004, led by 22 percent growth in China, 2 percent growth in Japan, 54 percent growth in Russia and 14 percent growth in Turkey. The increase in unit case volume in China was led by significant growth in both sparkling and still beverages. Japan's growth was primarily due to new product introductions. The unit case volume growth in Turkey was largely due to improving macroeconomic trends, strong bottler execution and successful marketing programs. The unit case volume growth in Russia was the result of the joint acquisition of Multon as well as improving macroeconomic trends, strong bottler execution and successful marketing programs.
Unit case volume for Bottling Investments increased 6 percent in 2005 versus 2004, primarily related to the acquisitions and full-year impact of consolidation of certain bottling operations under Interpretation No. 46(R). The unit case volume increase in 2005 was partially offset by a decline in India bottling operations and dispositions of certain bottling operations.
Gallon Sales
Company-wide gallon sales and unit case volume both grew 4 percent in 2006 when compared to 2005. In Africa, the gallon sales increase was lower than the unit case volume increase mostly due to planned inventory reductions in Nigeria. In East, South Asia and Pacific Rim, the gallon sales decline was lower than the unit case volume decline due to demand for Coca-Cola Zero in Australia and timing of gallon sales in India. In the European Union, unit case volume increased ahead of gallon sales volume due to timing of gallon sales. Both in Latin America and North America, gallon sales and unit case volume were approximately equal. In North Asia, Eurasia and Middle East, unit case volume increased ahead of gallon sales primarily due to inventory reductions in Russia. Unit case volume growth also reflected the impact of a full-year of unit case volume compared to a partial year in 2005 due to the joint acquisition of Multon with Coca-Cola HBC in the second quarter of 2005. The Company only reports unit case volume related to Multon, as the Company does not sell concentrates or syrups to Multon.
Company-wide gallon sales grew 3 percent while unit case volume grew 4 percent in 2005 compared to 2004. In Africa, gallon sales growth of 7 percent exceeded unit case volume growth of 6 percent in 2005 compared to 2004, primarily due to timing of gallon shipments. In East, South Asia and Pacific Rim, the gallon sales decline was higher than the unit case volume decline primarily due to timing of gallon sales in India and the impact of 2005 planned inventory reductions in Australia. Both in the European Union and in Latin America, gallon sales growth and unit case volume growth were even in 2005 versus 2004. In North America, gallon sales increased 1 percent while unit case volume increased 2 percent, primarily due to the impact of higher gallon salesunit case volume growth of 16 percent in 2004 relatedChina, 31 percent in India and 1 percent in the Philippines. The Company's consolidated bottling operations account for approximately 33 percent, 65 percent and 100 percent of the unit case volume in China, India and the Philippines, respectively. The favorable impact of unit case volume in these markets was partially offset by the sale of certain bottling operations during 2008, including Refrigerantes Minas Gerais Ltda. ("Remil"), a bottler in Brazil, and the sale of a portion of our ownership interest in Coca-Cola Beverages Pakistan Ltd. ("Coca-Cola Pakistan"), which resulted in its deconsolidation. Refer to Note 14 of Notes to Consolidated Financial Statements. In addition, Germany's unit case volume declined 2 percent. The Company's consolidated bottling operations account for 100 percent of the unit case volume in Germany.
Beginning January 1, 2010, we deconsolidated certain entities as a result of the Company's adoption of new accounting guidance issued by the FASB. These entities are primarily bottling operations and have been accounted for under the equity method of accounting since they were deconsolidated. Refer to the launchheading "Critical Accounting Policies and Estimates — Principles of Coca-Cola C2 andConsolidation," above. The entities that have been deconsolidated as a result of this change in shipping routesaccounting policy accounted for approximately 1 percent of the Company's worldwide unit case volume in 2004. 2009 and were primarily included in the Bottling Investments operating segment. However, the deconsolidation of these entities will only impact the unit case volume data for our Bottling Investments operating segment, since our geographic segment data reflects unit case volume growth for all bottlers in the applicable geographic areas, both consolidated and unconsolidated. The Bottling Investments operating segment data reflects unit case volume growth for consolidated bottlers only.
Year Ended December 31, 2008, versus Year Ended December 31, 2007
In North Asia, Eurasia and Middle East,Africa, unit case volume increased ahead7 percent, which reflected growth in sparkling and still beverages of gallon sales4 percent and 21 percent, respectively. Unit case volume growth of 15 percent in Turkey, 14 percent in India and 11 percent in Southern Eurasia drove the group's growth. Acquisitions contributed 6 percent of the unit case volume growth in Turkey during 2008. High single-digit volume growth in North and West Africa and 7 percent volume growth in Nigeria also significantly contributed to the group's growth. South Africa's unit case volume increased 1 percent for the year, which included the impact of supply chain issues related to carbon dioxide shortages in the early part of 2008. Our system has invested in manufacturing capabilities that allow us to produce our own supply of carbon dioxide to mitigate the risk of future shortages. Russia's unit case volume was even for the year, primarily due to a more challenging economic environment and unseasonable weather during the summer.
Unit case volume in Europe increased 3 percent, primarily attributable to high single-digit volume growth in Eastern Europe. The group's unit case volume growth reflected 1 percent growth in sparkling beverages and 11 percent growth in still beverages. The unit case volume growth in sparkling beverages included 1 percent growth in Trademark Coca-Cola. Also included in the group's 2008 volume growth was the impact of a low single-digit volume decline in Iberia, primarily due to the joint acquisitionslowing Western European economy and a truck drivers' strike in Spain during the second quarter of Multon, which contributed to2008.
In Latin America, unit case volume increased 8 percent. The group benefited from strong volume growth in 2005, along with timing of 2004 gallon sales, which impacted mostall key markets, including 9 percent in Mexico, 7 percent in Brazil and 5 percent in Argentina. Acquisitions contributed 3 percent of the remaining divisions in the operating segment. Multon had full-yeargroup's total unit case volume growth in 2008. The group's unit case volume growth consisted of approximately 80 million4 percent growth in sparkling beverages and 40 percent growth in still beverages. Sparkling beverage unit casescase volume growth was primarily attributable to 4 percent volume growth in 2004.Coca-Cola. The successful integration of Jugos del Valle, which we acquired jointly with Coca-Cola FEMSA in 2007, drove still beverage volume growth. Still beverage unit case volume grew 21 percent in 2008, excluding the impact of acquisitions.
Unit case volume in North America decreased 1 percent, which reflected the impact of a difficult U.S. economic environment and significant bottler price increases during the fourth quarter of 2008. The overall unit case volume decline in North America during 2008 consisted of a 3 percent unit case volume decline in sparkling beverages, partially offset by a 5 percent increase in still beverages. The decline in sparkling beverages was partly attributable to the softness of our Foodservice business and other on-premise channels, which were negatively impacted by economic conditions. The negative impact of macroeconomic conditions and bottler price increases was tempered by the successful execution of the three-cola strategy (focusing on driving unit case volume growth for Coca-Cola, Coca-Cola Zero and Diet Coke). Coca-Cola Zero continued its strong performance, increasing unit case volume 36 percent in
2008. Still beverage unit case volume increased 5 percent in 2008, primarily due to the strong performance of glacéau, Fuze, Trademark Simply and Minute Maid Enhanced Juices. Acquisitions contributed 4 percent of the volume growth in still beverages during 2008. The overall 5 percent unit case volume growth in still beverages also included the impact of volume declines in Trademark Dasani and Trademark Powerade during 2008, primarily due to the slowing water and sports drink categories.
In Pacific, unit case volume increased 8 percent. The group's unit case volume growth was driven by 19 percent volume growth in China, which consisted of growth in both sparkling and still beverages. China's sparkling unit case volume increased 15 percent, primarily attributable to double-digit volume growth in both Trademark Coca-Cola and Trademark Sprite. Double-digit unit case volume growth in Minute Maid accounted for the majority of China's 30 percent unit case volume growth in still beverages. Also contributing to the volume growth of still beverages in China was the impact of Yuan Ye, a tea manufactured from tea leaves instead of tea powder, which was launched in 2008. The strong performance in China across our brands was partly attributable to our successful activation of the Beijing 2008 Olympic Games. In Japan, unit case volume was even. Sparkling beverage unit case volume grew 5 percent in 2008, led by 6 percent growth in Trademark Coca-Cola and 13 percent growth in Trademark Fanta. Unit case volume growth in Trademark Coca-Cola was primarily attributable to the continued success of Coca-Cola Zero and the successful execution of the three-cola strategy (focusing on driving unit case volume growth for Coca-Cola, Coca-Cola Zero and Diet Coke or Coca-Cola Light). Still beverage unit case volume declined 1 percent in 2008, primarily due to declines in Sokenbicha and Aquarius. The impact of these volume declines on still beverages was partially offset by a 2 percent unit case volume increase in Georgia Coffee.
Unit case volume for Bottling Investments increased 14 percent. The group's unit case volume growth was primarily attributable to the full year impact of prior year acquisitions, including, but not limited to, 18 bottling and distribution operations in Germany, Nordeste Refrigerantes S.A. ("NORSA") and CCBPI. Refer to Note 17 of Notes to Consolidated Financial Statements. Additionally, the unit case volume growth reflected the overall improving health of the Company's consolidated bottling operations. The favorable impact that the previously mentioned items had on unit case volume growth was partially offset by the sale of Remil and the sale of a portion of our ownership interest in Coca-Cola Pakistan, which resulted in its deconsolidation. Refer to the heading "Operations Review — Other Income (Loss) — Net" and Note 14 of Notes to Consolidated Financial Statements.
Concentrate Sales Volume
In 2009, concentrate sales volume and unit case volume both grew 3 percent compared to 2008. The differences between unit case volume and concentrate sales volume growth rates for individual operating segments were primarily due to the timing of concentrate shipments and the impact of unit case volume from certain joint ventures in which the Company has an equity interest, but to which the Company does not sell concentrates, syrups, beverage bases or powders.
Concentrate sales volume and unit case volume grew 4 percent and 5 percent, respectively, in 2008 compared to 2007. The differences between unit case volume and concentrate sales volume growth rates for all segments were primarily due to timing of concentrate shipments and the impact of unit case volume from certain joint ventures in which the Company has an equity interest, but to which the Company does not sell concentrates, syrups, beverage bases or powders.
Analysis of Consolidated Statements of Income
| Percent Change | ||||||||||||
| Year Ended December 31, | 2006 | 2005 | 2004 | 2006 vs. 2005 | 2005 vs. 2004 | |||||||
(In millions except per share data and percentages) | ||||||||||||
| NET OPERATING REVENUES | $ 24,088 | $ 23,104 | $ 21,742 | 4 | % | 6 | % | |||||
| Cost of goods sold | 8,164 | 8,195 | 7,674 | 0 | 7 | |||||||
| GROSS PROFIT | 15,924 | 14,909 | 14,068 | 7 | 6 | |||||||
| GROSS PROFIT MARGIN | 66.1 | % | 64.5 | % | 64.7 | % | ||||||
| Selling, general and administrative expenses | 9,431 | 8,739 | 7,890 | 8 | 11 | |||||||
| Other operating charges | 185 | 85 | 480 | * | * | |||||||
| OPERATING INCOME | 6,308 | 6,085 | 5,698 | 4 | 7 | |||||||
| OPERATING MARGIN | 26.2 | % | 26.3 | % | 26.2 | % | ||||||
| Interest income | 193 | 235 | 157 | (18 | ) | 50 | ||||||
| Interest expense | 220 | 240 | 196 | (8 | ) | 22 | ||||||
| Equity income — net | 102 | 680 | 621 | (85 | ) | 10 | ||||||
| Other income (loss) — net | 195 | (93 | ) | (82 | ) | * | * | |||||
| Gains on issuances of stock by equity investees | — | 23 | 24 | * | * | |||||||
| INCOME BEFORE INCOME TAXES | 6,578 | 6,690 | 6,222 | (2 | ) | 8 | ||||||
| Income taxes | 1,498 | 1,818 | 1,375 | (18 | ) | 32 | ||||||
| Effective tax rate | 22.8 | % | 27.2 | % | 22.1 | % | ||||||
| NET INCOME | $ 5,080 | $ 4,872 | $ 4,847 | 4 | % | 1 | % | |||||
| PERCENTAGE OF NET OPERATING REVENUES | 21.1 | % | 21.1 | % | 22.3 | % | ||||||
| NET INCOME PER SHARE: | ||||||||||||
| Basic | $ 2.16 | $ 2.04 | $ 2.00 | 6 | % | 2 | % | |||||
| Diluted | $ 2.16 | $ 2.04 | $ 2.00 | 6 | % | 2 | % | |||||
* Calculation is not meaningful.
| Percent Change | |||||||||||
Year Ended December 31, | 2009 | 2008 | 2007 | 2009 vs. 2008 | 2008 vs. 2007 | ||||||
(In millions except percentages and per share data) | |||||||||||
NET OPERATING REVENUES | $ 30,990 | $ 31,944 | $ 28,857 | (3 | )% | 11 | % | ||||
Cost of goods sold | 11,088 | 11,374 | 10,406 | (3 | ) | 9 | |||||
GROSS PROFIT | 19,902 | 20,570 | 18,451 | (3 | ) | 11 | |||||
GROSS PROFIT MARGIN | 64.2 | % | 64.4 | % | 63.9 | % | |||||
Selling, general and administrative expenses | 11,358 | 11,774 | 10,945 | (4 | ) | 8 | |||||
Other operating charges | 313 | 350 | 254 | * | * | ||||||
OPERATING INCOME | 8,231 | 8,446 | 7,252 | (3 | ) | 16 | |||||
OPERATING MARGIN | 26.6 | % | 26.4 | % | 25.1 | % | |||||
Interest income | 249 | 333 | 236 | (25 | ) | 41 | |||||
Interest expense | 355 | 438 | 456 | (19 | ) | (4 | ) | ||||
Equity income (loss) — net | 781 | (874 | ) | 668 | * | * | |||||
Other income (loss) — net | 40 | 39 | 219 | * | * | ||||||
INCOME BEFORE INCOME TAXES | 8,946 | 7,506 | 7,919 | 19 | (5 | ) | |||||
Income taxes | 2,040 | 1,632 | 1,892 | 25 | (14 | ) | |||||
Effective tax rate | 22.8 | % | 21.7 | % | 23.9 | % | |||||
CONSOLIDATED NET INCOME | 6,906 | 5,874 | 6,027 | 18 | (3 | ) | |||||
Less: Net income attributable to noncontrolling interests | 82 | 67 | 46 | 22 | 46 | ||||||
NET INCOME ATTRIBUTABLE TO SHAREOWNERS OF THE COCA-COLA COMPANY | $ 6,824 | $ 5,807 | $ 5,981 | 18 | % | (3 | )% | ||||
NET INCOME PER SHARE1 | |||||||||||
Basic net income per share | $ 2.95 | $ 2.51 | $ 2.59 | 18 | % | (3 | )% | ||||
Diluted net income per share | $ 2.93 | $ 2.49 | $ 2.57 | 18 | % | (3 | )% | ||||
* Calculation is not meaningful. | |||||||||||
1 Basic net income per share and diluted net income per share are calculated based on net income attributable to shareowners of The Coca-Cola Company. | |||||||||||
Net Operating Revenues
Net operating revenues decreased by $954 million, or 3 percent, in 2009 compared to 2008 and increased by $984$3,087 million, or 411 percent, in 2006 versus 2005. Net operating revenues increased by $1,362 million or 6 percent in 2005 versus 2004.
2008 compared to 2007. The following table indicates,illustrates, on a percentage basis, the estimated impact of key factors resulting in significant increases (decreases)the increase (decrease) in net operating revenues:
| Percent Change | |||||
| Year Ended December 31, | 2006 vs. 2005 | 2005 vs. 2004 | |||
| Increase in gallon sales | 4 | % | 3 | % | |
| Structural changes | (2 | ) | 0 | ||
| Price and product/geographic mix | 2 | 1 | |||
| Impact of currency fluctuations versus the U.S. dollar | 0 | 2 | |||
| Total percentage increase | 4 | % | 6 | % | |
| Percent Change | |||||||
Year Ended December 31, | 2009 vs. 2008 | 2008 vs. 2007 | |||||
Increase in concentrate sales volume | 3 | % | 4 | % | |||
Structural changes | (1 | ) | — | ||||
Price and product/geographic mix | — | 3 | |||||
Impact of currency fluctuations versus the U.S. dollar | (5 | ) | 4 | ||||
Total percentage increase (decrease) | (3 | )% | 11 | % | |||
Refer to the heading "Volume""Beverage Volume" for a detailed discussion on gallon sales.of concentrate sales volume. Also included in concentrate sales volume is the impact of acquired beverage companies and the acquisition of trademarks.
"StructuralYear Ended December 31, 2009, versus Year Ended December 31, 2008
"Structural changes" refers to acquisitions or dispositions of bottling, distribution or canning operations and consolidation or deconsolidation of bottling and distribution entities for accounting purposes. In 2006, structuralStructural changes accounted for approximately 1 percent of the decrease in net operating revenues. This decrease was primarily attributable to the sale of certain bottling operations during 2008, including Remil and a portion of our ownership interest in Coca-Cola Pakistan, which resulted in its deconsolidation. Refer to the heading "Operations Review — Other Income (Loss) — Net" and Note 14 of Notes to Consolidated Financial Statements.
Price and product/geographic mix had a net zero percent impact on net operating revenues. Favorable pricing and product/package mix in a number of our key markets was offset by: shifts in our marketing and media spend strategies, shifts away from the at-work vending channel in our Japanese business, our current focus to drive greater affordability initiatives across many key markets to ensure we continue building brand relevance and equity with consumers, and unfavorable geographic mix as a result of growth in our emerging and developing markets. The shift in our marketing and media spend strategies was primarily due to spending more marketing dollars toward in-store activations, loyalty points programs and point-of-sale marketing. Many of these strategies impact net revenues instead of marketing expenses. Refer to the heading "Selling, General and Administrative Expenses," below. The growth in our emerging and developing markets resulted in unfavorable geographic mix due to the fact that the revenue per unit sold in these markets is generally less than in developed markets. Refer to the heading "Operating Income and Operating Margin," below. We currently expect the impact of price and product/geographic mix in 2010 to be similar to 2009.
The unfavorable impact of currency fluctuations decreased net operating revenues by 2 percent compared to 2005,approximately 5 percent. The unfavorable impact of changes in foreign currency exchange rates was primarily due to a stronger U.S. dollar compared to most foreign currencies, including the changeeuro, South African rand, British pound, Brazilian real, Mexican peso and Australian dollar, which had an unfavorable impact on the Eurasia and Africa, Europe, Latin America, Pacific and Bottling Investments operating segments. The unfavorable impact of a stronger U.S. dollar compared to the business model in Spain,aforementioned currencies was partially offset by the impact of a weaker U.S. dollar compared to certain other foreign currencies, including the Japanese yen, which had a favorable impact on the Pacific operating segment. Refer to the heading "Liquidity, Capital Resources and Financial Position — Foreign Exchange."
Beginning January 1, 2010, we deconsolidated certain entities as a result of the Company's adoption of new accounting guidance issued by the FASB. These entities are primarily bottling operations and have been accounted for under the equity method of accounting since they were deconsolidated. Refer to the heading "Critical Accounting Policies and Estimates — Principles of Consolidation," above. The entities that have been deconsolidated as a result of this change in accounting policy accounted for approximately 3 percent of the Company's consolidated net operating revenues in 2009. Refer to the heading "Critical Accounting Policies and Estimates — Principles of Consolidation," above.
Year Ended December 31, 2008, versus Year Ended December 31, 2007
Structural changes had a net zero percent impact on net operating revenues. The increase in net operating revenues attributable to the full year impact of prior year acquisitions, including, but not limited to, 18 German bottling and distribution operations, NORSA and CCBPI, was offset by the sale of Bremer in the third quarter of 2005, TJC in the first quarter of 2006, CCCIL in the third quarter of 2006Remil and the consolidationsale of Brucephil under Interpretation No. 46(R) effective September 29, 2006.a portion of our ownership interest in Coca-Cola Pakistan, which resulted in its deconsolidation. Refer to Note 1914 and Note 17 of Notes to Consolidated Financial Statements. Effective January 1, 2006, the Company granted our bottling partners in Spain the rights to manufacture and distribute Company trademarked products in can packages. Prior to granting these rights to our bottling partners, the Company held the manufacturing and distribution rights for these can packages in Spain. In connection with granting these rights, the Company reduced our planned future annual marketing support payments to our bottling partners in Spain. These changes resulted in a reduction of net operating revenues and cost of goods sold. This change did not materially impact gross profit for 2006. If the change had occurred as of January 1, 2005, net operating revenues for 2005 would have been reduced by approximately $779 million.
Price and product/geographic mix increased net operating revenues by 23 percent, in 2006 compared to 2005, primarily due to price increasesfavorable pricing and product/package mix across the majority of the operating segments and improved pricing and product/package mix in Bottling Investments partially offset by unfavorable product mix primarily in Japan.segments.
In 2005, structural changes reflect the impact of a full year of revenue in 2005 for variable interest entities compared to a partial year in 2004. Under Interpretation No. 46(R), the results of operations of variable interest entities in which the Company was determined to be the primary beneficiary were included in our consolidated results beginning April 2, 2004. Refer to Note 1 of Notes to Consolidated Financial Statements. The acquisition of Bremer during the third quarter of 2005 also favorably impacted net operating revenues. Refer to Note 19 of Notes to Consolidated Financial Statements. These increases in net operating revenues were offset by the dispositions of certain bottling and canning operations which were not material individually or in aggregate.
The favorable impact of foreign currency fluctuations in 2005 versus 2004 resulted from the strength of most key foreign currencies versus theincreased net operating revenues by 4 percent. The U.S. dollar especially a strongerweakened against certain key currencies in 2008 including, but not limited to, the euro, whichJapanese yen and Brazilian real. The fluctuations in these currencies favorably impacted the European Union and Bottling Investments, and a stronger Brazilian real and Mexican peso, that favorably impactedEurope, Pacific, Latin America and Bottling Investments.Investments operating segments. The favorable impact of fluctuationfluctuations in thesethe aforementioned currencies was partially offset by a weaker Japanese yen, whichthe unfavorable impact of the U.S. dollar strengthening against the South African rand and the British pound during 2008. The fluctuations in these currencies unfavorably impacted North Asia,the Eurasia and Middle East.Africa, Europe and Bottling Investments operating segments. Refer to the heading "Liquidity, Capital Resources and Financial Position—Position — Foreign Exchange."
Price and product/geographic mix increased net operating revenuesNet Operating Revenues by 1 percent in 2005 compared to 2004, primarily due to price increases across the majority of the operating segments and improved product/package mix in Bottling Investments, partially offset by unfavorable country mix.Operating Segment
Information about our net operating revenues by operating segment as a percentage of Company net operating revenues is as follows:
| Year Ended December 31, | 2006 | 2005 | 2004 | ||||
| Africa | 4.6 | % | 4.8 | % | 4.4 | % | |
| East, South Asia and Pacific Rim | 3.3 | 3.1 | 3.2 | ||||
| European Union | 14.6 | 17.8 | 18.0 | ||||
| Latin America | 10.3 | 8.9 | 8.2 | ||||
| North America | 29.1 | 28.9 | 29.5 | ||||
| North Asia, Eurasia and Middle East | 16.5 | 17.7 | 17.9 | ||||
| Bottling Investments | 21.2 | 18.4 | 18.3 | ||||
| Corporate | 0.4 | 0.4 | 0.5 | ||||
| 100.0 | % | 100.0 | % | 100.0 | % | ||
Year Ended December 31, | 2009 | 2008 | 2007 | |||||||
Eurasia & Africa | 6.4 | % | 6.7 | % | 6.8 | % | ||||
Europe | 13.9 | 15.0 | 15.4 | |||||||
Latin America | 12.0 | 11.3 | 10.6 | |||||||
North America | 26.4 | 25.7 | 26.9 | |||||||
Pacific | 14.6 | 13.7 | 13.9 | |||||||
Bottling Investments | 26.4 | 27.3 | 26.2 | |||||||
Corporate | 0.3 | 0.3 | 0.2 | |||||||
| 100.0 | % | 100.0 | % | 100.0 | % | |||||
The percentage contribution of each operating segment has changed due to net operating revenues in certain operating segments growing at a faster rate compared to the other operating segments, the impact ofsegments. Net operating revenue growth rates are impacted by concentrate sales volume growth rates, structural changes, price and product/geographic mix, and foreign currency fluctuations; and the acquisitions of CCCIL and TJC, and the consolidation of Brucephil under Interpretation No. 46(R), which impacted Bottling Investments. The acquisition of Bremer during the third quarter of 2005 also increased net operating revenues in 2006, reflecting the impact of full-year net operating revenues in 2006 for Bremer compared to a partial year in 2005.fluctuations.
The size and timing of structural changes, including acquisitions or dispositions of bottling and canning operations, do not occur consistently from period to period. As a result, anticipating the impact of such events on future increases or decreases in net operating revenues (and other financial statement line items) usually is not possible. However, we expect to continue to buy and sell bottling interests in limited circumstances and, as a result, structural changes will continue to affect our consolidated financial statements in future periods.
Gross Profit
Year Ended December 31, 2009, versus Year Ended December 31, 2008
Our gross profit margin increaseddecreased to 66.164.2 percent in 20062009 from 64.564.4 percent in 2005. Our gross margin2008, primarily due to foreign currency fluctuations, the growth of our finished product operations, unfavorable geographic mix as a result of growth in our emerging and developing markets, our current focus to drive greater affordability initiatives across many key markets, and unfavorable channel and product mix in certain key markets. The unfavorable impact of the previously mentioned items was favorably impactedpartially offset by the changefavorable impact of price increases in the business model in Spain, as discussed above. Other structural changes, which included the consolidation of Brucephil under Interpretation No. 46(R) in 2006, the acquisitions of CCCIL and TJC in 2006,certain markets, lower costs related to several key commodities and the acquisitionsale of Bremercertain bottling operations in 2005, unfavorably impacted our gross profit margin.2008. Generally, bottling and finished product operations produce higher net operating revenues but lower gross profit margins compared to concentrate and syrup operations. Bottling operations sold in 2008 included Remil and a portion of our ownership interest in Coca-Cola Pakistan, which
resulted in its deconsolidation. Refer to the heading "Operations Review — Other Income (Loss) — Net" and Note 14 of Notes to Consolidated Financial Statements.
Beginning January 1, 2010, we deconsolidated certain entities as a result of the Company's adoption of new accounting guidance issued by the FASB. These entities are primarily bottling operations and have been accounted for under the equity method of accounting since they were deconsolidated. Refer to the heading "Critical Accounting Policies and Estimates — Principles of Consolidation," above. The Company expects the deconsolidation of these entities to have a favorable impact on our gross profit margin percentage in future periods. Generally, bottling and finished product operations produce higher net operating revenues but lower gross profit margins compared to concentrate and syrup operations. Refer to the heading "Net Operating Revenues," above.
Year Ended December 31, 2008, versus Year Ended December 31, 2007
Our gross profit margin increased to 64.4 percent in 20062008 from 63.9 percent in 2007. The increase in our gross profit margin was primarily attributable to favorable price and product mix across the majority of our operating segments, as well as the favorable impact of the sale of Remil and the sale of a portion of our ownership interest in Coca-Cola Pakistan, which resulted in its deconsolidation. Refer to the heading "Operations Review — Other Income (Loss) — Net" and Note 14 of Notes to Consolidated Financial Statements. The favorable impact of the previously mentioned items was partially offset by the full year impact of 2007 acquisitions, including, but not limited to, 18 German bottling and distribution operations, NORSA, glacéau, CCBPI and Leao Junior S.A. ("Leao Junior"), a Brazilian tea company. Refer to Note 17 of Notes to Consolidated Financial Statements. In addition to the full year impact of prior year acquisitions, our 2008 gross profit margin was also unfavorably impacted favorably by price increases, partially offset by increases in the cost of raw materials and freight, primarily in North America, and by an unfavorable product mix, primarily in Japan. Gross profit margin in 2005 was favorably impacted by the receipt of approximately $109 million in proceeds related to a class action lawsuit settlement concerning price-fixing in the sale of high fructose corn syrup ("HFCS") purchased by the Company during the years 1991 to 1995. Subsequent to the receipt of this settlement, the Company distributed approximately $62 million to certain bottlers in North America. From 1991 to 1995, the Company purchased HFCS on behalf of those bottlers. Therefore, those bottlers ultimately were entitled to a portion of the proceeds. The Company's portion of the settlement was approximately $47 million, which was recorded as a reduction of cost of goods sold and impacted Corporate. Refer to Note 18 of Notes to Consolidated Financial Statements.freight.
In 2007, the Company expects the cost of raw materials to increase, primarily in North America. We will attempt to mitigate the overall impact on our business through appropriate pricing and other strategies.
Our gross profit margin decreased to 64.5 percent in 2005 from 64.7 percent in 2004, primarily due to higher raw material and freight costs driven by rising oil prices. This decrease was partially offset by the receipt of net settlement proceeds of approximately $47 million, as discussed above. Our gross margin was also impacted by the consolidation of certain bottling operations under Interpretation No. 46(R) as of April 2, 2004. Refer to Note 1 of Notes to Consolidated Financial Statements.
Selling, General and Administrative Expenses
The following table sets forth the significant components of selling, general and administrative expenses (in millions):
| Year Ended December 31, | 2006 | 2005 | 2004 | |||
| Selling expenses | $ 3,924 | $ 3,453 | $ 3,031 | |||
| Advertising expenses | 2,553 | 2,475 | 2,165 | |||
| General and administrative expenses | 2,630 | 2,487 | 2,349 | |||
| Stock-based compensation expense | 324 | 324 | 345 | |||
| Selling, general and administrative expenses | $ 9,431 | $ 8,739 | $ 7,890 | |||
Year Ended December 31, | 2009 | 2008 | 2007 | |||||||
Selling expenses | $ 5,433 | $ 5,776 | $ 5,029 | |||||||
Advertising expenses | 2,791 | 2,998 | 2,774 | |||||||
General and administrative expenses | 2,893 | 2,734 | 2,829 | |||||||
Stock-based compensation expense | 241 | 266 | 313 | |||||||
Selling, general and administrative expenses | $ 11,358 | $ 11,774 | $ 10,945 | |||||||
TotalYear Ended December 31, 2009, versus Year Ended December 31, 2008
Selling, general and administrative expenses decreased by $416 million, or 4 percent, in 2009 compared to 2008. The decrease was primarily attributable to the impact of foreign currency fluctuations, which decreased selling, general and administrative expenses wereby approximately 8 percent higher in 2006 versus 2005. The increases in4 percent. In addition to the impact of foreign currency fluctuations, selling and advertising expenses were primarily relateddecreased due to increased investments in marketing activities, including World Cup and Winter Olympics promotions in the European Union, combined with new product innovation activities and increased costs in our consolidated bottling investments as a result of acquisitions and consolidationsale of certain bottling operations. Generaloperations in 2008. Bottling operations sold in 2008 included Remil and administrativea portion of our ownership interest in Coca-Cola Pakistan, which resulted in its deconsolidation. Advertising expenses increasedwere impacted by shifts in our marketing and media spend strategies, primarily due to higher costs in Bottling Investments relatedspending more marketing dollars toward in-store activations, loyalty points programs and point-of-sale marketing. Many of these strategies impact net operating revenues instead of marketing expenses. Refer to the acquisitions of CCCIL and TJC and the consolidation of Brucephil under Interpretation No. 46(R).heading "Net Operating Revenues," above. The acquisition of Bremer during the third quarter of 2005 also increasedincrease in general and administrative expenses was primarily due to an increase in 2006, reflecting a full-year impactpension costs and higher short-term incentive costs, partially offset by savings generated from the Company's ongoing productivity initiatives.
The increase in 2006 for Bremer compared to a partial year in 2005. General and administrative expenses in 2006 also reflected the impact of a $100 million donation made to The Coca-Cola Foundation, which impacted Corporate. Stock-based compensationour pension expense was flatprimarily attributable to the significant decline in 2006 comparedthe value of our pension plan assets precipitated by the credit crisis and financial system instability in 2008. As a result of this decline, along with a decrease in the discount rate, our 2009 pension costs increased by $103 million. Refer to 2005. Stock-based compensationthe heading "Liquidity, Capital Resources and Financial Position — Off-Balance Sheet Arrangements and Aggregate Contractual Obligations" and Note 10 of Notes to Consolidated Financial Statements for further discussion.
Our 2010 pension expense in 2005 includedis expected to decrease by approximately $50 million of expensecompared to 2009. The anticipated decrease is primarily due to a change inthe appreciation of our estimated service period for retirement-eligible participants in our plans. This amount was offset primarily bypension plan assets and the impact of the timing$269 million in contributions to our pension plans in 2009, partially offset by a decrease in the discount rate. Refer to the heading "Liquidity, Capital Resources and Financial Position — Off-Balance Sheet Arrangements and Aggregate Contractual Obligations" and Note 10 of stock-based compensation grants in prior years.Notes to Consolidated Financial Statements for further discussion.
As of December 31, 2006,2009, we had approximately $376$335 million of total unrecognized compensation cost related to nonvested share-based compensation arrangements granted under our plans. This cost is expected to be recognized as stock-based compensation expense over a weighted-average period of 1.7 years.years as stock-based compensation expense. This expected cost does not include the impact of any future stock-based compensation awards. Refer to Note 159 of Notes to Consolidated Financial Statements.
TotalBeginning January 1, 2010, we deconsolidated certain entities as a result of the Company's adoption of new accounting guidance issued by the FASB. These entities are primarily bottling operations and have been accounted for under the equity method of accounting since they were deconsolidated. Refer to the heading "Critical Accounting Policies and Estimates — Principles of Consolidation," above. The entities that were deconsolidated as of January 1, 2010, accounted for approximately 2 percent of the Company's consolidated selling, general and administrative expenses were approximately 11 percent higher in 20052009.
Year Ended December 31, 2008, versus 2004. Approximately 1 percentage point of this increase was due to an overall weaker U.S. dollar (especially compared to the Brazilian real, the Mexican peso and the euro). The increase in selling, advertising andYear Ended December 31, 2007
Selling, general and administrative expenses increased $829 million, or 8 percent, in 2008 compared to 2007. This increase was primarily relatedattributable to increased marketing and innovation expenses and the full-year impact of foreign currency fluctuations, which accounted for approximately 4 percent of the consolidation of certain bottling operations under Interpretation No. 46(R). The decreasetotal increase in stock-based compensation expense was primarily relatedselling, general and administrative expenses. In addition to the lower average fair value per shareimpact of stock options expensedforeign currency fluctuations, the increase in 2005 comparedadvertising expenses reflected the Company's continued investment in our brands and building market execution capabilities. Selling expenses increased primarily to support our bottling operations. In addition to the average fair value per share expensedpreviously mentioned items, the increase in 2004. This decreaseselling, general and administrative expenses in 2008 was also partially offset by approximately $50 millionattributable to the full year impact of accelerated amortization of compensation expense related to a change in our estimated service period for retirement-eligible participants when the terms of their stock-based compensation awards provided for accelerated vesting upon early retirement.bottlers and brands acquired during 2007. Refer to Note 1517 of Notes to Consolidated Financial Statements. These increases were partially offset by a decline in general and administrative expenses, primarily due to expense management and productivity initiatives. In addition, general and administrative expenses during 2008 also benefited from the full year impact of amendments made to the U.S. retiree medical plan and other employee benefit related costs during 2007. Refer to Note 10 of Notes to Consolidated Financial Statements for further discussion of the amendments made to the U.S. retiree medical plan during 2007.
Other Operating Charges
The otherOther operating charges incurred by operating segment were as follows (in millions):
| Year Ended December 31, | 2006 | 2005 | 2004 | |||
| Africa | $ 3 | $ — | $ — | |||
| East, South Asia and Pacific Rim | 44 | 85 | — | |||
| European Union | 36 | — | — | |||
| Latin America | — | — | — | |||
| North America | — | — | 18 | |||
| North Asia, Eurasia and Middle East | 17 | — | — | |||
| Bottling Investments | 84 | — | 398 | |||
| Corporate | 1 | — | 64 | |||
| Total | $ 185 | $ 85 | $ 480 | |||
Year Ended December 31, | 2009 | 2008 | 2007 | |||||||
Eurasia & Africa | $ 4 | $ 1 | $ 37 | |||||||
Europe | 7 | — | 33 | |||||||
Latin America | — | 1 | 4 | |||||||
North America | 31 | 56 | 23 | |||||||
Pacific | 1 | — | 3 | |||||||
Bottling Investments | 141 | 46 | 33 | |||||||
Corporate | 129 | 246 | 121 | |||||||
Total | $ 313 | $ 350 | $ 254 | |||||||
During 2006, ourIn 2009, the Company recordedincurred other operating charges of $185approximately $313 million, which consisted of $166 million related to restructuring charges, $107 million attributable to the Company's ongoing productivity initiatives and $40 million due to asset impairments.
The Company's restructuring activities in 2009 primarily related to the integration of the 18 German bottling and distribution operations acquired in 2007. The Company began these integration initiatives in 2008 and has incurred total pretax expenses of approximately $131 million since they commenced. The expenses recorded in connection with these integration activities have been primarily due to involuntary terminations. The Company is currently reviewing other integration and restructuring opportunities within the German bottling and distribution operations, which if
implemented will result in additional charges in future periods. However, as of December 31, 2009, the Company has not finalized any additional plans. Refer to Note 15 of Notes to Consolidated Financial Statements for additional information related to restructuring charges.
Other operating charges included expenses related to the Company's ongoing productivity initiatives. The Company has recognized approximately $162 million related to these initiatives since they commenced in the first quarter of 2008. The Company is targeting $500 million in annualized savings from productivity initiatives by the end of 2011 to provide additional flexibility to invest for growth. The savings are expected to be generated in a number of areas and include aggressively managing operating expenses supported by lean techniques, redesigning key processes to drive standardization and effectiveness, better leveraging our size and scale, and driving savings in indirect costs through the implementation of a "procure-to-pay" program. In realizing these savings, the Company expects to incur total costs of approximately $500 million by the end of 2011. The Company believes we are on track to achieve our $500 million target in annualized savings by the end of 2011 and has realized more than half of the targeted annualized savings by December 31, 2009. Refer to Note 15 of Notes to Consolidated Financial Statements for additional information related to the Company's ongoing productivity initiatives.
The asset impairment charges recorded in 2009 were the result of a change in the expected useful life of an intangible asset and a change in disposal strategy related to a building that is no longer occupied. Refer to Note 13 of Notes to Consolidated Financial Statements for additional fair value information related to these impairment charges.
During 2008, the Company incurred other operating charges of approximately $350 million, which consisted of $194 million due to restructuring charges, $63 million related to contract termination fees, $55 million attributable to productivity initiatives and $38 million as a result of asset impairments. The restructuring charges in 2008 were primarily related to steps the Company took in 2007 to streamline and simplify its operations globally, which included the closing of a beverage concentrate manufacturing and distribution plant in Drogheda, Ireland, as well as streamlining activities in other selected business units. Refer to Note 15 of Notes to Consolidated Financial Statements for additional information on the restructuring charges and productivity initiatives. The contract termination fees were primarily the result of penalties incurred by the Company to terminate existing supply and co-packer agreements. Charges related to asset impairments were primarily due to the write-down of manufacturing lines that produce product packaging materials. Refer to Note 14 of Notes to Consolidated Financial Statements for additional information related to the contract termination fees and asset impairments.
In 2007, the Company incurred restructuring charges of approximately $237 million and asset impairments of $31 million. Of theseThese restructuring charges approximately $108 million were primarily related to the impairmentreorganization of the North American business around three main business units: Sparkling Beverages, Still Beverages and Emerging Brands. They also included the plan to close a beverage concentrate manufacturing and distribution plant in Drogheda, Ireland, as well as individually insignificant streamlining activities throughout many other business units. Refer to Note 15 for additional information on the restructuring charges. The asset impairments were primarily related to certain assets and investments in our bottling operations, approximately $53 million were for contract termination costs related to production capacity efficiencies and approximately $24 million were related to other restructuring costs. Nonenone of these chargeswhich was individually significant. The impairmentOf this total, $254 million was recorded in other operating charges were primarily the resultand $14 million was recorded in cost of a revised outlook for certain assets and bottling operations in Asia, which have been impacted by unfavorable market conditions and declines in volume.goods sold. Refer to the discussion under "Critical Accounting Policies and Estimates—Goodwill, Trademarks and Other Intangible Assets," above.
Other operating charges in 2005 reflected the impactNote 14 of approximately $84 million of expenses relatedNotes to impairment charges for intangible assets and approximately $1 million related to impairments of other assets. These intangible assets primarily relate to trademark beverages sold in the Philippines, which is part of East, South Asia and Pacific Rim. Refer to the heading "Critical Accounting Policies and Estimates—Goodwill, Trademarks and Other Intangible Assets."
Other operating charges in 2004 reflected the impact of approximately $480 million of expenses primarily related to impairment charges for franchise rights and certain manufacturing assets. Bottling Investments accounted for approximately $398 million of the impairment charges, which were primarily related to the impairment of franchise rights at CCEAG. For a discussion of the operating environment in Germany, refer to the heading "Critical Accounting Policies and Estimates—Goodwill, Trademarks and Other Intangible Assets." Corporate accounted for approximately $64 million of impairment charges, which were primarily related to the impairment of certain manufacturing assets.Consolidated Financial Statements.
Operating Income and Operating Margin
Information about our operating income contribution by operating segment on a percentage basis is as follows:
| Year Ended December 31, | 2006 | 2005 | 2004 | ||||
| Africa | 6.7 | % | 6.5 | % | 5.9 | % | |
| East, South Asia and Pacific Rim | 5.7 | 4.6 | 7.7 | ||||
| European Union | 35.7 | 36.5 | 37.3 | ||||
| Latin America | 23.0 | 19.3 | 18.5 | ||||
| North America | 26.7 | 25.5 | 28.2 | ||||
| North Asia, Eurasia and Middle East | 24.7 | 29.0 | 29.3 | ||||
| Bottling Investments | — | (1.0 | ) | (8.0 | ) | ||
| Corporate | (22.5 | ) | (20.4 | ) | (18.9 | ) | |
| 100.0 | % | 100.0 | % | 100.0 | % | ||
Information about our operating margin on a consolidated basis and by operating segment is as follows:
| Year Ended December 31, | 2006 | 2005 | 2004 | ||||
| Consolidated | 26.2 | % | 26.3 | % | 26.2 | % | |
| Africa | 38.4 | % | 35.8 | % | 35.0 | % | |
| East, South Asia and Pacific Rim | 45.0 | 39.5 | 62.2 | ||||
| European Union | 64.3 | 54.1 | 54.3 | ||||
| Latin America | 57.9 | 57.0 | 59.2 | ||||
| North America | 24.0 | 23.3 | 25.0 | ||||
| North Asia, Eurasia and Middle East | 39.1 | 42.4 | 43.0 | ||||
| Bottling Investments | — | (1.0 | ) | (11.4 | ) | ||
| Corporate | * | * | * | ||||
| Year Ended December 31, | 2009 | 2008 | 2007 | |||||||
| Eurasia & Africa | 9.8 | % | 9.9 | % | 9.2 | % | ||||
| Europe | 35.8 | 37.6 | 38.3 | |||||||
| Latin America | 24.8 | 24.8 | 24.1 | |||||||
| North America | 20.7 | 18.8 | 23.4 | |||||||
| Pacific | 22.9 | 22.0 | 23.4 | |||||||
| Bottling Investments | 2.2 | 3.1 | 2.1 | |||||||
| Corporate | (16.2 | ) | (16.2 | ) | (20.5 | ) | ||||
| 100.0 | % | 100.0 | % | 100.0 | % | |||||
Information about our operating margin on a consolidated basis and by operating segment is as follows: | ||||||||||
| Year Ended December 31, | 2009 | 2008 | 2007 | |||||||
| Consolidated | 26.6 | % | 26.4 | % | 25.1 | % | ||||
| Eurasia & Africa | 41.0 | % | 39.1 | % | 34.4 | % | ||||
| Europe | 68.4 | 66.4 | 62.4 | |||||||
| Latin America | 55.2 | 57.9 | 57.0 | |||||||
| North America | 20.7 | 19.3 | 21.9 | |||||||
| Pacific | 41.6 | 42.6 | 42.5 | |||||||
| Bottling Investments | 2.2 | 3.0 | 2.0 | |||||||
| Corporate | * | * | * | |||||||
* Calculation is not meaningful. | ||||||||||
As demonstrated by the tables above, the percentage contribution to operating income and operating margin by each operating segment fluctuated from year to year. Operating income and operating margin by operating segment were influenced by a variety of factors and events including the following:
Beginning January 1, 2010, we deconsolidated certain entities as a result of the Company's adoption of new accounting guidance issued by the FASB. These entities are primarily bottling operations and have been accounted for under the equity method of accounting since they were deconsolidated. Refer to the heading "Critical Accounting Policies and Estimates — Principles of Consolidation," above. The entities that were deconsolidated as of January 1, 2010, accounted for approximately 2 percent of the Company's consolidated operating income in 2009.
Interest Income
Interest income decreased by $84 million in 2009 compared to 2008. This decrease was primarily attributable to lower interest rates, partially offset by the impact of higher short-term investment balances.
Interest income increased by $97 million in 2008 compared to 2007. This increase was primarily due to higher average short-term investment balances, partially offset by lower interest rates.
Interest Expense
Interest expense decreased by $83 million, or 19 percent, in 2009 compared to 2008. This decrease was primarily due to lower interest rates on short-term debt, partially offset by the issuance of long-term debt in the first quarter of 2009. In addition, interest expense in 2008 included the impact of the reclassification of approximately $17 million of previously unrecognized gains on interest rate locks from AOCI to interest expense, which was partially offset by approximately $9 million of losses related to production capacity efficiencies, asset impairmentsthe portion of cash flow hedges that were deemed to be ineffective. The reclassification was the result of a discontinued cash flow hedging relationship on interest rate locks, as it was no longer probable that we would issue the long-term debt for which these hedges were designated.
Interest expense decreased by $18 million, or 4 percent, in 2008 compared to 2007. This decrease was primarily attributable to lower interest rates on short-term debt and a net benefit of approximately $8 million related to the reclassification of gains and losses on interest rate locks from AOCI to interest expense, partially offset by the impact of higher average short-term and long-term debt balances. See discussion above for more information on the net benefit related to the reclassification of gains and losses on interest rate locks from AOCI to interest expense.
The Company reviews its optimal mix of short-term and long-term debt regularly. This monitoring includes a review of business and other restructuring costs.financial risks. Refer to the heading "Liquidity, Capital Resources and Financial Position." During the first quarter of 2009, the Company elected to replace a certain amount of commercial paper and short-term debt with longer-term debt, which resulted in the Company issuing long-term notes in the principal amounts of $900 million at a rate of 3.625 percent and $1,350 million at a rate of 4.875 percent due March 15, 2014, and March 15, 2019, respectively. The interest rates on the long-term notes are higher than the interest rates on our short-term debt. Refer to Note 207 of Notes to Consolidated Financial Statements.
Interest Income and Interest Expense
We monitor our mix of fixed-rate and variable-rate debt as well as ourreview its optimal mix of short-term and long-term debt versus long-term debt. Fromand may replace a certain amount of commercial paper and short-term debt with longer-term debt in the future. In addition, from time to time, we enter into interest rate swap agreements and other related instruments to manage our mix of fixed-rate and variable-rate debt. The Company will reclassify deferred losses on interest rate locks from AOCI to interest expense over approximately the next eight years. Refer to Note 4 of Notes to Consolidated Financial Statements.
Equity Income (Loss) — Net
Equity income (loss) — net represents our Company's proportionate share of net income or loss from each of our equity method investments. In 2006, interest2009, equity income decreased by $42was $781 million, compared to 2005, primarily due to lower average short-term investment balances, partially offset by higher average interest rates. Interest expense in 2006 decreased by $20 million compared to 2005. This decrease is primarily the resultan equity loss of lower average balances on commercial paper borrowings, partially offset by higher average interest rates. We expect 2007 net interest expense to increase due to forecasted lower cash balances and higher debt balances.
In 2005, interest income increased by $78 million compared to 2004, primarily due to higher average short-term investment balances and higher average interest rates on U.S. dollar denominated deposits. Interest expense in 2005 increased by $44 million compared to 2004, primarily due to higher average interest rates on commercial paper borrowings in the United States, partially offset by lower interest expense at CCEAG due to the repayment of current maturities of long-term debt in 2005.
Equity Income—Net
Our Company's share of income from equity method investments for 2006 totaled $102 million, compared to $680$874 million in 2005, a decrease2008, an increase of $578$1,655 million. EquityIn 2008, equity income in 2006(loss) — net was reducedimpacted by approximately $602 million resulting from the impact of our proportionate share of an impairment chargeapproximately $7.6 billion pretax ($4.9 billion after-tax) of charges recorded by CCE. CCE recorded a $2.9 billion pretax ($1.8 billion after tax) impairmentdue to impairments of its North American franchise rights. The decline in the estimated fair value of CCE's North American franchise rights was the result of several factors, including but not limited to (1) CCE's revised outlook on 2007 raw material costs driven by significant increases in aluminum and HFCS; (2) a challenging marketplace environment with increased pricing pressures in several high-growth beverage categories; and (3) increased interest rates contributing to a higher discount rate and corresponding capital charge. Our 2006 equity income—net also reflected a net decrease of approximately $37 million primarily related to other impairment and restructuring charges recorded by CCE and certain other equity method investees, partially offset by approximately $33 million related to ourCompany's proportionate share of favorable changes in certain of CCE's state and Canadian federal and provincial tax rates. In addition, our 2006 equity incomethese charges was slightly impacted by the Company's sale of shares representing 8 percent of the capital stock of Coca-Cola FEMSA. The Company sold these shares to Fomento Economico Mexicano, S.A.B. de C.V. ("FEMSA"), the major shareowner of Coca-Cola FEMSA, in November 2006. As a result of this sale, our ownership interest in Coca-Cola FEMSA was reduced from approximately 40 percent to approximately 32 percent. The decrease in 2006 equity income was also the result of the sale of a portion of our investment in Coca-Cola Icecek A.S. ("Coca-Cola Icecek") in an initial public offering during the second quarter of 2006. As a result of this public offering, our Company's interest in Coca-Cola Icecek decreased from approximately 36 percent to approximately 20 percent. These reductions in ownership of Coca-Cola FEMSA and Coca-Cola Icecek will reduce our future equity income related to these equity method investees.$1.6 billion. Refer to the heading "Critical Accounting Policies and Estimates — Goodwill, Trademarks and Other Intangible Assets," and Note 314 of Notes to Consolidated Financial Statements. The decreaseincrease in equity income for 2006in 2009 was also partially offset byattributable to our Company's proportionate share of increased net income from certain of theour equity method investees, partially offset by the unfavorable impact of foreign exchange fluctuations and the Company's proportionate share of asset impairments and restructuring charges recorded by equity method investees.
In 2008, equity income (loss) — net was an equity loss of $874 million compared to equity income of $668 million in 2007, a decrease of $1,542 million. This decrease was primarily attributable to the aforementioned impairment charges recorded by CCE during 2008, of which our Company's proportionate share was approximately $1.6 billion. Refer to the heading "Critical Accounting Policies and Estimates — Goodwill, Trademarks and Other Intangible Assets" and Note 14 of Notes to Consolidated Financial Statements. In addition to our proportionate share of the net income ofcharges discussed above, the Multon juice joint venture in Russia.
In February 2007, CCE announced that it would restructure segments of its Corporate, North America and European operations. As a part of the restructuring, CCE expects a net job reductionCompany recorded charges of approximately 3,500
positions, or 5 percent of its total workforce. CCE expects this restructuring will result in a charge of approximately $300$60 million with the majority to be recognized in 2007 and 2008. The Company's equity income in 2007 and 2008 will reflect our proportionate share of the restructuring charges recorded by CCE.
Our Company's share of income from equity method investments for 2005 totaled $680 million compared to $621 million in 2004, an increase of $59 million or 10 percent,(loss) — net, primarily due to the overall improving health of the Coca-Cola bottling system in most of the world and the joint acquisition of Multon in April 2005. The increase was offset by approximately $33 million related to our proportionate share of certainrestructuring charges and asset impairments recorded by CCE.certain equity method investees.
Refer to Note 14 of Notes to Consolidated Financial Statements. The impact of these charges was partially offset by our proportionate share of increased net income from certain of our equity method investees, which included the favorable impact of foreign exchange fluctuations.
Other Income (Loss) — Net
Other income (loss) — net includes, among other things, the impact of foreign exchange gains and losses, dividend income, rental income, gains and losses related to the disposal of property, plant and equipment, realized and unrealized gains and losses on trading securities, realized gains and losses on available-for-sale securities, other-than-temporary impairments of available-for-sale securities and the accretion of expense related to certain acquisitions. The foreign currency exchange gains and losses are primarily the result of the remeasurement of monetary assets and liabilities from certain currencies into functional currencies. The effects of the remeasurement of these assets and liabilities are partially offset by the impact of our economic hedging program for certain exposures on our consolidated balance sheets. Refer to Note 4 of Notes to Consolidated Financial Statements.
In 2009, other income (loss) — net was income of $40 million, primarily related to a realized gain of approximately $44 million on the sale of equity securities classified as available-for-sale, $40 million from the sale of other investments and $18 million of dividend income from cost method investments. Refer to Note 2 and Note 14 of Notes to Consolidated Financial Statements for additional information related to the gain on the sale of available-for-sale securities. These charges includedgains were partially offset by approximately $51$34 million in net foreign currency exchange losses and an other-than-temporary impairment charge of approximately $27 million on a cost method investment. Refer to the heading "Critical Accounting Policies and Estimates — Investments in Equity and Debt Securities," and Note 13 and Note 14 of Notes to Consolidated Financial Statements.
In 2008, other income (loss) — net was income of $39 million. The Company recognized gains on divestitures of approximately $119 million, primarily related to the tax liability resulting from the repatriationsale of previously unremitted foreign earnings under the Jobs Creation Act,Remil to Coca-Cola FEMSA and approximately $18 million due to restructuring charges recorded by CCE. These charges were offset by approximately $37 million from CCE's HFCS lawsuit settlement and changes in certain of CCE's state and provincial tax rates.
Other Income (Loss)—Net
Other income (loss)—net was a net income of $195 million for 2006 compared to a net loss of $93 million for 2005, a difference of $288 million. In 2006, other income (loss)—net included a gain of approximately $175 million resulting from the sale of a portion of ourthe Company's investment in Coca-Cola FEMSA sharesPakistan to FEMSACoca-Cola Icecek A.S. ("Coca-Cola Icecek"). Refer to Note 14 of Notes to Consolidated Financial Statements. Other income (loss) — net also included approximately $24 million in net foreign currency exchange gains in 2008. The gains on divestitures and net foreign currency exchange were partially offset by other-than-temporary impairment charges of approximately $81 million on available-for-sale securities. Refer to the heading "Critical Accounting Policies and Estimates — Investments in Equity and Debt Securities," and Note 2 and Note 14 of Notes to Consolidated Financial Statements. Other income (loss) — net also included approximately $46 million of realized and unrealized losses on trading securities.
In 2007, other income (loss) — net was income of $219 million. The Company recognized a gain of approximately $123$73 million resulting fromdue to the sale of a portion of the Company's ownership interest in Coca-Cola Amatil. As a result of this transaction, our ownership interest in Coca-Cola Amatil was reduced from approximately 32 percent to 30 percent. In addition, we recognized a gain of approximately $70 million as a result of the sale of our equity investment in Coca-Cola Icecek sharesVonpar Refrescos S.A. ("Vonpar") and gains of approximately $84 million due to the sale of real estate in an initial public offering.Spain and the United States. Refer to Note 1814 of Notes to Consolidated Financial Statements. This line itemThese gains were partially offset by approximately $10 million in 2006 also included $15 million innet foreign currency exchange losses, the accretion of $58 million for the discounted value of our liability to purchase CCEAG shares (refer to Note 8 of Notes to Consolidated Financial Statements) and the minority shareowners' proportional share of net income of certain consolidated subsidiaries.losses.
Other income (loss)—net amounted to a net loss of $93 million for 2005 compared to a net loss of $82 million for 2004, a difference of $11 million. The difference was primarily related to a reduction in foreign exchange losses. This line item in 2005 primarily consisted of $23 million in foreign currency exchange losses, the accretion of $60 million for the discounted value of our liability to purchase CCEAG shares (refer to Note 8 of Notes to Consolidated Financial Statements) and the minority shareowners' proportional share of net income of certain consolidated subsidiaries.
Gains on Issuances of Stock by Equity Method Investees
When one of our equity method investees issues additional shares to third parties, our percentage ownership interest in the investee decreases. In the event the issuance price per share is higher or lower than our average carrying amount per share, we recognize a noncash gain or loss on the issuance, when appropriate. This noncash gain or loss, net of any deferred taxes, is recognized in our net income in the period the change of ownership interest occurs.
In 2006, our equity method investees did not issue any additional shares to third parties that resulted in our Company recording any noncash pretax gains.
In 2005, our Company recorded approximately $23 million of noncash pretax gains on the issuances of stock by equity method investees. The issuances primarily related to Coca-Cola Amatil's issuance of common stock in connection with the acquisition of SPC Ardmona Pty. Ltd., an Australian packaged fruit company. These issuances of common stock reduced our ownership interest in the total outstanding shares of Coca-Cola Amatil from approximately 34 percent to approximately 32 percent.
In 2004, our Company recorded approximately $24 million of noncash pretax gains on issuances of stock by CCE. The issuances primarily related to the exercise of CCE stock options by CCE employees at amounts greater than the book value per share of our investment in CCE. These issuances of stock reduced our
ownership interest in the total outstanding shares of CCE common stock from approximately 37 percent to approximately 36 percent.
Income Taxes
Our effective tax rate reflects tax benefits derived from significant operations outside the United States, which are generally taxed at rates lower than the U.S. statutory rate of 35 percent. A change in the mix of pretax income from these various tax jurisdictions can have a significant impact on the Company's periodic effective tax rate.
Our effective tax rate of approximately 22.8 percent for the year ended December 31, 2006,2009, included the following:
Our effective tax rate of approximately 21.7 percent for the year ended December 31, 2008, included the following:
Our effective tax rate of approximately 23.9 percent for the utilizationyear ended December 31, 2007, included the following:
OurAs of December 31, 2009, the gross amount of unrecognized tax benefits was approximately $354 million. If the Company were to prevail on all uncertain tax positions, the net effect would be a benefit to the Company's effective tax rate of approximately 27.2 percent$134 million, exclusive of any benefits related to interest and penalties. The remaining approximately $220 million, which was recorded as a deferred tax asset, primarily represents tax benefits that would be received in different tax jurisdictions in the event that the Company did not prevail on all uncertain tax positions. Refer to Note 11 of Notes to Consolidated Financial Statements.
A reconciliation of the changes in the gross balance of unrecognized tax benefit amounts is as follows (in millions):
Year Ended December 31, | 2009 | 2008 | 2007 | |||||||
Beginning balance of unrecognized tax benefits | $ 369 | $ 643 | $ 511 | |||||||
Increases related to prior period tax positions | 49 | 52 | 22 | |||||||
Decreases related to prior period tax positions | (28 | ) | (4 | ) | — | |||||
Increases due to current period tax positions | 16 | 47 | 51 | |||||||
Decreases related to settlements with taxing authorities | (27 | ) | (254 | ) | (4 | ) | ||||
Reductions as a result of a lapse of the applicable statute of limitations | (73 | ) | (36 | ) | (1 | ) | ||||
Increases (decreases) from effects of exchange rates | 48 | (79 | ) | 64 | ||||||
Ending balance of unrecognized tax benefits | $ 354 | $ 369 | $ 643 | |||||||
In 2008, agreements were reached between the U.S. government and a foreign government concerning the allocation of income between the two tax jurisdictions. Pursuant to these agreements, we made cash payments during the third quarter of 2008 that constituted payments of tax and interest. These payments were partially offset by tax credits taken in the third quarter and fourth quarter of 2008, and tax refunds and interest on refunds received in 2009. These benefits had been recorded as deferred tax assets in prior periods. The settlements did not have a material impact on the Company's consolidated income statement for the year ended December 31, 2005, included the following:2008.
The Company recognizes accrued interest and penalties related to unrecognized tax benefits in income tax benefit primarilyexpense. The Company had approximately $94 million, $110 million and $272 million in interest and penalties related to unrecognized tax benefits accrued as of December 31, 2009, 2008 and 2007, respectively. Of these amounts, approximately $16 million, $14 million and $82 million of benefits were recognized through tax expense for the Philippines impairment charges at a rate of approximately 4 percent;
OurCompany's effective tax rate of approximately 22.1 percent for the year ended December 31, 2004, included the following:rate.
Based on current tax laws, the Company's effective tax rate in 20072010 is expected to be approximately 2323.0 percent to 23.5 percent before considering the effect of any unusual or special items that may affect our tax rate in future years.
Liquidity, Capital Resources and Financial Position
We believe our ability to generate cash from operating activities is one of our fundamental financial strengths. WeThe near-term outlook for our business remains strong, and we expect to generate substantial cash flows from operations in 2010. As a result of our expected strong cash flows from operations, we have significant flexibility to meet our financial commitments. We typically fund a significant portion of our dividends, capital expenditures, contractual obligations, share repurchases and acquisitions with cash generated from operating activitiesactivities. We rely on external funding for additional cash requirements. The Company does not typically raise capital through the issuance of stock. Instead, we use debt financing to lower our overall cost of capital and increase our return on shareowners' equity. Refer to the heading "Cash Flows from Financing Activities," below. Our debt financing includes the use of an extensive commercial paper program as part of our overall cash management strategy. The Company reviews its optimal mix of short-term and long-term debt regularly. During the first quarter of 2009, the Company elected to replace a certain amount of commercial paper and short-term debt with longer-term debt, which resulted in the Company issuing long-term notes in the principal amounts of $900 million at a rate of 3.625 percent and $1,350 million at a rate of 4.875 percent due March 15, 2014, and March 15, 2019, respectively. Refer to Note 7 of Notes to Consolidated Financial Statements. The Company continues to review its optimal mix of short-term and long-term debt and may replace a certain amount of commercial paper and short-term debt with longer-term debt in the future.
On February 25, 2010, we entered into a definitive agreement with CCE that will result in the acquisition of the assets and liabilities of CCE's North American operations for consideration including the Company's current 34 percent ownership interest in CCE valued at approximately $3.4 billion, based upon a 30 day trailing average as of February 24, 2010, and the assumption of approximately $8.9 billion of CCE debt. At closing, CCE shareowners other than the Company will exchange their current CCE common stock for common stock in a new entity, which will retain the name CCE and hold CCE's current European operations. This new entity initially will be 100 percent owned by the CCE shareowners other than the Company. As a result of the transaction, the Company will not own any interest in the new CCE entity. The transaction is subject to CCE shareowners' approval and certain regulatory approvals. In a concurrent transaction, we reached an agreement in principle to sell our ownership interests in our Norway bottling operation, Coca-Cola Drikker AS, and our Sweden bottling operation, Coca-Cola Drycker Sverige AB, to the new CCE entity for approximately $822 million in cash. The transactions are subject to certain regulatory approvals. We expect the transactions will close in the fourth quarter of 2010.
In addition, we granted the new CCE entity the right to acquire our majority interest in our German bottling operation, Coca-Cola Erfrischungsgetraenke AG ("CCEAG"), 18 to 36 months after closing of the North America transaction, at the then current fair value.
On September 3, 2008, we announced our intention to make cash offers to purchase China Huiyuan Juice Group Limited, a Hong Kong listed company which owns the Huiyuan juice business throughout China ("Huiyuan"). The Company had accepted irrevocable undertakings from three shareholders for acceptance of the offers, in aggregate representing approximately 66 percent of the Huiyuan shares. The making of the offers was subject to preconditions relating to Chinese regulatory approvals. On March 18, 2009, the Chinese Ministry of Commerce declined approval for the Company's proposed purchase of Huiyuan. Consequently, the Company was unable to proceed with the proposed cash offers, and the irrevocable undertakings terminated.
The significant decline in the equity markets precipitated by the recent credit crisis and financial system instability has negatively affected the value of our pension plan assets. As a result of the decline in fair value of our pension plan assets, we contributed approximately $269 million to our pension plans during the year ended December 31, 2009, of which approximately $175 million was allocated to our primary U.S. plan. We anticipate making contributions in 2010 of approximately $73 million, primarily to our non-U.S. pension plans. Refer to Note 10 of Notes to Consolidated Financial Statements.
The government in Venezuela has enacted certain monetary policies that restrict the ability of companies to pay dividends from retained earnings. As of December 31, 2009, cash held by our Venezuelan subsidiary accounted for approximately 2 percent of our consolidated cash and cash equivalents balance. We translated the financial statements of our Venezuelan subsidiary at the official exchange rate that was in effect as of December 31, 2009; however, subsequent to December 31, 2009, the Venezuelan government announced a currency devaluation, and Venezuela was determined to be a hyperinflationary economy for financial reporting purposes. As a result, our local subsidiary is required to use the U.S. dollar as its functional currency, and we will remeasure the financial statements of our local subsidiary into U.S. dollars and recognize the related gains or losses from remeasurement in the line item other income (loss) — net in our consolidated statements of income. Based on the carrying value of our assets and liabilities denominated in Venezuelan bolivar as of December 31, 2009, we anticipate recognizing an initial remeasurement loss of approximately $100 million in the first quarter of 2010.
In addition to the Company's cash balances and commercial paper program, we also maintain approximately $2.3 billion of committed, currently unused lines of credit for general corporate purposes, including commercial paper backup. These backup lines of credit expire at various times from 2010 through 2012. We have evaluated the financial stability of each bank and believe we can access the funds, if needed.
Based on all of these factors, the Company believes its current liquidity position is strong, in 2007 and in future years. Accordingly, our Company expectswe will continue to meet all of our financial commitments and operating needs for the foreseeable future. We expect to use cash generated from operating activities primarily for dividends, share repurchases, acquisitions and aggregate contractual obligations.
Cash Flows from Operating Activities
Net cash provided by operating activities for the years ended December 31, 2006, 20052009, 2008 and 20042007 was approximately $6.0 billion, $6.4 billion$8,186 million, $7,571 million and $6.0 billion,$7,150 million, respectively.
Cash flows from operating activities decreased 7 percent in 2006 compared to 2005. This decrease was primarily the result of payments in 2006 of marketing accruals recorded in 2005 related to increased marketing and innovation activities and increased tax payments made in the first quarter of 2006 related to the 2005 repatriation of foreign earnings under the Jobs Creation Act. This decrease was partially offset by an increase in cash receipts in 2006 from customers, which was driven by a 4 percent growth in net operating revenues. Our cash flows from operating activities in 2006 also decreased versus 2005 as a result of a contribution of approximately $216 million to a U.S. Voluntary Employee Beneficiary Association ("VEBA"), a tax-qualified trust to fund retiree medical benefits (refer to Note 16 of Notes to Consolidated Financial Statements) and a $100 million donation made to The Coca-Cola Foundation.
Cash flows from operating activities increased $615 million, or 8 percent, in 20052009 compared to 2004. The2008. This increase was primarily relatedattributable to anlower tax payments, decreased payments to suppliers and vendors, and the receipt of a $183 million special dividend from Coca-Cola Hellenic. The special dividend received from Coca-Cola Hellenic was incremental to its normal quarterly dividend. We classified the receipt of this special dividend in cash flows from operating activities due to the fact that our cumulative equity in earnings from Coca-Cola Hellenic exceeded the cumulative distributions received; therefore, the special dividend was deemed to be a return on our investment and not a return of our investment. The impact of these items was partially offset by increased contributions to our pension plans. The increase in contributions to our pension plans was primarily due to the decline in fair value of our pension plan assets in 2008. The Company contributed approximately $269 million to our pension plans during the year ended December 31, 2009, compared to approximately $96 million during the year ended December 31, 2008.
Cash flows from operating activities increased $421 million, or 6 percent, in 2008 compared to 2007. This increase was primarily attributable to increased cash receiptscollections from customers, which was driven by a 6the 11 percent growthincrease in net operating revenues. These higherRefer to the heading "Operations Review — Net Operating Revenues." The impact of increased cash collections werefrom customers was partially offset by increased payments to suppliers and vendors, includingincreased payments relatedfor selling, general and administrative expenses and an increase in tax payments. The increase in payments to oursuppliers and vendors was primarily attributable to higher sales volume and increased marketing spending. Our cash flows from operating activitiesand advertising costs to support our brands. The increase in 2005 also improved versus 2004 astax payments included payments associated with the agreement between the U.S. government and a resultforeign government. Refer to the heading "Operations Review — Income Taxes" and Note 11 of a $137Notes to Consolidated Financial Statements. Additionally, the Company made approximately $224 million reduction in payments related to streamlining activities and the costs of productivity initiatives during 2008. Refer to Note 15 of Notes to Consolidated Financial Statements.
On May 26, 2008, the Company and the other defendants reached an agreement with the plaintiffs in a class action lawsuit (Carpenters Health & Welfare Fund of Philadelphia & Vicinity v. The Coca-Cola Company, et al.) to settle the lawsuit for approximately $138 million, without admitting any wrongdoing. The settlement amount was covered by insurance and, therefore, the settlement had no impact on our 2003 streamlining initiatives. Cash flows from operating activities in 2005 were unfavorably impacted by a $176 million increase in income taxconsolidated statement of income. The payments primarily related to paymentthis settlement were made directly from the insurers to the plaintiffs during the third quarter and fourth quarter of 2008. As a portionresult, the settlement had no impact on our consolidated statement of the tax provision associated with the repatriation of previously unremitted foreign earnings under the Jobs Creation Act.cash flows.
Cash Flows from Investing Activities
Our cash flows used inprovided by (used in) investing activities are summarized as follows (in millions):
| Year Ended December 31, | 2006 | 2005 | 2004 | |||||
| Cash flows (used in) provided by investing activities: | ||||||||
| Acquisitions and investments, principally trademarks and bottling companies | $ (901 | ) | $ (637 | ) | $ (267 | ) | ||
| Purchases of other investments | (82 | ) | (53 | ) | (46 | ) | ||
| Proceeds from disposals of other investments | 640 | 33 | 161 | |||||
| Purchases of property, plant and equipment | (1,407 | ) | (899 | ) | (755 | ) | ||
| Proceeds from disposals of property, plant and equipment | 112 | 88 | 341 | |||||
| Other investing activities | (62 | ) | (28 | ) | 63 | |||
| Net cash used in investing activities | $ (1,700 | ) | $ (1,496 | ) | $ (503 | ) | ||
Year Ended December 31, | 2009 | 2008 | 2007 | |||||||
Acquisitions and investments, principally beverage and bottling companies and trademarks | $ (300 | ) | $ (759 | ) | $ (5,653 | ) | ||||
Purchases of other investments | (2,152 | ) | (240 | ) | (99 | ) | ||||
Proceeds from disposals of bottling companies and other investments | 240 | 479 | 448 | |||||||
Purchases of property, plant and equipment | (1,993 | ) | (1,968 | ) | (1,648 | ) | ||||
Proceeds from disposals of property, plant and equipment | 104 | 129 | 239 | |||||||
Other investing activities | (48 | ) | (4 | ) | (6 | ) | ||||
Net cash provided by (used in) investing activities | $ (4,149 | ) | $ (2,363 | ) | $ (6,719 | ) | ||||
PurchasesDuring 2009, our Company's acquisition and investment activities totaled approximately $300 million. None of property, plantthe acquisitions or investments was individually significant. Included in these investment activities was the acquisition of a minority interest in Fresh Trading Ltd. Additionally, the Company and equipment accountedthe existing shareowners of Fresh Trading Ltd. entered into a series of put and call options for the most significant cash outlays for investing activities in eachCompany to potentially acquire some or all of the three years ended December 31, 2006. Our Company currently estimates thatremaining shares not already owned by the Company. The put and call options are exercisable in stages between 2010 and 2014. Refer to Note 17 of Notes to Consolidated Financial Statements.
In 2009, purchases of property, plant and equipmentother investments included time deposits of $2,130 million, which were classified as short-term investments in 2007 will be approximately $1.5 billion.our consolidated balance sheet. These time deposits have maturities of greater than three months, but less than one year. The Company's decision to invest in longer-term time deposits in 2009 was primarily to match the maturities of short-term debt issued as part of our commercial paper program. Refer to the heading "Cash Flows from Financing Activities."
During 2008, the Company's acquisition and investment activities included the acquisition of brands and licenses in Denmark and Finland from Carlsberg for Total capital expendituresproperty, plant and equipment (including our investments in information technology) andapproximately $225 million. None of the percentageother acquisitions during 2008 was individually significant. Refer to Note 17 of such totals by operating segment for 2006, 2005 and 2004 wereNotes to Consolidated Financial Statements. Investing activities during 2008 also included proceeds of approximately $275 million, net of the cash balance as follows:
| Year Ended December 31, | 2006 | 2005 | 2004 | ||||
| Capital expenditures (in millions) | $ 1,407 | $ 899 | $ 755 | ||||
| Africa | 2.7 | % | 2.5 | % | 2.3 | % | |
| East, South Asia and Pacific Rim | 0.7 | 0.8 | 0.9 | ||||
| European Union | 6.6 | 8.6 | 5.1 | ||||
| Latin America | 3.1 | 2.7 | 3.4 | ||||
| North America | 29.9 | 29.5 | 32.7 | ||||
| North Asia, Eurasia and Middle East | 9.2 | 9.9 | 6.0 | ||||
| Bottling Investments | 29.7 | 29.4 | 34.1 | ||||
| Corporate | 18.1 | 16.6 | 15.5 | ||||
Acquisitions and investments representedof the next most significant investing activity, accounting for $901 million in 2006, $637 million in 2005 and $267 million in 2004.disposal date, related to the sale of Remil to Coca-Cola FEMSA. Refer to Note 14 of Notes to Consolidated Financial Statements.
In 2006,2007, our Company acquired glacéau, 18 German bottling and distribution operations, Fuze and Leao Junior. Our Company also completed the acquisition of the remaining 65 percent of the shares of capital stock of CCBPI not previously owned by our Company. In addition, the Company acquired a controlling50 percent interest in CCCILJugos del Valle, a 34 percent interest in Tokyo Coca-Cola Bottling Company ("Tokyo CCBC") and acquired Apollinaris and TJC.an 11 percent interest in NORSA. Refer to Note 1917 of Notes to Consolidated Financial Statements. The remaining amount of cash used for acquisitions and investments was primarily related to the acquisition of various trademarks and brands, none of which werewas individually significant.
Investing activities in 20062007 also included proceeds of approximately $198$238 million received from the sale of sharesour 49 percent equity interest in connection with the initial public offering of Coca-Cola Icecek and proceeds ofVonpar, approximately $427$143 million received from the sale of a portion of our interest in Coca-Cola FEMSA shares to FEMSA.Amatil, and approximately $106 million in proceeds from the sale of real estate in Spain and in the United States. Refer to Note 314 of Notes to Consolidated Financial Statements.
In April 2005, our CompanyPurchases of property, plant and Coca-Cola HBC jointly acquired Multonequipment net of disposals for a total purchase pricethe years ended December 31, 2009, 2008 and 2007 were approximately $1,889 million, $1,839 million and $1,409 million, respectively. The increase in 2009 and 2008 compared to 2007 was primarily attributable to the acquisitions of approximately $501 million, split equally between the Companycertain bottling operations in 2007 and Coca-Cola HBC. During the third quarter of 2005, our Company acquired the German bottling company Bremer for approximately $160 million from InBev SA. Also in 2005, the Company acquired Sucos Mais, a Brazilian juice company, and completed the acquisition of the remaining 49 percent interest in the business of CCDA Waters L.L.C. not previously owned by our Company.2006. Refer to Note 1917 of Notes to Consolidated Financial Statements.
In 2004, proceeds from disposals Generally, bottling and finished product operations are more capital intensive compared to concentrate and syrup operations. Our Company currently estimates that net purchases of property, plant and equipment in 2010 will be in line with 2009 and 2008.
Total capital expenditures for property, plant and equipment (including our investments in information technology) and the percentage of approximately $341 million related primarily to the sale of production assets in Japan. Refer to Note 3 of Notes to Consolidated Financial Statements. In 2004, cash paymentssuch totals by operating segment for acquisitions2009, 2008 and investments were primarily related to the purchase of trademarks in Latin America.
Cash Flows from Financing Activities
Our cash flows used in financing activities2007 were as follows (in millions):
| Year Ended December 31, | 2006 | 2005 | 2004 | |||||
| Cash flows provided by (used in) financing activities: | ||||||||
| Issuances of debt | $ 617 | $ 178 | $ 3,030 | |||||
| Payments of debt | (2,021 | ) | (2,460 | ) | (1,316 | ) | ||
| Issuances of stock | 148 | 230 | 193 | |||||
| Purchases of stock for treasury | (2,416 | ) | (2,055 | ) | (1,739 | ) | ||
| Dividends | (2,911 | ) | (2,678 | ) | (2,429 | ) | ||
| Net cash used in financing activities | $ (6,583 | ) | $ (6,785 | ) | $ (2,261 | ) | ||
Year Ended December 31, | 2009 | 2008 | 2007 | |||||||
Capital expenditures | $ 1,993 | $ 1,968 | $ 1,648 | |||||||
Eurasia & Africa | 3.5 | % | 3.4 | % | 4.5 | % | ||||
Europe | 3.4 | 3.9 | 4.8 | |||||||
Latin America | 6.2 | 2.9 | 2.8 | |||||||
North America | 23.0 | 25.0 | 20.9 | |||||||
Pacific | 4.6 | 9.0 | 11.6 | |||||||
Bottling Investments | 41.4 | 41.6 | 39.1 | |||||||
Corporate | 17.9 | 14.2 | 16.3 | |||||||
Cash Flows from Financing Activities | ||||||||||
Our cash flows provided by (used in) financing activities were as follows (in millions): | ||||||||||
Year Ended December 31, | 2009 | 2008 | 2007 | |||||||
Issuances of debt | $ 14,689 | $ 4,337 | $ 9,979 | |||||||
Payments of debt | (12,326 | ) | (4,308 | ) | (5,638 | ) | ||||
Issuances of stock | 662 | 586 | 1,619 | |||||||
Purchases of stock for treasury | (1,518 | ) | (1,079 | ) | (1,838 | ) | ||||
Dividends | (3,800 | ) | (3,521 | ) | (3,149 | ) | ||||
Net cash provided by (used in) financing activities | $ (2,293 | ) | $ (3,985 | ) | $ 973 | |||||
Debt Financing
Our Company maintains debt levels we consider prudent based on our cash flows, interest coverage ratio and percentage of debt to capital. We use debt financing to lower our overall cost of capital, which increases our return on
shareowners' equity. This exposes us to adverse changes in interest rates. Our interest expense may also be affected by our credit ratings.
As of December 31, 2006,2009, our long-term debt was rated "A+" by Standard & Poor's, and "Aa3" by Moody's and our"A+" by Fitch. Our commercial paper program was rated "A-1" and "P-1" by Standard & Poor's, "P-1" by Moody's and Moody's, respectively."F-1" by Fitch. In assessing our credit strength, both Standard & Poor's and Moody'sall three agencies consider our capital structure (including the amount and maturity dates of our debt) and financial policies as well as the aggregated balance sheet and other financial information for the Company and certain bottlers, including CCE and Coca-Cola HBC.Hellenic. While the Company has no legal obligation for the debt of these bottlers, the rating agencies believe the strategic importance of the bottlers to the Company's business model provides the Company with an incentive to keep these bottlers viable. It is our expectation that the credit rating agencies will continue using this methodology. If our credit ratings were reduced byto be downgraded as a result of changes in our capital structure, our major bottlers' financial performance, changes in the credit rating agencies,agencies' methodology in assessing our interest expensecredit strength, or for any other reason, our cost of borrowing could increase. Additionally, if certain bottlers' credit ratings were to decline, the Company's share of equity income could be reduced as a result of the potential increase in interest expense for these bottlers.
In 2009, Standard & Poor's affirmed the Company's A+ long-term debt rating and revised its outlook from negative to stable. Moody's revised its Aa3 rating for the Company's long-term debt in 2009 from negative outlook to stable. The Company does not believe that a downgrade by either agency would have a significant adverse effect on the cost of borrowing.
We monitor our interest coverage ratiofinancial ratios and, as indicated above, the rating agencies consider our ratiothese ratios in assessing our credit ratings. However, the rating agencies aggregate financial data for certain bottlers along with our Company when assessing our debt rating. As such, the key measure to rating agencies is the aggregate interest coverage ratio of the Company and certain bottlers. Both Standard & Poor's and Moody's employ different aggregation methodologies and have different thresholds for the aggregate interest coverage ratio.various financial ratios. These thresholds are not necessarily permanent, nor are they always fully disclosed to our Company.
Our global presence and strong capital position give us access to key financial markets around the world, enabling us to raise funds at a low effective cost. This posture, coupled with active management of our mix of short-term and long-term debt and our mix of fixed-rate and variable-rate debt, results in a lower overall cost of borrowing. Our debt management policies, in conjunction with our share repurchase programs and investment activity, can result in current liabilities exceeding current assets.
Issuances and payments of debt included both short-term and long-term financing activities. On December 31, 2006,2009, we had $1,952approximately $3,082 million in lines of credit and other short-term credit facilities available, of which approximately $225$427 million was outstanding. TheThis outstanding amount of $225 million was primarily related to our international operations.
In 2009, the Company had issuances of debt of approximately $14,689 million and payments of debt of $12,326 million. The issuances of debt included approximately $12,397 million of issuances of commercial paper and short-term debt with maturities greater than 90 days, as well as $900 million and $1,350 million of long-term debt due March 15, 2014, and March 15, 2019, respectively. The payments of debt included approximately $1,861 million of net payments of commercial paper and short-term debt with maturities of 90 days or less; $10,017 million related to commercial paper and short-term debt with maturities greater than 90 days; and $448 million related to long-term debt. The increase in issuances and payments of commercial paper with maturities of greater than 90 days was primarily due to a favorable interest rate environment on longer-term commercial paper. As a result, the Company also began investing in longer-term time deposits that have maturities of greater than three months. Refer to the heading "Cash Flows from Investing Activities." The Company continues to review its optimal mix of short-term and long-term debt.
The issuances of debt in 2006 primarily2008 included approximately $484$4,001 million of issuances of commercial paper and short-term debt with maturities of greater than 90 days.days, and approximately $194 million of net issuances of commercial paper and short-term debt with maturities of 90 days or less. The payments of debt in 2006 primarily2008 included approximately $580$4,032 million related to commercial paper and short-term debt with maturities of greater than 90 days.
The issuances of debt in 2007 included approximately $6,024 million of issuances of commercial paper and short-term debt with maturities of greater than 90 days, approximately $1,750 million in issuances of long-term notes due November 15, 2017, and approximately $1,383$2,024 million of net repaymentsissuances of commercial paper and short-term debt with maturities of 90 days or less.
The issuancesincrease in debt was primarily due to 2007 acquisitions. Refer to Note 17 of debt in 2005 primarily included approximately $144 million of issuances of commercial paper with maturities of 90 days or more. The payments of debt primarily included approximately $1,037 million relatedNotes to net repayments of commercial paper with maturities of less than 90 days, repayments of commercial paper with maturities greater than 90 days of approximately $32 million and repayment of approximately $1,363 million of long-term debt.
The issuances of debt in 2004 primarily included approximately $2,109 million of net issuances of commercial paper with maturities of 90 days or less, and approximately $818 million of issuances of commercial paper with maturities of more than 90 days.Consolidated Financial Statements. The payments of debt in 2004 primarily2007 included approximately $927$5,514 million related to commercial paper and short-term debt with maturities of moregreater than 90 daysdays. Included in these payments was the payment of the outstanding liability to CCEAG shareowners in January 2007 of $1,068 million.
Issuances of Stock
The issuances of stock in 2009, 2008 and $3672007 primarily related to the exercise of stock options by Company employees. In addition, during 2007, certain executive officers and former shareholders of glacéau invested approximately $179 million of long-term debt.their proceeds from the sale of glacéau in common stock of the Company at then current market prices. These shares of Company common stock were placed in escrow pursuant to the glacéau acquisition agreement.
Share Repurchases
In October 1996, our Board of Directors authorized a plan ("1996 Plan") to repurchase up to 206 million shares of our Company's common stock through 2006. On July 20, 2006, the Board of Directors of the Company authorized a new share repurchase program of up to 300 million shares of the Company's common stock. The new program took effect upon the expiration of the 1996 Plan on October 31, 2006. The table below presents annual shares repurchased and average price per share:
| Year Ended December 31, | 2006 | 2005 | 2004 | |||
| Number of shares repurchased (in millions) | 55 | 46 | 38 | |||
| Average price per share | $ 45.19 | $ 43.26 | $ 46.33 | |||
Year Ended December 31, | 2009 | 2008 | 2007 | |||||||
Number of shares repurchased (in millions) | 26 | 18 | 34 | |||||||
Average price per share | $ 57.09 | $ 58.01 | $ 51.66 | |||||||
Since the inception of our initial share repurchase program in 1984 through our current program as of December 31, 2006,2009, we have purchased more than 1.2approximately 1.3 billion shares of our Company's common stock at an average price per share of $17.53.
As strong cash flows are expected$19.78. In addition to continue inshares repurchased under the future,stock repurchase plans authorized by our Board of Directors, the Company's treasury stock activity also includes shares surrendered to the Company to pay the exercise price and/or to satisfy tax withholding obligations in connection with so-called stock swap exercises of employee stock options and/or the vesting of restricted stock issued to employees. In 2009, we repurchased approximately $1.5 billion of our stock. We currently expects 2007 shareexpect to repurchase an additional $1.5 billion of our stock during 2010. However, we anticipate that these repurchases will be subsequent to be in the rangeclose of $2.5 billionour acquisition of CCE's North American operations. Refer to $3.0 billion.Note 19 of Notes to Consolidated Financial Statements.
Dividends
At its February 20072010 meeting, our Board of Directors increased our quarterly dividend by 107 percent, raising it to $0.34$0.44 per share, equivalent to a full-yearfull year dividend of $1.36$1.76 per share in 2007.2010. This is our 4548th consecutive annual increase. Our annual common stock dividend was $1.24$1.64 per share, $1.12$1.52 per share and $1.00$1.36 per share in 2006, 20052009, 2008 and 2004,2007, respectively. The 20062009 dividend represented a 10an 8 percent increase from 2005,2008, and the 20052008 dividend represented a 12 percent increase from 2004.2007.
Off–BalanceOff-Balance Sheet Arrangements and Aggregate Contractual Obligations
Off–BalanceOff-Balance Sheet Arrangements
In accordance with the definition under SEC rules, the following qualify as off–balanceoff-balance sheet arrangements:
As of December 31, 2006, our Company was2009, we were contingently liable for guarantees of indebtedness owed by third parties in the amount of approximately $270$245 million. These guarantees primarily are related to third-party customers, bottlers and vendors and have arisen through the normal course of business. These guarantees have various terms, and none of
these guarantees was individually significant. The amount represents the maximum potential future payments that we could be required to make under the guarantees; however, we do not consider it probable that we will be required to satisfy these guarantees. Management concluded that the likelihood of any materialsignificant amounts being paid by our Company under these guarantees is not probable. As of December 31, 2006,2009, we were not directly liable for the debt of any unconsolidated entity, and we did not have any retained or contingent interest in assets as defined above.
Our Company recognizes all derivatives as either assets or liabilities at fair value in our consolidated balance sheets. Refer to Note 124 of Notes to Consolidated Financial Statements.
In December 2003, we granted a $250 million standby line of credit to Coca-Cola FEMSA with normal market terms. This standby line of credit expired in December 2006.
Aggregate Contractual Obligations
As of December 31, 2006,2009, the Company's contractual obligations, including payments due by period, were as follows (in millions):
| Payments Due by Period | |||||||||||
| Total | 2007 | 2008-2009 | 2010-2011 | 2012 and Thereafter | |||||||
| Short-term loans and notes payable1: | |||||||||||
| Commercial paper borrowings | $ 1,942 | $ 1,942 | $ — | $ — | $ — | ||||||
| Lines of credit and other short-term borrowings | 225 | 225 | — | — | — | ||||||
| Liability to CCEAG shareowners2 | 1,068 | 1,068 | — | — | — | ||||||
| Current maturities of long-term debt3 | 33 | 33 | — | — | — | ||||||
| Long-term debt, net of current maturities3 | 1,314 | — | 611 | 576 | 127 | ||||||
| Estimated interest payments4 | 993 | 80 | 135 | 73 | 705 | ||||||
| Purchase obligations5 | 8,401 | 4,815 | 1,237 | 636 | 1,713 | ||||||
| Marketing obligations6 | 3,925 | 1,579 | 832 | 583 | 931 | ||||||
| Lease obligations | 545 | 141 | 193 | 127 | 84 | ||||||
| Total contractual obligations | $ 18,446 | $ 9,883 | $ 3,008 | $ 1,995 | $ 3,560 | ||||||
| Payments Due by Period | ||||||||||
| Total | 2010 | 2011-2012 | 2013-2014 | 2015 and Thereafter | ||||||
Short-term loans and notes payable1: | ||||||||||
Commercial paper borrowings | $ 6,322 | $ 6,322 | $ — | $ — | $ — | |||||
Lines of credit and other short-term borrowings | 427 | 427 | — | — | — | |||||
Current maturities of long-term debt2 | 51 | 51 | — | — | — | |||||
Long-term debt, net of current maturities2 | 5,059 | — | 726 | 1,090 | 3,243 | |||||
Estimated interest payments3 | 2,348 | 246 | 448 | 396 | 1,258 | |||||
Accrued income taxes4 | 264 | 264 | — | — | — | |||||
Purchase obligations5 | 9,950 | 6,465 | 1,017 | 1,205 | 1,263 | |||||
Marketing obligations6 | 4,216 | 2,300 | 777 | 425 | 714 | |||||
Lease obligations | 636 | 193 | 230 | 105 | 108 | |||||
Total contractual obligations4,7 | $ 29,273 | $ 16,268 | $ 3,198 | $ 3,221 | $ 6,586 | |||||
1 | Refer to Note | ||||||||||
2 | Refer to Note | ||||||||||
| We calculated estimated interest payments for our long-term | ||||||||||
4 Refer to Note 11 of Notes to Consolidated Financial Statements for information regarding income taxes. As of December 31, 2009, the noncurrent portion of our income tax liability, including accrued interest and penalties related to unrecognized tax benefits, was approximately $420 million, which was not included in the total above. At this time, the settlement period for the noncurrent portion of our income tax liability cannot be determined. In addition, any payments related to unrecognized tax benefits would be partially offset by reductions in payments in other jurisdictions. | |||||||||||
5 | |||||||||||
6 | We expect to fund these marketing obligations with cash flows from operating activities. | ||||||||||
7 Included within total contractual obligations are approximately $560 million of obligations of entities that were deconsolidated effective January 1, 2010. Refer to the heading "Critical Accounting Policies and Estimates-Principles of Consolidation." | |||||||||||
In accordance with SFAS No. 87, "Employers' Accounting for Pensions," and SFAS No. 106, "Employers' Accounting for Postretirement Benefits Other Than Pensions," as amended by SFAS No. 158, "Employers' Accounting for Defined Benefit Pension and Other Postretirement Plans—an amendment of FASB Statements No. 87, 88, 106, and 132(R)," theThe total accrued benefit liability for pension and other postretirement benefit plans recognized as of December 31, 2006,2009, was $1,273approximately $1,339 million. Refer to Note 1610 of Notes to Consolidated Financial Statements. This accrued liability is included in the consolidated balance sheet line item other liabilities. This amount is impacted by, among other items, pension expense, funding levels, plan amendments, changes in plan demographics and assumptions, and the investment return on plan assets, and the application of SFAS No. 158.assets. Because the accrued liability does not represent expected liquidity needs, we did not include this amount in the contractual obligations table.
The Pension Protection Act of 2006 ("PPA") was enacted in August 2006 and established, among other things, new standards for funding of U.S. defined benefit pension plans. OneDuring 2008, the funded status of the Company's primary objectives of the PPA is to improve the financial integrity of underfunded plans through the requirement of additional contributions. The requirements of the PPA will not have a significant impact on our financial condition because, under the provisions of the PPA, the minimum required contribution for the primary funded U.S. defined benefit pension plan is projected to be zero through 2017declined as a result of contributions we have madethe overall stock market decline. In early 2009, the Company contributed approximately $175 million to this plan. Subsequent to this contribution, the plan since 2001. Therefore, we did not include any amountsis sufficiently funded to maintain maximum flexibility as a contractual obligationoutlined in the above table. We may, however, decide to make additional discretionary contributions to our pension and other benefit plans in future years. In addition, as a result of contributions totaling approximately $224 million in 2006 to fund a portion of our U.S. postretirement healthcare obligation, including a contribution of $216 million to a VEBA trust, we do not expect to contribute to our U.S. postretirement healthcare plan in 2007.PPA. We generally expect to fund all future contributions with cash flows from operating activities.
Our international pension plans are funded in accordance with local laws and income tax regulations. We do not expect contributions to these plans to be material in 20072010 or thereafter. Therefore, no amounts have been included in the table above.
As of December 31, 2006,2009, the projected benefit obligation of the U.S. qualified pension plans was $1,660$2,138 million, and the fair value of plan assets was $2,120approximately $1,975 million. The majority of this underfunding was due to the negative impact that the recent credit crisis and financial system instability had on the value of our pension plan assets. As of December 31, 2006,2009, the projected benefit obligation of all pension plans other than the U.S. qualified pension plans was $1,385approximately $1,858 million, and the fair value of all other pension plan assets was $723approximately $1,057 million. The majority of this underfunding is attributable to an international pension plan for certain non-U.S. employees that is unfunded due to tax law restrictions, as well as our unfunded U.S. nonqualified pension plans. These U.S. nonqualified pension plans provide, for certain associates, benefits that are not permitted to be funded through a qualified plan because of limits imposed by the Internal Revenue Code of 1986. Disclosure of amountsThe expected benefit payments for these unfunded pension plans are not included in the above table regarding expected benefit payments for our unfunded pension plans.above. However, we anticipate annual benefit payments to these unfunded pension plans to be in the range of approximately $25 million to $30$35 million in 20072010 and remain near that level through 2030, decreasing annually thereafter. Refer to remain at or near this annual level for the next several years. We can not reasonably estimate these payments for 2012 and thereafter dueNote 10 of Notes to the ongoing nature of the obligations under these plans.Consolidated Financial Statements.
Deferred income tax liabilities as of December 31, 2006,2009, were $641approximately $1,614 million. Refer to Note 1711 of Notes to Consolidated Financial Statements. This amount is not included in the total contractual obligations table because we believe this presentation would not be meaningful. Deferred income tax liabilities are calculated based on temporary differences between the tax bases of assets and liabilities and their respective book bases, which will result in taxable amounts in future years when the liabilities are settled at their reported financial statement amounts. The results of these calculations do not have a direct connection with the amount of cash taxes to be paid in any future periods. As a result, scheduling deferred income tax liabilities as payments due by period could be misleading, because this scheduling would not relate to liquidity needs.
Minority interests of $358 million as of December 31, 2006, for consolidated entities in which we do not have a 100 percent ownership interest were recorded in the consolidated balance sheet line item other liabilities. Such minority interests are not liabilities requiring the use of cash or other resources; therefore, this amount is excluded from the contractual obligations table.
Foreign Exchange
Our international operations are subject to certain opportunities and risks, relating to foreignincluding currency fluctuations and governmental actions. We closely monitor our operations in each country and seek to adopt appropriate strategies that are responsive to changing economic and political environments, and to fluctuations in foreign currency exchange rates.currencies.
We use 6472 functional currencies. Due to our global operations, weaknessesweakness in some of these currencies might be offset by strength in others. In 2006, 20052009, 2008 and 2004,2007, the weighted-average exchange rates for foreign
currencies in which the Company conducted operations (all operating currencies), and for certain individual currencies, strengthened (weakened) against the U.S. dollar as follows:
| Year Ended December 31, | 2006 | 2005 | 2004 | ||||
| All operating currencies | (1 | )% | 2 | % | 6 | % | |
| Brazilian real | 10 | % | 21 | % | 5 | % | |
| Mexican peso | 0 | % | 4 | % | (5 | )% | |
| Australian dollar | (1 | )% | 3 | % | 13 | % | |
| South African rand | (7 | )% | 1 | % | 18 | % | |
| British pound | 1 | % | 0 | % | 12 | % | |
| Euro | 1 | % | 1 | % | 9 | % | |
| Japanese yen | (6 | )% | (1 | )% | 7 | % | |
Year Ended December 31, | 2009 | 2008 | 2007 | |||||||
All operating currencies | (9 | )% | 5 | % | 4 | % | ||||
Brazilian real | (8 | )% | 6 | % | 11 | % | ||||
Mexican peso | (24 | ) | 0 | 0 | ||||||
Australian dollar | (8 | ) | 1 | 10 | ||||||
South African rand | (1 | ) | (18 | ) | (3 | ) | ||||
British pound | (18 | ) | (9 | ) | 9 | |||||
Euro | (8 | ) | 9 | 8 | ||||||
Japanese yen | 9 | 12 | (2 | ) | ||||||
These percentages do not include the effects of our hedging activities and, therefore, do not reflect the actual impact of fluctuations in exchange rates on our operating results. Our foreign currency management program is designed to
mitigate, over time, a portion of the impact of exchange rate changes on our net income and earnings per share. The total currency impact on operating income, including the effect of our hedging activities, was a decrease of approximately 111 percent in 2006. The impact2009 and an increase of a weaker U.S. dollar increased our operating income by approximately 4 percent and 86 percent in 2005 and 2004, respectively. The2008. Based on the anticipated benefits of hedging coverage in place, the Company currently expects currencies to have littlea slightly positive impact on operating income in 2007.2010, with the benefit more heavily impacting our results in the first half of the year.
Exchange losses—net amounted to approximately $15 million in 2006, $23 million in 2005Foreign currency exchange gains and $39 million in 2004 and were recorded in other income (loss)—net in our consolidated statementslosses are primarily the result of income. Exchange losses—net include the remeasurement of monetary assets and liabilities from certain currencies into functional currenciescurrencies. The effects of the remeasurement of these assets and liabilities are partially offset by the costsimpact of our economic hedging program for certain exposures ofon our consolidated balance sheets. Refer to Note 124 of Notes to Consolidated Financial Statements. Foreign currency exchange gains and losses are included as a component of other income (loss) — net in our consolidated financial statements. Refer to the heading "Operations Review — Other Income (Loss) — Net." The Company recorded a foreign currency loss of $34 million in 2009, a foreign currency gain of $24 million in 2008 and a foreign currency loss of $10 million in 2007.
As of December 31, 2009, we translated the financial statements of our Venezuelan subsidiary at the official exchange rate that was in effect as of that date; however, subsequent to December 31, 2009, the Venezuelan government announced a currency devaluation, and Venezuela was determined to be a hyperinflationary economy. As a result, our local subsidiary is required to use the U.S. dollar as its functional currency, and we will remeasure the financial statements of our local subsidiary into U.S. dollars and recognize the related gains or losses from remeasurement in the line item other income (loss) — net going forward. Based on the carrying value of our assets and liabilities denominated in Venezuelan bolivar as of December 31, 2009, we anticipate recognizing an initial remeasurement loss of approximately $100 million in the first quarter of 2010.
The Company will continue to manage its foreign currency exposure to mitigate, over time, a portion of the impact of exchange rate changes on net income and earnings per share.
Overview of Financial Position
Our consolidated balance sheet as of December 31, 2006,2009, compared to our consolidated balance sheet as of December 31, 2005,2008, was impacted by the following:
Impact of Inflation and Changing Prices
Inflation affects the way we operate in many markets around the world. In general, we believe that, over time, we are able to increase prices to counteract the majority of the inflationary effects of increasing costs and to generate sufficient cash flows to maintain our productive capability.
Additional Information
Effective January 1, 2007, we combined the Eurasia and Middle East Division, and the Russia, Ukraine and Belarus Division, both of which were previously included in the North Asia, Eurasia and Middle East operating segment, with the India Division, previously included in the East, South Asia and Pacific Rim operating segment, to form the Eurasia operating segment; and we combined the China Division and the Japan Division, previously included in the North Asia, Eurasia and Middle East operating segment, with the remaining East, South Asia and Pacific Rim operating segment to form the Pacific operating segment. As a result, beginning with the first quarter of 2007, our organizational structure will consist of the following operating segments: Africa; Eurasia; European Union; Latin America; North America; Pacific; Bottling Investments; and Corporate.
For information concerning our operating segments as of December 31, 2006, refer to Note 20 of Notes to Consolidated Financial Statements.
ITEM 7A. QUANTITATIVE AND QUALITATIVE DISCLOSURES ABOUT MARKET RISK
Our Company uses derivative financial instruments primarily to reduce our exposure to adverse fluctuations in interest rates and foreign currency exchange rates, and, to a lesser extent, adverse fluctuations in interest rates and commodity prices and other market risks. We do not enter into derivative financial instruments for trading purposes. As a matter of policy, all of our derivative positions are used to reduce risk by hedging an underlying economic exposure. Because of the high correlation between the hedging instrument and the underlying exposure, fluctuations in the value of the instruments are generally offset by reciprocal changes in the value of the underlying exposure. The Company generally hedges anticipated exposures up to 36 months in advance; however, the majority of our derivative instruments expire within 24 months or less. Virtually all of our derivatives are straightforward over-the-counter instruments with liquid markets.
Foreign Exchange
We manage most of our foreign currency exposures on a consolidated basis, which allows us to net certain exposures and take advantage of any natural offsets. In 2006,2009, we generated approximately 7274 percent of our net operating revenues from operations outside of the United States; therefore, weakness in one particular currency might be offset by strengths in other currencies over time. We use derivative financial instruments to further reduce our net exposure to currency fluctuations.
Our Company enters into forward exchange contracts and purchases currency options (principally euro and Japanese yen) and collars to hedge certain portions of forecasted cash flows denominated in foreign currencies. Additionally, we enter into forward exchange contracts to offset the earnings impact relating to exchange rate fluctuations on certain monetary assets and liabilities. We also enter into forward exchange contracts as hedges of net investments in international operations.
Interest Rates
We monitor our mix of fixed-rate and variable-rate debt, as well as our mix of termshort-term debt versus non-termlong-term debt. From time to time, we enter into interest rate swap agreements to manage our mix of fixed-rate and variable-rate debt.
Value-at-Risk
We monitor our exposure to financial market risks using several objective measurement systems, including value-at-risk models. Our value-at-risk calculations use a historical simulation model to estimate potential future losses in the fair value of our derivatives and other financial instruments that could occur as a result of adverse movements in foreign currency and interest rates. We have not considered the potential impact of favorable movements in foreign currency and interest rates on our calculations. We examined historical weekly returns over the previous 10 years to calculate our value-at-risk. The average value-at-risk represents the simple average of quarterly amounts over the past year. As a result of our foreign currency value-at-risk calculations, we estimate with 95 percent confidence that the fair values of our foreign currency derivatives, and other financial instruments, over a one-week period, would decline by not more than approximately $14$34 million, $9$44 million and $17$20 million, respectively, using 2006, 20052009, 2008 or 20042007 average fair values, and by not more than approximately $14$34 million and $9$30 million, respectively, using December 31, 20062009, and 20052008 fair values. According to our interest rate value-at-risk calculations, we estimate with 95 percent confidence that any increase in our net interest expense due to an adverse move in our 20062009 average or in our December 31, 2006,2009, interest rates over a one-week period would not have a material impact on our consolidated financial statements. Our December 31, 20052008 and 20042007 estimates were also were not material to our consolidated financial statements.
ITEM 8. FINANCIAL STATEMENTS AND SUPPLEMENTARY DATA
| Page | |||||
Consolidated Statements of Income | 67 | ||||
Consolidated Balance Sheets | 68 | ||||
Consolidated Statements of Cash Flows | 69 | ||||
Consolidated Statements of Shareowners' Equity | 70 | ||||
Notes to Consolidated Financial Statements | 71 | ||||
Report of Management | |||||
Report of Independent Registered Public Accounting Firm | |||||
Report of Independent Registered Public Accounting Firm on Internal Control Over Financial Reporting | |||||
Quarterly Data (Unaudited) |
THE COCA-COLA COMPANY AND SUBSIDIARIES
CONSOLIDATED STATEMENTS OF INCOME
| Year Ended December 31, | 2006 | 2005 | 2004 | ||||
(In millions except per share data) | |||||||
NET OPERATING REVENUES | $ 24,088 | $ 23,104 | $ 21,742 | ||||
| Cost of goods sold | 8,164 | 8,195 | 7,674 | ||||
| GROSS PROFIT | 15,924 | 14,909 | 14,068 | ||||
| Selling, general and administrative expenses | 9,431 | 8,739 | 7,890 | ||||
| Other operating charges | 185 | 85 | 480 | ||||
| OPERATING INCOME | 6,308 | 6,085 | 5,698 | ||||
| Interest income | 193 | 235 | 157 | ||||
| Interest expense | 220 | 240 | 196 | ||||
| Equity income — net | 102 | 680 | 621 | ||||
| Other income (loss) — net | 195 | (93 | ) | (82 | ) | ||
| Gains on issuances of stock by equity method investees | — | 23 | 24 | ||||
| INCOME BEFORE INCOME TAXES | 6,578 | 6,690 | 6,222 | ||||
| Income taxes | 1,498 | 1,818 | 1,375 | ||||
| NET INCOME | $ 5,080 | $ 4,872 | $ 4,847 | ||||
| BASIC NET INCOME PER SHARE | $ 2.16 | $ 2.04 | $ 2.00 | ||||
| DILUTED NET INCOME PER SHARE | $ 2.16 | $ 2.04 | $ 2.00 | ||||
| AVERAGE SHARES OUTSTANDING | 2,348 | 2,392 | 2,426 | ||||
| Effect of dilutive securities | 2 | 1 | 3 | ||||
| AVERAGE SHARES OUTSTANDING ASSUMING DILUTION | 2,350 | 2,393 | 2,429 | ||||
Year Ended December 31, | 2009 | 2008 | 2007 | |||||||
(In millions except per share data) | ||||||||||
NET OPERATING REVENUES | $ 30,990 | $ 31,944 | $ 28,857 | |||||||
Cost of goods sold | 11,088 | 11,374 | 10,406 | |||||||
GROSS PROFIT | 19,902 | 20,570 | 18,451 | |||||||
Selling, general and administrative expenses | 11,358 | 11,774 | 10,945 | |||||||
Other operating charges | 313 | 350 | 254 | |||||||
OPERATING INCOME | 8,231 | 8,446 | 7,252 | |||||||
Interest income | 249 | 333 | 236 | |||||||
Interest expense | 355 | 438 | 456 | |||||||
Equity income (loss) — net | 781 | (874 | ) | 668 | ||||||
Other income (loss) — net | 40 | 39 | 219 | |||||||
INCOME BEFORE INCOME TAXES | 8,946 | 7,506 | 7,919 | |||||||
Income taxes | 2,040 | 1,632 | 1,892 | |||||||
CONSOLIDATED NET INCOME | 6,906 | 5,874 | 6,027 | |||||||
Less: Net income attributable to noncontrolling interests | 82 | 67 | 46 | |||||||
NET INCOME ATTRIBUTABLE TO SHAREOWNERS OF THE COCA-COLA COMPANY | $ 6,824 | $ 5,807 | $ 5,981 | |||||||
BASIC NET INCOME PER SHARE1 | $ 2.95 | $ 2.51 | $ 2.59 | |||||||
DILUTED NET INCOME PER SHARE1 | $ 2.93 | $ 2.49 | $ 2.57 | |||||||
AVERAGE SHARES OUTSTANDING | 2,314 | 2,315 | 2,313 | |||||||
Effect of dilutive securities | 15 | 21 | 18 | |||||||
AVERAGE SHARES OUTSTANDING ASSUMING DILUTION | 2,329 | 2,336 | 2,331 | |||||||
1 Basic net income per share and diluted net income per share are calculated based on net income attributable to shareowners of The Coca-Cola Company. | ||||||||||
Refer to Notes to Consolidated Financial Statements.
THE COCA-COLA COMPANY AND SUBSIDIARIES
CONSOLIDATED BALANCE SHEETS
| December 31, | 2006 | 2005 | |||||||
(In millions except par value) | |||||||||
| ASSETS | |||||||||
| CURRENT ASSETS | |||||||||
| Cash and cash equivalents | $ 2,440 | $ 4,701 | |||||||
| Marketable securities | 150 | 66 | |||||||
| Trade accounts receivable, less allowances of $63 and $72, respectively | 2,587 | 2,281 | |||||||
| Inventories | 1,641 | 1,379 | |||||||
| Prepaid expenses and other assets | 1,623 | 1,778 | |||||||
| TOTAL CURRENT ASSETS | 8,441 | 10,205 | |||||||
| INVESTMENTS | |||||||||
| Equity method investments: | |||||||||
| Coca-Cola Enterprises Inc. | 1,312 | 1,731 | |||||||
| Coca-Cola Hellenic Bottling Company S.A. | 1,251 | 1,039 | |||||||
| Coca-Cola FEMSA, S.A.B. de C.V. | 835 | 982 | |||||||
| Coca-Cola Amatil Limited | 817 | 748 | |||||||
| Other, principally bottling companies | 2,095 | 2,062 | |||||||
| Cost method investments, principally bottling companies | 473 | 360 | |||||||
| TOTAL INVESTMENTS | 6,783 | 6,922 | |||||||
| OTHER ASSETS | 2,701 | 2,648 | |||||||
| PROPERTY, PLANT AND EQUIPMENT — net | 6,903 | 5,831 | |||||||
| TRADEMARKS WITH INDEFINITE LIVES | 2,045 | 1,946 | |||||||
| GOODWILL | 1,403 | 1,047 | |||||||
| OTHER INTANGIBLE ASSETS | 1,687 | 828 | |||||||
| TOTAL ASSETS | $ 29,963 | $ 29,427 | |||||||
| LIABILITIES AND SHAREOWNERS' EQUITY | |||||||||
| CURRENT LIABILITIES | |||||||||
| Accounts payable and accrued expenses | $ 5,055 | $ 4,493 | |||||||
| Loans and notes payable | 3,235 | 4,518 | |||||||
| Current maturities of long-term debt | 33 | 28 | |||||||
| Accrued income taxes | 567 | 797 | |||||||
| TOTAL CURRENT LIABILITIES | 8,890 | 9,836 | |||||||
| LONG-TERM DEBT | 1,314 | 1,154 | |||||||
| OTHER LIABILITIES | 2,231 | 1,730 | |||||||
| DEFERRED INCOME TAXES | 608 | 352 | |||||||
| SHAREOWNERS' EQUITY | |||||||||
| Common stock, $0.25 par value; Authorized — 5,600 shares; | |||||||||
| Issued — 3,511 and 3,507 shares, respectively | 878 | 877 | |||||||
| Capital surplus | 5,983 | 5,492 | |||||||
| Reinvested earnings | 33,468 | 31,299 | |||||||
| Accumulated other comprehensive income (loss) | (1,291 | ) | (1,669 | ) | |||||
| Treasury stock, at cost — 1,193 and 1,138 shares, respectively | (22,118 | ) | (19,644 | ) | |||||
| TOTAL SHAREOWNERS' EQUITY | 16,920 | 16,355 | |||||||
| TOTAL LIABILITIES AND SHAREOWNERS' EQUITY | $ 29,963 | $ 29,427 | |||||||
December 31, | 2009 | 2008 | ||||||||
(In millions except par value) | ||||||||||
ASSETS | ||||||||||
CURRENT ASSETS | ||||||||||
Cash and cash equivalents | $ 7,021 | $ 4,701 | ||||||||
Short-term investments | 2,130 | — | ||||||||
TOTAL CASH, CASH EQUIVALENTS AND SHORT-TERM INVESTMENTS | 9,151 | 4,701 | ||||||||
Marketable securities | 62 | 278 | ||||||||
Trade accounts receivable, less allowances of $55 and $51, respectively | 3,758 | 3,090 | ||||||||
Inventories | 2,354 | 2,187 | ||||||||
Prepaid expenses and other assets | 2,226 | 1,920 | ||||||||
TOTAL CURRENT ASSETS | 17,551 | 12,176 | ||||||||
EQUITY METHOD INVESTMENTS | 6,217 | 5,316 | ||||||||
OTHER INVESTMENTS, PRINCIPALLY BOTTLING COMPANIES | 538 | 463 | ||||||||
OTHER ASSETS | 1,976 | 1,733 | ||||||||
PROPERTY, PLANT AND EQUIPMENT — net | 9,561 | 8,326 | ||||||||
TRADEMARKS WITH INDEFINITE LIVES | 6,183 | 6,059 | ||||||||
GOODWILL | 4,224 | 4,029 | ||||||||
OTHER INTANGIBLE ASSETS | 2,421 | 2,417 | ||||||||
TOTAL ASSETS | $ 48,671 | $ 40,519 | ||||||||
LIABILITIES AND EQUITY | ||||||||||
CURRENT LIABILITIES | ||||||||||
Accounts payable and accrued expenses | $ 6,657 | $ 6,205 | ||||||||
Loans and notes payable | 6,749 | 6,066 | ||||||||
Current maturities of long-term debt | 51 | 465 | ||||||||
Accrued income taxes | 264 | 252 | ||||||||
TOTAL CURRENT LIABILITIES | 13,721 | 12,988 | ||||||||
LONG-TERM DEBT | 5,059 | 2,781 | ||||||||
OTHER LIABILITIES | 2,965 | 3,011 | ||||||||
DEFERRED INCOME TAXES | 1,580 | 877 | ||||||||
THE COCA-COLA COMPANY SHAREOWNERS' EQUITY | ||||||||||
Common stock, $0.25 par value; Authorized — 5,600 shares; | 880 | 880 | ||||||||
Capital surplus | 8,537 | 7,966 | ||||||||
Reinvested earnings | 41,537 | 38,513 | ||||||||
Accumulated other comprehensive income (loss) | (757 | ) | (2,674 | ) | ||||||
Treasury stock, at cost — 1,217 and 1,207 shares, respectively | (25,398 | ) | (24,213 | ) | ||||||
EQUITY ATTRIBUTABLE TO SHAREOWNERS OF THE COCA-COLA COMPANY | 24,799 | 20,472 | ||||||||
EQUITY ATTRIBUTABLE TO NONCONTROLLING INTERESTS | 547 | 390 | ||||||||
TOTAL EQUITY | 25,346 | 20,862 | ||||||||
TOTAL LIABILITIES AND EQUITY | $ 48,671 | $ 40,519 | ||||||||
Refer to Notes to Consolidated Financial Statements.
THE COCA-COLA COMPANY AND SUBSIDIARIES
CONSOLIDATED STATEMENTS OF CASH FLOWS
| Year Ended December 31, | 2006 | 2005 | 2004 | |||||
(In millions) | ||||||||
OPERATING ACTIVITIES | ||||||||
| Net income | $ 5,080 | $ 4,872 | $ 4,847 | |||||
| Depreciation and amortization | 938 | 932 | 893 | |||||
| Stock-based compensation expense | 324 | 324 | 345 | |||||
| Deferred income taxes | (35 | ) | (88 | ) | 162 | |||
| Equity income or loss, net of dividends | 124 | (446 | ) | (476 | ) | |||
| Foreign currency adjustments | 52 | 47 | (59 | ) | ||||
| Gains on issuances of stock by equity investees | — | (23 | ) | (24 | ) | |||
| Gains on sales of assets, including bottling interests | (303 | ) | (9 | ) | (20 | ) | ||
| Other operating charges | 159 | 85 | 480 | |||||
| Other items | 233 | 299 | 437 | |||||
| Net change in operating assets and liabilities | (615 | ) | 430 | (617 | ) | |||
| Net cash provided by operating activities | 5,957 | 6,423 | 5,968 | |||||
| INVESTING ACTIVITIES | ||||||||
| Acquisitions and investments, principally trademarks and bottling companies | (901 | ) | (637 | ) | (267 | ) | ||
| Purchases of other investments | (82 | ) | (53 | ) | (46 | ) | ||
| Proceeds from disposals of other investments | 640 | 33 | 161 | |||||
| Purchases of property, plant and equipment | (1,407 | ) | (899 | ) | (755 | ) | ||
| Proceeds from disposals of property, plant and equipment | 112 | 88 | 341 | |||||
| Other investing activities | (62 | ) | (28 | ) | 63 | |||
| Net cash used in investing activities | (1,700 | ) | (1,496 | ) | (503 | ) | ||
| FINANCING ACTIVITIES | ||||||||
| Issuances of debt | 617 | 178 | 3,030 | |||||
| Payments of debt | (2,021 | ) | (2,460 | ) | (1,316 | ) | ||
| Issuances of stock | 148 | 230 | 193 | |||||
| Purchases of stock for treasury | (2,416 | ) | (2,055 | ) | (1,739 | ) | ||
| Dividends | (2,911 | ) | (2,678 | ) | (2,429 | ) | ||
| Net cash used in financing activities | (6,583 | ) | (6,785 | ) | (2,261 | ) | ||
| EFFECT OF EXCHANGE RATE CHANGES ON CASH AND CASH EQUIVALENTS | 65 | (148 | ) | 141 | ||||
| CASH AND CASH EQUIVALENTS | ||||||||
| Net (decrease) increase during the year | (2,261 | ) | (2,006 | ) | 3,345 | |||
| Balance at beginning of year | 4,701 | 6,707 | 3,362 | |||||
| Balance at end of year | $ 2,440 | $ 4,701 | $ 6,707 | |||||
Year Ended December 31, | 2009 | 2008 | 2007 | |||||||
(In millions) | ||||||||||
OPERATING ACTIVITIES | ||||||||||
Consolidated net income | $ 6,906 | $ 5,874 | $ 6,027 | |||||||
Depreciation and amortization | 1,236 | 1,228 | 1,163 | |||||||
Stock-based compensation expense | 241 | 266 | 313 | |||||||
Deferred income taxes | 353 | (360 | ) | 109 | ||||||
Equity income or loss, net of dividends | (359 | ) | 1,128 | (452 | ) | |||||
Foreign currency adjustments | 61 | (42 | ) | 9 | ||||||
Gains on sales of assets, including bottling interests | (43 | ) | (130 | ) | (244 | ) | ||||
Other operating charges | 134 | 209 | 166 | |||||||
Other items | 221 | 153 | 99 | |||||||
Net change in operating assets and liabilities | (564 | ) | (755 | ) | (40 | ) | ||||
Net cash provided by operating activities | 8,186 | 7,571 | 7,150 | |||||||
INVESTING ACTIVITIES | ||||||||||
Acquisitions and investments, principally beverage and bottling companies and trademarks | (300 | ) | (759 | ) | (5,653 | ) | ||||
Purchases of other investments | (2,152 | ) | (240 | ) | (99 | ) | ||||
Proceeds from disposals of bottling companies and other investments | 240 | 479 | 448 | |||||||
Purchases of property, plant and equipment | (1,993 | ) | (1,968 | ) | (1,648 | ) | ||||
Proceeds from disposals of property, plant and equipment | 104 | 129 | 239 | |||||||
Other investing activities | (48 | ) | (4 | ) | (6 | ) | ||||
Net cash provided by (used in) investing activities | (4,149 | ) | (2,363 | ) | (6,719 | ) | ||||
FINANCING ACTIVITIES | ||||||||||
Issuances of debt | 14,689 | 4,337 | 9,979 | |||||||
Payments of debt | (12,326 | ) | (4,308 | ) | (5,638 | ) | ||||
Issuances of stock | 662 | 586 | 1,619 | |||||||
Purchases of stock for treasury | (1,518 | ) | (1,079 | ) | (1,838 | ) | ||||
Dividends | (3,800 | ) | (3,521 | ) | (3,149 | ) | ||||
Net cash provided by (used in) financing activities | (2,293 | ) | (3,985 | ) | 973 | |||||
EFFECT OF EXCHANGE RATE CHANGES ON CASH AND CASH EQUIVALENTS | 576 | (615 | ) | 249 | ||||||
CASH AND CASH EQUIVALENTS | ||||||||||
Net increase (decrease) during the year | 2,320 | 608 | 1,653 | |||||||
Balance at beginning of year | 4,701 | 4,093 | 2,440 | |||||||
Balance at end of year | $ 7,021 | $ 4,701 | $ 4,093 | |||||||
Refer to Notes to Consolidated Financial Statements.
THE COCA-COLA COMPANY AND SUBSIDIARIES
CONSOLIDATED STATEMENTS OF SHAREOWNERS' EQUITY
| Year Ended December 31, | 2006 | 2005 | 2004 | ||||||
(In millions except per share data) | |||||||||
NUMBER OF COMMON SHARES OUTSTANDING | |||||||||
| Balance at beginning of year | 2,369 | 2,409 | 2,442 | ||||||
| Stock issued to employees exercising stock options | 4 | 7 | 5 | ||||||
| Purchases of stock for treasury1 | (55 | ) | (47 | ) | (38 | ) | |||
| Balance at end of year | 2,318 | 2,369 | 2,409 | ||||||
| COMMON STOCK | |||||||||
| Balance at beginning of year | $ 877 | $ 875 | $ 874 | ||||||
| Stock issued to employees exercising stock options | 1 | 2 | 1 | ||||||
| Balance at end of year | 878 | 877 | 875 | ||||||
| CAPITAL SURPLUS | |||||||||
| Balance at beginning of year | 5,492 | 4,928 | 4,395 | ||||||
| Stock issued to employees exercising stock options | 164 | 229 | 175 | ||||||
| Tax benefit from employees' stock option and restricted stock plans | 3 | 11 | 13 | ||||||
| Stock-based compensation | 324 | 324 | 345 | ||||||
| Balance at end of year | 5,983 | 5,492 | 4,928 | ||||||
| REINVESTED EARNINGS | |||||||||
| Balance at beginning of year | 31,299 | 29,105 | 26,687 | ||||||
| Net income | 5,080 | 4,872 | 4,847 | ||||||
| Dividends (per share — $1.24, $1.12 and $1.00 in 2006, 2005 and 2004, respectively) | (2,911 | ) | (2,678 | ) | (2,429 | ) | |||
| Balance at end of year | 33,468 | 31,299 | 29,105 | ||||||
| ACCUMULATED OTHER COMPREHENSIVE INCOME (LOSS) | |||||||||
| Balance at beginning of year | (1,669 | ) | (1,348 | ) | (1,995 | ) | |||
| Net foreign currency translation adjustment | 603 | (396 | ) | 665 | |||||
| Net gain (loss) on derivatives | (26 | ) | 57 | (3 | ) | ||||
| Net change in unrealized gain on available-for-sale securities | 43 | 13 | 39 | ||||||
| Net change in pension liability, prior to adoption of SFAS No. 158 | 46 | 5 | (54 | ) | |||||
| Net other comprehensive income adjustments | 666 | (321 | ) | 647 | |||||
| Adjustment to initially apply SFAS No. 158 | (288 | ) | — | — | |||||
| Balance at end of year | (1,291 | ) | (1,669 | ) | (1,348 | ) | |||
| TREASURY STOCK | |||||||||
| Balance at beginning of year | (19,644 | ) | (17,625 | ) | (15,871 | ) | |||
| Purchases of treasury stock | (2,474 | ) | (2,019 | ) | (1,754 | ) | |||
| Balance at end of year | (22,118 | ) | (19,644 | ) | (17,625 | ) | |||
| TOTAL SHAREOWNERS' EQUITY | $ 16,920 | $ 16,355 | $ 15,935 | ||||||
| COMPREHENSIVE INCOME | |||||||||
| Net income | $ 5,080 | $ 4,872 | $ 4,847 | ||||||
| Net other comprehensive income adjustments | 666 | (321 | ) | 647 | |||||
| TOTAL COMPREHENSIVE INCOME | $ 5,746 | $ 4,551 | $ 5,494 | ||||||
Year Ended December 31, | 2009 | 2008 | 2007 | ||||||||
(In millions except per share data) | |||||||||||
EQUITY ATTRIBUTABLE TO SHAREOWNERS OF THE COCA-COLA COMPANY | |||||||||||
NUMBER OF COMMON SHARES OUTSTANDING | |||||||||||
Balance at beginning of year | 2,312 | 2,318 | 2,318 | ||||||||
Stock issued to employees exercising stock options | — | — | 8 | ||||||||
Purchases of treasury stock | (26 | ) | (18 | ) | (35 | ) | |||||
Treasury stock issued to employees exercising stock options | 17 | 12 | 23 | ||||||||
Treasury stock issued to former shareholders of glacéau | — | — | 4 | ||||||||
Balance at end of year | 2,303 | 2,312 | 2,318 | ||||||||
COMMON STOCK | |||||||||||
Balance at beginning of year | $ 880 | $ 880 | $ 878 | ||||||||
Stock issued to employees related to stock compensation plans | — | — | 2 | ||||||||
Balance at end of year | 880 | 880 | 880 | ||||||||
CAPITAL SURPLUS | |||||||||||
Balance at beginning of year | 7,966 | 7,378 | 5,983 | ||||||||
Stock issued to employees related to stock compensation plans | 339 | 324 | 1,001 | ||||||||
Tax (charge) benefit from employees' stock option and restricted stock plans | (6 | ) | (1 | ) | (28 | ) | |||||
Stock-based compensation | 238 | 265 | 309 | ||||||||
Stock purchased by former shareholders of glacéau | — | — | 113 | ||||||||
Balance at end of year | 8,537 | 7,966 | 7,378 | ||||||||
REINVESTED EARNINGS | |||||||||||
Balance at beginning of year | 38,513 | 36,235 | 33,468 | ||||||||
Cumulative effect of the adoption of new accounting guidance for pension and other postretirement plans | — | (8 | ) | — | |||||||
Cumulative effect of the adoption of new accounting guidance for uncertain tax positions | — | — | (65 | ) | |||||||
Net income attributable to shareowners of The Coca-Cola Company | 6,824 | 5,807 | 5,981 | ||||||||
Dividends (per share — $1.64, $1.52 and $1.36 in 2009, 2008 and 2007, respectively) | (3,800 | ) | (3,521 | ) | (3,149 | ) | |||||
Balance at end of year | 41,537 | 38,513 | 36,235 | ||||||||
ACCUMULATED OTHER COMPREHENSIVE INCOME (LOSS) | |||||||||||
Balance at beginning of year | (2,674 | ) | 626 | (1,291 | ) | ||||||
Net foreign currency translation adjustment | 1,824 | (2,285 | ) | 1,575 | |||||||
Net gain (loss) on derivatives | 34 | 1 | (64 | ) | |||||||
Net change in unrealized gain on available-for-sale securities | (52 | ) | (44 | ) | 14 | ||||||
Net change in pension liability | 111 | (972 | ) | 392 | |||||||
Net other comprehensive income (loss) | 1,917 | (3,300 | ) | 1,917 | |||||||
Balance at end of year | (757 | ) | (2,674 | ) | 626 | ||||||
TREASURY STOCK | |||||||||||
Balance at beginning of year | (24,213 | ) | (23,375 | ) | (22,118 | ) | |||||
Stock issued to employees related to stock compensation plans | 333 | 243 | 428 | ||||||||
Stock purchased by former shareholders of glacéau | — | — | 66 | ||||||||
Purchases of treasury stock | (1,518 | ) | (1,081 | ) | (1,751 | ) | |||||
Balance at end of year | (25,398 | ) | (24,213 | ) | (23,375 | ) | |||||
TOTAL EQUITY ATTRIBUTABLE TO SHAREOWNERS OF THE COCA-COLA COMPANY | $ 24,799 | $ 20,472 | $ 21,744 | ||||||||
EQUITY ATTRIBUTABLE TO NONCONTROLLING INTERESTS | |||||||||||
Balance at beginning of year | $ 390 | $ 342 | $ 333 | ||||||||
Net income attributable to noncontrolling interests | 82 | 67 | 46 | ||||||||
Net foreign currency translation adjustment | 49 | (25 | ) | 1 | |||||||
Dividends paid to noncontrolling interests | (14 | ) | (20 | ) | (23 | ) | |||||
Contributions by noncontrolling interests | 40 | 31 | 41 | ||||||||
Disposal of subsidiaries | — | (5 | ) | (56 | ) | ||||||
TOTAL EQUITY ATTRIBUTABLE TO NONCONTROLLING INTERESTS | $ 547 | $ 390 | $ 342 | ||||||||
COMPREHENSIVE INCOME | |||||||||||
Consolidated net income | $ 6,906 | $ 5,874 | $ 6,027 | ||||||||
Consolidated net other comprehensive income (loss) | 1,966 | (3,325 | ) | 1,918 | |||||||
CONSOLIDATED COMPREHENSIVE INCOME | $ 8,872 | $ 2,549 | $ 7,945 | ||||||||
Refer to Notes to Consolidated Financial Statements.
THE COCA-COLA COMPANY AND SUBSIDIARIES
NOTES TO CONSOLIDATED FINANCIAL STATEMENTS
NOTE 1: BUSINESS AND SUMMARY OF SIGNIFICANT ACCOUNTING POLICIES
Description of Business
The Coca-Cola Company is predominantly a manufacturer, distributor and marketer of nonalcoholic beverage concentrates and syrups. We also manufacture, distribute and market some finished beverages. In these notes, the terms "The Coca-Cola Company," "Company," "we," "us" orand "our" mean The Coca-Cola Company and all subsidiariesentities included in theour consolidated financial statements. We primarily sell
The Coca-Cola Company is the world's leading owner and marketer of nonalcoholic beverage brands and the world's largest manufacturer, distributor and marketer of concentrates and syrups as well as some finished beverages,used to bottlingproduce nonalcoholic beverages. We own or license and canning operations, distributors, fountain wholesalers and fountain retailers. Our Company owns or licensesmarket more than 400500 nonalcoholic beverage brands, including Coca-Cola, Diet Coke, Fanta and Sprite, andprimarily sparkling beverages but also a variety of diet and lightstill beverages such as waters, juiceenhanced waters, juices and juice drinks, ready-to-drink teas and coffees, and energy and sports drinks. Additionally,Finished beverage products bearing our trademarks, sold in the United States since 1886, are now sold in more than 200 countries. Along with Coca-Cola, which is recognized as the world's most valuable brand, we own and market four of the world's top five nonalcoholic sparkling beverage brands, including Diet Coke, Fanta and Sprite.
We manufacture beverage concentrates and syrups, which we sell to authorized bottling and canning operations (to which we typically refer as our "bottlers" or our "bottling partners") who use the concentrates and syrups to produce finished beverage products. We also manufacture, or authorize bottling partners to manufacture, fountain syrups, which we sell to fountain retailers such as restaurants and convenience stores, which use the fountain syrups to produce finished beverages for immediate consumption, or to fountain wholesalers or bottlers, which in turn sell and distribute the fountain syrups to fountain retailers. In addition, we manufacture certain finished beverages, such as juices and juice drinks and water products, which we sell to retailers directly or through wholesalers or other distributors, including bottling partners.
While most of our branded beverage products are manufactured, sold and distributed by independently owned and managed bottling partners, from time to time we do acquire or take control of bottling or canning operations, often, but not always, in underperforming markets where we believe we can use our resources and expertise to improve performance. In addition, we have noncontrolling ownership interests in numerous beverage joint ventures, bottling partners and canning operations. Significant marketsemerging beverage companies. The Company has had a significant increase in the number of consolidated bottling operations over the last several years, primarily due to acquisitions in 2008 and 2007. Refer to Note 17 for our products existadditional information related to the Company's acquisition and investment activity. Net operating revenues generated by consolidated bottling operations are included in all the world's geographic regions.Bottling Investments operating segment. Refer to Note 18.
Summary of Significant Accounting Policies
Basis of Presentation and Consolidation
Our consolidated financial statements are prepared in accordance with accounting principles generally accepted in the United States. Our Company consolidates all entities that we control by ownership of a majority voting interest as well as variable interest entities for which our Company is the primary beneficiary. Refer to the heading "Variable Interest Entities," below, for a discussion of variable interest entities.
We use the equity method to account for our investments for which we have the ability to exercise significant influence over operating and financial policies. Consolidated net income includes our Company's share of the net income of these companies.
We use the cost method to account for our investments in companies that we do not control and for which we do not have the ability to exercise significant influence over operating and financial policies. In accordance with the cost method, these investments are recorded at cost or fair value, as appropriate.
We eliminate from our financial results all significant intercompany transactions, including the intercompany transactions with variable interest entities and the intercompany portion of transactions with equity method investees.
Certain amounts in the prior years' consolidated financial statements and notes have been reclassified to conform to the current year presentation.
Variable Interest Entities
Financial Accounting Standards Board ("FASB") Interpretation No. 46 (revised December 2003), "Consolidation of Variable Interest Entities" ("Interpretation No. 46(R)") addresses the consolidation of business enterprises to which the usual condition (ownership of a majority voting interest) of consolidation does not apply. Interpretation No. 46(R) focuses on controlling financial interests that may be achieved through arrangements that do not involve voting interests. It concludes that in the absence of clear control through voting interests, a company's exposure (variable interest) to the economic risks and potential rewards from the variable interest entity's assets and activities is the best evidence of control. If an enterprise holds a majority of the variable interests of an entity, it would be considered the primary beneficiary. Upon consolidation, the primary beneficiary is generally required to include assets, liabilities and noncontrolling interests at fair value and subsequently account for the variable interest as if it were consolidated based on majority voting interest.
In our consolidated financial statements as of December 31, 2003, and prior to December 31, 2003, we consolidated all entities that we controlled by ownership of a majority of voting interests. As a result of Interpretation No. 46(R), effective as of April 2, 2004, our consolidated balance sheets include the assets and liabilities of the following:
Our Company holds interests in certain entities, primarily bottlers accounted for under the equity method of accounting prior to April 2, 2004 that are considered variable interest entities. These variable interests relate to profit guarantees or subordinated financial support for these entities. Upon adoption of Interpretation No. 46(R) as of April 2, 2004, we consolidated assets of approximately $383 million and liabilities of approximately $383 million that were previously not recorded on our consolidated balance sheets. We did not record a cumulative effect of an accounting change, and prior periods were not restated. The results of operations of these variable interest entities were included in our consolidated results beginning April 3, 2004, and did not have a material impact for the year ended December 31, 2004. Our Company's investment, plus any loans and guarantees, related to these variable interest entities totaled approximately $429 million and $263 million at December 31, 2006 and 2005, respectively, representing our maximum exposures to loss. Any creditors of the variable interest entities do not have recourse against the general credit of the Company as a result of including these variable interest entities in our consolidated financial statements.
Use of Estimates and Assumptions
The preparation of our consolidated financial statements requires us to make estimates and assumptions that affect the reported amounts of assets, liabilities, revenues and expenses and the disclosure of contingent assets and liabilities in our consolidated financial statements and accompanying notes. Although these estimates are based on our knowledge of current events and actions we may undertake in the future, actual results may ultimately differ from these estimates and assumptions. Furthermore, when testing assets for impairment in future periods, if management uses different assumptions or if different conditions occur, impairment charges may result.
We use the equity method to account for investments in companies, if our investment provides us with the ability to exercise significant influence over operating and financial policies of the investee. Our consolidated net income includes our Company's proportionate share of the net income or loss of these companies. Our judgment regarding the level of influence over each equity method investment includes considering key factors such as our ownership interest, representation on the board of directors, participation in policy-making decisions and material intercompany transactions.
We eliminate from our financial results all significant intercompany transactions, including the intercompany transactions with consolidated variable interest entities ("VIEs") and the intercompany portion of transactions with equity method investees.
Certain amounts in the prior years' consolidated financial statements and notes have been revised to conform to the current year presentation.
Principles of Consolidation
Our Company consolidates all entities that we control by ownership of a majority voting interest as well as VIEs of which our Company is the primary beneficiary. Generally, we consolidate only business enterprises that we control by ownership of a majority voting interest. However, there are situations in which consolidation is required even though the usual condition (ownership of a majority voting interest) of consolidation does not apply. These situations generally occur when one entity has a controlling financial interest in another business enterprise that was achieved through arrangements that do not involve voting interests, which results in a disproportionate relationship between such entity's voting interests in, and its exposure to the economic risks and potential rewards of, the other business enterprise. This disproportionate relationship results in what is known as a variable interest, and the entity in which we have the variable interest is referred to as a VIE.
In accordance with accounting principles generally accepted in the United States as of December 31, 2009, the best evidence of control of a VIE is not necessarily voting interests. The entity that holds a majority of the variable interests in a VIE is deemed to be the primary beneficiary and therefore to control the entity. Upon consolidation, the primary beneficiary is generally required to include assets, liabilities and noncontrolling interests at fair value and subsequently account for the variable interest as if it were consolidated based on a majority voting interest.
Our Company holds interests in certain entities, primarily bottling operations, that are considered VIEs. These variable interests relate to profit guarantees or subordinated financial support for these entities. Our Company's investments, plus any loans and guarantees, related to these VIEs totaled approximately $708 million and $604 million at December 31, 2009, and 2008, respectively, representing our maximum exposures to loss. Creditors of the VIEs do not have recourse against the general credit of the Company as a result of including these VIEs in our consolidated financial statements. The Company's investment, plus any loans and guarantees, related to VIEs was not significant to the Company's consolidated financial statements. In addition, assets and liabilities of VIEs for which we are the primary beneficiary were not significant to the Company's consolidated financial statements. We do not have any significant variable interests in entities for which we were not determined to be the primary beneficiary.
In June 2009, the Financial Accounting Standards Board ("FASB") amended its guidance on accounting for VIEs. The new accounting guidance resulted in a change in our accounting policy effective January 1, 2010. Among other things, the new guidance requires more qualitative than quantitative analyses to determine the primary beneficiary of a VIE, requires continuous assessments of whether an enterprise is the primary beneficiary of a VIE, enhances disclosures about an enterprise's involvement with a VIE, and amends certain guidance for determining whether an entity is a VIE. Under the new guidance, a VIE must be consolidated if the enterprise has both (a) the power to direct the activities of the VIE that most significantly impact the entity's economic performance, and (b) the obligation to absorb losses or the right to receive benefits from the VIE that could potentially be significant to the VIE.
Beginning January 1, 2010, we deconsolidated certain entities as a result of this change in accounting policy. These entities are primarily bottling operations and had previously been consolidated due to certain loan guarantees and/or other financial support given by the Company. These financial arrangements, although not significant to our consolidated financial statements, resulted in a disproportionate relationship between our voting interests in these entities and our exposure to the economic risks and potential rewards of the entities. As a result, we determined that we held a majority of the variable interests in these entities and, therefore, were deemed to be the primary beneficiary. The loan guarantees and/or other financial support given by the Company to these entities are included in the calculation of our maximum exposure to loss discussed above. Although these financial arrangements resulted in us holding a majority of the variable interests in these VIEs, the majority of these arrangements did not empower us to direct the activities of the VIEs that most significantly impact the VIEs' economic performance. Consequently, subsequent to the change in accounting policy, the Company deconsolidated the majority of these VIEs. The deconsolidation of these entities will not have a material impact on our consolidated financial statements.
Risks and Uncertainties
Factors that could adversely impact the Company's operations or financial results include, but are not limited to, the following: obesity and other health concerns; water scarcity and poor quality; changes in the nonalcoholic beverages business environment; the recent global credit crisis and continuing unfavorable credit and equity market conditions; increased competition; an inability to expand operations in developing and emerging markets; fluctuations in foreign currency exchange andrates; interest rates;rate increases; an inability to maintain good relationships with our bottling partners; a deterioration in our bottling partners' financial condition; increases in income tax rates or changes in income tax laws; increased or new indirect taxes; an inability to renew collective bargaining agreements on satisfactory terms or strikes, or work stoppages or labor unrest (including at keybottling partners' manufacturing locations); increased cost, disruption of supply or shortage of energy; increased cost, disruption of supply or shortage of rawingredients or packaging materials; changes in laws and regulations relating to our business, including those regarding beverage containers and packaging; additional labeling or warning requirements; unfavorable economic and political conditions in the United States or in other major markets; unfavorable economic and political conditions in international markets; changes in commercial and market practices within the European Economic Area; litigation or legal proceedings; adverse weather conditions; an inability to maintain our brand image and product issues such as product recalls;corporate reputation; changes in the legal and regulatory environment in variousthe countries in which we operate; changes in accounting and taxation standards including an increase in tax rates;standards; an inability to achieve our overall long-term goals; an inability to protect our information systems; future impairment charges;charges, including potential charges attributable to changes in market participant assumptions; an inability to successfully manage our Company-owned or controlled bottling operations; climate change; and global or regional catastrophic events.
Our Company monitors our operations with a view to minimizing the impact to our overall business that could arise as a result of the risks and uncertainties inherent in our business.
Revenue Recognition
Our Company recognizes revenue when persuasive evidence of an arrangement exists, delivery of products has occurred, the sales price charged is fixed or determinable, and collectibility is reasonably assured. For our Company, this generally means that we recognize revenue when title to our products is transferred to our bottling partners, resellers or other customers. In particular, title usually transfers upon shipment to or receipt at our customers' locations, as determined by the specific sales terms of the transactions. Our sales terms do not allow for a right of return except for matters related to any manufacturing defects on our part.
In addition, ourDeductions from Revenue
Our customers can earn certain incentives whichincluding, but not limited to, cash discounts, funds for promotional and marketing activities, volume-based incentive programs and support for infrastructure programs. The costs associated with these incentives are included in deductions from revenue, a component of net operating revenues in the consolidated statements of income. TheseFor customer incentives include, but are not limitedthat must be earned, management must make estimates related to cash discounts, funds for promotionalthe contractual terms, customer performance and sales volume to determine the total amounts earned and to be recorded in deductions from revenue. In making these estimates, management considers past results. The actual amounts ultimately paid may be different from our estimates.
In some situations, the Company may determine it to be advantageous to make advance payments to specific customers to fund certain marketing activities volume-based incentiveintended to generate profitable volume and/or invest in infrastructure programs with our bottlers that are directed at strengthening our bottling system and supportincreasing unit case volume. The Company also makes advance payments to certain customers for distribution rights. The advance payments made to customers are initially capitalized and included in our consolidated balance sheets in prepaid expenses and other assets and noncurrent other assets, depending on the duration of the agreements. The assets are amortized over the applicable periods and included in deductions from revenue. The duration of these agreements typically ranges from 5 to 10 years.
Amortization expense for infrastructure programs (referwas approximately $150 million, $162 million and $151 million for the years ended December 31, 2009, 2008 and 2007, respectively. Refer to the heading "Other Assets").Note 3. The aggregate deductions from revenue recorded by the Company in relation to these programs, including amortization expense on infrastructure initiatives, wasprograms, were approximately $3.8$4.5 billion, $3.7$4.4 billion and $3.6$4.1 billion for the years ended December 31, 2006, 20052009, 2008 and 2004,2007, respectively.
Advertising Costs
Our Company expenses production costs of print, radio, television and other advertisements as of the first date the advertisements take place. Advertising costs included in selling, general and administrative expenses were approximately $2.6$2.8 billion, $2.5$3.0 billion and $2.2$2.8 billion for the years ended December 31, 2006, 20052009, 2008 and 2004,2007, respectively. As of December 31, 20062009 and 2005,2008, advertising and production costs of approximately $214$288 million and $170$195 million, respectively, were primarily recorded in prepaid expenses and other assets and in noncurrent other assets in our consolidated balance sheets.
Stock-Based Compensation
Our Company currently sponsors stock option plans and restricted stock award plans. Refer to Note 15. Prior to January 1, 2006, the Company accounted for these plans under the fair value recognition and measurement provisions of Statement of Financial Accounting Standards ("SFAS") No. 123, "Accounting for Stock-Based Compensation." Effective January 1, 2006, the Company adopted SFAS No. 123 (revised 2004), "Share Based Payment" ("SFAS No. 123(R)"). Our Company adopted SFAS No. 123(R) using the modified prospective method. Based on the terms of our plans, our Company did not have a cumulative effect related to our plans. The adoption of SFAS No. 123(R) did not have a material impact on our stock-based compensation expense for the year ended December 31, 2006. Further, we believe the adoption of SFAS No. 123(R) will not have a material impact on our Company's future stock-based compensation expense. The fair values of the stock awards are determined using an estimated expected life. The Company recognizes compensation expense on a straight-line basis over the period the award is earned by the employee.
Our equity method investees also adopted SFAS No. 123(R) effective January 1, 2006. Our proportionate share of the stock-based compensation expense resulting from the adoption of SFAS No. 123(R) by our equity method investees is recognized as a reduction of equity income. The adoption of SFAS No. 123(R) by our equity method investees did not have a material impact on our consolidated financial statements.
Issuances of Stock by Equity Method Investees
When one of our equity method investees issues additional shares to third parties, our percentage ownership interest in the investee decreases. In the event the issuance price per share is higher or lower than our average carrying amount per share, we recognize a noncash gain or loss on the issuance. This noncash gain or loss, net of any deferred taxes, is generally recognized in our net income in the period the change in ownership interest occurs.
If gains or losses have been previously recognized on issuances of an equity method investee's stock and shares of the equity method investee are subsequently repurchased by the equity method investee, gain or loss recognition does not occur on issuances subsequent to the date of a repurchase until shares have been issued in an amount equivalent to the number of repurchased shares. This type of transaction is reflected as an equity transaction, and the net effect is reflected in our consolidated balance sheets. Refer to Note 4.
Income Taxes
Income tax expense includes United States, state, local and international income taxes, plus a provision for U.S. taxes on undistributed earnings of foreign subsidiaries not deemed to be indefinitely reinvested. Deferred tax assets and liabilities are recognized for the tax consequences of temporary differences between the financial reporting and the tax basis of existing assets and liabilities. The tax rate used to determine the deferred tax assets and liabilities is the enacted tax rate for the year in which the differences are expected to reverse. Valuation allowances are recorded to reduce deferred tax assets to the amount that will more likely than not be realized. Refer to Note 17.
Net Income Per Share
Basic net income per share is computed by dividing net income by the weighted averageweighted-average number of common shares outstanding during the reporting period. Diluted net income per share is computed similarly to basic net income per share, except that it includes the potential dilution that could occur if dilutive securities were exercised. Approximately 175103 million, 18059 million and 15171 million stock option awards were excluded from the computations of diluted net income per share in 2006, 20052009, 2008 and 2004,2007, respectively, because the awards would have been antidilutive for the periods presented.
Cash Equivalents
We classify marketable securitiestime deposits and other investments that are highly liquid and have maturities of three months or less at the date of purchase as cash equivalents. We manage our exposure to counterparty credit risk through specific minimum credit standards, diversification of counterparties and procedures to monitor our credit risk concentrations.
Short-Term Investments
We classify investments in time deposits that have maturities of greater than three months, but less than one year as short-term investments.
Investments in Equity and Debt Securities
We use the equity method to account for our investments in equity securities, if our investment gives us the ability to exercise significant influence over operating and financial policies of the investee. We include our proportionate share of earnings and/or losses of our equity method investees in equity income (loss) — net in the consolidated statements of income. The carrying value of our equity investments is reported in equity method investments in our consolidated balance sheets. Refer to Note 3.
We account for investments in companies that we do not control or account for under the equity method either at fair value or under the cost method, as applicable. Investments in equity securities are carried at fair value if the fair value of the security is readily determinable. Equity investments carried at fair value are classified as either trading or available-for-sale securities with their cost basis determined by the specific identification method. Realized and unrealized gains and losses on trading securities and realized gains and losses on available-for-sale securities are included in other income (loss) — net in the consolidated statements of income. Unrealized gains and losses, net of deferred taxes, on available-for-sale securities are included in our consolidated balance sheets as a component of accumulated other comprehensive income (loss) ("AOCI"). Trading securities are reported as marketable securities in our consolidated balance sheets. Securities classified as available-for-sale are reported as either marketable securities or other investments in our consolidated balance sheets, depending on the length of time we intend to hold the investment. Refer to Note 2.
Investments in equity securities that we do not control or account for under the equity method and do not have readily determinable fair values are accounted for under the cost method. Cost method investments are originally recorded at cost, and we record dividend income when applicable dividends are declared. Cost method investments are reported as other investments in our consolidated balance sheets, and dividend income from cost method investments is reported in other income (loss) — net.
Our investments in debt securities are carried at either amortized cost or fair value. Investments in debt securities that the Company has the positive intent and ability to hold to maturity are carried at amortized cost and classified as held-to-maturity. Investments in debt securities that are not classified as held-to-maturity are carried at fair value and classified as either trading or available-for-sale.
Each reporting period, we review all of our investments in equity and debt securities, except for those classified as trading, to determine whether a significant event or change in circumstances has occurred that may have an adverse effect on the fair value of each investment. When such events or changes occur, we evaluate the fair value compared to our cost basis in the investment. We also perform this evaluation every reporting period for each investment for which our cost basis exceeded the fair value in the prior period. The fair values of most of our investments in publicly traded companies are often readily available based on quoted market prices. For investments in nonpublicly traded companies, management's assessment of fair value is based on valuation methodologies including discounted cash flows, estimates of sales proceeds and appraisals, as appropriate. We consider the assumptions that we believe hypothetical marketplace participants would use in evaluating estimated future cash flows when employing the discounted cash flow or estimates of sales proceeds valuation methodologies.
In the event the fair value of an investment declines below our cost basis, management determines if the decline in fair value is other than temporary. If management determines the decline is other than temporary, an impairment charge is recorded. Management's assessment as to the nature of a decline in fair value is based on, among other things, the length of time and the extent to which the market value has been less than our cost basis, the financial condition and near-term prospects of the issuer, and our intent and ability to retain the investment for a period of time sufficient to allow for any anticipated recovery in market value.
Trade Accounts Receivable
We record trade accounts receivable at net realizable value. This value includes an appropriate allowance for estimated uncollectible accounts to reflect any loss anticipated on the trade accounts receivable balances and charged to the provision for doubtful accounts. We calculate this allowance based on our history of write-offs, the level of past-due accounts based on the contractual terms of the receivables, and our relationships with, and the economic status of, our bottling partners and customers. We believe our exposure to concentrations of credit risk is limited due to the diverse geographic areas covered by our operations.
Activity in the allowance for doubtful accounts was as follows (in millions):
| Year Ended December 31, | 2006 | 2005 | 2004 | ||||
| Balance, beginning of year | $ 72 | $ 69 | $ 61 | ||||
| Net charges to costs and expenses | 2 | 17 | 28 | ||||
| Write-offs | (12 | ) | (12 | ) | (19 | ) | |
| Other1 | 1 | (2 | ) | (1 | ) | ||
| Balance, end of year | $ 63 | $ 72 | $ 69 | ||||
Year Ended December 31, | 2009 | 2008 | 2007 | |||||||
Balance, beginning of year | $ 51 | $ 56 | $ 63 | |||||||
Net charges to costs and expenses | 24 | 17 | 17 | |||||||
Write-offs | (22 | ) | (28 | ) | (32 | ) | ||||
Other1 | 2 | 6 | 8 | |||||||
Balance, end of year | $ 55 | $ 51 | $ 56 | |||||||
1 Other includes acquisitions, divestitures and currency translation. | ||||||||||
A significant portion of our net operating revenues and corresponding accounts receivable is derived from sales of our products in international markets. Refer to Note 20.18. We also generate a significant portion of our net operating revenues by selling concentrates and syrups to bottlers in which we have a noncontrolling interest, including Coca-Cola Enterprises Inc. ("CCE"), Coca-Cola Hellenic Bottling Company S.A. ("Coca-Cola HBC"Hellenic"), Coca-Cola FEMSA, S.A.B. de C.V. ("Coca-Cola FEMSA") and Coca-Cola Amatil Limited ("Coca-Cola Amatil"). Refer to Note 3.
Inventories
Inventories consist primarily of raw materials and packaging (which includes ingredients and supplies) and finished goods (which includesinclude concentrates and syrups in our concentrate and foodservice operations, and finished beverages in our bottling and canning operations). Inventories are valued at the lower of cost or market. We determine cost on the basis of the average cost or first-in, first-out methods. Refer to Note 2.
Recoverability of Equity Method and Cost Method Investments
Management periodically assesses the recoverability of our Company's equity method and cost method investments. For publicly traded investments, readily available quoted market prices are an indicationInventories consisted of the following (in millions):
December 31, | 2009 | 2008 | ||
Raw materials and packaging | $ 1,366 | $ 1,191 | ||
Finished goods | 697 | 706 | ||
Other | 291 | 290 | ||
Total inventories | $ 2,354 | $ 2,187 | ||
Our Company, when deemed appropriate, uses derivatives as a risk management tool to mitigate the potential impact of certain market risks. The primary market risks managed by the Company through the use of derivative instruments are foreign currency exchange rate risk, commodity price risk and interest rate risk. All derivatives are carried at fair value of our Company's investments. For nonpublicly traded investments, if an identified event or change in circumstances requires an impairment evaluation, management assesses fair value based on valuation methodologies, including discounted cash flows, estimates of sales proceeds and external appraisals, as appropriate. We consider the assumptions that we believe hypothetical marketplace participants would useconsolidated balance sheets in evaluating estimated future cash flows when employing the discounted cash flows and estimates of sales proceeds valuation methodologies. If an investment is considered to be impaired and the decline in value is other than temporary, we record a write-down.
Other Assets
Our Company advances payments to certain customers for marketing to fund future activities intended to generate profitable volume, and we expense such payments over the applicable period. Advance payments are also made to certain customers for distribution rights. Additionally, our Company invests in infrastructure programs with our bottlers that are directed at strengthening our bottling system and increasing unit case volume. When facts and circumstances indicate that the carrying value of the assets may not be recoverable, management evaluates the recoverability of these assets by preparing estimates of sales volume, the resulting gross profit and cash flows. Costs of these programs are recorded inline items prepaid expenses and other assets and
noncurrent other assetsor accounts payable and are being amortized over the remaining periods to be directly benefited, which range from 1 to 12 years. Amortization expense for infrastructure programs was approximately $136 million, $134 million and $136 million for the years ended December 31, 2006, 2005 and 2004, respectively.accrued expenses, as applicable. Refer to heading "Revenue Recognition," above, and Note 3.4.
Property, Plant and Equipment
Property, plant and equipment are stated at cost. Repair and maintenance costs that do not improve service potential or extend economic life are expensed as incurred. Depreciation is recorded principally by the straight-line method over the estimated useful lives of our assets, which generally have the following ranges: buildings and improvements: 40 years or less; machinery and equipment: 15 years or less; and containers: 10 years or less. Land is not depreciated, and construction in progress is not depreciated until ready for service and capitalized.service. Leasehold improvements are amortized using the straight-line method over the shorter of the remaining lease term, including renewals that are deemed to be reasonably assured, or the estimated useful life of the improvement. Depreciation expense, including the depreciation expense of assets under capital lease, totaled approximately $763$1,005 million, $752$993 million and $715$958 million for the years ended December 31, 2006, 20052009, 2008 and 2004,2007, respectively. Amortization expense for leasehold improvements totaled approximately $21$18 million, $17$19 million and $7$21 million for the years ended December 31, 2006, 20052009, 2008 and 2004,2007, respectively. Refer to Note 5.
Management assessesThe following table summarizes our property, plant and equipment (in millions):
December 31, | 2009 | 2008 | ||
Land | $ 699 | $ 657 | ||
Buildings and improvements | 3,816 | 3,408 | ||
Machinery and equipment | 10,355 | 8,936 | ||
Containers | 835 | 698 | ||
Construction in progress | 762 | 701 | ||
| 16,467 | 14,400 | |||
Less accumulated depreciation | 6,906 | 6,074 | ||
Property, plant and equipment — net | $ 9,561 | $ 8,326 | ||
Certain events or changes in circumstances may indicate that the recoverability of the carrying amount of property, plant and equipment if certain events or changes in circumstances indicate that the carrying value of such assets may notshould be recoverable, such asassessed, including, among others, a significant decrease in market value, of the assets or a significant change in the business conditionsclimate in a particular market. Ifmarket, or a current period operating or cash flow loss combined with historical losses or projected future losses. When such events or changes in circumstances are present, we determine thatestimate the carrying value of an asset is not recoverable based on expected undiscounted future cash flows excludingexpected to result from the use of the asset (or asset group) and its eventual disposition. These estimated future cash flows are consistent with those we use in our internal planning. If the sum of the expected future cash flows (undiscounted and without interest charges, we record an impairment loss equal to the excess ofcharges) is less than the carrying amount, ofwe recognize an impairment loss. The impairment loss recognized is the asset over itsamount by which the carrying amount exceeds the fair value. We use a variety of methodologies to determine the fair value of property, plant and equipment, including appraisals and discounted cash flow models, which are consistent with the assumptions we believe hypothetical marketplace participants would use.
Goodwill, Trademarks and Other Intangible Assets
In accordance with SFAS No. 142, "Goodwill and Other Intangible Assets," weWe classify intangible assets into three categories: (1) intangible assets with definite lives subject to amortization, (2) intangible assets with indefinite lives not subject to amortization and (3) goodwill. We test intangible assets with definite lives for impairment if conditions exist that indicate the carrying value may not be recoverable. Such conditions may include an economic downturn in a geographic market or a change in the assessment of future operations. We record an impairment charge when the carrying value of the definite lived intangible asset is not recoverable by the cash flows generated from the use of the asset.
Intangible assets with indefinite lives and goodwill are not amortized. We test these intangible assets and goodwill for impairment at least annually or more frequently if events or circumstances indicate that such intangible assets or goodwill might be impaired. Such tests for impairment are also required for intangible assets with indefinite lives and/or goodwill recorded by our equity method investees. All goodwill is assigned to reporting units, which are one level below our operating segments. Goodwill is assigned to the reporting unit that benefits from the synergies arising from each business combination. We perform our impairment tests of goodwill at our reporting unit level. Such impairment tests for goodwill include comparing the fair value of the respective reporting unit with its carrying value, including goodwill. We use a variety of methodologies in conducting these impairment tests, including discounted cash flow analyses with a number of scenarios, where applicable, that are weighted based on the probability of different outcomes. When appropriate, we consider the
assumptions that we believe hypothetical marketplace participants would use in estimating future cash flows. In addition, where applicable, an appropriate discount rate is used, based on the Company's cost of capital rate or location-specific economic factors. When the fair value is less than the carrying value of the intangible assets or the reporting unit, we record an impairment charge to reduce the carrying value of the assets to fair value. These impairment charges are generally recorded in the line item other operating charges or, to the extent they relate to equity method investees, as a reduction of equity income—net, in the consolidated statements of income.
Our Company determinesdetermine the useful lives of our identifiable intangible assets after considering the specific facts and circumstances related to each intangible asset. Factors we consider when determining useful lives include the contractual term of any agreement related to the historyasset, the historical performance of the asset, the Company's long-term strategy for the use ofusing the asset, any laws or other local regulations which could impact the useful life of the asset, and other economic factors, including competition and specific market conditions. Intangible assets that are deemed to have definite lives are amortized, generallyprimarily on a straight-line basis, over their useful lives, generally ranging from 1 to 45 years. Intangible assets with definite lives have estimated remaining useful lives ranging from 1 to 3520 years. Refer to Note 6.5.
When facts and circumstances indicate that the carrying value of definite-lived intangible assets may not be recoverable, management assesses the recoverability of the carrying value by preparing estimates of sales volume and the resulting gross profit and cash flows. These estimated future cash flows are consistent with those we use in our internal planning. If the sum of the expected future cash flows (undiscounted and without interest charges) is less than the carrying amount, we recognize an impairment loss. The impairment loss recognized is the amount by which the carrying amount exceeds the fair value. We use a variety of methodologies to determine the fair value of these assets, including discounted cash flow models, which are consistent with the assumptions we believe hypothetical marketplace participants would use.
Derivative Financial Instruments
We test intangible assets determined to have indefinite useful lives, including trademarks, franchise rights and goodwill, for impairment annually, or more frequently if events or circumstances indicate that assets might be impaired. Our Company accounts for derivative financial instruments in accordance with SFAS No. 133, "Accounting for Derivative Instruments and Hedging Activities,"performs these annual impairment reviews as amended by SFAS No. 137, "Accounting for Derivative Instruments and Hedging Activities—Deferral of the Effective Datefirst day of FASB Statement No. 133—an amendmentour third fiscal quarter. We use a variety of FASB Statement No. 133," SFAS No. 138, "Accounting for Certain Derivative Instruments and Certain Hedging Activities—an amendmentmethodologies in conducting impairment assessments of FASB Statement No. 133," and SFAS No. 149, "Amendment of Statement 133indefinite-lived intangible assets, including, but not limited to, discounted cash flow models, which are based on Derivative Instruments and Hedging Activities." We recognize all derivative instruments as eitherthe assumptions we believe hypothetical marketplace participants would use. For indefinite-lived intangible assets, or liabilities atother than goodwill, if the carrying amount exceeds the fair value, an impairment charge is recognized in an amount equal to that excess.
We perform impairment tests of goodwill at our consolidated balance sheets, with fair values of foreign currency derivatives estimatedreporting unit level, which is one level below our operating segments. Our operating segments are primarily based on quoted market pricesgeographic responsibility, which is consistent with the way management runs our business. Our operating segments are subdivided into smaller geographic regions or pricingterritories that we sometimes refer to as business units. These business units are also our reporting units. The Bottling Investments operating segment includes all Company-owned or consolidated bottling operations, regardless of geographic location. Generally, each Company-owned or consolidated bottling operation within our Bottling Investments operating segment is its own reporting unit. Goodwill is assigned to the reporting unit or units that benefit from the synergies arising from each business combination. We have had no changes to our reporting units in 2009.
The goodwill impairment test consists of a two-step process, if necessary. The first step is to compare the fair value of a reporting unit to its carrying value, including goodwill. We typically use discounted cash flow models using current market rates. Refer to Note 12.determine the fair value of a reporting unit. The assumptions used in these models are consistent with those we believe hypothetical marketplace participants would use. If the fair value of the reporting unit is less than its carrying value, the second step of the impairment test must be performed in order to determine the amount of impairment loss, if any. The second step compares the implied fair value of the reporting unit goodwill with the carrying amount of that goodwill. If the carrying amount of the reporting unit's goodwill exceeds its implied fair value, an impairment charge is recognized in an amount equal to that excess. The loss recognized cannot exceed the carrying amount of goodwill.
Retirement-Related Benefits
Using appropriate actuarial methods and assumptions, our Company accounts for defined benefit pension plans in accordance with SFAS No. 87, "Employers' Accounting for Pensions," and we account for our nonpension postretirement benefits in accordance with SFAS No. 106, "Employers' Accounting for Postretirement Benefits Other Than Pensions," as amended by SFAS No. 158, "Employers' Accounting for Defined Benefit Pension and Other Postretirement Plans—an amendment of FASB Statements No. 87, 88, 106, and 132(R)." Effective December 31, 2006 for our Company, SFAS No. 158 requires that previously unrecognized actuarial gains or losses, prior service costs or credits and transition obligations orImpairment charges related to intangible assets be recognizedare generally through adjustments to accumulated other comprehensive income and credits to prepaid benefit cost or accrued benefit liability. As a result of these adjustments, the current funded status of defined benefit pension plans and other postretirement benefit plans is reflectedrecorded in the Company's consolidated balance sheet as of December 31, 2006. Referline item other operating charges or, to Note 16.
Ourthe extent they relate to equity method investees, also adopted SFAS No. 158 effective December 31, 2006. Refer to Note 3 forin the impact on ourline item equity income (loss) — net in the consolidated balance sheet resulting from the adoptionstatements of SFAS No. 158 by our equity method investees.income.
Contingencies
Our Company is involved in various legal proceedings and tax matters. Due to their nature, such legal proceedings and tax matters involve inherent uncertainties including, but not limited to, court rulings, negotiations between affected parties and governmental actions. Management assesses the probability of loss for such contingencies and accrues a liability and/or discloses the relevant circumstances, as appropriate. Refer to Note 13.8.
Business CombinationsStock-Based Compensation
Our Company currently sponsors stock option plans and restricted stock award plans. The fair values of the stock awards are determined using an estimated expected life. The Company recognizes compensation expense on a straight-line basis over the period the award is earned by the employee. Refer to Note 9.
Pension and Other Postretirement Benefit Plans
Our Company sponsors and/or contributes to pension and postretirement health care and life insurance benefit plans covering substantially all U.S. employees. We also sponsor nonqualified, unfunded defined benefit pension plans for certain associates. In addition, our Company and its subsidiaries have various pension plans and other forms of postretirement arrangements outside the United States. Refer to Note 10.
Income Taxes
Income tax expense includes United States, state, local and international income taxes, plus a provision for U.S. taxes on undistributed earnings of foreign subsidiaries not deemed to be indefinitely reinvested. Deferred tax assets and liabilities are recognized for the tax consequences of temporary differences between the financial reporting basis and the tax basis of existing assets and liabilities. The tax rate used to determine the deferred tax assets and liabilities is the enacted tax rate for the year and manner in which the differences are expected to reverse. Valuation allowances are recorded to reduce deferred tax assets to the amount that will more likely than not be realized.
In July 2006, the FASB issued accounting guidance that clarified the accounting for uncertainty in income taxes recognized in an enterprise's financial statements. This guidance prescribes a recognition threshold and measurement attribute for the financial statement recognition and measurement of a tax position taken or expected to be taken in a tax return. It also provides guidance on derecognition, classification, interest and penalties, accounting in interim periods, disclosure and transition. Our Company adopted the provisions of this accounting guidance and changed our accounting policy effective January 1, 2007. As a result, we recorded an approximate $65 million increase in accrued income taxes in our consolidated balance sheet for unrecognized tax benefits, which was accounted for as a cumulative effect adjustment to the January 1, 2007, balance of reinvested earnings. Refer to Note 11.
Translation and Remeasurement
We translate the assets and liabilities of our foreign subsidiaries from their respective functional currencies to U.S. dollars at the appropriate spot rates as of the balance sheet date. Generally, our foreign subsidiaries use the local currency as their functional currency. Changes in the carrying value of these assets and liabilities attributable to fluctuations in spot rates are recognized in foreign currency translation adjustment, a component of AOCI. Refer to Note 12. Income statement accounts are translated using the monthly average exchange rates during the year.
Monetary assets and liabilities denominated in a currency that is different from a reporting entity's functional currency must first be remeasured from the applicable currency to the legal entity's functional currency. The effect of this remeasurement process is recognized in the line item other income (loss) — net in our consolidated statements of income and is partially offset by the impact of our economic hedging program for certain exposures on our consolidated balance sheets. Refer to Note 4.
The government in Venezuela has enacted certain monetary policies that restrict the ability of companies to pay dividends from retained earnings. As of December 31, 2009, cash held by our Venezuelan subsidiary accounted for approximately 2 percent of our consolidated cash and cash equivalents balance. We translated the financial statements of our Venezuelan subsidiary at the official exchange rate that was in effect as of December 31, 2009; however, subsequent to December 31, 2009, the Venezuelan government announced a currency devaluation, and Venezuela was determined to be a hyperinflationary economy. In accordance with SFAS No. 141, "Business Combinations,accounting principles generally accepted in the United States, companies are not permitted to adjust their financial statements for foreign currency exchange rate changes that occur after the balance sheet date.
Since Venezuela is a hyperinflationary economy, our local subsidiary will be required to use the U.S. dollar as its functional currency. As a result, in 2010 we will be required to remeasure the financial statements of our local subsidiary into U.S. dollars and recognize the related gains or losses from remeasurement in the line item other income (loss) — net in our consolidated statements of income. Based on the carrying value of our assets and liabilities denominated in Venezuelan bolivar as of December 31, 2009, we anticipate recognizing an initial remeasurement loss of approximately $100 million in the first quarter of 2010.
Recently Issued Accounting Guidance
As previously discussed, in June 2009, the FASB amended its guidance on accounting for VIEs. Please refer to the heading "Principles of Consolidation," we accountabove.
In December 2007, the FASB amended its guidance on accounting for business combinations. The new accounting guidance resulted in a change in our accounting policy effective January 1, 2009, and is being applied prospectively to all business combinations bysubsequent to the purchase method. Furthermore, we recognize intangibleeffective date. Among other things, the new guidance amends the principles and requirements for how an acquirer recognizes and measures in its financial statements the identifiable assets apartacquired, the liabilities assumed, any noncontrolling interest in the acquiree and the goodwill acquired. It also establishes new disclosure requirements to enable the evaluation of the nature and financial effects of the business combination. The adoption of this new accounting policy did not have a significant impact on our consolidated financial statements, and the impact it will have on our consolidated financial statements in future periods will depend on the nature and size of business combinations completed subsequent to the date of adoption.
In December 2007, the FASB issued new accounting and disclosure guidance related to noncontrolling interests in subsidiaries (previously referred to as "minority interests"), which resulted in a change in our accounting policy effective January 1, 2009. Among other things, the new guidance requires that a noncontrolling interest in a subsidiary be accounted for as a component of equity separate from goodwill if they arise from contractual or legal rights or if they are separable from goodwill.the parent's equity, rather than as a liability. The new guidance is being applied prospectively, except for the presentation and disclosure requirements, which have been applied retrospectively. The adoption of this new accounting policy did not have a significant impact on our consolidated financial statements.
Recent Accounting StandardsIn December 2007, the FASB issued new accounting guidance that defines collaborative arrangements and Pronouncementsestablishes reporting requirements for transactions between participants in a collaborative arrangement and between participants in the arrangement and third parties. It also establishes the appropriate income statement presentation and classification for joint operating activities and payments between participants, as well as the sufficiency of the disclosures related to those arrangements. This new accounting guidance was effective for our Company on January 1, 2009, and its adoption did not have a significant impact on our consolidated financial statements.
In February 2007, the FASB issued SFAS No. 159, "The Fair Value Option for Financial Assets and Financial Liabilities—Including an amendment of FASB Statement No. 115." SFAS No. 159new accounting guidance that permits entities to choose to measure many financial instruments and certain other items at fair value. Unrealized gains and losses on items for which the fair value option has been elected will be recognized in earnings at each subsequent reporting date. SFAS No. 159 isThis new accounting guidance was effective for our Company on January 1, 2008. The Company is evaluatingdid not elect the impact that thefair value option for any financial instruments or other items permitted under this guidance; therefore, its adoption of SFAS No. 159 will havehad no impact on our consolidated financial statements.
In September 2006, the Securities and Exchange Commission staff published Staff Accounting Bulletin ("SAB") No. 108,"Considering the Effects of Prior Year Misstatements when Quantifying Misstatements in Current Year Financial Statements." SAB No. 108 addresses quantifying the financial statement effects of misstatements, specifically, how the effects of prior year uncorrected errors must be considered in quantifying misstatements in the current year financial statements. SAB No. 108 is effective for fiscal years ending after November 15, 2006. The adoption of SAB No. 108 by our Company in the fourth quarter of 2006 did not have a material impact on our consolidated financial statements.
As previously discussed, our Company adopted SFAS No. 158 related to defined benefit pension and other postretirement plans. Refer to Note 16.
In September 2006, the FASB issued SFAS No. 157, "Fair Value Measurements." SFAS No. 157new accounting guidance that defines fair value, establishes a framework for measuring fair value, and expands disclosure requirements about fair value measurements. SFAS No. 157 is effective for our Company January 1, 2008. We believe that the adoption of SFAS No. 157 will not have a material impact on our consolidated financial statements.
In July 2006,However, in February 2008, the FASB issued FASB Interpretation No. 48, "Accounting for Uncertainty in Income Taxes" ("Interpretation No. 48"). Interpretation No. 48 clarifiesdelayed the accounting for uncertainty in income taxes recognized in an enterprise's financial statements in accordance with SFAS No. 109, "Accounting for Income Taxes." Interpretation No. 48 prescribes a recognition threshold and measurement attribute for the financial statement recognition and measurementeffective date of a tax position taken or expected to be taken in a tax return. Interpretation No. 48 also provides guidance on derecognition, classification, interest and penalties, accounting in interim periods, disclosure and transition. For our Company, Interpretation No. 48 was effective beginning January 1, 2007, and the cumulative effect adjustment will be recorded in the first quarter of 2007. We believe that the adoption of Interpretation No. 48 will not have a material impact on our consolidated financial statements.
In May 2005, the FASB issued SFAS No. 154, "Accounting Changes and Error Corrections, a replacement of Accounting Principles Board ("APB") Opinion No. 20 and FASB Statement No. 3." SFAS No. 154 requires
retrospective application to prior periods' financial statements of a voluntary change in accounting principle unless it is impracticable. APB Opinion No. 20, "Accounting Changes," previously required that most voluntary changes in accounting principle be recognized by including in net income of the period of the change the cumulative effect of changing to the new accounting principle. SFAS No. 154 becameguidance for all nonfinancial assets and nonfinancial liabilities, except those that are recognized or disclosed at fair value in the financial statements on a recurring basis (at least annually), until January 1, 2009. The accounting guidance related to recurring fair value measurements was effective for our Company on January 1, 2006.2008. The adoption of SFAS No. 154this accounting guidance did not have a material impact on our consolidated financial statements.
In December 2004, the FASB issued SFAS No. 153, "Exchanges of Nonmonetary Assets, an amendment of APB Opinion No. 29." SFAS No. 153 is based on the principle that exchanges of nonmonetary assets should be measured based on the fair value of the assets exchanged. APB Opinion No. 29, "Accounting for Nonmonetary Transactions," provided an exception to its basic measurement principle (fair value) for exchanges of similar productive assets. Under APB Opinion No. 29, an exchange of a productive asset for a similar productive asset was based on the recorded amount of the asset relinquished. SFAS No. 153 eliminates this exception and replaces it with an exception for exchanges of nonmonetary assets that do not have commercial substance. SFAS No. 153 became effective for our Company as of July 2, 2005, and did not have a material impact on our consolidated financial statements.
As previously discussed, our Company adopted SFAS No. 123(R) related to share based payments. Refer to Note 15.
During 2004, the FASB issued FASB Staff Position 106-2, "Accounting and Disclosure Requirements Related to the Medicare Prescription Drug, Improvement and Modernization Act of 2003" ("FSP 106-2"). FSP 106-2 relates to the Medicare Prescription Drug, Improvement and Modernization Act of 2003 (the "Act"). The Act introduced a prescription drug benefit under Medicare known as Medicare Part D. The Act also established a federal subsidy to sponsors of retiree health care plans that provide a benefit that is at least actuarially equivalent to Medicare Part D. During the second quarter of 2004, our Company adopted the provisions of FSP 106-2 retroactive to January 1, 2004. The adoption of FSP 106-2 did not have a materialsignificant impact on our consolidated financial statements. Refer to Note 16.
In November 2004, the FASB issued SFAS No. 151, "Inventory Costs, an amendment of Accounting Research Bulletin No. 43, Chapter 4." SFAS No. 151 requires that abnormal amounts of idle facility expense, freight, handling costs and wasted materials (spoilage) be recorded as current period charges and that the allocation of fixed production overheads to inventory be based on the normal capacity of the production facilities. The Company adopted SFAS No. 151 on January 1, 2006. The adoption of SFAS No. 151 did not have a material impact on our consolidated financial statements.
In October 2004, the American Jobs Creation Act of 2004 (the "Jobs Creation Act") was signed into law. The Jobs Creation Act includes a temporary incentive for U.S. multinationals to repatriate foreign earnings at an approximate 5.25 percent effective tax rate. Issued in December 2004, FASB Staff Position 109-2, "Accounting and Disclosure Guidance for the Foreign Earnings Repatriation Provision within the American Jobs Creation Act of 2004" ("FSP 109-2"), indicated that the lack of clarification of certain provisions within the Jobs Creation Act and the timing of the enactment necessitated a practical exception to the SFAS No. 109, "Accounting for Income Taxes," requirement to reflect in the period of enactment the effect of a new tax law. Accordingly, enterprises were allowed time beyond 2004 to evaluate the effect of the Jobs Creation Act on their plans for reinvestment or repatriation of foreign earnings for purposes of applying SFAS No. 109. Accordingly, in 2005, the Company repatriated $6.1 billion of its previously unremitted earnings and recorded an associated tax expense of approximately $315 million. Refer to Note 17.
In 2004, our Company recorded an income tax benefit of approximately $50 million as a result of the realization of certain tax credits related to certain provisions of the Jobs Creation Act not related to repatriation provisions. Refer to Note 17.13.
NOTE 2: INVENTORIESINVESTMENTS
InventoriesTrading Securities
As of December 31, 2009 and 2008, our trading securities had a fair value of approximately $61 million and $49 million, respectively, and were included in the line item marketable securities in our consolidated balance sheets. The Company had net unrealized losses on trading securities of approximately $16 million, $32 million and $1 million as of December 31, 2009, 2008 and 2007, respectively.
Available-for-Sale and Held-to-Maturity Securities
As of December 31, 2009 and 2008, available-for-sale and held-to-maturity securities consisted of the following (in millions):
| December 31, | 2006 | 2005 | ||
| Raw materials and packaging | $ 923 | $ 704 | ||
| Finished goods | 548 | 512 | ||
| Other | 170 | 163 | ||
| Inventories | $ 1,641 | $ 1,379 | ||
| Gross Unrealized | Estimated | ||||||||||||
| Cost | Gains | Losses | Fair Value | ||||||||||
2009 | |||||||||||||
Available-for-sale securities:1 | |||||||||||||
Equity securities | $ 231 | $ 176 | $ (18 | ) | $ 389 | ||||||||
Other securities | 12 | — | (3 | ) | 9 | ||||||||
| $ 243 | $ 176 | $ (21 | ) | $ 398 | |||||||||
Held-to-maturity securities: | |||||||||||||
Bank and corporate debt | $ 199 | $ — | $ — | $ 199 | |||||||||
2008 | |||||||||||||
Available-for-sale securities:1 | |||||||||||||
Equity securities | $ 329 | $ 193 | $ (7 | ) | $ 515 | ||||||||
Other securities | 12 | — | (5 | ) | 7 | ||||||||
| $ 341 | $ 193 | $ (12 | ) | $ 522 | |||||||||
Held-to-maturity securities: | |||||||||||||
Bank and corporate debt | $ 74 | $ — | $ — | $ 74 | |||||||||
1 Refer to Note 13 for additional information related to the estimated fair value. | ||||||||||||
The Company divested certain available-for-sale securities during the year ended December 31, 2009. These divestitures were the result of both sales and a charitable donation. The sales of available-for-sale securities resulted in cash proceeds of $157 million, gross realized gains of $44 million and gross realized losses of $2 million. In addition to the sale of available-for-sale securities, the Company donated certain available-for-sale securities to The Coca-Cola Foundation. The donated investments had a cost basis of $7 million and a fair value of $106 million at the date of donation. The net impact of this donation was an expense equal to our cost basis in the securities, which was recorded in other income (loss) — net.
The Company did not sell any available-for-sale securities during 2008 and 2007. For the year ended December 31, 2008, the Company realized losses of approximately $81 million due to other-than-temporary impairments of certain available-for-sale securities. Refer to Note 14.
The Company's available-for-sale and held-to-maturity securities were included in the following captions in our consolidated balance sheets (in millions):
| December 31, 2009 | December 31, 2008 | |||||||
| Available- for-Sale Securities | Held-to- Maturity Securities | Available- for-Sale Securities | Held-to- Maturity Securities | |||||
Cash and cash equivalents | $ — | $ 198 | $ — | $ 73 | ||||
Marketable securities | — | 1 | 228 | 1 | ||||
Other investments, principally bottling companies | 389 | — | 287 | — | ||||
Other assets | 9 | — | 7 | — | ||||
| $ 398 | $ 199 | $ 522 | $ 74 | |||||
The contractual maturities of these investments as of December 31, 2009, were as follows (in millions):
| Available-for-Sale Securities | Held-to-Maturity Securities | |||||||
| Cost | Fair Value | Amortized Cost | Fair Value | |||||
Within 1 year | $ — | $ — | $ 199 | $ 199 | ||||
After 1 year through 5 years | — | — | — | — | ||||
After 5 years through 10 years | 2 | 1 | — | — | ||||
After 10 years | 10 | 8 | — | — | ||||
Equity securities | 231 | 389 | — | — | ||||
| $ 243 | $ 398 | $ 199 | $ 199 | |||||
Cost Method Investments
We periodically review all of our cost method investments to determine if impairment indicators are present; however, we are not required to determine the fair value of these investments unless impairment indicators exist. When impairment indicators exist, we generally use discounted cash flow analyses to determine the fair value. We estimate that the fair values of our cost method investments approximated or exceeded their carrying values as of December 31, 2009 and 2008. Our cost method investments had a carrying value of approximately $149 million and $176 million as of December 31, 2009 and 2008, respectively.
During the year ended December 31, 2009, the Company recorded a charge of approximately $27 million in other income (loss) — net, as a result of an other-than-temporary decline in the fair value of a cost method investment. Refer to Note 13 and Note 14 for additional information related to this impairment.
NOTE 3: BOTTLINGEQUITY METHOD INVESTMENTS
Our consolidated net income includes our Company's proportionate share of the net income or loss of our equity method investees. When we record our proportionate share of net income, it increases equity income (loss) — net in our consolidated statements of income and our carrying value in that investment. Conversely, when we record our proportionate share of a net loss, it decreases equity income (loss) — net in our consolidated statements of income and our carrying value in that investment. The Company's proportionate share of the net income or loss of our equity method investees includes significant operating and nonoperating items recorded by our equity method investees. These items can have a significant impact on the amount of equity income (loss) — net in our consolidated statements of income and our carrying value in those investments. The summarized financial information presented below includes the impact of significant operating and nonoperating items recorded by our equity method investees. Refer to Note 14 for additional information related to significant operating and nonoperating items recorded by our equity method investees. The carrying values of our equity method investments are also impacted by our proportionate share of items impacting the equity investee's AOCI.
We eliminate from our financial results all significant intercompany transactions, including the intercompany portion of transactions with equity method investees.
Refer to Note 14 and Note 17 for information related to acquisitions and divestitures of equity method investments.
Coca-Cola Enterprises Inc.
CCE is a marketer, producer and distributor of bottle, can and canfountain nonalcoholic beverages, operating in eight countries. As of December 31, 2006,2009, our Company owned approximately 3534 percent of the outstanding common stock of CCE. We account for our investment by the equity method of accounting and, therefore, our net income includes our proportionate share of CCE's net income resulting from our investment in CCE.or loss. As of December 31, 2006,2009, our proportionate share of the net assets of CCE exceeded our investment by approximately $282$271 million. This difference is not amortized.
A summary of financial information for CCE is as follows (in millions):
| December 31, | 2006 | 2005 | |||||
| Current assets | $ 3,691 | $ 3,395 | |||||
| Noncurrent assets | 19,534 | 21,962 | |||||
| Total assets | $ 23,225 | $ 25,357 | |||||
| Current liabilities | $ 3,818 | $ 3,846 | |||||
| Noncurrent liabilities | 14,881 | 15,868 | |||||
| Total liabilities | $ 18,699 | $ 19,714 | |||||
| Shareowners' equity | $ 4,526 | $ 5,643 | |||||
| Company equity investment | $ 1,312 | $ 1,731 | |||||
Year Ended December 31, | 2006 | 2005 | 2004 | ||||
| Net operating revenues | $ 19,804 | $ 18,743 | $ 18,190 | ||||
| Cost of goods sold | 11,986 | 11,185 | 10,771 | ||||
| Gross profit | $ 7,818 | $ 7,558 | $ 7,419 | ||||
| Operating (loss) income | $ (1,495 | ) | $ 1,431 | $ 1,436 | |||
| Net (loss) income | $ (1,143 | ) | $ 514 | $ 596 | |||
Year Ended December 31, | 2009 | 2008 | 2007 | ||||
Net operating revenues | $ 21,645 | $ 21,807 | $ 20,936 | ||||
Cost of goods sold | 13,333 | 13,763 | 12,955 | ||||
Gross profit | $ 8,312 | $ 8,044 | $ 7,981 | ||||
Operating income (loss) | $ 1,527 | $ (6,299 | ) | $ 1,470 | |||
Net income (loss) | $ 731 | $ (4,394 | ) | $ 711 | |||
December 31, | 2009 | 2008 | |||
Current assets | $ 5,170 | $ 4,583 | |||
Noncurrent assets | 11,246 | 11,006 | |||
Total assets | $ 16,416 | $ 15,589 | |||
Current liabilities | $ 4,588 | $ 5,074 | |||
Noncurrent liabilities | 10,946 | 10,524 | |||
Total liabilities | $ 15,534 | $ 15,598 | |||
Shareowners' equity (deficit) | $ 859 | $ (31 | ) | ||
Noncontrolling interest | $ 23 | $ 22 | |||
Total equity (deficit) | $ 882 | $ (9 | ) | ||
Company equity investment | $ 25 | $ — | |||
The carrying value of our investment in CCE was reduced to zero as of December 31, 2008, primarily as a result of recording our proportionate share of CCE's net loss and adjustments to AOCI. CCE's net loss in 2008 was primarily due to impairment charges recorded by CCE. Refer to Note 14. CCE's adjustments to AOCI were primarily due to an increase in its pension liability and the impact of foreign exchange fluctuations. In accordance with accounting principles generally accepted in the United States, once the carrying value of an equity investment is reduced to zero, the investor's proportionate share of net losses and items impacting AOCI is required to be recorded as a reduction to advances made from the investor to the investee. As a result, the Company reduced the carrying value of its investment in infrastructure programs with CCE. We continued to amortize our investment in these infrastructure programs based on our original investment; therefore, this adjustment had no impact on the amortization expense related to these infrastructure programs. During 2009, we restored our basis in these infrastructure programs as a result of recording our proportionate share of CCE's net income and adjustments to AOCI. Once our basis in these infrastructure programs was restored, we subsequently began increasing the carrying value of our investment in CCE under the equity method of accounting.
A summary of our significant transactions with CCE is as follows (in millions):
| Year Ended December 31, | 2006 | 2005 | 2004 | |||
| Concentrate, syrup and finished product sales to CCE | $ 5,378 | $ 5,125 | $ 5,203 | |||
| Syrup and finished product purchases from CCE | 415 | 428 | 428 | |||
| CCE purchases of sweeteners through our Company | 274 | 275 | 309 | |||
| Marketing payments made by us directly to CCE | 514 | 482 | 609 | |||
| Marketing payments made to third parties on behalf of CCE | 113 | 136 | 104 | |||
| Local media and marketing program reimbursements from CCE | 279 | 245 | 246 | |||
| Payments made to CCE for dispensing equipment repair services | 74 | 70 | 63 | |||
| Other payments — net | 99 | 81 | 19 | |||
Year Ended December 31, | 2009 | 2008 | 2007 | ||||
Concentrate, syrup and finished product sales to CCE | $ 6,032 | $ 6,431 | $ 5,948 | ||||
Syrup and finished product purchases from CCE | 351 | 344 | 410 | ||||
CCE purchases of sweeteners through our Company | 419 | 357 | 326 | ||||
Marketing payments made by us directly to CCE | 415 | 626 | 636 | ||||
Marketing payments made to third parties on behalf of CCE | 174 | 131 | 123 | ||||
Local media and marketing program reimbursements from CCE | 330 | 316 | 299 | ||||
Payments made to CCE for dispensing equipment repair services | 87 | 84 | 78 | ||||
Other payments — net | 66 | 75 | 102 | ||||
Syrup and finished product purchases from CCE represent purchases of fountain syrup in certain territories that have been resold by our Company to major customers and purchases of bottle and can products. Marketing payments made by us directly to CCE represent support of certain marketing activities and our participation with CCE in cooperative advertising and other marketing activities to promote the sale of Company trademark products within CCE territories. These programs are agreed to on an annual basis. Marketing payments made to third parties on behalf of CCE represent support of certain marketing activities and programs to promote the sale of Company trademark products within CCE's territories in conjunction with certain of CCE's customers. Pursuant to cooperative advertising and trade agreements with CCE, we received funds from CCE for local media and marketing program reimbursements. Payments made to CCE for dispensing equipment repair services represent reimbursement to CCE for its costs of parts and labor for repairs on cooler, dispensing or post-mix equipment owned by us or our customers. The Other payments—other payments — net line in the table above represents payments made to and received from CCE that are individually not significant.
In 2006, our Company's equity income related to CCE decreased by approximately $587 million, related to our proportionate share of certain items recorded by CCE. Our proportionate share of these items included approximately $602 million resulting from the impact of an impairment charge recorded by CCE. CCE recorded a $2.9 billion pretax ($1.8 billion after tax) impairment of its North American franchise rights. The decline in the estimated fair value of CCE's North American franchise rights was the result of several factors, including but not limited to (1) CCE's revised outlook on 2007 raw material costs driven by significant increases in aluminum and high fructose corn syrup ("HFCS"); (2) a challenging marketplace environment with increased pricing pressures in several high-growth beverage categories; and (3) increased interest rates contributing to a higher discount rate and corresponding capital charge. Our proportionate share of CCE's charges also included approximately $18 million due to restructuring charges recorded by CCE. These charges were partially offset by approximately $33 million related to our proportionate share of changes in certain of CCE's state and Canadian federal and provincial tax rates. All of these charges and changes impacted our Bottling Investments operating segment.
In 2005, our equity income related to CCE was reduced by approximately $33 million related to our proportionate share of certain charges and gains recorded by CCE. Our proportionate share of CCE's charges included an approximate $51 million decrease to equity income, primarily related to the tax liability recorded by CCE in the fourth quarter of 2005 resulting from the repatriation of previously unremitted foreign earnings under the Jobs Creation Act and approximately $18 million due to restructuring charges recorded by CCE. These restructuring charges were primarily related to workforce reductions associated with the reorganization of CCE's North American operations, changes in executive management and elimination of certain positions in
CCE's corporate headquarters. These charges were partially offset by an approximate $37 million increase to equity income in the second quarter of 2005 resulting from CCE's HFCS lawsuit settlement proceeds and changes in certain of CCE's state and provincial tax rates. Refer to Note 18.
In the second quarter of 2004, our Company and CCE agreed to terminate the Sales Growth Initiative ("SGI") agreement and certain other marketing funding programs that were previously in place. Due to termination of these agreements, a significant portion of the cash payments to be made by us directly to CCE was eliminated prospectively. At the termination of these agreements, we agreed that the concentrate price that CCE pays us for sales made in the United States and Canada would be reduced. Total cash support paid by our Company under the SGI agreement prior to its termination was approximately $58 million and approximately $161 million for 2004 and 2003, respectively. These amounts are included in the line item marketing payments made by us directly to CCE in the table above.
In the second quarter of 2004, our Company and CCE agreed to establishhave established a Global Marketing Fund, under which we expect to pay CCE $62 million annually through December 31, 2014, as support for certain marketing activities. The term of the agreement will automatically be extended for successive 10-year periods thereafter unless either party gives written notice of termination of this agreement. The marketing activities to be funded under this agreement will be agreed upon each year as part of the annual joint planning process and will be incorporated into the annual marketing plans of both companies. We paid CCE a prorated amount of $42 million for 2004. The prorated amount was determined based on the agreement date. These amounts are included in the line item marketing payments made by us directly to CCE in the table above.
Our Company previously entered into programs with CCE designed to help develop cold-drink infrastructure. Under these programs, our Company paid CCE for a portion of the cost of developing the infrastructure necessary to support accelerated placements of cold-drink equipment. These payments support a common objective of increased sales of Company trademarked beveragesTrademark Beverages from increased availability and consumption in the cold-drink channel. In connection with these programs, CCE agreed to:
CCE must achieve minimum average unit case volume for a 12-year period following the placement of equipment. These minimum average unit case volume levels ensure adequate gross profit from sales of concentrate to fully recover the capitalized costs plus a return on the Company's investment. Should CCE fail to purchase the specified numbers of cold-drink equipment for any calendar year through 2010, the parties agreed to mutually develop a reasonable solution. Should no mutually agreeable solution be developed, or in the event that CCE otherwise breaches any material obligation under the contracts and such breach is not remedied within a stated period, then CCE would be required to repay a portion of the support funding as determined by our Company. In the third quarter of 2004, our Company and CCE agreed to amend the contract to defer the placement of some equipment from 2004 and 2005, as previously agreed under the original contract, to 2009 and
2010. In connection with this amendment, CCE agreed to pay the Company approximately $2 million in 2004, $3 million annually in 2005 through 2008, and $1 million in 2009. In 2005, our Company and CCE agreed to amend the contract for North America to move to a system of purchase and
placement credits, whereby CCE earns credit toward its annual purchase and placement requirements based upon the type of equipment it purchases and places. The amended contract also provides that no breach by CCE will occur even if they doit does not achieve the required number of purchase and placement credits in any given year, so long as (1) the shortfall does not exceed 20 percent of the required purchase and placement credits for that year; (2) a compensating payment is made to our Company by CCE; (3) the shortfall is corrected in the following year; and (4) CCE meets all specified purchase and placement credit requirements by the end of 2010. The payments we made to CCE under these programs are recorded in prepaid expenses and other assets and in noncurrent other assets and amortized as deductions from revenues over the 10-year period following the placement of the equipment. OurThe amortizable carrying values for these infrastructure programs with CCE were approximately $576$307 million and $662$388 million as of December 31, 20062009 and 2005,2008, respectively. The Company has no further commitments under these programs.
In March 2004, During 2009, CCE failed to achieve the Companyminimum average unit case volume requirements on certain previously placed equipment. If such equipment is not generating sufficient unit case volume on a trailing twelve month period in April 2010, we and CCE launchedhave agreed to meet and develop a mutually agreeable solution to ensure compliance under these programs.
On January 1, 2008, CCE adopted the Dasani water brandmeasurement provisions of new accounting guidance for pension and other postretirement plans, which require entities to measure the funded status of retirement benefit plans as of their fiscal year end. The adoption of this new accounting guidance required a cumulative adjustment to be made to the beginning balance of retained earnings in Great Britain. The product was voluntarily recalled. During 2004,the period of adoption. We reduced the beginning balance of our Company reimbursedretained earnings and our investment basis in CCE $32by approximately $8 million for product recall costs incurred by CCE.
Effective December 31, 2006, CCE adopted SFAS No. 158. Ourour proportionate share of the impact of CCE's adoption of SFAS No. 158 was an approximate $132 million pretax ($84 million after tax) reduction in both the carrying value of our investment in CCE and our accumulated other comprehensive income (loss) ("AOCI"). Refer to Note 10 and Note 16.adjustment.
If valued at the December 31, 20062009, quoted closing price of CCE shares, the fair value of our investment in CCE would have exceeded our carrying value by approximately $2.1$3.6 billion.
Other Equity Method Investments
Our other equity method investments include our ownership interests in Coca-Cola HBC,Hellenic, Coca-Cola FEMSA and Coca-Cola Amatil. As of December 31, 2006,2009, we owned approximately 23 percent, 32 percent and 3230 percent, respectively, of these companies' common shares.
Operating results include our proportionate share of income (loss) from our equity method investments. As of December 31, 2006,2009, our investment in our equity method investees in the aggregate, other than CCE, exceeded our proportionate share of the net assets of these equity method investees by approximately $1,375$588 million. This difference is not amortized.
A summary of financial information for our equity method investees in the aggregate, other than CCE, is as follows (in millions):
| December 31, | 2006 | 2005 | |||||
| Current assets | $ 8,778 | $ 7,803 | |||||
| Noncurrent assets | 21,304 | 20,698 | |||||
| Total assets | $ 30,082 | $ 28,501 | |||||
| Current liabilities | $ 8,030 | $ 7,705 | |||||
| Noncurrent liabilities | 9,469 | 8,395 | |||||
| Total liabilities | $ 17,499 | $ 16,100 | |||||
| Shareowners' equity | $ 12,583 | $ 12,401 | |||||
| Company equity investment | $ 4,998 | $ 4,831 | |||||
Year Ended December 31, | 2006 | 2005 | 2004 | ||||
| Net operating revenues | $ 24,990 | $ 24,389 | $ 21,202 | ||||
| Cost of goods sold | 14,717 | 14,141 | 12,132 | ||||
| Gross profit | $ 10,273 | $ 10,248 | $ 9,070 | ||||
| Operating income | $ 2,697 | $ 2,669 | $ 2,406 | ||||
| Net income (loss) | $ 1,475 | $ 1,501 | $ 1,389 | ||||
| Net income (loss) available to common shareowners | $ 1,455 | $ 1,477 | $ 1,364 | ||||
Year Ended December 31, | 2009 | 2008 | 2007 | ||||
Net operating revenues | $ 34,292 | $ 34,482 | $ 28,112 | ||||
Cost of goods sold | 20,205 | 19,974 | 16,003 | ||||
Gross profit | $ 14,087 | $ 14,508 | $ 12,109 | ||||
Operating income | $ 3,657 | $ 3,687 | $ 3,369 | ||||
Consolidated net income (loss) | $ 2,269 | $ 1,950 | $ 1,923 | ||||
Less: Net income (loss) attributable to noncontrolling interests | $ 78 | $ 53 | $ 55 | ||||
Net income (loss) attributable to common shareowners | $ 2,191 | $ 1,897 | $ 1,868 | ||||
December 31, | 2009 | 2008 | |||||
Current assets | $ 10,848 | $ 10,922 | |||||
Noncurrent assets | 25,397 | 23,538 | |||||
Total assets | $ 36,245 | $ 34,460 | |||||
Current liabilities | $ 8,578 | $ 9,726 | |||||
Noncurrent liabilities | 10,945 | 9,940 | |||||
Total liabilities | $ 19,523 | $ 19,666 | |||||
Shareowners' equity | $ 16,232 | $ 14,457 | |||||
Noncontrolling interest | $ 490 | $ 337 | |||||
Total equity (deficit) | $ 16,722 | $ 14,794 | |||||
Company equity investment | $ 6,192 | $ 5,316 | |||||
Net sales to equity method investees other than CCE, the majority of which are located outside the United States, were approximately $7.6$5.6 billion in 2006, $7.42009, $9.4 billion in 20052008 and $5.2$8.0 billion in 2004.2007. Total support payments, primarily marketing, made to equity method investees other than CCE were approximately $512$878 million, $475$659 million and $442$546 million in 2006, 20052009, 2008 and 2004,2007, respectively.
In 2003, oneaddition, purchases of our Company'sfinished products from equity method investees Coca-Cola FEMSA, consummated a merger with another of the Company's equity method investees, Panamerican Beverages, Inc. At the time of the merger, the Company and Fomento Economico Mexicano, S.A.B. de C.V. ("FEMSA"), the major shareowner of Coca-Cola FEMSA, reached an understanding under which this shareowner could purchase from our Company an amount of Coca-Cola FEMSA shares sufficient for this shareowner to regain majority ownership interest in Coca-Cola FEMSA. That understanding expired in May 2006; however, in the third quarter of 2006, the Company and the shareowner reached an agreement under which the Company would sell a number of shares representing 8 percent of the capital stock of Coca-Cola FEMSA to FEMSA. As a result of this sale, which occurred in the fourth quarter of 2006, the Company received cash proceeds ofwere approximately $427$152 million, $228 million and realized a gain of approximately $175$108 million which was recorded in the consolidated statement of income line item other income (loss)—net2009, 2008 and impacted the Corporate operating segment. Also as a result of this sale, our ownership interest in Coca-Cola FEMSA was reduced from approximately 40 percent to approximately 32 percent. Refer to Note 18.
In 2006, our Company sold a portion of our investment in Coca-Cola Icecek A.S. ("Coca-Cola Icecek"), an equity method investee bottler incorporated in Turkey, in an initial public offering. Our Company received cash proceeds of approximately $198 million and realized a gain of approximately $123 million, which was recorded in the consolidated statement of income line item other income (loss)—net and impacted the Corporate operating segment. As a result of this public offering, our Company's interest in Coca-Cola Icecek decreased from approximately 36 percent to approximately 20 percent. Refer to Note 18.2007, respectively.
Our Company owns a 50 percent interest in Multon, a Russian juice business ("Multon"), which we acquired in April 2005 jointly with Coca-Cola HBC, for a total purchase price of approximately $501 million, split equally between the Company and Coca-Cola HBC. Multon produces and distributes juice products under the Dobriy, Rich, Nico and other trademarks in Russia, Ukraine and Belarus. Equity income—net includes our proportionate share of Multon's net income beginning April 20, 2005. Refer to Note 19.
During the second quarter of 2004, the Company's equity income benefited by approximately $37 million for its share of a favorable tax settlement related to Coca-Cola FEMSA.
In December 2004, the Company sold to an unrelated financial institution certain of its production assets that were previously leased to the Japanese supply chain management company (refer to discussion below). The assets were sold for approximately $271 million, and the sale resulted in no gain or loss. The financial institution entered into a leasing arrangement with the Japanese supply chain management company. These assets were previously reported in our consolidated balance sheet line item property, plant and equipment—net and assigned to our North Asia, Eurasia and Middle East operating segment.
During 2004, our Company sold our bottling operations in Vietnam, Cambodia, Sri Lanka and Nepal to Coca-Cola Sabco (Pty) Ltd. ("Sabco") for a total consideration of $29 million. In addition, Sabco assumed certain debts of these bottling operations. The proceeds from the sale of these bottlers were approximately equal to the carrying value of the investment.
Effective October 1, 2003, the Company and all of its bottling partners in Japan created a nationally integrated supply chain management company to centralize procurement, production and logistics operations for the entire Coca-Cola system in Japan. As a result of the creation of this supply chain management company in Japan, a portion of our Company's business was essentially converted from a finished product business model to a concentrate business model, thus reducing our net operating revenues and cost of goods sold by the same amounts. The formation of this entity included the sale of Company inventory and leasing of certain Company assets to this new entity on October 1, 2003, as well as our recording of a liability for certain contractual obligations to Japanese bottlers. Such amounts were not material to the Company's results of operations.
Effective December 31, 2006, our equity method investees other than CCE also adopted SFAS No. 158. Our proportionate share of the impact of the adoption of SFAS No. 158 by our equity method investees other than CCE was an approximate $18 million pretax ($12 million after tax) reduction in the carrying value of our investments in those equity method investees and our AOCI. Refer to Note 10 and Note 16.
If valued at the December 31, 2006,2009, quoted closing prices of shares actively traded on stock markets, the value of our equity method investments in publicly traded bottlers other than CCE would have exceeded our carrying value by approximately $3.6$5.5 billion.
Net Receivables and Dividends from Equity Method Investees
The total amount of net receivables due from equity method investees, including CCE, was approximately $857$949 million and $644$823 million as of December 31, 20062009 and 2005,2008, respectively. The total amount of dividends received from equity method investees, including CCE, was approximately $226$422 million, $234$254 million and $145$216 million for the years ended December 31, 2006, 20052009, 2008 and 2004,2007, respectively.
NOTE 4: ISSUANCES OF STOCK BY EQUITY METHOD INVESTEES
In 2006, our Dividends received in 2009 from equity method investees did not issue any additional shares to third parties that resulted in our Company recording any noncash pretax gains.
In 2005, our Company recorded approximately $23included the receipt of a $183 million of noncash pretax gains on issuances of stock by equity method investees. We recorded deferred taxes of approximately $8 million on these gains. These gains primarily related to an issuance of common stock byspecial dividend from Coca-Cola Amatil,Hellenic, which was valued at an amount greater thanincremental to its normal quarterly dividend. We classified the book value per sharereceipt of this cash dividend in cash flows from operating activities due to the fact that our cumulative equity in earnings from Coca-Cola Hellenic exceeded the cumulative distributions received; therefore, the dividend was deemed to be a return on our investment and not a return of our investment in Coca-Cola Amatil. Coca-Cola Amatil issued approximately 34 million shares of common stock with a fair value of $5.78 each in connection with the acquisition of SPC Ardmona Pty. Ltd., an Australian packaged fruit company. This issuance of common stock reduced our ownership interest in the total outstanding shares of Coca-Cola Amatil from approximately 34 percent to approximately 32 percent.investment.
In 2004, our Company recorded approximately $24 million of noncash pretax gains on issuances of stock by CCE. The issuances primarily related to the exercise of CCE stock options by CCE employees at amounts greater than the book value per share of our investment in CCE. We recorded deferred taxes of approximately $9 million on these gains. These issuances of stock reduced our ownership interest in the total outstanding shares of CCE from approximately 37 percent to approximately 36 percent.
NOTE 5: PROPERTY, PLANT AND EQUIPMENT
The following table summarizes our property, plant and equipment (in millions):
| December 31, | 2006 | 2005 | ||
| Land | $ 495 | $ 447 | ||
| Buildings and improvements | 3,020 | 2,692 | ||
| Machinery and equipment | 7,333 | 6,271 | ||
| Containers | 556 | 468 | ||
| Construction in progress | 507 | 306 | ||
| $ 11,911 | $ 10,184 | |||
| Less accumulated depreciation | 5,008 | 4,353 | ||
| Property, plant and equipment — net | $ 6,903 | $ 5,831 | ||
NOTE 4: HEDGING TRANSACTIONS AND DERIVATIVE FINANCIAL INSTRUMENTS
The Company is directly and indirectly affected by changes in certain market conditions. These changes in market conditions may adversely impact the Company's financial performance and are referred to as "market risks." Our Company, when deemed appropriate, uses derivatives as a risk management tool to mitigate the potential impact of certain market risks. The primary market risks managed by the Company through the use of derivative instruments are foreign currency exchange rate risk, commodity price risk and interest rate risk.
The Company uses various types of derivative instruments including, but not limited to, forward contracts, commodity futures contracts, option contracts, collars and swaps. Forward contracts and commodity futures contracts are agreements to buy or sell a quantity of a currency or commodity at a predetermined future date, and at a predetermined rate or price. An option contract is an agreement that conveys the purchaser the right, but not the obligation, to buy or sell a quantity of a currency or commodity at a predetermined rate or price during a period or at a time in the future. A collar is a strategy that uses a combination of options to limit the range of possible positive or negative returns on an underlying asset or liability to a specific range, or to protect expected future cash flows. To do this, an investor simultaneously buys a put option and sells (writes) a call option. A swap agreement is a contract between two parties to exchange cash flows based on specified underlying notional amounts, assets and/or indices. We do not enter into derivative financial instruments for trading purposes.
All derivatives are carried at fair value in the consolidated balance sheets in the line items prepaid expenses and other assets or accounts payable and accrued expenses, as applicable. The carrying values of the derivatives reflect the impact of legally enforceable master netting agreements and cash collateral held or placed with the same counterparties. These master netting agreements allow the Company to net settle positive and negative positions (assets and liabilities) arising from different transactions with the same counterparty.
The accounting for gains and losses that result from changes in the fair values of derivative instruments depends on whether the derivatives have been designated and qualify as hedging instruments and the type of hedging relationships. Derivatives can be designated as fair value hedges, cash flow hedges or hedges of net investments in foreign operations. The Company does not typically designate derivatives as fair value hedges. The changes in fair values of derivatives that have been designated and qualify as cash flow hedges or hedges of net investments in foreign operations are recorded in AOCI and are reclassified into the line item in the consolidated income statement in which the hedged items are recorded in the same period the hedged items affect earnings. Due to the high degree of effectiveness between the hedging instruments and the underlying exposures being hedged, fluctuations in the value of the derivative instruments are generally offset by changes in the fair values or cash flows of the underlying exposures being hedged. The changes in fair values of derivatives that were not designated and/or did not qualify as hedging instruments are immediately recognized into earnings.
For derivatives that will be accounted for as hedging instruments, the Company formally designates and documents, at inception, the financial instrument as a hedge of a specific underlying exposure, the risk management objective and the strategy for undertaking the hedge transaction. In addition, the Company formally assesses, both at the inception and at least quarterly thereafter, whether the financial instruments used in hedging transactions are effective at offsetting changes in either the fair values or cash flows of the related underlying exposures. Any ineffective portion of a financial instrument's change in fair value is immediately recognized into earnings.
The Company estimates the fair values of its derivatives based on quoted market prices or pricing models using current market rates. Refer to Note 13. The notional amounts of the derivative financial instruments do not necessarily represent amounts exchanged by the parties and, therefore, are not a direct measure of our exposure to the financial risks described above. The amounts exchanged are calculated by reference to the notional amounts and by other terms of the derivatives, such as interest rates, foreign currency exchange rates or other financial indices. The Company does not view the fair values of its derivatives in isolation, but rather in relation to the fair values or cash flows of the underlying hedged transactions or other exposures. Virtually all of our derivatives are straightforward over-the-counter instruments with liquid markets.
Credit Risk Associated with Derivatives
We have established strict counterparty credit guidelines and enter into transactions only with financial institutions of investment grade or better. We monitor counterparty exposures regularly and review any downgrade in credit rating immediately. If a downgrade in the credit rating of a counterparty were to occur, we have provisions requiring collateral in the form of U.S. government securities for substantially all of our transactions. To mitigate presettlement risk, minimum credit standards become more stringent as the duration of the derivative financial instrument increases. In addition, the Company's master netting agreements reduce credit risk by permitting the Company to net settle for transactions with the same counterparty. To minimize the concentration of credit risk, we enter into derivative transactions with a portfolio of financial institutions. Based on these factors, we consider the risk of counterparty default to be minimal.
NOTE 6: GOODWILL, TRADEMARKS AND OTHER INTANGIBLE ASSETSCash Flow Hedging Strategy
The following tables set forth information for intangibleCompany uses cash flow hedges to minimize the variability in cash flows of assets subjector liabilities or forecasted transactions caused by fluctuations in foreign currency exchange rates, commodity prices or interest rates. The changes in the fair values of derivatives designated as cash flow hedges are recorded in AOCI and are reclassified into the line item in the consolidated income statement in which the hedged items are recorded in the same period the hedged items affect earnings. The changes in fair values of hedges that are determined to amortization and for intangible assetsbe ineffective are immediately reclassified from AOCI into earnings. The Company did not subject to amortization (in millions):
| December 31, | 2006 | 2005 | |||
| Amortized intangible assets (various, principally trademarks): | |||||
| Gross carrying amount1 | $ 372 | $ 314 | |||
| Less accumulated amortization | 174 | 168 | |||
| Amortized intangible assets — net | $ 198 | $ 146 | |||
| Unamortized intangible assets: | |||||
| Trademarks2 | $ 2,045 | $ 1,946 | |||
| Goodwill3 | 1,403 | 1,047 | |||
| Bottlers' franchise rights3 | 1,359 | 521 | |||
| Other | 130 | 161 | |||
| Unamortized intangible assets | $ 4,937 | $ 3,675 | |||
Total amortization expense for intangible assets subject to amortization was approximately $18 million, $29 million and $35 million fordiscontinue any cash flow hedging relationships during the yearsyear ended December 31, 2006, 20052009. The maximum length of time over which the Company hedges its exposure to future cash flows is typically three years.
The Company maintains a foreign currency cash flow hedging program to reduce the risk that our eventual U.S. dollar net cash inflows from sales outside the United States and 2004, respectively.
Information about estimated amortization expense for intangible assets subjectU.S. dollar net cash outflows from procurement activities will be adversely affected by changes in foreign currency exchange rates. We enter into forward contracts and purchase foreign currency options (principally euros and Japanese yen) and collars to amortizationhedge certain portions of forecasted cash flows denominated in foreign currencies. When the dollar strengthens against the foreign currencies, the decline in the present value of future foreign currency cash flows is partially offset by gains in the fair value of the derivative instruments. Conversely, when the dollar weakens, the increase in the present value of future foreign currency cash flows is partially offset by losses in the fair value of the derivative instruments. The total notional value of derivatives that have been designated and qualify for the five years succeedingCompany's foreign currency cash flow hedging program as of December 31, 2006,2009, was approximately $3,679 million.
The Company has entered into commodity futures contracts and other derivative instruments on various commodities to mitigate the price risk associated with forecasted purchases of materials used in our manufacturing process. The derivative instruments have been designated and qualify as part of the Company's commodity cash flow hedging program. The objective of this hedging program is to reduce the variability of cash flows associated with future purchases of certain commodities. The total notional value of derivatives that have been designated and qualify under this program as follows (in millions):of December 31, 2009, was approximately $26 million.
| Amortization Expense | ||
| 2007 | $ 26 | |
| 2008 | 24 | |
| 2009 | 23 | |
| 2010 | 22 | |
| 2011 | 22 | |
Our Company monitors our mix of short-term debt and long-term debt. From time to time, we manage our risk to interest rate fluctuations through the use of derivative financial instruments. The Company had no outstanding derivative instruments under this hedging program as of December 31, 2009.
Hedges of Net Investments in Foreign Operations Strategy
The Company uses forward contracts to protect the value of our investments in a number of foreign subsidiaries. For derivative instruments that are designated and qualify as hedges of net investments in foreign operations, the changes in fair values of the derivative instruments are recognized in net foreign currency translation gain (loss), a component of AOCI, to offset the changes in the values of the net investments being hedged. Any ineffective portions of net investment hedges are reclassified from AOCI into earnings during the period of change. The total notional value of derivatives that have been designated and qualify as hedges of net investments in foreign operations as of December 31, 2009, was approximately $250 million.
Goodwill by operating segment wasEconomic Hedging Strategy
In addition to derivative instruments that are designated and qualify for hedge accounting, the Company also uses certain derivatives as follows (in millions):
| December 31, | 2006 | 2005 | ||
| Africa | $ — | $ — | ||
| East, South Asia and Pacific Rim | 22 | 22 | ||
| European Union | 696 | 593 | ||
| Latin America | 119 | 82 | ||
| North America | 141 | 141 | ||
| North Asia, Eurasia and Middle East | 21 | 21 | ||
| Bottling Investments | 404 | 188 | ||
| $ 1,403 | $ 1,047 | |||
In 2006, oureconomic hedges. Although these derivatives were not designated and/or did not qualify for hedge accounting, they are effective economic hedges. The Company recorded impairment chargesprimarily uses economic hedges to offset the earnings impact that fluctuations in foreign currency exchange rates have on certain monetary assets and liabilities denominated in nonfunctional currencies. The changes in fair values of approximately $41 million primarilythese economic hedges are immediately recognized into earnings in the line item other income (loss) — net. The total notional value of derivatives related to trademarks for beverages sold inour economic hedges of this type as of December 31, 2009, was approximately $651 million. The Company's other economic hedges are not significant to the Philippines and Indonesia. Company's consolidated financial statements.
The Philippines and Indonesia are components of our East, South Asia and Pacific Rim operating segment. The amount of these impairment charges was determined by comparingfollowing table presents the fair values of the intangible assets to their respective carrying values. Company's derivative instruments that were designated and qualified as part of a hedging relationship as of December 31, 2009 (in millions):
| Derivatives Designated as Hedging Instruments | Balance Sheet Location1 | Fair Value | 1,2 | |||
| Assets | ||||||
| Foreign currency contracts | Prepaid expenses and other assets | $ 66 | ||||
| Commodity futures | Prepaid expenses and other assets | 4 | ||||
| Total assets | $ 70 | |||||
| Liabilities | ||||||
| Foreign currency contracts | Accounts payable and accrued expenses | $ 22 | ||||
| Commodity futures | Accounts payable and accrued expenses | 3 | ||||
| Total liabilities | $ 25 | |||||
1 All of the Company's derivative instruments are carried at fair value in the consolidated balance sheets after considering the impact of legally enforceable master netting agreements and cash collateral held or placed with the same counterparties. However, current disclosure requirements mandate that derivatives must be disclosed without reflecting the impact of master netting agreements and cash collateral. Refer to Note 13 for the net presentation of the Company's derivative instruments. | ||||||
2 Refer to Note 13 for additional information related to the estimated fair value. | ||||||
The fair values were determined using discounted cash flow analyses. Becausefollowing table presents the fair values of the Company's derivative instruments that were less thannot designated as hedging instruments as of December 31, 2009 (in millions):
| Derivatives Not Designated as Hedging Instruments | Balance Sheet Location1 | Fair Value | 1,2 | |||
| Assets | ||||||
| Foreign currency contracts | Prepaid expenses and other assets | $ 110 | ||||
| Commodity futures | Prepaid expenses and other assets | 7 | ||||
| Other derivative instruments | Prepaid expenses and other assets | 9 | ||||
| Total assets | $ 126 | |||||
| Liabilities | ||||||
| Foreign currency contracts | Accounts payable and accrued expenses | $ 88 | ||||
| Total liabilities | $ 88 | |||||
1 All of the Company's derivative instruments are carried at fair value in the consolidated balance sheets after considering the impact of legally enforceable master netting agreements and cash collateral held or placed with the same counterparties. However, current disclosure requirements mandate that derivatives must be disclosed without reflecting the impact of master netting agreements and cash collateral. Refer to Note 13 for the net presentation of the Company's derivative instruments. | ||||||
2 Refer to Note 13 for additional information related to the estimated fair value. | ||||||
The following tables present the carryingpretax impact that changes in the fair values of derivatives designated as hedging instruments had on AOCI and earnings during the assets,year ended December 31, 2009 (in millions):
| Gain (Loss) Recognized in OCI | Location of Gain (Loss) Reclassified from AOCI into Income (Effective Portion) | Gain (Loss) Reclassified from AOCI into Income (Effective Portion) | Location of Gain (Loss) Recognized in Income (Ineffective Portion and Amount Excluded from Effectiveness Testing) | Gain (Loss) Recognized in Income (Ineffective Portion and Amount Excluded from Effectiveness Testing) | |||||||
| Cash Flow Hedges | |||||||||||
| Foreign currency contracts | $ (59 | ) | Net operating revenues | $ (62 | ) | Net operating revenues | $ — | 1 | |||
| Interest rate locks | — | Interest expense | (10 | ) | Interest expense | 4 | |||||
| Commodity futures | — | Cost of goods sold | (47 | ) | Cost of goods sold | — | |||||
| Total | $ (59 | ) | $ (119 | ) | $ 4 | ||||||
| Net Investment Hedges | |||||||||||
| Foreign currency contracts | $ (33 | ) | Other income (loss) — net | $ — | Other income (loss) — net | $ — | |||||
| Total | $ (33 | ) | $ — | $ — | |||||||
1 Includes a de minimis amount of ineffectiveness in the hedging relationship. | |||||||||||
In 2008 and 2007, the Company reclassified from AOCI into income pretax losses of approximately $53 million and $62 million, respectively. In addition, in 2008, we recorded impairment chargesreclassified approximately $17 million of previously unrecognized gains on interest rate locks from AOCI to reduce the carrying valuesinterest expense, which was partially offset by approximately $9 million of the assets to their respective fair values. These impairment charges were recorded in the line item other operating charges in the consolidated statement of income. Refer to Note 18.
In 2005, our Company recorded an impairment chargelosses related to trademarks for beverages sold in the Philippinesportion of approximately $84 million.cash flow hedges that were deemed to be ineffective. The carrying value of our trademarks in the Philippines, prior to the recording of the impairment charges in 2005, was approximately $268 million. The impairmentreclassification was the result of our revised outlooka discontinued cash flow hedging relationship on interest rate locks, as it was no longer probable that we would issue the long-term debt for which these hedges were designated.
As of December 31, 2009, the Philippines, which had been unfavorably impacted by declines in volume and income before income taxes resultingCompany estimates that it will reclassify into earnings during the next 12 months losses of approximately $41 million from the continued lack of an affordable package offering andpretax amount recorded in AOCI as the continued limited availability of these trademark beveragesanticipated cash flows occur.
The following table presents the pretax impact that changes in the marketplace. We determinedfair values of derivatives not designated as hedging instruments had on earnings during the amount of this impairment charge by comparing the fair value of the intangible assets to the carrying value. Fair values were derived using discounted cash flow analyses with a number of scenarios that were weighted based on the probability of different outcomes. Because the fair value was less than the carrying value of the assets, we recorded an impairment charge to reduce the carrying value of the assets to fair value. This impairment charge was recorded in the line item other operating charges in the consolidated statement of income.year ended December 31, 2009 (in millions):
| Location of Gain (Loss) Recognized in Income | Gain (Loss) Recognized in Income | ||||
| Foreign currency contracts | Net operating revenues | $ (16 | ) | ||
| Foreign currency contracts | Other income (loss) — net | 114 | |||
| Commodity futures | Cost of goods sold | 12 | |||
| Other derivative instruments | Selling, general and administrative expenses | 23 | |||
| Total | $ 133 | ||||
NOTE 5: GOODWILL, TRADEMARKS AND OTHER INTANGIBLE ASSETS
The following table summarizes information related to indefinite-lived intangible assets (in millions):
December 31, | 2009 | 2008 | ||
Trademarks1 | $ 6,183 | $ 6,059 | ||
Goodwill | 4,224 | 4,029 | ||
Bottlers' franchise rights2 | 1,953 | 1,840 | ||
Other | 124 | 192 | ||
Indefinite-lived intangible assets3 | $ 12,484 | $ 12,120 | ||
1 The increase in 2009 was primarily related to the acquisition of trademarks and brands of $54 million and the effect of translation adjustments. None of the acquisitions was individually significant. | ||||
2 The increase in 2009 was primarily related to the effect of translation adjustments. | ||||
3 The Company does not have any significant indefinite-lived intangible assets subject to renewal or extension arrangements. | ||||
The following table provides information related to the carrying value of our goodwill by operating segment (in millions):
| Eurasia & Africa | Europe | Latin America | North America | Pacific | Bottling Investments | Total | |||||||||
2008 | |||||||||||||||
Balance as of January 1 | $ 36 | $ 780 | $ 207 | $ 2,412 | $ 30 | $ 791 | $ 4,256 | ||||||||
Goodwill acquired during the year | — | 4 | 56 | 49 | — | — | 109 | ||||||||
Effect of foreign currency translation | — | (45 | ) | (28 | ) | — | 2 | (55 | ) | (126 | ) | ||||
Adjustments related to the finalization of purchase accounting | — | — | (6 | ) | (305 | )1 | 79 | 36 | (196 | ) | |||||
Impairments | — | — | — | — | — | — | — | ||||||||
Goodwill related to the sale of a business | — | — | — | — | (5 | ) | (9 | ) | (14 | ) | |||||
Balance as of December 31 | $ 36 | $ 739 | $ 229 | $ 2,156 | $ 106 | $ 763 | $ 4,029 | ||||||||
2009 | |||||||||||||||
Balance as of January 1 | $ 36 | $ 739 | $ 229 | $ 2,156 | $ 106 | $ 763 | $ 4,029 | ||||||||
Goodwill acquired during the year | 2 | 6 | 36 | — | — | — | 44 | ||||||||
Effect of foreign currency translation | 5 | 52 | 59 | — | 4 | 55 | 175 | ||||||||
Adjustments related to the finalization of purchase accounting | — | — | (4 | ) | (2 | ) | — | (14 | ) | (20 | ) | ||||
Impairments | — | — | — | — | — | — | — | ||||||||
Goodwill related to the sale of a business | — | — | — | — | — | (4 | ) | (4 | ) | ||||||
Balance as of December 31 | $ 43 | $ 797 | $ 320 | $ 2,154 | $ 110 | $ 800 | $ 4,224 | ||||||||
1 These adjustments were primarily related to the finalization of purchase accounting for glacéau and Fuze Beverage, LLC ("Fuze"), which resulted in a reclassification from goodwill to indefinite-lived trademarks. | |||||||||||||||
The following table summarizes information related to definite-lived intangible assets, which primarily consist of customer relationships and trademarks (in millions):
December 31, | 2009 | 2008 | ||
Gross carrying amount1 | $ 577 | $ 560 | ||
Less accumulated amortization | 233 | 175 | ||
Definite-lived intangible assets — net | $ 344 | $ 385 | ||
1 The increase in 2009 was primarily related to the effect of translation adjustments. | ||||
Total amortization expense for intangible assets subject to amortization was approximately $63 million, $54 million and $33 million for the years ended December 31, 2009, 2008 and 2007, respectively. Based on the carrying value of amortized intangible assets as of December 31, 2009, we estimate our amortization expense for the next five years will be as follows (in millions):
| Amortization Expense | ||
2010 | $ 56 | |
2011 | 52 | |
2012 | 46 | |
2013 | 37 | |
2014 | 33 | |
NOTE 7:6: ACCOUNTS PAYABLE AND ACCRUED EXPENSES
Accounts payable and accrued expenses consisted of the following (in millions):
| December 31, | 2006 | 2005 | ||
| Other accrued expenses | $ 1,653 | $ 1,413 | ||
| Accrued marketing | 1,348 | 1,268 | ||
| Trade accounts payable | 929 | 902 | ||
| Accrued compensation | 550 | 468 | ||
| Sales, payroll and other taxes | 264 | 215 | ||
| Container deposits | 264 | 209 | ||
| Accrued streamlining costs | 47 | 18 | ||
| Accounts payable and accrued expenses | $ 5,055 | $ 4,493 | ||
December 31, | 2009 | 2008 | ||
Accrued marketing | $ 1,912 | $ 1,694 | ||
Other accrued expenses | 1,883 | 1,985 | ||
Trade accounts payable | 1,410 | 1,370 | ||
Accrued compensation | 720 | 548 | ||
Sales, payroll and other taxes | 375 | 303 | ||
Container deposits | 357 | 305 | ||
Accounts payable and accrued expenses | $ 6,657 | $ 6,205 | ||
NOTE 8: SHORT-TERM BORROWINGS7: DEBT AND CREDITBORROWING ARRANGEMENTS
Short-Term Borrowings
Loans and notes payable consist primarily of commercial paper issued in the United States and a liability to acquire the remaining approximate 59 percent of the outstanding stock of Coca-Cola Erfrischungsgetraenke AG ("CCEAG").States. As of December 31, 2006, the Company owned approximately 41 percent of CCEAG's outstanding stock. In February 2002, the Company acquired control of CCEAG2009 and agreed to put/call agreements with the other shareowners of CCEAG, which resulted in the recording of a liability to acquire the remaining shares in CCEAG. The present value of the total amount to be paid by our Company to all other CCEAG shareowners was approximately $1,068 million at December 31, 2006, and approximately $941 million at December 31, 2005. This amount increased from the initial liability of approximately $600 million due to the accretion of the discounted value to the ultimate maturity of the liability and the translation adjustment related to this liability, partially offset by payments made to the other CCEAG shareowners during the term of the agreements. The accretion of the discounted value to its ultimate maturity value is recorded in the line item other income (loss)—net, and this amount was approximately $58 million, $60 million and $58 million, respectively, for the years ended December 31, 2006, 2005 and 2004.
As of December 31, 2006 and 2005,2008, we had approximately $1,942$6,322 million and $3,311$5,389 million, respectively, outstanding in commercial paper borrowings. Our weighted-average interest rates for commercial paper outstanding were approximately 5.20.2 percent and 4.21.7 percent per year atas of December 31, 20062009 and 2005,2008, respectively.
In addition, we had $1,952approximately $3,082 million in lines of credit and other short-term credit facilities available as of December 31, 2006,2009, of which approximately $225$427 million was outstanding. The outstanding amount of approximately $225 million was primarily related to our international operations. Included in the available credit facilities discussed above, the Company had $1,150$2,250 million in lines of credit for general corporate purposes, including commercial paper backup. These backup lines of credit expire at various times from 2010 through 2012. There were no borrowings under these backup lines of credit during 2006.
2009. These credit facilities are subject to normal banking terms and conditions. Some of the financial arrangements require compensating balances, none of which is presently significant to our Company.
NOTE 9: LONG-TERM DEBTOn March 6, 2009, the Company replaced a certain amount of commercial paper and short-term debt with longer-term debt. The Company issued long-term notes in the principal amounts of $900 million at a rate of 3.625 percent and $1,350 million at a rate of 4.875 percent due March 15, 2014, and March 15, 2019, respectively.
On November 1, 2007, the Company issued approximately $1,750 million of notes due on November 15, 2017. The proceeds from this debt issuance were used to repay short-term debt, including commercial paper issued to finance acquisitions during 2007. Refer to Note 17.
Long-term debt consisted of the following (in millions):
| December 31, | 2006 | 2005 | ||
| 53/4% U.S. dollar notes due 2009 | $ 399 | $ 399 | ||
| 53/4% U.S. dollar notes due 2011 | 499 | 499 | ||
| 73/8% U.S. dollar notes due 2093 | 116 | 116 | ||
| Other, due through 20141 | 333 | 168 | ||
| $ 1,347 | $ 1,182 | |||
| Less current portion | 33 | 28 | ||
| Long-term debt | $ 1,314 | $ 1,154 | ||
December 31, | 2009 | 2008 | |||||
53/4% U.S. dollar notes due 2009 | $ — | $ 399 | |||||
53/4% U.S. dollar notes due 2011 | 500 | 499 | |||||
35/8% U.S. dollar notes due 2014 | 897 | — | |||||
57/20% U.S. dollar notes due 2017 | 1,748 | 1,747 | |||||
47/8% U.S. dollar notes due 2019 | 1,339 | — | |||||
73/8% U.S. dollar notes due 2093 | 116 | 116 | |||||
Other, due through 20181 | 510 | 485 | |||||
Total2,3 | $ 5,110 | $ 3,246 | |||||
Less current portion | 51 | 465 | |||||
Long-term debt | $ 5,059 | $ 2,781 | |||||
1 | The weighted-average interest rate on outstanding balances was | |||||||
2 As of December 31, 2009 and 2008, the fair value of our long-term debt, including the current portion, was approximately $5,371 million and $3,402 million, respectively. The fair value of our long-term debt is estimated based on quoted prices for those or similar instruments. | ||||||||
3 The above notes include various restrictions, none of which is presently significant to our Company. | ||||||||
The above notes include various restrictions, noneAs of which is presently significant to our Company.
The principal amountDecember 31, 2009 and 2008, all of our long-term debt that had fixed and variable interest rates, respectively, was $1,346 million and $1 million on December 31, 2006. The principal amount of our long-term debt that had fixed and variable interest rates, respectively, was $1,181 million and $1 million on December 31, 2005.rates. The weighted-average interest rate on the outstanding balances of our Company's long-term debt was 6.05.0 percent and 5.7 percent for both the years ended December 31, 20062009 and 2005.
2008, respectively. Total interest paid was approximately $212$346 million, $233$460 million and $188$405 million in 2006, 20052009, 2008 and 2004,2007, respectively. ForRefer to Note 4 for a more detailed discussion ofon interest rate management, refer to Note 12.management.
Maturities of long-term debt for the five years succeeding December 31, 2006,2009, are as follows (in millions):
| Maturities of Long-Term Debt | ||
| 2007 | $ 33 | |
| 2008 | 175 | |
| 2009 | 436 | |
| 2010 | 54 | |
| 2011 | 522 | |
| Maturities of Long-Term Debt | ||
2010 | $ 51 | |
2011 | 573 | |
2012 | 153 | |
2013 | 178 | |
2014 | 912 | |
NOTE 10: COMPREHENSIVE INCOME
AOCI, including our proportionate share of equity method investees' AOCI, consisted of the following (in millions):
| December 31, | 2006 | 2005 | |||
| Foreign currency translation adjustment | $ (984 | ) | $ (1,587 | ) | |
| Accumulated derivative net losses | (49 | ) | (23 | ) | |
| Unrealized gain on available-for-sale securities | 147 | 104 | |||
| Adjustment to pension and other benefit liabilities | (405 | )1 | (163 | ) | |
| Accumulated other comprehensive income (loss) | $ (1,291 | ) | $ (1,669 | ) | |
A summary of the components of other comprehensive income (loss), including our proportionate share of equity method investees' other comprehensive income (loss), for the years ended December 31, 2006, 2005 and 2004, is as follows (in millions):
| Before-Tax Amount | Income Tax | After-Tax Amount | |||||
| 2006 | |||||||
| Net foreign currency translation adjustment | $ 685 | $ (82 | ) | $ 603 | |||
| Net loss on derivatives | (44 | ) | 18 | (26 | ) | ||
| Net change in unrealized gain on available-for-sale securities | 53 | (10 | ) | 43 | |||
| Net change in pension liability, prior to adoption of SFAS No. 158 | 68 | (22 | ) | 46 | |||
| Other comprehensive income (loss) | $ 762 | $ (96 | ) | $ 666 | |||
Before-Tax Amount | Income Tax | After-Tax Amount | |||||
| 2005 | |||||||
| Net foreign currency translation adjustment | $ (440 | ) | $ 44 | $ (396 | ) | ||
| Net gain on derivatives | 94 | (37 | ) | 57 | |||
| Net change in unrealized gain on available-for-sale securities | 20 | (7 | ) | 13 | |||
| Net change in pension liability, prior to adoption of SFAS No. 158 | 5 | — | 5 | ||||
| Other comprehensive income (loss) | $ (321 | ) | $ — | $ (321 | ) | ||
Before-Tax Amount | Income Tax | After-Tax Amount | |||||
| 2004 | |||||||
| Net foreign currency translation adjustment | $ 766 | $ (101 | ) | $ 665 | |||
| Net loss on derivatives | (4 | ) | 1 | (3 | ) | ||
| Net change in unrealized gain on available-for-sale securities | 48 | (9 | ) | 39 | |||
| Net change in pension liability, prior to adoption of SFAS No. 158 | (81 | ) | 27 | (54 | ) | ||
| Other comprehensive income (loss) | $ 729 | $ (82 | ) | $ 647 | |||
NOTE 11: FINANCIAL INSTRUMENTS
Certain Debt and Marketable Equity Securities
Investments in debt and marketable equity securities, other than investments accounted for by the equity method, are categorized as trading, available-for-sale or held-to-maturity. Our marketable equity investments are categorized as trading or available-for-sale with their cost basis determined by the specific identification method. Trading securities are carried at fair value with realized and unrealized gains and losses included in net income. We record available-for-sale instruments at fair value, with unrealized gains and losses, net of deferred income taxes, reported as a component of AOCI. Debt securities categorized as held-to-maturity are stated at amortized cost.
As of December 31, 2006 and 2005, trading, available-for-sale and held-to-maturity securities consisted of the following (in millions):
| Gross Unrealized | |||||||||
| Cost | Gains | Losses | Estimated Fair Value | ||||||
| 2006 | |||||||||
| Trading Securities: | |||||||||
| Equity securities | $ 60 | $ 6 | $ — | $ 66 | |||||
| Available-for-sale securities: | |||||||||
| Equity securities | $ 240 | $ 219 | $ (1 | ) | $ 458 | ||||
| Other securities | 13 | — | — | 13 | |||||
| $ 253 | $ 219 | $ (1 | ) | $ 471 | |||||
| Held-to-maturity securities: | |||||||||
| Bank and corporate debt | $ 83 | $ — | $ — | $ 83 | |||||
Gross Unrealized | |||||||||
| Cost | Gains | Losses | Estimated Fair Value | ||||||
| 2005 | |||||||||
| Trading Securities: | |||||||||
| Equity securities | $ — | $ — | $ — | $ — | |||||
| Available-for-sale securities: | |||||||||
| Equity securities | $ 138 | $ 167 | $ (2 | ) | $ 303 | ||||
| Other securities | 13 | — | — | 13 | |||||
| $ 151 | $ 167 | $ (2 | ) | $ 316 | |||||
| Held-to-maturity securities: | |||||||||
| Bank and corporate debt | $ 348 | $ — | $ — | $ 348 | |||||
As of December 31, 2006 and 2005, these investments were included in the following captions (in millions):
| Trading Securities | Available- for-Sale Securities | Held-to- Maturity Securities | ||||
| 2006 | ||||||
| Cash and cash equivalents | $ — | $ — | $ 82 | |||
| Current marketable securities | 66 | 83 | 1 | |||
| Cost method investments, principally bottling companies | — | 372 | — | |||
| Other assets | — | 16 | — | |||
| $ 66 | $ 471 | $ 83 | ||||
Trading Securities | Available- for-Sale Securities | Held-to- Maturity Securities | ||||
| 2005 | ||||||
| Cash and cash equivalents | $ — | $ — | $ 346 | |||
| Current marketable securities | — | 64 | 2 | |||
| Cost method investments, principally bottling companies | — | 239 | — | |||
| Other assets | — | 13 | — | |||
| $ — | $ 316 | $ 348 | ||||
The contractual maturities of these investments as of December 31, 2006, were as follows (in millions):
| Trading Securities | Available-for-Sale Securities | Held-to-Maturity Securities | ||||||||||
| Cost | Fair Value | Cost | Fair Value | Amortized Cost | Fair Value | |||||||
| 2007 | $ — | $ — | $ — | $ — | $ 83 | $ 83 | ||||||
| 2008-2011 | — | — | — | — | — | — | ||||||
| 2012-2016 | — | — | — | — | — | — | ||||||
| After 2016 | — | — | 13 | 13 | — | — | ||||||
| Equity securities | 60 | 66 | 240 | 458 | — | — | ||||||
| $ 60 | $ 66 | $ 253 | $ 471 | $ 83 | $ 83 | |||||||
For the years ended December 31, 2006, 2005 and 2004, gross realized gains and losses on sales of trading and available-for-sale securities were not material. The cost of securities sold is based on the specific identification method.
Fair Value of Other Financial Instruments
The carrying amounts of cash and cash equivalents, receivables, accounts payable and accrued expenses, and loans and notes payable approximate their fair values because of the relatively short-term maturity of these instruments.
We estimate that the fair values of non-marketable cost method investments approximate their carrying amounts.
We carry our non-marketable cost method investments at cost or, if a decline in the value of the investment is deemed to be other than temporary, at fair value. Estimates of fair value are generally based upon discounted cash flow analyses.
We recognize all derivative instruments as either assets or liabilities at fair value in our consolidated balance sheets, with fair values estimated based on quoted market prices or pricing models using current market rates. Virtually all of our derivatives are straightforward, over-the-counter instruments with liquid markets. For further discussion of our derivatives, including a disclosure of derivative values, refer to Note 12.
The fair value of our long-term debt is estimated based on quoted prices for those or similar instruments. As of December 31, 2006, the carrying amounts and fair values of our long-term debt, including the current portion, were approximately $1,347 million and approximately $1,386 million, respectively. As of December 31, 2005, these carrying amounts and fair values were approximately $1,182 million and approximately $1,240 million, respectively.
NOTE 12: HEDGING TRANSACTIONS AND DERIVATIVE FINANCIAL INSTRUMENTS
When deemed appropriate our Company uses derivative financial instruments primarily to reduce our exposure to adverse fluctuations in interest rates and foreign currency exchange rates, commodity prices and other market risks. Derivative instruments used to manage fluctuations in commodity prices were not material to the consolidated financial statements for the three years ended December 31, 2006. The Company formally designates and documents the financial instrument as a hedge of a specific underlying exposure, as well as the risk management objectives and strategies for undertaking the hedge transactions. The Company formally assesses, both at the inception and at least quarterly thereafter, whether the financial instruments that are used in hedging transactions are effective at offsetting changes in either the fair value or cash flows of the related underlying exposure. Because of the high degree of effectiveness between the hedging instrument and the underlying exposure being hedged, fluctuations in the value of the derivative instruments are generally offset by changes in the fair values or cash flows of the underlying exposures being hedged. Any ineffective portion of a financial instrument's change in fair value is immediately recognized in earnings. Virtually all of our derivatives are straightforward over-the-counter instruments with liquid markets. Our Company does not enter into derivative financial instruments for trading purposes.
The fair values of derivatives used to hedge or modify our risks fluctuate over time. We do not view these fair value amounts in isolation, but rather in relation to the fair values or cash flows of the underlying hedged transactions or other exposures. The notional amounts of the derivative financial instruments do not necessarily represent amounts exchanged by the parties and, therefore, are not a direct measure of our exposure to the financial risks described above. The amounts exchanged are calculated by reference to the notional amounts and by other terms of the derivatives, such as interest rates, foreign currency exchange rates or other financial indices.
Our Company recognizes all derivative instruments as either assets or liabilities in our consolidated balance sheets at fair value. The accounting for changes in fair value of a derivative instrument depends on whether it has been designated and qualifies as part of a hedging relationship and, further, on the type of hedging relationship. At the inception of the hedging relationship, the Company must designate the instrument as a fair value hedge, a cash flow hedge, or a hedge of a net investment in a foreign operation. This designation is based upon the exposure being hedged.
We have established strict counterparty credit guidelines and enter into transactions only with financial institutions of investment grade or better. We monitor counterparty exposures daily and review any downgrade in credit rating immediately. If a downgrade in the credit rating of a counterparty were to occur, we have provisions requiring collateral in the form of U.S. government securities for substantially all of our transactions. To mitigate presettlement risk, minimum credit standards become more stringent as the duration of the derivative financial instrument increases. To minimize the concentration of credit risk, we enter into derivative transactions with a portfolio of financial institutions. The Company has master netting agreements with most of the financial institutions that are counterparties to the derivative instruments. These agreements allow for the net settlement of assets and liabilities arising from different transactions with the same counterparty. Based on these factors, we consider the risk of counterparty default to be minimal.
Interest Rate Management
Our Company monitors our mix of fixed-rate and variable-rate debt as well as our mix of term debt versus non-term debt. This monitoring includes a review of business and other financial risks. We also enter into interest rate swap agreements to manage our mix of fixed-rate and variable-rate debt. Interest rate swap agreements that meet certain conditions required under SFAS No. 133 for fair value hedges are accounted for as such, with the offset recorded to adjust the fair value of the underlying exposure being hedged. The Company had no outstanding interest rate swaps as of December 31, 2006 and 2005. The Company estimates the fair value of its interest rate derivatives based on quoted market prices. Any ineffective portion, which was not significant in 2006, 2005 or 2004, of the changes in the fair value of these instruments was immediately recognized in net income.
Foreign Currency Management
The purpose of our foreign currency hedging activities is to reduce the risk that our eventual U.S. dollar net cash inflows resulting from sales outside the United States will be adversely affected by changes in foreign currency exchange rates.
We enter into forward exchange contracts and purchase foreign currency options (principally euro and Japanese yen) and collars to hedge certain portions of forecasted cash flows denominated in foreign currencies. The effective portion of the changes in fair value for these contracts, which have been designated as cash flow hedges, was reported in AOCI and reclassified into earnings in the same financial statement line item and in the same period or periods during which the hedged transaction affects earnings. Any ineffective portion, which was not significant in 2006, 2005 or 2004, of the change in the fair value of these instruments was immediately recognized in net income.
Additionally, the Company enters into forward exchange contracts that are effective economic hedges and are not designated as hedging instruments under SFAS No. 133. These instruments are used to offset the earnings impact relating to the variability in foreign currency exchange rates on certain monetary assets and liabilities denominated in nonfunctional currencies. Changes in the fair value of these instruments are immediately recognized in earnings in the line item other income (loss)—net of our consolidated statements of income to offset the effect of remeasurement of the monetary assets and liabilities.
The Company also enters into forward exchange contracts to hedge its net investment position in certain major currencies. Under SFAS No. 133, changes in the fair value of these instruments are recognized in foreign currency translation adjustment, a component of AOCI, to offset the change in the value of the net investment
being hedged. For the years ended December 31, 2006, 2005 and 2004, we recorded net gain (loss) in foreign currency translation adjustment of approximately $3 million, $(40) million and $(8) million, respectively.
The following table presents the carrying values, fair values and maturities of the Company's foreign currency derivative instruments outstanding as of December 31, 2006 and 2005 (in millions):
| Carrying Values Assets/(Liabilities | ) | Fair Values Assets/(Liabilities | ) | Maturity | ||
| 2006 | ||||||
| Forward contracts | $ (21 | ) | $ (21 | ) | 2007-2008 | |
| Options and collars | 18 | 18 | 2007 | |||
| $ (3 | ) | $ (3 | ) | |||
Carrying Values Assets | Fair Values Assets | Maturity | ||||
| 2005 | ||||||
| Forward contracts | $ 28 | $ 28 | 2006 | |||
| Options and collars | 11 | 11 | 2006 | |||
| $ 39 | $ 39 | |||||
The Company estimates the fair value of its foreign currency derivatives based on quoted market prices or pricing models using current market rates. These amounts are primarily reflected in prepaid expenses and other assets in our consolidated balance sheets.
Summary of AOCI
For the years ended December 31, 2006, 2005 and 2004, we recorded a net gain (loss) to AOCI of approximately $(31) million, $55 million and $6 million, respectively, net of both income taxes and reclassifications to earnings, primarily related to gains and losses on foreign currency cash flow hedges. These items will generally offset cash flow gains and losses relating to the underlying exposures being hedged in future periods. The Company estimates that it will reclassify into earnings during the next 12 months losses of approximately $11 million from the after-tax amount recorded in AOCI as of December 31, 2006, as the anticipated cash flows occur.
The following table summarizes activity in AOCI related to derivatives designated as cash flow hedges held by the Company during the applicable periods (in millions):
| Before-Tax Amount | Income Tax | After-Tax Amount | |||||
| 2006 | |||||||
| Accumulated derivative net gains as of January 1, 2006 | $ 35 | $ (14 | ) | $ 21 | |||
| Net changes in fair value of derivatives | (38 | ) | 15 | (23 | ) | ||
| Net gains reclassified from AOCI into earnings | (13 | ) | 5 | (8 | ) | ||
| Accumulated derivative net losses as of December 31, 2006 | $ (16 | ) | $ 6 | $ (10 | ) | ||
Before-Tax Amount | Income Tax | After-Tax Amount | |||||
| 2005 | |||||||
| Accumulated derivative net losses as of January 1, 2005 | $ (56 | ) | $ 22 | $ (34 | ) | ||
| Net changes in fair value of derivatives | 135 | (53 | ) | 82 | |||
| Net gains reclassified from AOCI into earnings | (44 | ) | 17 | (27 | ) | ||
| Accumulated derivative net gains as of December 31, 2005 | $ 35 | $ (14 | ) | $ 21 | |||
Before-Tax Amount | Income Tax | After-Tax Amount | |||||
| 2004 | |||||||
| Accumulated derivative net losses as of January 1, 2004 | $ (66 | ) | $ 26 | $ (40 | ) | ||
| Net changes in fair value of derivatives | (76 | ) | 30 | (46 | ) | ||
| Net losses reclassified from AOCI into earnings | 86 | (34 | ) | 52 | |||
| Accumulated derivative net losses as of December 31, 2004 | $ (56 | ) | $ 22 | $ (34 | ) | ||
The Company did not discontinue any cash flow hedge relationships during the years ended December 31, 2006, 2005 and 2004.
NOTE 13:8: COMMITMENTS AND CONTINGENCIES
As of December 31, 2006,2009, we were contingently liable for guarantees of indebtedness owed by third parties in the amount of approximately $270$245 million. These guarantees primarily are related to third-party customers, bottlers and vendors and have arisen through the normal course of business. These guarantees have various terms, and none of these guarantees was individually significant. The amount represents the maximum potential future payments that we could be required to make under the guarantees; however, we do not consider it probable that we will be required to satisfy these guarantees.
In December 2003,On September 3, 2008, we grantedannounced our intention to make cash offers to purchase China Huiyuan Juice Group Limited, a $250 million standby lineHong Kong listed company which owns the Huiyuan juice business throughout China ("Huiyuan"). The Company had accepted irrevocable undertakings from three shareholders for acceptance of creditthe offers, in aggregate representing approximately 66 percent of the Huiyuan shares. The making of the offers was subject to Coca-Cola FEMSApreconditions relating to Chinese regulatory approvals. On March 18, 2009, the Chinese Ministry of Commerce declined approval for the Company's proposed purchase of Huiyuan. Consequently, the Company was unable to proceed with normal market terms. This standby line of credit expired in December 2006.the proposed cash offers, and the irrevocable undertakings terminated.
We believe our exposure to concentrations of credit risk is limited due to the diverse geographic areas covered by our operations.
The Company is involved in various legal proceedings. We establish reserves for specific legal proceedings when we determine that the likelihood of an unfavorable outcome is probable and the amount of loss can be reasonably estimated. Management has also identified certain other legal matters where we believe an unfavorable outcome is reasonably possible and/or for which no estimate of possible losses can be made. Management believes that any liability to the Company that may arise as a result of currently pending legal proceedings including those discussed below, will not have a material adverse effect on the financial condition of the Company taken as a whole.
During the period from 1970 to 1981, our Company owned Aqua-Chem, Inc., now known as Cleaver-Brooks, Inc. ("Aqua-Chem"). A division of Aqua-Chem manufactured certain boilers that contained gaskets that Aqua-Chem purchased from outside suppliers. Several years after our Company sold this entity, Aqua-Chem received its first lawsuit relating to asbestos, a component of some of the gaskets. In September 2002, Aqua-Chem notified our Company that it believed we were obligated for certain costs and expenses associated with its asbestos litigations. Aqua-Chem demanded that our Company reimburse it for approximately $10 million for out-of-pocket litigation-related expenses. Aqua-Chem also demanded that the Company acknowledge a continuing obligation to Aqua-Chem for any future liabilities and expenses that are excluded from coverage under the applicable insurance or for which there is no insurance. Our Company disputes Aqua-Chem's claims, and we believe we have no obligation to Aqua-Chem for any of its past, present or future liabilities, costs or expenses. Furthermore, we believe we have substantial legal and factual defenses to Aqua-Chem's claims. The parties entered into litigation in Georgia to resolve this dispute, which was stayed by agreement of the parties pending the outcome of litigation filed in Wisconsin by certain insurers of Aqua-Chem. In that case, five plaintiff insurance companies filed a declaratory judgment action against Aqua-Chem, the Company and 16 defendant insurance companies seeking a determination of the parties' rights and liabilities under policies issued by the insurers and reimbursement for amounts paid by plaintiffs in excess of their obligations. ThatDuring the course of the Wisconsin coverage litigation, remains pending, and the Company believes it has substantial legal and factual defenses to the insurers' claims. Aqua-Chem and the Company subsequently reached a settlement agreementsettlements with sixseveral of the insurers, in the Wisconsin insurance coverage litigation, and those insurersincluding plaintiffs, who have or will pay funds into an escrow account for payment of costs arising from the asbestos claims against Aqua-Chem. Aqua-Chem has also reachedOn July 24, 2007, the Wisconsin trial court entered a settlement agreement with an additional insurerfinal declaratory judgment regarding paymentthe rights and obligations of that insurer's policy proceeds for Aqua-Chem's asbestos claims. Aqua-Chem and the Company will continue to negotiate withparties under the insurance policies issued by the remaining defendant insurers, which judgment was not appealed. The judgment directs, among other things, that are partieseach insurer whose policy is triggered is jointly and severally liable for 100 percent of Aqua-Chem's losses up to policy limits. The Georgia litigation remains subject to the Wisconsin insurance coverage case and will litigate their claims against such insurers to the extent negotiations do not result in settlements. The Company also believes Aqua-Chem has substantial insurance coverage to pay Aqua-Chem's asbestos claimants.stay agreement.
The Company is discussing with the Competition Directorate of the European Commission (the "European Commission") issues relating to parallel trade within the European Union arising out of comments received by the European Commission from third parties. The Company is cooperating fully with the European Commission and is providing information on these issues and the measures taken and to be taken to address any issues raised. The Company is unable to predict at this time with any reasonable degree of certainty what action, if any, the European Commission will take with respect to these issues.
At the time we acquire or divest our interest in an entity, we sometimes agree to indemnify the seller or buyer for specific contingent liabilities. Management believes that any liability to the Company that may arise as a result of any such indemnification agreements will not have a material adverse effect on the financial condition of the Company taken as a whole.
The Company is involved in various tax matters.matters, with respect to some of which the outcome is uncertain. We establish reserves to remove some or all of the tax benefit of any of our tax positions at the time that we determine that it becomes
uncertain based upon one of the following conditions: (1) the tax position is probablenot "more likely than not" to be sustained, (2) the tax position is "more likely than not" to be sustained, but for a lesser amount, or (3) the tax position is "more likely than not" to be sustained, but not in the financial period in which the tax position was originally taken. For purposes of evaluating whether or not a tax position is uncertain, (1) we presume the tax position will be liableexamined by the relevant taxing authority that has full knowledge of all relevant information; (2) the technical merits of a tax position are derived from authorities such as legislation and statutes, legislative intent, regulations, rulings and case law and their applicability to pay additional taxes related to certain matters and the amounts of such possible additional taxes are reasonably estimable. We adjust these reserves, including any impact on the related interest and penalties, in light of changing facts and circumstances such asof the progresstax position; and (3) each tax position is evaluated without consideration of athe possibility of offset or aggregation with other tax audit.positions taken. A number of years may elapse before a particular matter, for which we may have established a reserve,uncertain tax position is audited and finally resolved or when a tax assessment is raised. The number of years with opensubject to tax auditsassessments varies depending on the tax jurisdiction. While it is often difficult to predict the final outcome or the timing of resolution of any particularThe tax matter, we record a reserve when we determine the likelihood of loss is probable and the amount of loss is reasonably estimable. Such liabilities are recorded in the line item accrued income taxes in the Company's consolidated balance sheets. Favorable resolution of tax mattersbenefit that hadhas been previously reserved because of a failure to meet the "more likely than not" recognition threshold would be recognized as a reduction toin our income tax expense in the first interim period when known.the uncertainty disappears under any one of the following conditions: (1) the tax position is "more likely than not" to be sustained, (2) the tax position, amount, and/or timing is ultimately settled through negotiation or litigation, or (3) the statute of limitations for the tax position has expired. Refer to Note 11.
NOTE 9: STOCK COMPENSATION PLANS
Our Company grants stock options and restricted stock awards to certain employees of the Company. Total stock-based compensation expense was approximately $241 million in 2009, $266 million in 2008 and $313 million in 2007 and was included as a component of selling, general and administrative expenses in our consolidated statements of income. The total income tax benefit recognized in our consolidated statements of income for share-based compensation arrangements was approximately $68 million, $72 million and $91 million for 2009, 2008 and 2007, respectively.
As of December 31, 2009, we had approximately $335 million of total unrecognized compensation cost related to nonvested share-based compensation arrangements granted under our plans. This cost is expected to be recognized over a weighted-average period of 1.7 years as stock-based compensation expense. This expected cost does not include the impact of any future stock-based compensation awards.
Stock Option Plans
The fair value of our stock option grants is amortized over the vesting period, generally four years. The fair value of each option award is estimated on the grant date using a Black-Scholes-Merton option-pricing model. The weighted-average fair value of options granted during the past three years and the weighted-average assumptions used in the Black-Scholes-Merton option-pricing model for such grants were as follows:
| 2009 | 2008 | 2007 | |||||
Fair value of options at grant date | $ 6.38 | $ 9.81 | $ 8.46 | ||||
Dividend yield1 | 3.4 | % | 2.3 | % | 2.6 | % | |
Expected volatility2 | 20.0 | % | 18.0 | % | 15.4 | % | |
Risk-free interest rate3 | 2.8 | % | 3.2 | % | 4.6 | % | |
Expected term of the option4 | 6 years | 6 years | 6 years | ||||
1 The dividend yield is the calculated yield on the Company's stock at the time of the grant. | |||||||
2 Expected volatility is based on implied volatilities from traded options on the Company's stock, historical volatility of the Company's stock, and other factors. | |||||||
3 The risk-free interest rate for the period matching the expected term of the option is based on the U.S. Treasury yield curve in effect at the time of the grant. | |||||||
4 The expected term of the option represents the period of time that options granted are expected to be outstanding and is derived by analyzing historic exercise behavior. | |||||||
Stock options granted prior to 1999 and in December 2003 and thereafter expire 10 years from the date of grant. Stock options granted from 1999 through July 2003 expire 15 years from the date of grant. The shares of common stock to be issued, transferred and/or sold under the stock option plans are made available from authorized and unissued Company common stock or from the Company's treasury shares. In 2007, the Company began issuing common stock under these
plans from the Company's treasury shares. The Company is also involvedhad the following active stock option plans as of December 31, 2009:
The 1999 Stock Option Plan (the "1999 Option Plan") was approved by shareowners in various tax matters where we have determined thatApril 1999. Under the probability1999 Option Plan, a maximum of an unfavorable outcome is reasonably possible. Management believes that any liability120 million shares of our common stock was approved to be issued or transferred, through the grant of stock options, to certain officers and employees.
The 2002 Stock Option Plan (the "2002 Option Plan") was approved by shareowners in April 2002. An amendment to the 2002 Option Plan which permitted the issuance of stock appreciation rights was approved by shareowners in April 2003. Under the 2002 Option Plan, a maximum of 120 million shares of our common stock was approved to be issued or transferred, through the grant of stock options or stock appreciation rights, to certain officers and employees. No stock appreciation rights have been issued under the 2002 Option Plan as of December 31, 2009.
The 2008 Stock Option Plan (the "2008 Option Plan") was approved by shareowners in April 2008. Under the 2008 Option Plan, a maximum of 140 million shares of our common stock was approved to be issued or transferred to certain officers and employees pursuant to stock options granted under the 2008 Option Plan.
As of December 31, 2009, there were approximately 127 million shares available to be granted under the stock option plans discussed above. Options to purchase common stock under all of these plans have generally been granted at fair market value at the date of grant.
Stock option activity for all stock option plans for the year ended December 31, 2009, was as follows:
| Shares (In millions | ) | Weighted-Average Exercise Price | Weighted-Average Remaining Contractual Life | Aggregate Intrinsic Value (In millions | ) | ||||
Outstanding on January 1, 2009 | 176 | $ 48.56 | |||||||
Granted | 34 | 43.24 | |||||||
Exercised | (15 | ) | 44.26 | ||||||
Forfeited/expired | (6 | ) | 50.66 | ||||||
Outstanding on December 31, 2009 | 189 | $ 47.90 | 6.78 years | $ 1,753 | |||||
Expected to vest at December 31, 2009 | 186 | $ 47.92 | 6.74 years | $ 1,717 | |||||
Exercisable on December 31, 2009 | 127 | $ 48.10 | 5.98 years | $ 1,147 | |||||
The total intrinsic value of the options exercised during the years ended December 31, 2009, 2008 and 2007 was $146 million, $150 million and $284 million, respectively. The total shares exercised during the years ended December 31, 2009, 2008 and 2007 were 15 million, 12 million and 31 million, respectively.
Restricted Stock Award Plans
Under the amended 1989 Restricted Stock Award Plan and the amended 1983 Restricted Stock Award Plan (the "Restricted Stock Award Plans"), 40 million and 24 million shares of restricted common stock, respectively, were originally available to be granted to certain officers and key employees of our Company. As of December 31, 2009, approximately 25 million shares remain available for grant under the Restricted Stock Award Plans, when all outstanding awards including promises to grant restricted stock and performance share units at the target level are included. The Company that may ariseissues restricted stock to employees as a result of currently pending tax matters will not have a material adverse effectperformance share unit awards, time-based awards and performance-based awards.
For awards prior to January 1, 2008, under the 1983 Restricted Stock Award Plan, participants are reimbursed by our Company for income taxes imposed on the financial conditionaward, but not for taxes generated by the reimbursement payment. The Company has not granted awards from the 1983 Restricted Stock Plan since 1993. The 1983 Restricted Stock Plan has been amended to eliminate this tax reimbursement for awards after January 1, 2008. The shares are subject to certain transfer restrictions and may be forfeited if a participant leaves our Company for reasons other than retirement, disability or death, absent a change in control of our Company.
Performance Share Unit Awards
In 2003, the Company established a program to grant performance share units under the 1989 Restricted Stock Award Plan to executives. In 2008, the Company expanded the program to award a mix of stock options and performance
share units to eligible employees in addition to executives. The number of shares earned is determined at the end of each performance period, generally three years, based on the actual performance criteria predetermined by the Board of Directors at the time of grant. If the performance criteria are met, the award results in a grant of restricted stock or promises to grant restricted stock, which are then generally subject to a holding period in order for the restricted stock to be released. For performance share units granted before 2008, this holding period is generally two years. For performance share units granted in 2008 and beyond, this holding period is generally one year. Restrictions on such stock generally lapse at the end of the holding period. Performance share units generally do not pay dividends or allow voting rights during the performance period. Participants generally only receive dividends or dividend equivalents once the performance criteria have been certified and the restricted stock or promises to grant restricted stock have been issued. Accordingly, the fair value of these units is the quoted market value of the Company taken as a whole.
NOTE 14: NET CHANGE IN OPERATING ASSETS AND LIABILITIES
Net cash provided by (used in) operating activities attributablestock on the grant date less the present value of the expected dividends not received during the performance period. In the period it becomes probable that the performance criteria specified in the plan will be achieved, we recognize expense for the proportionate share of the total fair value of the performance share units related to the net change in operating assets and liabilities is composedvesting period that has already lapsed. The remaining cost of the grant is expensed on a straight-line basis over the balance of the vesting period.
Performance share units require achievement of certain financial measures, primarily compound annual growth in earnings per share or economic profit. These financial measures are adjusted for certain items approved and certified by the Audit Committee of the Board of Directors. The purpose of these adjustments is to ensure a consistent year to year comparison of the specific performance criteria. Economic profit is our net operating profit after tax less the cost of the capital used in our business. In the event that the financial result equals the predefined target, the Company will grant the number of restricted shares equal to the Target Award in the underlying performance share unit agreements. In the event the financial result exceeds the predefined target, additional shares up to the Maximum Award may be granted. In the event the financial result falls below the predefined target, a reduced number of shares may be granted. If the financial result falls below the Threshold Award performance level, no shares will be granted. Performance share units are generally settled in stock, except for certain circumstances such as death or disability, where former employees or their beneficiaries are provided a cash equivalent payment. As of December 31, 2009, performance share units of 802,473 and 2,530,338 were granted and outstanding for the 2007-2009 and 2008-2010 performance periods, respectively. Also, outstanding as of December 31, 2009, are 65,800 performance share units granted in 2007 with certain financial measures of a business unit of the Company as the performance criteria. In addition, 72,000 performance share units, with predefined qualitative performance criteria and release criteria that differ from the program described above, were granted in 2004 and were outstanding as of December 31, 2009. The following (in millions):table summarizes information about performance share units based on the Target Award amounts in the performance share unit agreements:
| Year Ended December 31, | 2006 | 2005 | 2004 | ||||
| (Increase) in trade accounts receivable | $ (214 | ) | $ (79 | ) | $ (5 | ) | |
| (Increase) in inventories | (150 | ) | (79 | ) | (57 | ) | |
| (Increase) decrease in prepaid expenses and other assets | (152 | ) | 244 | (397 | ) | ||
| Increase in accounts payable and accrued expenses | 173 | 280 | 45 | ||||
| (Decrease) increase in accrued taxes | (68 | ) | 145 | (194 | ) | ||
| (Decrease) in other liabilities | (204 | ) | (81 | ) | (9 | ) | |
| $ (615 | ) | $ 430 | $ (617 | ) | |||
| Share Units (In thousands | ) | Weighted-Average Grant-Date Fair Value | ||
Outstanding on January 1, 2009 | 4,534 | $ 48.59 | ||
Granted | — | — | ||
Conversions: | ||||
Restricted stock1,2 | (625 | ) | 39.26 | |
Promises to grant2,3 | (212 | ) | 37.32 | |
Paid in cash equivalent | (21 | ) | 40.72 | |
Canceled/forfeited | (205 | ) | 52.29 | |
Outstanding on December 31, 20094 | 3,471 | $ 50.78 | ||
1 Represents performance share units converted to restricted stock based on the certification of financial results for the 2006-2008 performance period and for certain executives prior to retirement. The vesting of this restricted stock is subject to terms of the performance share unit agreements. | ||||
2 The performance share unit conversions during 2009 are presented at the Target Award. An additional 238,400 restricted shares and 105,700 of promises to grant restricted shares were awarded during 2009 based on the certified financial results of the 2006-2008 performance period. | ||||
3 Represents performance share units converted to promises to grant restricted stock for executives based on the certification of financial results for the 2006-2008 performance period. These awards are similar to restricted stock, including payment of dividend equivalents, but were granted in this manner because the executives were based outside the United States. The vesting of promises to grant restricted stock is subject to terms of the performance share unit agreements. | ||||
4 The outstanding performance share units as of December 31, 2009, at the Threshold Award and Maximum Award levels were 1.8 million and 5.3 million, respectively. | ||||
The Company converted performance share units of 20,958 in 2009, 56,642 in 2008 and 23,790 in 2007 to cash equivalent payments of approximately $1.1 million, $3.3 million and $1.2 million, respectively, to former executives who were ineligible for restricted stock grants due to certain events such as death, disability or termination.
The following table summarizes information about the conversions of performance share units to restricted stock and promises to grant restricted stock:
| Share Units (In thousands | ) | Weighted-Average Grant-Date Fair Value | 1 | ||
Nonvested on January 1, 2009 | 710 | $ 38.38 | |||
Granted | 625 | 39.26 | |||
Promises to grant2 | 212 | 37.32 | |||
Vested and released | (862 | ) | 38.08 | ||
Canceled/forfeited | (7 | ) | 37.81 | ||
Nonvested on December 31, 20093 | 678 | $ 39.25 | |||
1 The weighted-average grant-date fair value is based on the fair values of the performance share units grant fair values. | ||||
2 These awards are similar to restricted stock, including the payment of dividend equivalents, but were granted in this manner because the employees were based outside the United States. | ||||
3 The nonvested shares as of December 31, 2009, are presented at the performance share units Target Award. An additional 256,099 restricted shares and promises to grant restricted stock were outstanding and nonvested as of December 31, 2009. | ||||
The total intrinsic value of restricted shares that were vested and released during the years ended December 31, 2009, 2008 and 2007 was $65.9 million, $22.9 million and $2.9 million, respectively. The total restricted share units vested and released during the years ended December 31, 2009, 2008 and 2007 were 861,776, 437,871 and 59,515, respectively.
Time-Based and Performance-Based Restricted Stock Awards
In 2001, shareowners approved an amendment to the 1989 Restricted Stock Award Plan to allow for the grant of performance-based awards. These awards are released only upon the achievement of specific measurable performance criteria. These awards pay dividends during the performance period. The majority of awards have specific performance targets for achievement. If the performance targets are not met, the awards will be canceled. In the period it becomes probable that the performance criteria will be achieved, we recognize expense for the proportionate share of the total fair value of the grant related to the vesting period that has already lapsed. The remaining cost of the grant is expensed on a straight-line basis over the balance of the vesting period.
For time-based and performance-based restricted stock awards, participants are entitled to vote and receive dividends on the restricted shares. The Company also awards promises to grant time-based and performance-based restricted stock for which participants receive payments of dividend equivalents but are not entitled to vote. As of December 31, 2009, the Company had nonvested time-based and performance-based restricted stock awards, including promises to grant, of 286,327 and 279,300, respectively. Time-based and performance-based restricted awards are not significant to our consolidated financial statements.
NOTE 15: STOCK COMPENSATION PLANS
Effective January 1, 2006, the Company adopted SFAS No. 123(R). Our Company adopted SFAS No. 123(R), using the modified prospective method. Based on the terms of our plans, our Company did not have a cumulative effect related to its plans. The adoption of SFAS No. 123(R) did not have a material impact on our stock-based compensation expense for the year ended December 31, 2006. Further, we believe the adoption of SFAS No. 123(R) will not have a material impact on our Company's future stock-based compensation expense. Prior to 2006, our Company accounted for stock option plans and restricted stock plans under the preferable fair value recognition provisions of SFAS No. 123.
Our total stock-based compensation expense was approximately $324 million, $324 million and $345 million in 2006, 2005 and 2004, respectively. These amounts were recorded in selling, general and administrative expenses in 2006, 2005 and 2004, respectively. The total income tax benefit recognized in the income statement for share-based compensation arrangements was approximately $93 million, $90 million and $92 million for 2006, 2005 and 2004, respectively. As of December 31, 2006, we had approximately $376 million of total
unrecognized compensation cost related to nonvested share-based compensation arrangements granted under our plans. This cost is expected to be recognized as stock-based compensation expense over a weighted-average period of 1.7 years. This expected cost does not include the impact of any future stock-based compensation awards. Additionally, our equity method investees also adopted SFAS No. 123(R) effective January 1, 2006. Our proportionate share of the stock-based compensation expense resulting from the adoption of SFAS No. 123(R) by our equity method investees is recognized as a reduction to equity income. The adoption of SFAS No. 123(R) by our equity method investees did not have a material impact on our consolidated financial statements.
During 2005, the Company changed its estimated service period for retirement-eligible participants in its plans when the terms of their stock-based compensation awards provide for accelerated vesting upon early retirement. The full-year impact of this change in our estimated service period was approximately $50 million for 2005.
Stock Option Plans
Under our 1991 Stock Option Plan (the "1991 Option Plan"), a maximum of 120 million shares of our common stock was approved to be issued or transferred to certain officers and employees pursuant to stock options granted under the 1991 Option Plan. Options to purchase common stock under the 1991 Option Plan have been granted to Company employees at fair market value at the date of grant.
The 1999 Stock Option Plan (the "1999 Option Plan") was approved by shareowners in April 1999. Following the approval of the 1999 Option Plan, no grants were made from the 1991 Option Plan, and shares available under the 1991 Option Plan were no longer available to be granted. Under the 1999 Option Plan, a maximum of 120 million shares of our common stock was approved to be issued or transferred to certain officers and employees pursuant to stock options granted under the 1999 Option Plan. Options to purchase common stock under the 1999 Option Plan have been granted to Company employees at fair market value at the date of grant.
The 2002 Stock Option Plan (the "2002 Option Plan") was approved by shareowners in April 2002. An amendment to the 2002 Option Plan which permitted the issuance of stock appreciation rights was approved by shareowners in April 2003. Under the 2002 Option Plan, a maximum of 120 million shares of our common stock was approved to be issued or transferred to certain officers and employees pursuant to stock options and stock appreciation rights granted under the 2002 Option Plan. The stock appreciation rights permit the holder, upon surrendering all or part of the related stock option, to receive common stock in an amount up to 100 percent of the difference between the market price and the option price. No stock appreciation rights have been issued under the 2002 Option Plan as of December 31, 2006. Options to purchase common stock under the 2002 Option Plan have been granted to Company employees at fair market value at the date of grant.
Stock options granted in December 2003 and thereafter generally become exercisable over a four-year annual vesting period and expire 10 years from the date of grant. Stock options granted from 1999 through July 2003 generally become exercisable over a four-year annual vesting period and expire 15 years from the date of grant. Prior to 1999, stock options generally became exercisable over a three-year vesting period and expired 10 years from the date of grant.
The fair value of each option award is estimated on the date of the grant using a Black-Scholes-Merton option-pricing model that uses the assumptions noted in the following table. The expected term of the options granted represents the period of time that options granted are expected to be outstanding and is derived by
analyzing historic exercise behavior. Expected volatilities are based on implied volatilities from traded options on the Company's stock, historical volatility of the Company's stock, and other factors. The risk-free interest rate for the period matching the expected term of the option is based on the U.S. Treasury yield curve in effect at the time of the grant. The dividend yield is the calculated yield on the Company's stock at the time of the grant.
The following table sets forth information about the weighted-average fair value of options granted during the past three years and the weighted-average assumptions used for such grants:
| 2006 | 2005 | 2004 | |||||
| Fair value of options at grant date | $ 8.16 | $ 8.23 | $ 8.84 | ||||
| Dividend yields | 2.7 | % | 2.6 | % | 2.5 | % | |
| Expected volatility | 19.3 | % | 19.9 | % | 23.0 | % | |
| Risk-free interest rates | 4.5 | % | 4.3 | % | 3.8 | % | |
| Expected term of the option | 6 years | 6 years | 6 years | ||||
A summary of stock option activity under all plans for the years ended December 31, 2006, 2005 and 2004, is as follows:
| Shares (In millions | ) | Weighted-Average Exercise Price | Weighted-Average Remaining Contractual Life | Aggregate Intrinsic Value (In millions | ) | ||||
| 2006 | |||||||||
| Outstanding on January 1, 2006 | 203 | $ 48.50 | |||||||
| Granted1 | 2 | 41.65 | |||||||
| Exercised | (4 | ) | 44.53 | ||||||
| Forfeited/expired2 | (15 | ) | 48.30 | ||||||
| Outstanding on December 31, 2006 | 186 | $ 48.52 | 8.1 years | $ 502 | |||||
| Expected to vest at December 31, 2006 | 182 | $ 48.65 | 8.1 years | $ 478 | |||||
| Exercisable on December 31, 2006 | 141 | $ 50.50 | 8.0 years | $ 227 | |||||
| Shares available on December 31, 2006 for options that may be granted | 64 | ||||||||
Shares (In millions | ) | Weighted-Average Exercise Price | Weighted-Average Remaining Contractual Term | Aggregate Intrinsic Value (In millions | ) | ||||
| 2005 | |||||||||
| Outstanding on January 1, 2005 | 183 | $ 49.41 | |||||||
| Granted1 | 34 | 41.26 | |||||||
| Exercised | (7 | ) | 35.63 | ||||||
| Forfeited/expired2 | (7 | ) | 49.11 | ||||||
| Outstanding on December 31, 2005 | 203 | $ 48.50 | 8.8 years | $ 0 | |||||
| Exercisable on December 31, 2005 | 131 | $ 51.61 | 8.4 years | $ 0 | |||||
| Shares available on December 31, 2005 for options that may be granted | 58 | ||||||||
Shares (In millions | ) | Weighted-Average Exercise Price | Weighted-Average Remaining Contractual Term | Aggregate Intrinsic Value (In millions | ) | ||||
| 2004 | |||||||||
| Outstanding on January 1, 2004 | 167 | $ 50.56 | |||||||
| Granted1 | 31 | 41.63 | |||||||
| Exercised | (5 | ) | 35.54 | ||||||
| Forfeited/expired2 | (10 | ) | 51.64 | ||||||
| Outstanding on December 31, 2004 | 183 | $ 49.41 | 9.3 years | $ 51 | |||||
| Exercisable on December 31, 2004 | 116 | $ 52.02 | 8.7 years | $ 39 | |||||
| Shares available on December 31, 2004 for options that may be granted | 85 | ||||||||
The total intrinsic value of the options exercised during the years ended December 31, 2006, 2005 and 2004, was $11 million, $49 million and $67 million, respectively.
Restricted Stock Award Plans
Under the amended 1989 Restricted Stock Award Plan and the amended 1983 Restricted Stock Award Plan (the "Restricted Stock Award Plans"), 40 million and 24 million shares of restricted common stock, respectively, were originally available to be granted to certain officers and key employees of our Company.
On December 31, 2006, approximately 31 million shares remain available for grant under the Restricted Stock Award Plans. Participants are entitled to vote and receive dividends on the shares and, under the 1983 Restricted Stock Award Plan, participants are reimbursed by our Company for income taxes imposed on the award, but not for taxes generated by the reimbursement payment. The shares are subject to certain transfer restrictions and may be forfeited if a participant leaves our Company for reasons other than retirement, disability or death, absent a change in control of our Company.
The following awards were outstanding and nonvested as of December 31, 2006:
Time-Based Restricted Stock Awards
The following table summarizes information about time-based restricted stock awards:
| 2006 | 2005 | 2004 | ||||||||||
| Shares | Weighted- Average Grant-Date Fair Value | Shares | Weighted- Average Grant-Date Fair Value | Shares | Weighted- Average Grant-Date Fair Value | |||||||
| Nonvested on January 1 | 422,700 | $ 36.31 | 513,700 | $ 39.97 | 1,224,900 | $ 45.20 | ||||||
| Granted1 | — | — | 9,000 | 41.80 | 140,000 | 48.97 | ||||||
| Vested and released2 | (30,000 | ) | 58.48 | (100,000 | ) | 55.62 | (296,800 | ) | 36.68 | |||
| Cancelled/Forfeited | (10,000 | ) | 21.91 | — | — | (554,400 | ) | 55.57 | ||||
| Nonvested on December 31 | 382,700 | 1 | $ 34.95 | 422,700 | 1 | $ 36.31 | 513,700 | $ 39.97 | ||||
In the third quarter of 2004, in connection with Douglas N. Daft's retirement, the Compensation Committee of the Board of Directors released to Mr. Daft 200,000 shares of restricted stock previously granted to him during the period from April 1992 to October 1998. The weighted average grant-date fair value was $32.26 per share and the total fair value of shares released was approximately $8.3 million. The terms of these grants provided that the restricted shares be released upon retirement after age 62 but not earlier than five years from the date of grant. The Compensation Committee determined to release the shares in recognition of Mr. Daft's 27 years of service to the Company and the fact that he would turn 62 in March 2005. Mr. Daft forfeited 500,000 shares of restricted stock granted to him in November 2000, since as of the date of his retirement, he had not held these shares for five years from the date of grant. In addition, Mr. Daft forfeited 1,000,000 shares of performance-based restricted stock, since Mr. Daft retired prior to the completion of the performance period.
Performance-Based Restricted Stock Awards
In 2001, shareowners approved an amendment to the 1989 Restricted Stock Award Plan to allow for the grant of performance-based awards. These awards are released only upon the achievement of specific measurable performance criteria. These awards pay dividends during the performance period. The majority of awards have specific earnings per share targets for achievement. If the earnings per share targets are not met, the awards will be cancelled.
The following table summarizes information about performance-based restricted stock awards:
| 2006 | 2005 | 2004 | ||||||||||
| Shares | Weighted- Average Grant-Date Fair Value | Shares | Weighted- Average Grant-Date Fair Value | Shares | Weighted- Average Grant-Date Fair Value | |||||||
| Nonvested on January 1 | 713,000 | $ 47.37 | 713,000 | $ 47.75 | 2,507,720 | $ 47.93 | ||||||
| Granted | 224,000 | 43.66 | 50,000 | 42.40 | — | — | ||||||
| PSU conversion1 | 123,852 | 42.07 | — | — | — | — | ||||||
| Vested and released2 | (50,000 | ) | 56.25 | — | — | (110,000 | ) | 50.54 | ||||
| Cancelled/Forfeited | (594,000 | ) | 47.18 | (50,000 | ) | 47.88 | (1,684,720 | ) | 47.84 | |||
| Nonvested on December 31 | 416,852 | $ 43.00 | 713,000 | $ 47.37 | 713,000 | $ 47.75 | ||||||
Performance Share Unit Awards
In 2003, the Company modified its use of performance-based awards and established a program to grant performance share unit awards under the 1989 Restricted Stock Award Plan to executives. The number of performance share units earned shall be determined at the end of each performance period, generally three years, based on performance criteria determined by the Board of Directors and may result in an award of restricted stock for U.S. participants and certain international participants at that time. The restricted stock may be granted to other international participants shortly before the fifth anniversary of the original award. Restrictions on such stock generally lapse on the fifth anniversary of the original award date. Generally, performance share unit awards are subject to the performance criteria of compound annual growth in earnings per share over the performance period, as adjusted for certain items approved by the Compensation Committee of the Board of Directors ("adjusted EPS"). The purpose of these adjustments is to ensure a consistent year to year comparison of the specified performance criteria. Performance share units do not pay dividends during the performance period. Accordingly, the fair value of these units is the quoted market value of the Company stock on the date of the grant less the present value of the expected dividends not received during the performance period.
Performance share unit Target Awards for the 2004-2006, 2005-2007 and 2006-2008 performance periods require adjusted EPS growth in line with our Company's internal projections over the performance periods. In the event adjusted EPS exceeds the target projection, additional shares up to the Maximum Award may be granted. In the event adjusted EPS falls below the target projection, a reduced number of shares as few as the Threshold Award may be granted. If adjusted EPS falls below the Threshold Award performance level, no shares will be granted. Performance share unit awards provide for cash equivalent payments to former executives who become ineligible for restricted stock grants due to certain events such as death, disability or termination.
Of the outstanding granted performance share unit awards as of December 31, 2006, 590,964; 787,576; and 820,700 awards are for the 2004-2006, 2005-2007 and 2006-2008 performance periods, respectively. In addition, 72,000 performance share unit awards, with predefined qualitative performance criteria and release criteria that differ from the program described above, were granted in 2004 and were outstanding as of December 31, 2006.
The following table summarizes information about performance share unit awards:
| 2006 | 2005 | 2004 | ||||||||||
| Share Units | Weighted- Average Grant-Date Fair Value | Share Units | Weighted- Average Grant-Date Fair Value | Share Units | Weighted- Average Grant-Date Fair Value | |||||||
| Outstanding on January 1 | 2,356,728 | $ 40.42 | 1,583,447 | $ 41.83 | 798,931 | $ 46.78 | ||||||
| Granted | 160,000 | 37.84 | 835,440 | 37.71 | 953,196 | 38.71 | ||||||
| Converted to restricted stock1 | (123,852 | ) | 42.07 | — | — | — | — | |||||
| Paid in cash equivalent2 | (7,178 | ) | 41.87 | — | — | — | — | |||||
| Cancelled/Forfeited | (114,458 | ) | 43.45 | (62,159 | ) | 40.06 | (168,680 | ) | 47.62 | |||
| Outstanding on December 31 | 2,271,240 | $ 39.99 | 2,356,728 | $ 40.42 | 1,583,447 | $ 41.83 | ||||||
Number of Performance Share Units Outstanding | ||||||
| December 31, | 2006 | 2005 | 2004 | |||
| Threshold Award | 1,297,632 | 1,352,388 | 950,837 | |||
| Target Award | 2,271,240 | 2,356,728 | 1,583,447 | |||
| Maximum Award | 3,370,860 | 3,499,092 | 2,339,171 | |||
The Company recognizes compensation expense when it becomes probable that the performance criteria specified in the plan will be achieved. The compensation expense is recognized over the remaining performance period and is recorded in selling, general and administrative expenses.
NOTE 16:10: PENSION AND OTHER POSTRETIREMENT BENEFIT PLANS
Our Company sponsors and/or contributes to pension and postretirement health care and life insurance benefit plans covering substantially all U.S. employees. We also sponsor nonqualified, unfunded defined benefit pension plans for certain associates. In addition, our Company and its subsidiaries have various pension plans and other forms of postretirement arrangements outside the United States. We use a measurement date of December 31 for substantially all of our pension and postretirement benefit plans.
Effective December 31, 2006, the Company adopted SFAS No. 158, which required the recognition in pension obligations and AOCI of actuarial gains or losses, prior service costs or credits and transition assets or obligations that had previously been deferred under the reporting requirements of SFAS No. 87, SFAS No. 106 and SFAS No. 132(R). The following table reflects the effects of the adoption of SFAS No. 158 on our consolidated balance sheet as of December 31, 2006. SFAS No. 158 also impacted the reporting of equity method investees as described in Note 3.
| December 31, 2006 (in millions) | Before Application of SFAS No. 158 | Adjustments | After Application of SFAS No. 158 | ||||
| Equity method investments | $ 6,460 | $ (150 | ) | $ 6,310 | |||
| Other assets | 2,776 | (75 | ) | 2,701 | |||
| Other intangible assets | 1,699 | (12 | ) | 1,687 | |||
| Total assets | 30,200 | (237 | ) | 29,963 | |||
| Other liabilities | 2,039 | 192 | 2,231 | ||||
| Deferred income taxes | 749 | (141 | ) | 608 | |||
| Total liabilities | 12,992 | 51 | 13,043 | ||||
| Accumulated other comprehensive income | (1,003 | ) | (288 | ) | (1,291 | ) | |
| Total shareowners' equity | 17,208 | (288 | ) | 16,920 | |||
| Total liabilities and shareowners' equity | 30,200 | (237 | ) | 29,963 | |||
Amounts recognized in AOCI consist of the following (in millions, pretax):
| Pension Benefits | Other Benefits | ||||
| December 31, | 2006 | 2006 | |||
| Net actuarial loss (gain) | $ 267 | $ 97 | |||
| Prior service cost (credit) | 37 | (5 | ) | ||
| $ 304 | $ 92 | ||||
Amounts in AOCI expected to be recognized as components of net periodic pension cost in 2007 are as follows (in millions, pretax):
| Pension Benefits | Other Benefits | |||
| 2007 | 2007 | |||
| Net actuarial loss (gain) | $ 20 | $ 1 | ||
| Prior service cost (credit) | 6 | — | ||
| $ 26 | $ 1 | |||
Certain amounts in the prior years' disclosure have been reclassified to conform to the current year presentation.
Obligations and Funded Status
The following table sets forth the changechanges in benefit obligations for our benefit plans (in millions):
| Pension Benefits | Other Benefits | ||||||||
| December 31, | 2006 | 2005 | 2006 | 2005 | |||||
| Benefit obligation at beginning of year1 | $ 2,806 | $ 2,592 | $ 787 | $ 801 | |||||
| Service cost | 104 | 88 | 31 | 28 | |||||
| Interest cost | 158 | 146 | 46 | 43 | |||||
| Foreign currency exchange rate changes | 53 | (56 | ) | (1 | ) | — | |||
| Amendments | 4 | 2 | — | — | |||||
| Actuarial (gain) loss | (41 | ) | 186 | (25 | ) | (63 | ) | ||
| Benefits paid2 | (127 | ) | (123 | ) | (23 | ) | (25 | ) | |
| Business combinations | 95 | — | 10 | — | |||||
| Settlements | (10 | ) | (28 | ) | — | — | |||
| Curtailments | — | (7 | ) | — | — | ||||
| Other | 3 | 6 | 3 | 3 | |||||
| Benefit obligation at end of year1 | $ 3,045 | $ 2,806 | $ 828 | $ 787 | |||||
The accumulated benefit obligation for our pension plans was $2,648 million and $2,428 million at December 31, 2006 and 2005, respectively.
For pension plans with projected benefit obligations in excess of plan assets, the total projected benefit obligation and fair value of plan assets were $1,339 million and $642 million, respectively, as of December 31, 2006, and $1,156 million and $470 million, respectively, as of December 31, 2005. For pension plans with accumulated benefit obligations in excess of plan assets, the total accumulated benefit obligation and fair value of plan assets were $852 million and $278 million, respectively, as of December 31, 2006, and $875 million and $331 million, respectively, as of December 31, 2005.
The following table sets forth the change in the fair value of plan assets for our benefit plans (in millions):
| Pension Benefits | Other Benefits | |||||||
| December 31, | 2006 | 2005 | 2006 | 2005 | ||||
| Fair value of plan assets at beginning of year1 | $ 2,406 | $ 2,166 | $ 19 | $ 10 | ||||
| Actual return on plan assets | 339 | 213 | 5 | 1 | ||||
| Employer contributions | 94 | 161 | 224 | 8 | ||||
| Foreign currency exchange rate changes | 36 | (35 | ) | — | — | |||
| Benefits paid | (96 | ) | (95 | ) | — | — | ||
| Business combinations | 68 | — | — | — | ||||
| Other | (4 | ) | (4 | ) | — | — | ||
| Fair value of plan assets at end of year1 | $ 2,843 | $ 2,406 | $ 248 | $ 19 | ||||
The pension and other benefit amounts recognized in our consolidated balance sheets are as follows (in millions):
| Pension Benefits | Other Benefits | ||||||||
| December 31, | 2006 | 1 | 2005 | 2006 | 1 | 2005 | |||
| Funded status — plan assets less than benefit obligations | $ (202 | ) | $ (400 | ) | $ (580 | ) | $ (768 | ) | |
| Unrecognized net actuarial loss | — | 512 | — | 123 | |||||
| Unrecognized prior service cost (credit) | — | 39 | — | (6 | ) | ||||
| Fourth quarter contribution | 3 | — | — | — | |||||
| Net prepaid asset (liability) recognized | $ (199 | ) | $ 151 | $ (580 | ) | $ (651 | ) | ||
| Prepaid benefit cost | $ 494 | $ 581 | $ — | $ — | |||||
| Accrued benefit liability | (693 | ) | (570 | ) | (580 | ) | (651 | ) | |
| Intangible asset | — | 12 | — | — | |||||
| Accumulated other comprehensive income | — | 128 | — | — | |||||
| Net prepaid asset (liability) recognized | $ (199 | ) | $ 151 | $ (580 | ) | $ (651 | ) | ||
December 31, | 2009 | 2008 | |||||
Projected benefit obligation | $ 3,718 | $ 3,416 | |||||
Fair value of plan assets | 2,687 | 2,051 | |||||
ComponentsCertain of Net Periodic Benefit Cost
Net periodic benefit cost for our pension and other postretirementplans have accumulated benefit plans consistedobligations in excess of the followingfair value of plan assets. For these plans, the accumulated benefit obligations and the fair value of plan assets were as follows (in millions):
| Pension Benefits | Other Benefits | ||||||||||||
| December 31, | 2006 | 2005 | 2004 | 2006 | 2005 | 2004 | |||||||
| Service cost | $ 104 | $ 88 | $ 82 | $ 31 | $ 28 | $ 27 | |||||||
| Interest cost | 158 | 146 | 136 | 46 | 43 | 44 | |||||||
| Expected return on plan assets | (179 | ) | (154 | ) | (141 | ) | (5 | ) | (1 | ) | — | ||
| Amortization of prior service cost (credit) | 7 | 7 | 8 | — | — | (1 | ) | ||||||
| Recognized net actuarial loss | 46 | 42 | 35 | 3 | 1 | 3 | |||||||
| Net periodic benefit cost1 | $ 136 | $ 129 | $ 120 | $ 75 | $ 71 | $ 73 | |||||||
December 31, | 2009 | 2008 | |||||
Accumulated benefit obligation | $ 3,139 | $ 2,881 | |||||
Fair value of plan assets | 2,418 | 1,885 | |||||
Assumptions
Certain weighted-average assumptions used in computing the benefit obligations are as follows:
| Pension Benefits | Other Benefits | ||||||||
| December 31, | 2006 | 2005 | 2006 | 2005 | |||||
| Discount rate | 53/4 | % | 51/2 | % | 6 | % | 53/4 | % | |
| Rate of increase in compensation levels | 41/4 | % | 41/4 | % | 41/2 | % | 41/2 | % | |
Certain weighted-average assumptions used in computing net periodic benefit cost are as follows:
| Pension Benefits | Other Benefits | ||||||||||||
| Year Ended December 31, | 2006 | 2005 | 2004 | 2006 | 2005 | 2004 | |||||||
| Discount rate | 51/2 | % | 51/2 | % | 6 | % | 53/4 | % | 6 | % | 61/4 | % | |
| Rate of increase in compensation levels | 41/4 | % | 4 | % | 41/4 | % | 41/2 | % | 41/2 | % | 41/2 | % | |
| Expected long-term rate of return on plan assets | 8 | % | 8 | % | 8 | % | 81/2 | % | 81/2 | % | 81/2 | % | |
The assumed health care cost trend rates are as follows:
| December 31, | 2006 | 2005 | |||
| Health care cost trend rate assumed for next year | 9 | % | 9 | % | |
| Rate to which the cost trend rate is assumed to decline (the ultimate trend rate) | 5 | % | 51/4 | % | |
| Year that the rate reaches the ultimate trend rate | 2011 | 2010 | |||
Assumed health care cost trend rates have a significant effect on the amounts reported for the postretirement health care plans. A one percentage point change in the assumed health care cost trend rate would have the following effects (in millions):
| One Percentage Point Increase | One Percentage Point Decrease | ||||
| Effect on accumulated postretirement benefit obligation as of December 31, 2006 | $ 117 | $ (95 | ) | ||
| Effect on total of service cost and interest cost in 2006 | $ 15 | $ (12 | ) | ||
The discount rate assumptions used to account for pension and other postretirement benefit plans reflect the rates at which the benefit obligations could be effectively settled. These rates were determined using a cash flow matching technique whereby a hypothetical portfolio of high quality debt securities was constructed that mirrors the specific benefit obligations for each of our primary U.S. plans. The rate of compensation increase assumption is determined by the Company based upon annual reviews. We review external data and our own historical trends for health care costs to determine the health care cost trend rate assumptions.
Pension Plan Assets
Pension Benefit Plans
The following table sets forth the actual asset allocation and weighted-average target asset allocationpresents total pension assets for our U.S. and non-U.S. pension plan assets:plans (in millions):
| December 31, | 2006 | 2005 | Target Asset Allocation | ||||
| Equity securities1 | 62 | % | 63 | % | 61 | % | |
| Debt securities | 27 | 24 | 29 | ||||
| Real estate and other2 | 11 | 13 | 10 | ||||
| Total | 100 | % | 100 | % | 100 | % | |
| U.S. Plans | Non-U.S. Plans | ||||||||||||
December 31, | 2009 | 2008 | 2009 | 2008 | |||||||||
Cash and cash equivalents | $ 169 | $ 70 | $ 41 | $ 28 | |||||||||
Equity securities: | |||||||||||||
U.S.-based companies | 744 | 561 | — | 1 | |||||||||
International-based companies | 154 | 111 | 11 | 8 | |||||||||
Fixed income securities: | |||||||||||||
Government bonds | 61 | 53 | 164 | 115 | |||||||||
Corporate bonds and debt securities | 339 | 266 | 16 | 7 | |||||||||
Mutual, pooled and commingled funds1 | 256 | 175 | 736 | 544 | |||||||||
Hedge funds/limited partnerships | 80 | 58 | — | — | |||||||||
Real estate | 107 | 157 | 46 | 41 | |||||||||
Other | 65 | 49 | 43 | 46 | |||||||||
Total pension plan assets2 | $ 1,975 | $ 1,500 | $ 1,057 | $ 790 | |||||||||
1 Mutual, pooled and commingled funds include investments in equity securities, fixed income securities and combinations of both. There are a significant number of mutual and pooled funds from which investors can choose. The selection of the type of fund is dictated by the specific investment objectives and needs of a given plan. These objectives and needs vary greatly between plans. | |||||||||||||
2 Fair value disclosures related to our pension assets are included in Note 13. Fair value disclosures include, but are not limited to, the level within the fair value hierarchy on which the fair value measurements in their entirety fall, a reconciliation of | |||||||||||||
U.S. Pension Plan Investment objectivesStrategy
The Company utilizes the services of investment managers to actively manage the pension assets of our primary U.S. plan. We have established asset allocation targets and investment guidelines with each investment manager. Our asset allocation targets promote optimal expected return and volatility characteristics given the long-term time horizon for fulfilling the Company'sobligations of the plan. Selection of the targeted asset allocation for U.S. pension plan assets which comprise 75was based upon a review of the expected return and risk characteristics of each asset class, as well as the correlation of returns among asset classes. Our target allocation is a mix of approximately 60 percent of total pension plan assets as of December 31, 2006, are to:equity investments, 30 percent fixed income investments and 10 percent in alternative investments. Furthermore, we believe that our target allocation will enable us to achieve the following long-term investment objectives:
Asset allocation targets promote optimal expected return and volatility characteristics given the long-term time horizon for fulfilling the obligations of the pension plans. Selection of the targeted asset allocation for U.S. plan assets was based upon a review of the expected return and risk characteristics of each asset class, as well as the correlation of returns among asset classes.
InvestmentThe guidelines arethat have been established with each investment manager. These guidelinesmanager provide the parameters within which the investment managers agree to operate, including criteria that determine eligible and ineligible securities, diversification requirements and credit quality standards, where applicable. Unless exceptions have been approved, investment managers are prohibited from buying or selling commodities, futures or option contracts, as well as from short selling of securities. Furthermore,Additionally, investment managers agree to obtain written approval for deviations from stated investment style or guidelines.
As of December 31, 2006,2009, no investment manager was responsible for more than 10 percent of total U.S. plan assets.
Our target allocation of 60 percent equity investments is composed of approximately 33 percent domestic large-cap securities, 33 percent domestic small-cap securities, 19 percent international securities and 15 percent domestic mid-cap securities. Optimal returns through our investments in domestic large-cap securities are achieved through security selection and sector diversification. Investments in common stock of our Company accounted for approximately 25 percent of our investments in domestic large-cap securities and 5 percent of total plan assets. Our investments in domestic mid-cap and small-cap securities are expected to experience larger swings in their market value on a periodic basis. We select our investments in these asset classes based on capital appreciation potential. Our investments in international securities are intended to provide equity-like returns, while at the same time helping to diversify our overall equity investment portfolio.
Our target allocation of 30 percent fixed income investments is composed of 50 percent long-duration bonds and 50 percent high-yield bonds. Long-duration bonds provide a stable rate of return through investments in high-quality publicly traded debt securities. We diversify our investments in long-duration bonds to mitigate duration and credit exposure. High-yield bonds are investments in lower-rated and non-rated debt securities, which generally produce higher returns compared to long-duration bonds. Investments in high-yield bonds also help diversify our fixed income portfolio.
In addition diversification requirements for each investment manager preventto investments in equity securities and fixed income investments, we have a single security or other investment from exceedingtarget allocation of 10 percent atin alternative investments. These alternative investments include hedge funds, private equity limited partnerships, leveraged buyout funds, international venture capital partnerships and real estate. The objective of investing in hedge funds, private equity limited partnerships, leveraged buyout funds and international venture capital partnerships is to provide a higher rate of return than that available from publicly traded equity securities. This objective is achieved through investing in limited partnerships that require capital for rapidly growing businesses. These investments are inherently illiquid and require a long-term perspective in evaluating investment performance. Investments in real estate have two objectives. First, investments in real estate help diversify our overall portfolio due to the low historical cost,correlation with traditional stocks and fixed income investments. The secondary objective is to provide stable investment returns from income-producing properties.
Non-U.S. Pension Plan Investment Strategy
The majority of our international subsidiaries' pension plan assets are invested in mutual, pooled and commingled funds. As of December 31, 2009, mutual, pooled and commingled funds were composed of approximately 45 percent pooled equity securities, 35 percent pooled fixed income securities and 20 percent mutual and commingled funds. The investment strategies of our international subsidiaries differ greatly, and in some instances are influenced by local law. None of our pension plans outside the United States is individually significant for separate disclosure.
Other Postretirement Benefit Plan Assets
Plan assets associated with other benefits represent funding of the individual manager's portfolio.primary U.S. postretirement benefit plan. In late 2006, we established and contributed $216 million to a U.S. Voluntary Employee Beneficiary Association ("VEBA"), a tax-qualified trust. The VEBA assets remain segregated from the primary U.S. pension master trust and are primarily invested in liquid assets due to the level of expected future benefit payments.
The following table presents total assets for our other postretirement benefit plans (in millions):
December 31, | 2009 | 2008 | ||
Cash and cash equivalents | $ 86 | $ 108 | ||
Equity securities: | ||||
U.S.-based companies | 62 | 47 | ||
International-based companies | 13 | 9 | ||
Fixed income securities: | ||||
Government bonds | 1 | 1 | ||
Corporate bonds and debt securities | 5 | 4 | ||
Mutual, pooled and commingled funds | 2 | 2 | ||
Hedge funds/limited partnerships | 1 | 1 | ||
Real estate | 2 | 2 | ||
Other | 1 | 1 | ||
Total other postretirement benefit plan assets1 | $ 173 | $ 175 | ||
1 Fair value disclosures related to our other postretirement assets are included in Note 13. Fair value disclosures include, but are not limited to, the level within the fair value hierarchy on which the fair value measurements in their entirety fall, a reconciliation of the beginning and ending balances of Level 3 assets and information about the valuation techniques and inputs used to measure the fair value of our pension and other postretirement assets. | ||||
Components of Net Periodic Benefit Cost
Net periodic benefit cost for our pension and other postretirement benefit plans consisted of the following (in millions):
| Pension Benefits | Other Benefits | ||||||||||||||||||
Year Ended December 31, | 2009 | 2008 | 2007 | 2009 | 2008 | 2007 | |||||||||||||
Service cost | $ 113 | $ 114 | $ 123 | $ 21 | $ 20 | $ 40 | |||||||||||||
Interest cost | 213 | 205 | 191 | 29 | 26 | 34 | |||||||||||||
Expected return on plan assets | (214 | ) | (249 | ) | (231 | ) | (8 | ) | (20 | ) | (20 | ) | |||||||
Amortization of prior service cost (credit) | 5 | 10 | 7 | (61 | ) | (61 | ) | (42 | ) | ||||||||||
Amortization of actuarial loss | 86 | 10 | 18 | — | — | 1 | |||||||||||||
Net periodic benefit cost (credit) | 203 | 90 | 108 | (19 | ) | (35 | ) | 13 | |||||||||||
Settlement charge | 5 | 14 | 3 | — | — | — | |||||||||||||
Curtailment charge (credit) | 1 | — | 2 | — | (6 | ) | — | ||||||||||||
Special termination benefits1 | 9 | 11 | — | 4 | — | — | |||||||||||||
Total cost (credit) recognized in the statements of income | $ 218 | $ 115 | $ 113 | $ (15 | ) | $ (41 | ) | $ 13 | |||||||||||
1 The special termination benefits primarily relate to several restructuring plans, including the Company's ongoing productivity initiatives. Refer to Note 15 for additional information related to our restructuring plans and productivity initiatives. | |||||||||||||||||||
The following table sets forth the changes in AOCI for our benefit plans (in millions, pretax):
| Pension Benefits | Other Benefits | ||||||||||||
December 31, | 2009 | 2008 | 2009 | 2008 | |||||||||
Beginning balance in AOCI | $ (1,389 | ) | $ (108 | ) | $ 189 | $ 297 | |||||||
Recognized prior service cost (credit) | 6 | 10 | (61 | ) | (61 | ) | |||||||
Recognized net actuarial loss (gain) | 91 | 24 | — | — | |||||||||
Prior service credit (cost) arising in current year | (1 | ) | 13 | 1 | — | ||||||||
Net actuarial (loss) gain arising in current year | 198 | (1,335 | ) | (11 | ) | (47 | ) | ||||||
Translation gain (loss) | (24 | ) | 7 | — | — | ||||||||
Ending balance in AOCI | $ (1,119 | ) | $ (1,389 | ) | $ 118 | $ 189 | |||||||
The following table sets forth amounts in AOCI for our benefit plans (in millions, pretax):
| Pension Benefits | Other Benefits | ||||||||||||
December 31, | 2009 | 2008 | 2009 | 2008 | |||||||||
Prior service credit (cost) | $ (58 | ) | $ (56 | ) | $ 184 | $ 244 | |||||||
Net actuarial loss | (1,061 | ) | (1,333 | ) | (66 | ) | (55 | ) | |||||
Ending balance in AOCI | $ (1,119 | ) | $ (1,389 | ) | $ 118 | $ 189 | |||||||
Amounts in AOCI expected to be recognized as components of net periodic pension cost in 2010 are as follows (in millions, pretax):
| Pension Benefits | Other Benefits | |||||
Amortization of prior service cost (credit) | $ 6 | $ (61 | ) | |||
Amortization of actuarial loss | 58 | 2 | ||||
| $ 64 | $ (59 | ) | ||||
Assumptions
Certain weighted-average assumptions used in computing the benefit obligations are as follows:
| Pension Benefits | Other Benefits | ||||||||||||
December 31, | 2009 | 2008 | 2009 | 2008 | |||||||||
Discount rate | 53/4 | % | 6 | % | 53/4 | % | 61/4 | % | |||||
Rate of increase in compensation levels | 33/4 | % | 33/4 | % | N/A | N/A | |||||||
Certain weighted-average assumptions used in computing net periodic benefit cost are as follows:
| Pension Benefits | Other Benefits | ||||||||||||||||||
December 31, | 2009 | 2008 | 2007 | 2009 | 2008 | 2007 | |||||||||||||
Discount rate | 6 | % | 6 | % | 51/2 | % | 61/4 | % | 61/4 | % | 6 | % | |||||||
Rate of increase in compensation levels | 33/4 | % | 41/4 | % | 41/4 | % | N/A | N/A | N/A | ||||||||||
Expected long-term rate of return on plan assets | 8 | % | 8 | % | 73/4 | % | 43/4 | % | 81/2 | % | 81/2 | % | |||||||
The expected long-term rate of return assumption for U.S. pension plan assets is based upon the target asset allocation and is determined using forward-looking assumptions in the context of historical returns and volatilities for each asset class, as well as correlations among asset classes. We evaluate the rate of return assumption on an annual basis. The expected long-term rate of return assumption used in computing 20062009 net periodic pension cost for the U.S. plans was 8.5 percent. As of December 31, 2006,2009, the 10-year annualized return on plan assets in the primary U.S. plan assets was 9.03.1 percent, the 15-year annualized return was 11.08.5 percent, and the annualized return since inception was 12.811.0 percent.
Plan assets for our pension plans outside the United States are insignificant on an individual plan basis.
Other Benefit Plans
Plan assets associated with other benefits represent funding of the primary U.S. postretirement benefit plans. In late 2006, we established and contributed $216 million to a U.S. Voluntary Employee Beneficiary Association, a tax-qualified trust. As of December 31, 2006, the majority of these funds were held in short-term investments pending the implementation of long-term asset allocation strategies. While these assets will remain segregated from the primary U.S. pension master trust, the investment objectives, asset allocation targets and investment guidelines will be determined in a methodology similar to that applied to the U.S. pension plans described above.
Cash FlowsThe assumed health care cost trend rates are as follows:
Information about
December 31, | 2009 | 2008 | |||||
Health care cost trend rate assumed for next year | 71/2 | % | 9 | % | |||
Rate to which the cost trend rate is assumed to decline (the ultimate trend rate) | 51/4 | % | 51/4 | % | |||
Year that the rate reaches the ultimate trend rate | 2012 | 2012 | |||||
During 2007, the expected cash flowsCompany amended its U.S. retiree medical plan to limit the Company's exposure to increases in retiree medical costs for ourboth current and future retirees. As a result, the effects of a 1 percentage point change in the assumed health care cost trend rate would not be significant to the Company.
The discount rate assumptions used to account for pension and other postretirement benefit plans reflect the rates at which the benefit obligations could be effectively settled. Rates for each of our U.S. plans at December 31, 2009, were determined using a cash flow matching technique whereby the rates of a yield curve, developed from high-quality debt securities, were applied to the benefit obligations to determine the appropriate discount rate. For our non-U.S. plans, we base the discount rate on comparable indices within each of the non-U.S. countries. The rate of compensation increase assumption is determined by the Company based upon annual reviews. We review external data and our own historical trends for health care costs to determine the health care cost trend rate assumptions.
Cash Flows
Our estimated future benefit payments for funded and unfunded plans are as follows (in millions):
| Pension Benefits | Other Benefits | |||
| Expected employer contributions: | ||||
| 2007 | $ 49 | $ — | ||
| Expected benefit payments1: | ||||
| 2007 | $ 135 | $ 30 | ||
| 2008 | 133 | 33 | ||
| 2009 | 134 | 36 | ||
| 2010 | 145 | 39 | ||
| 2011 | 142 | 42 | ||
| 2012-2016 | 834 | 253 | ||
Year Ended December 31, | 2010 | 2011 | 2012 | 2013 | 2014 | 2015–2019 | |||||||||||||
Pension benefit payments | $ 230 | $ 232 | $ 242 | $ 252 | $ 263 | $ 1,541 | |||||||||||||
Other benefit payments1 | 33 | 35 | 38 | 39 | 40 | 208 | |||||||||||||
Total estimated benefit payments | $ 263 | $ 267 | $ 280 | $ 291 | $ 303 | $ 1,749 | |||||||||||||
1 | The expected benefit payments for our other postretirement benefit plans are net of estimated federal subsidies expected to be received under the Medicare Prescription Drug, Improvement and Modernization Act of 2003. Federal subsidies are estimated to | |||||||||||||||||||
We anticipate making contributions in 2010 of approximately $73 million, primarily to our non-U.S. pension plans.
Defined Contribution Plans
Our Company sponsors a qualified defined contribution planplans covering substantially all U.S. employees. Under thisthe primary plan, we match 100 percent of participants' contributions up to a maximum of 3 percent of compensation.compensation, subject to certain limitations. Company contributionscosts related to the U.S. planplans were approximately $25$27 million, $21$22 million and $18$29 million in 2006, 20052009, 2008 and 2004,2007, respectively. We also sponsor defined contribution plans in certain locations outside the United States. Company contributions tocosts associated with those plans were approximately $18$36 million, $16$20 million and $13$25 million in 2006, 20052009, 2008 and 2004,2007, respectively.
NOTE 17:11: INCOME TAXES
Income before income taxes consisted of the following (in millions):
| Year Ended December 31, | 2006 | 2005 | 2004 | |||
| United States | $ 2,126 | $ 2,268 | $ 2,535 | |||
| International | 4,452 | 4,422 | 3,687 | |||
| $ 6,578 | $ 6,690 | $ 6,222 | ||||
Year Ended December 31, | 2009 | 2008 | 2007 | |||||||
United States | $ 2,691 | $ 519 | 1 | $ 2,544 | ||||||
International | 6,255 | 6,987 | 5,375 | |||||||
| $ 8,946 | $ 7,506 | $ 7,919 | ||||||||
1 The decrease in 2008 was primarily attributable to impairment charges recorded by CCE during 2008, of which our Company's proportionate share was approximately $1.6 billion. | ||||||||||
Income tax expense (benefit) consisted of the following for the years ended December 31, 2006, 20052009, 2008 and 20042007 (in millions):
| United States | State and Local | International | Total | |||||||
| 2006 | ||||||||||
| Current | $ 608 | $ 47 | $ 878 | $ 1,533 | ||||||
| Deferred | (20 | ) | (22 | ) | 7 | (35 | ) | |||
| 2005 | ||||||||||
| Current | $ 873 | $ 188 | $ 845 | $ 1,906 | ||||||
| Deferred | (72 | ) | (25 | ) | 9 | (88 | ) | |||
| 2004 | ||||||||||
| Current | $ 350 | $ 64 | $ 799 | $ 1,213 | ||||||
| Deferred | 209 | 29 | (76 | ) | 162 | |||||
| United States | State and Local | International | Total | ||||||||||
2009 | |||||||||||||
Current | $ 509 | $ 79 | $ 1,099 | $ 1,687 | |||||||||
Deferred | 322 | 18 | 13 | 353 | |||||||||
2008 | |||||||||||||
Current | $ 690 | $ 70 | $ 1,232 | $ 1,992 | |||||||||
Deferred | (320 | ) | (65 | ) | 25 | (360 | ) | ||||||
2007 | |||||||||||||
Current | $ 664 | $ 75 | $ 1,044 | $ 1,783 | |||||||||
Deferred | 98 | (13 | ) | 24 | 109 | ||||||||
We made income tax payments of approximately $1,601$1,534 million, $1,676$1,942 million and $1,500$1,596 million in 2006, 20052009, 2008 and 2004,2007, respectively.
A reconciliation of the statutory U.S. federal tax rate and effective tax rates is as follows:
| Year Ended December 31, | 2006 | 2005 | 2004 | ||||
| Statutory U.S. federal rate | 35.0 | % | 35.0 | % | 35.0 | % | |
| State and local income taxes — net of federal benefit | 0.7 | 1.2 | 1.0 | ||||
| Earnings in jurisdictions taxed at rates different from the statutory U.S. federal rate | (11.4 | )1 | (12.1 | )5 | (9.4 | )9,10 | |
| Equity income or loss | (0.6 | )2 | (2.3 | ) | (3.1 | )11 | |
| Other operating charges | 0.6 | 3 | 0.4 | 6 | (0.9 | )12 | |
| Other — net | (1.5 | )4 | 0.3 | 7 | (0.5 | )13 | |
| Repatriation under the Jobs Creation Act | — | 4.7 | 8 | — | |||
| Effective rates | 22.8 | % | 27.2 | % | 22.1 | % | |
Year Ended December 31, | 2009 | 2008 | 2007 | |||||||
Statutory U.S. federal tax rate | 35.0 | % | 35.0 | % | 35.0 | % | ||||
State and local income taxes — net of federal benefit | 0.7 | 0.8 | 0.6 | |||||||
Earnings in jurisdictions taxed at rates different from the statutory U.S. federal rate | (11.6 | )1 | (14.5 | )6,7,8 | (10.9 | )13,14 | ||||
Equity income or loss | (2.3 | )2 | 0.2 | 9 | (1.3 | )15,16 | ||||
Other operating charges | 0.6 | 3 | 0.7 | 10 | 0.5 | 17 | ||||
Other — net | 0.4 | 4,5 | (0.5 | )11,12 | 0.0 | 18 | ||||
Effective tax rates | 22.8 | % | 21.7 | % | 23.9 | % | ||||
1 | Includes approximately | ||||||||||
2 | Includes approximately | ||||||||||
3 Includes approximately 0.6 percent impact to our effective tax rate related to restructuring charges and asset impairments. Refer to Note 14 and Note 15. | |||||||||||
4 Includes approximately (0.2) percent impact to our effective tax rate related to the sale of all or a portion of certain investments. Refer to Note 14. | |||||||||||
5 Includes approximately 0.1 percent impact to our effective tax rate related to an other-than-temporary impairment of a cost method investment. Refer to Note 13 and Note 14. | |||||||||||
6 Includes approximately $17 million (or 0.2 percent) tax charge related to amounts required to be recorded for changes to our uncertain tax positions, including interest and penalties, in various international jurisdictions. | |||||||||||
7 Includes approximately 0.2 percent impact on our effective tax rate related to impairments of assets and investments in our bottling operations. Refer to Note 14. | |||||||||||
8 Includes approximately $10 million (or 0.1 percent) impact on our effective tax rate related to recording valuation allowances offsetting deferred tax assets booked in prior periods. | |||||||||||
9 Includes approximately 2.7 percent impact to our effective tax rate related to charges recorded by our equity method investments. Refer to Note 3 and Note | |||||||||||
| Includes | ||||||||||
11 Includes approximately $22 million (or 0.3 percent) tax benefit related to amounts required to be recorded for changes to our uncertain tax positions, including interest and penalties, in certain domestic jurisdictions. | |||||||||||
12 Includes approximately (0.2) percent impact to our effective tax rate related to the sale of all or a portion of our investments in certain bottling operations. Refer to Note 3 and Note 14. | |||||||||||
13 Includes approximately $19 million (or 0.2 percent) tax benefit related to a tax rate change in Germany. | |||||||||||
14 Includes approximately $85 million (or 1.1 percent) tax charge related to amounts required to be recorded for changes to our uncertain tax positions, including interest and penalties, in various international jurisdictions. | |||||||||||
15 Includes approximately 0.4 percent impact to our effective tax rate related to charges recorded by our equity method investments. Refer to Note 3 and Note 14. | |||||||||||
16 Includes approximately 0.4 percent impact to our effective tax rate related to the sale of a portion of our investment in Coca-Cola Amatil and the sale of our investment in Vonpar. Refer to Note 3 and Note 14. | |||||||||||
17 Includes approximately 0.5 percent impact to our effective tax rate related to the impairment of assets and investments in our bottling operations | |||||||||||
| Includes approximately | ||||||||||
Our effective tax rate reflects the tax benefits from having significant operations outside the United States that are taxed at rates lower than the statutory U.S. rate of 35 percent. During 9Includes approximately $92 million (or 1.4 percent) tax benefit related to the favorable resolution of certain tax matters in various international jurisdictions.10Includes a tax charge of approximately $75 million (or 1.2 percent) related to the recording of a valuation allowance on various deferred tax assets recorded in Germany.11Includes an approximate $50 million (or 0.8 percent) tax benefit related to the realization of certain foreign tax credits per provisions of the Jobs Creation Act.12Includes a tax benefit of approximately $171 million primarily related to impairment of franchise rights at CCEAG and certain manufacturing investments. Refer to Note 18.13Includes an approximate $36 million (or 0.6 percent) tax benefit related to the favorable resolution of various domestic tax matters.2006,2009, 2008 and 2007, the Company had several subsidiaries that benefited from various tax incentive grants. The terms of these grants range from 2010 to 2018.2031. The Company expects each of the grants to be renewed indefinitely. The grants did not have a material effect on the results of operations for the years ended December 31, 2006, 20052009, 2008 or 2004.2007.
The Company or one of its subsidiaries files income tax returns in the U.S. federal jurisdiction and various state and foreign jurisdictions. U.S. tax authorities have completed their federal income tax examinations for all years prior to 2005.
With respect to state and local jurisdictions and countries outside the United States, with limited exceptions, the Company and its subsidiaries are no longer subject to income tax audits for years before 2001. Although the outcome of tax audits is always uncertain, the Company believes that adequate amounts of tax, including interest and penalties, have been provided for any adjustments that are expected to result from those years.
As of December 31, 2009, the gross amount of unrecognized tax benefits was approximately $354 million. If the Company were to prevail on all uncertain tax positions, the net effect would be a benefit to the Company's effective tax rate of approximately $134 million, exclusive of any benefits related to interest and penalties. The remaining approximately $220 million, which was recorded as a deferred tax asset, primarily represents tax benefits that would be received in different tax jurisdictions in the event that the Company did not prevail on all uncertain tax positions.
A reconciliation of the changes in the gross balance of unrecognized tax benefit amounts is as follows (in millions):
Year Ended December 31, | 2009 | 2008 | 2007 | |||||||
Beginning balance of unrecognized tax benefits | $ 369 | $ 643 | $ 511 | |||||||
Increases related to prior period tax positions | 49 | 52 | 22 | |||||||
Decreases related to prior period tax positions | (28 | ) | (4 | ) | — | |||||
Increases due to current period tax positions | 16 | 47 | 51 | |||||||
Decreases related to settlements with taxing authorities | (27 | ) | (254 | ) | (4 | ) | ||||
Reductions as a result of a lapse of the applicable statute of limitations | (73 | ) | (36 | ) | (1 | ) | ||||
Increases (decreases) from effects of exchange rates | 48 | (79 | ) | 64 | ||||||
Ending balance of unrecognized tax benefits | $ 354 | $ 369 | $ 643 | |||||||
In 2008, agreements were reached between the U.S. government and a foreign government concerning the allocation of income between the two tax jurisdictions. Pursuant to these agreements, we made cash payments during the third quarter of 2008 that constituted payments of tax and interest. These payments were partially offset by tax credits taken in the third quarter and fourth quarter of 2008, and tax refunds and interest on refunds received in 2009. These benefits had been recorded as deferred tax assets in prior periods. As a result of these agreements, these deferred tax assets were reclassified to income tax and interest receivables. These settlements did not have a material impact on the Company's consolidated financial statements.
The Company recognizes accrued interest and penalties related to unrecognized tax benefits in income tax expense. As of December 31, 2009, 2008 and 2007, the Company had approximately $94 million, $110 million and $272 million in interest and penalties related to unrecognized tax benefits accrued, respectively, of which approximately $16 million, $14 million and $82 million of benefit was recognized through income tax expense in the years ended December 31, 2009, 2008 and 2007, respectively. If the Company were to prevail on all uncertain tax positions, the reversal of this accrual would also be a benefit to the Company's effective tax rate.
It is expected that the amount of unrecognized tax benefits will change in the next twelve months; however, we do not expect the change to have a significant impact on our consolidated statement of income or consolidated balance sheet. These changes may be the result of settlement of ongoing audits, statute of limitations expiring, or final settlements in transfer pricing matters that are the subject of litigation. At this time, an estimate of the range of the reasonably possible outcomes cannot be made.
Undistributed earnings of the Company's foreign subsidiaries amounted to approximately $7.7$19 billion atas of December 31, 2006.2009. Those earnings are considered to be indefinitely reinvested and, accordingly, no U.S. federal and state income taxes have been provided thereon. Upon distribution of those earnings in the form of dividends or otherwise, the Company would be subject to both U.S. income taxes (subject to an adjustment for foreign tax credits) and withholding taxes payable to the various foreign countries. Determination of the amount of unrecognized deferred U.S. income tax liability is not practical because of the complexities associated with its hypothetical calculation; however, unrecognized foreign tax credits would be available to reduce a portion of the U.S. tax liability.
As discussed in Note 1, the Jobs Creation Act was enacted in October 2004. One of the provisions provides a one-time benefit related to foreign tax credits generated by equity investments in prior years. The Company recorded an income tax benefit of approximately $50 million as a result of this law change in 2004. The Jobs Creation Act also included a temporary incentive for U.S. multinationals to repatriate foreign earnings at an approximate 5.25 percent effective tax rate. During the first quarter of 2005, the Company decided to repatriate approximately $2.5 billion in previously unremitted foreign earnings. Therefore, the Company recorded a provision for taxes on such previously unremitted foreign earnings of approximately $152 million in the first quarter of 2005. During 2005, the United States Internal Revenue Service and the United States Department of Treasury issued additional guidance related to the Jobs Creation Act. As a result of this guidance, the Company reduced the accrued taxes previously provided on such unremitted earnings by $25 million in the second quarter of 2005. During the fourth quarter of 2005, the Company repatriated an additional $3.6 billion, with an associated tax liability of approximately $188 million. Therefore, the total previously unremitted earnings that were repatriated during the full year of 2005 was $6.1 billion with an associated tax liability of approximately $315 million. This liability was recorded in 2005 as federal and state and local tax expenses in the amount of $301 million and $14 million, respectively.
The tax effects of temporary differences and carryforwards that give rise to deferred tax assets and liabilities consist of the following (in millions):
| December 31, | 2006 | 2005 | ||||
| Deferred tax assets: | ||||||
| Property, plant and equipment | $ 58 | $ 60 | ||||
| Trademarks and other intangible assets | 75 | 64 | ||||
| Equity method investments (including translation adjustment) | 354 | 445 | ||||
| Other liabilities | 190 | 200 | ||||
| Benefit plans | 866 | 649 | ||||
| Net operating/capital loss carryforwards | 593 | 750 | ||||
| Other | 224 | 295 | ||||
| Gross deferred tax assets | 2,360 | 2,463 | ||||
| Valuation allowances | (678 | ) | (786 | ) | ||
| Total deferred tax assets1,2 | $ 1,682 | $ 1,677 | ||||
| Deferred tax liabilities: | ||||||
| Property, plant and equipment | $ (630 | ) | $ (641 | ) | ||
| Trademarks and other intangible assets | (504 | ) | (278 | ) | ||
| Equity method investments (including translation adjustment) | (622 | ) | (674 | ) | ||
| Other liabilities | (82 | ) | (80 | ) | ||
| Other | (200 | ) | (170 | ) | ||
| Total deferred tax liabilities3 | $ (2,038 | ) | $ (1,843 | ) | ||
| Net deferred tax liabilities | $ (356 | ) | $ (166 | ) | ||
December 31, | 2009 | 2008 | |||||
Deferred tax assets: | |||||||
Property, plant and equipment | $ 28 | $ 33 | |||||
Trademarks and other intangible assets | 72 | 79 | |||||
Equity method investments (including translation adjustment) | 396 | 339 | |||||
Other liabilities | 404 | 447 | |||||
Benefit plans | 1,106 | 1,171 | |||||
Net operating/capital loss carryforwards | 629 | 494 | |||||
Other | 241 | 532 | |||||
Gross deferred tax assets | 2,876 | 3,095 | |||||
Valuation allowances | (681 | ) | (569 | ) | |||
Total deferred tax assets1,2 | $ 2,195 | $ 2,526 | |||||
Deferred tax liabilities: | |||||||
Property, plant and equipment | $ (988 | ) | $ (667 | ) | |||
Trademarks and other intangible assets | (1,776 | ) | (1,974 | ) | |||
�� Equity method investments (including translation adjustment) | (462 | ) | (267 | ) | |||
Other liabilities | (66 | ) | (101 | ) | |||
Benefit plans | (55 | ) | (17 | ) | |||
Other | (248 | ) | (212 | ) | |||
Total deferred tax liabilities3 | $ (3,595 | ) | $ (3,238 | ) | |||
Net deferred tax liabilities | $ (1,400 | ) | $ (712 | ) | |||
1 | Noncurrent deferred tax assets of | |||||||
| Current deferred tax assets of | |||||||
| Current deferred tax liabilities of | |||||||
As of December 31, 20062009 and 2005,2008, we had approximately $93$593 million and $454 million, respectively, of net deferred tax liabilities and $116 million of net deferred tax assets, respectively, located in countries outside the United States.
As of December 31, 2006,2009, we had approximately $2,324$3,255 million of loss carryforwards available to reduce future taxable income. Loss carryforwards of approximately $373$329 million must be utilized within the next five years; $91 million must be utilized within the next 10 years;years and the remainder can be utilized over a period greater than 10 years.
An analysis of our deferred tax asset valuation allowances is as follows (in millions):
| Year Ended December 31, | 2006 | 2005 | 2004 | ||||
| Balance, beginning of year | $ 786 | $ 854 | $ 630 | ||||
| Additions | 50 | 43 | 291 | ||||
| Deductions | (158 | ) | (111 | ) | (67 | ) | |
| Balance, end of year | $ 678 | $ 786 | $ 854 | ||||
Year Ended December 31, | 2009 | 2008 | 2007 | |||||||
Balance, beginning of year | $ 569 | $ 611 | $ 678 | |||||||
Additions | 178 | 99 | 201 | |||||||
Deductions | (66 | ) | (141 | ) | (268 | ) | ||||
Balance, end of year | $ 681 | $ 569 | $ 611 | |||||||
The Company's deferred tax asset valuation allowances are primarily the result of uncertainties regarding the future realization of recorded tax benefits on tax loss carryforwards from operations in various jurisdictions. These valuation allowances were primarily related to deferred tax assets generated from net operating losses. Current evidence does not suggest we will realize sufficient taxable income of the appropriate character (e.g., capital gain versus ordinary income) within the carryforward period to allow us to realize these deferred tax benefits. If we were to identify and implement tax planning strategies to recover these deferred tax assets or generate sufficient income of the appropriate character in these jurisdictions in the future, it could lead to the reversal of these valuation allowances and a reduction of income tax expense. The Company believes that it will generate sufficient future taxable income to realize the tax benefits related to the remaining net deferred tax assets in our consolidated balance sheets.
In 2006,2009, the Company recognized a net increase of $112 million in its valuation allowances. This increase was primarily related to asset impairments, increases in net operating losses during the normal course of business operations, and the impact of foreign currency exchange. In addition, the Company also recognized a reduction in the valuation allowances due to the reversal of a deferred tax asset and related valuation allowance on certain equity investments.
In 2008, the Company recognized a net decrease of $42 million in its valuation allowances, primarily related to the utilization of $108 million.capital loss carryforwards used to offset taxable gains on the sale of our investment in Refrigerantes Minas Gerais Ltda. ("Remil"), a bottler in Brazil. In addition, the Company also recognized a decrease in the valuation allowances as a result of asset write-offs, pension adjustments and the impact of foreign currency fluctuations in 2008.
In 2007, the Company recognized a net decrease of $67 million in its valuation allowances. This decrease was primarily related to the reversal of valuation allowances that covered certainon deferred tax assets recorded on capital loss carryforwards. A portion of the capital loss carryforwards was utilized to offset taxable gains on the sale of a portion of the investmentsbasis difference in Coca-Cola Icecek and Coca-Cola FEMSA. In 2005, theequity investments. The Company also recognized a decrease in its valuation allowances of $68 million. This decrease was primarily related to a change in tax rates which resulted in a reduction of certain deferred tax assets and corresponding valuation allowances. allowances related to a change in German tax rates.
NOTE 12: OTHER COMPREHENSIVE INCOME
AOCI attributable to shareowners of The Coca-Cola Company is separately presented on our consolidated balance sheets as a component of The Coca-Cola Company's shareowners' equity, which also includes our proportionate share of equity method investees' AOCI. Other comprehensive income (loss) ("OCI") attributable to noncontrolling interests is allocated to, and included in, our balance sheets as part of the line item equity attributable to noncontrolling interests. AOCI attributable to the shareowners of The Coca-Cola Company consisted of the following (in millions):
December 31, | 2009 | 2008 | |||||
Foreign currency translation adjustment | $ 130 | $ (1,694 | ) | ||||
Accumulated derivative net losses | (78 | ) | (112 | ) | |||
Unrealized net gain on available-for-sale securities | 65 | 117 | |||||
Adjustment to pension and other benefit liabilities | (874 | ) | (985 | ) | |||
Accumulated other comprehensive income (loss) | $ (757 | ) | $ (2,674 | ) | |||
OCI attributable to shareowners of The Coca-Cola Company, including our proportionate share of equity method investees' OCI, for the years ended December 31, 2009, 2008 and 2007, is as follows (in millions):
| Before-Tax Amount | Income Tax | After-Tax Amount | ||||||||
2009 | ||||||||||
Net foreign currency translation adjustment | $ 1,968 | $ (144 | ) | $ 1,824 | ||||||
Net gain (loss) on derivatives1 | 58 | (24 | ) | 34 | ||||||
Net change in unrealized gain on available-for-sale securities2 | (39 | ) | (13 | ) | (52 | ) | ||||
Net change in pension and other benefit liabilities | 173 | (62 | ) | 111 | ||||||
Other comprehensive income (loss) | $ 2,160 | $ (243 | ) | $ 1,917 | ||||||
2008 | ||||||||||
Net foreign currency translation adjustment | $ (2,626 | ) | $ 341 | $ (2,285 | ) | |||||
Net gain (loss) on derivatives | 2 | (1 | ) | 1 | ||||||
Net change in unrealized gain on available-for-sale securities | (56 | ) | 12 | (44 | ) | |||||
Net change in pension and other benefit liabilities | (1,561 | ) | 589 | (972 | ) | |||||
Other comprehensive income (loss) | $ (4,241 | ) | $ 941 | $ (3,300 | ) | |||||
2007 | ||||||||||
Net foreign currency translation adjustment | $ 1,729 | $ (154 | ) | $ 1,575 | ||||||
Net gain (loss) on derivatives | (109 | ) | 45 | (64 | ) | |||||
Net change in unrealized gain on available-for-sale securities | 24 | (10 | ) | 14 | ||||||
Net change in pension and other benefit liabilities | 605 | (213 | ) | 392 | ||||||
Other comprehensive income (loss) | $ 2,249 | $ (332 | ) | $ 1,917 | ||||||
1 Refer to Note 4 for information related to the net gain or loss on derivative instruments designated and qualifying as cash flow hedging instruments. | ||||||||||
2 Includes reclassification adjustments related to divestitures of certain available-for-sale securities. Refer to Note 2 for additional information related to these divestitures. | ||||||||||
NOTE 13: FAIR VALUE MEASUREMENTS
Accounting principles generally accepted in the United States define fair value as the exchange price that would be received for an asset or paid to transfer a liability (an exit price) in the principal or most advantageous market for the asset or liability in an orderly transaction between market participants at the measurement date. Additionally, the inputs used to measure fair value are prioritized based on a three-level hierarchy. This hierarchy requires entities to maximize the use of observable inputs and minimize the use of unobservable inputs. The three levels of inputs used to measure fair value are as follows:
Recurring Fair Value Measurements
In 2004,accordance with accounting principles generally accepted in the United States, certain assets and liabilities are required to be recorded at fair value on a recurring basis. For our Company, the only assets and liabilities that are adjusted to fair value on a recurring basis are investments in equity and debt securities classified as trading or available-for-sale and derivative instruments. The following tables summarize those assets and liabilities measured at fair value on a recurring basis as of December 31, 2009 and 2008 (in millions):
| December 31, 2009 | |||||||||||
| Level 1 | Level 2 | Level 3 | Netting Adjustment | 1 | Fair Value Measurements | ||||||
Assets | |||||||||||
Trading securities | $ 50 | $ 8 | $ 3 | $ — | $ 61 | ||||||
Available-for-sale securities | 393 | 5 | — | — | 398 | ||||||
Derivatives | 10 | 184 | 2 | (108 | ) | 88 | |||||
Total assets | $ 453 | $ 197 | $ 5 | $ (108 | ) | $ 547 | |||||
Liabilities | |||||||||||
Derivatives | $ 1 | $ 110 | $ 2 | $ (111 | ) | $ 2 | |||||
Total liabilities | $ 1 | $ 110 | $ 2 | $ (111 | ) | $ 2 | |||||
1 Amounts represent the impact of legally enforceable master netting agreements that allow the Company to settle positive and negative positions and also cash collateral held or placed with the same counterparties. Refer to Note 4. | |||||||||||
| December 31, 2008 | |||||||||||
| Level 1 | Level 2 | Level 3 | Netting Adjustment | 1 | Fair Value Measurements | ||||||
Assets | |||||||||||
Trading securities | $ 39 | $ 4 | $ 6 | $ — | $ 49 | ||||||
Available-for-sale securities | 518 | 4 | — | — | 522 | ||||||
Derivatives | 5 | 108 | — | (108 | ) | 5 | |||||
Total assets | $ 562 | $ 116 | $ 6 | $ (108 | ) | $ 576 | |||||
Liabilities | |||||||||||
Derivatives | $ 6 | $ 288 | $ 34 | $ (117 | ) | $ 211 | |||||
Total liabilities | $ 6 | $ 288 | $ 34 | $ (117 | ) | $ 211 | |||||
1 Amounts represent the impact of legally enforceable master netting agreements that allow the Company to settle positive and negative positions and also cash collateral held or placed with the same counterparties. Refer to Note 4. | |||||||||||
Gross realized and unrealized gains and losses on Level 3 assets and liabilities were not significant for the years ended December 31, 2009 and 2008, respectively.
Nonrecurring Fair Value Measurements
In addition to assets and liabilities that are recorded at fair value on a recurring basis, the Company records assets and liabilities at fair value on a nonrecurring basis as required by accounting principles generally accepted in the United States. Generally, assets are recorded at fair value on a nonrecurring basis as a result of impairment charges. Assets measured at fair value on a nonrecurring basis for the year ended December 31, 2009, are summarized below (in millions):
| Level Used to Determine | |||||||||||
| Impairment | New Cost | New Cost Basis | |||||||||
| Charge | Basis | 2 | Level 1 | Level 2 | Level 3 | ||||||
Cost method investment | $ 27 | 1 | $ — | $ — | $ — | $ — | |||||
Bottler franchise rights | 23 | 3 | 2 | — | — | 2 | |||||
Buildings and improvements | 17 | 4 | — | — | — | — | |||||
Total | $ 67 | $ 2 | $ — | $ — | $ 2 | ||||||
1 The Company recognized an other-than-temporary impairment charge of approximately $27 million. The carrying value of the Company's investment prior to recognizing the impairment was approximately $27 million. The Company determined that the fair value of the investment was zero based on Level 3 inputs. Refer to Note 14 for further discussion of the factors leading to the recognition of the impairment. | |||||||||||
2 The new cost basis represents the carrying value of the impaired asset immediately after the date of impairment. Therefore, this balance does not include the effect of translation and/or depreciation or amortization subsequent to the date of impairment, if applicable. | |||||||||||
3 The Company recognized a charge of approximately $23 million related to the impairment of an indefinite-lived intangible asset. The carrying value of the asset prior to the impairment was approximately $25 million. At the time of impairment, the estimated fair value of the asset was approximately $2 million and was estimated based on Level 3 inputs. Refer to Note 14. | |||||||||||
4 The Company recognized an impairment charge of approximately $17 million due to a change in disposal strategy related to a building that is no longer occupied. The Company had originally intended to sell the building along with the related land. However, we have determined that the maximum potential sales proceeds would likely be realized through the sale of vacant land. As a result, the building will be removed. Refer to Note 14. The carrying value of the asset prior to recognizing the impairment was approximately $17 million. | |||||||||||
Fair Value Measurements for Pension and Other Postretirement Benefit Plans
The fair value hierarchy discussed above is not only applicable to assets and liabilities that are included in our consolidated balance sheets, but is also applied to certain other assets that indirectly impact our consolidated financial statements. For example, our Company sponsors and/or contributes to a number of pension and other postretirement benefit plans. Assets contributed by the Company become the property of the individual plans. Even though the Company no longer has control over these assets, we are indirectly impacted by subsequent fair value adjustments to these assets. The actual return on these assets impacts the Company's future net periodic benefit cost, as well as amounts recognized in our consolidated balance sheets. Refer to Note 10. The Company uses the fair value hierarchy to measure the fair value of assets held by our various pension and other postretirement plans.
Pension Plan Assets
The following table summarizes the level within the fair value hierarchy used to determine the fair value of our pension plan assets for our U.S. and non-U.S. pension plans as of December 31, 2009 (in millions):
| Level 1 | Level 2 | Level 3 | Total | ||||||
Cash and cash equivalents | $ 49 | $ 161 | $ — | $ 210 | |||||
Equity securities: | |||||||||
U.S.-based companies | 741 | 3 | — | 744 | |||||
International-based companies | 164 | 1 | — | 165 | |||||
Fixed income securities: | |||||||||
Government bonds | — | 225 | — | 225 | |||||
Corporate bonds and debt securities | — | 345 | 10 | 355 | |||||
Mutual, pooled and commingled funds | 233 | 759 | — | 992 | |||||
Hedge funds/limited partnerships | — | — | 80 | 80 | |||||
Real estate | — | — | 153 | 153 | |||||
Other | 1 | 62 | 45 | 1 | 108 | ||||
Total pension assets | $ 1,188 | $ 1,556 | $ 288 | $ 3,032 | |||||
1 Includes approximately $39 million of purchased annuity contracts. | |||||||||
The following table provides a reconciliation of the beginning and ending balance of Level 3 assets for our U.S. and non-U.S. pension plans for the year ended December 31, 2009 (in millions):
| Corporate Bonds and Debt Securities | Hedge Funds/Limited Partnerships | Real Estate | Other | Total | |||||||
Beginning balance at January 1, 2009 | $ — | $ 58 | $ 198 | $ 44 | $ 300 | ||||||
Actual return on plan assets: | |||||||||||
Related to assets still held at the reporting date | (1 | ) | 10 | (57 | ) | (1 | ) | (49 | ) | ||
Related to assets sold during the period | — | — | — | — | — | ||||||
Purchases, sales and settlements — net | (5 | ) | 12 | 6 | 5 | 18 | |||||
Transfers in and/or out of Level 3 — net | 16 | — | — | (5 | ) | 11 | |||||
Translation | — | — | 6 | 2 | 8 | ||||||
Ending balance at December 31, 2009 | $ 10 | $ 80 | $ 153 | $ 45 | 1 | $ 288 | |||||
1 Includes approximately $39 million of purchased annuity contracts. | |||||||||||
Other Postretirement Benefit Plan Assets
The following table summarizes the level within the fair value hierarchy used to determine the fair value of our other postretirement benefit plan assets as of December 31, 2009 (in millions):
| Level 1 | Level 2 | Level 3 | 1 | Total | |||||
Cash and cash equivalents | $ — | $ 86 | $ — | $ 86 | |||||
Equity securities: | |||||||||
U.S.-based companies | 62 | — | — | 62 | |||||
International-based companies | 13 | — | — | 13 | |||||
Fixed income securities: | |||||||||
Government bonds | — | 1 | — | 1 | |||||
Corporate bonds and debt securities | — | 5 | — | 5 | |||||
Mutual, pooled and commingled funds | — | 2 | — | 2 | |||||
Hedge funds/limited partnerships | — | — | 1 | 1 | |||||
Real estate | — | — | 2 | 2 | |||||
Other | — | 1 | — | 1 | |||||
Total other postretirement benefit plan assets | $ 75 | $ 95 | $ 3 | $ 173 | |||||
1 Level 3 assets are not a significant portion of other postretirement benefit plan assets. | |||||||||
NOTE 14: SIGNIFICANT OPERATING AND NONOPERATING ITEMS
Other Operating Charges
Other operating charges incurred by operating segment were as follows (in millions):
| 2009 | 2008 | 2007 | |||||
Eurasia & Africa | $ 4 | $ 1 | $ 37 | ||||
Europe | 7 | — | 33 | ||||
Latin America | — | 1 | 4 | ||||
North America | 31 | 56 | 23 | ||||
Pacific | 1 | — | 3 | ||||
Bottling Investments | 141 | 46 | 33 | ||||
Corporate | 129 | 246 | 121 | ||||
Total other operating charges | $ 313 | $ 350 | $ 254 | ||||
In 2009, the Company incurred other operating charges of approximately $313 million, which consisted of $166 million related to restructuring charges, $107 million attributable to the Company's ongoing productivity initiatives and $40 million due to asset impairments. Refer to Note 15 for additional information on the restructuring charges and productivity initiatives. The asset impairment charges were the result of a change in the expected useful life of an intangible asset and a change in disposal strategy related to a building that is no longer occupied. Refer to Note 13 for additional fair value information related to these impairment charges.
During 2008, the Company incurred other operating charges of approximately $350 million, which consisted of $194 million due to restructuring charges, $63 million related to contract termination fees, $55 million attributable to productivity initiatives and $38 million as a result of asset impairments. Refer to Note 15 for additional information on the restructuring charges and productivity initiatives. The contract termination fees were primarily the result of penalties incurred by the Company to terminate existing supply and co-packer agreements. Charges related to asset impairments were primarily due to the write-down of manufacturing lines that produce product packaging materials.
In 2007, the Company incurred restructuring charges of approximately $237 million and asset impairments of approximately $31 million. Refer to Note 15 for additional information on the restructuring charges. The asset impairments were primarily related to certain assets and investments in bottling operations, none of which was individually significant. Of this total, $254 million was recorded in other operating charges and $14 million was recorded in cost of goods sold.
Other Nonoperating Items
Equity Income (Loss) — Net
During 2009, the Company recorded charges of approximately $86 million in equity income (loss) — net. These charges primarily represent the Company's proportionate share of asset impairments and restructuring charges recorded by equity method investees. These charges impacted the Bottling Investments and Corporate operating segments.
In 2008, the Company recognized a net charge to equity income (loss) — net of approximately $1,686 million, primarily due to our proportionate share of approximately $7.6 billion pretax ($4.9 billion after-tax) of charges recorded by CCE due to impairments of its North American franchise rights in the second quarter and fourth quarter of 2008. The Company's proportionate share of these charges was approximately $1.6 billion. The decline in the estimated fair value of CCE's North American franchise rights during the second quarter was the result of several factors including, but not limited to, (1) challenging macroeconomic conditions which contributed to lower than anticipated volume for higher-margin packages and certain higher-margin beverage categories; (2) increases in raw material costs, including significant increases in aluminum, high fructose corn syrup and resin; and (3) increased delivery costs as a result of higher fuel costs. The decline in the estimated fair value of CCE's North American franchise rights during the fourth quarter was primarily driven by financial market conditions as of the measurement date that caused (1) a dramatic increase in market debt rates, which impacted the capital charge, and (2) a significant decline in the funded status of CCE's defined benefit pension plans. In addition, the market price of CCE's common stock declined by more than 50 percent between the date of CCE's interim impairment test (May 23, 2008) and the date of CCE's annual impairment test
(October 24, 2008). The net charge to equity income (loss) — net also included a net charge of approximately $60 million, primarily due to our proportionate share of restructuring charges recorded by our equity method investees. These charges impacted the Europe, North America and Bottling Investments operating segments.
During 2007, the Company recognized a net charge to equity income (loss) — net of approximately $150 million. This net charge primarily related to our proportionate share of asset impairments recorded by our equity method investees, which included a charge of $99 million due to excess and obsolete bottles and cases at Coca-Cola Bottlers Philippines, Inc., ("CCBPI") and $62 million attributable to an impairment recorded by Coca-Cola Amatil as a result of the sale of its bottling operations in South Korea. Our proportionate share of the asset impairments recorded by our equity method investees was partially offset by a net $11 million benefit, which represented our proportionate share of items recorded by CCE. These items impacted the Bottling Investments operating segment.
Other Income (Loss) — Net
During 2009, the Company realized a gain of approximately $44 million in other income (loss) — net on the sale of equity securities that were classified as available-for-sale. In 2008, the Company recognized an increaseother-than-temporary impairment on these same securities, primarily due to the length of time the market value had been less than our cost basis, and the lack of intent to retain the investment for a period of time sufficient to allow for recovery in market value. Refer to Note 2 for additional information related to the other-than-temporary impairment charges recorded in 2008. The gain on the sale of these securities represents the appreciation in market value since the impairment was recognized and impacted the Corporate operating segment.
In 2009, the Company recorded a charge of approximately $27 million in other income (loss) — net due to an other-than-temporary decline in the fair value of a cost method investment. As of December 31, 2008, the estimated fair value of this investment approximated the Company's carrying value in the investment. However, during the first quarter of 2009, the Company was informed by the investee of its valuation allowancesintent to reorganize its capital structure in 2009, which would result in the Company's shares in the investee being canceled. As a result, the Company determined that the decline in fair value of $224 million.this cost method investment was other than temporary. This increase wasimpairment charge impacted the Corporate operating segment. Refer to Note 13 for additional fair value information related to this impairment.
During 2008, the Company recognized gains of approximately $119 million in other income (loss) — net due to divestitures, primarily related to the recordingsale of Remil to Coca-Cola FEMSA, and the sale of 49 percent of our interest in Coca-Cola Beverages Pakistan Ltd. ("Coca-Cola Pakistan") to Coca-Cola Icecek A.S. ("Coca-Cola Icecek"). Prior to the sale of Remil, our Company owned 100 percent of the outstanding common stock of Remil. Cash proceeds from the sale were approximately $275 million, net of the cash balance, as of the disposal date. Subsequent to the sale of a valuation allowanceportion of our interest in Coca-Cola Pakistan, the Company owns a noncontrolling interest and accounts for our remaining investment under the equity method. These gains impacted the Bottling Investments and Corporate operating segments.
In 2008, the Company recorded charges of approximately $84 million to other income (loss) — net, which primarily consisted of $81 million of other-than-temporary impairment charges. As of December 31, 2008, the Company had several investments classified as available-for-sale securities in which our cost basis exceeded the fair value of the investment, each of which initially occurred between the end of the second quarter and the beginning of the third quarter of 2008. Management assessed each individual investment to determine if the decline in fair value was other than temporary. Based on Germany'sthese assessments, management determined that the decline in fair value of each investment was other than temporary. These impairment charges impacted the North America, Bottling Investments and Corporate operating segments. Refer to Note 2 for additional information related to the other-than-temporary impairment charges recorded in 2008.
During 2007, the Company sold a portion of its interest in Coca-Cola Amatil for proceeds of approximately $143 million. As a result of this transaction, we recognized a pretax gain of approximately $73 million, which impacted the Corporate operating segment and was included in other income (loss) — net in our consolidated statement of income. Our ownership interest in the total outstanding shares of Coca-Cola Amatil was reduced from approximately 32 percent to 30 percent.
In 2007, the Company sold substantially all of its interest in Vonpar Refrescos S.A. ("Vonpar"), a bottler headquartered in Brazil. Total proceeds from the sale were approximately $238 million, and we recognized a pretax gain on this sale of approximately $70 million, which impacted the Corporate operating losses,segment and was included in other income (loss) — net. Prior to this sale, our Company owned approximately 49 percent of Vonpar's outstanding common stock and accounted for the recordinginvestment using the equity method.
During 2007, the Company recorded pretax gains of approximately $66 million and $18 million in other income (loss) — net from the sale of real estate in Spain and the United States, respectively. The gains impacted the Corporate operating segment. Total proceeds amounted to approximately $106 million.
NOTE 15: RESTRUCTURING COSTS
The following table summarizes the impact that productivity, integration, streamlining and other restructuring initiatives had on our operating segments (in millions):
Year Ended December 31, | 2009 | 2008 | 2007 | ||||
Eurasia & Africa | $ 4 | $ 1 | $ 36 | ||||
Europe | 7 | — | 33 | ||||
Latin America | — | 1 | 4 | ||||
North America | 31 | 30 | 23 | ||||
Pacific | 1 | — | 3 | ||||
Bottling Investments | 118 | 46 | 29 | ||||
Corporate | 112 | 171 | 109 | ||||
Total | $ 273 | $ 249 | $ 237 | ||||
Productivity Initiatives
During 2008, the Company announced a transformation effort centered on productivity initiatives that will provide additional flexibility to invest for growth. The initiatives are expected to impact a number of areas and include aggressively managing operating expenses supported by lean techniques; redesigning key processes to drive standardization and effectiveness; better leveraging our size and scale; and driving savings in indirect costs through the implementation of a valuation allowance on a deferred tax asset recorded on the basis difference in an equity investment and a change"procure-to-pay" program.
The Company has incurred total pretax expenses of approximately $162 million related to these productivity initiatives since they commenced in the valuation allowancefirst quarter of 2008, which were recorded in India.the line item other operating charges in our consolidated statements of income and impacted the Eurasia and Africa, Europe, North America, Pacific and Corporate operating segments. Other direct costs included both internal and external costs associated with the development, communication, administration and implementation of these initiatives. The Company currently expects the total cost of these initiatives to be approximately $500 million and anticipates recognizing the remainder of the costs by the end of 2011.
The table below summarizes the balance of accrued expenses related to productivity initiatives and the changes in the accrued amounts for the years ended December 31, 2009 and 2008 (in millions):
| Costs Incurred 2008 | Payments | Noncash and Exchange | Accrued Balance December 31, 2008 | Costs Incurred 2009 | Payments | Noncash and Exchange | Accrued Balance December 31, 2009 | ||||||||||
Severance pay and benefits | $ 15 | $ (1 | ) | $ — | $ 14 | $ 41 | $ (37 | ) | $ — | $ 18 | |||||||
Outside services — legal, outplacement, consulting | 35 | (32 | ) | — | 3 | 47 | (41 | ) | — | 9 | |||||||
Other direct costs | 5 | (5 | ) | — | — | 19 | (12 | ) | (3 | ) | 4 | ||||||
Total | $ 55 | $ (38 | ) | $ — | $ 17 | $ 107 | $ (90 | ) | $ (3 | ) | $ 31 | ||||||
Integration Initiatives
During 2009, the Company incurred approximately $110 million of charges related to the integration of the 18 German bottling and distribution operations acquired in 2007. The Company began these integration initiatives in 2008 and has incurred total pretax expenses of approximately $131 million since they commenced. The expenses recorded in connection with these integration activities have been primarily due to involuntary terminations. These charges were recorded in the line item other operating charges in our consolidated statements of income and impacted the Bottling Investments operating segment. The Company had approximately $46 million and $17 million accrued related to these integration costs as of December 31, 2009 and 2008, respectively. The Company is currently reviewing other integration and restructuring opportunities within the German bottling and distribution operations, which if implemented will result in additional charges in future periods. However, as of December 31, 2009, the Company has not finalized any additional plans.
Streamlining Initiatives
During 2007, the Company took steps to streamline and simplify its operations globally. In North America, the Company reorganized its operations around three main business units: Sparkling Beverages, Still Beverages and Emerging Brands. In Ireland, the Company announced a plan to close its beverage concentrate manufacturing and distribution plant in Drogheda, which was closed during the third quarter of 2008. The plant closure is expected to improve operating productivity and enhance capacity utilization. The costs associated with this plant closure are included in the Corporate operating segment. Selected other operations also took steps to streamline their operations to improve overall efficiency and effectiveness. The Company incurred restructuring costs as a result of our streamlining initiatives of approximately $5 million, $173 million and $237 million for the years ended December 31, 2009, 2008 and 2007, respectively. The Company has incurred total pretax expenses of approximately $415 million related to these streamlining initiatives since they commenced in 2007, which were recorded in the line item other operating charges in our consolidated statements of income. The Company does not anticipate significant additional charges, individually or in the aggregate, related to these initiatives. The Company had approximately $2 million and $30 million accrued related to these streamlining initiatives as of December 31, 2009 and 2008, respectively. The decrease in the accrued balance was primarily due to cash payments in 2009.
Employees separated, or to be separated, from the Company as a result of these streamlining initiatives were offered severance or early retirement packages, as appropriate, that included both financial and nonfinancial components. The expenses recorded in connection with these streamlining activities included costs related to involuntary terminations and other direct costs associated with implementing these initiatives. Other direct costs included expenses to relocate employees; contract termination costs; costs associated with the development, communication and administration of these initiatives; accelerated depreciation; and asset write-offs.
Other Restructuring Initiatives
During 2009, the Company incurred approximately $51 million of charges related to other restructuring initiatives outside the scope of the productivity, integration and streamlining initiatives discussed above. These other restructuring charges were related to individually insignificant activities throughout many of our business units. None of these activities is expected to be individually significant. These charges were recorded in the line item other operating charges in our consolidated statement of income.
NOTE 18: SIGNIFICANT16: NET CHANGE IN OPERATING ASSETS AND NONOPERATING ITEMSLIABILITIES
In 2006, our Company recorded charges of approximately $606 million related to our proportionate share of charges recordedNet cash provided by our equity method investees. Of this amount, approximately $602 million related to our proportionate share of an impairment charge recorded by CCE for its North American franchise rights. Our proportionate share of CCE's charges also included approximately $18 million due to restructuring charges recorded by CCE. These charges were partially offset by approximately $33 million related to our proportionate share of changes in certain of CCE's state and Canadian federal and provincial tax rates. The charges were recorded in the line item equity income—net in the consolidated statement of income. All of these charges and changes impacted our Bottling Investments(used in) operating segment. Refer to Note 3.
During 2006, our Company also recorded charges of approximately $112 million, primarily relatedactivities attributable to the impairment ofnet change in operating assets and investments in our bottling operations, approximately $53 million for contract termination costs related to production capacity efficiencies and approximately $24 million related to other restructuring costs. These charges impactedliabilities is composed of the Africa, the East, South Asia and Pacific Rim, the European Union, the North Asia, Eurasia and Middle East, the Bottling Investments and the Corporate operating segments. None of these charges was individually significant. Approximately $4 million of these charges were recorded in the line item cost of goods sold and approximately $185 million of these charges were recorded in the line item other operating charges in the consolidated statement of income. Refer to Note 20.following (in millions):
Year Ended December 31, | 2009 | 2008 | 2007 | ||||
(Increase) decrease in trade accounts receivable | $ (404 | ) | $ 148 | $ (406 | ) | ||
(Increase) decrease in inventories | (50 | ) | (165 | ) | (258 | ) | |
(Increase) decrease in prepaid expenses and other assets | (332 | ) | 63 | (244 | ) | ||
Increase (decrease) in accounts payable and accrued expenses | 319 | (576 | ) | 762 | |||
Increase (decrease) in accrued taxes | 81 | (121 | ) | 185 | |||
Increase (decrease) in other liabilities | (178 | ) | (104 | ) | (79 | ) | |
Net change in operating assets and liabilities | $ (564 | ) | $ (755 | ) | $ (40 | ) | |
The Company made a $100 million donation to The Coca-Cola Foundation in 2006, which resulted in a charge to the consolidated statement of income line item selling, general and administrative expenses and impacted the Corporate operating segment.
In 2006, the Company sold a portion of its Coca-Cola FEMSA shares to FEMSA and recorded a pretax gain of approximately $175 million to the consolidated statement of income line item other income (loss)—net, which impacted the Corporate operating segment. Refer to Note 3.
The Company sold a portion of our investment in Coca-Cola Icecek in an initial public offering in 2006. Our Company received net cash proceeds of approximately $198 million and realized a pretax gain of approximately $123 million, which was recorded as other income (loss)—net in the consolidated statement of income and impacted the Corporate operating segment. Refer to Note 3.
In 2005, our Company received approximately $109 million related to the settlement of a class action lawsuit concerning price-fixing in the sale of HFCS purchased by the Company during the years 1991 to 1995. Subsequent to the receipt of this settlement amount, the Company distributed approximately $62 million to certain bottlers in North America. From 1991 to 1995, the Company purchased HFCS on behalf of these bottlers. Therefore, these bottlers were ultimately entitled to a portion of the proceeds of the settlement. Of the approximately $62 million we distributed to certain bottlers in North America, approximately $49 million was distributed to CCE. The Company's remaining share of the settlement was approximately $47 million, which was recorded as a reduction of cost of goods sold and impacted the Corporate operating segment.
During 2005, we recorded approximately $23 million of noncash pretax gains on the issuances of stock by equity method investees. Refer to Note 4.
The Company recorded approximately $50 million of expense in 2005 as a result of a change in our estimated service period for the acceleration of certain stock-based compensation awards. Refer to Note 15.
Equity income in 2005 was reduced by approximately $33 million for the Bottling Investments operating segment, primarily related to our proportionate share of the tax liability recorded by CCE resulting from its repatriation of previously unremitted foreign earnings under the Jobs Creation Act, as well as our proportionate share of restructuring charges. Those amounts were partially offset by our proportionate share of CCE's HFCS lawsuit settlement proceeds and changes in certain of CCE's state and provincial tax rates. Refer to Note 3.
Our Company recorded impairment charges during 2005 of approximately $84 million related to certain trademarks for beverages sold in the Philippines and approximately $1 million related to impairment of other assets. These impairment charges were recorded in the consolidated statement of income line item other operating charges.
During 2004, our Company's equity income benefited by approximately $37 million for our proportionate share of a favorable tax settlement related to Coca-Cola FEMSA. Refer to Note 3.
In 2004, we recorded approximately $24 million of noncash pretax gains on the issuances of stock by CCE. Refer to Note 4.
We recorded impairment charges during 2004 of approximately $374 million, primarily related to the impairment of franchise rights at CCEAG and approximately $18 million related to other assets. These impairment charges were recorded in the consolidated statement of income line item other operating charges.
We recorded additional impairment charges in 2004 of approximately $88 million. These impairments primarily related to the write-downs of certain manufacturing investments and an intangible asset. As a result of operating losses, management prepared analyses of cash flows expected to result from the use of the assets and their eventual disposition. Because the sum of the undiscounted cash flows was less than the carrying value of such assets, we recorded an impairment charge to reduce the carrying value of the assets to fair value. These impairment charges were recorded in the consolidated statement of income line item other operating charges.
Also in 2004, our Company received a $75 million insurance settlement related to the class action lawsuit that was settled in 2000. The Company donated $75 million to The Coca-Cola Foundation in 2004.
NOTE 19:17: ACQUISITIONS AND INVESTMENTS
InFor the year ended December 2006,31, 2009, our Company's acquisition and investment activities totaled approximately $300 million. None of the acquisitions or investments was individually significant. Included in these investment activities was the acquisition of a minority interest in Fresh Trading Ltd. Additionally, the Company and the existing shareowners of Fresh Trading Ltd. entered into a purchase agreement with San Miguel Corporationseries of put and two of its subsidiaries (collectively, "SMC")call options for the Company to potentially acquire some or all of the remaining shares not already owned by the Company. The put and call options are exercisable in stages between 2010 and 2014.
For the year ended December 31, 2008, our Company's acquisition and investment activities totaled approximately $759 million, primarily related to the purchase of capital stocktrademarks, brands and licenses. Included in these investment activities was the acquisition of Coca-Cola Bottlers Philippines, Inc.brands and licenses in Denmark and Finland from Carlsberg Group Beverages ("CCBPI"Carlsberg") held by SMC, representing 65 percent of all the issued and outstanding capital stock of CCBPI. CCBPI is the Company's authorized bottler in the Philippines. The transaction is subject to certain conditions. Upon the closing of this transaction, the Company will own 100 percentfor approximately $225 million. None of the issuedother acquisitions or investments was individually significant.
For the year ended December 31, 2007, our Company's acquisition and outstanding capital stockinvestment activity, including the acquisition of CCBPI. The total purchase price is expected to betrademarks, totaled approximately $590 million, subject to adjustment based on$5,653 million.
In the terms and conditionsfourth quarter of the purchase agreement. The results of operations of CCBPI will be included in our consolidated financial statements from the date of the closing.
In December 2006,2007, the Company and Coca-Cola FEMSA entered into an agreement to jointly acquireacquired Jugos del Valle, S.A.B. de C.V. ("Jugos del Valle"), the second largest producer of packaged juices, nectars and fruit-flavored beverages in Mexico and the largest producer of such beverages in Brazil. The total purchase price is expected to bewas approximately $380$370 million in cash plus the assumption of approximately $90$85 million in debt. The transaction is subject to certain conditions, including required regulatory approvals.
During 2006, our Company's acquisitiondebt and investment activity, including the acquisition of trademarks, totaled approximately $901 million. In the third quarter of 2006, our Company acquired a controlling shareholding interest in Kerry Beverages Limited ("KBL"). KBL was formed bysplit equally between the Company and Coca-Cola FEMSA. As of December 31, 2009, the Kerry Group in 1993 and hasCompany owned a majority ownership in 11 joint ventures that manufacture and distribute Company products across nine provinces in China. KBL also has a minority50 percent interest in Jugos del Valle. The Company's investment in Jugos del Valle is accounted for under the joint venture bottlerequity method. Equity income (loss) — net includes our proportionate share of the results of Jugos del Valle's operations beginning November 2007 and is included in Beijing. Subsequentthe Latin America operating segment.
In order to increase the efficiency of our bottling and distribution operations in the German market, the Company, through its consolidated German bottling operation Coca-Cola Erfrischungsgetraenke AG ("CCEAG"), acquired 18 German bottling and distribution operations on September 1, 2007, for a total purchase price of approximately $547 million plus transaction costs. Following the acquisition, the Company changed KBL's name to Coca-Cola China Industries Limited ("CCCIL"). As a resultowns the franchise rights for all of the transaction, the Company owns 89.5German market. The purchase price consisted of approximately 17 percent of the outstanding shares of CCCIL,CCEAG valued at approximately $384 million, approximately $151 million in cash and we have agreed to purchaseassumed net debt of approximately $12 million. The acquisition agreements also provide the remaining 10.5 percent by the end of 2008 at the same price per share as the initial purchase price plus interest. We have all voting and economic rights over the remaining shares. This transaction was accounted for as a business combination, and the results of CCCIL's operations have been included in the Company's consolidated financial statements since August 29, 2006. CCCIL is included in the Bottling Investments operating segment.
In the third quarter of 2006, our Company signed agreements with J. Bruce Llewellyn and Brucephil, Inc. ("Brucephil"), the parent company of The Philadelphia Coca-Cola Bottling Company, for the potential purchaseformer owners of the remaining18 German bottling and distribution operations a put option to sell their respective shares in CCEAG back to the Company on January 2, 2014, with notification to the Company required by September 30, 2013. In addition, the agreements provide the Company with a call option to repurchase the issued shares of Brucephil not currently owned byCCEAG back from the Company. The agreements provide for the Company's purchaseformer owners of the shares upon18 German bottling and distribution operations on January 2, 2014, with notification to the election of Mr. Llewellyn or the electionformer owners of the Company. Based on18 German bottlers and distributors by December 15, 2013. The strike price of the termscall option is approximately 20 percent higher than the strike price of these agreements, the Company concluded that it must consolidate Brucephil under Interpretation No. 46(R). Brucephil's financial statements were consolidated effective September 29, 2006. Brucephil is included in our Bottling Investments operating segment.
Also input option. As of the third quarterclosing date of 2006, our Company acquired Apollinaris GmbH ("Apollinaris"). Apollinaris has been selling sparkling and still mineral water in Germany since 1862. Thisthis transaction, was accounted for as a business combination, and the resultspresent value of Apollinaris' operations have been included in the Company's consolidated financial statements since July 1, 2006. A portion of Apollinaris' business is included in the European Union operating segment, and the balance is included in the Bottling Investments operating segment.
The combined amount paid oramounts likely to be paid under the put and call agreements and guaranteed future cash payments was approximately $384 million. Under the purchase method of accounting, the total purchase price is allocated to complete these third-quarter 2006 transactions totalsthe tangible assets, liabilities and identifiable intangible assets acquired based on their estimated fair values. Any excess of purchase price over the aggregate fair value of acquired net assets is recorded as goodwill. The final purchase price allocated to franchise rights was approximately $707$345 million; property, plant and equipment was approximately $227 million; deferred tax liabilities was approximately $97 million; and goodwill was approximately $142 million. As a result of these transactions, the Company recorded approximately $707Approximately $33 million of franchise rights, approximately $74 million of trademarks and $182 million of goodwill. These amounts reflect a preliminary allocation of the purchase price of the applicable transactions and are subject to refinement.goodwill is deductible for tax purposes. The franchise rights and trademarks have been assigned an indefinite life.
In January 2006, ourconjunction with this acquisition, management formulated a plan to improve the efficiency of the German bottling and distribution operations. The implementation of this plan resulted in approximately $45 million in liabilities for anticipated costs related to production and distribution facility closings. The Company acquired a 100 percent interestfinished implementing this plan in TJC Holdings (Pty) Ltd. ("TJC"), athe first quarter of 2009. In addition to the plan that was formulated at the time of acquisition and executed in months that followed, the Company has incurred additional integration related charges. Refer to Note 15. The Company's acquisition of the 18 German bottling company in South Africa, from Chef Limited and Tom Cook Trust for cash consideration of approximately $200 million. This transactiondistribution operations was accounted for as a business combination, with the results of TJCthe acquired entities included in the Bottling Investments operating segment since September 1, 2007.
In the third quarter of 2007, the Company acquired a 34 percent interest in Tokyo Coca-Cola Bottling Company ("Tokyo CCBC"). The Company's consolidated financial statements sinceinvestment in Tokyo CCBC is accounted for under the dateequity method. Equity income (loss) — net includes our proportionate share of acquisition. TJCthe results of Tokyo CCBC's operations beginning July 2007 and is
included in ourthe Bottling Investments operating segment. In the third quarter of 2007, the Company also acquired an additional 11 percent interest in Nordeste Refrigerantes S.A. ("NORSA"). After this acquisition, the Company owned approximately 60 percent of NORSA. The Company allocatedbegan consolidating this entity from the date we acquired the additional 11 percent interest. The combined purchase price for these third-quarter acquisitions was approximately $203 million. NORSA is included in the Bottling Investments operating segment.
On June 7, 2007, in an effort to expand our still beverage offerings, our Company acquired Energy Brands Inc., also known as glacéau, the maker of enhanced water brands, such as vitaminwater and smartwater, for approximately $4.1 billion. On the acquisition date, we made a cash payment of approximately $2.9 billion for a 71.4 percent interest in glacéau and entered into a put and call option agreement with certain entities associated with the Tata Group ("Tata") to acquire the remaining 28.6 percent ownership interest in glacéau. As a result of the terms of these agreements with Tata, the amount to be paid under the put and call option agreement of $1.2 billion was recorded at the acquisition date as an additional investment in glacéau, with the offset being recorded as a current liability within loans and notes payable on the consolidated balance sheets. On October 22, 2007, the Company exercised its right to call the remaining interest in glacéau and paid Tata $1.2 billion, such that the Company owned 100 percent of glacéau as of December 31, 2007. Under the purchase method of accounting, the total purchase price of glacéau is allocated to the tangible assets, liabilities and identifiable intangible assets acquired based on their estimated fair values,values. Any excess of purchase price over the aggregate fair value of acquired net assets is recorded as goodwill. The final purchase price allocation was approximately $3.3 billion to trademarks, approximately $2.0 billion to goodwill, approximately $0.1 billion to customer relationships and approximately $1.1 billion to deferred tax liabilities. The trademarks have been assigned indefinite lives. The goodwill resulting from this acquisition is primarily related to our ability to optimize the route to market and increase the availability of the product, which will result in additional product sales. The goodwill also includes the recognition of deferred tax liabilities associated with the identifiable intangible assets recorded in purchase accounting. The goodwill is not deductible for tax purposes. On August 30, 2007, the Company announced its plans to transition to a new distribution model for glacéau products. This new distribution model includes a mix of legacy glacéau distributors and existing Coca-Cola system bottlers. Also, the Company will retain the distribution rights for certain channels. The implementation of this plan resulted in approximately $0.2 billion in liabilities for anticipated costs to terminate existing glacéau distribution agreements, which was reflected as an adjustment to the original allocation of acquisition costs. Substantially all of these termination costs were paid by the assetsend of 2008. The acquisition of glacéau was accounted for as a business combination, with the results of the acquired entity included in the North America operating segment as of the acquisition date.
In addition, certain executive officers and liabilities that we acquired.former shareholders of glacéau invested approximately $179 million of their proceeds from the sale of glacéau in common stock of the Company at then-current market prices. These shares of Company common stock were placed in escrow pursuant to the glacéau acquisition agreement.
In the second quarter of 2007, the Company divested a portion of its interest in Scarlet Ibis Investment 3 (Proprietary) Limited ("Scarlet"), a bottling company in South Africa.
During the first quarter of 2007, our Company acquired the remaining 65 percent interest in CCBPI from San Miguel Corporation ("SMC") for consideration of approximately $591 million plus assumed net debt, of which $100 million was placed in escrow until certain matters related to the closing balance sheet audit of CCBPI were resolved. During the third quarter of 2007, the entire escrow amount was released, and our Company recovered $70 million. The adjusted purchase price after the recovery from escrow was approximately $521 million plus assumed debt, net of acquired cash, of approximately $79 million. Of the $521 million of consideration, the Company has outstanding notes payable to SMC of approximately $100 million as of December 31, 2009. As a result of the acquisition, the Company owns 100 percent of the outstanding stock of CCBPI. The final amount of the purchase price allocated to property, plant and equipment was approximately $21 million,$319 million; franchise rights was approximately $169 million$285 million; and goodwill was approximately $59$197 million. The goodwill is not deductible for tax purposes. The franchise rights have been assigned an indefinite life. Management finalized a plan to improve the efficiency of CCBPI, which included the closing of eight production facilities during the third quarter of 2007. The acquisition of CCBPI was accounted for as a business combination, with the results of the acquired entity included in the Bottling Investments operating segment as of the acquisition date.
First quarter 2007 acquisition and investing activities also included approximately $327 million related to the purchases of Fuze and Leao Junior, S.A. ("Leao Junior"), a Brazilian tea company, which are included in the North America and Latin America operating segments, respectively. The final amount of purchase price related to these acquisitions
allocated to property, plant and equipment was approximately $19 million; identifiable intangible assets, primarily indefinite-lived trademarks, was approximately $265 million; and goodwill was approximately $57 million.
The acquisitions of the 18 German bottling and distribution operations, glacéau, CCBPI, Fuze, Leao Junior, NORSA, our 34 percent investment in Tokyo CCBC and our 50 percent investment in Jugos del Valle in 2007 were primarily financed through the issuance of commercial paper and long-term debt.
Assuming the results of thesethe businesses acquired in 2007 had been included in operations beginning on January 1, 2006,2007, the estimated pro forma financial datanet operating revenues of the Company for the year ended December 31, 2007, would have been approximately $29.6 billion. The estimated pro forma net income, excluding the effect of interest expense as a result of financing the acquisitions, for the year ended December 31, 2007, would not be required due to immateriality.
During 2005, our Company's acquisition and investment activity totaled approximately $637 million and included the acquisition of the German bottling company Bremer Erfrischungsgetraenke GmbH ("Bremer") for approximately $160 million from InBev SA. This transaction was accounted for as a business combination, and the results of Bremer's operations have been included insignificantly different than the Company's consolidated financial statements beginning in September 2005. The Company recorded approximately $54 million of property, plant and equipment, approximately $85 million of franchise rights and approximately $58 million of goodwill related to this acquisition. The franchise rights have been assigned an indefinite life, and the goodwill was allocated to the Germany and Nordic reporting unit within the European Union operating segment.reported amount.
In August 2005, we completed the acquisition of the remaining 49 percent interest in the business of CCDA Waters L.L.C. ("CCDA") not previously owned by our Company. Our Company and Danone Waters of North America, Inc. ("DWNA") had formed CCDA in July 2002 for the production, marketing and distribution of DWNA's bottled spring and source water business in the United States. This transaction was accounted for as a business combination, and the consolidated results of CCDA's operations have been included in the Company's consolidated financial statements since July 2002. CCDA is included in our North America operating segment. In July 2005, the Company acquired Sucos Mais, a Brazilian juice company. The results of Sucos Mais have been included in our consolidated financial statements since July 2005.
Assuming the results of these businesses had been included in operations beginning on January 1, 2005, pro forma financial data would not be required due to immateriality.
On April 20, 2005, our Company and Coca-Cola HBC jointly acquired Multon for a total purchase price of approximately $501 million, split equally between the Company and Coca-Cola HBC. The Company's
investment in Multon is accounted for under the equity method. Equity income—net includes our proportionate share of the results of Multon's operations beginning April 20, 2005.
During 2004, our Company's acquisition and investment activity totaled approximately $267 million, primarily related to the purchase of trademarks, brands and related contractual rights in Latin America, none of which was individually significant.
NOTE 20:18: OPERATING SEGMENTS
During 2006, the Company made certain changes to its operating structure, primarily to establish a separate internal organization for its consolidated bottling operations and its unconsolidated bottling investments. This structure resulted in the reporting of a Bottling Investments operating segment, along with the six existing geographic operating segments and Corporate, beginning with the first quarter of 2006. Prior to this change in the operating structure, the financial results of the consolidated bottling operations and our proportionate share of the earnings of unconsolidated bottling operations had been generally included in the geographic operating segments in which they conducted business. As of December 31, 2006,2009, our Company's operatingorganizational structure consisted of the following operating segments: Eurasia and Africa; East, South Asia and Pacific Rim; European Union;Europe; Latin America; North America; North Asia, Eurasia and Middle East;Pacific; Bottling Investments; and Corporate. Prior-yearPrior-period amounts have been reclassified to conform to the newcurrent operating structure described above.structure.
Segment Products and Services
The business of our Company is nonalcoholic beverages. Our geographic operating segments (Eurasia and Africa; Europe; Latin America; North America and Pacific) derive a majority of their revenues from the manufacture and sale of beverage concentrates and syrups and, in some cases, the sale of finished beverages. Our Bottling Investments operating segment is comprised of our Company-owned or consolidated bottling operations, regardless of the geographic location of the bottler, and equity income from the majority of our equity method investments. Company-owned or consolidated bottling operations derive the majority of their revenue from the sale of finished beverages. Generally, bottling and finished product operations produce higher net revenues but lower gross profit margins compared to concentrate and syrup operations.
Method of Determining Segment Income or Loss
Management evaluates the performance of our operating segments separately to individually monitor the different factors affecting financial performance. Our Company manages income taxes and financial costs, such as interest income and expense, on a global basis within the Corporate operating segment. We evaluate segment performance based on income or loss before income taxes.
Geographic Data (in millions)
Year Ended December 31, | 2009 | 2008 | 2007 | ||||
Net operating revenues: | |||||||
United States | $ 8,011 | $ 8,014 | $ 7,556 | ||||
International | 22,979 | 23,930 | 21,301 | ||||
Net operating revenues | $ 30,990 | $ 31,944 | $ 28,857 | ||||
December 31, | 2009 | 2008 | 2007 | ||||
Property, plant and equipment — net: | |||||||
United States | $ 3,115 | $ 3,161 | $ 2,750 | ||||
International | 6,446 | 5,165 | 5,743 | ||||
Property, plant and equipment — net | $ 9,561 | $ 8,326 | $ 8,493 | ||||
Information about our Company's operations by operating segment for the years ended December 31, 2006, 20052009, 2008 and 2004,2007, is as follows (in millions):
| Africa | East, South Asia and Pacific Rim | European Union | Latin America | North America | North Asia, Eurasia and Middle East | Bottling Investments | Corporate | Eliminations | Consolidated | ||||||||||||
| 2006 | |||||||||||||||||||||
| Net operating revenues: | |||||||||||||||||||||
| Third party | $ 1,103 | $ 795 | $ 3,505 | $ 2,484 | $ 7,013 | $ 3,986 | 1 | $ 5,109 | $ 93 | $ — | $ 24,088 | ||||||||||
| Intersegment | 37 | 77 | 859 | 132 | 16 | 137 | 89 | — | (1,347 | ) | — | ||||||||||
| Total net revenues | 1,140 | 872 | 4,364 | 2,616 | 7,029 | 4,123 | 5,198 | 93 | (1,347 | ) | 24,088 | ||||||||||
| Operating income (loss) | 424 | 2 | 358 | 2 | 2,254 | 2 | 1,438 | 1,683 | 1,557 | 2 | 18 | 2 | (1,424 | )2,3 | — | 6,308 | |||||
| Interest income | — | — | — | — | — | — | — | 193 | — | 193 | |||||||||||
| Interest expense | — | — | — | — | — | — | — | 220 | — | 220 | |||||||||||
| Depreciation and amortization | 16 | 13 | 100 | 25 | 361 | 55 | 278 | 90 | — | 938 | |||||||||||
| Equity income — net | — | — | (4 | ) | — | — | 27 | 56 | 6 | 23 | — | 102 | |||||||||
| Income (loss) before income taxes | 413 | 2 | 358 | 2 | 2,258 | 2 | 1,434 | 1,681 | 1,579 | 2 | 67 | 2,6 | (1,212 | )2,3,4 | — | 6,578 | |||||
| Identifiable operating assets5,7 | 573 | 390 | 2,557 | 1,516 | 4,778 | 1,043 | 5,953 | 6,370 | — | 23,180 | |||||||||||
| Investments8 | — | — | 24 | — | 2 | 428 | 6,276 | 53 | — | 6,783 | |||||||||||
| Capital expenditures | 37 | 10 | 93 | 44 | 421 | 129 | 418 | 255 | — | 1,407 | |||||||||||
| 2005 | |||||||||||||||||||||
| Net operating revenues: | |||||||||||||||||||||
| Third party | $ 1,107 | $ 719 | $ 4,104 | $ 2,064 | $ 6,676 | $ 4,089 | 1 | $ 4,262 | $ 83 | $ — | $ 23,104 | ||||||||||
| Intersegment | 13 | 60 | 807 | 94 | — | 130 | — | — | (1,104 | ) | — | ||||||||||
| Total net revenues | 1,120 | 779 | 4,911 | 2,158 | 6,676 | 4,219 | 4,262 | 83 | (1,104 | ) | 23,104 | ||||||||||
| Operating income (loss) | 396 | 9 | 284 | 9,10 | 2,219 | 9 | 1,176 | 9 | 1,553 | 9 | 1,735 | 9 | (37 | ) | (1,241 | )9,11 | — | 6,085 | |||
| Interest income | — | — | — | — | — | — | — | 235 | — | 235 | |||||||||||
| Interest expense | — | — | — | — | — | — | — | 240 | — | 240 | |||||||||||
| Depreciation and amortization | 18 | 16 | 86 | 27 | 348 | 43 | 265 | 129 | — | 932 | |||||||||||
| Equity income — net | — | — | �� | — | — | — | 20 | 624 | 12 | 36 | — | 680 | |||||||||
| Income (loss) before income taxes | 382 | 9 | 283 | 9,10 | 2,225 | 9 | 1,175 | 9 | 1,549 | 9 | 1,748 | 9 | 590 | 12 | (1,262 | )9,11,13 | — | 6,690 | |||
| Identifiable operating assets5,7 | 561 | 339 | 2,183 | 1,324 | 4,645 | 987 | 3,842 | 8,624 | — | 22,505 | |||||||||||
| Investments8 | — | 1 | 16 | 6 | — | 281 | 6,538 | 80 | — | 6,922 | |||||||||||
| Capital expenditures | 23 | 7 | 78 | 24 | 265 | 89 | 264 | 149 | — | 899 | |||||||||||
| 2004 | |||||||||||||||||||||
| Net operating revenues: | |||||||||||||||||||||
| Third party | $ 961 | $ 706 | $ 3,913 | $ 1,778 | $ 6,423 | $ 3,885 | 1 | $ 3,975 | $ 101 | $ — | $ 21,742 | ||||||||||
| Intersegment | 10 | 109 | 773 | 69 | — | 96 | — | — | (1,057 | ) | — | ||||||||||
| Total net revenues | 971 | 815 | 4,686 | 1,847 | 6,423 | 3,981 | 3,975 | 101 | (1,057 | ) | 21,742 | ||||||||||
| Operating income (loss) | 336 | 439 | 2,126 | 1,053 | 1,606 | 14 | 1,671 | (454 | )14 | (1,079 | )14,15 | — | 5,698 | ||||||||
| Interest income | — | — | — | — | — | — | — | 157 | — | 157 | |||||||||||
| Interest expense | — | — | — | — | — | — | — | 196 | — | 196 | |||||||||||
| Depreciation and amortization | 18 | 14 | 75 | 33 | 347 | 69 | 245 | 92 | — | 893 | |||||||||||
| Equity income — net | — | — | — | — | — | — | 580 | 16 | 41 | — | 621 | ||||||||||
| Income (loss) before income taxes | 322 | 440 | 2,125 | 1,059 | 1,615 | 14 | 1,667 | 131 | 14,16 | (1,137 | )14,15,17 | — | 6,222 | ||||||||
| Identifiable operating assets5,7 | 575 | 360 | 2,300 | 1,202 | 4,728 | 939 | 4,144 | 10,941 | — | 25,189 | |||||||||||
| Investments8 | — | 1 | 16 | 5 | — | 8 | 6,138 | 84 | — | 6,252 | |||||||||||
| Capital expenditures | 17 | 7 | 39 | 25 | 247 | 45 | 258 | 117 | — | 755 | |||||||||||
| Eurasia & Africa | Europe | Latin America | North America | Pacific | Bottling Investments | Corporate | Eliminations | Consolidated | ||||||||||||||||||||
2009 | ||||||||||||||||||||||||||||
Net operating revenues: | ||||||||||||||||||||||||||||
Third party | $ 1,977 | $ 4,308 | $ 3,700 | $ 8,191 | $ 4,533 | 1 | $ 8,193 | $ 88 | $ — | $ 30,990 | ||||||||||||||||||
Intersegment | 220 | 895 | 182 | 80 | 342 | 127 | — | (1,846 | ) | — | ||||||||||||||||||
Total net revenues | 2,197 | 5,203 | 3,882 | 8,271 | 4,875 | 8,320 | 88 | (1,846 | ) | 30,990 | ||||||||||||||||||
Operating income (loss) | 810 | 2 | 2,946 | 2 | 2,042 | 1,699 | 2 | 1,887 | 2 | 179 | 2 | (1,332 | )2 | — | 8,231 | |||||||||||||
Interest income | — | — | — | — | — | — | 249 | — | 249 | |||||||||||||||||||
Interest expense | — | — | — | — | — | — | 355 | — | 355 | |||||||||||||||||||
Depreciation and amortization | 27 | 132 | 52 | 365 | 95 | 424 | 141 | — | 1,236 | |||||||||||||||||||
Equity income (loss) — net | (1 | ) | 20 | (4 | ) | (1 | ) | (23 | ) | 785 | 3 | 5 | 3 | — | 781 | |||||||||||||
Income (loss) before income taxes | 810 | 2 | 2,976 | 2 | 2,039 | 1,701 | 2 | 1,866 | 2 | 980 | 2,3 | (1,426 | )2,3,4,5 | — | 8,946 | |||||||||||||
Identifiable operating assets6 | 1,155 | 3,047 | 7 | 2,480 | 10,941 | 1,929 | 9,140 | 7 | 13,224 | — | 41,916 | |||||||||||||||||
Investments8 | 331 | 214 | 248 | 8 | 82 | 5,809 | 63 | — | 6,755 | |||||||||||||||||||
Capital expenditures | 70 | 68 | 123 | 458 | 91 | 826 | 357 | — | 1,993 | |||||||||||||||||||
2008 | ||||||||||||||||||||||||||||
Net operating revenues: | ||||||||||||||||||||||||||||
Third party | $ 2,135 | $ 4,785 | $ 3,623 | $ 8,205 | $ 4,358 | 1 | $ 8,731 | $ 107 | $ — | $ 31,944 | ||||||||||||||||||
Intersegment | 192 | 1,016 | 212 | 75 | 337 | 200 | — | (2,032 | ) | — | ||||||||||||||||||
Total net revenues | 2,327 | 5,801 | 3,835 | 8,280 | 4,695 | 8,931 | 107 | (2,032 | ) | 31,944 | ||||||||||||||||||
Operating income (loss) | 834 | 9 | 3,175 | 2,099 | 9 | 1,584 | 9 | 1,858 | 264 | 9 | (1,368 | )9 | — | 8,446 | ||||||||||||||
Interest income | — | — | — | — | — | — | 333 | — | 333 | |||||||||||||||||||
Interest expense | — | — | — | — | — | — | 438 | — | 438 | |||||||||||||||||||
Depreciation and amortization | 26 | 169 | 42 | 376 | 78 | 409 | 128 | — | 1,228 | |||||||||||||||||||
Equity income (loss) — net | (14 | ) | (4 | )10 | 6 | (2 | )10 | (19 | ) | (844 | )10 | 3 | — | (874 | ) | |||||||||||||
Income (loss) before income taxes | 823 | 9 | 3,182 | 10 | 2,098 | 9 | 1,579 | 9,10,11 | 1,841 | (582 | )9,10,11,12 | (1,435 | )9,11,12 | — | 7,506 | |||||||||||||
Identifiable operating assets6 | 956 | 3,012 | 7 | 1,849 | 10,845 | 1,444 | 7,935 | 7 | 8,699 | — | 34,740 | |||||||||||||||||
Investments8 | 395 | 179 | 199 | 4 | 72 | 4,873 | 57 | — | 5,779 | |||||||||||||||||||
Capital expenditures | 67 | 76 | 58 | 493 | 177 | 818 | 279 | — | 1,968 | |||||||||||||||||||
2007 | ||||||||||||||||||||||||||||
Net operating revenues: | ||||||||||||||||||||||||||||
Third party | $ 1,941 | $ 4,447 | $ 3,069 | $ 7,761 | $ 3,997 | 1 | $ 7,570 | $ 72 | $ — | $ 28,857 | ||||||||||||||||||
Intersegment | 168 | 845 | 175 | 75 | 409 | 125 | — | (1,797 | ) | — | ||||||||||||||||||
Total net revenues | 2,109 | 5,292 | 3,244 | 7,836 | 4,406 | 7,695 | 72 | (1,797 | ) | 28,857 | ||||||||||||||||||
Operating income (loss) | 667 | 13 | 2,775 | 13 | 1,749 | 13 | 1,696 | 13 | 1,699 | 13 | 153 | 13 | (1,487 | )13 | — | 7,252 | ||||||||||||
Interest income | — | — | — | — | — | — | 236 | — | 236 | |||||||||||||||||||
Interest expense | — | — | — | — | — | — | 456 | — | 456 | |||||||||||||||||||
Depreciation and amortization | 23 | 141 | 41 | 359 | 82 | 388 | 129 | — | 1,163 | |||||||||||||||||||
Equity income (loss) — net | 37 | 11 | 1 | 4 | (14 | ) | 630 | 14 | (1 | ) | — | 668 | ||||||||||||||||
Income (loss) before income taxes | 706 | 13 | 2,796 | 13 | 1,752 | 13 | 1,700 | 13 | 1,670 | 13 | 793 | 13,14 | (1,498 | )13,15 | — | 7,919 | ||||||||||||
Identifiable operating assets6 | 1,023 | 2,997 | 7 | 1,989 | 10,510 | 1,468 | 8,962 | 7 | 8,543 | — | 35,492 | |||||||||||||||||
Investments8 | 386 | 111 | 245 | 18 | 23 | 6,949 | 45 | — | 7,777 | |||||||||||||||||||
Capital expenditures | 74 | 79 | 47 | 344 | 191 | 645 | 268 | — | 1,648 | |||||||||||||||||||
Certain prior year amounts have been | ||||||||||||||||||||||||||||
1 | Net operating revenues in Japan represented approximately | |||||||||||||||||||||||||||
| 2007. | ||||||||||||||||||||||||||||
2 | Operating income (loss) and income (loss) before income taxes were reduced by approximately | |||||||||||||||||||||||||||
| ||||||||||||||||||||||||||||
4 Income (loss) before income taxes was reduced by approximately $27 million for Corporate due to an other-than-temporary impairment of a cost method investment. Refer to Note 14. | ||||||||||||||||||||||||||||
5 Income (loss) before income taxes was increased by approximately $44 million for Corporate due to realized gains on the sale of equity securities that were classified as available-for-sale. In 2008, the Company recognized an other-than-temporary impairment related to these securities. Refer to Note 14. | ||||||||||||||||||||||||||||
6 Principally cash and cash equivalents, trade accounts receivable, inventories, goodwill, trademarks and other intangible assets and property, plant and equipment — net. | ||||||||||||||||||||||||||||
7 | Property, plant and | ||||||||||||||||||||||||||||
8 | Principally equity method investments, available-for-sale securities and | ||||||||||||||||||||||||||||
9 | Operating income (loss) and income (loss) before income taxes were reduced by approximately | ||||||||||||||||||||||||||||
10 Equity income (loss) — net and income (loss) before income taxes was reduced by approximately $19 million for Europe, $8 million for North America and $1,659 million for Bottling Investments, primarily attributable to our proportionate share of asset impairment charges recorded by equity method investees. Refer to Note 14. | |||||||||||||||||||||||||||||
11 Income (loss) before income taxes was reduced by approximately $2 million for North America, $30 million for Bottling Investments and $52 million for Corporate, primarily due to other-than-temporary impairments of available-for-sale securities. Refer to Note 14. | |||||||||||||||||||||||||||||
12 Income (loss) before income taxes was increased by approximately $119 million for Bottling Investments and Corporate, primarily due to the gain on the sale of Remil and the sale of 49 percent of our interest in Coca-Cola Pakistan. Refer to Note 14. | |||||||||||||||||||||||||||||
13Operating income (loss) and income (loss) before income taxes were reduced by approximately | |||||||||||||||||||||||||||||
| |||||||||||||||||||||||||||||
15 | |||||||||||||||||||||||||||||
| Income (loss) before income taxes was increased by | |||||||||||||||||||||||||||||
Geographic Data(in millions)14.
| Year Ended December 31, | 2006 | 2005 | 2004 | ||||
| Net operating revenues: | |||||||
| United States | $ 6,662 | $ 6,299 | $ 6,084 | ||||
| International | 17,426 | 16,805 | 15,658 | ||||
| Net operating revenues | $ 24,088 | $ 23,104 | $ 21,742 | ||||
December 31, | 2006 | 2005 | 2004 | ||||
| Property, plant and equipment—net: | |||||||
| United States | $ 2,607 | $ 2,309 | $ 2,371 | ||||
| International | 4,296 | 3,522 | 3,720 | ||||
| Property, plant and equipment—net | $ 6,903 | $ 5,831 | $ 6,091 | ||||
Five-Year Compound Growth Rates
| Five Years Ended December 31, 2006 | Net Operating Revenues | Operating Income | |||
| Consolidated | 6.8 | % | 3.3 | % | |
| Africa | 11.7 | % | 9.0 | % | |
| East, South Asia and Pacific Rim | 8.0 | % | 2.8 | % | |
| European Union | 2.7 | % | 9.5 | % | |
| Latin America | 5.4 | % | 5.0 | % | |
| North America | 4.8 | % | 3.2 | % | |
| North Asia, Eurasia and Middle East | (0.6 | )% | 1.2 | % | |
| Bottling Investments | 28.6 | % | * | ||
| Corporate | * | * | |||
NOTE 21:19: SUBSEQUENT EVENTSEVENT
On January 8, 2007, our Company sold substantially allFebruary 25, 2010, we entered into a definitive agreement with CCE that will result in the acquisition of ourthe assets and liabilities of CCE's North American operations for consideration including the Company's current 34 percent ownership interest in Vonpar Refrescos S.A. ("Vonpar"),CCE valued at approximately $3.4 billion, based upon a bottler headquartered in Brazil. Total proceeds from30 day trailing average as of February 24, 2010, and the sale were approximately $238 million, and we recognized a gain on this saleassumption of approximately $71 million. Prior to this sale, our$8.9 billion of CCE debt. At closing, CCE shareowners other than the Company owned approximately 49 percent of Vonpar's outstandingwill exchange their current CCE common stock for common stock in a new entity, which will retain the name CCE and accounted forhold CCE's current European operations. This new entity initially will be 100 percent owned by the investment usingCCE shareowners other than the equity method.
On February 1, 2007, ourCompany. As a result of the transaction, the Company entered into an agreement to purchase Fuze Beverage, LLC, maker of Fuze enhanced juices and teaswill not own any interest in the U.S.new CCE entity. The acquisition, whichtransaction is subject to regulatory clearanceCCE shareowners' approval and certain other termsregulatory approvals.
In a concurrent transaction, we reached an agreement in principle to sell our ownership interests in our Norway bottling operation, Coca-Cola Drikker AS, and conditions, includes all Fuze Beverage, LLC brands, including the Vitalize, Refresh, Tea and Slenderize lines under the Fuze trademark, WaterPlus enhanced water products, and license rightsour Sweden bottling operation, Coca-Cola Drycker Sverige AB, to the NOS Energy Drink brands. Ifnew CCE entity for approximately $822 million in cash. The transactions are subject to certain regulatory clearance is obtained,approvals.
We expect the transfer of ownership is expected to occur withintransactions will close in the firstfourth quarter of 2007.2010.
In addition, we granted the new CCE entity the right to acquire our majority interest in our German bottling operation, CCEAG, 18 to 36 months after closing of the North America transaction, at the then current fair value.
REPORT OF MANAGEMENT ON INTERNAL CONTROL OVER FINANCIAL REPORTING
The Coca-Cola Company and Subsidiaries
Management's Responsibility for the Financial Statements
Management of the Company is responsible for the preparation and integrity of the consolidated financial statements appearing in our annual report on Form 10-K. The financial statements were prepared in conformity with generally accepted accounting principles appropriate in the circumstances and, accordingly, include certain amounts based on our best judgments and estimates. Financial information in this annual report on Form 10-K is consistent with that in the financial statements.
Management of the Company is responsible for establishing and maintaining adequatea system of internal control over financial reporting as such term is defined in Rule 13a-15(f) under the Securities Exchange Act of 1934 ("Exchange Act"). The Company's internal control over financial reporting is designedcontrols and procedures to provide reasonable assurance regarding the reliability of financial reporting and the preparation of the consolidated financial statements. Our internal control over financial reportingsystem is supported by a program of internal audits and appropriate reviews by management, written policies and guidelines, careful selection and training of qualified personnel and a written Code of Business Conduct adopted by our Company's Board of Directors, applicable to all Company Directors and all officers and employees of our Company and subsidiaries. In addition, our Company's Board of Directors adopted a written Code of Business Conduct for Non-Employee Directors which reflects the same principles and values as our Code of Business Conduct for officers and employees but focuses on matters of relevance to non-employee Directors.
Because of its inherent limitations, internal control over financial reportingcontrols may not prevent or detect misstatements and, even when determined to be effective, can only provide reasonable assurance with respect to financial statement preparation and presentation. Also, projections of any evaluation of effectiveness to future periods are subject to the risk that controls may become inadequate because of changes in conditions, or that the degree of compliance with the policies or procedures may deteriorate.
Management's Report on Internal Control Over Financial Reporting
Management of the Company is responsible for establishing and maintaining adequate internal control over financial reporting as such term is defined in Rule 13a-15(f) under the Securities Exchange Act of 1934 ("Exchange Act"). Management assessed the effectiveness of the Company's internal control over financial reporting as of December 31, 2009. In making this assessment, management used the criteria set forth by the Committee of Sponsoring Organizations of the Treadway Commission (COSO) inInternal Control — Integrated Framework. Based on this assessment, management believes that the Company maintained effective internal control over financial reporting as of December 31, 2009.
The Company's independent auditors, Ernst & Young LLP, a registered public accounting firm, are appointed by the Audit Committee of the Company's Board of Directors, subject to ratification by our Company's shareowners. Ernst & Young LLP has audited and reported on the consolidated financial statements of The Coca-Cola Company and subsidiaries and the Company's internal control over financial reporting. The reports of the independent auditors are contained in this annual report.
Audit Committee's Responsibility
The Audit Committee of our Company's Board of Directors, composed solely of Directors who are independent in accordance with the requirements of the New York Stock Exchange listing standards, the Exchange Act, and the Company's Corporate Governance Guidelines, meets with the independent auditors, management and internal auditors periodically to discuss internal control over financial reportingcontrols and auditing and financial reporting matters. The Audit Committee reviews with the independent auditors the scope and results of the audit effort. The Audit Committee also meets periodically with the independent auditors and the chief internal auditor without management present to ensure that the independent auditors and the chief internal auditor have free access to the Audit Committee. Our Audit Committee's Report can be found in the Company's 20072010 Proxy statement.Statement.
Management assessed the effectiveness of the Company's internal control over financial reporting as of December 31, 2006. In making this assessment, management used the criteria set forth by the Committee of Sponsoring Organizations of the Treadway Commission (COSO) inInternal Control—Integrated Framework. During 2006, the Company acquired Kerry Beverages Limited (subsequently renamed Coca-Cola China Industries Limited), Apollinaris GmbH and TJC Holdings (Pty) Ltd. and began consolidating the operations of Brucephil, Inc. Refer to Note 19 of Notes to Consolidated Financial Statements for additional information regarding these events. Management has excluded these businesses from its evaluation of the effectiveness of the Company's internal control over financial reporting as of December 31, 2006. The net operating revenues attributable to these businesses represented approximately 1.6 percent of the Company's consolidated net operating revenues for the year ended December 31, 2006, and their aggregate total assets represented approximately 6.1 percent of the Company's consolidated total assets as of December 31, 2006. Based on our assessment, management believes that the Company maintained effective internal control over financial reporting as of December 31, 2006.
The Company's independent auditors, Ernst & Young LLP, a registered public accounting firm, are appointed by the Audit Committee of the Company's Board of Directors, subject to ratification by our Company's shareowners. Ernst & Young LLP have audited and reported on the consolidated financial statements of The Coca-Cola Company and subsidiaries, management's assessment of the effectiveness of the Company's internal control over financial reporting and the effectiveness of the Company's internal control over financial reporting. The reports of the independent auditors are contained in this annual report.
  | ||
| Chairman of the Board of Directors, February 26, 2010 | Vice President and Controller | |
February | ||
  | ||
| Gary P. Fayard Executive Vice President and Chief Financial Officer | ||
February |
Report of Independent Registered Public Accounting Firm
Board of Directors and Shareowners
The Coca-Cola Company
We have audited the accompanying consolidated balance sheets of The Coca-Cola Company and subsidiaries as of December 31, 20062009 and 2005,2008, and the related consolidated statements of income, shareowners' equity, and cash flows for each of the three years in the period ended December 31, 2006.2009. These financial statements are the responsibility of the Company's management. Our responsibility is to express an opinion on these financial statements based on our audits.
We conducted our audits in accordance with the standards of the Public Company Accounting Oversight Board (United States). Those standards require that we plan and perform the audit to obtain reasonable assurance about whether the financial statements are free of material misstatement. An audit includes examining, on a test basis, evidence supporting the amounts and disclosures in the financial statements. An audit also includes assessing the accounting principles used and significant estimates made by management, as well as evaluating the overall financial statement presentation. We believe that our audits provide a reasonable basis for our opinion.
In our opinion, the financial statements referred to above present fairly, in all material respects, the consolidated financial position of The Coca-Cola Company and subsidiaries at December 31, 20062009 and 2005,2008, and the consolidated results of their operations and their cash flows for each of the three years in the period ended December 31, 2006,2009, in conformity with U.S. generally accepted accounting principles.
As discussed in Note 1 to the consolidated financial statements, in 20062007 the Company adopted SFAS No. 158 related to defined benefit pension and other postretirement plans.changed its method of accounting for uncertainty in income taxes.
We also have audited, in accordance with the standards of the Public Company Accounting Oversight Board (United States), the effectiveness of The Coca-Cola Company and subsidiaries' internal control over financial reporting as of December 31, 2006,2009, based on criteria established inInternal Control—Control — Integrated Framework issued by the Committee of Sponsoring Organizations of the Treadway Commission and our report dated February 20, 2007,26, 2010 expressed an unqualified opinion thereon.
  |
Atlanta, Georgia
February 20, 200726, 2010
Report of Independent Registered Public Accounting Firm
on Internal Control Over Financial Reporting
Board of Directors and Shareowners
The Coca-Cola Company
We have audited management's assessment, included in the accompanying Report of Management on Internal Control Over Financial Reporting, that The Coca-Cola Company and subsidiaries maintained effectivesubsidiaries' internal control over financial reporting as of December 31, 2006,2009, based on criteria established inInternal Control—Control — Integrated Framework issued by the Committee of Sponsoring Organizations of the Treadway Commission (the COSO criteria). The Coca-Cola Company'sCompany and subsidiaries' management is responsible for maintaining effective internal control over financial reporting, and for its assessment of the effectiveness of internal control over financial reporting.reporting included in the accompanying Management's Report on Internal Control Over Financial Reporting. Our responsibility is to express an opinion on management's assessment and an opinion on the effectiveness of the Company's internal control over financial reporting based on our audit.
We conducted our audit in accordance with the standards of the Public Company Accounting Oversight Board (United States). Those standards require that we plan and perform the audit to obtain reasonable assurance about whether effective internal control over financial reporting was maintained in all material respects. Our audit included obtaining an understanding of internal control over financial reporting, evaluating management's assessment,assessing the risk that a material weakness exists, testing and evaluating the design and operating effectiveness of internal control based on the assessed risk, and performing such other procedures as we considered necessary in the circumstances. We believe that our audit provides a reasonable basis for our opinion.
A company's internal control over financial reporting is a process designed to provide reasonable assurance regarding the reliability of financial reporting and the preparation of financial statements for external purposes in accordance with generally accepted accounting principles. A company's internal control over financial reporting includes those policies and procedures that (1) pertain to the maintenance of records that, in reasonable detail, accurately and fairly reflect the transactions and dispositions of the assets of the company; (2) provide reasonable assurance that transactions are recorded as necessary to permit preparation of financial statements in accordance with generally accepted accounting principles, and that receipts and expenditures of the company are being made only in accordance with authorizations of management and directors of the company; and (3) provide reasonable assurance regarding prevention or timely detection of unauthorized acquisition, use, or disposition of the company's assets that could have a material effect on the financial statements.
Because of its inherent limitations, internal control over financial reporting may not prevent or detect misstatements. Also, projections of any evaluation of effectiveness to future periods are subject to the risk that controls may become inadequate because of changes in conditions, or that the degree of compliance with the policies or procedures may deteriorate.
As indicated in the accompanying Report of Management on Internal Control Over Financial Reporting, management's assessment of and conclusion on the effectiveness of internal control over financial reporting did not include the internal controls of Kerry Beverages Limited (subsequently renamed Coca-Cola China Industries Limited), Brucephil, Inc., Apollinaris GmbH and TJC Holdings (Pty) Ltd. which are included in the 2006 consolidated financial statements of The Coca-Cola Company and subsidiaries and constituted approximately 6.1 percent of the Company's consolidated total assets as of December 31, 2006 and approximately 1.6 percent of the Company's consolidated net operating revenues for the year then ended. Our audit of internal control over financial reporting of The Coca-Cola Company also did not include an evaluation of the internal control over financial reporting of Kerry Beverages Limited (subsequently renamed Coca-Cola China Industries Limited), Brucephil, Inc., Apollinaris GmbH and TJC Holdings (Pty) Ltd.
In our opinion, management's assessment that The Coca-Cola Company and subsidiaries maintained effective internal control over financial reporting as of December 31, 2006, is fairly stated, in all material respects, based on the COSO criteria. Also, in our opinion, The Coca-Cola Company and subsidiaries maintained, in all material respects, effective internal control over financial reporting as of December 31, 2006,2009, based on the COSO criteria.
We also have audited, in accordance with the standards of the Public Company Accounting Oversight Board (United States), the consolidated balance sheets of The Coca-Cola Company and subsidiaries as of December 31, 20062009 and 2005,2008, and the related consolidated statements of income, shareowners' equity, and cash flows for each of the three years in the period ended December 31, 2006,2009, and our report dated February 20, 2007,26, 2010 expressed an unqualified opinion thereon.
|
Atlanta, Georgia
February 20, 200726, 2010
| Year Ended December 31, | First Quarter | Second Quarter | Third Quarter | Fourth Quarter | Full Year | |||||
(In millions, except per share data) | ||||||||||
| 2006 | ||||||||||
| Net operating revenues | $ 5,226 | $ 6,476 | $ 6,454 | $ 5,932 | $ 24,088 | |||||
| Gross profit | 3,500 | 4,366 | 4,189 | 3,869 | 15,924 | |||||
| Net income | 1,106 | 1,836 | 1,460 | 678 | 5,080 | |||||
| Basic net income per share | $ 0.47 | $ 0.78 | $ 0.62 | $ 0.29 | $ 2.16 | |||||
| Diluted net income per share | $ 0.47 | $ 0.78 | $ 0.62 | $ 0.29 | $ 2.16 | |||||
| 2005 | ||||||||||
| Net operating revenues | $ 5,206 | $ 6,310 | $ 6,037 | $ 5,551 | $ 23,104 | |||||
| Gross profit | 3,388 | 4,164 | 3,802 | 3,555 | 14,909 | |||||
| Net income | 1,002 | 1,723 | 1,283 | 864 | 4,872 | |||||
| Basic net income per share | $ 0.42 | $ 0.72 | $ 0.54 | $ 0.36 | $ 2.04 | |||||
| Diluted net income per share | $ 0.42 | $ 0.72 | $ 0.54 | $ 0.36 | $ 2.04 | |||||
| First Quarter | Second Quarter | Third Quarter | Fourth Quarter | Full Year | ||||||||||||
(In millions except per share data) | ||||||||||||||||
2009 | ||||||||||||||||
Net operating revenues | $ 7,169 | $ 8,267 | $ 8,044 | $ 7,510 | $ 30,990 | |||||||||||
Gross profit | 4,579 | 5,354 | 5,110 | 4,859 | 19,902 | |||||||||||
Net income attributable to shareowners of The Coca-Cola Company | 1,348 | 2,037 | 1,896 | 1,543 | 6,824 | |||||||||||
Basic net income per share | $ 0.58 | $ 0.88 | $ 0.82 | $ 0.67 | $ 2.95 | |||||||||||
Diluted net income per share | $ 0.58 | $ 0.88 | $ 0.81 | $ 0.66 | $ 2.93 | |||||||||||
2008 | ||||||||||||||||
Net operating revenues | $ 7,379 | $ 9,046 | $ 8,393 | $ 7,126 | $ 31,944 | |||||||||||
Gross profit | 4,755 | 5,884 | 5,373 | 4,558 | 20,570 | |||||||||||
Net income attributable to shareowners of The Coca-Cola Company | 1,500 | 1,422 | 1,890 | 995 | 5,807 | |||||||||||
Basic net income per share | $ 0.65 | $ 0.61 | $ 0.82 | $ 0.43 | $ 2.51 | |||||||||||
Diluted net income per share | $ 0.64 | $ 0.61 | $ 0.81 | $ 0.43 | $ 2.49 | |||||||||||
Our reporting period ends on the Friday closest to the last day of the quarterly calendar period. Our fiscal year ends on December 31 regardless of the day of the week on which December 31 falls.
The Company's first quarter of 20062009 results were impacted by one lessfive additional shipping daydays as compared to the first quarter of 2005.2008. Additionally, the Company recorded the following transactions which impacted results:
In the second quarter of 2006,2009, the Company recorded the following transactions which impacted results:
In the third quarter of 2006,2009, the Company recorded the following transactions which impacted results:
The Company's fourth quarter of 20062009 results were impacted by one additionalsix fewer shipping daydays as compared to the fourth quarter of 2005.2008. Additionally, the Company recorded the following transactions which impacted results:
In the first quarter of 2005,2008, the Company recorded the following transactions which impacted results:
In the second quarter of 2005,2008, the Company recorded the following transactions which impacted results:
In the third quarter of 2005,2008, the Company recorded the following transactions which impacted results:
In the fourth quarter of 2005,2008, the Company recorded the following transactions which impacted results:
ITEM 9. CHANGES IN AND DISAGREEMENTS WITH ACCOUNTANTS ON ACCOUNTING AND FINANCIAL DISCLOSURE
Not applicable.
ITEM 9A. CONTROLS AND PROCEDURES
Evaluation of Disclosure Controls and Procedures
The Company, under the supervision and with the participation of its management, including the Chief Executive Officer and the Chief Financial Officer, evaluated the effectiveness of the design and operation of the Company's "disclosure controls and procedures" (as defined in Rule 13a-15(e) under the Securities Exchange Act of 1934, as amended (the "Exchange Act")) as of the end of the period covered by this report. Based on that evaluation, the Chief Executive Officer and the Chief Financial Officer concluded that the Company's disclosure controls and procedures arewere effective in timely making known to them material information relating to the Company and the Company's consolidated subsidiaries required to be disclosed in the Company's reports filed or submitted under the Exchange Act.as of December 31, 2009.
The report called for by Item 308(a) of Regulation S-K is incorporated herein by reference to Report of Management on Internal Control Over Financial Reporting included in Part II, "Item 8. Financial Statements and Supplementary Data"Attestation Report of this report. During 2006, the Company acquired Kerry Beverages Limited (subsequently renamed Coca-Cola China Industries Limited), Apollinaris GmbH and TJC Holdings (Pty) Ltd. and began consolidating the operationsIndependent Registered Public Accounting Firm
The report of Brucephil, Inc. Refer to Note 19 of Notes to Consolidated Financial Statements for additional information regarding these events. Management has excluded these businesses from its evaluation of the effectiveness of the Company'smanagement on our internal control over financial reporting as of December 31, 2006. The net operating revenues attributable to these businesses represented approximately 1.6 percent of2009 and the Company's consolidated net operating revenues for the year ended December 31, 2006, and their aggregate total assets represented approximately 6.1 percent of the Company's consolidated total assets as of December 31, 2006.
The attestation report called for by Item 308(b) of Regulation S-K is incorporated herein by reference to Report of Independent Registered Public Accounting Firmour independent registered public accounting firm on our internal control over financial reporting are set forth in Part II. "Item 8, Financial Statements and Supplementary Data" in this report.
Changes in Internal Control Over Financial Reporting included in Part II, "Item 8. Financial Statements and Supplementary Data" of this report.
There hashave been no changechanges in the Company's internal control over financial reporting during the quarter ended December 31, 20062009 that hashave materially affected, or isare reasonably likely to materially affect, the Company's internal control over financial reporting.
Additional Information
The Company is in the process of several productivity and transformation initiatives that include redesigning several key business processes in a number of areas. As business processes change related to these transformation initiatives, the Company identifies, documents and evaluates controls to ensure controls over our financial reporting remain effective.
Not applicable.
ITEM 10. DIRECTORS, EXECUTIVE OFFICERS AND CORPORATE GOVERNANCE
The information under the headings "Board of Directors," "Sectionprincipal heading "SECTION 16(a) Beneficial Ownership Reporting Compliance," "Information AboutBENEFICIAL OWNERSHIP REPORTING COMPLIANCE" and under the Board of Directors and Corporate Governance—The Audit Committee"subheadings "2010 Nominees for Director" and "Information About the Board of Directors and Corporate Governance—TheGovernance — Board Meetings and Board Committees" through the subsection entitled "Audit Committee" under the principal heading "ELECTION OF DIRECTORS" in the Company's 20072010 Proxy Statement is incorporated herein by reference. See Item X in Part I of this report for information regarding executive officers of the Company.
The Company has adopted a code of business conduct and ethics applicable to the Company's Directors, officers (including the Company's principal executive officer, principal financial officer and controller) and employees, known as the Code of Business Conduct. TheIn addition, the Company has adopted a Code of Business Conduct isfor Non-Employee Directors. Both Codes of Business Conduct are available on the Company's website. In the event that we amend or waive any of the provisions of the Code of Business Conduct applicable to our principal executive officer, principal financial officer or controller that relates to any element of the code of ethics definition enumerated in Item 406(b) of Regulation S-K, we intend to disclose the same on the Company's website at www.thecoca-colacompany.com.
On May 17, 2006, we filed with the New York Stock Exchange ("NYSE") the Annual CEO Certification regarding the Company's compliance with the NYSE's Corporate Governance listing standards as required by Section 303A-12(a) of the NYSE Listed Company Manual. In addition, the Company has filed as exhibits to this annual report and to the annual report on Form 10-K for the year ended December 31, 2005, the applicable certifications of its Chief Executive Officer and its Chief Financial Officer required under Section 302 of the Sarbanes-Oxley Act of 2002, regarding the quality of the Company's public disclosures.
ITEM 11. EXECUTIVE COMPENSATION
The information under the headings "Information About the Board of Directors and Corporate Governance—Director Compensation" and the information under the principal headings "EXECUTIVE"DIRECTOR COMPENSATION," "COMPENSATION DISCUSSION AND ANALYSIS," "REPORT OF THE COMPENSATION COMMITTEE," and "COMPENSATION COMMITTEE INTERLOCKS AND INSIDER PARTICIPATION" and "EXECUTIVE COMPENSATION" in the Company's 20072010 Proxy Statement is incorporated herein by reference.
ITEM 12. SECURITY OWNERSHIP OF CERTAIN BENEFICIAL OWNERS AND MANAGEMENT AND RELATED STOCKHOLDER MATTERS
The information under the principal headingheadings "EQUITY COMPENSATION PLAN INFORMATION,"INFORMATION" and the information under the headings "Ownership of Equity Securities in the Company," "Principal Shareowners" and "Ownership of Securities in Investee Companies""OWNERSHIP OF EQUITY SECURITIES OF THE COMPANY" in the Company's 20072010 Proxy Statement is incorporated herein by reference.
ITEM 13. CERTAIN RELATIONSHIPS AND RELATED TRANSACTIONS, AND DIRECTOR INDEPENDENCE
The information under the headings "Information About the Board of Directorssubheading "Independence and Corporate Governance" and "Certain Related Person Transactions" under the principal heading "ELECTION OF DIRECTORS" and the information under the principal headings "COMPENSATION COMMITTEE INTERLOCKS AND INSIDER PARTICIPATION,heading "COCA-COLA ENTERPRISES INC." and "CERTAIN INVESTEE COMPANIES" in the Company's 20072010 Proxy Statement is incorporated herein by reference.
ITEM 14. PRINCIPAL ACCOUNTANT FEES AND SERVICES
The information under the headingsubheadings "Audit Fees and All Other Fees" and "Audit Committee Pre-Approval of Audit and Permissible Non-Audit Services of Independent Auditors" below the principal heading "RATIFICATION OF THE APPOINTMENT OF ERNST & YOUNG LLP AS INDEPENDENT AUDITORS" in the Company's 20072010 Proxy Statement is incorporated herein by reference.
ITEM 15. EXHIBITS AND FINANCIAL STATEMENT SCHEDULES
Consolidated Statements of Income—Income — Years ended December 31, 2006, 20052009, 2008 and 2004.2007.
Consolidated Balance Sheets—Sheets — December 31, 20062009 and 2005.2008.
Consolidated Statements of Cash Flows—Flows — Years ended December 31, 2006, 20052009, 2008 and 2004.2007.
Consolidated Statements of Shareowners' Equity—Equity — Years ended December 31, 2006, 20052009, 2008 and 2004.2007.
Notes to Consolidated Financial Statements.
Report of Independent Registered Public Accounting Firm.
Report of Independent Registered Public Accounting Firm on Internal Control Over Financial Reporting.
The schedules for which provision is made in the applicable accounting regulations of the SECSecurities and Exchange Commission ("SEC") are not required under the related instructions or are inapplicable and, therefore, have been omitted.
In reviewing the agreements included as exhibits to this report, please remember they are included to provide you with information regarding their terms and are not intended to provide any other factual or disclosure information about the Company or the other parties to the agreements. The agreements contain representations and warranties by each of the parties to the applicable agreement. These representations and warranties have been made solely for the benefit of the other parties to the applicable agreement and:
Accordingly, these representations and warranties may not describe the actual state of affairs as of the date they were made or at any other time. Additional information about the Company may be found elsewhere in this report and the Company's other public filings, which are available without charge through the SEC's website at http://www.sec.gov.
| Exhibit No. | | ||
|---|---|---|---|
| 2.1 | |||
3.1 | Certificate of Incorporation of the Company, including Amendment of Certificate of Incorporation, effective May 1, | ||
3.2 | By-Laws of the Company, as amended and restated through | ||
4.1 | The Company agrees to furnish to the Securities and Exchange Commission, upon request, a copy of any instrument defining the rights of holders of long-term debt of the Company and all of its consolidated subsidiaries and unconsolidated subsidiaries for which financial statements are required to be filed with the SEC. | ||
4.2 | Amended and Restated Indenture dated as of April 26, 1988 between the Company and Deutsche Bank Trust Company Americas, as | ||
4.3 | First Supplemental Indenture dated as of | ||
4.4 | Second Supplemental Indenture dated as of | ||
4.5 | Form of | ||
4.6 | |||
Form of | |||
4.7 | Form of | ||
10.1 | Supplemental Disability Plan of the Company, as amended and restated effective January 1, | ||
10.2 | Performance Incentive Plan of the Company, | ||
10.3.1 | 1999 Stock Option Plan of the Company, |
| Exhibit No. | |||
|---|---|---|---|
| 10.3.2 | Form of Stock Option Agreement in connection with the 1999 Stock Option Plan of the Company — incorporated herein by reference to Exhibit 99.1 of the Company's Current Report on Form 8-K filed February 14, 2007.* | ||
10.3.3 | Form of Stock Option Agreement for E. Neville Isdell in connection with the 1999 Stock Option Plan of the Company — incorporated herein by reference to Exhibit 99.2 of the Company's Current Report on Form 8-K filed February 14, 2007.* | ||
10.3.4 | Form of Stock Option Agreement for E. Neville Isdell in connection with the 1999 Stock Option Plan of the Company, as | ||
10.3.5 | Form of Stock Option Agreement in connection with the 1999 Stock Option Plan of the Company, as adopted December 12, 2007 — incorporated herein by reference to Exhibit 10.8 of the Company's Current Report on Form 8-K filed February 21, 2008.* | ||
10.3.6 | Form of Stock Option Agreement in connection with the 1999 Stock Option Plan of the Company, as adopted February 18, 2009 — incorporated herein by reference to Exhibit 10.5 of the Company's Current Report on Form 8-K filed February 18, 2009.* | ||
10.4.1 | 2002 Stock Option Plan of the Company, | ||
10.4.2 | Form of Stock Option Agreement in connection with the 2002 Stock Option Plan, as | ||
10.4.3 | Form of Stock Option Agreement for E. Neville Isdell in connection with the 2002 Stock Option Plan, as | ||
10.4.4 | Form of Stock Option Agreement in connection with the 2002 Stock Option Plan, as adopted December 12, 2007 — incorporated herein by reference to Exhibit 10.9 of the Company's Current Report on Form 8-K filed on February 21, 2008.* | ||
10.4.5 | Form of Stock Option Agreement in connection with the 2002 Stock Option Plan, as adopted February 18, 2009 — incorporated herein by reference to Exhibit 10.6 of the Company's Current Report on Form 8-K filed on February 18, 2009.* | ||
10.5.1 | 2008 Stock Option Plan of the Company as amended and restated, effective February 18, 2009 — incorporated herein by reference to Exhibit 10.4 of the Company's Current Report on Form 8-K filed on February 18, 2009.* | ||
10.5.2 | Form of Stock Option Agreement for grants under the Company's 2008 Stock Option Plan — incorporated herein by reference to Exhibit 10.1 of the Company's Current Report on Form 8-K filed July 16, 2008.* | ||
10.5.3 | Form of Stock Option Agreement for grants under the Company's 2008 Stock Option Plan, as adopted February 18, 2009 — incorporated herein by reference to Exhibit 10.7 of the Company's Current Report on Form 8-K filed February 18, 2009.* | ||
10.6 | 1983 Restricted Stock Award Plan of the Company, as amended through December | ||
10.7.1 | 1989 Restricted Stock Award Plan of the Company, as amended through | ||
10.7.2 | Form of Restricted Stock Agreement (Performance Share Unit Agreement) in connection with the 1989 Restricted Stock Award Plan of the | ||
| Exhibit No. | |||
|---|---|---|---|
| 10.7.3 | Form of Restricted Stock Agreement (Performance Share Unit Agreement) in connection with the 1989 Restricted Stock Award Plan of the Company, effective as of December | ||
10.7.4 | Form of Restricted Stock Agreement (Performance Share Unit Agreement) for E. Neville Isdell in connection with the 1989 Restricted Stock Award Plan of the Company, as | ||
10.7.5 | |||
Form of Restricted Stock Agreement (Performance Share Unit Agreement) in connection with the 1989 Restricted Stock Award Plan of the | |||
10.7.6 | Form of Restricted Stock Agreement (Performance Share Unit Agreement) for E. Neville Isdell in connection with the 1989 Restricted Stock Award Plan of the | ||
10.7.7 | Form of Restricted Stock Agreement (Performance Share Unit Agreement) in connection with the 1989 Restricted Stock Award Plan of the Company — incorporated herein by reference to Exhibit 99.3 of the Company's Current Report on Form 8-K filed February 14, 2007.* | ||
10.7.8 | Form of Restricted Stock Agreement (Performance Share Unit Agreement) for E. Neville Isdell in connection with the 1989 Restricted Stock Award Plan of the Company, as adopted December 12, 2007 — incorporated herein by reference to Exhibit 10.4 of the Company's Current Report on Form 8-K filed February 21, 2008.* | ||
10.7.9 | Form of Restricted Stock Agreement (Performance Share Unit Agreement) in connection with the 1989 Restricted Stock Award Plan of the Company, as adopted December 12, 2007 — incorporated herein by reference to Exhibit 10.5 of the Company's Current Report on Form 8-K filed February 21, 2008.* | ||
10.7.10 | Form of Restricted Stock Agreement (Performance Share Unit Agreement) for France in connection with the 1989 Restricted Stock Award Plan of the Company, as adopted December 12, 2007 — incorporated herein by reference to Exhibit 10.6 of the Company's Current Report on Form 8-K filed February 21, 2008.* | ||
10.8.1 | Compensation Deferral & Investment Program of the Company, as amended, including Amendment Number Four dated November 28, | ||
10.8.2 | Amendment Number Five to the Compensation Deferral & Investment Program of the Company, effective as of January 1, | ||
10.8.3 | |||
Amendment Number Six to the Compensation Deferral & Investment Program of the Company, dated as of January 12, 2004, effective January 1, | |||
10.9.1 | Executive Medical Plan of the Company, as amended and restated effective January 1, | ||
10.9.2 | Amendment Number One to the Executive Medical Plan of the Company, dated April 15, | ||
10.9.3 | Amendment Number Two to the Executive Medical Plan of the Company, dated August 27, |
| Exhibit No. | |||
|---|---|---|---|
| 10.9.4 | Amendment Number Three to the Executive Medical Plan of the Company, dated December 29, 2004, effective January 1, | ||
10.9.5 | Amendment Number Four to the Executive Medical Plan of the | ||
10.9.6 | Amendment Number Five to the Executive Medical Plan of the Company, dated December 20, | ||
10.10.1 | Supplemental Pension Plan of the Company | ||
10.10.2 | Amendment One to the Company's Supplemental Pension Plan, dated May 5, 2008 — incorporated herein by reference to Exhibit 10.10.2 of the Company's Annual Report on Form 10-K | ||
10.10.3 | Amendment | ||
10.10.4 | Amendment Three to the Company's Supplemental Pension Plan, dated December 18, 2008 — incorporated herein by reference to Exhibit 10.10.4 of the Company's Annual Report on Form 10-K for the year ended December 31, 2008.* | ||
10.10.5 | Amendment Four to the Company's Supplemental Pension Plan, dated April 28, 2009 — incorporated herein by reference to Exhibit 10.6 of the Company's Quarterly Report on Form 10-Q for the quarter ended April 3, 2009.* | ||
10.10.6 | Supplemental Pension Plan, Amended and Restated Effective January 1, 2010.* | ||
10.11.1 | Supplemental Thrift Plan of the Company (successor plan to the Supplemental Benefit Plan | ||
10.11.2 | Amendment | ||
10.11.3 | Amendment | ||
10.12 | The Coca-Cola Company | ||
| Deferred Compensation Plan for Non-Employee Directors, | |||
10.13 | Compensation Plan for Non-Employee Directors of The Coca-Cola | ||
10.14 | |||
The Coca-Cola Company Compensation and |
| Exhibit No. | ||||
|---|---|---|---|---|
| Long-Term Performance Incentive Plan of the Company, as amended and restated effective December 13, | ||||
10.16 | Executive Incentive Plan of the Company, adopted as of February 14, | |||
10.17 | Form of United States Master Bottler Contract | |||
10.18.1 | Deferred Compensation Plan of the Company, as amended and restated | |||
10.18.2 | Amendment One, dated December 16, 2008, to the Company's Deferred Compensation Plan, as amended and restated effective January 1, 2008 — incorporated herein by reference to Exhibit 10.5 of the Company's Quarterly Report on Form 10-Q for the quarter ended April 3, 2009.* | |||
10.18.3 | Deferred Compensation Plan Delegation of Authority from the Compensation Committee to the Management Committee, adopted as of December 17, | |||
10.19 | ||||
The Coca-Cola Export Corporation Employee Share Plan, effective as of March 13, | ||||
10.20 | Employees' Savings and Share Ownership Plan of Coca-Cola Ltd., effective as of January 1, | |||
10.21 | Share Purchase | |||
10.22.1 | ||||
The Coca-Cola Company Benefits Plan for Members of the Board of Directors, as amended and restated through April 14, | |||
10.22.2 | Amendment Number One to the Company's Benefits Plan for Members of the Board of Directors, dated December 16, | ||
10.23 | |||
Letter, dated September 16, 2004, from the Company to E. Neville | |||
10.24 | Stock Award Agreement for E. Neville Isdell, dated September 14, 2004, under the 1989 Restricted Stock Award Plan of the | ||
10.25 | Stock Option Agreement for E. Neville Isdell, dated July 22, 2004, under the 2002 Stock Option Plan of the Company, as | ||
10.26 | |||
Employment Agreement, dated as of February 20, 2003, between the Company and José Octavio |
| Exhibit No. | |||
|---|---|---|---|
| 10.27 | Severance Pay Plan of the Company, | ||
10.28 | Amendment One to | ||
10.29 | |||
Order Instituting Cease and Desist Proceedings, Making Findings and Imposing a Cease-and-Desist Order Pursuant to Section 8A of the Securities Act of 1933 and Section 21C of the Securities Exchange Act of | |||
10.30 | Offer of Settlement of The Coca-Cola | ||
10.31 | Final Undertaking from The Coca-Cola Company and certain of its bottlers, adopted by the European Commission on June 22, 2005, relating to various commercial practices in the European Economic | ||
10.32 | Employment Agreement, effective as of May 1, 2005, between Refreshment Services, S.A.S. and Dominique Reiniche, dated September 7, | ||
10.33 | Refreshment Services S.A.S. Defined Benefit Plan, dated September 25, | ||
10.34 | Share Purchase Agreement among Coca-Cola South Asia Holdings, Inc. and San Miguel Corporation, San Miguel Beverages (L) Pte Limited and San Miguel Holdings Limited in connection with the Company's purchase of Coca-Cola Bottlers Philippines, Inc., dated December 23, | ||
10.35 | Cooperation Agreement between Coca-Cola South Asia Holdings, Inc. and San Miguel Corporation in connection with the Company's purchase of Coca-Cola Bottlers Philippines, Inc., dated December 23, | ||
10.36 | Roll-Over Agreement among Tata Tea (GB) Investments Limited, Tata Limited and Mustang Acquisition Company, LLP, dated as of May 24, 2007 — incorporated herein by reference to Exhibit 99.1 to the Company's Current Report on Form 8-K filed on May 31, 2007. | ||
10.37 | Put and Call Option Agreement among Tata Tea (GB) Limited, Tata Tea (GB) Investments Limited, Tata Limited and The Coca-Cola Company, dated as of May 24, 2007 — incorporated herein by reference to Exhibit 99.2 to the Company's Current Report on Form 8-K filed on May 31, 2007. | ||
10.38 | Voting Agreement among Tata Limited, Tata Tea (GB) Investments Limited and The Coca-Cola Company, dated as of May 24, 2007 — incorporated herein by reference to Exhibit 99.3 to the Company's Current Report on Form 8-K filed on May 31, 2007. | ||
10.39 | Supplemental Indemnity Agreement between J. Darius Bikoff and The Coca-Cola Company, dated May 24, 2007 — incorporated herein by reference to Exhibit 99.4 to the Company's Current Report on Form 8-K filed on May 31, 2007. | ||
10.40 | Form of Investment Agreement, dated as of May 24, 2007, between each of J. Darius Bikoff, Michael Repole and Michael Venuti and The Coca-Cola Company — incorporated herein by reference to Exhibit 99.5 to the Company's Current Report on Form 8-K filed on May 31, 2007. | ||
10.41 | Separation Agreement between the Company and Danny Strickland, dated June 5, 2008 — incorporated herein by reference to Exhibit 10.2 to the Company's Quarterly Report on Form 10-Q for the quarter ended June 27, 2008.* |
| Exhibit No. | |||
|---|---|---|---|
| 10.42.1 | Offer Letter dated July 20, 2007 from the Company to Joseph V. Tripodi, including Agreement on Confidentiality, Non-Competition and Non-Solicitation, dated July 20, 2007 — incorporated herein by reference to Exhibit 10.1 to the Company's Quarterly Report on Form 10-Q for the quarter ended September 28, 2007.* | ||
10.42.2 | Agreement between the Company and Joseph V. Tripodi, dated December 15, 2008 — incorporated herein by reference to Exhibit 10.47.2 of the Company's Annual Report on Form 10-K for the year ended December 31, 2008.* | ||
10.43 | Letter, dated July 17, 2008, from Cathleen P. Black, Chair of the Compensation Committee of the Board of Directors of the Company, to Muhtar Kent — incorporated herein by reference to Exhibit 10.1 of the Company's Current Report on Form 8-K filed July 21, 2008.* | ||
10.44 | Separation Agreement between the Company and Tom Mattia, dated August 28, 2008 — incorporated herein by reference to Exhibit 10.3 of the Company's Quarterly Report on Form 10-Q for the quarter ended September 26, 2008.* | ||
10.45 | Separation Agreement between the Company and Robert Leechman, dated February 24, 2009, including form of Full and Complete Release and Agreement on Competition, Trade Secrets and Confidentiality — incorporated herein by reference to Exhibit 10.9 of the Company's Quarterly Report on Form 10-Q for the quarter ended April 3, 2009.* | ||
10.46 | Separation Agreement between the Company and Cynthia McCague, dated June 22, 2009 (effective as of July 22, 2009), including form of Full and Complete Release and Agreement on Competition, Trade Secrets and Confidentiality and summary of anticipated consulting agreement — incorporated herein by reference to Exhibit 10.1 of the Company's Quarterly Report on Form 10-Q for the quarter ended October 2, 2009.* | ||
10.47 | Letter of Understanding between the Company and Ceree Eberly, dated October 26, 2009, including Agreement on Confidentiality, Non-Competition and Non-Solicitation, dated November 1, 2009.* | ||
10.48 | Irrevocable Undertaking by and among Atlantic Industries, China Hui Yuan Juice Holdings Co., Ltd. and Mr. Zhu Xinli dated August 31, 2008 — incorporated herein by reference to Exhibit 10.1 of the Company's Current Report on Form 8-K filed September 5, 2008. | ||
10.49 | Irrevocable Undertaking by and among Atlantic Industries, Danone Asia Pte. Ltd. and Group Danone S.A. dated August 31, 2008 — incorporated herein by reference to Exhibit 10.2 of the Company's Current Report on Form 8-K filed September 5, 2008. | ||
10.50 | Irrevocable Undertaking by and among Atlantic Industries, Gourmet Grace International Limited and Warburg Pincus Private Equity IX, LP dated August 31, 2008 — incorporated herein by reference to Exhibit 10.3 of the Company's Current Report on Form 8-K filed September 5, 2008. | ||
10.51 | Deed of Non-Competition by and among Mr. Zhu Xinli, China Huiyuan Juice Group Limited and Atlantic Industries dated August 31, 2008 — incorporated herein by reference to Exhibit 10.4 of the Company's Current Report on Form 8-K filed September 5, 2008. | ||
10.52 | The Coca-Cola Export Corporation Overseas Retirement Plan, as amended and restated, effective October 1, 2007 — incorporated herein by reference to Exhibit 10.55 of the Company's Annual Report on Form 10-K for the year ended December 31, 2008.* | ||
10.53.1 | The Coca-Cola Export Corporation International Thrift Plan, as amended and restated, effective October 1, 2007 — incorporated herein by reference to Exhibit 10.56.1 of the Company's Annual Report on Form 10-K for the year ended December 31, 2008.* | ||
10.53.2 | Amendment Number One to The Coca-Cola Export Corporation International Thrift Plan, as amended and restated, effective October 1, 2007 — incorporated herein by reference to Exhibit 10.56.2 of the Company's Annual Report on Form 10-K for the year ended December 31, 2008.* | ||
12.1 | Computation of Ratios of Earnings to Fixed Charges for the years ended December 31, 2009, 2008, 2007, 2006 | ||
| Exhibit No. | |||
|---|---|---|---|
| 21.1 | List of subsidiaries of the Company as of December 31, | ||
23.1 | Consent of Independent Registered Public Accounting Firm. | ||
24.1 | Powers of Attorney of Officers and Directors signing this report. | ||
31.1 | Rule 13a-14(a)/15d-14(a) Certification, executed by | ||
31.2 | Rule 13a-14(a)/15d-14(a) Certification, executed by Gary P. Fayard, Executive Vice President and Chief Financial Officer of The Coca-Cola Company. | ||
32.1 | Certifications required by Rule 13a-14(b) or Rule 15d-14(b) and Section 1350 of Chapter 63 of Title 18 of the United States Code (18 U.S.C. 1350), executed by | ||
101 | The following financial information from The Coca-Cola Company's Annual Report on Form 10-K for the year ended December 31, 2009, formatted in XBRL (eXtensible Business Reporting Language): (i) Consolidated Statements of Income, (ii) Consolidated Balance Sheets, (iii) Consolidated Statements of Cash Flows, (iv) Consolidated Statements of Shareowners' Equity and (v) the Notes to Consolidated Financial Statements, tagged as blocks of text. | ||
| * | Management contracts and compensatory plans and arrangements required to be filed as exhibits pursuant to Item 15(c) of this report. |
Pursuant to the requirements of Section 13 or 15(d) of the Securities Exchange Act of 1934, the Registrant has duly caused this report to be signed on its behalf by the undersigned, thereunto duly authorized.
| THE COCA-COLA COMPANY | ||||
| (Registrant) | ||||
By: | /s/ MUHTAR KENT | |||
Chairman of the Board of Directors, Chief Executive Officer and President | ||||
Date: February | ||||
Pursuant to the requirements of the Securities Exchange Act of 1934, this report has been signed below by the following persons on behalf of the Registrant and in the capacities and on the dates indicated.
| /s/ | ||
| MUHTAR KENT | * | |
| Muhtar Kent Chairman of the Board of Directors, Chief Executive Officer, President and a Director (Principal Executive Officer) | Cathleen P. Black Director | |
February | ||
/s/ GARY P. FAYARD | * | |
| Fayard Executive Vice President and Chief Financial Officer (Principal Financial Officer) | Barry Diller Director | |
February | ||
/s/ KATHY N. WALLER | * | |
| Kathy N. Waller Vice President and Controller (Principal Accounting Officer) | Alexis M. Herman Director | |
February | February | |
* | * | |
| Allen Director | Donald R. Keough Director | |
February | February | |
* | * | |
| Ronald W. Allen Director | Maria Elena Lagomasino Director | |
February | February |
* | * | |
| Donald F. McHenry Director | Peter V. Ueberroth Director | |
February | February 26, 2010 | |
* | * | |
| Sam Nunn Director | Director | |
February 26, 2010 | February 26, 2010 | |
* | * | |
| James D. Robinson III Director | James B. Williams Director | |
February 26, 2010 | February 26, 2010 |
*By: | /s/ GLORIA K. BOWDEN Gloria K. Bowden Attorney-in-fact | |||
February |
![]()

Printed on Recycled Paper