Use these links to rapidly review the document
KEY ENERGY SERVICES, INC. ANNUAL REPORT ON FORM 10-K For the Year Ended December 31, 2006 INDEX2007
ITEM 8. Consolidated Financial Statements and Supplementary Data
UNITED STATES
SECURITIES AND EXCHANGE COMMISSION
Washington, D.C. 20549
FORM 10-K
| (Mark One) | |
ý |
ANNUAL REPORT PURSUANT TO SECTION 13 OR 15(d) OF THE SECURITIES EXCHANGE ACT OF 1934 |
For the fiscal year ended December 31, 20062007 |
o |
TRANSITION REPORT PURSUANT TO SECTION 13 OR 15(d) OF THE SECURITIES EXCHANGE ACT OF 1934 |
Commission file number 1-8038
KEY ENERGY SERVICES, INC.
(Exact name of registrant as specified in its charter)
Maryland
(State or other jurisdiction of
incorporation or organization) | | 04-2648081
(I.R.S. Employer
Identification No.)
|
1301 McKinney Street
Suite 1800
Houston, Texas 77010
(Address of principal executive offices, including ZIP Code)
(713) 651-4300
(Registrant's telephone number, including area code)
Securities registered pursuant to Section 12(b) of the Act:
1301 McKinney Street
Suite 1800
Houston, Texas 77010
(Address of principal executive offices, including ZIP Code) |
(713) 651-4300
(Registrant's telephone number, including area code) |
Securities registered pursuant to Section 12(b) of the Act: |
Title of Each Class
|
|
Name of Exchange on Which Registered
|
|---|
NoneCommon Stock, $0.10 par value | | New York Stock Exchange |
Securities registered pursuant to Section 12(g) of the Act: |
Title of Each Class
|
| None |
Securities registered pursuant to Section 12(g) of the Act:
Title of Each Class
Common Stock, $0.10 par value
Indicate by check mark if the Registrant is a well-known seasoned issuer (as defined in Rule 405 of the Securities Act). Yes o No ý
Indicate by check mark if the registrantRegistrant is not required to file reports pursuant to Section 13 or Section 15(d) of the Exchange Act. Yes o No ý
Indicate by check mark whether the Registrant (1) has filed all reports required to be filed by Section 13 or 15(d) of the Securities Exchange Act of 1934 during the preceding 12 months (or for such shorter period that the Registrant was required to file such reports), and (2) has been subject to such filing requirements for the past 90 days: Yes oý No ýo
Indicate by check mark if disclosure of delinquent filers pursuant to Item 405 of Regulation S-K is not contained herein, and will not be contained, to the best of Registrant's knowledge, in definitive proxy or information statement incorporated by reference in Part III of this Form 10-K or any amendment to this Form 10-K. /x/o
Indicate by check mark whether the registrantRegistrant is a large accelerated filer, an accelerated filer, a non-accelerated filer, or a non-accelerated filer.smaller reporting company. See definitionthe definitions of "large accelerated filer," "accelerated filerfiler" and large accelerated filer""smaller reporting company" in Rule 12b-2 of the Exchange Act. (Check one):
| Large accelerated filer ý | | Accelerated filer o | | Non-accelerated filer o | | Smaller reporting company o |
| | | | (Do not check if a smaller reporting company) | | |
Large accelerated filer ý Accelerated filer o Non-accelerated filer o
Indicate by check mark whether the Registrant is a shell company (as defined in Rule 12b-2 of the Exchange Act). Yes o No ý
As of June 30, 2007, the aggregate market value of the common stock of the Registrant held by non-affiliates of the Registrant, based on the $18.53 per share price for the registrant'sRegistrant's common stock as quoted by the National Quotation Bureau's Pink Sheets on June 29, 2007 was $2,145,411,905 (for purposes of calculating these amounts, only directors, officers and beneficial owners of 10% or more of the outstanding capital stock of the Registrant have been deemed affiliates).
As of June 30, 2007,February 20, 2008, the number of outstanding shares of common stock of the Registrant was 131,593,695.128,149,793.
DOCUMENTS INCORPORATED BY REFERENCE
None.Portions of the Registrant's definitive proxy statement to be filed pursuant to Regulation 14A under the Securities Exchange Act of 1934 with respect to the 2008 Annual Meeting of Shareholders are incorporated by reference into Part III of this Form 10-K.
KEY ENERGY SERVICES, INC.
ANNUAL REPORT ON FORM 10-K
For the Year Ended December 31, 20062007
INDEX
CAUTIONARY NOTE REGARDING FORWARD LOOKING STATEMENTS
In addition to statements of historical fact, this report contains forward-looking statements within the meaning of the Private Securities Litigation Reform Act of 1995. Statements that are not historical in nature or that relate to future events and conditions are, or may be deemed to be, forward-looking statements. These "forward-looking statements" are based on our current expectations, estimates and projections about current expectations, estimates and projections about the Company, our industry and management's beliefs and assumptions concerning future events and financial trends affecting our financial condition and results of operations. In some cases, you can identify these statements by terminology such as "may," "will," "predicts," "projects," "potential" or "continue" or the negative of such terms and other comparable terminology. These statements are only predictions and are subject to substantial risks and uncertainties. In evaluating those statements, you should carefully consider the information above and as well as the risks outlined in Item 1A. "Risk Factors." Actual performance or results may differ materially and adversely.
We undertake no obligation to update any forward-looking statement to reflect events or circumstances after the date of this report except as required by law. All of our written and oral forward-looking statements are expressly qualified by these cautionary statements and any other cautionary statements that may accompany such forward-looking statements.
NOTE REGARDING OUR FINANCIAL REPORTING PROCESS
This report has been delayed due to our restatement and financial reporting process for periods ending December 31, 2003, which began in March 2004. That process was completed on October 19, 2006. Our 2003 Financial and Informational Report on Form 8-K/A, filed with the Securities and Exchange Commission ("SEC") on October 26, 2006, included an audited 2003 consolidated balance sheet which presented our financial condition as of December 31, 2003 in accordance with Generally Accepted Accounting Principles ("GAAP"). We did not present other consolidated financial statements in accordance with GAAP as we were unable to determine with sufficient certainty the appropriate period(s) in 2003 or before in which to record certain write-offs and write-downs that were identified in our restatement process. Our former registered public accounting firm expressed an unqualified opinion that the 2003 balance sheet fairly presented our financial condition on December 31, 2003. The firm also audited the other financial statements presented in the 2003 Financial and Informational Report. It opined that the financial statements other than the 2003 balance sheet did not fairly present our financial condition or results of operations or cash flows for the periods covered in accordance with GAAP. Investors should refer to the 2003 Financial and Informational Report for a full description of the restatement and financial reporting process for periods prior to 2004.Investors are strongly cautioned not to rely on any of the financial statements contained in the 2003 Financial and Informational Report, other than the 2003 balance sheet, as fairly presenting, for the periods covered, our financial condition or our results of operations or cash flows, in accordance with GAAP. Any information set forth in that report that incorporates or discusses information contained in the financial statements is subject to the same caution. You also should not rely on any of our previously-filed Annual Reports on Form 10-K or Quarterly Reports on Form 10-Q for the periods that ended prior to and including September 30, 2003.
Since we filed the 2003 Financial and Informational Report, we have been working to complete this Annual Report on Form 10-K for the year ended December 31, 2006, which included completing our financial statements for the years 2004, 2005 and 2006. This Annual Report contains audited financial statements for the three years ended December 31, 2006. Due to our inability to present our financial statements for the 2002 and 2003 fiscal years (other than the 2003 balance sheet) in accordance with GAAP, we are not including selected financial data for those years.
After filing this report, we expect to file Quarterly Reports on Form 10-Q for the first three quarters of each of 2005 and 2006. The 2005 Reports on Form 10-Q will also include 2004 quarterly information. After the 2005 and 2006 quarterly reports have been filed, we will file Quarterly Reports on Form 10-Q for the quarters ended March 31 and June 30, 2007, respectively. Once we have filed the quarterly reports for the first two quarters of 2007, and the quarterly report for the third quarter of 2007, if then due, we will have filed all required filings with the SEC for the previous 12 months. In light of our inability to provide financial statements in accordance with GAAP for periods prior to 2004, we will not be filing any other earlier reports, including annual reports for 2004 and 2005, or quarterly reports for the first three quarters of 2004.
PART I
ITEM 1.Business
THE COMPANY
Key Energy Services, Inc. is a Maryland corporation that was organized in April 1977 and commenced operations in July 1978 undercorporation. References to "Key," the name National Environmental Group, Inc. We emerged from a prepackaged bankruptcy plan in December 1992 as Key Energy Group, Inc. On December 9, 1998, we changed our name"Company," "we," "us" or "our" are intended to refer to Key Energy Services, Inc. and its subsidiaries.
We believe that we are now the leading onshore, rig-basedprovide a broad array of services including: well servicing, contractor inoilfield transportation services, cased-hole electric wireline services, contract drilling services, pressure pumping and well stimulation services and fishing and rental services. Over the United States.years, our business has grown primarily through acquisitions. From 1994 through 2002, we grew rapidly through a series of over 100 acquisitions,acquisitions. From 2003 through 2006, we grew primarily through organic growth as we were engaged in a financial reporting process that involved a restatement of financial statements for 2003 and todayprior periods and delays in filing periodic reports with the Securities and Exchange Commission (the "SEC"). During this period, we providealso focused on improving the quality and reliability of our equipment. We completed this process and became current in our financial reporting in September 2007. With the completion of our financial reporting process in 2007, we commenced a complete rangeprogram of well services to major oil companies and independent oil and natural gas production companies, includinggeographic-focused acquisitions.
We believe that we are the leading onshore, rig-based well maintenance, workover, well completion and recompletion services, oilfield transportation services, cased-hole electric wireline services and ancillary oilfield services, fishing and rental services and pressure pumping services. During 2006, Key conducted well servicing operations onshorecontractor in the continental United StatesStates. We operate in all major energy-providing regions of the following regions: Gulf Coast (including South Texas, Central Gulf Coast of Texas and South Louisiana), Permian Basin of West Texas and Eastern New Mexico, Mid-Continent (including the Anadarko, Hugoton and Arkoma Basins and the ArkLaTex and North Texas regions), Four Corners (including the San Juan, Piceance, Uinta, and Paradox Basins), the Appalachian Basin, Rocky Mountains (including the Denver-Julesberg, Powder River, Wind River, Green River and Williston Basins), and California (the San Joaquin Basin), andUnited States. We also have limited operations offshore. We operate internationally in Argentina. We began operatingArgentina and Mexico, and we have a technology development group based in Mexico during 2007. During 2006, we also provided limited onshore drilling services in the Rocky Mountains, the Appalachian Basin and in Argentina. During 2006, we conducted pressure pumping and cementing operations in a number of major domestic producing basins including California, the Permian Basin, the San Juan Basin, the Mid-Continent region, and in the Barnett Shale of North Texas. Our fishing and rental services are located primarily in the Gulf Coast region of Texas as well as in the Permian Basin, California and the Mid-Continent region.Calgary, Canada.
Key's principal executive office is located at 1301 McKinney Street, Suite 1800, Houston, Texas 77010. Our phone number is (713) 651-4300 and website address iswww.keyenergy.com. We make available free of charge through our website our Annual Reports on Form 10-K, Quarterly Reports on Form 10-Q, current reports on Form 8-K, and all amendments to those reports as soon as reasonably practicable after such material is electronically filed with the SEC. Information on our website is not a part of this report.
DESCRIPTION OF BUSINESS SEGMENTS
Key operated inOur business is comprised of three primary business segments during 2006, which weresegments: well servicing, pressure pumping services and fishing and rental services. Key's operations during 2006 were conductedKey operates in various regions in the continental United States and internationally in Argentina.Argentina and Mexico. The following is a description of these three business segments. For financial information regarding these business segments, see Item 8. "Consolidated Financial Statements and Supplementary Data," Note 16—18—"Segment Information."
Well Servicing Segment
Key providesThrough our well servicing segment (approximately 76% of our revenues for the year ended December 31, 2007), we provide a broad range of well services, including rig-based services, oilfield transportation services, cased-hole electric wireline services, contract drilling services and other ancillary oilfield services. These services collectively are necessary to complete, stimulate, maintain and workover oil and natural gas producing wells. During 2007, Key conducted well servicing operations onshore: in the continental United States in the following regions Gulf Coast (including South Texas, Central Gulf Coast of Texas and South Louisiana), Permian Basin of West Texas and Eastern New Mexico, Mid-Continent (including the Anadarko, Hugoton and Arkoma Basins and the Ark-La-Tex and North Texas regions), Four Corners (including the San Juan, Piceance, Uinta and Paradox Basins), the Appalachian Basin, Rocky Mountains (including the Denver Julesberg, Powder River, Wind River, Green River and Williston Basins), and California (the San Joaquin Basin), and internationally in Argentina and Mexico.
Rig-based Services
Rig-based services include the maintenance of existing wells, workover of existing wells, completion of newly drilled wells, recompletion of existing wells (re-entering a well to complete the well in a new geologic zone or formation) and plugging and abandonment of wells at the end of their useful lives. Our rig fleet is diverse and allows us to work on all types of wells, ranging from very shallow wells to wells as deep as 20,000 feet. Over 200 of our well servicing segment includes contractservice rigs are outfitted with our proprietary KeyView® technology, which captures and reports well site operating data. This technology allows our customers and our crews to actively monitor well site operations, to improve efficiency and safety, and to add value to the services we offer. Included in our domestic well service fleet are eight inland barge rigs. Inland barge rigs are mobile, self-contained, drilling and/or workover vessels that are used in the search for oil and cased-hole electric wireline services.gas in shallow marshes, inland lakes, rivers and swamps along the Gulf Coast of the United States. When moved from one location to another, the barge floats; when stationed on the drill or workover site, the barge is submerged to rest on the bottom. Typically, inland barge rigs are used to drill or workover wells in marshes, shallow inland bays and offshore where the water covering the drill site is not too deep. Our barge rigs can operate at depths between three and 17 feet.
Maintenance Services. Key providesWe provide the well service rigs, equipment and crews for maintenance services, which are performed on both oil and natural gas wells, but more frequently on oil wells. While some oil wells in the United States flow oil to the surface without mechanical assistance, most require pumping or some other method of artificial lift. Oil wells that require pumping characteristically require more maintenance than flowing wells due to the operation of the mechanical pumping equipment. Because few natural gas wells have mechanical pumping systems in the wellbore, maintenance work on natural gas wells is less frequent.
Maintenance services are required throughout the life of most producing wells to ensure efficient and continuous operation. These services consist of routine mechanical repairs necessary to maintain production from the well, such as repairing inoperable pumping equipment in an oil well or replacing defective tubing in an oil or natural gas well, and removing debris such as sand and paraffin from the well. Other services include pulling the rods, tubing, pumps and other downhole equipment out of the wellbore to identify and repair a production problem.
Maintenance services are often performed on a series of wells in close proximity to each other and typically require less than 48 hours per well to complete. The general demand for maintenance services is closely related to the total number of producing oil and natural gas wells in a geographic market, and maintenance services are generally the most stable type of well service activity.
Workover Services. In addition to periodic maintenance, producing oil and natural gas wells occasionally require major repairs or modifications, called "workovers." Workover services are performed to enhance the production of existing wells. Such services include extensions of existing wells to drain new formations either by deepening wellbores to new zones or by drilling horizontal or lateral wellbores to improve reservoir drainage. In less extensive workovers, Key'sour rigs are used to seal off depleted zones in existing wellbores and access previously bypassed productive zones. Our workover rigs are also used to convert former producing wells to injection wells through which water or carbon dioxide is pumped into the formation for enhanced recovery operations. Other workover services include: conducting major subsurface repairs such as casing repair or replacement, recovering tubing and removing foreign objects in the wellbore, repairing downhole equipment failures, plugging back a section of a well to reduce the amount of water being produced with the oil and natural gas, cleaning out and recompleting a well if production has declined, and repairing leaks in the tubing and casing. These extensive workover operations are normally performed by a well service rig with a workover package, which may include rotary drilling equipment, mud pumps, mud tanks and blowout preventers, depending upon the particular type of workover operation. Most of our well service rigs are designed to perform complex workover operations.
Workover services are more complex and time consuming than routine maintenance operations and consequently may last from a few days to several weeks. These services are almost exclusively performed by well service rigs. Demand for workover services is closely related to capital spending by oil and natural gas producers, which is generally a function of oil and natural gas prices. As commodity prices increase, oil and natural gas producers tend to increase capital spending for workover services in order to increase oil and natural gas production.
Completion Services. Key'sOur completion services prepare a newly drilled oil or natural gas well for production. The completion process may involve selectively perforating the well casing to access producing zones, stimulating and testing these zones and installing downhole equipment. We typically provide a well service rig and may also provide other equipment such as a workover package to assist in the completion process. However, during periods of weak drilling rig demand, some drilling contractors may compete with service rigs for completion work. Also, for some completion work on natural gas wells, coiled tubing units can be used in place of a well service rig.
The completion process typically requires a few days to several weeks, depending on the nature and type of the completion, and generally requires additional auxiliary equipment that we provide for
an additional fee. The demand for well completion services is directly related to drilling activity levels, which are highly sensitive to expectations relating to, and changes in, oil and natural gas prices. As the number of newly drilled wells decreases, the number of completion jobs correspondingly decreases.
Plugging and Abandonment Services. Well service rigs and workover equipment are also used in the process of permanently shutting-in oil and natural gas wells at the end of their productive lives. Plugging and abandonment work can be performed with a well servicingservice rig along with electric wireline and cementing equipment. TheyPlugging and abandonment services require compliance with state regulatory requirements. The demand for oil and natural gas does not significantly affect the demand for plugging and abandonment services because well operators are required by state regulations to plug wells that are no longer productive. The need for these services is also driven by lease or operator policy requirements.
Oilfield Transportation.Transportation Services Key provides
We provide oilfield transportation services, which primarily include vacuum truck services, fluid transportation services and disposal services for operators whose oil or natural gas wells produce salt water and other fluids. In addition, we are a supplier of frac tanks which are used for temporary storage of fluids in conjunction with the fluid hauling operations.
Fluid hauling trucks are utilized in connection with drilling and workover projects, which tend to use large amounts of various oilfield fluids. We transport fresh water to the well site and provide temporary storage and disposal of produced salt water and drilling/drilling or workover fluids. These fluids are removed from the well site and transported for disposal in a salt water disposal well. Key owned or leased 47 active salt water disposal wells at December 31, 2006.2007. In addition, we provide equipment trucks that are used to move large pieces of equipment from one wellsitewell site to the next, and we operate a fleet of hot oilers which are capable of pumping heated fluids that are used to clear soluable restrictions in a wellbore. Demand and pricing for these services generally correspond to demand for Key'sour well service rigs. Fluid hauling and equipment hauling services are typically priced on a per barrel or per hour basis while frac tank rentals are typically billed on a per day basis.
Ancillary Oilfield Services.Cased-Hole Electric Wireline Services
Key provides ancillary oilfield services, which include, among others:cased-hole electric wireline operations (conveying downholeservices in the Appalachian Basin, Texas and Louisiana. This service is performed at various times throughout the life of the well and includes perforating, completion logging, production logging and casing integrity services. After the wellbore is cased and cemented, we can provide a number of services. Perforating creates the flow path between the reservoir
and the wellbore. Production logging can be performed throughout the life of the well to measure temperature, fluid type, flow rate, pressure and other reservoir characteristics. This service helps the operator analyze and monitor well performance and determine when a well may need a workover or further stimulation.
In addition, cased-hole services may involve wellbore remediation, which could include the positioning and installation of various plugs and packers to maintain production or repair well problems, and casing inspection for internal or external abnormalities in the casing string. Wireline services are provided from surface logging units, which lower tools and information); wellsite construction (preparationsensors into the wellbore. We operated 22 units as of December 31, 2007, and we have seven units ordered that are expected to be delivered in 2008. Cased-hole electric wireline services are conducted during the completion of an oil or natural gas well and often times throughout the life of a wellsite for drilling activities); roustabout services (provision of manpowerproducing well. Services include: production logging, perforating, pipe recovery, pressure control and setting services. We use advanced wireline instruments to assist with activities on a wellsite); foam air services (drilling technique using air or gas to which a foaming agent has been added);evaluate well integrity and air drilling services (drilling technique using compressed air).perform cement evaluations and production logging. Demand and pricing for these services are generally related to demand for our well service operations.cased-hole electric wireline services is correlated to current and anticipated oil and natural gas prices and the resulting effect on the willingness of our customers to make operating and capital expenditures.
Contract Drilling Services
Although we sold the majority of our contract drilling assets in 2005, we continue toWe provide limited drilling services to oil and natural gas producers, with approximately 13producers. In Argentina, we operate seven drilling rigs onshoreand in the continental United States in the Appalachian Basin and the Powder River Basinwe operate several heavy-duty well service rigs that are capable of Wyoming, and internationally in Argentina. Theproviding drilling services. Our drilling services are primarily provided under standard dayrate,day rate, and, to a lesser extent, footage contracts, although our coal bed methane drilling rigs in the Powder River Basin are typically priced on a footage basis. Thecontracts. Our drilling rigs vary in size and capability. The rigs located in Argentina are equipped with mechanical power systems and have depth ratings of approximately 10,000 feet, although one rig can drill up to approximately 15,000 feet. In 2007, we elected to shut down our coal bed methane drilling operations in the Powder River Basin. We are now seeking to redeploy these assets to other regions. The coal bed methane drilling rigs have depth ratings between 1,200 to 1,800 feet. Like workover services, the demand for contract drilling is directly related to expectations about, and changes in, oil and natural gas prices which, in turn, are driven by the supply of and demand for these commodities.
Ancillary Oilfield Services
We provide ancillary oilfield services, which include, among others: well site construction (preparation of a well site for drilling activities); roustabout services (provision of manpower to assist with activities on a well site); and air drilling services (drilling technique using compressed air). Demand and pricing for these services are generally related to demand for our well service operations.
Pressure Pumping Services Segment
Key Energy Pressure Pumping Services providesThrough our pressure pumping services segment (approximately 18% of our revenues for the year ended December 31, 2007), we provide well stimulation and cementing services to oil and natural gas producers. Well stimulation services include fracturing, nitrogen services, and acidizing. These services (which may be completion or workover services) are provided to oil and natural gas
producers and are used to enhance the production of oil and natural gas wells from formations which exhibit restricted flow of oil and natural gas. In the fracturing process, we typically pump fluid and sized sand, or proppants, into a well at high pressure in order to fracture the formation and thereby increase the flow of oil and natural gas. With our cementing services, we pump cement into a well between the casing and the wellbore. Key offers a full complement of acidizing, fracturing and nitrogen and cementing services. At December 31, 2006, Key operated approximately 166,000 horsepower in stimulation and cementing equipment. Key'sOur pressure pumping services in 20062007 were provided in the Permian Basin, the San Juan Basin, the Barnett Shale region of North Texas and the Mid-Continent region. The CompanyWe also providesprovide cementing services in conjunction with our plugging and abandonment operations in California.
In February 2004, we expanded Demand for our pressure pumping operations throughservices is primarily influenced by current and anticipated oil and natural gas prices and the acquisition of Fleet Cementers, Inc., a wholly owned subsidiary of Precision Drilling Corporation, for approximately $20 million in cash (of which $6 million was paid back to us in 2005 in considerationresulting effect on the willingness of our agreeingcustomers to remove certain noncompete restrictions from the agreement). Fleet Cementers provided pressure pumping services, including cementing, fracturing, acidizing, coiled tubing pumpingmake operating and nitrogen pumping, with primary operations in California and Texas. In connection with the Fleet acquisition, we relocated certain of the Fleet assets to the Barnett Shale region of North Texas. During 2004, 2005 and 2006, we expanded our pressure pumping operation with the purchase of approximately 100,000 horsepower of new pressure pumping equipment. We have additional pumping equipment on order today, and we anticipate that once we receive the equipment, which we expect to receive in the third quarter of 2007, we will operate approximately 212,000 horsepower.capital expenditures.
Fishing and Rental Services Segment
Key Energy Fishing & Rental Services providesThrough our fishing and rental services segment (approximately 6% of revenues for the year ended December 31, 2007), we provided fishing and rental services to major and independent oil and natural gas production companies in the Gulf Coast, Mid-Continent and Permian Basin regions, of the United States, as well as in California. We also provided limited services offshore in the Gulf of Mexico. Fishing services involve recovering lost or stuck equipment in the wellbore andutilizing a "fishing tool" is a downhole tool designed to recover any such equipment lost in the well. The fishing tool supervisors who manage the fishing process have extensive experience with downhole problems. In addition, Key offerstool." We offer a full line of services and rental equipment designed for use both on landonshore and offshore for drilling and workover services. Our rental tool inventory consists of tubulars, handling tools, pressure-controlpressure-controlled equipment, power swivels, and a fleet of power swivels.
Equipment Overview
Well Service Rigs
We usefoam air units. Demand for our well service rig fleetfishing and rental services is also closely related to perform four major categories of rig services forcapital spending by oil and natural gas producers.producers, which is generally a function of oil and natural gas prices.
Equipment Overview
Well Service Rigs
Our rigs typically are billed to customers on a per hour basis but in certain cases may be billed on a dayrate.day rate. We categorize our rigs as active, stacked or inactive. We consider an active rig or piece of equipment to be a unit that is working, on standby, or down for repairs but with work orders assigned to it or that is available for work, which means that the equipment has a crew and is ready to work. A stacked rig or piece of equipment is defined as a unit that is in the remanufacturing process or a unit that does not have a crew assigned to it and could not be put to work without significant investment in repairs and additional equipment. A rig or piece of equipment is considered inactive if we intend to salvage the unit for parts, if we intend to sell the unit or if we intend to scrap the unit. The definitions of active, stacked and inactive are used for the majority of our equipment, including rigs.equipment.
As of December 31, 2006,2007, our active fleet of well service rigs totaled 900975 rigs. These rigs are located throughout the United States and internationally in Argentina. TheArgentina and Mexico. Our geographic diversification provides us with a balanced mix of oil versus natural gas exposure. We estimate that approximately 60% of our rigs are located in predominantly oil regions while 40% of our rigs are located in predominantly natural gas regions.
Our fleet is diverse and allows us to work on all types of wells, ranging from very shallow wells to wells as deep as 20,000 feet. The following table classifies our rigs based on size.size and location. Typically, heavy duty rigs will be utilized on deep wells while light duty rigs will be used on shallow wells. In most cases, these rigs can be reassigned to other regions should market conditions warrant the transfer of equipment.
| | Swab(1)
| | Light Duty(2)
| | Medium Duty(3)
| | Heavy Duty(4)
| | Total
|
|---|
| Appalachia | | 3 | | 13 | | 6 | | 1 | | 23 |
| Argentina | | 1 | | 2 | | 32 | | 9 | | 44 |
| Ark-La-Tex | | 5 | | 11 | | 41 | | 16 | | 73 |
| California | | 0 | | 59 | | 40 | | 13 | | 112 |
| Gulf Coast | | 2 | | 10 | | 50 | | 12 | | 74 |
| Mid-Continent | | 13 | | 5 | | 91 | | 20 | | 129 |
| Permian Basin | | 13 | | 22 | | 243 | | 74 | | 352 |
| Rockies | | 2 | | 8 | | 37 | | 46 | | 93 |
| | |
| |
| |
| |
| |
|
| | Total | | 39 | | 130 | | 540 | | 191 | | 900 |
Well Service Rig Fleet as of December 31, 2007
Region
| | Swab(1)
| | Light Duty(2)
| | Medium Duty(3)
| | Heavy Duty(4)
| | Total
|
|---|
| Appalachia | | 2 | | 15 | | 8 | | 1 | | 26 |
| Argentina | | 1 | | 3 | | 31 | | 7 | | 42 |
| Ark-La-Tex | | 7 | | 0 | | 51 | | 4 | | 62 |
| California | | 0 | | 86 | | 57 | | 9 | | 152 |
| Gulf Coast | | 2 | | 1 | | 41 | | 11 | | 55 |
| Mexico | | 0 | | 0 | | 2 | | 1 | | 3 |
| Mid-Continent | | 12 | | 13 | | 97 | | 4 | | 126 |
| Permian Basin | | 13 | | 36 | | 232 | | 66 | | 347 |
| Rocky Mountains | | 3 | | 2 | | 47 | | 37 | | 89 |
| Southeastern(5) | | 6 | | 5 | | 46 | | 16 | | 73 |
| | |
| |
| |
| |
| |
|
| | Total | | 46 | | 161 | | 612 | | 156 | | 975 |
- (1)
- Swab rigs include rigs used in shallow-depth wells.
- (2)
- Light Duty rigs include rigs with rated capacity of less than 90 tons.
- (3)
- Medium Duty rigs include rigs with rated capacity of 90 tons to 125 tons.
- (4)
- Heavy Duty rigs include rigs with rated capacity of greater than 125 tons.
This also includes seven drilling
- (5)
- Includes eight inland barge rigs acquired in
Argentina.the acquisition of Moncla Well Service, Inc. and related entities. See Item 7. "Management's Discussion and Analysis of Financial Condition and Results of Operations—Acquisitions."
DISCONTINUED OPERATIONS
Oilfield Transportation Equipment
During 2004, we provided contract drilling services to major oil companiesWe have a broad and independent oildiverse fleet of oilfield transportation service vehicles. We broadly define an oilfield transportation service vehicle as any heavy-duty, revenue-generating vehicle weighing over one ton. Our transportation fleet includes vacuum trucks, winch trucks, hot oilers and natural gas producers onshore in the continental United States in the Permian Basin, the Four Corners region, the Appalachian Basinother vehicles, including kill trucks and the Rocky Mountains. On January 15, 2005, we completed the salevarious hauling and transport trucks.
Transportation Fleet as of the majority of our contract drilling assets, which included the drilling rigs and associated equipment in the Permian Basin and Four Corners regions and certain rigs from the Rocky Mountain region. In consideration of the sale, we received approximately $62.0 million in cash. The sale included approximately 25 active rigs and 10 stacked rigs as well as a number of rigs which had been classified as either scrap or salvage. Prior to the sale, our drilling rigs varied in size and capability and in some cases included specialized equipment. The majority of Key's drilling rigs were equipped with mechanical power systems and had drilling depth capabilities ranging from approximately 4,500 to 12,000 feet. We operated one drilling rig with a depth rating of approximately 18,000 feet. As a result of the sale, we treated our land drilling business as a discontinued operation for all periods and recorded an after-tax loss from discontinued operations of $3.4 million, or $0.03 per diluted share, for the year ended December 31, 20052007
Region
| | Vacuum Truck
| | Winch Truck
| | Hot Oil Truck
| | Other
| | Total
|
|---|
| Appalachia | | 16 | | 20 | | 0 | | 9 | | 45 |
| Argentina | | 1 | | 15 | | 2 | | 29 | | 47 |
| Ark-La-Tex | | 175 | | 26 | | 0 | | 27 | | 228 |
| California | | 24 | | 1 | | 0 | | 44 | | 69 |
| Gulf Coast | | 151 | | 37 | | 0 | | 10 | | 198 |
| Mid-Continent | | 30 | | 16 | | 7 | | 18 | | 71 |
| Permian Basin | | 183 | | 25 | | 63 | | 110 | | 381 |
| Rocky Mountains | | 12 | | 2 | | 0 | | 4 | | 18 |
| Southeastern | | 0 | | 34 | | 2 | | 2 | | 38 |
| | |
| |
| |
| |
| |
|
| | Total | | 592 | | 176 | | 74 | | 253 | | 1,095 |
Pressure Pumping Equipment
Our pressure pumping segment operates a diverse fleet of equipment, including: frac pumps, cementing units, acidizing units and an after-tax lossnitrogen units.
Pressure Pumping Fleet as of $5.6 million, or $0.04 per diluted share, during the year ended December 31, 2004.2007
Region
| | Frac Pumps
| | Cement Units
| | Acidizing Units
| | Nitrogen Units
| | Total
|
|---|
| California | | 0 | | 8 | | 0 | | 0 | | 8 |
| Barnett Shale | | 41 | | 4 | | 3 | | 0 | | 48 |
| Four Corners | | 7 | | 3 | | 4 | | 5 | | 19 |
| Mid-Continent | | 18 | | 4 | | 1 | | 0 | | 23 |
| Permian Basin | | 20 | | 5 | | 3 | | 2 | | 30 |
| | |
| |
| |
| |
| |
|
| | Total | | 86 | | 24 | | 11 | | 7 | | 128 |
SEASONALITY
Our operations are impacted by seasonal factors. Historically, our business has been negatively impacted during the winter months due to inclement weather, fewer daylight hours and holidays. Our well service rigs are mobile, and we operate a significant number of oilfield transportation service vehicles. During periods of heavy snow, ice or rain, we may not be able to move our equipment between locations, thereby reducing our ability to generate rig or truck hours. In addition, the majority of our well service rigs work only during daylight hours. In the winter months when days become shorter, this reduces the amount of time that the rigs can work and therefore has a negative impact on total hours worked.
Finally, Lastly, during the fourth quarter, we historically have experienced significant slowdown during the Thanksgiving and Christmas holiday seasons.
PATENTS, TRADE SECRETS, TRADEMARKS AND COPYRIGHTS
Key isWe are the owner of numerous patents, trademarks and proprietary technology that we believe provide us with a competitive advantage in the various markets in which we operate or intend to operate. Key hasWe have devoted significant resources to developing technological improvements in our well service business and hashave sought patent protection both inside and outside the United States for products and methods that appear to have commercial significance. In the United States, as of December 31, 2006,2007, we had 2630 patents issued and 1516 patents pending. As of December 31, 2006,2007, we had 611 patents issued and 91121 patents pending in foreign countries. All the issued patents have varying remaining durations and begin expiring between 2013 and 2025. The most notable of our technologies include numerous patents surrounding the KeyView® system, a field data acquisition system that captures vital wellsitewell site operating data from service equipment. We believe this information helps us and our customers improve safety, reduce costs and increase productivity.
We own several trademarks that are important to our business both in the United States and in foreign countries. In general, depending upon the jurisdiction, trademarks are valid as long as they are in use or their registrations are properly maintained and they have not been found to become generic. Registrations of trademarks can generally be renewed indefinitely as long as the trademarks are in use. While our patents and trademarks, in the aggregate, are of considerable importance to maintaining our competitive position, no single patent or trademark is considered to be of a critical or essential nature.nature to our business.
We also rely on a combination of trade secret laws, copyright and contractual provisions to establish and protect proprietary rights in our products and services. We typically enter into confidentiality agreements with our employees, strategic partners and suppliers and limit access to the distribution of our proprietary information.
FOREIGN OPERATIONS
At December 31, 2006,During 2007, we operated internationally in Argentina. During 2006, our operations in Argentina and Mexico. In Argentina, we operated 37 well service rigs and seven drilling rigs and oilfield transportation vehicles, all of which we include in our well servicing segment. We commenced operations in Mexico during the second quarter of 2007. In February 2007, Petróleos Mexicanos, the Mexican national oil company ("PEMEX"), awarded our Mexican subsidiary, Key Energy Services de México S. de R.L. de C.V., a 22-month contract valued at $45.8 million (USD) to provide field production solutions and well workover services. Under the terms of the contract, we initially provided three well service rigs outfitted with our proprietary KeyView® system, and we installed two KeyView® systems on PEMEX-owned well service rigs. The Company previously operatedcontract grants PEMEX the option to call for additional rigs and KeyView® systems in Ontario, Canada asthe future, although these incremental services are not included in the contract. The current project covers PEMEX's North Region assets and initially focuses on oil wells in Burgos, Poza Rica-Altamira and Cerro Azul. We anticipate that we will expand our presence in Mexico during 2008. Recently, PEMEX has requested that we send additional equipment and KeyView® systems to Mexico. We anticipate that we will deploy up to an additional eight well as in Egypt. During 2004,service rigs with our proprietary KeyView® technology and will install three KeyView® units on PEMEX-owned rigs during 2008. Concurrent with the deployment of additional equipment, we closed our Ontario, Canada operation and relocated those assetsintend to our Michigan operation, which was subsequently sold on May 17, 2005. As described below, during 2005,seek an extension of our contract in Egypt terminated.with PEMEX.
Revenue from our international operations during 2007 totaled $105.8 million, or 6.4% of total revenue. Revenue from international operations for 2006 and 2005 totaled $78.3 million or 5% of total revenue. Forand $68.2 million, respectively.
On September 5, 2007, we acquired Advanced Measurements, Inc., a discussion of the effects of Argentina foreign currency transactions, see Item 8. "Consolidated Financial Statements and Supplementary Data," Note 10—"Argentina Foreign Currency Translation Loss."
In Egypt we operated five well service rigs and a number ofprivately-held Canadian technology company focused on oilfield service vehicles underequipment controls, data acquisition and digital information work flow. In addition, in connection with the acquisition, we acquired a two-year contract we signed with Apache Corporation51% ownership interest in Advanced Flow Technologies, Inc., a privately-held Canadian technology company focused on March 28, 2002. While Apache extended the contract for limited periods, Apache did not exercise its right to extend the agreement for two additional one-year periods. In July 2005, the remaining work under the contract was completed,low cost wireless gas well production monitoring. See Item 7. "Management's Discussion and asAnalysis of December 2005, all five rigsFinancial Condition and oilfield service vehicles were shipped back to the United States and redeployed. Under the termsResults of the agreement, Apache paid all demobilization costs associated with these rigs. For information on the risks associated with our international operations, see Item 1A. "Risk Factors—Business and Debt-Related Risk Factors.Operations—Acquisitions."
CUSTOMERS
Our customers include major oil companies, independent oil and natural gas production companies, and foreign national oil and natural gas production companies. During the years ended
December 31, 2007, 2006 2005, and 2004,2005, no single customer accounted for 10% or more of our consolidated revenues.
COMPETITION AND OTHER EXTERNAL FACTORS
In the well servicing markets, we believe that, based on available industry data, we are the largest provider of well service rigs based on available industry data. At June 30, 2007, we had 850 active rigs in the United States. At December 31, 2007, we had 975 active rigs. Based on the Weatherford-AESC ("AESC") well service rig count, which is available on Weatherford International's internet website, there were approximately 2,7982,839 well service rigs in the United States at MayDecember 31, 2007 and approximately 2,8492007. A recent well service industry survey published by a U.S. investment bank suggests that there are more well service rigs in the United States in December 2006. Despitethan are reported by the significant consolidation in the domestic well servicing industry,AESC count. We agree that there are numerous small companies that compete in Key'slikely more rigs than reported by the AESC and we believe the active rig count could be as high as 3,600 well servicing markets. In addition, in May 2007 Nabors Industries announced that it operates 438service rigs. The difference between the AESC data and the investment bank survey is likely attributable to (i) not all U.S. well service providers being members of the AESC, (ii) some U.S. oil and natural gas producers owning well service rigs while Basic Energy Services, Inc. statedand not reporting to the AESC, and (iii) poor reporting of equipment by certain members of the AESC.
The markets in a June 2007 press release that it has 371 wellwhich we operate are highly competitive. Competition is influenced by such factors as price, capacity, availability of work crews, and reputation and experience of the service rigs. We do not believe that any other competitors have greater numbers of active well service rigs than Key. In Argentina, our largest competitors are Pride International, Nabors Industries, and Allis-Chalmers Energy.
provider. We believe that an important competitive factor in establishing and maintaining long-term customer
relationships is having an experienced, skilled and well-trained work force. In recent years, many of Key'sour larger customers have placed increased emphasis on the safety performance and quality of the crews, equipment and services provided by their contractors. Key hasWe have devoted, and will continue to devote, substantial resources toward employee safety and training programs. In addition, we believe that the KeyView® system has provided and will continue to provide important safety enhancements. Further,Although we believe customers consider all of these factors, price is generally the primary factor in determining which service provider is awarded the work. However, we believe that most customers are willing to pay a slight premium for the quality and efficient service we provide.
Significant well service providers include Nabors Industries, Basic Energy Services and Complete Production Services. Other large competitors include Bronco Drilling and Forbes Energy Services. In addition, though there has been consolidation in the domestic well servicing industry, there are numerous small companies that compete in Key's well servicing markets. We do not believe that any other competitors have greater numbers of active well service rigs than Key. In Argentina, our largest competitors are Pride International, Nabors Industries, and Allis-Chalmers Energy. Schlumberger Ltd. and Nabors Industries are our largest competitors in Mexico.
The pressure pumping market is dominated by three large competitors,major competitors: Schlumberger Ltd., Halliburton Company and BJ Services Company. These three companies have a substantially larger asset base than Key and are believed to operate in all major U.S. oil and natural gas producing basins. Other competitors include Weatherford International, Superior Well Service, Basic Energy Services, Complete Production Services, Frac-Tech and RPC. The pressure pumping industry is very competitive, and the three major competitors generally lead pricing in any particular region. Our pressure pumping services operate in niche markets and historically have competed effectively with these competitors based on performance and strong customer service. Where feasible, we cross-marketcross market our pressure pumping services along with our well service rigs and fishing and rental services, thereby offering our customers the ability to minimize vendors, which, we believe, will improve efficiency. This cross marketing capability is unique to Key, because none of the three major pressure pumping contractors operate well service rigs in the United States.
The U.S. fishing and rental toolequipment market is fragmented compared to our other product lines. Companies which provide fishing services generally compete based on the reputation of their fishing tool operators and their relationships with customers. Competition for rental tools is sometimes based on price; however, in most cases, when a customer chooses a specific fishing tool operator for a particular job, then the necessary rental toolsequipment will be part of that job as well. Our primary competitors include: Baker Oil Tools, Smith International, Weatherford International, Basic Energy Services, Superior Energy Services, Quail Tools (owned by Parker Drilling) and Knight Oil Tools.
The need for well servicing, pressure pumping services and fishing and rental services fluctuates, primarily, in relation to the price (or anticipated price) of oil and natural gas, which, in turn, is driven by the supply of and demand for oil and natural gas. Generally, as supply of those commodities decreases and demand increases, service and maintenance requirements increase as oil and natural gas producers attempt to maximize the productivity of their wells in a higher priced environment.
The level of Key'sour revenues, earnings and cash flows are substantially dependent upon, and affected by, the level of domestic and international oil and gas exploration and development activity.activity, as well as the equipment capacity in any particular region. For a more detailed discussion, please see Item 7. "Management's Discussion and Analysis of Financial Condition and Results of Operations and Financial Condition.Operations."
EMPLOYEES
As of December 31, 2006,2007, we employed approximately 9,400 persons.8,380 persons in our domestic operations and approximately 1,440 additional persons in Argentina, Mexico and Canada. Our domestic employees are not represented by a labor union and are not covered by collective bargaining agreements. Many of
our field employees in Argentina are represented by formal unions. While Mexico has a strong petroleum workers union, we are currently only employing non-union workers in Mexico. We have not experienced any material work stoppages associated with labor disputes or grievances and consider our relations with our employees to be satisfactory. We historically haveDuring 2007, we experienced an annual employee turnover rate of over 50%approximately 41%, although ourcompared to a turnover rate during 2006 improved toof approximately 43%.45% in 2006. The high turnover rate is caused, in part, by the nature of the work, which is physically demanding and sometimes performed in harsh outdoor conditions. As a result, workers may choose to pursue employment in fields that offer a more desirable work environment at wage rates that are competitive with ours. Alternatively, some employees may leave Key if they can earn a higher wage with a competitor. A discussion of the risks associated with our high turnover is presented in Item 1A. "Risk Factors—Business and Debt-RelatedBusiness-Related Risk Factors."
ENVIRONMENTALGOVERNMENTAL REGULATIONS
Key'sOur operations are subject to various federal, state, and local laws and regulations intendedpertaining to protecthealth, safety and the environment. Key'sWe cannot predict the level of enforcement of existing laws or regulations or how such laws and regulations may be interpreted by enforcement agencies or court rulings in the future. We also cannot predict whether additional laws and regulations affecting our business will be adopted, or the effect such changes might have on us, our financial condition or our business. The following is a summary of the more significant existing environmental, health and safety laws and regulations to which our operations are subject and for which compliance may have a material adverse impact on our results of operation or financial position.
Environmental Regulations
Our operations routinely involve the storage, handling, transport and disposal of bulk waste materials, some of which contain oil, contaminants, and regulated substances. Various environmental laws and regulations require prevention, and where necessary, cleanup of spills and leaks of such materials, and some of our operations must obtain permits limitingthat limit the discharge of materials. Failure to comply with such environmental requirements or permits may result in fines and penalties, remediation orders and revocation of permits.
Laws and regulations protecting the environment have become more stringent over the years, and in certain circumstances may impose "strict liability," rendering us liable for environmental damage without regard to negligence or fault on our part. CleanupMoreover, cleanup costs, penalties, and other damages arising as a result of environmental laws and costs associated withnew or changes into existing environmental laws and regulations could be substantial and could have a material adverse effect on Key'sour financial condition, results of operations and cash flows. From time to time, claims have been made and litigation has been brought against Keyus under such laws. However, the costs incurred in connection with such claims and other costs of environmental compliance have not had a material adverse effect on Key'sour past operations or financial statements in the past.statements. Management believes that Key conducts its operations in substantial compliance with current federal, state and local requirements as they relaterelated to health, safety and the environment.
Our underground injectionHazardous Substances and Waste
The Comprehensive Environmental Response, Compensation, and Liability Act, as amended, referred to as "CERCLA" or the "Superfund" law, and comparable state laws impose liability without regard to fault or the legality of the original conduct on certain defined persons, including current and prior owners or operators of a site where a release of hazardous substances occurred and entities that disposed or arranged for the disposal of the hazardous substances found at the site. Under CERCLA, these "responsible persons" may be liable for the costs of cleaning up the hazardous substances, for damages to natural resources, and for the costs of certain health studies. In the course of our operations, we generate materials that are regulated as hazardous substances and, as a result, may incur
CERCLA liability for cleanup costs. Also, claims may be filed for personal injury and property damage allegedly caused by the release of hazardous substances or other pollutants.
We also generate solid wastes that are subject to the requirements of the Resource Conservation and Recovery Act, as amended, or "RCRA," and comparable state statutes. Certain materials generated in the exploration, development, or production of crude oil and natural gas are excluded from RCRA's hazardous waste regulation, but these wastes, which include wastes currently generated during our operations, could be designated as "hazardous wastes" in the future and become subject to more rigorous and costly disposal requirements. Any such changes in these laws and regulations could have a material adverse effect on our operating expense.
Although we used operating and disposal practices that were standard in the industry at the time, hydrocarbons or other wastes may have been released at properties owned or leased by us now or in the past, or at other locations where these hydrocarbons and wastes were taken for treatment or disposal. Under CERCLA, RCRA and analogous state laws, we could be required to clean up contaminated property (including contaminated groundwater), or to perform remedial activities to prevent future contamination.
Air Emissions
The Clean Air Act, as amended, or "CAA," and state laws and regulations restrict the emission of air pollutants and also impose various monitoring and reporting requirements. These laws and regulations may require us to obtain approvals or permits for construction, modification or operation of certain projects or facilities and may require use of emission controls. Our failure to comply with CAA requirements and those of similar state laws and regulations could subject us to civil and criminal penalties, injunctions, and restrictions on operations.
Global Warming and Climate Control
Recent scientific studies suggest that emissions of greenhouse gases (including carbon dioxide and methane) may contribute to warming of the Earth's atmosphere. In response to such studies, the U.S. Congress is considering legislation to reduce greenhouse gas emissions. In addition, many states have already taken measures to address greenhouse gases through the development of greenhouse gas emission inventories, and/or regional greenhouse gas cap and trade programs. As a result of the U.S. Supreme Court's decision on April 2, 2007 inMassachusetts et al. v. EPA, the Environmental Protection Agency (the "EPA") may regulate greenhouse gas emissions from mobile sources (e.g. cars and trucks) even if Congress does not adopt new legislation. The Court's holding inMassachusetts that greenhouse gases are covered pollutants under the CAA may also result in future regulation of greenhouse gas emissions from stationary sources. Legislation or regulatory programs that restrict greenhouse gas emissions in areas where we conduct business could increase our costs in order to stay compliant with any new laws.
Water Discharges
We operate facilities that are subject to requirements of the Clean Water Act, or "CWA," and analogous state laws that impose restrictions and controls on the discharge of pollutants into navigable waters. Pursuant to these laws, permits must be obtained to discharge pollutants into state waters or waters of the United States, including to discharge storm water runoff from certain types of facilities. Spill prevention, control and countermeasure requirements under the CWA require implementation of measures to help prevent the contamination of navigable waters in the event of a hydrocarbon spill. Other requirements for the prevention of spills are established under the Oil Pollution Act of 1990, as amended, or "OPA", which amends the CWA and applies to owners and operators of vessels, including barges, offshore platforms, and certain onshore facilities. Under OPA, regulated parties are strictly
liable for oil spills and must establish and maintain evidence of financial responsibility sufficient to cover liabilities related to an oil spill for which such parties could be statutorily responsible. The CWA can impose substantial civil and criminal penalties for non-compliance.
Employees
Occupational Safety and Health Act
We are subject to the requirements of the federal Occupational Safety and Health Act, as amended, or "OSHA", and comparable state laws that regulate the protection of employee health and safety. OSHA's hazard communication standard requires that information about hazardous materials used or produced in our operations be maintained and provided to employees, state and local government authorities and citizens. We believe that our operations are in substantial compliance with OSHA requirements.
Marine Employees
Certain of our employees who perform services on our barge rigs or work offshore are covered by the provisions of the Jones Act, the Death on the High Seas Act and general maritime law. These laws operate to make the liability limits established under state workers' compensation laws inapplicable to these employees. Instead, these employees or their representatives are permitted to pursue actions against us for damages resulting from job related injuries, with generally no limitations on our potential liability.
Other Laws and Regulations
Saltwater Disposal Wells
We operate saltwater disposal wells that are subject to the CWA, Safe Drinking Water Act, and state and local laws and regulations, including those established by the EPA's Underground Injection Control program. The Underground Injection Control programProgram which establishes the minimum program requirements for state and local programs regulating underground injection activities. Those regulations include requirements for permitting, testing and record keeping. The substantial majorityrequirements. Most of our salt watersaltwater disposal wells are located in the State of Texas and regulated by the Texas Railroad Commission, also known as the "RRC." Wewe also operate salt watersaltwater disposal wells in Arkansas, Louisiana and New Mexico and are subject to similar regulatory controls in those states.Mexico. Regulations in these states require us to obtain a permit from the applicable regulatory agencies to operate each of our underground injectionsaltwater disposal wells. TheseThe applicable regulatory agencies have the general authority toagency may suspend or modify one or more of theseour permits if continuedour well operation of one of our underground injection wells is likely to result in pollution of freshwater, substantial violation of permit conditions or applicable rules, or leaks to the environment.
We maintain insurance against some risks associated with underground contamination that may occur as a result ofour well service activities. However, this insurance is limited to activities, at the wellsite andbut there can be no assurance that this insurance will continue to be commercially available or that this insurance will be available at premium levels that justify its purchase by us. The occurrence of a significant event that is not fully insured or indemnified against us could have a materiallymaterial adverse effect on our financial condition and operations.
CertainElectric Wireline
We conduct cased-hole electric wireline logging, which may entail the use of our wirelineradioactive isotopes along with other nuclear, electrical, acoustic, and mechanical devices to evaluate downhole formation. Our activities involving the use of isotopes are regulated by the U.S. Nuclear Regulatory Commission and specified agencies of applicable agreement states that work cooperatively in implementing the federal regulations. In addition, our down-hole surveying services involve thecertain states. Additionally, we may use ofhigh explosive charges thatfor perforating casing and formations, and various explosive cutters to assist in wellbore cleanout. Such operations are regulated by the U.S. Department of Justice, Bureau of Alcohol, Tobacco, Firearms, and Explosives. Standards implemented by these regulatory agenciesExplosives and require us to obtain licenses or other approvals for the use of such densitometers as well as explosive charges. We have obtained these licenses and approvals when necessary and believe that we are in substantial compliance with these federal requirements.
ITEM 1A.Risk Factors
In addition to the other information in this report, the following factors should be considered in evaluating us and our business.
Business and Debt-RelatedBusiness-Related Risk Factors
Our business is dependent on conditions in the oil and natural gas industry, especially oil and natural gas prices and capital expenditures by oil and natural gas companies.
The demand for our services is primarily influenced by current and anticipated oil and natural gas prices. Prices for oil and natural gas historically have been extremely volatile and have reacted to changes in the supply of and demand for oil and natural gas. These include changes resulting from, among other things, the ability of the Organization of Petroleum Exporting Countries to establish and maintain production quotas to support oil prices, domestic and worldwide economic conditions and political instability in oil-producing countries. Weakness in oil and natural gas prices (or the perception by our customers that oil and natural gas prices will decrease) may cause lower rates for, and lower utilization of available well service equipment.equipment and result in lower rates. In addition, when oil and natural gas prices are weak, or when our customers expect oil and natural gas prices to decrease, fewer wells are drilled, resulting in less completion and maintenance work for us. Additional factors that affect demand for our services include:
- •
- the level of development, exploration and production activity of, and corresponding capital spending by, oil and natural gas companies;
- •
- oil and natural gas production costs;
- •
- government regulation; and
- •
- conditions in the worldwide oil and natural gas industry.
In addition, we anticipate that prices for oil and natural gas will continue to be volatile and affect the demand for and pricing of our services. Decreases in oil and natural gas prices can result in a reduction in the trading prices and value of our securities, even if the decreases in oil and natural gas prices do not affect our business directly. Moreover, a material decline in oil or natural gas prices or activities over a sustained period of time could materially adversely affect the demand for our services and, therefore, our results of operations and financial condition.
Periods of diminished or weakened demand for our services have occurred in the past. Although we experienced a material decrease in the demand for our services beginning in August 2001 and continuing through September 2002, since September 2002 we have experienced continued strong demand for our services. We believe the previous decrease in demand was due to an overall weakening
of demand for onshore well services, which was attributable to general uncertainty about future oil and natural gas prices and the U.S. economy, including the impact of the September 11, 2001 terrorist attacks. If any of these conditions return, demand for our services could again decrease, having a material adverse effect on our financial condition and results of operations. In light of these and other factors relating to the oil and natural gas industry, our historical operating results may not be indicative of future performance.
We may be unable to implementmaintain pricing increases on our core services.
A component of our business strategy includes charging higherDuring the past three years, we have increased the prices on our core services to offset rising costs and to generate higher returns for our shareholders. Recently, we have made some price concessions to our customers in order to generate higher returns. During periods ofmaintain market share. We believe that market conditions should remain strong industry activity when demanddue to high commodity prices, and therefore anticipate that pricing for our services has increased, we have been able to increase our prices. These increases have been initiated to offset our rising cost structure and to enhance our margins. We believe that we have been able to increase our prices due to strong industry conditions, our capabilities and our leading market position. In the eventshould be relatively stable during 2008; however, should market conditions deteriorate or additional new industry capacity increase, it may become more difficult for us to increase prices, and if demand for our services declines, some customers may seek pricing concessions. Additionally, in some cases, we have not been able to successfully increase prices without adversely affecting demand for our services. Specifically, some customers have elected to use our competition rather than to pay our higher price.maintain prices.
The inability to secure further price increasesmaintain our pricing could:
- •
- limit our ability to offset rising costs; and
- •
- impact our ability to generate
highergreater free cash flow which would be used to expand our business.
Increases in industry capacity may adversely affect our business.
Over the past three years, new capacity, including new well service rigs, new pressure pumping equipment and new fishing and rental equipment, has entered the market. In some cases, the new capacity is attributable to start-up oilfield service companies and in other cases, the new capacity has been employed by existing service providers to increase their service capacity. We have been adversely affected by the new capacity as our utilization for 2007 is down from prior years. Lower utilization of our fleet has led to reduced pricing for our services. Should oilfield service companies continue to add new capacity and demand for services not increase, it is possible that we could experience continued pressure on the pricing of our services.services and experience lower utilization. This could have a material negative impact on our operating results.
An economic downturn may adversely affect our business.
AThere is a concern that the United States may enter into a recession in 2008, and if so, a downturn in the U.S. economy may cause reduced demand for petroleum-based products and natural gas. In addition, during a downturn many oil and natural gas production companies often reduce or delay expenditures to reduce costs, which in turn may cause a reduction in the demand for our services during these periods. We view the Baker Hughes U.S. land drilling rig count as a good barometer of oilfield service activity, which is driven by capital spending from oil and natural gas production companies. During 2002, the last economic slowdown in which activity levels fell, the Baker Hughes U.S. land drilling rig count declined to an average of 717. Since that time, activity levels, as measured by the Baker Hughes U.S. land drilling rig count, have improved. According to available industry data, in 2006, the average U.S. land drilling rig count was approximately 1,559 working rigs, as compared to an average of approximately 1,290 working rigs in 2005. The number of land drilling rigs may be seen as indicative of the demand for services such as those we provide. If the economic environment should deteriorate, our business, financial condition and results of operations may be adversely impacted.
Our business involves certain operating risks, which are primarily self-insured, and our insurance may not be adequate to cover all losses or liabilities we might incur in our operations.
Our operations are subject to many hazards and risks, including the following:
- •
- blow-outs, the uncontrolled flow of natural gas, oil or other well fluids into the atmosphere or an underground formation;
- •
- reservoir damage;
- •
- fires and explosions;
- •
- accidents resulting in serious bodily injury and the loss of life or property;
- •
- pollution and other damage to the environment; and
- •
- liabilities from accidents or damage by our fleet of trucks, rigs and other equipment.
If these hazards occur, they could result in suspension of operations, damage to or destruction of our equipment and the property of others, or injury or death to our or a third party's personnel.
We self-insure a significant portion of these liabilities. For losses in excess of our self-insurance limits, we maintain insurance from unaffiliated commercial carriers. However, our insurance may not be adequate to cover all losses or liabilities that we might incur in our operations. Furthermore, our insurance may not adequately protect us against liability from all of the hazards of our business. We also are subject to the risk that we may not be able to maintain or obtain insurance of the type and amount we desire at a reasonable cost. If we were to incur a significant liability for which we were uninsured or for which we were not fully insured, it could have a material adverse effect on our financial position, results of operations and cash flows.
We are subject to the economic, political and social instability risks of doing business in certain foreign countries.
We currently have operations in Argentina and Mexico and may expand our operations into other foreign countries. We also have a technology development group in Canada. As a result, we are exposed to risks of international operations, including:
- •
- increased governmental ownership and regulation of the economy in the markets where we operate;
- •
- inflation and adverse economic conditions stemming from governmental attempts to reduce inflation, such as imposition of higher interest rates and wage and price controls;
- •
- increased trade barriers, such as higher tariffs and taxes on imports of commodity products;
- •
- exposure to foreign currency exchange rates;
- •
- exchange controls or other currency restrictions;
- •
- war, civil unrest or significant political instability;
- •
- expropriation, confiscatory taxation
andor nationalization of our assets located in the markets where we operate;
- •
- governmental policies limiting investments by and returns to foreign investors;
- •
- labor unrest and strikes; and
- •
- restrictive governmental regulation and bureaucratic delays.
The occurrence of one or more of these risks may:
- •
- negatively impact our results of operations;
- •
- restrict the movement of funds and
equipment;equipment to and from affected countries; and
- •
- inhibit our ability to collect
receivables; and
•lead to U.S. government or international sanctions.receivables.
We historically have experienced a high employee turnover rate. Any difficulty we experience replacing or adding workers could adversely affect our business.
We historically have experienced an annual employee turnover rate of almost 50%, although our turnover rate during 20062007 improved to approximately 43%41%. The high turnover rate is attributable to the nature of the work, which is physically demanding and performed outdoors. As a result, workers may choose to pursue employment in fields that offer a more desirable work environment at wage rates that are competitive with ours. We cannot assure that at times of high demand we will be able to retain, recruit and train an adequate number of workers. Potential inability or lack of desire by workers to commute to our facilities and job sites and competition for workers from competitors or other industries are factors that could affect our ability to attract and retain workers. We believe that our wage rates are competitive with the wage rates of our competitors and other potential employers. A significant increase in the wages other employers pay could result in a reduction in our workforce, increases in our wage rates, or both. Either of these events could diminish our profitability and growth potential.
We may not be successful in implementing technology development and technology enhancements.
A component of our business strategy is to incorporate our technology into our well service rigs, primarily through the KeyView® system. The inability to successfully develop and integrate the technology could:
- •
- limit our ability to improve our market position;
- •
- increase our operating costs; and
- •
- limit our ability to recoup the investments made in technology initiatives.
We are subject tomay incur significant costs and liabilities as a result of environmental, health and safety laws and regulations that expose us to potential liability.govern our operations.
Our operations are regulated under a number ofsubject to U.S. federal, state and local, and foreign laws and regulations that govern, among other things,impose limitations on the discharge of pollutants into the environment and establish standards for the handling, storage and disposal of waste materials, some of which are classified asincluding toxic and hazardous substances, and the discharge of hazardous materials into the environment. In addition to potential liability if we should fail towastes. To comply environmental regulations may expose us to liability for noncompliance of other parties, without regard to whether we were negligent. Sanctions for noncompliance with applicable environmentalthese laws and regulations, may include administrative, civilwe must obtain and criminal penalties, revocationmaintain numerous permits, approvals and certificates from various governmental authorities. While the cost of permits and corrective action orders. Furthermore, we may be liable for costs for environmental clean-up at currently or previously owned or operated properties or off-site locations where we sent, disposed of, or arranged for disposal of hazardous materials.
Our expenditures for environmentalsuch compliance havehas not been significant in the past, but may increase in the future. Compliance with existing laws or regulations, adoption of new laws, or regulations or enforcement policies could become more vigorous enforcement of environmental lawsstringent and significantly increase our compliance costs or regulationslimit our future business opportunities, which could have a material adverse effect on our operations by increasing our expenses and limiting our future business opportunities.operations.
In addition, we conduct electric wireline logging, which entails the use of various downhole sondes that acquire geologic data from the surrounding well bore. The data is set up downhole using armored, insulated cable which has from one to seven electrical conductors inside. We use radioactive isotopes along with other nuclear, electrical, acoustic, and mechanical devices to evaluate downhole formations, such as Americium, Beryllium 241, Cesium 137, Iodine 131, and other isotopes. Our activities involving the use of isotopes are regulated by the U.S. Nuclear Regulatory Commission and specified agencies of applicable agreement states that work cooperatively in implementing the federal regulations. Additionally, we use high explosive charges for perforating casing and formations, and various explosive cutters to assist in well bore cleanout. Such operations are regulated by the U.S. Department of Justice, Bureau of Alcohol, Tobacco, Firearms, and Explosives. Standards implemented by these regulatory
agencies require us to obtain licenses or other approvals for the use of densitometers as well as explosive charges. While we believe we are in substantial compliance with these requirements, failure to obtain necessary licenses or otherwise Failure to comply with environmental, health and safety laws and regulations could result in the lawassessment of administrative, civil or criminal penalties, imposition of cleanup and site restoration costs and liens, revocation of permits, and to a lesser extent, orders to limit or cease certain operations. Certain environmental laws impose strict and/or joint and several liability, which could adversely affectcause us to become liable for the conduct of others or for consequences of our business.own actions that were in compliance with all applicable laws at the time of those actions. Please see Item 1. "Business—Governmental Regulations" for more information.
We rely on a limited number of suppliers for certain materials used in providing our pressure pumping services.
We rely heavily on three suppliers for sized sand, a principal raw material that is critical for our pressure pumping operations. While the materials are generally available, if we were to have a problem sourcing raw materials or transporting these materials from either of these vendors, our ability to provide pressure pumping services could be limited.
We may not be successful in identifying, making and integrating our acquisitions.
A component of our growth strategy is to make geographic-focused acquisitions that will strengthen our presence in selected regional markets. The success of this strategy will depend on our ability to identify suitable acquisition candidates and to negotiate acceptable financial and other terms. There is no assurance that we will be able to do so. The success of an acquisition depends on our ability to perform adequate diligence before the acquisition and on our ability to integrate the acquisition after it is completed. While we commit significant resources to ensure that we conduct comprehensive due diligence, there can be no assurance that all potential risks and liabilities will be identified in connection with an acquisition. Similarly, while we expect to commit substantial resources, including management time and effort, to integrating acquired businesses into ours, there is no assurance that we will be successful integrating these businesses. In particular, it is important that we are able to retain both key personnel of the acquired business and its customer base. A loss of either key personnel or customers could negatively impact the future operating results of the acquired business.
Debt-Related Risk Factors
We may not be able to generate sufficient cash flow to meet our debt service obligations.
We had $421.8 million of total indebtedness and capital lease obligations outstanding at December 31, 2006. As of June 30, 2007, we had $424.1 million of total indebtedness and capital lease obligations outstanding.
Our ability to make payments on and to refinance our indebtedness, and to fund planned capital expenditures, will depend on our ability to generate cash in the future. This, to a certain extent, is subject to conditions in the oil and gas industry, general economic and financial conditions, competition in the markets where we operate, the impact of legislative and regulatory actions on how we conduct our business and other factors, thatall of which are beyond our control.
We cannot assure you that our business will generate sufficient cash flow from operations to service our outstanding indebtedness, or that future borrowings will be available to us in an amount sufficient to enable us to pay our indebtedness or to fund our other capital needs. If our business does not generate sufficient cash flow from operations to service our outstanding indebtedness, we may not ablehave to refinanceundertake alternative financing plans, such as:
- •
- refinancing or restructuring our
indebtedness. We may not be able to continue to implement the parts of our business strategy relating to strengthening our balance sheet by debt;
- •
- selling assets;
- •
- reducing
debt, makingor delaying acquisitions andor capital investments, such as remanufacturing our rigs and related equipment.equipment; or
- •
- seeking to raise additional capital.
However, we cannot assure you that we would be able to implement alternative financing plans, if necessary, on commercially reasonable terms or at all, or that implementing any such alternative financing plans would allow us to meet our debt obligations. Our inability to generate sufficient cash flow to satisfy our debt obligations, or to obtain alternative financings, could materially and adversely affect our business, financial condition, results of operations and prospects.
Our debt instruments impose restrictions on us that may affectlevel and the covenants in the agreements governing our ability to successfully operate our business.
Our senior secured credit facility limits our ability to take various actions, such as:
•incurring additional indebtedness;
•paying dividends;
•repurchasing junior indebtedness;
•making investments;
•entering into transactions with affiliates;
•merging or consolidating with other entities; and
•selling all or substantially all of our assets.
These restrictions alsodebt could limit our ability to obtain additional financing, make needed capital expenditures, withstand a downturn in our business or the economy in general, or otherwise conduct our business.
Additional indebtedness could materially adversely affectnegatively impact our financial condition, results of operations and business prospects and prevent us from fulfilling our obligations under our outstanding indebtedness.debt agreements.
UnderOur level of indebtedness, and the covenants contained in the agreements governing our senior secured credit facility, we are limited indebt, could have important consequences for our ability to incur additional debt until we have filed our required periodic reports with the SEC. If and when such restrictions are lifted and we can incur additional debt, increased leverage could, for example:operations, including:
- •
makemaking it more difficult for us to satisfy our obligations under our indebtedness; ifindebtedness and increasing the risk that we fail to comply with the requirements ofmay default on our indebtedness, that failure could result in an event of default of such indebtedness;debt obligations;
- •
requirerequiring us to dedicate a substantial portion of our cash flow from operations to required payments on indebtedness, thereby reducing the availability of cash flow for working capital, capital expenditures and other general business activities;
- •
limitlimiting our ability to obtain additional financing in the future for working capital, capital expenditures, acquisitions and general corporate and other general corporate purposes;activities;
- •
limitlimiting management's discretion in operating our business;
- •
- limiting our flexibility in planning for, or reacting to, changes in our business and the industry in which we operate;
- •
diminishdetracting from our ability to withstand successfully withstand a downturn in our business or the economy generally; and
- •
placeplacing us at a competitive disadvantage against less leveraged competitors.competitors; and
- •
- making us vulnerable to increases in interest rates, because certain debt will vary with prevailing interest rates.
If new debt is added to our and our subsidiaries' current debt levels, the related risks that we and they now face could increase.
We may be unablerequired to repay all or a portion of our debt on an accelerated basis in certain circumstances. If we fail to comply with the covenants contained in our senior secured credit facility, which could resultand other restrictions in the impairmentagreements governing our debt, it could lead to an event of default and the consequent acceleration of our working capital and alter ourobligation to repay outstanding debt. Our ability to operatecomply with these covenants and other restrictions may be affected by events beyond our business.control, including prevailing economic and financial conditions.
We are a party to a $547.25 million senior secured credit facility. To maintainIn addition, under the right to borrow under this credit facility and avoid a default,terms of our indebtedness, we are required to maintainmust comply with certain financial covenant ratios and satisfy certain financial condition tests, several of which become more restrictive over time and maycould require us to take action to reduce our debt or take some other action in order to comply with them. Our ability to satisfy required financial ratios and tests can be affected by events beyond our control, including prevailing economic, financial and industry conditions, and we cannot assure you that we will continue to meet those ratios and tests in the future. A breach of any of these covenants, ratios or tests could result in a default under our credit agreement.indebtedness. If we default, our lendercredit facility lenders will no longer be obligated to extend credit to us and they, as well as the trustee for our outstanding notes, could elect to declare all amounts outstanding under the indenture or senior secured credit agreement,facility, as applicable, together with accrued interest, to be immediately due and payable. The results of such action would have a significant negative impact on our results of operations, financial condition and cash flows.
Our business may be adversely affected if we cannot successfully execute acquisitions that we make or effectively integrate acquired operations.variable rate indebtedness subjects us to interest rate risk, which could cause our debt service obligations to increase significantly.
Our strategy includes acquiring complementary businessesBorrowings under our senior secured credit facility bear interest at variable rates, exposing us to interest rate risk. If interest rates increase, our domestic operations. In addition,debt service obligations on the variable rate indebtedness would increase even though the amount borrowed remained the same, and our net income and cash available for servicing our indebtedness would decrease.
Delayed Financial Reporting-Related Risk Factors
We are not eligible to use short-form or shelf registration.
The securities laws require that we supply current annual and quarterly financial statements in order for us to be able to register securities for a public offering or an acquisition. Although we are able to register securities for public offerings and acquisitions, we are not eligible to use "short-form" registration that allows us to incorporate by reference our SEC reports into our registration statements, or to use shelf registration until we have filed all of our periodic reports in a timely manner for a period of twelve months. Therefore, we will also evaluate possible international acquisitions. Anybe ineligible for short-form or shelf registration until October 2008. Inability to use short-form or shelf registration could increase the costs of selling securities publicly and could significantly delay such strategysales.
Taxing authorities may determine that we owe additional taxes from previous years.
As a result of the restatement of our financial statements for periods prior to 2004 and delay in our financial reporting for subsequent periods, we will involve a numberlikely have to amend previously filed tax returns and reports. Where legal, regulatory or administrative rules require or allow us to amend our previous tax filings, we intend to comply with our obligations under applicable law. To the extent that tax authorities do not accept our conclusions about the tax effects of risksthe restatement, liabilities for taxes could differ from those which have been recorded in our consolidated financial statements. If it is determined that we have additional tax liabilities, there could be an adverse effect on our financial condition, results of operations and challenges, including:cash flows.
•
We have identified material weaknesses in our abilityinternal control over financial reporting. These material weaknesses, if not corrected, could affect the reliability of our financial statements and have other adverse consequences.
Section 404 of the Sarbanes-Oxley Act of 2002 and the related SEC rules require management of public companies to identify suitable acquisition candidates, to negotiate acceptable terms, documentation and other conditions,assess the effectiveness of their internal control over financial reporting annually and to obtaininclude in Annual Reports on Form 10-K a management report on that assessment, together with an attestation report by an independent registered public accounting firm. Under Section 404 and the SEC rules, a company cannot find that its internal control over financial reporting is effective if there exist any necessary regulatory clearances;
•our ability to integrate acquired operations;
•potential loss"material weaknesses" in its financial controls. A "material weakness" is a control deficiency, or combination of key employees and customerscontrol deficiencies in internal control over financial reporting such that there is a reasonable possibility that a material misstatement of the acquired companies;annual or interim financial statements will not be prevented or detected. We have identified material weaknesses in internal control over financial reporting as of December 31, 2007. We have taken and
•an increase will take actions to remediate the material weaknesses and improve the effectiveness of our internal control over financial reporting; however, we cannot assure you that we will be able to correct these material weaknesses by the end of 2008. Any failure in the effectiveness of internal control over financial reporting, if it results in misstatements in our expenses and working capital requirements.
Any of these factorsfinancial statements, could adversely affect our ability to achieve anticipated levels of earnings and cash flow from acquisitions or realize other anticipated benefits. Furthermore, competition from other potential buyers could reduce our acquisition opportunitieshave a material effect on financial reporting or cause us to pay a higher price than we otherwise might pay.fail to meet reporting obligations, and could negatively impact investor perceptions.
The trading price of our common stock could be subject to significant fluctuations.Takeover Protection-Related Risks
The trading price of our common stock has been volatile due to, among other factors, the uncertainty associated with the restatement of our prior period financial statements, our ability to become current with respect to our SEC filings, and our ability to relist our common stock on the NYSE. Continued uncertainty or negative developments may cause significant declines in the price of our common stock. Also, factors such as announcements of fluctuations in our or our competitors' operating results and market conditions for oil and gas-related stocks in general could have a significant impact on the future trading prices of our common stock. In particular, the trading price of the common stock of many oilfield service companies has experienced extreme price and volume fluctuations, which have at times been unrelated to the operating performance of the companies whose stocks were affected. In addition, the trading prices and value of our common stock could be subject to significant fluctuations in response to variations in our prospects and operating results, which may in turn be affected by weakness in commodity prices, changes in interest rates and other factors. There can be no assurance that these factors will not have an adverse effect on the trading prices of our common stock.
Our bylaws contain provisions that may prevent or delay a change in control.
Our Amended and Restated Bylaws contain certain provisions designed to enhance the ability of the Board of Directors to respond to unsolicited attempts to acquire control of the Company. These provisions:
- •
- establish a classified Board of Directors,
generally providing for three-year staggered terms of office for all members of our Board;
- •
- set limitations on the removal of directors;
- •
- provide our Board of Directors the ability to set the number of directors and to fill vacancies on the Board occurring between shareholder meetings; and
- •
- set limitations on who may call a special meeting of shareholders.
These provisions may have the effect of entrenching management and may deprive investors of the opportunity to sell their shares to potential acquirers at a premium over prevailing prices. This potential inability to obtain a control premium could reduce the price of our common stock.
Delayed Financial Reporting-Related Risk Factors
The delay in reporting our financial statements and related events has had, and will continue to have, a material adverse effect on us.
Because of the delay in completing our financial statements for the year ended December 31, 2003, and our restatement of prior period financial statements, we have been unable to file our required periodic reports with the SEC for some time. This report is being filed more than four months after it was due. We have not yet filed our quarterly reports for 2005, 2006 and the first two quarters of 2007, and we may be unable to timely file our quarterly report for the third quarter of 2007. As a result of these events, we have become subject to significant risks and occurrences relating to the following matters, which are described in more detail below:
•Possible adverse consequences of failure to file past SEC reports;
•Limitations on access to public capital markets;
•Inability of common stock to trade on a recognized exchange and potential inability to re-list on a recognized exchange;
•Impact of material weaknesses in internal control over financial reporting;
•Potential changes in tax liabilities; and
•Civil litigation.
Our inability to file past annual and quarterly reports with the SEC could have adverse consequences.
We have not filed, and will be unable to file, annual reports that comply with SEC rules for years prior to 2006. Nor will we be able to file compliant quarterly reports for the first three quarters of 2004 or prior periods. We cannot rule out the possibility of regulatory action by the SEC due to the failure to file these required reports. Any such action could have adverse effects on us, including possible impact on our compliance with lending agreements, on the trading market for our common stock, or on our ability to access the capital markets.
We cannot register securities for a public offering or acquisitions until we are current in our financial reporting. We also will be unable to repurchase our common stock until we are current.
The securities laws require that we supply current annual and quarterly financial statements in order for us to be able to register securities for a public offering or an acquisition. In order to become current, we must file, in addition to this report, our Quarterly Reports on Form 10-Q for the first three quarters of 2005 and 2006, respectively. We also must file our Quarterly Report on Form 10-Q for the first and second quarters of 2007, which are overdue. Although we should be able to register securities for public offerings and acquisitions after we become current, we will be ineligible to use "short-form" registration that allows us to incorporate by reference our SEC reports into our registration statements, or to use shelf registration until we have filed all of our periodic reports in a timely manner for a period of twelve months. This could increase the costs of selling securities publicly and could significantly delay such sales. We will also be unable to engage in other transactions involving our common stock, including a stock repurchase, until we have become current in our financial disclosures.
We cannot be re-listed on a securities exchange until we are current in our financial reporting.
Due to our failure to file current financial statements, we became ineligible for listing on a stock exchange, and our common stock has been trading on the Pink Sheets Electronic Quotation Service since April 2005. We intend to seek to be re-listed on a securities exchange when we become current in our financial reporting. There can be no assurance whether we will satisfy the standards for listing on an exchange or that the exchange will approve our listing. Nor can there be any assurance at this time when the re-listing would occur. Continuing to be quoted only on Pink Sheets could adversely affect the trading market—and potentially the market price—of our common stock.
Taxing authorities may determine that we owe additional taxes from previous years.
As a result of the restatement and delay in our financial reporting, we will likely have to amend previously filed tax returns and reports. Where legal, regulatory or administrative rules require or allow us to amend our previous tax filings, we intend to comply with our obligations under applicable law. To the extent that tax authorities do not accept our conclusions about the tax effects of the restatement, liabilities for taxes could differ from those which have been recorded in our consolidated financial statements. If it is determined that we have additional tax liabilities, there could be an adverse effect on our financial condition, results of operations and cash flows.
If we are unable to file all financial reports by the dates currently required in our credit facility, we would have to seek a waiver from our lenders. There is no assurance such waiver would be obtained.
Our senior secured credit facility, as amended, requires that we file our first and second quarterly reports on Form 10-Q for 2007 no later than October 31, 2007. Although we believe that we will be able to file our 2007 quarterly reports by October 31, 2007, we can make no assurances that will be able to do so. If we cannot meet the filing deadline, we will be required either to seek a waiver from our lenders or refinance the credit facility, or risk an event of default. We can make no assurances that a waiver will be granted by our lenders or about the terms on which it might be granted. If we default, our lenders will no longer be obligated to extend credit to us and could elect to declare all amounts outstanding under the credit agreement, together with accrued interest, to be immediately due and payable. The results of such action would have a significant negative impact on our results of operations and financial condition.
We have identified material weaknesses in our internal control over financial reporting. These material weaknesses, if not corrected, could affect the reliability of our financial statements and have other adverse consequences.
Section 404 of the Sarbanes-Oxley Act and the related SEC rules require management of public companies to assess the effectiveness of their internal control over financial reporting annually and to include in Annual Reports on Form 10-K a management report on that assessment, together with an attestation report by an independent registered public accounting firm. Under Section 404 and the SEC rules, a company cannot find that its internal control over financial reporting is effective if there exist any "material weaknesses" in its financial controls. A "material weakness" is a control deficiency, or combination of control deficiencies, that results in a more than remote likelihood that a material misstatement of the annual or interim financial statements will not be prevented or detected.
We have identified material weaknesses in internal control over financial reporting as of December 31, 2006. We have taken and will take actions to remediate the material weaknesses and improve the effectiveness of our internal control over financial reporting; however, we cannot assure you that we will be able to correct these material weaknesses by the end of 2007. Any failure in the effectiveness of internal control over financial reporting, if it results in misstatements in our financial statements, could have a material effect on financial reporting or cause us to fail to meet reporting obligations, and could negatively impact investor perceptions.
Litigation arising in connection with the restatement of our financial statements could adversely affect our financial condition and operations.
The restatement led to litigation. Several securities class action lawsuits and derivative cases are pending against us, members of our Board of Directors and present and former members of management. We have also been named in a lawsuits by our former general counsel and our former chief financial officer. Further, our former controller and assistant controller filed a joint complaint against us. The lawsuits and other legal matters in which we have become involved following the announcement of the restatement are described in Item 3. "Legal Proceedings."
Due to our inability to issue shares of common stock upon exercise of options because we have been unable to maintain an effective SEC registration statement for those shares, or to rely on an exemption from registration, some previously granted options that were in-the-money have expired without the optionees being able to exercise them. Although we believe the plan agreements permit our actions taken thus far with respect to stock options, we are defending lawsuits by some option holders and may face lawsuits from other option holders.
Other than actions that have been previously settled, we are unable at this time to predict the outcome of pending legal actions. The ultimate resolution of the securities class action lawsuits and
derivative cases could have a material adverse impact on our financial results, financial condition or liquidity, and on the trading price of our common stock.
These lawsuits and other legal matters also could have a disruptive effect upon the operation of our business and consume the time and attention of our senior management. In addition, we are likely to incur substantial expenses in connection with such matters, including substantial fees for attorneys.
We maintain insurance that may provide coverage for some or all of these matters. We have given notice to our insurers of the claims. The insurers have responded by requesting additional information and by reserving their rights under the policies, including the rights to deny coverage under various policy exclusions or to rescind the policies in question as a result of our restatement of our financial statements. There is risk that the insurers will rescind the policies; that some or all of the claims will not be covered by such policies; or that, even if covered, our ultimate liability will exceed the available insurance.
ITEM 1B.Unresolved Staff Comments
None.
ITEM 2.Properties
Key leases executive office space in Houston, Texas (principal executive office) and Midland, Texas. In addition, we conduct our operations using a combination of owned and leased properties to support our operations in each of our geographic markets. Our leased properties are subject to various lease terms and expirations. As of December 31, 2006,2007, we owned 135142 properties, twelve10 of which were inactive. We also operated 8475 leased
office and yard locations. We owned or leased 57 salt water disposal wells, ten of which were inactive at December 31, 2006.2007. The majority of our salt water disposal wells are located in Texas.
We believe all properties that we currently occupy are suitable for their intended use. We believe that we have sufficient facilities to conduct our operations during 2007.2008. However, we continue to evaluate the purchase or lease of additional properties or the consolidation of our properties, as our business requires.
ITEM 3.Legal Proceedings
Since June 2004, we have beenwere named as a defendant in six class action complaints for alleged violations of federal securities laws, which have been filed in federal district court in Texas. They are as follows:
Cause No. MO-04-CV-082;Peter Kaltman, on behalf of himself and all others similarly situated v. Key Energy Services, Inc., Francis D. John, Royce W. Mitchell, Richard J. Alario and James J. Byerlotzer, filed in the United States District Court for the Western District of Texas
Cause No. MO-04-CV-083;Malcolm Lord, Individually and on Behalf of all Others Similarly situated v. Key Energy Services, Inc., Francis D. John, Richard J. Alario, James J. Byerlotzer and Royce W. Mitchell, filed in the United States District Court for the Western District of Texas
Cause No. MO-04-CV-090;Celeste Navon, on behalf of herself and all others similarly situated v. Key Energy Services, Inc., Francis John, Royce Mitchell, James Byerlotzer and Richard Alario, filed in the United States District Court for the Western District of Texas
Cause No. MO-04-CV-104;David W. Ortbals, on Behalf of Himself and All Others Similarly situated v. Key Energy Services, Inc., Richard J. Alario, James J. Byerlotzer, Francis D. John, and Royce W. Mitchell, filed in the United States District Court for the Western District of Texas
Cause No. MO-04-CV-0254;Paul E. Steward, on Behalf of Himself and All Others Similarly situated v. Key Energy Services, Inc., Francis D. John and Royce W. Mitchell, filed in the United States District Court for the Western District of Texas
Cause No. MO-04-CV-0227;Garco Investment LLP Individually and on Behalf of all Others Similarly Situated v. Key Energy Services, Inc., Richard J. Alario, James J. Byerlotzer, Francis D. John and Royce W. Mitchell, filed in the United States District Court for the Western District of Texas
These six actions have beenwere consolidated into one action. On November 1, 2005, the plaintiffs filed a consolidated amended class action complaint. The complaint iswas brought on behalf of a putative class of purchasers of our securities between April 29, 2003 and June 4, 2004. The complaint namesnamed Key, Francis D. John, Royce W. Mitchell, Richard J. Alario and James J. Byerlotzer as defendants. The complaint generally allegesalleged that we made false and misleading statements and omitted material information from our public statements and SEC reports during the class period in violation of the Securities Exchange Act of 1934, including alleged: (i) overstatement of revenues, net income, and earnings per share, (ii) failure to take write-downs of assets, consisting of primarily idle equipment, (iii) failure to amortize the Company's goodwill, (iv) failure to disclose that the Company lacked adequate internal controls and therefore was unable to ascertain the true financial condition of the Company, (v) material inflation of the Company's financial results at all relevant times, (vi) misrepresentation of the value of acquired businesses, and (vii) failure to disclose misappropriation of funds by employees. We filed a motion to dismiss the case. The individual defendants also filed motions to dismiss the case. On August 11, 2006, the court denied our motion to dismiss, but granted dismissals as to Messrs. Alario and Byerlotzer. We filed our answer to the consolidated amended complaint on September 11, 2006. Trial is set for March 3, 2008.
The Plaintiffs have filed a motion for class certification. The class certification hearing is scheduled to be held on September 6, 2007. The parties are engaged in written discovery and document production.
FourIn addition, four shareholder derivative suits have beenwere filed by certain of our shareholders. They are as follows:
Cause No. 2004-CV-44728; Moonlight Investments, LTD. on Behalf of Nominal Defendant Key Energy Services, Inc., v. Francis D. John, Richard J. Alario, James J. Byerlotzer, Royce W. Mitchell, Kevin P. Collins, W. Phillip Marcum, and Ralph S. Michael, III, and Key Energy Services, Inc., filed in the 385th Judicial District Court, Midland County, Texas
Cause No. EP-04-CA-0457;Sandra Weissman, Derivatively on Behalf of Key Energy Services, Inc., v. Francis D. John, David J. Breazzano, Kevin P. Collins, William D. Fertig, W. Phillip Marcum, Ralph S. Michael III, J. Robinson West, James J. Byerlotzer, Royce W. Mitchell, Richard J. Alario and Key Energy Services, Inc., a Maryland Corporation, filed in the United States District Court Western District of Texas
Cause No. EP-04-CA-0456;Daniel Bloom, Derivatively on Behalf of Key Energy Services, Inc., v. Francis D. John, David J. Breazzano, Kevin P. Collins, William D. Fertig, W. Phillip Marcum, Ralph S. Michael III, J. Robinson West, James J. Byerlotzer, Royce W. Mitchell, Richard J. Alario and Key Energy Services, Inc., a Maryland Corporation, filed in the United States District Court Western District of Texas
Cause No. 2007-31254;Sandra Weissman, Derivatively on Behalf of Key Energy Services, Inc., v. Francis D. John, David J. Breazzano, Kevin P. Collins, William D. Fertig, W. Phillip Marcum, Ralph S. Michael III, J. Robinson West, James J. Byerlotzer, Royce W. Mitchell, Richard J. Alario and Key Energy Services, Inc., a Maryland Corporation filed in the 270th Judicial District, Harris County, Texas.Texas
The first derivative suit was filed on August 9, 2004 in state court in Midland, Texas. Two other derivative suits were filed in federal court in El Paso, Texas on December 10, 2004 and subsequently transferred to federal court in Midland, Texas and consolidated by agreement of the parties. Following dismissal of those two actions for failure to make a demand, a fourth derivative suit was filed in Texas state court in Harris County, Texas on May 22, 2007. Francis D. John, David J. Breazzano, Kevin P. Collins, William D. Fertig, W. Phillip Marcum, Ralph S. Michael III, J. Robinson West, James J. Byerlotzer, Royce W. Mitchell, and Richard J. Alario have beenwere named as defendants in one or more of those actions. ThoseThe actions arewere filed by individual shareholders purporting to act on our behalf, asserting various claims against the named officer and director defendants. The derivative actions generally allege the same facts as those in the shareholder class action suits. Those suits also allege breach of fiduciary duty, abuse of control, waste of corporate assets, and unjust enrichment by these defendants.
The first derivative suit was filed on August 9, 2004On September 7, 2007, we reached agreements in state court in Midland, Texas. The plaintiff subsequently amended that suitprinciple to assert claims against our former independent public accountants, KPMG LLP. We filed a motion to dismisssettle all claims in thatpending securities class action which was granted by the court on March 29, 2005 for failure to make demand on the directors before filing suit. The plaintiff appealed that ruling. On May 18, 2006, the intermediate Court of Appeals issued an opinion affirming the trial court's ruling that the plaintiff had not pleaded sufficient facts to excuse its failure to make demand, but reversing on procedural grounds. We filed a motion for rehearing, which was denied June 15, 2006, and we appealed to the Texas Supreme Court. On June 8, 2007 the Texas Supreme Court denied Key's Petition For Review (appeal). The case has been sent back to the trial court for further proceedings.
Two other derivative suits were filed in federal court in El Paso, Texas on December 10, 2004. Those actions were transferred to federal court in Midland, Texas and consolidated by agreement of the parties. We filed a motion to dismiss or to stay that consolidated action. The individual defendants also filed a motion to dismiss. On July 10, 2006, the court entered an order dismissing those two derivative actions for failure to make a demand. After the dismissal, Plaintiff, Sandra Weissman made a putative demand on Key. On May 22, 2007, Ms. Weissman refiled her suit. She filed suit in Texas state court in Harris County, Texas. We have not yet been formally served with the lawsuit.
In each of the matters described above, plaintiffs are seeking an unspecified amount of monetary damages. At this time, we cannot ascertain the ultimate aggregate amount of monetary liability or financial impact of the class actions and derivative lawsuits. While we have directors'lawsuits in consideration of payments totaling $16.6 million in exchange for full and officers' insurance in the aggregate amountcomplete releases for all defendants, of $50 million, we cannot determine whether these actions, suits, claims, and proceedingswhich Key will individually or collectively, have a material adverse effect on our business, results of operations, financial condition and cash flows. We and named directors and officers intendbe required to vigorously defend these actions, suits, claims and proceedings.
On March 29, 2004, we were notified by the Fort Worth office of the SEC that it had commenced an inquiry regarding the Company. The SEC issued a formal order of investigation on July 15, 2004. On May 30, 2007, we were informed by the staff of the Enforcement Division of the SEC that it had completed its investigation as to Key and that it did not intend to recommend enforcement action. In addition, on January 5, 2005, we were served with a subpoena issued by a grand jury in Midland, Texas, that asked for the production of documents in connection with an investigation being conducted by the U.S. Attorney's Office for the Western District of Texas. In October 2006, we were notified by the U.S. Attorney's Office that it would not pursue any criminal charges against the Company.
We have been named in a lawsuit by our former general counsel, Jack D. Loftis, Jr., in the U.S. District Court, District of New Jersey on April 21, 2006, in which he alleges a "whistle-blower" claim under the Sarbanes-Oxley Act, breach of contract, breach of good faith and fair dealing, breach of fiduciary duty, and wrongful termination. Mr. Loftis previously filed his "whistle-blower" claim with the Department of Labor ("DOL"), which found that there was no reasonable cause to believe that we violated the Sarbanes-Oxley Act when we terminated Mr. Loftis and dismissed the complaint. On July 28, and October 2, 2006, Key moved to dismiss the lawsuit for lack of jurisdiction over Key Energy or for lack of venue. On June 28, 2007, the court denied our motions but on its own motion transferred the case to the U.S. District Court for the Eastern District of Pennsylvania.
Additionally, on August 21, 2006, our former chief financial officer, Royce W. Mitchell, filed a suit against the Company in 385th District Court, Midland County, Texas alleging breach of contract with regard to alleged bonuses, benefits and expense reimbursements, conditional stock grants and stock options, to which he believes himself entitled; as well as relief under theories of quantum meruit, promissory estoppel, and specific performance. Although there is no scheduling order in the case, discovery is underway. Further, our former controller and assistant controller filed a joint complaint against the Company on September 3, 2006 in 133rd District Court, Harris County, Texas alleging constructive termination and breach of contract. Following Key's removal of the case to the federal court, Plaintiff dismissed his constructive termination allegation and the parties agreed to a remand of the case back to the state court. Discovery is now ongoing.
We intend to vigorously defend against these claims; however, we cannot predict the outcome of the lawsuits. See Item 8. "Consolidated Financial Statements and Supplementary Data," Note 19—"Subsequent Events," for a discussionpay $1,125,000. Final approval of the settlement of litigation with our former chief executive officer.the shareholder and class action claims by the court is anticipated to occur in the first quarter of 2008.
A class action lawsuit,Gonzalez v. Key Energy Services, Inc., was filed in Ventura County, California, Superior Court in September 2005 alleging that Key did not pay its hourly employees for travel time between the yard and the wellhead and that certain employees were denied meal and rest periods during shifts. Discovery in the case is underway, but a class has not been certified. Key moved for a legal determination regarding its use of on-duty meal periods, and the Court issued a ruling on March 16, 2007 contrary to Key's interpretation of the relevant law. Key has recently filed a Petition for Writ with the Court of Appeals of the State of California. We intend to vigorously defend against this action; however, we cannot predict the outcome of the lawsuit.
In addition we are involved into various suits and claims that have arisen in the ordinary course of business.business, we continue to be involved in litigation with our former executive officers as well as a class action lawsuit in California. We do not believe that the disposition of any of these items, including litigation with former management, will result in a material adverse effect on theour consolidated financial position, results of operations or cash flows of Key.flows. See Item 8. "Consolidated Financial Statements and Supplementary Data," Note 12—"Commitments and Contingencies."
ITEM 4.Submission of Matters to a Vote of Security Holders
None.At our 2007 Annual Meeting of Shareholders held on December 6, 2007, holders of 106,759,477 shares were present in person or by proxy, constituting 80.47% of the outstanding shares of common stock as of the record date for the annual meeting. The matters voted upon at the annual meeting were:
Election of four Class I Directors. The shareholders elected four Class I Directors to serve for a three year term, expiring in 2010:
| | Votes cast in favor:
| | Votes withheld:
|
|---|
| Lynn R. Coleman | | 100,342,605 | | 6,416,872 |
| Kevin P. Collins | | 93,124,276 | | 13,635,201 |
| W. Phillip Marcum | | 93,386,783 | | 13,372,694 |
| William F. Owens | | 100,345,025 | | 6,414,452 |
Four Class II Directors, David J. Breazzano, William D. Fertig, Robert K. Reeves and J. Robinson West, continued in office with terms expiring in 2008. Three Class III Directors, Richard J. Alario, Ralph S. Michael, III and Arlene M. Yocum, continued in office with terms expiring in 2009.
Adoption of 2007 Equity and Cash Incentive Plan. The shareholders adopted the Key Energy Services, Inc. 2007 Equity and Cash Incentive Plan:
Adoption of 2007 Equity and Cash Incentive Plan
|
|---|
| Votes cast in favor | | 63,861,992 |
| Votes cast against | | 27,648,235 |
| Votes abstaining | | 26,350 |
| Broker non-vote | | 15,222,900 |
Ratification of Independent Registered Public Accounting Firm. The shareholders ratified the selection of Grant Thornton LLP as the Company's independent registered public accounting firm for the current fiscal year:
Ratification of Independent Registered Public Accounting Firm
|
|---|
| Votes cast in favor | | 106,699,110 |
| Votes cast against | | 19,094 |
| Votes abstaining | | 41,273 |
| Broker non-vote | | 0 |
PART II
ITEM 5.Market for Registrant's Common Equity, Related Stockholder Matters and Issuer Purchases of Equity Securities
Market and Share Prices. On October 3, 2007, Key's common stock was tradedresumed trading on the New York Stock Exchange, under the symbol "KEG,"KEG." until April 7, 2005, when the NYSE suspended the trading of our common stock based on our failure to timely file our SEC reports. The common stock was delisted on May 5, 2005. SinceFrom April 8, 2005 until October 2, 2007, our stock has beenwas quoted on the Pink Sheets Electronic Quotation Service (the "Pink Sheets") under the symbol "KEGS." As of June 30, 2007,February 20, 2008, there were 564556 registered holders of 131,593,695128,149,793 issued and outstanding shares of common stock, net of 533,466 shares of common stock held in treasury.stock. The following table sets forth the reported high and low sales price of Key's common stock as quoted on the Pink Sheets for the periods indicated.
| | High
| | Low
|
|---|
| Year Ended December 31, 2005 | | | | | | |
| | 1st Quarter | | $ | 14.25 | | $ | 10.44 |
| | 2nd Quarter | | | 12.90 | | | 9.64 |
| | 3rd Quarter | | | 15.05 | | | 11.96 |
| | 4th Quarter | | | 15.10 | | | 12.75 |
| Year Ended December 31, 2006 | | | | | | |
| | 1st Quarter | | $ | 16.50 | | $ | 13.46 |
| | 2nd Quarter | | | 18.75 | | | 13.00 |
| | 3rd Quarter | | | 15.85 | | | 12.75 |
| | 4th Quarter | | | 16.95 | | | 13.05 |
| | High
| | Low
|
|---|
| Year Ended December 31, 2007 | | | | | | |
| | 1st Quarter | | $ | 16.90 | | $ | 14.85 |
| | 2nd Quarter | | | 20.07 | | | 16.52 |
| | 3rd Quarter | | | 18.38 | | | 13.08 |
| | 4th Quarter | | | 16.95 | | | 13.25 |
| | High
| | Low
|
|---|
| Year Ended December 31, 2006 | | | | | | |
| | 1st Quarter | | $ | 16.50 | | $ | 13.46 |
| | 2nd Quarter | | | 18.75 | | | 13.00 |
| | 3rd Quarter | | | 15.85 | | | 12.75 |
| | 4th Quarter | | | 16.95 | | | 13.05 |
The following Corporate Performance Graph and related information shall not be deemed "soliciting material" or to be "filed" with the SEC, nor shall such information be incorporated by reference into any future filing under the Securities Act or the Exchange Act, except to the extent that we specifically incorporate it by reference into such filing.
The following performance graph compares the performance of our common stock to the Oil Service Sector and to a peer group established by management. This peer group is comprised of five other companies with a similar mix of operations and includes Nabors Industries Ltd., Weatherford International Ltd., Basic Energy Services, Inc., Complete Production Services, Inc., and RPC, Inc. The graph below matches the cumulative sixty-six monthfive-year total return ofto holders of our common stock with the cumulative total returns of the Oil Service Sector and our peer group. The graph assumes that the value of the investment in our common stock and each index (including reinvestment of dividends) was $100 at June 30, 2001December 31, 2002 and tracks the return on the investment through December 31, 2006.2007.
Stock Performance Graph
COMPARISON OF 66 MONTH5 YEAR CUMULATIVE TOTAL RETURN*
Among Key Energy Services, Inc., The Russell 2000 Index,
The PHLX Oil Service Sector Index And A Peer Group
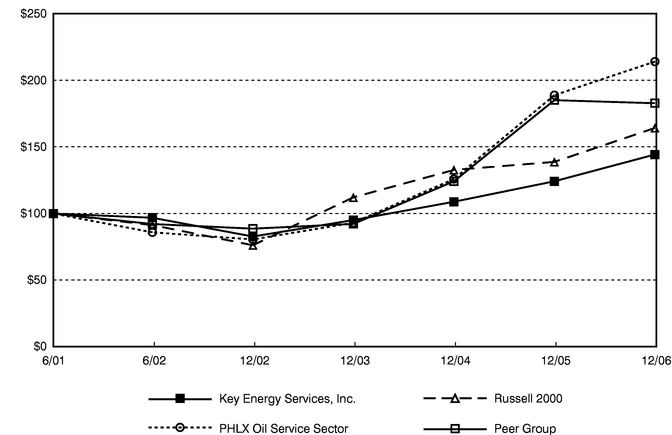
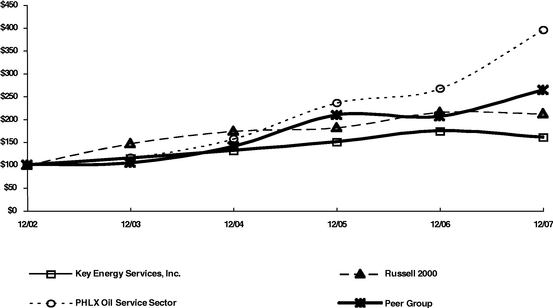
- *
- $100 invested on
6/30/01December 31, 2002 in stock or index—includingindex-including reinvestment of dividends. Fiscal year ending December 31.
Copyright © 2007, Standard and Poor's, a division of The McGraw-Hill Companies, Inc. All rights reserved. www.researchdatagroup.com/S&P.htm
Dividend Policy. There were no dividends paid on Key's common stock duringfor the yearsyear ended December 31, 2006, December 31, 2005 or December 31, 2004.2007. Key must meet certain financial
covenants before it may pay dividends under the terms of its current credit facility. Key does not currently intend to pay dividends.
Sale of Unregistered Securities. On October 2, 2006, we awarded 25,000 shares of restricted stock to Mr. Don Weinheimer, our senior vice president-business development, technology and strategic planning, in connection with his hiring. On October 30, 2006, we awarded 15,000 shares of restricted stock to Mr. Marshall Dodson, our chief accounting officer, in connection with the completion of our restatement process. On December 22, 2006, we awarded an aggregate amount of 285,000 shares of restricted stock to our top four current executive officers for retention purposes. All such shares of restricted stock were granted under the Key Energy Group, Inc. 1997 Incentive Plan. Each of these issuances of shares of restricted stock were made in reliance upon the exemption from the registration requirements of the Securities Act of 1933 provided by Section 4(2) thereof for transactions by an issuer not involving any public offering.
Stock Repurchases. TheDuring the fourth quarter of 2007, the Company made the following repurchasesrepurchased an aggregate 2,378,283 million shares of its common stock during 2006.stock. The repurchases were made pursuant to the Company's $300 million share repurchase program and to satisfy tax withholding obligations that arose upon vesting of restricted stock that washad been granted to certain senior executives during 2005. See Item 11. "Executive Compensation."executives. Set forth below is a summary of the share repurchases.
ISSUER PURCHASES OF EQUITY SECURITIES
Period
| | Total Number of Shares Purchased(1)
| | Average Price Paid per Share(2)
| | Total Number of Shares Purchased as Part of Publicly Announced Plans or Programs
| | Maximum Number (or Appropriate Dollar Value) of Shares (or Units) that May Yet Be Purchased Under the Plans or Programs
| | Total Number
of Shares
Purchased
| | Weighted
Average Price
Paid per Share
| | Total Number
of Shares
Purchased as
Part of Publicly Announced Plans or Programs
| | Appropriate
Dollar Value of
Shares that May Yet Be Purchased Under the Plans or Programs
|
|---|
| June 24, 2006 | | 80,835 | | 14.60 | | — | | — | |
| October 1, 2007 to October 31, 2007 | | | 3,528 | (1) | $ | 15.64 | (2) | — | | — |
| November 1, 2007 to November 30, 2007 | | | 820,400 | (3) | $ | 13.53 | | 820,400 | | $ | 288.9 million |
| December 1, 2007 to December 31, 2007 | | | 1,554,355 | (4) | $ | 13.81 | (5) | 1,521,000 | | $ | 267.8 million |
- (1)
The numberRelated to share repurchases made to satisfy tax withholding obligations of shares repurchased was determined based on the minimum supplemental withholding rate and an additional withholding ratecertain executive officers upon vesting of 10% for Kim B. Clarke.restricted stock.
- (2)
- The average price paid per share on the vesting date was determined using the closing price of the common stock of the Company as quoted on the Pink Sheets on
June 23, 2006.October 1, 2007 and the closing price of the common stock of the Company as quoted on the NYSE on October 29, 2007.
- (3)
- In October 2007, the Company announced a $300 million share repurchase program. The program expires March 31, 2009.
- (4)
- Includes 33,355 shares repurchased to satisfy tax withholding obligations of certain executive officers upon vesting of restricted stock.
- (5)
- The price paid per share on the vesting date with respect to the tax withholding repurchases was determined using the average of the closing price and opening price on December 21, 2007 and December 24, 2007, respectively, as quoted on the NYSE.
Equity Compensation Plan Information
See Item 12. "Security OwnershipThe following table sets forth information as of Certain Beneficial Owners and Management and Related Stockholder Matters" for a description of securitiesDecember 31, 2007 with respect to compensation plans (including individual compensation arrangements) under which our common stock is authorized for issuanceissuance.
Plan Category
| | Number of securities to
be issued upon exercise
of outstanding options,
warrants and rights
(a)
| | Weighted-average exercise
price of outstanding
options, warrants
and rights
(b)
| | Number of securities remaining available for future issuance under equity compensation plans (excluding securities reflected in column (a))
(c)
|
|---|
| | (in thousands)
| |
| | (in thousands)
|
|---|
| Equity compensation plans approved by shareholders(1) | | 4,998 | | $ | 11.50 | | 4,000 |
| Equity compensation plans not approved by shareholders(2) | | 180 | | $ | 8.10 | | — |
| | |
| | | | |
|
| Total | | 5,178 | | | | | 4,000 |
- (1)
- Represents options and other stock-based awards granted under
equity compensation plans.the Key Energy Group, Inc. 1997 Incentive Plan (the "1997 Incentive Plan") and the options and other stock-based awards available under the Key Energy Services, Inc. 2007 Equity and Cash Incentive Plan (the "2007 Incentive Plan"). The 1997 Incentive Plan expired in November 2007.
- (2)
- Represents non-statutory stock options granted outside the 1997 Incentive Plan and the 2007 Incentive Plan. The options have a ten-year term and other terms and conditions as those options granted under the 1997 Incentive Plan. These options were granted during 2000 and 2001.
ITEM 6.Selected Financial Data
The following historical selected financial data for the years ended December 31, 2007, 2006, 2005 and 2004 has been derived from the audited financial statements of the Company. TheAlthough the Company emerged from an extended restatement and financial reporting process in September 2007, it is unable to provide complete audited financial information for periods prior to 2004. Therefore, the Company is not providing selected financial data for the yearsyear ended December 31, 2002 and 2003, because it is unable to provide financial statements for those periodsthat period (except for the December 31, 2003 balance sheet) in accordance with GAAP. See "Note Regarding Ourgenerally accepted accounting principles ("GAAP"). Investors should refer to the 2003 Financial Reporting Process."and Informational Report on Form 8-K/A, filed with the SEC on October 26, 2006 for a full description of the restatement process.
The historical selected financial data should be read in conjunction with the historical Consolidated Financial Statements and related notes thereto included in Item 8. "Consolidated Financial Statements and Supplementary Data."
Consolidated Results of Operations Data:
| |
| | Year Ended December 31,
| |
|---|
|
| | Year Ended
December 31,
2006
| | Year Ended
December 31,
2005
| | Year Ended
December 31,
2004
| |
| | 2007
| | 2006
| | 2005
| | 2004
| |
|---|
|
| | (in thousands, except per share data)
| |
| | (in thousands, except per share data)
| |
|---|
| Revenues | Revenues | | $ | 1,546,177 | | $ | 1,190,444 | | $ | 987,739 | | Revenues | | $ | 1,662,012 | | $ | 1,546,177 | | $ | 1,190,444 | | $ | 987,739 | |
| Direct expenses | Direct expenses | | 937,830 | | 782,126 | | 689,980 | | Direct expenses | | 985,614 | | 920,602 | | 780,243 | | 685,420 | |
| | | |
| |
| |
| | | |
| |
| |
| |
| |
| | Gross margin | | 608,347 | | 408,318 | | 297,759 | | Gross margin | | 676,398 | | 625,575 | | 410,201 | | 302,319 | |
| | | |
| |
| |
| | | |
| |
| |
| |
| |
| Selling, general and administrative expenses | | 178,299 | | 149,420 | | 157,573 | | |
| General and administrative expenses | | General and administrative expenses | | 230,396 | | 195,527 | | 151,303 | | 162,133 | |
| | | |
| |
| |
| | | |
| |
| |
| |
| |
| | Operating income, before depreciation and amortization | | 430,048 | | 258,898 | | 140,186 | | Operating income, before depreciation and amortization | | 446,002 | | 430,048 | | 258,898 | | 140,186 | |
| | | |
| |
| |
| | | |
| |
| |
| |
| |
| Depreciation and amortization | Depreciation and amortization | | 126,011 | | 111,888 | | 103,339 | | Depreciation and amortization | | 129,623 | | 126,011 | | 111,888 | | 103,339 | |
| Interest expense | | 38,927 | | 50,299 | | 46,206 | | |
| Interest expense, net of amounts capitalized | | Interest expense, net of amounts capitalized | | 36,207 | | 38,927 | | 50,299 | | 46,206 | |
| Other, net | Other, net | | (9,370 | ) | | 12,313 | | 19,114 | | Other, net | | 4,232 | | (9,370 | ) | | 12,313 | | 19,114 | |
| | | |
| |
| |
| | | |
| |
| |
| |
| |
| | Income (loss) from continuing operations before income taxes | | 274,480 | | 84,398 | | (28,473 | ) | Income (loss) from continuing operations before income taxes | | 275,940 | | 274,480 | | 84,398 | | (28,473 | ) |
| | | |
| |
| |
| | | |
| |
| |
| |
| |
| Income tax (expense) benefit | Income tax (expense) benefit | | (103,447 | ) | | (35,320 | ) | | 1,890 | | Income tax (expense) benefit | | (106,768 | ) | | (103,447 | ) | | (35,320 | ) | | 1,890 | |
| Minority interest | | Minority interest | | 117 | | — | | — | | — | |
| | | |
| |
| |
| | | |
| |
| |
| |
| |
| | Income (loss) from continuing operations | | 171,033 | | 49,078 | | (26,583 | ) | Income (loss) from continuing operations | | 169,289 | | 171,033 | | 49,078 | | (26,583 | ) |
| | | |
| |
| |
| | | |
| |
| |
| |
| |
| Discontinued operations, net of tax | Discontinued operations, net of tax | | — | | (3,361 | ) | | (5,643 | ) | Discontinued operations, net of tax | | — | | — | | (3,361 | ) | | (5,643 | ) |
| | | |
| |
| |
| | | |
| |
| |
| |
| |
| | Net income (loss) | | $ | 171,033 | | $ | 45,717 | | $ | (32,226 | ) | Net income (loss) | | $ | 169,289 | | $ | 171,033 | | $ | 45,717 | | $ | (32,226 | ) |
| | | |
| |
| |
| | | |
| |
| |
| |
| |
| | Income (loss) per common share from continuing operations: | | | | | | | | Income (loss) per common share from continuing operations: | | | | | | | | | |
| | | Basic | | $ | 1.30 | | $ | 0.37 | | $ | (0.20 | ) | | Basic | | $ | 1.29 | | $ | 1.30 | | $ | 0.37 | | $ | (0.20 | ) |
| | | Diluted | | $ | 1.28 | | $ | 0.37 | | $ | (0.20 | ) | | Diluted | | $ | 1.27 | | $ | 1.28 | | $ | 0.37 | | $ | (0.20 | ) |
| |
Income (loss) per common share from discontinued operations: |
|
|
|
|
|
|
| Income (loss) per common share from discontinued operations: | | | | | | | | | |
| | | Basic | | $ | — | | $ | (0.03 | ) | $ | (0.04 | ) | | Basic | | $ | — | | $ | — | | $ | (0.03 | ) | $ | (0.04 | ) |
| | | Diluted | | $ | — | | $ | (0.03 | ) | $ | (0.04 | ) | | Diluted | | $ | — | | $ | — | | $ | (0.03 | ) | $ | (0.04 | ) |
| |
Net income (loss) per common share: |
|
|
|
|
|
|
| Net income (loss) per common share: | | | | | | | | | |
| | | Basic | | $ | 1.30 | | $ | 0.34 | | $ | (0.24 | ) | | Basic | | $ | 1.29 | | $ | 1.30 | | $ | 0.34 | | $ | (0.24 | ) |
| | | Diluted | | $ | 1.28 | | $ | 0.34 | | $ | (0.24 | ) | | Diluted | | $ | 1.27 | | $ | 1.28 | | $ | 0.34 | | $ | (0.24 | ) |
Cash Flow Data:
| | Year Ended December 31,
| |
|---|
| | 2007
| | 2006
| | 2005
| | 2004
| |
|---|
| | (in thousands)
| |
|---|
| Net cash provided by operating activities | | $ | 249,919 | | $ | 258,724 | | $ | 218,838 | | $ | 69,801 | |
| Net cash used in investing activities | | | (302,847 | ) | | (245,647 | ) | | (33,218 | ) | | (64,081 | ) |
| Net cash provided by (used in) financing activities | | | 23,240 | | | (18,634 | ) | | (111,213 | ) | | (88,277 | ) |
| Effect of exchange rates on cash | | | (184 | ) | | (238 | ) | | (662 | ) | | (233 | ) |
Selected Balance Sheet Data:
| | December 31,
2006
| | December 31,
2005
| | December 31,
2004
|
|---|
| | (in thousands)
|
|---|
| Working capital | | $ | 265,498 | | $ | 169,022 | | $ | 165,920 |
| Property, plant and equipment, gross | | | 1,279,980 | | | 1,089,826 | | | 999,414 |
| Property, plant and equipment, net | | | 694,291 | | | 610,341 | | | 597,778 |
| Total assets | | | 1,541,398 | | | 1,329,244 | | | 1,316,622 |
| Long-term debt and capital leases, net of current maturities | | | 406,080 | | | 410,781 | | | 481,047 |
| Total liabilities | | | 810,887 | | | 775,187 | | | 810,956 |
| Stockholders' equity | | | 730,511 | | | 554,057 | | | 505,666 |
| | December 31,
2007
| | December 31,
2006
| | December 31,
2005
| | December 31,
2004
|
|---|
| | (in thousands)
|
|---|
| Working capital | | $ | 253,068 | | $ | 265,498 | | $ | 169,022 | | $ | 165,920 |
| Property and equipment, gross | | | 1,595,225 | | | 1,279,980 | | | 1,089,826 | | | 999,414 |
| Property and equipment, net | | | 911,208 | | | 694,291 | | | 610,341 | | | 597,778 |
| Total assets | | | 1,859,077 | | | 1,541,398 | | | 1,329,244 | | | 1,316,622 |
| Long-term debt and capital leases, net of current maturities | | | 511,614 | | | 406,080 | | | 410,781 | | | 481,047 |
| Total liabilities | | | 970,079 | | | 810,887 | | | 775,187 | | | 810,956 |
| Stockholders' equity | | | 888,998 | | | 730,511 | | | 554,057 | | | 505,666 |
| Cash dividends per common share | | | — | | | — | | | — | | | — |
ITEM 7.Management's Discussion and Analysis of Financial Condition and Results of Operations
The following discussion and analysis of our financial condition and results of operations should be read in conjunction with our consolidated financial statements and related notes thereto in Item 8. "Consolidated Financial Statements and Supplementary Data." The discussion below contains forward-looking statements that are based upon our current expectations and are subject to uncertainty and changes in circumstances including those identified in "Cautionary Note Regarding Forward-Looking Statements." Actual results may differ materially from these expectations due to inaccurate assumptions and known or unknown risks and uncertainties. See Item 1A. "Risk Factors."
Business and Growth Strategies
Our strategy is to improve results through improved pricing onacquisitions, growing our core services, addition of new equipment across all operating segments, acquisitions, international expansion,maintaining a strong balance sheet, expanding internationally, investing in technology, expanding our product line, remanufacturing rigs and related equipment,services offering, and training personnel in order to maintain a qualified and safety-conscious employee base.
Core Services Pricing.Acquisitions. Our strategy contemplates that we may make acquisitions that strengthen our presence in selected regional markets. During 2007, we completed the acquisition of Moncla Well Service, Inc. and related entities (collectively, "Moncla") and Advanced Measurements, Inc. ("AMI"). In addition, we acquired the well service assets of Kings Oil Tools, Inc. ("Kings"). Through the purchase of Moncla and Kings, we increased our well service rig count by 89 units and our swab rig count by six units. We believe that it is importantthese acquisitions will allow us to expand our geographic "footprint" and improve our service to our customers. See—"Acquisitions," for our operational and financial success that we have a consistent and sound pricing philosophy. During the past several years, we have implementedadditional discussion.
We are currently evaluating a number of price increases across all service lines. These increases have allowed us to improve operating results, to invest more capitalgeographic-focused acquisition candidates, primarily in equipmentour well servicing segment, and to enhance employee safety, training and retention programs. During periods of soft demand, we intend tothese acquisitions, if completed, would help strengthen our position in several core markets. We may seek to maintainidentify other acquisition candidates and we may evaluate acquisition opportunities in either our prices, where feasible.pressure pumping or fishing and rental services segments. Our acquisitions in 2007 were made with cash and notes payable, and our objective is to use cash for future geographic-focused acquisitions. In some limited cases, however, we may elect to use equity as a financing tool for our acquisition program.
Organic Growth in Core Segments. During the past three years we have significantly increased our capital expenditures, devoting more capital to organic growth. Since the beginning of 2004,2005, we have cumulatively spent approximately $416.4$526.5 million on capital expenditures, including those financed through capital leases. Capital expenditures including capital lease additions, were $211.2of $212.6 million in 2006. This includes2007. These expenditures include the purchase of new pressure pumping equipment, new cased-hole electric wireline units, and new and remanufactured well service rigs, as well as numerous rental equipment and fishing tools. WeWhile we believe that the returns on organic growth capital remain strong, we intend to reduce our capital expenditures in 2008 in order to allocate
more capital to our acquisition and share repurchase programs. Presently, we estimate that we will spend approximately $175.0 million in capital expenditures in 2008; however, that amount could increase if we are awarded additional international work, which would require us to build new equipment.
Maintain Strong Balance Sheet. We believe that our ability to maintain a strong balance sheet and therefore, we anticipate a similar levelexercise sound capital discipline is critical. We also believe that our ability to maintain ample liquidity and borrowing capacity is important in order to enable us to finance acquisitions and share repurchases, as well as to take advantage of capital spendingother attractive business opportunities if they should develop. In order to provide more flexibility and meet our objectives, during 2007 as in 2006.
Acquisitions. Our strategy also contemplates that we may make acquisitions that strengthenrefinanced our presence in selected regional markets.outstanding indebtedness. We are currently evaluating a numberissued $425.0 million of geographic-focused acquisition candidates, primarily in our well service segment,long-term senior unsecured notes (the "Notes") and these acquisitions, if completed, would help strengthen our position in several core markets. We may seek to identify other acquisition candidates and we may evaluate acquisition opportunities in either pressure pumping or fishing and rental services segments. At present we have not entered into any definitive acquisition agreementsa new $400.0 million Senior Secured Credit Facility (the "2007 Senior Secured Credit Facility"). The Notes, which have a coupon of 8.375%, require no prepayment and any acquisition is subject to agreement upon terms, negotiationmature in 2014. The 2007 Senior Secured Credit Facility consists of definitive documentation, regulatory clearancesa revolving credit facility, letter of credit sub-facility and other conditions. We expect that these acquisitions will be for cash.swing line facility, all of which mature no later than 2012.
International Expansion. We presently operate in Argentina and Mexico.Mexico and have a technology development group based in Canada. We are evaluating ways in which we can expand internationally. Our objectiveOne of our objectives is to redeploy under-utilized assets to international markets. In addition, we will consider strategic international acquisitions in order to establish a presence in a particular market, if appropriate. We have evaluated a number of international markets, and our topnear-term priority is expansion in Mexico. Long term, we believe opportunities may exist in the Middle East, Russia and Latin America. See Item 1. "Business—Foreign Operations," for further discussion of our current international operations. We also have an investment in IROC SystemsEnergy Services Corp. in Canada. See Item 8. "Consolidated Financial Statements and Supplementary Data," Note 9—7—"Investment in IROC SystemsEnergy Services Corp."
We commenced operations in Mexico during the second quarter of 2007. In February 2007, PEMEX awarded our Mexican subsidiary, Key Energy Services de México S. de R.L. de C.V., a 22-month contract valued at $45.8 million to provide field production solutions and well workover services. Under the terms of the contract, we will initially provide three well service rigs outfitted with our proprietary KeyView® system and will install two KeyView systems on PEMEX-owned well service rigs. The contract grants PEMEX the option to call for additional rigs and KeyView® systems in the future, although these incremental services are not included in the contract. The current project will cover PEMEX's North Region assets and will initially focus on oil wells in the Burgos, Poza Rica-Altamira and Cerro Azul. Depending on the success of the initial project, potential expansion opportunities into the Veracruz and Reynosa fields plus the entire PEMEX Southern Region out of Villa Hermosa, Tabasco, may be possible. Further details of the PEMEX contract are provided in Item 8. "Consolidated Financial Statements and Supplementary Data," Note 19—"Subsequent Events."
Technology Initiative. We have invested, and will continue to invest, in technology projects that improve operating efficiencies for both ourselves and our customers, improve safety performance of our well service rigs and fluid hauling vehicles and provide opportunities for additional revenue.
In 2003, we began deployment of our proprietary well service technology. The KeyView® system captures well-site operating data, thereby allowing customers and ourselves to monitor and analyze information about well servicing, resulting in improved efficiency. At December 31, 2006,2007, we had 207220 KeyView® units installed, and as of June 30, 2007, 215 units had been installed. The KeyView® system increases our and our customers' visibility into activities at the well site. Through this technology, we have the ability to (i) ensure proper rod and tubing make-up which will result in reduced downhole failures, (ii) improve efficiency, through better logistics and planning, and (iii) improve safety. We believe that this system provides us a competitive advantage as it is a patented technology. For a further discussion of the KeyView® system, see Item 1. "Business—Patents, Trade Secrets, Trademarks and Copyrights."
Our technology initiative was expanded with the acquisition of AMI in 2007. AMI designs and produces oilfield service data acquisition, control and information systems. AMI's technology platform and applications facilitate the collection of job performance and related information and digitally distributes the information to customers. AMI contributed to the development of the KeyView® system and will assist in the advancement of this technology.
Expansion of Product Line.Services Offering. We believe that it is important to have a broad and diverse product line.services offering. For this reason, we have invested growth capital intoin our pressure pumping segment and our fishing and rental segment. In addition, during 2006 we entered the cased-hole electric wireline business in Texas, and we are seekingexpanded our cased-hole electric wireline operation during 2007. During 2008, we intend to seek opportunities to expand our wireline services to other markets.markets and to expand our project with PEMEX in Mexico. We also have ordered six coiled-tubing units which we expect to receive during the
second quarter of 2008. We believe that some customers prefer to consolidate vendors and we feel that our expanded product lineservices offering may provide better opportunities for select customer penetration.
Remanufacturing Rigs and Related Equipment. We intend to continue to actively remanufacture our rigs and related equipment in order to improve the quality of our rig fleet. We believe that the remanufacturing program results in increased efficiency and improved safety. We believe these benefits result in more reliability for our customers. We believe that our cash flow (as well as other financial resources) is sufficient for us to continue to make the capital expenditures necessary to remanufacture our equipment. Although we believe our remanufactured rigs are more economical and equal in quality to new rigs, we have ordered and may again elect to order new rigs during periods of very strong demand when our remanufacturing centers are operating at or near capacity.
Training and Developing Employees. We devote significant resources to the training and professional development of our employees, with a special emphasis on safety. We currently own and operate two training centers in Texas, as well as two facilities in California, Wyoming and Wyoming.Louisiana. In addition, in conjunction with local community colleges, we have two cooperative training centers in New Mexico and Oklahoma. The training centers are used to enhance our employees' understanding of operating and safety procedures. We recognize the historically high turnover rate in the industry.industry in which we operate. We are committed to offering attractive and competitive compensation, benefits and incentive programs for our employees that are
attractive and competitive in the industry, in order to ensure a steady stream of qualified, safety-conscious personnel that are able to provide quality service to our customers.
Current Financial Condition and Liquidity
We believe our current financial condition is strong, and we believe that our current reserves of cash and cash equivalents, short-term investments, current availability ofunder our revolving credit facility,2007 Senior Secured Credit Facility, and internally generated cash flow from operations are sufficient to finance the cash requirements of our current and future operations and our budgeted capital expenditures for 2007.2008. As of June 30,December 31, 2007, we had $166.5$58.8 million in cash and short-term investments and $65.0$288.9 million of availability under our revolving credit facility. Cash was reduced by $23.0 million in July 2007 as a result of the settlement of litigation with our former chief executive officer.Senior Secured Credit Facility.
In July 2007, we adopted a near-term capital investment plan to return capital to our shareholders and to make strategic geographic focused acquisitions, as described above. Once we have completed our quarterly reports for the first and second quarters of 2007, and the third quarter report if then due, ourgeographic-focused acquisitions. Our Board of Directors intendssubsequently authorized a share repurchase program of up to initiate a program to repurchase between $200$300 million and $300 millionwhich is effective through March 31, 2009. Through December 31, 2007, we repurchased 2,341,400 shares of our common stock. The amount, terms and method of execution of the stock repurchase will be determined by the Board afterfor approximately $32.2 million. In addition, through February 20, 2008, we have made the quarterly filings. Anycumulatively had repurchased 5,363,096 shares for approximately $69.8 million. Our repurchase program, as well as the amount and timing of the future repurchases, is subject to market conditions and our financial condition and liquidity at the time, including obtaining additional debt financing for the repurchase program.liquidity.
The capital investment plan also contemplates that we will continueprovides for the Company to make acquisitions. During 2007, we completed three acquisitions for approximately $158.0 million in the aggregate, net of cash acquired. Our capital expenditures totalingexpenditure program for 2008 is expected to total approximately $200 million during 2007.$175.0 million; however, that amount is subject to market conditions, including activity levels, commodity prices and industry capacity. Our focus in 2008 will be maximizing the utilization of our current equipment, however, we may seek to increase our 2008 capital expenditure budget in the event international expansion opportunities develop. See—"Acquisitions."
Our stock repurchase program and the acquisition program, described above, as well as planned capital expenditures, are expected to be financed through a combination of cash on hand, cash flow from operations and additional borrowings. Our cash and short-term investments and availabilityborrowings under our revolving credit facility would enable us to finance a portion of the capital investment plan. However, to complete the capital plan, we anticipate that we will have to incur more indebtedness. We believe that our balance sheet and cash generated from operations will support additional leverage. We can provide no assurance that new debt financing can be obtained or as to the terms and conditions on which it can be obtained.2007 Senior Secured Credit Facility.
Performance Measures
In determining the overall health of the oilfield service industry, we believe that the Baker Hughes U.S. land drilling rig count is the best barometer of capital spending and activity levels, since this data is made publicly available on a weekly basis. Historically, our activity levels have been highly correlated to capital spending by oil and natural gas producers. When commodity prices are strong, capital spending by our customers tends to be high, as illustrated by the Baker Hughes U.S. land drilling rig
count. As the following table indicates, the land drilling rig count has increased significantly over the past several years as commodity prices, both oil and natural gas, have increased.
Year
| | WTI Cushing
Crude Oil(1)
| | NYMEX Henry Hub
Natural Gas(1)
| | Average Baker Hughes
Land Drilling Rigs(2)
| | WTI Cushing
Crude Oil(1)
| | NYMEX Henry Hub
Natural Gas(1)
| | Average Baker Hughes
Land Drilling Rigs(2)
|
|---|
| 2002 | | $ | 26.18 | | $ | 3.37 | | 717 | | $ | 26.18 | | $ | 3.37 | | 717 |
| 2003 | | $ | 31.08 | | $ | 5.49 | | 924 | | $ | 31.08 | | $ | 5.49 | | 924 |
| 2004 | | $ | 41.51 | | $ | 6.18 | | 1,095 | | $ | 41.51 | | $ | 6.18 | | 1,095 |
| 2005 | | $ | 56.64 | | $ | 9.02 | | 1,290 | | $ | 56.64 | | $ | 9.02 | | 1,290 |
| 2006 | | $ | 66.05 | | $ | 6.98 | | 1,559 | | $ | 66.05 | | $ | 6.98 | | 1,559 |
| 2007 | | | $ | 72.34 | | $ | 7.12 | | 1,695 |
- (1)
- Represents average crude oil or natural gas price, respectively, for each of the years presented.
- (2)
- Source:www.bakerhughes.com
Internally, we measure activity levels primarily through our rig and trucking hours. Generally, as capital spending by oil and natural gas producers increases, demand for our services also rises, resulting in increased rig and trucking services and more hours worked. Conversely, when activity levels decline due to lower spending by oil and natural gas producers, we generally provide fewer rig and trucking services, which results in lower hours worked. We publicly release our monthly rig and trucking hours, and the following table presents our quarterly rig and trucking hours from 20042005 through the second quarter of 2007.
|
| | Rig Hours
| | Trucking Hours
|
| | Rig Hours
| | Trucking Hours
|
|---|
| 2004: | | | | | |
| | First Quarter | | 584,897 | | 729,020 | |
| | Second Quarter | | 609,116 | | 718,003 | |
| | Third Quarter | | 626,556 | | 690,542 | |
| | Fourth Quarter | | 600,217 | | 664,283 | |
| | |
| |
| |
| Total 2004: | | 2,420,786 | | 2,801,848 | |
2005: |
2005: |
|
|
|
| 2005: | | | | |
| | First Quarter | | 621,228 | | 641,841 | First Quarter | | 621,228 | | 641,841 |
| | Second Quarter | | 661,928 | | 635,448 | Second Quarter | | 661,928 | | 635,448 |
| | Third Quarter | | 668,741 | | 607,500 | Third Quarter | | 668,741 | | 607,500 |
| | Fourth Quarter | | 646,810 | | 594,762 | Fourth Quarter | | 646,810 | | 594,762 |
| | | |
| |
| | |
| |
|
| Total 2005: | Total 2005: | | 2,598,707 | | 2,479,551 | Total 2005: | | 2,598,707 | | 2,479,551 |
2006: |
2006: |
|
|
|
|
2006: |
|
|
|
|
| | First Quarter | | 663,819 | | 609,317 | First Quarter | | 663,819 | | 609,317 |
| | Second Quarter | | 679,545 | | 602,118 | Second Quarter | | 679,545 | | 602,118 |
| | Third Quarter | | 677,271 | | 587,129 | Third Quarter | | 677,271 | | 587,129 |
| | Fourth Quarter | | 637,994 | | 578,471 | Fourth Quarter | | 637,994 | | 578,471 |
| | | |
| |
| | |
| |
|
| Total 2006: | Total 2006: | | 2,658,629 | | 2,377,035 | Total 2006: | | 2,658,629 | | 2,377,035 |
2007: |
2007: |
|
|
|
|
2007: |
|
|
|
|
| | First Quarter | | 625,748 | | 571,777 | First Quarter | | 625,748 | | 571,777 |
| | Second Quarter | | 611,890 | | 583,074 | Second Quarter | | 611,890 | | 583,074 |
| | | Third Quarter | | 597,617 | | 570,356 |
| | | Fourth Quarter | | 614,444 | | 583,191 |
| | | | |
| |
|
| Total 2007: | | Total 2007: | | 2,449,699 | | 2,308,398 |
In our pressure pumping segment, we track the total number of jobs performed to measure activity levels. The following table presents the types and total number of jobs performed by the Key Pressure Pumping Services divisionour pressure pumping services segment for the periods presented.
Year
| | Fracturing
| | Cementing
| | Acidizing
| | Other
| | Total
| | Fracturing
| | Cementing
| | Acidizing
| | Other
| | Total
|
|---|
| 2004 | | 1,228 | | 1,007 | | 883 | | 180 | | 3,298 | |
| 2005 | | 1,329 | | 1,558 | | 1,057 | | 132 | | 4,076 | | 1,329 | | 1,558 | | 1,057 | | 106 | | 4,050 |
| 2006 | | 1,672 | | 2,039 | | 641 | | 106 | | 4,458 | | 1,585 | | 1,958 | | 639 | | 96 | | 4,278 |
| 2007 | | | 2,152 | | 2,074 | | 481 | | 77 | | 4,784 |
The majority of our pressure pumping segment revenue (approximately 80 - 85%) is derived from our fracturing jobs.
Historical Operating Environment: 2004 and 2005
Environment
2007 Operating Environment
High commodity prices existed during 2004Activity levels in 2007 (as measured by our rig and 2005, reflecting concerns about the long-term U.S.trucking hours) were lower than 2006 due to increased supply of natural gas, the limited ability to increase oilwell service rigs and natural gas production despite strong increasesoilfield trucking assets in the U.S. land drilling rig count, declining U.S. inventories of crude oil and instability in the Middle East, among other factors. For these reasons, commodity prices were high relative to historical standards, and this resulted in higher than normal levels of capital spending by our customers to develop their properties through increased drilling and workover services.
We benefited from the increased spending as our total rig hours increased 7.3% to 2,598,707 in 2005 compared to 2004, although our trucking hours decreased 11.5% to 2,479,551 for the same period. The increase in rig hours is indicative of strong demand by U.S. oil and natural gas producers to utilize workover and well maintenance services in order to boost production of oil and natural gas reserves during a strong commodity price environment. The decrease in our trucking hours reflected increased competitive forces and, to a lesser extent, reflects the termination of our Egypt contract and the sale of our Michigan assets, both of whichmarket. Our activity declines occurred in the summer of 2005.
We believe that the strong activity levels in 2004 and 2005 were the result of the high commodity price environment and the desire of our customers to increase production of oil and natural gas reserves.
Current Operating Environment: 2006 through June 30, 2007
Overall activity levels in 2006 were stronger than 2005 due todespite continued strength of commodity prices, including record high oil prices, and overall industry demand for ourwell services. Rig hours for 20062007 totaled 2,658,629, an increase2,449,699, a decrease of 2.3%7.9% from 2005. Meanwhile, our2006. The decrease in activity levels would have been greater absent the impact of the businesses acquired during 2007. The Moncla acquisition included 59 well service rigs and during the fourth quarter those assets contributed approximately 34,000 rig hours.
Our trucking hours totaled 2,377,035,2,308,398, a decrease of 4.1%2.9% from 2005.2006. The Baker Hughes land drilling rig count averaged 1,5591,695 in 2006,2007, an increase of approximately 20.9%8.7% from an average of 1,2901,559 in 2005.2006. The higher drilling rig count is indicative of the strength of the U.S. marketplace, which is directly associated with the strength of oil and natural gas prices. As of June 30,December 31, 2007, the Baker Hughes land drilling rig count totalled 1,697. In 2006,totaled 1,719, while in 2007 the WTI Cushing price for light sweet crude averaged $66.05$72.34 per barrel whileand natural gas prices averaged $6.98$7.12 per MMbtu.
Through the six months ending June 30, 2007, commodity prices have remained at historically strong levels as crude oil prices have averaged $61.68 per barrel while natural gas prices averaged $7.42 per MMbtu. Despite these high commodity prices, our activity levels haveOur business has been negatively impacted by poor weather conditionsnew industry capacity. In our well servicing segment, both our rig and trucking hours are down year-over-year due primarily to new competition. The new capacity has entered the U.S. market place due to high returns and strong demand for oilfield services. In addition, some of our customers have elected to vertically integrate and have purchased and now operate their own equipment. Activity levels in severalmost of our operating regions are down from 2006; the regions with the most pronounced declines include the Gulf Coast, the Rocky Mountains and East Texas. These regions are characterized by high natural gas production. In response to lower utilization of our assets, during 2007, we reduced pricing for some of our customers. These reductions have taken place in most of our regions while new industry capacity has also negatively impactedand in all of our operating segments.
2008 Operating Environment Outlook
Our activity levels and resultedto date in pricing pressure for2008, excluding the contribution of businesses acquired in 2007, are down from last year. However, our services. We have experienced more pronounced pressure in the Gulf Coastbusiness remains strong and East Texas regions as well as in the Rocky Mountain region. For the quarter ended June 30, 2007, our rig hours totaled 611,890 while our trucking hours totaled 583,074. The rig hours declined 2.2% from the March 2007 quarter while our trucking hours slightly improved by 2.0% from the March 2007 quarter. Although activity levels have moderated slightly, overall industry conditions remain strong.
We recognize that commodity prices are volatile and could decline; however, based on current commodity prices, we believe that our activity levels will remain strongstable for the balance of 2007 and, assuming no material decline in2008. Our belief is predicated on the fact that commodity prices this winter, shouldthrough February 2008 remain at levels higher than 2007. As of February 15, 2008 crude oil prices were in excess of $90 per barrel while natural gas prices were in excess of $8.50 per MMbtu. At these high prices, we believe customer spending in 2008 could surpass spending in 2007. We also remain strong for 2008.believe that our recent acquisitions in the fourth quarter of 2007 will help offset declines in our other businesses. We also believe that our recent acquisitions in the fourth quarter of 2007 will help offset declines in our other businesses. Because demand for our well servicing, pressure pumping services, and fishing and rental services is generally correlatescorrelated to commodity prices and drilling activity, our activity levels may be negatively impacted in the event commodity prices decline rapidly or unexpectedly.
Although we believe that demand for our services will be strong because of the high commodity prices, we also believe that our business will continue to face increased competition due to additional industry capacity and new market entrants. We believe that this risk is somewhat mitigated as a number of oilfield service companies, including us, have announced capital spending reductions for 2008. This should reduce the rate of growth of new equipment entering the market. This reduction, combined with higher commodity prices, leads us to believe that 2008 could be as strong, if not stronger, than 2007. Our 2008 budget estimates that our revenues will exceed revenue for 2007. In the event new capacity does not slow, we believe that margin compression could occur in 2008 as increased equipment capacity could result in lower utilization of our assets. Further, an increase in equipment supply could lead to higher labor rates as the demand for people would correspondingly increase.
We also have initiatives underway that we hope will maintain and possibly enhance our margins. These initiatives include a continued focus on safety improvements and reductions in employee turnover. Better safety performance, we believe, will reduce workers compensation expense and help lower our insurance premiums. Additionally, lower employee turnover will help reduce hiring and training costs. We are also seeking to reduce our reliance on third-party consultants and outside legal counsel, to the extent their services were generally attributable to matters arising out of our restatement and financial reporting process. We believe this will help reduce our general and administrative expenses.
We also anticipate that our international operations will expand. We have received additional requests for equipment from our customer in Mexico. Presently, we operate three rigs in Mexico, and we believe that we will send up to eight additional rigs to Mexico during 2008. In addition, we have secured pricing increases in our Argentina division and anticipate that margins for that division should improve in 2008.
Acquisitions
Moncla Acquisition.Acquisitions
On October 25, 2007, we purchased all of the outstanding shares and membership interests of Moncla. Moncla operated in Texas, Louisiana, Mississippi, Alabama and Florida. Headquartered in Lafayette, Louisiana, and with offices in Sour Lake, Texas and Sandersville, Mississippi, Moncla operated a total of 59 rigs (including six swabbing units) and had over 900 employees. Moncla's fleet included 37 daylight rigs for well servicing and workovers and eight twenty-four hour rigs for shallow drilling, sidetracking and deep workovers. In addition, the Moncla companies operated eight barge rigs, and owned rig-up, swab, hot oil and anchor trucks, tubing testing units and rental equipment. Revenue attributable to the Moncla business is anticipated to be approximately $140.0 million in 2008.
In February 2004,The purchase price for Moncla was approximately $146.0 million, which consisted of net assets acquired of $131.3 million and assumed debt of $14.7 million. Amounts transferred at closing consisted of (i) $108.6 million of cash; (ii) the issuance of an unsecured promissory note for $12.5 million that is payable in a lump sum on October 25, 2009, with accrued interest payable on each anniversary date of the closing of the acquisition; and (iii) the issuance of an unsecured promissory note for $10.0 million that is payable in five annual installments of $2.0 million plus accrued interest on each annual anniversary date of the closing of the acquisition. Both promissory notes bear interest at the Federal Funds rate, adjusted annually on the anniversary of the closing date. The long-term debt assumed in the acquisition was repaid simultaneously with the closing of the transaction. The purchase price is subject to a working capital adjustment, which has not been finalized.
The Moncla purchase agreement entitles the former owners of Moncla to receive earnout payments, on each of the next five anniversary dates of the closing date of the acquisition, of up to $5.0 million (up to $25.0 million in total). The earnout payments are based on the achievement of certain revenue targets and profit percentage targets over the next five years and are payable upon
achieving annual targets or a cumulative target on the fifth anniversary date. These payments represent an additional element of cost of the acquired entity and will be accounted for as an increase to goodwill if and when the contingent payment is made.
Kings Acquisition. On December 7, 2007, we acquired Fleet Cementers, Inc., a wholly owned subsidiarythe well service assets and related equipment of Precision Drilling Corporation,Kings. The acquired assets, all of which are located in California, included 36 marketed well service rigs, 10 stacked well service rigs and related support equipment. We anticipate that the acquired assets will contribute revenue of approximately $36 million in 2008. Total consideration paid for the transaction was approximately $20.0$45 million in cash, (of which $6.0included consideration for a noncompete agreement with the owner of Kings.
Technology Acquisition. On September 5, 2007, we purchased, through a wholly-owned Canadian subsidiary, all of the outstanding shares of AMI, a privately-held Canadian technology company focused on oilfield service equipment controls, data acquisition, and digital information work flow. The purchase price was $6.6 million in cash and the assumption of approximately $2.9 million in debt, which has since been paid in full. The purchase agreement also provided for deferred cash payments up to a maximum of $1.8 million related to the retention of key employees. On the date of acquisition, AMI owned a 48% interest in Advanced Flow Technologies, Inc. ("AFTI"), a privately-held Canadian technology company focused on low cost wireless gas well production monitoring. As part of the purchase of AMI we were required to exercise an option to increase AMI's interest in AFTI to 51.46%. The cost to exercise this option was paid back to usapproximately $0.5 million. As a result, through AMI we now own a 51.46% interest in 2005 in consideration of our agreeing to remove certain noncompete restrictions from the agreement). Fleet Cementers provided pressure pumping services, including cementing, fracturing, acidizing, coil tubing pumping and nitrogen pumping, with primary operations in California and Texas.AFTI. In connection with the Fleet acquisition of AMI, we relocated certainbecame party to a revolving credit agreement with a maximum outstanding amount of the Fleet assets to the Barnett Shale region$0.9 million. This facility was extinguished in North Texas. This acquisition was accounted for using the purchase method, and the results of the operations generated from the acquired assets are included in our results of operations as of the completion date of the acquisition. In addition to the Fleet acquisition, we completed several other small acquisitions in 2004 for total consideration of $2.2 million.November 2007.
We made no acquisitions during 2005 or 2006.
Discontinued Operations
On January 15, 2005, we completed the sale to Patterson-UTI Energy, Inc. of the majority of our contract drilling assets, which included the drilling rigs and associated equipment in the Permian Basin and Four Corners regions and certain rigs from the Rocky Mountain region. In consideration of the sale, we received approximately $60.5 million in cash, after paying all fees related to the sale. The sale included approximately 25 active rigs and 10 stacked rigs as well as a number of rigs which had been classified as either scrap or salvage. The active rigs were mechanical with an average of approximately 700 horsepower and depth ratings of approximately 10,000 feet. We estimate that the contract drilling assets contributed $72.6 million of revenue in 2004. As a result of the sale, we treated our drilling business as a discontinued operation for all periods presented and recorded an after-tax loss from discontinued operations of $3.4 million, or $0.03 per diluted share, for the year ended December 31, 2005 and an after-tax loss of $5.6 million, or $0.04 per diluted share, during the year ended December 31, 2004.2005.
Cash flows from our discontinued operations have been segregated and individually presented for all years in our consolidated statements of cash flows. We do not anticipate that the absence of these cash flows in future periods will have a material adverse impact on our liquidity, results of operations or financial position.
Adoption of SFAS 123(R)
On January 1, 2006, we adopted the provisions of Statement of Financial Accounting Standards No. 123 (revised 2004), "Share-Based Payment" ("SFAS 123(R)"). Prior to that date, we applied the provisions of Statement of Financial Accounting Standards No. 123, "Accounting for Stock-Based Compensation" ("SFAS 123"). In the years in which we applied SFAS 123, we continued to account for stock-based compensation using the intrinsic value approach as outlined by Accounting Principles Board Opinion No. 25, "Accounting for Stock Issued to Employees" ("APB 25"), with proforma disclosure of the impact of SFAS 123 on our net income and basic and diluted earnings per share, which was permitted under SFAS 123. As a result of the adoption of SFAS 123(R), our Consolidated Statements of Operations for the years ended December 31, 2006, 2005 and 2004 are not comparable.
We adopted SFAS 123(R) using the modified prospective approach, which was one of the options permitted by that standard. There was no one-time effect of the adoption of SFAS 123(R), and no changes to option valuation models or assumptions previously used to calculate the proforma effects of accounting for stock-based compensation under the fair value approach were made upon the adoption of SFAS 123(R). As of the date of adoption, we had approximately $5.0 million of compensation expense associated with prior awards that were not vested, which we expect to recognize over a weighted-average period of 1.36 years.
Results of Operations
The following table sets forth statements of operations for the years indicated:
| | Year Ended December 31,
| |
|---|
| | 2007
| | 2006
| | 2005
| |
|---|
| | (in thousands)
| |
|---|
| REVENUES: | | | | | | | | | | |
| | Well servicing | | $ | 1,264,797 | | $ | 1,201,228 | | $ | 956,457 | |
| | Pressure pumping | | | 299,348 | | | 247,489 | | | 152,320 | |
| | Fishing and rental | | | 97,867 | | | 97,460 | | | 81,667 | |
| | |
| |
| |
| |
| Total revenues | | | 1,662,012 | | | 1,546,177 | | | 1,190,444 | |
| | |
| |
| |
| |
| COSTS AND EXPENSES: | | | | | | | | | | |
| | Well servicing | | | 738,694 | | | 725,008 | | | 634,043 | |
| | Pressure pumping | | | 189,645 | | | 138,377 | | | 92,301 | |
| | Fishing and rental | | | 57,275 | | | 57,217 | | | 53,899 | |
| | Depreciation and amortization | | | 129,623 | | | 126,011 | | | 111,888 | |
| | General and administrative | | | 230,396 | | | 195,527 | | | 151,303 | |
| | Interest expense, net of amounts capitalized | | | 36,207 | | | 38,927 | | | 50,299 | |
| | Loss on early extinguishment of debt | | | 9,557 | | | — | | | 20,918 | |
| | Loss (gain) on sale of assets, net | | | 1,752 | | | (4,323 | ) | | (656 | ) |
| | Interest income | | | (6,630 | ) | | (5,574 | ) | | (2,713 | ) |
| | Other, net | | | (447 | ) | | 527 | | | (5,236 | ) |
| | |
| |
| |
| |
| Total costs and expenses, net | | | 1,386,072 | | | 1,271,697 | | | 1,106,046 | |
| | |
| |
| |
| |
| Income from continuing operations before income taxes | | | 275,940 | | | 274,480 | | | 84,398 | |
| Income tax expense | | | (106,768 | ) | | (103,447 | ) | | (35,320 | ) |
| Minority interest | | | 117 | | | — | | | — | |
| | |
| |
| |
| |
| INCOME FROM CONTINUING OPERATIONS | | | 169,289 | | | 171,033 | | | 49,078 | |
| | |
| |
| |
| |
| Loss from discontinued operations, net of tax expense of $4,590 | | | — | | | — | | | (3,361 | ) |
| | |
| |
| |
| |
| NET INCOME | | $ | 169,289 | | $ | 171,033 | | $ | 45,717 | |
| | |
| |
| |
| |
Key Energy Services, Inc.
Consolidated Statements of Operations
(In thousands, exceptREVIEW OF OPERATIONS
For the year ended December 31, 2007, our revenue reached a record high. Our revenue for the year ended December 31, 2007 totaled $1.66 billion, which represents a 7.5% increase over the prior year. Our net income for the year totaled $169.3 million, which represents a 1.0% decrease from the prior year while our earnings per fully diluted share totaled $1.27 compared to $1.28 from the prior year.
Impacting our net income and earnings per share data)
for 2007 results were costs associated with the refinancing of our indebtedness in the fourth quarter of 2007. These include a loss related to the early extinguishment of our 2005 Senior Secured Credit Facility (defined herein) which totaled $9.6 million, or $0.04 per fully diluted share, and the termination of two interest rate swaps associated with that debt, which resulted in a loss of $2.3 million, or $0.01 per fully diluted share.
A detailed review of our operations, including a review of our segments, is provided below.
Revenue
| | Year Ended December 31,
| |
|---|
| | 2006
| | 2005
| | 2004
| |
|---|
| REVENUES: | | | | | | | | | | |
| | Well servicing | | $ | 1,201,228 | | $ | 956,457 | | $ | 818,001 | |
| | Pressure pumping | | | 247,489 | | | 152,320 | | | 91,226 | |
| | Fishing and rental services | | | 97,460 | | | 81,667 | | | 78,512 | |
| | |
| |
| |
| |
| Total revenues | | | 1,546,177 | | | 1,190,444 | | | 987,739 | |
| | |
| |
| |
| |
COSTS AND EXPENSES: |
|
|
|
|
|
|
|
|
|
|
| | Well servicing | | | 736,014 | | | 635,442 | | | 571,032 | |
| | Pressure pumping | | | 141,743 | | | 92,323 | | | 69,156 | |
| | Fishing and rental services | | | 60,073 | | | 54,361 | | | 49,792 | |
| | Depreciation and amortization | | | 126,011 | | | 111,888 | | | 103,339 | |
| | General and administrative | | | 178,299 | | | 149,420 | | | 157,573 | |
| | Interest expense | | | 38,927 | | | 50,299 | | | 46,206 | |
| | Loss on early extinguishment of debt | | | — | | | 20,918 | | | 12,025 | |
| | (Gain) loss on sale of assets | | | (4,323 | ) | | (656 | ) | | 8,040 | |
| | Interest income | | | (5,574 | ) | | (2,713 | ) | | (660 | ) |
| | Other, net | | | 527 | | | (5,236 | ) | | (291 | ) |
| | |
| |
| |
| |
| Total costs and expenses, net | | | 1,271,697 | | | 1,106,046 | | | 1,016,212 | |
| | |
| |
| |
| |
Income from continuing operations before income taxes |
|
|
274,480 |
|
|
84,398 |
|
|
(28,473 |
) |
| Income tax (expense) benefit | | | (103,447 | ) | | (35,320 | ) | | 1,890 | |
| | |
| |
| |
| |
| INCOME FROM CONTINUING OPERATIONS | | | 171,033 | | | 49,078 | | | (26,583 | ) |
| | |
| |
| |
| |
Discontinued operations, net of tax (expense) benefit of $0, $(4,590) and $2,285, respectively |
|
|
— |
|
|
(3,361 |
) |
|
(5,643 |
) |
| | |
| |
| |
| |
| NET INCOME (LOSS) | | $ | 171,033 | | $ | 45,717 | | $ | (32,226 | ) |
| | |
| |
| |
| |
EARNINGS (LOSS) PER SHARE: |
|
|
|
|
|
|
|
|
|
|
| | Net income from continuing operations | | | | | | | | | | |
| | Basic | | $ | 1.30 | | $ | 0.37 | | $ | (0.20 | ) |
| | Diluted | | $ | 1.28 | | $ | 0.37 | | $ | (0.20 | ) |
| |
Discontinued operations, net of tax |
|
|
|
|
|
|
|
|
|
|
| | Basic | | $ | — | | $ | (0.03 | ) | $ | (0.04 | ) |
| | Diluted | | $ | — | | $ | (0.03 | ) | $ | (0.04 | ) |
| |
Net income (loss) |
|
|
|
|
|
|
|
|
|
|
| | Basic | | $ | 1.30 | | $ | 0.34 | | $ | (0.24 | ) |
| | Diluted | | $ | 1.28 | | $ | 0.34 | | $ | (0.24 | ) |
WEIGHTED AVERAGE SHARES OUTSTANDING: |
|
|
|
|
|
|
|
|
|
|
| | Basic | | | 131,332 | | | 131,075 | | | 130,757 | |
| | Diluted | | | 134,064 | | | 133,595 | | | 130,757 | |
Year Ended December 31, 2007 versus Year Ended December 31, 2006
Our revenue for the year ended December 31, 2007 increased $115.8 million, or 7.5%, to $1.66 billion from $1.55 billion for the year ended December 31, 2006. The increase in revenue relates to:
Revenue (in millions)
| | Change from 2006
|
|---|
| Well servicing segment | | $ | 63.5 |
| Pressure pumping segment | | $ | 51.9 |
| Fishing & rental segment | | $ | 0.4 |
| | |
|
| Total change | | $ | 115.8 |
Businesses acquired during 2007 contributed approximately $26.5 million of the increase in the well servicing segment over 2006. The Moncla transaction included 59 well service rigs, and during the fourth quarter those assets contributed approximately 34,000 rig hours and $23.6 million in revenue. The remaining $2.9 million of revenues from acquired businesses is attributable to AMI. Mexican operations began during the second quarter of 2007 and added $9.0 million in revenue to our well servicing segment. We presently operate three well service rigs in Mexico and the number of rigs in Mexico is anticipated to increase by eight rigs (for a total of 11 rigs) during 2008. Our cased-hole electric wireline activities in our well servicing segment also expanded during the year, providing a $13.7 million increase in revenues as we added additional units to our fleet. We believe this business offers a good growth opportunity and we intend to add additional cased-hole electric wireline units during 2008. Absent these items, overall increases in well servicing segment revenue were driven primarily by the impact of pricing increases that were implemented during the middle of 2006, though we were affected by declines in prices in the second half of 2007. Revenue was also affected by declines in rig and truck hours, as competition in the well servicing sector increased during 2007 and we lost market share to new capacity in the marketplace. Our pressure pumping segment revenue increased as we deployed additional frac pumps and cement units. This allowed us to perform more frac jobs, which is the primary revenue driver in our pressure pumping segment. Revenue in the fishing and rental segment was flat compared to 2006.
YEAR ENDED DECEMBERYear Ended December 31, 2006 VERSUS YEAR ENDED DECEMBERversus Year Ended December 31, 2005
Our revenue for the year ended December 31, 2006 increased $355.7 million, or 29.9%, to $1.55 billion from $1.19 billion for the year ended December 31, 2005. The increase in revenue relates to:
Revenue (in millions)
| | Change from 2005
|
|---|
| Well servicing segment | | $ | 244.7 |
| Pressure pumping segment | | $ | 95.2 |
| Fishing & rental segment | | $ | 15.8 |
| | |
|
| Total change | | $ | 355.7 |
Our well servicing segment benefited from a 2.3% increase in our rig hours combined with a significant improvement in the pricing for our well service rig services. Our pressure pumping segment revenue increased as we deployed new frac pumps and cement units, adding to our fleet. This allowed us to perform more frac jobs, which is primarilythe primary revenue driver in our pressure pumping segment. Fishing and rental revenue increased principally due to higher pricingactivity levels and improved pricing.
Direct Costs
Direct costs as a percentage of total revenue improved to 59.3% for the year ended December 31, 2007, compared to 59.5% for the year ended December 31, 2006. Direct costs as a percentage of total revenue improved to 59.5% for the year ended December 31, 2006, compared to 65.5% for the year ended December 31, 2005.
Year ended December 31, 2007 versus Year Ended December 31, 2006
Consolidated direct costs for the year ended December 31, 2007 increased $65.0 million, or 7.1%, to $985.6 million from $920.6 million for the year ended December 31, 2006. The $65.0 million increase is primarily the result of:
Direct Costs (in millions)
| | Change from 2006
| |
|---|
| Employee compensation | | $ | 25.4 | |
| Pressure pumping supplies and equipment | | $ | 41.6 | |
| Well service acquisitions | | $ | 16.0 | |
| Self-insurance costs | | $ | (21.8 | ) |
| Other costs | | $ | 3.8 | |
| | |
| |
| Total change | | $ | 65.0 | |
Our employee compensation costs, which include salaries, bonuses and related expenses, increased $25.4 million primarily as the result of increased incentive compensation and increased headcount, exclusive of the impact of acquisitions. Wage and bonus increases during the year were necessary, as the market for our labor continues to be extremely competitive. With new competitors entering the market and existing competitors adding equipment capacity, we were forced to increase wage rates in order to maintain our high levels of quality personnel. Supplies and equipment for our pressure pumping segment increased $41.6 million, primarily as a result of increases in the size of our pressure pumping fleet and increases in the costs to purchase and transport materials used in providing services to our customers. Acquisitions in our well serviceservices segment modestly higher levelsadded $16.0 million to our direct costs in 2007. Our self-insurance costs, composed of well service rig activitycosts associated with workers compensation, vehicular liability exposure, and insurance premiums declined significantly in 2007 as compared to 2006. We have been focused on improving our safety performance, and in 2007 the impactnumber and severity of additional pressure pumping equipment. Thesesafety-
related accidents declined. We continue to focus on safety improvements more than offset the declines inand our trucking hours. We believe that the overall increases in activity and demand forsafety performance is a component of our services is attributable to the continued strength of commodity prices.incentive compensation program.
Year Ended December 31, 2006 versus Year Ended December 31, 2005
Operating income, before depreciation and amortizationConsolidated direct costs for the year ended December 31, 2006 increased $171.2$140.4 million, or 66.1%18.0%, to $430.0$920.6 million from $258.9$780.2 million for the year ended December 31, 2005. The $140.4 million increase is primarily the result of:
Direct Costs (in millions)
| | Change from 2005
| |
|---|
| Employee compensation | | $ | 97.0 | |
| Well service equipment and supplies | | $ | 17.9 | |
| Pressure pumping equipment and supplies | | $ | 36.6 | |
| Other costs | | $ | (11.1 | ) |
| | |
| |
| Total change | | $ | 140.4 | |
Our employee compensation costs, which include salaries, bonuses and related expenses increased $97.0 million, primarily as the result of increased incentive compensation and increased headcount. Wage and bonus increases during the year were necessary, as the market for our labor continues to be extremely competitive. With new competitors entering the market and existing competitors adding equipment capacity, we were forced to increase wage rates in order to maintain our high levels of quality personnel. Supplies and equipment costs for our well servicing operations increased $17.9 million in 2006 compared to 2005, primarily as a result of increases in costs associated with higher activity levels, which results in strong utilization of our equipment and therefore, more wear and tear on our operational assets. Additionally, many of the assets we acquired through acquisitions during the 1994 - 2002 timeframe are beginning to reach the end of their economic useful lives; because of this, these assets require greater repairs and maintenance to keep them productive and operating. The repair and maintenance expense is also a function of our proactive maintenance programs. Supplies and equipment for our pressure pumping operations increased $36.6 million, primarily as a result of increases in the size of our fleet as we added equipment year over year, as well as increases in the costs to purchase and transport sand and chemicals used in our operations. Other costs declined $11.1 million, primarily as a result of reductions in self-insurance costs.
Depreciation and Amortization Expense
Year Ended December 31, 2007 versus Year Ended December 31, 2006
Depreciation and amortization expense increased $3.6 million, or 2.9%, to $129.6 million for the year ended December 31, 2007, compared to $126.0 million for the year ended December 31, 2006. Contributing to the increase in depreciation and amortization expense was depreciation expense associated with our acquisitions during 2007, which totaled approximately $4.8 million, and increased depreciation of approximately $7.7 million related to management's reassessment of the useful lives of certain assets. Excluding the depreciation and amortization expense associated with acquisitions and reassessment of useful lives, our depreciation expense would have declined approximately $8.9 million because the assets we added through various acquisitions during the 1994 to 2002 time period are now reaching the end of their depreciable lives. Depreciation and amortization expense as a percentage of revenue for the year ended December 31, 2007 totaled 7.8%, compared to 8.1% for the year ended December 31, 2006.
Year Ended December 31, 2006 versus Year Ended December 31, 2005
Depreciation and amortization expense increased $14.1 million, or 12.6%, to $126.0 million for the year ended December 31, 2006, compared to $111.9 million for the year ended December 31, 2005. The increase is primarily attributable to a greater fixed asset base, which is due to increased capital expenditures. For the year ended December 31, 2006, our capital expenditures totaled approximately $195.8 million, as compared to $118.1 million for the year ended December 31, 2005. Depreciation and amortization expense as a percentage of revenue for the year ended December 31, 2006 totaled 8.1%, compared to 9.4% for the year ended December 31, 2005.
General and Administrative Expense
Year Ended December 31, 2007 versus Year Ended December 31, 2006
General and administrative ("G&A") expense increased $34.9 million, or 17.8%, to $230.4 million for the year ended December 31, 2007, compared to $195.5 million for the year ended December 31, 2006. The $34.9 million increase is primarily the result of:
G&A Expense (in millions)
| | Change from 2006
|
|---|
| Employee compensation | | $ | 7.5 |
| Acquisitions | | $ | 3.0 |
| 2006 legal settlement to the Company | | $ | 7.5 |
| Professional fees | | $ | 9.6 |
| Bad debt expense | | $ | 1.8 |
| Other | | $ | 5.5 |
| | |
|
| Total change | | $ | 34.9 |
Employee compensation, exclusive of the impact of acquisitions, which includes salaries, bonuses, equity-based compensation and payroll taxes, increased primarily due to higher equity-based compensation and, to a lesser extent, increased salaries. Equity-based compensation expense, excluding grants made to our outside directors, during 2007 totaled $12.0 million, compared to $5.6 million during 2006. The $6.4 million increase is primarily attributable to awards granted under our Phantom Share Plan at the end of 2006, as well as incremental stock options, restricted stock and stock appreciation rights awarded during 2007 under our 1997 Incentive Plan. G&A expenses added through acquisitions made during 2007 contributed $3.0 million to the increase in costs when compared to 2006.
G&A also increased in 2007, because G&A in 2006 included a $7.5 million benefit from a legal settlement in 2006 that was not repeated during 2007. Professional fees increased approximately $9.6 million during 2007, primarily due to our financial reporting process. Also contributing to the increase in G&A was an additional $1.8 million in bad debt expense and $5.5 million in other G&A costs. G&A expense as a percentage of revenue for the year ended December 31, 2007 totaled 13.9% compared to 12.6% for the year ended December 31, 2006.
Year Ended December 31, 2006 versus Year Ended December 31, 2005
G&A expense increased $44.2 million, or 29.2%, to $195.5 million for the year ended December 31, 2006 compared to $151.3 million for the year ended December 31, 2005. The increases in G&A expense are primarily attributable to:
G&A Expense (in millions)
| | Change from 2005
| |
|---|
| Employee compensation | | $ | 40.5 | |
| 2006 legal settlement | | $ | (7.5 | ) |
| Other costs | | $ | 11.2 | |
| | |
| |
| Total change | | $ | 44.2 | |
Compensation-related expenses increased primarily due to increased staff, higher equity-based compensation and increased incentive compensation expense. Equity-based compensation expense during 2006 totaled $5.6 million compared to $1.7 million during 2005, primarily due to incremental stock options and restricted stock granted during 2006. The 2006 period also benefited from a $7.5 million legal settlement. With the increases in staff, other general and administrative costs associated with additional employees, including but not limited to office and computer supplies and travel, also increased. These other G&A costs increased $11.2 million in 2006 as compared to 2005. G&A expense as a percentage of revenue for the year ended December 31, 2006 totaled 12.6% compared to 12.7% for the year ended December 31, 2005.
Interest Expense
Year Ended December 31, 2007 versus Year Ended December 31, 2006
Interest expense decreased $2.7 million, or 7.0%, to $36.2 million for the year ended December 31, 2007, compared to $38.9 million for the year ended December 31, 2006. The decrease is primarily the result of the impact of higher capitalized interest as a result of higher capital expenditures. This decrease was partially offset by a one-time $2.3 million cost associated with the settlement of two interest rate swaps that were terminated in connection with the termination of our 2005 Senior Secured Credit Facility in 2007. Interest expense as a percent of revenue for the year ended December 31, 2007 totaled 2.2%, compared to 2.5% for the year ended December 31, 2006. We anticipate that our interest expense will be higher in 2008 as our total debt has increased from the prior year.
Year Ended December 31, 2006 versus Year Ended December 31, 2005
Interest expense decreased $11.4 million, or 22.6%, to $38.9 million for the year ended December 31, 2006, compared to $50.3 million for the year ended December 31, 2005. The decrease was the result of lower interest rates under our 2005 Senior Secured Credit Facility, which was entered into in July 2005 and used to refinance all of our then-outstanding senior notes. The refinancing eliminated the monthly consent fees which were being paid to bondholders due to our failure to file SEC reports. Interest expense as a percentage of revenue for the year ended December 31, 2006 totaled 2.5%, compared to 4.2% for the year ended December 31, 2005.
Loss on Early Extinguishment of Debt
Year Ended December 31, 2007 versus Year Ended December 31, 2006
For the year ended December 31, 2007, we incurred a loss of $9.6 million associated with the termination of our 2005 Senior Secured Credit Facility. During 2007, we issued $425.0 million of Notes and used the proceeds to retire the term loans then outstanding under the 2005 Senior Secured Credit Facility. Concurrently, we entered into the 2007 Senior Secured Credit Facility and terminated the 2005
Senior Secured Credit Facility. The loss represents the write-off of debt issue costs we incurred when we entered into the 2005 Senior Secured Credit Facility.
Year Ended December 31, 2006 versus Year Ended December 31, 2005
For the year ended December 31, 2006, we did not incur any losses associated with the retirement of long-term debt obligations; however, for the year ended December 31, 2005, we incurred losses totaling $20.9 million associated with the termination of our then senior secured credit facility and the redemption or repayment of $425.0 million in senior notes.
Income Taxes
Year Ended December 31, 2007 versus Year Ended December 31, 2006
Our income tax expense was $106.8 million for the year ended December 31, 2007, as compared to income tax expense of $103.4 million for the year ended December 31, 2006. Our effective tax rate in 2007 was 38.7%, as compared to 37.7% in 2006. The increase in income tax and our effective tax rate is primarily attributable to the Texas Margins Tax, which added $5.5 million of state income taxes during 2007. In general, differences between the effective tax rates and the statutory rate of 35% result primarily from the effect of certain foreign and state income taxes and permanent items attributable to book-tax differences.
Year Ended December 31, 2006 versus Year Ended December 31, 2005
Our income tax expense was $103.4 million for the year ended December 31, 2006, as compared to income tax expense from continuing operations of $35.3 million for the year ended December 31, 2005. The increase in operating income istax was the result of higher taxable income. Our effective tax rate in 2006 was 37.7%, as compared to 41.8% in 2005. In general, differences between the effective tax rates and the statutory rate of 35% result primarily from the effect of certain foreign and state income taxes and permanent items attributable to increased pricing for our services and, to a lesser extent, increased activity levels. The rate of increase in the pricing for our services surpassed cost increases, resulting in higher operating income.book-tax differences.
Segment Results
| | Year Ended December 31,
| |
|---|
Segments
| |
|---|
| | 2007
| | 2006
| | 2005
| |
|---|
| | (in thousands, except for percentages)
| |
|---|
| Well Servicing | | | | | | | | | | |
| | Revenue | | $ | 1,264,797 | | $ | 1,201,228 | | $ | 956,457 | |
| | Direct Costs | | | 738,694 | | | 725,008 | | | 634,043 | |
| | Gross Profit | | | 526,103 | | | 476,220 | | | 322,414 | |
| | Gross Margin | | | 41.6 | % | | 39.6 | % | | 33.7 | % |
Pressure Pumping |
|
|
|
|
|
|
|
|
|
|
| | Revenue | | $ | 299,348 | | $ | 247,489 | | $ | 152,320 | |
| | Direct Costs | | | 189,645 | | | 138,377 | | | 92,301 | |
| | Gross Profit | | | 109,703 | | | 109,112 | | | 60,019 | |
| | Gross Margin | | | 36.6 | % | | 44.1 | % | | 39.4 | % |
Fishing & Rental |
|
|
|
|
|
|
|
|
|
|
| | Revenue | | $ | 97,867 | | $ | 97,460 | | $ | 81,667 | |
| | Direct Costs | | | 57,275 | | | 57,217 | | | 53,899 | |
| | Gross Profit | | | 40,592 | | | 40,243 | | | 27,768 | |
| | Gross Margin | | | 41.5 | % | | 41.3 | % | | 34.0 | % |
Well Servicing Segment
Revenue
Year Ended December 31, 2007 versus Year Ended December 31, 2006
Well Servicing:servicing segment revenue increased $63.5 million, or 5.3%, to $1.26 billion for the year ended December 31, 2007, compared to revenue of $1.20 billion for the year ended December 31, 2006. The increase in revenue is largely attributable to the impact of the acquisition of Moncla, which contributed $23.6 million, $9.0 million from our contract with PEMEX in Mexico and $13.7 million in higher revenue from our cased-hole electric wireline operations. The remainder of the increase is a result of the full-year impact of pricing increases implemented during the second half of 2006, though revenues were affected by declines in activity levels and reductions from overall peak pricing in the second half of 2007. During the year ended December 31, 2007, our rig hours decreased 7.9% compared to the year ended December 31, 2006 and our trucking hours decreased 2.9% during the comparable period. The decrease in both rig and trucking hours was due primarily to lost market share to new market entrants.
Year Ended December 31, 2006 versus Year Ended December 31, 2005
Well servicing segment revenues increased $244.8$244.7 million, or 25.6%, to $1.20 billion for the year ended December 31, 2006, compared to revenue of $956.5 million for the year ended December 31, 2005. The increase in revenue is largely attributable to higher pricing for our well service rigs and modestly higher activity levels. Because of continued high commodity prices and strong demand for maintenance and workover-related services, we implemented multiple price increases during the year.2006. This resulted in increased revenue year-over-year. Also, during the year ended December 31, 2006, our rig hours increased 2.3% compared to the year ended December 31, 2005, while our trucking hours decreased 4.1% during the comparable period. The decrease in trucking hours was due primarily to lost market share to new market entrants.
Direct Costs
Direct costs as a percent of total well servicing segment revenue improved to 58.4% for the year ended December 31, 2007, compared to 60.4% for the year ended December 31, 2006. Direct costs as a percent of total well servicing segment revenue improved to 60.4% for the year ended December 31, 2006, compared to 66.3% for the year ended December 31, 2005.
Year Ended December 31, 2007 versus Year Ended December 31, 2006
Well servicing direct costs increased $13.7 million, or 1.9%, to $738.7 million for the year ended December 31, 2007, compared to $725.0 million for the year ended December 31, 2006. Acquisitions made during 2007 contributed approximately $16.0 million to the increase in direct costs. Excluding the effect of acquisitions, well servicing direct costs increased as a result of higher employee compensation costs of $17.2 million. Compensation-related expenses increased due to the need to retain our workforce. As a result of new equipment capacity in the marketplace, the demand for labor remains strong and we have implemented programs to retain our personnel, including higher wage rates. Partially offsetting the increased compensation costs was a $22.8 million decrease in costs associated with our self-insurance programs. These costs, which include workers compensation, vehicular liability exposure and insurance premiums declined primarily as a result of improved safety performance and fewer and less severe incidents in 2007 compared to 2006. Other well servicing direct expenses increased approximately $3.3 million.
Year Ended December 31, 2006 versus Year Ended December 31, 2005
Well servicing direct costs increased $91.0 million, or 14.3%, to $725.0 million for the year ended December 31, 2006, compared to $634.0 million for the year ended December 31, 2005. The overall increase in direct costs is largely attributable to higher activity levels. During the year, direct labor costs increased $83.4 million due primarily to higher compensation-related expenses and higher workers compensation expense. Compensation-related expenses increased due to increased headcount, increased payroll hours and higher wages, all of which are attributable to increased demand for our services. Further, because demand for personnel had been very high due to strong market conditions, we increased wage rates for our employees in order to retain our employees and minimize employee turnover. Equipment costs increased $17.9 million during 2006 due primarily to higher repair and maintenance expense and higher supplies expense. This is the result of increased activity levels. Other direct well servicing costs decreased $10.3 million, which is largely attributable to lower self-insurance-related costs.
Pressure Pumping Services Segment
Pressure Pumping Services:Revenue
Year Ended December 31, 2007 versus Year Ended December 31, 2006
Pressure pumping services ("PPS") segment revenue increased $51.9 million, or 21.0%, to $299.3 million for the year ended December 31, 2007, compared to revenue of $247.5 million for the year ended December 31, 2006. The increase in revenue is attributable to the purchase of incremental pressure pumping equipment and higher activity levels, but was offset somewhat by lower pricing in 2007. Over the course of 2006 and 2007 we purchased additional new pressure pumping equipment to service and satisfy our customers' needs, increasing the size of our fleet. The new equipment resulted in additional services performed, which resulted in higher revenue during 2007. During 2007, we completed 2,152 fracturing jobs and 2,074 cementing jobs as compared to 1,585 and 1,958, respectively, in 2006. Fracturing and cementing jobs accounted for the substantial majority of the PPS segment revenue.
Year Ended December 31, 2006 versus Year Ended December 31, 2005
PPS segment revenues increased $95.2 million, or 62.5%, to $247.5 million for the year ended December 31, 2006, compared to revenue of $152.3 million for the year ended December 31, 2005. The increase in revenue is attributable to the purchase of incremental pressure pumping equipment, higher activity levels and higher pricing for our services. BecauseOver the course of continued strong demand for pressure pumping2006 and cementing services,2005 we purchased additional new pressure pumping equipment to service and satisfy our customers' needs.needs, increasing the size of our fleet. The new equipment resulted in additional services performed, which combined with higher pricing for our services, resulted in higher revenue during 2006. During 2006, we completed 1,6721,585 fracturing jobs and 2,0391,958 cementing jobs as compared to 1,329 and 1,558, respectively, in 2005. Fracturing and cementing jobs accountaccounted for the substantial majority of the PPS segment revenues.
Direct Costs
Direct costs as a percent of total PPS segment revenue worsened to 63.4% for the year ended December 31, 2007, compared to 55.9% for the year ended December 31, 2006. Direct costs as a percent of total PPS segment revenue improved to 55.9% for the year ended December 31, 2006, compared to 60.6% for the year ended December 31, 2005.
Year Ended December 31, 2007 versus Year Ended December 31, 2006
PPS direct costs increased $51.3 million, or 37.0%, to $189.6 million for the year ended December 31, 2007, compared to $138.4 million for the year ended December 31, 2006. The increase in direct costs is largely attributable to costs associated with increased demand for pressure pumping services and the increased size of our pressure pumping fleet. During 2007, costs related to employee compensation for the pressure pumping segment increased $8.8 million due primarily to expansion of our pressure pumping fleet through the introduction of new equipment, which required us to hire additional personnel and increased wage rates for our crews. Our equipment costs increased $13.2 million from 2006 primarily due to the expansion of our pressure pumping fleet. Additionally, sand, chemical and associated freight costs increased approximately $29.3 million during 2007. These costs relate to the purchase of sand and chemicals used in our operations from our various suppliers and the shipment to our pressure pumping facilities and job locations. As activity levels in our pressure pumping segment increased in 2007, we used greater amounts of sand and chemicals. Additionally, as overall activity in the pressure pumping sector increased during 2007, the costs for the materials and their transportation increased.
Year Ended December 31, 2006 versus Year Ended December 31, 2005
PPS direct costs increased $46.1 million, or 49.9%, to $138.4 million for the year ended December 31, 2006, compared to $92.3 million for the year ended December 31, 2005. The increase in direct costs is largely attributable to costs associated with increased demand for pressure pumping services and the increased size of our pressure pumping fleet. During 2006, direct labor costs increased $9.5 million due primarily to higher compensation-related expenses and higher contract labor costs. Compensation-related expenses increased due to increased headcount, increased payroll hours and higher wages, all of which are attributable to increased demand for our services. Further, because of the expansion of our pressure pumping fleet, we hired additional personnel to operate the new equipment, and because demand for personnel had been high due to strong market conditions, we increased wage rates in order to retain our employees. Equipment costs increased $12.5 million in 2006 due primarily to higher repair and maintenance expense, higher fuel expense and higher supplies expense. These increases are all the result of increased activity levels and the expansion of our pressure pumping fleet. Other direct pressure pumping costs increased $24.1 million. This increase is due primarily to higher sand and chemical product purchases, as well as higher freight costs.
Fishing and Rental Services:Services Segment
Revenue
Year Ended December 31, 2007 versus Year Ended December 31, 2006
Fishing and rental services ("FRS") segment revenuesrevenue totaled $97.9 million for the year ended December 31, 2007, compared to revenue of $97.5 million for the year ended December 31, 2006. Although the segment benefited from additional rental equipment in 2007, these equipment additions were offset somewhat by lower overall pricing.
Year Ended December 31, 2006 versus Year Ended December 31, 2005
FRS segment revenue increased $15.8 million, or 19.3%, to $97.5 million for the year ended December 31, 2006, compared to revenue of $81.7 million for the year ended December 31, 2005. The increase in revenue is due to higher activity levels and improved pricing for our services. In addition, the FRS segment benefited from the implementation of our management team's turnaround efforts which began during 2005.
Direct Costs
Direct costs as a percent of total FRS segment revenue improved to 58.5% for the year ended December 31, 2007, compared to 58.7% for the year ended December 31, 2006. Direct costs as a percent of total FRS segment revenue improved to 58.7% for the year ended December 31, 2006, compared to 66.0% for the year ended December 31, 2005.
Well Servicing:Year Ended December 31, 2007 versus Year Ended December 31, 2006
FRS direct costs were flat at $57.3 million for the year ended December 31, 2007, compared to $57.2 million for the year ended December 31, 2006.
Well servicingYear Ended December 31, 2006 versus Year Ended December 31, 2005
FRS direct costs increased $100.6$3.3 million, or 15.8%6.2%, to $736.0$57.2 million for the year ended December 31, 2006, compared to $635.4 million for the year ended December 31, 2005. The overall increase in direct costs is largely attributable to higher activity levels. During the year, direct labor costs increased $84.9 million due primarily to higher compensation-related expenses and higher workers' compensation expense. Compensation-related expenses, which primarily include salaries, bonuses and payroll taxes, increased due to increased headcount, increased payroll hours and higher wages, all of which are attributable to increased demand for our services. Further, because demand for personnel has been very high due to strong market conditions, we have increased wage
rates for our employees in order to retain our employees and minimize employee turnover. Equipment costs increased $17.9 million during 2006 due primarily to higher repair and maintenance expense and higher supplies expense. This is the result of increased activity levels. Other direct costs decreased $7.8 million, which is largely attributable to lower insurance costs. Direct costs as a percent of total well servicing segment revenue improved to 61.3% for the year ended December 31, 2006, compared to 66.4% for the year ended December 31, 2005.
Pressure Pumping Services: PPS direct costs increased $49.4 million, or 53.5%, to $141.7 million for the year ended December 31, 2006, compared to $92.3$53.9 million for the year ended December 31, 2005. The increase in direct costs is largely attributable to increased demand for our services. During the year, direct labor costs increased $12.8 million due primarily to higher compensation-related expenses and higher contract labor costs. Compensation-related expenses, which primarily include salaries, bonuses and payroll taxes, increased due to increased headcount, increased payroll hours and higher wages, all of which are attributable to increased demand for our services. Further, because of the expansion of our pressure pumping fleet, we hired additional personnel to operate the new equipment, and because demand for personnel has been high due to strong market conditions, we increased wage rates in order to retain our employees. Equipment costs increased $12.5 million due primarily to higher repair and maintenance expense, higher fuel expense and higher supplies expense. These increases are all the result of increased activity levels and the expansion of our pressure pumping fleet. Other direct costs increased $24.0 million. This increase is due primarily to higher sand and chemical product purchases as well as higher freight costs. Direct costs as a percent of total PPS segment revenue improved to 57.3% for the year ended December 31, 2006, compared to 60.6% for the year ended December 31, 2005.
Fishing and Rental Services: FRS direct costs increased $5.7 million, or 10.5%, to $60.1 million for the year ended December 31, 2006, compared to $54.4 million for the year ended December 31, 2005. The increase in direct costs is largely attributable to increased demand for our services. During the year, direct labor costs increased $6.6$4.2 million from the prior year. The FRS segment recorded higher labor costs due to higher activity levels, whileand incentive payments increased due to improved financial performance. Equipment costs were essentially flat, declining by $0.2 million while other direct costs decreased $0.7 million. Direct costs as a percent of total FRS segment revenue improved to 61.6%
Liquidity and Capital Resources
Historical Cash Flows
The following table summarizes our cash flows for the yearyears ended December 31, 2006, compared to 66.6% for the year ended December 31, 2005.2007 and 2006:
| | Year Ended December 31,
| |
|---|
| | 2007
| | 2006
| |
|---|
| | (in thousands)
| |
|---|
| Net cash provided by operating activities | | $ | 249,919 | | $ | 258,724 | |
| Cash paid for capital expenditures | | | (212,560 | ) | | (195,830 | ) |
| Cash paid for acquisitions, net of cash acquired | | | (157,955 | ) | | — | |
| Cash paid for short-term investments | | | (121,613 | ) | | (83,769 | ) |
| Cash proceeds received from sales of short-term investments | | | 183,177 | | | 22,294 | |
| Other investing activities | | | 6,104 | | | 11,658 | |
| Repayments of long-term debt and capital leases | | | (424,751 | ) | | (16,975 | ) |
| Borrowings of long-term debt, net of cash paid for debt issuance costs | | | 461,600 | | | (479 | ) |
| Cash paid to repurchase common stock | | | (30,454 | ) | | (1,180 | ) |
| Proceeds received from exercises of stock options | | | 13,444 | | | — | |
| Other financing activities | | | 3,401 | | | — | |
| Effect of exchange rates on cash | | | (184 | ) | | (238 | ) |
| | |
| |
| |
| Net decrease in cash and cash equivalents | | $ | (29,872 | ) | $ | (5,795 | ) |
| | |
| |
| |
General and Administrative ExpenseSources of Liquidity
GeneralOur sources of liquidity include our current cash and administrative ("G&A") expense increased $28.9 million, or 19.3%, to $178.3 million for the year ended December 31, 2006 compared to $149.4 million for the year ended December 31, 2005. The increase in G&A expense is primarily attributable to increased compensation-related expense, due primarily to increased corporate staff, higher equity-based compensation and increased incentive compensation expense. Equity-based compensation expense during 2006 totaled $6.3 million compared to $2.2 million during 2005. The increase in G&A expense was offset somewhat by lower bad debt expense and lower professional fees. G&A expense as a percent of revenue for the year ended December 31, 2006 totaled 11.5% compared to 12.6% for the year ended December 31, 2005.
Interest Expense
Interest expense decreased $11.4 million, or 22.6%, to $38.9 million for the year ended December 31, 2006, compared to $50.3 million for the year ended December 31, 2005. The decrease is the result of lower interest ratesshort-term investments, availability under our 2007 Senior Secured Credit Facility (defined below), which wasand internally generated cash flow from operations. During 2007, we refinanced our indebtedness. We issued $425.0 million of Notes and entered into the 2007 Senior Secured Credit Facility. The Notes, which have a coupon of 8.375%, require no prepayment and mature in July 20052014. The 2007 Senior Secured Credit Facility consists of a revolving credit facility, letter of credit sub-facility and usedswing line facility of up to refinancean aggregate principal amount of $400.0 million, all of our outstanding senior notes. The refinancing eliminated the monthly consent fees which were being paid to bondholders. Interest expense as a percent of revenue for the year ended December 31, 2006 totaled 2.5%, compared to 4.2% for the year ended December 31, 2005.
Depreciation and Amortization Expense
Depreciation and amortization expense increased $14.1 million, or 12.6%, to $126.0 million for the year endedwhich mature no later than 2012. As of December 31, 2006, compared to $111.92007, we had $288.9 million available for borrowing under the year ended December 31, 2005. The increase is primarily attributable to a greater fixed asset base, which is due to increased capital expenditures. For2007 Senior Secured Credit Facility. Approximately $50.0 million in borrowings were outstanding under the year ended December 31, 2006, our capital expenditures totaled approximately $211.2 million, including those financed under capital lease arrangements, as compared to $141.1 million for the year ended December 31, 2005. Depreciation and amortization expense as a percent of revenue for the year ended December 31, 2006 totaled 8.1%, compared to 9.4% for the year ended December 31, 2005.
Loss on Early Extinguishment of Debt
For the year ended December 31, 2006, we did not incur any losses associated with the retirement of long-term debt obligations; however, for the year ended December 31, 2005, we incurred a loss of $20.9 million associated with the termination of our prior seniorrevolving credit facility, the redemptionand $61.1 million of $275.0 million in 8.375% Senior Notes and the repaymentletters of our $150.0 million in 6.375% Senior Notes.
Income Taxes
Our income tax expense from continuing operations was $103.4 million for the year ended December 31, 2006, as compared to an income tax expense from continuing operations of $35.3 million for the year ended December 31, 2005. The increase in income tax expense was the result of higher taxable income. Our effective tax rate in 2006 was 37.7%, as compared to 41.8% in 2005. Income tax expense in 2006 included a benefit of $0.4 million related to the Texas Margins Tax and a $1.6 million benefit related to the Section 199 deduction for qualifying domestic production activitiescredit, issued under the American Jobs Creation Actletter of 2004. Itcredit sub-facility, were outstanding, which also included a $1.5 million benefit related toreduces the release of valuation allowance against state net operating losses and a $3.0 million expense for non-deductible executive and share-based compensation. Income tax expense in 2005 included a $0.6 million benefit related toavailability under the Section 199 deduction, a $1.1 million expense related to foreign taxes and a $0.6 million expense for non-deductible executive and share-based compensation. In general, differences between the effective rates and the statutory rate of 35% result primarily from the effect of certain foreign and state income taxes and permanent items attributable to book-tax basis differences.
YEAR ENDED DECEMBER 31, 2005 VERSUS YEAR ENDED DECEMBER 31, 2004
Our revenue for the year ended December 31, 2005 increased $202.7 million, or 20.5%, to $1.19 billion from $987.7 million for the year ended December 31, 2004. The increase in revenue is primarily due to modestly higher pricing in our well service segment, higher levels of well service rig activity and the impact of additional pressure pumping equipment. These improvements more than offset declines in our trucking hours.2007 Senior Secured Credit Facility. We believe that the overall increases in activity and demand for our servicesliquidity position is attributable to the continued strengthstrong. Our debt totaled $524.0 million as of commodity prices.
Operating income, before depreciation and amortization for the year ended December 31, 2005 increased $118.7 million, or 84.7%, to $258.9 million from $140.2 million for the year ended December 31, 2004. The increase in operating income2007, and we believe that this amount is attributable to increased pricing foracceptable given our servicesrecent financial performance and to a lesser extent, increased activity levels. The higher pricing for our services combined with higherbelief that industry activity levels resulted in higher operating income.2008 should remain stable.
Revenue
Well Servicing: Well servicing segment revenues increased $138.5 million, or 16.9%, to $956.5 million for the year ended December 31, 2005 compared to revenue of $818.0 million for the year ended December 31, 2004. The increase in revenue is largely attributable to higher pricing for our well service rigs and higher activity levels. During the year ended December 31, 2005, our rig hours increased 7.3%, compared to the year ended December 31, 2004 while our trucking hours decreased 11.5% during the comparable period. The decrease in trucking hours was due primarily to lost market share to new market entrants as well as due to the sale of our Michigan assets and the expiration of our Egypt contract. Because of rising demand for our maintenance and workover-related services, we were able to successfully implement rate increases on our services and this resulted in year-over-year revenue improvement.
Pressure Pumping Services: PPS segment revenues increased $61.1 million, or 67.0%, to $152.3 million for the year ended December 31, 2005 compared to revenue of $91.2 million for the year ended December 31, 2004. The increase in revenue is attributable to the purchase of additional pressure pumping equipment, higher activity levels and higher pricing for our services. During 2005, we completed 1,329 fracturing jobs and 1,558 cementing jobs as compared to 1,228 and 1,007, respectively in 2004. Fracturing and cementing jobs account for the substantial majority of the PPS segment revenue. In addition, our results in 2005 reflect the full year impact of the pumping and cementing assets acquired in February 2004 from Precision Drilling.
Fishing and Rental Services: FRS segment revenues increased $3.2 million, or 4.0%, to $81.7 million for the year ended December 31, 2005, compared to revenue of $78.5 million for the year ended December 31, 2004. Despite stronger market conditions and higher commodity prices in 2005 compared to 2004, the FRS segment experienced high management turnover in 2005 which negatively impacted our operations.
Direct Costs
Well Servicing: Well servicing direct costs increased $64.4 million, or 11.3%, to $635.4 million for the year ended December 31, 2005, compared to $571.0 million for the year ended December 31, 2004. During the year, direct labor costs increased $45.8 million due primarily to higher compensation-related expenses and higher workers' compensation expense. Compensation-related expenses, which primarily include salaries, bonuses and payroll taxes, increased due to increased headcount, increased payroll hours and higher wages, all of which are attributable to increased demand for our services. Because demand for personnel remained high, we implemented wage rate increases to retain our employees. Equipment costs increased $10.2 million due primarily to higher fuel expense, higher repair and maintenance expense and higher supplies expenses. The increase in fuel expense is due primarily to higher diesel prices combined with increased activity levels, while the other equipment cost increases are attributable to increased demand for our services. Other direct costs increased $8.4 million, which is largely attributable to higher insurance costs. Direct costs as a percent of total well servicing segment revenue improved to 66.4% for the year ended December 31, 2005, compared to 69.8% for the year ended December 31, 2004.
Pressure Pumping Services: PPS direct costs increased $23.2 million, or 33.5%, to $92.3 million for the year ended December 31, 2005, compared to $69.2 million for the year ended December 31, 2004. During the year, direct labor costs increased $4.1 million due to primarily to higher compensation-related expenses. Compensation-related expenses, which primarily include salaries, bonuses and payroll taxes, increased due to increased headcount, increased payroll hours and higher wages, all of which are attributable to increased demand for our services. Because demand for personnel remained high, we implemented wage rate increases to retain our employees, and we added additional personnel to operate our new pressure pumping equipment which was purchased to meet growing customer demand. Equipment costs increased $6.2 million due primarily to higher repair and maintenance expense and higher fuel expense. These increases are all the result of increased activity levels and the expansion of our pressure pumping fleet. Other direct costs increased $12.9 million. This increase is due primarily to higher sand and chemical product purchases and, to a lesser extent, higher freight costs. Direct costs as a percent of total PPS segment revenue improved to 60.6% for the year ended December 31, 2005, compared to 75.8% for the year ended December 31, 2004.
Fishing and Rental Services: FRS direct costs increased $4.6 million, or 9.2%, to $54.4 million for the year ended December 31, 2005 compared to $49.8 million for the year ended December 31, 2004. During the year, direct labor costs increased $1.9 million due to primarily to higher salaries expense, offset by lower incentive compensation and lower contract labor costs. The FRS segment recorded higher labor costs due to higher activity levels while incentive payments declined due to weaker financial performance. Equipment costs increased $2.2 million due primarily to higher repair and
maintenance expense. This is the result of higher activity levels. Other direct costs increased by $0.5 million. Direct costs as a percent of total FRS segment revenue worsened to 66.6% for the year ended December 31, 2005, compared to 63.4% for the year ended December 31, 2004.
General and Administrative ExpenseCash Requirements
General and administrative expense decreased $8.2 million, or 5.2%,During 2008, we anticipate our cash requirements to $149.4 million for the year ended December 31, 2005 compared to $157.6 million for the year ended December 31, 2004. G&A expense for the year ended December 31, 2004 includes a $21.5 million charge related to the settlement of litigation with our former chief executive officer. If this charge is subtracted from 2004 G&A expense, G&A expense of $149.4 million for 2005 was $13.3 million, or 9.8%, greater than the $136.1 million of G&A expense in 2004, other than the litigation settlement. The increase in G&A expense is primarily attributable to higher professional fees associated with the restatement process as well as higher compensation expense associated with increased corporate staff and increased incentive compensation. The increase is offset somewhat by lower bad debt expense. During the year ended December 31, 2005, we had $4.8 million of bad debt expense compared to bad debt expense of $11.7 million for the year ended December 31, 2004. The bad debt expense during the year ended December 31, 2004 includes the write-off of the $9.0 million retention bonus to our former chief executive officer. Equity-based compensation for the year ended December 31, 2005 totaled $2.2 million compared to $1.1 million for the year ended December 31, 2004. G&A expense as a percent of revenue for the year ended December 31, 2005 totaled 12.6% compared to 16.0% for the year ended December 31, 2004 (13.8% of total revenue if the litigation settlement is subtracted).
Interest Expense
Interest expense increased $4.1 million, or 8.9%, to $50.3 million for the year ended December 31, 2005 compared to $46.2 million for the year ended December 31, 2004. The increase resulted from higher waiver and consent fees paid to our bondholders due to our inability to timely file our financial statements. Interest expense as a percent of revenue for the year ended December 31, 2005 totaled 4.2% compared to 4.7% for the year ended December 31, 2004.
Depreciation and Amortization Expense
Depreciation and amortization expense increased $8.5 million, or 8.3%, to $111.9 million for the year ended December 31, 2005 compared to $103.3 million for the year ended December 31, 2004. The increase is primarily attributable to a greater fixed asset base which is due to increasedinclude working capital expenditures. For the year ended December 31, 2005, ourneeds, capital expenditures, totaled approximately $141.1 million, including those financed under capital lease arrangements, compared to $64.2 million foracquisitions and the year ended December 31, 2004. Depreciation and amortization expense as a percentrepurchase of revenue for the year ended December 31, 2005 totaled 9.4% compared to 10.5% for the year ended December 31, 2004.
Loss on Early Extinguishment of Debt
For the year ended December 31, 2005, we incurred a loss of $20.9 million associated with the terminationshares of our prior senior credit facility, the redemption of $275.0 million of our 8.375% Senior Notes and $150.0 million of our 6.375% Senior Notes. For the year ended December 31, 2004, we incurred a loss of $12.0 million which relates to primarily to the retirement of $97.5 million of our 14.0% Senior Subordinated Notes.
Income Taxes
Our income tax expense from continuing operations was $35.3 million for the year ended December 31, 2005, as compared to an income tax benefit of $1.9 million for the year ended
December 31, 2004. The increase in income tax is the result of higher taxable income. Our effective tax rate in 2005 was 41.8%, as compared to 6.6% in 2004. Income tax expense in 2005 included a $0.6 million benefit related to the Section 199 deduction for qualifying domestic production activities under the American Jobs Creation Act of 2004. It also included a $1.1 million expense related to foreign taxes and a $0.6 million expense for non-deductible executive and share-based compensation. Discontinued operations in 2005 and 2004 included a $3.9 million and $0.6 million expense, respectively, related to non-deductible goodwill. Income tax benefit in 2004 included a $3.6 million expense for non-deductible executive and share-based compensation and a $1.3 million expense related to foreign taxes. In general, differences between the effective rates and the statutory rate of 35% result primarily from the effect of certain foreign and state income taxes and permanent items attributable to book-tax basis differences.
Liquidity and Capital Resources
General
We have historically funded our operations, including capital expenditures, with cash flow from operations and have funded growth opportunities, including acquisitions, through debt and equity financing. Since 2004, we have pursued a strategy of repaying indebtedness and increasing our cash and short-term investments in order to maintain appropriate levels of liquidity while we completed the restatement and financial reporting process. We accomplished this objective by increasing cash flow from operations through increased activity levels and higher pricing as well as increasing liquidity through the sale of non-core assets.
common stock. We believe that our current reserves of cash and short termshort-term investments, our availability under our revolving credit facility2007 Senior Secured Credit Facility and our internally generated cash flow from operations are sufficient to finance the cash requirements of our current and future operations, including our 20072008 capital expenditure budget. We do not budget for acquisitions; however, we are continually evaluating opportunities that fit our specific acquisition profile. We expect to finance acquisitions through a combination of cash on hand, cash flow from operations and borrowings under our 2007 Senior Secured Credit Facility. In some limited cases, however, we may elect to use equity as a financing tool.
We anticipate that our capital expenditures in 2008, excluding acquisitions, will be approximately $175.0 million. For the past three years we have devoted significant amounts of our cash flow from operations to support organic growth. From the beginning of 2005 through December 31, 2007, we have cumulatively invested approximately $526.5 million in our rig fleet and equipment, excluding acquisitions. Capital expenditures during the year ended December 31, 2007 were $212.6 million, excluding acquisitions.
In October 2007, our board authorized us to repurchase up to $300.0 million of our outstanding common stock. We may from time to time repurchase shares of our common stock depending on the price of the stock, our liquidity and other considerations. During the year ended December 31, 2007, we repurchased approximately 2.3 million shares of our common stock for $32.2 million through our stock repurchase program. The 2007 Senior Secured Credit Facility permits share repurchases up to $200.0 million and provides that share repurchases in excess of $200.0 million can be made if our debt to capitalization ratio is below 50%. As of June 30,December 31, 2007, we had $176.3would have been permitted to make share repurchases in excess of $200.0 million.
From time to time we acquire businesses that improve our footprint in certain geographic areas, increase our range of products or services or are otherwise strategic to our business. During the year ended December 31, 2007, we used approximately $158.0 million in cash (net of cash acquired) and short-term investments and $65.0$22.5 million of availability under our revolving credit facility. In July 2007, we paid $23.0 million to our former chief executive officer to settle litigation with him. See Item 8. "Consolidated Financial Statements and Supplementary Data," Note 19—"Subsequent Events."in notes payable, in business acquisitions.
LiquidityOutstanding Indebtedness and Working Capital Resources for Year Endedas of December 31, 20062007
Our primary debt obligation,obligations, other than capital lease obligations and miscellaneousthe notes payable incurred in the acquisition of Moncla, as of December 31, 2006, was a term loan,2007, consisted of which $396.0$425.0 million was outstanding.outstanding principal amount of the Notes and $50.0 million of borrowings under the 2007 Senior Secured Credit Facility.
As of December 31, 2006,2007, we had net working capital (excluding the current portion of long-term debt and capital lease obligations of $12.4 million) of $265.5 million, which includes cash, cash equivalents and short-term investments of $58.8 million, as compared to net working capital (excluding the current portion of long-term debt and capital lease obligations of $15.7 million) of $281.2 million, which includes cash and cash equivalents and short-term investments of $150.1 million, as compared to netof December 31, 2006. Our working capital (excludingdeclined from December 31, 2006 to December 31, 2007 primarily as a result of using cash for our acquisitions in the current portionfourth quarter of long-term debt and capital lease2007.
Contractual Obligations
Set forth below is a summary of our contractual obligations of $12.6 million) of $181.7 million, which includes cash and cash equivalents of $94.2 million, as of December 31, 2005.2007. The increaseobligations we pay in future periods reflect certain assumptions, including variability in interest rates on our variable-rate obligations and the duration of our obligations, and actual payments in future periods may vary.
| | Payments Due by Period (in thousands)
|
|---|
| | Total
| | Less than
1 Year
(2008)
| | 1 - 3 Years
(2009 - 2011)
| | 4 - 5 Years
(2012 - 2013)
| | After 5 Years
(2014 +)
|
|---|
| 8.375% Senior Notes due 2014 | | $ | 425,000 | | $ | — | | $ | — | | $ | — | | $ | 425,000 |
| Interest associated with 8.375% Senior Notes due 2014 | | | 249,361 | | | 35,693 | | | 106,785 | | | 71,288 | | | 35,595 |
| Borrowings under 2007 Senior Secured Credit Facility | | | 50,000 | | | — | | | — | | | 50,000 | | | — |
| Interest associated with 2007 Senior Secured Credit Facility(1) | | | 16,015 | | | 3,242 | | | 9,699 | | | 3,074 | | | — |
| Commitment and availability fees associated with 2007 Senior Secured Credit Facility | | | 22,266 | | | 4,453 | | | 13,360 | | | 4,453 | | | — |
| Notes payable—related party, excluding discount | | | 22,500 | | | 2,000 | | | 18,500 | | | 2,000 | | | — |
| Interest associated with notes payable—related party(1) | | | 2,611 | | | 1,079 | | | 1,437 | | | 95 | | | — |
| Capital lease obligations, excluding interest and executory costs | | | 26,815 | | | 10,701 | | | 15,879 | | | 235 | | | — |
| Interest and executory costs associated with capital lease obligations(1) | | | 4,838 | | | 2,441 | | | 2,388 | | | 9 | | | — |
| Non-cancellable operating leases | | | 24,224 | | | 7,428 | | | 11,111 | | | 3,030 | | | 2,655 |
| Severance liabilities and retention payments | | | 1,970 | | | 831 | | | 1,104 | | | 27 | | | 8 |
| FIN 48 liabilities | | | 6,751 | | | 782 | | | 4,039 | | | 1,930 | | | — |
| Equity-based compensation liability awards | | | 5,386 | | | 1,775 | | | 3,611 | | | — | | | — |
| Earnout payments(2) | | | 25,000 | | | 5,000 | | | 15,000 | | | 5,000 | | | — |
| | |
| |
| |
| |
| |
|
| Total | | $ | 882,737 | | $ | 75,425 | | $ | 202,913 | | $ | 141,141 | | $ | 463,258 |
| | |
| |
| |
| |
| |
|
- (1)
- Interest costs on our floating rate debt were estimated using the rate in effect at December 31, 2007.
- (2)
- These amounts assume certain performance targets will be achieved.
Senior Notes
On November 29, 2007, we issued $425.0 million aggregate principal amount of Notes under an indenture, dated as of November 29, 2007 (the "Indenture"), among us, the guarantors party thereto (the "Guarantors") and The Bank of New York Trust Company, N.A., as trustee. The Notes were priced at 100% of their face value to yield 8.375%. Net proceeds, after deducting initial purchasers' discounts and estimated offering expenses, were approximately $416.1 million. We used approximately $394.9 million of the net workingproceeds to retire our term loans, including accrued and unpaid interest, under the 2005 Senior Secured Credit Facility, with the balance used for general corporate purposes. The 2005 Senior Secured Credit Facility was terminated in connection with our entry into the 2007 Senior Secured Credit Facility described below.
The Notes are general unsecured senior obligations of Key. Accordingly, they will rank effectively subordinate to all of our existing and future secured indebtedness. The Notes are or will be jointly and severally guaranteed on a senior unsecured basis by certain of our existing and future domestic subsidiaries.
Interest on the Notes is payable on June 1 and December 1 of each year, beginning June 1, 2008. The Notes mature on December 1, 2014.
On or after December 1, 2011, the Notes will be subject to redemption at any time and from time to time at our option, in whole or in part, upon not less than 30 nor more than 60 days' notice, at the redemption prices (expressed as percentages of the principal amount redeemed) set forth below, plus
accrued and unpaid interest thereon to the applicable redemption date, if redeemed during the twelve-month period beginning on December 1 of the years indicated below:
Year
| | Percentage
| |
|---|
| 2011 | | 104.188 | % |
| 2012 | | 102.094 | % |
| 2013 | | 100.000 | % |
Notwithstanding the foregoing, at any time and from time to time before December 1, 2010, we may, on any one or more occasions, redeem up to 35% of the aggregate principal amount of the outstanding Notes at a redemption price of 108.375% of the principal amount thereof, plus accrued and unpaid interest thereon to the redemption date, with the net cash proceeds of any one or more equity offerings; provided that at least 65% of the aggregate principal amount of the Notes issued under the Indenture remains outstanding immediately after each such redemption; and provided, further, that each such redemption shall occur within 180 days of the date of the closing of such equity offering.
In addition, at any time and from time to time prior to December 1, 2011, we may, at our option, redeem all or a portion of the Notes at a redemption price equal to 100% of the principal amount thereof plus the applicable premium (as defined in the Indenture) with respect to the Notes and plus accrued and unpaid interest thereon to the redemption date. If we experience a change of control, subject to certain exceptions, we must give holders of the Notes the opportunity to sell to us their Notes, in whole or in part, at a purchase price equal to 101% of the aggregate principal amount thereof, plus accrued and unpaid interest thereon to the date of purchase.
We are subject to certain negative covenants under the Indenture governing the Notes. The Indenture limits our ability to, among other things:
- •
- sell assets;
- •
- pay dividends or make other distributions on capital stock or subordinated indebtedness;
- •
- make investments;
- •
- incur additional indebtedness or issue preferred stock;
- •
- create certain liens;
- •
- enter into agreements that restrict dividends or other payments from our subsidiaries to us;
- •
- consolidate, merge or transfer all or substantially all of its assets;
- •
- engage in transactions with affiliates; and
- •
- create unrestricted subsidiaries.
These covenants are subject to certain exceptions and qualifications. In addition, substantially all of the covenants will terminate before the Notes mature if one of two specified ratings agencies assigns the Notes an investment grade rating in the future and no events of default exist under the Indenture. Any covenants that cease to apply to us as a result of achieving an investment grade rating will not be restored, even if the credit rating assigned to the Notes later falls below an investment grade rating.
In connection with the sale of the Notes, we entered into a registration rights agreement with the initial purchasers, pursuant to which we have agreed to file an exchange offer registration statement with the SEC with respect to an offer to exchange the Notes for substantially identical notes that are registered under the Securities Act, and to use reasonable best efforts to cause such registration statement become effective on or prior to November 29, 2008. Additionally, we have agreed to commence the registered exchange offer and to use our reasonable best efforts to issue, on or prior to the date that is principally due60 days after the date on which the exchange offer registration statement became effective, exchange notes in exchange for all Notes tendered prior thereto in the registered exchange
offer. Under some circumstances, in lieu of a registered exchange offer, we have agreed to stronger operating performance.file a shelf registration statement to cover resales of the Notes by certain holders thereof and to use reasonable best efforts to keep the shelf registration statement effective for a period of at least two years or such shorter period ending on the earlier of when all of the Notes available for sale thereunder (i) have been sold pursuant thereto and (ii) are no longer restricted securities (as defined in Rule 144 under the Securities Act, or any successor rule thereof). We are required to pay additional interest if we fail to comply with our obligations to register the Notes within the specified time periods.
2007 Senior Secured Credit Facility
Simultaneously with the closing of the offering of the Notes, we entered into a new credit agreement (the "Credit Agreement") with the several lenders from time to time party thereto, Bank of America, N.A., as Paying Agent, Co-Administrative Agent, Swing Line Lender and L/C Issuer, and Wells Fargo Bank, National Association, as Co-Administrative Agent, Swing Line Lender and L/C Issuer. The Credit Agreement provides for a senior secured credit facility (the "2007 Senior Secured Credit Facility") consisting of a revolving credit facility, letter of credit sub-facility and swing line facility of up to an aggregate principal amount of $400.0 million, all of which will mature no later than November 29, 2012. The 2007 Senior Secured Credit Facility and the obligations thereunder are secured by substantially all of the assets of the Company and the Guarantors, and are or will be guaranteed by certain of our existing and future domestic subsidiaries. The 2007 Senior Secured Credit Facility replaced our 2005 Senior Secured Credit Facility, which was terminated in connection with the closing of the offering of the Notes.
The interest rate per annum applicable to the 2007 Senior Secured Credit Facility is, at our option (i) LIBOR plus the applicable margin or (ii) the higher of (x) Bank of America's prime rate and (y) the Federal Funds rate plus 0.5%, plus the applicable margin. The applicable margin for LIBOR loans ranges from 150 to 200 basis points, and the applicable margin for all other loans ranges from 50 to 100 basis points, depending upon our consolidated leverage ratio.
The 2007 Senior Secured Credit Facility contains certain financial covenants, which, among other things, require the maintenance of a consolidated leverage ratio not to exceed 3.50 to 1.00 and a consolidated interest coverage ratio of not less than 3.00 to 1.00, and limit our capital expenditures to $250.0 million per fiscal year, up to 50% of which amount may be carried over for expenditure in the following fiscal year. Each of the ratios referred to above will be calculated quarterly on a consolidated basis for each trailing four fiscal quarter period. In addition, the 2007 Senior Secured Credit Facility contains certain affirmative and negative covenants, including, without limitation, restrictions on (i) liens; (ii) debt, guarantees and other contingent obligations; (iii) mergers and consolidations; (iv) sales, transfers and other dispositions of property or assets; (v) loans, acquisitions, joint ventures and other investments (with acquisitions permitted so long as, after giving pro forma effect thereto, no default or event of default exists under the 2007 Senior Secured Credit Facility, the consolidated leverage ratio does not exceed 2.75 to 1.00, we are in compliance with the consolidated interest coverage ratio and we have at least $25 million of availability under the 2007 Senior Secured Credit Facility); (vi) dividends and other distributions to, and redemptions and repurchases from, equity holders; (vii) prepaying, redeeming or repurchasing subordinated (contractually or structurally) debt; (viii) granting negative pledges other than to the lenders; (ix) changes in the nature of our business; (x) amending organizational documents, or amending or otherwise modifying any debt, any related document or any other material agreement if such amendment or modification would have a material adverse effect; and (xi) changes in accounting policies or reporting practices; in each of the foregoing cases, with certain exceptions. The 2007 Senior Secured Credit Facility permits share repurchase up to $200.0 million and provides that share repurchases in excess of $200.0 million can be made only if our debt to capitalization ratio is below 50%.
We may prepay the 2007 Senior Secured Credit Facility in whole or in part at any time without premium or penalty, subject to certain reimbursements to the lenders for breakage and redeployment costs.
Moncla Notes Payable
In connection with the acquisition of Moncla we entered into two notes payable with its former owners. The first is an unsecured note in the amount of $12.5 million, which is due and payable in a lump-sum, together with accrued interest, on October 25, 2009. Interest on this note is due on each anniversary of the closing date, which was October 25, 2007. The second unsecured note in the amount of $10.0 million is payable in annual installments of $2.0 million, plus accrued interest, beginning October 25, 2008 through 2012. Each of the notes bear interest at the Federal Funds rate adjusted annually on the anniversary of the closing date.
2005 Senior Secured Credit Facility
On July 29, 2005, the Companywe entered into a $547.3 million credit agreement (the "Senior"2005 Senior Secured Credit Facility"), among Key Energy Services, Inc., as Borrower, the several lenders from time to time party thereto, Lehman Brothers Inc., as sole lead arranger and sole book runner, Lehman Commercial Paper Inc., as syndication agent, administrative agent and as collateral agent, and Wells Fargo Foothill, Inc., as revolving administrative agent. The 2005 Senior Secured Credit Facility consistsconsisted of (i) a revolving credit facility of up to an aggregate principal amount of $65.0 million, which willwas to mature on July 29, 2010, (ii) a senior term loan facility (the "Term Loan") in the original aggregate amount of $400.0 million, which iswas payable in quarterly installments of $1.0 million each commencing March 31,
2006 with the unpaid balance due on June 30, 2012 and (iii) a prefunded letter of credit facility in the aggregate amount of $82.25 million, which willwas to mature on July 29, 2010. The revolving credit facility includesincluded a $25.0 million sub-facility for additional letters of credit.
The 2005 Senior Secured Credit Facility enabled us to refinance our former senior credit facility and to repay our outstanding 8.375% Senior Notes due 2008 (the "8.375% Senior Notes") and 6.375% Senior Notes due 2013 (the "6.375% Senior Notes", together with the 8.375% Senior Notes, the "Senior Notes"). On October 5, 2005, we repaid all $150.0 million principal amount of the 6.375% Senior Notes, which had been accelerated on September 27, 2005. We redeemed all $275.0 million principal amount of the 8.375% Senior Noteswas terminated on November 8, 2005. The Senior Note repayments were funded29, 2007 in connection with us entering into the proceeds of the Term Loan and cash on hand. The letter of credit facility and revolving credit facility replaced the Company's prior $150.0 million revolving credit facility. We paid fees totaling approximately $7.2 million at closing, which consisted of legal, administrative, closing and other fees.
The2007 Senior Secured Credit Facility contains certain covenants, which, among other things, require the maintenance of a prescribed consolidated leverage ratio and a consolidated interest coverage ratio. Upon the occurrence of certain events of default, our obligations under the Senior Secured Credit Facility may be accelerated. Such events of default include payment defaults to lenders under the Senior Secured Credit Facility, covenant defaults and other customary defaults. Our obligations under the Senior Secured Credit Facility are guaranteed by most of our subsidiaries and secured by most of our assets.
On November 21, 2006, we amended the Senior Secured Credit Facility to provide us with more flexibility and to reduce our interest costs. The amendment: (i) gave the Company until July 31, 2007 to file (1) this 2006 Annual Report on Form 10-K, (2) our quarterly reports on Form 10-Q for 2005 and 2006, and (3) any other periodic reports then due, (ii) waived any defaults due to failure to file compliant SEC reports for prior periods; (iii) reduced the Eurodollar interest rate spread from 3.75% to 2.50% and commitment fees from 0.50% to 0.375%; (iv) increased the limitation on permitted capital expenditures through 2009 to $225 million annually; (v) increased the permitted stock repurchase basket from $50 million to $250 million and allowed repurchases before the Company has made all required SEC filings (the Company will still be subject to securities laws limitations on its ability to repurchase stock before it has released current financial information); (vi) increased the permitted acquisitions basket from $50 million to $100 million; and (vii) eliminated a provision requiring the Company to prepay the Term Loan with excess cash flow. This amendment further increased the limitation on capital expenditures which had been previously increased by an amendment dated November 1, 2005. See Item 8. "Consolidated Financial Statements and Supplementary Data," Note 11—"Long-Term Debt."
On July 27, 2007, we further amended the Senior Secured Credit Facility to (i) give us until August 31, 2007 to file this report and the quarterly reports for 2005 and 2006, (ii) give us until October 31, 2007 to file our quarterly reports on Form 10-Q for the first and second quarters of 2007, (iii) increase the permitted stock repurchase basket from $250 million to $300 million, and (iv) eliminate the $100 million limitation on permitted acquisitions. See Item 8. "Consolidated Financial Statements and Supplementary Data," Note 19—"Subsequent Events."Facility.
Lease Agreements
We also obtained a series of waivers from financial institutions that leasedlease equipment, such as tractors, trailers, frac tanks and forklifts, to the Companyfrom financial institutions under certain master lease agreements. Under the master lease agreements, the Company wasis required to provide current annual and quarterly reports. The last waivers allowed until September 30, 2006 to file an Annual Report on Form 10-K for 2003. Due to our inabilityBecause we were unable to provide audited financial statements for the year ended December 31, 2003 that complycomplied with SEC rules, and the time required to file this report, we are not in compliance with the terms of these equipment leases. We had previously sought and received waivers from these financial institutions, but we do not intend to seek any additional waivers. The
equipment lessors may demand that the leases be repaid. No formal demands for repayment have been made by the lessors and the defaults do not otherwise affect the terms of our 2007 Senior Secured Credit Facility or the terms of the 2005 Senior Secured Credit Facility. As of JulyDecember 31, 2007, there was approximately $4.7$2.7 million outstanding under such equipment leases.
Registration Statements
As a result of our inabilityfailure to timely file annual or quarterly reports with the SEC over the last several years, we do not have an effective shelf registration statement on file. Until we have timely filed all of our SEC reports for at least one year, our access to the public securities markets will be limited. See Item 1A. "Risk Factors" for a discussion of limitations on our ability to use "short-form" registration statements.
Cash Flow
Our net cash provided by operating activities for the year ended December 31, 2006, totaled $258.7 million. Our net cash used in investing activities for the year ended December 31, 2006 totaled $245.6 million. During the year ended December 31, 2006 we spent $211.2 million on capital expenditures, including approximately $15.4 million in assets that were financed through capital lease obligations, and received $11.7 million from the sale of fixed assets. Our net cash used in financing activities totaled $18.6 million for the year ended December 31, 2006, of which approximately $13.0 million represents repayments on our capital lease obligations.
Our net cash provided by operating activities for the year ended December 31, 2005, totaled $218.8 million. Our net cash used in investing activities for the year ended December 31, 2005 totaled $33.2 million. During the year ended December 31, 2005 we spent $141.1 million on capital expenditures, added approximately $22.9 million in assets that were financed through capital lease obligations, and received $18.7 million from the sale of fixed assets. Our net cash used in financing activities totaled $111.2 million for the year ended December 31, 2005. During the year ended December 31, 2005, we entered into the $547.25 million Senior Secured Credit Facility and borrowed $400.0 million under the seven-year Term Loan. We used the proceeds from the Term Loan as well as cash on hand to repay the $275.0 million in 8.375% Senior Notes and the $150.0 million in 6.375% Senior Notes.
Off-Balance Sheet Arrangements
At December 31, 20062007 we did not, and we currently do not, have any off-balance sheet arrangements that have or are reasonably likely to have a material current or future effect on our
financial condition, revenues or expenses, results of operations, liquidity, capital expenditures or capital resources.
Contractual Obligations
Set forth below is a summary of our contractual obligations as of December 31, 2006:
| | Payments Due by Period (thousands)
|
|---|
| | Total
| | Less Than
1 Year
| | 1-3 Years
| | 3-5 Years
| | More Than 5
Years
|
|---|
| Long-term debt, excluding discount and premium | | $ | 396,000 | | $ | 4,000 | | $ | 12,000 | | $ | 380,000 | | $ | — |
| Interest associated with long-term debt, excluding discount and premium(1) | | | 166,219 | | | 30,929 | | | 90,900 | | | 44,389 | | | — |
| Capital lease obligations | | | 25,794 | | | 11,677 | | | 13,792 | | | 325 | | | — |
| Operating leases | | | 35,109 | | | 10,744 | | | 16,749 | | | 5,423 | | | 2,193 |
| Noncompete and severance liabilities | | | 1,013 | | | 273 | | | 427 | | | 313 | | | — |
| | |
| |
| |
| |
| |
|
| Total | | $ | 624,135 | | $ | 57,623 | | $ | 133,868 | | $ | 430,450 | | $ | 2,193 |
| | |
| |
| |
| |
| |
|
(1)Interest costs on our floating rate debt were estimated using the rate at December 31, 2006.
Critical Accounting Policies
Our Accounting Department is responsible for the development and application of our accounting policies and internal control procedures. It reports to the Chief Financial Officer.
The process and preparation of our financial statements in conformity with GAAP requires our management to make certain estimates, judgments and assumptions, which may affect reported amounts of our assets and liabilities, disclosures of contingencies at the balance sheet date, the amounts of revenues and expenses recognized during the reporting period and the presentation of our statement of cash flows for the period ended. We may record materially different amounts if these estimates, judgments and assumptions change or if actual results differ. However, we analyze our estimates, assumptions and judgments based on our historical experience and various other factors that we believe to be reasonable under the circumstances.
As such, we have identified the following critical accounting policies that require a significant amount of estimation and judgment to accurately present our financial position, results of operations and statement of cash flows:
- •
- Estimate of reserves for workers' compensation, vehicular liability and other self-insured retentions;
- •
- Accounting for contingencies;
- •
- Accounting for income taxes;
- •
- Estimate of fixed asset depreciable lives;
and
- •
- Valuation of tangible and intangible
assets.assets; and
- •
- Valuation of equity-based compensation.
Workers' Compensation, Vehicular Liability and Other Insurance Reserves
Well servicing and workover operations expose our employees to hazards generally associated with the oilfield. Heavy lifting, moving equipment and slippery surfaces can cause or contribute to accidents involving our employees and third parties who may be present at a site. Environmental conditions in remote domestic oil and gas basins range from extreme cold to extreme heat, from heavy rain to blowing dust. Those conditions can also lead to or contribute to accidents. Our business activities incorporate significant numbers of fluid transport trucks, other oilfield vehicles and supporting rolling stock that move on public and private roads. Vehicle accidents are a significant risk for us. We also conduct contract drilling operations, which present additional hazards inherent in the drilling of wells, such as blowouts, explosions and fires, which could result in loss of hole, damaged equipment and personal injury.
As a contractor, we also enter into master service agreements with our customers. These agreements subject us to potential contractual liabilities common in the oilfield.
All of these hazards and accidents could result in damage to our property or a third party's property andor injury or death to our employees or third parties. Although we purchase insurance to protect against large losses, much of the risk is retained in the form of large deductibles or self-insured retentions.
The occurrence of an event not fully insured or indemnified against, or the failure of a customer or insurer to meet its indemnification or insurance obligations, could result in substantial losses. In addition, there can be no assurance that insurance will be available to cover any or all of these risks, or that, if available, it could be obtained without a substantial increase in premiums. It is possible that, in
addition to higher premiums, future insurance coverage may be subject to higher deductibles and coverage restrictions.
Based on the risks discussed above, we estimate our liability arising out of potentially insured events, including workers' compensation, employer's liability, vehicular liability, and general liability, and record accruals in our consolidated financial statements. Reserves related to claims covered by insurance are based on the specific facts and circumstances of the insured event and our past experience with similar claims. Loss estimates for individual claims are adjusted based upon actual claim judgments, settlements and reported claims. The actual outcome of these claims could differ significantly from estimated amounts.
We are largely self-insured for physical damage to our equipment, automobiles and rigs. Our accruals that we maintain on our consolidated balance sheet relate to these deductibles and self-insured retentions, which we estimate through the use of historical claims data and trend analysis. The actual outcome of any claim could differ significantly from estimated amounts. We adjust loss estimates in the calculation of these accruals, based upon actual claim settlements and reported claims.
Accounting for Contingencies
In addition to our workers' compensation, vehicular liability and other self-insurance reserves, we record other loss contingencies, which relate to numerous lawsuits, claims, proceedings and tax-related audits in the normal course of our operations on our consolidated balance sheet. In accordance with Statement of Financial Accounting Standards No. 5, "Accounting for Contingencies," ("SFAS 5"), we record a loss contingency for these matters when it is probable that a liability has been incurred and the amount of the loss can be reasonably estimated. We review our loss contingencies routinely to ensure that we have appropriate reservesliabilities recorded on the balance sheet. We adjust these reservesliabilities based on estimates and judgments made by management with respect to the likely outcome of these matters, including the effect of any applicable insurance coverage for litigation matters. Our estimates and judgmentjudgments could change based on new information, changes in laws or regulations, changes in management's plans or intentions, the outcome of legal proceedings, settlements or other factors. If different estimates and judgments were applied with respect to these matters, it is likely that reserves would be recorded for different amounts. Actual results could vary materially from these reserves.
We record liabilities when environmental assessment indicates that site remediation efforts are probable and the costs can be reasonably estimated. We measure liabilities based, in part, on relevant past experience, currently enacted laws and regulations, existing technology, site-specific costs and cost-sharing arrangements. Recognition of any joint and several liability is based upon our best estimate of our final pro-rata share of such liability.liability or the low amount in a range of estimates. These assumptions involve the judgments and estimates of management, and any changes in assumptions or new information could lead to increases or decreases in our ultimate liability, with any such changes recognized immediately in earnings.
Under the provisions of Statement of Financial Accounting Standards No. 143 "Accounting for Asset Retirement Obligations," we record legal obligations to retire tangible, long-lived assets on our balance sheet as liabilities, which are recorded at a discount when we incur the liability. Significant judgment is involved in estimating our future cash flows associated with such obligations, as well as the ultimate timing of the cash flows. If our estimates on the amount or timing of the cash flows change, the change may have a material impact on our results of operations.
Accounting for Income Taxes
We follow Statement of Financial Accounting Standards No. 109, "Accounting for Income Taxes,"("SFAS 109") which requires that we account for deferred income taxes using the asset and liability method and provide income taxes for all significant temporary differences. Management determines our current tax liability as well as taxes incurred as a result of current operations, yet deferred until future periods. Current taxes payable represent our liability related to our income tax
return for the current year, while net deferred tax expense or benefit represents the change in the balance of deferred tax assets and liabilities reported on our consolidated balance sheets. Management estimates the changes in both deferred tax assets and liabilities using the basis of assets and liabilities for financial reporting purposes
and for enacted rates that management estimates will be in effect when the differences reverse. Further, management makes certain assumptions about the timing of temporary tax differences for the differing treatment of certain items for tax and accounting purposes or whether such differences are permanent. The final determination of our tax liability involves the interpretation of local tax laws, tax treaties, and related authorities in each jurisdiction as well as the significant use of estimates and assumptions regarding the scope of future operations and results achieved and the timing and nature of income earned and expenditures incurred.
We establish valuation allowances to reduce deferred tax assets if we determine that it is more likely than not (e.g., a likelihood of more than 50%) that some portion or all of the deferred tax assets will not be realized in future periods. To assess the likelihood, we use estimates and judgment regarding our future taxable income, as well as the jurisdiction in which this taxable income is generated, to determine whether a valuation allowance is required. Such evidence can include our current financial position, our results of operations, both actual and forecasted results, the reversal of deferred tax liabilities, and tax planning strategies as well as the current and forecasted business economics of our industry. Additionally, we record reserves for uncertain tax positions that are subject to management judgment related to the resolution of the tax positions and completion of audits by tax authorities in the domestic and international tax jurisdictions in which we operate.
Please see Item 8. "Consolidated Financial Statements and Supplementary Data," Note 5—10—"Income Taxes" for further discussion of accounting for our income taxes, changes in our valuation allowance, components of our tax rate reconciliation and realization of loss carryforwards.
EstimateEstimates of Depreciable Lives
We use the estimated depreciable lives of our long-lived assets, such as rigs, heavy duty trucks and trailers, etc., to compute depreciation expense, to estimate future asset retirement obligations and to conduct impairment tests. We base the estimateestimates of our depreciable lives on a number of factors, such as the environment in which the assets operate, industry factors including forecasted prices and competition, and the assumption that we provide the appropriate amount of capital expenditures while the asset is in operation to maintain economical operation of the asset and prevent untimely demise to scrap. The useful lives of our intangible assets are determined by the years over which we expect the assets to generate a benefit based on legal, contractual or other expectations.
We depreciate our operational assets over their depreciable lives to their salvage value, which is generally 10% of the acquisition cost. We recognize a gain or loss upon ultimate disposal of the asset.
We periodically analyze our estimates of the depreciable lives of our fixed assets to determine if the depreciable periods and salvage value continue to be appropriate. We also analyze useful lives and salvage value when events or conditions occur that could shorten the remaining depreciable life of the asset. We review the depreciable periods and salvage values for reasonableness, given current conditions. As a result, our depreciation expense is based upon estimates of depreciable lives of the fixed assets, the salvage value and economic factors, all of which require management to make significant judgments and estimates. If we determine that the depreciable lives should be shorterdifferent than originally estimated, depreciation expense may increase or decrease and impairments in the carrying values of our fixed assets may result.
Valuation of Tangible and Intangible Assets
On at least an annual basis as required by Statement of Financial Accounting Standards No. 142, "Goodwill and Other Intangible Assets" and as required by Statement of Financial Accounting Standards No. 144, "Accounting for the Impairment or Disposal of Long-Lived Assets," we review
long-lived assets, such as well-service rigs, drilling rigs, pressure pumping equipment, heavy duty trucks, investments, goodwill and noncompete agreementsidentified intangible assets to evaluate whether our long-lived assets or goodwill may have been impaired.
Impairment tests may be required annually, as with goodwill, or as management identifies certain trigger events such as negative industry or economic trends, changes in our business strategy, and underperformance relative to historical or projected operating results. To perform an impairment test,
we make judgments, estimates and assumptions regarding long-term forecasts of revenues and expenses relating to assets subject to review or, in the case of goodwill, to our reporting units. Market conditions, energy prices, estimated depreciable lives of the assets, discount rate assumptions and legal factors impact our operations and have a significant effect on the estimates of management. Using different judgments, these estimates could differ significantly and actual financial results could differ materially from these estimates. These long-term forecasts are used in the impairment tests to determine if an asset's carrying value is recoverable or if a write-down to fair value is required.
Financial Accounting Standards Affecting This ReportValuation of Equity-Based Compensation
SFAS 123(R). In December 2004,We account for stock based compensation under the FASB issuedprovisions of Statement of Financial Accounting Standards No. 123 (revised 2004), "Share-Based"Share Based Payment" ('SFAS("SFAS 123(R)"), which revises SFAS No. 123.we adopted on January 1, 2006. We adopted the provisions of SFAS 123(R) is effective July 1, 2005 for all calendar year-end companies and requires companies to expenseusing the fair value of employeemodified prospective transition method. The Company has granted stock options, stock-settled stock appreciation rights ("SARs"), restricted stock ("RSAs"), and other forms of stock-based compensation. Thisphantom shares ("Phantom Shares") to its employees and non-employee directors. Option and SAR awards granted by the Company are fair valued using a Black-Scholes option model and are amortized to compensation expense will be recognized over the period during which an employee is required to provide services in exchange for the award. Compensation cost for the unvested portion of awards that are outstanding as of January 1, 2006 is recognized ratably over the remaining vesting period. The compensation cost for the unvested portionperiod of the awardsoption award, net of estimated and actual forfeitures. Compensation related to RSAs is based on the fair value of the award on the grant date and is recognized based on the vesting requirements that have been satisfied during the period. Phantom Shares are accounted for at fair value, and changes in the datefair value of grantthese awards are recorded as calculatedcompensation expense during the period. Please see Item 8. "Consolidated Financial Statements and Supplementary Data," Note 16—"Equity-Based Compensation" for further discussion of the various award types and our accounting for our pro forma disclosure under SFAS 123. We recognize compensation expense under SFAS 123(R) for new awards granted after January 1, 2006. We useequity-based compensation.
In utilizing the Black-Scholes option pricing model to calculatedetermine fair values of awards, certain assumptions are made which are based on subjective expectations, and are subject to change. A change in one or more of these assumptions would impact the expense associated with future grants. These key assumptions include the volatility of our common stock, the risk-free interest rate and the expected life of awards.
We used the following weighted average assumptions in the Black-Scholes option pricing model for determining the fair value of awards granted after January 1,our stock option grants during the years ended December 31, 2007, 2006 and estimate forfeitures and2005:
| | Year Ended December 31,
| |
|---|
| | 2007
| | 2006
| | 2005
| |
|---|
| Risk-free interest rate | | 4.41 | % | 4.70 | % | 3.80 | % |
| Expected life of options, years | | 6 | | 6 | | 6 | |
| Expected volatility of the Company's stock price | | 39.49 | % | 48.80 | % | 53.85 | % |
| Expected dividends | | none | | none | | none | |
We calculate the expected volatility for our stock option grants by measuring the calculationvolatility of compensation expense and grant date fair value. We adopted SFAS 123(R) effective January 1, 2006. The adoption of this standard did not materially impact our financial statements.
SFAS 149. In April 2003, the FASB issued Statement of Financial Accounting Standards No. 149, "Amendment of SFAS No. 133 on Derivative Instruments and Hedging Activities," ("SFAS 149") which clarifies and amends various issues related to derivatives and financial instruments addressed in SFAS 133 and interpretations issued by the Derivatives Implementation Group. In particular, SFAS 149: (1) clarifies whenhistorical stock price for a contract with an initial net investment meets the characteristics of a derivative; (2) clarifies when a derivative contains a financing component that should be recorded as a financing transaction on the balance sheet and the statement of cash flows; (3) amends the definition of an "underlying" in SFAS 133 to conformperiod equal to the language used in FIN 45; and (4) clarifies other derivative concepts. SFAS 149 is applicable to all contracts entered into or modified after June 30, 2003 and to all hedging relationships designated after June 30, 2003. The adoption of this standard did not materially impact our financial statements.
SFAS 150. In May 2003, the FASB issued Statement of Financial Accounting Standards No. 150, "Accounting for Certain Financial Instruments with Characteristics of Both Liabilities and Equity," ("SFAS 150") which establishes how an issuer classifies and measures certain financial instruments with characteristics of both liabilities and equity. Instruments that have an unconditional obligation requiring the issuer to redeem the instrument by transferring an asset at a specified date are required to be classified as liabilities on the balance sheet. Instruments that require the issuance of a variable number of equity shares by the issuer generally do not have the risks associated with equity instruments and as such should also be classified as liabilities on the balance sheet. SFAS 150 was effective for contracts in existence or created or modified for the first interim period beginning after June 15, 2003. The adoption of this standard did not materially impact our financial statements.
FIN 46R. In January 2003, the FASB issued Financial Interpretation No. 46, "Consolidation of Variable Interest Entities—An Interpretation of ARB No. 51" ("FIN 46"). In December 2003, the FASB issued the updated and final interpretation FIN 46 ("FIN 46R"). FIN 46R requires that an equity investor in a variable interest entity have significant equity at risk (generally a minimum of 10%, which is an increase from the 3% required under previous guidance) and hold a controlling interest, evidenced by voting rights, and absorb a majorityexpected life of the entity'soption and ending at the time the option was granted. We determine the risk-free interest rate based upon the interest rate on a U.S. Treasury Bill with a term equal to the expected losses, receive a majoritylife of the option at the time the option was granted. In estimating the expected lives of our stock options, we have relied primarily on our actual experience
the entity'swith our previous stock option grants. The expected returns, or both. If the equity investorlife is unable to evidence these characteristics, the entity that retains these ownership characteristics will be required to consolidate the variable interest entity as the primary beneficiary. FIN 46R was applicable immediately to variable interest entities created or obtained after March 15, 2004. The adoption of this interpretation did not materially impact our financial statements.
FIN 47. FASB Financial Interpretation No. 47, "Accounting for Conditional Asset Retirement Obligations" ("FIN 47") became effective for all for fiscal years ending after December 15, 2005. This interpretation clarifiesless than the term of conditional asset retirement obligationthe option as usedoption holders, in SFAS 143 and refers to a legal obligation to perform an asset retirement activity in whichour experience, exercise or forfeit the timing and methodoptions during the term of settlementthe option.
We are conditional on a future event that may or may not be within our control. However, our obligation to perform the asset retirement activity is unconditional, despite the uncertainties that exist. Accordingly, we are required to recognize a liability forrecalculate the fair value of our stock option grants estimated using the Black-Scholes option pricing model after the initial calculation unless the original option grant terms are modified. However, a conditional asset retirement obligation if100 basis point increase in our expected volatility and risk-free interest rate at the fair value can be reasonably estimated. The adoption ofgrant date would have increased our compensation expense for the year ended December 31, 2007 by approximately $0.1 million and $0.2 million, respectively.
New Accounting Standards Affecting this interpretation did not materially impact our financial statements.Report
SFAS 154. FIN 48 and FSP FIN 48-1. In June 2006, the Financial Accounting Standard Board ("FASB") issued "Accounting for Uncertainty in Income Taxes—an interpretation of FASB statement No. 109" ("FIN 48"), which provides clarification of SFAS 109 with respect to the recognition of income tax benefits of uncertain tax positions in financial statements. FIN 48 requires that uncertain tax positions be reviewed and assessed, with recognition and measurement of the tax benefit based on a "more likely than not" standard.
In May 2005,2007, the FASB issued StatementFASB Staff Position FIN 48-1, "Definition of Financial Accounting Standardsa Settlement in FASB Interpretation No. 154, "Accounting Changes and Error Corrections—A Replacement of APB Opinion No. 20 and SFAS No. 3,"48 ("SFAS 154"FSP FIN 48-1"). SFAS 154 changed the requirementsFSP FIN 48-1 provides guidance on how an enterprise should determine whether a tax position is effectively settled for the accounting for and reportingpurpose of recognizing previously unrecognized tax benefits. In determining whether a tax position has been effectively settled, entities must evaluate (i) whether taxing authorities have completed their examination procedures; (ii) whether the entity intends to appeal or litigate any aspect of a changetax position included in accounting principlea completed evaluation; and applies to all voluntary changes in accounting principle. It also applies to changes required by an accounting pronouncement in the unusual instance that the pronouncement does not include specific transition provisions. SFAS 154 requires retrospective application to prior periods' financial statements of changes in accounting principle, unless(iii) whether it is impracticableremote that a taxing authority would examine or re-examine any aspect of a taxing position. FSP FIN 48-1 is to determine eitherbe applied upon the period-specific effects orinitial adoption of FIN 48.
We adopted the provisions of FIN 48 and FSP FIN 48-1 on January 1, 2007 and recorded a $1.3 million decrease to the balance of our retained earnings as of January 1, 2007 to reflect the cumulative effect of adopting these standards. See Note 10—"Income Taxes" for further discussion of the change. The provisionsimpact of SFAS 154 are effective for accounting changes and correction of errors made in fiscal years beginning after December 15, 2005. Thethe adoption of this standard did not materially affect our financial statements.these standards.
FSP FIN No. 45-3.EITF 00-19-2. In November 2005,December 2006, the FASB issued FASB Staff Position No. 45-3, "ApplicationEITF 00-19-2, "Accounting for Registration Payment Arrangements" ("FSP EITF 00-19-2"). FSP EITF 00-19-2 addresses accounting for Registration Payment Arrangements ("RPAs"), which are provisions within financial instruments such as equity shares, warrants or debt instruments in which the issuer agrees to file a registration statement and to have that registration statement declared effective by the SEC within a specified grace period. If the registration statement is not declared effective within the grace period or its effectiveness is not maintained for the period of time specified in the RPA, the issuer must compensate its counterparty. The FASB Staff concluded that the contingent obligation to make future payments or otherwise transfer consideration under a RPA should be recognized as a liability and measured in accordance with SFAS 5 and FASB Interpretation No. 4514, "Reasonable Estimation of the Amount of a Loss," and that the RPA should be recognized and measured separately from the instrument to Minimum Revenue Guarantees Grantedwhich the RPA is attached.
In January 1999, the Company completed the private placement of 150,000 units consisting of $150.0 million of 14% Senior Subordinated Notes due January 25, 2009 and 150,000 warrants to purchase an aggregate of approximately 2.2 million shares of the Company's common stock at an exercise price of $4.88125 per share (the "Warrants"). As of December 31, 2007, 65,000 Warrants had been exercised, leaving 85,000 Warrants outstanding that were exercisable for an aggregate of approximately 1.2 million shares. Under the terms of the Warrants, we are required to maintain an effective registration statement covering the shares of common stock issuable upon exercise. If we are unable to maintain an effective registration statement, we are required to make semiannual liquidated damages payments for periods in which an effective registration statement is not maintained.
Due to our past failure to file our SEC reports in a Businesstimely manner, we do not have an effective registration statement covering the Warrants, and have been required to make liquidated damages payments, and will continue to be required to make those payments until such time as we have an effective registration statement on file for exercise of the Warrants or Its Owners"the warrant shares issuable thereunder are eligible for resale without registration pursuant to SEC Rule 144 or otherwise. The requirement to make liquidated damages payments constitutes an RPA under the provisions of FSP EITF 00-19-2, and as prescribed by the transition provisions of that standard, on January 1, 2007 the Company recorded a pre-tax current liability of approximately $1.0 million, which is equivalent to the payments for the Warrant RPA for one year, with an offsetting adjustment to the opening balance of retained earnings.
Accounting Standards Not Yet Adopted in this Report
SFAS 157. In September 2006, the FASB issued SFAS No. 157, "Fair Value Measurements" ("SFAS 157"). SFAS 157 establishes a framework for measuring fair value and requires expanded disclosure about the information used to measure fair value. The statement applies whenever other statements require or permit assets or liabilities to be measured at fair value, and does not expand the use of fair value accounting in any new circumstances.
In February 2008, the FASB issued FASB Staff Position FIN 157-2 ("FSP FIN 45-3"157-2")., which delayed the effective date by which companies must adopt the provisions of SFAS 157. FSP Fin 45-3 served asFIN 157-2 defers the effective date of SFAS 157 to fiscal years beginning after November 15, 2008, and interim periods within those fiscal years. The adoption of this standard is not anticipated to have a material impact on our financial position, results of operations, or cash flows.
SFAS 159. In February 2007, the FASB issued SFAS No. 159, "The Fair Value Option for Financial Assets and Liabilities, including an amendment of FASB Statement No. 115" ("SFAS 159"). SFAS 159 permits companies to FIN 45 by adding minimum revenue guaranteeschoose, at specified election dates, to measure eligible items at fair value (the "Fair Value Option"). Companies choosing such an election would report unrealized gains and losses on items for which the Fair Value Option has been elected in earnings at each subsequent reporting period. This standard is effective as of the beginning of the first fiscal year that begins after November 15, 2007. We adopted the provisions of this standard on January 1, 2008. We did not elect to measure any of our financial assets or liabilities using the Fair Value Option. We will assess at each measurement date whether to use the Fair Value Option on any future financial assets or liabilities as permitted pursuant to the listprovisions of examples of contracts to which FIN 45 applies.SFAS 159.
SFAS 141(R). In December 2007, the FASB issued SFAS No. 141 (Revised 2007), "Business Combinations" ("SFAS 141(R)"). SFAS 141(R) will significantly change the accounting for business combinations. Under FSP FIN 45-3, a guarantor isSFAS 141(R), an acquiring entity will be required to recognize all the assets and liabilities assumed in a transaction at the inceptionacquisition-date fair value, with limited exceptions. Specific changes in SFAS 141(R) from previously issued guidance include:
- •
- Acquisition costs will generally be expensed as incurred;
- •
- Noncontrolling interests will be valued at fair value at the acquisition date;
- •
- Acquired contingent liabilities will be recorded at fair value at the acquisition date and subsequently remeasured at either the higher of such amount or the amount determined under existing guidance for non-acquired contingencies;
- •
- In-process research and development will be recorded at fair value as an indefinite-lived intangible asset at the acquisition date;
- •
- Restructuring costs associated with a business combination will generally be expensed subsequent to the acquisition date; and
- •
- Changes in deferred tax asset valuation allowances and income tax uncertainties after the acquisition date generally will affect income tax expense.
SFAS 141(R) also includes new disclosure requirements related to business combinations. This statement applies to all business combinations for which the acquisition date is on or after the beginning of the first annual reporting period beginning on or after December 15, 2008, and earlier adoption is prohibited. The Company is still in the process of determining the impact of the adoption of this standard on the Company's financial position, results of operations, and cash flows.
SFAS 160. In December 2007 the FASB issued SFAS No. 160, "Noncontrolling Interests in Consolidated Financial Statements: an amendment of ARB No. 51" ("SFAS 160"). SFAS 160 establishes new accounting and reporting standards for the noncontrolling interest (formerly referred to as "minority interests") in a subsidiary and for the deconsolidation of a guarantee,subsidiary. Specifically, this statement requires the recognition of a liability fornoncontrolling interest as equity in the consolidated financial statements and separate from the parent's equity. The amount of net income attributable to a noncontrolling interest will be included in consolidated net income on the face of the income statement. SFAS 160 clarifies that changes in a parent's ownership interest in a subsidiary that do not result in deconsolidation are equity transactions if the parent retains its controlling financial interest. In addition, SFAS 160 requires that a parent recognize a gain or loss in net income when a subsidiary is deconsolidated. Such gains or loss will be measured using the fair value of the obligation undertaken in issuingnoncontrolling equity investment on the guarantee. FSP FIN 45-3deconsolidation date. SFAS 160 also includes expanded disclosure requirements regarding the interests of the parent and its noncontrolling interest. SFAS 160 is effective for new minimum revenue guarantees issued or modified on or after January 1, 2006. The adoption of this interpretation did not materially impact our financial statements.
EITF 04-10. In June 2005, the FASB issued EITF Issue 04-10, "Determining Whether to Aggregate Operating Segments That Do Not Meet the Quantitative Thresholds." This standard considers how a company should evaluate the aggregation criteria in FAS 131 to operating segments that do not meet the quantitative thresholds. Several of our operating segments do not meet the quantitative thresholds as described in SFAS 131. Under this standard, we are permitted to combine information about certain operating segments with other similar segments that individually do not meet the quantitative thresholds to produce a reportable segment since the operating segments meet the aggregation criteria. It was effective for fiscal years endingand interim periods within those fiscal years, beginning on or after SeptemberDecember 15, 2005.2008, with early adoption prohibited. The Company is still in the process of determining the impact of the adoption of this standard did not materially impact ouron the Company's financial statements.position, results of operations and cash flows.
See Item 8. "Consolidated Financial Statements and Supplementary Data," Note 1—"Organization and Summary of Significant Accounting Policies," for a discussion of accounting pronouncements issued, but not yet adopted and reflected in this report.
Impact of Inflation on Operations
We are of the opinion that inflation has not had a significant impact on Key's business.
ITEM 7A.Quantitative and Qualitative Disclosures About Market Risk
We are exposed to certain market risks as part of our ongoing business operations, including risks from changes in interest rates, and foreign currency exchange rates and equity prices that could impact our financial condition,position, results of operations and cash flows. We plan to manage our exposure to these risks through regular operating and financing activities, and may, on a limited basis, through the use of derivative financial instruments.instruments to manage this risk. To the extent if any, that we use such derivative financial instruments, we will use them only as risk management tools and not for speculative investment purposes.
Interest Rate Risk
At December 31, 2006, all of our long-term debt had variable interest rates, which subjects us to changes in our interest expense associated with movements in market interest rates. At December 31, 2006, we had $396.0 million in variable-rate debt that bears interest, at the Company's option, at the prime rate plus a margin or a Eurodollar ("LIBOR") rate plus a margin. As of December 31, 2006, we had elected LIBOR rates for all of2007, our borrowings. An increase of 10% in the 3-month LIBOR rate from its December 31, 2006 levels would result in an increase of approximately $2.1principal debt obligation was our $425.0 million in annual interest expense.
As discussed in Item 8. "Consolidated Financial Statements8.375% Senior Notes due 2014. These notes are fixed-rate obligations, and Supplementary Data," Note 8—"Derivative Financial Instruments," we have entered into two interest rate swap agreementsas such do not subject us to risks associated with a counterparty in order to partially mitigate the risk posed to us by changes in interest rates. Any potential increase inBorrowings under our 2007 Senior Secured Credit Facility, our capital lease obligations, and our notes payable to the former owners of Moncla all bear interest expense associated with unfavorable movements in LIBORat variable interest rates, would be partially offset by gainsand therefore expose us to interest rate risk.
As of December 31, 2007, the weighted average interest rate on our interest rate swaps. The benefit from the increase in fair value of our swaps, based on aoutstanding variable-rate debt obligations was 5.9787%. A hypothetical 10% increase in 3-month LIBOR rates,that rate would beincrease the annual interest expense on those instruments by approximately $1.1 million annually.$0.6 million.
Foreign Currency Risk
Key's net assets of its Argentina subsidiary are based on the U.S. dollar equivalent of such amounts measured in Argentine pesos asAs of December 31, 2006, 20052007, we conduct operations in Argentina and 2004, respectively. AssetsMexico, and also own a Canadian subsidiary. The functional currency is the local currency for all of these entities, and therefore poses risk to us related to changes in the exchange rate between the U.S. Dollar and the respective local currencies.
A hypothetical 10% decrease in the value of the U.S. Dollar relative to the value of all of the local currencies for our Argentinean, Mexican and Canadian subsidiaries would increase our net income by approximately $0.3 million. Our net assets would be unaffected by such an decrease because the changes in the value of our foreign subsidiaries' assets and liabilities would be offset by changes in accumulated other comprehensive income.
Equity Risk
Equity-Based Compensation. We account for our equity-based compensation awards at fair value under the provisions of SFAS 123(R). Certain of these awards' fair values are determined based upon the price of the Argentine operations were translatedCompany's common stock on the measurement date. Any increase in the price of the Company's common stock would lead to U.S. dollarsa corresponding increase in the fair value of those awards. A 10% increase in the price of the Company's common stock from its value at December 31, 2006, 2005 and 20042007 would increase annual compensation expense recognized on these awards by approximately $0.2 million.
Equity-Method Investment in IROC. We currently possess a 19.7% ownership interest in IROC, a publicly-traded Canadian company. We exert significant influence over the operations of IROC, but we do not control it. As such, we account for our investment as an equity-method investment under the guidance provided by Accounting Principles Board Opinion ("APB") No. 18, "The Equity Method of Accounting for Investments in Common Stock" ("APB 18").
An impairment review of our equity method investment in IROC is performed on a quarterly basis to determine if there has been a decline in fair value that is other than temporary. The fair value of the asset is measured using quoted market prices or, in the applicable freeabsence of quoted market conversion ratios, of 3.1:1, 3.0:1 and 3.0:1, respectively. Key's revenues, expenses and cash flow were translated using the average exchange rates during the reporting period.
Key's net assets, net earnings and cash flows from its Canadian operations wereprices, fair value is based on the U.S. dollar equivalentan estimate of such amounts measured in Canadian dollars. Assets and liabilities of the Canadian operations are translated to U.S. dollars using the applicable exchange rate as of the end of a reporting period. Revenues and expenses are translated using the average exchange rate during the reporting period. During 2004, we closed our Ontario, Canada operation and relocated those assets to our Michigan operation, which was subsequently divested.
A 10% change in the Canadian-to-U.S. dollar or Argentina-to-U.S. dollar exchange rate would not be material to our net assets, net earnings ordiscounted cash flows. In addition,determining whether the decline is other than temporary, we consider the cyclicality of the industry in which the investment operates, its historical performance, its performance in relation to its peers and the current economic environment. Future conditions in the industry, operating performance and performance in relation to peers and the future economic environment may vary from our Egypt operations were denominatedcurrent assessment of recoverability. Such future conditions could therefore result in U.S. dollars and as such posed no foreign currency riska determination a decline in fair value is other than temporary. IROC's stock price is currently depressed. If we later determine the decline is other than temporary, we would record a write-down in the carrying value of our asset to us.the then current fair market value.
In 2007, we began operations in Mexico. Our Mexican operations are denominated in pesos, which will subject us to foreign currency fluctuations from pesos to U.S. dollars.
ITEM 8.Consolidated Financial Statements and Supplementary Data
All financial statements and supplementary data that are required by this Item are listed in Part IV, Item 15. "Exhibits and Financial Statement Schedules" of this annual report and are presented beginning on page F-1, and are incorporated by reference.
ITEM 9.Changes in and Disagreements with Accountants on Accounting and Financial Disclosure
Effective December 1, 2006, we engaged Grant Thornton LLP to serve as our registered public accounting firm for the audit of our consolidated financial statements for the fiscal years ended December 31, 2004, December 31, 2005 and December 31, 2006 and dismissed KPMG LLP ("KPMG") as our principal accountants. During the fiscal years ended December 31, 2004 and 2005, respectively, and through December 1, 2006, there were no "reportable events" as that term is defined in Item 304 (a)(1)(iv) or (a)(1)(5) of Regulation S-K, except that during the course of the restatement process, KPMG had several discussions with the Audit Committee of our Board of Directors related to our control environment and the need for it to be improved. KPMG advised and discussed with the Audit Committee the following material weaknesses: (1) our controls surrounding our monitoring of the status and condition of our fixed assets and the appropriate recording of the results of any changes in our financial statements, (2) the lack of controls to ensure proper capitalization of costs in accordance with GAAP and (3) the lack of accounting processes and lack of qualified accounting personnel to develop such processes or execute such processes. The Audit Committee fully discussed the material weaknesses identified in the 2003 Financial and Informational Report with KPMG and KPMG's expanded audit scope prior to the filing of the 2003 Financial and Informational Report. We authorized KPMG to respond fully to all inquiries of Grant Thornton concerning the subject matter of such material weaknesses.
ITEM 9A.Controls and Procedures
Disclosure Controls and Procedures. We maintain a set of disclosure controls and procedures that are designed to provide reasonable assurance that information required to be disclosed in our reports filed under the Exchange Act is recorded, processed, summarized, and reported within the time periods specified in the SEC's rules and forms. Disclosure controls and procedures include, without limitation, controls and procedures designed to ensure that information required to be disclosed by us in the reports that we file or submit under the Exchange Act is accumulated and communicated to the Company's management, including the Company's Chairman and Chief Executive Officer and Chief Financial Officer, as appropriate to allow timely decisions regarding required disclosure.
The Company's management, with the participation of the Company's Chairman and Chief Executive Officer and Chief Financial Officer, has evaluated the effectiveness of the Company's disclosure controls and procedures (as such term is defined in Rules 13a-15(e) and 15d-15(e) under the Exchange Act) as of the end of the period covered by this report. Based on such evaluation, the Company's Chairman and Chief Executive Officer and Chief Financial Officer have concluded that, as of the end of such period, due to the material weaknesses in our internal control over financial reporting described below, our disclosure controls and procedures were not effective.
Changes in Internal Control Over Financial Reporting. We believe that there have been changes in our internal control over financial reporting during the period from January 1, 2004 to December 31, 2006 that have materially affected, or are reasonably likely to materially affect, our internal control over financial reporting. However, in light of the delayed filing of this report, it is impracticable for us to identify the specific changes that may have occurred within each quarter within the annual period covered by this report. Please refer to "Management's Report on Internal Control Over Financial Reporting" for a description of material weaknesses in internal control over financial reporting as of December 31, 2006 and remedial actions that we have taken in 2006 and 2007 to address such deficiencies.
Management's Report on Internal Control Over Financial Reporting
Management is responsible for establishing and maintaining adequate internal control over financial reporting. Internal control over financial reporting is a process designed to provide reasonable assurance regarding the reliability of financial reporting and the preparation of financial statements for external purposes in accordance with generally accepted accounting principles. Internal control over financial reporting includes those policies and procedures that (i) pertain to the maintenance of records that, in reasonable detail, accurately and fairly reflect the transactions and dispositions of the assets of the Company; (ii) provide reasonable assurance that transactions are recorded as necessary to permit preparation of financial statements in accordance with generally accepted accounting principles, and that receipts and expenditures of the Company are being made only in accordance with authorizations of management and directors of the Company; and (iii) provide reasonable assurance regarding prevention or timely detection of unauthorized acquisition, use, or disposition of the Company's assets that could have a material effect on the financial statements.
Internal control over financial reporting cannot provide absolute assurance of achieving financial reporting objectives because of its inherent limitations. Internal control over financial reporting is a process that involves human diligence and compliance and is subject to lapses in judgment and breakdowns resulting from human failures. Internal control over financial reporting can also be circumvented by collusion or improper management override. Because of such limitations, there is a risk that material misstatements may not be prevented or detected on a timely basis by internal control over financial reporting. Also, projections of any evaluation of effectiveness to future periods are subject to the risk that controls may become inadequate because of changes in conditions, or that the degree of compliance with the policies or procedures may deteriorate. However, these inherent limitations are known features of the financial reporting process. Therefore, it is possible to design into the process safeguards to reduce, though not eliminate, this risk.
A material weakness is a significant deficiency (within the meaning of Public Company Accounting Oversight Board Auditing Standard No. 2), or combination of significant deficiencies, that results in there being more than a remote likelihood that a material misstatement of the annual or interim financial statements will not be prevented or detected on a timely basis by employees in the normal course of their assigned functions.
Management conducted an evaluation of the effectiveness of the Company's internal control over financial reporting based on the framework in Internal Control—Integrated Framework issued by the Committee of Sponsoring Organizations of the Treadway Commission (COSO). Based on this evaluation, management concluded that we did not maintain effective internal control over financial reporting. Management has identified the following material weaknesses of internal control over financial reporting as of December 31, 2006:
Authorizations of Expenditures: We determined that a material weakness existed due to our inability to ensure and evidence that expenditures, including capital, operating and general and administrative expenses and changes in salaries and other payroll-related items, were approved by the appropriate level of management in accordance with our established policies. This is a result of a lack of a systematic process to ensure that expenditure related transactions are reviewed and approved by the appropriate level of management.
In 2007, we implemented automated approval controls in our procurement system, ensuring that expenditures made through that system will have and will capture the appropriate level of approval. In conjunction with the system change, revised approval authorities were implemented and communicated to employees. Additionally, we have begun to consolidate our data entry personnel, who, due to lack of training, lack of system knowledge and high turn-over within the position, committed numerous input errors. The consolidation has improved accuracy, increased consistency and efficiency, and has better enabled supervision of the remaining personnel. We continue to evaluate opportunities to improve the
effectiveness and efficiencies of our personnel. We are also installing software to ensure that salary-related changes are made with appropriate authorizations and are tracked in a systematic way.
Recognition of Expenditures: We determined that a material weakness existed with respect to expenditures—consisting largely of individually immaterial corporate expenditures—that are not captured through our procurement system, as controls were not in place and operating effectively at December 31, 2006 to ensure that these expenses were properly accrued for and recorded in the appropriate period. Additionally, we did not have sufficient controls in place to ensure that expenditures that were accrued through our procurement system were recorded in the correct period or that changes to amounts that were previously accrued through this system were appropriately adjusted and recorded in the correct period.
In 2007, management instituted a policy and process regarding the accrual of these types of costs to ensure that they are captured in the appropriate periods. We have also developed account reconciliation procedures which will be performed on accruals recorded through our procurement system to ensure that they are reflected in the correct period.
Recording of Revenues: We determined that a material weakness existed in our revenue recognition and collection process, because that process is heavily dependent on manual reviews and approvals of credit terms, amounts to be billed and recorded and adjustments for bad debts. As a result, in many instances, evidence of approvals was not maintained to ensure that work performed was billed and recorded appropriately. Additionally, adequate controls were not in place at December 31, 2006 to ensure that amounts were recorded in the correct period.
In 2006 to ensure that amounts billed are recorded appropriately, we modified our revenue system to minimize the ability of users to make adjustments to data in our billing system. Notwithstanding these modifications, the material weakness existed as of December 31, 2006. In 2007, we implemented a process and a control to analyze amounts recorded as accrued revenues to ensure that such amounts are recorded in the proper period. The consolidation of our data entry personnel has also reduced the number of errors and improved consistency and efficiencies in the processes with respect to our billing system.
Property, Plant & Equipment (PP&E): We determined that a material weakness existed at December 31, 2006 because we had not established effective controls for recording PP&E, including associated depreciation expense and accumulated depreciation. As a result of the ongoing restatement process, we did not perform monthly accounting for PP&E from the first quarter of 2004 through 2006. Accordingly, our controls did not include monthly reconciliations, determination of propriety of cost capitalization and disposals, and computation of depreciation expense.
In response to previously identified control weaknesses during the restatement process, we have significantly changed our processes for accounting for PP&E items and performed significant substantive procedures to verify amounts recorded. A discussion of the procedures that were implemented in connection with the items identified in the restatement process is more fully discussed in our 2003 Financial and Informational Report. See "Note Regarding Our Financial Reporting Process," at the beginning of this report. We believe that the substantive procedures we performed were sufficient to provide reasonable assurance that the amounts recorded were done so in accordance with GAAP and were fairly presented in all material respects.
In late 2006, we formed an accounting group that included additional accountants dedicated to PP&E accounting and developed policies and processes for our monthly PP&E accounting. Prior to this change, the accounting for PP&E was performed at numerous locations by various staff as part of their accounting and other responsibilities. On January 1, 2007, this group assumed the responsibilities for PP&E accounting. In addition to performing other necessary accounting functions, they are responsible for monthly account reconciliations, review of costs capitalized and assets disposed to ensure
appropriateness under GAAP. They are also responsible for monitoring periodic physical counts. We also developed a new capital expenditure policy that became effective January 1, 2007.
User Developed Applications: We determined that a material weakness existed in the use of certain spreadsheets and database programs. In the course of preparing our consolidated financial statements, we employ numerous spreadsheets and database programs ("User Developed Applications"). The User Developed Applications are utilized by us in calculating estimates, tracking inventory costs and making cost allocations, among other things. In the course of our testing, we identified numerous instances where these User Developed Applications were not secured as to access, logical security, changes or data integrity.
In 2007, we will institute a policy requiring increased controls over User Developed Applications used in our financial and accounting processes.
Application Access and Segregation of Duties: We determined that material weaknesses existed in four aspects of information technology general controls over security and segregation of duties of our primary financial systems. These include security administration procedures, administrator access privileges, database and file access and password controls. The weaknesses in these information technology general control areas were further evidenced by or related to deficiencies in our various access controls at the financial system level, causing inappropriate access and segregation of duties issues in significant processes.
In 2007 we have developed management reports for business owner review to address segregation of duties and financial application access. Additionally, new administrative controls and procedures have been implemented for all levels of system access. During the second half of 2007, we will begin the process of selecting and implementing a new enterprise resource planning system, and we believe the enhanced capabilities of a new system will further remediate these deficiencies.
Account Reconciliations. We determined that a material weakness existed in our processes to evidence timely and accurate preparation and review of account reconciliations, including calculations of underlying amounts recorded in the financial statements. Account reconciliations, including final underlying calculations, for numerous accounts were not prepared and evidenced in a timely manner, due to the significant amount of changes resulting from the restatement process and preparation of our 2003 Financial and Informational Report. Additionally, the changes we implemented in our processes in 2006 included the establishment of a balance sheet reconciliation process.
In preparing the consolidated financial statements contained in this report, our accounting staff, hired throughout 2006, along with outside consultants, performed significant substantive procedures to determine the appropriate amounts to record in the 2004 through 2006 periods. In the course of this process, we developed account reconciliations or other supporting calculations and documentation to provide reasonable assurance that the amounts recorded were done so in accordance with GAAP and were fairly presented in all material respects. We did not, however, in the course of our substantive procedures, incur the time or expense necessary to follow, or document compliance with, control procedures identified with respect to such accounts. We believe that the substantive procedures we performed were sufficient to provide reasonable assurance that the amounts recorded were done so in accordance with GAAP and were fairly presented in all material respects.
In 2007, our accounting organization adopted the methodologies and account reconciliations developed in the course of our substantive efforts in these areas. On a monthly basis these account reconciliations, roll-forwards and methodologies will be utilized in the preparation of our financial statements for 2007 and future periods
Accounting for Income Taxes. We determined that a material weakness existed in our processes to account for income taxes and to do so in a timely manner. Because of the significant amount of
changes resulting from our restatement process and preparation of our 2003 Financial and Informational Report, and the changes we implemented in our processes, our accounting for income taxes was not performed and evidenced in a timely manner.
In preparing the consolidated financial statements contained in this report, our recently hired accounting staff, along with outside consultants, performed significant substantive procedures to determine the appropriate amounts to record in the 2004 through 2006 periods. In the course of this process, we developed account reconciliations, roll-forwards or tax basis information and documentation to provide reasonable assurance that the amounts recorded were done so in accordance with GAAP and were fairly presented in all material respects. We did not, however, in the course of our substantive procedures, incur the time or expense necessary to follow or document compliance with control procedures identified with respect to such accounts. We believe that the substantive procedures we performed were sufficient to provide reasonable assurance that the amounts recorded were done so in accordance with GAAP and were fairly presented in all material respects.
In 2007, our accounting organization adopted the methodologies, roll-forwards and utilized the tax basis information developed in the course of our substantive efforts in these areas. On a monthly basis these account reconciliations and methodologies will be utilized in the preparation of our financial statements for 2007 and future periods.
Financial Close and Reporting: During the restatement process and the preparation of the 2003 Financial and Informational Report, we determined that our previous processes for preparing the consolidated financial statements were not clearly defined and lacked appropriate controls to ensure the completeness, accuracy, timeliness, appropriate valuation, and proper presentation and disclosure of financial transactions.
In response to the material weaknesses and other deficiencies identified during the preparation of our 2003 Financial and Informational Report, we implemented several changes to the structure of the accounting organization, increased our accounting staff, implemented processes and developed procedures to ensure that the appropriate amounts were reflected in our financial statements. During 2006, we transitioned accounting responsibilities to our new accounting staff and began to address amounts recorded in our financial statements during 2004 and 2005. The accounting staff was also responsible for recording current transactions in addition to reviewing the historical accounting transactions.
In preparing the consolidated financial statements contained in this report, our recently hired accounting staff, along with outside consultants, performed significant substantive procedures to determine the appropriate amounts to record in the 2004 through 2006 periods. In the course of this process, we developed methodologies and other supporting calculations and documentation to provide reasonable assurance that the amounts were fairly presented in all material respects in accordance with GAAP. We did not, however, in the course of our substantive procedures, incur the time or expense necessary to evidence compliance with our methodologies. As a result, we determined that as of December 31, 2006, a material weakness exists with respect to those control procedures in that we could not affirmatively conclude that they were effective. However, we believe that the substantive procedures we performed were sufficient to provide reasonable assurance that the amounts recorded were done so in accordance with GAAP and were fairly presented in all material respects. We believe that this deficiency is temporary and is a result of a combination of factors specific to our situation, which include significant changes in processes, recently hired accountants comprising the majority of our staff and the simultaneous preparation of three years of financial statements.
In 2007, our accounting organization adopted the methodologies and documentation developed in the course of our substantive efforts in these areas. These methodologies will be utilized in the preparation of our financial statements for 2007 and future periods. In addition to these steps, during the second half of 2007 we will begin the process of selecting and implementing a new enterprise
resource planning system to replace our current general ledger system, simplify our control structure and reduce reliance on manual controls. We are also recruiting for a new position that will be in charge of internal controls. This position will also have a leadership role in the selection and implementation of our new enterprise resource planning systems.
Management's assessment of the effectiveness of our internal control over financial reporting as of December 31, 2006 has been audited by Grant Thornton LLP, an independent registered public accounting firm, as stated in their report included herein.
ITEM 9B.Other Information
Not Applicable.
PART III
ITEM 10.Directors, Executive Officers and Corporate Governance
The following table sets forth the names and ages of each of the Company's directors as of July 31, 2007.
Names
| | Position and Business Experience
| | Age
| | Director
Since
|
|---|
Richard J. Alario |
|
Chairman of the Board, President, Chief Executive Officer, and Chief Operating Officer
Mr. Alario joined the Company as President and Chief Operating Officer effective January 1, 2004. On May 1, 2004, Mr. Alario was promoted to Chief Executive Officer and appointed to the Board of Directors. He was elected Chairman of the Board of Directors on August 25, 2004. Prior to joining the Company, Mr. Alario was employed by BJ Services Company, where he served as Vice President from May 2002 when OSCA, Inc. was acquired by BJ Services. Prior to joining BJ Services, Mr. Alario had over 21 years of service in various capacities with OSCA, an oilfield services company, most recently serving as its Executive Vice President. Mr. Alario received a BA from Louisiana State University. |
|
52 |
|
2004 |
David J. Breazzano |
|
Lead Director and Compensation Committee Chairman
Mr. Breazzano was named Lead Director in August 2004. Mr. Breazzano is one of the founding principals of DDJ Capital Management, LLC, an investment management firm established in 1996. He holds a BA from Union College, where he serves on the Board of Trustees, and an MBA from Cornell University. |
|
51 |
|
1997 |
Kevin P. Collins |
|
Director
Mr. Collins has been Managing Member of The Old Hill Company LLC since 1997. From 1992 to 1997, he served as a principal of JHP Enterprises, Ltd., and from 1985 to 1992, as Senior Vice President of DG Investment Bank, Ltd., both of which were engaged in providing corporate finance and advisory services. Mr. Collins was a director of WellTech, Inc. ("WellTech") from January 1994 until March 1996, when WellTech was merged into the Company. Mr. Collins is also a director of The Penn Traffic Company, Metretek Technologies, Inc. and Contractors Holding, Inc. He holds BS and MBA degrees from the University of Minnesota. Mr. Collins is a CFA Charterholder. |
|
56 |
|
1996 |
William D. Fertig |
|
Director and Corporate Governance & Nominating Committee Chairman
Mr. Fertig has been Co-Chairman and Chief Investment Officer of Context Capital Management, an investment |
|
|
|
|
| | | | | | | |
|
|
advisory firm since 2002. Mr. Fertig was a Principal and a Senior Managing Director of McMahan Securities from 1990 through April 2002. Mr. Fertig previously served in various senior capacities at Drexel Burnham Lambert and Credit Suisse First Boston from 1980 through 1990. He holds a BS from Allegheny College and an MBA from the Stern Business School of New York University. |
|
49 |
|
2000 |
W. Phillip Marcum |
|
Director
Mr. Marcum was a director of WellTech from January 1994 until March 1996, when WellTech was merged into the Company. From October 1995 until March 1996, Mr. Marcum was the acting Chairman of the Board of Directors of WellTech. He was Chairman of the Board, President and Chief Executive Officer of Metretek Technologies, Inc., formerly known as Marcum Natural Gas Services, Inc., from January 1991 to April 2007 when he retired. He is presently a principal in MG Advisors, LLC. He holds a BBA from Texas Tech University. |
|
63 |
|
1996 |
Ralph S. Michael, III |
|
Director and Audit Committee Chairman
Since July 25, 2005, Mr. Michael has been President and Chief Operating Officer of the Ohio Casualty Insurance Company. From 2004 through July 2005, Mr. Michael served as Executive Vice President and Manager of West Commercial Banking for US Bank, National Association and then as Executive Vice President and Manager of Private Asset Management for US Bank. He also served as President of U.S. Bank Oregon from 2003 to 2005. From 2001 to 2002, he served as Executive Vice President and Group Executive of PNC Financial Services Group, with responsibility for PNC Advisors, PNC Capital Markets and PNC Leasing. From 1996 to 2001, he served as Executive Vice President and Chief Executive Officer of PNC Corporate Banking. He was a director of Integrated Alarm Services Group from January 2003 until April 2007 and a director of T.H.E. Inc. from 1991 to 2004. He has been a director at Cincinnati Bengals, Inc. since April 2005. Mr. Michael also served as a director of Ohio Casualty Corporation from April 2002 until July 25, 2005. Mr. Michael began serving as a director of Friedman, Billings, Ramsey Group, Inc. in June 2006 and as a director of AK Steel Corporation in July 2007. He holds a BA from Stanford University and an MBA from the Graduate School of Management of the University of California Los Angeles. |
|
52 |
|
2003 |
William F. Owens |
|
Director
From 1999 to 2007, Mr. Owens served as Governor of |
|
|
|
|
| | | | | | | |
|
|
Colorado. In addition to his public service, Mr. Owens served for more than 10 years as Executive Director of the Colorado Petroleum Association, which represented 400 energy firms doing business in the Rockies. Mr. Owens served as a member of the Colorado state house of representatives from 1982 to 1988, as a member of the state senate from 1988 to 1994 and as Colorado state treasurer from 1994 to 1998. Prior to his public service, Mr. Owens was a consultant with Touche Ross & Co., now Deloitte & Touche, LLP. He holds a master's degree in public administration from the Lyndon B. Johnson School of Public Affairs at the University of Texas at Austin and an undergraduate degree from Stephen F. Austin University. |
|
57 |
|
2007 |
J. Robinson West |
|
Director
Mr. West is the founder, and since 1984 has served as Chairman and a director, of PFC Energy, strategic advisers to international oil and gas companies, national oil companies, and petroleum ministries. Previously, Mr. West served as U.S. Assistant Secretary of the Interior with responsibility for offshore oil leasing policy from 1981 through 1983. He was Deputy Assistant Secretary of Defense for International Economic Affairs from 1976 through 1977 and a member of the White House Staff from 1974 through 1976. He is currently a member of the Council on Foreign Relations and the National Petroleum Council, and serves as Chairman of the Board of the United States Institute of Peace. Mr. West is also a director of Cheniere Energy, Inc. He holds a BA from the University of North Carolina at Chapel Hill and a JD from Temple University Law School. |
|
59 |
|
2001 |
Morton Wolkowitz |
|
Director
Mr. Wolkowitz served as President and Chief Executive Officer of Wolkow Braker Roofing Corporation, a company that provided a variety of roofing services, from 1958 through 1989. Mr. Wolkowitz has been a private investor since 1989. He holds a BS from Syracuse University. Mr. Wolkowitz has resigned from the Board of Directors, effective when the Company has one or more effective registration statements on file with the SEC allowing for the issuance of shares of common stock of the Company upon exercise of Mr. Wolkowitz's outstanding stock options. |
|
79 |
|
1989 |
The following table sets forth each of the Company's Executive Officers (other than Mr. Alario) as of July 31, 2007:
Names
| | Position and Business Experience
| | Age
| | Executive
Since
|
|---|
William M. "Bill" Austin |
|
Senior Vice President and Chief Financial Officer
On January 20, 2005, Mr. Austin was named Senior Vice President, Chief Financial Officer and Chief Accounting Officer. Mr. Austin served as an advisor, principally in a financial capacity, to the Company for six months prior to becoming an officer of Key. Prior to joining the Company, Mr. Austin served as Chief Restructuring Officer of Northwestern Corporation from 2003 to 2004, which declared bankruptcy in September 2003. Mr. Austin served as Chief Executive Officer, U.S. Operations, of Cable & Wireless/Exodus Communications from 2001 to 2002, which declared bankruptcy in September 2001. He also served as Chief Financial Officer of BMC Software from 1997 to 2001. Prior to that, Mr. Austin spent nearly six years at McDonnell Douglas Aerospace, a subsidiary of McDonnell Douglas Corporation, serving most recently as Vice President and Chief Financial Officer, and 18 years at Bankers Trust Company. Mr. Austin received a BS in Electrical Engineering from Brown University and an MBA from Columbia University. |
|
61 |
|
2005 |
Newton W. "Trey" Wilson III |
|
Senior Vice President, General Counsel and Secretary
Mr. Wilson joined the Company as Senior Vice President and General Counsel effective January 24, 2005. He also was appointed Secretary effective January 24, 2005. Previously, Mr. Wilson served as Senior Vice President, General Counsel and Secretary of Forest Oil Corporation, which he joined in November 2000. Prior to joining Forest, Mr. Wilson was a consultant to the oil industry as well as an executive for two oil and gas companies, Union Texas Petroleum and Transco Energy Company. Mr. Wilson received a BBA from Southern Methodist University and a JD from the University of Texas. |
|
56 |
|
2005 |
| | | | | | | |
Kim B. Clarke |
|
Senior Vice President and Chief People Officer
Ms. Clarke joined the Company on November 22, 2004 as Vice President and Chief People Officer. She was elected as an executive officer in January 2005. As of January 1, 2006, Mr. Clarke serves as our Senior Vice President and Chief People Officer. Ms. Clarke previously served as Vice President of Human Resources for GC Services from 1999 to 2004. Prior to that she served in a number of senior level human resource roles for Browning-Ferris Industries (BFI) from 1988 to 1997 and as BFI's Vice President Human Resources from 1997 to 1999. Ms. Clarke's 25 years of work experience also includes industry experience with Baker Service Tools and National Oilwell. Ms. Clarke holds a BS Degree from the University of Houston. |
|
50 |
|
2005 |
Don D. Weinheimer |
|
Senior Vice President of Business Development, Technology and Strategic Planning
Mr. Weinheimer joined the Company on October 2, 2006. Previously, Mr. Weinheimer served as Vice President, Technology Globalization, within Halliburton's Energy Services Group from July 2006 to October 2006. Prior to that, Mr. Weinheimer served as Vice President, Innovation and Marketing within the Production Optimization Division of Halliburton from July 2004 to July 2006. Mr. Weinheimer has over 25 years of industry experience, including international operational and business development experience in both the Middle East and Algeria. Mr. Weinheimer holds a BS degree in Agricultural Engineering from Texas A&M University. |
|
48 |
|
2006 |
Phil G. Coyne |
|
Senior Vice President—Eastern Region
Mr. Coyne became Senior Vice President of the Company's Eastern Region in September 2004. He was appointed as an executive officer in April 2005. Mr. Coyne joined the Company as Vice President Eastern Region in April of 2004. Before joining the Company, Mr. Coyne was Vice President of North America for Owen Oil Tools, an explosives manufacturer and a division of Core Laboratories, from 2001 to 2004. He served as U.S. Operations Support Manager for Wood Group (a British based company) from 1999 to 2001. Mr. Coyne served in various positions with Western Atlas from 1984 to 2000, most recently serving as the District Manager of Atlas's Broussard, Louisiana offshore operations. Mr. Coyne is a Vietnam era veteran and was in the Air Force stationed primarily in Thailand. |
|
55 |
|
2004 |
| | | | | | | |
Jim D. Flynt |
|
Senior Vice President—Western Division
Mr. Flynt assumed his current position as Senior Vice President—Western Region effective September 2004. Mr. Flynt became an executive officer of the Company effective March 5, 2003 when he was promoted to Senior Vice President—Production Services. From December 1999 to March 2003, Mr. Flynt served as Vice President—Western Operations. Mr. Flynt joined the Company in September 1998 as the President of the Company's California Division, following the Company's acquisition of Dawson Production Services, Inc. From February 1997 to September 1998, Mr. Flynt served as the Regional Vice President of Dawson Production Services, Inc. Before joining Dawson Production Services, Inc., he was Vice President, Area Manager, of Pride Petroleum Services, Inc. from January 1996 to February 1997. From June 1995 to January 1996, he served as District Manager of Pool California Production Service, a subsidiary of Pool Energy Services Co. From March 1976 to June 1995, he served as Vice President, Operations, of California Production Services, Inc. |
|
61 |
|
2003 |
J. Marshall Dodson |
|
Vice President and Chief Accounting Officer
Mr. Dodson joined the Company as Vice President and Chief Accounting Officer on August 22, 2005. Prior to joining the Company, Mr. Dodson served in various capacities at Dynegy, Inc. from 2002 to August 2005, most recently serving as Managing Director and Controller, Dynegy Generation since 2003. Mr. Dodson started his career with Arthur Andersen LLP in Houston, Texas in 1993, serving most recently as a senior manager prior to joining Dynegy, Inc. Mr. Dodson is a Certified Public Accountant and received a BBA from the University of Texas at Austin in 1993. |
|
36 |
|
2005 |
D. Bryan Norwood |
|
Vice President and Treasurer
Mr. Norwood was named Vice President and Treasurer effective October 20, 2006. Mr. Norwood has 28 years of experience, most recently as Eastern Region Controller for the Company, having served in that capacity from September 2005 to October 2006. Prior to joining Key, Mr. Norwood had a consulting company DBN Norwood Services, Inc., from September 2003 to September 2005. He served as Vice President Finance-Americas for Bredero Shaw Company from January 1998 to September 2003. Mr. Norwood is a Certified Public Accountant and is a graduate of the University of Texas at Austin, where he received his BBA. |
|
52 |
|
2006 |
Section 16(a) Beneficial Ownership Reporting Compliance
Section 16(a) of the Securities Exchange Act of 1934, as amended, requires the Company's directors, executive officers and persons who beneficially own more than 10% of a registered class of the Company's equity securities, to file initial reports of ownership on Form 3 and changes in ownership on Forms 4 or 5 with the SEC. Such officers, directors and 10% shareholders also are required by SEC rules to furnish the Company with copies of all Section 16(a) reports they file. Based solely on its review of the copies of such forms furnished or available to the Company, the Company believes that its directors, executive officers and 10% shareholders complied with all Section 16(a) filing requirements for the fiscal year ended December 31, 2006.
Code of Ethics
We adopted a Code of Business Conduct on April 5, 2006 that superseded our Code of Business Conduct and Ethics, which was adopted in October 2004. The new policy applies to all of our employees, including our Chief Executive Officer, Chief Financial Officer and senior financial and accounting officers. In addition, we adopted a Code of Conduct for members of the Board of Directors on April 18, 2005. Among other matters, the Code of Business Conduct and the Board Code of Conduct establish policies to deter wrongdoing and to promote both honest and ethical conduct, including ethical handling of actual or apparent conflicts of interest, compliance with applicable laws, rules and regulations, full, fair, accurate, timely and understandable disclosure in public communications and prompt internal reporting of violations of the Code of Business Conduct. We also have an Ethics Committee, composed of members of management, which administers our ethics and compliance program with respect to our employees. In addition, we provide an ethics line for reporting any violations of the Code of Business Conduct on a confidential basis. Copies of our Code of Business Conduct and the Board Code of Conduct are available on our website atwww.keyenergy.com. We will post on our internet website all waivers to or amendments of our Code of Business Conduct and the Board Code of Conduct that are required to be disclosed by applicable law and the NYSE listing standards.
Executive Committee
By unanimous written consent dated May 11, 2005, the Board of Directors expanded the membership and authority of the Executive Committee of the Board. The current members of the Committee are Messrs. Alario, Breazzano, Collins, Fertig, Marcum, Michael, West and Owens. Mr. Wolkowitz is not a member of the Executive Committee. The Executive Committee has been delegated all of the powers of the Board, except those powers reserved to the full Board of Directors under Maryland law. Since May 11, 2005, the Executive Committee has largely been acting in place of the Board of Directors.
Board Composition and Election
Directors are elected at annual meetings of shareholders. We amended and restated our Bylaws effective September 21, 2006 to provide for a classified Board of Directors, consisting of three staggered classes of directors, as nearly equal in number as possible. As a result, shareholders will elect a portion of our Board of Directors each year. The Class I directors' terms will expire at our first annual meeting held after September 21, 2006 (the date of establishment of the classified Board), the Class II directors' terms will expire at our second annual meeting held after September 21, 2006, and the Class III directors' terms will expire at our third annual meeting held after September 21, 2006. The successors to these directors will be elected for a term expiring at the third annual meeting following election.
Currently, the Class I directors are Messrs. Collins, Marcum, Owens, and Wolkowitz, the Class II directors are Messrs. Breazzano, Fertig and West, and the Class III directors are Messrs. Alario and Michael. Daniel Dienstbier served as a Class III director until his death on April 13, 2007.
In addition, our Bylaws provide that the authorized number of directors may be changed only by action of a majority of the Board of Directors. Any additional directorships resulting from an increase in the number of directors will be distributed among the three classes so that, as nearly as possible, each class will consist of one-third of the total number of directors. Vacancies and newly created directorships may be filled by the affirmative vote of a majority of our directors then in office, even if less than a quorum. Our Bylaws also provide that no director may be removed except for cause and then only by a vote of at least two-thirds of the total eligible shareholder votes, and also require the vote of a majority of the shareholders of the Company to call a special meeting of shareholders.
Because we have not filed required annual reports with the SEC, we have not been able to hold an annual meeting of shareholders since 2003. We expect to hold an annual meeting in 2007 after the filing of this Annual Report on Form 10-K. We expect to hold future annual meetings in the second quarter of the fiscal year, beginning in 2008.
Director Nomination Process
On October 29, 2004, the Board of Directors adopted guidelines for nomination as a director of the Company and process for the selection of new candidates for the Board of Directors. These guidelines include procedures to be followed by shareholders who wish to recommend candidates to the Corporate Governance and Nominating Committee for its consideration in connection with its selection of director candidates to the Board of Directors. Shareholders may nominate candidates to the Company's Board of Directors by submitting such nominations in writing to the Company's Secretary no later than 120 days prior to the scheduled date for the annual meeting of shareholders. (We may announce a shorter period for nominations for the 2007 annual meeting.) The Corporate Governance and Nominating Committee will consider candidates proposed by shareholders in the same manner as other candidates, so long as the shareholder meets certain eligibility standards.
Shareholder nominations must include the name, age, business and residence address and principal occupation or employment of the proposed nominee. An explanation of how the nominee meets the Company's selection criteria, as set forth in the guidelines, is required. The nomination also must include the name and residence address of the shareholder and the number of shares of Company common stock owned by the shareholder. The shareholder must also provide the total number of shares of Company common stock that, to the shareholder's knowledge, will be voted for the proposed nominee and are owned by the proposed nominee. A signed consent of the proposed nominee to serve if elected must be submitted, and any other information relating to the proposed nominee that is required to be disclosed in solicitations of proxies for the election of directors under Regulation 14A of the Securities Exchange Act of 1934.
Audit Committee Financial Expert
The Company has a separately designated standing Audit Committee. The Audit Committee plays an important role in promoting effective corporate governance, and members of the Audit Committee must possess the requisite financial literacy and expertise. All members of Key's Audit Committee would meet the financial literacy standard required by the NYSE rules and at least one member would qualify as having accounting or related financial management expertise under the NYSE rules. In addition, as required by the Sarbanes-Oxley Act of 2002, the SEC adopted rules requiring that each public company disclose whether or not its audit committee has an "audit committee financial expert" as a member. An "audit committee financial expert" is defined as a person who, based on his or her experience, satisfies all of the following attributes:
•An understanding of generally accepted accounting principles and financial statements;
•An ability to assess the general application of such principles in connection with the accounting for estimates, accruals, and reserves;
•Experience preparing, auditing, analyzing or evaluating financial statements that present a breadth and level of complexity of accounting issues that are generally comparable to the breadth and level of complexity of issues that can reasonably be expected to be raised by Key's financial statements, or experience actively supervising one or more persons engaged in such activities;
•An understanding of internal controls over financial reporting; and
•An understanding of audit committee functions.
The Board of Directors has affirmatively determined that Mr. Michael satisfies the definition of "audit committee financial expert," and has designated Mr. Michael as an "audit committee financial expert." During the fiscal year ended December 31, 2006, the Audit Committee was comprised of Messrs. Michael, Collins and Marcum. Mr. Owens was appointed as a member of the Audit Committee effective August 7, 2007. All of the members of the Audit Committee are independent within the meaning of SEC regulations, the NYSE listing standards and the Company's Corporate Governance Guidelines.
ITEM 11.Executive Compensation
Oversight of Executive Compensation Program
The Compensation Committee of our Board of Directors (the "Compensation Committee") has responsibility for establishing, implementing and continually monitoring adherence with our compensation philosophy. The Compensation Committee has the authority to engage independent compensation consultants, who report directly to the committee to advise and consult on compensation issues.
Throughout this report, the individuals who served as our Chief Executive Officer ("CEO") and Chief Financial Officer ("CFO") during fiscal 2006, and each of our three other most highly compensated executive officers as included in the 2006 Summary Compensation Table on page 70, are referred to as the "Named Executive Officers" or "NEOs".
The Compensation Committee is composed entirely of independent, non-management members of the Board of Directors. No Compensation Committee member participates in any of the Company's employee compensation programs other than the Key Energy Group, Inc. 1997 Incentive Plan. During 2006, the Compensation Committee met eight times.
The Compensation Committee has taken the following actions during 2005 and 2006 to improve the links between senior executive pay and performance by:
•Clearly aligning incentive pay with overall Company objectives and goals;
•Hiring an independent compensation consultant to advise on executive compensation issues; and
•Realigning compensation structures based on a clearly defined competitive pay strategy.
The responsibilities of the Compensation Committee, as stated in its charter, include the following:
•Reviewing and approving corporate goals and objectives relevant to the compensation of the CEO;
•Evaluating the CEO's performance in light of corporate goals and objectives and, together with the other independent directors (as directed by the Board), determining and approving the CEO's compensation level based on this evaluation;
•Reviewing and approving the compensation of senior executive officers other than the CEO;
•Reviewing and approving any incentive-compensation plans or equity-based plans;
•Overseeing the activities of the individuals and committees responsible for administering incentive-compensation plans or equity-based plans, including the 401(k) plan; and discharging any responsibilities imposed on the Compensation Committee by any of these plans;
•Approving any new equity compensation plan or any material change to an existing plan where shareholder approval has not been obtained;
•In consultation with management, overseeing regulatory compliance with respect to compensation matters, including overseeing the Company's policies on structuring compensation programs to preserve tax deductibility;
•Making recommendations to the Board with respect to any severance or similar termination payments proposed to be made to any current or former senior executive officer or member of senior management of the Company;
•Reviewing and recommending director compensation to the Board;
•Preparing an annual report of the Compensation Committee on executive compensation for inclusion in the Company's annual proxy statement or annual report in accordance with applicable SEC rules and regulations; and
•Reviewing and approving the Compensation Disclosure and Analysis for inclusion in the Company's annual proxy statement or annual report in accordance with applicable SEC rules and regulations.
Compensation Consultant
In June 2005, the Compensation Committee retained Towers Perrin as its independent compensation consultant to advise the Compensation Committee on all matters related to the senior executives' compensation and general compensation programs. This relationship with Towers Perrin continued in 2006.
Towers Perrin assisted the Compensation Committee by providing comparative market data on compensation practices and programs based on an analysis of peer competitors. Towers Perrin also provided guidance on industry best practices. Towers Perrin advised the Compensation Committee in (1) determining base salaries for senior executives, (2) recommending long-term incentive initiatives for consideration, and (3) designing and recommending individual grant levels for the 2006 long-term incentive awards for the senior executives.
Towers Perrin recommended to the Compensation Committee the appropriate long-term and short-term incentives and also made recommendations with respect to total compensation for senior executives. Long-term incentives include stock options, restricted stock and other forms of benefits that may be considered a component in total compensation.
Compensation ranges for all positions are reviewed annually for adjustment based on cost of living or shifts in the market. Towers Perrin's last review in 2006 was completed in October of that year. A review was also completed during April 2007. The benchmarks used for executive compensation comparisons include industry peer data and nationwide industry data recommended by Towers Perrin. Included in the peer data review were the following companies:
•Basic Energy Services, Inc.
•Complete Production Services, Inc.
•Grant Prideco, Inc.
•Grey Wolf, Inc.
•Patterson-UTI Energy, Inc.
•Pride International, Inc.
•Superior Well Services, Inc.
•W-H Energy Services, Inc.
The recommendations of Towers Perrin including the selection of the peer group were reviewed with management and adjusted by the Compensation Committee as appropriate to provide the most relevant information to the Compensation Committee. Areas such as revenue, number of employees and scope of NEO duties were considered when selecting market comparisons.
From time to time, Towers Perrin provided advice with respect to reviewing and structuring our policy regarding fees paid to our directors as well as other equity and non-equity compensation awarded to non-management directors, including designing and determining individual grant levels for the 2006 long-term incentive awards. Towers Perrin was not engaged to do any additional work for us outside of executive and director compensation.
In May 2007, the Compensation Committee engaged and retained Longnecker & Associates as the new compensation consultant. Advice and consulting for all non-executive compensation is completed by third parties other than Towers Perrin or Longnecker & Associates.
Role of Executives in Establishing Compensation
The Compensation Committee makes the final determination of all compensation paid to our NEOs and is involved in all compensation decisions affecting our Chief Executive Officer. However, management also plays a role in the determination of executive compensation levels. The key members of management involved in the compensation process are the Chief Executive Officer, the Chief Financial Officer, the General Counsel and the Chief People Officer. Management proposes certain corporate and executive performance objectives for executive management. Management also participates in the discussion of peer companies to be used to benchmark NEO compensation, and recommends the overall funding level for cash bonuses and equity incentive awards. All management recommendations are reviewed, modified as necessary by the Compensation Committee, and approved by the Compensation Committee.
Compensation Philosophy
In order to recruit and retain the most qualified and competent individuals as senior executives, we strive to maintain a compensation program that is competitive in our market and with respect to the general profession of our executives. We are committed to hiring and retaining qualified, motivated employees at all levels within the organization while ensuring that all forms of compensation are aligned with business needs. The purpose of our compensation program is to reward exceptional organizational and individual performance. Our compensation system is designed to support the successful attainment of our vision, values and business objectives.
The following compensation objectives are considered in setting the compensation components for our senior executives:
•Attract and retain key executives responsible not only for our continued growth and profitability but to ensure proper corporate governance and principles;
•Motivate management to enhance long-term shareholder value and to align our executives' interests with that of our shareholders;
•Correlate a portion of management's compensation to measurable performance, including specific financial and operating goals; and
•Set compensation and incentive levels that reflect competitive market practices.
We want our executives to be motivated to achieve the Company's short- and long-term goals, without sacrificing our financial and corporate integrity in trying to achieve those goals. While an executive's overall compensation should be strongly influenced by the achievement of specific financial
targets, we believe that an executive must be provided a degree of financial certainty and stability in his or her compensation.
The principal components of our executive compensation program are base salary, cash incentive bonuses and long-term incentive awards in the form of stock options, restricted stock and phantom stock awards. We blend these elements in order to formulate compensation packages which provide competitive pay, reward the achievement of financial, operational and strategic objectives on a short- and long-term basis, and align the interests of our executive officers and other senior personnel with those of our shareholders. To understand our compensation philosophy, it is important to note that we believe that compensation is not the only manner in which we attract people to Key. We strive to hire and retain talented people who are compatible with our corporate culture, committed to our core values, and who want to make a contribution to our mission.
Elements of Compensation
The total compensation and benefits program for our senior executives generally consists of the following components:
•base salaries;
•cash bonus incentive plan;
•long-term equity-based incentive compensation;
•retirement, health and welfare benefits;
•perquisites; and
•certain post-termination payments.
Base Salaries
We provide base salaries to compensate our senior executives and other employees for services performed during the fiscal year. This provides a level of financial certainty and stability in an industry with historical volatility and cyclicality. The base salaries are designed to reflect the experience, education, responsibilities and contribution of the individual executive officers. This form of compensation is eligible for annual merit increases, and is initially established for each executive through individual negotiation and is reflected in the executive's employment agreement. Thereafter, salaries are reviewed annually, based on a number of factors, both quantitative, including detailed organizational and competitive analyses performed by an independent consultant engaged by the Compensation Committee, and qualitative, including the Compensation Committee's perception of the executive's experience, performance and contribution to our business objectives and corporate values.
The average salary increase for the NEOs overall during 2006 was 7.7%. In addition, effective May 6, 2007, each of the NEOs, other than Mr. Flynt, received an average salary increase of 5.5%.
Cash Bonus Incentive Plan
The cash bonus incentive awards are variable cash compensation earned only when established semi-annual performance goals are achieved. It is designed to reward the plan participants, including the NEOs who have achieved certain corporate and executive performance objectives and have contributed to the achievement of certain short- and long-term objectives of the Company.
Under this cash compensation program, each executive has the opportunity to earn a cash incentive compensation bonus based on the achievement of pre-determined operating and financial performance measures and other performance objectives established semi-annually by the Compensation Committee. Those goals are financial targets, safety targets, retention targets and some individual job-related targets. Each goal is weighted in terms of percentage of the total program.
Our financial target is measured by our EBITDA performance and is tied to our financial business plan, which is approved by the Board. The Compensation Committee establishes a threshold and a target percentage of EBITDA performance for the period. The threshold level of EBITDA performance must be met in order to fund the incentive program. If the EBITDA performance falls short of such threshold, then no incentive bonuses are awarded under the program regardless of goal achievement under the other measures. If EBITDA threshold is achieved, but less than 100% of the target is achieved, then the executive may receive an incremental bonus percentage with respect to the EBITDA target. Assuming that the EBITDA financial threshold is met, the executive can then receive credit in the other bonus measurements. The executive may also receive incremental credit for the other bonus measurements even though 100% of the target goal with respect to each other performance measurement has not been reached. The Compensation Committee reviews these goals at the beginning of the period and authorizes payment following the end of the period.
Each executive's bonus opportunity is initially reflected in the executive's employment agreement and subsequently reviewed at least annually. Currently, the Compensation Committee has set the aggregate annual bonus opportunity as a percentage of base salary. The participation percentage for all eligible employees can range from 10% to 100% of base salary. The participation percentage for all NEOs is 100%.
If the Company performs above the financial business plan and therefore exceeds the established EBITDA performance measures, additional increments are awarded up to 140% of the weighted portion of the EBITDA target. Achievement over and above the financial target can occur only when the business plan is exceeded. In as much as the business plan is our estimate of maximum expected achievement for such six-month period, exceeding the target for this measure is difficult.
The following measures, which are discussed in more detail below, determined the size of bonus awards earned by the NEOs during 2006.
•EBITDA
•Safety
•Employee Turnover
•DSO and DSO Related Measurements
•Additional Individual Objectives
Depending upon actual performance under each of these measures, participants of the plan, including executives, may earn up to 130% of their total bonus opportunity.
Measurements
EBITDA
The financial target is based on EBITDA, which is defined as earnings before interest, taxes, depreciation and amortization expenses; however, during the course of our previous restatement process and prior to being current with our financial reporting obligations, we calculated this financial target as revenue less direct costs, less general and administrative expenses. We believe that this calculation was a comparable alternative for measuring financial performance and we generally refer to the financial target in this report as the EBITDA target.
Safety
The safety target is based on a goal established by the Compensation Committee at the beginning of the period. This goal represents the improvement required or desired result in the Occupational Safety and Health Administration ("OSHA") recordable incident rate. OSHA recordable incident rates are determined by measuring the number of incidents, such as accidents or injuries, involving our employees. Incidents that are recorded include accidents or injuries potentially resulting in a fatality, an employee missing work, an employee having to switch to "light" duty work or an employee needing to have medical treatment.
Employee Turnover
The employee retention goal is used as an incentive to reduce employee turnover. The goals are established by the Compensation Committee at the beginning of the period and represent a specific percent of improvement or a desired minimum in the number of employees that terminate employment with the Company from the prior period goal.
Days Sales Outstanding (DSO)
DSO and DSO-related measurements indicate how quickly the Company is collecting on its invoices and the aging of its receivables. The Compensation Committee establishes a goal representing a certain level of improvement in the rate of collection.
Individual Objectives
Individual performance goals are based on individual objectives for each NEO specific to his or her area of expertise and influence, such as the implementation of a new corporate-wide initiative, system or policy. The Compensation Committee sets, to the extent it deems appropriate, the individual targets for the CEO and CFO, while the CEO sets the individual objectives for all other NEOs. The targets for these measures are derived from our 2006 business plan as approved by the Board and are set at or above the levels set within the business plan.
Under our incentive compensation program, the Compensation Committee has discretion to adjust targets, as well as individual awards, either positively or negatively. For example, during 2006, the Compensation Committee recognized 100% achievement in the second-half employee turnover goal when the Company had fallen short of such goal by less than one percent.
The percentage weighting with respect to these target measurements and actual achievement levels for the first and second half of 2006 (expressed as a percentage of base salary for the corresponding period) are highlighted in the tables below:
PERCENTAGE WEIGHTING OF
FIRST HALF 2006 INCENTIVE MEASURES
| |
|---|
Participant
| | EBITDA
| | Safety
| | Turnover
| | Individual
| | DSO
| | Target
| | 1H06 Actual
| |
|---|
| Richard J. Alario | | 70 | % | 15 | % | 10 | % | — | | 5 | % | 100 | % | 124 | % |
| William M. Austin | | 70 | % | 5 | % | 10 | % | — | | 15 | % | 100 | % | 117 | % |
| Newton W. Wilson III | | 65 | % | 15 | % | 10 | % | 5 | % | 5 | % | 100 | % | 121 | % |
| Kim B. Clarke | | 55 | % | 15 | % | 10 | % | 20 | % | — | | 100 | % | 121 | % |
| Jim D. Flynt | | 55 | % | 25 | % | 10 | % | — | | 10 | % | 100 | % | 97 | % |
PERCENTAGE WEIGHTING OF
SECOND HALF 2006 INCENTIVE MEASURES
| |
|---|
Participant
| | EBITDA
| | Safety
| | Turnover
| | Individual
| | DSO
| | Target
| | 2H06 Actual
| |
|---|
| Richard J. Alario | | 75 | % | 15 | % | 10 | % | — | | — | | 100 | % | 114 | % |
| William M. Austin | | 65 | % | 15 | % | 10 | % | 5 | % | 5 | % | 100 | % | 109 | % |
| Newton W. Wilson III | | 65 | % | 15 | % | 10 | % | 5 | % | 5 | % | 100 | % | 109 | % |
| Kim B. Clarke | | 50 | % | 15 | % | 10 | % | 25 | % | — | | 100 | % | 108 | % |
| Jim D. Flynt | | 50 | % | 20 | % | 10 | % | 5 | % | 15 | % | 100 | % | 100 | % |
After giving effect to the restatement and related adjustments as reflected in this report (see Item 8. "Consolidated Financial Statements and Supplementary Data"), the actual achievement levels
for each of NEOs, which are expressed as a percentage of base salary, for the second half of 2006 would have been as follows:
Participant
| | 2H06
Actual
(adjusted)
| |
|---|
Richard J. Alario | | 92 | % |
William M. Austin | | 87 | % |
Newton W. Wilson III | | 87 | % |
Kim B. Clarke | | 93 | % |
Jim D. Flynt | | 93 | % |
The first half achievement levels did not change. The Compensation Committee will review the second half achievement levels and may take this information into account when determining future cash bonus incentive awards.
Long-Term Equity-Based Incentive Compensation
The purpose of our long-term incentive compensation is to align the interest of our executives with that of our shareholders. We want our executives to be focused on increasing shareholder value. In order to encourage and establish this focus on shareholder value we use two long-term incentive vehicles: the Key Energy Group, Inc. 1997 Incentive Plan (the "Incentive Plan") and the Key Energy Services, Inc. 2006 Phantom Share Plan (the "Phantom Plan").
As a result of the Company's inability to file its 2003 Annual Report on Form 10-K and the subsequent delay in filing this report, the Company has been unable to allow the exercise of any vested stock options. In addition, the Company's failure to have current financial statements on file with the SEC has limited the ability of the Compensation Committee to issue restricted shares, except to those senior executives who qualified for an exemption from registration under the Securities Act. The Compensation Committee considered these limitations in determining the components of equity-based compensation granted to its senior executives.
Key Energy Group, Inc. 1997 Incentive Plan
To promote our long-term objectives, equity awards are made under the Incentive Plan to directors, executive officers and other employees who are in a position to make a significant contribution to our long-term success. Our Incentive Plan provides that the Compensation Committee has the authority to grant participants different types of equity awards, including non-qualified and incentive stock options, shares of common stock and restricted stock. Since equity awards may vest and grow in value over time, this component of our compensation plan is designed to provide incentives to reward performance over a sustained period.
Stock options represent rights to purchase shares of Key stock at a set price at some date in the future, not to exceed ten years from the date of grant. Stock options are granted with an exercise price equal to the closing stock price on the business day immediately preceding the date of grant.
We believe that awards of stock options provide a significant incentive for senior executives to remain employed and to achieve and maintain high levels of performance over multi-year periods, and strengthen the connection between executive and shareholder interests. Although no performance-vesting criteria are applied to our stock option awards, we believe that stock options represent a powerful performance incentive, as the options become valuable only to the extent that our stock price increases following the date of grant.
We have not allowed the exercise of any stock options since 2004. Until we have an effective registration statement on file with the SEC, we will be unable to issue any shares upon exercise of the outstanding options. See Item 1A—"Risk Factors" regarding our inability to issue shares of common stock on exercise of options.
•Restricted Stock
Restricted stock awards represent awards of actual shares of our common stock, earned contingent upon continued employment. Typically the restricted stock we grant to our executives vests at a rate of one-third per year over a three-year term.
We believe that awards of restricted stock provide a significant incentive for executives to achieve and maintain high levels of performance over multi-year periods, and strengthen the connection between executive and shareholder interests. We believe that restricted shares are a powerful tool for helping us retain executive talent. The higher value of a share of restricted stock in comparison to a stock option allows us to issue fewer total shares in order to arrive at a competitive total long-term incentive award value. Furthermore, we believe that the use of restricted stock reflects competitive practice among other production service companies with whom we compete for executive talent. Until we have filed a registration statement covering the resale of the restricted shares, the ability of shareholders to resell the shares after they have vested will also be limited by the Securities Act.
Key Energy Services, Inc. 2006 Phantom Share Plan
In December 2006, the Compensation Committee adopted the Company's Phantom Plan. The Phantom Plan's purpose is to enable the Company to obtain and retain the services of the types of employees who will contribute to the long range success of the Company and its affiliates and to provide an incentive to increase the value of the Company's equity which inures to the benefit of all shareholders of the Company. The Phantom Plan has allowed the Company to issue equity-based incentives to employees and executives who, because of the Company's late filing status, would have been otherwise unable to participate in such plans. The Company has a maximum number of 495,500 Phantom Shares reserved for issuance under this Phantom Plan, of which 489,500 have been awarded.
Under the terms of the Phantom Share Agreement, within 20 business days of the vesting date of outstanding Phantom Shares, we will deliver to the employee a payment in cash equal to the value of the vested Phantom Shares as determined by the then-fair market value of our common stock. No performance-vesting criteria are applied to our Phantom Plan awards; however, the value of a Phantom Plan award is tied directly to the price of our common stock at the time of vesting. We believe that this represents a powerful performance incentive since the value of the Phantom Share depends entirely on the price of the Company's stock.
Retirement, Health and Welfare Benefits
We offer a variety of health and welfare and retirement programs to all eligible employees. Under the terms of their employment agreements, the NEOs are eligible for the same broad-based benefit programs on the same basis as the rest of the Company's employees. Our health and welfare programs include medical, pharmacy, dental, vision, life insurance and accidental death and disability. For some of our NEOs, we also pay all covered out-of-pocket expenses for healthcare not otherwise covered by insurance.
Perquisites
In addition to the compensation described above, under the terms of their respective employment agreements, executive officers may also be paid reasonable fees for personal financial advisory
counseling, accounting and related services, legal advisory or attorney's fees and income tax preparation and tax audit services. Additional perquisites include auto allowances plus reimbursement for reasonable insurance and maintenance expenses and club memberships. The costs to the Company associated with providing these benefits for NEOs in 2006 are reflected in the Perquisites Table on page 71.
401(k) Plan
We maintain a 401(k) plan for our employees. Under the 401(k) plan, eligible employees may elect to contribute up to 100% of their eligible compensation on a pre-tax basis in accordance with the limitations imposed under the Code.
We also match 100% of each employee's deferrals up to 4% of the individual's eligible salary, which for 2006 was $220,000. Therefore, even if an employee earned more than $220,000 in eligible salary, the contribution match made by the Company could not exceed $8,800.
The cash amounts contributed under the 401(k) plan are held in a trust and invested among various investment funds in accordance with the directions of each participant. An employee's salary deferral contributions under the 401(k) plan are 100% vested. Our matching contributions vest at the rate of 25% for each year of service. Therefore, an employee is fully-vested in all Company matching contributions after four years of employment with Key. Participants of the plan are entitled to payment of their vested account balances upon termination of employment. Participants of the plan are eligible for 100% of their account balances in the event of retirement, disability or death. We made employer matching contributions to the 401(k) plan of approximately $7.4 million for the year ended December 31, 2006.
Severance Payments/Change In Control
We have employment agreements in place with each of the NEOs providing for their severance compensation for a period of up to three years in the event the executive's employment is terminated under a variety of reasons, including a change in control of the Company. We have provided more information about these benefits, along with estimates of the value under various circumstances under "Potential Payments upon Termination or Change in Control" below.
Our practice in the case of change in control benefits has been to structure these as "double trigger" benefits. In other words, the change of control does not itself trigger benefits; rather, benefits are paid only if the employment of the executive is terminated during a specified period after a change of control. We believe a "double trigger" benefit maximizes shareholder value because it prevents an unintended windfall to executives in the event of a friendly change of control, while still providing appropriate incentives to cooperate in negotiating any change of control. In addition, these agreements avoid distractions involving executive management that arise when the Board is considering possible strategic transactions involving a change in control, and assure continuity of executive management and objective input to the Board when it is considering any strategic transaction. For additional information concerning our change in control agreements, see "Potential Payments upon Termination or Change in Control" below.
Each of the executive officers is subject to noncompete and non-solicitation provisions pursuant to the terms of their employment contracts.
Regulatory Considerations
The tax and accounting consequences of utilizing various forms of compensation are considered by the Compensation Committee when adopting new or modifying existing compensation.
Under Section 162(m) of the Internal Revenue Code, publicly-held corporations may not take a tax deduction for compensation in excess of $1 million paid to any of the executive officers named in the Summary Compensation Table during any fiscal year. There is an exception to the $1 million limitation for performance-based compensation meeting certain requirements. To maintain flexibility in compensating executives in a manner designed to promote varying corporate goals, the Compensation Committee has not adopted a policy requiring all compensation to be deductible under Section 162(m). However, the Compensation Committee considers deductibility under Section 162(m) with respect to compensation arrangements for executives. The Committee cannot guarantee that future executive compensation will be fully deductible under Code Section 162(m).
Accounting for Stock-Based Compensation
Beginning January 1, 2006, the Company began accounting for stock-based payments, including stock options, in accordance with the requirements of Statement of Financial Accounting Standards 123 (Revised 2004), "Share-Based Payment" ("SFAS 123(R)").
COMPENSATION OF EXECUTIVE OFFICERSSubsidiaries
2006 Summary Compensation Table
Name and Principal Position
| | Year
| | Salary
($)
| | Bonus
($)
| | Stock
Awards
($)(1)
| | Option
Awards
($)(2)
| | Non-equity
Incentive Plan
Compensation
($)
| | All Other
Compensation
($)(3)
| | Total
|
|---|
Richard J. Alario,
Chief Executive Officer | | 2006 | | $ | 745,769 | | $ | 432,190 | (4) | $ | 1,598,474 | | $ | 495,204 | | $ | 891,563 | (5) | $ | 57,643 | | $ | 4,220,843 |
William M. Austin
Chief Financial Officer |
|
2006 |
|
$ |
418,308 |
|
|
— |
|
$ |
529,719 |
|
$ |
66,090 |
|
$ |
473,445 |
(6) |
$ |
15,184 |
|
$ |
1,502,746 |
Newton W. Wilson III
General Counsel |
|
2006 |
|
$ |
372,938 |
|
$ |
100,000 |
(7) |
$ |
529,719 |
|
$ |
232,738 |
|
$ |
433,661 |
(8) |
$ |
34,462 |
|
$ |
1,703,518 |
Kim B. Clarke
Chief People Officer |
|
2006 |
|
$ |
250,000 |
|
|
— |
|
$ |
186,125 |
|
$ |
75,701 |
|
$ |
286,313 |
(9) |
$ |
12,953 |
|
$ |
811,092 |
Jim D. Flynt
Senior Vice President |
|
2006 |
|
$ |
250,000 |
|
$ |
12,500 |
(10) |
$ |
7,553 |
|
$ |
37,265 |
|
$ |
245,625 |
(11) |
|
— |
|
$ |
552,943 |
(1)Represents the dollar amount of expense recognized by the Company in 2006 for financial statement reporting purposes with respect to restricted stock awards granted under the 1997 Incentive Plan and Phantom Stock Awards granted under the Phantom Plan in accordance with SFAS 123(R). See Item 8. "Consolidated Financial Statements and Supplementary Data," Note 14—"Stockholders' Equity" for a discussion of the relevant assumptions used to determine the valuation of our stock for accounting purposes.
(2)Represents the dollar amount of expense recognized by the Company in 2006 for financial statement reporting purposes with respect to option awards granted under the 1997 Incentive Plan in accordance with SFAS 123(R). See Item 8. "Consolidated Financial Statements and Supplementary Data," Note 14—"Stockholders' Equity" for a discussion of the relevant assumptions used to determine the valuation of our stock options for accounting purposes.
(3)A breakdown of the amounts shown in this column for 2006 for each of the NEOs is set forth in the Perquisites Table below.
(4)Represents bonuses of $232,190 and $200,000 payable to Mr. Alario pursuant to the terms of his employment agreement for foregone retention bonuses with his prior employer.
(5)Represents annual incentive compensation of $463,125 and $428,438 for the first and second half of 2006, respectively.
(6)Represents annual incentive compensation of $245,490 and $227,955 for the first and second half of 2006, respectively.
(7)Represents retention bonus payable pursuant to the terms of his employment agreement.
(8)Represents annual incentive compensation of $228,501 and $205,160 for the first and second half of 2006, respectively.
(9)Represents annual incentive compensation of $151,000 and $135,313 for the first and second half of 2006, respectively.
(10)Represents a lump sum merit bonus payment paid July 17, 2006.
(11)Represents annual incentive compensation of $121,250 and $124,375 for the first and second half of 2006, respectively.
Perquisites
Name
| | Tax
Gross-Up(1)
| | Savings Plan
Contributions(2)
| | Life
Insurance(3)
| | Auto
Allowance(4)
| | Medical
Expenses(5)
| | Other(6)
| | Total
|
|---|
| Richard J. Alario | | $ | 3,460 | | $ | 8,800 | | $ | 16,727 | | $ | 13,200 | | $ | 15,042 | | $ | 414 | | $ | 57,643 |
| William M. Austin | | | — | | $ | 8,800 | | | — | | | — | | $ | 5,196 | | $ | 1,188 | | $ | 15,184 |
| Newton W. Wilson III | | $ | 23,733 | | $ | 8,800 | | | — | | | — | | $ | 1,087 | | $ | 842 | | $ | 34,462 |
| Kim B. Clarke | | | — | | $ | 8,800 | | | — | | | — | | $ | 3,619 | | $ | 534 | | $ | 12,953 |
(1)Represents cash gross-up payment calculated to pay all of the federal, state and local income and payroll taxes incurred by the NEO as a result of the Company's reimbursement of relocation expenses and related relocation bonuses received during 2005.
(2)Represents contributions by the Company on behalf of the NEO to the Key Energy Services, Inc. 401(k) Savings and Retirement Plan.
(3)Represents premium paid by the Company on behalf of the NEO for life insurance policy.
(4)Represents auto allowance payable to NEO pursuant to terms of his employment agreement.
(5)Represents out-of-pocket medical expenses reimbursed to the NEO under the Company's Exec-u-Care insurance program.
(6)Includes amounts for imputed income with respect to life insurance and nominal awards granted to employees for participation in improvement processes program.
2006 Grants of Plan Based Awards
| |
| | Estimated Possible Payouts
Under Non-Equity
Incentive Plan Awards (1)
| |
| | All Other
Option
Awards
Number of
Securities
Underlying
(#)
| |
| |
| |
|---|
| |
| | All Other
Stock Awards:
Number of
Securities
Underlying (#)
| | Exercise or
Base Price
of Option
Awards
($/Sh)
| | Grant Date
Fair Value
of Stock and
Option
Awards ($)
| |
|---|
Name
| | Grant
Date
| | Threshold
($)
| | Target
($)
| | Maximum
($)
| |
|---|
| Richard J. Alario | | —
12/22/06 | | $
| 56,250
— | | $
| 750,000
— | | $
| 975,000
— | | —
150,000 |
(2) | —
— | | | —
— | |
$ | —
2,475,500 |
(3) |
William M. Austin |
|
—
12/22/06 |
|
$
|
27,300
— |
|
$
|
420,000
— |
|
$
|
529,200
— |
|
—
50,000 |
(2) |
—
— |
|
|
—
— |
|
$ |
—
825,000 |
(3) |
Newton W. Wilson III |
|
—
12/22/06 |
|
$
|
24,570
— |
|
$
|
378,000
— |
|
$
|
476,280
— |
|
—
50,000 |
(2) |
—
— |
|
|
—
— |
|
$ |
—
825,000 |
(3) |
Kim B. Clarke |
|
—
12/22/06 |
|
$
|
12,500
— |
|
$
|
250,000
— |
|
$
|
300,000
— |
|
—
35,000 |
(2) |
—
— |
|
|
—
— |
|
$ |
—
577,500 |
(3) |
Jim D. Flynt |
|
—
03/15/06
12/22/06 |
|
$
|
12,500
—
— |
|
$
|
250,000
—
— |
|
$
|
300,000
—
— |
|
—
—
40,000 |
(6) |
—
12,500
— |
|
$
|
—
15.05
— |
(4)
|
$
$ |
—
90,344
660,000 |
(5)
(3) |
(1)The columns represent the potential annual value of the payout for each NEO under the cash bonus incentive compensation component if the threshold, target or maximum goals were satisfied. Actual amounts awarded in 2006 are included in the Non-Equity Incentive Plan Compensation Column of the 2006 Summary Compensation Table. For a detailed description of the Non-Equity Incentive Plan, see the "Cash Bonuses Incentive Plan" section of the Compensation Discussion and Analysis above.
(2)Represents the number of restricted shares granted in 2006 to the NEOs. The restricted shares vest ratably over the three year period following the date of grant.
(3)Grant date fair value of stock awards and phantom stock awards is determined by multiplying the number of shares by the closing price of the common stock on the date of the award. The closing price as quoted on the Pink Sheets on December 22, 2006 was $16.50.
(4)Pursuant to the Key Energy Group, Inc. 1997 Incentive Plan, the fair market value is the closing price of the common stock on the business day immediately preceding the grant date. The closing price as quoted on the Pink Sheets on March 15, 2006 was $15.05.
(5)Grant date fair value of the stock option awards is determined using the Black-Scholes option pricing model. See Item 8. "Consolidated Financial Statements and Supplementary Data," Note 14—"Stockholders' Equity" for a discussion of the relevant assumptions used to determine the valuation of our stock options for accounting purposes.
(6)Represents grant of phantom stock that vests ratably over the four-year period following the date of grant.
2006 Outstanding Equity Awards at Fiscal Year-End
| | Option Awards (1)
| | Stock Awards
|
|---|
Name
| | Number of
Securities
Underlying
Unexercised
Options (#)
Exercisable
| | Number of
Securities
Underlying
Unexercised
Options (#)
Unexercisable
| | Equity
Incentive
Plan Awards:
Number of
Securities
Underlying
Unexercised
Unearned
Options (#)
| | Option
Exercise
Price ($)
| | Option
Expiration
Date
| | Number of Shares
or Units of Stock
That Have Not
Vested (#)(2)
| | Market
Value of
Shares or
Units of
Stock That
Have Not
Vested ($)(3)
| | Equity
Incentive Plan
Awards:
Number of
Unearned
Shares,
Units or Other Rights
That Have
Not Vested (#)
| | Equity
Incentive Plan
Awards:
Market or
Payout Value
of Unearned
Shares, Units or Other Rights That Have Not Vested ($)
|
|---|
| Richard J. Alario | | 66,666 | | 133,334 | | — | | $ | 11.90 | | 06/24/15 | | 250,000 | | $ | 3,912,500 | | — | | — |
William M. Austin |
|
100,000 |
|
— |
|
— |
|
$ |
10.53 |
|
09/09/14 |
|
116,667 |
|
$ |
1,825,839 |
|
— |
|
— |
Newton W. Wilson III |
|
83,333 |
|
41,667 |
|
— |
|
$ |
11.90 |
|
06/24/15 |
|
116,667 |
|
$ |
1,825,339 |
|
— |
|
— |
Kim B. Clarke |
|
6,666
5,000 |
|
3,334
10,000 |
|
—
— |
|
$
$ |
11.75
14.25 |
|
12/15/14
12/08/15 |
|
51,667
— |
|
$
|
808,859
— |
|
—
— |
|
—
— |
Jim D. Flynt |
|
16,667
20,000
37,500
—
35,000
25,000
50,000
— |
|
—
—
—
—
—
—
—
12,500 |
|
—
—
—
12,500
—
—
—
— |
|
$
$
$
$
$
$
$
$ |
3.00
5.00
8.50
8.50
8.25
8.00
10.22
15.05 |
|
05/05/09
12/01/09
04/18/10
04/18/10
12/11/10
10/16/11
07/18/13
03/15/16 |
|
40,000
—
—
—
—
—
—
— |
|
$
|
626,000
|
|
—
—
—
—
—
—
—
— |
|
—
—
—
—
—
—
—
— |
(1)Stock options become exercisable in accordance with the following vesting schedule:
Option Expiration Date
| | Vesting
|
|---|
June 24, 2015 (Alario) | | 1/3 per year beginning on the anniversary date of the grant |
June 24, 2015 (Wilson) | | 1/3 on date of grant and 1/3 per year beginning on the anniversary date of the grant |
September 9, 2014 | | 1/3 per year beginning on the date of the grant |
December 15, 2014 | | 1/3 per year beginning on the anniversary date of the grant |
December 8, 2015 | | 1/3 per year beginning on the anniversary date of the grant |
May 5, 2009 | | 1/2 on 1/31/00 and 1/3 per year beginning on 7/1/00 |
December 1, 2009 | | 1/3 per year beginning on the anniversary date of the grant |
April 18, 2010 | | Price triggers vesting: $13 on, or after, 4/18/00; $15 on, or after, 4/18/01; $17 on or after, 4/18/02; $20 on, or after, 4/18/03. Absolute vesting after 8 years. |
December 11, 2010 | | 1/3 per year beginning on 7/1/01 |
October 16, 2010 | | 1/3 per year beginning on 7/1/02 |
July 18, 2013 | | 1/3 per year beginning on 5/7/04 |
March 15, 2016 | | 1/2 on the second anniversary date of the grant and 1/4 per year beginning on the third year of the anniversary date of the grant |
(2)The restricted shares vest in one-third increments beginning on the one-year anniversary of the date of grant. The grant of 40,000 shares to Mr. Flynt represents a phantom stock grant, which grant will vest in quarterly increments beginning on the one-year anniversary of the date of grant.
(3)The market value of stock awards and phantom stock awards is determined by multiplying the number of shares by the closing price of the stock on the last trading day of the year. The closing price quoted on the Pink Sheets on December 29, 2006 was $15.65.
2006 OPTION EXERCISES AND STOCK VESTED
The following table sets forth certain information regarding options and stock awards exercised and vested, respectively, during 2006 for the persons named in the Summary Compensation Table above.
| | Option Awards(1)
| | Stock Awards
|
|---|
Name
| | Number of
Shares
Acquired on
Exercise (#)
| | Value
Realized on
Exercise ($)
| | Number of
Shares
Acquired on
Vesting (#)
| | Value
Realized on
Vesting ($)(2)
|
|---|
| Richard J. Alario | | — | | — | | 175,000 | | $ | 2,555,000 |
| William M. Austin | | — | | — | | 33,333 | | $ | 486,662 |
| Newton W. Wilson III | | — | | — | | 33,333 | | $ | 486,662 |
| Kim B. Clarke | | — | | — | | 8,333 | | $ | 121,662 |
| Jim D. Flynt | | — | | — | | — | | | — |
(1)The Company did not allow the exercise of any stock options during the fiscal year ended December 31, 2006.
(2)The value realized on vesting was calculated as the number of shares acquired on vesting multiplied by the closing price of the common stock on the vesting date. The closing price as quoted on the Pink Sheets on June 24, 2006 was $14.60.
Payments Upon Termination or Change in Control
The following table reflects the potential payments to which the NEOs would be entitled upon termination of employment on December 31, 2006. The closing price of a share of Key's common stock on December 29, 2006, the last trading day of the year, was $15.65. The actual amounts to be paid out to executives upon termination can only be determined at the time of each NEO's separation from the Company.
Name
| | Non-
Renewal(1)
| | For Cause or
Voluntary
Resignation(2)
| | Death(3)
| | Disability(4)
| | Without
Cause(5)
| | Change of
Control(6)
|
|---|
| Richard J. Alario | | | | | | | | | | | | | | | | | |
| | Cash Severance | | $ | 750,000 | | — | | | — | | $ | 2,250,000 | | $ | 2,250,000 | | $ | 4,500,000 |
| | Restricted Stock | | $ | 3,912,500 | | — | | $ | 3,912,500 | | $ | 3,912,500 | | $ | 3,912,500 | | $ | 3,912,500 |
| | Vested Options | | $ | 249,998 | | — | | $ | 249,998 | | $ | 249,998 | | $ | 249,998 | | $ | 249,998 |
| | Unvested Options | | $ | 500,003 | | — | | $ | 500,003 | | $ | 500,003 | | $ | 500,003 | | $ | 500,003 |
| | Unvested 401(k) Plan | | | — | | — | | $ | 7,062 | | $ | 7,062 | | | — | | $ | 7,062 |
| | Health & Welfare | | $ | 33,496 | | — | | $ | 77,622 | | $ | 54,756 | | $ | 54,756 | | $ | 77,622 |
| | Tax Gross-Ups | | | — | | — | | | — | | | — | | | — | | $ | 2,120,479 |
| Total Pre-Tax Benefit | | $ | 5,445,997 | | — | | $ | 4,747,185 | | $ | 6,974,319 | | $ | 6,967,257 | | $ | 11,367,664 |
Name
| | Non-
Renewal(1)
| | For Cause or
Voluntary
Resignation(2)
| | Death(3)
| | Disability(4)
| | Without
Cause(5)
| | Change of
Control(6)
|
|---|
| William M. Austin | | | | | | | | | | | | | | | | | |
| | Cash Severance | | $ | 420,000 | | — | | | — | | $ | 420,000 | | $ | 840,000 | | $ | 2,520,000 |
| | Restricted Stock | | $ | 1,825,839 | | — | | $ | 1,825,839 | | $ | 1,825,839 | | $ | 1,825,839 | | $ | 1,825,839 |
| | Vested Options | | $ | 512,000 | | — | | $ | 512,000 | | $ | 512,000 | | $ | 512,000 | | $ | 512,000 |
| | Unvested Options | | | — | | — | | | — | | | — | | | — | | | — |
| | Unvested 401(k) Plan | | | — | | — | | $ | 6,138 | | $ | 6,138 | | | — | | $ | 6,138 |
| | Health & Welfare | | | — | | — | | $ | 31,181 | | $ | 23,387 | | $ | 23,387 | | $ | 31,181 |
| | Tax Gross-Ups | | | — | | — | | | — | | | — | | | — | | $ | 1,132,023 |
| Total Pre-Tax Benefit | | $ | 2,757,839 | | — | | $ | 2,375,158 | | $ | 2,787,364 | | $ | 3,201,226 | | $ | 6,027,181 |
Name
| | Non-
Renewal(1)
| | For Cause or
Voluntary
Resignation(2)
| | Death(3)
| | Disability(4)
| | Without
Cause(5)
| | Change of
Control(6)
|
|---|
| Newton W. Wilson III | | | | | | | | | | | | | | | | | |
| | Cash Severance | | $ | 378,000 | | — | | | — | | $ | 378,000 | | $ | 756,000 | | $ | 2,268,000 |
| | Restricted Stock | | $ | 1,825,839 | | — | | $ | 1,825,839 | | $ | 1,825,839 | | $ | 1,825,839 | | $ | 1,825,839 |
| | Vested Options | | $ | 312,499 | | — | | $ | 312,499 | | $ | 312,499 | | $ | 312,499 | | $ | 312,499 |
| | Unvested Options | | $ | 156,251 | | — | | $ | 156,251 | | $ | 156,251 | | $ | 156,251 | | $ | 156,251 |
| | Unvested 401(k) Plan | | | — | | — | | $ | 10,966 | | $ | 10,966 | | | — | | $ | 10,966 |
| | Health & Welfare | | | — | | — | | $ | 20,566 | | $ | 15,424 | | $ | 15,424 | | $ | 20,566 |
| | Tax Gross-Ups | | | — | | — | | | — | | | — | | | — | | $ | 900,706 |
| Total Pre-Tax Benefit | | $ | 2,672,589 | | — | | $ | 2,326,121 | | $ | 2,698,979 | | $ | 3,066,013 | | $ | 5,494,827 |
Name
| | Non-
Renewal(1)
| | For Cause or
Voluntary
Resignation(2)
| | Death(3)
| | Disability(4)
| | Without
Cause(5)
| | Change of
Control(6)
|
|---|
| Kim B. Clarke(7) | | | | | | | | | | | | | | | | | |
| | Cash Severance | | $ | 250,000 | | — | | | — | | $ | 250,000 | | $ | 500,000 | | $ | 1,500,000 |
| | Restricted Stock | | $ | 808,509 | | — | | $ | 808,509 | | $ | 808,509 | | $ | 808,509 | | $ | 808,509 |
| | Vested Options | | $ | 32,997 | | — | | $ | 32,997 | | $ | 32,997 | | $ | 32,997 | | $ | 32,997 |
| | Unvested Options | | $ | 27,003 | | — | | $ | 27,003 | | $ | 27,003 | | $ | 27,003 | | $ | 27,003 |
| | Unvested 401(k) Plan | | | — | | — | | $ | 8,847 | | $ | 8,847 | | | — | | $ | 8,847 |
| | Health & Welfare | | | — | | — | | $ | 9,546 | | $ | 7,160 | | $ | 7,160 | | $ | 9,546 |
| Tax Gross-Ups | | | — | | — | | | — | | | — | | | — | | $ | 705,195 |
| Total Pre-Tax Benefit | | $ | 1,118,509 | | — | | $ | 886,902 | | $ | 1,134,516 | | $ | 1,375,669 | | $ | 3,092,097 |
Name
| | Non-
Renewal(1)
| | For Cause or
Voluntary
Resignation(2)
| | Death(3)
| | Disability(4)
| | Without
Cause(5)
| | Change of
Control(6)
| |
|---|
| Jim D. Flynt | | | | | | | | | | | | | | | | | | |
| | Cash Severance | | $ | 500,000 | | — | | $ | 500,000 | | $ | 500,000 | | $ | 500,000 | | $ | 500,000 | |
| | Restricted Stock | | | — | | — | | $ | 626,000 | (8) | $ | 626,000 | (8) | $ | 626,000 | (8) | $ | 626,000 | (8) |
| | Vested Options | | | — | | — | | | — | | | — | | | — | | $ | 1,503,088 | |
| | Unvested Options | | | — | | — | | | — | | | — | | | — | | $ | 7,500 | |
| | Unvested 401(k) Plan | | | — | | — | | | — | | | — | | | — | | | — | |
| | Health & Welfare | | | — | | — | | | — | | | — | | | — | | | — | |
| | Tax Gross-Ups | | | — | | — | | | — | | | — | | | — | | | — | |
| Total Pre-Tax Benefit | | $ | 500,000 | | | | $ | 1,126,000 | | $ | 1,126,000 | | $ | 1,126,000 | | $ | 2,636,588 | |
(1)Represents compensation payable if the Company does not renew the NEO's employment agreement after the initial term of the agreement.
(2)Represents compensation payable if the Company terminates the NEO's employment for cause or the NEO otherwise resigns without "Good Reason" as defined in the respective employment agreements.
(3)Represents compensation due to the NEO's estate upon his or her death.
(4)Represents compensation payable to NEO upon determination of NEO's permanent disability.
(5)Represents compensation due to NEO if terminated by the Company without "Cause" or if the NEO resigns for "Good Reason," as each such term is defined in the respective employment agreement.
(6)Represents payments due upon termination of employment following a "change of control" (as defined in the respective employment agreements or 1997 Incentive Plan) with respect to equity compensation. The cash severance is due in a lump sum payment. Also assumes that the target annual bonus is made, and that the 401(k) plan is terminated upon change of control.
(7)The benefits payable to Ms. Clarke are pursuant to her current employment agreement, which although was effective after December 31, 2006, we believe is a better representation of the benefits payable to Ms. Clarke for the purposes of this report.
(8)Represents payment under Phantom Stock Plan.
Elements of Severance Payments
The Company has entered into employment agreements with the NEOs that provide for certain payments upon termination depending upon the circumstances of the NEO's separation from the Company, as summarized below.
Cash Severance. If, during the term of Mr. Alario's employment agreement, he is terminated by the Company for any reason other than for "Cause," or if he terminates his employment because of a material breach by the Company, Mr. Alario will be entitled to severance compensation in an aggregate amount, generally equal to three times his base salary in effect at the time of termination payable in equal installments over a 36-month period following termination.
For Messrs. Austin and Wilson, and Ms. Clarke, if, during the term of the NEOs' employment agreement, the NEO is terminated by the Company for any reason other than for "Cause" or disability, or if the NEO terminates his or her employment because of a material breach by the Company, the NEO will be entitled to severance compensation in an aggregate amount, equal to two times the NEOs' base salary in effect at the time of termination payable in equal installments over a 24-month period following termination.
However, each of Messrs. Alario, Austin, Wilson and Ms. Clarke's employment agreement specifies that if termination is in anticipation of, or within one year following a change of control of the Company, the severance compensation will be an amount equal to three times their respective base salary then in effect plus an amount equal to three times their respective annual target cash bonus, and will be payable in one lump sum on the effective date of the termination.
If Mr. Flynt's employment is terminated by the Company for any reason other than for "Cause," including his death or non-renewal of his employment agreement, he will be entitled to the cash severance compensation in an aggregate amount equal to two times his base salary in effect at the time of termination payable in equal installments over a 24-month period following termination; provided, however, that if termination results within six months from a change of control of the Company or in anticipation of a change in control, the severance compensation will be payable in one lump sum on the date of termination.
In addition, other than Mr. Flynt, each of the NEOs is entitled to one year's base salary in the event the NEOs' employment agreement is not renewed by the Company. Further, none of the NEOs, other than Mr. Flynt, are entitled to cash severance compensation upon the NEOs' death. Mr. Flynt is entitled to two times his base salary then in effect upon either the non-renewal of his employment agreement or his death.
Restricted Stock. For Messrs. Austin and Wilson, and Ms. Clarke, if the NEO is terminated by the Company for any reason other than for "Cause," or if the NEO terminates his or her employment because of a material breach by the Company or following a change of control of the Company, any equity-based incentives held by the NEO that have not vested prior to the termination date shall immediately vest and all vested equity-based incentives shall remain exercisable until the earlier of the first anniversary date of the termination or the stated expiration date of the equity-based incentive. With respect to Mr. Alario, the equity-based incentives shall remain exercisable until the earlier of the third anniversary date of the termination or the stated expiration date of the equity-based incentive. Pursuant to the terms of the phantom stock grant, if Mr. Flynt's employment is terminated by any reason other than "Cause," he shall be immediately entitled to the payments due for the fair market value of the phantom shares.
Vested Options and Unvested Options. Other than termination for cause, all stock options held by the executives, other than Mr. Flynt, will become immediately vested and exercisable (to the extent not already vested and exercisable) for the remainder of the original terms of the options or until the second anniversary, or the third anniversary with respect to Mr. Alario, of the date of termination. Mr. Flynt's options become immediately vested and exercisable (to the extent not already vested and exercisable) only upon a change in control.
Unvested 401(k) Plan. For each NEO, the unvested portion of the company-match contribution to the 401(k) plan becomes fully vested upon death, retirement or disability. If the executive is terminated for any other reason, including without-cause, it is forfeited. Pursuant to the terms of the 401(k) plan, after an NEO has been employed by the Company for at least four years, all prior and future company-match 401(k) contributions are fully vested.
Health & Welfare. Other than Mr. Flynt, if the NEO terminates his or her employment because of a material breach by the Company or following a change in control or the Company terminates the NEO's employment for any reason other than for "Cause," the NEO will continue to receive the benefits that the NEO was receiving at the Company's expense until the earlier of (i) twenty-four months with respect to Messrs. Austin or Wilson and Ms. Clarke, or thirty-six months with respect to Mr. Alario, (ii) the last date of eligibility under the applicable benefits, or (iii) the date on which the NEO commences full-time employment with another employer that provides equivalent benefits; provided that, if termination occurs for any reason within one year of a change in control or in anticipation of a change of control, in lieu of such benefits the Company will pay an amount in cash equal to the aggregate reasonable expenses the Company would incur to pay such benefits. The Company's current benefit program provides for a maximum of eighteen months coverage after the date of termination. In the event of death, the executive's spouse is entitled to up to three years of coverage after the date of termination.
In addition, Mr. Alario is entitled to term-life insurance for such period that he is otherwise entitled to severance under his employment agreement.
Tax Gross-Ups. If any NEO, other than Mr. Flynt, is subject to the tax imposed due to unfavorable tax treatment under Sections 2806 and 4999 of the Internal Revenue Code because of any termination-related payments, the Company has agreed to reimburse the NEO for such tax on an after-tax basis.
Director Compensation
For 2006, the non-employee directors received a fee equal to $65,000 per year and an annual award of common stock of the Company having a fair market value of $85,000, and are reimbursed for travel and other expenses directly associated with Company business. Each non-employee director received the annual award of common stock in 2006, except for Mr. Wolkowitz, who declined such awards. The chairs of the Compensation Committee and the Corporate Governance and Nominating Committee each received an additional $10,000 per year for their service, and the chair of the Audit Committee and the Lead Director each received an additional $20,000 per year. All other members of the Audit Committee (other than the chair) receive an additional $10,000 per year.
The following table discloses the cash, equity awards and other compensation earned, paid or awarded, as the case may be, to each of the Company's non-employee directors during the fiscal year ended December 31, 2006.
Name
| | Fees Earned or
Paid in Cash ($)
| | Stock Awards ($)(1)
| | Total ($)
|
|---|
| David J. Breazzano | | $ | 95,000 | | $ | 85,000 | | $ | 180,000 |
| Kevin P. Collins | | | 75,000 | | | 85,000 | | | 160,000 |
| Daniel L. Dienstbier(2) | | | 65,000 | | | 170,000 | | | 235,000 |
| William D. Fertig | | | 75,000 | | | 85,000 | | | 160,000 |
| W. Phillip Marcum | | | 75,000 | | | 85,000 | | | 160,000 |
| Ralph S. Michael III | | | 85,000 | | | 85,000 | | | 170,000 |
| William F. Owens(3) | | | — | | | — | | | — |
| J. Robinson West | | | 65,000 | | | 85,000 | | | 150,000 |
| Morton Wolkowitz(4) | | | 65,000 | | | — | | | 65,000 |
(1)Represents the dollar amount of expense recognized by the Company for financial statement reporting purposes with respect to annual stock awards granted to the Directors under the 1997 Incentive Plan in accordance with SFAS 123(R). See Item 8. "Consolidated Financial Statements and Supplementary Data," Note 14—"Stockholders' Equity" for a discussion of the relevant assumptions used to determine the valuation of our stock for accounting purposes.
(2)Mr. Dienstbier also received an initial grant of common stock having a fair market value of $85,000 for joining the Board in January 2006. Mr. Dienstbier died in April 2007.
(3)Mr. Owens did not join our Board of Directors until January 2007, at which time he received an award of stock.
(4)Mr. Wolkowitz declined his annual stock grant.
COMPENSATION COMMITTEE REPORT
The Compensation Committee has reviewed and discussed the Compensation Discussion and Analysis with management. Based upon such review, the related discussions and such other matters deemed relevant and appropriate by the Compensation Committee, the Compensation Committee has recommended to the Board of Directors that the Compensation Discussion and Analysis be included in this Annual Report on Form 10-K.
David J. Breazzano (Chairman)
William D. Fertig
Ralph S. Michael, III
J. Robinson West
COMPENSATION COMMITTEE INTERLOCKS AND INSIDER PARTICIPATION
The Compensation Committee consists of Messrs. Breazzano (Chairman), Fertig, Michael, and West, all of whom are independent non-management directors. None of the Compensation Committee members has served as an officer or employee of the Company, and none of the Company's executive officers have served as a member of a compensation committee or board of directors of any other entity, which has an executive officer serving as a member of the Company's Board of Directors.
ITEM 12.Security Ownership of Certain Beneficial Owners and Management and Related Stockholder Matters
Set forth below is certain information with respect to beneficial ownership of the common stock as of July 31, 2007 by each director, the persons named in the Summary Compensation Table and the directors and executive officers as a group.
Name of Beneficial Owner
| | Number of
Shares(1)
| | Percentage of
Outstanding
Shares(2)
| |
|---|
| Richard J. Alario(3) | | 481,889 | | * | |
| David J. Breazzano(4) | | 337,571 | | * | |
| Kevin P. Collins(5) | | 272,643 | | * | |
| William D. Fertig(6) | | 122,571 | | * | |
| W. Phillip Marcum(7) | | 272,643 | | * | |
| Ralph S. Michael, III(8) | | 41,371 | | * | |
| William F. Owens | | 10,365 | | * | |
| J. Robinson West(9) | | 67,571 | | * | |
| Morton Wolkowitz(10) | | 825,045 | | * | |
| William M. Austin(11) | | 232,849 | | * | |
| Newton W. Wilson, III(12) | | 257,849 | | * | |
| Kim B. Clarke(13) | | 65,712 | | * | |
| Don D. Weinheimer(14) | | 26,600 | | * | |
| Phil Coyne(15) | | 10,000 | | * | |
| Jim D. Flynt(16) | | 196,667 | | * | |
| J. Marshall Dodson(17) | | 18,333 | | * | |
| D. Bryan Norwood(18) | | — | | * | |
| | |
| | | |
| Current Directors and Executive Officers as a group (17 persons) | | 3,239,679 | | 2.46 | % |
| | |
| | | |
*Less than 1%
(1)Includes all shares with respect to which each director or executive officer directly or indirectly, through any contract, arrangement, understanding, relationship or otherwise, has or shares the
power to vote or to direct voting of such shares and/or to dispose or to direct the disposition of such shares. Includes shares that may be purchased under currently exercisable stock options and warrants.
(2)Based on 131,593,695 shares of common stock outstanding at June 30, 2007, plus, for each beneficial owner, those numbers of shares underlying currently exercisable options held by each executive officer or director.
(3)Includes 133,333 shares issuable upon the exercise of vested options. Does not include 66,667 shares issuable pursuant to options that have not vested. Includes 200,000 shares of restricted stock that have not vested.
(4)Includes 250,000 shares issuable upon the exercise of vested options.
(5)Includes 250,000 shares issuable upon the exercise of vested options.
(6)Includes 100,000 shares issuable upon the exercise of vested options.
(7)Includes 250,000 shares issuable upon the exercise of vested options.
(8)Includes 20,000 shares issuable upon the exercise of vested options. Also includes 700 shares held jointly with Mr. Michael's spouse.
(9)Includes 50,000 shares issuable upon the exercise of vested options.
(10)Includes 237,000 shares issuable upon the exercise of vested options.
(11)Includes 100,000 shares issuable upon the exercise of vested options. Includes 83,334 shares of restricted stock that have not vested.
(12)Includes 125,000 shares issuable upon the exercise of vested options. Includes 83,334 shares of restricted stock that have not vested.
(13)Includes 11,666 shares issuable upon the exercise of vested options. Does not include 13,334 shares issuable pursuant to options that have not vested. Includes 43,334 shares of restricted stock that have not vested.
(14)Includes 25,000 shares of restricted stock that have not vested.
(15)Includes 10,000 shares issuable upon the exercise of vested options. Does not include 25,000 shares issuable pursuant to options that have not been vested.
(16)Includes 196,667 shares issuable upon the exercise of vested options. Does not include 12,500 shares issuable pursuant to options that have not vested or 500 shares held by Mr. Flynt's spouse.
(17)Includes 3,333 shares issuable upon the exercise of vested options. Does not include 31,667 shares issuable pursuant to options that have not vested. Includes 15,000 shares of restricted stock that have not vested.
(18)Does not include 10,000 shares issuable pursuant to options that have not vested.
Certain Beneficial Owners
The following table sets forth, as of July 31, 2007, certain information regarding the beneficial ownership of common stock by each person, other than the Company's directors or executive officers, who is known by the Company to own beneficially more than 5% of the outstanding shares of common stock.
| | Shares Beneficially Owned at
July 31, 2007
| |
|---|
Name and Address of Beneficial Owner
| |
|---|
| | Number
| | Percent
| |
|---|
| Guardian Life Insurance Company of America(1) | | 14,348,500 | | 10.9 | % |
| | 388 Market Street, Suite 1700 | | | | | |
| | San Francisco, CA 9411 | | | | | |
| MHR Fund Management LLC(2) | | 8,342,000 | | 6.3 | % |
| | 40 West 57th Street, 24th Floor | | | | | |
| | New York, NY 10019 | | | | | |
(1)As reported on Schedule 13G filed with the SEC on February 9, 2007, The Guardian Life Insurance Company of America ("Guardian") holds 14,348,500 shares. As a result of being subsidiaries of Guardian, Guardian Investor Services LLC and RS Investment Management Co, LLC may be deemed to be indirect beneficial owners of the shares held by Guardian.
(2)As reported on Schedule 13G filed with the SEC on July 19, 2007 on behalf of MHR Fund Management LLC and Mark H. Rachesky, M.D. relating to an aggregate amount of 8,342,000 shares held for the accounts of MHR Capital Partners Master Account LP, MHR Capital Partners (100) LP, MHR Institutional Partners II LP, MHR Institutional Partners IIA and MHR Institutional Partners III LP.
Equity Compensation Plan Information
The following table sets forth information as of December 31, 2006 with respect to compensation plans (including individual compensation arrangements) under which our common stock is authorized for issuance.
Plan Category
| | Number of securities to be
issued upon exercise of
outstanding options, warrants
and rights
(a)
| | Weighted-average exercise price of
outstanding options, warrants and
rights
(b)
| | Number of securities
remaining available for
future issuance under
equity compensation plans
(excluding securities
reflected in column (a))
(c)
|
|---|
| | (in thousands)
| |
| | (in thousands)
|
|---|
| Equity compensation plans approved by shareholders(1) | | 5,189 | | $ | 8.55 | | 1,638 |
| Equity compensation plans not approved by shareholders(2) | | 640 | | $ | 8.49 | | — |
| | |
| | | | |
|
| Total | | 5,829 | | | | | 1,638 |
(1)Represents options and other stock-based awards granted under the Key Energy Group, Inc. 1997 Incentive Plan (the "Plan").
(2)Represents non-statutory stock options granted outside the Plan. The options have a ten-year term and other terms and conditions as those options granted under the Plan. These options were issued during 2000 and 2001.
ITEM 13.Certain Relationships and Related Transactions, and Director Independence
Corporate Governance
The Board of Directors has adopted Corporate Governance Guidelines that address significant issues of corporate governance and set forth the procedures by which the Board carries out its responsibilities. Among the areas addressed by the Guidelines are director qualifications and responsibilities, Board committee responsibilities, director compensation and tenure, director orientation and continuing education, access to management and independent advisors, succession planning and management development, and Board and committee performance evaluations. The Corporate Governance and Nominating Committee is responsible for assessing and periodically reviewing the adequacy of these Guidelines and recommending proposed changes to the Board, as appropriate. The Guidelines are posted on the Company's website atwww.keyenergy.com. The Company will provide Guidelines in print, free of charge, to shareholders who request them.
Director Independence
Under the Corporate Governance Guidelines, at least a majority of the Board shall consist of directors that the Board has affirmatively determined have no direct or indirect material relationship with the Company and who are otherwise "independent" under the rules of the New York Stock Exchange. In addition, all members of the Audit Committee, Compensation Committee and Corporate Governance and Nominating Committee are also required to meet the applicable independence requirements set forth in the rules of the New York Stock Exchange and the SEC.
The Board has determined that, except for Mr. Alario, who serves as the President and Chief Executive Officer, each of our current directors is independent within the meaning of the foregoing rules.
Review of Related Party Transactions
In July 2007, the Executive Committee of the Board of Directors adopted a revised Affiliate Transaction Policy which requires advance review and approval of any proposed transactions (other than employee or director compensation) between the Company and an affiliate of the Company. For this purpose, affiliates include major shareholders, directors and executive officers and members of their immediate family (including in-laws), nominees for director, and affiliates of the foregoing persons, as determined in accordance with SEC rules. In determining whether to approve an affiliate transaction, the Board will use such process its deems reasonable in light of the circumstances, such as the nature of the transaction and the affiliate involved, and which may include an analysis of any auction process involved, an analysis of market comparables, use of an appraisal, obtaining an investment banking opinion or a review by independent counsel. Approval of a covered transaction requires a majority of the Board (other than interested directors). The policy requires the Board to determine that, under all of the circumstances, the covered transaction is in, or not inconsistent with, the best interests of the Company, and requires approval of covered transaction by a majority of the Board (other than interested directors). The Board, in its discretion, may delegate this authority to the Corporate Governance and Nominating Committee or another committee comprised solely of independent directors, as appropriate.
In addition, the Company requires on an annual basis that the directors and executive officers of the Company complete a Directors and Officers Questionnaire to describe certain information and relationships (including those involving their immediate family members) that may be required to be
disclosed in the Company's Form 10-K, annual proxy statement and other filings with the SEC. Director nominees and newly appointed executive officers must complete the questionnaire at or before the time they are nominated or appointed. If a change occurs in certain information required to be disclosed in the questionnaire after it is completed, the director or executive officer must immediately report this to the Company throughout the year, including changes in relationships between immediate family members and the Company, compensation paid from third parties for services rendered to the Company not otherwise disclosed, interests in certain transactions, and facts that could affect director independence. Directors are required to disclose in the questionnaire, among other things, any transaction that the director or any immediate family member has entered into with the Company or relationships that a director or an immediate family member has with the Company, whether direct or indirect. This information is provided to the Company's legal department for review and, if required, submitted to the Board for the process of determining independence.
For fiscal year ended December 31, 2006, Craig Owen, the son-in-law of Jim Flynt, our Senior Vice President—Western Region, served, and continues to serve, as a manager in our Rocky Mountain Division. Mr. Owen received approximately $137,000 in salary, bonus and benefits as of December 31, 2006. Mr. Owen has been with Key since 1980. We believe that Mr. Owen's compensation is comparable to what he would receive absent his relationship to Mr. Flynt.
ITEM 14.Principal Accountant Fees and Services
Effective December 1, 2006, Grant Thornton LLP was engaged as the Company's registered independent public accountant. Grant Thornton did not bill us prior to 2007. We estimate that we will incur approximately $8.0 million in audit fees in 2007 related to the audits of the three years ended December 31, 2006. We have not engaged Grant Thornton for services beyond the audit or review of our financial statements and internal control over financial reporting.
Prior to the engagement of Grant Thornton, KPMG LLP served as our registered independent public accountant in 2005 and until December 1, 2006. Audit fees paid prior to that date relate to our financial statements for 2003 and prior years. Our registered independent public accountants billed the Company for the aggregate fees set forth in the table below for services provided during 2006 and 2005.
| | 2006
| | 2005
|
|---|
| Grant Thornton LLP Audit Fees | | $ | — | | $ | — |
| KPMG LLP Audit Fees | | | 3,370,000 | | | 5,898,000 |
| KPMG LLP Audit-Related Fees | | | 5,960 | | | 150,000 |
| KPMG LLP Tax Fees | | | — | | | 175,556 |
| KPMG LLP All Other Fees | | | 46,486 | | | 19,324 |
| | |
| |
|
| Total | | $ | 3,422,446 | | $ | 6,242,880 |
| | |
| |
|
Audit fees include fees paid or to be paid by the Company for professional services rendered for the audit of the Company's annual financial statements, including the audit of the annual financial statements for the fiscal year ended December 31, 2003, audit services related to the Company's restatement of prior period financial statements, and services related to the audit of the Company's internal control over financial reporting.
Audit-related fees include fees paid or to be paid by the Company for assurance and related services that are reasonably related to the performance of the audit or review of the Company's financial statements and are not included in audit fees.
Tax fees include fees paid or to be paid by the Company for professional services rendered for tax compliance, tax advice, and tax planning.
All other fees include fees paid or to be paid by the Company for other services.
Policy for Approval of Audit and Non-Audit Fees. The Audit Committee has an Audit and Non-Audit Services Pre-Approval Policy. The policy requires the Audit Committee to pre-approve the audit and non-audit services performed by our independent auditor. Under the policy, the Audit Committee establishes the audit, audit-related, tax and all other services that have the approval of the Audit Committee. The term of any such pre-approval is 12 months from the date of pre-approval, unless the Audit Committee adopts a shorter period and so states. The Audit Committee will periodically review the list of pre-approved services and will add to or subtract from the list of pre-approved services from time to time. The Committee will also establish annually pre-approval fee levels or budgeted amounts for all services to be provided by the independent auditor. Any proposed services exceeding these levels or amounts will require specific pre-approval by the Audit Committee.
The Audit Committee has delegated to its Chair the authority to pre-approve services, not previously pre-approved by the Audit Committee, that involve aggregate payments (with respect to each such service or group of related services) of $10,000 or less. The Chair will report any such pre-approval to the Audit Committee at its next scheduled meeting.
The policy contains procedures for a determination by the CFO that proposed services are included within the list of services that have received pre-approval of the Audit Committee. Proposed services that require specific approval by the Audit Committee must be submitted jointly by the auditor and the CFO and must include backup statements and documentation regarding the proposed services and whether the proposed services are consistent with the SEC's rules on auditor independence.
The Audit Committee has considered whether the provision of certain non-audit services by Grant Thornton LLP is compatible with maintaining auditor independence and has determined that auditor independence has not been compromised.
PART IV
ITEM 15.Exhibits and Financial Statement Schedules
The following financial statements, schedules and exhibits are filed as part of this Report:
1.Financial Statements—See "Index to Consolidated Financial Statements" at Page F-1 below.
2.Financial Statement Schedules filed in Part IV of this Annual Report are listed below:
• Schedule II—Valuation and other Qualifying Accounts
We have omitted all other financial statement schedules because they are not required or are not applicable, or the required information is shown in the financial statements in notes to the financial statements.
EXHIBIT INDEX
Exhibit
No.
| | Description
|
|---|
2.1 | | Asset Purchase Agreement dated December 7, 2004 among the Company, Key Energy Drilling, Inc., Key Energy Drilling Beneficial, L.P., Key Four Corners, Inc. and Key Rocky Mountain Inc. and Patterson-UTI Drilling Company LP, LLLP. (Incorporated by reference to Exhibit 2.5 of the Company's Current Report on Form 8-K dated October 19, 2006, File No. 1-8038.) |
3.1* |
|
Articles of Restatement of the Company. |
3.2 |
|
Unanimous consent of the Board of Directors of the Company dated January 11, 2000, limiting the designation of the additional authorized shares to common stock. (Incorporated by reference to Exhibit 3.2 of the Company's Quarterly Report on Form 10-Q for the quarter ended March 31, 2000, File No. 1-8038.) |
3.3 |
|
Second Amended and Restated By-laws of Key Energy Services, Inc. (Incorporated by reference to Exhibit 3.1 of the Company's Form 8-K filed on September 22, 2006, File No. 1-8038.) |
4.1 |
|
Warrant Agreement dated as of January 22, 1999 between the Company and the Bank of New York, a New York banking corporation as warrant agent. (Incorporated by reference to Exhibit 99(b) of the Company's Form 8-K filed on February 3, 1999, File No. 1-8038.) |
4.2 |
|
Warrant Registration Rights Agreement dated January 22, 1999, by and among the Company and Lehman Brothers Inc., Bear, Stearns & Co., Inc., F.A.C. / Equities, a division of First Albany Corporation, and Dain Rauscher Wessels, a division of Dain Rauscher Incorporated. (Incorporated by reference to Exhibit 99(e) of the Company's Form 8-K filed on February 3, 1999, File No. 1-8038.) |
4.3 |
|
First Supplemental Indenture dated as of March 1, 2002 among the Registrant, the Guarantors (as defined therein) and U.S. Bank National Association. (Incorporated by reference to Exhibit 4.1 of the Company's Current Report on Form 8-K dated March 1, 2002, File No. 1-8038.) |
4.4 |
|
First Supplemental Indenture to the Indenture dated May 9, 2003, dated as of May 14, 2003 between the Company and U.S. Bank National Association, as Trustee. (Incorporated by reference to Exhibit 4.1 of the Company's Current Report on Form 8-K dated May 14, 2003, File No. 1-8038.) |
4.5 |
|
Consent Solicitation Statement of the Company dated July 6, 2004, regarding the solicitation of consents from the holders of its outstanding 6.375% senior notes due 2013 and 8.375% senior notes due 2008. (Incorporated by reference to Exhibit 99.2 of the Company's Current Report on Form 8-K dated July 7, 2004, File No. 1-8038.) |
4.6 |
|
Second Supplemental Indenture, dated as of July 12, 2004, between the Company and U.S. Bank National Association, as Trustee. (Incorporated by reference to Exhibit 4.2 of the Company's Current Report on Form 8-K dated October 19, 2006, File No. 1-8038.) |
4.7 |
|
Fourth Supplemental Indenture, dated as of July 12, 2004, among the Company, the Guarantors (as defined therein) and U.S. Bank National Association, as Trustee. (Incorporated by reference to Exhibit 4.3 of the Company's Current Report on Form 8-K dated October 19, 2006, File No. 1-8038.) |
| | |
4.8 |
|
Supplement to July 6, 2004 Consent Solicitation Statement of the Company, dated July 15, 2004 regarding the solicitation of consents from the holders of its outstanding 6.375% senior notes due 2013 and 8.375% senior notes due 2008. (Incorporated by reference to Exhibit 99.3 of the Company's Current Report on Form 8-K dated July 16, 2004, File No. 1-8038.) |
4.9 |
|
Third Supplemental Indenture, dated as of July 19, 2004, between the Company and U.S. Bank National Association, as Trustee. (Incorporated by reference to Exhibit 4.4 of the Company's Current Report on Form 8-K dated October 19, 2006, File No. 1-8038.) |
4.10 |
|
Fifth Supplemental Indenture, dated as of July 19, 2004, among the Company, the Guarantors (as defined therein) and U.S. Bank National Association, as Trustee. (Incorporated by reference to Exhibit 4.5 of the Company's Current Report on Form 8-K dated October 19, 2006, File No. 1-8038.) |
4.11 |
|
Consent Solicitation Statement of Key Energy Services, Inc. dated January 7, 2005, regarding the solicitation of consents from the holders of its outstanding 6.375% senior notes due 2013 and 8.375% senior notes due 2008. (Incorporated by reference to Exhibit 99.2 of the Company's Current Report on Form 8-K dated January 7, 2005, File No. 1-8038.) |
4.12 |
|
Fourth Supplemental Indenture dated as of January 19, 2005, among Key Energy Services, Inc., the guarantors party thereto and U.S. Bank National Association, as Trustee, with respect to the Company's 6.375% senior notes due 2008. (Incorporated by reference to Exhibit 4.1 of the Company's Current Report on Form 8-K dated January 24, 2005, File No. 1-8038.) |
4.13 |
|
Sixth Supplemental Indenture dated as of January 21, 2005, among Key Energy Services, Inc., the guarantors party thereto and U.S. Bank National Association, as Trustee, with respect to the Company's 8.375% senior notes due 2008. (Incorporated by reference to Exhibit 4.1 of the Company's Current Report on Form 8-K dated January 24, 2005, File No. 1-8038.) |
4.14 |
|
Fifth Supplemental Indenture dated as of April 5, 2005, among Key Energy Services, Inc., the guarantors party thereto and U.S. Bank National Association, as Trustee, with respect to the Company's 6.375% senior notes due 2013. (Incorporated by reference to Exhibit 4.2 of the Company's Current Report on Form 8-K dated April 7, 2005.) |
4.15 |
|
Seventh Supplemental Indenture dated as of April 5, 2005, among Key Energy Services, Inc., the guarantors party thereto and U.S. Bank National Association, as Trustee, with respect to the Company's 8.375% senior notes due 2008. (Incorporated by reference to Exhibit 4.3 of the Company's Current Report on Form 8-K dated April 7, 2005, File No. 1-8038.) |
10.1† |
|
Key Energy Group, Inc. 1997 Incentive Plan, as an amendment and restatement effective November 17, 1997 of the Key Energy Group, Inc. 1995 Outside Directors Stock Option Plan. (Incorporated by reference to Exhibit B of the Company's Schedule 14A Proxy Statement filed November 26, 1997, File No. 000-22665.) |
10.2† |
|
Employment Agreement between Key Energy Services, Inc. and Richard J. Alario dated effective as of May 1, 2004. (Incorporated by reference to Exhibit 10.2 of the Company's Current Report on Form 8-K dated October 19, 2006, File No. 1-8038.) |
10.3† |
|
First Amendment to the Employment Agreement between the Company and Richard J. Alario effective as of June 24, 2005. (Incorporated by reference to Exhibit 10.11 of the Company's Current Report on Form 8-K dated October 19, 2006, File No. 1-8038.) |
| | |
10.4† |
|
Acknowledgment and Waiver by Richard J. Alario dated March 25, 2005 regarding rescinded option grant. (Incorporated by reference to Exhibit 10.1 of the Company's Current Report on Form 8-K dated March 29, 2005.) |
10.5† |
|
Employment Agreement between Key Energy Services, Inc. and William M. "Bill" Austin dated as of March 1, 2005. (Incorporated by reference to Exhibit 10.1 of the Company's Current Report on Form 8-K dated March 7, 2005, File No. 1-8038.) |
10.6† |
|
First Amendment to the Employment Agreement between the Company and William M. Austin effective as of June 24, 2005. (Incorporated by reference to Exhibit 10.12 of the Company's Current Report on Form 8-K dated October 19, 2006, File No. 1-8038.) |
10.7† |
|
Employment Agreement between Key Energy Services, Inc. and Newton W. "Trey" Wilson III dated as of January 24, 2005. (Incorporated by reference to Exhibit 10.1 of the Company's Current Report on Form 8-K dated January 28, 2005, File No. 1-8038.) |
10.8† |
|
First Amendment to the Employment Agreement between the Company and Newton W. Wilson III effective as of June 24, 2005. (Incorporated by reference to Exhibit 10.13 of the Company's Current Report on Form 8-K dated October 19, 2006, File No. 1-8038.) |
10.9† |
|
Acknowledgment and Waiver by Newton W. Wilson III dated March 25, 2005 regarding rescinded option grant (Incorporated by reference to Exhibit 10.2 of the Company's Current Report on Form 8-K dated March 29, 2005.) |
10.10† |
|
Restated Employment Agreement dated effective as of January 1, 2007 between Kim B. Clarke and Key Energy Services, Inc. (Incorporated by reference to Exhibit 10.1 of the Company's Current Report on Form 8-K dated October 19, 2006, File No. 1-8038.) |
10.11† |
|
Employment Agreement between Key Energy Services, Inc. and Jim D. Flynt dated as of January 1, 2004. (Incorporated by reference to Exhibit 10.6 of the Company's Current Report on Form 8-K dated October 19, 2006, File No. 1-8038.) |
10.12† |
|
Employment Agreement between Key Energy Services, Inc. and Phil Coyne dated November 17, 2004. (Incorporated by reference to Exhibit 10.8 of the Company's Current Report on Form 8-K dated October 19, 2006, File No. 1-8038.) |
10.13† |
|
First Amendment to Employment Agreement between the Company and Phil Coyne effective as of January 24, 2005. (Incorporated by reference to Exhibit 10.9 of the Company's Current Report on Form 8-K dated October 19, 2006, File No. 1-8038.) |
10.14† |
|
Employment Agreement between Key Energy Services, Inc. and Don D. Weinheimer dated October 2, 2006. (Incorporated by reference to Exhibit 10.17 of the Company's Current Report on Form 8-K dated October 19, 2006, File No. 1-8038.) |
10.15†* |
|
Form of Restricted Stock Agreement under Key Energy Group, Inc. 1997 Incentive Plan. |
10.16 |
|
Third Amended and Restated Credit Agreement dated as of July 15, 2002, among Key Energy Services, Inc., the several lenders from time to time parties thereto, PNC Bank, National Association, as Administrative Agent, PNC Capital Markets, Inc., and Wells Fargo Bank (Texas), as Col-Lead Arrangers and Credit Lyonnais New York Bank, Lehman Commercial Paper, Inc., and Royal Bank of Canada, as the Documentation Agents. (Incorporated by reference to Exhibit 10.1 of the Company's Quarterly Report on Form 10-Q for the quarter ended September 30, 2002, File No. 1-8038). |
| | |
10.17 |
|
First Amendment, dated as of December 20, 2002, to the Third Amended and Restated Credit Facility, dates as of July 15, 2002, among Key Energy Services, Inc., the several lenders from time to time parties thereto, PNC Bank, National Association, as Administrative Agent, PNC Capital Markets, Inc., and Wells Fargo Bank (Texas), as Co-Lead Arrangers and Credit Lyonnais New York Bank, Lehman Commercial Paper, Inc., and Royal Bank of Canada, as the Documentation Agents. (Incorporated by reference to Exhibit 10.29 of the Company's Annual Transition Report on Form 10-KT, File No. 1-8038.) |
10.18 |
|
Second Amendment, dated May 9, 2003 to the Third Amended and Restated Credit Facility, dated as of July 15, 2002, among Key Energy Services, Inc., the several lenders from time to time parties thereto, PNC Bank, National Association, as Administrative Agent, PNC Capital Markets, Inc., and Wells Fargo Bank (Texas), as Co-Lead Arrangers and Credit Lyonnais New York Bank, Lehman Commercial Paper, Inc. and Royal Bank Canada, as the Documentation Agents. (Incorporated by reference to Exhibit 10.1 of the Company's Current Report on Form 8-K dated May 9, 2003, File No. 1-8038.) |
10.19 |
|
Fourth Amended and Restated Credit Agreement, dated as of June 7, 1997, as amended and restated through November 10, 2003, among the Company, the several Lenders from time to time parties thereto, the Guarantors, PNC Bank, National Association, as Administrative Agent, PNC Capital Markets, Inc. and Wells Fargo Bank Texas, as Co-Lead Arrangers, and Credit Lyonnais New York Branch, as Syndication Agent, Bank One N.A. and Comerica Bank, as Co-Documentation Agents. (Incorporated by reference to Exhibit 99.1 of the Company's Current Report on Form 8-K dated November 13, 2003, File No. 1-8038.) |
10.20 |
|
Waiver and First Amendment to Credit Agreement to Fourth Amended and Restated Credit Agreement dated as of April 5, 2004 by and among the Registrant, each of the Guarantors (as defined in the Credit Agreement), the Lenders (as defined in the Credit Agreement), PNC Bank, National Association, as Administrative Agent, PNC Capital Markets, Inc., and Wells Fargo Bank, National Association (successor-by-merger to Wells Fargo Bank Texas, National Association), as the Co-Lead Arrangers, and Credit Lyonnais New York Branch, as the Syndication Agent, and Bank One, NA and Comerica Bank, as the Co-Documentation Agents. (Incorporated by reference to Exhibit 99.2 of the Company's Form 8-K Report dated April 7, 2004, File No. 1-8038.) |
10.21 |
|
Modification of Waiver and Second Amendment to Fourth Amended and Restated Credit Agreement dated as of August 31, 2004 by and among the Company, each of the Guarantors (as defined in the Credit Agreement), the Lenders (as defined in the Credit Agreement), PNC Bank, National Association, as Administrative Agent, PNC Capital Markets, Inc., and Wells Fargo Bank, National Association (successor-by-merger to Wells Fargo Bank Texas, National Association), as the Co-Lead Arrangers, and Calyon New York Branch (successor by merger to Credit Lyonnais New York Branch), as the Syndication Agent, JPMorgan Chase Bank, N.A. and Comerica Bank, as the Co-Documentation Agents. (Incorporated by reference to Exhibit 99.1 of the Company's Current Report on Form 8-K Report dated September 7, 2004, File No. 1-8038.) |
| | |
10.22 |
|
Second Modification of Waiver and Third Amendment to Fourth and Restated Credit Agreement on December 17, 2004 by and among the Company, each of the Guarantors (as defined in the Credit Agreement), the Lenders (as defined in the Credit Agreement), PNC Bank, National Association, as Administrative Agent, PNC Capital Markets, Inc., and Wells Fargo Bank, National Association (successor- by-merger to Wells Fargo Bank Texas, National Association), as the Co-Lead Arrangers, and Calyon New York Branch (successor by merger to Credit Lyonnais New York Branch), as the Syndication Agent, JPMorgan Chase Bank, N.A. and Comerica Bank, as the Co-Documentation Agents. ((Incorporated by reference to Exhibit 99.1 of the Company's Current Report on Form 8-K Report dated December 22, 2004, File No. 1-8038.) |
10.23 |
|
Third Modification of Waiver and Fourth Amendment to Fourth Amended and Restated Credit Agreement dated as of March 30, 2005 by and among the Company, each of the Guarantors (as defined in the Credit Agreement), the Lenders (as defined in the Credit Agreement), PNC Bank, National Association, as Administrative Agent, PNC Capital Markets, Inc. and Wells Fargo Bank, National Association (successor-by-merger to Wells Fargo Bank Texas, National Association), as the Co-Lead Arrangers, and Calyon New York Branch (successor by merger to Credit Lyonnais New York Branch), as the Syndication Agent, JPMorgan Chase Bank, N.A. and Comerica Bank, as the Co-Documentation Agents. (Incorporated by reference Exhibit 10.1 of the Company's Current Report on Form 8-K dated April 5, 2003, File No. 1-8038.) |
10.24 |
|
Fourth Modification of Waiver and Fifth Amendment to the Fourth Amended and Restated Credit Agreement dated as of April 29, 2005 by and among the Company, each of the Guarantors (as defined in the Credit Agreement), the Lenders (as defined in the Credit Agreement), PNC Bank, National Association, as Administrative Agent, PNC Capital Markets, Inc. and Wells Fargo Bank, National Association (successor-by-merger to Wells Fargo Bank Texas, National Association) as the Co-Lead Arrangers, and Calyon New York Branch (successor-by-merger to Credit Lyonnais New York Branch), as the Syndication Agent, JPMorgan Chase Bank, N.A. and Comerica Bank, as the Co-documentation Agents, (Incorporated by reference to Exhibit 10.1 of the Company's Current Report on Form 8-K dated May 3, 2005.) |
10.25 |
|
Fifth Modification of Wavier and Sixth Amendment to the Fourth Amended and Restated Credit Agreement dates as of May 26, 2005 by and among the Company, each of the Guarantors (as defined in the Credit Agreement), the Lenders (as defined in the Credit Agreement), PNC Bank, National Association, as Administrative Agent, PNC Capital Markets, Inc. and Wells Fargo Bank, National Association (successor-by-merger to Wells Fargo Bank Texas, National Association) as the Co-Leas Arrangers, and Calyon New York Branch (successor-by-merger to Credit Lyonnais New York Branch), as the Syndication Agent, JPMorgan Chase Bank, N.A. and Comerica Bank, as the Co-Documentation Agents. (Incorporated by reference to Exhibit 10.1 of the Company's Current Report on Form 8-K dated June 1, 2005.) |
10.26 |
|
Agreement for Supply and Operation of Workover Rigs, Pulling Units, Vehicles, Other Equipment and Related Services by and between Apache Corporation and Registrant dated as of March 28, 2002. (Incorporated by reference to Exhibit 10.18 of the Company's Current Report on Form 8-K dated October 19, 2006, File No. 1-8038.) |
10.27 |
|
Office Lease effective as of January 20, 2005 between Crescent 1301 McKinney, L.P. and Key Energy Services, Inc. (Incorporated by reference to Exhibit 10.1 of the Company's Current Report on Form 8-K dated January 26, 2005, File No. 1-8038.) |
| | |
10.28 |
|
First Amendment to Office Lease dated as of March 15, 2005 between Crescent 1301 McKinney, L.P. and Key Energy Services, Inc. (Incorporated by reference to Exhibit 10.1 of the Company's Current Report on Form 8-K dated June 30, 2005, File No. 1-3038.) |
10.29 |
|
Commitment Letter dated June 1, 2005 between Lehman Brothers Inc., Lehman Commercial Paper Inc. and Key Energy Services, Inc. (Incorporated by reference to Exhibit 10.1 of the Company's Current Report on Form 8-K dated June 2, 2005, File No. 1-8038.) |
10.30 |
|
Second Amendment to Office Lease dated as of July 24, 2005 between Crescent 1301 McKinney, L.P. and Key Energy Services, Inc. (Incorporated by reference to Exhibit 10.2 of the Company's Current Report on Form 8-K dated June 30, 2005, File No. 1-8038.) |
10.31 |
|
Credit Agreement, dated as of June 29, 2005, among the Company, as Borrower, the several lenders from time to time party thereto, Lehman Brothers Inc., as sole lead arranger and sole book runner, Lehman Commercial Paper Inc., as syndication agent, administrative agent and as collateral agent, and Wells Fargo Foothill, Inc., as revolving administrative agent. (Incorporated by reference to Exhibit 10.1 of the Company's Current Report on Form 8-K dated August 4, 2005, File No. 1-8038.) |
10.32 |
|
First Amendment to Credit Agreement and First Amendment to Guaranty and Collateral Agreement dated as of November 1, 2005, among the Company, as Borrower, the Guarantors, the Lenders, and Lehman Commercial Paper Inc., as administrative agent for the Lenders and as Collateral Agent for the Lenders and other Secured Parties. (Incorporated by reference to Exhibit 10.1 of the Company's Current Report on Form 8-K dated November 7, 2005, File No. 1-8038.) |
10.33 |
|
Second Amendment to Credit Agreement dated as of November 21, 2006, among the Company, as Borrower, the Guarantors, the Lenders, and Lehman Commercial Paper Inc., as administrative agent for the Lenders and as Collateral Agent for the Lenders and other secured Parties. (Incorporated by reference to Exhibit 10.1 of the Company's Current Report on Form 8-K dated October 19, 2006, File No. 1-8038.) |
10.34† |
|
The 2006 Phantom Share Plan of Key Energy Services, Inc. (Incorporated by reference to Exhibit 10.1 of the Company's Current Report on Form 8-K dated October 19, 2006, File No. 1-8038.) |
10.35† |
|
Form of Award Agreement under the 2006 Phantom Share Plan of Key Energy Services, Inc. (Incorporated by reference to Exhibit 10.2 of the Company's Current Report on Form 8-K dated October 19, 2006, File No. 1-8038.) |
10.36 |
|
Third Amendment to Credit Agreement dated as of July 27, 2007, among the Company, as Borrower, the Guarantors, the Lenders and Lehman Commercial Paper, Inc., as administrative agent for the Lenders and as Collateral Agent for the Lenders and other Secured Parties. (Incorporated by reference to Exhibit 10.1 of the Company's Current Report on Form 8-K dated July 31, 2007, File No. 1-8038.) |
16.1 |
|
Letter dated December 7, 2006 from KPMG LLP. (Incorporated by reference to Exhibit 4.2 of the Company's Current Report on Form 8-K dated October 19, 2006, File No. 1-8038.) |
21* |
|
Significant Subsidiaries of the Company. |
31.1* |
|
Certification of CEO pursuant to Securities Exchange Act Rules 13a-14(a) and 15d-14(a), as adopted pursuant to Section 302 of the Sarbanes-Oxley Act. of 2002. |
| | |
31.2* |
|
Certification of CFO pursuant to Securities Exchange Act Rules 13a-14(a) and 15d-14(a), as adopted pursuant to Section 302 of the Sarbanes-Oxley Act of 2002. |
32* |
|
Certification of CEO and CFO pursuant to 18 U.S.C. Section 1350, as adopted pursuant to Section 906 of the Sarbanes-Oxley Act of 2002. |
†Indicates a management contract or compensatory plan, contract or arrangement in which any Director or any Executive Officer participates.
*Filed herewith.
SIGNATURES
Pursuant to the requirements of Section 13 of 15(d) of the Securities Exchange Act of 1934, the registrant has duly caused this report to be signed on its behalf by the undersigned, thereunto duly authorized.
Date: August 13, 2007 | | KEY ENERGY SERVICES, INC. |
|
|
By: |
/s/ WILLIAM M. AUSTIN
|
| | | William M. Austin, Senior Vice
President and Chief Financial Officer |
POWER OF ATTORNEY
Each person whose signature appears below hereby constitutes and appoints Richard J Alario and William M. Austin, and each of them, his true and lawful attorney-in-fact and agent, with full powers of substitution, for him and in his name, place and stead, in any and all capacities, to sign any and all amendments to this Annual Report on Form 10-K, and to file the same, with all exhibits thereto, and other documents in connection therewith, with the Securities and Exchange Commission granting to said attorneys-in-fact, and each of them, full power and authority to perform any other act on behalf of the undersigned required to be done in connection therewith.
Pursuant to the requirements of the Securities Exchange Act of 1934, this report has been signed below by the following persons on behalf of the registrant in the capacities and on the dates indicated.
Signature
| | Title
| | Date
|
|---|
|
|
|
|
|
/s/ RICHARD J. ALARIO
Richard J. Alario | | Chairman of the Board of Directors, President and Chief Executive Officer (Principal Executive Officer) | | August 13, 2007 |
/s/ WILLIAM M. AUSTIN
William M. Austin |
|
Senior Vice President and Chief Financial Officer
(Principal Financial Officer) |
|
August 13, 2007 |
/s/ J. MARSHALL DODSON
J. Marshall Dodson |
|
Vice President and Chief Accounting Officer
(Principal Accounting Officer) |
|
August 13, 2007 |
/s/ DAVID J. BREAZZANO
David J. Breazzano |
|
Director |
|
August 13, 2007 |
/s/ KEVIN P. COLLINS
Kevin P. Collins |
|
Director |
|
August 13, 2007 |
/s/ WILLIAM D. FERTIG
William D. Fertig |
|
Director |
|
August 13, 2007 |
/s/ W. PHILLIP MARCUM
W. Phillip Marcum |
|
Director |
|
August 13, 2007 |
/s/ RALPH S. MICHAEL, III
Ralph S. Michael, III |
|
Director |
|
August 13, 2007 |
| | | | |
/s/ WILLIAM F. OWENS
William F. Owens |
|
Director |
|
August 13, 2007 |
/s/ J. ROBINSON WEST
J. Robinson West |
|
Director |
|
August 13, 2007 |
/s/ MORTON WOLKOWITZ
Morton Wolkowitz |
|
Director |
|
August 13, 2007 |
INDEX TO CONSOLIDATED FINANCIAL STATEMENTS
REPORT OF INDEPENDENT REGISTERED PUBLIC ACCOUNTING FIRM
Board of Directors and Shareholders of
Key Energy Services, Inc.
We have audited the accompanying consolidated balance sheets of Key Energy Services, Inc. and subsidiaries (a Maryland corporation) as of December 31, 2006, 20052007 and 2004,2006, and the related consolidated statements of operations, comprehensive income, stockholders' equity, and cash flows for each of the three years in the period ended December 31, 2006.2007. These financial statements are the responsibility of the Company's management. Our responsibility is to express an opinion on these financial statements based on our audits.
We conducted our audits in accordance with the standards of the Public Company Accounting Oversight Board (United States). Those standards require that we plan and perform the audit to obtain reasonable assurance about whether the financial statements are free of material misstatement. An audit includes examining, on a test basis, evidence supporting the amounts and disclosures in the financial statements. An audit also includes assessing the accounting principles used and significant estimates made by management, as well as evaluating the overall financial statement presentation. We believe that our audits provide a reasonable basis for our opinion.
In our opinion, the consolidated financial statements referred to above present fairly, in all material respects, the financial position of Key Energy Services, Inc. and subsidiaries as of December 31, 2006, 20052007 and 2004,2006, and the results of their operations and their cash flows for each of the three years in the period ended December 31, 20062007 in conformity with accounting principles generally accepted in the United States of America.
As discussed in Note 1 to the consolidated financial statements, effective January 1, 2006, the Company adopted the provisions of Statement of Financial Accounting Standards No. 123 (revised 2004), "Share-Based Payments"."Share Based Payments."
As discussed in Note 1 to the consolidated financial statements, an error resultingeffective January 1, 2007, the Company adopted the provisions of Financial Accounting Standards Interpretation No. 48, "Accounting for Uncertainty in an overstatementIncome Taxes."
As discussed in Note 1 to the consolidated financial statements, effective January 1, 2007, the Company adopted the provisions of deferred tax liabilities and an overstatement of retained deficit previously reported as of December 31, 2003, was discovered by Company management during the current year. Accordingly, an adjustment has been made to retained deficit as of December 31, 2003 to correct the error.FSP EITF 00-19-2, "Accounting for Registration Payment Arrangements."
We also have audited, in accordance with the standards of the Public Company Accounting Oversight Board (United States), the effectiveness of Key Energy Services, Inc. and subsidiaries' internal control over financial reporting as of December 31, 2006,2007, based on criteria established inInternal Control—Integrated Framework issued by the Committee of Sponsoring Organizations of the Treadway Commission (COSO) and our report dated August 11, 2007February 26, 2008 expressed an unqualified opinion on management's assessment of the effectiveness of internal control over financial reporting and an adverse opinion on the effectiveness of internal control over financial reporting.
/s/ Grant ThorntonGRANT THORNTON LLP
Houston, Texas
August 11, 2007February 26, 2008
REPORT OF INDEPENDENT REGISTERED PUBLIC ACCOUNTING FIRM
Board of Directors and Shareholders of
Key Energy Services, Inc.
We have audited management's assessment, included in the accompanying Management's Report on Internal Control Over Financial Reporting, that Key Energy Services, Inc. and subsidiaries (a Maryland Corporation) did not maintain effectivecorporation) internal control over financial reporting as of December 31, 2006, because of the effect of the material weaknesses identified in management's assessment,2007, based on criteria established inInternal Control—Integrated Framework issued by the Committee of Sponsoring Organizations of the Treadway Commission (COSO). Key Energy Services, Inc. and subsidiaries' management is responsible for maintaining effective internal control over financial reporting and for its assessment of the effectiveness of internal control over financial reporting.reporting, included in the accompanying Management's Report on Internal Control Over Financial Reporting. Our responsibility is to express an opinion on management's assessmentKey Energy Services, Inc. and an opinion on the effectiveness of the company'ssubsidiaries' internal control over financial reporting based on our audit.
We conducted our audit in accordance with the standards of the Public Company Accounting Oversight Board (United States). Those standards require that we plan and perform the audit to obtain reasonable assurance about whether effective internal control over financial reporting was maintained in all material respects. Our audit included obtaining an understanding of internal control over financial reporting, evaluating management's assessment,assessing the risk that a material weakness exists, testing and evaluating the design and operating effectiveness of internal control based on the assessed risk, and performing such other procedures as we considered necessary in the circumstances. We believe that our audit provides a reasonable basis for our opinions.opinion.
A company's internal control over financial reporting is a process designed to provide reasonable assurance regarding the reliability of financial reporting and the preparation of financial statements for external purposes in accordance with generally accepted accounting principles. A company's internal control over financial reporting includes those policies and procedures that (1) pertain to the maintenance of records that, in reasonable detail, accurately and fairly reflect the transactions and dispositions of the assets of the company; (2) provide reasonable assurance that transactions are recorded as necessary to permit preparation of financial statements in accordance with generally accepted accounting principles, and that receipts and expenditures of the company are being made only in accordance with authorizations of management and directors of the company; and (3) provide reasonable assurance regarding prevention or timely detection of unauthorized acquisition, use, or disposition of the company's assets that could have a material effect on the financial statements.
Because of its inherent limitations, internal control over financial reporting may not prevent or detect misstatements. Also, projections of any evaluation of effectiveness to future periods are subject to the risk that controls may become inadequate because of changes in conditions, or that the degree of compliance with the policies or procedures may deteriorate.
A material weakness is a control deficiency, or combination of control deficiencies, in internal control over financial reporting, such that results in more thanthere is a remote likelihoodreasonable possibility that a material misstatement of the company's annual or interim financial statements will not be prevented or detected.detected on a timely basis. The following material weaknesses have been identified and included in management's assessment.
- A.
- Financial Close and Reporting: The Company determined that a material weakness existed with regard to their financial reporting and close process because the controls that were put in place to ensure completeness, accuracy, timeliness, appropriate valuation and proper presentation and disclosure of financial transactions were not in place until the fourth quarter of 2007. Due to the timing of the Company's controls being put in place, sufficient instances of the operating effectiveness of these controls had not occurred as of December 31, 2007.
- B.
- Authorizations of Expenditures: The Company determined that a material weakness existed due to its inability to ensure and evidence that expenditures,
including capital, operating and general and administrative expenses and changes in salaries and other payroll-related items,covering substantially all aspects
of spending, were approved by the appropriate level of management in accordance with the Company'stheir established policies. This is a result of a lack of a systematic process to ensure thatappropriate approvals for expenditure related transactions are reviewed and approved by the appropriate level of management.
B.Recognition of Expenditures: The Company determined that a material weakness existed for expenditures—consisting largely of individually immaterial corporate expenditures—that are not capturedeither made through the Company's procurement system as controls were not in place and operating effectively at December 31, 2006 to ensure that these expenses were properly accrued for and recorded inor made outside of the appropriate period. Additionally, the Company did not have sufficient controls in place to ensure that expenditures that were accrued through its procurement system were recorded in the correct period or that changes to amounts that were previously accrued through this system were appropriately adjusted and recorded in the appropriate period.
- C.
- Recording of Revenues: The Company determined that a material weakness existed
in itsregarding the recording of revenues as their revenue recognition and collection process, because that process is heavily dependent on manual reviews and approvals of credit terms, amounts to be billed and recorded and adjustments for bad debts. As a result, in many instances, evidence ofThese manual reviews and approvals wascould not maintained to ensure that work performed was billedbe adequately substantiated and recorded appropriately. Additionally, adequate controls were not in place atoperating effectively as of December 31, 2006 to ensure that amounts were recorded in the correct periods.2007.
- D.
- Property, Plant &
Equipment (PP&E):Equipment: The Company determined that a material weakness existed at December 31, 2006 becauserelated to the Company hadtiming of assets placed in service, timing of the recognition of gains and losses for asset dispositions, and the timing of and lack of appropriate approvals for asset dispositions. Due to the design and utilization of the Company's procurement system and practices, certain final costs for an asset may not established effective controls for recording PP&E, including associated depreciation expense and accumulated depreciation.be captured in a timely manner. As a result of this, the on-going restatement process,asset may be physically placed in service prior to all cost information being received. This delay in accumulating necessary cost information may delay the Company did not perform monthly accountingtiming of when an asset begins being depreciated. Additionally, evidence of appropriate approval for PP&E from the first quarterdisposition as well as the timing of 2004 through 2006. Accordingly, the Company's controls did not include monthly reconciliations, determinationreceipt of proprietythat information may result in delays in the recording of cost capitalization and disposals and computation of depreciation expense.the disposition to the appropriate reporting periods.
- E.
- User Developed Applications: The Company determined that a material weakness existed in the use of certain spreadsheets and database programs. In the course of preparing its consolidated financial statements, the Company employed numerous spreadsheets and database programs ("User Developed Applications"). The User Developed Applications are utilized in calculating estimates, reconciling payroll hours, tracking inventory costs and making cost allocations, among other things.
In the courseThe material weakness is a result of its testing, the Company identified numerous instances where these User Developed Applications were not being secured as to access, logical security, changes or data integrity.
- F.
- Application Access and Segregation of Duties: The Company determined that material weaknesses existed in four aspects of information technology general controls over security and segregation of duties of
itstheir primary financial systems. These include security administration procedures, administrator access privileges, database and file access and password controls. The weaknesses in these information technology general control areas were further evidenced by or related to deficiencies in various access controls at the financial reporting system level, causingresulting in inappropriate access and segregation of duties issues infor significant processes.
- G.
Account Reconciliations:Payroll: The Company determined that deficiencies surrounding their payroll process, in particular, adequacy of personnel involved in the process, lack of proper documentation concerning hours worked or rate changes coupled with deficiencies with reconciliations where payroll data was a major component constituted a material weakness existed in its processes to evidence timely and accurate preparation and reviewtheir system of account reconciliations, including calculations of underlying amounts recorded in the financial statements. Account reconciliations, including final underlying calculations, for numerous accounts were not prepared and evidenced in a timely manner. In preparing the consolidated financial statements contained in this annual report, the Company's accounting staff, hired throughout 2006, along with outside consultants, performed procedures to determine the appropriate amounts to record in the 2004 through 2006 periods. In the course of this process, the Company developed account reconciliations or other supporting calculations and documentation. The Company did not, however, in the course of its procedures, incur the time or expense necessary to follow, or document compliance with, control procedures identified with respect to such accounts.
H.Accounting for Income Taxes: The Company determined that a material weakness existed in its processes to account for income taxes, and to do so in a timely manner. Due to the significantinternal controls.
amount of changes implemented in the Company's processes, accounting for income taxes was not prepared and evidenced in a timely manner. In preparing the consolidated financial statements contained in this annual report, the Company's recently hired accounting staff, along with outside consultants, performed procedures to determine the appropriate amounts to record in the 2004 through 2006 periods. In the course of this process, the Company developed account reconciliations, roll-forwards or tax basis information and documentation. The Company did not, however, in the course of its procedures, incur the time or expense necessary to follow or document compliance with control procedures identified with respect to such accounts.
I.Financial Close and Reporting: The Company has determined that its previous processes for preparing the consolidated financial statements were not clearly defined and lacked appropriate controls to ensure the completeness, accuracy, timeliness, appropriate valuation, and proper presentation and disclosure of financial transactions. In preparing the consolidated financial statements contained in this annual report, the Company's recently hired accounting staff, along with outside consultants, performed procedures to determine the appropriate amounts to record in the 2004 through 2006 periods. In the course of this process, the Company developed methodologies and other supporting calculations and documentation. The Company did not, however, in the course of its procedures, incur the time or expense necessary to evidence compliance with its methodologies.
These material weaknesses were considered in determining the nature, timing, and extent of audit tests applied in our audit of the 2006 consolidated financial statements, and this report does not affect our report dated August 11, 2007, which expressed an unqualified opinion on those consolidated financial statements.
In our opinion, management's assessment that Key Energy Services, Inc. and subsidiaries did not maintain effective internal control over financial reporting as of December 31, 2006, is fairly stated, in all material respects, based onInternal Control—Integrated Framework issued by the Committee of Sponsoring Organizations of the Treadway Commission (COSO). Also in our opinion, because of the effect of the material weaknesses described above on the achievement of the objectives of the control criteria, Key Energy Services, Inc. and subsidiaries hashave not maintained effective internal control over financial reporting as of December 31, 2006,2007, based on criteria established inInternal Control—Integrated Framework issued by COSO.
We also have audited, in accordance with the Committee of Sponsoring Organizationsstandards of the Treadway Commission (COSO).Public Company Accounting Oversight Board (United States), the consolidated balance sheets, statements of operations, comprehensive income, stockholders' equity, and cash flows of Key Energy Services, Inc. and subsidiaries. The material weaknesses identified above were considered in determining the nature, timing, and extent of audit tests applied in our audit of the 2007 consolidated financial statements, and this report does not affect our report dated February 26, 2008, which expressed an unqualified opinion on those consolidated financial statements.
/s/ Grant ThorntonGRANT THORNTON LLP
Houston, Texas
August 11, 2007February 26, 2008
Key Energy Services, Inc. and Subsidiaries
Consolidated Balance SheetsCONSOLIDATED BALANCE SHEETS
(In thousands)thousands, except share data)
| |
| | December 31,
| |
|---|
|
| | December 31,
2006
| | December 31,
2005
| | December 31,
2004
| |
| | 2007
| | 2006
| |
|---|
| ASSETS | ASSETS | | | | | | | | | | | ASSETS | | | | | |
| Current assets: | Current assets: | | | | | | | | | | | Current assets: | | | | | |
| | Cash and cash equivalents | | $ | 88,375 | | $ | 94,170 | | $ | 20,425 | | Cash and cash equivalents | | $ | 58,503 | | $ | 88,375 | |
| | Short-term investments | | | 61,767 | | | — | | | — | | Short-term investments | | 276 | | 61,767 | |
| | Accounts receivable, net of allowance for doubtful accounts of $12,998, $10,843 and $8,990 at December 31, 2006, 2005 and 2004, respectively | | | 272,382 | | | 211,680 | | | 190,518 | | Accounts receivable, net of allowance for doubtful accounts of $13,501 and $12,998 at December 31, 2007 and 2006, respectively | | 343,408 | | 272,382 | |
| | Inventories | | | 19,505 | | | 17,254 | | | 19,069 | | Inventories | | 22,849 | | 19,505 | |
| | Prepaid expenses | | | 4,810 | | | 3,292 | | | 7,472 | | Prepaid expenses | | 12,997 | | 4,810 | |
| | Deferred tax assets | | | 35,968 | | | 23,912 | | | 48,823 | | Deferred tax assets | | 27,676 | | 35,968 | |
| | Other current assets | | | 5,176 | | | 6,854 | | | 5,758 | | Income taxes receivable | | 15,796 | | 642 | |
| | Current assets of discontinued operations | | | 623 | | | 658 | | | 18,958 | | Other current assets | | 6,360 | | 5,157 | |
| | | |
| |
| |
| | | |
| |
| |
| Total current assets | Total current assets | | | 488,606 | | | 357,820 | | | 311,023 | | Total current assets | | 487,865 | | 488,606 | |
| | | |
| |
| |
| | | |
| |
| |
| Property and equipment: | | | | | | | | | | | |
| | Well servicing equipment | | | 1,020,569 | | | 856,455 | | | 770,001 | | |
| | Contract drilling equipment | | | 16,624 | | | 25,583 | | | 21,916 | | |
| | Motor vehicles | | | 105,858 | | | 91,910 | | | 87,189 | | |
| | Furniture and equipment | | | 78,143 | | | 70,485 | | | 72,040 | | |
| | Buildings and land | | | 58,786 | | | 45,393 | | | 48,268 | | |
| | |
| |
| |
| | |
| Total property and equipment | | | 1,279,980 | | | 1,089,826 | | | 999,414 | | |
| Property and equipment, gross | | Property and equipment, gross | | 1,595,225 | | 1,279,980 | |
| Accumulated depreciation | Accumulated depreciation | | | (585,689 | ) | | (479,485 | ) | | (401,636 | ) | Accumulated depreciation | | (684,017 | ) | | (585,689 | ) |
| | | |
| |
| |
| | | |
| |
| |
| Net property and equipment | | | 694,291 | | | 610,341 | | | 597,778 | | |
| Property and equipment, net | | Property and equipment, net | | 911,208 | | 694,291 | |
| | | |
| |
| |
| | | |
| |
| |
| Goodwill | Goodwill | | | 320,912 | | | 320,922 | | | 320,942 | | Goodwill | | 378,550 | | 320,912 | |
| Deferred costs, net | | | 9,952 | | | 11,093 | | | 9,068 | | |
| Other intangible assets, net | | Other intangible assets, net | | 45,894 | | 3,346 | |
| Deferred financing costs, net | | Deferred financing costs, net | | 12,117 | | 9,952 | |
| Notes and accounts receivable—related parties | Notes and accounts receivable—related parties | | | 287 | | | 151 | | | 101 | | Notes and accounts receivable—related parties | | 173 | | 287 | |
| Investment in IROC Systems Corp | | Investment in IROC Systems Corp | | 11,217 | | 10,661 | |
| Other assets | Other assets | | | 27,350 | | | 28,917 | | | 17,130 | | Other assets | | 12,053 | | 13,343 | |
Non-current assets of discontinued operations |
|
|
— |
|
|
— |
|
|
60,580 |
| |
| | | |
| |
| |
| | | |
| |
| |
| TOTAL ASSETS | TOTAL ASSETS | | $ | 1,541,398 | | $ | 1,329,244 | | $ | 1,316,622 | | TOTAL ASSETS | | $ | 1,859,077 | | $ | 1,541,398 | |
| | | |
| |
| |
| | | |
| |
| |
| LIABILITIES AND STOCKHOLDERS' EQUITY | LIABILITIES AND STOCKHOLDERS' EQUITY | | | | | | | | | | |
LIABILITIES AND STOCKHOLDERS' EQUITY |
|
|
|
|
|
| Current liabilities: | Current liabilities: | | | | | | | | | | | Current liabilities: | | | | | |
| | Accounts payable | | $ | 15,294 | | $ | 14,633 | | $ | 14,464 | | Accounts payable | | $ | 35,159 | | $ | 15,294 | |
| | Accrued payroll, taxes and employee benefits | | | 64,876 | | | 43,691 | | | 36,218 | | Accrued liabilities | | 183,364 | | 189,570 | |
| | Accrued operating expenditures | | | 40,150 | | | 39,964 | | | 24,385 | | Accrued interest | | 3,895 | | 2,530 | |
| | Unsettled legal claims | | | 28,754 | | | 11,249 | | | 5,823 | | Current portion of capital lease obligations | | 10,701 | | 11,714 | |
| | Income, sales, use and other taxes | | | 30,282 | | | 31,331 | | | 21,881 | | Current notes payable—related party, net of discount | | 1,678 | | — | |
| | Workers' compensation claims accrual | | | 17,325 | | | 19,852 | | | 14,684 | | Current portion of long-term debt | | — | | 4,000 | |
| | Other accrued liabilities | | | 8,164 | | | 8,748 | | | 6,376 | | | |
| |
| |
| | Accrued interest | | | 2,530 | | | 6,399 | | | 9,980 | | |
| | Current portion of capital lease obligations | | | 11,714 | | | 8,639 | | | 6,354 | | |
| | Current portion of long-term debt | | | 4,000 | | | 4,000 | | | — | | |
| | Current liabilities of discontinued operations | | | 19 | | | 292 | | | 4,938 | | |
| | |
| |
| |
| | |
| Total current liabilities | Total current liabilities | | | 223,108 | | | 188,798 | | | 145,103 | | Total current liabilities | | 234,797 | | 223,108 | |
| | | |
| |
| |
| | | |
| |
| |
| Capital lease obligations, less current portion | Capital lease obligations, less current portion | | | 14,080 | | | 14,781 | | | 7,177 | | Capital lease obligations, less current portion | | 16,114 | | 14,080 | |
| Notes payable—related party, less current portion | | Notes payable—related party, less current portion | | 20,500 | | — | |
| Long-term debt, less current portion | Long-term debt, less current portion | | | 392,000 | | | 396,000 | | | 473,870 | | Long-term debt, less current portion | | 475,000 | | 392,000 | |
| Workers' compensation, vehicular, health and other insurance claims | Workers' compensation, vehicular, health and other insurance claims | | | 44,617 | | | 38,311 | | | 35,829 | | Workers' compensation, vehicular, health and other insurance claims | | 43,818 | | 44,617 | |
| Deferred tax liability | | | 115,826 | | | 96,572 | | | 107,760 | | |
| Other non-current accrued expenses | | | 21,256 | | | 40,725 | | | 41,217 | | |
| Deferred tax liabilities | | Deferred tax liabilities | | 160,068 | | 115,826 | |
| Other non-current accrued liabilities | | Other non-current accrued liabilities | | 19,531 | | 21,256 | |
| Minority interest | | Minority interest | | 251 | | — | |
| Commitments and contingencies | Commitments and contingencies | | | — | | | — | | | — | |
Commitments and contingencies |
|
|
|
|
|
Stockholders' equity: |
Stockholders' equity: |
|
|
|
|
|
|
|
|
|
|
Stockholders' equity: |
|
|
|
|
|
| | Common stock, $0.10 par value; 200,000,000 shares authorized, 131,624,038, 131,334,196 and 130,791,338 shares issued and outstanding at December 31, 2006, 2005 and 2004, respectively | | | 13,212 | | | 13,175 | | | 13,121 | | |
| | Additional paid-in capital | | | 722,610 | | | 716,389 | | | 713,563 | | Common stock, $0.10 par value; 200,000,000 shares authorized, 131,142,905 and 131,624,038 shares issued and outstanding at December 31, 2007 and 2006, respectively | | 13,114 | | 13,162 | |
| | Treasury stock, at cost; 497,501, 416,666 and 416,666 shares at December 31, 2006, 2005, and 2004, respectively | | | (10,862 | ) | | (9,682 | ) | | (9,682 | ) | Additional paid-in capital | | 704,644 | | 711,798 | |
| | Accumulated other comprehensive loss | | | (36,284 | ) | | (36,627 | ) | | (36,421 | ) | Accumulated other comprehensive loss | | (37,981 | ) | | (36,284 | ) |
| | Retained earnings (deficit) | | | 41,835 | | | (129,198 | ) | | (174,915 | ) | Retained earnings | | 209,221 | | 41,835 | |
| | | |
| |
| |
| | | |
| |
| |
| Total stockholders' equity | Total stockholders' equity | | | 730,511 | | | 554,057 | | | 505,666 | | Total stockholders' equity | | 888,998 | | 730,511 | |
| | | |
| |
| |
| | | |
| |
| |
| TOTAL LIABILITIES AND STOCKHOLDERS' EQUITY | TOTAL LIABILITIES AND STOCKHOLDERS' EQUITY | | $ | 1,541,398 | | $ | 1,329,244 | | $ | 1,316,622 | | TOTAL LIABILITIES AND STOCKHOLDERS' EQUITY | | $ | 1,859,077 | | $ | 1,541,398 | |
| | | |
| |
| |
| | | |
| |
| |
See the accompanying notes which are an integral part of these consolidated financial statements
Key Energy Services, Inc. and Subsidiaries
Consolidated Statements of OperationsCONSOLIDATED STATEMENTS OF OPERATIONS
(In thousands, except per share data)
|
| | Year Ended December 31,
| |
| | Year Ended December 31,
| |
|---|
|
| | 2006
| | 2005
| | 2004
| |
| | 2007
| | 2006
| | 2005
| |
|---|
| REVENUES: | REVENUES: | | | | | | | | REVENUES: | | | | | | | |
| | Well servicing | | $ | 1,201,228 | | $ | 956,457 | | $ | 818,001 | | Well servicing | | $ | 1,264,797 | | $ | 1,201,228 | | $ | 956,457 | |
| | Pressure pumping | | 247,489 | | 152,320 | | 91,226 | | Pressure pumping | | 299,348 | | 247,489 | | 152,320 | |
| | Fishing and rental services | | 97,460 | | 81,667 | | 78,512 | | Fishing and rental | | 97,867 | | 97,460 | | 81,667 | |
| | | |
| |
| |
| | | |
| |
| |
| |
| Total revenues | Total revenues | | 1,546,177 | | 1,190,444 | | 987,739 | | Total revenues | | 1,662,012 | | 1,546,177 | | 1,190,444 | |
| | | |
| |
| |
| | | |
| |
| |
| |
| COSTS AND EXPENSES: | COSTS AND EXPENSES: | | | | | | | |
COSTS AND EXPENSES: |
|
|
|
|
|
|
|
| | Well servicing | | 736,014 | | 635,442 | | 571,032 | | Well servicing | | 738,694 | | 725,008 | | 634,043 | |
| | Pressure pumping | | 141,743 | | 92,323 | | 69,156 | | Pressure pumping | | 189,645 | | 138,377 | | 92,301 | |
| | Fishing and rental services | | 60,073 | | 54,361 | | 49,792 | | Fishing and rental | | 57,275 | | 57,217 | | 53,899 | |
| | Depreciation and amortization | | 126,011 | | 111,888 | | 103,339 | | Depreciation and amortization | | 129,623 | | 126,011 | | 111,888 | |
| | General and administrative | | 178,299 | | 149,420 | | 157,573 | | General and administrative | | 230,396 | | 195,527 | | 151,303 | |
| | Interest expense | | 38,927 | | 50,299 | | 46,206 | | Interest expense, net of amounts capitalized | | 36,207 | | 38,927 | | 50,299 | |
| | Loss on early extinguishment of debt | | — | | 20,918 | | 12,025 | | Loss on early extinguishment of debt | | 9,557 | | — | | 20,918 | |
| | (Gain) loss on sale of assets | | (4,323 | ) | | (656 | ) | | 8,040 | | Loss (gain) on sale of assets, net | | 1,752 | | (4,323 | ) | | (656 | ) |
| | Interest income | | (5,574 | ) | | (2,713 | ) | | (660 | ) | Interest income | | (6,630 | ) | | (5,574 | ) | | (2,713 | ) |
| | Other, net | | 527 | | (5,236 | ) | | (291 | ) | Other (income) expense, net | | (447 | ) | | 527 | | (5,236 | ) |
| | | |
| |
| |
| | | |
| |
| |
| |
| Total costs and expenses, net | Total costs and expenses, net | | 1,271,697 | | 1,106,046 | | 1,016,212 | | Total costs and expenses, net | | 1,386,072 | | 1,271,697 | | 1,106,046 | |
| | | |
| |
| |
| | | |
| |
| |
| |
| Income (loss) from continuing operations before income taxes | | 274,480 | | 84,398 | | (28,473 | ) | |
| Income tax (expense) benefit | | (103,447 | ) | | (35,320 | ) | | 1,890 | | |
| Income from continuing operations before income taxes | | Income from continuing operations before income taxes | | 275,940 | | 274,480 | | 84,398 | |
| Income tax expense | | Income tax expense | | (106,768 | ) | | (103,447 | ) | | (35,320 | ) |
| Minority interest | | Minority interest | | 117 | | — | | — | |
| | | |
| |
| |
| | | |
| |
| |
| |
| INCOME (LOSS) FROM CONTINUING OPERATIONS | | 171,033 | | 49,078 | | (26,583 | ) | |
| INCOME FROM CONTINUING OPERATIONS | | INCOME FROM CONTINUING OPERATIONS | | 169,289 | | 171,033 | | 49,078 | |
| | | |
| |
| |
| | | |
| |
| |
| |
| Discontinued operations, net of tax (expense) benefit of $0, $(4,590) and $2,285, respectively | | — | | (3,361 | ) | | (5,643 | ) | |
| Loss from discontinued operations, net of income tax expense of $4,590 | | Loss from discontinued operations, net of income tax expense of $4,590 | | — | | — | | (3,361 | ) |
| | | |
| |
| |
| | | |
| |
| |
| |
| NET INCOME (LOSS) | | $ | 171,033 | | $ | 45,717 | | $ | (32,226 | ) | |
| NET INCOME | | NET INCOME | | $ | 169,289 | | $ | 171,033 | | $ | 45,717 | |
| | | |
| |
| |
| | | |
| |
| |
| |
| EARNINGS (LOSS) PER SHARE: | EARNINGS (LOSS) PER SHARE: | | | | | | | |
EARNINGS (LOSS) PER SHARE: |
|
|
|
|
|
|
|
| | Net income (loss) from continuing operations | | | | | | | | Net income from continuing operations: | | | | | | | |
| | Basic | | $ | 1.30 | | $ | 0.37 | | $ | (0.20 | ) | Basic | | $ | 1.29 | | $ | 1.30 | | $ | 0.37 | |
| | Diluted | | $ | 1.28 | | $ | 0.37 | | $ | (0.20 | ) | Diluted | | $ | 1.27 | | $ | 1.28 | | $ | 0.37 | |
| |
Discontinued Operations, net of tax |
|
|
|
|
|
|
|
Discontinued operations, net of tax: |
|
|
|
|
|
|
|
| | Basic | | $ | — | | $ | (0.03 | ) | $ | (0.04 | ) | Basic | | $ | — | | $ | — | | $ | (0.03 | ) |
| | Diluted | | $ | — | | $ | (0.03 | ) | $ | (0.04 | ) | Diluted | | $ | — | | $ | — | | $ | (0.03 | ) |
| |
Net Income (loss) |
|
|
|
|
|
|
|
Net income: |
|
|
|
|
|
|
|
| | Basic | | $ | 1.30 | | $ | 0.34 | | $ | (0.24 | ) | Basic | | $ | 1.29 | | $ | 1.30 | | $ | 0.34 | |
| | Diluted | | $ | 1.28 | | $ | 0.34 | | $ | (0.24 | ) | Diluted | | $ | 1.27 | | $ | 1.28 | | $ | 0.34 | |
WEIGHTED AVERAGE SHARES OUTSTANDING: |
|
|
|
|
|
|
| |
WEIGHTED AVERAGE SHARES OUTSTANDING: | |
WEIGHTED AVERAGE SHARES OUTSTANDING: |
|
|
|
|
|
|
|
| | Basic | | 131,332 | | 131,075 | | 130,757 | | Basic | | 131,194 | | 131,332 | | 131,075 | |
| | Diluted | | 134,064 | | 133,595 | | 130,757 | | Diluted | | 133,551 | | 134,064 | | 133,595 | |
See the accompanying notes which are an integral part of these consolidated financial statements
Key Energy Services, Inc. and Subsidiaries
Consolidated Statements of Comprehensive Income (Loss)CONSOLIDATED STATEMENTS OF COMPREHENSIVE INCOME
(inIn thousands)
| | Year Ended December 31,
| |
|---|
| | 2006
| | 2005
| | 2004
| |
|---|
| NET INCOME (LOSS) | | $ | 171,033 | | $ | 45,717 | | $ | (32,226 | ) |
OTHER COMPREHENSIVE INCOME (LOSS), NET OF TAX: |
|
|
|
|
|
|
|
|
|
|
| | Foreign currency translation loss | | | (51 | ) | | (206 | ) | | (303 | ) |
| | Deferred gain from cash flow hedges | | | 213 | | | — | | | — | |
| | Deferred gain from available for sale investments | | | 181 | | | — | | | — | |
| | |
| |
| |
| |
| COMPREHENSIVE INCOME (LOSS), NET OF TAX | | $ | 171,376 | | $ | 45,511 | | $ | (32,529 | ) |
| | |
| |
| |
| |
| | Year Ended December 31,
| |
|---|
| | 2007
| | 2006
| | 2005
| |
|---|
| NET INCOME | | $ | 169,289 | | $ | 171,033 | | $ | 45,717 | |
OTHER COMPREHENSIVE INCOME (LOSS), NET OF TAX: |
|
|
|
|
|
|
|
|
|
|
| | Foreign currency translation loss | | | (1,281 | ) | | (51 | ) | | (206 | ) |
| | Deferred gain from cash flow hedges | | | — | | | 213 | | | — | |
| | Deferred (loss) gain from short-term investments | | | (22 | ) | | 181 | | | — | |
| | |
| |
| |
| |
| COMPREHENSIVE INCOME, NET OF TAX | | $ | 167,986 | | $ | 171,376 | | $ | 45,511 | |
| | |
| |
| |
| |
See the accompanying notes which are an integral part of these consolidated financial statements
Key Energy Services, Inc. and Subsidiaries
Consolidated Statements of Cash FlowsCONSOLIDATED STATEMENTS OF CASH FLOWS
(inIn thousands)
|
| | Year Ended December 31,
| |
| | Year Ended December 31,
| |
|---|
|
| | 2006
| | 2005
| | 2004
| |
| | 2007
| | 2006
| | 2005
| |
|---|
| CASH FLOWS FROM OPERATING ACTIVITIES: | CASH FLOWS FROM OPERATING ACTIVITIES: | | | | | | | | | | | CASH FLOWS FROM OPERATING ACTIVITIES: | | | | | | | |
| | | Net income | | $ | 169,289 | | $ | 171,033 | | $ | 45,717 | |
| | | Adjustments to reconcile net income to net cash provided by operating activities: | | | | | | | |
| | | | Minority interest | | (117 | ) | | — | | — | |
| |
Net income (loss) |
|
$ |
171,033 |
|
$ |
45,717 |
|
$ |
(32,226 |
) | | Depreciation and amortization | | 129,623 | | 126,011 | | 111,888 | |
| |
Adjustments to reconcile net income (loss) to net cash provided by operating activities: |
|
|
|
|
|
|
|
|
|
| | Accretion of asset retirement obligations | | 585 | | 508 | | 511 | |
| | |
Depreciation and amortization |
|
|
126,011 |
|
|
111,888 |
|
|
103,339 |
| | Income from equity-method investment in IROC Systems Corp | | (387 | ) | | (416 | ) | | (467 | ) |
| | | Accretion of asset retirement obligations | | | 508 | | | 511 | | | 527 | | | Amortization of deferred financing costs, discount and premium | | 1,680 | | 1,620 | | 1,351 | |
| | | Income from equity investment | | | (416 | ) | | (467 | ) | | (55 | ) | | Deferred income tax expense | | 24,613 | | 6,757 | | 13,723 | |
| | | Amortization of deferred issuance costs, discount and premium | | | 1,620 | | | 1,351 | | | 2,093 | | | Capitalized interest | | (5,296 | ) | | (3,358 | ) | | (1,266 | ) |
| | | Deferred income tax expense (benefit) | | | 6,757 | | | 13,723 | | | (10,874 | ) | | Loss (gain) on sale of assets, net | | 1,752 | | (4,323 | ) | | (656 | ) |
| | | Capitalized interest | | | (3,358 | ) | | (1,266 | ) | | (2,306 | ) | | Loss on early extinguishment of debt | | 9,557 | | — | | 20,918 | |
| | | (Gain) loss on sale of assets | | | (4,323 | ) | | (656 | ) | | 8,040 | | | Stock-based compensation | | 9,355 | | 6,345 | | 2,787 | |
| | | Loss on early extinguishment of debt | | | — | | | 20,918 | | | 12,025 | | | Excess tax benefits from stock-based compensation | | (3,401 | ) | | — | | — | |
| | | Stock-based compensation | | | 6,345 | | | 2,787 | | | 928 | | Changes in working capital: | | | | | | | |
| | | Amortization of deferred gain on sale-leaseback transactions | | | (159 | ) | | (53 | ) | | — | | | Accounts receivable, net | | (44,712 | ) | | (60,801 | ) | | (21,560 | ) |
| | | Accrual for former officers' termination | | | — | | | — | | | 30,232 | | | Stock-based compensation liability awards | | 3,701 | | — | | — | |
| |
Changes in working capital: |
|
|
|
|
|
|
|
|
|
| | Other current assets | | (424 | ) | | 976 | | 5,836 | |
| | |
Accounts receivable, net |
|
|
(60,801 |
) |
|
(21,560 |
) |
|
(47,256 |
) | | Accounts payable, accrued interest and accrued expenses | | (1,360 | ) | | 35,138 | | 42,577 | |
| | | Other current assets | | | 493 | | | 5,889 | | | (3,395 | ) | | Income tax refund receivable | | (15,154 | ) | | (642 | ) | | — | |
| | | Accounts payable, accrued interest and accrued expenses | | | 35,138 | | | 42,577 | | | (2,374 | ) | | Cash paid for legal settlement | | (21,200 | ) | | — | | — | |
| |
Other assets and liabilities |
|
|
(19,886 |
) |
|
(16,278 |
) |
|
8,871 |
| Other assets and liabilities | | (8,185 | ) | | (20,124 | ) | | (16,278 | ) |
| |
Operating cash flows (used by) provided by discontinued operations |
|
|
(238 |
) |
|
13,757 |
|
|
2,232 |
| Operating cash flows provided by discontinued operations | | — | | — | | 13,757 | |
| | | |
| |
| |
| | | |
| |
| |
| |
| | Net cash provided by operating activities | | | 258,724 | | | 218,838 | | | 69,801 | | Net cash provided by operating activities | | 249,919 | | 258,724 | | 218,838 | |
| | | |
| |
| |
| | | |
| |
| |
| |
CASH FLOWS FROM INVESTING ACTIVITIES: |
CASH FLOWS FROM INVESTING ACTIVITIES: |
|
|
|
|
|
|
|
|
|
| CASH FLOWS FROM INVESTING ACTIVITIES: | | | | | | | |
| |
Capital expenditures—Well Servicing |
|
|
(143,080 |
) |
|
(79,410 |
) |
|
(36,813 |
) | Capital expenditures—Well Servicing | | (135,336 | ) | | (143,080 | ) | | (79,410 | ) |
| | Capital expenditures—Pressure Pumping | | | (35,513 | ) | | (27,258 | ) | | (12,550 | ) | Capital expenditures—Pressure Pumping | | (51,115 | ) | | (35,513 | ) | | (27,258 | ) |
| | Capital expenditures—Fishing and Rental | | | (12,953 | ) | | (4,070 | ) | | (3,270 | ) | Capital expenditures—Fishing and Rental | | (19,811 | ) | | (12,953 | ) | | (4,070 | ) |
| | Capital expenditures—Other | | | (4,284 | ) | | (7,408 | ) | | (101 | ) | Capital expenditures—Other | | (6,298 | ) | | (4,284 | ) | | (7,408 | ) |
| | Proceeds from sale of fixed assets | | | 11,658 | | | 18,694 | | | 5,648 | | Proceeds from sale of fixed assets | | 8,427 | | 11,658 | | 18,694 | |
| | Proceeds from sale-leaseback transactions | | | — | | | 5,757 | | | — | | Proceeds from sale-leaseback transactions | | — | | — | | 5,757 | |
| | Acquisitions, net of cash acquired | | | — | | | — | | | (22,153 | ) | Acquisitions, net of cash acquired of $2,154 | | (157,955 | ) | | — | | — | |
| | Investment in available for sale securities | | | (83,769 | ) | | — | | | — | | Cash paid for short-term investments | | (121,613 | ) | | (83,769 | ) | | — | |
| | Proceeds from sale of available for sale securities | | | 22,294 | | | — | | | — | | Proceeds from sales of short-term investments | | 183,177 | | 22,294 | | — | |
| |
Investing cash flows provided by discontinued operations |
|
|
— |
|
|
60,477 |
|
|
5,158 |
| Acquisition of intangible assets | | (2,323 | ) | | — | | — | |
| | | |
| |
| |
| | Investing cash flows provided by discontinued operations | | — | | — | | 60,477 | |
| | Net cash used in investing activities | | | (245,647 | ) | | (33,218 | ) | | (64,081 | ) | | |
| |
| |
| |
| | | |
| |
| |
| | Net cash used in investing activities | | (302,847 | ) | | (245,647 | ) | | (33,218 | ) |
| | | | |
| |
| |
| |
CASH FLOWS FROM FINANCING ACTIVITIES: |
CASH FLOWS FROM FINANCING ACTIVITIES: |
|
|
|
|
|
|
|
|
|
| CASH FLOWS FROM FINANCING ACTIVITIES: | | | | | | | |
| |
Repayments of long-term debt |
|
|
(4,000 |
) |
|
(436,999 |
) |
|
(123,056 |
) | Repayments of long-term debt | | (396,000 | ) | | (4,000 | ) | | (436,999 | ) |
| | Proceeds from long-term debt | | | — | | | 400,000 | | | — | | Proceeds from long-term debt | | 425,000 | | — | | 400,000 | |
| | Repayments on revolving credit facility | | | — | | | (48,000 | ) | | (22,000 | ) | Borrowings under revolving credit facility | | 50,000 | | — | | — | |
| | Borrowings under revolving credit facility | | | — | | | — | | | 70,000 | | Payments on revolving credit facility | | — | | — | | (48,000 | ) |
| | Repayments of capital lease obligations | | | (12,975 | ) | | (13,049 | ) | | (14,804 | ) | Repayments of capital lease obligations | | (11,316 | ) | | (12,975 | ) | | (13,049 | ) |
| | Proceeds paid for debt issuance costs | | | (479 | ) | | (13,165 | ) | | (3 | ) | Repayments of debt assumed in acquisitions | | (17,435 | ) | | — | | — | |
| | Purchase of treasury stock | | | (1,180 | ) | | — | | | — | | Proceeds paid for debt issuance costs | | (13,400 | ) | | (479 | ) | | (13,165 | ) |
| | Proceeds from exercise of stock options | | | — | | | — | | | 1,586 | | Repurchases of common stock | | (30,454 | ) | | (1,180 | ) | | — | |
| | | |
| |
| |
| | Proceeds from exercise of stock options | | 13,444 | | — | | — | |
| | Net cash used in financing activities | | | (18,634 | ) | | (111,213 | ) | | (88,277 | ) | Excess tax benefits from stock-based compensation | | 3,401 | | — | | — | |
| | | |
| |
| |
| | | |
| |
| |
| |
| |
Effect of exchange rates on cash |
|
|
(238 |
) |
|
(662 |
) |
|
(233 |
) | Net cash provided by (used in) financing activities | | 23,240 | | (18,634 | ) | | (111,213 | ) |
| | | |
| |
| |
| | | |
| |
| |
| |
| Effect of changes in exchange rates on cash | | Effect of changes in exchange rates on cash | | (184 | ) | | (238 | ) | | (662 | ) |
| | Net (decrease) increase in cash and cash equivalents | | | (5,795 | ) | | 73,745 | | | (82,790 | ) | | |
| |
| |
| |
| Net (decrease) increase in cash and cash equivalents | | Net (decrease) increase in cash and cash equivalents | | (29,872 | ) | | (5,795 | ) | | 73,745 | |
| | | |
| |
| |
| | | |
| |
| |
| |
| Cash and cash equivalents, beginning of period | | Cash and cash equivalents, beginning of period | | 88,375 | | 94,170 | | 20,425 | |
| | Cash and cash equivalents, beginning of period | | | 94,170 | | | 20,425 | | | 103,215 | | | |
| |
| |
| |
| Cash and cash equivalents, end of period | | Cash and cash equivalents, end of period | | $ | 58,503 | | $ | 88,375 | | $ | 94,170 | |
| | | |
| |
| |
| | | |
| |
| |
| |
| | Cash and cash equivalents, end of period | | $ | 88,375 | | $ | 94,170 | | $ | 20,425 | | |
| | |
| |
| |
| | |
See the accompanying notes which are an integral part of these consolidated financial statements
Key Energy Services, Inc. and Subsidiaries
Consolidated Statements of Stockholders' EquityCONSOLIDATED STATEMENTS OF STOCKHOLDERS' EQUITY
(inIn thousands)
| | Common Stock
| |
| |
| |
| |
| |
| | |
|---|
| |
| |
| | Accumulated
Other
Comprehensive
Loss
| |
| |
| | |
|---|
| | Number of
Shares
| | Amount
at par
| | Additional
Paid-in
Capital
| | Treasury
Stock
| | Retained
Earnings
| | Total
| | |
|---|
| | (In thousands)
| | |
|---|
| BALANCE AT DECEMBER 31, 2003 (Restated) | | 130,561 | | $ | 13,098 | | $ | 711,455 | | $ | (9,682 | ) | $ | (36,118 | ) | $ | (142,689 | ) | $ | 536,064 | | |
| | Foreign currency translation adjustment | | — | | | — | | | — | | | — | | | (303 | ) | | — | | | (303 | ) | |
| | Exercise of options | | 230 | | | 23 | | | 1,563 | | | — | | | — | | | — | | | 1,586 | | |
| | Stock-based compensation | | — | | | — | | | 545 | | | — | | | — | | | — | | | 545 | |
| | Common Stock
| |
| | Accumulated
Other
Comprehensive
Loss
| |
| |
| |
|---|
| | Net loss | | — | | | — | | | — | | | — | | | — | | | (32,226 | ) | | (32,226 | ) |
| | Additional
Paid-In
Capital
| | Retained
Earnings
| |
| |
|---|
| | | |
| |
| |
| |
| |
| |
| |
| |
| | Shares
| | Amount
| | Accumulated
Other
Comprehensive
Loss
| |
|---|
| BALANCE AT DECEMBER 31, 2004 | BALANCE AT DECEMBER 31, 2004 | | 130,791 | | | 13,121 | | | 713,563 | | | (9,682 | ) | | (36,421 | ) | | (174,915 | ) | | 505,666 | | BALANCE AT DECEMBER 31, 2004 | | 130,791 | | $ | 13,079 | | $ | 703,923 | | $ | (36,421 | ) | $ | (174,915 | |
| | |
| |
| |
| |
| |
| |
| |
| | |
| | Foreign currency translation adjustment | | — | | | — | | | — | | | — | | | (206 | ) | | — | | | (206 | ) | Comprehensive income, net of tax | | — | | | — | | | — | | | (206 | ) | | — | | | (206 | ) |
| | Stock-based compensation | | 543 | | | 54 | | | 2,826 | | | — | | | — | | | — | | | 2,880 | | Stock-based compensation | | 543 | | | 54 | | | 2,826 | | | — | | | — | | | 2,880 | |
| | Net income | | — | | | — | | | — | | | — | | | — | | | 45,717 | | | 45,717 | | Net income | | — | | | — | | | — | | | — | | | 45,717 | | | 45,717 | |
| | | |
| |
| |
| |
| |
| |
| |
| | | |
| |
| |
| |
| |
| |
| |
| BALANCE AT DECEMBER 31, 2005 | BALANCE AT DECEMBER 31, 2005 | | 131,334 | | | 13,175 | | | 716,389 | | | (9,682 | ) | | (36,627 | ) | | (129,198 | ) | | 554,057 | | BALANCE AT DECEMBER 31, 2005 | | 131,334 | | | 13,133 | | | 706,749 | | | (36,627 | ) | | (129,198 | ) | | 554,057 | |
| | | |
| |
| |
| |
| |
| |
| |
| | | |
| |
| |
| |
| |
| |
| |
| | Foreign currency translation adjustment | | — | | | — | | | — | | | — | | | (51 | ) | | — | | | (51 | ) | Comprehensive income, net of tax | | — | | | — | | | — | | | 343 | | | — | | | 343 | |
| | Deferred gain from cash flow hedges | | — | | | — | | | — | | | — | | | 213 | | | — | | | 213 | | Common stock purchases | | (81 | ) | | (8 | ) | | (1,172 | ) | | — | | | — | | | (1,180 | ) |
| | Deferred gain from available for sale investments | | — | | | — | | | — | | | — | | | 181 | | | — | | | 181 | | Stock-based compensation | | 371 | | | 37 | | | 6,181 | | | — | | | — | | | 6,218 | |
| | Purchase of treasury stock | | (81 | ) | | — | | | — | | | (1,180 | ) | | — | | | — | | | (1,180 | ) | Tax benefits from stock-based compensation | | — | | | — | | | 40 | | | — | | | — | | | 40 | |
| | Stock-based compensation | | 371 | | | 37 | | | 6,221 | | | — | | | — | | | — | | | 6,258 | | Net income | | — | | | — | | | — | | | — | | | 171,033 | | | 171,033 | |
| | Net income | | — | | | — | | | — | | | — | | | — | | | 171,033 | | | 171,033 | | | |
| |
| |
| |
| |
| |
| |
| | |
| |
| |
| |
| |
| |
| |
| | |
| BALANCE AT DECEMBER 31, 2006 | BALANCE AT DECEMBER 31, 2006 | | 131,624 | | $ | 13,212 | | $ | 722,610 | | $ | (10,862 | ) | $ | (36,284 | ) | $ | 41,835 | | $ | 730,511 | | BALANCE AT DECEMBER 31, 2006 | | 131,624 | | | 13,162 | | | 711,798 | | | (36,284 | ) | | 41,835 | | | 730,511 | |
| | | |
| |
| |
| |
| |
| |
| |
| | | |
| |
| |
| |
| |
| |
| |
| | | Effect of adoption of FIN 48 | | — | | | — | | | — | | | — | | | (1,272 | ) | | (1,272 | ) |
| | | Effect of adoption of FSP EITF 00-19-2, net of tax | | — | | | — | | | — | | | — | | | (631 | ) | | (631 | ) |
| | | | |
| |
| |
| |
| |
| |
| |
| Adjusted balance, beginning of year | | Adjusted balance, beginning of year | | 131,624 | | | 13,162 | | | 711,798 | | | (36,284 | ) | | 39,932 | | | 728,608 | |
| | | | |
| |
| |
| |
| |
| |
| |
| | | Comprehensive income, net of tax | | — | | | — | | | — | | | (1,697 | ) | | — | | | (1,697 | ) |
| | | Common stock purchases | | (2,414 | ) | | (241 | ) | | (33,161 | ) | | — | | | — | | | (33,402 | ) |
| | | Exercise of stock options | | 1,592 | | | 159 | | | 13,285 | | | — | | | — | | | 13,444 | |
| | | Exercise of warrants | | 23 | | | 2 | | | (2 | ) | | — | | | — | | | — | |
| | | Stock-based compensation | | 318 | | | 32 | | | 9,323 | | | — | | | — | | | 9,355 | |
| | | Tax benefits from stock-based compensation | | — | | | — | | | 3,401 | | | — | | | — | | | 3,401 | |
| | | Net income | | — | | | — | | | — | | | — | | | 169,289 | | | 169,289 | |
| | | | |
| |
| |
| |
| |
| |
| |
| BALANCE AT DECEMBER 31, 2007 | | BALANCE AT DECEMBER 31, 2007 | | 131,143 | | $ | 13,114 | | $ | 704,644 | | $ | (37,981 | ) | $ | 209,221 | | $ | 888,998 | |
| | | | |
| |
| |
| |
| |
| |
| |
See the accompanying notes which are an integral part of these consolidated financial statements
Key Energy Services, Inc.
and Subsidiaries
NOTES TO CONSOLIDATED FINANCIAL STATEMENTS
December 31, 2006, 2005 and 2004
1. ORGANIZATION AND SUMMARY OF SIGNIFICANT ACCOUNTING POLICIES
The Company
Key Energy Services, Inc. is a Maryland corporation that was organized in April 1977 and commenced operations in July 1978 undercorporation. References to "Key," the name National Environmental Group, Inc. We emerged from a prepackaged bankruptcy plan in December 1992 as Key Energy Group, Inc. On December 9, 1998, we changed our name"Company," "we," "our," or "us" are intended to refer to Key Energy Services, Inc. ("Key" or the "Company").and subsidiaries. We believe that we are now the leading onshore, rig-based well servicing contractor in the United States. From 1994 through 2002, the Company grew rapidly through a series of over 100 acquisitions, and today we provide a complete rangebroad array of services including: well services to major oil companies and independent oil and natural gas production companies, including rig-based well maintenance, workover, well completion and recompletion services,servicing, oilfield transportation services, cased-hole electric wireline services, contract drilling services, pressure pumping and ancillary oilfieldwell stimulation services and fishing and rental services and pressure pumping services. During 2006,
Key conductedconducts onshore well servicing operations onshorein every major oil and natural gas producing region in the continental United States in the following regions: Gulf Coast (including South Texas, Central Gulf Coast of Texas and South Louisiana), Permian Basin of West Texas and Eastern New Mexico, Mid-Continent (including the Anadarko, Hugoton and Arkoma Basins and the ArkLaTex and North Texas regions), Four Corners (including the San Juan, Piceance, Uinta, and Paradox Basins), the Appalachian Basin, Rocky Mountains (including the Denver-Julesberg, Powder River, Wind River, Green River and Williston Basins), and California (the San Joaquin Basin), and internationally in Argentina.States. We also provide limited onshore drilling services in the Rocky Mountains, the Appalachian Basin and in Argentina. During 2006, we conductedwith our well servicing equipment. We conduct pressure pumping and cementing operations in a number of major domestic producing basinsregions including California, the Permian Basin, the San Juan Basin, the Mid-Continent region and in the Barnett Shale of North Texas. Our fishing and rental services are located primarily in the Gulf Coast and Permian Basin regions of Texas, as well as in California and the Mid-Continent region. We also have limited operations offshore.
Internationally, we conduct onshore well servicing and contract drilling operations in Argentina and during the second quarter of 2007, we began conducting well servicing operations in the Northern region of Mexico. In September 2007, we acquired Advanced Measurements, Inc. ("AMI"), a privately-held Canadian technology company.
On October 25, 2007, Key Energy Services, LLC, a Delaware limited liability company and wholly-owned subsidiary of the Company, purchased all of the outstanding shares and membership interests of Moncla Well Service, Inc. and related entities ("Moncla"). In December 2007 we acquired the well servicing assets and related equipment of Kings Oil Tools, a privately-held well servicing company operating in California ("Kings"). See Note 2—"Acquisitions."
Basis of Presentation
This Report has been delayed due to our restatement and financial reporting process for periods ending December 31, 2003, which began in March 2004. That process was completed on October 19, 2006. Our 2003 Financial and Informational Report on Form 8-K/A, filed with the Securities and Exchange Commission ("SEC") on October 26, 2006, included an audited 2003 consolidated balance sheet which presented our financial condition as of December 31, 2003 in accordance with Generally Accepted Accounting Principles ("GAAP"). We did not present other consolidated financial statements in accordance with GAAP as we were unable to determine with sufficient certainty the appropriate period(s) in 2003 or before in which to record certain write-offs and write-downs that were identified in our restatement process. Our former registered public accounting firm, expressed an unqualified opinion that the 2003 balance sheet fairly presented our financial condition on December 31, 2003. The firm also audited the other financial statements presented in the 2003 Financial and Informational Report. It opined that the financial statements other than the 2003 balance sheet did not fairly present our financial condition or results of operations or cash flows for the periods covered in accordance with GAAP. Investors should refer to the 2003 Financial and Informational Report for a full description of the restatement and financial reporting process for periods prior to 2004.
The financial statements and associated schedules included in this Annual Report on Form 10-K present our financial condition,position, results of operations and cash flows for the periods presented in accordance with GAAP.generally accepted accounting principles in the United States ("GAAP").
The preparation of these consolidated financial statements requires us to develop estimates and to make assumptions that affect our financial position, results of operations and cash flows. These estimates also impact the nature and extent of our disclosure, if any, of our contingent liabilities. Among other things, we use estimates to (1)(i) analyze assets for possible impairment, (2)(ii) determine depreciable lives for our assets, (3)(iii) assess future tax exposure and realization of deferred tax assets, (4)(iv) determine amounts to accrue for contingencies, (5)(v) value tangible and intangible assets, and (6)(vi) assess workers' compensation, vehicular liability, self-insured risk accruals and other insurance reserves. Ourreserves, and (vii) provide allowances for our uncollectible accounts receivable. We review all significant estimates on a recurring basis and record the effect of any necessary adjustments prior to publication of our financial statements. Adjustments made with respect to the use of estimates relate to improved information not previously available. Because of the limitations inherent in this process, our actual results may differ materially from these estimates. We believe that our estimates are reasonable.
Due to the delay in the filing of this annual report as discussed above, additional information regarding certain liabilities and uncertainties that existed as of the date of this report has become available, either through additional facts about, or the ultimate settlement or resolution of, the liability or uncertainty. We have taken any additional information that has come to light into account in our estimates and disclosure of any potential liabilities or other contingencies as of the date of this Report, in accordance with Statement of Financial Accounting Standards No. 5, "Accounting for Contingencies" ("SFAS 5").
Certain reclassifications have been made to prior period amounts to conform to current period financial statement classifications. These reclassifications primarily relate to the change in our reportable segments. Priorrecasting of prior periods to 2004, our Pressure Pumping and Fishing and Rental segmentsconform to a realignment of certain employment positions that were previously reported as parta
Key Energy Services, Inc. and Subsidiaries
NOTES TO CONSOLIDATED FINANCIAL STATEMENTS (Continued)
1. ORGANIZATION AND SUMMARY OF SIGNIFICANT ACCOUNTING POLICIES (Continued)
component of our Well Servicing segment; Pressure Pumpingdirect expenses and Fishing and Rentalthat are now presentedreported as independent reportable segments. Additionally, as further discussed in Note 3—"Discontinued Operations,"general and administrative. These reclassifications had no effect on previously reported income from continuing operations or net income. The following tables summarize the effects of these reclassifications on previously reported amounts (in thousands):
| | Year Ended December 31, 2006
|
|---|
| | Amounts as
Previously
Reported
| | Effect of
Reclassifications
| | Amounts as
Currently
Reported
|
|---|
| Well servicing costs | | $ | 736,014 | | $ | (11,006 | ) | $ | 725,008 |
| Pressure pumping costs | | | 141,743 | | | (3,366 | ) | | 138,377 |
| Fishing and rental costs | | | 60,073 | | | (2,856 | ) | | 57,217 |
| General and administrative costs | | | 178,299 | | | 17,228 | | | 195,527 |
| | |
| |
| |
|
| | Total | | $ | 1,116,129 | | $ | — | | $ | 1,116,129 |
| | |
| |
| |
|
| | Year Ended December 31, 2005
|
|---|
| | Amounts as
Previously
Reported
| | Effect of
Reclassifications
| | Amounts as
Currently
Reported
|
|---|
| Well servicing costs | | $ | 635,442 | | $ | (1,399 | ) | $ | 634,043 |
| Pressure pumping costs | | | 92,323 | | | (22 | ) | | 92,301 |
| Fishing and rental costs | | | 54,361 | | | (462 | ) | | 53,899 |
| General and administrative costs | | | 149,420 | | | 1,883 | | | 151,303 |
| | |
| |
| |
|
| | Total | | $ | 931,546 | | $ | — | | $ | 931,546 |
| | |
| |
| |
|
In January 2005 we sold the majority of our contract drilling assets to Patterson-UTI Energy on January 15, 2005. These assets had previously been reported as part of our contract drilling reportable segment. As a result, we now show these assets as net assets of discontinued operations on our consolidated balance sheets, andEnergy. We present the results of operations and cash flows related to these activities are presented as discontinued operations onin our consolidated statements of operations and consolidated statements of cash flows for all periods presented.2005.
Our remaining contract drilling operations are now reported as part of our Well Servicing segment. We apply the provisions of EITF Issue 04-10, "Determining Whether to Aggregate Operating Segments That Do Not Meet Quantitative Thresholds" ("EITF 04-10") infor our segment reporting in Note 16—18—"Segment Information." Our remaining contract drilling operationsUnder the provisions of EITF 04-10, operating segments that do not individually meet the quantitative thresholds asaggregation criteria described in Statement of Financial Accounting Standards ("SFAS") No. 131, "Disclosures About Segments of an Enterprise and Related Information" ("SFAS 131"), and, under the provisions of EITF 4-10, since themay be combined with other operating segments that do not individually meet the aggregation criteria weto form a separate reportable segment. We have combined information about this segment with other similarall of our operating segments that individually do not individually meet the quantitative thresholdsaggregation criteria established in SFAS 131 to produce a reportable segment.
Restatement for Error
In connection withform the preparation of these financial statements, we identified an error"Corporate and Other" segment in our balance sheet as of December 31, 2003. This error affected both our retained earnings and deferred tax liabilities accounts, and arose as a result of our lack of roll-forwards and other appropriate reconciliations of the differences between the book and tax bases of our fixed assets. The error had been carried forward into our consolidated balance sheets as of December 31, 2003 from differences that initially arose in our 1999 fiscal year, and resulted in an overstatement of our retained deficit as of December 31, 2003 by approximately $10 million and an overstatement of our deferred tax liability as of the same date by the same amount. Our retained earnings and deferred tax liabilities were adjusted as of December 31, 2003 to correct this error and the adjustment is reflected in these consolidated financial statements. Total liabilities and stockholders' equity at December 31, 2003 was not impacted by this error.segment reporting.
Principles of Consolidation
Within our consolidated financial statements, we include our accounts and the accounts of our majority-owned or controlled subsidiaries. We eliminate intercompany accounts and transactions. We account for our interest in entities for which we do not have significant control or influence under the cost method. When we have an interest in an entity and can exert significant influence but not control, we account for that interest using the equity method. See
Key Energy Services, Inc. and Subsidiaries
NOTES TO CONSOLIDATED FINANCIAL STATEMENTS (Continued)
1. ORGANIZATION AND SUMMARY OF SIGNIFICANT ACCOUNTING POLICIES (Continued)
As further discussed in Note 9—2—"InvestmentAcquisitions," in IROC Systems Corp."September 2007 we completed the acquisition of AMI, a privately-held Canadian company focused on oilfield technology. Prior to the acquisition, AMI owned a portion of another Canadian company, Advanced Flow Technologies, Inc. ("AFTI"). As part of the acquisition, AMI increased its ownership percentage of AFTI to 51.46%. We now consolidate the assets, liabilities, results of operations and cash flows of AFTI into our consolidated financial statements, with the portion of AFTI remaining outside of our control forming a minority interest in our consolidated financial statements.
In January 2003, theWe apply Financial Accounting Standards Board ("FASB") issued Interpretation ("FIN") No. 46, "Consolidation of Variable Interest Entities—an Interpretation of ARB No. 51"51 (Revised 2003)" ("FIN 46"46(R)"). In December 2003 the FASB issued the updated and final interpretation of ARB 51 when determining whether or not to consolidate a Variable Interest Entity ("FIN 46R"VIE"). FIN 46R46(R) requires that an equity investor in a variable interest entityVIE have significant equity at risk (generally a minimum of 10%, which is an increase from the 3% required under previous guidance)) and hold a controlling interest, evidenced by voting rights, and absorb a majority of the entity's expected losses, receive a majority of the entity's expected returns, or both. If the equity investor is unable to evidence these characteristics, the entity that retains these ownership characteristics will be required to consolidate the variable interest entities created or obtained after March 15, 2004. The adoption of FIN 46R did not materially impact our consolidated financial statements.VIE.
Revenue Recognition
Well Servicing Rigs. Well servicing revenue consists primarily of maintenance services, workover services, completion services and plugging and abandonment services. We recognize revenue Revenue is recognized when services are performed, collectionall of the relevant receivable is probable, persuasivefollowing criteria have been met: (i) evidence of an arrangement exists, and(ii) delivery has occurred or services have been rendered, (iii) the price to the customer is fixed or determinable. These criteria are typically met at the time we complete a job for a customer. Primarily, we price well servicing rig services by the hour of service performed. Depending on the type of job, we may charge by the project or by the day.
Oilfield Transportation. Oilfield transportation revenue consists primarily of fluid and equipment transportation servicesdeterminable and frac tanks which are used in conjunction with fluid hauling services. We recognize revenue when services are performed, collection of the relevant receivable(iv) collectibility is probable, persuasive evidencereasonably assured.
- •
- Evidence of an arrangement exists when a final understanding between the Company and its customer has occurred, and is generally evidenced by a signed customer purchase order, field ticket, supplier contract, or master service agreement.
- •
- Delivery has occurred or services have been rendered when the Company has completed what is required pursuant to the terms of the arrangement and is generally evidenced by a customer signed field ticket or service log.
- •
- The price to the customer is fixed and determinable when the amount that is required to be paid is agreed upon. Evidence of the price being fixed and determinable is
fixedgenerally evidenced by contractual terms, a Company price book, a signed customer purchase order, or determinable. These criteria are typically met at the time we complete a job forsigned customer field ticket.
- •
- Collectibility is reasonably assured as a
customer. Primarily, we price oilfield trucking services by the hour or by the quantities hauled. Pressure Pumping and Fishing and Rental Services. We recognize revenue when services are performed, collectionresult of the relevant receivableCompany screening its customers and providing goods and services to customers that have been granted credit terms in accordance with the Company's credit policy.
In accordance with EITF Issue No. 06-03, "How Taxes Collected from Customers and Remitted to Governmental Authorities Should be Presented in the Income Statement (That is, probable, persuasive evidenceGross versus Net Presentation)" ("EITF 06-03"), we present our revenues net of an arrangement exists and the price is fixedany sales taxes collected by us from our customers that are required to be remitted to local or determinable. These criteria are typically met at the time we complete a job for a customer. Generally, we price fishing and rental tool services by the day and pressure pumping services by the job.state governmental taxing authorities.
Ancillary Oilfield Services. Ancillary oilfield services include services such as wireline operations, wellsite construction, roustabout services, foam units and air drilling services. We recognize revenue when services are performed, collection of the relevant receivable is probable, persuasive evidence of an arrangement exists and the price is fixed or determinable. These criteria are typically met at the time we complete a job for a customer. We price ancillary oilfield services by the hour, day or project depending on the type of services performed.
Cash and Cash Equivalents
We consider short-term investments with an original maturity of less than three months to be cash equivalents. None of our cash is restricted, and we have not entered into any compensating balance
Key Energy Services, Inc. and Subsidiaries
NOTES TO CONSOLIDATED FINANCIAL STATEMENTS (Continued)
1. ORGANIZATION AND SUMMARY OF SIGNIFICANT ACCOUNTING POLICIES (Continued)
arrangements. However, at December 31, 2006,2007, all of our obligations under the 2007 Senior Secured Credit
Facility (hereinafter defined) were secured by most of our assets, including assets held by our subsidiaries, which includes our cash and cash equivalents. We restrict investment of cash to financial institutions with high credit standing and limit the amount of credit exposure to any one financial institution. As of December 31, 2007, approximately $9.3 million of our cash and cash equivalents was held in bank accounts located in foreign countries, representing approximately 15.9% of total cash and cash equivalents. Of the total amount held in foreign bank accounts as of December 31, 2007, approximately $4.4 million was located in Argentina, $0.3 million was located in Canada, and approximately $4.5 million was held in Mexico, with the remaining $0.1 million located in other countries.
Investment in Debt and Equity Securities
We account for investments in debt and equity securities under the provisions of Statement of Financial Accounting StandardsSFAS No. 115, "Accounting for Certain Investments in Debt and Equity Securities" ("SFAS 115"). Under SFAS 115, investments are classified as either "trading," "available for sale," or "held to maturity," depending on management's intent regarding the investment.
Securities classified as "trading" are carried at fair value, on the Company's Consolidated Balance Sheets, with any unrealized holding gains or losses reported currently in earnings on our Consolidated Statements of Operations.earnings. Securities classified as "available for sale" or "held to maturity" are carried at fair value, on the Company's Consolidated Balance Sheets, with any unrealized holding gains or losses, net of tax, reported as a separate component of shareholders' equity in Accumulated Other Comprehensive Income.other comprehensive income.
As of December 31, 2006, 20052007 and 2004,2006, the Company had no investments in debt or equity securities that were classified as "trading" or "held to maturity." In the third quarter of 2006, the Company began investing in Auction-Rate Securities ("ARS") and Variable-Rate Demand Notes ("VRDN"). These are investments in long-term bonds whose returns are tied to short-term interest rates that are periodically reset, with periods ranging from 7 days to 6 months. As a result of the long-term nature of the underlying security (bonds with contractual lives ranging from 20 to 30 years), the Company accounts for ARS and VRDN investments as "available for sale" securities. As of December 31, 2007 and 2006, the aggregate value of our investments in ARS and VRDN was zero and $44.4 million, respectively. We sold all of our ARS and VRDN investments during the third quarter of 2007 and used the proceeds to fund part of our acquisition of Moncla (see Note 2—"Acquisitions").
In addition to the ARS and VRDN investments, the Company also began investing in 270-day commercial paper and certain other bond investments. These instruments are treated as "available for sale" securities and are carried at fair value as short-term investments on the Company's Consolidated Balance Sheets,consolidated balance sheets, because their maturity dates are within one year of the date of investment. Any unrealized holding gains or losses on these securities are recorded net of tax as a separate component of stockholders' equity in Accumulated Other Comprehensive Incomeother comprehensive income until the date of maturity, at which point any gains or losses are reclassified into earnings. We use the specific identification method when determining the amount of realized gain or loss upon the date of maturity. The aggregate fair value of our available for sale investments was approximately $0.3 million and $61.8 million as of December 31, 2007 and 2006, was approximately $61.8 million.respectively.
Key Energy Services, Inc. and Subsidiaries
NOTES TO CONSOLIDATED FINANCIAL STATEMENTS (Continued)
1. ORGANIZATION AND SUMMARY OF SIGNIFICANT ACCOUNTING POLICIES (Continued)
Accounts Receivable and Allowance for Doubtful Accounts
Key's customers include major oil and natural gas production companies, independent oil and natural gas production companies, and foreign national oil and natural gas production companies. Historically, our credit losses have not been material. We establish provisions for losses on accounts receivable if we determine that we will not collect all or part of the outstanding balances. We regularly review collectiblitycollectibility and establish or adjust our allowance as necessary using the specific identification method.
From time to time we are entitled to proceeds under our insurance policies, and in accordance with FASB InterpretationFIN No. 39, "Offsetting of Amounts Related to Certain Contracts, an Interpretation of APB No. 10 and FASB Statement No. 105" ("FIN 39"), we present insurance receivables gross on our balance sheet as a component of accounts receivable, separate from the corresponding liability.
Concentration of Credit Risk and Significant Customers
Key's customers include major oil and natural gas production companies, independent oil and natural gas production companies, and foreign national oil and natural gas production companies. For all periods presented, no single customer accounted for more than ten percent of our consolidated revenues.
Inventories
Inventories, which consist primarily of equipment parts for use in our well servicing operations, sand and chemicals for our pressure pumping operations, and supplies held for consumption, are valued at the lower of average cost or market.
Property and Equipment
Property and equipment are carried at cost less accumulated depreciation. Depreciation is provided for oilfield service and related equipment, excluding our drilling rigs, using the straight-line method,assets over the following estimated depreciable lives of the assets:
Description
| | Years
|
|---|
Well service rigs and components | | 3 - 17 |
Oilfield trucks, trailers and related equipment | | 7 - 15 |
Motor vehicles | | 3 - 5 |
Fishing and rental tools | | 4 - 10 |
Disposal wells | | 15 - 30 |
Furniture and equipment | | 3 - 7 |
Buildings and improvements | | 15 - 30 |
assets using the straight-line method. We depreciate our operational assets over their depreciable lives to their salvage value, which is a fair value higher than the assets' value as scrap. Generally, salvage value approximates 10% of a rig'san operational asset's acquisition cost. When a rigan operational asset is stacked or taken out of service, we review its physical condition, depreciable life and ultimate salvage value to determine if the asset is no longer operable and whether the remaining depreciable life and salvage value should be adjusted.
The following table presents the net carrying valueCompany leases certain of our property, plant and equipment leasedits operating assets under capital lease obligations whose terms generally run from 55 to 60 months.
Change in Estimate of Useful Lives. In the first quarter of 2007, management reassessed the estimated useful lives assigned to all of the Company's equipment in light of the higher activity and utilization levels experienced due to recent market conditions. As a result, the maximum estimated useful lives of certain assets were adjusted to reflect higher annual utilization. As a result, the useful life expected for a well service rig was reduced from an average expected life of 17 years to 15 years. With respect to oilfield trucks, trailers and related equipment the expected life was reduced from an average expected life of 15 years to 12 years. Management also determined that the life assigned to a self-remanufactured well service rig should be the same as the 15-year life assigned to a newly constructed well service rig acquired from third parties.
Key Energy Services, Inc. and Subsidiaries
NOTES TO CONSOLIDATED FINANCIAL STATEMENTS (Continued)
1. ORGANIZATION AND SUMMARY OF SIGNIFICANT ACCOUNTING POLICIES (Continued)
The following table identifies the impact of this change in depreciation and amortization expense for the year ended December 31, 2007 (in thousands):
| | Year Ended
December 31, 2007
| |
|---|
| Depreciation and amortization using prior lives | | $ | 121,960 | |
| Impact of change | | | 7,663 | |
| | |
| |
| Depreciation and amortization, as reported | | $ | 129,623 | |
| | |
| |
Diluted earnings per share using prior lives |
|
$ |
1.33 |
|
| Impact of change on diluted earnings per share | | | (0.06 | ) |
| | |
| |
| Diluted earnings per share, as reported | | $ | 1.27 | |
| | |
| |
As of December 31, 2006, 2005 and 2004:2007, the estimated useful lives of the Company's asset classes are as follows:
| | December 31,
|
|---|
| | 2006
| | 2005
| | 2004
|
|---|
| | (in millions)
|
|---|
| Asset Class | | | | | | | | | |
Well servicing equipment |
|
$ |
23.7 |
|
$ |
27.0 |
|
$ |
32.5 |
| Vehicles | | | 2.6 | | | 5.2 | | | 6.3 |
| | |
| |
| |
|
| | Total | | $ | 26.3 | | $ | 32.2 | | $ | 38.8 |
| | |
| |
| |
|
Description
| | Years
|
|---|
| Well service rigs and components | | 3–15 |
| Oilfield trucks, trailers and related equipment | | 7–12 |
| Motor vehicles | | 3–5 |
| Fishing and rental tools | | 4–10 |
| Disposal wells | | 15–30 |
| Furniture and equipment | | 3–7 |
| Buildings and improvements | | 15–30 |
Asset Retirement Obligations.Obligations
In connection with our well servicing activities, we operate a number of Salt Water Disposalsalt water disposal ("SWD") facilities. Our operations involve the transportation, handling and disposal of fluids in our SWD facilities that are by-products of the drilling process, some of which have been determined to be harmful to the environment. SWD facilities used in connection with our fluid hauling operations are subject to future costs associated with the abandonment of these properties. As a result, we have incurred costs associated with the proper storage and disposal of these materials.
In accordance with Statement of Financial Accounting StandardsSFAS No. 143, "Accounting for Asset Retirement Obligations" ("SFAS 143"), we recognize a liability for the fair value of all legal obligations associated with the retirement of tangible long-lived assets and capitalize an equal amount as a cost of the asset. We depreciate the additional cost over the estimated useful life of the assets. Our obligations to perform our asset retirement activities are unconditional, despite the uncertainties that may exist surrounding an individual retirement activity. Accordingly, we recognize a liability for the fair value of a conditional asset retirement obligation if the fair value can be reasonably estimated. Significant judgment is involved in estimating future cash flows associated with such obligations, as well as the ultimate timing of those cash flows. If our estimates of the amount or timing of the cash flows change, such changes may have a material impact on our results of operations.
Adoption of SFAS 143 was required for all companies with fiscal years beginning after June 15, 2002.Key Energy Services, Inc. and Subsidiaries
NOTES TO CONSOLIDATED FINANCIAL STATEMENTS (Continued)
1. ORGANIZATION AND SUMMARY OF SIGNIFICANT ACCOUNTING POLICIES (Continued)
Annual amortization of the assets associated with the asset retirement obligations was $0.5$0.6 million, $0.5 million and $0.5 million for the yearyears ended December 31, 2007, 2006 2005 and 2004,2005, respectively. A summary of changes in our asset retirement obligations is as follows (in millions)thousands):
| Balance at January 1, 2004 | | $ | 9.1 | |
| | |
| |
| |
Additions |
|
|
1.0 |
|
| | Costs Incurred | | | (0.1 | ) |
| | Accretion Expense | | | 0.5 | |
| | |
| |
| Balance at December 31, 2004 | | | 10.5 | |
| | |
| |
| |
Additions |
|
|
0.1 |
|
| | Costs Incurred | | | (0.2 | ) |
| | Accretion Expense | | | 0.5 | |
| | Disposals | | | (1.3 | ) |
| | |
| |
| Balance at December 31, 2005 | | | 9.6 | |
| | |
| |
| |
Additions |
|
|
0.2 |
|
| | Costs Incurred | | | (0.6 | ) |
| | Accretion Expense | | | 0.5 | |
| | Disposals | | | (0.1 | ) |
| | |
| |
| Balance at December 31, 2006 | | $ | 9.6 | |
| | |
| |
| Balance at January 1, 2006 | | $ | 9,634 | |
Additions |
|
|
155 |
|
| Costs incurred | | | (568 | ) |
| Accretion expense | | | 508 | |
| Disposals | | | (107 | ) |
| | |
| |
| Balance at December 31, 2006 | | $ | 9,622 | |
| | |
| |
Additions |
|
|
12 |
|
| Costs incurred | | | (576 | ) |
| Accretion expense | | | 585 | |
| Disposals | | | (345 | ) |
| | |
| |
| Balance at December 31, 2007 | | $ | 9,298 | |
| | |
| |
In March 2005, the FASB issued Interpretation No. 47, "Accounting for Conditional Retirement Obligations—an Interpretation of FASB Statement No. 143" ("FIN 47"), which became effective for all years ending after December 15, 2005, with early adoption encouraged. This interpretation clarifies the term "conditional asset retirement obligation" as used in SFAS 143 and refers to a legal obligation to perform asset retirement activities in which the timing and method of settlement are conditional on a future event that may or may not be within the Company's control. Our obligations to perform our asset retirement activities are unconditional, despite the uncertainties that may exist surrounding an individual retirement activity. Accordingly, we recognize a liability for the fair value of a conditional asset retirement obligation if the fair value can be reasonably estimated. The adoption of FIN 47 did not have a material impact on our consolidated financial statements.Long-lived Asset Impairments
Asset and Investment Impairments. We apply Statement of Financial Accounting StandardsSFAS No. 144, "Accounting for the Impairment or Disposal of Long-Lived Assets" ("SFAS 144") in reviewing our long-lived assets and investments for possible impairment. This statement requires that long-lived assets held and used by us, including certain identifiable intangibles, be reviewed for impairment whenever events or changes in circumstances indicate that the carrying amount of an asset may not be recoverable. For purposes of applying this statement,testing for impairment, we group our long-lived assets into divisions, which are based on a division-by-division basisgeographical regions, and in some cases the services provided. We then compare the estimated future cash flows of each division to the division's net carrying value. The division level represents the lowest level for which identifiable cash flows are available. We would record an impairment charge, reducing the division's net carrying value to an estimated fair value, if its estimated future cash flows were less than the division's net carrying value. "Trigger events," as defined in SFAS 144, that cause us to evaluate our fixed assets for recoverability and possible impairment may include changes in market conditions, such as adverse changesmovements in the prices of oil and natural gas, which could reduce the fair value of certain of our property and equipment. The development of future cash flows and the determination of fair value for a division involves significant judgment and estimates. As of December 31,During 2007, 2006, 2005, and 2004,2005, no trigger events had been
were identified by management. However, in
Capitalized Interest
Interest is capitalized on the third quarteraverage amount of 2004, in connection withaccumulated expenditures for equipment that is undergoing major modifications and reconstruction prior to being placed into service. Interest is capitalized using an effective interest rate based on related debt until the sale of the majority of our contract drilling assets to Patterson-UTI Energy, Inc. on January 15, 2005, we reduced the carrying value of our held for sale assets to their fair values. This reduction resulted in a pretax charge to earnings of approximately $10.8 million in 2004. See Note 3—"Discontinued Operations."equipment is placed into service.
Key Energy Services, Inc. and Subsidiaries
NOTES TO CONSOLIDATED FINANCIAL STATEMENTS (Continued)
1. ORGANIZATION AND SUMMARY OF SIGNIFICANT ACCOUNTING POLICIES (Continued)
Long-Term Debt
Gains and Losses on the Early Extinguishment of Debt
Debt.
We record gains and losses from the extinguishment of debt as a part of continuing operations. DuringAs further discussed in Note 11—"Long-Term Debt," we recognized a loss of approximately $9.6 million during the years ended December 31, 2005 and 2004, we conducted a numberfourth quarter of refinancings of our debt. In association with these refinancings, we extinguished several of our debt instruments. We recorded $20.9 million and $12.0 million of losses2007 associated with the termination of our 2005 Senior Secured Credit Facility (hereinafter defined). During 2005 we recognized losses on the early extinguishment of debt of approximately $20.9 million in connection with the retirement of our 2003 Senior Secured Credit Facility (hereinafter defined), 6.375% Senior Notes due 2013 and 8.375% Senior Notes due 2008.
Deferred Financing Costs. In connection with our long-term debt, we capitalized costs and expenses of approximately $13.4 million, $0.5 million and $13.2 million for the years ended December 31, 2007, 2006 and 2005, and 2004, respectively.
Deferred Costs
In connection with our various financings, we capitalized $0.5 million, $11.6 million, and zero in fees and costs during the years ended December 31, 2006, 2005, and 2004, respectively. DeferredThese costs are amortized to interest expense using the effective interest method over the life of eachthe related debt instrument. When the related debt instrument is retired, any remaining unamortized costs are included in the determination of the gain or to gain (loss)loss on earlythe extinguishment of the debt. Amortization of deferred financing costs totaled $1.6$1.7 million, $1.6 million and $2.3$1.4 million for the years ended December 31, 2007, 2006 2005, and 2004,2005, respectively. Unamortized debt issuance costs written off and included in the determination of the gain or loss on the early extinguishment of debt were $9.6 million, zero, and $8.0 million for the years ended December 31, 2007, 2006 and 2005, and 2004 totaled zero, $8.0 million and $3.0 million, respectively.
| | December 31,
2006
| | December 31,
2005
| | December 31,
2004
| |
|---|
| | (in thousands)
| |
|---|
| Deferred costs | | | | | | | | | | |
| | Gross carrying value | | $ | 12,042 | | $ | 11,563 | | $ | 26,937 | |
| | Accumulated amortization | | | (2,090 | ) | | (470 | ) | | (17,869 | ) |
| | |
| |
| |
| |
| | | Net carrying value | | $ | 9,952 | | $ | 11,093 | | $ | 9,068 | |
| | |
| |
| |
| |
Goodwill and Other Intangible Assets
Goodwill results from business acquisitions and represents the excess of acquisition costs over the fair value of the net assets acquired. We account for goodwill and other intangible assets under the provisions of Statement of Financial Accounting StandardsSFAS No. 142, "Goodwill and Other Intangible Assets" ("SFAS 142"). SFAS 142 eliminates amortization for goodwill and other intangible assets with indefinite lives. Intangible assets with lives restricted by contractual, legal, or other means will continue to be amortized over their expected useful lives. Goodwill and other intangible assets not subject to amortization are tested for impairment annually on December 31, or more frequently if events or changes in circumstances indicate that the asset might be impaired. SFAS 142 requires a two-step process for testing impairment. First, the fair value of each reporting unit is compared to its carrying value to determine whether an indication of impairment exists. If impairment is indicated, then the fair value of the reporting unit's goodwill is determined by allocating the unit's fair value to its assets and liabilities (including any unrecognized intangible assets) as if the reporting unit had been acquired in a business combination. The amount of impairment for goodwill is measured as the excess of its carrying value over its fair value. We conduct annual impairment assessments, the most recent as of December 31, 2006.2007. The assessments did not result in an indication of goodwill impairment. However, in the third quarter
Our major classes of 2004, in connection with the sale of the majority of our contract drilling assets to Patterson-UTI Energy, Inc., we reduced the carrying value of our drilling segment's goodwill to its fair
value. This reduction resulted in a pretax charge to earnings of approximately $1.7 million in 2004. See Note 3—"Discontinued Operations."
Intangibleintangible assets subject to amortization under SFAS 142 consist of noncompete agreements, and patents and trademarks.trademarks, customer backlog, customer relationships and developed technology. Amortization expense for our noncompete agreements, patents and trademarks, and developed technology is calculated using the straight-line method over the period of the agreement ranging from three to seven years. The cost and accumulated amortization are retired whenor the noncompete agreement is fully amortized and no longer enforceable. Amortization expense for patents and trademarks is calculated using the straight-line method over theestimated economic useful lifelive of the patent or trademark, ranging from fiveintangible asset. Intangible assets related to seven years. We first acquired patents on July 16, 2002. Amortization expense forcustomer relationships are amortized utilizing the next five years for noncompete agreements that are in effect as of December 31, 2006 is estimated to be $1.2 million and $0.3 million for 2007 and 2008, respectively, and zero for the three succeeding years. Amortization expense for eachpattern of the next five years for patentsconsumption of the economic benefit over their estimated lives.
Key Energy Services, Inc. and trademarks in effect as of December 31, 2006 is estimated to be $0.7 million, $0.6 million, $0.3 million, $0.1 million and less than $0.1 million, respectively. The weighted average remaining amortization periods of our noncompete agreements and patents and trademarks are 1.3 years and 3.6 years, respectively.Subsidiaries
| | December 31,
| |
|---|
| | 2006
| | 2005
| | 2004
| |
|---|
| | (in thousands)
| |
|---|
| Goodwill: | | | | | | | | | | |
| | Well servicing | | $ | 254,106 | | $ | 254,116 | | $ | 254,136 | |
| | Pressure pumping | | | 47,905 | | | 47,905 | | | 47,905 | |
| | Fishing and rental | | | 18,901 | | | 18,901 | | | 18,901 | |
| | |
| |
| |
| |
| | | Carrying value | | $ | 320,912 | | $ | 320,922 | | $ | 320,942 | |
| | |
| |
| |
| |
| Noncompete agreements: | | | | | | | | | | |
| | Gross carrying value | | $ | 9,401 | | | 11,467 | | $ | 14,982 | |
| | Accumulated amortization | | | (7,887 | ) | | (7,751 | ) | | (7,379 | ) |
| | |
| |
| |
| |
| | | Net carrying value | | $ | 1,514 | | $ | 3,716 | | $ | 7,603 | |
| | |
| |
| |
| |
| Patents and Trademarks: | | | | | | | | | | |
| | Gross carrying value | | $ | 4,296 | | $ | 3,822 | | $ | 3,559 | |
| | Accumulated amortization | | | (2,465 | ) | | (1,752 | ) | | (1,110 | ) |
| | |
| |
| |
| |
| | | Net carrying value | | $ | 1,831 | | $ | 2,070 | | $ | 2,449 | |
| | |
| |
| |
| |
Amortization expense for our intangible assets with determinable lives is as follows:
| | Year Ended December 31,
|
|---|
| | 2006
| | 2005
| | 2004
|
|---|
| | (in thousands)
|
|---|
| | Noncompete agreements | | $ | 2,202 | | $ | 2,955 | | $ | 3,616 |
| | Patents and trademarks | | | 713 | | | 642 | | | 564 |
| | |
| |
| |
|
| | | Total intangible asset amortization expense | | $ | 2,915 | | $ | 3,597 | | $ | 4,180 |
| | |
| |
| |
|
NOTES TO CONSOLIDATED FINANCIAL STATEMENTS (Continued)
1. ORGANIZATION AND SUMMARY OF SIGNIFICANT ACCOUNTING POLICIES (Continued)
Derivative Instruments and Hedging Activities
The Company applies Statement of Financial Accounting StandardsSFAS No. 133, "Accounting for Derivative Instruments and Hedging Activities" ("SFAS 133") as amended by Statement of Financial Accounting StandardsSFAS No. 137, SFAS No. 138 and SFAS No. 149 ("SFAS 137," "SFAS 138," and "SFAS 149," respectively) in accounting for derivative instruments. SFAS 133 establishes accounting and reporting standards for derivative instruments, including certain derivative instruments embedded in other contracts, and hedging activities. It requires the recognition of all derivative instruments as assets and
liabilities on the balance sheet and measurement of those instruments at fair value. The accounting treatment of changes in fair value is dependent upon whether or not a derivative instrument is designated as a hedge, and if so, the type of hedge. For derivatives designated as cash flow hedges, the effective portion of the change in the fair value of the hedging instrument is recognized in other comprehensive income until the hedged item is recognized in earnings. Any ineffective portion of changes in the fair value of the hedging instrument is recognized currently in earnings.
To account for a financial instrument as a hedge, the contract must meet the following criteria: the underlying asset or liability must expose the Companya company to risk that is not offset in another asset or liability, the hedging contract must reduce that risk, and the instrument must be properly designated as a hedge at the inception of the contract and throughout the contract period. To be an effective hedge, there must be a high correlation between changes in the fair value of the financial instrument and the fair value of the underlying asset or liability, such that changes in the market value of the financial instrument would be offset by the effect of price changes on the exposed items.
In March 2006, under For derivatives designated as cash flow hedges, the termseffective portion of our Senior Secured Credit Facility, the Company was required to mitigatechange in the riskfair value of the hedging instrument is recognized in other comprehensive income until the hedged item is recognized in earnings. Any ineffective portion of changes in future cash flows posed by changesthe fair value of the hedging instrument is recognized currently in interest rates associated withearnings.
During the variable interest-rate term loan portion of our Senior Secured Credit Facility. We entered into twoyears ended December 31, 2007 and 2006, the Company had interest rate swap arrangements in order to offset this risk. The swaps are classifiedand foreign currency instruments that qualify as derivative instruments and were designated at inception as cash flow hedges. Management believes that these instruments were highly effective at inception to offset changes in the future cash flows of the underlying liabilities and will continue to be highly effective throughout the life of the hedge.under SFAS 133. See Note 8—9—"Derivative Financial Instruments" for further discussion.
LitigationLitigation
When estimating our liabilities related to litigation, we take into account all available facts and circumstances in order to determine whether a loss is probable and reasonably estimable in accordance with SFAS No. 5, "Accounting for Contingencies" ("SFAS 5").
Various suits and claims arising from the ordinary course of business are pending against us. Due to the locations where we conduct business in the continental United States, we are often subject to jury verdicts and arbitration hearings that result in favor of the plaintiffs. We do not believe that the disposition of any of these items will result in a material adverse impact on our consolidated financial position, results of operations or cash flows. See Note 12—"Commitments and Contingencies" for a description of other currently pending litigation.
When estimating our liabilities related to litigation as of December 31, 2006, we take into account all available facts and circumstances in order to determine whether a loss is probable and reasonably estimable in accordance with SFAS 5.
Environmental
Our operations are subject to various federal, state and local laws and regulations intended to protect the environment. Our operations routinely involve the storage, handling, transport and disposal of bulk waste materials, some of which contain oil, contaminants, and regulated substances. Various environmental laws and regulations require prevention, and where necessary, cleanup of spills and leaks of such materials, and some of our operations must obtain permits limiting the discharge of materials. Failure to comply with such environmental requirements or permits may result in fines and penalties, remediation orders and revocation of permits. Laws and regulations have become more stringent over the years, and in certain circumstances may impose "strict liability," rendering us liable for
Key Energy Services, Inc. and Subsidiaries
NOTES TO CONSOLIDATED FINANCIAL STATEMENTS (Continued)
1. ORGANIZATION AND SUMMARY OF SIGNIFICANT ACCOUNTING POLICIES (Continued)
environmental damage without regard to negligence or fault on our part. Cleanup costs, penalties, and other damages arising as a result of environmental laws and costs associated with changes in environmental laws and regulations, could be substantial and could have a material adverse effect on our financial condition, results of operations and cash flows. From time to time, claims have been made and litigation has been brought against us under such laws. Environmental expenditures are expensed or capitalized depending on their future economic benefit. Expenditures that relate to an existing condition caused by past operations and that have no future economic benefits are expensed. Liabilities for expenditures of a non-capital nature are recorded when environmental assessment and/or remediation is probable, and the costs can be reasonably estimated.
See Note 12—"Commitments and Contingencies" for further discussion.
Guarantees
In November 2002, the FASB issued InterpretationWe account for guarantees under FIN No. 45, "Guarantor's Accounting and Disclosure Requirements for Guarantees, Including Indirect Guarantees of Indebtedness of Others" ("FIN 45"). On January 1, 2003, we adopted the initial recognition and measurement provisions for guarantees issued or modified after December 31, 2002. In November 2005, the FASB issued FASB Staff Position No. 45-3, "Application of FASB Interpretation No. 45 to Minimum Revenue Guarantees Granted to Business or Its Owners" ("FSP FIN 45-3"). It served as an amendment to FIN 45 by adding minimum revenue guarantees to the list of examples of contracts to which FIN 45 applies. Under FSP FIN No. 45-3, a guarantor is required to recognize, at the inception of a guarantee, a liability for the fair value of the obligation undertaken in issuing the guarantee. FSP FIN 45-3 is effective for new minimum revenue guarantees issued or modified on or after January 1, 2006. The adoptionAs of December 31, 2007 and 2006, the Company had no guarantees that were accounted for under the guidance provided by FIN 45 and FSP FIN 45-3 did not have a material impact on our consolidated financial statements.45-3.
Income Taxes
We account for income taxes based upon Statement of Financial Accounting StandardsSFAS No. 109, "Accounting for Income Taxes" ("SFAS 109"). Under SFAS 109, deferred tax assets and liabilities are recognized for the future tax consequences attributable to differences between the financial statement carrying amounts of existing assets and liabilities and their respective tax bases. Deferred tax assets and liabilities are measured using statutory tax rates expected to apply to taxable income in the years in which those temporary differences are expected to be recovered or settled. The effect on deferred tax assets and liabilities of a change in tax rate is recognized in income in the period that includes the statutory enactment date. A valuation allowance for deferred tax assets is recognized when it is more likely than not that the benefit of deferred tax assets will not be realized.
We and our eligible subsidiaries file a consolidated U.S. federal income tax return. Certain foreign subsidiaries that are consolidated for financial reporting purposes are not eligible to be included in the consolidated U.S. federal income tax return and are subject to the jurisdiction of a number of taxing authorities. The income earned in the various jurisdictions is taxed on differing bases. The final determination of our tax liability involves the interpretation of local tax laws, tax treaties, and related authorities in each jurisdiction as well as the significant use of estimates and assumptions regarding the scope of future operations and results achieved and the timing and nature of income earned and expenditures incurred. We file separate income tax returns in the countries in which these foreign subsidiaries operate. We have not made the election as described in Accounting Principles Board ("APB") Opinion No. 23, "Accounting for Income Taxes—Special Areas," that earnings from foreign entities will be reinvested indefinitely. Our foreign subsidiary in Argentinasubsidiaries had negative earnings and profits for the years ended as of
Key Energy Services, Inc. and Subsidiaries
NOTES TO CONSOLIDATED FINANCIAL STATEMENTS (Continued)
1. ORGANIZATION AND SUMMARY OF SIGNIFICANT ACCOUNTING POLICIES (Continued)
December 31, 2006, 2005, 20042007 and 2003.2006. Accordingly, no deferred taxes are provided on that subsidiary's current earnings during those years.
FIN No. 48 and FSP FIN 48-1. In June 2006, the FASB issued FIN No. 48, "Accounting for Uncertainty in Income Taxes—an interpretation of FASB Statement No. 109" ("FIN 48"), which provides clarification of SFAS 109 with respect to the recognition of income tax benefits of uncertain tax positions in financial statements. FIN 48 requires that uncertain tax positions be reviewed and assessed, with recognition and measurement of the tax benefit based on a "more likely than not" standard.
In May 2007 the FASB issued FASB Staff Position No. FIN 48-1, "Definition of a Settlement in FASB Interpretation No. 48" ("FSP FIN 48-1"). FSP FIN 48-1 provides guidance on how an enterprise should determine whether a tax position is effectively settled for the purpose of recognizing previously unrecognized tax benefits. In determining whether a tax position has been effectively settled, entities must evaluate (i) whether taxing authorities have completed their examination procedures; (ii) whether the entity intends to appeal or litigate any aspect of a tax position included in a completed evaluation; and (iii) whether it is remote that a taxing authority would examine or re-examine any aspect of a taxing position. FSP FIN 48-1 is to be applied upon the initial adoption of FIN 48. We recognize accrued interest and penalties related to unrecognized tax benefits as a component of income tax expense.
We adopted the provisions of FIN 48 and FSP FIN 48-1 on January 1, 2007 and recorded a $1.3 million decrease to the balance of our retained earnings as of January 1, 2007 to reflect the cumulative effect of adopting these standards. See Note 10—"Income Taxes" for further discussion of the impact of the adoption of these standards.
Earnings Per Share
We present earnings per share information in accordance with the provisions of Statement of Financial Accounting StandardsSFAS No. 128, "Earnings Per Share" ("SFAS 128"). Under SFAS 128, basic earnings per common share is determined by dividing net earnings applicable to common stock by the weighted average number of shares of common sharesstock actually outstanding during the year. Diluted earnings per common share is based on the increased number of shares that would be outstanding assuming
conversion or exercise of dilutive outstanding securities or stock options using the "as if converted" method.
| | Year Ended
December 31,
2006
| | Year Ended
December 31,
2005
| | Year Ended
December 31,
2004
| |
|---|
| | (in thousands, except per share data)
| |
|---|
| Basic EPS Computation: | | | | | | | | | | |
| Numerator | | | | | | | | | | |
| | Income from continuing operations | | $ | 171,033 | | $ | 49,078 | | $ | (26,583 | ) |
| | Discontinued operations, net of tax | | | — | | | (3,361 | ) | | (5,643 | ) |
| | |
| |
| |
| |
| | Net income (loss) | | $ | 171,033 | | $ | 45,717 | | $ | (32,226 | ) |
| | |
| |
| |
| |
| Denominator | | | | | | | | | | |
| | Weighted average shares outstanding | | | 131,332 | | | 131,075 | | | 130,757 | |
Basic EPS: |
|
|
|
|
|
|
|
|
|
|
| | Income from continuing operations | | $ | 1.30 | | $ | 0.37 | | $ | (0.20 | ) |
| | Discontinued operations, net of tax | | | — | | | (0.03 | ) | | (0.04 | ) |
| | |
| |
| |
| |
| | Net income (loss) | | $ | 1.30 | | $ | 0.34 | | $ | (0.24 | ) |
| | |
| |
| |
| |
Diluted EPS Computation: |
|
|
|
|
|
|
|
|
|
|
| Numerator | | | | | | | | | | |
| | Income from continuing operations | | $ | 171,033 | | $ | 49,078 | | $ | (26,583 | ) |
| | Discontinued operations, net of tax | | | — | | | (3,361 | ) | | (5,643 | ) |
| | |
| |
| |
| |
| | Net income (loss) | | $ | 171,033 | | $ | 45,717 | | $ | (32,226 | ) |
| | |
| |
| |
| |
| Denominator | | | | | | | | | | |
| | Weighted average shares outstanding | | | 131,332 | | | 131,075 | | | 130,757 | |
| | Stock options | | | 2,180 | | | 2,017 | | | — | |
| | Warrants | | | 552 | | | 503 | | | — | |
| | |
| |
| |
| |
| | | | 134,064 | | | 133,595 | | | 130,757 | |
| | |
| |
| |
| |
Diluted EPS: |
|
|
|
|
|
|
|
|
|
|
| | Income from continuing operations | | $ | 1.28 | | $ | 0.37 | | $ | (0.20 | ) |
| | Discontinued operations, net of tax | | | — | | | (0.03 | ) | | (0.04 | ) |
| | |
| |
| |
| |
| | Net income (loss) | | $ | 1.28 | | $ | 0.34 | | $ | (0.24 | ) |
| | |
| |
| |
| |
The diluted earnings per share calculation See Note 5—"Earnings Per Share" for the years ended December 31, 2006 and 2005 excludes the potential exercise of 381,750 and 266,875 stock options, respectively, because the effects of such exercises on earnings per share in those years would be anti-dilutive. The diluted earnings per share calculation for the year ended December 31, 2004 excludes the potential exercise of all then-outstanding stock options and the potential conversion of our 5% Convertible Subordinated Notes, because the effects of such instruments on earnings per share would be anti-dilutive.further discussion.
Stock-Based Compensation
We account for stock-based compensation under the provisions of Statement of Financial Accounting StandardsSFAS No. 123 (revised 2004), "Share-Based Payment" ("SFAS 123(R)"), which we adopted on January 1, 2006. Prior to January 1, 2006, we accounted for share-based payments under the provisions of Accounting Principles BoardSFAS No. 123, "Accounting for Stock-Based Compensation" ("SFAS 123"), which allowed companies to continue to use the intrinsic value methods established by APB Opinion No. 25, "Accounting for Stock Issued to Employees" ("APB 25"), which was permitted by Statement of Financial Accounting Standards No. 123, "Accounting for Stock-Based Compensation" ("SFAS 123"). We adopted the provisions of SFAS 123(R) using the modified prospective transition method.method, and no cumulative effect was recorded on the adoption date of SFAS 123(R). We record stock-based compensation according to the salary classification of the award recipient, primarily as a component of general and administrative expense.
Key Energy Services, Inc. and Subsidiaries
NOTES TO CONSOLIDATED FINANCIAL STATEMENTS (Continued)
1. ORGANIZATION AND SUMMARY OF SIGNIFICANT ACCOUNTING POLICIES (Continued)
SFAS 123 setsset forth alternative accounting and disclosure requirements for stock-based compensation arrangements. Companies were permitted to continue following the provisions of APB 25 to measure and recognize employee stock-based compensation prior to January 1, 2006; however, SFAS 123 requiresrequired disclosure of pro forma net income and earnings per share that would have been reported under the fair value recognition provisions of SFAS 123. The following table below illustrates the effect on net income and earnings per share if we had applied the fair value recognition principles of SFAS 123 to stock-based employee compensation in 2004 and 2005. As noted above, while we followed the guidance established by APB 25 to account formeasure stock-based compensation during those years,that year, the stock-based compensation expense included in net income or loss in the following table below represents the compensation expense for the 875,180 options, net of forfeitures, that were granted in prior years at strike prices ranging from $0.10 to $2.53 below the market price of our common stock on the date of grant. During the years in which we applied APB 25, we elected to amortize any compensation cost on a straight-line basis over the vesting period of the award, in accordance with FASB InterpretationFIN No. 28, "Accounting for Stock Appreciation Rights and Other Variable Stock Option or Award Plans, an Interpretation of APB Opinions No. 15 and 25" ("FIN 28"). After the adoption of SFAS 123(R), we elected to amortize compensation cost associated with the fair value of equity-based awards ratably over the vesting period of the award.award based on graded vesting using the straight-line attribution method.
|
| | Year Ended
December 31,
2005
| | Year Ended
December 31,
2004
| |
| | Year Ended
December 31, 2005
| |
|---|
|
| | (in thousands, except per share amounts)
| |
| | (in thousands, except per
share amounts)
| |
|---|
| Net income (loss): | | | | | | |
| Net income: | | Net income: | | | |
| |
As reported |
|
$ |
45,717 |
|
$ |
(32,226 |
) | As reported | | $ | 45,717 | |
| |
Add: stock-based employee compensation expense included in reported net income (loss), net of related tax effects of $955 and $359, respectively |
|
1,643 |
|
617 |
|
Add: stock-based compensation expense included in reported net income, net of related tax effects of $955 |
|
1,643 |
|
| |
Deduct: Total stock-based employee compensation expense determined under the fair value based method for all awards, net of related tax effects of $1,919 and $1,437, respectively |
|
(2,473 |
) |
|
(3,300 |
) |
Deduct: total stock-based employee compensation expense determined under the fair value based method for all awards, net of related tax effects of $1,919 |
|
(2,473 |
) |
| | | |
| |
| | | |
| |
| | Pro forma | | $ | 44,887 | | $ | (34,909 | ) | Pro forma net income | | $ | 44,887 | |
| | | |
| |
| | | |
| |
Basic earnings per share: |
Basic earnings per share: |
|
|
|
|
|
Basic earnings per share: |
|
|
|
| | As reported | | $ | 0.34 | | $ | (0.24 | ) | As reported | | $ | 0.34 | |
| | Pro forma | | $ | 0.34 | | $ | (0.26 | ) | Pro forma | | $ | 0.34 | |
| Diluted earnings per share: | Diluted earnings per share: | | | | | |
Diluted earnings per share: |
|
|
|
| | As reported | | $ | 0.34 | | $ | (0.24 | ) | As reported | | $ | 0.34 | |
| | Pro forma | | $ | 0.33 | | $ | (0.26 | ) | Pro forma | | $ | 0.33 | |
For additional information regarding the computations presented above, see Note 14—16—"Stockholders' Equity.Equity-Based Compensation."
In addition toJune 2005, the stock option grants discussed above, beginning in 2005 weCompany began making grants of shares and restrictedgranting shares of common stock to its non-employee directors and restricted stock to certain of our employees and non-employee directors.its employees. These sharesawards have vesting periods ranging from zero to three years. For shares with immediate vesting, the Company recognized currently in earnings expense an amount equal to the intrinsic value of the shares on the date of grant. For restricted shares that did not immediately vest, the compensation cost equal to the intrinsic value of the grant, net of actual and estimated forfeitures, was recognized in earnings ratably over the vesting period of the grant. In 2006, subjectSubject to the provisions of SFAS 123(R), the Company recognizedrecognizes expense in earnings related to these awards equal to the fair value of the shares vesting during the period, net of actual and estimated forfeitures.
Key Energy Services, Inc. and Subsidiaries
NOTES TO CONSOLIDATED FINANCIAL STATEMENTS (Continued)
1. ORGANIZATION AND SUMMARY OF SIGNIFICANT ACCOUNTING POLICIES (Continued)
In December 2006, the Company began granting "Phantom Shares" to certain of its employees, which vest ratably over a four-year period from the date of grant. The Phantom Shares convey the right to the grantee to receive a cash payment on each anniversary of the grant date equal to the fair market value of the Phantom Shares vesting on that date. Grantees are not permitted to defer the payout to a later date. The Phantom Shares qualify as a "liability"-type award awards under the provisions of SFAS 123(R); as such, and the Company accounts for the Phantom Sharesthese awards at fair value, with the fair value of the Phantom Shares recorded as a liability onin our Consolidated Balance Sheets.consolidated balance sheets. Changes in the fair value of the liability, net of actual and estimated forfeitures, are recorded currently in earnings as compensation expense.
In August 2007, the Company issued stock appreciation rights ("SARs") to its executive officers. Each SAR award has a ten-year term from the date of grant and vests in equal annual installments on the first, second and third anniversaries of the date of grant. Upon the exercise of a SAR, the recipient will receive an amount equal to the difference between the exercise price and the fair market value of a share of the Company's common stock on the date of exercise multiplied by the number of shares of common stock for which the SAR was exercised. All payments will be made in shares of the Company's common stock. Prior to exercise, the SAR does not entitle the recipient to receive any shares of the Company's common stock and does not provide the recipient with any voting or other stockholder rights. The Company accounts for SARs as equity awards under SFAS 123(R) and recognizes compensation expense over the vesting period of the award based on their fair value on the date of issuance, net of estimated and actual forfeitures.
Foreign Currency Gains and Losses
The local currency is the functional currency for our foreign operations in Argentina, Mexico and our former Canadian operations. The U.S. dollar is the functional currency for our former operations in Egypt.Canada. The cumulative translation gains and losses resulting from translating each foreign subsidiary's financial statements from the functional currency to U.S. dollars are included as a separate component of stockholders' equity in other comprehensive income until a partial or complete sale or liquidation of our net investment in the foreign entity.
From time to time our foreign subsidiaries may enter into transactions that are denominated in currencies other than their functional currency. These transactions are initially recorded in the functional currency of that subsidiary based on the applicable exchange rate in effect on the date of the transaction. At the end of each month, these transactions are remeasured to an equivalent amount of the functional currency based on the applicable exchange rates in effect at that time. Any adjustment required to remeasure a transaction to the equivalent amount of the functional currency at the end of the month is recorded in the income or loss of the foreign subsidiary as a component of other income and expense. See Note 13—"Foreign Currency Translation."
Leases
We account for leases in accordance with Statement of Financial Accounting StandardsSFAS No. 13, "Accounting for Leases" ("SFAS 13"). Certain of our operating lease agreements are structured to include scheduled and specified rent increases over the term of the lease agreement. These increases may be the result of an inducement or "rent holiday" conveyed to us early in the lease, or are included to reflect the anticipated effects of inflation. We apply the provisions of FASB Technical Bulletin No. 85-3, "Accounting for Operating Leases with Scheduled Rent Increases" ("FTB 85-3"), when accounting for scheduled and specified rent increases. FTB 85-3 provides that the effects of scheduled and specified rent increases should be recognized on a straight-line basis over the lease term unless another systematic and rational allocation
Key Energy Services, Inc. and Subsidiaries
NOTES TO CONSOLIDATED FINANCIAL STATEMENTS (Continued)
1. ORGANIZATION AND SUMMARY OF SIGNIFICANT ACCOUNTING POLICIES (Continued)
basis is more representative of the time pattern in which the leased property is physically employed. We recognize scheduled and specified rent increases on a straight-line basis over the term of the lease agreement.
In addition, certain of our operating lease agreements contain incentives to induce us to enter into the lease agreement, such as up-front cash payments to us, payment by the lessor of our costs, such as moving expenses, or the assumption by the lessor of our pre-existing lease agreements with third parties. Any payments made to us or on our behalf represent incentives that we consider to be a reduction of our rent expense, and are recognized on a straight-line basis over the term of the lease agreement. We amortize leasehold improvements on our operating leases over the shorter of their economic lives or the lease term.
Sales Taxes
In accordance with EITF Issue No. 06-03, "How Taxes Collected from Customers and Remitted to Governmental Authorities Should be Presented in the Income Statement (That is, Gross versus Net Presentation)" ("EITF 06-03"), we show our revenues net of any sales taxes collected by us from our customers that are required to be remitted to local or state governmental taxing authorities.
New Accounting Pronouncements
Standards Affecting this Report
SFAS 157.FIN 48 and FSP FIN 48-1. In SeptemberJune 2006, the FASB issued Statement of Financial Accounting Standards No. 157, "Fair Value Measurements" ("SFAS 157"). SFAS 157 establishes a framework for measuring fair value and requires expanded disclosure about the information used to measure fair value. The
statement applies whenever other statements require or permit assets or liabilities to be measured at fair value. SFAS 157 does not expand the use of fair value accounting in any new circumstances and is effective for the Company for the year ended December 31, 2008 and for interim periods included in that year, with early adoption encouraged. The Company is evaluating the effect of adoptionFIN 48, which provides clarification of SFAS 157 on its109 with respect to the recognition of income tax benefits of uncertain tax positions in financial position, results of operations and cash flows.
SFAS 158. In September 2006, the FASB issued Statement of Financial Accounting Standards No. 158, "Employer's Accounting for Defined Benefit Pension and Other Postretirement Plans—an amendment of FASB Statements No. 87, 88, 106, and 123(R)" ("SFAS 158"). SFAS 158 requires an entity that is the sponsor of a plan within the scope of the statement to (a) recognize on its balance sheet as an asset a plan's over-funded status or as a liability such plan's under-funded status; (b) measure a plan's assets and obligations as of the end of the entity's fiscal year; and (c) recognize changes in the funded status of its plans in the year in which changes occur through adjustments to other comprehensive income. Adoption of the provisions of SFAS 158 is required for public companies for the first fiscal year ending after December 15, 2006. Because the Company is not a sponsor of a defined postretirement benefit plan as defined by SFAS 158, the adoption of this standard will not have a material impact on the Company's financial position, results of operations, or cash flows.
FIN 48. In December 2006, the Financial Accounting Standards Board ("FASB") issued FASB Interpretation No. 48, "Accounting for Uncertainty in Income Taxes—an Interpretation of FASB Statement No. 109" ("FIN 48").statements. FIN 48 clarifies the accounting for uncertainty in income taxes recognized in an enterprise's financial statements in accordancerequires that uncertain tax positions be reviewed and assessed, with FASB Statement No. 109. FIN 48 prescribes a recognition threshold and measurement attribute for the financial statement recognition and measurement of the tax benefit based on a "more likely than not" standard.
In May 2007 the FASB issued FSP FIN 48-1. FSP FIN 48-1 provides guidance on how an enterprise should determine whether a tax position takenis effectively settled for the purpose of recognizing previously unrecognized tax benefits. In determining whether a tax position has been effectively settled, entities must evaluate (i) whether taxing authorities have completed their examination procedures; (ii) whether the entity intends to appeal or expectedlitigate any aspect of a tax position included in a completed evaluation; and (iii) whether it is remote that a taxing authority would examine or re-examine any aspect of a taxing position. FSP FIN 48-1 is to be taken in a tax return.applied upon the initial adoption of FIN 48 also provides guidance or derecognition, classification, interest and penalties, accounting in interim periods, disclosure, and transition. The48.
We adopted the provisions of FIN 48 are effective for fiscal years beginning after December 15, 2006 and FSP FIN 48-1 on January 1, 2007 and recorded a $1.3 million decrease to the cumulative effectbalance of adopting FIN 48 will be recorded as an adjustment toour retained earnings as of January 1, 2007. In our evaluation2007 to reflect the cumulative effect of adopting FIN 48, we do not expectthese standards. See Note 10—"Income Taxes" for further discussion of the impact of the adoption to have a material impact on our consolidated financial statements.of these standards.
FSP EITF 00-19-2. In December 2006, the FASB issued FASB Staff Position No. EITF 00-19-2, "Accounting for Registration Payment Arrangements" ("FSP EITF 00-19-2"). FSP EITF 00-19-2 addresses accounting for Registration Payment Arrangements ("RPAs"), which are provisions within financial instruments such as equity shares, warrants or debt instruments in which the issuer agrees to file a registration statement and to have that registration statement declared effective by the SECSecurities and Exchange Commission (the "SEC") within a specified grace period. If the registration statement is not declared effective within the grace period or its effectiveness is not maintained for the period of time specified in the RPA, the issuer must compensate its counterparty. The FASB Staff concluded that the contingent obligation to make future payments or otherwise transfer consideration under a RPA should be recognized as a liability and measured in accordance with SFAS 5 and FASB Interpretation No. 14, "Reasonable Estimation of the Amount of a Loss"Loss," and that the RPA should be recognized and measured separately from the instrument to which the RPA is attached.
As discussed more fully in Note 11—"Long-Term Debt," inIn January 1999, the Company completed the private placement of 150,000 units (the "Units") consisting of $150.0 million of 14% Senior Subordinated Notes due January 25, 2009 (the "14% Senior Subordinated Notes") and 150,000 warrants to purchase 1,253,350an aggregate of approximately 2.2 million shares of the Company's common stock at an exercise price of $4.88125 per share (the "Warrants"). As of
Key Energy Services, Inc. and Subsidiaries
NOTES TO CONSOLIDATED FINANCIAL STATEMENTS (Continued)
1. ORGANIZATION AND SUMMARY OF SIGNIFICANT ACCOUNTING POLICIES (Continued)
December 31, 2006, 63,5002007, 65,000 Warrants had been exercised, leaving 86,500 outstanding.
85,000 Warrants outstanding that were exercisable for an aggregate of approximately 1.2 million shares. Under the terms of the Warrants, we are required to maintain an effective registration statement covering the shares of common stock issuable upon exercise. If we are unable to maintain an effective registration statement, we are required to paymake semiannual liquidated damages payments for periods in which an effective
registration statement is not maintained.
Due to our past failure to file our SEC reports in a timely manner, we do not have been unable to maintain an effective registration statement.statement covering the Warrants, and have been required to make liquidated damages payments, and will continue to be required to make those payments until such time as we have an effective registration statement on file for exercise of the Warrants or the warrant shares issuable thereunder are eligible for resale without registration pursuant to SEC Rule 144 or otherwise. The requirement to make liquidated damages payments under the terms of the Warrant agreement constitutes aan RPA under the provisions of FSP EITF 00-19-2. On00-19-2, and as prescribed by the transition provisions of that standard, on January 1, 2007 the Company recorded a pre-tax current liability of approximately $1.0 million, on its balance sheet,which is equivalent to the payments for the Warrant RPA for one year, with an offsetting adjustment to the opening balance of retained earnings, as prescribedearnings.
Accounting Standards Not Yet Adopted in this Report
SFAS 157. In September 2006, the FASB issued SFAS No. 157, "Fair Value Measurements" ("SFAS 157"). SFAS 157 establishes a framework for measuring fair value and requires expanded disclosure about the information used to measure fair value. The statement applies whenever other statements require or permit assets or liabilities to be measured at fair value, and does not expand the use of fair value accounting in any new circumstances.
In February 2008, the FASB issued FASB Staff Position FIN 157-2 ("FSP FIN 157-2"), which delayed the effective date by which companies must adopt the transition provisions of SFAS 157. FSP EITF 00-19-2, whichFIN 157-2 defers the effective date of SFAS 157 to fiscal years beginning after November 15, 2008, and interim periods within those fiscal years. The adoption of this standard is equivalent payments for the Warrant RPA for one year. This amount represents the low endnot anticipated to have a material impact on our financial position, results of a range of possible outcomes. If we continue to be unable to maintain an effective registration statement with the SEC, the total amount of liquidated damages payable under the Warrant RPA could be as high as $1.4 million. Any subsequent changes in the carrying value of the RPA liability will be recorded contemporaneously in earnings as other income and expense.operations, or cash flows.
SFAS 159. In February 2007, the FASB issued Statement of Financial Accounting StandardsSFAS No. 159, "The Fair Value Option for Financial Assets and Liabilities, including an amendment of FASB Statement No. 115" ("SFAS 159"). SFAS 159 permits companies to choose, at specified election dates, to measure eligible items at fair value (the "Fair Value Option"). Companies choosing such an election would report unrealized gains and losses on items for which the Fair Value Option has been elected in earnings at each subsequent reporting period. This standard is effective as of the beginning of the first fiscal year that begins after November 15, 2007. The adoptionWe adopted the provisions of this standard on January 1, 2008. We did not elect to measure any of our financial assets or liabilities using the Fair Value Option. We will assess at each measurement date whether to use the Fair Value Option on any future financial assets or liabilities as permitted pursuant to the provisions of SFAS 159.
SFAS 141(R). In December 2007, the FASB issued SFAS No. 141 (Revised 2007), "Business Combinations" ("SFAS 141(R)"). SFAS 141(R) will significantly change the accounting for business combinations. Under SFAS 141(R), an acquiring entity will be required to recognize all the assets and
Key Energy Services, Inc. and Subsidiaries
NOTES TO CONSOLIDATED FINANCIAL STATEMENTS (Continued)
1. ORGANIZATION AND SUMMARY OF SIGNIFICANT ACCOUNTING POLICIES (Continued)
liabilities assumed in a transaction at the acquisition-date fair value, with limited exceptions. Specific changes in SFAS 141(R) from previously issued guidance include:
- •
- Acquisition costs will generally be expensed as incurred;
- •
- Noncontrolling interests will be valued at fair value at the acquisition date;
- •
- Acquired contingent liabilities will be recorded at fair value at the acquisition date and subsequently remeasured at either the higher of such amount or the amount determined under existing guidance for non-acquired contingencies;
- •
- In-process research and development will be recorded at fair value as an indefinite-lived intangible asset at the acquisition date;
- •
- Restructuring costs associated with a business combination will generally be expensed subsequent to the acquisition date; and
- •
- Changes in deferred tax asset valuation allowances and income tax uncertainties after the acquisition date generally will affect income tax expense.
SFAS 141(R) also includes new disclosure requirements related to business combinations. This statement applies to all business combinations for which the acquisition date is not anticipated to have a materialon or after the beginning of the first annual reporting period beginning on or after December 15, 2008, and earlier adoption is prohibited. The Company is still in the process of determining the impact of the adoption of the standard on ourthe Company's financial position, results of operations, and cash flows.
SFAS 160. In December 2007 the FASB issued SFAS No. 160, "Noncontrolling Interests in Consolidated Financial Statements: an amendment of ARB No. 51" ("SFAS 160"). SFAS 160 establishes new accounting and reporting standards for the noncontrolling interest (formerly referred to as "minority interests") in a subsidiary and for the deconsolidation of a subsidiary. Specifically, this statement requires the recognition of a noncontrolling interest as equity in the consolidated financial statements and separate from the parent's equity. The amount of net income attributable to a noncontrolling interest will be included in consolidated net income on the face of the income statement. SFAS 160 clarifies that changes in a parent's ownership interest in a subsidiary that do not result in deconsolidation are equity transactions if the parent retains its controlling financial interest. In addition, SFAS 160 requires that a parent recognize a gain or loss in net income when a subsidiary is deconsolidated. Such gains or loss will be measured using the fair value of the noncontrolling equity investment on the deconsolidation date. SFAS 160 also includes expanded disclosure requirements regarding the interests of the parent and its noncontrolling interest. SFAS 160 is effective for fiscal years and interim periods within those fiscal years, beginning on or after December 15, 2008, with early adoption prohibited. The Company is still in the process of determining the impact of the adoption of this standard on the Company's financial position, results of operations, and cash flows.
2. ACQUISITIONS
Moncla Well Service, Inc. and related entities
On October 25, 2007, we completed our acquisition of Moncla, which operates in Texas, Louisiana, Mississippi, Alabama, and Florida. Collectively, the Moncla assets included daylight rigs for well servicing and workovers and twenty-four hour rigs for shallow drilling, sidetracking and deep workovers. In addition, Moncla operated barge rigs, and owned rig-up, swab, hot oil and anchor trucks, tubing
Key Energy Services, Inc. and Subsidiaries
NOTES TO CONSOLIDATED FINANCIAL STATEMENTS (Continued)
2. ACQUISITIONS (Continued)
testing units and rental equipment. The Moncla acquisition was made in order to expand our service offerings and meet our customers' service needs in Texas, Louisiana, Mississippi, Alabama and Florida.
The purchase price for Moncla was approximately $146.0 million, which consisted of net assets acquired of $131.3 million and assumed debt of $14.7 million. Amounts transferred at closing consisted of (i) $108.6 million of cash; (ii) the issuance of an unsecured promissory note for $12.5 million that is payable in a lump sum on October 25, 2009, with accrued interest payable on each anniversary date of the closing of the acquisition; and (iii) the issuance of an unsecured promissory note for $10.0 million that is payable in five annual installments of $2.0 million plus accrued interest on each annual anniversary date of the closing of the acquisition. Both promissory notes bear interest at the Federal Funds rate, adjusted annually on the anniversary of the closing date. The long-term debt assumed in the acquisition was repaid simultaneously with the closing of the transaction. The purchase price is subject to a working capital adjustment, which has not been finalized.
The Moncla purchase agreement entitles the former owners of Moncla to receive earnout payments, on each of the next five anniversary dates of the closing date of the acquisition, of up to $5.0 million (up to $25.0 million in total). The earnout payments are based on the achievement of certain revenue targets and profit percentage targets over the next five years and are payable upon achieving annual targets or a cumulative target on the fifth anniversary date. These payments represent an additional element of cost of the acquired entity and will be accounted for as an increase to goodwill if and when the contingent payment is made.
The total purchase price was allocated to Moncla's net tangible and identifiable intangible assets based on their estimated fair values. The excess of the purchase price over the net assets was recorded as goodwill. The preliminary allocation of the purchase price was based upon preliminary valuations and estimates, and these are subject to change as the valuations are finalized. The primary areas of the purchase price allocation which are not yet finalized relate to identifiable intangible assets, completion of the analysis of the acquired tax bases of the assets, and pre-merger contingencies related to environmental exposures. The final valuation of net assets is expected to be completed no later than the fourth quarter of 2008.
Key Energy Services, Inc. and Subsidiaries
NOTES TO CONSOLIDATED FINANCIAL STATEMENTS (Continued)
2. ACQUISITIONS (Continued)
The following table summarizes the preliminary estimated fair values of the assets acquired and liabilities assumed on the date of the acquisition (in thousands):
| Cash | | $ | 1,527 |
| Other current assets | | | 28,633 |
| Property and equipment | | | 101,862 |
| Goodwill | | | 34,339 |
| Intangible assets | | | 28,273 |
| Other assets | | | 271 |
| | |
|
| | Total assets acquired | | | 194,905 |
Current liabilities |
|
|
21,548 |
| Long-term debt and capital leases | | | 14,765 |
| Other liabilities | | | 671 |
| Deferred tax liability | | | 26,590 |
| | |
|
| | Total liabilities assumed | | | 63,574 |
| | |
|
| | Net assets acquired | | $ | 131,331 |
| | |
|
The preliminary allocation of the purchase price is based upon the fair values of assets and liabilities acquired. The fair values of property and equipment were determined using a market approach, depending on the asset being valued. The fair values of identified intangible assets were determined using an income approach to measure the present worth of anticipated economic benefits. We also performed an economic obsolescence analysis to confirm the values identified through the above methods. The allocation is still preliminary at this time, and may potentially change by a material amount once purchase accounting is finalized.
Goodwill was recognized as part of the acquisition of Moncla as the purchase price exceeded the fair value of the acquired assets and liabilities. We believe that the goodwill associated with the Moncla acquisition is related to the acquired workforce and potential future expansion and the ability to expand our service offerings. Therefore, it was not allocated to the assets and liabilities acquired.
All of the $28.3 million of acquired identified intangible assets is subject to amortization under SFAS 142 and has a weighted-average remaining useful life of approximately nine years. These intangible assets relate to customer relationships of $25.1 million and noncompete agreements of $3.2 million. The noncompete agreements will be amortized to expense on a straight-line basis over the expected duration of the respective agreement. The intangible asset associated with customer relationships will be amortized as the value of the relationships are realized using rates of 6.56%, 31.33%, 19.49%, 12.74%, 8.78%, and 21.10% for 2007, 2008, 2009, 2010, 2011 and the remaining periods, respectively. The $34.3 million of goodwill associated with the purchase of Moncla has been allocated to our well servicing segment; of that amount, approximately $25.6 million is expected to be deductible for income tax purposes.
The following presents the consolidated financial information for the Company on a pro forma basis, assuming the acquisition of Moncla had occurred as of January 1, 2006. The historical financial information has been adjusted to give effect to pro forma items that are directly attributable to the acquisition and expected to have a continuing impact on the consolidated results. These items include adjustments to record incremental amortization and depreciation expense related to the increase in fair
Key Energy Services, Inc. and Subsidiaries
NOTES TO CONSOLIDATED FINANCIAL STATEMENTS (Continued)
2. ACQUISITIONS (Continued)
value of the acquired assets, to reflect change in depreciation methodology, and to reclassify certain items to conform to the Company's financial reporting presentation.
The unaudited financial information set forth below has been compiled from historical financial statements and other information, but is not necessarily indicative of the results that actually would have been achieved had the transaction occurred on the dates indicated or that may be achieved in the future.
| | Year Ended December 31,
|
|---|
| | 2007
| | 2006
|
|---|
| | As reported
| | Proforma
Adjustments
| | Proforma
| | As reported
| | Proforma
Adjustments
| | Proforma
|
|---|
| | (in thousands, except for per share data)
|
|---|
| | (unaudited)
|
|---|
| Revenues | | $ | 1,662,012 | | $ | 105,341 | | $ | 1,767,353 | | $ | 1,546,177 | | $ | 104,282 | | $ | 1,650,459 |
| Net income | | $ | 169,289 | | $ | 7,418 | | $ | 176,707 | | $ | 171,033 | | $ | 5,338 | | $ | 176,371 |
Basic earnings per share |
|
$ |
1.29 |
|
$ |
0.06 |
|
$ |
1.35 |
|
$ |
1.30 |
|
$ |
0.04 |
|
$ |
1.34 |
| Diluted earnings per share | | $ | 1.27 | | $ | 0.05 | | $ | 1.32 | | $ | 1.28 | | $ | 0.04 | | $ | 1.32 |
Kings Oil Tools, Inc.
On December 7, 2007, the Company acquired the well service assets and related equipment of Kings, a California-based well service company. The acquired assets, all of which are located in California, include 36 marketed well service rigs, 10 stacked well service rigs and related support equipment. We made this acquisition to expand our business in California. Total consideration paid for the transaction was approximately $45.1 million in cash, including transaction-related costs. We analyzed this acquisition as required under SFAS No. 141, "Business Combinations" ("SFAS 141"), and determined that the acquired assets and facts and circumstances of this transaction met the criteria of a "business" as that term is defined under EITF 98-3, "Determining Whether a Nonmonetary Transaction Involves Receipt of Productive Assets or of a Business" ("EITF 98-3"), and have accounted for this asset purchase as a business combination.
The following table summarizes the preliminary estimated fair values of the assets acquired and liabilities assumed on the date of acquisition (in thousands):
| Property and equipment | | $ | 17,563 |
| Goodwill | | | 18,958 |
| Intangible assets | | | 11,000 |
| | |
|
| | Total assets acquired | | | 47,521 |
| | |
|
Current liabilities |
|
|
2,400 |
| | |
|
| | Net assets acquired | | $ | 45,121 |
| | |
|
The preliminary allocation of purchase price to specific assets and liabilities is based upon the fair values of identified assets and liabilities acquired. The fair values of property and equipment was determined for property and equipment using a market or cost approach, depending on the asset being valued. The allocation is still preliminary at this time, and may potentially change by a material amount
Key Energy Services, Inc. and Subsidiaries
NOTES TO CONSOLIDATED FINANCIAL STATEMENTS (Continued)
2. ACQUISITIONS (Continued)
as our purchase accounting is finalized. We believe certain customer-related intangibles were also acquired in this purchase and are utilizing an income approach to value these items as we have not completed our analysis and valuation. However, we have not allocated any purchase price to this asset in the financial statements. We anticipate finalizing our allocation of purchase price in the second quarter of 2008, once our valuation of the intangible assets is completed.
Goodwill has been recognized as part of the acquisition of the assets of Kings as the purchase price exceeded the fair value of the acquired assets and liabilities absent the allocation of value to identified intangible assets. We believe that the goodwill associated with the acquisition is related primarily to the acquired workforce. Therefore, it was not allocated to the assets and liabilities acquired.
All of the $11.0 million of acquired intangible assets is related to a noncompete agreement and subject to amortization under SFAS 142 and has a weighted-average remaining useful life of 5 years. The $19.0 million of purchase price preliminarily associated with goodwill has been allocated to our well servicing segment. The entire amount is expected to be deductible for income tax purposes. We are not including the pro-forma effect of this acquisition because the impact is not material to our results of operations.
Advanced Measurements, Inc.
On September 5, 2007, the Company, through a wholly-owned Canadian subsidiary, purchased all of the outstanding shares of AMI, a privately-held Canadian technology company focused on oilfield service equipment controls, data acquisition, and digital information work flow. We made this acquisition in order to improve our access to oilfield services technology.
The purchase price was approximately $6.6 million in cash and approximately $2.9 million of assumed debt, which was repaid in September and November 2007. The purchase agreement also provided for deferred cash payments of up to $1.8 million related to the retention of key AMI employees. These deferred payments will be recognized as an expense over the period that the services are rendered.
On the date of acquisition, AMI owned a 48% interest in AFTI, a privately-held Canadian technology company focused on low-cost wireless gas well production monitoring. As part of the purchase of AMI, we were required to exercise an option to increase AMI's interest in AFTI to 51.46%. The cost to exercise this option was approximately $0.5 million. As a result, through our acquisition of AMI we now own a 51.46% interest in AFTI, and we consolidate AFTI into our financial statements, with the remaining 48.54% representing a minority interest.
Key Energy Services, Inc. and Subsidiaries
NOTES TO CONSOLIDATED FINANCIAL STATEMENTS (Continued)
2. ACQUISITIONS (Continued)
The following table summarizes the preliminary estimated fair values of the assets acquired and liabilities assumed at the date of acquisition (in thousands):
| Cash | | $ | 672 |
| Other current assets | | | 3,240 |
| Property and equipment | | | 388 |
| Goodwill | | | 4,523 |
| Intangible assets | | | 5,894 |
| Other assets | | | 824 |
| | |
|
| | Total assets acquired | | | 15,541 |
| | |
|
Current liabilities |
|
|
2,246 |
| Long-term debt and capital leases | | | 2,884 |
| Deferred tax liability | | | 2,804 |
| | |
|
| | Total liabilities assumed | | | 7,934 |
| Minority interest | | | 357 |
| | |
|
| | Net assets acquired | | $ | 7,250 |
| | |
|
The preliminary allocation of the purchase price is based upon the fair values of assets and liabilities acquired. The fair values of identified intangible assets were determined using an income approach to measure the present worth of anticipated economic benefits. We also performed a business enterprise valuation to confirm the values identified through the income approach. Goodwill was recognized as part of the acquisition of AMI as the purchase price exceeded the fair value of the acquired assets and liabilities. We believe that the goodwill associated with the AMI acquisition is related to the acquired workforce and the potential future development of technology by this workforce. Therefore, it was not allocated to the assets and liabilities acquired.
All of the $5.9 million of acquired identified intangible assets is subject to amortization under SFAS 142 and has a weighted-average remaining useful life of approximately 3.6 years. The intangible assets identified relate to developed technology ($4.8 million), customer backlog ($1.0 million) and noncompete agreements ($0.1 million). The $4.5 million of goodwill associated with the purchase has been allocated to our well servicing segment, as the technologies developed are anticipated to benefit these operations; of that amount, none is expected to be deductible for income tax purposes.
The preliminary allocation of the purchase price was based upon preliminary valuations and estimates, and these are subject to change as the valuations are finalized. The primary areas of the purchase price allocation which are not yet finalized relate to the completion of the analysis of the acquired tax bases of the assets. The final valuation of net assets is expected to be completed no later than the third quarter of 2008.
In connection with the acquisition of AMI, we also became party to a revolving credit agreement with a maximum outstanding amount of $0.9 million. This facility was extinguished in November 2007, and the outstanding balance was paid with cash.
We are not including the pro-forma effect of this acquisition because the impact is not material to our results of operations.
Key Energy Services, Inc. and Subsidiaries
NOTES TO CONSOLIDATED FINANCIAL STATEMENTS (Continued)
3. SUPPLEMENTAL FINANCIAL INFORMATION
| | December 31,
|
|---|
| | 2007
| | 2006
|
|---|
| | (in thousands)
|
|---|
| Current accrued liabilities: | | | | | | |
| Accrued payroll, taxes and employee benefits | | $ | 56,744 | | $ | 58,904 |
| Accrued operating expenditures | | | 52,180 | | | 41,856 |
| Income, sales, use and other taxes | | | 35,310 | | | 30,282 |
| Self-insurance reserves | | | 25,208 | | | 24,378 |
| Unsettled legal claims | | | 6,783 | | | 28,754 |
| Phantom share liability | | | 2,458 | | | — |
| Assumed executory contract | | | 1,120 | | | — |
| Deferred revenue | | | 976 | | | — |
| Other | | | 2,585 | | | 5,396 |
| | |
| |
|
| | Total | | $ | 183,364 | | $ | 189,570 |
| | |
| |
|
| | December 31,
|
|---|
| | 2007
| | 2006
|
|---|
| | (in thousands)
|
|---|
| Non-current accrued liabilities: | | | | | | |
| Asset retirement obligations | | $ | 9,298 | | $ | 9,622 |
| Environmental liabilities | | | 3,090 | | | 4,683 |
| Accrued rent | | | 2,829 | | | 3,241 |
| Accrued income taxes | | | 2,705 | | | 2,507 |
| Phantom share liability | | | 896 | | | — |
| Other | | | 713 | | | 1,203 |
| | |
| |
|
| | Total | | $ | 19,531 | | $ | 21,256 |
| | |
| |
|
| | December 31,
| |
|---|
| | 2007
| | 2006
| |
|---|
| | (in thousands)
| |
|---|
| Major classes of property and equipment: | | | | | | | |
| Well servicing equipment | | $ | 1,200,069 | | $ | 950,952 | |
| Disposal wells | | | 56,576 | | | 47,942 | |
| Motor vehicles | | | 112,986 | | | 105,858 | |
| Furniture and fixtures | | | 73,032 | | | 78,143 | |
| Buildings and land | | | 64,258 | | | 58,786 | |
| Work in progress | | | 88,304 | | | 38,299 | |
| | |
| |
| |
| | Gross property and equipment | | | 1,595,225 | | | 1,279,980 | |
| Accumulated depreciation | | | (684,017 | ) | | (585,689 | ) |
| | |
| |
| |
| | Net property and equipment | | $ | 911,208 | | $ | 694,291 | |
| | |
| |
| |
Key Energy Services, Inc. and Subsidiaries
NOTES TO CONSOLIDATED FINANCIAL STATEMENTS (Continued)
3. SUPPLEMENTAL FINANCIAL INFORMATION (Continued)
| | December 31,
|
|---|
| | 2007
| | 2006
|
|---|
| | (in thousands)
|
|---|
| Carrying values of assets leased under capital lease obligations: | | | | | | |
| | Well servicing equipment | | $ | 19,687 | | $ | 23,713 |
| | Motor vehicles | | | 5,938 | | | 2,589 |
| | |
| |
|
| | | Total | | $ | 25,625 | | $ | 26,302 |
| | |
| |
|
| | December 31,
| |
|---|
| | 2007
| | 2006
| |
|---|
| | (in thousands)
| |
|---|
| Deferred financing costs: | | | | | | | |
| | Gross carrying value | | $ | 12,262 | | $ | 12,042 | |
| | Accumulated amortization | | | (145 | ) | | (2,090 | ) |
| | |
| |
| |
| | | Net carrying value | | $ | 12,117 | | $ | 9,952 | |
| | |
| |
| |
| | Year Ended December 31,
|
|---|
| | 2007
| | 2006
| | 2005
|
|---|
| | (in thousands)
|
|---|
| Noncash investing and financing activities: | | | | | | | | | |
| Property and equipment acquired under captial lease obligations | | $ | 12,003 | | $ | 15,349 | | $ | 18,267 |
| Equity investment in IROC Systems Corp | | | — | | | — | | | 9,019 |
| Asset retirement obligations | | | 12 | | | 155 | | | 119 |
| Unrealized gain on short-term investments | | | — | | | 328 | | | — |
| Unrealized gain on cash flow hedges | | | — | | | 185 | | | — |
| Capital lease portion of sale-leaseback transactions | | | — | | | — | | | 4,663 |
| Deferred gain on sale-leaseback transactions | | | — | | | — | | | 1,094 |
| Accrued repurchases of common stock | | | 2,949 | | | — | | | — |
| Debt assumed and issued in acquisitions | | | 40,149 | | | — | | | — |
Supplemental cash flow information: |
|
|
|
|
|
|
|
|
|
| Cash paid for interest | | $ | 38,457 | | $ | 44,534 | | $ | 54,007 |
| Cash paid for taxes | | | 96,327 | | | 99,048 | | | 17,156 |
Cash paid for interest includes cash payments for interest on our long-term debt and capital lease obligations, commitment and agency fees paid, and cash paid to settle the interest rate swaps associated with the termination of our 2005 Senior Secured Credit Facility.
Included in the 2007 consolidated statement of cash flows are approximately $21.2 million in cash outflows related to the settlement of litigation with our former chief executive officer. The amount was previously accrued for in 2004.
Key Energy Services, Inc. and Subsidiaries
NOTES TO CONSOLIDATED FINANCIAL STATEMENTS (Continued)
4. GOODWILL AND OTHER INTANGIBLE ASSETS
The following table presents a summarization of the activity in our goodwill accounts for the years ended December 31, 2007 and 2006:
| | Well Servicing Segment
| | Pressure Pumping Segment
| | Fishing and Rental Segment
| | Total
| |
|---|
| | (in thousands)
| |
|---|
| December 31, 2005 | | $ | 254,116 | | $ | 47,905 | | $ | 18,901 | | $ | 320,922 | |
| | Goodwill acquired during period | | | — | | | — | | | — | | | — | |
| | Foreign currency translation and other | | | (10 | ) | | — | | | — | | | (10 | ) |
| | |
| |
| |
| |
| |
| December 31, 2006 | | $ | 254,106 | | $ | 47,905 | | $ | 18,901 | | $ | 320,912 | |
| | |
| |
| |
| |
| |
| | Goodwill acquired during period | | | 57,820 | | | — | | | — | | | 57,820 | |
| | Foreign currency translation and other | | | (182 | ) | | — | | | — | | | (182 | ) |
| | |
| |
| |
| |
| |
| December 31, 2007 | | $ | 311,744 | | $ | 47,905 | | $ | 18,901 | | $ | 378,550 | |
| | |
| |
| |
| |
| |
The following tables present the gross carrying values and accumulated amortization of our identified intangible assets with determinable lives that are subject to amortization under SFAS 142 as of December 31, 2007 and 2006:
| | December 31,
| |
|---|
| | 2007
| | 2006
| |
|---|
| | (in thousands)
| |
|---|
| Noncompete agreements: | | | | | | | |
| | Gross carrying value | | $ | 18,402 | | $ | 9,401 | |
| | Accumulated amortization | | | (2,772 | ) | | (7,886 | ) |
| | |
| |
| |
| | | Net carrying value | | $ | 15,630 | | $ | 1,515 | |
| | |
| |
| |
| Patents and trademarks: | | | | | | | |
| | Gross carrying value | | $ | 4,150 | | $ | 4,296 | |
| | Accumulated amortization | | | (2,526 | ) | | (2,465 | ) |
| | |
| |
| |
| | | Net carrying value | | $ | 1,624 | | $ | 1,831 | |
| | |
| |
| |
| Customer relationships: | | | | | | | |
| | Gross carrying value | | $ | 25,139 | | $ | — | |
| | Accumulated amortization | | | (1,649 | ) | | — | |
| | |
| |
| |
| | | Net carrying value | | $ | 23,490 | | $ | — | |
| | |
| |
| |
| Customer backlog: | | | | | | | |
| | Gross carrying value | | $ | 999 | | $ | — | |
| | Accumulated amortization | | | (214 | ) | | — | |
| | |
| |
| |
| | | Net carrying value | | $ | 785 | | $ | — | |
| | |
| |
| |
| Developed technology: | | | | | | | |
| | Gross carrying value | | $ | 4,762 | | $ | — | |
| | Accumulated amortization | | | (397 | ) | | — | |
| | |
| |
| |
| | | Net carrying value | | $ | 4,365 | | $ | — | |
| | |
| |
| |
Key Energy Services, Inc. and Subsidiaries
NOTES TO CONSOLIDATED FINANCIAL STATEMENTS (Continued)
4. GOODWILL AND OTHER INTANGIBLE ASSETS (Continued)
Amortization expense for our intangible assets with determinable lives was as follows:
| | Year Ended December 31,
|
|---|
| | 2007
| | 2006
| | 2005
|
|---|
| | (in thousands)
|
|---|
| Noncompete agreements | | $ | 1,919 | | $ | 2,202 | | $ | 2,955 |
| Patents and trademarks | | | 774 | | | 713 | | | 642 |
| Customer relationships | | | 1,649 | | | — | | | — |
| Customer backlog | | | 210 | | | — | | | — |
| Developed technology | | | 389 | | | — | | | — |
| | |
| |
| |
|
| | Total intangible asset amortization expense | | $ | 4,941 | | $ | 2,915 | | $ | 3,597 |
| | |
| |
| |
|
The weighted average remaining amortization periods and expected amortization expense for the next five years for our intangible assets are as follows:
| | Weighted average
remaining
amortization
period (years)
| | Expected Amortization Expense
|
|---|
| | 2008
| | 2009
| | 2010
| | 2011
| | 2012
|
|---|
| |
| | (in thousands)
|
|---|
| Noncompete agreements | | 4.8 | | $ | 4,091 | | $ | 3,192 | | $ | 2,622 | | $ | 2,606 | | $ | 2,389 |
| Patents and trademarks | | 2.9 | | | 724 | | | 449 | | | 233 | | | 163 | | | 55 |
| Customer relationships | | 9.8 | | | 7,877 | | | 4,900 | | | 3,201 | | | 2,208 | | | 1,648 |
| Customer backlog | | 3.3 | | | 268 | | | 194 | | | 194 | | | 129 | | | — |
| Developed technology | | 3.7 | | | 1,191 | | | 1,191 | | | 1,191 | | | 792 | | | — |
| | | | |
| |
| |
| |
| |
|
| | Total | | | | $ | 14,151 | | $ | 9,926 | | $ | 7,441 | | $ | 5,898 | | $ | 4,092 |
| | | | |
| |
| |
| |
| |
|
Included in capitalized costs associated with noncompete agreements during 2007 is approximately $1.8 million related to a two-year noncompete agreement with our former chief executive officer. Through December 31, 2007, amortization of this noncompete agreement was approximately $0.4 million. This noncompete agreement expires on July 1, 2009.
Key Energy Services, Inc. and Subsidiaries
NOTES TO CONSOLIDATED FINANCIAL STATEMENTS (Continued)
5. EARNINGS PER SHARE
The following table presents our basic and diluted earnings per share for the years ended December 31, 2007, 2006 and 2005:
| | Year Ended December 31,
| |
|---|
| | 2007
| | 2006
| | 2005
| |
|---|
| | (in thousands, except per share data)
| |
|---|
| Basic Earnings per Share Computation: | | | | | | | | | | |
| Numerator | | | | | | | | | | |
| | Income from continuing operations | | $ | 169,289 | | $ | 171,033 | | $ | 49,078 | |
| | Discontinued operations, net of tax | | | — | | | — | | | (3,361 | ) |
| | |
| |
| |
| |
| | Net income | | $ | 169,289 | | $ | 171,033 | | $ | 45,717 | |
| | |
| |
| |
| |
| Denominator | | | | | | | | | | |
| | Weighted average shares outstanding | | | 131,194 | | | 131,332 | | | 131,075 | |
Basic Earnings per Share: |
|
|
|
|
|
|
|
|
|
|
| | Income from continuing operations | | $ | 1.29 | | $ | 1.30 | | $ | 0.37 | |
| | Discontinued operations, net of tax | | | — | | | — | | | (0.03 | ) |
| | |
| |
| |
| |
| | Net income | | $ | 1.29 | | $ | 1.30 | | $ | 0.34 | |
| | |
| |
| |
| |
| Diluted Earnings per Share Computation: | | | | | | | | | | |
| Numerator | | | | | | | | | | |
| | Income from continuing operations | | $ | 169,289 | | $ | 171,033 | | $ | 49,078 | |
| | Discontinued operations, net of tax | | | — | | | — | | | (3,361 | ) |
| | |
| |
| |
| |
| | Net income | | $ | 169,289 | | $ | 171,033 | | $ | 45,717 | |
| | |
| |
| |
| |
| Denominator | | | | | | | | | | |
| | Weighted average shares outstanding | | | 131,194 | | | 131,332 | | | 131,075 | |
| | Dilutive effect from stock options | | | 1,518 | | | 2,180 | | | 2,017 | |
| | Dilutive effect from unvested restricted stock | | | 256 | | | — | | | — | |
| | Dilutive effect from warrants | | | 565 | | | 552 | | | 503 | |
| | Dilutive effect from stock appreciation rights | | | 18 | | | — | | | — | |
| | |
| |
| |
| |
| | | | 133,551 | | | 134,064 | | | 133,595 | |
| | |
| |
| |
| |
| Diluted Earnings per Share: | | | | | | | | | | |
| | Income from continuing operations | | $ | 1.27 | | $ | 1.28 | | $ | 0.37 | |
| | Discontinued operations, net of tax | | | — | | | — | | | (0.03 | ) |
| | |
| |
| |
| |
| | Net income | | $ | 1.27 | | $ | 1.28 | | $ | 0.34 | |
| | |
| |
| |
| |
Stock options, warrants and stock appreciation rights are included in the computation of diluted earnings per share using the treasury stock method. Restricted stock grants are legally considered issued and outstanding, but are included in basic and diluted earnings per share only to the extent that they are vested. Unvested restricted stock is included in the computation of diluted earnings per share using the treasury stock method. The diluted earnings per share calculation for the years ended December 31, 2007, 2006 and 2005 excludes options to purchase 495,875, 381,750 and 266,875 shares of the Company's common stock at weighted average exercise prices of $14.78, $15.08, and $12.88,
Key Energy Services, Inc. and Subsidiaries
NOTES TO CONSOLIDATED FINANCIAL STATEMENTS (Continued)
5. EARNINGS PER SHARE (Continued)
respectively, because their exercise prices exceeded the average price of the Company's stock during those years and would therefore be anti-dilutive.
6. SALE-LEASEBACK TRANSACTIONS
We lease certain equipment such as tractors, trailers, frac tanks and forklifts from financial institutions under master lease agreements. Under our former master lease agreements, we were required to provide current annual and quarterly financial reports to the lessor.lessors. Due to our inability to provide audited financial statements for the year ended December 31, 2003 and subsequent periods, we were required to seek waivers and amendments from our equipment lessors or pay off the outstanding leases. Some lessors refused to grant these waivers and demanded settlement of the obligation and our purchase of the equipment.
We entered into two new master lease agreements on August 31, 2005 and October 14, 2005 with a new lessor. Some of the equipment, which was being leased from lessors that demanded settlement, was sold to this new lessor and subsequently leased back from that lessor, which we account for as capital leases. We received an aggregate amount of $5.8 million in proceeds from the sale-leaseback transactions. We realized a gain of $1.1 million on one of the sale-leaseback transactions, which is being amortized to interest expense over the term of the new lease. Amounts recognized in earnings related to the amortization of this deferred gain were $0.2 million, $0.2 million and $0.1 million for the years ended December 31, 2007, 2006 and 2005, respectively. On the other sale-leaseback transaction, we realized a loss of less than $0.1 million, which was immediately recognized in earnings.
See7. INVESTMENT IN IROC ENERGY SERVICES CORP.
On July 22, 2004, we entered into an agreement (the "IROC Agreement") with IROC Energy Services Corp., an Alberta-based oilfield services company ("IROC"), to sell IROC ten remanufactured Skytop well service rigs, along with supporting equipment and inventory. We began delivery of the rigs in the fall of 2004, and these rigs are operated by IROC in Western Canada. The purchase price for the rigs was $7.0 million USD. This amount was converted at an agreed exchange rate of 0.7634 to $9.17 million CDN, and was paid by way of the issuance of 8,187,058 common shares of IROC stock at a deemed issuance price of $1.12 CDN per share. The final four rigs were delivered in 2005, and we recognized a gain of $1.9 million upon delivery, which represents the difference between the aggregate carrying value of the delivered rigs and the fair market value on the delivery date of the IROC shares we received as consideration for those four rigs.
In July 2005, we sold additional well service rig support equipment to IROC for $0.9 million USD. This amount was converted at an agreed exchange rate of 0.7937 to $1.1 million CDN, and was paid by way of the issuance of 547,411 shares of IROC common stock (the "Additional Shares") at a deemed issuance price of $2.09 CDN per share. We recognized a gain of $0.7 million related to this transaction, which represents the difference between the carrying value of the transferred equipment and the fair value of the Additional Shares on the transaction date.
As of December 31, 2007, we owned approximately 8.7 million shares of IROC common stock, which represents approximately 19.7% of IROC's shares on that date. On September 15, 2005, IROC completed a private placement of a series of unsecured non-convertible debentures, which also included 1,050,000 warrants to purchase common shares of IROC. Exercises of these warrants are potentially dilutive of Key's ownership percentage in IROC. IROC shares trade on the Toronto Venture Stock
Key Energy Services, Inc. and Subsidiaries
NOTES TO CONSOLIDATED FINANCIAL STATEMENTS (Continued)
7. INVESTMENT IN IROC ENERGY SERVICES CORP. (Continued)
Exchange and had a closing price of $0.74 CDN per share on December 31, 2007. Pursuant to the terms of the IROC Agreement, Mr. William Austin, our Chief Financial Officer, and Mr. Newton W. Wilson III, our General Counsel, were appointed to the board of directors of IROC.
We have significant influence over the operations of IROC, but do not control it. We account for our investment in IROC using the equity method. The value of our investment in IROC is recorded in our consolidated balance sheets as a non-current asset. The pro rata share of IROC's earnings and losses to which we are entitled are recorded in our consolidated statements of operations as a component of other income and expense, with an offsetting increase or decrease to the value of our investment, as appropriate. Any earnings distributed back to us from IROC in the form of dividends would result in a decrease in the value of our equity investment.
IROC had net income of approximately $2.0 million, $1.8 million and $1.8 million USD for the years ended December 31, 2007, 2006 and 2005, respectively. IROC's total assets as of December 31, 2007 and 2006 were $140.5 million and $76.9 million USD, respectively. Our investment in IROC totaled $11.2 million and $10.7 million at December 31, 2007 and 2006, respectively. In addition to our pro-rata share of IROC's net income, the value of our investment increased during 2007 due to the strengthening of the Canadian dollar against the U.S. dollar. This increase was offset in accumulated other comprehensive income.
During the years ended December 31, 2007, 2006, and 2005, we recorded $0.4 million, $0.4 million and $0.5 million, respectively, of equity income related to our investment in IROC. During the years ended December 31, 2007, 2006 and 2005, no earnings were distributed to us by IROC. Only distributed earnings or any gains or losses arising from the disposal of our investment are reportable for income tax purposes; as a result, the amounts we record for our pro-rata share of IROC's earnings or losses to which we are entitled result in a temporary difference between book and taxable income. Under the provisions of SFAS 109, we record a deferred tax asset or liability, as appropriate, to account for these temporary differences.
An impairment review of our equity method investment in IROC is performed on a quarterly basis to determine if there has been a decline in fair value that is other than temporary. The fair value of the asset is measured using quoted market prices or, in the absence of quoted market prices, fair value is based on an estimate of discounted cash flows. In determining whether the decline is other than temporary, we consider the cyclicality of the industry in which the investment operates, its historical performance, its performance in relation to its peers and the current economic environment. Future conditions in the industry, operating performance and performance in relation to peers and the future economic environment may vary from our current assessment of recoverability. Such future conditions could therefore result in a determination that a decline in fair value is other than temporary. IROC's stock price is currently depressed. If we later determine that the decline is other than temporary, we would record a write-down in the carrying value of our asset to the then current fair market value.
8. ESTIMATED FAIR VALUE OF FINANCIAL INSTRUMENTS
The following is a summary of the carrying amounts and estimated fair values of our financial instruments as of December 31, 2007 and 2006. SFAS No. 107, "Disclosures about Fair Value of Financial Instruments" ("SFAS 107") defines the fair value of a financial instrument as the amount at which the instrument could be exchanged in a current transaction between willing parties.
Key Energy Services, Inc. and Subsidiaries
NOTES TO CONSOLIDATED FINANCIAL STATEMENTS (Continued)
8. ESTIMATED FAIR VALUE OF FINANCIAL INSTRUMENTS (Continued)
Cash, cash equivalents, short-term investments, accounts payable and accrued liabilities. These carrying amounts approximate fair value because of the short maturity of the instruments or because the carrying value is equal to the fair value of those instruments on the balance sheet date.
| | December 31, 2007
| | December 31, 2006
|
|---|
| | Carrying Value
| | Fair Value
| | Carrying Value
| | Fair Value
|
|---|
| | (in thousands)
|
|---|
| Financial assets: | | | | | | | | | | | | |
| | Notes receivable—related parties | | $ | 173 | | $ | 173 | | $ | 287 | | $ | 287 |
| | Cash flow hedges | | | — | | | — | | | 185 | | | 185 |
Financial liabilities: |
|
|
|
|
|
|
|
|
|
|
|
|
| | 8.375% Senior Notes due 2014 | | $ | 425,000 | | $ | 434,563 | | $ | — | | $ | — |
| | 2007 Senior Secured Credit Facility Revolving Loans | | | 50,000 | | | 50,000 | | | — | | | — |
| | 2005 Senior Secured Credit Facility Term Loans | | | — | | | — | | | 396,000 | | | 396,000 |
| | Notes payable—related parties | | | 22,178 | | | 22,178 | | | — | | | — |
Notes receivable-related parties. The amounts reported relate to notes receivable from certain employees of the Company related to relocation and retention agreements. The carrying values of these notes approximate their fair values as of the applicable balance sheet dates.
Cash flow hedges. The carrying value of our cash flow hedges is equal to the fair value of those instruments on December 31, 2006. We had no cash flow hedges on December 31, 2007.
8.375% Senior Notes due 2014. The fair value of our long-term debt is based upon the quoted market prices and face value for the various debt securities at December 31, 2007. The carrying value of these notes as of December 31, 2007 was $425.0 million and the fair value was $434.6 million.
2007 Senior Secured Credit Facility Revolving Loans. Because of their variable interest rates, the fair values of the revolving loans borrowed under our 2007 Senior Secured Credit Facility approximate their carrying values as of December 31, 2007. The carrying and fair values of these loans as of December 31, 2007 were approximately $50.0 million.
2005 Senior Secured Credit Facility Term Loans. Because of their variable interest rates, the fair values of the term loans borrowed under our 2005 Senior Secured Credit Facility approximate their carrying values as of December 31, 2006. The carrying and fair values of these loans as of December 31, 2006 were $396.0 million. The loans were repaid in November 2007 with the proceeds from our 8.375% Senior Notes due 2014.
Notes payable—related parties. The amounts reported relate to the seller financing arrangement entered into in connection with our acquisition of Moncla (see Note 2—"Acquisitions"). The carrying value of these notes approximate their fair values as of December 31, 2007.
9. DERIVATIVE FINANCIAL INSTRUMENTS
Interest Rate Swaps. Under the term loan portion of our 2005 Senior Secured Credit Facility, we were exposed to risks related to variable interest rates. On March 10, 2006 we entered into two
Key Energy Services, Inc. and Subsidiaries
NOTES TO CONSOLIDATED FINANCIAL STATEMENTS (Continued)
9. DERIVATIVE FINANCIAL INSTRUMENTS (Continued)
$100.0 million notional amount interest rate swaps to effectively fix the interest rate on a portion of this debt. These swaps met the criteria of derivative instruments.
The Company uses a historic simulation based on regression analysis to assess the effectiveness of the swaps as a hedge of the future cash flows of the forecasted transaction, both on a historical and prospective basis. The simulation regresses the monthly changes in the cash flows associated with the hedging instrument and the hedged item. The results of the regression indicated the swaps were highly effective in offsetting the future cash flows of the items being hedged and could be reasonably assumed to be highly effective on an ongoing basis. Based on the results of this analysis and the Company's intent to use the instruments to reduce exposure to changes in future cash flows attributable to interest payments, the Company elected to account for the swaps as cash flow hedges.
The measurement of hedge ineffectiveness is based on a comparison of the cumulative change in the fair value of the actual swap designated as the hedging instrument and the cumulative change in fair value of a perfectly effective hypothetical derivative ("Perfect Hypothetical Derivative") (as defined in Derivatives Implementation Group ("DIG") Issue G7). The perfectly effective hypothetical swap mimics the terms of the debt with a fixed interest rate assumed to be the same as the hedge instrument. This method of measuring ineffectiveness is known as the "Hypothetical Derivative Method." Under this method, the actual swap is recorded at fair value on the Company's consolidated balance sheets and accumulated other comprehensive income is adjusted to a balance that reflects the lesser of either the cumulative change in the fair value of the actual swap or the cumulative change in the fair value of the Perfect Hypothetical Derivative. The amount of ineffectiveness, if any, is equal to the excess of the cumulative change in the fair value of the actual swap over the cumulative change in the fair value of the Perfect Hypothetical Derivative, and is recorded currently in earnings as a component of other income and expense on the Company's consolidated statements of operations.
In connection with the termination of the 2005 Senior Secured Credit Facility in November 2007 (see Note 11—"Long-Term Debt—Default Under Capital Lease Obligations" forDebt"), we settled all outstanding interest rate swap arrangements. We recognized a discussionloss of the current status of these lease obligations.
3. DISCONTINUED OPERATIONS
On January 15, 2005, we sold the majority of our contract drilling operations to Patterson-UTI Energy, Inc. for $62.0approximately $2.3 million in cash. We received approximately $60.5 million in cash, after paying all fees related to the sale. Assettlement of our interest rate swaps, which is recorded in our consolidated statements of operations as a component of interest expense.
Call Options on 8.375% Senior Notes due 2014. The indenture related to our $425.0 million in 8.375% Senior Notes due 2014 (see Note 11—"Long-Term Debt") contains provisions by which, at our option, we may redeem the notes at varying prices before their stated maturity date. Certain of these provisions are based on contingent events, such as a future equity offering by us or a change in control of the Company. Other provisions are not contingent in nature. In one of the non-contingent scenarios, the price at which we could retire the notes is based, in part, on a variable interest rate. We have analyzed all the provisions of the indenture that allow us to repay the notes early in order to determine if any of these call options constitute an embedded derivative instrument under SFAS 133 and require bifurcation and separate measurement from the host contract. We followed the guidance provided in paragraphs 6, 12, 13, and 61 of SFAS 133 and DIG Issues B-16 and B-39 in determining whether or not the call options required bifurcation and separate measurement. Based on our analysis, we do not believe these options require bifurcation and separate measurement.
Foreign Currency Instruments. In connection with our acquisition of AMI in September 2007 (see Note 2—"Acquisitions"), we became party to four swap arrangements that exchanged Singaporean Dollars for Canadian Dollars. These arrangements meet the definition of a derivative under SFAS 133.
Key Energy Services, Inc. and Subsidiaries
NOTES TO CONSOLIDATED FINANCIAL STATEMENTS (Continued)
9. DERIVATIVE FINANCIAL INSTRUMENTS (Continued)
We have not elected to treat these derivatives as cash flow hedges and as a result, any gains or losses arising out of changes in the sale, this operation, which was previously reportedfair value of these contracts are recorded as unrealized gains or losses in our contract drilling segment, has been presentedconsolidated statements of operations as a discontinued operation for all periods. We recorded an after-tax loss from discontinued operationscomponent of $3.4other income and expense. As of December 31, 2007, the aggregate notional amount of these contracts was approximately $0.4 million or $0.03 per diluted share, forUSD and the aggregate fair value of these contracts was less than $0.1 million USD. The last of these contracts settled in January 2008. For the year ended December 31, 2005 and an after-tax2007, the unrealized holding loss of $5.7 million, or $0.04 per diluted share, during the year ended December 31, 2004.associated with these contracts was not material.
The assets sold to Patterson-UTI Energy, Inc. were classified as held for sale beginning in the third quarter of 2004. When we classified these assets as held for sale, we adjusted the carrying values of
these assets to their fair value. These adjustments resulted in pre-tax reductions in the carrying value of goodwill of approximately $1.7 million and of property, plant and equipment of approximately $10.8 million. These adjustments are included in the costs and expenses of our discontinued operations for the year ended December 31, 2004.
Results for activities reported as discontinued operations were as follows:
| | Year Ended December 31,
| |
|---|
| | 2006
| | 2005
| | 2004
| |
|---|
| | (in thousands)
| |
|---|
| Revenues | | $ | — | | $ | 3,361 | | $ | 72,538 | |
| Costs and expenses | | | — | | | 2,132 | | | 80,466 | |
| | |
| |
| |
| |
| Income (loss) before income taxes | | | — | | | 1,229 | | | (7,928 | ) |
| Income tax expense (benefit) | | | — | | | (4,590 | ) | | 2,285 | |
| | |
| |
| |
| |
| Loss from discontinued operations | | $ | — | | $ | (3,361 | ) | $ | (5,643 | ) |
| | |
| |
| |
| |
Balance sheet data attributable to discontinued operations were as follows:
| | December 31,
| |
|---|
| | 2006
| | 2005
| | 2004
| |
|---|
| | (in thousands)
| |
|---|
| Current assets | | $ | 623 | | $ | 658 | | $ | 18,958 | |
| Current liabilities | | | (19 | ) | | (292 | ) | | (4,938 | ) |
| Property, plant and equipment, net | | | — | | | — | | | 49,295 | |
| Other assets | | | — | | | — | | | 11,285 | |
| | |
| |
| |
| |
| | Net assets of discontinued operations | | $ | 604 | | $ | 366 | | $ | 74,600 | |
| | |
| |
| |
| |
4. OTHER CURRENT AND NON-CURRENT ACCRUED LIABILITIES
Our other current accrued liabilities consist of the following:
| | December 31,
|
|---|
| | 2006
| | 2005
| | 2004
|
|---|
| | (in thousands)
|
|---|
| Accrued rent | | $ | 834 | | $ | 2,630 | | $ | 88 |
| Vehicular insurance | | | 3,298 | | | 2,632 | | | 3,732 |
| Other | | | 4,032 | | | 3,486 | | | 2,556 |
| | |
| |
| |
|
| | Total | | $ | 8,164 | | $ | 8,748 | | $ | 6,376 |
| | |
| |
| |
|
Our non-current accrued expenses consist of the following:
| | December 31,
|
|---|
| | 2006
| | 2005
| | 2004
|
|---|
| | (in thousands)
|
|---|
| Asset retirement obligations | | $ | 9,622 | | $ | 9,633 | | $ | 10,512 |
| Environmental liabilities | | | 4,683 | | | 5,427 | | | 5,622 |
| Accrued rent | | | 3,241 | | | — | | | — |
| Accrued income taxes | | | 2,507 | | | 2,076 | | | 1,754 |
| Deferred gain on sale-leaseback transactions | | | 722 | | | 882 | | | — |
| Severance accruals | | | 234 | | | 22,111 | | | 21,909 |
| Other | | | 247 | | | 596 | | | 1,420 |
| | |
| |
| |
|
| | Total | | $ | 21,256 | | $ | 40,725 | | $ | 41,217 |
| | |
| |
| |
|
5.10. INCOME TAXES
ComponentsThe components of our income tax expense are as follows:
| | Year Ended
December 31, 2006
| | Year Ended
December 31,
2005
| | Year Ended
December 31,
2004
| |
|---|
| | (in thousands)
| |
|---|
| Current income tax benefit (expense) | | | | | | | | | | |
| | Federal and state | | $ | (92,213 | ) | $ | (18,022 | ) | $ | (3,641 | ) |
| | Foreign | | | (4,242 | ) | | (3,610 | ) | | (5,478 | ) |
| | |
| |
| |
| |
| | | | (96,455 | ) | | (21,632 | ) | | (9,119 | ) |
| | |
| |
| |
| |
| Deferred income tax benefit (expense) | | | | | | | | | | |
| | Federal and state | | | (7,906 | ) | | (13,952 | ) | | 8,623 | |
| | Foreign | | | 914 | | | 264 | | | 2,386 | |
| | |
| |
| |
| |
| | | | (6,992 | ) | | (13,688 | ) | | 11,009 | |
| | |
| |
| |
| |
| Income tax (expense) benefit | | $ | (103,447 | ) | $ | (35,320 | ) | $ | 1,890 | |
| | |
| |
| |
| |
| | Year Ended December 31,
| |
|---|
| | 2007
| | 2006
| | 2005
| |
|---|
| | (in thousands)
| |
|---|
| Current income tax (expense) benefit: | | | | | | | | | | |
| | Federal and state | | $ | (81,384 | ) | $ | (92,213 | ) | $ | (18,022 | ) |
| | Foreign | | | (771 | ) | | (4,242 | ) | | (3,610 | ) |
| | |
| |
| |
| |
| | | | (82,155 | ) | | (96,455 | ) | | (21,632 | ) |
| | |
| |
| |
| |
| Deferred income tax (expense) benefit: | | | | | | | | | | |
| | Federal and state | | | (24,281 | ) | | (7,906 | ) | | (13,952 | ) |
| | Foreign | | | (332 | ) | | 914 | | | 264 | |
| | |
| |
| |
| |
| | | | (24,613 | ) | | (6,992 | ) | | (13,688 | ) |
| | |
| |
| |
| |
| Total income tax expense | | $ | (106,768 | ) | $ | (103,447 | ) | $ | (35,320 | ) |
| | |
| |
| |
| |
We made net federal income tax payments of approximately $85.5 million, $87.6 million $10.8 million and $0.2$10.8 million for the years ended December 31, 2007, 2006 2005 and 2004,2005, respectively. We made net state income tax payments of approximately $6.6 million, $8.4 million $1.0 million, and $0.4$1.0 million for the years ended December 31, 2007, 2006 2005 and 2004,2005, respectively. We made net foreign tax payments of approximately $4.2 million, $3.0 million $5.4 million, and $5.8$5.4 million for the years ended December 31, 2007, 2006 2005, and 2004,2005, respectively. For the years ended December 31, 20062007 and 2005,2006, tax benefits allocated to stockholders' equity for compensation expense for income tax purposes in excess of amounts recognized for financial reporting purposes were $3.4 million and less than $0.1 million, and zero, respectively. For the year ended December 31, 2004,2005, no tax expense was allocated to stockholders' equity for compensation expense for income tax purposes less than amounts recognized for financial reporting purposes was $0.1 million.purposes. The Company had allocated tax benefits to stockholders' equity in prior years for compensation expense for income tax purposes in excess of amounts recognized for financial reporting purposes.
Key Energy Services, Inc. and Subsidiaries
NOTES TO CONSOLIDATED FINANCIAL STATEMENTS (Continued)
10. INCOME TAXES (Continued)
Income tax benefit (expense)expense differs from amounts computed by applying the statutory federal rate as follows:
| | Year Ended
December 31, 2006
| | Year Ended
December 31, 2005
| | Year Ended
December 31, 2004
| | | Year Ended December 31,
| |
|---|
| Income tax computed at statutory rate | | 35.0 | % | 35.0 | % | 35.0 | % | |
| | | 2007
| | 2006
| | 2005
| |
|---|
| Income tax computed at Federal statutory rate | | | 35.0 | % | 35.0 | % | 35.0 | % |
| State taxes | | 1.7 | | 2.4 | | (1.2 | ) | | 3.2 | | 1.7 | | 2.4 | |
| Meals and entertainment | | 0.8 | | 2.1 | | (6.1 | ) | | 0.9 | | 0.8 | | 2.1 | |
| Executive and share-based compensation | | 1.1 | | 0.6 | | (12.5 | ) | | 0.6 | | 1.1 | | 0.6 | |
| Foreign rate differential | | — | | 1.3 | | (4.7 | ) | | 0.2 | | — | | 1.3 | |
| Change in valuation allowance | | (0.5 | ) | — | | — | | | 0.2 | | (0.5 | ) | — | |
| Other | | (0.4 | ) | 0.4 | | (3.9 | ) | | (1.4 | ) | (0.4 | ) | 0.4 | |
| | |
| |
| |
| | |
| |
| |
| |
| Effective income tax rate | | 37.7 | % | 41.8 | % | 6.6 | % | | 38.7 | % | 37.7 | % | 41.8 | % |
| | |
| |
| |
| | |
| |
| |
| |
Deferred As of December 31, 2007 and 2006, our deferred tax assets (liabilities) areand liabilities were comprised of the following:
| | December 31,
| |
|---|
| | 2006
| | 2005
| | 2004
| |
|---|
| | (in thousands)
| |
|---|
| Deferred tax assets | | | | | | | | | | |
| | Net operating loss and tax credit carry forwards | | $ | 5,375 | | $ | 8,225 | | $ | 40,153 | |
| | Self insurance reserves | | | 21,593 | | | 18,029 | | | 17,738 | |
| | Allowance for doubtful accounts | | | 4,793 | | | 3,985 | | | 3,669 | |
| | Accrued liabilities | | | 24,287 | | | 21,942 | | | 19,062 | |
| | Share-based compensation | | | 2,736 | | | 3,646 | | | 3,325 | |
| | Other | | | 18 | | | 173 | | | 3,421 | |
| | |
| |
| |
| |
| | Total deferred tax assets | | | 58,802 | | | 56,000 | | | 87,368 | |
| | |
| |
| |
| |
| | Valuation allowance for deferred tax assets | | | (841 | ) | | (4,985 | ) | | (7,947 | ) |
| | |
| |
| |
| |
| | Net deferred tax assets | | | 57,961 | | | 51,015 | | | 79,421 | |
| | |
| |
| |
| |
| Deferred tax liabilities | | | | | | | | | | |
| | Property and equipment | | | (121,314 | ) | | (110,362 | ) | | (127,561 | ) |
| | Intangibles | | | (16,196 | ) | | (13,216 | ) | | (10,708 | ) |
| | Other | | | (309 | ) | | (97 | ) | | (89 | ) |
| | |
| |
| |
| |
| | | Total deferred tax liabilities | | | (137,819 | ) | | (123,675 | ) | | (138,358 | ) |
| | |
| |
| |
| |
| Net deferred tax liability, net of valuation allowance | | $ | (79,858 | ) | $ | (72,660 | ) | $ | (58,937 | ) |
| | |
| |
| |
| |
| | December 31,
| |
|---|
| | 2007
| | 2006
| |
|---|
| | (in thousands)
| |
|---|
| Deferred tax assets: | | | | | | | |
| | Net operating loss and tax credit carryforwards | | $ | 6,000 | | $ | 5,375 | |
| | Self-insurance reserves | | | 21,484 | | | 21,593 | |
| | Allowance for doubtful accounts | | | 4,731 | | | 4,793 | |
| | Accrued liabilities | | | 15,600 | | | 24,287 | |
| | Equity-based compensation | | | 3,876 | | | 2,736 | |
| | Other | | | 488 | | | 18 | |
| | |
| |
| |
| Total deferred tax assets | | | 52,179 | | | 58,802 | |
| | |
| |
| |
| Valuation allowance for deferred tax assets | | | (1,458 | ) | | (841 | ) |
| | |
| |
| |
| Net deferred tax assets | | | 50,721 | | | 57,961 | |
| | |
| |
| |
| Deferred tax liabilities: | | | | | | | |
| | Property and equipment | | | (150,802 | ) | | (121,314 | ) |
| | Intangible assets | | | (31,993 | ) | | (16,196 | ) |
| | Other | | | (318 | ) | | (309 | ) |
| | |
| |
| |
| Total deferred tax liabilities | | | (183,113 | ) | | (137,819 | ) |
| | |
| |
| |
| Net deferred tax liability, net of valuation allowance | | $ | (132,392 | ) | $ | (79,858 | ) |
| | |
| |
| |
In 2006,2007, deferred tax liabilities increaseddecreased by $206,000$0.2 million for adjustments to accumulated other comprehensive loss. In 2005,2006, deferred tax liabilities increased by $35,000 for adjustments to accumulated comprehensive loss. In 2004, deferred tax liabilities decreased by $12,000$0.2 million for adjustments to accumulated other comprehensive lossloss.
Key Energy Services, Inc. and increased by $149,000 for adjustments to additional paid-in capital.Subsidiaries
NOTES TO CONSOLIDATED FINANCIAL STATEMENTS (Continued)
10. INCOME TAXES (Continued)
In recording deferred income tax assets, we consider whether it is more likely than not that some portion or all of the deferred income tax assets will be realized. The ultimate realization of deferred income tax assets is dependent upon the generation of future taxable income during the periods in which those deferred income tax assets would be deductible. We consider the scheduled reversal of deferred income tax liabilities and projected future taxable income for this determination. To fully realize the deferred income tax assets related to our federal net operating loss carryforwards that do not have a valuation allowance due to Section 382 limitations, we would need to generate future federal taxable income of approximately $7.0$5.9 million over the next ten years. With certain exceptions noted below, we believe that after considering all the available objective evidence, both positive and negative, historical and prospective, with greater weight given to the historical evidence, it is more likely than not that these assets will be realized.
We estimate that as of December 31, 2007, 2006 2005 and 20042005 we have available $8.2 million, $9.3 million $14.0 million and $100.0$14.0 million, respectively, of federal net operating loss carryforwards. Approximately $6.9$5.8 million of our net operating losses as of December 31, 20062007 are subject to a $1.1 million annual Section 382 limitation and expire in 2018. Approximately $2.4 million of our net operating losses as of December 31, 20062007 are subject to a $5,000 annual Section 382 limitation and expire in 2016 through 2018. A valuation allowance is provided when it is more likely than not that some portion of the deferred tax assets will not be realized. Due to annual limitations under Sections 382 and 383, management believes that we will not be able to utilize all available carryforwards prior to their ultimate expiration. The deferred tax asset associated with our remaining
federal net operating loss carryforwards that will expire before utilization due to Section 382 limitations of $2.3 million includes a valuation allowance of $0.8 million as a result of the Section 382 limitations.limitations at December 31, 2007 and 2006, respectively.
We estimate that as of December 31, 2007, 2006 2005 and 20042005 we have available $19 million, $31 million, $43 million and $70$43 million, respectively, of state net operating loss carryforwards that will expire from 20072008 to 2025. To fully realize the deferred income tax assets related to our state net operating loss carryforwards, we would need to generate future West Virginia taxable income of $16.5$14.2 million over the next 1918 years and future Pennsylvania taxable income of $4.6$3.5 million over the next 1918 years. Management believes that it is not more likely than not that we will be able to utilize all available carryforwards prior to their ultimate expiration. The deferred tax asset associated with our remaining state net operating loss carryforwards at December 31, 20062007 of $0.3$1.7 million includes a valuation allowance of less than $0.1 million as a result. In the second quarter of 2006, the Texas Margins Tax (see below) was enacted. At that point in time, a deferred tax asset of approximately $0.2 million related to Texas NOLs whichnet operating losses that had a complete valuation allowance was effectively converted to a Texas Margins Tax Creditcredit that no longer requires a valuation allowance. A tax benefit net of federal tax effect was recorded in the second quarter of 2006 relating to the release of this valuation allowance. In the fourth quarter of 2006, we implemented plans for an internal reorganization of our legal entity structure to occur at year end. After the reorganization, state NOLsnet operating losses previously subject to valuation allowances of $2.3 million will no longer require valuation allowances. A tax benefit net of federal tax effect was recorded in the fourth quarter 2006 relating to the release of this valuation allowance.
In 2007, the Company began operations in Mexico that resulted in a net operating loss of $2.0 million and a deferred tax asset related to the net operating loss carryforward of $0.6 million. Mexico enacted a new flat tax rate effective January 1, 2008. The flat tax will function in addition to
Key Energy Services, Inc. and Subsidiaries
NOTES TO CONSOLIDATED FINANCIAL STATEMENTS (Continued)
10. INCOME TAXES (Continued)
the regular corporate tax rate of 28%. Tax expense will be calculated under both methods and if the flat tax is greater than the regular tax, the additional tax expense above the regular tax will be assessed in addition to the regular tax calculation. We have recorded a full valuation allowance related to our Mexico net operating loss carryforwards of $0.6 million at December 31, 2007, as management believes that, because of the enactment of the Mexico flat tax, all of our net operating loss carryforwards related to the Mexico operations are not more likely than not to be fully realized in the future based on the future reversal of deferred tax liabilities. The net operating loss expires in 2017.
In 2007, the Company made a stock acquisition of AMI, a Canadian company. At December 31, 2007, the Company's Canadian operations had a net operating loss of $3.2 million and a deferred tax asset related to the net operating loss carryforward of $1.0 million. The net operating loss is comprised of approximately $2.0 million net operating loss as of the acquisition date and an additional $1.2 million net operating loss from operations for the four months ended December 31, 2007. We have recorded no valuation allowance related to our Canadian net operating loss carryforwards at December 31, 2007, as management believes that all of our net operating loss carryforwards related to the Canadian operations are more likely than not to be fully realized in the future. To fully realize the deferred income tax assets related to our Canadian net operating loss carryforwards, we would need to generate $0.2 million of future Canadian taxable income over the next eight years and $3.1 million of future Canadian taxable income over the next nineteen years. The net operating losses expire from 2015 to 2027.
In December 2006, the FASB issued FIN 48. FIN 48 clarifies the accounting for uncertainty in income taxes recognized in an enterprise's financial statements in accordance with SFAS 109. FIN 48 prescribes a recognition threshold and measurement attributes for the financial statement recognition and measurement of an income tax position taken or expected to be taken in an income tax return. FIN 48 also provides guidance on de-recognition, classification, interest and penalties, accounting in interim periods, disclosure and transition.
In May 2007, the FASB issued FSP FIN 48-1. FSP FIN 48-1 provides guidance on how an enterprise should determine whether a tax position is effectively settled for the purpose of recognizing previously unrecognized tax benefits. In determining whether a tax position has been effectively settled, entities must evaluate (i) whether taxing authorities have completed their examination procedures; (ii) whether the entity intends to appeal or litigate any aspect of a tax position included in a completed evaluation; and (iii) whether it is remote that a taxing authority would examine or re-examine any aspect of a taxing position. FSP FIN 48-1 is to be applied upon the initial adoption of FIN 48.
We adopted the provisions of FIN 48 and FSP FIN 48-1 on January 1, 2007 and recorded a $1.3 million decrease to the balance of our retained earnings to reflect the cumulative effect of adopting these standards.
As part of the acquisitions we made during 2007, the Company acquired or assumed unrecognized tax benefits, as defined by FIN 48. The cumulative effect of the acquisition of the unrecognized tax benefits was $3.2 million, which consisted primarily of rig refurbishment and meals and entertainment expense.
As of January 1, 2007 and December 31, 2007, we had approximately $3.8 million and $6.8 million, respectively, of unrecognized tax benefits net of federal benefit which, if recognized, would impact our effective tax rate. We have accrued approximately $2.3 million and $1.0 million for the payment of
Key Energy Services, Inc. and Subsidiaries
NOTES TO CONSOLIDATED FINANCIAL STATEMENTS (Continued)
10. INCOME TAXES (Continued)
interest and penalties as of December 31, 2007 and January 1, 2007, respectively. While it is possible for changes to occur due to settlement of examinations or the expiration of statute of limitations, we do not anticipate significant changes in our unrecognized tax benefit liability in the next 12 months.
We file income tax returns in the United States federal jurisdiction and various states and foreign jurisdictions. In January 2005, the Internal Revenue Service concluded its examination of the Company's federal tax returns for tax years June 30, 1997 through December 31, 2002. These examinations have substantially concluded all U.S. federal income tax matters through the year ended December 31, 2002. However, due to the use of net operating losses in subsequent years, these audited tax years as well as the subsequent un-audited 2003-2007 tax years remain open as of December 31, 2007. Our other significant filings are in Argentina, which has been examined through 2006, and in the State of Texas, where tax filings remain open for 2003 to 2006 for certain subsidiaries of the Company.
There were no expirations of statutes of limitations in 2007 that would require the release of a FIN 48 reserve. However, a change in the circumstances surrounding the audit of our Egyptian operations has resulted in the decrease of the FIN 48 reserve related to that audit by approximately $0.7 million. The current reserve related to the Egyptian audit is $0.4 million.
The following table presents the activity during 2007 related to our FIN 48 reserve (in thousands):
| Balance at January 1, 2007 | | $ | 4,123 | |
| Additions based on tax positions related to the current year | | | — | |
| Additions based on tax positions related to prior years | | | 104 | |
| Increases in unrecognized tax benefits acquired or assumed in business combinations | | | 2,403 | |
| Reductions for tax positions from prior years | | | — | |
| Settlements | | | (908 | ) |
| | |
| |
| Balance at December 31, 2007 | | $ | 5,722 | |
| | |
| |
Tax Legislative Changes
American Jobs Creation Act of 20042004.
The American Jobs Creation Act of 2004 added the Section 199 deduction to the Internal Revenue Code. This allows for tax deduction on qualifying domestic production activities, as defined and limited in the Internal Revenue Code. We concluded we will receive benefits of $2.0 million, $1.6 million and $0.6 million from this deduction for the years ended December 31, 2007, 2006 and 2005, respectively.
Texas Margins TaxTax.
In May 2006, the state of Texas enacted a new law, effective January 1, 2007, that substantially changes the tax system in Texas. The law replaces the taxable capital and earned surplus components of its franchise tax with a new tax that is based on modified gross revenue. This law imposes a tax on a unitary group of affiliated entities' net receipts rather than on the earned surplus of each separate entity. The Company recognized a tax benefit of $0.4 million in the second quarter of 2006 related to the enactment of the new law. TheIn 2007, the Company believes its taxes in theincurred $5.5 million of state of Texas will increase in 2007 and future periods dueincome tax expense related to the new Texas Margins Tax.
6. SUPPLEMENTAL SCHEDULE OF NONCASH INVESTING AND FINANCING ACTIVITIES
| | Year Ended December 31,
|
|---|
| | 2006
| | 2005
| | 2004
|
|---|
| | (in thousands)
|
|---|
| Property, plant and equipment acquired under capital lease obligations | | $ | 15,349 | | $ | 18,267 | | $ | 11,450 |
| Equity investment in IROC Systems Corp | | | — | | | 9,019 | | | 6,221 |
| Asset retirement obligations | | | 155 | | | 119 | | | 1,017 |
| Unrealized gain on available for sale investments | | | 328 | | | — | | | — |
| Unrealized gain on cash flow hedges | | | 185 | | | — | | | — |
| Capital lease portion of sale-leaseback transactions | | | — | | | 4,663 | | | — |
| Deferred gain on sale-leaseback transactions | | | — | | | 1,094 | | | — |
7. ESTIMATED FAIR VALUE OF FINANCIAL INSTRUMENTS
The following table presents the carrying amountsKey Energy Services, Inc. and estimated fair values of our financial instruments at December 31, 2006, 2005 and 2004. FASB Statement No. 107, "Disclosures about Fair Value of Financial Instruments," defines the fair value of a financial instrument as the amount at which the instrument could be exchanged in a current transaction between willing parties.
| | December 31, 2006
| | December 31, 2005
| | December 31, 2004
|
|---|
| | Carrying
Value
| | Fair
Value
| | Carrying
Value
| | Fair
Value
| | Carrying
Value
| | Fair
Value
|
|---|
| | (in thousands)
| | (in thousands)
| | (in thousands)
|
|---|
| Financial Assets: | | | | | | | | | | | | | | | | | | |
| | Cash and cash equivalents | | $ | 88,375 | | $ | 88,375 | | $ | 94,170 | | $ | 94,170 | | $ | 20,425 | | $ | 20,425 |
| | Available for sale investments | | | 61,767 | | | 61,767 | | | — | | | — | | | — | | | — |
| | Notes receivable—related parties | | | 287 | | | 287 | | | 151 | | | 151 | | | 101 | | | 101 |
| | Cash flow hedges | | | 185 | | | 185 | | | — | | | — | | | — | | | — |
Financial Liabilities: |
|
|
|
|
|
|
|
|
|
|
|
|
|
|
|
|
|
|
| | Long-term debt: | | | | | | | | | | | | | | | | | | |
| | | 6.375% Senior Notes | | | — | | | — | | | — | | | — | | | 150,000 | | | 151,875 |
| | | 8.375% Senior Notes | | | — | | | — | | | — | | | — | | | 275,000 | | | 283,938 |
| | | Senior Credit Facility Term Loans | | | 396,000 | | | 396,000 | | | 400,000 | | | 400,000 | | | — | | | — |
| | | Senior Credit Facility Revolving Loans | | | — | | | — | | | — | | | — | | | 48,000 | | | 48,000 |
The following methods and assumptions were used to estimate the fair value of each class of financial instruments:
Cash and available for sale investments. These carrying amounts approximate fair value because of the short maturity of the instruments or because the carrying value is equal to the fair value of those instruments on the balance sheet date.Subsidiaries
Notes receivable-related parties. The amounts reported relate to notes receivable from certain employees of the Company related to relocation and retention agreements. The carrying values of these notes approximate their fair values as of the applicable balance sheet dates.
Cash flow hedges. The carrying value of our cash flow hedges is equal to the fair value of those instruments on the balance sheet date.
Long-term debt. The fair value of our long-term debt is based upon the quoted market prices and face value for the various debt securities at December 31, 2006, 2005 and 2004, respectively. Because of their variable interest rates, the fair values of term loan and revolving loan amounts borrowed under our Senior Secured Credit Facility approximate their carrying values as of the applicable balance sheet dates.
8. DERIVATIVENOTES TO CONSOLIDATED FINANCIAL INSTRUMENTSSTATEMENTS (Continued)
We are exposed to risks due to potential changes in interest rates associated with the variable-rate interest term loan of our Senior Secured Credit Facility. As of December 31, 2006, our variable rate interest debt instruments comprised 100% of our total debt, excluding our capital lease obligations. Based on this exposure, and because of provisions contained in our Senior Secured Credit Facility, on March 10, 2006 we entered into two $100.0 million notional amount interest rate swaps to effectively fix the interest rate on a portion of our variable rate debt. These swaps meet the criteria of derivative instruments.
We account for derivative instruments using the guidance provided by SFAS 133, as amended. SFAS 133 establishes accounting and reporting standards for derivative instruments, including certain
derivative instruments embedded in other contracts, and hedging activities. It requires the recognition of all derivative instruments as assets and liabilities on the balance sheet and measurement of those instruments at fair value. The accounting treatment of changes in fair value is dependent upon whether or not a derivative instrument is designated as a hedge, and if so, the type of hedge. For derivatives designated as cash flow hedges, the effective portion of a change in the fair value of the hedging instrument is recognized in other comprehensive income until the settlement of the forecasted hedged transaction. Any ineffective portion of changes in the fair value of the hedging instrument is recognized currently in earnings.
The Company uses a historic simulation based on regression analysis to assess the effectiveness of the swaps as a hedge of the future cash flows of the forecasted transaction, both on a historical and prospective basis. The simulation regresses the monthly changes in the cash flows associated with the hedging instrument and the hedged item. The results of the regression indicated that the swaps were highly effective in offsetting the future cash flows of the items being hedged and could be reasonably assumed to be highly effective on an ongoing basis. Based on the results of this analysis and the Company's intent to use the instruments to reduce exposure to changes in future cash flows attributable to interest payments, the Company elected to account for the swaps as cash flow hedges.
The measurement of hedge ineffectiveness is based on a comparison of the cumulative change in the fair value of the actual swap designated as the hedging instrument and the cumulative change in fair value of a perfectly effective hypothetical derivative ("Perfect Hypothetical Derivative") (as defined in Derivatives Implementation Group Issue G7). The perfectly effective hypothetical swap mimics the terms of the debt with a fixed interest rate assumed to be the same as the hedge instrument. This method of measuring ineffectiveness is known as the "Hypothetical Derivative Method." Under this method, the actual swap is recorded at fair value on the Company's Consolidated Balance Sheets and Accumulated Other Comprehensive Income is adjusted to a balance that reflects the lesser of either the cumulative change in the fair value of the actual swap or the cumulative change in the fair value of the Perfect Hypothetical Derivative. The amount of ineffectiveness, if any, is equal to the excess of the cumulative change in the fair value of the actual swap over the cumulative change in the fair value of the Perfect Hypothetical Derivative, and is recorded currently in earnings as a component of other income and expense on the Company's Consolidated Statements of Income.
As of December 31, 2006, we recorded $0.2 million in current assets, $0.2 million in long-term assets and $0.1 million in current liabilities in our consolidated balance sheets, based on the fair value of our derivative instruments on that date. During the year ended December 31, 2006, amounts recorded related to the ineffective portion of our cash flow hedges were not material. No amounts were excluded from the assessment of hedge effectiveness related to the hedge of future cash flows in any of the periods. During the year ended December 31, 2006, no amounts were reclassified to earnings in connection with forecasted transactions whose occurrence was no longer considered probable. During the next twelve months, the Company anticipates that the amount of accumulated other comprehensive loss that will be reclassified to earnings upon settlement of hedge transactions will be less than $1 million.
9. INVESTMENT IN IROC SYSTEMS CORP.
On July 22, 2004, we entered into an agreement with IROC Systems Corp. ("IROC"), an Alberta-based oilfield services company, to sell IROC ten remanufactured Skytop well servicing rigs, along with supporting equipment and inventory. We began delivery of the rigs in the fall of 2004, and these rigs are operated by IROC in Western Canada. The purchase price for the rigs was $7.0 million USD. This amount was converted at an agreed exchange rate of 0.7634 to $9.17 million CDN, and was paid by way of the issuance of 8,187,058 common shares of IROC stock (the "Consideration Shares") at a deemed purchase price of $1.12 CDN per share. During 2004, we recognized a loss of $0.1 million upon delivery of the first six rigs under the contract, which represents the difference between the
aggregate carrying value of the rigs transferred and the fair market value on the delivery date of the IROC common shares we received as consideration for those six rigs. The final four rigs were delivered in 2005, and we recognized a gain of $1.9 million upon delivery, which represents the difference between the aggregate carrying value of the delivered rigs and the fair market value on the delivery date of the IROC shares we received as consideration for those four rigs.
In July 2005, we sold additional well service rig support equipment to IROC for $0.9 million USD. This amount was converted at an agreed exchange rate of 0.7937 to $1.1 million CDN, and was paid by way of the issuance of 547,411 shares (the "Additional Shares") of IROC common stock at a deemed issuance price of $2.09 CDN per share. We recognized a gain of $0.7 million related to this transaction, which represents the difference between the carrying value of the transferred equipment and the fair value of the Additional Shares on the transaction date.
As of December 31, 2006, we owned 8,734,469 shares of IROC common stock, which represents approximately 23.0% of IROC's shares. On September 15, 2005, IROC completed a private placement of a series of unsecured non-convertible debentures, which also included 1,050,000 warrants to purchase common shares of IROC. Exercises of these warrants are potentially dilutive of Key's ownership percentage in IROC. IROC shares trade on the Toronto Venture Stock Exchange and had a closing price of $2.10 CDN per share on December 31, 2006. Pursuant to the terms of the agreement with IROC, Mr. William Austin, our Chief Financial Officer, and Mr. Newton W. Wilson III, our General Counsel, were appointed to the board of directors of IROC.
We have significant influence over the operations of IROC, but do not control it. We account for our investment in IROC using the equity method. The value of our investment in IROC is recorded in our Consolidated Balance Sheets as a component of other non-current assets. The pro rata share of IROC's earnings and losses to which we are entitled are recorded in our Consolidated Statements of Operations as a component of other income and expense, with an offsetting increase or decrease to the value of our investment, as appropriate. Any earnings distributed back to us from IROC in the form of dividends would result in a decrease in the value of our equity investment.
IROC had net income of approximately $1.8 million, $1.8 million and $0.2 million USD for the years ended December 31, 2006, 2005, and 2004, respectively. IROC's total assets as of December 31, 2006, 2005 and 2004 were $76.9 million, $56.6 million and $16.3 million USD, respectively. Our investment in IROC totaled $10.7 million, $10.3 million and $3.8 million at December 31, 2006, 2005 and 2004, respectively.
During the years ended December 31, 2006, 2005 and 2004, we recorded $0.4 million, $0.5 million and $0.1 million, respectively, of equity income related to our investment in IROC. During the years ended December 31, 2006, 2005, and 2004, no earnings were distributed to us by IROC. Only distributed earnings or any gains or losses arising from the disposal of our investment are reportable for income tax purposes; as a result, the amounts we record for our pro-rata share of IROC's earnings or losses to which we are entitled result in a temporary difference between book and taxable income. Under the provisions of SFAS 109, we record a deferred tax asset or liability, as appropriate, to account for these temporary differences.
10. ARGENTINA FOREIGN CURRENCY TRANSLATION LOSS
The local currency is the functional currency for our foreign operations in Argentina and our former operations in Canada. The functional currency for our former Egyptian operations is the U.S. dollar. The cumulative translation gains and losses resulting from translating each foreign subsidiary's financial statements from the functional currency to U.S. dollars are included in other comprehensive income and accumulated in stockholders' equity until a partial or complete sale or liquidation of our net investment in the foreign entity. The foreign currency translation gains and losses of our former Canadian operations were not material. We used conversion ratios of 3.1:1, 3.0:1 and 3.0:1 to translate the assets and liabilities of our Argentine subsidiary, resulting in cumulative foreign currency translation
losses, net of tax, of $36.7 million, $36.6 million, and $36.4 million, at December 31, 2006, 2005 and 2004, respectively. The foreign currency translation loss is included in Accumulated Other Comprehensive Loss, a component of stockholders' equity.
11. LONG-TERM DEBT
The components of our long-term debt are as follows:
| | December 31,
| |
|---|
| | 2006
| | 2005
| | 2004
| |
|---|
| | (in thousands)
| |
|---|
| Senior Credit Facility Term Loans | | $ | 396,000 | | $ | 400,000 | | | — | |
| Senior Credit Facility Revolving Loans | | | — | | | — | | | 48,000 | |
| 6.375% Senior Notes Due 2013 | | | — | | | — | | | 150,000 | |
| 8.375% Senior Notes Due 2008 | | | — | | | — | | | 275,870 | |
| Capital lease obligations | | | 25,794 | | | 23,420 | | | 13,531 | |
| | |
| |
| |
| |
| | | | 421,794 | | | 423,420 | | | 487,401 | |
| Less: current portion | | | (15,714 | ) | | (12,639 | ) | | (6,354 | ) |
| | |
| |
| |
| |
| Total long-term debt | | $ | 406,080 | | $ | 410,781 | | $ | 481,047 | |
| | |
| |
| |
| |
| | December 31,
| |
|---|
| | 2007
| | 2006
| |
|---|
| | (in thousands)
| |
|---|
| 8.375% Senior Notes due 2014 | | $ | 425,000 | | $ | — | |
| 2007 Senior Secured Credit Facility revolving loans due 2012 | | | 50,000 | | | — | |
| Notes payable—related party, net of fair value discount | | | 22,178 | | | — | |
| 2005 Senior Secured Credit Facility term loans | | | — | | | 396,000 | |
| Capital lease obligations | | | 26,815 | | | 25,794 | |
| | |
| |
| |
| | | | 523,993 | | | 421,794 | |
| | |
| |
| |
| Less: current portion | | | (12,379 | ) | | (15,714 | ) |
| | |
| |
| |
| Total long-term debt and capital lease obligations, net of fair value discount | | $ | 511,614 | | $ | 406,080 | |
| | |
| |
| |
On November 29, 2007, the Company issued $425.0 million aggregate principal amount of its 8.375% Senior Notes due 2014 (the "Notes"), under an Indenture, dated as of November 29, 2007 (the "Indenture"), among us, the guarantors party thereto (the "Guarantors") and The Bank of New York Trust Company, N.A., as trustee. The Notes were priced at 100% of their face value to yield 8.375%. Net proceeds, after deducting initial purchasers' discounts and estimated offering expenses, were approximately $416.1 million. We used approximately $394.9 million of the net proceeds to retire our term loans, including accrued and unpaid interest, under the 2005 Senior Secured Credit Facility, with the balance used for general corporate purposes. The 2005 Senior Secured Credit Facility was terminated in connection with our entry into the 2007 Senior Secured Credit Facility described below.
The Notes are general unsecured senior obligations of Key. Accordingly, they will rank effectively subordinate to all of our existing and future secured indebtedness. The Notes are or will be jointly and severally guaranteed on a senior unsecured basis by certain of our existing and future domestic subsidiaries.
Interest on the Notes is payable on June 1 and December 1 of each year, beginning June 1, 2008. The Notes mature on December 1, 2014.
On or after December 1, 2011, the Notes will be subject to redemption at any time and from time to time at our option, in whole or in part, upon not less than 30 nor more than 60 days' notice, at the redemption prices (expressed as percentages of the principal amount redeemed) set forth below, plus accrued and unpaid interest thereon to the applicable redemption date, if redeemed during the twelve-month period beginning on December 1 of the years indicated below:
Year
| | Percentage
| |
|---|
| 2011 | | 104.188 | % |
| 2012 | | 102.094 | % |
| 2013 | | 100.000 | % |
Notwithstanding the foregoing, at any time and from time to time before December 1, 2010, the Company may, on any one or more occasions, redeem up to 35% of the aggregate principal amount of
Key Energy Services, Inc. and Subsidiaries
NOTES TO CONSOLIDATED FINANCIAL STATEMENTS (Continued)
11. LONG-TERM DEBT (Continued)
the outstanding Notes at a redemption price of 108.375% of the principal amount thereof, plus accrued and unpaid interest thereon to the redemption date, with the net cash proceeds of any one or more equity offerings; provided that at least 65% of the aggregate principal amount of the Notes issued under the Indenture remains outstanding immediately after each such redemption; and provided, further, that each such redemption shall occur within 180 days of the date of the closing of such equity offering.
In addition, at any time and from time to time prior to December 1, 2011, the Company may, at our option, redeem all or a portion of the Notes at a redemption price equal to 100% of the principal amount thereof plus the applicable premium (as defined in the Indenture) with respect to the Notes and plus accrued and unpaid interest thereon to the redemption date. If the Company experiences a change of control, subject to certain exceptions, it must give holders of the Notes the opportunity to sell to the Company their Notes, in whole or in part, at a purchase price equal to 101% of the aggregate principal amount thereof, plus accrued and unpaid interest thereon to the date of purchase.
The Company and its restricted subsidiaries are subject to certain negative covenants under the indenture governing the Notes. The indenture limits the ability of the Company and each of its restricted subsidiaries to, among other things, (i) sell assets, (ii) pay dividends or make other distributions on capital stock or subordinated indebtedness, (iii) make investments, (iv) incur additional indebtedness or issue preferred stock, (v) create certain liens, (vi) enter into agreements that restrict dividends or other payments from its subsidiaries to itself, (vii) consolidate, merge or transfer all or substantially all of its assets, (viii) engage in transactions with affiliates, and (ix) create unrestricted subsidiaries.
These covenants are subject to certain exceptions and qualifications. In addition, substantially all of the covenants will terminate before the Notes mature if one of two specified ratings agencies assigns the Notes an investment grade rating in the future and no events of default exist under the Indenture. Any covenants that cease to apply to us as a result of achieving an investment grade rating will not be restored, even if the credit rating assigned to the Notes later falls below an investment grade rating.
In connection with the sale of the Notes, the Company entered into a registration rights agreement with the initial purchasers, pursuant to which it has agreed to file an exchange offer registration statement with the SEC with respect to an offer to exchange the Notes for substantially identical notes that are registered under the Securities Act, and to use reasonable best efforts to cause such registration statement become effective on or prior to November 29, 2008. Additionally, the Company has agreed to commence the registered exchange offer and to use its reasonable best efforts to issue, on or prior to the date that is 60 days after the date on which the exchange offer registration statement became effective, exchange notes in exchange for all Notes tendered prior thereto in the registered exchange offer. Under some circumstances, in lieu of a registered exchange offer, the Company has agreed to file a shelf registration statement to cover resales of the Notes by certain holders thereof and to use reasonable best efforts to keep the shelf registration statement effective for a period of at least two years or such shorter period ending on the earlier of when all of the Notes available for sale thereunder (i) have been sold pursuant thereto and (ii) are no longer restricted securities (as defined in Rule 144 under the Securities Act, or any successor rule thereof). The Company and the Guarantors are required to pay additional interest if they fail to comply with their obligations to register the Notes within the specified time periods.
Key Energy Services, Inc. and Subsidiaries
NOTES TO CONSOLIDATED FINANCIAL STATEMENTS (Continued)
11. LONG-TERM DEBT (Continued)
As of December 31, 2007, the Company is in compliance with all the covenants required under the Notes.
Simultaneously with the closing of the offering of the Notes, the Company entered into a new credit agreement (the "Credit Agreement") with several lenders. The Credit Agreement provides for a senior secured credit facility (the "2007 Senior Secured Credit Facility") consisting of a revolving credit facility, letter of credit sub-facility and swing line facility of up to an aggregate principal amount of $400.0 million, all of which will mature no later than November 29, 2012. The 2007 Senior Secured Credit Facility and the obligations thereunder are secured by substantially all of the assets of the Company and are or will be guaranteed by certain of the Company's existing and future domestic subsidiaries.
The 2007 Senior Secured Credit Facility replaced the Company's 2005 Senior Secured Credit Facility, which was terminated in connection with the closing of the offering of the Notes.
The interest rate per annum applicable to amounts borrowed under the 2007 Senior Secured Credit Facility are, at the Company's option, (i) LIBOR plus the applicable margin or (ii) the higher of (x) Bank of America's prime rate and (y) the Federal Funds rate plus 0.5%, plus the applicable margin. The applicable margin for LIBOR loans ranges from 150 to 200 basis points, and the applicable margin for all other loans ranges from 50 to 100 basis points, both of which depend upon the Company's consolidated leverage ratio.
The 2007 Senior Secured Credit Facility contains certain financial covenants, which, among other things, require the maintenance of a consolidated leverage ratio not to exceed 3.50 to 1.00 and a consolidated interest coverage ratio of not less than 3.00 to 1.00, and limit the Company's capital expenditures to $250.0 million per fiscal year, up to 50% of which amount may be carried over for expenditure in the following fiscal year. Each of the ratios referred to above will be calculated quarterly on a consolidated basis for each trailing four fiscal quarter period. In addition, the 2007 Senior Secured Credit Facility contains certain affirmative and negative covenants, including, without limitation, restrictions on (i) liens; (ii) debt, guarantees and other contingent obligations; (iii) mergers and consolidations; (iv) sales, transfers and other dispositions of property or assets; (v) loans, acquisitions, joint ventures and other investments (with acquisitions permitted so long as, after giving pro forma effect thereto, no default or event of default exists under the 2007 Senior Secured Credit Facility, the consolidated leverage ratio does not exceed 2.75 to 1.00, the Company is in compliance with the consolidated interest coverage ratio and the Company has at least $25 million of availability under the 2007 Senior Secured Credit Facility); (vi) dividends and other distributions to, and redemptions and repurchases from, equity holders; (vii) prepaying, redeeming or repurchasing subordinated (contractually or structurally) debt; (viii) granting negative pledges other than to the lenders; (ix) changes in the nature of the Company's business; (x) amending organizational documents, or amending or otherwise modifying any debt, any related document or any other material agreement if such amendment or modification would have a material adverse effect; and (xi) changes in accounting policies or reporting practices; in each of the foregoing cases, with certain exceptions. Further, the 2007 Senior Secured Credit Facility permits share repurchases up to $200.0 million and provides that share repurchases in excess of $200.0 million can be made only if our debt to capitalization ratio is below 50%.
Key Energy Services, Inc. and Subsidiaries
NOTES TO CONSOLIDATED FINANCIAL STATEMENTS (Continued)
11. LONG-TERM DEBT (Continued)
As of December 31, 2007, the Company is in compliance with all the covenants required under the 2007 Senior Secured Credit Facility.
The Company may prepay the 2007 Senior Secured Credit Facility in whole or in part at any time without premium or penalty, subject to certain reimbursements to the lenders for breakage and redeployment costs.
As of December 31, 2007, the Company had approximately $50.0 million outstanding in borrowings under the revolving portion of the 2007 Senior Secured Credit Facility. The Company also had $61.1 million in committed letters of credit under the facility, and $288.9 million available to borrow under the facility. Under the terms of the agreement, committed letters of credit count against our borrowing capacity under the revolving credit facility. In addition to interest, we also pay a quarterly commitment fee of 0.3% of our available balance under the revolver, and an annual fee for our committed letters of credit equal to 1.5% of the balance of our committed letters of credit.
In connection with the acquisition of Moncla (see Note 2—"Acquisitions"), the Company entered into two promissory notes with the sellers. The first is an unsecured note in the amount of $12.5 million, which is due and payable in a lump-sum, together with accrued interest, on October 25, 2009. Interest on this note is due on each anniversary of the closing of the acquisition of Moncla, which was October 25, 2007. The second unsecured note in the amount of $10.0 million is payable in annual installments of $2.0 million, plus accrued interest, beginning October 25, 2008 through 2012. Each of the notes bears interest at the Federal Funds rate, adjusted annually on the anniversary date of the closing date. As of December 31, 2007, the interest rate on these notes was 4.75%.
The Federal Funds rate does not represent a rate that would have resulted if an independent borrower and an independent lender had negotiated a similar transaction under comparable terms and conditions and is not equal to our incremental borrowing rate. In accordance with APB No. 21, "Interest on Receivables and Payables" ("APB 21") and SFAS 141, we recorded the promissory notes at fair value which resulted in a discount being recorded. The discount will be recognized as interest expense over the life of the promissory notes using the effective interest method.
On July 29, 2005, we entered into a Credit Agreement (the "Senior"2005 Senior Secured Credit Facility"). The 2005 Senior Secured Credit Facility consistsconsisted of (i) a revolving credit facility of up to an aggregate principal amount of $65.0 million, which willwas to mature on July 29, 2010,2010; (ii) a senior term loan facility in the original aggregate principal amount of $400.0 million, which willwas to mature on June 30, 2012,2012; and (iii) a prefunded letter of credit facility in the aggregate amount of $82.3 million, which willwas to mature on July 29, 2010. The revolving credit facility includesincluded a $25.0 million sub-facility for additional letters of credit. The proceeds from the term loan facility, along with cash on hand, were used to refinanceredeem or repay our existing 8.375%Previous Senior Notes and our existing 6.375% Senior Notes. The revolving credit facility may be used for general corporate purposes.(defined below).
Borrowings under the 2005 Senior Secured Credit Facility through December 31, 2005 bore interest upon the outstanding principal balance, at the Company's option, at the prime rate plus a margin of 1.75% or a Eurodollar rate plus a margin of 2.75%. These margins were increased on December 31, 2005 by 0.50% and again on June 30, 2006 by 0.50% because the Company did not meet
Key Energy Services, Inc. and Subsidiaries
NOTES TO CONSOLIDATED FINANCIAL STATEMENTS (Continued)
11. LONG-TERM DEBT (Continued)
certain filing targets for our 2003 Annual Report on Form 10-K. We were also required to pay certain fees in connection with the credit facilities, including a commitment fee as a percentage of aggregate commitments.
TheBetween November 1, 2005 and July 27, 2007, we amended the 2005 Senior Secured Credit Facility contains certain covenants, which,three times in order to, among other things, require us to maintain a consolidated leverage ratio (defined generally as(i) extend the ratio of consolidated total debt to consolidated EBITDA) as follows:
Fiscal Quarter
| | Consolidated Leverage Ratio
|
|---|
Fourth Fiscal Quarter, 2005 | | 3.5 : 1.0 |
First Fiscal Quarter, 2006 | | 3.0 : 1.0 |
Second Fiscal Quarter, 2006 | | 3.0 : 1.0 |
Third Fiscal Quarter, 2006 and thereafter | | 2.75 : 1.0 |
The Senior Secured Credit Facility also requires that we maintain a consolidated interest coverage ratio (defined generally as the ratio of consolidated EBITDA to consolidated interest expense) as of the last day of any fiscal quarter, beginning with the fourth fiscal quarter of 2005, of not less than 3.0
to 1.0. Upon the occurrence of certain events of default, such as payment default,filing deadlines for our obligations under the Senior Secured Credit Facility may be accelerated.
All obligations under the Senior Secured Credit Facility are guaranteed by most of our subsidiaries and are secured by most of our assets, including our accounts receivable, inventory and equipment.
On November 1, 2005, we amended the Senior Secured Credit Facility (the "First Amendment") to increase the amount of capital expenditures allowed under the facility during 2005 and 2006. Under the terms of the First Amendment, we were allowed to make annual capital expenditures of $175.0 million for 2005 and $200.0 million for 2006. Additionally, under certain conditions, up to $25.0 million of the capital expenditure limit, if not spent in the permitted fiscal year, could be carried over for expenditures in the next succeeding fiscal year. Previously under the Senior Secured Credit Facility, we were limited to annual capital expenditures of $150.0 million.
On November 21, 2006, we again amended the Senior Secured Credit Facility (the "Second Amendment") to (i) allow the Company until July 31, 2007 to file this 2006 Annual Report on Form 10-K and quarterly reports for 2005, and 2006, and quarterly reports forthe first two quarters of 2007, that were then due, and to waive any defaults due to the failure to file compliant SEC reports for prior periods; (ii) reduce the Eurodollar interest rate spread from 3.75% to 2.50%spreads and commitment fees from 0.50% to 0.375%;associated with the term loans under the facility, (iii) increase the limitationlimitations on our capital expenditures, through 2009 to $225.0 million; (iv) increase the permitted stock repurchase basket from $50.0 million to $250.0 millionunder the agreement, (v) increase and permit repurchases before the Company has made all required SEC filings (although the Company is still subject to securities laws limitations on its ability to repurchase stock before it has released current financial information); (v) increasesubsequently eliminate the permitted acquisitions basket from $50.0 million to $100.0 million;under the agreement, and (vi) eliminate the provisionprovisions requiring the Company to prepay term loans under the term loanfacility with excess cash flow. We paid a total of $0.5approximately $1.7 million in fees and other expenses in connection with the Second Amendment.for these amendments.
As of December 31, 2006,On November 29, 2007, the Company had no borrowingsissued the Notes, and used the proceeds to retire the term loan amounts then outstanding under the revolving credit facility of the Senior Secured Credit Facility and had $396.0 million borrowed at three-month Eurodollar rates, plus a margin of 2.50%. As described above, the Company has interest rate swaps that hedge a portion of the interest rate expense on the term loan.
On July 27, 2007, we entered into a third amendment to our2005 Senior Secured Credit Facility. Please see Note 19–"Subsequent Events" forWe recognized a discussionloss of our amendment to ourapproximately $9.6 million upon the extinguishment of the 2005 Senior Secured Credit Facility.
On November 10, 2003, we entered into a Fourth Amended and Restated Credit Agreement (the "Prior"2003 Senior Secured Credit Facility"). The Prior2003 Senior Secured Credit Facility consisted of a $175.0 million revolving loan facility with the entire facilityamount being available for letters of credit. We previously had the right, subject to certain terms and conditions, to increase the total commitment under the Prior Senior Credit Facility from $175.0 million to upfacility to $225.0 million if we were ableunable to obtain additional lending commitments. The revolving loan commitments were scheduled to terminate on November 10, 2007, and all revolving loans would have been required to be paid on or before that date. The revolving loans bore interest based upon, at our option, the agent's base rate for loans or the agent's reserve-adjusted LIBOR rate for loans, plus, in either case, a margin which would fluctuate based upon our consolidated total leverage ratio and, in either case, according to the pricing grid set forth in the Prior Senior Credit Facility.
The Prior Senior Credit Facility contained various financial covenants applicable to specific periods, including: (i) a maximum consolidated total leverage ratio, (ii) a minimum consolidated interest coverage ratio, and (iii) a minimum net worth. The Prior Senior Credit Facility subjected us to other restrictions, including restrictions upon our ability to incur additional debt, liens and guarantee obligations, to merge or consolidate with other persons, to make acquisitions, to sell assets, to pay dividends, to repurchase our stock or subordinated debt, to make investments, loans and advances or to make changes to debt instruments and organizational documents. All obligations under the Prior Senior Credit Facility were guaranteed by most of our subsidiaries and were secured by most of our assets, including our accounts receivable, inventory and most equipment.
Our failure to file our 2003 Annual Report on Form 10-K on a timely basis violated the covenants underof the Prior2003 Senior Secured Credit Facility. Between March 31, 2004 and July 29,20, 2005, we amended the terms of the Prior2003 Senior Secured Credit Facilityfacility six times to waive the covenants and extend the due date for theour 2003 reportAnnual Report on Form 10-K and other filings. WeDuring 2005 we paid a total of $1.1 million and $1.3 million in fees during the years ended December 31, 2005 and 2004, respectively, related to the various amendments to the Prior2003 Senior Secured Credit Facility. The final due date under the Prior Senior Credit Facility for the filing of our Annual Report on Form 10-K for 2004 and the Quarterly Reports on Form 10-Q for the first three quarters of 2004 was October 31, 2005. The last amendment also extended the date by which the Quarterly Reports on Form 10-Q for the first quarter and second quarter of 2005 had to be filed to December 31, 2005. On July 29, 2005, we entered into the 2005 Senior Secured Credit Facility, which replaced the Prior2003 Senior Secured Credit Facility.
On May 14, 2003, we completed a public offering of $150.0 million of 6.375% Senior Notes due May 1, 2013 (the "6.375% Senior Notes"). The proceeds from the public offering, net of fees and expenses, were used to repay the balance of the revolving loan facility then outstanding under our then-existing credit facility, with the remainder being used for general corporate purposes. The 6.375% Senior Notes were senior unsecured obligations and were fully and unconditionally guaranteed by substantially all of our subsidiaries. The 6.375% Senior Notes were effectively subordinated to Key's secured indebtedness, which included borrowings under our Prior Senior Credit Facility. The 6.375% Senior Notes required semi-annual interest payments on May 1 and November 1 of each year. Interest of $9.6 million and $8.9 million was paid on these notes during 2005.
On March 6, 2001, we completed a private placement of $175.0 million of 8.375% Senior Notes due March 1, 2008 (the "8.375% Senior Notes"; together with the 6.375% Senior Notes, the "Previous Senior Notes"). The net cash proceeds from the private placement were used to repay all of the remaining balance of prior term loans and a portion of the revolving credit facility then outstanding under our then-existing credit facility. On March 1, 2002, we completed the public offering of an additional $100.0 million of 8.375% Senior Notes. The net cash proceeds were used to repay the
Key Energy Services, Inc. and Subsidiaries
NOTES TO CONSOLIDATED FINANCIAL STATEMENTS (Continued)
11. LONG-TERM DEBT (Continued)
outstanding balance of the revolving loan facility under our then-existing credit facility. The 8.375% Senior Notes required semi-annual interest payments on March 1 and September 1 of each year. Interest of $27.3 million was paid on these notes during 2005.
Our failure to file our 2003 Annual Report on Form 10-K with the SEC and deliver it to the trustee under the indentures for the Previous Senior Notes before March 30, 2004 constituted a default under those indentures. During 2004 and 2005 respectively.we amended the terms of each of the indentures three times to waive the covenant non-compliance and extend the due date for our 2003 Annual Report on Form 10-K and other filings. In order to obtain these amendments and consents we incurred costs totaling $9.0 million during 2005. The final amendment to the indentures established due dates of May 31, 2005 for filing our 2003 Annual Report on Form 10-K and of July 31, 2005 for filing our 2004 Annual Report on Form 10-K and 2004 quarterly reports on Form 10-Q. The consents also provided a due date of October 31, 2005 for filing our quarterly reports on Form 10-Q for the first and second quarters of 2005. We failed to meet these deadlines, and on June 6, 2005 the trustee for the Previous Senior Notes sent us notice of the financial reporting violation, which the triggered a 60-day cure period. Due to our failure to cure this default, on September 28, 2005 we received a valid acceleration notice from the trustee for the 6.375% Senior Notes.
The 6.375% Senior Notes were repaid on October 5, 2005, at a price of 100% of the outstanding principal amount plus accrued and unpaid interest to the repayment date, resulting in a net cash outlay of $154.1 million. We recognized a loss of $2.3 million on this transaction. Proceeds from the Senior Secured Credit Facility and cash on hand were used to repay the 6.375% Notes.
On March 6, 2001, we completed a private placement of $175.0 million of 8.375% Senior Notes due March 1, 2008 (the "8.375% Senior Notes," together with the 6.375% Senior Notes, the "Senior Notes"). The net cash proceeds from the private placement were used to repay all of the remaining balance of prior term loans and a portion of the revolving loans then outstanding under our then-existing credit facility. On March 1, 2002, we completed a public offering of an additional $100.0 million of 8.375% Senior Notes. The net cash proceeds from the public offering were used to repay the then-outstanding balance of the revolving loan facility under our credit facility. The 8.375% Senior Notes were senior unsecured obligations. The 8.375% Senior Notes were effectively subordinated to Key's secured indebtedness which included borrowings under our Prior Senior Credit Facility. The 8.375% Senior Notes required semi-annual interest payments on March 1 and
September 1 of each year. Interest of $23.0 million and $27.3 million was paid on the 8.375% Senior Notes in 2004 and 2005, respectively.
We redeemed all $275.0 million outstanding principal amount of the 8.375% Senior Notes on November 8, 2005. The 8.375% Senior Notes were redeemed at a redemption price of 104.188% of the principal amount plus accrued and unpaid interest to the redemption date, for a net cash outlay of $290.9 million,million. resulting in a loss of $14.1 million. We recognized losses totaling $16.4 million related to these transactions. Proceeds from the 2005 Senior Secured Credit Facility and cash on hand were used to repay the 8.375% Notes.
Our failure to file our 2003 Annual Report on Form 10-K with the SEC and deliver it to the trustee under the Senior Note indentures on or before March 30, 2004 was a default under each of the indentures for thePrevious Senior Notes. During 2004 and 2005, we amended the terms of each of the Senior Note indentures three times to waive the covenant non-compliance and extend the due date for our 2003 Annual Report on Form 10-K and other filings. In order to obtain these amendments and consents, we incurred $9.0 million and $5.1 million of expenses in 2005 and 2004, respectively. We were required under the last consent by the holders of each series of Senior Notes to file our 2003 Annual Report on form 10-K on or before May 31, 2005 and our 2004 quarterly reports on Form 10-Q and our Annual Report on Form 10-K for 2004 on or before July 31, 2005. The consent also provided that the Quarterly Reports on Form 10-Q for the first quarter and second quarter of 2005 had to be filed no later than October 31, 2005. We failed to meet those deadlines, and as a result, on June 6, 2005, the trustee for the Senior Notes sent us notice of the financial reporting violation, which then triggered a 60-day cure period. Due to our failure to cure this default, on September 28, 2005, we received a valid acceleration notice from the trustee for the 6.375% Senior Notes. As a result, the 6.375% Senior Notes were repaid on October 5, 2005. We also redeemed all of the 8.375% Senior Notes on November 8, 2005. The Senior Notes were repaid with funds from our Senior Secured Credit Facility and cash on hand.
On January 22, 1999, we completed the private placement of 150,000 units (the "Units") consisting of $150.0 million of 14% Senior Subordinated Notes due January 15, 2009 (the "14% Senior Subordinated Notes") and 150,000 warrants to purchase 2,173,433 shares of the Company's common stock at an exercise price of $4.88125 per share (the "Warrants"). The net cash proceeds from the private placement were used to repay substantially all of the remaining $148.6 million principal amount (plus accrued interest) owed under our bridge loan facility arranged in connection with the acquisition of Dawson Production Services, Inc. The 14% Senior Subordinated Notes were issued at a discount, which was amortized to interest expense over the term of the 14% Senior Subordinated Notes.
The 14% Senior Subordinated Notes required semi-annual interest payments on January 15 and July 15 of each year. The 14% Senior Subordinated Notes were subordinated to our other senior indebtedness, which included borrowings under the Prior Senior Credit Facility, the 8.375% Senior Notes and the 6.375% Senior Notes. During the years prior to 2004, we redeemed approximately $52.5 million of principal amount of our 14% Senior Subordinated Notes at varying times and redemption prices, plus accrued interest.
We repaid the remaining $97.5 million outstanding principal amount of the 14% Senior Subordinated Notes on January 15, 2004. The notes were redeemed at a redemption price of 107% of the principal amount outstanding plus accrued and unpaid interest to the redemption date, for a total cash outlay of $111.2 million. This transaction resulted in a loss of $12.0 million.
As of December 31, 2006, 63,500 Warrants had been exercised, providing $4.2 million of proceeds to us and leaving 86,500 Warrants outstanding. On the date of issuance, the value of the Warrants was
estimated at $7.4 million and was classified as equity. Under the terms of the Warrants, we are required to maintain an effective registration statement covering the shares of common stock issuable upon exercise. If we are unable to maintain an effective registration statement, we are required to pay liquidated damages for periods in which an effective registration statement is not maintained. We have been unable to maintain an effective registration statement due to our failure to timely file our SEC reports. As a result, we paid liquidated damages starting at $0.05 per Warrant per week and escalating to $0.20 per Warrant per week. The total amounts paid to the holders of the Warrants were $0.9 million, $0.7 million and $69,200 in the years ended December 31, 2006, 2005 and 2004, respectively.
In 1997, we completed a private placement of $216.0 million of 5% Convertible Subordinated Notes due September 15, 2004 (the "5% Convertible Notes"). The 5% Convertible Notes were subordinated to our senior indebtedness. The 5% Convertible Notes were convertible, at the holder's option, into shares of Key's common stock at a conversion price of $38.50 per share, subject to certain adjustments. The 5% Convertible Notes were redeemable, at our option, on and after September 15, 2000, in whole or part, together with accrued and unpaid interest. The initial redemption price was 102.86% for the year beginning September 15, 2000 and declined ratably thereafter on an annual basis. During the years prior to 2004, we repurchased and canceled through open market transactions approximately $187.2 million principal amount of the 5% Convertible Notes at various times and prices.
Interest on the 5% Convertible Notes was payable on March 15 and September 15 of each year. Interest of approximately $0.5 million was paid on March 15, 2004.
The remaining $18.7 million outstanding principal amount of the 5% Convertible Notes matured and was repaid at par on September 15, 2004, plus accrued interest and fees, for a total cash outlay of $19.2 million.
As discussed in Note 2—6—"Sale-Leaseback Transactions," we lease certain equipment such as tractors, trailers, frac tanks and forklifts from financial institutions under master lease agreements. Under certain of these master lease agreements, we were required to provide current annual and quarterly financial reports. WeFor certain of these leases, we obtained a series of waivers from the financial institutions regarding the filing of these reports, the last of which allowed us until September 30, 2006 to file an Annual Report on Form 10-K for 2003. Due to our inability to provide audited financial statements for the year ended December 31, 2003 that comply with SEC rules, and the time required to file this report, we are not in compliance with the terms of these equipment leases. We do not intend to seek additional waivers from the financial institutions, and as a result the equipment lessors may demand that the leases be repaid. NoAs of December 31, 2007, no formal demands for repayment havehad been made by the lessors. As of December 31, 2006,2007, the total amount outstanding under such lease agreements was approximately $7.2$2.7 million. We have recorded a current liability of $4.2$1.7 million in our consolidated balance sheets as of December 31, 2006,2007, which represents our obligation under these lease agreements that are accounted for as capital leases. The remaining $3.0$1.0 million represents the remaining payments under leases with those lessors that we account for as operating leases.
Key Energy Services, Inc. and Subsidiaries
NOTES TO CONSOLIDATED FINANCIAL STATEMENTS (Continued)
11. LONG-TERM DEBT (Continued)
Presented below is a schedule of the repayment requirements of long-term debt for each of the next five years and thereafter as of December 31, 2006:2007:
| | Principal
Amount Long-
Term Debt
|
| | Principal Amount of
Long-Term Debt
| |
|---|
| | (in thousands)
|
| | (in thousands)
| |
|---|
| 2007 | | $ | 4,000 | |
| 2008 | | 4,000 | 2008 | | $ | 2,000 | |
| 2009 | | 4,000 | 2009 | | 14,500 | |
| 2010 | | 4,000 | 2010 | | 2,000 | |
| 2011 | | 4,000 | 2011 | | 2,000 | |
| 2012 | | 2012 | | 52,000 | |
| Thereafter | | 376,000 | Thereafter | | 425,000 | |
| | |
| | |
| |
| | | $ | 396,000 | Total principal payments | | 497,500 | |
| | |
| | |
| |
| Less: fair value discount | | Less: fair value discount | | (322 | ) |
| | | | |
| |
| Total long-term debt | | Total long-term debt | | $ | 497,178 | |
| | | | |
| |
Presented below is a schedule of our estimated minimum lease payments on our capital lease obligations for the next five years and thereafter as of December 31, 2006:2007:
| | Capital Lease
Obligation
Minimum Lease
Payments
| | | Capital Lease
Obligation Minimum
Lease Payments
| |
|---|
| | (in thousands)
| | | (in thousands)
| |
|---|
| 2007 | | $ | 12,890 | | |
| 2008 | | 6,983 | | | $ | 13,142 | |
| 2009 | | 5,526 | | | 9,251 | |
| 2010 | | 2,935 | | | 6,066 | |
| 2011 | | 255 | | | 2,950 | |
| 2012 | | | 244 | |
| Thereafter | | — | | | — | |
| | |
| | |
| |
| Total minimum lease payments | | 28,589 | | | 31,653 | |
| | |
| | |
| |
| Less: executory costs | | (547 | ) | | (2,696 | ) |
| | |
| | |
| |
| Net minimum lease payments | | 28,042 | | | 28,957 | |
| | |
| | |
| |
| Less: amounts representing interest | | (2,248 | ) | | (2,142 | ) |
| | |
| | |
| |
| Present value of minimum lease payments | | $ | 25,794 | | | $ | 26,815 | |
| | |
| | |
| |
Key Energy Services, Inc. and Subsidiaries
NOTES TO CONSOLIDATED FINANCIAL STATEMENTS (Continued)
11. LONG-TERM DEBT (Continued)
Interest expense for the years ended December 31, 2007, 2006 2005 and 20042005 consisted of the following:
| | Year ended December 31,
| | | Year Ended December 31,
| |
|---|
| | 2006
| | 2005
| | 2004
| | | 2007
| | 2006
| | 2005
| |
|---|
| | (in thousands)
| | | (in thousands)
| |
|---|
| Cash payments | | $ | 40,290 | | $ | 38,889 | | $ | 42,219 | | | $ | 33,964 | | $ | 40,290 | | $ | 39,098 | |
| Commitment and agency fees paid | | 4,244 | | 14,909 | | 10,327 | | | 2,232 | | 4,244 | | 14,909 | |
| Amortization of discount and premium on notes | | — | | (212 | ) | | (236 | ) | |
| Amortization of discount and premium, net | | | — | | — | | (212 | ) |
| Amortization of debt issuance costs | | 1,620 | | 1,560 | | 2,329 | | | 1,680 | | 1,620 | | 1,351 | |
| Settlement of interest rate swaps | | | 2,261 | | — | | — | |
| Net change in accrued interest | | (3,869 | ) | | (3,581 | ) | | (6,127 | ) | | 1,366 | | (3,869 | ) | | (3,581 | ) |
| Capitalized interest | | (3,358 | ) | | (1,266 | ) | | (2,306 | ) | | (5,296 | ) | | (3,358 | ) | | (1,266 | ) |
| | |
| |
| |
| | |
| |
| |
| |
| Total interest expense | | $ | 38,927 | | $ | 50,299 | | $ | 46,206 | | | $ | 36,207 | | $ | 38,927 | | $ | 50,299 | |
| | |
| |
| |
| | |
| |
| |
| |
As of December 31, 2007, the weighted average interest rate of our variable rate debt was 5.9787%.
12. COMMITMENTS AND CONTINGENCIES
Litigation.Operating Lease Arrangements. Key leases certain property and equipment under non-cancelable operating leases that generally expire at various dates through 2020, with varying payment dates throughout each month.
As of December 31, 2007, the future minimum lease payments under non-cancelable operating leases are as follows (in thousands):
| | Lease Payments
|
|---|
| 2008 | | $ | 7,428 |
| 2009 | | | 5,569 |
| 2010 | | | 3,823 |
| 2011 | | | 1,719 |
| 2012 | | | 1,540 |
| Thereafter | | | 4,145 |
| | |
|
| | | $ | 24,224 |
| | |
|
Operating lease expense was $16.4 million, $17.0 million and $19.5 million for the years ended December 31, 2007, 2006 and 2005, respectively.
Litigation in the Normal Course of Business. Various suits and claims arising in the ordinary course of business are pending against us. Due to locations where we conduct business in the continental United States, we are often subject to jury verdicts and arbitration hearings that result in favor of the plaintiffs. We do not believe that the disposition of any of these items will result in a material adverse impact on our consolidated financial position, results of operations or cash flows.
Government Investigations. On March 29, 2004, we were notified by the Fort Worth office of the SEC that it had commenced an inquiry regarding the Company. The SEC issued a formal order of investigation on July 15, 2004. On May 30, 2007, we were informed by the staff of the Enforcement Division of the SEC that it had completed its investigation as to Key and that it did not intend to recommend enforcement action. In addition, on January 5, 2005, we were served with a subpoena issued by a grand jury in Midland, Texas, that asked for the production of documents in connection with an investigation being conducted by the U.S. Attorney's Office for the Western District of Texas. In October 2006, we were notified by the U.S. Attorney's Office that it would not pursue any criminal charges against the Company.
Gonzales Matter. In September 2005 a class action lawsuit,Gonzales v. Key Energy Services, Inc., was filed in Ventura County, California Superior Court alleging that Key did not pay its hourly
Key Energy Services, Inc. and Subsidiaries
NOTES TO CONSOLIDATED FINANCIAL STATEMENTS (Continued)
12. COMMITMENTS AND CONTINGENCIES (Continued)
employees for travel time between the yard and the wellhead and that certain employees were denied meal and rest periods between shifts. Discovery in the case is underway, but a class has not been certified. Key moved for a legal determination regarding its use of on-duty meal periods and the Court issued a ruling on March 16, 2007 contrary to Key's interpretation of the relevant law. Key has recently filed a petition for a writ with the Court of Appeals of the State of California. We intend to vigorously defend against this action; however, we cannot predict the outcome of the lawsuit. We have recorded a liability for this matter and do not expect that the conclusion of this matter will have a material impact on our financial position, results of operations, or cash flows or financial position.
Eustace Matter. Joe Eustace was employed by Key from 1999 until 2004 as a Vice President and Regional Manager pursuant to an employment agreement. Key terminated him for cause in February 2004. He filed suit in January 2006 alleging breach of contract, fraud and conversion seeking reinstatement of his stock options. The case was transferred from Harris County to Midland County, Texas. A jury trial began May 7, 2007. The jury found that Key Energy did not have "cause" to terminate his employment but made no finding on damages. On July 20, 2007, the court entered a judgment in favor of Mr. Eustace of approximately $1.4 million. Key is considering whether to appeal this decision. See Note 19—"Subsequent Events" for a discussion of the court's ruling. We have recorded a liability for this matter and do not expect that the conclusion of this matter will have a material impact on our results of operations, cash flows or financial position.flows.
Litigation with Former Officers and Employees. On April 7, 2006, we delivered a notice to our former chief executive officer, Francis D. John, of our intention to treat his termination of employment effective May 1, 2004, as "for Cause" under his employment agreement with us. In response to the notice, Mr. John filed a lawsuit against us in the U.S. District Court for the Southern District of Texas, Houston Division on May 19, 2006, in which he alleged, among other things, that we breached stock option agreements and his employment agreement. On June 13, 2006, we filed an answer and counterclaim denying Mr. John's claims and asserting claims against Mr. John for breach of contract and declaratory judgment including, among other things, a declaration that "Cause" exists under Mr. John's employment agreement. On June 20, 2007 we settled our litigation with Mr. John for $23.0 million. Please see Note 19—"Subsequent Events" for a discussion of our settlement with Mr. John.
We have also beenwere named in a lawsuit by our former general counsel, Jack D. Loftis, Jr., filed in the U.S. District Court, District of New Jersey on April 21, 2006, in which he alleges a "whistle-blower" claim under the Sarbanes-Oxley Act, breach of contract, breach of good faith and fair dealing, breach of fiduciary duty, and wrongful termination. Mr. Loftis previously filed his "whistle-blower" claim with the Department of Labor ("DOL"), which found that there was no reasonable cause to believe that we violated the Sarbanes-Oxley Act when we terminated Mr. Loftis and dismissed the complaint. On July 28, and October 2, 2006, Key moved to dismiss the lawsuit for lack of jurisdiction over Key Energy or for lack of venue. On June 28, 2007, the New Jersey District Court denied our motions but on its own motion transferred the case to the U.S. District Court for the Eastern District of Pennsylvania.Pennsylvania, where it is pending.
On July 6, 2007, we delivered a notice to Mr. Loftis, through his counsel, of our intention to treat his termination of employment effective July 8, 2004 as "for cause" under his employment agreement. On August 17, 2007, the Company filed counterclaims against Mr. Loftis alleging attorney malpractice, breach of contract, and breach of fiduciary duties. In its counterclaims, the Company seeks repayment of all severance paid to Mr. Loftis to date (approximately $0.8 million) plus benefits paid during the period July 8, 2004 to September 21, 2004, as well as damages relating to the allegations of malpractice and breach of fiduciary duties. On September 21, 2007, the Company's Board of Directors determined that Mr. Loftis should be terminated "for cause" effective July 8, 2004, and further found that his vested and unvested stock options should be deemed expired.
On September 3, 2006, our former controller and assistant controller filed a joint complaint against the Company on in 133rd District Court, Harris County, Texas alleging constructive termination and breach of contract. Discovery is now ongoing in this case. Additionally, on January 11, 2008, our former Chief Operating Officer, James Byerlotzer, filed a lawsuit in the 55th District Court, Harris County, Texas, alleging breach of contract based on his inability to exercise his stock options during the period that Key was not current in its SEC filings, and based on Key's failure to provide him shares of restricted stock.
We are vigorously defending against these claims; however, we cannot predict the outcome of the lawsuits.
On August 21, 2006, our former chief financial officer, Royce W. Mitchell, filed a suit against the Company in 385th District Court, Midland County, Texas alleging breach of contract with regard to alleged bonuses, benefits, and expense reimbursements, conditional stock grants and stock options, to which he believes himself entitled; as well as relief under theories of quantum meruit, promissory estoppel, and specific performance. Although there is no scheduling order in the case, discovery is underway. Further, our former controller and assistant controller filed a joint complaint against the Company on September 3, 2006 in 133rd District Court, Harris County, Texas alleging constructive termination and breach of contract. Following Key's removal of the case to the federal court, Plaintiff dismissed his constructive termination allegation andOn February 15, 2008, the parties agreed to a remandsettled the matter for $0.5 million, which included reimbursement of the case back to the state court. Discovery is now ongoing.
We intend to vigorously defend against these claims; however, we cannot predict the outcomeexpenses and attorneys fees of the lawsuits.approximately $0.4 million.
Shareholder Class Action Suits.Suits and Derivative Actions. Since June 2004, we have beenand certain of our officers and directors were named as a defendant in six class action complaints for alleged violations of federal securities laws, which have beenwere filed in federal district court in Texas. They are as follows:
Cause No. MO-04-CV-082;Peter Kaltman, on behalf of himself and all others similarly situated v. Key Energy Services, Inc., Francis D. John, Royce W. Mitchell, Richard J. Alario and James J. Byerlotzer, filed in the United States District Court for the Western District of Texas
Cause No. MO-04-CV-083;Malcolm Lord, Individually and on Behalf of all Others Similarly situated v. Key Energy Services, Inc., Francis D. John, Richard J. Alario, James J. Byerlotzer and Royce W. Mitchell, filed in the United States District Court for the Western District of Texas
Cause No. MO-04-CV-090;Celeste Navon, on behalf of herself and all others similarly situated v. Key Energy Services, Inc., Francis John, Royce Mitchell, James Byerlotzer and Richard Alario, filed in the United States District Court for the Western District of Texas
Cause No. MO-04-CV-104;David W. Ortbals, on Behalf of Himself and All Others Similarly situated v. Key Energy Services, Inc., Richard J. Alario, James J. Byerlotzer, Francis D. John, and Royce W. Mitchell, filed in the United States District Court for the Western District of Texas
Cause No. MO-04-CV-0254;Paul E. Steward, on Behalf of Himself and All Others Similarly situated v. Key Energy Services, Inc., Francis D. John and Royce W. Mitchell, filed in the United States District Court for the Western District of Texas
Cause No. MO-04-CV-0227;Garco Investment LLP Individually and on Behalf of all Others Similarly Situated v. Key Energy Services, Inc., Richard J. Alario, James J. Byerlotzer, Francis D. John and Royce W. Mitchell, filed in the United States District Court for the Western District of Texas
These six actions have beenwere consolidated into one action. On November 1, 2005, the plaintiffs filed a consolidated amended class action complaint. The complaint iswas brought on behalf of a class of putative class of purchasers of our securities between April 29, 2003 and June 4, 2004. The complaint names Key, Francis D. John, Royce W. Mitchell, Richard J. Alario and James J. Byerlotzer as defendants. The
complaint generally alleges that we made false
Key Energy Services, Inc. and Subsidiaries
NOTES TO CONSOLIDATED FINANCIAL STATEMENTS (Continued)
12. COMMITMENTS AND CONTINGENCIES (Continued)
and misleading statements and omitted material information from our public statements and SEC reports during the class period, in violation of the Securities Exchange Act of 1934, including alleged: (i) overstatement of revenues, net income, and earnings per share, (ii) failure to take write-downs of assets, consisting of primarily idle equipment, (iii) failure to amortize the Company's goodwill, (iv) failure to disclose that the Company lacked adequate internal controls and therefore was unable to ascertain the true financial condition of the Company, (v) material inflation of the Company's financial results at all relevant times, (vi) misrepresentation of the value of acquired businesses, and (vii) failure to disclose misappropriation of funds by employees. We filed a motion to dismiss the case. The individual defendants also filed motions to dismiss the case. On August 11, 2006, the court denied our motion to dismiss, but granted dismissals as to Messrs. Alario and Byerlotzer. We filed our answer to the consolidated amended complaint on September 11, 2006. Trial is set for March 3, 2008.
The Plaintiffs have filed a motion for class certification. The class certification hearing is scheduled to be held on September 6, 2007. The parties are engaged in written discovery and document production.
Shareholder Derivative Actions. Four shareholder derivative actions have beenwere filed by certain of our shareholders. They are as follows:
Cause No. 2004-CV-44728;Moonlight Investments, LTD. on Behalf of Nominal Defendant Key Energy Services, Inc., vs. Francis D. John, Richard J. Alario, James J. Byerlotzer, Royce W. Mitchell, Kevin P. Collins, W. Phillip Marcum, and Ralph S. Michael, III, and Key Energy Services, Inc., filed in the 385th Judicial District Court, Midland County, Texas
Cause No. EP-04-CA-0457;Sandra Weissman, Derivatively on Behalf of Key Energy Services, Inc., vs. Francis D. John, David J. Breazzano, Kevin P. Collins, William D. Fertig, W. Phillip Marcum, Ralph S. Michael III, J. Robinson West, James J. Byerlotzer, Royce W. Mitchell, Richard J. Alario and Key Energy Services, Inc., a Maryland Corporation, filed in the United States District Court Western District of Texas
Cause No. EP-04-CA-0456;Daniel Bloom, Derivatively on Behalf of Key Energy Services, Inc., vs. Francis D. John, David J. Breazzano, Kevin P. Collins, William D. Fertig, W. Phillip Marcum, Ralph S. Michael III, J. Robinson West, James J. Byerlotzer, Royce W. Mitchell, Richard J. Alario and Key Energy Services, Inc., a Maryland Corporation, filed in the United States District Court Western District of Texas
Cause No. 2007-31254;Sandra Weissman, Derivatively on Behalf of Key Energy Services, Inc., v. Francis D. John, David J. Breazzano, Kevin P. Collins, William D. Fertig, W. Phillip Marcum, Ralph S. Michael III, J. Robinson West, James J. Byerlotzer, Royce W. Mitchell, Richard J. Alario and Key Energy Services, Inc., a Maryland Corporation filed in the 270th Judicial District, Harris County, Texas.
Francis D. John, David J. Breazzano, Kevin P. Collins, William D. Fertig, W. Phillip Marcum, Ralph S. Michael III, J. Robinson West, James J. Byerlotzer, Royce W. Mitchell, and Richard J. Alario have been named as defendants in one or more of those actions. Those actions are filed by individual shareholders, purporting to act on our behalf, asserting various claims against the named officer and director defendants. The derivative actions generally allege the same facts as those in the shareholder class action suits. Those suits also allege breach of fiduciary duty, abuse of control, waste of corporate assets, and unjust enrichment by these defendants.
The firstOn September 7, 2007, we reached agreements in principle to settle all pending securities class action and derivative suit was filed on August 9, 2004lawsuits in state courtconsideration of payments totaling $16.6 million in Midland, Texas. The plaintiff amended that suitexchange for full and complete releases for all defendants, of which Key will be required to assertpay approximately $1.1 million. Final approval of the settlement of the shareholder and class action claims against our former independent public accountants, KPMG LLP. We filed a motion to dismiss all claims in that action, which was granted by the court is anticipated to occur in the first quarter of 2008. We have recorded an appropriate liability for this matter.
Expired Option Holders. On September 24, 2007, Belinda Taylor, on March 29, 2005 for failure to make demand onbehalf of herself and all similarly situated residents of Texas, filed a lawsuit in the directors before filing suit. The plaintiff appealed that ruling. On May 18, 2006, the intermediate Court11th Judicial District of Appeals issued an opinion affirming the trial court's ruling
Harris County, Texas, alleging that the plaintiff had not pleaded sufficient factsCompany breached its contracts with current and former employees who held vested options that expired between April 28, 2004 and the date that the Company became current in its financial statements (the "Expired Option Holders"). The suit also alleges the Company breached its fiduciary duties and duties of good faith and fair dealing in the pricing of stock options it granted to excuse its failure to make demand, but reversing on procedural grounds. We filed a motion for rehearing, which was denied June 15, 2006, and we appealedthose Expired Option Holders, based upon the alleged overstatement of assets prior to the Texas Supreme Court. On June 8,Company's restatement. Ms. Taylor amended her lawsuit on September 25, 2007, to include all Expired Option Holders, regardless of residence. The Company has denied the Texas Supreme Court denied Key's Petition for Review (appeal). The case has been sent backallegations, and does not expect the resolution of this matter to the trial court for further proceedings.
Two other derivative suits were filed in federal court in El Paso, Texas on December 10, 2004. Those actions were transferred to federal court in Midland, Texas and consolidated by agreement of the parties. We filed a motion to dismiss or to stay that consolidated action. The individual defendants also filed a motion to dismiss. On July 10, 2006, the court entered an order dismissing those two derivative actions for failure to make a demand. After the dismissal, Plaintiff, Sandra Weissman made a putative demand on Key. On May 22, 2007, Ms. Weissman refiled her suit in Texas state court in Harris County, Texas. Key has not yet been formally served with the lawsuit.
In each of the matters described above, plaintiffs are seeking an unspecified amount of monetary damages. At this time, we cannot ascertain the ultimate aggregate amount of monetary liability or financial impact of the class actions and derivative lawsuits. While we have directors and officers insurance in the aggregate amount of $50 million, we cannot determine whether these actions, suits, claims, and proceedings will, individually or collectively, have a material adverse effectimpact on our business,its financial position, results of operations financial condition andor cash flows. We and named directors and officers intend to vigorously defend these actions, suits, claims and proceedings.
Tax Audits. We are routinely the subject of audits by tax authorities and have received some material assessments from tax auditors. As of December 31, 2006,2007, we have recorded reserves that management feels are appropriate for future potential liabilities as a result of these audits that management feels are appropriate.audits. While we believe we have fully reserved for these assessments, the ultimate amount of settlement can vary from this estimate. In connection with our former Egyptian operations, which terminated in 2005, we are undergoing income tax audits for all periods in which we had operations. Based on our work to date, we have determined that it is probable that additional income taxes will be owed and haveAs of December 31, 2006 the Company had recorded a liability of approximately $1.1 million relating to open Egyptian tax audits. In the fourth quarter of 2007, the Company reached a preliminary settlement with the Egyptian tax authorities on the 2003 and 2004 tax years, recording a tax benefit of $0.7 million and reducing the tax liability accrued at December 31, 2007 to approximately $0.4 million.
Self-Insurance Reserves. We maintain reserves for workers' compensation and vehicle liability on our balance sheet based on our judgment and estimates using an actuarial method based on claims
Key Energy Services, Inc. and Subsidiaries
NOTES TO CONSOLIDATED FINANCIAL STATEMENTS (Continued)
12. COMMITMENTS AND CONTINGENCIES (Continued)
incurred. We estimate general liability claims on a case-by-case basis. We maintain insurance policies for workers' compensation, vehicle liability and general liability claims. These insurance policies carry self-insured retention limits or deductibles on a per occurrence basis. The retention limits or deductibles are accounted for in our accrual process for all workers' compensation, vehicular liability and general liability claims. We maintain reserves for workers' compensation and vehicle liability on our balance sheet based on our judgment and estimates using an actuarial method based on claims incurred. We estimate general liability claims on a case-by-case basis. As of December 31, 2006, 20052007 and 2004,December 31, 2006, we have recorded $69.0 million $64.6 million and $58.5$69.0 million, respectively, of self-insurance reserves related to worker'sworkers' compensation, vehicular liabilities and general liability claims. Partially offsetting these liabilities, we had approximately $8.1 million and $5.7 million of insurance receivables as of December 31, 2007 and 2006, respectively.
Environmental Remediation Liabilities. For environmental reserve matters, including remediation efforts for current locations and those relating to previously-disposed properties, we record liabilities when our remediation efforts are probable and the costs to conduct such remediation efforts are reasonably estimated. See Note 1—"Organization and Summary of Significant Accounting Policies—Environmental" for further discussion of accounting for our environmental reserves, compliance with applicable federal and state environmental laws, and how our operations may affect the environment and may require remediation. Environmental reserves do not reflect management's assessment of the insurance coverage that may apply to these matters at issue, if such coverage is available, whereas our litigation reserves do reflect the application of our insurance coverage. AtAs of December 31, 2007 and December 31, 2006, 2005 and 2004, we have recorded $4.6 million, $5.3$3.1 million and $5.5$4.6 million, respectively, for our environmental remediation liabilities.
Guarantees. We provide performance bonds to provide financial surety assurances for the remediation and maintenance of our SWD properties to comply with environmental protection standards. Costs for SWD properties may be mandatory (to comply with applicable laws and
regulations), in the future (required to divest or cease operations), or for optimization (to improve operations, but not for safety or regulatory compliance).
Employment Agreements. To retain qualified senior management, we enter into employment agreements with our executive officers. These employment agreements run for periods ranging from one to three years, but can be automatically extended on a yearly basis unless terminated by us or the executive officer according to the terms of the employment agreement. In addition to providing a base salary for each executive officer, the employment agreements provide for severance payments for each executive officer equal to one to three years of the executive officer's base salary depending on the terms of the specific agreement. At December 31, 2006, the annual base salaries for the executive officers covered under such employment agreements totaled $2.9 million.
Argentina Payroll Matters. Our Argentinean subsidiary, Key Energy Services S.A., had previously underpaid our social security contributions to the Administración Federal de Ingressos Públicos ("AFIP") as a result of applying an incorrect rate in the calculation of our obligation.obligations. Additionally, we also underpaid AFIP as a result of our incorrect use of food stamp equivalents provided to employees as compensation. The correct amounts have been reflected in these financial statements. On May 31, 2007 we paid AFIP $3.5 million, representing the cumulative amount of underpayment and interest. As a result of our underpayment, AFIP has imposed fines and penalties against us and has begun an audit of our filings made to them in prior years. We have recorded a fair estimate of ouran appropriate liability for this matter and do not expect the ultimate resolution of this matter to have a material impact to our financial position, results of operations or cash flows or financial position.flows.
Operating Lease Arrangements. Key leases certain property and equipment under non-cancelable operating leases that generally expire at various dates through calendar 2020. The term of the operating leases generally run from 12 to 180 months with varying payment dates throughout each month.13. FOREIGN CURRENCY TRANSLATION
As of December 31, 2006,The local currency is the future minimum lease payments under non-cancelable operating leases are as follows (in thousands):
As of December 31, 2006
| | Lease
Payments
|
|---|
| 2007 | | $ | 8,854 |
| 2008 | | | 7,114 |
| 2009 | | | 4,801 |
| 2010 | | | 3,244 |
| 2011 | | | 1,986 |
| Thereafter | | | 5,630 |
| | |
|
| | | $ | 31,629 |
| | |
|
Operating lease expense was $17.0 million, $19.5 million and $21.8 million for the years ended December 31, 2006, 2005 and 2004, respectively.
Well Service Rig Purchase Contract. In October 2005, we entered into a purchase and sale agreement to acquire 30 well service rigs, with the option to acquire more under the terms of the agreement. Through December 31, 2006 we have ordered five additional rigs under this option and have received delivery of 21 rigs. The purchase and sale agreement is cancelable at our option at any time. Should we cancel the agreement prior to taking delivery of the 30 well service rigs, we may be required to refund to the seller the amount of the contractual discount provided by the seller on the previously delivered well service rigs.
Equipment Purchases. In the course of purchasing equipmentfunctional currency for our business lines, weoperations in Argentina, Mexico and Canada. The cumulative translation gains and losses resulting from translating each foreign subsidiary's financial statements from the functional currency to U.S. dollars are included in some instances requiredother comprehensive income and accumulated in stockholders' equity until a partial or complete sale or liquidation of our net investment in the foreign entity. The table below summarizes the conversion ratios used to provide deposits or payments whentranslate the equipment is ordered. In some
instances, these payments are non-refundable should we cancel our orders. At December 31, 2006, we had outstanding approximately $11.3 million in prepayments for equipment orders.
New Lease Agreements. In the third quarter of 2006, we entered into a lease agreement for a rental property in the state of Colorado for use in our fishingKey Energy Services, Inc. and rental operations. This lease agreement commenced on May 31, 2007 and runs for a period of seven years and contains standard default terms and insurance coverage requirements. The rental payments under the lease agreement total $2.8 million over the term of the lease.Subsidiaries
Sand Purchases. In June 2006, we entered into an agreement to purchase sand for use in our fracturing operations at a fixed price from a supplier. The agreement will commence upon the completion of the supplier's facility for a term of three years, subject to renewal options at mutually agreed upon prices. We are required to purchase an annual minimum quantity of sand from this supplier under the terms of this agreement, and in the event we do not, we are required to make payments to the supplier for amounts not taken, up to the contractual minimum and subject to the terms of the agreement. We do not believe that non-performance on our part would have a material impact on our financial position, cash flows or results of operations.NOTES TO CONSOLIDATED FINANCIAL STATEMENTS (Continued)
13. FOREIGN CURRENCY TRANSLATION (Continued)
financial statements and the cumulative currency translation gains and losses, net of tax, for each of our foreign subsidiaries:
| | Argentina
| | Mexico
| | Canada(1)
| | Total
| |
|---|
| | (in thousands, except for conversion ratios)
| |
|---|
| As of December 31, 2007: | | | | | | | | | | | |
Conversion ratio |
|
|
3.15 : 1 |
|
10.92 : 1 |
|
0.98 : 1 |
|
|
n/a |
|
| Cumulative translation adjustment | | $ | (38,181 | ) | $(143 | ) | $365 | | $ | (37,959 | ) |
As of December 31, 2006: |
|
|
|
|
|
|
|
|
|
|
|
Conversion ratio |
|
|
3.1 : 1 |
|
n/a |
|
1.17 : 1 |
|
|
n/a |
|
| Cumulative translation adjustment | | $ | (36,896 | ) | $— | | $218 | | $ | (36,678 | ) |
- (1)
- Foreign currency translation gains for Canada include translation gains related to the acquisition of AMI and the Company's equity-method investment in IROC Systems Corp.
14. EMPLOYEE BENEFIT PLANS
We maintain a 401(k) plan as part of our employee benefits package. We match 100% of employee contributions up to 4% of the employee's salary into our 401(k) plan, subject to a maximummaximums of $9,000, $8,800 $8,400 and $8,200 per participant$8,400 for the years ended December 31, 2007, 2006 2005 and 2004,2005, respectively. Our matching contributions were $7.4$10.2 million, $5.8$7.4 million and $5.8 million for the years ended December 31, 2007, 2006 2005 and 2004,2005, respectively.
Effective January 1, 2006, we no longer offered participants the option to purchase units of company stock through a 401(k) plan fund. We discontinued this option for participants and transferred all units of Key stock into another 401(k) plan fund, which did not affect the ability of plan participants to manage these contributions.
14.15. STOCKHOLDERS' EQUITY
Common Stock
On December 31, 2007, we had 200,000,000 shares of common stock authorized with a $0.10 par value; 131,142,905 of these shares of common stock were issued and outstanding, and no dividends had been issued. On December 31, 2006, we had 200,000,000 shares of common stock authorized with a $0.10 par value; 131,624,038 of these shares of common stock were issued and outstanding, net of 497,501 shares held in treasury, and no dividends had been issued. On December 31, 2005, we had 200,000,000 shares of common stock authorized with a $0.10 par value; 131,334,196 of these shares of common stock were issued and outstanding, net of 416,666 shares held in treasury, and no dividends were issued. On December 31, 2004, we had 200,000,000 shares of common stock authorized with a $0.10 par value; 130,791,338 of these shares were issued and outstanding, net of 416,666 shares held in treasury, and no dividends had been issued. Under the terms of ourthe Notes and 2007 Senior Secured Credit Facility, we must meet certain financial covenants before we may pay dividends. We currently do not intend to pay dividends.
Share Repurchase Program. On October 26, 2007, the Company's Board of Directors authorized a share repurchase program, in which the Company may spend up to $300.0 million to repurchase shares of its common stock on the open market. The program expires at the end of the first quarter of 2009. In 2007, the Company repurchased an aggregate of 2,341,400 shares at a total cost of approximately $32.2 million, which represents the fair market value of the shares based on the price of the Company's stock on the dates of purchase.
Treasury Stock
Key Energy Services, Inc. and Subsidiaries
NOTES TO CONSOLIDATED FINANCIAL STATEMENTS (Continued)
15. STOCKHOLDERS' EQUITY (Continued)
Tax Withholding. In June 2006, the Company purchased 80,835began purchasing shares of restricted common stock that had been previously granted to certain of the Company's executive officers, pursuant to an agreement under which those individuals were permitted to sell shares back to the Company in order to satisfy the minimum income tax withholding requirements related to vesting of these grants. We accountrepurchased a total of 72,847 and 80,835 shares for treasury stock under thean aggregate cost method,of $1.3 million and as such recorded $1.2 million in treasury stock on the date of purchase,during 2007 and 2006, respectively, which represented the fair market value of the shares based on the price of the Company's stock on the datedates of purchase.
Through December 31, 2007, under the share repurchase program, tax withholdings and share acquisitions in prior years, we have repurchased approximately 2.9 million shares of our common stock, at an aggregate cost of $44.3 million.
Common Stock Warrants
At December 31, 2006, we had 86,500 Warrants outstanding that were issued inIn January 1999, in connection with our 14% Senior Subordinated Notes, which we recorded as equity. As of December 31, 2006, theissued 150,000 Warrants that were exercisable for 1,253,350an aggregate of approximately 2.2 million shares of the Company's common stock at an exercise price of $4.88125 per underlying share. The Warrants were recorded at their fair value on the date of issuance as a component of stockholders' equity. During the fourth quarter of 2007, 2,500 Warrants were exercised for 23,226 shares of our common stock. These exercises were made under the "cashless" exercise provisions of the Warrants. At December 31, 2007, 85,000 warrants remained outstanding and were exercisable for approximately 1.2 million shares of our common stock. The Warrants expire on January 15, 2009.
Under the terms of the Warrants, we are required to maintain an effective registration statement covering the shares of common stock issuable upon exercise. If we are unable to maintain an effective registration statement, we are required to pay liquidated damages for periods in which an effective registration statement is not maintained. We have beenwere unable to maintain ouran effective registration statement due to our failurepast inability to timely file our required periodic financial reports with the SEC.SEC and we have not filed a new registration statement. As a result, we have paid liquidated damages starting at $0.05 per Warrant per weekof $0.9 million, $0.9 million and escalating to $0.20 per Warrant per week. The total amounts paid to the holders of the Warrants were $899,600, $730,925 and $69,200$0.7 million for the years ended December 31, 2007, 2006 2005 and 2004,2005, respectively.
Stock Incentive Plans
16. EQUITY-BASED COMPENSATION
1997 Incentive Plan. On January 13, 1998, Key's shareholders approved the Key Energy Group, Inc. 1997 Incentive Plan, as amended (the "1997 Incentive Plan"). The 1997 Incentive Plan is an amendment and restatement of the plans formerly known as the Key Energy Group, Inc. 1995 Stock Option Plan and the Key Energy Group, Inc. 1995 Outside Directors Stock Option Plan (collectively, the "Prior Plans").
All options previously granted under the Prior Plans and outstanding as ofPlan. On November 17, 1997 (the date on which our board of directors adopted2007, the 1997 Incentive Plan) were assumed and continued, without modification, under the 1997 Incentive Plan.Plan terminated pursuant to its terms.
Under the 1997 Incentive Plan, Key maywas allowed to grant the following awards to certain key employees, directors who are not employees ("Outside Directors") and consultants of Key, our controlled subsidiaries, and our parent corporation, if any: (i) incentive stock options ("ISOs") as defined in Section 422 of the Internal Revenue Code of 1986, as amended (the "Code"), (ii) "nonstatutory""nonstatutory" stock options ("NSOs"), (iii) stock appreciation rights ("SARs"), (iv) shares of restricted stock, (v) performance shares and performance units, (vi) other stock-based awards and (vii) supplemental tax bonuses (collectively, "Incentive Awards"). ISOs and NSOs are sometimes referred to collectively herein as "Options."
Key may grant Incentive Awards covering an aggregate of the greater of (i) 3.0 million shares of our common stock or (ii) 10% of the shares of our common stock issued and outstanding on the last day of each calendar quarter, provided, however, that a decrease in the number of issued and outstanding shares of our common stock from the previous calendar quarter shall not result in a decrease in the number of shares available for issuance under the 1997 Incentive Plan. As of December 31, 2006, the number of shares of our common stock that may be covered by Incentive Awards was approximately 13.2 million shares.
Any Incentive Awards that are issued under the 1997 Incentive Plan that expire, terminate or are forfeited for any reason will remain available for issuance with respect to the granting of Incentive Awards during the term of the 1997 Incentive Plan, except as may otherwise be provided by applicable law. Shares of Key's common stock issued under the 1997 Incentive Plan may be either newly issued or treasury shares, including shares of Key's common stock that we receive in connection with the exercise of an Incentive Award.bonuses. The number and kind of securities that may bewere issued under the 1997 Incentive Plan and pursuant to then-outstanding Incentive Awardsincentive awards are subject to adjustments to prevent
Key Energy Services, Inc. and Subsidiaries
NOTES TO CONSOLIDATED FINANCIAL STATEMENTS (Continued)
16. EQUITY-BASED COMPENSATION (Continued)
enlargement or dilution of rights resulting from stock dividends, stock splits, recapitalizations, reorganization or similar transactions.
The maximum number of shares of Key's common stock subject to Incentive Awards that may be granted or that may vest, as applicable, to any one Covered Employee (defined below) during any
calendar year shall be 500,000 shares, subject to adjustment under the provisions of the 1997 Incentive Plan.
The maximum aggregate cash payout subject to Incentive Awards (including SARs, performance units and performance shares payable in cash, or other stock-based awards payable in cash) that may be granted to any one Covered Employee during any fiscal year is $2.5 million. For purposes of the 1997 Incentive Plan, "Covered Employees" means a named executive officer who is one of the group of covered employees defined in Section 162(m) of the Code and the regulations promulgated thereunder (i.e., generally the chief executive officer and the other four most highly compensated executive officers for a given year).
The 1997 Incentive Plan is administered by the Compensation Committee appointed by the Board of Directors (the "Committee") and consisting of not less than two directors, each of whom is (i) an "outside director" under Section 162(m) of the Code and (ii) a "non-employee director" under Rule 16b-3 of the Securities Exchange Act of 1934. In addition, subject to applicable shareholder approval requirements, we may issue NSOs outside the 1997 Incentive Plan. During the period 2000-2001, the Board of Directors granted 3.7 million stock options that were outside the 1997 Incentive Plan. The 3.7 million non-plan options are in addition to and do not include other options which were granted under the Plan, but not in conformity with certain of the terms of the Plan.
The exercise price of options granted under the 1997 Incentive Plan is to be at or above the fair market value per share on the date the options are granted. Under the 1997 Incentive Plan, while the shares of common sharesstock are listed on a securities exchange, fair market value iswas determined using the closing sales price on the immediate preceding business day as reported on such securities exchange.
WhereWhen the shares arewere not listed on an exchange, (as they have not been sincewhich includes the period from April 2005),2005 through October 2007, the fair market value has beenwas determined by using the published closing price of the common stock on the Pink Sheets on the business day immediately preceding the date of grant. In 2006, we determined that the Company incorrectly determined the measurement date for certain grants of options prior to 2004, and, therefore, the exercise price of such options was not at or above the fair market value on the measurement date.
The exercise of NSOs results in a U.S. tax deduction to us equal to the difference between the exercise price and the market price at the exercise date.
During the period 2000-2001, the Board of Directors granted 3.7 million stock options that were outside the 1997 Incentive Plan, of which 180,000 remained outstanding as of December 31, 2007. The 3.7 million non-plan options were in addition to and do not include other options which were granted under the 1997 Incentive Plan, but not in conformity with certain of the terms of the 1997 Incentive Plan.
2007 Incentive Plan. On December 6, 2007, the Company's shareholders approved its 2007 Equity and Cash Incentive Plan (the "2007 Incentive Plan"). The 2007 Incentive Plan will be administered by the Board or a committee designated by the Board (the "Committee"). While the Company is a publicly traded company, the Committee may consist solely of two or more members of the Board who qualify as "outside directors" within the meaning of Section 162(m) of the Internal Revenue Code of 1986, as amended (the "Code"), and as "non-employee directors" under Rule 16b-3 as promulgated under Section 16 of the Securities Exchange Act of 1934. The Board or the Committee (the "Administrator") will have the power and authority to select Participants (as defined below) in the 2007 Incentive Plan and to grant Awards (as defined below) to such Participants pursuant to the terms of the 2007 Incentive Plan.
Subject to adjustment, the total number of shares of the Company's common stock, par value $0.10 per share, that will be available for the grant of Awards under the 2007 Incentive Plan may not exceed 4,000,000 shares; however, for purposes of this limitation, any stock subject to an Award that is canceled, forfeited or expires prior to exercise or realization will again become available for issuance under the 2007 Incentive Plan. Subject to adjustment, no Participant will be granted, during any one year period, options to purchase common stock and/or stock appreciation rights with respect to more than 500,000 shares of common stock. Stock available for distribution under the 2007 Incentive Plan will come from authorized and unissued shares or shares reacquired by the Company in any manner.
Awards may be in the form of options (incentive stock options and nonstatutory stock options), restricted stock, restricted stock units, performance compensation awards and stock appreciation rights (collectively, "Awards"). Awards may be granted to employees, directors and, in some cases, consultants and those individuals whom the Administrator determines are reasonably expected to become employees, directors or consultants following the grant date of the Award ("Participants"). However, incentive stock options may be granted only to employees.
Key Energy Services, Inc. and Subsidiaries
NOTES TO CONSOLIDATED FINANCIAL STATEMENTS (Continued)
16. EQUITY-BASED COMPENSATION (Continued)
The 2007 Incentive Plan provides that in the event of certain corporate events or changes in the Company's common stock, Awards and the maximum number of shares subject to all Awards under the 2007 Incentive Plan and the maximum number of shares that can be awarded to any one person will be adjusted to reflect such event. Any such adjustment made to an incentive stock option will be made in accordance with Section 424(a) of the Code and any such adjustment made to a nonstatutory option will be made so as not to violate Section 409A of the Code.
In the event of a Change in Control (as defined in the 2007 Incentive Plan), unless otherwise provided in an Award agreement, all options and stock appreciation rights will become immediately exercisable with respect to 100% of the shares subject to such option or stock appreciation rights, and the restrictions will expire immediately with respect to 100% of shares of restricted stock or restricted stock units subject to such Award (including a waiver of any applicable performance goals). In addition, unless otherwise provided in an Award agreement, all incomplete performance periods in respect of a performance compensation award will end upon the Change in Control, and the Administrator will (a) determine the extent to which performance goals with respect to each such performance period have been met, (b) cause to be paid to the applicable participant partial or full performance compensation awards with respect to performance goals for each such performance period based upon the Administrator's determination of the degree of attainment of performance goals and (c) cause the Award, if previously deferred, to be settled in full as soon as possible. Further, in the event of a Change in Control, the Administrator may in its discretion and upon advance notice to the affected persons, cancel any outstanding Awards and pay to the holders thereof, in cash or stock, or any combination thereof, the value of such Awards based upon the price per share of the Company's common stock received or to be received by other shareholders of the Company in the event.
Upon exercise, payment or delivery pursuant to an Award, the participant will be required to certify that the participant has not engaged in any Detrimental Activity (as defined in the 2007 Incentive Plan). Subject to the terms of the applicable Award agreement, the Administrator may cancel, rescind, suspend, withhold or otherwise limit or restrict any unexpired, unpaid or deferred Awards at any time if the participant engages in any Detrimental Activity. If a participant engages in Detrimental Activity after any exercise, payment or delivery pursuant to an Award, during any period for which any restrictive covenant prohibiting such activity is applicable to the participant, such exercise, payment or delivery may be rescinded within one year thereafter. In the event of any such rescission, the participant will pay to the Company the amount of any gain realized or payment received as a result of the exercise, payment or delivery, in such manner and on such terms and conditions as may be required by the Company.
The Board at any time, and from time to time, may amend or terminate the 2007 Incentive Plan. However, except as provided otherwise in the 2007 Incentive Plan, no amendment will be effective unless approved by the stockholders of the Company to the extent stockholder approval is necessary to satisfy any applicable law or securities exchange listing requirements. As of December 31, 2007, no Awards had been granted under the 2007 Incentive Plan.
Key Energy Services, Inc. and Subsidiaries
NOTES TO CONSOLIDATED FINANCIAL STATEMENTS (Continued)
16. EQUITY-BASED COMPENSATION (Continued)
Stock Option Awards
Stock option awards granted under the 1997 Incentive Plan have a maximum contractual term of ten years from the date of grant. Shares issuable upon exercise of a stock option are issued from authorized, but unissued shares of the Company's common stock. The following table summarizes the stock option activity related to the 1997 Incentive Plan and the 3.7 million options granted outside the 1997 Incentive Plan, of which 640,000180,000 were outstanding as of December 31, 2006, 2005 and 20042007 (shares in thousands):
| | Year Ended
December 31, 2006
| | Year Ended
December 31, 2005
| | Year Ended
December 31, 2004
| | Year Ended December 31, 2007
|
|---|
| | Options
| | Weighted
Average
Exercise
Price
| | Weighted
Average
Fair
Value
| | Options
| | Weighted
Average
Exercise
Price
| | Weighted
Average
Fair
Value
| | Options
| | Weighted
Average
Exercise
Price
| | Weighted
Average
Fair
Value
| | Options
| | Weighted Average
Exercise Price
| | Weighted Average
Fair Value
|
|---|
| Outstanding at beginning of period | | 9,275 | | $ | 8.68 | | $ | 4.79 | | 10,408 | | $ | 8.47 | | $ | 4.77 | | 10,642 | | $ | 8.34 | | $ | 4.65 | | 5,829 | | $ | 9.46 | | $ | 4.94 |
| Granted | | 833 | | $ | 15.03 | | $ | 7.21 | | 385 | | $ | 12.20 | | $ | 6.09 | | 424 | | $ | 10.24 | | $ | 7.10 | | 1,195 | | $ | 14.41 | | $ | 5.98 |
Exercised(2) | | — | | $ | — | | $ | — | | — | | $ | — | | $ | — | | (229 | ) | $ | 6.90 | | $ | 4.08 | | (1,592 | ) | $ | 8.45 | | $ | 4.58 |
| Cancelled or Expired(1) | | (4,279 | ) | $ | 8.86 | | $ | 5.06 | | (1,518 | ) | $ | 8.16 | | $ | 4.97 | | (429 | ) | $ | 7.68 | | $ | 4.38 | |
| Cancelled or expired | | | (838 | ) | $ | 10.36 | | $ | 5.03 |
| | |
| | | | | | | |
| | | | | | | |
| | | | | | | |
| | | | |
| Outstanding at end of period | | 5,829 | | $ | 9.46 | | $ | 4.94 | | 9,275 | | $ | 8.68 | | $ | 4.79 | | 10,408 | | $ | 8.47 | | $ | 4.77 | | 4,594 | | $ | 11.01 | | $ | 5.32 |
| | |
| | | | | | | |
| | | | | | | |
| | | | | | | |
| | | | |
| Exercisable at end of period | | 4,791 | | $ | 8.42 | | $ | 4.51 | | 8,628 | | $ | 8.49 | | $ | 4.75 | | 9,301 | | $ | 8.28 | | $ | 4.72 |
|
2,615 |
|
$ |
8.34 |
|
$ |
4.47 |
| | Year Ended December 31, 2006
|
|---|
| | Options
| | Weighted Average
Exercise Price
| | Weighted Average
Fair Value
|
|---|
| Outstanding at beginning of period | | 9,275 | | $ | 8.68 | | $ | 4.79 |
| Granted | | 833 | | $ | 15.03 | | $ | 7.21 |
| Exercised | | — | | $ | — | | $ | — |
| Cancelled or expired(1) | | (4,279 | ) | $ | 8.86 | | $ | 5.06 |
| | |
| | | | | | |
| Outstanding at end of period | | 5,829 | | $ | 9.46 | | $ | 4.94 |
| | |
| | | | | | |
Exercisable at end of period |
|
4,791 |
|
$ |
8.42 |
|
$ |
4.51 |
| | Year Ended December 31, 2005
|
|---|
| | Options
| | Weighted Average
Exercise Price
| | Weighted Average
Fair Value
|
|---|
| Outstanding at beginning of period | | 10,408 | | $ | 8.47 | | $ | 4.77 |
| Granted | | 385 | | $ | 12.20 | | $ | 6.09 |
| Exercised | | — | | $ | — | | $ | — |
| Cancelled or expired | | (1,518 | ) | $ | 8.16 | | $ | 4.97 |
| | |
| | | | | | |
| Outstanding at end of period | | 9,275 | | $ | 8.68 | | $ | 4.79 |
| | |
| | | | | | |
Exercisable at end of period |
|
8,628 |
|
$ |
8.49 |
|
$ |
4.75 |
- (1)
- Cancelled/expired options in 2006 include approximately 3.9 million options previously held by our former
Chief Executive Officer,chief executive officer, which were cancelled in connection with his termination.
(2)The 229,030 options exercised during 2004 had an aggregate intrinsic value of approximately $1.6 million.
Key Energy Services, Inc. and Subsidiaries
NOTES TO CONSOLIDATED FINANCIAL STATEMENTS (Continued)
16. EQUITY-BASED COMPENSATION (Continued)
The following table summarizes information about the stock options outstanding at December 31, 20062007 (shares in thousands):
| | Options Outstanding
| | Options Exercisable
|
|---|
| | Weighted
Average
Remaining
Contractual
Life (Years)
| | Number of
Options
Outstanding
December 31,
2006
| | Weighted
Average
Exercise
Price
| | Weighted
Average
Fair
Value
| | Number of
Options
Exercisable
December 31,
2006
| | Weighted
Average
Exercise
Price
| | Weighted
Average
Fair
Value
|
|---|
| Range of Exercise Prices: | | | | | | | | | | | | | | | | | | | | |
| $3.00 - $7.44 | | 2.63 | | | 971 | | $ | 4.87 | | $ | 3.44 | | | 971 | | $ | 4.87 | | $ | 3.44 |
| $7.45 - $8.43 | | 4.74 | | | 1,262 | | $ | 8.16 | | $ | 4.46 | | | 1,262 | | $ | 8.16 | | $ | 4.46 |
| $8.44 - $9.75 | | 3.78 | | | 1,175 | | $ | 8.63 | | $ | 5.44 | | | 1,150 | | $ | 8.64 | | $ | 5.44 |
| $9.76 - $11.75 | | 6.66 | | | 1,049 | | $ | 10.29 | | $ | 4.21 | | | 1,033 | | $ | 10.27 | | $ | 4.19 |
| $11.76 - $16.25 | | 7.70 | | | 1,372 | | $ | 13.97 | | $ | 6.57 | | | 375 | | $ | 12.74 | | $ | 5.49 |
| | | | |
| | | | | | | |
| | | | | | |
| | | | | | 5,829 | | $ | 9.46 | | $ | 4.94 | | | 4,791 | | $ | 8.42 | | $ | 4.51 |
| | | | |
| | | | | | | |
| | | | | | |
| Aggregate intrinsic value (in thousands) | | | | $ | 5,330 | | | | | | | | $ | 5,330 | | | | | | |
| | Options Outstanding
|
|---|
| | Weighted Average
Remaining
Contractual Life
(Years)
| | Number of
Options
Outstanding
| | Weighted Average
Exercise Price
| | Weighted Average
Fair Value
|
|---|
| Range of Exercise Prices: | | | | | | | | | | | |
| $ 3.00 - $ 7.44 | | 1.46 | | | 749 | | $ | 4.80 | | $ | 3.42 |
| $ 7.45 - $ 9.37 | | 3.45 | | | 980 | | $ | 8.34 | | $ | 4.82 |
| $ 9.38 - $13.10 | | 6.40 | | | 933 | | $ | 11.27 | | $ | 4.98 |
| $13.11 - $14.70 | | 9.56 | | | 1,196 | | $ | 14.31 | | $ | 5.98 |
| $14.71 - $18.90 | | 8.26 | | | 736 | | $ | 15.20 | | $ | 7.26 |
| | | | |
| | | | | | |
| | | | | | 4,594 | | $ | 11.01 | | $ | 5.32 |
| | | | |
| | | | | | |
Aggregate intrinsic value (in thousands) |
|
|
|
$ |
16,153 |
|
|
|
|
|
|
| | Options Exercisable
| |
|
|---|
| | Number of
Options
Outstanding
| | Weighted Average
Exercise Price
| | Weighted Average
Fair Value
|
|---|
| Range of Exercise Prices: | | | | | | | | | |
| $ 3.00 - $ 7.44 | | | 749 | | $ | 4.80 | | $ | 3.42 |
| $ 7.45 - $ 9.37 | | | 958 | | $ | 8.35 | | $ | 4.84 |
| $ 9.38 - $13.10 | | | 882 | | $ | 9.49 | | $ | 4.88 |
| $13.11 - $14.51 | | | 26 | | $ | 14.29 | | $ | 7.07 |
| | |
| | | | | | |
| | | | 2,615 | | $ | 8.34 | | $ | 4.47 |
| | |
| | | | | | |
Aggregate intrinsic value (in thousands) |
|
$ |
15,992 |
|
|
|
|
|
|
The total fair value of stock options granted during the years ended December 31, 2007, 2006 and 2005 and 2004 was $7.1 million, $6.0 million and $2.3 million, and $3.0respectively. For the year ended December 31, 2007, the Company recognized approximately $3.5 million respectively.in pre-tax expense related to stock options. For unvested stock option awards outstanding as of December 31, 2006,2007, we expect to recognize approximately $4.4$7.3 million of compensation expense over a weighted average remaining vesting period of approximately 1.80.58 years. The fair valueTax benefits of each$0.7 million were recognized for the year ended December 31, 2007 related to stock option grant was estimated on the date of grant using the Black-Scholes option-pricing model, based on the following weighted-average assumptions:options.
| | Year Ended
December 31,
2006
| | Year Ended
December 31,
2005
| | Year Ended
December 31,
2004
| |
|---|
| Risk-free interest rate | | 4.70 | % | 3.80 | % | 3.91 | % |
| Expected life of options, years | | 6 | | 6 | | 6 | |
| Expected volatility of the Company's stock price | | 48.80 | % | 53.85 | % | 62.55 | % |
| Expected dividends | | none | | none | | none | |
Common Stock Awards
In June 2005 we began granting shares of common stock to our outside directors and certain employees. These shares are restricted asCommon stock awards granted to exercisability and transferability, and in certain cases, have required service periodsour outside directors vest immediately, while those granted to our employees vest ratably over a three-year period and are subject to forfeiture before they are vested. The vesting periods on these grants range from zero (immediately vested) to three years.forfeiture. The total fair market value of all common stock grantsawards granted during the years ended December 31, 2007, 2006 and 2005 was $4.7 million, $5.9 million and $6.5 million, for the years ended December 31, 2006respectively.
Key Energy Services, Inc. and 2005, respectively. No common stock awards were granted prior to June 2005.Subsidiaries
NOTES TO CONSOLIDATED FINANCIAL STATEMENTS (Continued)
16. EQUITY-BASED COMPENSATION (Continued)
In June 2006, pursuantPursuant to the agreement under which they wereare issued restrictedcommon stock certainawards, recipients of the Company's officers had a number of commonthose awards may have shares withheld in order to satisfy those individuals' income tax obligations associated with the vesting of the first trancheawards granted to them. Shares withheld for tax withholding purposes totaled 72,847 and 80,835 for the years ended December 31, 2007 and 2006, respectively, with aggregate repurchase values of shares that were conveyed to them$1.3 million and $1.2 million, respectively. In connection with a vesting in June 2005. In this transaction, the Company purchased 80,835 shares from the officers, which had a fair market value of approximately $1.2 million on the purchase date. We accounted for this as a treasury stock transaction. One2006, one of the officersrecipients was permitted to have an amount withheld that was in excess of the required minimum required withholding under current tax law. Under SFAS 123(R) and previously under variable plan accounting under APB 25,, we are required to account for this grant as a liability award. Compensation expense for this award during the years ended December 31, 2007, 2006 and 2005 was $0.1 million, $0.2 million and $0.1 million, respectively.
The following table summarizes information for the years ended December 31, 2007, 2006 and 2005 was $0.2 million and $0.1 million, respectively.
Weabout the common share awards that have been issued a total 550,000by the Company (shares in thousands):
| | Year Ended December 31, 2007
|
|---|
| | Outstanding
| | Weighted Average
Issuance Price
| | Vested
| | Weighted Average
Issuance Price
|
|---|
| Shares at beginning of year | | 833 | | $ | 13.69 | | 258 | | $ | 12.44 |
| Shares issued during year(1) | | 318 | | $ | 14.87 | | 54 | | $ | 17.48 |
| Previously issued shares vesting during year | | — | | $ | — | | 239 | | $ | 13.87 |
| Shares repurchased during year | | (73 | ) | $ | 14.05 | | (73 | ) | $ | 14.05 |
| | |
| | | | |
| | | |
| Shares at end of year | | 1,078 | | $ | 14.01 | | 478 | | $ | 13.48 |
| | |
| | | | |
| | | |
| | Year Ended December 31, 2006
|
|---|
| | Outstanding
| | Weighted Average
Issuance Price
| | Vested
| | Weighted Average
Issuance Price
|
|---|
| Shares at beginning of year | | 543 | | $ | 11.90 | | 43 | | $ | 11.90 |
| Shares issued during year(1) | | 371 | | $ | 15.92 | | 46 | | $ | 14.95 |
| Previously issued shares vesting during year | | — | | $ | — | | 250 | | $ | 11.90 |
| Shares repurchased during year | | (81 | ) | $ | 11.90 | | (81 | ) | $ | 11.90 |
| | |
| | | | |
| | | |
| Shares at end of year | | 833 | | $ | 13.69 | | 258 | | $ | 12.44 |
| | |
| | | | |
| | | |
| | Year Ended December 31, 2005
|
|---|
| | Outstanding
| | Weighted Average
Issuance Price
| | Vested
| | Weighted Average
Issuance Price
|
|---|
| Shares at beginning of year | | — | | $ | — | | — | | $ | — |
| Shares issued during year(1) | | 543 | | $ | 11.90 | | 43 | | $ | 11.90 |
| Previously issued shares vesting during year | | — | | $ | — | | — | | $ | — |
| Shares repurchased during year | | — | | $ | — | | — | | $ | — |
| | |
| | | | |
| | | |
| Shares at end of year | | 543 | | $ | 11.90 | | 43 | | $ | 11.90 |
| | |
| | | | |
| | | |
- (1)
- Shares of common
shares to our outside directors and employees during 2005 at a weighted-average issuance price of $11.90 per share. Of these, 50,000 werestock issued to our outsidenon-employee directors and vestedvest immediately while the remaining 500,000 vest ratably over a three year period. We issued a total of 370,677 common shares to our outside directors and employees during 2006 at a weighted-average issuance price of $15.92 per share. Of these, 45,677 shares were issued to our outside directors and vested immediately, while the remaining 325,000 shares vest ratably over a three year period. At December 31, 2005, 42,858 of these common shares were vested, at a weighted-average issuance price of $11.90 per share. At December 31, 2006, 338,534 of these common shares were vested, at a weighted average issuance price of $12.30 per share. During 2005, one of our outside directors refused his common stock award of 7,143 shares. That director was not issued a common stock award in 2006.upon issuance.
For common stock grants that vest immediately upon issuance, we record expense equal to the fair market value of the shares on the date of grant. For common stock grantsawards that do not immediately
Key Energy Services, Inc. and Subsidiaries
NOTES TO CONSOLIDATED FINANCIAL STATEMENTS (Continued)
16. EQUITY-BASED COMPENSATION (Continued)
vest, we recognize compensation costexpense ratably over the vesting period of the grant, net of actualestimated and estimatedactual forfeitures. For the years ended December 31, 2007, 2006 and 2005, we recognized $5.6 million, $3.6 million and $2.5 million, respectively, of pre-tax expense related toassociated with common stock awards, net of estimated and actual forfeitures. In connection with the expense related to common stock awards recognized during the year ended December 31, 2007, we recognized tax benefits of approximately $1.2 million. For the unvested common stock awards outstanding as of December 31, 2006, we expect to2007, the Company anticipates that it will recognize approximately $6.3$5.2 million of compensationpre-tax expense over a weighted average remaining vesting period of approximately 1.6the next 0.65 years.
Phantom Share Plan
OnIn December 22, 2006, the Companywe announced the implementation of a "Phantom Share Plan," in which certain of the Company'sour employees were granted a total of 460,500 "Phantom Shares." The Phantom Shares vest ratably over a four-year period and convey the right to the grantee to receive a cash payment on the anniversary date of the grant equal to the fair market value of the Phantom Shares vesting on that date. Grantees are not permitted to defer this payment to a later date. The Phantom Shares qualify asare a "liability" type award under SFAS 123(R), and as such, we account for these awards at fair value. We recognize compensation expense related to the Phantom Shares based on the change in the fair value of the awards during the period and the percentage of the service requirement that has been performed, net of estimated and actual forfeitures, with an offsetting liability recorded on our Consolidated Balance Sheets.consolidated balance sheets. During 2007, we recognized approximately $3.3 million of pre-tax compensation expense associated with the Phantom Shares. As of December 31, 2007, we recorded current and non-current liabilities of $2.4 million and $0.9 million, respectively, which represented the aggregate fair value of the Phantom Shares on that date. As of December 31, 2006, the amount of compensation expense and liabilities recorded related to the Phantom Share Plan in our consolidated financial statements were not material.
We recognized income tax benefits associated with the Phantom Shares of $1.3 million in 2007. For unvested Phantom Share awards outstanding as of December 31, 2006,2007, we expect to recognize approximately $7.2$3.4 million of compensation expense over a weighted average remaining vesting period of approximately 2.51.5 years. The first payout under the Phantom Share Plan was made in January 2008, at which time we paid approximately $1.6 million in cash to the holders of Phantom Shares that vested in December 2007.
Stock Appreciation Rights
In August 2007, the Company issued approximately 587,000 stock appreciation rights ("SARs") to its executive officers. Each SAR has a ten-year term from the date of grant and vests in equal annual installments on the first, second and third anniversaries of the date of grant. Upon the exercise of a SAR, the recipient will receive an amount equal to the difference between the exercise price and the fair market value of a share of the Company's common stock on the date of exercise, multiplied by the number of shares of common stock for which the SAR was exercised. All payments will be made in shares of the Company's common stock. Prior to exercise, the SAR does not entitle the recipient to receive any shares of the Company's common stock and does not provide the recipient with any voting or other stockholders' rights. The Company accounts for these SARs as equity awards under SFAS 123(R) and recognizes compensation expense ratably over the vesting period of the SAR based on their fair value on the date of issuance, net of estimated and actual forfeitures.
Key Energy Services, Inc. and Subsidiaries
NOTES TO CONSOLIDATED FINANCIAL STATEMENTS (Continued)
16. EQUITY-BASED COMPENSATION (Continued)
Compensation expense recognized in 2007 in connection with the SARs was approximately $0.6 million. Income tax benefits of approximately $0.2 million were recognized by the Company in connection with this expense. For the unvested SARs outstanding as of December 31, 2007, the Company anticipates that it will recognize approximately $2.8 million of expense over the next 1.6 years.
15.Valuation Assumptions on Stock Options and Stock Appreciation Rights
The fair value of each stock option grant or SAR was estimated on the date of grant using the Black-Scholes option-pricing model, based on the following weighted-average assumptions:
| | Year Ended December 31,
| |
|---|
| | 2007
| | 2006
| | 2005
| |
|---|
| Risk-free interest rate | | 4.41 | % | 4.70 | % | 3.80 | % |
| Expected life of options, years | | 6 | | 6 | | 6 | |
| Expected volatility of the Company's stock price | | 39.49 | % | 48.80 | % | 53.85 | % |
| Expected dividends | | none | | none | | none | |
17. TRANSACTIONS WITH RELATED PARTIES
Employee Loans and Advances
From time to time and continuing in the comparative periods contained in this report, we have made certain retention loans and relocation loans to employees other than executive officers. The retention loans are forgiven over various time periods so long as the employee continues employment at the Company. The relocation loans are repaid upon the employee selling his prior residence. As of December 31, 2006,2007, these loans, in the aggregate, total approximately $287,000.$0.2 million. Of this amount, approximately $255,000 represents relocation loans made to employees of the Company and approximately $24,000less than $0.1 million were made to former officers of the Company, with the remainder being made to current employees of the Company.
Seller Financing Arrangement Associated with Moncla Acquisition
In connection with the acquisition of Moncla (see Note 2—"Acquisitions"), the Company entered into two promissory notes payable agreement with the seller, who, subsequent to the acquisition, became an officer of the Company. The first is an unsecured note in the amount of $12.5 million, which is due and payable in a lump-sum, together with accrued interest, on October 25, 2009. Interest on this note is payable on each anniversary of the closing of the acquisition of Moncla, which was October 25, 2007. The second unsecured note in the amount of $10.0 million is payable in annual installments of $2.0 million, plus accrued interest, beginning October 25, 2008 through 2012. Each of the notes bears interest at the Federal Funds rate adjusted annually on the anniversary date of the closing date.
The Federal Funds rate does not represent a rate that would have resulted if an independent borrower and an independent lender had negotiated a similar transaction under comparable terms and conditions and is not equal to our incremental borrowing rate. In accordance with APB 21 and SFAS 141, we recorded the promissory notes at fair value which resulted in a discount being recorded.
Key Energy Services, Inc. and Subsidiaries
NOTES TO CONSOLIDATED FINANCIAL STATEMENTS (Continued)
17. TRANSACTIONS WITH RELATED PARTIES (Continued)
The discount will be recognized as interest expense over the life of the promissory notes using the effective interest method.
16.Board of Director Relationship with Customer
In October 2007, we added a member to the Company's Board of Directors who is the Senior Vice President, General Counsel and Chief Administrative Officer of Anadarko Petroleum Corporation ("Anadarko"), which is one of our customers. Sales to Anadarko comprised less than 2% of our total revenues for the year ended December 31, 2007. Transactions with Anadarko for our services are made at market prices.
18. SEGMENT INFORMATION
For 2006,2007, our reportable operating business segments are well servicing, pressure pumping and fishing and rental. We evaluate the performance of our operating segments based on revenue and EBITDA, which is a non-GAAP measure and not disclosed below.
Well Servicing. These operations provide a full range of well services, including rig-based services, oilfield transportation services, cased-hole wireline services and other ancillary oilfield services necessary to complete, maintain and workover oil and natural gas producing wells. Our Argentina and Mexico operations are included in our well servicing segment. We aggregate our operating divisions engaged in well servicing activities into our well servicing reportable segment.
Pressure Pumping. These operations provide well stimulation and cementing services. Stimulation includes fracturing, nitrogen services and acidizing services and is used to enhance the production of oil and natural gas wells from formations which exhibit a restricted flow of oil and / or natural gas. Cementing services include pumping cement into a well between the casing and the wellbore.
Fishing and Rental. These operations provide services that include "fishing" to recover lost or stuck equipment in a wellbore through the use of "fishing tools." In addition, this segment offers a full line of services and rental equipment designed for use both on landonshore and offshore for drilling and workover services and includes an inventory consisting of tubulars, handling tools, pressure-control equipment and power swivels.
Corporate / Other. We evaluateapply the performanceprovisions of EITF 04-10 for our segment reporting. Under the provisions of EITF 04-10, operating segments that do not individually meet the aggregation criteria described in SFAS 131 may be combined with other operating segments that do not individually meet the aggregation criteria to form a separate reportable segment. We have combined all of our operating segments based on revenuethat do not individually meet the aggregation criteria established in SFAS 131 to form the "Corporate and EBITDA, which is a non-GAAP measure and not disclosed below.Other" segment for our segment reporting. Corporate expenses include general corporate expenses associated with managing all reportable operating segments. Corporate assets consist principally of cash and cash equivalents, short-term investments, deferred debt financing costs, investments in
Key Energy Services, Inc. and Subsidiaries
NOTES TO CONSOLIDATED FINANCIAL STATEMENTS (Continued)
18. SEGMENT INFORMATION (Continued)
subsidiaries, accounts and notes receivable from subsidiaries, the Company's investment in IROC Services Corp., and deferred income tax assets.
| | Well
Servicing
| | Pressure
Pumping
| | Fishing and
Rental
| | Corporate /
Other
| | Discontinued
Operations
| | Eliminations
| | Total
| |
|---|
| | (in thousands)
| |
|---|
| As of and for the year ended December 31, 2006: | | | | | | | | | | | | | | | | | | | | | | |
| Operating revenues | | $ | 1,201,228 | | $ | 247,489 | | $ | 97,460 | | $ | — | | $ | — | | $ | — | | $ | 1,546,177 | |
| Gross margin | | | 465,214 | | | 105,746 | | | 37,387 | | | — | | | — | | | — | | | 608,347 | |
| Depreciation and amortization | | | 95,673 | | | 12,416 | | | 6,787 | | | 11,135 | | | — | | | — | | | 126,011 | |
| Interest expense | | | (615 | ) | | (600 | ) | | (98 | ) | | 40,240 | | | — | | | — | | | 38,927 | |
| Net income (loss) from continuing operations | | | 311,339 | | | 88,070 | | | 22,860 | | | (251,236 | ) | | — | | | — | | | 171,033 | |
| Property, plant and equipment, net | | | 531,685 | | | 97,372 | | | 35,971 | | | 29,263 | | | — | | | — | | | 694,291 | |
| Total assets | | | 1,021,834 | | | 190,704 | | | 79,364 | | | 207,063 | | | 623 | | | 41,810 | | | 1,541,398 | |
| Capital expenditures, excluding acquisitions | | | (143,080 | ) | | (35,513 | ) | | (12,953 | ) | | (4,284 | ) | | — | | | — | | | (195,830 | ) |
| | Well
Servicing
| | Pressure
Pumping
| | Fishing and
Rental
| | Corporate /
Other
| | Discontinued
Operations
| | Eliminations
| | Total
| |
|---|
| | (in thousands)
| |
|---|
| As of and for the year ended December 31, 2005: | | | | | | | | | | | | | | | | | | | | | | |
| Operating revenues | | $ | 956,457 | | $ | 152,320 | | $ | 81,667 | | $ | — | | $ | — | | $ | — | | $ | 1,190,444 | |
| Gross margin | | | 321,015 | | | 59,997 | | | 27,306 | | | — | | | — | | | — | | | 408,318 | |
| Depreciation and amortization | | | 85,772 | | | 8,785 | | | 6,024 | | | 11,307 | | | — | | | — | | | 111,888 | |
| Interest expense | | | 86 | | | (328 | ) | | 35 | | | 50,506 | | | — | | | — | | | 50,299 | |
| Net income (loss) from continuing operations | | | 175,576 | | | 51,661 | | | 14,926 | | | (193,085 | ) | | — | | | — | | | 49,078 | |
| Property, plant and equipment, net | | | 479,972 | | | 71,688 | | | 27,214 | | | 31,467 | | | — | | | — | | | 610,341 | |
| Total assets | | | 919,887 | | | 151,683 | | | 67,082 | | | 450,709 | | | 658 | | | (260,775 | ) | | 1,329,244 | |
| Capital expenditures, excluding acquisitions | | | (79,410 | ) | | (27,258 | ) | | (4,070 | ) | | (7,408 | ) | | — | | | — | | | (118,146 | ) |
��
| | Well
Servicing
| | Pressure
Pumping
| | Fishing
and Rental
| | Corporate /
Other
| | Discontinued
Operations
| | Eliminations
| | Total
| |
|---|
| | (in thousands)
| |
|---|
| As of and for the year ended December 31, 2007: | | | | | | | | | | | | | | | | | | | | | | |
| Operating revenues | | $ | 1,264,797 | | $ | 299,348 | | $ | 97,867 | | $ | — | | $ | — | | $ | — | | $ | 1,662,012 | |
| Gross margin | | | 526,103 | | | 109,703 | | | 40,592 | | | — | | | — | | | — | | | 676,398 | |
| Depreciation and amortization | | | 90,274 | | | 16,854 | | | 8,742 | | | 13,753 | | | — | | | — | | | 129,623 | |
| Interest expense | | | (712 | ) | | (1,048 | ) | | (493 | ) | | 38,708 | | | — | | | (248 | ) | | 36,207 | |
| Net income (loss) | | | 360,617 | | | 83,785 | | | 22,028 | | | (297,141 | ) | | — | | | — | | | 169,289 | |
| Property and equipment, net | | | 693,804 | | | 133,903 | | | 48,703 | | | 34,798 | | | — | | | — | | | 911,208 | |
| Total assets | | | 1,500,913 | | | 247,018 | | | 89,802 | | | 402,513 | | | — | | | (381,169 | ) | | 1,859,077 | |
| Capital expenditures, excluding acquisitions | | | (135,336 | ) | | (51,115 | ) | | (19,811 | ) | | (6,298 | ) | | — | | | — | | | (212,560 | ) |
| | Well
Servicing
| | Pressure
Pumping
| | Fishing
and Rental
| | Corporate /
Other
| | Discontinued
Operations
| | Eliminations
| | Total
| |
|---|
| | (in thousands)
| |
|---|
| As of and for the year ended December 31, 2006: | | | | | | | | | | | | | | | | | | | | | | |
| Operating revenues | | $ | 1,201,228 | | $ | 247,489 | | $ | 97,460 | | $ | — | | $ | — | | $ | — | | $ | 1,546,177 | |
| Gross margin | | | 476,220 | | | 109,112 | | | 40,243 | | | — | | | — | | | — | | | 625,575 | |
| Depreciation and amortization | | | 95,673 | | | 12,416 | | | 6,787 | | | 11,135 | | | — | | | — | | | 126,011 | |
| Interest expense | | | (615 | ) | | (600 | ) | | (98 | ) | | 40,240 | | | — | | | — | | | 38,927 | |
| Net income (loss) | | | 311,339 | | | 88,070 | | | 22,860 | | | (251,236 | ) | | — | | | — | | | 171,033 | |
| Property and equipment, net | | | 531,685 | | | 97,372 | | | 35,971 | | | 29,263 | | | — | | | — | | | 694,291 | |
| Total assets | | | 1,022,898 | | | 190,704 | | | 79,364 | | | 206,622 | | | — | | | 41,810 | | | 1,541,398 | |
| Capital expenditures, excluding acquisitions | | | (143,080 | ) | | (35,513 | ) | | (12,953 | ) | | (4,284 | ) | | — | | | — | | | (195,830 | ) |
| | Well
Servicing
| | Pressure
Pumping
| | Fishing
and Rental
| | Corporate /
Other
| | Discontinued
Operations
| | Eliminations
| | Total
| |
|---|
| | (in thousands)
| |
|---|
| As of and for the year ended December 31, 2005: | | | | | | | | | | | | | | | | | | | | | | |
| Operating revenues | | $ | 956,457 | | $ | 152,320 | | $ | 81,667 | | $ | — | | $ | — | | $ | — | | $ | 1,190,444 | |
| Gross margin | | | 322,414 | | | 60,019 | | | 27,768 | | | — | | | — | | | — | | | 410,201 | |
| Depreciation and amortization | | | 85,772 | | | 8,785 | | | 6,024 | | | 11,307 | | | — | | | — | | | 111,888 | |
| Interest expense | | | 86 | | | (328 | ) | | 35 | | | 50,506 | | | — | | | — | | | 50,299 | |
| Net income (loss) | | | 175,576 | | | 51,661 | | | 14,926 | | | (193,085 | ) | | (3,361 | ) | | — | | | 45,717 | |
| Property and equipment, net | | | 479,972 | | | 71,688 | | | 27,214 | | | 31,467 | | | — | | | — | | | 610,341 | |
| Total assets | | | 919,887 | | | 151,683 | | | 67,082 | | | 450,709 | | | 658 | | | (260,775 | ) | | 1,329,244 | |
| Capital expenditures, excluding acquisitions | | | (79,410 | ) | | (27,258 | ) | | (4,070 | ) | | (7,408 | ) | | — | | | — | | | (118,146 | ) |
| | Well
Servicing
| | Pressure
Pumping
| | Fishing and
Rental
| | Corporate /
Other
| | Discontinued
Operations
| | Eliminations
| | Total
| |
|---|
| | (in thousands)
| |
|---|
| As of and for the year ended December 31, 2004: | | | | | | | | | | | | | | | | | | | | | | |
| Operating revenues | | $ | 818,001 | | $ | 91,226 | | $ | 78,512 | | $ | — | | $ | — | | $ | — | | $ | 987,739 | |
| Gross margin | | | 246,970 | | | 22,070 | | | 28,719 | | | — | | | — | | | — | | | 297,759 | |
| Depreciation and amortization | | | 84,137 | | | 6,279 | | | 5,540 | | | 7,383 | | | — | | | — | | | 103,339 | |
| Interest expense | | | 133 | | | (43 | ) | | 9 | | | 46,107 | | | — | | | — | | | 46,206 | |
| Net income (loss) from continuing operations | | | 96,829 | | | 12,475 | | | 18,625 | | | (154,512 | ) | | — | | | — | | | (26,583 | ) |
| Property, plant and equipment, net | | | 480,049 | | | 50,422 | | | 27,374 | | | 39,933 | | | — | | | — | | | 597,778 | |
| Total assets | | | 915,149 | | | 115,180 | | | 67,749 | | | 705,732 | | | 79,538 | | | (566,726 | ) | | 1,316,622 | |
| Capital expenditures, excluding acquisitions | | | (34,348 | ) | | (12,550 | ) | | (3,270 | ) | | (774 | ) | | — | | | — | | | (50,942 | ) |
Operating revenues for our foreign operations were $78.3 million, $68.2 million,Key Energy Services, Inc. and $59.0 million for the years ended December 31, 2006, 2005 and 2004, respectively. Gross margins for our foreign operations were $19.1 million, $17.3 million, and $18.0 million for the years ended December 31, 2006, 2005 and 2004, respectively.Subsidiaries
NOTES TO CONSOLIDATED FINANCIAL STATEMENTS (Continued)
18. SEGMENT INFORMATION (Continued)
We have $77.9 million, $58.8 million and $55.1 million of identifiable assetsThe following table presents information related to our foreign operations as(in thousands of December 31, 2006, 2005U.S. Dollars):
| | Argentina
| | Mexico
| | Canada
| | Total Foreign
|
|---|
| As of and for the year ended December 31, 2007: | | | | | | | | | | | | |
Operating revenues |
|
$ |
93,925 |
|
$ |
8,956 |
|
$ |
2,938 |
|
$ |
105,819 |
| Total assets | | | 82,550 | | | 12,870 | | | 8,876 | | | 104,296 |
As of and for the year ended December 31, 2006: |
|
|
|
|
|
|
|
|
|
|
|
|
Operating revenues |
|
$ |
78,321 |
|
$ |
— |
|
$ |
— |
|
$ |
78,321 |
| Total assets | | | 77,878 | | | — | | | — | | | 77,878 |
As of and for the year ended December 31, 2005: |
|
|
|
|
|
|
|
|
|
|
|
|
Operating revenues |
|
$ |
68,183 |
|
$ |
— |
|
$ |
— |
|
$ |
68,183 |
| Total assets | | | 58,816 | | | — | | | — | | | 58,816 |
Key Energy Services, Inc. and 2004, respectively. Capital expenditures for our foreign operations were $9.5 million, $7.0 million and $7.8 million for the years ended December 31, 2006, 2005 and 2004, respectively.Subsidiaries
17.NOTES TO CONSOLIDATED FINANCIAL STATEMENTS (Continued)
19. UNAUDITED SUPPLEMENTARY INFORMATION—QUARTERLY RESULTS OF OPERATIONS
Set forth below is unaudited summarized quarterly information for the periodstwo most recent years covered by these consolidated financial statements:statements (in thousands, except for per share data):
| | First Quarter
| | Second Quarter
| | Third Quarter
| | Fourth Quarter
| |
|---|
| | (in thousands, except per share data)
| |
|---|
| Year Ended December 31, 2006: | | | | | | | | | | | | | |
| | Revenues | | $ | 347,958 | | $ | 372,036 | | $ | 417,600 | | $ | 408,583 | |
| | Income from continuing operations before income taxes | | | 48,430 | | | 63,920 | | | 98,822 | | | 63,308 | |
| | Income from continuing operations | | | 30,063 | | | 39,582 | | | 60,885 | | | 40,503 | |
| | Discontinued operations, net of tax | | | — | | | — | | | — | | | — | |
| | Net income | | | 30,063 | | | 39,582 | | | 60,885 | | | 40,503 | |
| |
Earnings per Share(1): |
|
|
|
|
|
|
|
|
|
|
|
|
|
| | | Basic: | | | | | | | | | | | | | |
| | | | Income from continuing operations | | $ | 0.23 | | $ | 0.30 | | $ | 0.46 | | $ | 0.31 | |
| | | | Discontinued operations, net of tax | | $ | — | | $ | — | | $ | — | | $ | — | |
| | | | Net income | | $ | 0.23 | | $ | 0.30 | | $ | 0.46 | | $ | 0.31 | |
| | |
Diluted: |
|
|
|
|
|
|
|
|
|
|
|
|
|
| | | | Income from continuing operations | | $ | 0.22 | | $ | 0.29 | | $ | 0.45 | | $ | 0.31 | |
| | | | Discontinued operations, net of tax | | $ | — | | $ | — | | $ | — | | $ | — | |
| | | | Net income | | $ | 0.22 | | $ | 0.29 | | $ | 0.45 | | $ | 0.31 | |
| | | | | | | | | | | | | | |
Year Ended December 31, 2005: |
|
|
|
|
|
|
|
|
|
|
|
|
|
| | Revenues | | $ | 271,204 | | $ | 294,901 | | $ | 309,155 | | $ | 315,184 | |
| | Income from continuing operations before income taxes | | | 13,933 | | | 16,459 | | | 32,880 | | | 21,126 | |
| | Income from continuing operations | | | 8,365 | | | 9,373 | | | 19,318 | | | 12,022 | |
| | Discontinued operations, net of tax | | | (3,361 | ) | | — | | | — | | | — | |
| | Net income | | | 5,004 | | | 9,373 | | | 19,318 | | | 12,022 | |
| |
Earnings per Share(1): |
|
|
|
|
|
|
|
|
|
|
|
|
|
| | | Basic: | | | | | | | | | | | | | |
| | | | Income from continuing operations | | $ | 0.06 | | $ | 0.07 | | $ | 0.15 | | $ | 0.09 | |
| | | | Discontinued operations, net of tax | | $ | (0.03 | ) | $ | — | | $ | — | | $ | — | |
| | | | Net income | | $ | 0.03 | | $ | 0.07 | | $ | 0.15 | | $ | 0.09 | |
| | |
Diluted: |
|
|
|
|
|
|
|
|
|
|
|
|
|
| | | | Income from continuing operations | | $ | 0.06 | | $ | 0.07 | | $ | 0.14 | | $ | 0.09 | |
| | | | Discontinued operations, net of tax | | $ | (0.03 | ) | $ | — | | $ | — | | $ | — | |
| | | | Net income | | $ | 0.03 | | $ | 0.07 | | $ | 0.14 | | $ | 0.09 | |
| Year Ended December 31, 2004: | | | | | | | | | | | | | |
| | Revenues | | $ | 231,982 | | $ | 243,531 | | $ | 258,485 | | $ | 253,741 | |
| | Income (loss) from continuing operations before income taxes | | | (4,839 | ) | | (21,548 | ) | | 7,891 | | | (9,977 | ) |
| | Income (loss) from continuing operations | | | (5,378 | ) | | (17,422 | ) | | 3,348 | | | (7,131 | ) |
| | Discontinued operations, net of tax | | | (186 | ) | | 815 | | | (8,224 | ) | | 1,952 | |
| | Net income (loss) | | | (5,564 | ) | | (16,607 | ) | | (4,876 | ) | | (5,179 | ) |
| |
Earnings per Share(1): |
|
|
|
|
|
|
|
|
|
|
|
|
|
| | | Basic: | | | | | | | | | | | | | |
| | | | Income (loss) from continuing operations | | $ | (0.04 | ) | $ | (0.13 | ) | $ | 0.03 | | $ | (0.05 | ) |
| | | | Discontinued operations, net of tax | | $ | (0.00 | ) | $ | 0.01 | | $ | (0.06 | ) | $ | 0.01 | |
| | | | Net income (loss) | | $ | (0.04 | ) | $ | (0.12 | ) | $ | (0.03 | ) | $ | (0.04 | ) |
| | |
Diluted: |
|
|
|
|
|
|
|
|
|
|
|
|
|
| | | | Income (loss) from continuing operations | | $ | (0.04 | ) | $ | (0.13 | ) | $ | 0.03 | | $ | (0.05 | ) |
| | | | Discontinued operations, net of tax | | $ | (0.00 | ) | $ | 0.01 | | $ | (0.06 | ) | $ | 0.01 | |
| | | | Net income (loss) | | $ | (0.04 | ) | $ | (0.12 | ) | $ | (0.03 | ) | $ | (0.04 | ) |
| | First Quarter
| | Second Quarter
| | Third Quarter
| | Fourth Quarter(2)
|
|---|
| Year Ended December 31, 2007: | | | | | | | | | | | | |
| | Revenues | | $ | 408,919 | | $ | 410,511 | | $ | 413,967 | | $ | 428,615 |
| | Gross margin | | | 173,406 | | | 172,288 | | | 156,485 | | | 174,219 |
| | Income before income taxes | | | 84,694 | | | 78,471 | | | 59,832 | | | 52,943 |
| | Net income | | | 52,190 | | | 48,136 | | | 35,896 | | | 33,067 |
| |
Earnings per share(1): |
|
|
|
|
|
|
|
|
|
|
|
|
| | | Basic | | $ | 0.40 | | $ | 0.37 | | $ | 0.27 | | $ | 0.25 |
| | | Diluted | | $ | 0.39 | | $ | 0.36 | | $ | 0.27 | | $ | 0.25 |
| | First Quarter
| | Second Quarter
| | Third Quarter
| | Fourth Quarter
|
|---|
| Year Ended December 31, 2006: | | | | | | | | | | | | |
| | Revenues | | $ | 347,958 | | $ | 372,036 | | $ | 417,600 | | $ | 408,583 |
| | Gross margin | | | 129,336 | | | 151,975 | | | 180,199 | | | 164,065 |
| | Income before income taxes | | | 48,430 | | | 63,920 | | | 98,822 | | | 63,308 |
| | Net income | | | 30,063 | | | 39,582 | | | 60,885 | | | 40,503 |
| |
Earnings per share(1): |
|
|
|
|
|
|
|
|
|
|
|
|
| | | Basic | | $ | 0.23 | | $ | 0.30 | | $ | 0.46 | | $ | 0.31 |
| | | Diluted | | $ | 0.22 | | $ | 0.29 | | $ | 0.45 | | $ | 0.31 |
- (1)
- Quarterly earnings per common share are based on the weighted average number of shares outstanding during the quarter, and the sum of the quarters may not equal annual earnings per common share.
- (2)
- Revenues, gross margins, income before income taxes, net income and earnings per share were impacted in the fourth quarter of 2007 due to the acquisitions of Moncla, Kings and AMI. See Note 2—"Acquisitions."
18.20. CONDENSED CONSOLIDATING FINANCIAL STATEMENTS
Our SeniorThe Notes which were retired in the fourth quarter of 2005, wereare guaranteed by virtually all of our domestic subsidiaries, all of which are wholly-owned. The guarantees were joint and several, full, complete and unconditional. There were no restrictions on the ability of subsidiary guarantors to transfer funds to the parent company.
As a result of these guarantee arrangements, we are required to present the following condensed consolidating financial information pursuant to SEC Regulation S-X Rule 3-10, "Financial Statements of Guarantors and Issuers of Guaranteed Securities Registered or Being Registered."
Key Energy Services, Inc. and Subsidiaries
NOTES TO CONSOLIDATED FINANCIAL STATEMENTS (Continued)
20. CONDENSED CONSOLIDATING FINANCIAL STATEMENTS (Continued)
CONDENSED CONSOLIDATING BALANCE SHEETSSHEET
|
| | December 31, 2004
|
| | December 31, 2007
|
|---|
|
| | Parent Company
| | Guarantor Subsidiaries
| | Non-Guarantor Subsidiaries
| | Eliminations
| | Consolidated
|
| | Parent
Company
| | Guarantor
Subsidiaries
| | Non-Guarantor
Subsidiaries
| | Eliminations
| | Consolidated
|
|---|
|
| | (in thousands)
|
| | (in thousands)
|
|---|
| Assets: | Assets: | | | | | | | | | | | Assets: | | | | | | | | | | |
| | Current assets | | $ | 75,365 | | $ | 190,972 | | $ | 25,728 | | $ | — | | $ | 292,065 | |
| | Current assets of discontinued operations | | — | | 18,958 | | — | | — | | 18,958 | |
| | Net property and equipment | | 43,392 | | 526,662 | | 27,724 | | — | | 597,778 | Current assets | | $ | 39,501 | | $ | 378,865 | | $ | 69,499 | | $ | — | | $ | 487,865 |
| | Goodwill | | 3,459 | | 316,527 | | 956 | | — | | 320,942 | Net property and equipment | | — | | 880,907 | | 30,301 | | — | | 911,208 |
| | Deferred costs, net | | 9,068 | | — | | — | | — | | 9,068 | Goodwill | | — | | 373,283 | | 5,267 | | — | | 378,550 |
| | Inter-company receivables | | 566,726 | | — | | — | | (566,726 | ) | | — | Deferred costs, net | | 12,117 | | — | | — | | — | | 12,117 |
| | Other assets | | 7,723 | | 9,508 | | — | | — | | 17,231 | Intercompany receivables and investments in subsidiaries | | 1,557,993 | | 175,461 | | — | | (1,733,454 | ) | | — |
| | Non-current assets of discontinued operations | | — | | 60,580 | | — | | — | | 60,580 | Other assets | | 11,217 | | 52,074 | | 6,046 | | — | | 69,337 |
| | | |
| |
| |
| |
| |
| | |
| |
| |
| |
| |
|
| TOTAL ASSETS | TOTAL ASSETS | | $ | 705,733 | | $ | 1,123,207 | | $ | 54,408 | | $ | (566,726 | ) | $ | 1,316,622 | TOTAL ASSETS | | $ | 1,620,828 | | $ | 1,860,590 | | $ | 111,113 | | $ | (1,733,454 | ) | $ | 1,859,077 |
| | | |
| |
| |
| |
| |
| | |
| |
| |
| |
| |
|
| Liabilities and equity: | Liabilities and equity: | | | | | | | | | | |
Liabilities and equity: |
|
|
|
|
|
|
|
|
|
|
| | Current liabilities | | $ | 59,784 | | $ | 62,683 | | $ | 17,698 | | $ | — | | $ | 140,165 | Current liabilities | | $ | 17,278 | | $ | 192,222 | | $ | 25,297 | | $ | — | | $ | 234,797 |
| | Current liabilities of discontinued operations | | — | | 4,938 | | — | | — | | 4,938 | Long-term debt | | 475,000 | | — | | — | | — | | 475,000 |
| | Long-term debt | | 473,870 | | — | | — | | — | | 473,870 | Capital lease obligations | | — | | 15,998 | | 116 | | — | | 16,114 |
| | Capital lease obligations | | 576 | | 6,601 | | — | | — | | 7,177 | Long-term notes payable— related party | | — | | 20,500 | | — | | — | | 20,500 |
| | Inter-company payables | | — | | 510,430 | | 56,296 | | (566,726 | ) | | — | Intercompany payables | | 78,660 | | 1,489,377 | | 24,408 | | (1,592,445 | ) | | — |
| | Deferred tax liability | | 107,168 | | 88 | | 504 | | — | | 107,760 | Deferred tax liabilities | | 157,759 | | (79 | ) | | 2,388 | | — | | 160,068 |
| | Other long-term liabilities | | 65,030 | | 10,811 | | 1,205 | | — | | 77,046 | Other long-term liabilities | | 3,133 | | 60,216 | | 251 | | — | | 63,600 |
| | Stockholders' equity | | (695 | ) | | 527,656 | | (21,295 | ) | | — | | 505,666 | Stockholders' equity | | 888,998 | | 82,356 | | 58,653 | | (141,009 | ) | | 888,998 |
| | | |
| |
| |
| |
| |
| | |
| |
| |
| |
| |
|
| TOTAL LIABILITIES AND STOCKHOLDERS' EQUITY | TOTAL LIABILITIES AND STOCKHOLDERS' EQUITY | | $ | 705,733 | | $ | 1,123,207 | | $ | 54,408 | | $ | (566,726 | ) | $ | 1,316,622 | TOTAL LIABILITIES AND STOCKHOLDERS' EQUITY | | $ | 1,620,828 | | $ | 1,860,590 | | $ | 111,113 | | $ | (1,733,454 | ) | $ | 1,859,077 |
| | | |
| |
| |
| |
| |
| | |
| |
| |
| |
| |
|
Key Energy Services, Inc. and Subsidiaries
NOTES TO CONSOLIDATED FINANCIAL STATEMENTS (Continued)
20. CONDENSED CONSOLIDATING FINANCIAL STATEMENTS (Continued)
CONDENSED CONSOLIDATING STATEMENTSSTATEMENT OF OPERATIONS
| | Twelve Months Ended December 31, 2004
| |
|---|
| | Parent Company
| | Guarantor Subsidiaries
| | Non-Guarantor Subsidiaries
| | Consolidated
| |
|---|
| | (in thousands)
| |
|---|
| Revenues | | $ | — | | $ | 928,713 | | $ | 59,026 | | $ | 987,739 | |
| Costs and expenses: | | | | | | | | | | | | | |
| | Direct expenses | | | — | | | 648,953 | | | 41,027 | | | 689,980 | |
| | Depreciation and amortization | | | 7,383 | | | 92,147 | | | 3,809 | | | 103,339 | |
| | General and administrative expenses | | | 94,711 | | | 57,129 | | | 5,733 | | | 157,573 | |
| | Interest | | | 46,107 | | | 58 | | | 41 | | | 46,206 | |
| | Loss on early extinguishment of debt | | | — | | | 12,025 | | | — | | | 12,025 | |
| | Other, net | | | (733 | ) | | 7,216 | | | 606 | | | 7,089 | |
| | |
| |
| |
| |
| |
| Total costs and expenses | | | 147,468 | | | 817,528 | | | 51,216 | | | 1,016,212 | |
| | |
| |
| |
| |
| |
| (Loss) income from continuing operations before income taxes | | | (147,468 | ) | | 111,185 | | | 7,810 | | | (28,473 | ) |
| | |
| |
| |
| |
| |
| Income tax benefit (expense) | | | 4,981 | | | 0 | | | (3,091 | ) | | 1,890 | |
| | |
| |
| |
| |
| |
| (Loss) income from continuing operations | | | (142,487 | ) | | 111,185 | | | 4,719 | | | (26,583 | ) |
| | |
| |
| |
| |
| |
| Discontinued operations, net of tax | | | — | | | (5,643 | ) | | — | | | (5,643 | ) |
| | |
| |
| |
| |
| |
| NET (LOSS) INCOME | | $ | (142,487 | ) | $ | 105,542 | | $ | 4,719 | | $ | (32,226 | ) |
| | |
| |
| |
| |
| |
| | Year Ended December 31, 2007
| |
|---|
| | Parent
Company
| | Guarantor
Subsidiaries
| | Non-guarantor
Subsidiaries
| | Eliminations
| | Consolidated
| |
|---|
| | (in thousands)
| |
|---|
| Revenues | | $ | — | | $ | 1,561,059 | | $ | 105,819 | | $ | (4,866 | ) | | 1,662,012 | |
| Costs and expenses: | | | | | | | | | | | | | | | | |
| | Direct expenses | | | — | | | 906,254 | | | 82,980 | | | (3,620 | ) | | 985,614 | |
| | Depreciation and amortization | | | — | | | 123,821 | | | 5,802 | | | — | | | 129,623 | |
| | General and administrative | | | 1,693 | | | 216,959 | | | 11,935 | | | (191 | ) | | 230,396 | |
| | Interest expense, net of amounts capitalized | | | 38,866 | | | (3,134 | ) | | 723 | | | (248 | ) | | 36,207 | |
| | Loss on early extinguishment of debt | | | 9,557 | | | — | | | — | | | — | | | 9,557 | |
| | Other, net | | | (449 | ) | | (5,850 | ) | | 1,781 | | | (807 | ) | | (5,325 | ) |
| | |
| |
| |
| |
| |
| |
| Total costs and expenses, net | | | 49,667 | | | 1,238,050 | | | 103,221 | | | (4,866 | ) | | 1,386,072 | |
| | |
| |
| |
| |
| |
| |
| (Loss) income before income taxes | | | (49,667 | ) | | 323,009 | | | 2,598 | | | — | | | 275,940 | |
| Income tax (expense) benefit | | | (105,928 | ) | | 934 | | | (1,774 | ) | | — | | | (106,768 | ) |
| Minority interest | | | — | | | — | | | 117 | | | — | | | 117 | |
| | |
| |
| |
| |
| |
| |
| NET (LOSS) INCOME | | $ | (155,595 | ) | $ | 323,943 | | $ | 941 | | $ | — | | $ | 169,289 | |
| | |
| |
| |
| |
| |
| |
CONDENSED CONSOLIDATING STATEMENTSSTATEMENT OF CASH FLOWS
| | Twelve Months Ended December 31, 2004
| | | Year Ended December 31, 2007
| |
|---|
| | Parent Company
| | Guarantor Subsidiaries
| | Non-Guarantor Subsidiaries
| | Consolidated
| | | Parent
Company
| | Guarantor
Subsidiaries
| | Non-guarantor
Subsidiaries
| | Eliminations
| | Consolidated
| |
|---|
| | (in thousands)
| | | (in thousands)
| |
|---|
| Net cash provided by operating activities | | $ | 12,691 | | $ | 50,094 | | $ | 7,016 | | $ | 69,801 | | | $ | (3,401 | ) | $ | 264,275 | | $ | (10,955 | ) | $ | — | | $ | 249,919 | |
| Net cash (used in) investing activities | | (101 | ) | | (56,234 | ) | | (7,746 | ) | | (64,081 | ) | |
| Net cash (used in) provided by financing activities | | (103,081 | ) | | 14,804 | | — | | (88,277 | ) | |
| Net cash used in investing activities | | | (473,412 | ) | | (732,359 | ) | | (5,160 | ) | | 908,084 | | (302,847 | ) |
| Net cash provided by financing activities | | | 476,813 | | 429,809 | | 24,702 | | (908,084 | ) | | 23,240 | |
| Effect of exchange rates on cash | | — | | — | | (233 | ) | | (233 | ) | | — | | — | | (184 | ) | | — | | (184 | ) |
| | |
| |
| |
| |
| | |
| |
| |
| |
| |
| |
| Net (decrease) increase in cash | | (90,491 | ) | | 8,664 | | (963 | ) | | (82,790 | ) | | — | | (38,275 | ) | | 8,403 | | — | | (29,872 | ) |
| | |
| |
| |
| |
| | |
| |
| |
| |
| |
| |
| Cash at beginning of period | | 100,109 | | 1,802 | | 1,304 | | 103,215 | | | — | | 84,633 | | 3,742 | | — | | 88,375 | |
| | |
| |
| |
| |
| | |
| |
| |
| |
| |
| |
| Cash at end of period | | $ | 9,618 | | $ | 10,466 | | $ | 341 | | $ | 20,425 | | | $ | — | | $ | 46,358 | | $ | 12,145 | | $ | — | | $ | 58,503 | |
| | |
| |
| |
| |
| | |
| |
| |
| |
| |
| |
ITEM 9. Changes in and Disagreements with Accountants on Accounting and Financial Disclosure
None.
ITEM 9A. Controls and Procedures
Disclosure Controls and Procedures. We maintain a set of disclosure controls and procedures that are designed to provide reasonable assurance that information required to be disclosed in our reports filed under the Securities Exchange Act of 1934 ("the Exchange Act") is recorded, processed, summarized, and reported within the time periods specified in the SEC's rules and forms. Disclosure controls and procedures include, without limitation, controls and procedures designed to ensure that information required to be disclosed by us in the reports that we file or submit under the Exchange Act is accumulated and communicated to the Company's management, including the Company's Chairman and Chief Executive Officer and Chief Financial Officer, as appropriate to allow timely decisions regarding required disclosure.
The Company's management, with the participation of the Company's Chairman and Chief Executive Officer and Chief Financial Officer, has evaluated the effectiveness of the Company's disclosure controls and procedures (as such term is defined in Rules 13a-15(e) under the Exchange Act) as of the end of the period covered by this report. Based on such evaluation, the Company's Chairman and Chief Executive Officer and Chief Financial Officer have concluded that, as of the end of such period, due to the material weaknesses in our internal control over financial reporting described below, our disclosure controls and procedures were not effective.
Changes in Internal Control Over Financial Reporting. We believe that there have been changes in our internal control over financial reporting during the period from January 1, 2007 to December 31, 2007 that have significantly improved our internal control over financial reporting. In August 2007 we filed our Annual Report on Form 10-K for the year ended December 31, 2006 ("2006 Report") and, as described in Item 9A. "Controls and Procedures" in that report, we identified multiple material weaknesses as of December 31, 2006. During 2007 and since filing the 2006 Report, we have made numerous changes to address those weaknesses. Based on these actions, we concluded that the following material weaknesses previously identified had been remediated as of December 31, 2007:
- •
- Recognition of expenditures
- •
- Account reconciliations
- •
- Accounting for income taxes
Improvements in 2007 for our internal control over financial reporting that remediated the 2006 weaknesses included adding a process for and controls over the accrual and recording of expenditures with appropriate reconciliations and review, an overall program of account reconciliations and review and a process, including controls and appropriate review, for our accounting for income taxes.
In other instances, the controls that were implemented during 2007 were not sufficient to effectively remediate the material weakness, or there were not sufficient instances of the controls in operation to make a determination that these controls were operating effectively. The actions taken with respect to the material weaknesses identified as of December 31, 2006 but not remediated at December 31, 2007 are discussed below in "Management's Report on Internal Control Over Financial Reporting."
Management's Report on Internal Control Over Financial Reporting
Management is responsible for establishing and maintaining adequate internal control over financial reporting. Internal control over financial reporting is a process designed to provide reasonable assurance regarding the reliability of financial reporting and the preparation of financial statements for
external purposes in accordance with generally accepted accounting principles. Internal control over financial reporting includes those policies and procedures that (i) pertain to the maintenance of records that, in reasonable detail, accurately and fairly reflect the transactions and dispositions of the assets of the Company; (ii) provide reasonable assurance that transactions are recorded as necessary to permit preparation of financial statements in accordance with generally accepted accounting principles, and that receipts and expenditures of the Company are being made only in accordance with authorizations of management and directors of the Company; and (iii) provide reasonable assurance regarding prevention or timely detection of unauthorized acquisition, use, or disposition of the Company's assets that could have a material effect on the financial statements.
Internal control over financial reporting cannot provide absolute assurance of achieving financial reporting objectives because of its inherent limitations. Internal control over financial reporting is a process that involves human diligence and compliance and is subject to lapses in judgment and breakdowns resulting from human failures. Internal control over financial reporting can also be circumvented by collusion or improper management override. Because of such limitations, there is a risk that material misstatements may not be prevented or detected on a timely basis by internal control over financial reporting. Also, projections of any evaluation of effectiveness to future periods are subject to the risk that controls may become inadequate because of changes in conditions, or that the degree of compliance with the policies or procedures may deteriorate. However, these inherent limitations are known features of the financial reporting process. Therefore, it is possible to design into the process safeguards to reduce, though not eliminate, this risk.
A material weakness (as defined in SEC Rule 12b-2) is a deficiency, or combination of deficiencies, in internal control over financial reporting such that there is a reasonable possibility that a material misstatement of the annual or interim financial statements will not be prevented or detected on a timely basis.
Management conducted an assessment of the effectiveness of the Company's internal control over financial reporting as of December 31, 2007. In making this assessment, management used the criteria described inInternal Control—Integrated Framework issued by the Committee of Sponsoring Organizations of the Treadway Commission (COSO). Based on this assessment, management concluded that our internal control over financial reporting was not effective as of December 31, 2007. Management has identified the following material weaknesses of internal control over financial reporting as of December 31, 2007:
Financial Close and Reporting: In our 2006 Report, we identified a material weakness at December 31, 2006 in our financial close and reporting process. In third quarter of 2007 we filed our 2006 Report, our Quarterly Reports on Form 10-Q for the years 2005 and 2006 and our Quarterly Reports on Form 10-Q for the first and second quarters of 2007, and, in November 2007, we filed our Quarterly Report on Form 10-Q for the third quarter of 2007. In response to the material weaknesses in financial close and reporting disclosed in the 2006 Report, management instituted substantial changes in 2007 to our internal control structure. These changes included additional personnel, adding analytical procedures and reviews, methodologies for the preparation of our financial statements, reconciliations of our accounts and reconciliations between our general ledger and subledger systems as well as increasing the availability of evidence for those controls. However, as a result of our delayed reporting and the devotion of resources to completing our required 2006 and 2007 filings under the Exchange Act, many of these improvements were not in place and evidenced as operating effectively until the financial close and reporting activities for the fourth quarter of 2007. Due to the timing of these improvements, sufficient instances of these controls in operation had not occurred for the controls to be assessed as effective at December 31, 2007. As a result, we could not conclude that this material weakness had been remediated.
Management believes that the control activities put in place in 2007 are sufficient to remediate previously identified deficiencies and that with the passage of sufficient close and reporting cycles to evidence effective operation of these controls the material weakness will be remediated.
19. SUBSEQUENT EVENTS Authorizations of Expenditures: In our 2006 Report, we determined that at December 31, 2006 multiple control deficiencies existed regarding our ability to appropriately ensure and evidence that expenditures, covering substantially all aspects of spending, were approved by the appropriate level of management in accordance with our established policies and, as a result, we identified this as a material weakness. Deficiencies related to authorizations for payroll were among the deficiencies identified in 2006; for 2007, those are discussed separately below. During 2007, changes were made that included the establishment of approval authorities and automated controls in our procurement system. Notwithstanding these changes, certain deficiencies remained at December 31, 2007. The remaining deficiencies resulting in our material weakness are our inability to ensure and evidence that (i) timely approvals occurred for expenditures made through our procurement system or (ii) that expenditures not made through our procurement system were appropriately approved in accordance with our policies. In addition to the changes previously discussed, we also instituted compensating controls in 2007, such as analytical procedures; however, these compensating controls were not all in place and evidenced as operating effectively until the financial close and reporting for the fourth quarter of 2007. As a result, sufficient instances of these controls in operation had not occurred for the controls to be assessed as effective at December 31, 2007.
We are continuing to make enhancements to our procurement processes and controls and believe that these changes, coupled with the passage of sufficient close and reporting cycles for compensating controls put in place in 2007 to be evidenced as operating effectively, will remediate this weakness.
Recording of Revenues: In our 2006 Report, we determined that a material weakness existed at December 31, 2006 regarding the recording of revenues, as our revenue process is heavily dependent on manual reviews and approvals of credit terms, amounts to be billed and recorded and adjustments for bad debts. At December 31, 2007, we determined that a material weakness remained in our revenue process, as manual approvals at the field level necessary to evidence the recognition of revenues and sufficient evidence of those approvals could not be adequately substantiated. We put compensating controls in place in 2007, such as analytical reviews of accrued revenues, analysis of aged receivables and account reconciliations of our revenue systems and general ledger. Sufficient instances had not occurred for all of these compensating controls to be assessed as effective at December 31, 2007. As a result, we have concluded that a material weakness identified in our 2006 Report remained in 2007.
Management believes that the compensating controls put in place in 2007 should be sufficient to compensate for the identified deficiencies in approvals and that with the passage of sufficient close and reporting cycles to evidence operation of these controls the material weakness will be remediated.
Property, Plant & Equipment (PP&E): In our 2006 Report, we determined that a material weakness existed at December 31, 2006 regarding the recording of PP&E. In 2007, substantial changes were made to our processes and controls; however, for two areas of our accounting for PP&E—the timing of assets being placed in service and the timing of recognition of gains and losses and approval for asset dispositions—a material weakness remained at December 31, 2007. Due to the design and utilization of our procurement system and practices, certain final costs for an asset may not be captured in a timely manner. As a result of this, the asset may be physically placed in service prior to all cost information being received. This delay in accumulating necessary cost information may delay the beginning of depreciation expense. Additionally, while we have implemented controls, including counts and observations, to ensure that information regarding asset dispositions is captured and recorded, obtaining evidence of appropriate approval for the disposition as well as the timing of the receipt of that information may result in delays in the recording of the disposition which could cross reporting periods.
Management is making enhancements to our procurement processes and practices and believes that these changes, coupled with compensating controls for the identified deficiencies, including reconciliations and analytical reviews of balances and depreciation expense will remediate this weakness.
User Developed Applications:PEMEX Contract
In the course of preparing our consolidated financial statements, numerous spreadsheets and database programs ("User Developed Applications") are employed. The User Developed Applications are utilized by us in calculating estimates, reconciling payroll hours, tracking inventory costs and making cost allocations, among other things. At December 31, 2006, we identified a material weakness as most User Developed Applications were not secured as to access, logical security, changes or data integrity. To mitigate the associated risk for situations where the above controls could not be implemented, compensating controls were put in place; however, for many of these compensating controls, sufficient instances had not occurred for these controls to be assessed as effective at December 31, 2007. As a result, we have concluded that this material weakness identified in our 2006 Report remained in 2007.
In February 2007, PEMEX awarded our Mexican subsidiary, Key Energy Services de México S. de R.L. de C.V., a 22-month contract valued at $45.8 millionmanagement began an effort to provide field production solutionsidentify all of its User Developed Applications and well workover services. Underremediate the terms of the contract, we will initially provide three well service rigs outfitted with our proprietary KeyView® system and will install two KeyView systems on PEMEX-owned well service rigs. The contract grants PEMEX the option to call for additional rigs and KeyView systemsweakness through controls in the future, althoughUser Developed Applications themselves or compensating controls. These efforts, along with elimination of User Developed Applications from critical processes, continue into 2008. Management believes that with the passage of sufficient close and reporting cycles to evidence operation of these incremental servicescompensating controls the material weakness will be remediated.
Application Access and Segregation of Duties: In our 2006 Report, we determined that material weaknesses existed at December 31, 2006 in four aspects of information technology general controls over security and segregation of duties of our primary financial systems. These include security administration procedures, administrator access privileges, database and file access and password controls. The weaknesses in these information technology general control areas were further evidenced by or related to deficiencies in our various access controls at the financial system level, causing inappropriate access and segregation of duties issues in significant processes. In 2007 we implemented management reports for business owner review as well as administrative controls and procedures. These controls were not fully effective in remediating the identified weakness. We put compensating controls in place in 2007, such as analytical reviews. Sufficient instances had not occurred for these controls to be assessed as effective at December 31, 2007. As a result, we have concluded that this material weakness identified in our 2006 Report remained in 2007.
Management believes that the compensating controls put in place are not includedsufficient to compensate for the identified deficiencies in access and segregation of duties and that with the passage of sufficient close and reporting cycles to evidence operation of these controls the risk associated with the material weakness will be remediated. Management will also be implementing additional activities around business owner review of access and segregation of duties across the systems we utilize.
Payroll: We determined that at December 31, 2007 control activities surrounding our payroll process, in particular, personnel involved in the $45.8 million award.process, proper documentation concerning hours worked or rate changes, coupled with deficiencies with reconciliations where payroll data was a major component, constituted a material weakness in our system of internal controls. These deficiencies had been previously identified in our 2006 Report as part of Account Reconciliationsand Authorization for Expenditures.
In 2007, we continued our process to improve our data quality and controls surrounding our payroll process, beginning with system enhancements and organizational changes. In late 2007, we initiated another phase of this process, which will encompass changes to payroll practices, further organizational changes and the replacement of our current payroll system. We commenced operations in Mexico during the second quarter. The current projectbelieve that these
changes, which will cover PEMEX's North Region assetsfurther strengthen our control structure and increase our efficiency as well as transparency into payroll related data, will initially focus on oil wellsremediate this deficiency. We anticipate that this process will be completed in the Burgos, Poza Rica-Altamira and Cerro Azul assets. Depending on the successthird quarter of the initial project, potential expansion opportunities into the Veracruz and Reynosa fields2008.
Our internal control over financial reporting has been audited by Grant Thornton LLP, an independent registered public accounting firm, as stated in the north plus the entire PEMEX Southern Region out of Villa Hermosa, Tabasco, may be possible.their report included herein.
ITEM 9B. Other Information
Not Applicable.
Settlement of Litigation with Former Chief Executive OfficerPART III
On June 20, 2007, we settled litigation with our former Chief ITEM 10. Directors, Executive Officer, Francis D. John. On May 19, 2006, Mr. John had filedOfficers and Corporate Governance
Item 10 is incorporated by reference pursuant to Regulation 14A under the Securities Exchange Act of 1934. We expect to file a lawsuit against the Company in the U.S. District Court for the Southern District of Texas, Houston Division in response to the Company's notice to him of its intention to treat his termination of employment effective May 1, 2004 as "for Cause" under his employment agreementdefinitive proxy statement with the Company. In connection withSEC within 120 days after the Company's "for Cause" termination, the Company cancelled 3,910,000 stock options which had a weighted-average exercise priceclose of $8.82 and would not have been required to pay Mr. John any severance benefits. In addition, the Company had sought to recover the unamortized balance of Mr. John's prepaid retention bonus.
Under the terms of the settlement agreement (the "Settlement Agreement") between the Company and Mr. John, the Company paid Mr. John $23.0 million in cash on July 5, 2007. This payment was in complete settlement of all amounts sought by Mr. John, including claims for payment for Mr. John's severance and other benefits related to his employment agreement, the value of the cancelled stock options, expense reimbursement, exemplary damages and attorney's fees. Mr. John will be responsible for any and all income taxes in connection with the Settlement Agreement. He will retain the unamortized balance of his prepaid retention bonus. The Settlement Agreement precludes Mr. John from competing with us for a period of two years. The Settlement Agreement contains mutual, general releases of any and all claims by and among the parties thereto, and a requirement that the Company and Mr. John submit a joint proposed order to the court dismissing, with prejudice, all claims asserted in Mr. John's lawsuit against the Company and the Company's counterclaims against Mr. John. Mr. John also agreed to indemnify the Company for certain claims asserted against the Company by his former wife.
In connection with the settlement, we recorded a $21.2 million charge to general and administrative expense in the year ended December 31, 2004, which was2007.
ITEM 11. Executive Compensation
Item 11 is incorporated by reference pursuant to Regulation 14A under the year Mr. John was terminated.Securities Exchange Act of 1934. We also recordedexpect to file a bad debt expensedefinitive proxy statement with the SEC within 120 days after the close of $9.0 million in the year ended December 31, 2004, representing2007.
ITEM 12. Security Ownership of Certain Beneficial Owners and Management and Related Stockholder Matters
Item 12 is incorporated by reference pursuant to Regulation 14A under the Securities Exchange Act of 1934. We expect to file a write-offdefinitive proxy statement with the SEC within 120 days after the close of the unvested portion of a retention bonus previously paid to Mr. John. We will record an intangible asset of $1.8 million in 2007, representing the non-compete agreement with Mr. John.year ended December 31, 2007.
ITEM 13. Amendment to Senior Secured Credit FacilityCertain Relationships and Related Transactions, and Director Independence
On July 27, 2007,Item 13 is incorporated by reference pursuant to Regulation 14A under the Company entered intoSecurities Exchange Act of 1934. We expect to file a Third Amendmentdefinitive proxy statement with the SEC within 120 days after the close of the year ended December 31, 2007.
ITEM 14. Principal Accountant Fees and Services
Item 14 is incorporated by reference pursuant to our Senior Secured Credit Facility. The amendment (i) eliminatedRegulation 14A under the $100 million limitation on permitted acquisitions; (ii) increasedSecurities Exchange Act of 1934. We expect to file a definitive proxy statement with the permitted stock repurchase basket from $250 million to $300 million; (iii) extended
until AugustSEC within 120 days after the close of the year ended December 31, 2007, the date by which we could file this annual report and the date by which we must file our quarterly reports on Form 10-Q for 2005 and 2006; and (iv) extended until October 31, 2007, the date by which we must file our quarterly reports for the quarters ending March 31, 2007 and June 30, 2007.
Eustace MatterPART IV
On July 20, 2007, ITEM 15. Exhibits and Financial Statement Schedules
The following financial statements, schedules and exhibits are filed as part of this Report:
- 1.
- Financial Statements—See "Index to Consolidated Financial Statements" at Page 61.
- 2.
- Financial Statement Schedules filed in Part IV of this Annual Report are listed below:
- •
- Schedule II—Valuation and other Qualifying Accounts
We have omitted all other financial statement schedules because they are not required or are not applicable, or the court entered a judgmentrequired information is shown in favor of Mr. Eustace of approximately $1.4 million. The judgment includes the value of Mr. Eustace's stock options, severance payments, attorney's fees, and court costs. The judgment is subjectfinancial statements in notes to pre-and post- judgment interest at 8.25% per annum. We are considering whether to appeal this decision.the financial statements.
REPORT OF INDEPENDENT REGISTERED PUBLIC ACCOUNTING FIRM
Board of Directors and Shareholders of
Key Energy Services, Inc.
We have audited in accordance with the standards of the Public Company Accounting Oversight Board (United States) the consolidated financial statements of Key Energy Services, Inc. and subsidiaries referred to in our report dated August 11, 2007, which is included in the annual report to shareholders and incorporated by reference in Part II of this form. Our report on the consolidated financial statements includes an explanatory paragraph, which discusses an error resulting in an overstatement of deferred tax liabilities and an overstatement of retained deficit previously reported as of December 31, 2003, and an explanatory paragraph, which discusses the adoption of the provisions of Statement of Financial Accounting Standards No. 123 (revised 2004). Our audits were conducted for the purpose of forming an opinion on the consolidated financial statements taken as a whole. The schedule listed in the index of consolidated financial statements is presented for purposes of additional analysis and is not a required part of the consolidated financial statements. This schedule has been subjected to the auditing procedures applied in the audits of the consolidated financial statements and, in our opinion, is fairly stated in all material respects in relation to the consolidated financial statements taken as a whole.
/s/ Grant Thornton LLP
Houston, Texas
August 11, 2007
Key Energy Services
Schedule II—Valuation and Qualifying Accounts
(in thousands)
| |
| | Additions
| |
| |
|
|---|
| | Balance at
Beginning of
Period
| | Charged to
Expense
| | Charged to
Other Accounts
| | Deductions
| | Balance at
End of Period
|
|---|
| Allowance for doubtful accounts: | | | | | | | | | | | | | | | |
| | As of December 31, 2006 | | $ | 10,843 | | $ | 2,455 | | $ | — | | $ | (300 | ) | $ | 12,998 |
| | As of December 31, 2005 | | | 8,990 | | | 1,853 | | | — | | | — | | | 10,843 |
| | As of December 31, 2004 | | $ | 5,662 | | $ | 3,328 | | $ | — | | $ | — | | $ | 8,990 |
EXHIBIT INDEX
Exhibit
No.
| | Description
|
|---|
2.13.1 | | Asset Purchase Agreement dated December 7, 2004 among the Company, Key Energy Drilling, Inc., Key Energy Drilling Beneficial, L.P., Key Four Corners, Inc. and Key Rocky Mountain Inc. and Patterson-UTI Drilling Company LP, LLLP. (Incorporated by reference to Exhibit 2.5 of the Company's Current Report on Form 8-K dated October 19, 2006, File No. 1-8038.) |
3.1* |
|
Articles of Restatement of the Company. (Incorporated by Reference to Exhibit 3.1 of the Company's Annual Report on Form 10-K for the fiscal year ended December 31, 2006, File No. 1-8038.) |
3.2 |
|
Unanimous consent of the Board of Directors of the Company dated January 11, 2000, limiting the designation of the additional authorized shares to common stock. (Incorporated by reference to Exhibit 3.2 of the Company's Quarterly Report on Form 10-Q for the quarter ended March 31, 2000, File No. 1-8038.) |
3.3 |
|
Second Amended and Restated By-laws of Key Energy Services, Inc. (Incorporated by reference to Exhibit 3.1 of the Company's Form 8-K filed on September 22, 2006, File No. 1-8038.) |
3.4 |
|
Amendment to Second Amended and Restated By-laws of Key Energy Services, Inc. (Incorporated by Reference to Exhibit 3.1 of the Company's Form 8-K filed on November 2, 2007, File No. 1-8038.) |
4.1 |
|
Warrant Agreement dated as of January 22, 1999 between the Company and the Bank of New York, a New York banking corporation as warrant agent. (Incorporated by reference to Exhibit 99(b) of the Company's Form 8-K filed on February 3, 1999, File No. 1-8038.) |
4.2 |
|
Warrant Registration Rights Agreement dated January 22, 1999, by and among the Company and Lehman Brothers Inc., Bear, Stearns & Co., Inc., F.A.C. / Equities, a division of First Albany Corporation, and Dain Rauscher Wessels, a division of Dain Rauscher Incorporated. (Incorporated by reference to Exhibit 99(e) of the Company's Form 8-K filed on February 3, 1999, File No. 1-8038.) |
4.3 |
|
First Supplemental Indenture, dated as of March 1, 2002 among the Registrant, the Guarantors (as defined therein) and U.S. Bank National Association. (Incorporated by reference to Exhibit 4.1 of the Company's Current Report on Form 8-K dated March 1, 2002, File No. 1-8038.) |
4.4 |
|
First Supplemental Indenture to the Indenture dated May 9, 2003, dated as of May 14, 2003 between the Company and U.S. Bank National Association, as Trustee. (Incorporated by reference to Exhibit 4.1 of the Company's Current Report on Form 8-K dated May 14, 2003, File No. 1-8038.) |
4.5 |
|
Consent Solicitation Statement of the Company dated July 6, 2004, regarding the solicitation of consents from the holders of its outstanding 6.375% senior notes due 2013 and 8.375% senior notes due 2008. (Incorporated by reference to Exhibit 99.2 of the Company's Current Report on Form 8-K dated July 7, 2004, File No. 1-8038.) |
4.6 |
|
Second Supplemental Indenture, dated as of July 12, 2004, between the Company and U.S. Bank National Association, as Trustee. (Incorporated by reference to Exhibit 4.2 of the Company's Current Report on Form 8-K dated October 19, 2006, File No. 1-8038.) |
4.7 |
|
Fourth Supplemental Indenture, dated as of July 12, 2004, among the Company, the Guarantors (as defined therein) and U.S. Bank National Association, as Trustee. (Incorporated by reference to Exhibit 4.3 of the Company's Current Report on Form 8-K dated October 19, 2006, File No. 1-8038.) |
4.8 |
|
Supplement to July 6, 2004 Consent Solicitation Statement of the Company, dated July 15, 2004 regarding the solicitation of consents from the holders of its outstanding 6.375% senior notes due 2013 and 8.375% senior notes due 2008. (Incorporated by reference to Exhibit 99.3 of the Company's Current Report on Form 8-K dated July 16, 2004, File No. 1-8038.) |
| | |
4.9 |
|
Third Supplemental Indenture, dated as of July 19, 2004, between the Company and U.S. Bank National Association, as Trustee. (Incorporated by reference to Exhibit 4.4 of the Company's Current Report on Form 8-K dated October 19, 2006, File No. 1-8038.) |
4.10 |
|
Fifth Supplemental Indenture, dated as of July 19, 2004, among the Company, the Guarantors (as defined therein) and U.S. Bank National Association, as Trustee. (Incorporated by reference to Exhibit 4.5 of the Company's Current Report on Form 8-K dated October 19, 2006, File No. 1-8038.) |
4.11 |
|
Consent Solicitation Statement of Key Energy Services, Inc. dated January 7, 2005, regarding the solicitation of consents from the holders of its outstanding 6.375% senior notes due 2013 and 8.375% senior notes due 2008. (Incorporated by reference to Exhibit 99.2 of the Company's Current Report on Form 8-K dated January 7, 2005, File No. 1-8038.) |
4.12 |
|
Fourth Supplemental Indenture dated as of January 19, 2005,November 29, 2007, among Key Energy Services, Inc., the guarantors party thereto and U.S.The Bank National Association,of New York Trust Company, N.A., as Trustee, with respect to the Company's 6.375% senior notes due 2008.trustee. (Incorporated by referenceReference to Exhibit 4.1 of the Company's Current Report on Form 8-K dated January 24, 2005,filed on November 30, 2007, File No. 1-8038.) |
4.134.4 |
|
Sixth Supplemental IndentureRegistration Rights Agreement dated as of January 21, 2005,November 29, 2007, among Key Energy Services, Inc., the subsidiary guarantors of the Company party thereto, and U.S. Bank National Association,Lehman Brothers Inc., Banc of America Securities LLC and Morgan Stanley & Co. Incorporated, as Trustee, with respect torepresentatives of the Company's 8.375% senior notes due 2008.several initial purchasers named therein. (Incorporated by reference to Exhibit 4.1 of the Company's Current Report on Form 8-K dated January 24, 2005, File No. 1-8038.) |
4.14 |
|
Fifth Supplemental Indenture dated as of April 5, 2005, among Key Energy Services, Inc., the guarantors party thereto and U.S. Bank National Association, as Trustee, with respect to the Company's 6.375% senior notes due 2013. (Incorporated by referenceReference to Exhibit 4.2 of the Company's Current Report on Form 8-K dated April 7, 2005.) |
4.15 |
|
Seventh Supplemental Indenture dated as of April 5, 2005, among Key Energy Services, Inc., the guarantors party thereto and U.S. Bank National Association, as Trustee, with respect to the Company's 8.375% senior notes due 2008. (Incorporated by reference to Exhibit 4.3 of the Company's Current Reportfiled on Form 8-K dated April 7, 2005,November 30, 2007, File No. 1-8038.) |
10.1† |
|
Key Energy Group, Inc. 1997 Incentive Plan, as an amendment and restatement effective November 17, 1997 of the Key Energy Group, Inc. 1995 Outside Directors Stock Option Plan. (Incorporated by reference to Exhibit B of the Company's Schedule 14A Proxy Statement filed November 26, 1997, File No. 000-22665.) |
10.2† |
|
EmploymentForm of Restricted Stock Agreement betweenunder Key Energy Group, Inc. 1997 Incentive Plan. |
10.3† |
|
The 2006 Phantom Share Plan of Key Energy Services, Inc. and Richard J. Alario(Incorporated by reference to Exhibit 10.1 of the Company's Current Report on Form 8-K dated effective asOctober 19, 2006, File No. 1-8038.) |
10.4† |
|
Form of May 1, 2004.Award Agreement under the 2006 Phantom Share Plan of Key Energy Services, Inc. (Incorporated by reference to Exhibit 10.2 of the Company's Current Report on Form 8-K dated October 19, 2006, File No. 1-8038.) |
10.3†10.5† |
|
First Amendment to the Employment Agreement between the Company and Richard J. Alario effective asForm of June 24, 2005.Stock Appreciation Rights Agreement. (Incorporated by referenceReference to Exhibit 10.1199.1 of the Company's Current Report on Form 8-K dated October 19, 2006,filed on August 24, 2007, File No. 1-8038.) |
10.4†10.6† |
|
Form of Non-Plan Option Agreement. (Incorporated by Reference to Exhibit 4.1 of the Company's Registration Statement on Form S-8 filed on September 25, 2007, File No. 333-146294.) |
10.7† |
|
Key Energy Services, Inc. 2007 Equity and Cash Incentive Plan. (Incorporated by Reference to Appendix A of the Company's Schedule 14A Proxy Statement filed on November 1, 2007, File No. 1-8038.) |
10.8†* |
|
Form of Nonstatutory Stock Option Agreement under 2007 Equity and Cash Incentive Plan. |
10.9† |
|
Restated Employment Agreement dated effective as of December 31, 2007, among Richard J. Alario, Key Energy Services, Inc. and Key Energy Shared Services, LLC (Incorporated by Reference to Exhibit 10.1 of the Company's Form 8-K filed on January 7, 2008, File No. 1-8038.) |
10.10† |
|
Acknowledgment and Waiver by Richard J. Alario dated March 25, 2005 regarding rescinded option grant. (Incorporated by reference to Exhibit 10.1 of the Company's Current Report on Form 8-K dated March 29, 2005.) |
10.5†10.11† |
|
Restated Employment Agreement betweendated effective as of December 31, 2007, among William M. Austin, Key Energy Services, Inc. and William M. "Bill" Austin dated as of March 1, 2005.Key Energy Shared Services, LLC (Incorporated by referenceReference to Exhibit 10.110.2 of the Company's Current Report on Form 8-K dated Marchfiled on January 7, 2005,2008, File No. 1-8038.) |
10.6†10.12† |
|
First Amendment to theRestated Employment Agreement between the Company and William M. Austindated effective as of June 24, 2005.December 31, 2007, among Newton W. Wilson III, Key Energy Services, Inc. and Key Energy Shared Services, LLC (Incorporated by referenceReference to Exhibit 10.1210.3 of the Company's Current Report on Form 8-K dated October 19, 2006,filed on January 7, 2008, File No. 1-8038.) |
| | |
10.7† |
|
Employment Agreement between Key Energy Services, Inc. and Newton W. "Trey" Wilson III dated as of January 24, 2005. (Incorporated by reference to Exhibit 10.1 of the Company's Current Report on Form 8-K dated January 28, 2005, File No. 1-8038.) |
10.8† |
|
First Amendment to the Employment Agreement between the Company and Newton W. Wilson III effective as of June 24, 2005. (Incorporated by reference to Exhibit 10.13 of the Company's Current Report on Form 8-K dated October 19, 2006, File No. 1-8038.) |
10.9†10.13† |
|
Acknowledgment and Waiver by Newton W. Wilson III dated March 25, 2005 regarding rescinded option grant (Incorporated by reference to Exhibit 10.2 of the Company's Current Report on Form 8-K dated March 29, 2005.) |
10.10†10.14† |
|
Restated Employment Agreement dated effective as of January 1,December 31, 2007, betweenamong Kim B. Clarke, and Key Energy Services, Inc. and Key Energy Shared Services, LLC (Incorporated by referenceReference to Exhibit 10.110.4 of the Company's Current Report on Form 8-K dated October 19, 2006,filed on January 7, 2008, File No. 1-8038.) |
10.11†10.15† |
|
Employment Agreement between Key Energy Services, Inc. and Jim D. Flynt dated as of January 1, 2004. (Incorporated by reference to Exhibit 10.6 of the Company's Current Report on Form 8-K dated October 19, 2006, File No. 1-8038.) |
10.12†10.16† |
|
First Amendment to Employment Agreement dated November 26, 2007, between Key Energy Services, Inc. and Jim D. Flynt. (Incorporated by Reference to Exhibit 10.2 of the Company's Form 8-K filed on November 30, 2007, File No. 1-8038.) |
10.17† |
|
Employment Agreement between Key Energy Services, Inc. and Phil Coyne dated November 17, 2004. (Incorporated by reference to Exhibit 10.8 of the Company's Current Report on Form 8-K dated October 19, 2006, File No. 1-8038.) |
10.13†10.18† |
|
First Amendment to Employment Agreement between the Company and Phil Coyne effective as of January 24, 2005. (Incorporated by reference to Exhibit 10.9 of the Company's Current Report on Form 8-K dated October 19, 2006, File No. 1-8038.) |
10.14†10.19†* |
|
Amended and Restated Employment Agreement between Key Energy Services, Inc. and Don D. Weinheimer dated October 2, 2006. (Incorporated by reference to Exhibit 10.17 of the Company's Current Report on Form 8-K dated October 19, 2006, File No. 1-8038.)December 31, 2007. |
10.15†*10.20† |
|
Form of Restricted Stock Agreement under Key Energy Group, Inc. 1997 Incentive Plan. |
10.16 |
|
Third Amended and Restated CreditEmployment Agreement dated as of July 15, 2002, among Key Energy Services, Inc.,August 14, 2007 between the several lenders from time to time parties thereto, PNC Bank, National Association, as Administrative Agent, PNC Capital Markets, Inc.,Company and Wells Fargo Bank (Texas), as Col-Lead Arrangers and Credit Lyonnais New York Bank, Lehman Commercial Paper, Inc., and Royal Bank of Canada, as the Documentation Agents.J. Marshall Dodson. (Incorporated by referenceReference to Exhibit 10.1 of the Company's Quarterly Report on Form 10-Q for the quarter ended September 30, 2002, File No. 1-8038). |
10.17 |
|
First Amendment, dated as of December 20, 2002, to the Third Amended and Restated Credit Facility, dates as of July 15, 2002, among Key Energy Services, Inc., the several lenders from time to time parties thereto, PNC Bank, National Association, as Administrative Agent, PNC Capital Markets, Inc., and Wells Fargo Bank (Texas), as Co-Lead Arrangers and Credit Lyonnais New York Bank, Lehman Commercial Paper, Inc., and Royal Bank of Canada, as the Documentation Agents. (Incorporated by reference to Exhibit 10.29 of the Company's Annual Transition Report on Form 10-KT,2007, File No. 1-8038.) |
10.1810.21† |
|
Second Amendment,Employment Agreement dated May 9, 2003 toAugust 14, 2007 between the Third AmendedCompany and Restated Credit Facility, dated as of July 15, 2002, among Key Energy Services, Inc., the several lenders from time to time parties thereto, PNC Bank, National Association, as Administrative Agent, PNC Capital Markets, Inc., and Wells Fargo Bank (Texas), as Co-Lead Arrangers and Credit Lyonnais New York Bank, Lehman Commercial Paper, Inc. and Royal Bank Canada, as the Documentation Agents.D. Bryan Norwood. (Incorporated by referenceReference to Exhibit 10.110.2 of the Company's CurrentQuarterly Report on Form 8-K dated May 9, 2003, File No. 1-8038.) |
| | |
10.19 |
|
Fourth Amended and Restated Credit Agreement, dated as of June 7, 1997, as amended and restated through November 10, 2003, among10-Q for the Company, the several Lenders from time to time parties thereto, the Guarantors, PNC Bank, National Association, as Administrative Agent, PNC Capital Markets, Inc. and Wells Fargo Bank Texas, as Co-Lead Arrangers, and Credit Lyonnais New York Branch, as Syndication Agent, Bank One N.A. and Comerica Bank, as Co-Documentation Agents. (Incorporated by reference to Exhibit 99.1 of the Company's Current Report on Form 8-K dated November 13, 2003, File No. 1-8038.) |
10.20 |
|
Waiver and First Amendment to Credit Agreement to Fourth Amended and Restated Credit Agreement dated as of April 5, 2004 by and among the Registrant, each of the Guarantors (as defined in the Credit Agreement), the Lenders (as defined in the Credit Agreement), PNC Bank, National Association, as Administrative Agent, PNC Capital Markets, Inc., and Wells Fargo Bank, National Association (successor-by-merger to Wells Fargo Bank Texas, National Association), as the Co-Lead Arrangers, and Credit Lyonnais New York Branch, as the Syndication Agent, and Bank One, NA and Comerica Bank, as the Co-Documentation Agents. (Incorporated by reference to Exhibit 99.2 of the Company's Form 8-K Report dated April 7, 2004, File No. 1-8038.) |
10.21 |
|
Modification of Waiver and Second Amendment to Fourth Amended and Restated Credit Agreement dated as of August 31, 2004 by and among the Company, each of the Guarantors (as defined in the Credit Agreement), the Lenders (as defined in the Credit Agreement), PNC Bank, National Association, as Administrative Agent, PNC Capital Markets, Inc., and Wells Fargo Bank, National Association (successor-by-merger to Wells Fargo Bank Texas, National Association), as the Co-Lead Arrangers, and Calyon New York Branch (successor by merger to Credit Lyonnais New York Branch), as the Syndication Agent, JPMorgan Chase Bank, N.A. and Comerica Bank, as the Co-Documentation Agents. (Incorporated by reference to Exhibit 99.1 of the Company's Current Report on Form 8-K Report datedquarter ended September 7, 2004,30, 2007, File No. 1-8038.) |
10.22 |
|
Second Modification of Waiver and Third Amendment to Fourth and Restated Credit Agreement on December 17, 2004 by and among the Company, each of the Guarantors (as defined in the Credit Agreement), the Lenders (as defined in the Credit Agreement), PNC Bank, National Association, as Administrative Agent, PNC Capital Markets, Inc., and Wells Fargo Bank, National Association (successor- by-merger to Wells Fargo Bank Texas, National Association), as the Co-Lead Arrangers, and Calyon New York Branch (successor by merger to Credit Lyonnais New York Branch), as the Syndication Agent, JPMorgan Chase Bank, N.A. and Comerica Bank, as the Co-Documentation Agents. ((Incorporated by reference to Exhibit 99.1 of the Company's Current Report on Form 8-K Report dated December 22, 2004, File No. 1-8038.) |
10.23 |
|
Third Modification of Waiver and Fourth Amendment to Fourth Amended and Restated Credit Agreement dated as of March 30, 2005 by and among the Company, each of the Guarantors (as defined in the Credit Agreement), the Lenders (as defined in the Credit Agreement), PNC Bank, National Association, as Administrative Agent, PNC Capital Markets, Inc. and Wells Fargo Bank, National Association (successor-by-merger to Wells Fargo Bank Texas, National Association), as the Co-Lead Arrangers, and Calyon New York Branch (successor by merger to Credit Lyonnais New York Branch), as the Syndication Agent, JPMorgan Chase Bank, N.A. and Comerica Bank, as the Co-Documentation Agents. (Incorporated by reference Exhibit 10.1 of the Company's Current Report on Form 8-K dated April 5, 2003, File No. 1-8038.) |
| | |
10.24 |
|
Fourth Modification of Waiver and Fifth Amendment to the Fourth Amended and Restated Credit Agreement dated as of April 29, 2005 by and among the Company, each of the Guarantors (as defined in the Credit Agreement), the Lenders (as defined in the Credit Agreement), PNC Bank, National Association, as Administrative Agent, PNC Capital Markets, Inc. and Wells Fargo Bank, National Association (successor-by-merger to Wells Fargo Bank Texas, National Association) as the Co-Lead Arrangers, and Calyon New York Branch (successor-by-merger to Credit Lyonnais New York Branch), as the Syndication Agent, JPMorgan Chase Bank, N.A. and Comerica Bank, as the Co-documentation Agents, (Incorporated by reference to Exhibit 10.1 of the Company's Current Report on Form 8-K dated May 3, 2005.) |
10.25 |
|
Fifth Modification of Wavier and Sixth Amendment to the Fourth Amended and Restated Credit Agreement dates as of May 26, 2005 by and among the Company, each of the Guarantors (as defined in the Credit Agreement), the Lenders (as defined in the Credit Agreement), PNC Bank, National Association, as Administrative Agent, PNC Capital Markets, Inc. and Wells Fargo Bank, National Association (successor-by-merger to Wells Fargo Bank Texas, National Association) as the Co-Leas Arrangers, and Calyon New York Branch (successor-by-merger to Credit Lyonnais New York Branch), as the Syndication Agent, JPMorgan Chase Bank, N.A. and Comerica Bank, as the Co-Documentation Agents. (Incorporated by reference to Exhibit 10.1 of the Company's Current Report on Form 8-K dated June 1, 2005.) |
10.26 |
|
Agreement for Supply and Operation of Workover Rigs, Pulling Units, Vehicles, Other Equipment and Related Services by and between Apache Corporation and Registrant dated as of March 28, 2002. (Incorporated by reference to Exhibit 10.18 of the Company's Current Report on Form 8-K dated October 19, 2006, File No. 1-8038.) |
10.27 |
|
Office Lease effective as of January 20, 2005 between Crescent 1301 McKinney, L.P. and Key Energy Services, Inc. (Incorporated by reference to Exhibit 10.1 of the Company's Current Report on Form 8-K dated January 26, 2005, File No. 1-8038.) |
10.2810.23 |
|
First Amendment to Office Lease dated as of March 15, 2005 between Crescent 1301 McKinney, L.P. and Key Energy Services, Inc. (Incorporated by reference to Exhibit 10.1 of the Company's Current Report on Form 8-K dated June 30, 2005, File No. 1-3038.) |
10.29 |
|
Commitment Letter dated June 1, 2005 between Lehman Brothers Inc., Lehman Commercial Paper Inc. and Key Energy Services, Inc. (Incorporated by reference to Exhibit 10.1 of the Company's Current Report on Form 8-K dated June 2, 2005, File No. 1-8038.) |
10.3010.24 |
|
Second Amendment to Office Lease dated as of July 24, 2005 between Crescent 1301 McKinney, L.P. and Key Energy Services, Inc. (Incorporated by reference to Exhibit 10.2 of the Company's Current Report on Form 8-K dated June 30, 2005, File No. 1-8038.) |
10.3110.25 |
|
Credit Agreement, dated as of June 29, 2005, among the Company, as Borrower, the several lenders from time to time party thereto, Lehman Brothers Inc., as sole lead arranger and sole book runner, Lehman Commercial Paper Inc., as syndication agent, administrative agent and as collateral agent, and Wells Fargo Foothill, Inc., as revolving administrative agent. (Incorporated by reference to Exhibit 10.1 of the Company's Current Report on Form 8-K dated August 4, 2005, File No. 1-8038.) |
10.3210.26 |
|
First Amendment to Credit Agreement and First Amendment to Guaranty and Collateral Agreement dated as of November 1, 2005, among the Company, as Borrower, the Guarantors, the Lenders, and Lehman Commercial Paper Inc., as administrative agent for the Lenders and as Collateral Agent for the Lenders and other Secured Parties. (Incorporated by reference to Exhibit 10.1 of the Company's Current Report on Form 8-K dated November 7, 2005, File No. 1-8038.) |
| | |
10.3310.27 |
|
Second Amendment to Credit Agreement dated as of November 21, 2006, among the Company, as Borrower, the Guarantors, the Lenders, and Lehman Commercial Paper Inc., as administrative agent for the Lenders and as Collateral Agent for the Lenders and other secured Parties. (Incorporated by reference to Exhibit 10.1 of the Company's Current Report on Form 8-K dated October 19, 2006, File No. 1-8038.) |
10.34†10.28 |
|
Third Amendment to Credit Agreement dated as of July 27, 2007, among the Company, as Borrower, the Guarantors, the Lenders and Lehman Commercial Paper, Inc., as administrative agent for the Lenders and as Collateral Agent for the Lenders and other Secured Parties. (Incorporated by reference to Exhibit 10.1 of the Company's Current Report on Form 8-K dated July 31, 2007, File No. 1-8038.) |
10.29 |
|
Fourth Amendment to Credit Agreement dated as of November 12, 2007, among Key Energy Services, Inc., as Borrower, the guarantors signatory thereto, the Lenders, and Lehman Commercial Paper Inc., as administrative agent for the Lenders and as Collateral Agent for the Lenders and other Secured Parties. (Incorporated by Reference to Exhibit 10.1 of the Company's Form 8-K filed on November 15, 2007, File No. 1-8038.) |
10.30 |
|
Credit Agreement dated as of November 29, 2007, among Key Energy Services, Inc., each lender from time to time party thereto, Bank of America, N.A., as Paying Agent, Co-Administrative Agent, Swing Line Lender and L/C Issuer, and Wells Fargo Bank, National Association, as Co-Administrative Agent, Swing Line Lender and L/C Issuer. (Incorporated by Reference to Exhibit 10.1 of the Company's Form 8-K filed on November 30, 2007, File No. 1-8038.) |
10.31 |
|
Stock and Membership Interest Purchase Agreement dated as of September 19, 2007. (Incorporated by Reference to Exhibit 10.1 of the Company's Form 8-K filed on September 20, 2007, File No. 1-8038.) |
10.32 |
|
First Amendment to Stock and Membership Interest Purchase Agreement dated October 25, 2007, among Key Energy Services, LLC and the Sellers (as defined therein). (Incorporated by Reference to Exhibit 10.3 of the Company's Quarterly Report on Form 10-Q for the quarter ended September 30, 2007, File No. 1-8038.) |
10.33 |
|
Asset Purchase Agreement dated December 7, 2007 among Key Energy Services, LLC, Kings Oil Tools, Inc. and Thomas Fowler. (Incorporated by Reference to Exhibit 10.1 of the Company's Form 8-K filed on December 13, 2007, File No. 1-8038.) |
10.33 |
|
Purchase Agreement, dated November 14, 2007, by and among the Company, certain of its domestic subsidiaries, and Lehman Brothers, Inc., Banc of America Securities LLC and Morgan Stanley & Co. Incorporated, as representatives of the initial purchasers. (Incorporated by Reference to Exhibit 10.2 of the Company's Form 8-K filed on November 15, 2007, File No. 1-8038.) |
21* |
|
Significant Subsidiaries of the Company. |
23* |
|
Consent of Independent Registered Public Accounting Firm. |
31.1* |
|
Certification of CEO pursuant to Securities Exchange Act Rules 13a-14(a) and 15d-14(a), as adopted pursuant to Section 302 of the Sarbanes-Oxley Act. of 2002. |
31.2* |
|
Certification of CFO pursuant to Securities Exchange Act Rules 13a-14(a) and 15d-14(a), as adopted pursuant to Section 302 of the Sarbanes-Oxley Act of 2002. |
32* |
|
Certification of CEO and CFO pursuant to 18 U.S.C. Section 1350, as adopted pursuant to Section 906 of the Sarbanes-Oxley Act of 2002. |
- †
- Indicates a management contract or compensatory plan, contract or arrangement in which any Director or any Executive Officer participates.
- *
- Filed herewith.
SIGNATURES
Pursuant to the requirements of Section 13 of 15(d) of the Securities Exchange Act of 1934, the registrant has duly caused this report to be signed on its behalf by the undersigned, thereunto duly authorized.
| Date: February 29, 2008 | | KEY ENERGY SERVICES, INC. |
|
|
By: |
/s/ WILLIAM M. AUSTIN
William M. Austin,Senior Vice
President and Chief Financial Officer |
POWER OF ATTORNEY
Each person whose signature appears below hereby constitutes and appoints Richard J. Alario and William M. Austin, and each of them, his true and lawful attorney-in-fact and agent, with full powers of substitution, for him and in his name, place and stead, in any and all capacities, to sign any and all amendments to this Annual Report on Form 10-K, and to file the same, with all exhibits thereto, and other documents in connection therewith, with the Securities and Exchange Commission granting to said attorneys-in-fact, and each of them, full power and authority to perform any other act on behalf of the undersigned required to be done in connection therewith.
Pursuant to the requirements of the Securities Exchange Act of 1934, this report has been signed below by the following persons on behalf of the registrant in the capacities and on the dates indicated.
Signature
| | Title
| | Date
|
|---|
|
|
|
|
|
/s/ RICHARD J. ALARIO
Richard J. Alario | | Chairman of the Board of Directors,
President and Chief Executive Officer
(Principal Executive Officer) | | February 29, 2008 |
/s/ WILLIAM M. AUSTIN
William M. Austin |
|
Senior Vice President and Chief
Financial Officer
(Principal Financial Officer) |
|
February 29, 2008 |
/s/ J. MARSHALL DODSON
J. Marshall Dodson |
|
Vice President and Chief Accounting
Officer
(Principal Accounting Officer) |
|
February 29, 2008 |
/s/ DAVID J. BREAZZANO
David J. Breazzano |
|
Director |
|
February 29, 2008 |
Lynn R. Coleman |
|
Director |
|
February 29, 2008 |
/s/ KEVIN P. COLLINS
Kevin P. Collins |
|
Director |
|
February 29, 2008 |
/s/ WILLIAM D. FERTIG
William D. Fertig |
|
Director |
|
February 29, 2008 |
/s/ W. PHILLIP MARCUM
W. Phillip Marcum |
|
Director |
|
February 29, 2008 |
/s/ RALPH S. MICHAEL, III
Ralph S. Michael, III |
|
Director |
|
February 29, 2008 |
/s/ WILLIAM F. OWENS
William F. Owens |
|
Director |
|
February 29, 2008 |
/s/ ARLENE M. YOCUM
Arlene M. Yocum |
|
Director |
|
February 29, 2008 |
/s/ ROBERT K. REEVES
Robert K. Reeves |
|
Director |
|
February 29, 2008 |
/s/ J. ROBINSON WEST
J. Robinson West |
|
Director |
|
February 29, 2008 |
EXHIBIT INDEX
Exhibit No.
| | Description
|
|---|
| 3.1 | | Articles of Restatement of the Company. (Incorporated by Reference to Exhibit 3.1 of the Company's Annual Report on Form 10-K for the fiscal year ended December 31, 2006, File No. 1-8038.) |
3.2 |
|
Unanimous consent of the Board of Directors of the Company dated January 11, 2000, limiting the designation of the additional authorized shares to common stock. (Incorporated by reference to Exhibit 3.2 of the Company's Quarterly Report on Form 10-Q for the quarter ended March 31, 2000, File No. 1-8038.) |
3.3 |
|
Second Amended and Restated By-laws of Key Energy Services, Inc. (Incorporated by reference to Exhibit 3.1 of the Company's Form 8-K filed on September 22, 2006, File No. 1-8038.) |
3.4 |
|
Amendment to Second Amended and Restated By-laws of Key Energy Services, Inc. (Incorporated by Reference to Exhibit 3.1 of the Company's Form 8-K filed on November 2, 2007, File No. 1-8038.) |
4.1 |
|
Warrant Agreement dated as of January 22, 1999 between the Company and the Bank of New York, a New York banking corporation as warrant agent. (Incorporated by reference to Exhibit 99(b) of the Company's Form 8-K filed on February 3, 1999, File No. 1-8038.) |
4.2 |
|
Warrant Registration Rights Agreement dated January 22, 1999, by and among the Company and Lehman Brothers Inc., Bear, Stearns & Co., Inc., F.A.C. / Equities, a division of First Albany Corporation, and Dain Rauscher Wessels, a division of Dain Rauscher Incorporated. (Incorporated by reference to Exhibit 99(e) of the Company's Form 8-K filed on February 3, 1999, File No. 1-8038.) |
4.3 |
|
Indenture, dated as of November 29, 2007, among Key Energy Services, Inc., the guarantors party thereto and The Bank of New York Trust Company, N.A., as trustee. (Incorporated by Reference to Exhibit 4.1 of the Company's Form 8-K filed on November 30, 2007, File No. 1-8038.) |
4.4 |
|
Registration Rights Agreement dated as of November 29, 2007, among Key Energy Services, Inc., the subsidiary guarantors of the Company party thereto, and Lehman Brothers Inc., Banc of America Securities LLC and Morgan Stanley & Co. Incorporated, as representatives of the several initial purchasers named therein. (Incorporated by Reference to Exhibit 4.2 of the Company's Form 8-K filed on November 30, 2007, File No. 1-8038.) |
10.1† |
|
Key Energy Group, Inc. 1997 Incentive Plan, as an amendment and restatement effective November 17, 1997 of the Key Energy Group, Inc. 1995 Outside Directors Stock Option Plan. (Incorporated by reference to Exhibit B of the Company's Schedule 14A Proxy Statement filed November 26, 1997, File No. 000-22665.) |
10.2† |
|
Form of Restricted Stock Agreement under Key Energy Group, Inc. 1997 Incentive Plan. |
10.3† |
|
The 2006 Phantom Share Plan of Key Energy Services, Inc. (Incorporated by reference to Exhibit 10.1 of the Company's Current Report on Form 8-K dated October 19, 2006, File No. 1-8038.) |
10.35†10.4† |
|
Form of Award Agreement under the 2006 Phantom Share Plan of Key Energy Services, Inc. (Incorporated by reference to Exhibit 10.2 of the Company's Current Report on Form 8-K dated October 19, 2006, File No. 1-8038.) |
10.3610.5† |
|
Form of Stock Appreciation Rights Agreement. (Incorporated by Reference to Exhibit 99.1 of the Company's Form 8-K filed on August 24, 2007, File No. 1-8038.) |
10.6† |
|
Form of Non-Plan Option Agreement. (Incorporated by Reference to Exhibit 4.1 of the Company's Registration Statement on Form S-8 filed on September 25, 2007, File No. 333-146294.) |
10.7† |
|
Key Energy Services, Inc. 2007 Equity and Cash Incentive Plan. (Incorporated by Reference to Appendix A of the Company's Schedule 14A Proxy Statement filed on November 1, 2007, File No. 1-8038.) |
10.8†* |
|
Form of Nonstatutory Stock Option Agreement under 2007 Equity and Cash Incentive Plan. |
10.9† |
|
Restated Employment Agreement dated effective as of December 31, 2007, among Richard J. Alario, Key Energy Services, Inc. and Key Energy Shared Services, LLC (Incorporated by Reference to Exhibit 10.1 of the Company's Form 8-K filed on January 7, 2008, File No. 1-8038.) |
10.10† |
|
Acknowledgment and Waiver by Richard J. Alario dated March 25, 2005 regarding rescinded option grant. (Incorporated by reference to Exhibit 10.1 of the Company's Current Report on Form 8-K dated March 29, 2005.) |
10.11† |
|
Restated Employment Agreement dated effective as of December 31, 2007, among William M. Austin, Key Energy Services, Inc. and Key Energy Shared Services, LLC (Incorporated by Reference to Exhibit 10.2 of the Company's Form 8-K filed on January 7, 2008, File No. 1-8038.) |
10.12† |
|
Restated Employment Agreement dated effective as of December 31, 2007, among Newton W. Wilson III, Key Energy Services, Inc. and Key Energy Shared Services, LLC (Incorporated by Reference to Exhibit 10.3 of the Company's Form 8-K filed on January 7, 2008, File No. 1-8038.) |
10.13† |
|
Acknowledgment and Waiver by Newton W. Wilson III dated March 25, 2005 regarding rescinded option grant (Incorporated by reference to Exhibit 10.2 of the Company's Current Report on Form 8-K dated March 29, 2005.) |
10.14† |
|
Restated Employment Agreement dated effective as of December 31, 2007, among Kim B. Clarke, Key Energy Services, Inc. and Key Energy Shared Services, LLC (Incorporated by Reference to Exhibit 10.4 of the Company's Form 8-K filed on January 7, 2008, File No. 1-8038.) |
10.15† |
|
Employment Agreement between Key Energy Services, Inc. and Jim D. Flynt dated as of January 1, 2004. (Incorporated by reference to Exhibit 10.6 of the Company's Current Report on Form 8-K dated October 19, 2006, File No. 1-8038.) |
10.16† |
|
First Amendment to Employment Agreement dated November 26, 2007, between Key Energy Services, Inc. and Jim D. Flynt. (Incorporated by Reference to Exhibit 10.2 of the Company's Form 8-K filed on November 30, 2007, File No. 1-8038.) |
10.17† |
|
Employment Agreement between Key Energy Services, Inc. and Phil Coyne dated November 17, 2004. (Incorporated by reference to Exhibit 10.8 of the Company's Current Report on Form 8-K dated October 19, 2006, File No. 1-8038.) |
10.18† |
|
First Amendment to Employment Agreement between the Company and Phil Coyne effective as of January 24, 2005. (Incorporated by reference to Exhibit 10.9 of the Company's Current Report on Form 8-K dated October 19, 2006, File No. 1-8038.) |
10.19†* |
|
Amended and Restated Employment Agreement between Key Energy Services, Inc. and Don D. Weinheimer dated December 31, 2007. |
10.20† |
|
Employment Agreement dated August 14, 2007 between the Company and J. Marshall Dodson. (Incorporated by Reference to Exhibit 10.1 of the Company's Quarterly Report on Form 10-Q for the quarter ended September 30, 2007, File No. 1-8038.) |
10.21† |
|
Employment Agreement dated August 14, 2007 between the Company and D. Bryan Norwood. (Incorporated by Reference to Exhibit 10.2 of the Company's Quarterly Report on Form 10-Q for the quarter ended September 30, 2007, File No. 1-8038.) |
10.22 |
|
Office Lease effective as of January 20, 2005 between Crescent 1301 McKinney, L.P. and Key Energy Services, Inc. (Incorporated by reference to Exhibit 10.1 of the Company's Current Report on Form 8-K dated January 26, 2005, File No. 1-8038.) |
10.23 |
|
First Amendment to Office Lease dated as of March 15, 2005 between Crescent 1301 McKinney, L.P. and Key Energy Services, Inc. (Incorporated by reference to Exhibit 10.1 of the Company's Current Report on Form 8-K dated June 30, 2005, File No. 1-3038.) |
10.24 |
|
Second Amendment to Office Lease dated as of July 24, 2005 between Crescent 1301 McKinney, L.P. and Key Energy Services, Inc. (Incorporated by reference to Exhibit 10.2 of the Company's Current Report on Form 8-K dated June 30, 2005, File No. 1-8038.) |
10.25 |
|
Credit Agreement, dated as of June 29, 2005, among the Company, as Borrower, the several lenders from time to time party thereto, Lehman Brothers Inc., as sole lead arranger and sole book runner, Lehman Commercial Paper Inc., as syndication agent, administrative agent and as collateral agent, and Wells Fargo Foothill, Inc., as revolving administrative agent. (Incorporated by reference to Exhibit 10.1 of the Company's Current Report on Form 8-K dated August 4, 2005, File No. 1-8038.) |
10.26 |
|
First Amendment to Credit Agreement and First Amendment to Guaranty and Collateral Agreement dated as of November 1, 2005, among the Company, as Borrower, the Guarantors, the Lenders, and Lehman Commercial Paper Inc., as administrative agent for the Lenders and as Collateral Agent for the Lenders and other Secured Parties. (Incorporated by reference to Exhibit 10.1 of the Company's Current Report on Form 8-K dated November 7, 2005, File No. 1-8038.) |
10.27 |
|
Second Amendment to Credit Agreement dated as of November 21, 2006, among the Company, as Borrower, the Guarantors, the Lenders, and Lehman Commercial Paper Inc., as administrative agent for the Lenders and as Collateral Agent for the Lenders and other secured Parties. (Incorporated by reference to Exhibit 10.1 of the Company's Current Report on Form 8-K dated October 19, 2006, File No. 1-8038.) |
10.28 |
|
Third Amendment to Credit Agreement dated as of July 27, 2007, among the Company, as Borrower, the Guarantors, the Lenders and Lehman Commercial Paper, Inc., as administrative agent for the Lenders and as Collateral Agent for the Lenders and other Secured Parties. (Incorporated by reference to Exhibit 10.1 of the Company's Current Report on Form 8-K dated July 31, 2007, File No. 1-8038.) |
16.110.29 |
|
LetterFourth Amendment to Credit Agreement dated as of November 12, 2007, among Key Energy Services, Inc., as Borrower, the guarantors signatory thereto, the Lenders, and Lehman Commercial Paper Inc., as administrative agent for the Lenders and as Collateral Agent for the Lenders and other Secured Parties. (Incorporated by Reference to Exhibit 10.1 of the Company's Form 8-K filed on November 15, 2007, File No. 1-8038.) |
10.30 |
|
Credit Agreement dated as of November 29, 2007, among Key Energy Services, Inc., each lender from time to time party thereto, Bank of America, N.A., as Paying Agent, Co-Administrative Agent, Swing Line Lender and L/C Issuer, and Wells Fargo Bank, National Association, as Co-Administrative Agent, Swing Line Lender and L/C Issuer. (Incorporated by Reference to Exhibit 10.1 of the Company's Form 8-K filed on November 30, 2007, File No. 1-8038.) |
10.31 |
|
Stock and Membership Interest Purchase Agreement dated as of September 19, 2007. (Incorporated by Reference to Exhibit 10.1 of the Company's Form 8-K filed on September 20, 2007, File No. 1-8038.) |
10.32 |
|
First Amendment to Stock and Membership Interest Purchase Agreement dated October 25, 2007, among Key Energy Services, LLC and the Sellers (as defined therein). (Incorporated by Reference to Exhibit 10.3 of the Company's Quarterly Report on Form 10-Q for the quarter ended September 30, 2007, File No. 1-8038.) |
10.33 |
|
Asset Purchase Agreement dated December 7, 2006 from KPMG LLP.2007 among Key Energy Services, LLC, Kings Oil Tools, Inc. and Thomas Fowler. (Incorporated by referenceReference to Exhibit 4.210.1 of the Company's Current Report on Form 8-K filed on December 13, 2007, File No. 1-8038.) |
10.33 |
|
Purchase Agreement, dated October 19, 2006,November 14, 2007, by and among the Company, certain of its domestic subsidiaries, and Lehman Brothers, Inc., Banc of America Securities LLC and Morgan Stanley & Co. Incorporated, as representatives of the initial purchasers. (Incorporated by Reference to Exhibit 10.2 of the Company's Form 8-K filed on November 15, 2007, File No. 1-8038.) |
21* |
|
Significant Subsidiaries of the Company. |
23* |
|
Consent of Independent Registered Public Accounting Firm. |
31.1* |
|
Certification of CEO pursuant to Securities Exchange Act Rules 13a-14(a) and 15d-14(a), as adopted pursuant to Section 302 of the Sarbanes-Oxley Act. of 2002. |
31.2* |
|
Certification of CFO pursuant to Securities Exchange Act Rules 13a-14(a) and 15d-14(a), as adopted pursuant to Section 302 of the Sarbanes-Oxley Act of 2002. |
32* |
|
Certification of CEO and CFO pursuant to 18 U.S.C. Section 1350, as adopted pursuant to Section 906 of the Sarbanes-Oxley Act of 2002. |
- †
- Indicates a management contract or compensatory plan, contract or arrangement in which any Director or any Executive Officer participates.
- *
- Filed herewith.
REPORT OF INDEPENDENT REGISTERED PUBLIC ACCOUNTING FIRM
Board of Directors and Shareholders of
Key Energy Services, Inc.
We have audited in accordance with the standards of the Public Company Accounting Oversight Board (United States) the consolidated financial statements of Key Energy Services, Inc. and Subsidiaries referred to in our report dated February 26, 2008, which is included in the annual report to security holders and incorporated by reference in Part II of this form. Our report on the consolidated financial statements includes explanatory paragraphs, which discuss the adoption of Statement of Financial Accounting Standards No. 123 (revised 2004),Share Based Payments, Financial Accounting Standards Interpretation No. 48,Accounting for Uncertainty in Income Taxes, and FSP EITF 00-19-2,Accounting for Registration Payment Arrangements. Our audits of the basic financial statements included the financial statement schedule listed in the index appearing under Item 15, which is the responsibility of the Company's management. In our opinion, this financial statement schedule, when considered in relation to the basic financial statements taken as a whole, presents fairly, in all material respects, the information set forth therein.
/s/ GRANT THORNTON LLP
Houston, Texas
February 26, 2008
Key Energy Services, Inc. and Subsidiaries
Schedule II—Valuation and Qualifying Accounts
(in thousands)
| |
| | Additions
| |
| |
|
|---|
| | Balance at
Beginning of
Period
| | Charged to
Expense
| | Charged to
Other
Accounts
| | Acquisitions
| | Deductions
| | Balance at
End of Period
|
|---|
| Allowance for doubtful accounts: | | | | | | | | | | | | | | | | | | |
| | As of December 31, 2007 | | $ | 12,998 | | $ | 3,675 | | $ | — | | $ | 1,251 | | $ | (4,423 | ) | $ | 13,501 |
| | As of December 31, 2006 | | | 10,843 | | | 1,854 | | | 301 | | | — | | | — | | | 12,998 |
| | As of December 31, 2005 | | | 8,990 | | | 1,853 | | | — | | | — | | | — | | | 10,843 |