•increased our store count from
80174 as of the end of fiscal20022005 to285400 as of the end of fiscal2007;•maintained2010, a compounded annual growth rate of 18.1%;experienced average net sales per square foot
in excessof$478$435 for our last five fiscal years ending with fiscal2007;•- 2010, from a peak of net sales per square foot of $499 in fiscal 2006;
increased net sales from
approximately $101.4$205.6 million in fiscal20022005 toapproximately $381.4$478.8 million in fiscal2007,2010, representing a compound annual growth rate of30.3%18.4%;•increased operating profit from $7.0 million in fiscal 2002 to $38.9 million in fiscal 2007, representing a compound annual growth rate of 40.9% and•been profitable in every fiscal year of our
2932 year history.Competitive Strengths
We believe that the following competitive strengths differentiate us from our competitors and are critical to our continuing success.
Attractive Lifestyle Retailing Concept. We target a large population of 12 to 24 year olds, many of whom we believe are attracted to the action sports lifestyle and desire to promote their personal independence and style through the apparel, shoes and accessories they wear and the equipment they use. We believe that action sports
areis a permanentand growingaspect of youth culture, reaching not only consumers that actually participate in action sports, but also those who seek brands and styles that fit a desired action sports image. We believe we have developed a brand image that our customers view as consistent with their attitudes, fashion tastes and identity that should allow us to benefitfromin ourmarket's anticipated growth.market.��Differentiated Merchandising Strategy. We have created a highly differentiated retailing concept by offering an extensive selection of current and relevant action sports brands encompassing apparel, footwear, equipment and accessories. The breadth of merchandise offered at our stores exceeds that offered by many other action sports specialty stores and includes some brands and products that are available within many malls only at our stores. The action sports lifestyle includes activities that are popular atdifferent times throughout the year, providing us the opportunity to shift our merchandise selection seasonally. Many of our customers desire to update their wardrobes and equipment as fashion trends evolve or the action sports season dictates. We believe that our ability to quickly recognize changing brand and style preferences and transition our merchandise offerings allows us to continually provide a compelling offering to our customers.
Deep-rooted
CorporateCulture. Our culture and brand image enable us to successfully attract and retain high quality employees who are passionate and knowledgeable about the products we sell. We place great emphasis on customer service and satisfaction, and we have made this a defining feature of our corporate culture. To preserveour culture, we strive to promote store managers from within and they are given extensive responsibility for most aspects of store level management. We provide these managers with the knowledge and tools to succeed through our comprehensive training programs and the flexibility to manage their stores to meet localized customer demand. Our store leadership at the district manager level and above have all been promoted from within the Zumiez system and their leadership provides unique value and insight to our store managers and sales associates.
Distinctive Store Experience. We strive to provide a convenient shopping environment that is appealing and clearly communicates our distinct brand image. Our stores are designed to reflect an
"organized chaos"“organized chaos” that we believe is consistent with manyteenagers'teenagers’ and young adults’ lifestyles. We seek to attract knowledgeable store associates who identify with the action sports lifestyle and are able to offer superior customer service, advice and product expertise. To further enhance ourcustomers'customers’ experience, most of our stores feature areas with couches and action sports oriented video game stations that are intended to encourage our customers to shop for longer periods of time, to interact with each other and our store associates in a familiar and comfortable setting and to visit our stores more frequently. We believe that our distinctive store environment enhances our image as a leading source for apparel and equipment for the action sports lifestyle.Disciplined Operating Philosophy. We have an experienced senior management team. Our management team has built a strong operating foundation based on sound retail principles that underlie our unique culture. Our philosophy emphasizes an integrated combination of results measurement, training and incentive programs, all designed to drive sales productivity
downto the individual store associate level. Our comprehensive training programs are designed to provide our home office staff, managers and store associates with enhanced product knowledge, selling skills and operational expertise. We believe that our merchandisingteam'steam’s immersion in theactionsaction sports lifestyle, supplemented with feedback from our customers, store associates, store leadership and managers, allows us to consistently identify and react to emerging fashion trends. We believe that this, combined with our inventory planning and allocation processes and systems, helps usmitigatebetter manage markdown and fashion risk.High-Impact, Integrated Marketing Approach. We seek to build relationships with our customers through a multi-faceted marketing approach that is designed to integrate our brand image with the action sports lifestyle. Our marketing efforts focus on reaching our customers in their environment and feature extensive grassroots marketing events, such as the Zumiez Couch Tour, which is a series of interactive sports, music and lifestyle events held at various locations throughout the United States. Our marketing efforts also incorporate local sporting and music event promotions, advertising in magazines popular with our target market, interactive contest sponsorships that actively involve our customers with our brands and
products.products and various social network channels such as Facebook and Twitter. Events and activities such as these provide opportunities for our customers to develop a strong identity with our culture and brand. We believe that our immersion in the action sports lifestyle allows us to build credibility with our customers and gather valuable feedback on evolving customer preferences.Growth Strategy
We intend to expand our presence as a leading action sports lifestyle retailer by:
Opening New Store Locations. We believe that the action sports lifestyle has
nationalappeal that provides store expansion opportunities throughout thecountry.country and internationally. Sincethe end of fiscal 2003January 28, 2006 throughthe year ended February 2, 2008 (fiscal 2007)January 29, 2011, we have opened or acquired174233 new stores consisting of27 new stores in fiscal 2004, 35 new stores in fiscal 2005, 42 new62 stores in fiscal 2006,and50newstores in fiscal2007. We also acquired 100% of the ownership of 202007, 58 stores(17inTexas, 2fiscal 2008, 36 stores inOklahomafiscal 2009 and127 stores inCalifornia) from Action Concepts Fast Forward, Ltd. (a limited partnership) ("Fast Forward"), an apparel and accessory retail sales company.fiscal 2010. We have successfully opened stores in diverse markets throughout the United States, which we believe demonstrates the portability and growth potential of our concept.We plan to open approximately 57 stores in fiscal 2008, including stores in our existing markets and in new markets, toTo take advantage of what we believe to be a compelling economic storemodel. Wemodel, we plan tocontinue to increaseopen approximately 44 stores in fiscal 2011, including stores in our existing markets, in new markets domestically and thesizeplanned opening of ouraveragefirst international stores in Canada. The number of anticipated storeby opening new store locations that average approximately 3,000 square feet. These larger locations will accommodate an expanded merchandise mix, while maintaining our unique in-store experience and culture.openings may increase or decrease due to market conditions.Continuing to Generate Sales Growth through Improved Store Level
Productivity.Productivity and Continued Ecommerce Sales Growth. We seek to maximize our comparable store sales, including sales from our ecommerce site, and net sales per square foot by maintaining consistent store-level execution and offering our customers a broad and relevant selection of action sports brands and products. Wealso intendseek to continue toexpandgrow our ecommerce sales with a continued focus on enhancing and integrating the unique Zumiez brandawareness in an effort to maintain high levelsexperience through this channel. In fiscal years 2010, 2009 and 2008, ecommerce sales represented 4.7%, 2.5% and 1.7% ofcustomer traffic.our total net sales.Enhancing our Brand Awareness through Continued Marketing and Promotion. We believe that a key component of our success is the brand exposure that we receive from our marketing events, promotions and activities that embody the action sports lifestyle. These are designed to assist us in increasing brand awareness in our existing markets and expanding into new markets by strengthening our connection with our target customer base. We believe that our marketing efforts have also been successful in generating and promoting interest in our product offerings. In addition, we use our
internetecommerce presence, designed to convey our passion for the action sports lifestyle, to increase our brand awareness. We plan to continue to expand our integrated marketing efforts by promoting more events and activities in our existing and new markets.The Action Sports MarketWe
believe that action sports are a permanent and growing aspect of youth culture, reaching not only consumers that actually participate in action sports, butalsothose who seek brands and styles that fit a desired action sports image. We believe that teens enjoy shopping in malls and purchasing clothing and fashion-related merchandise.benefit from branded vendors’ marketing.Merchandising and Purchasing
Merchandising.Our goal is to be viewed by our customers, both young men and young women, as the definitive source of merchandise for the action sports lifestyle. We believe that the breadth of merchandise offered at our stores, which includes apparel, footwear, equipment and accessories, exceeds that offered by many other action sports specialty stores at a single location, and makes our stores a single-stop purchase destination for our target customers. Our apparel offerings include tops, bottoms, outerwear and accessories such as caps, bags and backpacks, belts, jewelry and sunglasses. Our footwear offerings primarily consist of action sports related athletic shoes and sandals. Our equipment offerings, or hardgoods, include skateboards, snowboards and ancillary gear such as boots and bindings. We also offer a selection of other items, such as miscellaneous novelties and DVDs.We seek to identify action sports oriented fashion trends as they develop and to respond in a timely manner with a relevant in-store product assortment. We strive to keep our merchandising mix fresh by continuously introducing new brands or styles in response to the evolving desires of our customers. We also take advantage of the change in action sports seasons during the year to maintain an updated product selection. Our merchandise mix may vary by region, reflecting the specific action sports preferences and seasons in different parts of the country.
We believe that offering an extensive selection of current and relevant brands used and sometimes developed by professional action sports athletes is integral to our overall success. No single brand, including private label, accounted for more than 6.5%, 7.1% and
6.6%6.9% of our net sales in fiscal20062010, 2009 andfiscal 2007, respectively.2008. We believe that our strategic mix of both apparel and hardgoods, including skateboards, snowboards, bindings, components and other equipment, allows us to strengthen the potential of the brands we sell and affirms our credibility with our customers.We believe that our ability to maintain an image consistent with the action sports lifestyle is important to our key vendors. Given our scale and market position, we believe that many of our key vendors view us as an important retail partner. This position helps ensure our ability to procure a relevant product assortment and quickly respond to the changing fashion interests of our customers. Additionally, we believe we are presented with a greater variety of products and styles by some of our vendors, as well as certain specially designed items that are only distributed to our stores.
We supplement our merchandise assortment with a select offering of private label products across many of our apparel product categories. Our private label products complement the
branded products we sell, and some of our private label brands allow us to cater to the more value-oriented customer. For fiscal
2005, 2006,2010, 2009 and20072008 our private label merchandise representedapproximately 12.9%18.0%,14.3%15.7% and15.4% respectively,15.0% of our net sales.PurchasingOur merchandising staff consists of a general merchandising manager, planning staff and a staff of buyers and assistant buyers.Our purchasing approach focuses on quality, speed and cost in order to provide timely delivery of merchandise to our stores. We have developed a disciplined approach to buying and a dynamic inventory planning and allocation process to support our merchandise strategy. We utilize a broad vendor base that allows us to shift our merchandise purchases as required to react quickly to changing market conditions. We manage the purchasing and allocation process by reviewing branded merchandise lines from new and existing vendors, identifying emerging fashion trends and selecting branded merchandise styles in quantities, colors and sizes to meet inventory levels established by management. We also coordinate inventory levels in connection with individual store sales strength, our promotions and seasonality. Our management information systems provide us with current inventory levels at each store and for ourcompanyCompany as a whole, as well as current selling history within each store by merchandise classification and by style. We purchase most of our branded merchandise from domestic vendors.Our merchandising staff remains in tune with the action sports culture by participating in action sports, attending relevant events and concerts, watching action sports related programming and reading action sports publications. In order to identify evolving trends and fashion preferences, our staff spends considerable time analyzing sales data by category and brand down to the stock keeping unit, or
"SKU"“SKU” (an identification used for inventory tracking purposes) level, gathering feedback from our stores and customers, shopping in key markets and soliciting input from our vendors. As part of our feedback collection process, our merchandise team receives merchandise requests from both customers and store associates and meets with our store managers two to three times per year to discuss current customer trends.We source our private label merchandise from foreign manufacturers around the world. We have cultivated our private brand sources with a view towards high quality merchandise, production reliability and consistency of fit. We believe that our knowledge of fabric and production costs combined with a flexible sourcing base enables us to source high-quality private label goods at favorable costs.
Distribution and Fulfillment
Timely and efficient distribution of merchandise to our stores is an important component of our overall business strategy.
We process all of our merchandise throughDuring fiscal 2010, we relocated our distribution centerinfrom Everett,Washington.Washington to Corona, California to reduce distribution costs, expand capacity and increase speed of merchandise delivery to our customers. Atthisour Corona, California facility, merchandise is inspected, allocated to stores, ticketed when necessary and boxed for distribution to ourstores or segregated in our e-commerce fulfillment area for delivery to our internet customers.stores. A significant percentage of our merchandise is currently pre-ticketed by our vendors, which allows us to ship merchandise more quickly, reduces labor costs and enhances our inventory management. We continue to work with our vendors to increase the percentage of pre-ticketedmerchandise.merchandise as well as other value added services. Each store is typically shipped merchandise five times a week, providing our stores with a steady flow of new merchandise. We currently use United Parcel Service to ship the majority of our merchandise to our stores. We believe our current distribution infrastructure is sufficient to accommodate our expected store growth and expanded product offerings over the next several years.Stores
As of February 2, 2008Store Locations.At January 29, 2011, we operated285400 storeswith an average of approximately 2,900 square feet per storein2737 states. All of our stores are leased and substantially all are located in shopping malls of different types.All references in this Annual Report on Form 10-K to square footage of our stores refers to gross square footage, including retail selling, storage and back-office space.The following store list shows the number of stores we operated in each state
as of February 2, 2008:at January 29, 2011:StateNumber ofStoresAlaska2Arizona11California57Colorado16Connecticut5Delaware1Florida10Iowa1Idaho5Illinois13Indiana1Maryland3Minnesota10Montana4New Jersey14Nevada7New Mexico4New York30Oklahoma2Oregon11Pennsylvania10South Dakota1Texas25Utah11Washington22Wisconsin7Wyoming2As of February 2, 2008 approximately 78.2%State
Number of
StoresPercent of
Total StoresAlaska
3 0.7 % Arizona
13 3.3 % California
75 18.7 % Colorado
18 4.5 % Connecticut
8 2.0 % Delaware
2 0.5 % Florida
16 4.0 % Hawaii
1 0.2 % Iowa
2 0.5 % Idaho
6 1.5 % Illinois
16 4.0 % Indiana
7 1.8 % Kansas
3 0.7 % Maine
1 0.2 % Maryland
8 2.0 % Massachusetts
7 1.8 % Michigan
2 0.5 % Minnesota
11 2.8 % Missouri
2 0.5 % Montana
4 1.0 % New Jersey
16 4.0 % New Hampshire
3 0.7 % Nevada
8 2.0 % New Mexico
5 1.3 % New York
30 7.5 % North Carolina
2 0.5 % Oklahoma
3 0.7 % Oregon
12 3.0 % Pennsylvania
16 4.0 % Rhode Island
1 0.2 % South Dakota
2 0.5 % Texas
41 10.3 % Utah
12 3.0 % Virginia
5 1.3 % Washington
24 6.0 % Wisconsin
13 3.3 % Wyoming
2 0.5 % Total Number of Stores
400 100.0 % Approximately 63% of our stores
hadhave been opened or remodeled within the previous five fiscal years. The following table shows the number of stores (excluding temporary stores that we operate from time to time for special events) opened and closed in each of our last five fiscal years including 20 stores acquired in the fiscal 2006 Fast Forwardacquisition (we closed one Fast Forward store in fiscal 2006):acquisition:Fiscal Year Stores
OpenedStores
AcquiredStores
ClosedTotal Number of
Stores End of Year2003 15 1 113 2004 27 — 140 2005 35 1 174 2006 42 20 1 235 2007 50 — 285 Fiscal Year Stores
OpenedStores
AcquiredStores
ClosedTotal Number of
Stores End of Year2010 27 — 4 400 2009 36 — 2 377 2008 58 — — 343 2007 50 — — 285 2006 42 20 1 235 Store Design and Environment.We design our stores to create a distinctive and engaging shopping environment that we believe resonates with our customers and it reflects an
"organized chaos"“organized chaos” that is consistent with manyteenagers'teenagers’ and young adults’ lifestyles. Our stores feature an industrial look with concrete floors and open ceilings, dense merchandise displays, action sports focused posters and signage and popular music, all of which are consistent with the look and feel of an independent action sports specialty shop. Most of our stores have couches and action sports oriented video game stations that are intended to encourage our customers to shop for longer periods of time, to interact with each other and our store associates and to visit our stores more frequently. Our stores are constructed and finished to allow us to efficiently shift merchandise displays throughout the year as the action sports season dictates.To further enhance our customers' experience, we seek to attract enthusiastic store associates who are knowledgeable about our products and are able to offer superior customer service and expertise.We believe that our store atmosphere enhances our image as a leading provider of action sports lifestyle merchandise.As of February 2, 2008At January 29, 2011, our stores averaged approximately 2,900 square feet.We have been,All references in this Annual Report on Form 10-K to square footage of our stores refers to gross square footage, including retail selling, storage and back-office space. In fiscal 2011, we planto continue,on opening new storesthat average approximately 3,000with squarefeet, slightly larger thanfootage similar to this average. New stores’ size is determined by ourhistorical average size. Theseexpected sales volume; for instance, if we project higher sales, we generally try to build larger storesare intendedand, conversely, if we believe stores will be lower volume stores we generally try toenable us to offer an expanded merchandise selection while maintaining our distinctive store environment.build smaller stores.Expansion Opportunities and Site Selection.
Since the end of fiscal 2003, we have opened 174 stores, including 20 acquired in fiscal 2006 through the Fast Forward acquisition, to enhance our position in existing markets, to enter into new markets, to build our brand awareness and to capitalize on our successful store model. We plan to open 57 new stores in fiscal 2008 and to continue to open a significant number of new stores in future years. Our new store openings are planned in both existing and new markets.In selecting a location for a new store, we target high-traffic mall space with suitable demographics and favorable lease terms. We seek locations near busy areas of the mall such as food courts, movie theaters, music or game stores and other popular teen retailers. We generally locate our stores in malls in which other teen-oriented retailers have performed well. We also focus on evaluating the market and mall-specific competitive environment for potential new store locations. We seek to diversify our store locations regionally and by caliber of mall. We have currently identified a
significantnumber of potential sites for new stores in malls with appropriate market characteristics.We have successfully and consistently implemented our store concept across a variety of mall classifications and geographic locations. Our
6136 newand acquiredstores openedduringin fiscal2006, including 19 stores, net, acquired from Fast Forward,2009 generated average net sales of approximately$1.2$0.9 million per store in fiscal 2010 during their first full year ofoperations. On average, our net investment to open the 42 newoperation. In fiscal 2010, we opened 27 storeswas approximately $314,000 which includes capital expenditures, net of landlordcontributions. We opened 50 new stores in fiscal 2007with an average net capital investment of approximately$330,000 which includes$0.2 million per store by negotiating favorable terms with our construction contractors and obtaining tenant improvement allowances from landlords. In addition to capitalexpenditures, netinvestments, we make working capital investments between $0.1 million and $0.2 million per store consisting primarily oflandlord contributions.merchandise inventory. However, ournetcapital investment to open new stores and net sales generated by new stores vary significantly and depend on a number of factors, including manager and sales associate competency and tenure, the geographic location, type of mall, sales volume of the mall andsizesquare footage of those stores. Accordingly, net sales and other operating results for stores that we open or have opened subsequent to the end of fiscal2007,2010, as well as our net capital investment to open those stores, may differ substantially from net sales and other operating results and our net capital investment for the stores we opened infiscal 2007.prior years.Store Management, Operations and Training. We believe that our success is dependent in part on our ability to attract, train, retain and motivate qualified employees at all levels of our organization. We have developed a corporate culture that we believe empowers the individual store managers to make store-level business decisions and consistently rewards their success. We are committed to improving the skills and careers of our workforce and providing advancement opportunities for employees, as evidenced by a significant number of our store managers that began their careers with us as store associates.
Our store operations are currently organized into divisions, regions and districts. Each division is managed by a divisional manager, responsible for approximately one third of our stores. Each region is managed by a regional manager, responsible for approximately 50 stores. We employ one district
salesmanager per district, responsible for the sales and operations of approximately 10 stores. Each of our stores is typically staffed with one store manager, one or more assistant managers and two or more store associates, depending on theseason.season and sales volume of the store. The number of store associates we employ generally increases during peak selling seasons, particularly the back-to-school and the winter holiday seasons, and will increase to the extent that we open new stores.We believe we provide our managers with the knowledge and tools to succeed through our comprehensive training programs and the flexibility to manage their stores to meet customer demands. While general guidelines for our merchandise assortments, store layouts and in-store visuals are provided by our home office, we give our store managers and district managers substantial discretion to tailor their stores to the individual market and empower them to make store-level business decisions. We design group training programs for our managers, such as our
"Zumiez“Zumiez Managers Retreat,"” and “Rocktober,” to improve both operational expertise and supervisory skills. Our comprehensive training programs are offered at the store, regional and national levels. Our programs allow managers from all geographic locations to interact with each other and exchange ideas to better operate stores. Ourregional,store, district, andstoreregional managers are compensated in part based on the sales volume of the store or stores they manage.Our store associates generally have an interest in the action sports lifestyle and are knowledgeable about our products. Through our training, evaluation and incentive programs, we seek to enhance the productivity of our store associates. Our store associates receive extensive training from their managers to improve their product expertise and selling skills. We evaluate our store associates weekly on measures such as sales per hour,
itemsunits per transaction and dollars per transaction to ensure consistent productivity, to reward top performers and to identify potential training opportunities. We provide sales incentives for store associates such as sales-based commissions in addition to hourly wages and our annual"Zumiez 100K"“Zumiez 100K” event, which recognizes outstanding sales performance in a resort setting that combines recreation and education. These and other incentive programs are designed to promote a competitive, yet fun, corporate culture that is consistent with the action sports lifestyle we seek to promote.Internet Operations.Our website provides current information on our upcoming events and promotions, store locations and merchandise selection. We also sell products directly through our website, although internet sales currently comprise a small portion of our overall net sales. In fiscal years 2005, 2006, and 2007 internet sales represented approximately 1% of our total net sales. With respect to the freight component of our internet sales, we arrange and pay the freight for ourcustomers and bill them for this service. Such amounts billed are included in revenue and the related freight cost is charged to cost of goods sold.Marketing and Advertising
We seek to reach our target customer audience through a multi-faceted marketing approach that is designed to integrate our brand image with the action sports lifestyle. Our marketing efforts focus on reaching our customers in their environment, and feature extensive grassroots marketing events,
such as the Zumiez Couch Tour,which give our customers an opportunity to experience and participate in the action sports lifestyle.Our marketing efforts also incorporate local sporting and music event promotions, advertising in magazines popular with our target market such as Transworld Snowboarding and Transworld Skateboarding, interactive contest sponsorships that actively involve our customers with our brands and products. We believe that our immersion in the action sports lifestyle allows us to build credibility with our target audience and gather valuable feedback on evolving customer preferences.Our grassroots marketing events are built around the demographics of our customer base and offer an opportunity for our customers to develop a strong identity with our brand and culture. For example, the Zumiez Couch Tour is a series of entertainment events that includes skateboarding demonstrations from top professionals, autograph sessions, competitions and live music, and has featured some of
today'stoday’s most popularteenagepersonalities in action sports and music. The Zumiez Couch Tour provides a high-impact platform where customers can interact with some of their favorite action sports athletes and vendors can showcase new products. In2007fiscal 2010, our Zumiez Couch Tour completed atwelve citytwelve-city tour across the United States.Advertising expense was approximately, $250,000, $651,000Our marketing efforts also incorporate local sporting and
$748,000music event promotions, advertising infiscal 2005, 2006magazines popular with our target market, interactive contest sponsorships that actively involve our customers with our brands and2007, respectively. The marketing expense increaseproducts and various social network channels such as Facebook and Twitter. We believe that our immersion infiscal 2007 over fiscal 2006 of approximately $97,000 was primarily duethe action sports lifestyle allows us tosignage associatedbuild credibility withthe increase in new store openings of an additional 8 stores in fiscal 2007 over fiscal 2006our target audience andadditional costs to support fiscal 2007 marketing initiatives.gather valuable feedback on evolving customer preferences.Management Information Systems
Our management information systems provide integration of store, merchandising, distribution, financial and human resources functions. The systems include applications related to point-of-sale, inventory management, supply chain, planning, sourcing, merchandising and financial reporting. We
use software licensed from ANT USA for merchandise planningcontinue to invest in technology to align our systems with our business requirements andsoftware licensed from Epicor CRS, that is used for SKU and classification inventory tracking, purchase order management, merchandise distribution, automated ticket making and sales audit functions. Our financial systems are licensed from SAGE and are used for general ledger, accounts payable, payroll, budgeting, financial reporting and asset management.Sales are updated daily into support ourmerchandising reporting systems by polling sales information from each store's point-of-sale, or "POS," terminals. Our POS system consists of registers providing processing of retail transactions, price look-up, time and attendance and e-mail. Sales information, inventory tracking and payroll hours are uploaded to our central host system. The host system downloads price changes, performs system maintenance and provides software updates to the stores through automated nightly two-way electronic communication with each store. We evaluate information obtained through nightly polling to implement merchandising decisions, including product purchasing/reorders, markdowns and allocation of merchandise on a daily basis.continuing growth.In addition to our home office staff, each of our regional and district managers can access relevant business information, including current and historical sales by store, district and region, transaction information and payroll data.Competition
The teenage and young adult retail apparel, hardgoods and accessories industry is highly competitive. We compete with other retailers for vendors, teenage and young adult customers, suitable store locations and qualified store associates and management personnel. In the softgoods markets, which includes apparel, accessories and footwear, we currently compete with other teenage-focused retailers such as Abercrombie & Fitch,
Co.,Aeropostale,Inc.,American Apparel, American Eagle Outfitters,Inc., Anchor Blue Clothing Company, Charlotte Russe Inc., Claire's Stores, Inc.,Boathouse, CCS, Forever 21,Inc.,Hollister,Co.,Hot Topic,Inc.,Old Navy,Inc.,Pacific Sunwear of California,Inc.,The Buckle,Inc.,The Wet Seal,Inc. andTillys, Urban OutfittersInc.and West 49. In addition, in the softgoods markets we compete with independent specialty shops, department stores and direct marketers that sell similar lines of merchandise and target customers through catalogs ande-commerce.ecommerce. In the hardgoods markets, which includes skateboards, snowboards, bindings, components and other equipment, we compete directly or indirectly with the following categories of companies: other specialty retailers that compete with us across a significant portion of our merchandising categories, such as local snowboard and skate shops; large-format sporting goods stores and chains, such as Big 5 Sporting Goods Corporation,Dick'sDick’s Sporting Goods,Inc.,Sport ChaletInc.and The Sports AuthorityInc.,andInternetecommerce retailers.Competition in our sector is based on, among other things, merchandise offerings, store location, price and the ability to identify with the customer. We believe that we compete favorably with many of our competitors based on our differentiated merchandising strategy, compelling store environment and deep-rooted culture. However, some of our competitors are larger than we are and have substantially greater financial, marketing and other resources than we do. See
"Item“Item 1A Risk Factors."” We may be unable to compete favorably in the highly competitive retail industry, and if we lose customers to our competitors, our sales could decrease."Seasonality
Historically, our operations have been seasonal, with the largest portion of net sales and net income occurring in the third and fourth fiscal quarters, reflecting increased demand during the back-to-school and winter holiday selling seasons. During fiscal 2010, approximately 61% of our net sales occurred in the third and fourth quarters, similar to previous years. As a result of this seasonality, any factors negatively affecting us during the last half of the year, including unfavorable economic conditions, adverse weather or our ability to acquire seasonal merchandise inventory, could have a material adverse effect on our financial condition and results of operations for the entire year. Our quarterly results of operations may also fluctuate based upon such factors as the timing of certain holiday seasons, the popularity of seasonal merchandise offered, the timing and amount of markdowns, store remodels and closings, competitive influences and the number and timing of new store openings.
Trademarks
"Zumiez," "Free World," "ALab", "Tricycle",The “Zumiez” trademark and"Limelight"certain other trademarks, have been registered, or areamong our trademarks registeredthe subject of pending trademark applications, with the United States Patent and TrademarkOffice.Office and with the registries of certain foreign countries. We regard our trademarks as valuable and intend to maintain such marks and any relatedregistrations. We currently have trademarks pending for the "Empyre", "Rälik", "Aperture", 100K, Best Foot Forward, Couch Tour, Zumiez 100K, Zumiez Couch Tourregistrations and"Alibi" marks. We are not aware of any claims of infringement or other challenges to our right to use our marks in the United States. Wevigorously protect our trademarks. We also own numerous domain names, which have been registered with Corporation for Assigned Names and Numbers.Employees
As of February 2, 2008At January 29, 2011, we employed approximately1,5001,380 full-time and approximately1,8003,460 part-time employees, of which approximately400440 were employed at our home office, distribution center and ecommerce fulfillment center and approximately2,9004,400 at our store locations. However, the number of part-time employees fluctuates depending on our seasonal needs and, in fiscal2007,2010, varied from between approximately1,5003,000 and2,9005,400 part-time employees. None of our employees are represented by a labor union and we believe generally that our relationship with our employees is good.Available Information
Our principal website address is www.zumiez.com. We make available,
at this address under investor relations,free of charge, our proxy statement, annual report to shareholders, annual report on Form 10-K, quarterly reports on Form 10-Q, current reports on Form 8-K, and all amendments to those reports as soon as reasonably practicable after such material is electronically filed with or furnished to the SEC at http://ir.zumiez.com. Information available on our website is not incorporated by reference in and is not deemed a part of this Form 10-K.Item 1A. RISK FACTORS Investing in our securities involves a high degree of risk. The following risk factors, issues and uncertainties should be considered in evaluating our future prospects. In particular, keep these risk factors in mind when you read
"forward-looking"“forward-looking” statements elsewhere in this report. Forward-looking statements relate to our expectations for future events and time periods. Generally, the words"anticipate," "believe," "expect," "intend"“anticipate,” “believe,” “expect,” “intend” and similar expressions identify forward-looking statements.Forward—lookingForward-looking statements involve risks and uncertainties, and future events and circumstances could differ significantly from those anticipated in theforward—lookingforward-looking statements. Any of the following risks could harm our business, operating results or financial condition and could result in a complete loss of your investment. Additional risks and uncertainties that are not yet identified or that we currently think are immaterial may also harm our business and financial condition in the future.Significant fluctuations and volatility in the price of cotton, foreign labor costs and other raw materials used in the production of our merchandise may have a material adverse effect on our business, results of operations and financial conditions.
Increases in the cost of cotton, foreign labor costs or other raw materials used in the production of our merchandise can result in higher costs in the price we pay for this merchandise. The costs for cotton are affected by weather, consumer demand, speculation on the commodities market and other factors that are generally unpredictable and beyond our control. Our gross profit and earnings per share could be adversely affected to the extent that the selling prices of our products do not increase proportionately with the increases in the costs of cotton or other materials. Increasing labor costs and oil-related product costs, such as manufacturing and transportation costs, could also adversely impact gross profit. Additionally, significant changes in the relationship between carrier capacity and shipper demand could increase transportation costs, which could also adversely impact gross profit.
We are aware of increasing cotton, oil and other input costs that affect our cost of goods sold. We are working with our vendors and private label manufacturers to manage these cost increases. Our current expectation is that increases in product cost will be higher in the second half of 2011 versus the first half. While we believe we have strategies in place to mitigate the increase in cost, there can be no assurance our efforts will be successful and our gross profit margins may decline.
Most of our merchandise is produced by foreign manufacturers; therefore, the availability and costs of these products may be negatively affected by risks associated with international trade and other international conditions.
Most of our merchandise is produced by manufacturers around the world. Some of these facilities are located in regions that may be affected by natural disasters, political instability or other conditions that could cause a disruption in trade. Trade restrictions such as increased tariffs or quotas, or both, could also affect the importation of merchandise generally and increase the cost and reduce the supply of merchandise available to us. Any reduction in merchandise available to us or any increase in its cost due to tariffs, quotas or local issues that disrupt trade could have a material adverse effect on our results of operations. Although the prices charged by vendors for the merchandise we purchase are primarily denominated in United States dollars, a continued decline in the relative value of the United States dollar to foreign currencies could lead to increased merchandise costs, which could negatively affect our competitive position and our results of operation.
Our ability to attract customers to our stores depends heavily on the success of the shopping malls in which our stores are located; any decrease in customer traffic in those malls could cause our sales to be less than expected.
In order to generate customer traffic we depend heavily on locating our stores in prominent locations within successful shopping malls. Sales at these stores are derived, in part, from the volume of traffic in those malls. Our stores benefit from the ability of a mall’s other tenants to generate consumer traffic in the vicinity of our stores and the continuing popularity of malls as shopping destinations. Our sales volume and mall traffic generally may be adversely affected by, among other things, economic downturns in a particular area, competition from ecommerce retailers, non-mall retailers and other malls, increases in gasoline prices and the closing or decline in popularity of other stores in the malls in which we are located. An uncertain economic outlook could curtail new shopping mall development, decrease shopping mall traffic, reduce the number of hours that shopping mall operators keep their shopping malls open or force them to cease operations entirely. A reduction in mall traffic as a result of these or any other factors could have a material adverse effect on our business, results of operations and financial condition.
Our growth strategy depends on our ability to open and operate
a significant number ofnew stores each year, which could strain our resources and cause the performance of our existing stores to suffer.Our growth largely depends on our ability to open and operate new stores successfully. However, our ability to open new stores is subject to a variety of risks and uncertainties, and we may be unable to open new stores as planned, and any failure to successfully open and operate new stores would have a material adverse effect on our results of
operations and on the market price of our common stock.operations. We intend to continue to opena significant number ofnew stores in future years while remodeling a portion of our existing store base annually. In addition, our proposed expansion will place increased demands on our operational, managerial and administrative resources. These increased demands could cause us to operate our business less effectively, which in turn could cause deterioration in the financial performance of our individual stores and our overall business. To the extent our new store openings are in markets where we already have stores, we may experience reduced net sales in existing stores in those markets. In addition, successful execution of our growth strategy may require that we obtain additional financing, and we cannot assure you that we will be able to obtain that financing on acceptable terms or at all.If we fail to effectively execute our expansion strategy, we may not be able to successfully open new store locations in a timely manner, if at all, which could have an adverse affect on our net sales and results of operations.
Our ability to open and operate new stores successfully depends on many factors, including, among others, our ability to:
•identify suitable store locations, the availability of which is outside of our control;
•negotiate acceptable lease terms, including desired tenant improvement allowances;
•source sufficient levels of inventory at acceptable costs to meet the needs of new stores;
•hire, train and retain qualified store personnel;
•successfully integrate new stores into our existing operations; and
•identify and satisfy the merchandise preferences of new geographic areas.
In addition, many of our planned new stores are to be opened in regions of the United States or international locations in which we currently have few, or no, stores. The expansion into these markets may present competitive, merchandising and distribution challenges that are different from those currently encountered in our existing markets. Any of these challenges could adversely affect our business and results of operations.
The expansion of our store base to Canada may present increased risks due to our limited familiarity with that market.
In fiscal 2011, we plan to open store locations in Canada. The Canadian market may have different competitive conditions, consumer tastes and discretionary spending patterns than our existing markets. As a result, new stores in that market may be less successful than our stores in the United States. Additionally, consumers in the Canadian market may not be familiar with our brand, and we may need to build brand awareness in that market. Furthermore, we have limited experience with the legal and regulatory environments and market practices outside of the United States and cannot guarantee that we will be able penetrate or successfully operate in the Canadian market. We may also incur additional costs in complying with applicable Canadian laws and regulations as they pertain to both our products and our operations.
Our business is dependent upon our being able to anticipate, identify and respond to changing fashion trends, customer preferences and other fashion-related factors; failure to do so could have a material adverse effect on us.
Customer tastes and fashion trends in the action sports lifestyle market are volatile and tend to change rapidly. Our success depends on our ability to effectively anticipate, identify and respond to changing fashion tastes and consumer preferences, and to translate market trends into appropriate, saleable product offerings in a timely manner. If we are unable to successfully anticipate, identify or respond to changing styles or trends and misjudge the market for our products or any new product lines, our sales may be lower than predicted and we may be faced with a substantial amount of unsold inventory or missed opportunities. In response to such a situation, we may be forced to rely on markdowns or promotional sales to dispose of excess or slow-moving inventory, which could have a material adverse effect on our results of operations.
Our ability to attract customers to our stores depends heavily onThe current uncertainty surrounding thesuccess of the shopping mallsUnited States economy coupled with cyclical economic trends inwhich our stores are located; any decrease in customer traffic in those malls could cause our sales to be less than expected.In order to generate customer traffic we depend heavily on locating our stores in prominent locations within successful shopping malls. Sales at these stores are derived, in part, from the volume of traffic in those malls. Our stores benefit from the ability of a mall's other tenants to generate consumer traffic in the vicinity of our stores and the continuing popularity of malls as shopping destinations. Our sales volume and mall traffic generally may be adversely affected by, among other things, economic downturns in a particular area, competition from Internet retailers, non-mall retailers and other malls, increases in gasoline prices and the closing or decline in popularity of other stores in the malls in which we are located. A reduction in mall traffic as a result of these or any other factorsaction sports retailing could have a material adverse effect on ourbusiness,results of operations.The action sports retail industry historically has been subject to substantial cyclicality. As economic conditions in the United States change, the trends in discretionary consumer spending become unpredictable and discretionary consumer spending could be reduced due to uncertainties about the future. When discretionary
consumer spending is reduced, purchases of action sports apparel and related products may decline. The current uncertainty in the United States economy and increased government debt spending may have a material adverse impact on our results of operations and financial
condition.position.Because of this cycle, we believe the “value” message has become more important to consumers. As a retailer that sells approximately 82% branded merchandise, this trend may negatively affect our business, as we generally will have to charge more than vertically integrated private label retailers.
Our sales and inventory levels fluctuate on a seasonal basis, leaving our operating results particularly susceptible to changes in back-to-school and winter holiday shopping patterns.
Our sales and profitability are typically disproportionately higher in the third and fourth fiscal quarters of each fiscal year due to increased sales during the back-to-school and winter holiday shopping seasons. Sales during these periods cannot be used as an accurate indicator of annual results. Our sales in the first and second fiscal quarters are typically lower than in our third and fourth fiscal quarters due, in part, to the traditional retail slowdown immediately following the winter holiday season.
Any significant decrease in salesAs a result of this seasonality, any factors negatively affecting us during theback-to-school and winter holiday seasons wouldlast half of the year, including unfavorable economic conditions, adverse weather or our ability to acquire seasonal merchandise inventory, could have a material adverse effect on our financial condition and results ofoperations.operations for the entire year. In addition, in order to prepare for the back-to-school and winter holiday shopping seasons, we must order and keep in stock significantly more merchandise than we carry during otherpartstimes of the year. Any unanticipated decrease in demand for our products during these peak shopping seasons could require us to sell excess inventory at a substantial markdown, which could have a material adverse effect on our business, results of operations and financial condition.Our quarterly results of operations are volatile and may decline.
Our quarterly results of operations have fluctuated significantly in the past and can be expected to continue to fluctuate significantly in the future. As discussed above, our sales and operating results are typically lower in the first and second quarters of our fiscal year due, in part, to the traditional retail slowdown immediately following the winter holiday season. Our quarterly results of operations are affected by a variety of other factors, including:
•the timing of new store openings and the relative proportion of our new stores to mature stores;
•whether we are able to successfully integrate any new stores that we acquire and the presence
ofor absence of any unanticipated liabilities in connection therewith;•fashion trends and changes in consumer preferences;
•calendar shifts of holiday or seasonal periods;
•changes in our merchandise mix;
•timing of promotional events;
•general economic conditions and, in particular, the retail sales environment;
•actions by competitors or mall anchor tenants;
•weather conditions;
•the level of pre-opening expenses associated with our new stores; and
•inventory shrinkage beyond our historical average rates.
Failure to successfully integrate any businesses or stores that we acquire could have an adverse impact on our results of operations and financial performance.
We may from time to time acquire other retail stores, individually or in groups, or businesses.
In particular, in June 2006 we completed the acquisition of the Fast Forward an apparel and accessory retail sales company.We may experience difficulties in assimilating any stores or businesses we may acquire and any such acquisitions may also result in the diversion of our capital and ourmanagement'smanagement’s attention from other business issues and opportunities. We may not be able to successfully integrate any stores or businesses that we may acquire, including their facilities, personnel, financial systems, distribution, operations and general operating procedures. If we fail to successfully integrate acquisitions or if such acquisitions fail to provide the benefits that we expect to receive, we could experience increased costs and other operating inefficiencies, which could have an adverse effect on our results of operations and financial performance.Our business is susceptible to weather conditions that are out of our control including the potential risks of unpredictable weather patterns, including any weather patterns associated with naturally occurring global
warming,climate change, and the resultant unseasonable weather could have a negative impact on our results of operations.Our business is susceptible to unseasonable weather conditions. For example, extended periods of unseasonably warm temperatures (including any weather patterns associated with global
warming)warming and cooling) during the winter season or cool weather during the summer season could render a portion of our inventory incompatible with those unseasonable conditions. These prolonged unseasonable weather conditions, particularly in regions of the United States where we have a concentration of stores, could have a material adverse effect on our business and results of operations.We may be unable to compete favorably in the highly competitive retail industry, and if we lose customers to our competitors, our sales could decrease.
The teenage and young adult retail apparel, hardgoods and accessories industry is highly competitive. We compete with other retailers for vendors, teenage and young adult customers, suitable store locations, qualified store associates and management personnel. In the softgoods market, which includes apparel, accessories and footwear, we currently compete with other teenage-focused retailers. In addition, in the softgoods market we compete with independent specialty shops, department stores and direct marketers that sell similar lines of merchandise and target customers through catalogs and
e-commerce.ecommerce. In the hardgoods market, which includes skateboards, snowboards, bindings, components and other equipment, we compete directly or indirectly withthe following categories of companies:other specialty retailers that compete with us across a significant portion of our merchandising categories, such as local snowboard and skate
shops;shops, large-format sporting goods stores and chains andInternetecommerce retailers.Some of our competitors are larger than we are and have substantially greater financial, marketing, including advanced ecommerce marketing capabilities, and other resources than we do. Direct competition with these and other retailers may increase significantly in the future, which could require us, among other things, to lower our prices and could result in the loss of our customers. Current and increased competition could have a material adverse effect on our business, results of operations and financial condition.
If we fail to maintain good relationships with vendors or if a vendor is otherwise unable or unwilling to supply us with adequate quantities of their products at acceptable prices, our business and financial performance could suffer.
Our business is dependent on continued good relations with our vendors. In particular, we believe that we generally are able to obtain attractive pricing and other terms from vendors because we are perceived as a desirable customer, and deterioration in our relationship with our vendors would likely have a material adverse effect on our business. We do not have any contractual relationships with our vendors, other than normal course of business purchase orders and, accordingly, there can be no assurance that our vendors will provide us with an
adequate supply or quality of products or acceptable pricing. Our vendors could discontinue selling to us or raise the prices they charge at any time. There can be no assurance that we will be able to acquire desired merchandise in sufficient quantities on terms acceptable to us in the future.
Also,In addition, certain of our vendors sell their products directly to the retail market and therefore compete with us directly and other vendors may decide to do so in the future. There can be no assurance that such vendors will not decide to discontinue supplying their products to us, supply us only less popular orlesserlower quality items, raise the prices they charge us or focus on selling their products directly. In addition, a number of our vendors are smaller, less capitalized companies and are more likely to be impacted by unfavorable general economic and market conditions than larger and better capitalized companies. These smaller vendors may not have sufficient liquidity during economic downturns to properly fund their businesses and their ability to supply their products to us could be negatively impacted. Any inability to acquire suitable merchandise at acceptable prices, or the loss of one or more key vendors, would have a material adverse effect on our business, results of operations and financial condition.If we lose key management or are unable to attract and retain the talent required for our business, our financial performance could suffer.
Our performance depends largely on the efforts and abilities of our senior management, including our Co-Founder and Chairman, Thomas D. Campion, our
President andChief Executive Officer, Richard M. Brooks, ourChief Financial Officer, Trevor S. Lang, our Executive VicePresident and General Merchandising Manager, Lynn K. Kilbourne, our Chief Financial Officer and Chief Administrative Officer, Trevor S. Lang and our Executive Vice President of Stores, Ford K. Wright. None of our employeesexcept Mr. Brooks, has anhave employmentagreementagreements with us and we do not plan to obtain key person life insurance covering any of our employees. If we lose the services of one or more of our key executives, we may not be able to successfully manage our business or achieve our growth objectives. As our business grows, we will need to attract and retain additional qualified management personnel in a timely manner and we may not be able to do so.Our failure to meet our staffing needs could adversely affect our ability to implement our growth strategy and could have a material impact on our results of operations.
Our success depends in part upon our ability to attract, motivate and retain a sufficient number of qualified employees, including divisional managers, regional managers, district managers, store managers and store associates, who understand and appreciate our corporate culture based on a passion for the action sports lifestyle and are able to adequately represent this culture to our customers. Qualified individuals of the requisite caliber, skills and number needed to fill these positions may be in short supply in some areas, and the employee turnover rate in the retail industry is high. Competition for qualified employees could require us to pay higher wages to attract a sufficient number of suitable employees. If we are unable to hire and retain store managers and store associates capable of consistently providing a high level of customer service, as demonstrated by their enthusiasm for our culture and knowledge of our merchandise, our ability to open new stores may be impaired and the performance of our existing and new stores could be materially adversely affected. We are also dependent upon temporary personnel to adequately staff our stores, distribution center and
distributionecommerce fulfillment center particularly during busy periods such as the back-to-school and winter holiday seasons. There can be no assurance that we will receive adequate assistance from our temporary personnel, or that there will be sufficient sources of temporary personnel. Although none of our employees is currently covered by collective bargaining agreements, we cannot guarantee that our employees will not elect to be represented by labor unions in the future, which could increase our labor costs and could subject us to the risk of work stoppages and strikes. Any such failure to meet our staffing needs, any material increases in employee turnover rates, any increases in labor costs or any work stoppages,orinterruptions or strikes could have a material adverse effect on our business or results of operations.Our operations, including our sole distribution center, are concentrated in the western United States, which makes us susceptible to adverse conditions in this region.
Our home office and
sole distributionecommerce fulfillment center are located ina single facilityWashington, our sole distribution center is located inWashington,California and a substantial number of our stores are located inWashington andthe western half of the United States.We also have a substantial number of stores in the New York/New Jersey region and Texas. As a result, our business may be more susceptible to regional factors than the operations of more geographically diversified competitors. These factors include, among others, economic and weather conditions, demographic and population changes and fashion tastes. In addition, we rely on a single distribution center
in Everett, Washingtonto receive, store and distribute the vast majority of our merchandise to all of ourstores and to fulfill our internet sales.stores. As a result, a natural disaster or other catastrophic event, such as an earthquake affectingwestern Washington, in particular, orthe West Coast, could significantly disrupt our operations and have a material adverse effect on our business, results of operations and financial condition.We have relocated our sole distribution center previously located in
general,Everett, Washington to Corona, California to receive, store and distribute the vast majority of our merchandise to all of our retail stores. As a result, events may occur subsequent to the relocation that could significantly disrupt our operations and have a material adverse effect on our business, results of operations and financial condition.We are required to make substantial rental payments under our operating leases and any failure to make these lease payments when due would likely have a material adverse effect on our business and growth plans.
We do not own any of our retail stores or our combined home office and
distributionecommerce fulfillment center, but instead we leaseall ofthese facilities under operating leases. Payments under these operating leases account for a significant portion of our operatingexpenses.expenses and has historically been our third largest expense behind cost of sales and our employee related costs. For example, total rental expense, including additional rental payments (or"percentage rent"“percentage rent”) based on sales of some of the stores, common area maintenance charges and real estate taxes, under operating leases was$22.2$61.8 million,$31.9$58.0 million and$43.5$52.9 million for the fiscal2005, 2006,2010, 2009 and2007 respectively. As of February 2, 20082008. At January 29, 2011, we were a party to operating leases requiring future minimum lease payments aggregatingapproximately $134.1$227.8 million through fiscalyear 20122015 andapproximately $87.5$120.0 million thereafter. In addition, substantially all of our store leases provide for additional rental payments based on sales of the respective stores, as well as common area maintenance charges, and require that we pay real estatetaxes, none of which is includedin the amount of future minimum lease payments.taxes. These amounts generally escalate each year. We expect that any new stores we open will also be leased by us under operating leases, which will further increase our operating lease expenses.Our substantial operating lease obligations could have significant negative consequences, including:
•increasing our vulnerability to general adverse economic and industry conditions;
•limiting our ability to obtain additional financing;
•requiring that a substantial portion of our available cash be applied to pay our rental obligations, thus reducing
•- cash available for other
purposespurposes; and•limiting our flexibility in planning for or reacting to changes in our business or in the industry in which we compete, and placing us at a disadvantage with respect to some of our competitors.
We depend on cash flow from operations to pay our lease expenses and to fulfill our other cash needs. If our business does not generate sufficient cash flow from operating activities, and sufficient funds are not otherwise available to us from borrowings under bank loans or from other sources, we may not be able to service our operating lease expenses, grow our business, respond to competitive challenges or to fund our other liquidity and capital needs, which would have a material adverse effect on
us.our business.The terms of our revolving credit facility impose operating and financial restrictions on us that may impair our ability to respond to changing business and economic conditions. This impairment could have a significant adverse impact on our business.
We
have a $25 million revolvingrenewed and amended our secured creditfacilityagreement with Wells Fargo HSBC Trade Bank, N.A.,which we useon June 10, 2009, and the prior facility agreement was terminated. The credit agreement provides us with a secured revolving credit facility until September 1, 2011 of up to $25.0 million. The secured revolving credit facilityprovides for
inventory financingthe issuance of a standby letter of credit in an amount not to exceed $5.0 million outstanding at any time andother general corporate purposes,with a term not to exceed 365 days. The commercial line of credit provides for the issuance of a commercial letter of credit in an amount not to exceed $10.0 million and with terms not to exceed 120 days. The amount of borrowings available at any time under our secured revolving credit facility is reduced by the amount of standby and commercial letters of credit outstanding at that time. There were no outstanding borrowings under the secured revolving credit facility at January 29, 2011 or January 30, 2010. We had open commercial letters of credit outstanding under our secured revolving credit facility of $0.5 million and $0.6 million at January 29, 2011 and January 30, 2010. The secured revolving credit facility bears interest at the Daily One Month LIBOR rate plus 1.00%. The credit agreement contains a number ofsignificantrestrictions and covenants that generally limit our ability to, among other things, (1) incur additionalindebtedness,debt, (2)enter into certain transactions and (3)undergo a change inownership. In addition, all of our personal property, including our inventory, equipmentownership andfixtures, secure our obligations under the revolving credit agreement. Our(3) enter into certain transactions. The credit agreement also contains financial covenants that require us to meet certain specified financial tests and ratios, including,minimuma maximum net loss not to exceed $10.0 million after taxes on a trailing four-quarter basis provided, that, there shall be added to net incomeafter taxes,all charges for impairment of goodwill and store assets not to exceed $5.0 million in aggregate, and a minimumtotal liabilitiesquick ratio of 1.25. The quick ratio is defined as our cash and near cash equivalents plus certain defined receivables divided bytangible net worththe outstanding borrowings. All of our personal property, including, among other things, our inventory, equipment andminimum quick asset ratio. Our abilityfixtures, has been pledged tocomplysecure our obligations under the credit agreement. We must also provide financial information and statements to our lender. We were in compliance withthese ratios may be affected by events beyond our control.all such covenants at January 29, 2011.A breach of any of these restrictive covenants or our inability to comply with the required financial tests and ratios could result in a default under the credit agreement. If a default occurs, the lender may elect to declare all borrowings outstanding, together with accrued interest and other fees, to be immediately due and payable. If we are unable to repay outstanding borrowings when due, whether at their maturity or if declared due and payable by the lender following a default, the lender has the right to proceed against the collateral granted to it to secure the indebtedness. As a result, any breach of these covenants or failure to comply with these tests and ratios could have a material adverse effect on us. There can be no assurance that we will not breach the covenants or fail to comply with the tests and ratios in our credit agreement or any other debt agreements we may enter into in the future and, if a breach occurs, there can be no assurance that we will be able to obtain necessary waivers or amendments from the lenders.
The restrictions contained in our credit agreement could: (1) limit our ability to plan for or react to market conditions or meet capital needs or otherwise restrict our activities or business plans; and (2) adversely affect our ability to finance our operations, strategic acquisitions, investments or other capital needs or to engage in other business activities that would be in our interest.
Our business could suffer if our ability to acquire financing is reduced or eliminated.
In the current economic environment, we cannot be assured that our borrowing relationship with our lender will continue or that our lender will remain able to support its commitments to us in the future. If our lender fails to do so, then we may not be able to secure alternative financing on commercially reasonable terms, or at all.
Our business could suffer as a result of small parcel delivery services such as United Parcel Service or Federal Express being unable to distribute our merchandise.
We rely upon small parcel delivery services for our product shipments, including shipments to, from and between our stores. Accordingly, we are subject to risks, including employee strikes and inclement weather, which may affect their ability to meet our shipping needs. Among other things, any circumstances that require us to use other delivery services for all or a portion of our shipments could result in increased costs and delayed deliveries and could harm our business materially. In addition, although we have contracts with small parcel delivery services, we and the service providers have the right to terminate these contracts upon
3030-90 days written notice. Although the contracts with these small parcel delivery services provide certain discounts fromthe shipment rates in effect at the time of shipment, the contracts do not limit their ability to raise the shipment rates at any time. Accordingly, we are subject to the risk that small parcel delivery services may increase the rates they charge, that they may terminate their contracts with us, that they may decrease the rate discounts provided to us when an existing contract is renewed or that we may be unable to agree on the terms of a new contract with them, any of which could materially adversely affect our operating results.
Our business could suffer if a manufacturer fails to use acceptable labor practices.
We do not control our vendors or the manufacturers that produce the products we buy from them, nor do we control the labor practices of our vendors and these manufacturers. The violation of labor or other laws by any of our vendors or these manufacturers, or the divergence of the labor practices followed by any of our vendors or these manufacturers from those generally accepted as ethical in the United States, could interrupt, or otherwise disrupt, the shipment of finished products to us or damage our reputation. Any of these, in turn, could have a material adverse effect on our financial condition and results of operations. In that regard, most of the products sold in our stores are manufactured overseas, primarily in Asia and Central America, which may increase the risk that the labor practices followed by the manufacturers of these products may differ from those considered acceptable in the United States.
Additionally, our products are subject to regulation of and regulatory standards set by various governmental authorities with respect to quality and safety. Regulations and standards in this area are currently in place. These regulations and standards may change from time to time. Our inability to comply on a timely basis with regulatory requirements could result in significant fines or penalties, which could adversely affect our reputation and sales. Issues with the quality and safety of merchandise we sell in our stores, regardless of our culpability, or customer concerns about such issues, could result in damage to our reputation, lost sales, uninsured product liability claims or losses, merchandise recalls and increased costs.
Our failure to adequately anticipate a correct mix of private label merchandise may have a material adverse effect on our business.
Sales from private label merchandise accounted for
15.4%18% of our net sales in fiscal2007.2010 and generally carries higher gross margins than our other merchandise. We may take steps to increase the percentage of net sales of private label merchandise in the future, although there can be no assurance that we will be able to achieve increases in private label merchandise sales as a percentage of net sales.Because our private label merchandise generally carries higher gross margins than other merchandise, ourOur failure to anticipate, identify and react in a timely manner to fashion trends with our private label merchandise, would likely have a material adverse effect on our comparable store sales, financial condition and results of operations.Most of our merchandise is produced by foreign manufacturers, therefore the availability and costs of these products may be negatively affected by risks associated with international trade and other international conditions.Most of our merchandise is produced by manufacturers around the world. Some of these facilities are located in regions that may be affected by natural disasters, political instability or other conditions that could cause a disruption in trade. Trade restrictions such as increased tariffs or quotas, or both, could also affect the importation of merchandise generally and increase the cost and reduce the supply of merchandise available to us. Any reduction in merchandise available to us or any increase in its cost due to tariffs, quotas or local issues that disrupt trade could have a material adverse effect on our results of operations. Although the prices charged by vendors for the merchandise we purchase are all denominated in United States dollars, a continued decline in the relative value of the United States dollar to foreign currencies could lead to increased merchandise costs, which could negatively affect our competitive position and our results of operation.If our information systems hardware or software fails to function effectively or does not scale to keep pace with our planned growth, our operations could be disrupted and our financial results could be harmed.
Over the past several years, we have made improvements to our infrastructure and existing hardware and software systems, as well as implemented new systems. If these or any other information systems and software do not work effectively, this could adversely impact the promptness and accuracy of our transaction processing, financial accounting and reporting and our ability to manage our business and properly forecast operating results and cash requirements. To manage the anticipated growth of our operations and personnel, we may need to continue to improve our operational and financial systems, transaction processing, procedures and controls, and in doing so could incur substantial additional expenses that could impact our financial results.
Our inability or failure to protect our intellectual property or our infringement of
other'sother’s intellectual property could have a negative impact on our operating results.We believe that our trademarks and domain names are valuable assets that are critical to our success. The unauthorized use or other misappropriation of our trademarks or domain names could diminish the value of the
Zumiez brand, our store concept, our private label brands or our goodwill and cause a decline in our net sales. Although we have secured or are in the process of securing protection for our trademarks and domain names in a number of countries outside of the United States, there are certain countries where we do not currently have or where we do not currently intend to apply for protection for certain trademarks or at all. Also, the efforts we have taken to protect our trademarks may not be sufficient or effective. Therefore, we may not be able to prevent other persons from using our trademarks or domain names outside of the United States, which also could adversely affect our business. We are also subject to the risk that we may infringe on the intellectual property rights of third parties. Any infringement or other intellectual property claim made against us, whether or not it has merit, could be time-consuming, result in costly litigation, cause product delays or require us to pay royalties or license fees. As a result, any such claim could have a material adverse effect on our operating results.
The effects of war or acts of terrorism could adversely affect our business.
Substantially all of our stores are located in shopping malls. Any threat of terrorist attacks or actual terrorist events, particularly in public areas, could lead to lower customer traffic in shopping malls. In addition, local authorities or mall management could close shopping malls in response to security concerns. Mall closures, as well as lower customer traffic due to security concerns, would likely result in decreased sales. Additionally,
the escalation ofthe armed conflicts in the Middle East, or the threat, escalation or commencement of war or other armed conflict elsewhere, could significantly diminish consumer spending, and result in decreased sales for us. Decreased sales would have a material adverse effect on our business, financial condition and results of operations.The outcome of litigation could have a material adverse effect on our business, and may result in substantial costs and could divert
management'smanagement’s attention.We are involved, from time to time, in litigation incidental to our business including complaints filed by investors. This litigation could result in substantial costs, and could divert
management'smanagement’s attention and resources, which could harm our business. Risks associated with legal liability are often difficult to assess or quantify, and their existence and magnitude can remain unknown for significant periods of time. While we maintain director and officer insurance for litigation surrounding investor lawsuits, the amount of insurance coverage may not be sufficient to cover a claim and the continued availability of this insurance cannot be assured.As a result,We also maintain other forms of insurance that have historically been adequate to address lawsuits; however, there can be no assurance that the actual outcome of pending or future litigation will not have a material adverse effect on our results of operations or financial condition.Our operations expose us to the risk of litigation, which could lead to significant potential liability and costs that could harm our business, financial condition or results of operations.
We employ a substantial number of full-time and part-time employees, a majority of whom are employed at our store locations. As a result, we are subject to a large number of federal and state laws and regulations relating to employment. This creates a risk of potential claims that we have violated laws related to discrimination and harassment, health and safety, wage and hour laws, criminal activity, personal injury and other claims. We are also subject to other types of claims in the ordinary course of our business. Some or all of these claims may give rise to litigation, which could be time-consuming for our management team, costly and harmful to our business.
In addition, we are exposed to the risk of class action litigation. The costs of defense and the risk of loss in connection with class action suits are greater than in single-party litigation claims. Due to the costs of defending against such litigation, the size of judgments that may be awarded against us, and the loss of significant management time devoted to such litigation, we cannot assure you that such litigation will not disrupt our business or impact our financial results.
Our
internetfailure to comply with federal, state or local laws, or changes in these laws, could have an adverse impact on our results of operations and financial performance.Our business is subject to a wide array of laws and regulations. Changes in the regulations, the imposition of additional regulations, or the enactment of any new legislation including those related to health care, taxes, environmental issues and trade, could adversely affect our results of operations or financial condition.
Recent federal health care legislation could increase our expenses.
We are self-insured with respect to our health care coverage and do not purchase third party insurance for the health insurance benefits provided to employees with the exception of pre-defined stop loss, which helps limit the cost of large claims. In March 2010, the Patient Protection and Affordable Care Act (the “Act”) and the Health Care Education Reconciliation Act of 2010 (the “Reconciliation Act”) were signed into law. The Act, as modified by the Reconciliation Act, includes a large number of health care provisions to take effect over four years, including expanded dependent coverage, incentives for businesses to provide health care benefits, a prohibition on the denial of coverage and denial of claims on pre-existing conditions, a prohibition on limits on essential benefits and other expansions of health care benefits and coverage. The costs of these provisions are expected to be funded by a variety of taxes and fees. Some of the taxes and fees, as well as certain health care changes required by these acts, are expected to result, directly or indirectly, in increased health care costs for us. For example, the prohibition on limits on essential benefits (whereas we currently cap health-related benefits) could result in increased costs to us. At this time, we cannot quantify the impact, if any, that the legislation may have on us due to the changing regulatory environment around this legislation and due to the government’s requirement to issue future unknown regulatory rules. There is no assurance that we will be able to absorb and/or pass through the costs of such legislation in a manner that will not adversely impact our results of operations.
Our ecommerce operations subject us to numerous risks that could have an adverse effect on our results of operations.
Although
internetecommerce sales constitute a small, but increasing portion of our overall sales, ourinternetecommerce operations subject us to certain risks that could have an adverse effect on our operational results, including:•diversion of traffic and sales from our stores;
•liability for online content; and
•risks related to the computer systems that operate our website and related support systems, including computer viruses,
andelectronic break-ins and similar disruptions.In addition, risks beyond our control, such as governmental regulation of
the internet,ecommerce, entry of our vendors in theinternetecommerce business in competition with us, online security breaches and general economic conditions specific tothe Internet and online commerceecommerce could have an adverse effect on our results of operations.We have incurred and will continue to incur significant expenses as a result of being a public company, which will negatively impact our financial performance.
We completed our initial public offering in May 2005 and we have incurred and
willcould continue to incur significant legal, accounting, insurance and other expenses as a result of being a public company.The Sarbanes-Oxley Act of 2002, as well as related rulesRules and regulations implemented by Congress, the SEC andThethe NASDAQ Global Select Markethashave required changes in corporate governance practices of public companies. Compliance with these lawsrules and regulations, including compliance with Section 404 of the Sarbanes-Oxley Act as discussed in the following risk factor, have caused and will continue tocould cause us to incur significant costs and expenses, including legal and accounting costs, andhave made and will continue tocould make some compliance activities more time-consuming andcostly. These laws,negatively impact our financial performance. Additionally, these rules and regulationshave mademay make it more expensive for us to obtain director and officer liabilityinsurance, and we have been required to accept reduced policy limits and coverage.insurance. As a result, it may be more difficult for us to attract and retain qualified persons to serve on our board of directors or as officers.As a result of the foregoing, we have incurred and we expect to incur significant legal, accounting, insurance and certain other expenses on an ongoing basis, which will negatively impact our financial performance and could have a material adverse effect on our results of operations and financial condition.Failure to maintain adequate financial and management processes and controls could lead to errors in our financial reporting and could harm our ability to manage our expenses.
Reporting obligations as a public company and our anticipated growth are likely to place a considerable strain on our financial and management systems, processes and controls, as well as on our personnel. In addition, we are required to document and test our internal controls over financial reporting pursuant to Section 404 of the Sarbanes-Oxley Act of 2002 so that our management can certify as to the effectiveness of our internal controls and our independent registered public accounting firm can render an opinion on the effectiveness of our internal control over financial reporting on an annual basis. This process requires us to document our internal controls over financial reporting and to potentially make significant changes thereto, if applicable. As a result, we have incurred and expect to continue to incur substantial expenses to test our financial controls and systems, and we have been and in the future may be required to improve our financial and managerial controls, reporting systems and procedures, to incur substantial expenses to make such improvements and to hire additional personnel. If our management is ever unable to certify the effectiveness of our internal controls or if our independent registered public accounting firm cannot render an opinion on the effectiveness of our internal control over financial reporting, or if material weaknesses in our internal controls are ever identified, we could be subject to regulatory scrutiny and a loss of public confidence, which could have a material adverse effect on our business and our stock price. In addition, if we do not maintain adequate financial and management personnel, processes and controls, we may not be able to accurately report our financial performance on a timely basis, which could cause a decline in our stock price and adversely affect our ability to raise capital.
Changes to accounting rules or regulations could significantly affect our financial results.
Our financial statements are prepared in accordance with accounting principles generally accepted in the United States of America (“GAAP”). New accounting rules or regulations and changes to existing accounting rules or regulations have occurred and may occur in the future. Future changes to accounting rules or regulations, such as changes to lease accounting guidance or a requirement to convert to international financial reporting standards, could negatively affect our results of operations and financial condition through increased cost of compliance.
The security of our databases that contain personal information of our retail customers could be breached, which could subject us to adverse publicity, litigation and expenses. In addition, if we are unable to comply with security standards created by the credit card industry, our operations could be adversely affected.
Database privacy, network security and identity theft are matters of growing public concern. In an attempt to prevent unauthorized access to our network and databases containing confidential, third-party information, we have installed privacy protection systems, devices and activity monitoring on our network. Nevertheless, if unauthorized parties gain access to our networks or databases, they may be able to steal, publish, delete or modify our private and sensitive third-party information. In such circumstances, we could be held liable to our customers or other parties or be subject to regulatory or other actions for breaching privacy rules. This could result in costly investigations and litigation, civil or criminal penalties and adverse publicity that could adversely affect our financial condition, results of operations and reputation. Further, if we are unable to comply with the security standards established by banks and the credit card industry, we may be subject to fines, restrictions and expulsion from card acceptance programs, which could adversely affect our retail operations.
The current uncertainty surrounding the United States economy coupled with cyclical economic trends in action sports retailing could have a material adverse effect on our results of operations.The action sports retail industry historically has been subject to substantial cyclicality. As economic conditions in the United States change, the trends in discretionary consumer spending become unpredictable and discretionary consumer spending could be reduced due to uncertainties about the future. When discretionary consumer spending is reduced, purchases of action sports apparel and related products may decline. A recession in the general economy or continued uncertainties regarding future economic prospects could have a material adverse effect on our results of operations.We may fail to meet analyst expectations, which could cause the price of our stock to decline.
Our common stock is traded publicly and various securities analysts follow our financial results and issue reports on us. These reports include information about our historical financial results as well as
the
analysts'analysts’ estimates of our future performance. Theanalysts'analysts’ estimates are based upon their own independent opinions andare oftencan be different from our estimates or expectations. If our operating results are below the estimates or expectations of public market analysts and investors, our stock price could decline.Recently,In December 2007, asecurities class action litigation and associated derivative lawsuits was brought against us and such actions are frequently brought against other companies following a decline in the market price of their securities. These lawsuits were dismissed with prejudice in March 2009. If our stock price is volatile, we may become involved in this type of litigation in the future. Any litigation could result in substantial costs and a diversion of
management'smanagement’s attention and resources that are needed to successfully run our business.The
trading pricevalue of ourinvestment in marketable securitiesinvestments mayfluctuatefluctuate.We
investhave our excess cash primarily invested indiversified high credit money market accounts, US treasuries, certificates of deposit,state and local municipalbondssecurities, U.S. Treasury securities, U.S. Agency securities andauction rate securities. Thevariable-rate demand notes. These investments have historically been considered very safe investments withveryminimal default rates.However,At January 29, 2011, we had $114.6 million of investments in state and local government securities and variable-rate demand notes, excluding our auction rate security. These securities are not guaranteed by therecentUnited States government and are subject to additional credit risk based upon each local municipality’s tax revenues and financial stability. As a result, we may experience a reduction in value or loss of liquidity of our investments, which may have a negative adverse effect on our results of operations, liquidity and financial condition.The uncertainties in the credit markets have prevented us and other investors from liquidating holdings of auction rate securities in recent auctions for these securities because the amount of securities submitted for sale has exceeded the amount of purchase orders.
We reduced our holdingsAt January 29, 2011, we had $0.9 million, net of $0.1 million temporary impairment, invested in an auction ratesecurities during 2007 throughsecurity that is included in long-term investments on theauction process. As of February 2, 2008, we had $2 million invested in auction rate securities, which are classified as current, available-for-sale marketable securities on ourconsolidated balance sheet.If market liquidity issues continue, weWe mayhaveincur impairment charges on this investment in the future.In addition, we made a $2.0 million equity investment in a manufacturer and expect the value of this investment to increase. However, we do not have control over this investment and it may encounter unanticipated operating issues or negative financial performance that could adversely impact the value of our investment.
A decline in the market price of our stock and our performance may trigger an impairment of the goodwill recorded on the consolidated balance sheets.
Goodwill and other intangible assets with indefinite lives is required to be tested for impairment at least annually or more frequently if management believes indicators of impairment exist. Any reduction in the carrying value of our goodwill as a result of our impairment analysis could result in a non-cash goodwill impairment charge to our statement of operations. A goodwill impairment charge could have a significant impact on earnings and potentially result in a violation of our financial covenants, thereby limiting our ability to secure short-term financing.
Changes to estimates related to our fixed assets, or operating results that are lower than our current estimates at certain store locations, may cause us to incur non-cash impairment charges.
We make certain estimates and projections in connection with impairment analyses for our store locations and other property and equipment. These calculations require us to make a number of estimates and projections of future results. If these
investmentsestimates orhaveprojections change or prove incorrect, we may be required toreclassify them from short-term assets to long-term assets.record impairment charges on certain store locations and other property and equipment. If these impairment charges are significant, our operating results would be adversely affected and our bank covenants may be violated.Item 1B. UNRESOLVED STAFF COMMENTSUNRESOLVED STAFF COMMENTS None.
None.Item 2. PROPERTIESPROPERTIES All of our stores, primarily located in shopping malls and encompassing approximately 1,174,000 total square feet at January 29, 2011, are occupied under operating leases.
In early February 2005, we completed our move from the 49,000 square foot combined home office and distribution center that we occupied since 1994 to a newWe lease an 87,350 square foot combined home office and
distributionecommerce fulfillment centerbothin Everett, Washington. This lease expires in 2017.In
October, 2006fiscal 2010, weentered intoacquired anew lease agreement whereby168,450 square foot building in Corona, California that serves as our warehouse and distribution facility. Additionally, in fiscal 2010, weagreed to expand our existing lease of 87,350acquired approximately 253,500 square feet of land in Lynnwood, Washington, which we plan to use as the location of our new home officeand distribution center space by 37,350 square feet, bringing the aggregate square footage leased to 124,700 square feet effective January 1, 2007. The new lease agreement terminated and replaced the original February 2005 lease with the landlord. The new lease agreement provides for an initial lease term of 126 months within which we have an option to extend the lease term for an additional period of five years.starting in 2012.All of our stores, encompassing approximately 829,000 total square feet as of February 2, 2008 are occupied under operating leases. The store leases range for a term of five to ten years and we are generally responsible for payment of property taxes and utilities, common area maintenance and marketing fees.Item 3. LEGAL PROCEEDINGS We are involved from time to time in litigation incidental to our business. We believe that the outcome of current litigation is not expected to have a material adverse effect on our results of operations or financial condition.
See Note
89 to the Notes to Consolidated Financial Statements found in Part IV Item8 of Part II15 of this Form 10-K (listed under"Litigation"“Litigation” under Commitments and Contingencies).Item 4. (REMOVED AND RESERVED) Item 4. SUBMISSION OF MATTERS TO A VOTE OF SECURITY HOLDERS
PART IINo matters were submitted to a vote of security holders during the fourth quarter ended February 2, 2008.Item 5. MARKET FOR REGISTRANT’S COMMON EQUITY, RELATED STOCKHOLDER MATTERS AND ISSUER PURCHASES OF EQUITY SECURITIES Item 5. MARKET FOR REGISTRANT'S COMMON EQUITY, RELATED STOCKHOLDER MATTERS AND ISSUER PURCHASES OF EQUITY SECURITIESa)Market InformationOur common stock has traded on the NASDAQ Global Select Market under the symbol
"ZUMZ". As of February 2, 2008“ZUMZ.” At January 29, 2011, there were29,002,85230,834,713 shares of common stockissued. We began trading on the NASDAQ Stock Market on May 6, 2005. Accordingly, no information prior to this date is available.outstanding. The following table sets forth theApril 20, 2006 stock split adjustedhigh and lowlast reportedsales prices for our common stock on the NASDAQ Global Select Market for fiscal 2010 and fiscal 2009.Fiscal 2010
High Low First Fiscal Quarter (January 31, 2010—May 1, 2010)
$ 22.53 $ 12.54 Second Fiscal Quarter (May 2, 2010—July 31, 2010)
$ 19.79 $ 14.98 Third Fiscal Quarter (August 1, 2010—October 30, 2010)
$ 26.45 $ 14.44 Fourth Fiscal Quarter (October 31, 2010—January 29, 2011)
$ 33.13 $ 22.24 Fiscal 2009
High Low First Fiscal Quarter (February 1, 2009—May 2, 2009)
$ 13.07 $ 5.70 Second Fiscal Quarter (May 3, 2009—August 1, 2009)
$ 12.86 $ 7.27 Third Fiscal Quarter (August 2, 2009—October 31, 2009)
$ 17.43 $ 9.25 Fourth Fiscal Quarter (November 1, 2009—January 30, 2010)
$ 15.74 $ 10.68 Performance Measurement Comparison
The following graph shows a comparison for total cumulative returns for Zumiez Inc., The NASDAQ Composite Index and the
fiscal years ended February 3, 2007NASDAQ Retail Trade Index during the period commencing on January 28, 2006 andFebruary 2, 2008.ending on January 29, 2011. The comparison assumes $100 was invested on January 28, 2006 in each Zumiez, the NASDAQ Composite Index and the NASDAQ Retail Trade Index, and assumes the reinvestment of all dividends, if any. The comparison in the following graph and table is required by the SEC and is not intended to be a forecast or to be indicative of future Company common stock performance.Fiscal 2006 High Low First Fiscal Quarter (January 29, 2006—April 29, 2006) $ 33.02 $ 23.65 Second Fiscal Quarter (April 30, 2006—July 29, 2006) $ 38.85 $ 27.00 Third Fiscal Quarter (July 30, 2006—October 28, 2006) $ 33.53 $ 20.00 Fourth Fiscal Quarter (October 29, 2006—February 3, 2007) $ 36.28 $ 26.05 Fiscal 2007 High Low First Fiscal Quarter (February 4, 2007—May 5, 2007) $ 42.00 $ 31.57 Second Fiscal Quarter (May 6, 2007—August 4, 2007) $ 41.80 $ 35.77 Third Fiscal Quarter (August 5, 2007—November 3, 2007) $ 51.25 $ 37.96 Fourth Fiscal Quarter (November 4, 2007—February 2, 2008) $ 39.45 $ 15.59 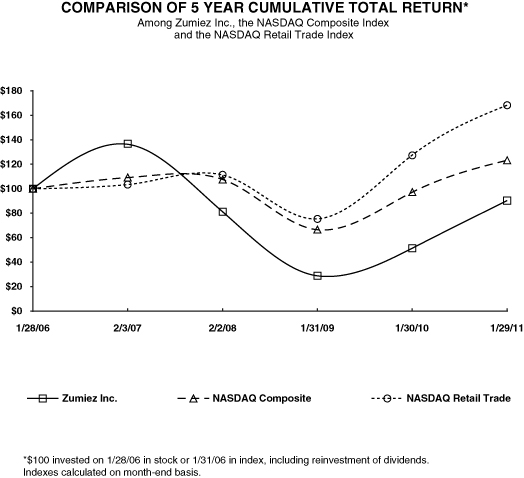
1/28/06 2/3/07 2/2/08 1/31/09 1/30/10 1/29/11 Zumiez Inc.
100.00 136.16 81.02 28.91 51.47 90.20 NASDAQ Composite
100.00 109.00 107.45 66.46 97.13 123.13 NASDAQ Retail Trade
100.00 103.41 111.20 75.42 127.28 168.13 b)Holders of theCorporation'sCorporation’s Capital StockWe had
approximately 20356 shareholders of record as of March3, 2008.7, 2011.c)DividendsNo cash dividends have been declared on our common stock to date nor have any decisions been made to pay a dividend in the foreseeable future. Payment of dividends is evaluated on a periodic basis and if a dividend were paid, it would be subject to covenants of our lending facility, which may have the effect of restricting our ability to pay dividends.
d)Recent Sales of Unregistered SecuritiesNone
e)Issuer Purchases of Equity SecuritiesNoneThe following table presents information with respect to purchases of common stock of the Company made during the thirteen weeks ended January 29, 2011.Period
Total Number of
Shares
Purchased (1)Average Price
Paid per ShareTotal Number of
Shares Purchased as
Part of Publicly
Announced Plans or
ProgramsMaximum Number of
Shares that May Yet
Be Purchased Under
the Plans or
ProgramsOctober 31, 2010—November 27, 2010
— $ — — — November 28, 2010—January 1, 2011
134 $ 29.32 — — January 2, 2011—January 29, 2011
77 $ 22.31 — — Total
211 — — (1) During the thirteen weeks ended January 29, 2011, 211 shares were either forfeited or purchased by us in order to satisfy employee tax withholding obligations upon the vesting of restricted stock. These shares were not acquired pursuant to any publicly announced purchase plan or program. Item 6. SELECTED FINANCIAL INFORMATION Item 6. SELECTED FINANCIAL INFORMATIONThe following selected consolidated financial information has been derived from our audited Consolidated Financial Statements. The data should be read in conjunction with our Consolidated Financial Statements and the notes thereto, and
Management'sManagement’s Discussion and Analysis of Financial Condition and Results of Operations included elsewhere herein.Each fiscal year consists of four 13-week quarters, with an extra week added to the fourth quarter every five or six years. Our fiscal years ended January 31, 2004, January 29, 2005, January 28, 2006 and February 2, 2008 each consisted of 52 weeks. Our fiscal year ended February 3, 2007 consisted of 53 weeks. In this document, we refer to the fiscal year ended January 29, 2005 as "fiscal 2004", to the fiscal year ended January 28, 2006 as "fiscal 2005", to the fiscal year ended February 3, 2007 as "fiscal 2006" and fiscal year ended February 2, 2008 as "fiscal 2007".Fiscal Year Ended January 29,
2011January 30,
2010January 31,
2009February 2,
2008February 3,
2007 (1)(in thousands, except per share data) Statement of Operations Data:
Net sales
$ 478,849 $ 407,603 $ 408,669 $ 381,416 $ 298,177 Cost of goods sold
308,452 272,865 274,134 244,429 189,959 Gross profit
170,397 134,738 134,535 136,987 108,218 Selling, general and administrative expenses
133,030 122,003 109,927 98,042 75,774 Operating profit
37,367 12,735 24,608 38,945 32,444 Interest income, net
1,496 1,176 2,059 1,722 1,178 Other (expense) income, net
(8 ) 96 36 3 (16 ) Earnings before income taxes
38,855 14,007 26,703 40,670 33,606 Provision for income taxes
14,652 4,876 9,499 15,344 12,750 Net income
$ 24,203 $ 9,131 $ 17,204 $ 25,326 $ 20,856 Earnings per share:
Basic
$ 0.81 $ 0.31 $ 0.59 $ 0.89 $ 0.76 Diluted
$ 0.79 $ 0.30 $ 0.58 $ 0.86 $ 0.73 Weighted average shares outstanding:
Basic
29,971 29,499 29,127 28,609 27,543 Diluted
30,794 30,133 29,694 29,322 28,703 The selected statement of operations data for the fiscal year ended January 28, 2006, the fiscal year ended February 3, 2007 and the fiscal year ended February 2, 2008 and the selected balance sheet data as of February 3, 2007 and February 2, 2008 are derived from our audited consolidated financial statements, which are included elsewhere in this document. The selected consolidated statement of operations data for the fiscal years ended January 31, 2004 and January 29, 2005 are derived from our audited financial statements not included in this document.Fiscal Year Ended January 31,
2004January 29,
2005January 28,
2006February 3,
2007February 2,
2008(in thousands, except share and per share data) Statement of Operations Data: Net sales $ 117,857 $ 153,583 $ 205,589 $ 298,177 $ 381,416 Cost of goods sold 81,463 103,297 133,047 189,959 244,429 Gross profit 36,394 50,286 72,542 108,218 136,987 Selling, general and administrative expenses 28,933 38,277 52,494 75,774 98,042 Operating profit 7,461 12,009 20,048 32,444 38,945 Interest income (expense) (293 ) (250 ) 648 1,178 1,722 Other income (expense) 8 8 (1 ) (16 ) 3 Earnings before income taxes 7,176 11,767 20,695 33,606 40,670 Provision for income taxes 2,701 4,500 7,844 12,750 15,344 Net income $ 4,475 $ 7,267 $ 12,851 $ 20,856 $ 25,326 Net income per share Basic (1) $ 0.20 $ 0.32 $ 0.50 $ 0.76 $ 0.89 Diluted (1) $ 0.17 $ 0.28 $ 0.47 $ 0.73 $ 0.86 Weighted average shares outstanding Basic (1) 22,610,522 22,610,522 25,879,675 27,542,891 28,608,818 Diluted (1) 25,623,710 25,877,716 27,376,684 28,703,037 29,322,337 (1)Fiscal 2003, 2004 and 2005 have been restated to reflect the 2 for 1 stock split that occurred in fiscal 2006 in the form of a share dividend.
Fiscal Year Ended January 31,
2004January 29,
2005January 28,
2006February 3,
2007February 2,
2008(in thousands) Balance Sheet Data: Cash, cash equivalents and marketable securities $ 578 $ 1,026 $ 43,001 $ 51,977 $ 76,532 Working capital 2,975 4,756 47,357 54,929 92,161 Total assets 41,558 54,811 114,411 167,294 216,095 Total long term obligations 2,613 5,576 9,129 12,910 18,097 Total shareholders' equity 18,438 25,799 73,684 104,812 154,602 (1) The fiscal year ended February 3, 2007 consisted of 53 weeks. Fiscal Year Ended January 31,
2004January 29,
2005January 28,
2006February 3,
2007February 2,
2008(in thousands, except square footage & sales per square foot) Other Financial Data: Gross margin percentage (1) 30.9 % 32.7 % 35.3 % 36.3 % 35.9 % Capital expenditures $ 6,467 $ 12,754 $ 16,453 $ 22,160 $ 30,722 Depreciation and Amortization $ 4,185 $ 5,857 $ 7,535 $ 10,499 $ 14,762 Store Data: Number of stores open at end of period 113 140 174 235 285 Comparable store sales increase (2)(3) 4.3 % 9.6 % 14.2 % 14.5 % 9.2 % Net sales per store (3)(4) $ 1,131 $ 1,195 $ 1,314 $ 1,403 $ 1,425 Total square footage at end of period (5) 288,784 371,864 475,646 667,337 829,021 Average square footage per store at end of period (6) 2,533 2,656 2,718 2,840 2,909 Net sales per square foot (3)(7) $ 448 $ 457 $ 488 $ 504 $ 495 (1)Gross margin percentage represents gross profit divided by net sales.(2)Comparable store sales percentage changes are calculated by comparing comparable store sales for the applicable fiscal year to comparable store sales for the prior fiscal year. Comparable store sales are based on net sales, and stores are considered comparable beginning on the first anniversary of their first day of operation. See "Management's Discussion and Analysis of Financial Condition and Results of Operations—General" for more information about how we compute comparable store sales. Comparable stores sales for fiscal years ended February 2, 2008 and February 3, 2007 consisted of 52 weeks and 53 weeks, respectively, resulting in an extra week of sales in fiscal 2006.(3)Comparable store sales, net sales per store and net sales per square foot include our in-store sales and our internet sales. Our internet sales represented approximately 1% of our total net sales in each of the periods presented. Fiscal 2006 included an extra week of sales due to the addition of a 53rdweek.(4)Net sales per store represents net sales for the period divided by the average number of stores open during the period. For purposes of this calculation, the average number of stores open during the period is equal to the sum of the number of stores open as of the end of each month during the period divided by the number of months in the period. Fiscal 2006 included an extra week of sales due to the addition of a 53rdweek.(5)Total square footage at end of period includes retail selling, storage and back office space.(6)Average square footage per store at end of period is calculated on the basis of the total square footage at end of period, including retail selling, storage and back office space, of all stores open at the end of the period.(7)Net sales per square foot represents net sales for the period divided by the average square footage of stores open during the period. For purposes of this calculation, the average square footage of stores open during the period is equal to the sum of the total square footage of the stores open as of the end of each month during the period divided by the number of months in the period.
January 29,
2011January 30,
2010January 31,
2009February 2,
2008February 3,
2007(in thousands) Balance Sheet Data:
Cash, cash equivalents and current marketable securities
$ 128,801 $ 108,051 $ 78,582 $ 76,532 $ 51,977 Working capital (1)
155,400 133,927 112,092 92,161 54,929 Total assets
301,631 260,265 233,349 216,095 167,294 Total long-term liabilities
29,435 27,802 24,177 18,097 12,910 Total shareholders’ equity
226,735 192,676 177,951 154,602 104,812 (1) Working capital is defined as current assets minus current liabilities. The fiscal year ended January 30, 2010 has been restated to account for the reclassification of certain assets from current assets to long-term assets. Reclassification of these assets from current assets to long-term assets is immaterial for prior periods. Fiscal Year Ended January 29,
2011January 30,
2010January 31,
2009February 2,
2008February 3,
2007 (1)Other Financial Data:
Gross margin (2)
35.6 % 33.1 % 32.9 % 35.9 % 36.3 % Capital expenditures (in thousands)
$ 29,361 $ 16,548 $ 28,349 $ 30,722 $ 22,160 Depreciation, amortization and accretion (in thousands)
$ 17,923 $ 22,092 $ 19,470 $ 14,762 $ 10,499 (1) The fiscal year ended February 3, 2007 consisted of 53 weeks. (2) Gross margin represents gross profit divided by net sales. Fiscal Year Ended January 29,
2011January 30,
2010January 31,
2009February 2,
2008February 3,
2007 (1)Store Data:
Number of stores open at end of period
400 377 343 285 235 Comparable store sales increase (decrease) (2)
11.9 % (10.0 %) (6.5 %) 9.2 % 14.5 % Net sales per store (3) (in thousands)
$ 1,162 $ 1,081 $ 1,240 $ 1,405 $ 1,389 Total square footage at end of period (4) (in thousands)
1,174 1,107 1,005 829 667 Average square footage per store at end of period (5)
2,935 2,937 2,930 2,909 2,840 Net sales per square foot (6)
$ 396 $ 367 $ 424 $ 488 $ 499 (1) The fiscal year ended February 3, 2007 consisted of 53 weeks. (2) Comparable store sales percentage changes are calculated by comparing comparable store sales for the applicable fiscal year to comparable store sales for the prior fiscal year. Comparable store sales are based on net sales, and stores are considered comparable beginning on the first anniversary of their first day of operation. See “Management’s Discussion and Analysis of Financial Condition and Results of Operations—General” for more information about how we compute comparable store sales. Comparable store sales include our ecommerce sales. (3) Net sales per store represents net sales for the period divided by the average number of stores open during the period. For purposes of this calculation, the average number of stores open during the period is equal to the sum of the number of stores open as of the end of each month during the period divided by the number of months in the period. Net sales per store excludes ecommerce sales. (4) Total square footage at end of period includes retail selling, storage and back office space. (5) Average square footage per store at the end of a period is calculated based on the total store square footage at end of period, including retail selling, storage and back office space, of all stores open at the end of the period. (6) Net sales per square foot represents net sales, excluding ecommerce sales, for the period divided by the average square footage of stores open during the period. For purposes of this calculation, the average square footage of stores open during the period is equal to the sum of the total square footage of the stores open as of the end of each month during the period divided by the number of months in the period. Item 7. MANAGEMENT’S DISCUSSION AND ANALYSIS OF FINANCIAL CONDITION AND RESULTS OF OPERATIONS Item 7. MANAGEMENT'S DISCUSSION AND ANALYSIS OF FINANCIAL CONDITION AND RESULTS OF OPERATIONSThe following discussion and analysis of our financial condition and results of operations should be read in conjunction with our consolidated financial statements and related notes included elsewhere in this document. This discussion contains forward-looking statements that involve risks and uncertainties. Our actual results could differ materially from those anticipated in these forward-looking statements as a result of certain factors, including those discussed in
"Item“Item 1A RiskFactors".Factors.” See the cautionary note regarding forward-looking statements set forth at the beginning of Part I of the Annual Report on Form 10-K.Overview
We are a mall based specialty retailer of action sports related apparel, footwear, equipment and accessories operating under the Zumiez brand name.
As of February 2, 2008At January 29, 2011, we operated285400 stores primarily located in shopping malls, giving us a presence in2737 states.We were founded in 1978 by Thomas D. Campion, our Chairman. Our current President and Chief Executive Officer, Richard M. Brooks, joined us as Chief Financial Officer in 1993.Our stores cater to young men and women between the ages of 12 and 24 who seek popular brands representing a lifestyle centered on activities that include skateboarding, surfing, snowboarding, BMX and motocross. We support the action sports lifestyle and promote our brand through a multi-faceted marketing approach that is designed to integrate our brand image with ourcustomers'customers’ activities and interests. This approach, combined with our differentiated merchandising strategy, store design, comprehensive training programs and passionate employees, allows us to provide an experience for our customers that we believe is consistent with their attitudes, fashion tastes and identities and is otherwise unavailable in most malls. Accordingly, our success is largely dependent upon our ability to anticipate, identify and respond to the fashion tastes of our customers and to provide merchandise that satisfies customer demands.OurFiscal 2010—A Review of This Past YearZumiez’ financial results in fiscal 2010 meaningfully exceeded our own projections and these results were significant, particularly when viewing against the teen retail landscape in what remained a tenuous consumer environment. In addition, while accomplishing these results, we made strategic investments that we believe will reap long-term benefits focused on enhancing the customer experience across multiple sales channels, and on our people and infrastructure aimed at improving decision making and product speed to market. The table below show net sales,
increased from approximately $101.4 millionoperating profit and margin and diluted earnings per share growth for fiscal 2010 compared to fiscal 2009:Fiscal Year Ended January 29, 2011 January 30, 2010 % Change Net sales (in thousands)
$ 478,849 $ 407,603 17 % Operating profit (in thousands)
$ 37,367 $ 12,735 193 % Operating margin
7.8 % 3.1 % Diluted earnings per share
$ 0.79 $ 0.30 163 % Our sales results were primarily driven by an increase in transactions, which is a testament to our differentiated product offering and the unique customer experience our store associates provide. The strong sales results we realized in fiscal
20022010 translated toapproximately $381.4 milliona significant increase in operating income, operating margin and diluted earnings per share compared to fiscal2007, a compound annual growth rate of 30.3%. Net sales2009 due to our unique business model and focus on managing our cost structure.Fiscal 2011—A Look At the Upcoming Year
While the momentum we have seen throughout fiscal 2010 would suggest that discretionary spending is increasing, unemployment, debt and housing remain concerns and the economy is still in recovery. In addition, other challenges have surfaced as we look out into fiscal 2011, most notably increases in production costs that may have an impact on our ability to maintain product margins. Considering these factors, our current outlook is cautiously optimistic, and we are planning the business conservatively for fiscal
2007 increased by $83.2 million, or 27.9%, over net2011.For the year, we expect total sales
for fiscal 2006. Over the past five fiscal years ended February 2, 2008 we increased our store base from 99 to 285 and our comparable store net sales increased an average of 10.1% per fiscal year. As of February 2, 2008 we operated 285 stores that averaged approximately 2,900 square feet per store.We intend to expand our presence as a leading action sports lifestyle retailer by opening new stores and continuing to generate sales growth through improved store level productivity. We have successfully and consistently implemented our store concept across a variety of mall classifications and geographic locations, and our strategy is to continue to open stores in both new and existing markets. We plan to open 57 new stores in fiscal 2008 and to continue to open a significant number of new stores in future years. Through our merchandising and marketing efforts, we have generally been successful in increasing the level of net sales in our existing stores and we will seek to continue such increases going forward.We believe that we have developed an economically compelling store model. Our new stores opened during fiscal 2006, including 19 stores, net, acquired from Fast Forward, generated average net sales of approximately $1.2 million during their first full year of operations. On average, our net investment to open these stores, excluding the Fast Forward stores, was approximately $314,000, which includes capital expenditures, net of landlord contributions. However, net sales and other operating results for stores that we open or have opened subsequent to the end of fiscal 2006, as well as our net investment to open those stores, may differ substantially from net sales and other operating results and our net investment for stores we opened in fiscal 2006. See "Business—Stores." We opened 50 new stores in fiscal 2007 with an average net investment of approximately $330,000 which includes capital expenditures, net of landlord contributions. However, our net investment to open new stores and net sales generated by new stores vary significantly and depend on a number of factors, including the geographic location, type of mall and size of those stores. Accordingly, net sales and other operatingresults for stores that we open or have opened subsequent to the end of fiscal 2007, as well as our net investment to open those stores, may differ substantially from net sales and other operating results and our net investment for the stores we opened in fiscal 2007.In any given period, our overall gross margin may be impacted by changes in the margins of the various products we offer as well as changes in the relative mix of revenues from the different categories of apparel and hardgood products that we sell. Over the past five fiscal years, our annual gross margin as a percentage of our net sales has ranged from a low of 30.9% to a high of 36.3%. We achieved these results while continuing to adjust our merchandise mix to respond to changing consumer preferences and market conditions. A number of other factors may also positively or negatively impact our gross margins and results of operations, including, but not limited to:•the timing of new store openings and the relative proportion of our new stores to mature stores;•whether we are able to successfully integrate any new stores that we acquire and the presence or absence of any unanticipated liabilities in connection therewith;•fashion trends and changes in consumer preferences;•calendar shifts of holiday or seasonal periods;•timing of promotional events;•general economic conditions and, in particular, the retail sales environment;•actions by competitors or mall anchor tenants;•weather conditions;•the level of pre-opening expenses associated with our new stores; and•inventory shrinkage beyond our historical average rates;
One of our ongoing goals is to leverage our expenses, particularly general corporate overhead and fixed costs such as non-variable occupancy costs, through increases in both comparable store sales and total net sales. At the store level, our strategy isto increasecomparable store sales indriven by aneffort to improve operating results by spreading our store level fixed costs over increased net sales per comparable store. We also seek toincreaseour total net sales, both through increasesin comparable store sales,and bythe opening of approximately 44 new stores, including our first stores inan effort to better leverageCanada, and increased sales from ourcorporate level expensesecommerce channel. If we achieve our sales projections, we expect earnings will increase in fiscal 2011. We will make further investments in people anddecrease our general and administrative expenses as a percentageinfrastructure in fiscal 2011, building on the progress we have made through fiscal 2010, primarily focused on the development of ournet sales.multi-channel sales strategies, expansion into Canada and continued progress on our product assortment planning and supply chain solutions and a capital investment related to building a new home office, planned to opening in the spring of 2011. We expect our cash, short-term investments and working capital to increase, and do not anticipate any borrowings on our credit facility. Inventory levels per square foot are expected to grow due to increased production costs and to support sales growth.General
Net sales constitute gross sales net of
returns.actual and estimated returns and deductions for promotions. Net sales include our in-store sales and ourinternetecommerce sales, which includes ecommerce shipping revenue. Ecommerce sales were 4.7%, 2.5% andaccordingly, information herein with respect to comparable store sales,1.7% of total net salesper storefor fiscal 2010, 2009 andnet sales per square foot includes our internet sales. For fiscal 2002 through fiscal 2007, internet sales represented approximately 1% of our annual net sales. We record the sale2008. Sales of gift cardsas a current liabilityare deferred andrecognize a salerecognized whena customer redeems agiftcard.cards are redeemed. The amount of the gift card liability is determined taking into account our estimate of the portion of gift cards that will not be redeemed or recovered("(“gift cardbreakage"breakage”). GiftCard Breakagecard breakage is recognized as revenue after 24 months, at which time the likelihood of redemption is considered remote based on our historical redemption data.We report
"comparable“comparable storesales"sales” based on netsales, and stores are included in our comparable storesales beginning on the first anniversary oftheirthe first day ofoperation.operation of a new store. Our comparable store sales also include our ecommerce sales. Changes in our comparable store sales between two periods are based on net sales of stores which were in operation during both of the two periods being compared and, if a store is included in the calculation of comparable store sales for only a portion of one of the two periods being compared, then that store is included in thecalculation for only the comparable portion of the other period.
When additionalAny change in square footageis added to a store that is included inof an existing comparable store,sales,including remodels, does not eliminate that storeremainsfrom inclusion in the calculation of comparable store sales. There may be variations in the way in which some of our competitors and other apparel retailers calculate comparable or same store sales. As a result, data herein regarding our comparable store sales may not be comparable to similar data made available by our competitors or other retailers.Cost of goods sold consists of
thebranded merchandise costs and our private label merchandise costs including design, sourcing, importing and inbound freight costs. Our cost ofmerchandisegoods soldto customers, inbound shipping costs,also includes shrinkage and buying, occupancy, distributioncosts, depreciation on leasehold improvements at our distribution center, buyingandmerchandising costs and store occupancywarehousing costs. This may not be comparable to the way in which our competitors or other retailers compute their cost of goods sold.In early February 2005 we completed our moveWe receive cash consideration from vendors, which have been reported as a reduction cost of goods sold if the49,000 square foot combined home office and distribution center we had leased since 1994 toinventory has sold, as anewly leased 87,350 square foot combined home office and distribution center. In October, 2006 we entered into a new lease agreement whereby we agreed to expand our existing lease of 87,350 square feet of home office and distribution center space by 37,350 square feet, bringing the aggregate square footage leased to 124,700 square feet. The effective datereduction of thenew lease was January 1, 2007. The new Lease Agreement terminatedcarrying value of the inventory if the inventory is still on hand, or a reduction of selling, general andreplacedadministrative expense if theoriginal February 2005 lease withamounts are reimbursements of specific, incremental and identifiable costs of selling theLandlord. The new Lease Agreement provides for an initial lease term of 126 months within which we have an optionvendors’ products.With respect to
extendthelease term for an additional period of five years. As a result, we experienced a slight increase in our distribution and warehousing costs, which are included as afreight component of ourcostsecommerce sales, we arrange and pay the freight for our customers and bill them for this service, unless our customers have their product shipped to one of our stores or we have free shipping promotions to our customers, in which case we do not bill our customers. Such amounts billed are included in net sales and the related freight cost is charged to cost of goodssold, in fiscal 2006.sold.Selling, general and administrative expenses consist primarily of store personnel wages and benefits, administrative staff and infrastructure expenses, outbound freight, store supplies, depreciation on
leasehold improvementsfixed assets at our home office and stores, facility expenses and training, advertising and marketing costs. Credit card fees, insurance, public company expenses,Sarbanes Oxley compliancelegal expensesstock based compensationand other miscellaneous operating costs are also included in selling, general and administrative expenses. This may not be comparable to the way in which our competitors or other retailers compute their selling, general and administrative expenses.Key Performance Indicators
Our management evaluates the following items, which we consider key performance indicators, in assessing our performance:
Comparable store sales. As previously described in detail under the caption “General,” comparable store sales provide a measure of sales growth for stores open at least one year over the comparable prior year period.
We
expect thatconsider comparable store sales to be an important indicator of our current performance. Comparable store sales results are important to achieve leveraging of our costs, including store payroll, store supplies and rent. Comparable store sales also have a direct impact on our total net sales, cash and working capital.Gross profit. Gross profit measures whether we are optimizing the price and inventory levels of our merchandise. Gross profit is the difference between net sales and cost of goods sold. Any inability to obtain acceptable levels of initial markups or any significant increase in our use of markdowns could have an adverse effect on our gross profit and results of operations.
Operating profit.We view operating profit as a key indicator of our success. The key drivers of operating profit are comparable store sales, gross profit, our ability to control selling, general and administrative expenses
will,and our level of capital expenditures affecting depreciation expense.Store productivity.We review our stores’ operating profit as
described below, increase in future periods due in part to increased expenses associated with opening new stores.a measure of their profitability.We recognized stock-based compensation expense of approximately $4.6 million in fiscal 2007 and $2.1 million in fiscal 2006. As a result of FinancialCritical AccountingStandards Board (FASB) Statement No. 123(R),EstimatesShare-Based Payment("SFAS No. 123(R)"), which became effective for us beginning with the first quarter of fiscal 2006, share-based payments granted in future periods will increase compensation expense that would otherwise have been recognizedOur consolidated financial statements are prepared in accordance with
Accounting Principles Board Opinion No. 25,Accounting For Stock Issued To Employees,GAAP. In connection with the preparation of our consolidated financial statements, we are required to make assumptions andoutstanding unvested options will resultestimates about future events, and apply judgments that affect the reported amounts of assets, liabilities, revenue, expenses and the related disclosures. We base our assumptions, estimates and judgments on historical experience, current trends and other factors that management believes to be relevant at the time our consolidated financial statements are prepared. On a regular basis, we review the accounting policies, assumptions, estimates and judgments to ensure that our consolidated financial statements are presented fairly and inadditional compensation expense that otherwise would only have been recognized on a pro-forma basis. For more information regarding the implementationaccordance with GAAP. However, because future events and their effects cannot be determined with certainty, actual results could differ from our assumptions and estimates, and such differences could be material.Our significant accounting policies are discussed in Note 2, Summary of
SFAS 123(R), see "CriticalSignificant Accounting Policies, of the Notes to Consolidated Financial Statements, included in Part IV Item 15, “Exhibits andEstimates" below.Our success is largely dependent uponConsolidated Financial Statements,” of this Annual Report on Form 10-K. We believe that the following accounting estimates are the most critical to aid in fully understanding and evaluating ourability to anticipate, identify and respond to the fashion tastes of our customers and to provide merchandise that satisfies customer demands. Any inability to provide appropriate merchandise in sufficient quantities in a timely manner could have a material adverse effect on our business, operatingreported financial results, andfinancial condition.they require our most difficult, subjective or complex judgments, resulting from the need to make estimates about the effect of matters that are inherently uncertain.We have and will continue to incur significant legal, accounting, insurance and other expenses as a result of being a public company, which will adversely affect our results of operations, perhaps materially. Among other things, we expect that continued compliance with the Sarbanes-Oxley Act of 2002 and related rules and regulations will result in significant legal and accounting costs in the future. See Item 1A "Risk Factors".Description
Judgments and Uncertainties
Effect If Actual Results Differ
From AssumptionsValuation of Merchandise Inventories We value our inventory at the lower of cost or fair market value through the establishment of write-down and inventory loss reserves.
Our write-down reserve represents the excess of the carrying value over the amount we expect to realize from the ultimate sales or other disposal of the inventory. Write-downs establish a new cost basis for our inventory. Subsequent changes in facts or circumstances do not result in the restoration of previously recorded write-downs or an increase in that newly established cost basis.
Our inventory loss reserve represents anticipated physical inventory losses (“shrinkage reserve”) that have occurred since the last physical inventory dates. Each quarter, we reserve for anticipated physical inventory losses on an aggregate basis.
Our write-down reserve contains uncertainties because the calculation requires management to make assumptions based on the current rate of sales, the age of inventory, the profitability of the inventory and other factors.
Our inventory loss reserve contains uncertainties because the calculation requires management to make assumptions and to apply judgment regarding a number of factors, including historical percentages that can be affected by changes in merchandise mix and changes in actual shrinkage trends.
We have not made any material changes in the accounting methodology used to calculate our write-down and inventory loss reserves in the past three fiscal years. We do not believe there is a reasonable likelihood that there will be a material change in the future estimates or assumptions we use to calculate our inventory reserves. However, if actual results are not consistent with our estimates and assumptions, we may be exposed to losses or gains that could be material.
A 10% decrease in ultimate sales price at January 29, 2011 would have affected net income by $0.1 million in fiscal 2010.
A 10% difference in actual physical inventory shrinkage reserved at January 29, 2011 would have affected net income by $0.3 million in fiscal 2010.
Fixed Assets We review the carrying value of our fixed assets for impairment whenever events or changes in circumstances indicate that the carrying value of such asset may not be recoverable.
Recoverability of assets to be held and used is determined by a comparison of the carrying amount of an asset to future undiscounted net cash flows expected to be generated by the asset. If such assets are considered impaired, the impairment recognized is measured by comparing projected individual store discounted cash flow to the asset carrying values. Declines in projected store cash flow could result in the impairment of assets.
The actual economic lives of our fixed assets may be different from our estimated useful lives, thereby resulting in a different carrying value. These evaluations could result in a change in the depreciable lives of these assets and therefore our depreciation expense in future periods.
Our impairment loss calculations contain uncertainties because they require management to make assumptions and to apply judgment to estimate future cash flows and asset fair values, including forecasting future sales, gross profit and operating expenses and selecting the discount rate that reflects the risk inherent in future cash flows.
Our fixed assets accounting methodology contains uncertainties because it requires management to make estimates with respect to the useful lives of our fixed assets that we believe are reasonable.
We do not believe there is a reasonable likelihood that there will be a material change in the estimates or assumptions we use to calculate long-lived asset impairment losses. However, if actual results are not consistent with our estimates and assumptions, our operating results could be adversely affected.
Although management believes that the current useful lives estimates assigned to our fixed assets are reasonable, factors could cause us to change our estimates, thus affecting the future calculation of depreciation.
We may take steps, such as increased promotional activities, to increase the percentage of net sales of private label merchandise in the future, although there can be no assurance that we will be able to achieve increases in private label merchandise sales as a percentage of net sales. Because our private label merchandise generally carries higher gross margins than other merchandise, our failure to anticipate, identify and react in a timely manner to fashion trends with our private label merchandise, particularly if the percentage of net sales derived from private label merchandise increases, may have a material adverse effect on our comparable store sales, financial condition and results of operations. See Item 1A "Risk Factors".Description
Judgments and Uncertainties
Effect If Actual Results Differ
From AssumptionsRevenue Recognition Revenue is recognized upon purchase at our retail store locations. For orders placed through our website, revenue is recognized upon estimated delivery to the customer. Revenue is recorded net of estimated and actual sales returns and deductions for promotions.
Revenue is not recorded on the sale of gift cards. A current liability is recorded upon sale, and revenue is recognized when the gift card is redeemed for merchandise. The amount of the gift card liability is determined taking into account our estimate of the portion of gift cards that will not be redeemed or recovered (“gift card breakage”). Gift card breakage is recognized as revenue after 24 months, at which time the likelihood of redemption is considered remote based on our historical redemption data.
Our revenue recognition accounting methodology contains uncertainties because it requires management to make assumptions regarding future sales returns and the amount and timing of gift cards projected to be redeemed by gift card recipients. Our estimate of the amount and timing of sales returns and gift cards to be redeemed is based primarily on historical transaction experience. We have not made any material changes in the accounting methodology used to measure sales returns or recognize revenue for our gift card program in the past three fiscal years. We do not believe there is a reasonable likelihood that there will be a material change in the future estimates or assumptions we use to recognize revenue. However, if actual results are not consistent with our estimates or assumptions, we may be exposed to losses or gains that could be material.
A 10% change in our sales return reserve at January 29, 2011 would have affected net income by less than $0.1 million in fiscal 2010.
A 10% change in our unredeemed gift card breakage life at January 29, 2011 would have affected net income by $0.2 million in fiscal 2010.
Stock-Based Compensation We maintain the Zumiez Inc. 2005 Equity Incentive Plan under which non-qualified stock options and restricted stock have been granted to employees and non-employee directors.
In determining the fair value of our stock options, we use the Black-Scholes option pricing model, which requires management to apply judgment and make assumptions to determine the fair value of our awards.
We determine the fair value of our restricted stock awards based on the closing market price of our stock on the grant date.
The calculation of stock-based compensation requires management to make assumptions and to apply judgment to determine the fair value of our awards. These assumptions and judgments include estimating the inputs to the Black-Scholes option pricing model, future employee turnover rates and future employee stock option exercise behaviors. Changes in these assumptions can materially affect the fair value estimate. We do not believe there is a reasonable likelihood there will be a material change in the future estimates or assumptions we use to determine stock-based compensation expense. However, if actual results are not consistent with our estimates or assumptions, we may be exposed to changes in stock-based compensation expense that could be material.
A 10% change in our stock-based compensation expense in fiscal 2010 would have affected net income by $0.3 million in fiscal 2010.
Accounting for Income Taxes As part of the process of preparing the financial statements, income taxes are estimated for each of the jurisdictions in which we operate. This process involves estimating actual current tax exposure together with assessing temporary differences resulting from differing treatment of items for tax and accounting purposes. These differences result in deferred tax assets and liabilities, which are included on the consolidated balance sheets. Significant judgment is required in evaluating our tax positions and determining our provision for income taxes. During the ordinary course of business, there are many transactions and calculations for which the ultimate tax determination is uncertain. For example, our effective tax rates could be adversely affected by earnings being lower than anticipated in jurisdictions where we have lower statutory rates and higher than anticipated in jurisdictions where we have higher statutory rates, by changes in the valuation of our deferred tax assets and liabilities or by changes in the relevant tax, accounting and other laws, regulations, principles and interpretations. Although management believes that the income tax related judgments and estimates are reasonable, actual results could differ and we may be exposed to losses or gains that could be material.
Upon income tax audit, any unfavorable tax settlement generally would require use of our cash and may result in an increase in our effective income tax rate in the period of resolution. A favorable tax settlement may be recognized as a reduction in our effective income tax rate in the period of resolution.
Description
Judgments and Uncertainties
Effect If Actual Results Differ
From AssumptionsAccounting for Contingencies We are subject to various claims and contingencies related to lawsuits, insurance, regulatory and other matters arising out of the normal course of business. We accrue a liability if the likelihood of an adverse outcome is probable and the amount is estimable. If the likelihood of an adverse outcome is only reasonably possible (as opposed to probable), or if an estimate is not determinable, we provide disclosure of a material claim or contingency in the Notes to the Consolidated Financial Statements. Significant judgment is required in evaluating our claims and contingencies, including determining the probability that a liability has been incurred and whether such liability is reasonably estimable. The estimated accruals for claims and contingencies are made based on the best information available, which can be highly subjective. Although management believes that the contingencies related judgments and estimates are reasonable, our accrual for claims and contingencies could fluctuate as additional information becomes known, thereby creating variability in our results of operations from period to period. Additionally, actual results could differ and we may be exposed to losses or gains that could be material. Goodwill We evaluate goodwill for impairment annually and when an event occurs or circumstances change to suggest that the carrying value may not be recoverable. We complete our impairment evaluation by performing internal valuation analyses, considering other publicly available market information, and where appropriate, by use of an independent valuation firm.
We test goodwill for impairment by first comparing the carrying value of net assets to the fair value of the related operations. If the fair value is determined to be less than carrying value, a second step is performed to compute the amount of impairment. We estimate fair value using discounted cash flows.
Forecasts of future cash flow are based on our best estimate of future net sales and operating expenses. These types of analyses contain uncertainties because they require management to make assumptions and to apply judgment to estimate economic factors and the profitability of future business operations. We do not believe there is a reasonable likelihood that there will be a material change in the future estimates or assumptions we use to test for impairment losses on goodwill. However, if actual results are not consistent with our estimates or assumptions, we may be exposed to an impairment charge that could be material.
A 10% decrease in the fair value of the Company at January 29, 2011 would have no impact on the carrying value of goodwill.
Results of Operations
The following table presents, for the periods indicated, selected items in the consolidated statements of operations as a percent of net sales:
Fical Year Ended January 28,
2006February 3,
2007February 2,
2008Net sales 100.0 % 100.0 % 100.0 % Cost of goods sold 64.7 % 63.7 % 64.1 % Gross margin 35.3 % 36.3 % 35.9 % Selling, general and administrative expenses 25.5 % 25.4 % 25.7 % Operating profit 9.8 % 10.9 % 10.2 % Interest income (expense) 0.3 % 0.4 % 0.4 % Earnings before income taxes 10.1 % 11.3 % 10.6 % Provision for income taxes 3.8 % 4.3 % 4.0 % Net income 6.3 % 7.0 % 6.6 % Fiscal Year Ended January 29,
2011January 30,
2010January 31,
2009Net sales
100.0 % 100.0 % 100.0 % Cost of goods sold
64.4 % 66.9 % 67.1 % Gross profit
35.6 % 33.1 % 32.9 % Selling, general and administrative expenses
27.8 % 30.0 % 26.9 % Operating profit
7.8 % 3.1 % 6.0 % Interest and other income, net
0.3 % 0.3 % 0.5 % Earnings before income taxes
8.1 % 3.4 % 6.5 % Provision for income taxes
3.0 % 1.2 % 2.3 % Net income
5.1 % 2.2 % 4.2 % Fiscal
(2007) Year Ended February 2, 20082010 Results Compared With Fiscal 2009Net Income
Net income for fiscal 2010 was $24.2 million, or $0.79 per diluted share, compared with
Fiscal (2006) Year Ended February 3, 2007net income of $9.1 million, or $0.30 per diluted share, for fiscal 2009. Our effective income tax rate for fiscal 2010 was 37.7% compared to 34.8% for fiscal 2009.Net Sales
Net sales
increased to $381.4were $478.8 million for fiscal2007 from $298.22010 compared to $407.6 million for fiscal2006,2009, an increase of$83.2$71.2 million or27.9%17.5%. The increase reflected a comparable store sales increase of 11.9% for fiscal 2010 as well as the net addition of 23 stores (27 new stores offset by four store closures) in fiscal 2010.ComparableGeographically, our best performing region for comparable storenetsales was the South, increasing 12%. Our stores west of Texas, which accounted for 50% of our comparable store sales, increased by9.2%9%, our stores in the52 week period ended February 2, 2008 compared toNortheast and Midwest increased by 8% combined and the52 week period ended February 3, 2007. Thisremaining increase in comparable store sales is due to increases in our ecommerce sales. The increase in comparable stores sales was primarilydue to higher netdriven by an increase in comparable store transactions, partially offset by a decline in dollars per transaction. Comparable store salesof men's and women'sincreases in men’s apparel, accessories, footwear, boy’s apparel andskatejunior’s apparel were partially offset by comparable store sales decreases in hardgoods. For information as to how we define comparable stores, see"General"“General” above.The increase in total net sales was due to an increase in comparable store net sales of approximately $23.6 million and an increase in net sales from non-comparable stores of approximately $59.6 million. The increase in non-comparable store net sales was primarily due to the opening of 50 new stores in fiscal 2007.Gross Profit
Gross profit
for fiscal 2007was$137.0 million compared with $108.2$170.4 million for fiscal2006,2010 compared to $134.7 million for fiscal 2009, an increase of$28.8$35.7 million, or26.6%26.5%. As a percentage of net sales, gross profitdecreasedincreased 250 basis points for fiscal 2010 to35.9% in35.6% from 33.1% for fiscal2007 from 36.3% in fiscal 2006.2009. The increase was primarily due to product margin improvement of 140 basis points and a 140 basis points decrease ingross profit as a percentage of net sales was due primarily to higher shrinkage,store occupancycosts, and distributioncosts, partially offset byhigher product marginsa 40 basis points increase due toimproved product management.distribution costs primarily associated with the exit costs and other charges of $2.4 million related to the relocation of our distribution center.Selling, General and Administrative Expenses
Selling, general and administrative
or "SG&A,"(“SG&A”) expensesinwere $133.0 million for fiscal2007 were $98.02010 compared to $122.0 millioncompared with $75.8 million infor fiscal2006,2009, an increase of$22.2$11.0 million, or29.4%9.0%.This increase was primarily the result of costs associated with operating new stores as well as increases in infrastructure and administrative staff to support our growth. As a percentage of net sales, SG&A expenses increased to 25.7% in fiscal 2007 from 25.4% in fiscal 2006. The increase inSG&A expenses as apercentagepercent ofnetsaleswas primarily attributabledecreased by 220 basis points for fiscal 2010 to 27.8% compared to 30.0% for fiscal 2009. The primary contributors to this decrease were 110 basis points due to store operating expense efficiencies gained by growing expenses at a slower rate than sales growth, theincreased stock based compensationeffect of the change in accounting estimate for the depreciable lives of our leasehold improvements of 90 basis points (as further explained in Note 2 in our Notes to Consolidated Financial Statements), 60 basis points due to impairment charges of $2.5 million on 21 stores in fiscal 2009 andincreased depreciation expensea 30 basis points impact of$3.9a litigation settlement charge of $1.3 million incurred fiscal 2009, partially offset bylower growtha 70 basis points impact of a litigation settlement charge of $2.1 million incurred instore wagesfiscal 2010.Exit or Disposal Activities
On March 2, 2010, we acquired a 168,450 square foot building in Corona, California for $11.8 million and
benefits relativewe have relocated our distribution facility from Everett, Washington to this facility. We believe that we will be more effective distributing our products through a distribution center located in Corona, California due to thegrowthmajority of our vendors being located innet salesSouthern California. Cumulatively, during fiscal 2010, we have recorded $0.9 million of employee benefit costs (severance andlower incentive compensation expense.performance bonuses), $0.6 million of lease termination costs, $0.3 million of loss on disposal of long-lived assets and $0.8 million of other costs to exit thefacility, partially offset by the $0.2 million benefit related to deferred rent liability. These amounts are included in cost of goods sold in our consolidated statements of operations. We do not expect to incur material additional costs related to the relocation.
Operating ProfitAs a result of the above factors, operating profit increased to $38.9 million for fiscal 2007, compared with $32.4 million in fiscal 2006 an increase of $6.5 million or 20.0%. As a percentage of net sales, operating profit was 10.2% in fiscal 2007 compared with 10.9% in fiscal 2006.Provision for Income TaxesProvision for income taxes was $15.3 million for fiscal 2007 compared with $12.8 million for fiscal 2006. The effective tax rate was 37.7% for fiscal 2007 and 37.9% for fiscal 2006. The lower effective tax rate was due to higher interest income from tax exempt municipal bonds.During fiscal 2007 the Company adopted the provisions of FASB issued Interpretation No. 48 ("FIN 48"), "Accounting for Uncertainty in Income Taxes—an Interpretation of FASB Statement No. 109."Fiscal 2009 Results Compared With Fiscal 2008Net Income
Net income
increased to $25.3 million,in fiscal2007 from $20.92009 was $9.1 million, or $0.30 per diluted share, compared with $17.2 million, or $0.58 per diluted share, in fiscal2006 an increase2008, a decrease of$4.4 million, or 21.4%46.9%.As a percentage of net sales,The decrease in net income was6.6%driven by the deleveraging effect of increased selling, general and administrative expenses (SG&A) on a decrease in net sales, partially offset by an improvement in gross profit as a percent of sales. Our effective income tax rate in fiscal20072009 was 34.8% comparedwith 7.0%to 35.6% in fiscal2006.Fiscal (2006) Year Ended February 3, 2007 Compared with Fiscal (2005) Year Ended January 28, 20062008.Net Sales
Net sales
increasedin fiscal 2009 decreased 0.3% to$298.2 million for fiscal 2006 from $205.6 million for fiscal 2005, an increase$407.6 million. The decrease reflected a comparable store sales decline of$92.6 million, or 45.0%.Comparable store net sales increased by 13.0%10.0% in the52 week period ended February 3, 2007 compared to the 52 week52-week period ended January28, 2006. This increase30, 2010, mostly offset by the net addition of 34 new stores in fiscal 2009 and a full year of sales from the 58 stores opened in fiscal 2008.Geographically our stores west of Texas, which account for 54% of our comparable store sales, declined by 12.4%, while our comparable store sales in the Northeast, Midwest and South decreased 9.0% combined. The decline in comparable store sales was
primarily due to higher netdriven by a decrease in comparable store transactions and all merchandise categories experienced comparable store salesof men's apparel, accessories anddeclines except footwear. For information as to how we define comparable stores, see"General"“General” above.The increase in total net sales was due to an increase in comparable store net sales of approximately $27.2 million and an increase in net sales from non-comparable stores of approximately $65.4 million. The increase in non-comparable store net sales was primarily due to the opening of 42 new stores in fiscal 2006 and the acquisition of 20 stores from Fast Forward.Gross Profit
Gross profit
forwas $134.7 million in fiscal2006 was $108.22009 compared to $134.5 millioncompared with $72.5 million forin fiscal2005,2008, an increase of$35.7$0.2 million or49.2%0.2%. As apercentagepercent of net sales, gross profit increasedto 36.3%0.2 percentage points in fiscal20062009 to 33.1% from35.3%32.9% in fiscal2005.2008. The increasein gross profitwas primarily due to product margin improvement of 140 basis points and 20 basis points from supply chain efficiencies, largely offset by a store occupancy increase of 140 basis points. Store occupancy is largely a fixed cost for which we have a minimal ability to lower. Store occupancy costs increased as apercentage of netpercent to saleswas dueprimarilyto the increase in net sales for fiscal 2006 compared to fiscal 2005, which allowed us to leverage certain fixed costs, over greater total net sales, improved pricing from some of our vendorsdue to
our larger merchandise purchases and reduced freight costs, distribution costs and buying costs asapercentage of net sales.10.0% same store sales decline.Selling, General and Administrative Expenses
Selling, general and administrative, or "SGSG&A" expenses in fiscal 2006 were $75.8 million compared with $52.5was $122.0 million in fiscal2005,2009 compared to $109.9 million in fiscal 2008, an increase of$23.3$12.1 million or44.4%11.0%.ThisSG&A as a percent of sales increased by 310 basis points in fiscal 2009 to 30.0% compared to 26.9% in fiscal 2008. The primary contributors to this increasewas primarily the result of costswere a 180 basis points increase for expenses associated withoperatingthe opening of 36 new stores,increases in infrastructure40 basis points related to impairment charges on 21 stores, andadministrative staff to support our growth and thelegal settlement costs contributing 30 basis points. New stores generally open with lower revenues than stores that have been open greater than one year, but a majority ofbeing a public company, including Sarbanes-Oxley costs, accounting fees, legal fees, and other related expenses. As a percentage of net sales, SG&A expenses decreased to 25.4% in fiscal 2006 from 25.5% in fiscal 2005. The decrease in SG&A expenses as a percentage of net sales was primarily a result of leveraging fixednew store operating costsoffset by an increase in store payroll for neware not meaningfully lower than storesof $9.5 million, additional depreciation of $3.0 million, Sarbanes-Oxley costs of $1.0 million, increased stock based compensation expense of $1.7 million and to a lesser extent, additional infrastructure and administrative staff costs to support our growth.Operating Profitgreater than one year old. As a result,
of the above factors, operating profit increasedthese stores contribute to$32.4 million for fiscal 2006, compared with $20.0 million in fiscal 2005 an increase of $12.4 million or 62.0%. Ashigher SG&A as apercentage of net sales, operating profit was 10.9% in fiscal 2006 compared with 9.8% in fiscal 2005.Provision for Income TaxesProvision for income taxes was $12.8 million for fiscal 2006 compared with $7.8 million for fiscal 2005. The effective tax rate was 37.9% for fiscal 2006 and 2005.Net IncomeNet income increasedpercent to$20.9 million in fiscal 2006 compared to $12.9 million in fiscal 2005, an increase of $8.0 million or 62.3%. As a percentage of net sales, net income was 7.0% in fiscal 2006 compared with 6.3% in fiscal 2005.sales.Seasonality and Quarterly Results
As is the case with many retailers of apparel and related merchandise, our business is subject to seasonal influences. As a result, we have historically experienced, and expect to continue to experience, seasonal and quarterly fluctuations in our net sales and operating results. Our net sales and operating results are typically lower in the first and second quarters of our fiscal year, while the back-to-school and winter holiday periods in our third and
back-to-school periodsfourth fiscal quarters historically have accounted for the largest percentage of our annual net sales. Quarterlyresults of operations may also fluctuate significantly as a result of a variety of factors, including the timing of store openings and the relative proportion of our new stores to mature stores, fashion trends and changes in consumer preferences, calendar shifts of holiday or seasonal periods, changes in merchandise mix, timing of promotional events, general economic conditions, competition and weather conditions.
The following table sets forth selected unaudited quarterly consolidated statements of operations data for the
periods indicated.last two recent fiscal years. The unaudited quarterly information has been prepared on a basis consistent with the audited consolidated financial statements included elsewhere herein and includes all adjustments that we consider necessary for a fair presentation of the information shown. This information should be read in conjunction withtheour audited consolidated financial statements and the notesthereto appearing elsewhere herein.thereto. The operating results for any fiscal quarter are not indicativeof the operating results for a full fiscal year or for any future period and there can be no assurance that any trend reflected in such results will continue in the future.
Fiscal Year Ended February 3, 2007 Fiscal Year Ended February 2, 2008 First
QuarterSecond
QuarterThird
QuarterFourth
QuarterFirst
QuarterSecond
QuarterThird
QuarterFourth
Quarter(in thousands, except per share data) Net sales $ 47,785 $ 55,756 $ 82,258 $ 112,378 $ 68,791 $ 81,974 $ 104,045 $ 126,606 Gross profit (1) $ 15,204 $ 18,710 $ 30,191 $ 44,113 $ 21,721 $ 28,191 $ 38,508 $ 48,567 Operating profit $ 1,470 $ 1,995 $ 10,921 $ 18,058 $ 2,183 $ 4,702 $ 12,722 $ 19,338 Net income $ 1,109 $ 1,642 $ 6,827 $ 11,278 $ 1,617 $ 3,118 $ 8,149 $ 12,442 Basic net income per share $ 0.04 $ 0.06 $ 0.25 $ 0.41 $ 0.06 $ 0.11 $ 0.28 $ 0.43 Dilute net income per share $ 0.04 $ 0.06 $ 0.24 $ 0.39 $ 0.06 $ 0.11 $ 0.28 $ 0.42 Number of stores open end of period 179 221 233 235 254 266 283 285 Comparable store sales increase (2) 19.7 % 12.6 % 10.7 % 12.0 % 11.3 % 11.6 % 13.2 % 4.0 % (1)Note 2—Significant Accounting Policies for "Cost of Goods Sold" reclassification of shipping costs.(2)Comparable store sales percentage changes are calculated by comparing comparable store sales for the applicable fiscal quarter to comparable store sales for the same fiscal quarter in the prior fiscal year. Comparable store sales are based on net sales and stores are considered comparable beginning on the first anniversary of the first day of operations. See "General" above for more information about how we compute comparable store sales.
Fiscal Year Ended January 29, 2011 First
QuarterSecond
QuarterThird
QuarterFourth
Quarter(in thousands, except stores and per share data) Net sales
$ 89,096 $ 97,702 $ 135,859 $ 156,192 Gross profit
$ 25,752 $ 30,716 $ 53,048 $ 60,881 Operating profit (loss)
$ (3,254 ) $ (2,368 ) $ 18,975 $ 24,014 Net income (loss)
$ (1,900 ) $ (1,214 ) $ 12,312 $ 15,005 Basic earnings (loss) per share
$ (0.06 ) $ (0.04 ) $ 0.41 $ 0.50 Diluted earnings (loss) per share
$ (0.06 ) $ (0.04 ) $ 0.40 $ 0.49 Number of stores open at the end of the period
381 393 400 400 Comparable store sales increase
9.1 % 9.3 % 14.4 % 13.0 % Fiscal Year Ended January 30, 2010 First
QuarterSecond
QuarterThird
QuarterFourth
Quarter(in thousands, except stores and per share data) Net sales
$ 76,808 $ 85,170 $ 113,192 $ 132,433 Gross profit
$ 21,900 $ 24,644 $ 40,099 $ 48,095 Operating profit (loss)
$ (3,438 ) $ (5,226 ) $ 8,357 $ 13,042 Net income (loss)
$ (1,658 ) $ (3,085 ) $ 5,073 $ 8,801 Basic earnings (loss) per share
$ (0.06 ) $ (0.10 ) $ 0.17 $ 0.30 Diluted earnings (loss) per share
$ (0.06 ) $ (0.10 ) $ 0.17 $ 0.29 Number of stores open at the end of the period
358 369 378 377 Comparable store sales decrease
(15.3 %) (18.8 %) (8.0 %) (1.7 %) Liquidity and Capital Resources
Our primary
capital requirementsuses of cash are for operational expenditures, capital investments, inventory purchases, store remodeling, store fixtures and ongoing infrastructure improvements such as technology enhancements and distribution capabilities. Historically, our main sources of liquidity have been cash flows fromoperations and borrowings under our revolving credit facility.operations.In May 2005, we completed an initial public offering of our common stock in which we sold 3,750,000 shares and certain selling shareholders sold 3,437,500 shares. We received net proceeds from the offering of approximately $29.2 million, after payment of underwriting discounts and commissions and offering expenses. Since the completion of the offering, we have used all of the net proceeds of the offering to pay down balances on our line of credit, to fund capital expenditures associated with opening new stores, and to fund the "Fast Forward" acquisition. We did not receive any of the proceeds from the sale of shares of common stock by the selling shareholders.The significant components of our working capital are inventory and liquid assets such as cash, cash equivalents, current marketable securities and receivables,
specifically credit card receivables,reduced byshort-term debt,accounts payable and accrued expenses. Our working capital position benefits from the fact that we generally collect cash from sales to customers the same day or within several days of the related sale, while we typically have longer payment terms with our vendors.At
the end of fiscal 2007January 29, 2011 and January 30, 2010, we heldtwo Auction Rate Securities totaling $2.0one $1.0 millionor 3.1%par value auction rate security valued at $0.9 million, net ofour investment portfolio.a $0.1 million temporary impairment charge. The $1.0 million security failed to sell at itsscheduled auction in March 2009 and March 2010. In March 2010, the interest rate for the security reset to a prescribed tax-free rate of 0.68% from 1.16%. We previously held another $1.0 million auction rate security that was redeemed at par in May 2009. We currently do not intend to hold
these securitiesthe security beyondtheirthe next auction date and will try to sellthese securitiesthis security whentheirthe auctiondates comedate comes up in Marchand May, respectively.2011. However, therecentuncertainties in the credit markets have prevented us and other investors from liquidating holdings of auction rate securities inrecentauctions for these securities because the amountof securities submitted for sale has exceeded the amount of purchase orders. If the
auctions fail,March 2011 auction fails, we plan to holdthese securitiesthe security until the next auction date and thesecuritiessecurity coupon rate will reset to a prescribed"failure"“failure” rate.Unsuccessful auctionsAn unsuccessful auction could result in our holdingsecuritiesthe security beyondtheirthe next scheduled auction resetdates if a secondary market does not develop;date; therefore, limiting the short-term liquidity ofthese investments.the investment. The security has been classified as available-for-sale marketable securities and included in long-term investments on the consolidated balance sheets at January 29, 2011 and January 30, 2010.At January 29, 2011 and January 30, 2010, cash, cash equivalents and current marketable securities were $128.8 million and $108.1 million. Working capital, the excess of current assets over current liabilities, was $155.4 million at the end of fiscal 2010, up 16% from $133.9 million at the end of fiscal 2009. The increase in cash, cash equivalents and current marketable securities and working capital in fiscal 2010 were due primarily to the increased cash flow from operations driven primarily by an increase in net income, partially offset by the costs of opening 27 stores in fiscal 2010 and the purchase of our distribution center in Corona, California.
The following table summarizes our cash flows from operating, investing and financing activities for each of the past three fiscal years (in thousands):
Fiscal Year Ended January 29,
2011January 30,
2010January 31,
2009Total cash provided by (used in)
Operating activities
$ 48,692 $ 45,116 $ 38,337 Investing activities
(44,011 ) (78,065 ) (11,943 ) Financing activities
5,108 1,460 (5,282 ) Increase (decrease) in cash and cash equivalents
$ 9,789 $ (31,489 ) $ 21,112 Operating Activities
Net cash provided by operating activities increased by $3.6 million from $45.1 million in fiscal 2009 to $48.7 million in fiscal 2010. Our operating cash flows result primarily from cash received from our customers, offset by cash payments we make for inventory, employee compensation, store occupancy expenses and other operational expenditures. Cash received from our customers generally corresponds to our net sales. Because our customers primarily use credit cards or cash to buy from us, our receivables from customers settle quickly. Changes to our operating cash flows have historically been driven primarily by changes in operating income and changes to the components of working capital, as well as changes to non-cash items such as deferred taxes, depreciation, amortization and accretion and excess tax benefit from stock-based compensation. Net cash provided by operating activities increased by $6.8 million from $38.3 million in fiscal 2008 to $45.1 million in fiscal 2009. The increase was primarily due to changes in working capital, partially offset by a decrease in net income in fiscal 2009 compared to 2008.
Investing Activities
Net cash used in investing activities was $44.0 million in fiscal 2010 primarily related to capital expenditures of $29.4 million for new store openings, existing store renovations and the purchase of our new distribution center in Corona, California and by net purchases of marketable securities of $14.7 million. Net cash used in investing activities was $78.1 million in fiscal 2009 primarily related to capital expenditures for new
store openings and existing store renovations of $16.6 million and by net purchases of marketable securities of $61.5 million. Net cash used in investing activities was $11.9 million in fiscal 2008 primarily related to capital expenditures for new store openings and existing store renovations of $28.3 million partially offset by net sales of marketable securities of $16.4 million.
Financing Activities
Net cash provided by financing activities in fiscal 2010 was $5.1 million related to proceeds from stock option exercise and the associated tax benefits. Net cash provided by financing activities in fiscal 2009 was $1.5 million related to proceeds from stock option exercise and the associated tax benefits. Net cash used in financing activities in fiscal 2008 was $5.3 million primarily related to short-term use of bank funds partially offset by proceeds from stock option exercise and associated tax benefits.
Sources of Liquidity
Our most significant sources of liquidity continue to be funds generated by operating activities, available cash, cash equivalents and current marketable securities. We expect these sources of liquidity and available borrowings under our revolving credit facility will be sufficient to meet our foreseeable cash requirements for operations and planned capital expenditures for at least the next twelve months. Beyond this time frame, if cash flows from operations and borrowings under our revolving credit facility are not sufficient to meet our capital requirements, then we will be required to obtain additional equity or debt financing in the future. However, there can be no assurance that equity or debt financing will be available to us when we need it or, if available, that the terms will be satisfactory to us and not dilutive to our then-current shareholders.
We renewed and amended our secured credit agreement with Wells Fargo HSBC Trade Bank, N.A., on June 10, 2009, and the prior facility agreement was terminated. The credit agreement provides us with a secured revolving credit facility until September 1, 2011 of up to $25.0 million. The secured revolving credit facility provides for the issuance of a standby letter of credit in an amount not to exceed $5.0 million outstanding at any time and with a term not to exceed 365 days. The commercial line of credit provides for the issuance of a commercial letter of credit in an amount not to exceed $10.0 million and with terms not to exceed 120 days. The amount of borrowings available at any time under our secured revolving credit facility is reduced by the amount of standby and commercial letters of credit outstanding at that time. There were no outstanding borrowings under the secured revolving credit facility at January 29, 2011 or January 30, 2010. We had open commercial letters of credit outstanding under our secured revolving credit facility of $0.5 million and $0.6 million at January 29, 2011 and January 30, 2010. The secured revolving credit facility bears interest at the Daily One Month LIBOR rate plus 1.00%. The credit agreement contains a number of restrictions and covenants that generally limit our ability to, among other things, (1) incur additional debt, (2) undergo a change in ownership and (3) enter into certain transactions. The credit agreement also contains financial covenants that require us to meet certain specified financial tests and ratios, including, a maximum net loss not to exceed $10.0 million after taxes on a trailing four-quarter basis provided, that, there shall be added to net income all charges for impairment of goodwill and store assets not to exceed $5.0 million in aggregate, and a minimum quick ratio of 1.25. The quick ratio is defined as our cash and near cash equivalents plus certain defined receivables divided by the outstanding borrowings. All of our personal property, including, among other things, our inventory, equipment and fixtures, has been pledged to secure our obligations under the credit agreement. We must also provide financial information and statements to our lender. We were in compliance with all such covenants at January 29, 2011.
Capital Expenditures
Our capital requirements include construction and fixture costs related to the opening of new stores
and for maintenanceand remodeling expenditures for existing stores. Future capital requirements will depend on many factors, including the pace of new store openings, the availability of suitable locations for new stores and the nature of arrangements negotiated with landlords. In that regard, our net investment to open a new store has varied significantly in the past due to a number of factors, including the geographic location and size of the new store, and is likely to vary significantly in the future.During fiscal 2010, we spent $29.4 million on capital expenditures, related to investment in 27 new stores and 3 remodeled stores at a cost of $10.0 million, the acquisition and build-out costs of our new distribution center in Corona, California of $12.9 million, the acquisition costs of $3.2 million for land in Lynnwood, Washington, which we plan to use as the location of our new home office and $3.3 million in information technology projects and other improvements.
During fiscal 2009, we spent $16.6 million on capital expenditures, related to investment in 36 new stores and 7 remodeled stores at a cost of $14.8 million and $1.8 million in information technology projects and other improvements.
During fiscal 2008, we spent $28.3 million on capital expenditures, related to investment in 58 new stores and 8 remodeled stores at a cost of $27.1 million and $1.2 million in information technology projects and other improvements.
In upcoming fiscal 2011, we expect to spend approximately
$34.0$32 million to$35.0$34 million on capital expenditures, a majority of which will relate to leasehold improvements and fixtures for the5744 new stores we plan to open in fiscal2008,2011 anda smaller amount will relate to equipment, systems and improvements forconstruction of ourdistribution center and support infrastructure. However, therenew home office building in Lynnwood, Washington. There can be no assurance that the number of stores that we actually open in fiscal20082011 will not be different from the number of stores we plan to open, or that actual fiscal20082011 capital expenditures will not differ from this expected amount.We expect cash flows from operations and available borrowings under our revolving credit facility will be sufficient to meet our foreseeable cash requirements for operations and planned capital expenditures for at least the next twelve months. Beyond this time frame, if cash flows from operations, and borrowings under our revolving credit facility are not sufficient to meet our capital requirements, then we will be required to obtain additional equity or debt financing in the future. There can be no assurance that equity or debt financing will be available to us when we need it or, if available, that the terms will be satisfactory to us and not dilutive to our then-current shareholders.Net cash provided by operating activities for fiscal 2007 was $34.3 million compared to $34.2 million for fiscal 2006. The change was primarily due to an increase in net income, offset by an increase in inventory needed to support 50 new stores and a decrease in trade accounts payable due to the timing of inventory receipts and associated payment in the fourth quarter. In addition, fiscal 2006 cash flow provided by operating activities benefited due to parts of Washington being declared a federal disaster area due to severe weather in the fourth quarter of fiscal 2006. In accordance with the Presidential Disaster Area tax relief, we deferred our federal income tax payment of $2.5 million from January 2007 to February 2007. This positively impacted fiscal 2006's cash flow provided by operations and negatively impacted fiscal 2007's cash flow provided by operations.Net cash used in investing activities was $51.2 million in fiscal 2007 primarily related to capital expenditures for new store openings and existing store renovations and net purchases of marketable securities of $20.5 million. Net cash used in investing activities was $44.4 million in fiscal 2006, primarily related to capital expenditures for new store openings and existing store renovations, the acquisition of the Fast Forward stores for $16.5 million and net purchases of marketable securities of $5.7 million and $54.7 million in fiscal 2005, primarily related to net purchases of marketable securities of $38.3 million and capital expenditures for new store openings and existing store renovations.Net cash provided by financing activities in the fiscal 2007 was $20.7 million, primarily related to proceeds from stock option exercise and associated tax benefits. Net cash used in financing activities in fiscal 2006 was $13.6 million, primarily related to proceeds from stock option exercise and the associated tax benefit and short term use of bank funds. Net cash used in financing activities in fiscal 2005 was $34.3 million, primarily related to proceeds from our initial public offering on May 5, 2005.We have a credit agreement with Wells Fargo HSBC Trade Bank, N.A. The credit agreement provides us with a secured revolving credit facility until August 30, 2009 of up to $25.0 million. Thisfacility replaces our $20.0 million secured revolving credit facility with Bank of America, N.A., which terminated effective August 31, 2006. The secured revolving credit facility provides for the issuance of standby commercial letters of credit in an amount not to exceed $5.0 million outstanding at any time and with a term not to exceed 365 days, although the amount of borrowings available at any time under our secured revolving credit facility is reduced by the amount of standby letters of credit outstanding at that time. There were no outstanding borrowings under the secured revolving credit facility at February 2, 2008 or February 3, 2007. The Company had open letters of credit outstanding under our secured revolving credit facility of $0.5 million at February 2, 2008 and approximately $0.7 million at February 3, 2007. The secured revolving credit facility bears interest at floating rates based on the lower of the prime rate (6.00% at February 2, 2008) minus 0.50% or the LIBOR rate (4.22% at February 2, 2008), plus 1% for advances over $500,000 for a minimum of 30 days and a maximum of 180 days. The credit agreement contains a number of restrictions and covenants that generally limit our ability to, among other things, (1) incur additional debt, (2) undergo a change in ownership and (3) enter into certain transactions. The credit agreement also contains financial covenants that require us to meet certain specified financial tests and ratios, including, minimum net income after taxes, maximum total liabilities divided by tangible net worth and minimum quick asset ratio. All of our personal property, including, among other things, our inventory, equipment and fixtures, has been pledged to secure our obligations under the credit agreement. We must also provide financial information and statements to our lender. We were in compliance with all such covenants at February 2, 2008.Contractual Obligations and Commercial Commitments
There
waswere no material changes outside the ordinary course of business in our contractual obligations during the fiscal year endedFebruary 2, 2008. Our operating lease obligations are not recognized as liabilities in the financial statements.January 29, 2011. The following table summarizes the total amount of future payments due undercertain ofour contractual obligationsand the amount of those payments due in future periods as of February 3, 2007at January 29, 2011 (in thousands):Contractual Obligations Total Less than
1 Year1-3 Years 3-5 Years More than
5 YearsOperating Lease Obligations $ 221,569 $ 27,876 $ 55,381 $ 50,828 $ 87,484 Purchase Obligations 59,548 59,548 — — — Letters of Credit 500 500 — — — $ 281,617 $ 87,924 $ 55,381 $ 50,828 $ 87,484 Total Fiscal
2011Fiscal 2012 and
Fiscal 2013Fiscal 2014 and
Fiscal 2015Thereafter Operating Lease Obligations
$ 347,801 $ 46,721 $ 93,763 $ 87,304 $ 120,013 Purchase Obligations
76,474 76,474 — — — Total
$ 424,275 $ 123,195 $ 93,763 $ 87,304 $ 120,013 We occupy our retail stores and combined home office and
distributionecommerce fulfillment center under operating leases generally with terms of five to ten years.SomeAt January 29, 2011, we were committed to property owners for operating lease obligations for $347.8 million. A majority of our leaseshaveprovide for ongoing co-tenancy requirements or early cancellation clauseswhichthat would further lower rental rates, or permit lease terminations, or both, in theleaseevent that co-tenants cease tobe terminated by usoperate for specific periods or if certain sales levels are not met in specific periods.Some leases contain renewal options for periods ranging from one to five years under substantiallyMost of thesame terms and conditions as the original leases. In addition to future minimum lease payments, substantially all of ourstore leasesprovide for additional rental payments (or "percentage rent") if sales at the respective stores exceed specified levels, as well as therequire payment ofcommon area maintenance chargesa specified minimum rent andreal estate taxes.a contingent rent based on a percentage of the store’s net sales in excess of a specified threshold. Amounts in the above table do not include percentage rent, common area maintenance charges or real estatetaxes. Most of our lease agreements have defined escalating rent provisions, which we have straight-lined over the term of the lease, including any lease renewals deemed to be probable. For certain locations, we receive cash tenant allowancestaxes unless these costs are fixed andwe have reported these amounts as a deferred liability which is amortized to rent expense over the term of the lease, including any lease renewals deemed to be probable. Rent expense, including common area maintenance and other occupancy costs, was $22.2 million, $31.9 million and $43.5 million for fiscal 2005, 2006, and 2007, respectively.determinable.At
February 2, 2008,January 29, 2011, we had outstanding purchase orders to acquiremerchandise from vendors for
approximately $59.5 million.$76.5 million, including $0.5 million of letters of credit outstanding. We have an option to cancel these commitments with no notice prior toshipment. At February 2, 2008,shipment, except for private label purchase orders in which wehad approximately $0.5 million of letters of credit outstanding.are obligated to repay certain contractual amounts upon cancellation.Off-Balance Sheet Obligations
Our only off-balance sheet contractual obligations and commercial commitments as of February 2, 2008 related to operating lease obligations and letters of credit.Wehave excluded these items from our balance sheet in accordance with generally accepted accounting principles "GAAP". We presently dodid not have anynon-cancelable purchase commitments. At February 2, 2008 we had outstanding purchase orders to acquire merchandise from vendors for approximately $59.5 million. These purchases are expected to be financed by cash flows from operations and borrowings under our revolving credit facility. We have an option to cancel these commitments with no notice prior to shipment. At February 2, 2008 we had approximately $0.5 million of letters of credit outstanding under our revolving credit facility.off-balance sheet arrangements at January 29, 2011.Impact of Inflation
We do not believe that inflation has had a material impact on our net sales or operating results for the past three fiscal years. There can be no assurance that our business will not be affected by inflation in the future.
Quantitative and Qualitative Disclosures About Market Risk
See discussion in Item 7A—
"”Quantitative and Qualitative Disclosures About Market Risk."”Critical Accounting Policies and EstimatesIn preparing financial statements in accordance with GAAP, we are required to make estimates and assumptions that have an impact on the assets, liabilities, revenue and expense amounts reported. These estimates can also affect supplemental information disclosed by us, including information about contingencies, risk, and financial condition. We believe, given current facts and circumstances that our estimates and assumptions are reasonable, adhere to GAAP, and are consistently applied. Inherent in the nature of an estimate or assumption is the fact that actual results may differ from estimates and estimates may vary as new facts and circumstances arise. In preparing the consolidated financial statements, we make routine estimates and judgments in determining the net realizable value of accounts receivable, inventory, fixed assets, prepaid assets, goodwill and certain liabilities. We believe our most critical accounting estimates and assumptions are in the following areas:Revenue recognition and sales returns reserve.We recognize revenue upon purchase by customers at our retail store locations or upon shipment for orders placed through our website as both title and risk of loss have transferred. We offer a return policy of generally 30 days and we accrue for estimated sales returns based on our historical sales returns results. The amounts of these sales returns reserves vary during the year due to the seasonality of our business. Actual sales returns could be higher or lower than our estimated sales returns due to customer buying patterns that could differ from historical trends.Valuation of merchandise inventories.We carry our merchandise inventories at the lower of cost or market. Merchandise inventories may include items that have been written down to our best estimate of their net realizable value. Our decisions to write-down our merchandise inventories are based on our current rate of sale, the age of the inventory and other factors. Actual final sales prices to our customers may be higher or lower than our estimated sales prices and could result in a fluctuation in gross margin. Historically, any additional write-downs have not been significant and we do not adjust the historical carrying value of merchandise inventories upwards based on actual sales experience.Leasehold improvements and equipment.We review the carrying value of our leasehold improvements and equipment for impairment whenever events or changes in circumstances indicate that the carrying value of such assets may not be recoverable. Measurement of the impairment loss is based on the fair value of the asset or group of assets. Generally, fair value will be determined using valuation techniques, such as the expected present value of future cash flows. The actual economic lives of these assets may be different than our estimated useful lives, thereby resulting in a different carrying value. These evaluations could result in a change in the depreciable lives of those assets and therefore our depreciation expense in future periods.Impairment of Long-Lived Assets.We review long-lived assets for impairment whenever events or changes in circumstances indicate that the carrying amount of an asset may not be recoverable. Recoverability of assets to be held and used is determined by a comparison of the carrying amount of an asset to future undiscounted net cash flows expected to be generated by the asset. If such assets are considered impaired, the impairment recognized is measured by comparing projected individual store discounted cash flow to the asset carrying values. Declines in projected store cash flow could result in the impairment of assets.Lease Accounting.The Company occupies its retail stores and combined home office and distribution center under operating leases generally with terms of five to ten years. Some of these leases have early cancellation clauses, which permit the lease to be terminated if certain sales levels are not met in specific periods. Some leases contain renewal options for periods ranging from one to five years under substantially the same terms and conditions as the original leases. Most of the store leases require payment of a specified minimum rent, plus a contingent rent based on a percentage of the store's net sales in excess of a specified threshold. Most of the lease agreements have defined escalating rent provisions, which are straight-lined over the term of the related lease, including any lease renewals deemed to be probable. The Company straight-lines and recognizes its rent expense over the term of the lease, plus the construction period prior to occupancy of the retail location, using a mid-month convention. For certain locations, the Company receives cash tenant allowances and has reported these amounts as a deferred liability which is amortized to rent expense over the term of the lease.Accounting for Income Taxes.As part of the process of preparing the financial statements, income taxes are estimated for each of the jurisdictions in which we operate. This process involves estimating actual current tax exposure together with assessing temporary differences resulting from differing treatment of items for tax and accounting purposes. These differences result in deferred tax assets and liabilities, which are included within the balance sheet. The likelihood that deferred tax assets will be recovered from future taxable income is assessed, recognizing that future taxable income may give rise to new deferred tax assets. To the extent that future recovery is not likely, a valuation allowance would be established. To the extent that a valuation allowance is established or increased, an expense will be included within the tax provision in the income statement.Significant management judgment is required in determining the provision for income taxes, deferred tax assets and liabilities and any valuation allowance recorded against net deferred tax assets. Based on our history of operating earnings, no valuation allowance has been recorded as of February 2, 2008. In the event that actual results differ from these estimates, or these estimates are adjusted in future periods, a valuation allowance may need to be established, which could impact our financial position and results of operations. As described in Note 2 to the financial statements, "Recent accounting pronouncements" the Company adopted the provisions of FASB Interpretation No. 48,"Accounting for Uncertainty in Income Taxes"("FIN 48"), on February 4, 2007. The Company's policy is to recognize penalties and interest related to unrecognized tax benefits in income tax expense. The adoption of FIN 48 did not have a material effect on the Company's consolidated financial position or results of operations for the year ended February 2, 2008.Provisions for income taxes are based on numerous factors that are subject to audit by the Internal Revenue Service and the tax authorities in the various jurisdictions in which we do business.Stock-based compensation.Effective January 29, 2006, we adopted the fair value method of accounting for stock-based compensation arrangements in accordance with FASB Statement No. 123(R), Share-Based Payment ("SFAS No. 123(R)"), under provisions of Staff Accounting Bulletin N0. 107 ("SAB 107") using the modified prospective method of transition. Under the provisions of SFAS No. 123(R), the estimated fair value of share-based awards granted under the 2005 Stock Incentive Plan is recognized as compensation expense over the vesting period. Using the modified prospective method, compensation expense is recognized beginning with the effective date of adoption of SFAS No. 123(R) for all share-based issuances (i) granted after the effective date of adoption and (ii) granted prior to the effective date of adoption and after our initial public offering on May 5, 2005. Prior to January 29, 2006, we accounted for stock-based employee compensation plans using the intrinsic value method of accounting in accordance with Accounting Principles Board Opinion No. 25,"Accounting for Stock Issued to Employees"("APB 25"), and its related interpretations. Under the provisions of APB 25, no compensation expense was recognized when stock options were granted with exercise prices equal to or greater than market value on the date of grant.We recorded $4.6 million of total stock-based compensation expense for the year ended February 2, 2008 of which $0.8 million was attributable to the Board of Directors as required by the provisions of SFAS No. 123(R). The stock-based compensation expense is calculated on an accelerated method over the vesting periods of the related options. This charge had no impact on our reported cash flowsAt February 2, 2008 there was approximately $9.2 million of total unrecognized compensation cost related to unvested stock options of which approximately $0.5 million was attributable to the Board of Directors. This cost is expected to be recognized on a weighted-average basis over a period of approximately eight years.We account for unvested stock-based employee compensation arrangements granted prior to our initial public offering on the intrinsic value method as allowed by SFAS 123(R).Business Acquisition.In June 2006, we completed the acquisition of 100% of the ownership of Action Concepts Fast Forward, Ltd. (a limited partnership) ("Fast Forward"), an apparel and accessory retail sales company which operated 20 stores (17 in Texas, 2 in Oklahoma and 1 in California). The transaction was accounted for under the purchase method of accounting and, accordingly, the purchased assets and assumed liabilities were recorded at their estimated fair values. The Company incurred transaction expenses of approximately $663,000 related to the employee severance and transition expense of the acquisition. As of February 2, 2008, this amount has been paid in full.Recently IssuedRecent Accounting PronouncementsIn June 2006, the FASB issued Interpretation No. 48 ("FIN 48"), "Accounting for Uncertainty in Income Taxes—an InterpretationSee Item 15 ofFASB Statement No. 109."FIN 48 prescribes a recognition thresholdPart IV, “Exhibits andmeasurement attribute for the financial statement recognition and measurement of a tax position taken or expected to be taken in a tax return, and provides guidance on de-recognition, classification, interest and penalties, accounting in interim periods, disclosure, and transition. FIN 48 is effective for fiscal years beginning after December 15, 2006. The Company adopted the provisions of FIN 48, on February 4, 2007. The adoption of FIN 48 did not have a material effect on the Company's consolidated financial position or results of operations for the year ended February 2, 2008. Interest recognized in accordance with this Interpretation may be classified in the financial statements as either income taxes or interest expense, based on the accounting policy election of the enterprise. The Company has elected to classify any interest expense recognized under this Interpretation as income taxes.In September 2006 the FASB issued SFAS No. 157, "Fair Value Measurements." SFAS No. 157 defines fair value, establishes framework for measuring fair value in accordance with generally accepted accounting principles and expands disclosures about fair value measurements. SFAS No. 157 is effective for financial statements issued for fiscal years beginning after November 15, 2007, however the FASB has delayed the effective date of SFAS 157 to fiscal years beginning after November 15, 2008 for nonfinancial assets and nonfinancial liabilities, except those items recognized or disclosed at fair value on an annual or more frequently occurring basis.The Company does not expect the adoption of SFAS No. 157 to have a material effect on the Company's consolidated financial position or results of operations.In February 2007, the FASB issued SFAS No. 159,"The Fair Value Option for Financial Assets and Financial Liabilities"including an amendment of FASB Statement No. 115, which provides entities with an option to report selected financial assets and liabilities at fair value. SFAS No.159 also establishes presentation and disclosure requirements designed to facilitate comparisons between entities that choose different measurement attributes for similar types of assets and liabilities. This statement is effective as of the beginning of the first fiscal year that begins after November 15, 2007. We are currently evaluating the impact that SFAS No. 159 will have on our consolidated financial statements.In December 2007, the FASB issued SFAS No. 141 (revised 2007),"Business Combinations" ("SFAS 141(R)"), which replaces SFAS No. 141,"Business Combinations"("SFAS 141"). SFAS 141(R) retains the underlying concepts of SFAS 141 in that all business combinations are still required to be accounted for at fair value under the acquisition method of accounting but SFAS 141(R) changed the method of applying the acquisition method in a number of significant aspects. Acquisition costs will generally be expensed as incurred; non-controlling interests will be valued at fair value at the acquisition date; in-process research and development will be recorded at fair value as an indefinite-lived intangible asset at the acquisition date; restructuring costs associated with a business combination will generally be expensed subsequent to the acquisition date; and changes in deferred tax asset valuation allowances and income tax uncertainties after the acquisition date generally will affect income tax expense. SFAS 141(R) is effective on a prospective basis for all business combinations for which the acquisition date is on or after the beginning of the first annual period subsequent to December 15, 2008, with the exception of the accounting for valuation allowances on deferred taxes and acquired tax contingencies. SFAS 141(R) amends SFAS No. 109, "Accounting for Income Taxes," such that adjustments made to valuation allowances on deferred taxes and acquired tax contingencies associated with acquisitions that closed prior to the effective date of SFAS 141(R) would also apply the provisions of SFAS 141(R). Early adoption is not permitted. We are currently evaluating the effects, if any, that SFAS 141(R) may have on our consolidated financial statements.In December 2007, the FASB issued SFAS No. 160, "Non-controlling Interests inConsolidated FinancialStatements." SFAS No. 160 amendsStatements—Note 2 Summary of Significant AccountingResearch Bulletin No. 51, "Consolidated Financial Statements" and requires (i) classification of non-controlling interests, commonly referred to as minority interests, within stockholders' equity, (ii) net income to include the net income attributable to the non-controlling interest and (iii) enhanced disclosure of activity related to non-controlling interests. SFAS No. 160 is effective for fiscal years beginning after December 15, 2008. We are currently assessing the impact of SFAS No. 160 on our consolidated financial statements.Policies—Recent Accounting Pronouncements.”In December 2007, the Securities and Exchange Commission issued SAB No. 110, "Share-Based Payment"("SAB 110"). SAB 110 amends SAB 107, and allows for the continued use, under certain circumstances, of the "simplified method" in developing an estimate of the expected term on stock options accounted for under SFAS 123R. SAB 110 is effective for stock options granted after December 31, 2007. We are currently evaluating the impact of the new provisions of SAB 110 for stock option awards granted in the future.Risk Factors, Issues and Uncertainties
Please refer to the information set forth under Item 1A, “Risk Factors,” above for a discussion of risk factors, issues and uncertainties that our business faces.
Item 7A. QUANTITATIVE AND QUALITATIVE DISCLOSURES ABOUT MARKET RISK Item 7A. QUANTITATIVE AND QUALITATIVE DISCLOSURES ABOUT MARKET RISKWe are susceptible to market value fluctuations with regard to our short-term investments. However, due to the relatively short maturity period of those investments and our intention and ability to hold those investments until maturity, the risk of material market value fluctuations is not expected to be significant.
During different times of the year, due to the seasonality of our business, we
have borrowedmay borrow under our revolving credit facility. To the extent we borrow under our revolving credit facility, which bearsinterestsinterest atfloating rates based either ontheprimeDaily One Month LIBOR rateor LIBOR,plus 1.00%, we are exposed to market risk related to changes in interest rates. AtFebruary 2, 2008January 29, 2011, we had no borrowings outstanding under our secured revolving credit facility. At January 29, 2011, we had $0.5 million of open commercial letters of credit outstanding under our secured revolving credit facility. We are not a party to any derivative financial instruments. Fluctuations in interest rates did not have a material effect on the results of operations in2007. We dofiscal 2010.Interest Rate Risk
Our earnings are affected by changes in market interest rates as a result of our short-term and long-term investments, which are primarily invested in state and local municipal securities, U.S. Treasury securities, U.S. Agency securities and variable-rate demand notes, which have long-term nominal maturity dates but feature variable interest rates that reset at short-term intervals. If our current portfolio average yield rate decreased by 10% in fiscal 2010, our net income would have decreased by $0.1 million. Our current expectation is that our investment yields will remain low in 2011 due to historically low interest rates. This amount is determined by considering the impact of the hypothetical yield rates on our cash, cash equivalents, short-term and long-term investment balances. This analysis does not
believeconsider the effects of the reduced level of overall investments thatpotential interest rate fluctuations will materially effectcould happen in such an environment. Further, in thefiscal 2008 resultsevent ofoperations.a change of such magnitude, management would likely take actions to further mitigate its exposure to the change. However, due to the uncertainty of the specific actions that would be taken and their possible effects, the sensitivity analysis assumes no changes in our investments structure.Item 8. CONSOLIDATED FINANCIAL STATEMENTS AND SUPPLEMENTARY DATA Item 8. CONSOLIDATED FINANCIAL STATEMENTS AND SUPPLEMENTARY DATAInformation with respect to this item is set forth in
"Index“Index to the Consolidated FinancialStatements",Statements,” under"Part“Part IV, Item15"15” of this report.Item 9. CHANGES IN AND DISAGREEMENTS WITH ACCOUNTANTS ON ACCOUNTING AND FINANCIAL DISCLOSURECHANGES IN AND DISAGREEMENTS WITH ACCOUNTANTS ON ACCOUNTING AND FINANCIAL DISCLOSURE None.
None.Item 9A. CONTROLS AND PROCEDURESItem 9A. CONTROLS AND PROCEDURES Evaluation of Disclosure Controls and Procedures. We carried out an evaluation, under the supervision and with the participation of our management, including our Chief Executive Officer
("CEO"(“CEO”) and Chief Financial Officer("CFO"(“CFO”), of the effectiveness of the design and operation of our disclosure controls and procedures (as defined in Securities Exchange Act Rule 13a-15(e)). Based on this evaluation, our CEO and CFO concluded that, as ofFebruary 2, 2008January 29, 2011 our disclosure controls and procedures were effective.Changes in Internal Control Over Financial Reporting. There has been no change in our internal control over financial reporting (as defined in Securities Exchange Act Rule 13a-15(f)) during the quarter ended
February 2, 2008January 29, 2011 that has materially affected, or is reasonably likely to materially affect, our internal control over financial reporting. The effectiveness of Zumiez Inc. internal control over financial reporting as ofFebruary 2, 2008January 29, 2011 has been audited by Moss Adams LLP, theCompany'sCompany’s independent registered public accounting firm, as stated in their report, which appears herein.�� Management'sManagement’s Report on Internal Control Over Financial Reporting is included in this Form 10-K under PartIII,IV, Item 15,"Exhibits“Exhibits and Consolidated Financial Statements."”Item 9B. OTHER INFORMATION None.
Item 9B. OTHER INFORMATION
PART IIINone.Item 10. DIRECTORS, EXECUTIVE OFFICERS AND CORPORATE GOVERNANCE Item 10. DIRECTORS EXECUTIVE OFFICERS AND CORPORATE GOVERNANCEInformation regarding our directors and nominees for directorship is presented under the headings
"Election“Election of Directors,"” in our definitive proxy statement for use in connection with our20082011 Annual Meeting of Shareholders (the"Proxy Statement"“Proxy Statement”) that will be filed within 120 days after our fiscal year endedFebruary 2, 2008January 29, 2011 and is incorporated herein by this reference thereto. Information concerning our executive officers is set forth under the heading"Executive Officers"“Executive Officers” in our Proxy Statement, and is incorporated herein by reference thereto. Information regarding compliance with Section 16(a) of the Exchange Act, our code of conduct and ethics and certain information related to theCompany'sCompany’s Audit Committee and Governance Committee is set forth under the heading"Corporate Governance"“Corporate Governance” in our Proxy Statement, and is incorporated herein by reference thereto.Item 11. EXECUTIVE COMPENSATION Item 11. EXECUTIVE COMPENSATIONInformation regarding the compensation of our directors and executive officers and certain information related to the
Company'sCompany’s Compensation Committee is set forth under the headings"Executive“Executive Compensation," "Director” “Director Compensation," "Compensation” “Compensation Discussion and Analysis," "Compensation” “Report of the Compensation CommitteeReport"of the Board of Directors” and"Compensation“Compensation Committee Interlocks and InsiderParticipation"Participation” in our Proxy Statement, and is incorporated herein by this reference thereto.Item 12. SECURITY OWNERSHIP OF CERTAIN BENEFICIAL OWNERS, AND MANAGEMENT AND RELATED SHAREHOLDER MATTERS Item 12. SECURITY OWNERSHIP OF CERTAIN BENEFICIAL OWNERS AND MANAGEMENT AND RELATED SHAREHOLDER MATTERSInformation with respect to security ownership of certain beneficial owners and management is set forth under the headings
"Security“Security Ownership of Certain Beneficial Owners andManagement"Management” and"Equity“Equity Compensation PlanInformation"Information” in our Proxy Statement, and is incorporated herein by this reference thereto.Item 13. CERTAIN RELATIONSHIPS AND RELATED TRANSACTIONS AND DIRECTOR INDEPENDENCE Item 13. CERTAIN RELATIONSHIPS AND RELATED TRANSACTIONS AND DIRECTOR INDEPENDENCEInformation regarding certain relationships and related transactions and director independence is presented under the heading
"Corporate Governance"“Corporate Governance” in our Proxy Statement, and is incorporated herein by this reference thereto.Item 14. PRINCIPAL ACCOUNTANT FEES AND SERVICES Item 14. PRINCIPAL ACCOUNTANT FEES AND SERVICESInformation concerning principal accounting fees and services is presented under the heading
"Fees“Fees Paid to Independent Registered Public Accounting Firm for FiscalYear 2007Years 2010 and2006"2009” in our Proxy Statement, and is incorporated herein by this reference thereto.Item 15. EXHIBITS AND CONSOLIDATED FINANCIAL STATEMENTS Item 15. EXHIBITS AND CONSOLIDATED FINANCIAL STATEMENTS.a)Exhibits and Consolidated Financial Statements1.Management's Annual Report on Internal Control Over Financial Reporting.2.Report of Independent Registered Public Accounting Firm on Internal Control over Financial Reporting.3.Consolidated Financial Statements can be found under Item 8 of Part II of this Form 10-K.4.Index to Consolidated Financial Statements.5.(a)(1) Consolidated Financial Statements: 1. Management’s Annual Report on Internal Control Over Financial Reporting. 2. Report of Independent Registered Public Accounting Firm on Internal Control over Financial Reporting. 3. Index to Consolidated Financial Statements. 4. Consolidated Financial Statements. (2) Consolidated Financial Statement Schedules: All financial statement schedules are omitted because the required information is presented either in the consolidated financial statements or notes thereto, or is not applicable, required or material.
(3) Exhibits included or incorporated herein: See Exhibit Index.
MANAGEMENT'SMANAGEMENT’S ANNUAL REPORT ON INTERNAL CONTROL OVER FINANCIAL REPORTINGThe management of Zumiez Inc. (the
"Company"“Company”) is responsible for establishing and maintaining adequate internal control over financial reporting, as defined in Rule 13a-15(f) of the Securities Exchange Act of 1934. TheCompany'sCompany’s internal control over financial reporting is a process designed to provide reasonable assurance regarding the reliability of financial reporting and the preparation of financial statements for external purposes in accordance with generally accepted accounting principles.This process includes policies and procedures that: (i) pertain to the maintenance of records that, in reasonable detail, accurately and fairly reflect the transactions of the Company; (ii) provide reasonable assurance that transactions are recorded as necessary to permit preparation of financial statements in accordance with generally accepted accounting principles, and that receipts and expenditures of the Company are being made only in accordance with authorizations of management and directors of the Company; and (iii) provide reasonable assurance regarding prevention or timely detection of unauthorized acquisition, use, or disposition of the
Company'sCompany’s assets that could have a material effect on the financial statements. Because of its inherent limitations, internal control over financial reporting may not prevent or detect misstatements, and can provide only reasonable, not absolute, assurance that the objectives of the control system are met. Furthermore, because of changes in conditions, the effectiveness of internal control may vary over time.The
Company'sCompany’s management, with the participation of the Chief Executive Officer and Chief Financial Officer, assessed the effectiveness of theCompany'sCompany’s internal control over financial reporting as ofFebruary 2, 2008. Management'sJanuary 29, 2011. Management’s assessment was based on criteria described in theInternal Control—Integrated Framework issued by the Committee of Sponsoring Organizations of the Treadway Commission("COSO"(“COSO”). Based on that assessment, theCompany'sCompany’s management concluded that theCompany'sCompany’s internal control over financial reporting was effective as ofFebruary 2, 2008.January 29, 2011.The effectiveness of Zumiez Inc. internal control over financial reporting as of
February 2, 2008January 29, 2011 has been audited by Moss Adams LLP, theCompany'sCompany’s independent registered public accounting firm, as stated in their report, which appears herein.Pursuant to the requirements of Section 13 or 15(d) of the Securities Exchange Act of 1934, the Registrant has duly caused this report to be signed on its behalf by the undersigned, thereunto duly authorized.
ZUMIEZ INC.
ZUMIEZ INC.
/s/ RICHARDS/ RICHARD M.BROOKSBROOKSSignature3/25/08DateBy:3/15/11Signature
Date By: Richard M. Brooks
Jr., President and
Chief Executive Officer and Director (Principal Executive Officer)/s/ TREVOR S. LANGSignature3/25/08Date/s/ TREVOR S. LANG
By:3/15/11Signature
Date By: Trevor S. Lang, Chief Financial Officer, Chief Administrative Officer and Secretary (Principal Financial Officer and Principal Accounting Officer)
Pursuant to the requirements of the Securities Exchange Act of 1934, this report has been signed by the following persons on behalf of the Registrant and in the capacities and on the dates indicated.
/ s/ THOMASS/ THOMAS D.CAMPIONCAMPION3/15/11 /S/ WILLIAM M. BARNUM, JR. 3/15/11 Signature
Date Signature
Date Thomas D. Campion, Chairman
3/25/08Date/s/ DAVID DEMATTEISignatureDavid DeMattei, Director
3/25/08Date/s/ GERALD F. RYLESSignatureGerald F. Ryles, Director
3/25/08Date/s/ WILLIAM M. BARNUM, JR.SignatureWilliam M. Barnum, Jr., Director
3/25/08Date
/s/ JIM WEBERSignatureJim Weber, DirectorS/ MATTHEW L. HYDE
3/15/11
/S/ JAMES M. WEBER3/ 25/08Date15/11/s/ MATTHEW L. HYDESignature
Date Signature
Date Matthew L. Hyde, Director
James M. Weber, Director
/S/ GERALD F. RYLES
3/15/11
/S/ SARAH G. MCCOY3/ 25/08
15/11Signature
Date Signature
Date Gerald F. Ryles, Director
Sarah G. McCoy, Director
REPORT OF INDEPENDENT REGISTERED PUBLIC ACCOUNTING FIRMTo theThe Board of Directors and ShareholdersofZumiez Inc.
We have audited Zumiez Inc.
's’s (the “Company”) internal control over financial reporting as ofFebruary 2, 2008,January 29, 2011, based on criteria established inInternalControl-IntegratedControl—Integrated Framework issued by the Committee of Sponsoring Organizations of the TreadwayCommission ("the COSO criteria").Commission. TheCompany'sCompany’s management is responsible for maintaining effective internal control over financial reporting and for its assessment of the effectiveness of internal control over financial reporting, included in the accompanyingManagement'sManagement’s Annual Report on Internal Control over Financial Reporting. Our responsibility is to express an opinion on theCompany'sCompany’s internal control over financial reporting based on our audit.We conducted our audit in accordance with the standards of the Public Company Accounting Oversight Board (United States). Those standards require that we plan and perform the audit to obtain reasonable assurance about whether effective internal control over financial reporting was maintained in all material respects. Our audit included obtaining an understanding of internal control over financial reporting, assessing the risk that a material weakness exists, and testing and evaluating the design and operating effectiveness of internal
control.control based on the assessed risk. Our audit alsoincludesincluded performing such other procedures as we considered necessary in the circumstances. We believe that our audit provides a reasonable basis for our opinion.A
company'scompany’s internal control over financial reporting is a process designed to provide reasonable assurance regarding the reliability of financial reporting and the preparation of financial statements for external purposes in accordance with generally accepted accounting principles. Acompany'scompany’s internal control over financial reporting includes those policies and procedures that (1) pertain to the maintenance of records that, in reasonable detail, accurately and fairly reflect the transactions and dispositions of the assets of the company; (2) provide reasonable assurance that transactions are recorded as necessary to permit preparation of financial statements in accordance with generally accepted accounting principles, and that receipts and expenditures of the company are being made only in accordance with authorizations of management and directors of the company; and (3) provide reasonable assurance regarding prevention or timely detection of unauthorized acquisition, use, or disposition of theCompany'scompany’s assets that could have a material effect on the financial statements.Because of its inherent limitations, internal control over financial reporting may not prevent or detect misstatements. Also, projections of any evaluation of effectiveness to future periods are subject to the risk that controls may become inadequate because of changes in conditions, or that the degree of compliance with the policies or procedures may deteriorate.
In our opinion, Zumiez Inc. maintained, in all material respects, effective internal control over financial reporting as of
February 2, 2008, in all material respects,January 29, 2011, based on criteria established inInternal Control—Integrated Framework issued by theCOSO criteria.Committee of Sponsoring Organizations of the Treadway Commission.We also have audited, in accordance with the standards of the Public Company Accounting Oversight Board (United States), the consolidated balance sheets of Zumiez Inc. as of
February 2, 2008January 29, 2011 andFebruary 3, 2007,January 30, 2010, and therelatedconsolidated statements of operations,shareholders'changes in shareholders’ equity, and cash flows for the three fiscal years in the period endedFebruary 2, 2008 and February 3, 2007,January 29, 2011, and our report dated March24, 2008, expresses15, 2011 expressed an unqualified opinionthereon.on those consolidated financial statements./s/ Moss Adams LLP
Seattle, Washington
March
24, 200815, 2011
INDEX TO CONSOLIDATED FINANCIAL STATEMENTSYears ended January 28, 2006, February 3, 2007 and February 2, 2008Reports of Independent Registered Public Accounting
FirmsFirm4447 4648 4749 Consolidated Statements of Changes in
Shareholders'Shareholders’ Equity4850 4951 5052
REPORT OF INDEPENDENT REGISTERED PUBLIC ACCOUNTING FIRMTo theThe Board of Directors and ShareholdersofZumiez Inc.
We have audited the accompanying consolidated balance sheets of Zumiez Inc. (the “Company”) as of
February 2, 2008January 29, 2011 andFebruary 3, 2007January 30, 2010, and the related consolidated statements of operations,shareholders'changes in shareholders’ equity and cash flows for each of theperiodsthree fiscal years in the period endedFebruary 2, 2008 and February 3, 2007.January 29, 2011. These consolidated financial statements are the responsibility of theCompany'sCompany’s management. Our responsibility is to express an opinion on these consolidated financial statements based on our audits.We conducted our audits in accordance with the auditing standards of the Public Company Accounting Oversight Board (United States). Those standards require that we plan and perform the audits to obtain reasonable assurance about whether the consolidated financial statements are free of material misstatement. An audit includes examining, on a test basis, evidence supporting the amounts and disclosures in the consolidated financial statements. An audit also includes assessing the accounting principles used and significant estimates made by management, as well as evaluating the overall consolidated financial statement presentation. We believe that our audits provide a reasonable basis for our opinion.
In our opinion, the consolidated financial statements referred to above present fairly, in all material respects, the consolidated financial position of Zumiez Inc. as of
February 2, 2008January 29, 2011 andFebruary 3, 2007January 30, 2010 and the consolidated results of its operations and its cash flows for each of theperiodsthree fiscal years in the period endedFebruary 2, 2008 and February 3, 2007,January 29, 2011, in conformity with generally accepted accounting principlesgenerally acceptedin the United States of America.As discussed in Notes 2 and 6 to the consolidated financial statements, effective January 29, 2006, Zumiez Inc. changed its method of accounting for share-based payment arrangements to conform to Statement of Financial Accounting Standards No. 123(R),Share-Based Payment.We also have audited, in accordance with the standards of the Public Company Accounting Oversight Board (United States),
the effectiveness ofZumiez Inc.'s’s internal control over financial reporting as ofFebruary 2, 2008,January 29, 2011 based on criteria established inInternalControl-IntegratedControl—Integrated Framework issued by the Committee of Sponsoring Organizations of the Treadway Commission and our report dated March24, 200815, 2011 expressed an unqualifiedopinion.opinion thereon./s/
MOSS ADAMSMoss Adams LLPSeattle, Washington
March
24, 200815, 2011REPORT OF INDEPENDENT REGISTERED PUBLIC ACCOUNTING FIRM
ZUMIEZ INC.To Board of Directors and Shareholders of Zumiez Inc.:In our opinion, the consolidated statements of operations, consolidated statements of changes in shareholders' equity and of cash flows of Zumiez Inc. and its subsidiary for the year ended January 28, 2006, present fairly, in all material respects, the results of operations and cash flows of Zumiez Inc. and its subsidiary for the year ended January 28, 2006, in conformity with accounting principles generally accepted in the United States of America. These financial statements are the responsibility of the Company's management. Our responsibility is to express an opinion on these financial statements based on our audits. We conducted our audits, of these statements in accordance with the standards of the Public Company Accounting Oversight Board (United States). Those standards require that we plan and perform the audit to obtain reasonable assurance about whether the financial statements are free of material misstatement. An audit includes examining, on a test basis, evidence supporting the amounts and disclosures in the financial statements, assessing the accounting principles used and significant estimates made by management, and evaluating the overall financial statement presentation. We believe that our audits provide a reasonable basis for our opinion./s/ PricewaterhouseCoopers LLPSeattle, WashingtonMarch 21, 2006, except for the stock split and revision to previously issued statements of cash flow described in Note 1, as which the date is March 25, 2008.ZUMIEZ INC.
CONSOLIDATED BALANCE SHEETS(In thousands, except share amounts)February 3, 2007 February 2, 2008 Assets Current assets Cash and cash equivalents $ 8,161 $ 11,945 Marketable securities 43,816 64,587 Receivables 5,223 4,775 Inventory 42,157 48,721 Prepaid expenses and other 3,593 4,440 Deferred tax assets 1,551 1,089 Total current assets 104,501 135,557
Leasehold improvements and equipment, net
49,889
65,937Goodwill 12,904 13,154 Deferred tax assets — 1,447 Total long-term assets 62,793 80,538
Total assets
$
167,294
$
216,095
Liabilities and Shareholders' Equity
Current liabilities Trade accounts payable $ 24,164 $ 19,672 Book overdraft 6,083 7,384 Accrued payroll and payroll taxes 4,784 5,097 Income taxes payable 6,598 47 Current portion of deferred rent and tenant allowances 1,377 2,136 Other accrued liabilities 6,566 9,060 Total current liabilities 49,572 43,396
Long-term deferred rent and tenant allowances, less current portion
12,069
18,097Deferred tax liabilities 841 — Total long-term liabilities 12,910 18,097
Total liabilities
62,482
61,493
Commitments and contingencies (Note 8)
Shareholders' equity
Preferred stock, no par value, 40,000,000 shares authorized; none issued and outstanding — — Common stock, no par value, 100,000,000 shares authorized; 27,880,512 shares issued and outstanding at February 3, 2007, 29,002,852 shares issued and outstanding at February 2, 2008 45,311 69,297 Accumulated other comprehensive income (loss) (14 ) 464 Retained earnings 59,515 84,841 Total shareholders' equity 104,812 154,602
Total liabilities and shareholders' equity
$
167,294
$
216,095See acccompanying notes to consolidated financial statementsZUMIEZ INC.CONSOLIDATED STATEMENTS OF OPERATIONS
(Inthousands, except share and per share amounts)
thousands)Fiscal Year Ended January 28,
2006February 3,
2007February 2,
2008Net sales $ 205,589 $ 298,177 $ 381,416 Cost of goods sold 133,047 189,959 244,429 Gross profit 72,542 108,218 136,987
Selling, general and administrative expenses
52,494
75,774
98,042Operating profit 20,048 32,444 38,945
Interest income, net
648
1,178
1,722Other income (expense) (1 ) (16 ) 3 Earnings before income taxes 20,695 33,606 40,670
Provision for income taxes
7,844
12,750
15,344
Net income
$
12,851
$
20,856
$
25,326
Basic net income per share
$
0.50
$
0.76
$
0.89
Diluted net income per share
$
0.47
$
0.73
$
0.86
Weighted average shares used in computation of earnings per share:
Basic
25,879,675
27,542,891
28,608,818
Diluted
27,376,684
28,703,037
29,322,337January 29,
2011January 30,
2010Assets
Current assets
Cash and cash equivalents
$ 11,357 $ 1,568 Marketable securities
117,444 106,483 Receivables
6,129 5,600 Inventories
56,303 50,916 Prepaid expenses and other
7,210 6,102 Deferred tax assets
2,418 3,045 Total current assets
200,861 173,714 Fixed assets, net
78,248 66,008 Goodwill and other intangibles
13,154 13,186 Long-term deferred tax assets
5,703 5,537 Long-term investments
2,766 872 Long-term other assets
899 948 Total long-term assets
100,770 86,551 Total assets
$ 301,631 $ 260,265 Liabilities and Shareholders’ Equity
Current liabilities
Trade accounts payable
$ 16,371 $ 16,817 Accrued payroll and payroll taxes
7,580 6,593 Income taxes payable
4,108 4,006 Deferred rent and tenant allowances
3,719 3,248 Other liabilities
13,683 9,123 Total current liabilities
45,461 39,787 Long-term deferred rent and tenant allowances
27,629 26,375 Long-term other liabilities
1,806 1,427 Total long-term liabilities
29,435 27,802 Total liabilities
74,896 67,589 Commitments and contingencies (Note 9)
Shareholders’ equity
Preferred stock, no par value, 20,000 shares authorized; none issued and outstanding
— — Common stock, no par value, 50,000 shares authorized; 30,835 shares issued and outstanding at January 29, 2011 and 30,251 shares issued and outstanding at January 30, 2010
91,373 81,399 Accumulated other comprehensive (loss) income
(17 ) 101 Retained earnings
135,379 111,176 Total shareholders’ equity
226,735 192,676 Total liabilities and shareholders’ equity
$ 301,631 $ 260,265 See accompanying notes to consolidated financial statements
ZUMIEZ INC.
CONSOLIDATED STATEMENTS OFCHANGES IN SHAREHOLDERS' EQUITY
OPERATIONS(In
thousands)
thousands, except per share amounts)Common Stock Other
Comprehensive
Income
(Loss)Employee
Stock
OptionsRetained
EarningsReceivable
from
ParentShares Amount Total Balance at January 29, 2005 22,610 $ 44 $ 95 — $ 25,808 $ (148 ) $ 25,799 Common shares issued through initial public offering 3,750 29,191 — — — — 29,191 Exercise of common stock options, including tax benefit of $4,457 899 5,535 — — — — 5,535 Stock based compensation — — 165 — — — 165 Cost incurred on behalf of parent — — — — — (1 ) (1 ) Parent receivable forgiven — — — — — 149 149 Unrealized (losses), net — — — (5 ) — — (5 ) Net income — — — — 12,851 — 12,851 Balance at January 28, 2006 27,259 34,770 260 (5 ) 38,659 — 73,684 Exercise of common stock options, including tax benefit of $6,822 622 8,228 — — — — 8,228 Stock based compensation — 2,313 (260 ) — — — 2,053 Unrealized (losses), net — — (9 ) — — (9 ) Net income — — — 20,856 — 20,856 Balance at February 3, 2007 27,881 45,311 — (14 ) 59,515 — 104,812 Exercise of common stock options, including tax benefit of $16,527 1,122 19,417 — — — — 19,417 Stock based compensation — 4,569 — — — — 4,569 Unrealized gains, net — — — 478 — — 478 Net income — — — — 25,326 — 25,326 Balance at February 2, 2008 29,003 $ 69,297 $ — $ 464 $ 84,841 $ — $ 154,602 Fiscal Year Ended January 29,
2011January 30,
2010January 31,
2009Net sales
$ 478,849 $ 407,603 $ 408,669 Cost of goods sold
308,452 272,865 274,134 Gross profit
170,397 134,738 134,535 Selling, general and administrative expenses
133,030 122,003 109,927 Operating profit
37,367 12,735 24,608 Interest income, net
1,496 1,176 2,059 Other (expense) income, net
(8 ) 96 36 Earnings before income taxes
38,855 14,007 26,703 Provision for income taxes
14,652 4,876 9,499 Net income
$ 24,203 $ 9,131 $ 17,204 Basic earnings per share
$ 0.81 $ 0.31 $ 0.59 Diluted earnings per share
$ 0.79 $ 0.30 $ 0.58 Weighted average shares used in computation of earnings per share:
Basic
29,971 29,499 29,127 Diluted
30,794 30,133 29,694 See accompanying notes to consolidated financial statements
ZUMIEZ INC.
CONSOLIDATED STATEMENTS OFCASH FLOWS
CHANGES IN SHAREHOLDERS’ EQUITY(In thousands)
Fiscal Year Ended January 28,
2006February 3,
2007February 2,
2008Cash flows from operating activities: Net income $ 12,851 $ 20,856 $ 25,326 Adjustments to reconcile net income to net cash provided by operating activities: Depreciation and amortization 7,535 10,499 14,762 Deferred tax expense (56 ) (1,306 ) (1,826 ) Stock-based compensation expense 165 2,053 4,569 Loss on disposal of assets 33 132 119 (Gain) Loss from sales of marketable securities, net — 17 (2 ) Excess tax benefit from stock options — (6,822 ) (16,527 ) Changes in operating assets and liabilities: Receivables (1,835 ) (1,309 ) 448 Inventory (6,307 ) (198 ) (6,564 ) Prepaid expenses and other 455 (2,713 ) (847 ) Trade accounts payable 6,361 (3,371 ) (4,492 ) Accrued payroll and payroll taxes 1,827 330 313 Income taxes payable 698 10,112 9,976 Other accrued liabilities (1,024 ) 1,506 2,244 Deferred rent and tenant allowances 3,450 4,409 6,787 Net cash provided by operating activities 24,153 34,195 34,286
Cash flows from investing activities:
Additions to leasehold improvements and equipment (16,453 ) (22,160 ) (30,722 ) Acquisitions, net of cash acquired — (16,542 ) — Purchases of marketable securities (72,651 ) (157,433 ) (143,957 ) Sales and maturities of marketable securities 34,365 151,785 123,459 Net cash used in investing activities (54,739 ) (44,350 ) (51,220 )
Cash flows from financing activities:
Change in book overdraft (429 ) 6,083 1,301 Borrowings on revolving credit facility 19,750 — — Payments on revolving credit facility (19,750 ) (732 ) — Proceeds from exercise of stock options — 1,406 2,890 Proceeds from sale of stock 34,726 — — Excess tax benefit from stock options — 6,822 16,527 Net cash provided by financing activities 34,297 13,579 20,718
Net increase in cash and cash equivalents
3,711
3,424
3,784
Cash and cash equivalents, beginning of period 1,026 4,737 8,161 Cash and cash equivalents, end of period $ 4,737 $ 8,161 $ 11,945
Supplemental disclosure on cash flow information:
Cash paid during the period for interest $ 61 $ — $ 4 Cash paid during the period for income taxes 2,746 4,027 7,185 Non-cash operating activity—dispositon of gift card breakage liability — — 303 Non-cash investing activity—acquisition costs in other accrued liabilities — — 250 Common Stock Accumulated
Other
ComprehensiveRetained Shares Amount Income (Loss) Earnings Total Balance at February 2, 2008
29,003 $ 69,297 $ 464 $ 84,841 $ 154,602 Net income
— — — 17,204 17,204 Change in unrealized loss on available-for-sale investments, net of tax of $213
— — (347 ) — (347 ) Comprehensive income
16,857 Issuance and exercise of stock-based compensation, including tax benefit of $1,173
530 2,102 — — 2,102 Stock-based compensation expense
— 4,390 — — 4,390 Balance at January 31, 2009
29,533 75,789 117 102,045 177,951 Net income
— — — 9,131 9,131 Change in unrealized loss on available-for-sale investments, net of tax of $7
— — (16 ) — (16 ) Comprehensive income
9,115 Issuance and exercise of stock-based compensation, including tax benefit of $707
718 1,461 — — 1,461 Stock-based compensation expense
— 4,149 — — 4,149 Balance at January 30, 2010
30,251 81,399 101 111,176 192,676 Net income
— — — 24,203 24,203 Change in unrealized loss on available-for-sale investments, net of tax of $76
— — (118 ) — (118 ) Comprehensive income
24,085 Issuance and exercise of stock-based compensation, including tax benefit of $3,248
584 5,108 — — 5,108 Stock-based compensation expense
— 4,866 — — 4,866 Balance at January 29, 2011
30,835 91,373 (17 ) 135,379 226,735 See accompanying notes to consolidated financial statements
CONSOLIDATED STATEMENTS OF CASH FLOWS
(in thousands)
Fiscal Year Ended January 29,
2011January 30,
2010January 31,
2009Cash flows from operating activities:
Net income
$ 24,203 $ 9,131 $ 17,204 Adjustments to reconcile net income to net cash provided by operating activities:
Depreciation, amortization and accretion
17,923 22,092 19,470 Deferred taxes
537 (4,886 ) (1,221 ) Stock-based compensation expense
4,866 4,149 4,390 Loss on disposal of assets
283 141 271 Excess tax benefit from stock-based compensation
(3,248 ) (707 ) (1,173 ) Impairment of long-lived assets
105 2,538 812 Other
70 (36 ) (36 ) Changes in operating assets and liabilities:
Receivables
(92 ) (319 ) 220 Inventories
(5,387 ) 1,058 (3,253 ) Prepaid expenses and other
(1,137 ) (656 ) (1,174 ) Trade accounts payable
(446 ) 908 (3,763 ) Accrued payroll and payroll taxes
987 1,854 (358 ) Income taxes payable
3,350 4,475 1,364 Deferred rent and tenant allowances
1,838 3,917 6,814 Other liabilities
4,840 1,457 (1,230 ) Net cash provided by operating activities
48,692 45,116 38,337 Cash flows from investing activities:
Additions to fixed assets
(29,361 ) (16,548 ) (28,349 ) Purchases of marketable securities and other investments
(179,611 ) (128,963 ) (82,607 ) Sales and maturities of marketable securities and other investments
164,961 67,446 99,013 Net cash used in investing activities
(44,011 ) (78,065 ) (11,943 ) Cash flows from financing activities:
Change in book overdraft
— — (7,384 ) Proceeds from exercise of stock-based compensation
1,860 753 929 Excess tax benefit from stock-based compensation
3,248 707 1,173 Net cash provided by (used in) financing activities
5,108 1,460 (5,282 ) Net increase (decrease) in cash and cash equivalents
9,789 (31,489 ) 21,112 Cash and cash equivalents, beginning of period
1,568 33,057 11,945 Cash and cash equivalents, end of period
$ 11,357 $ 1,568 $ 33,057 Supplemental disclosure on cash flow information:
Cash paid during the period for interest
$ 54 $ 10 $ 10 Cash paid during the period for income taxes
10,789 5,288 9,422 Non-cash investing activity—refundable use tax in fixed assets
359 (1,506 ) — Non-cash investing activity—asset retirement obligations in fixed assets
129 1,095 — See accompanying notes to consolidated financial statements
NOTES TO CONSOLIDATED FINANCIAL STATEMENTS
1. Nature
and Ownershipof Business and Basis of PresentationNature of Business—Zumiez Inc. (the
"Company"“Company,” “we,” “us,” “its” and “our”) is a leading specialty retailer of action sports related apparel, footwear, equipment and accessories operating under the Zumiez brand name.As of February 2, 2008 the CompanyAt January 29, 2011, we operated285400 stores primarily located in shopping malls, givingthe Companyus a presence in2737 states.The Company'sOur stores cater to young men and women between the ages of 12 and 24 who seek popular brands representing a lifestyle centered on activities that include skateboarding, surfing, snowboarding, bicycle motocross (or"BMX"“BMX”) and motocross.The Company supportsWe support the action sports lifestyle andpromotes itspromote our brand through a multi-faceted marketing approach that is designed to integrateitsour brand image withits customers'our customers’ activities and interests. In addition,the Company operateswe operate a websitewhichthat sells merchandise online and provides content and a community foritsour target customers. The Companybased in Everett, WA,was formed in August 1978, its home office and ecommerce fulfillment center are located in Everett, Washington and its distribution center is located in Corona, California. The Company operates within one reportable segment. We account for our business operation as one reportable segment based on the similar nature of products sold, production, merchandising and distribution processes involved, target customers and economic characteristics.Fiscal Year—
The Company usesWe use a fiscal calendar widely used by the retail industry that results in a fiscal year consisting of a 52- or53- week53-week period ending on the Saturday closest to January 31. Each fiscal year consists of four 13-week quarters, with an extra week added to the fourth quarter every five or six years. Fiscal2005 and fiscal 2007 were2010 was the 52-weekperiodsperiod ending January 29, 2011. Fiscal 2009 was the 52-week period ended January28, 2006 and February 2,30, 2010. Fiscal 2008respectively. Fiscal 2006wasa 53-weekthe 52-week period endedFebruary 3, 2007.January 31, 2009.Stock Split—On March 15, 2006 the Company's Board of Directors approved a two for one stock split of the Company's common stock that was effected by a share dividend and became effective April 19, 2006. All reference to shares in the consolidated financial statements and the accompanying notes, including but not limited to the number of shares and per share amounts, unless otherwise noted, have been adjusted to reflect the stock split on a retroactive basis. Previously awarded stock options in the Company's common stock have been retroactively adjusted to reflect the stock split.Reincorporation—On April 29, 2005 the Company reincorporated in the State of Washington from the State of Delaware. In connection with the reincorporation, the Company filed new articles of incorporation and adopted new bylaws. The new articles of incorporation changed the Company's common stock from $0.01 par value per share to no par value per share and increased the Company's authorized capital stock.Initial Public Offering—In May 2005 the Company completed an initial public offering of its common stock in which the Company sold 3,750,000 shares and the Company's selling shareholders sold 3,437,500 shares. Net proceeds from the offering received by the Company totaled approximately $29.2 million, after payment of underwriters' commissions and offering expenses. The Company did not receive any of the proceeds from the sale of shares of its common stock by the selling shareholders. Prior to this initial public offering, the Company was a majority owned subsidiary of Zumiez Holdings LLC (the "Parent"), a holding company with no operating activities. The financial position and operating results of the Parent are not included in the Company's financial statements included in this annual report. The Parent was dissolved in connection with the Company's initial public offering.Secondary Offering—In November 2005 a secondary offering of shares of the Company's common stock by certain of its shareholders was completed. The offering consisted of 5,462,500 shares of common stock, including 712,500 shares that were subject to the underwriters' over-allotment option. All of the shares were sold by shareholders of the Company and, as a result, the Company did not receive any of the proceeds from the offering.Basis of Presentation—The accompanying consolidated financial statements have been prepared in accordance with accounting principles generally accepted in the United States of America
("GAAP"(“GAAP”).NOTES TO CONSOLIDATED FINANCIAL STATEMENTS (Continued)1. Nature and Ownership of Business and Basis of Presentation (Continued)The consolidated financial statements include the accounts of Zumiez Inc. and its
subsidiary, Zumiez Nevada, LLC.wholly-owned subsidiaries. All significant intercompany transactions and balances are eliminated in consolidation.Revision toReclassification of Previously Issued Financial Statementsof Cash Flows—The Company has historicallyCertain prior period amounts have been reclassified to conform to the current period presentation. These reclassifications do not have a material impact on our consolidated financial statements. We have reclassified $21.4 million on the consolidated balance sheet at January 30, 2010 from cash equivalents to short-term marketable securities related to variable-rate demand notes and municipal bonds, which have an embedded put option that allows the bondholder to sell the security at par plus accrued interest. While these reclassified securities are considered highly liquid, we believe they are more appropriately classifiedtenant allowances received from landlordsasa reduction of leasehold improvements and equipmentshort-term marketable securities. This reclassification increased net cash used inthe cash flows frominvesting activitiessection ofby $21.4 million on the consolidated statements of cashflows. The appropriate classification is to include tenant allowances in deferred rent, which is included in net cash provided by operating activities. Forflows for the fiscalyearsyear endedFebruary 3, 2007 andJanuary28, 2006, we30, 2010. We havecorrected the classification of tenant allowances inalso reclassified $0.9 million on the consolidatedstatement of cash flows. The effect of this adjustment isbalance sheets at January 30, 2010 related toincrease cash used in investing activitieslong-term assets from receivables and prepaid expenses and other toincrease net cash flow provided by operating activities by $4.3 million and $3.1 million for fiscal 2006 and fiscal 2005, respectively.long-term other assets. There was no impact on thenet increase in cash and cash equivalents on theconsolidatedstatement of cash flows. The Company has determined these adjustments are not material and has corrected the classification of tenant allowances in thestatements of cash flowsfor these fiscal years.from this reclassification.2. Summary of Significant Accounting Policies
Use of Estimates—The preparation of financial statements in conformity with
accounting principles generally accepted in the United States of AmericaGAAP requiresmanagement to makeestimates and assumptions that affect the reported amounts of assets and liabilities and the disclosure of contingent assets and liabilities at the date of the consolidated financial statements as well as the reported amounts of revenues and expenses during the reporting period. These estimates can also affect supplemental information disclosed bythe Company,us, including information about contingencies, risk and financial condition.In preparing the financial statements, the Company makes routine estimates and judgments in determining the net realizable value of accounts receivable, inventory, fixed assets, and accrued liabilities. Some of the more significant estimates include the allowance for sales returns, the reserve for inventory valuation estimates, medical insurance reserve and the expected useful lives of fixed assets.Actual results could differ fromthose estimates.these estimates and assumptions.ConcentrationFair Value ofRisk—Financial Instruments—We disclose the estimated fair value of certain assets and liabilities as financial instruments. Financial instruments are generally defined as cash, evidence of ownership interest in anThe Company maintains itsentity or a contractual obligation that both conveys to one entity a right to receive cash or other financial instruments from another entity and imposes on the other entity the obligation to deliver cash or other financial instruments to the first entity. Our financial instruments, other than those presented in “Note 10. Fair Value Measurements,” include cash and cash equivalents,
in accounts with two major financial institution in the United States of America, in the form of demand deposits, certificates of depositsreceivables, payables andmoney market accounts. Deposits in this bank may exceed theother liabilities. The carrying amountsof federal deposit insurance provided on such deposits. The Company has not experienced any losses on its depositsof cash and cashequivalents. The Company's accounts receivable are primarily derived from credit card purchases from customersequivalents, receivables, payables andare typically settled within one to two days.other liabilities approximate fair value because of the short-term nature of these instruments.Cash and Cash
Equivalents—The Company considersEquivalents—We consider all highly liquid investments with original maturity of three months or less when purchased to be cash equivalents.Restricted Cash—At February 2, 2008Concentration of Risk—We maintain our cash andat February 3, 2007cash equivalents in accounts with major financial institutions, in theCompany had restrictedform of demand deposits, money market accounts and state and local municipal securities. Deposits in these financial institutions may exceed the amount of federal deposit insurance provided on such deposits. We have not experienced any losses on our deposits of cashof $250,000 held in escrow related to the Fast Forward acquisition.and cash equivalents.Marketable Securities—At
February 2, 2008January 29, 2011 andFebruary 3, 2007,January 30, 2010, marketable securities, classified asavailable for sale,available-for-sale, were$64.6$118.3 million and$43.8$107.4 million,respectively,and consisted primarily of state and local municipal securities, U.S. Treasury securities, U.S. Agency securities andU.S. agency debt instrumentsvariable-rate demand notes with original maturities over 90 days. Variable-rate demand notes are considered highly liquid. Although the variable-rate demand notes have long-term nominal maturity dates, the interest rates generally reset weekly. Despite the long-term nature of the underlying securities of the variable-rate demand notes, we have the ability to quickly liquidate these securities, which have an embedded put option that allows the bondholder to sell the security at par plus accrued interest.Generally accepted accounting principles require recording an investment impairment charge at the point we believe an investment has experienced a decline in value that is other-than-temporary. In determining whether an other-than-temporary impairment has occurred, we review information about the underlying investment that is publicly available such as analyst reports, applicable industry data and other pertinent information and assess our intent to hold the security and whether it is more likely than not we will be required to sell any investment before recovery of its amortized cost basis. The investment would be written down to its current market value at the time the impairment is deemed to have occurred. Future adverse changes in market conditions, continued poor operating results of underlying investments or other factors could result in further losses that may not be reflected in an investment’s current carrying value, possibly requiring an additional impairment charge in the future.
Inventories—Merchandise inventories are valued at the lower of cost or market. The cost of merchandise inventories are based upon an average cost methodology. Merchandise inventories may include items that have been written down to our best estimate of their net realizable value. Our decisions to write-down our merchandise inventories are based on their current rate of sale, the age of the inventory, the profitability of the inventory and other factors. Actual final sales prices to customers may be higher or lower than our estimated sales prices and could result in a fluctuation in gross profit. Historically, any additional write-downs have not been significant. We have reserved for inventory at January 29, 2011 and January 30, 2010 in the amounts of $3.2 million and $2.8 million. The inventory reserve includes inventory whose estimated market value is below cost and an estimate for inventory shrinkage. We estimate an inventory shrinkage reserve for anticipated losses for the period. Shrinkage refers to a reduction in inventory due to shoplifting, employee theft and other matters. The inventory related to these reserves is not marked up in subsequent periods.
Fixed Assets—Fixed assets primarily consist of land, buildings, leasehold improvements, fixtures, computer equipment, software and store equipment. Fixed assets are stated at cost less accumulated depreciation utilizing the straight-line method over the assets’ estimated useful lives. The useful lives of our major classes of fixed assets are as follows:
Leasehold improvements
Lesser of 10 years or the term of the lease
Fixtures
3 to 7 years
Computer equipment, software, store equipment & other
3 to 5 years
Buildings and improvements
15 to 39 years
The cost and related accumulated depreciation of assets sold or otherwise disposed of is removed from the accounts and the related gain or loss is reported in the consolidated statements of operations.
In accordance with our fixed asset policy, we review the estimated useful lives of our fixed assets on an ongoing basis. This review indicated that the actual lives of leasehold improvements were longer than the estimated useful lives used for depreciation purposes in our consolidated financial statements. As a result, effective January 31, 2010, we changed our estimate of the useful lives of our leasehold improvements to the lesser of 10 years or the term of the lease to better reflect the estimated periods during which these assets will remain in service. The useful lives of leasehold improvements were previously estimated to be the lesser of 7 years or the term of the lease. For the fiscal year ended January 29, 2011, the effect of this change in estimate was to reduce depreciation expense by $4.2 million, increase net income by $2.7 million and increase basic and diluted earnings per share by $0.09.
Asset Retirement Obligations— An asset retirement obligation (ARO) represents a legal obligation associated with the retirement of a tangible long-lived asset that is incurred upon the acquisition, construction, development or normal operation of that long-lived asset. Our AROs are primarily associated with leasehold improvements that, at the end of a lease, we are contractually obligated to remove in order to comply with certain lease agreements. The ARO is recorded in other liabilities and long-term other liabilities on the consolidated balance sheets and will be subsequently adjusted for changes in fair value. The associated estimated asset retirement costs are capitalized as part of the carrying amount of the long-lived asset and depreciated over its useful life.
Valuation of Long-Lived Assets—We review the carrying value of long-lived assets for impairment annually, or as indicators of impairment are present. Measurement of the impairment loss is based on the fair value of the asset or group of assets. Generally, fair value will be determined using accepted valuation techniques, such as the present value of expected future cash flows. During the fiscal year ended January 29, 2011, two stores were determined to be impaired, resulting in a non-cash impairment charge of $0.1 million. During the fiscal year ended January 30, 2010, 21 stores were determined to be impaired, resulting in a non-cash impairment charge of $2.5 million. These non-cash impairment charges are included in selling, general and administrative expenses.
Goodwill and Other Intangible Assets—We evaluate the recoverability of goodwill annually based on a two-step impairment test. The first step compares the fair value of the reporting unit with its carrying amount, including goodwill. If the carrying amount exceeds fair value, then the second step of the impairment test is performed to measure the amount of any impairment loss. Additional impairment assessments may be performed on an interim basis if we encounter events or changes in circumstances that would indicate that, more likely than not, the carrying amount of goodwill has been impaired.
Equity Method Investments—We hold a 14.3% interest in a manufacturer of apparel and hard goods, which we acquired for $2.0 million on May 11, 2010. We have elected to apply fair value accounting for this investment, which would otherwise be accounted for under the equity method of accounting. We have elected fair value accounting, as we believe the terms of the contract are more properly reflected through the fair value
method. The investment balance is reported in long-term investments on the consolidated balance sheets, with the corresponding changes in the fair value recorded in other income (expense), net on the consolidated statements of operations.
The investment agreement allows for a put option, where Zumiez has an option to sell its interest back to the investee for the greater of the initial purchase price of $2.0 million or the fair value of the investment. This put option is allowed any time following the fifth anniversary of the initial investment, but prior to the seventh anniversary of the initial investment. Additionally, the investment agreement allows for a call option, where the investee has an option to repurchase the interest from Zumiez for the fair value of the investment. This call option is allowed any time on or after the seventh anniversary of the initial investment. We have elected to apply fair value accounting for the put and call options. The put option has a nominal value and the call option has no fair value, given that the investment would be repurchased at its fair value if the call option were exercised.
Deferred Rent, Rent Expense and Tenant Allowances—We occupy our retail stores and combined home office and ecommerce fulfillment center under operating leases generally with terms of five to ten years. A majority of our leases provide for ongoing co-tenancy requirements or early cancellation clauses that would further lower rental rates, or permit lease terminations, or both, in the event that co-tenants cease to operate for specific periods or if certain sales levels are not met in specific periods. Most of the store leases require payment of a specified minimum rent and a contingent rent based on a percentage of the store’s net sales in excess of a specified threshold. Most of the lease agreements have defined escalating rent provisions, which are straight-lined over the term of the related lease, including any lease renewals deemed to be probable. We recognize rent expense over the term of the lease, plus the construction period prior to occupancy of the retail location. For certain locations, we receive tenant allowances and report these amounts as a liability, which is amortized to rent expense over the term of the lease.
Claims and Contingencies—We are subject to various claims and contingencies related to lawsuits, insurance, regulatory and other matters arising out of the normal course of business. We accrue a liability if the likelihood of an adverse outcome is probable and the amount is estimable. If the likelihood of an adverse outcome is only reasonably possible (as opposed to probable), or if an estimate is not determinable, we provide disclosure of a material claim or contingency in the Notes to the Consolidated Financial Statements.
Revenue Recognition—Sales are recognized upon purchase at our retail store locations. For orders placed through our website, revenue is recognized upon estimated delivery to the customer. Taxes collected from our customers are recorded on a net basis. We record the sale of gift cards as a current liability and recognize revenue when a customer redeems a gift card. The amount of the gift card liability is determined taking into account our estimate of the portion of gift cards that will not be redeemed or recovered (“gift card breakage”). Gift card breakage is recognized as revenue after 24 months, at which time the likelihood of redemption is considered remote based on our historical redemption data. We report shipping revenues within net sales. Revenue is recorded net of estimated and actual sales returns and deductions for promotions. We accrue for estimated sales returns by customers based on historical sales return results. The allowance for sales returns at January 29, 2011 and January 30, 2010 was $0.7 million and $0.3 million. The Company offers a return policy of 30 days.
We present our net sales by category as a percentage of net sales in the following table. “Accessories and Other” includes all other merchandise (e.g., hardgoods, accessories, footwear, etc.). The percentage of net sales for the fiscal years ended January 29, 2011, January 30, 2010 and January 31, 2009 was as follows:
Fiscal Year Ended January 29, 2011 January 30, 2010 January 31, 2009 Men’s Apparel
32.5 % 31.2 % 30.6 % Junior’s Apparel
10.1 % 11.2 % 14.2 % Accessories and Other
57.4 % 57.6 % 55.2 % Total
100.0 % 100.0 % 100.0 % Cost of Goods Sold—Cost of goods sold consists of branded merchandise costs and our private label merchandise costs including design, sourcing, importing and inbound freight costs. Our cost of goods sold also includes shrinkage and buying, occupancy, distribution and warehousing costs. This may not be comparable to the way in which our competitors or other retailers compute their cost of goods sold. We receive cash consideration from vendors, which have been recorded as a reduction of cost of goods sold if the inventory has sold, as a reduction of the carrying value of the inventory if the inventory is still on hand, or a reduction of selling, general and administrative expense if the amounts are reimbursements of specific, incremental and identifiable costs of selling the vendors’ products.
With respect to the freight component of our ecommerce sales, we arrange and pay the freight for our customers and bill them for this service, unless our customers have their product shipped to one of our stores or we have free shipping promotions to our customers, in which case we do not bill our customers. Such amounts billed are included in net sales and the related freight cost is charged to cost of goods sold. For fiscal years ended January 29, 2011, January 30, 2010 and January 31, 2009, we incurred shipping costs related to ecommerce sales of $2.6 million, $1.2 million and $0.8 million.
Selling, General and Administrative Expense—Selling, general and administrative expenses consist primarily of store personnel wages and benefits, administrative staff and infrastructure expenses, outbound freight, store supplies, depreciation on fixed assets at the home office and stores, facility expenses and training, advertising and marketing costs. Credit card fees, insurance, public company expenses, legal expenses and other miscellaneous operating costs are also included in selling, general and administrative expenses. This may not be comparable to the way in which our competitors or other retailers compute their selling, general and administrative expenses.
Advertising—We expense advertising costs as incurred. Advertising expenses are net of sponsorships and vendor reimbursements. Advertising expense was $1.3 million, $0.8 million and $0.8 million for the fiscal years ended January 29, 2011, January 30, 2010, and January 31, 2009.
Stock-Based Compensation—We account for stock-based compensation by which the estimated fair value of stock-based awards granted is recognized as compensation expense over the vesting period, net of estimated forfeitures. Stock-based compensation expense is recognized using an accelerated method for stock options and a straight-line basis for restricted stock. We estimate forfeitures of stock-based awards based on historical experience and expected future activity.
The fair value of restricted stock awards is measured based on the closing fair market value of the Company’s common stock on the date of grant. The fair value of stock option grants are estimated on the date of grant using the Black-Scholes option pricing method based on the following subjective assumptions:
Volatility—This is a measure of the amount by which a stock price has fluctuated or is expected to fluctuate. We use actual daily historical changes in the market value of our stock since becoming a public company in May 2005. An increase in the expected volatility will increase compensation expense.
Risk-free interest rate—This is the U.S. Treasury rate as of the grant date having a term equal to the expected term of the option. An increase in the risk-free interest rate will increase compensation expense.
Expected term—The expected term was calculated using the simplified method outlined by SEC Staff Accounting Bulletin No. 107, Share-Based Payment (SAB 107). Under this method, the expected term is equal to the sum of the weighted average vesting term plus the original contractual term divided by two. We have elected this method as we have concluded that we do not have sufficient historical exercise data to provide a reasonable basis upon which to estimate expected term due to the limited period of time our equity shares have been publicly traded.
Dividend yield—We do not have plans to pay dividends in the foreseeable future. An increase in the dividend yield will decrease compensation expense.
The following weighted-average assumptions were used for stock option grants issued during the fiscal years ended January 29, 2011, January 30, 2010 and January 31, 2009:
Fiscal Year Ended January 29, 2011 January 30, 2010 January 31, 2009 Dividend yield
0.0 % 0.0 % 0.0 % Volatility rate
67.5 % 66.8 % 55.4 % Expected life (in years):
Expected lives—four years
6.50 6.25 6.25 Expected lives—five years
6.50 6.50 6.50 Expected lives—eight years
— — 7.25 Risk-free interest rate
2.4 % 1.7 % 2.8 % Income Taxes—Deferred income tax balances reflect the effects of temporary differences between the carrying amounts of assets and liabilities and their respective tax bases. Valuation allowances may be established when necessary to reduce deferred tax assets to the amount expected to be realized. We did not have a valuation allowance recorded at January 29, 2011, January 30, 2010 and January 31, 2009.
We recognize tax benefits from an uncertain position only if it is “more likely than not” that the position is sustainable, based on its technical merits. The tax benefit of a qualifying position is the largest amount of tax benefit that is greater than fifty percent likely of being realized upon ultimate settlement with a taxing authority having full knowledge of all relevant information. Interest and penalties related to uncertain tax positions may be classified in the financial statements as either income taxes or interest and another expense classification. The Company has elected to classify interest and penalties related to uncertain tax positions as income tax expense. We did not have unrealized tax benefits related to uncertain tax positions recorded at January 29, 2011, January 30, 2010 and January 31, 2009.
Earnings per Share—Basic earnings per share is based on the weighted average number of common shares outstanding during the period. The dilutive effect of stock options and restricted stock is applicable only in periods of net income. Diluted earnings per share is based on the weighted average number of common shares and common share equivalent outstanding during the period. Common share equivalents included in the computation represent shares issuable upon assumed exercise of outstanding stock options, employee stock purchase plan funds held to acquire stock and non-vested restricted stock. Potentially anti-dilutive securities not included in the calculation of diluted earnings per share are options to purchase common stock where the option exercise price is greater than the average market price of the Company’s common stock during the period reported.
Recent Accounting Pronouncements—In June 2009, the Financial Accounting Standards Board (“FASB”) issued guidance on the consolidation of variable interest entities. The guidance requires a revised approach to identifying a controlling financial interest in a variable interest entity and requires additional disclosures about an entity’s involvement in variable interest entities. The guidance is effective for interim and annual reporting periods beginning after November 15, 2009. We adopted the new requirements in the three months ended May 1, 2010. The adoption of this guidance did not have a material impact on our consolidated financial statements.
In January 2010, the FASB issued guidance that requires reporting entities to make new disclosures about fair value measurements including significant transfers into and out of Level 1 and Level 2 fair value measurements and information on purchases, sales, issuances and settlements on a gross basis in the reconciliation of Level 3 fair value measurements. In addition, the guidance clarifies certain existing disclosure requirements. This guidance is effective for interim and annual reporting periods beginning after December 15, 2009, except for the additional Level 3 reconciliation disclosures, which are effective for interim and annual reporting periods beginning after December 15, 2010. We adopted the new requirements in the three months ended May 1, 2010. The adoption of this guidance did not have a material impact on our consolidated financial statements.
In February
2, 2008,2010, the FASB issued amended guidance on subsequent events. Under this amended guidance, SEC filers are no longer required to disclose the date through which subsequent events have been evaluated in originally issued and revised financial statements. This guidance was effective immediately and wehad $2 million investedadopted these new requirements in the three months ended May 1, 2010.In July 2010, the FASB issued guidance that requires reporting entities to make new disclosures about the allowance for credit losses and the credit quality of its financing receivables. For disclosures required as of the end of a reporting period, the guidance is effective for interim and annual reporting periods ending on or after December 15, 2010. For disclosures required about activity that occurs during a reporting period, the guidance is effective for interim and annual reporting periods beginning on or after December 15, 2010. We adopted the new requirements in the three months ended January 29, 2011. The adoption of this guidance did not have a material impact on our consolidated financial statements.
3. Cash, Cash Equivalents and Marketable Securities
The following tables summarize the estimated fair market value of our cash, cash equivalents and marketable securities and the gross unrealized holding gains and losses at January 29, 2011 and January 30, 2010 (in thousands):
January 29, 2011 Amortized
CostGross
Unrealized
Holding
GainsGross
Unrealized
Holding
LossesEstimated
Fair ValueCash and cash equivalents:
Cash
$ 7,160 $ — $ — $ 7,160 Money market funds
928 — — 928 State and local government securities
3,269 — — 3,269 Total cash and cash equivalents
11,357 — — 11,357 Marketable securities:
Treasury and agency securities
6,043 26 — 6,069 State and local government securities
103,110 125 (195 ) 103,040 Variable-rate demand notes
9,205 — — 9,205 Total marketable securities
$ 118,358 $ 151 $ (195 ) $ 118,314 Less: Long-term marketable securities (1)
(870 ) Total current marketable securities
$ 117,444 January 30, 2010 Amortized
CostGross
Unrealized
Holding
GainsGross
Unrealized
Holding
LossesEstimated
Fair ValueCash and cash equivalents:
Cash
$ 1,081 $ — $ — $ 1,081 Money market funds
487 — — 487 Total cash and cash equivalents
1,568 — — 1,568 Marketable securities:
Treasury and agency securities
15,268 48 — 15,316 State and local government securities
70,538 255 (136 ) 70,657 Variable-rate demand notes
21,382 — — 21,382 Total marketable securities
$ 107,188 $ 303 $ (136 ) $ 107,355 Less: Long-term marketable securities (1)
(872 ) Total current marketable securities
$ 106,483 (1) At January 29, 2011 and January 30, 2010, we held one $1.0 million par value auction rate security valued at $0.9 million net of a $0.1 million temporary impairment charge, classified as available-for-sale marketable securities and included in long-term investments on the consolidated balance sheets. All of our available-for-sale securities, excluding our auction rate
securities, which are classified as current,security, have an effective maturity date of two years or less and may be liquidated, at our discretion, prior to maturity. For the fiscal years ended January 29, 2011, January 30, 2010 and January 31, 2009, realized gains and losses on sales of available-for-sale marketable securities were not material. We use the specific identification method to determine any realized gains or losses from the sale of our marketable securities classified as available-for-sale.The following tables summarize the gross unrealized holding losses and fair value for investments in an unrealized loss position at January 29, 2011 and January 30, 2010, and the length of time that individual securities have been in a continuous loss position (in thousands):
January 29, 2011 Less Than Twelve Months 12 Months or Greater Total Fair Value Unrealized
LossesFair Value Unrealized
LossesFair Value Unrealized
LossesMarketable securities:
Treasury and agency securities
$ — $ — $ — $ — $ — $ — State and local government securities
42,761 (62 ) 1,907 (133 ) 44,668 (195 ) Variable-rate demand notes
— — — — — — Total marketable securities
$ 42,761 $ (62 ) $ 1,907 $ (133 ) $ 44,668 $ (195 ) January 30, 2010 Less Than Twelve Months 12 Months or Greater Total Fair Value Unrealized
LossesFair Value Unrealized
LossesFair Value Unrealized
LossesMarketable securities:
Treasury and agency securities
$ — $ — $ — $ — $ — $ — State and local government securities
8,389 (8 ) 872 (128 ) 9,261 (136 ) Variable-rate demand notes
— — — — — — Total marketable securities
$ 8,389 $ (8 ) $ 872 $ (128 ) $ 9,261 $ (136 ) We did not record a realized loss for other-than-temporary impairments during the fiscal years ended January 29, 2011, January 30, 2010 and January 31, 2009. At January 29, 2011 and January 30, 2010, we had $0.9 million invested, net of temporary impairment charge of $0.1 million, in an auction rate security that is classified as available-for-sale marketable securities in long-term investments on
ourthe consolidated balancesheet. We reduced our holdings of auction rate securities during 2007 through the auction process.NOTES TO CONSOLIDATED FINANCIAL STATEMENTS (Continued)2. Summary of Significant Accounting Policies (Continued)sheets. Auction rate securities are generally long-term debt instruments that provide liquidity through a Dutch auction process that resets the applicable interest rate at pre-determined calendar intervals. This mechanism generally allows existing investors to rollover their holdings and continue to own their respective securities or liquidate their holdings by selling their securities at par value.
We generally investPrior to February 3, 2008, we invested in these securities for short periods of time as part of our cash management program. However, therecentuncertainties in the credit markets that began in early 2008 have prevented us and other investors from liquidating holdings of auction rate securities in recent auctions for these securities because the amount of securities submitted for sale has exceeded the amount of purchase orders. Should theauctionsauction continue to fail, weanticipatedo not intend to sell the security and it is not more likely than not that wehavewill be required to sell theability to hold these securities untilinvestment before the liquidity in the market improves.We believeAdditionally, theinterest rate on these investments will increase based on current interest rates. These investments areinvestment is fully collateralized by theUnited States government and are insured against loss of principal and interest by a bond insurer whose AAA ratings are under review. If the credit ratings of the issuer, the bond insurers or the collateral deteriorate, we may adjust the carrying value of these investments.U. S. government. Although we are uncertain as to when the liquidity issues relating tothese investmentsthis investment will improve, we considerthese issues to be onlythe issue temporary.AnyAs a result of the temporary declineif sustained, would be recognized in other comprehensive income. It is possible that declinesin fair valuemay occur.for our auction rate security, we have recorded an unrealized loss of $0.1 million, which is included in accumulated other comprehensive (loss) income on the consolidated balance sheets at January 29, 2011 and January 30, 2010. We continue to monitor the market for auction rate securities and consider its impact,(if any)if any, on the fair market value of theinvestments. Ifinvestment. It is possible that further declines in fair value may occur, and those declines, if any, would be recognized in accordance with GAAP, and if it is later determined that thecurrentfair value of this security is other-than-temporarily impaired, we will record a loss in the consolidated statements of operations. Due to our belief that the marketconditions deteriorate furtherfor this investment may take in excess of twelve months to fully recover, we have classified it as a noncurrent asset in long-term investments on theCompany may be required to record unrealized losses in other comprehensive income or impairment charges in 2008.consolidated balance sheets at January 29, 2011 and January 30, 2010.4. Receivables
At January 29, 2011 and January 30, 2010, receivables on the consolidated balance sheets consisted of the following (in thousands):
Receivables—At February 2, 2008 and February 3, 2007, receivables include, tenant allowances receivable credit cards receivable, interest receivable and other. The Company doesJanuary 29, 2011 January 30, 2010 Credit cards receivable
$ 2,468 $ 2,161 Interest receivable
1,220 894 Refundable use tax
1,053 1,506 Tenant allowances receivable
704 575 Other receivables
684 464 $ 6,129 $ 5,600 We do not extend credit to
itsour customers except through independent third-party creditcards.cards, which are generally collected in several business days. The refundable use tax amounts in the table of $1.1 million and $1.5 million at January 29, 2011 and January 30, 2010 represents an overpayment of use tax on construction costs to build and remodel stores that is expected to be collected or credited from state jurisdictions.5. Fixed Assets
Fiscal Year Ended February 3,
2007February 2,
2008Tenant allowances receivable $ 2,531 $ 1,334 Credit cards receivable 1,551 2,108 Interest receivable 374 557 Employee receivables 110 257 Other receivables 657 519 $ 5,223 $ 4,775 Merchandise Inventories—Merchandise inventories are valued atAt January 29, 2011 and January 30, 2010, fixed assets on thelower of cost or market. The cost of merchandise inventories are based upon an average cost methodology. Merchandise inventories may include items that have been written down to the Company's best estimate of their net realizable value. The Company's decisions to write-down its merchandise inventories are based on its current rate of sale, the ageconsolidated balance sheets consist of theinventoryfollowing (in thousands):January 29, 2011 January 30, 2010 Leasehold improvements
$ 93,011 $ 88,892 Fixtures
49,738 46,219 Computer equipment, software, store equipment and other
15,586 11,807 Land, building and building improvements
14,890 — Fixed assets, at cost
173,225 146,918 Less: accumulated depreciation
(94,977 ) (80,910 ) Fixed assets, net of accumulated depreciation
$ 78,248 $ 66,008 In March 2010, we acquired a 168,450 square foot building in Corona, California for $11.8 million and
other factors. Actual final sales pricesrelocated our distribution center from Everett, Washington tocustomers may be higher or lower than the Company's estimated sales prices and could result in a fluctuation in gross profit. Historically, any additional write-downs have not been significant to the Company. We have reserved for inventory shrinkage as of February 2, 2008 and February 3, 2007this facility in theamountsfiscal year ended January 29, 2011. Refer to “Note 16. Exit or Disposal Activities” for discussion ofapproximately $2.2our exit activity related to this relocation.Depreciation expense on fixed assets was $16.4 million, $20.3 million, and
$1.9$18.8 millionrespectively.for fiscal years ended January 29, 2011, January 30, 2010 and January 31, 2009.6. Goodwill and Other Intangible Assets
Leasehold Improvements and Equipment—Leasehold improvements and equipment are stated at cost less accumulated depreciation. AmortizationWe recorded $13.2 million ofleasehold improvements is computed ongoodwill as thestraight-line method over the lesser of an asset's estimated useful life or the lease term (generallyNOTES TO CONSOLIDATED FINANCIAL STATEMENTS (Continued)2. Summary of Significant Accounting Policies (Continued)5-10 years), whichever is shorter. Depreciation on furniture, fixtures and equipment is computed on the straight-line method over 5 years. Maintenance and repairs are expensed as incurred. The cost and related accumulated depreciation or amortization of assets sold or otherwise disposed of is removed from the accounts and the related gain or loss is reported in the consolidated statement of operations.Valuation of Long-Lived Assets—The Company reviews the carrying value of long-lived assets for impairment whenever events or changes in circumstances indicate that the carrying value of such assets may not be recoverable. Measurementexcess of theimpairment loss is based onpurchase price of $15.5 million over the fair value of theasset, or group of assets. The company determined that there was no impairment loss for the year ended February 2, 2008. Generally, fair value will be determined using accepted valuation techniques, such as the present value of expected future cash flows. Asset retirements were not material for fiscal 2007.Fair Value of Financial Instruments—Statement of Financial Accounting Standards No. 107"Disclosures about Fair Value of Financial Instrument"("SFAS No. 107"), requires managementnet amounts assigned todisclose the estimated fair value of certainassets acquired and liabilitiesas financial instruments. Financial instruments are generally defined by SFAS No. 107 as cash, evidenceassumed in connection with the acquisition ofownership interestAction Concepts Fast Forward, Ltd. inan entity, or a contractual obligation that both conveys2006. We will continue toone entity a right to receive cash or other financial instruments from another entity and imposes on the other entity the obligation to deliver cash or other financial instruments to the first entity. At February 3, 2007 and February 2, 2008 the carrying amounts of cash and cash equivalents, receivables, payables and other accrued liabilities approximated fair value because of the short maturity of these financial instruments. The carrying value of marketable securities, approximate the fair value because these financial instruments have floating interest rates which reflect current market conditions. Contractual maturities of investments underlying our available-for-sale securities at February 2, 2008 included $2.0 millionassess, inauction rate securities. Based on current market conditions, it is possible that auctions related to these securities may be unsuccessful in the near term. Unsuccessful auctions could result in our holding securities beyond their next scheduled auction reset dates if a secondary market does not develop; therefore, limiting the short-term liquidity of these investments.Deferred Rent, Rent Expense and Tenant Allowances—The Company occupies its retail stores and combined home office and distribution center under operating leases generally with terms of five to ten years. Some of these leases have early cancellation clauses, which permit the lease to be terminated if certain sales levels are not met in specific periods. Some leases contain renewal options for periods ranging from one to five years under substantially the same terms and conditions as the original leases. Most of the store leases require payment of a specified minimum rent, plus a contingent rent based on a percentage of the store's net sales in excess of a specified threshold. Most of the lease agreements have defined escalating rent provisions, which are straight-lined over the term of the related lease, including any lease renewals deemed to be probable. The Company straight-lines and recognizes its rent expense over the term of the lease, plus the construction period prior to occupancy of the retail location, using a mid-month convention. For certain locations, the Company receives cash tenant allowances and has reported these amounts as a deferred liability which is amortized to rent expense over the term of the lease. Also included in rent expense are payments of real estate taxes, insurance and certain common area and maintenance costs in addition to the future minimum operating lease payments. All other pre-opening costs are expensed as incurred.Goodwill—Inaccordance withStatement of Financial Accounting Standards No. 142, "Accounting for Goodwill and Other Intangible Assets"("SFAS No. 142"), the Company does not amortizeour goodwillderived from purchase business combinations. The Company evaluates the recoverability ofpolicy as stated in Note 2, whether goodwillNOTES TO CONSOLIDATED FINANCIAL STATEMENTS (Continued)2. Summary of Significant Accounting Policies (Continued)annually based on a two-step impairment test. The first step compares the fair value of each reporting unit with its carrying amount, including goodwill. If the carrying amount exceeds fair value, then the second step of the impairment testisperformed to measure the amount of any impairment loss. Additional impairment assessments may be performed on an interim basis if the Company encounters events or changes in circumstances that would indicate that, more likely than not, the book value of goodwill has beenimpaired. There was no impairment of goodwillin the 2007 and 2006 fiscal years.Other Liabilities—At February 2, 2008 and February 3, 2007 other liabilities consisted of the following:Fiscal Year Ended February 3,
2007February 2,
2008Accrued Payables $ 1,357 $ 3,475 Gift cards payable 1,954 3,033 Accrued excise tax 1,400 1,793 Other current liabilities 1,855 759 $ 6,566 $ 9,060 Income Taxes—The provision for income taxes includes both current and deferred tax expenses. Current tax expense is the amount associated with current operating results. The Company follows the liability method of accounting for income taxes, which requires recognition of deferred tax assets and liabilities for the expected future tax consequences of temporary difference between the carrying amounts and the tax bases of the assets and liabilities. Valuation allowances may be established when necessary to reduce deferred tax assets to the amount expected to be realized.Comprehensive Income—Comprehensive income represents all changes in equity during a period except those resulting from investments by and distributions to shareholders. Comprehensive income for fiscal 2007, 2006 and 2005 was $25.8 million, $20.8 million and $12.8 million, respectively comprised of net income plus or (minus) net unrealized gains or (losses) on our available-for-sale securities.Revenue Recognition—Sales are recognized upon purchase at the Company's retail store locations or upon shipment for orders placed through the Company's website as both title and risk of loss have transferred. Taxes collected from the Company's customers are and have been recorded on a net basis. The Company records the sale of gift cards as a current liability and recognizes revenue when a customer redeems a gift card. The amount of the gift card liability is determined taking into account our estimate of the portion of gift cards that will not be redeemed or recovered ("gift card breakage"). Gift card breakage is recognized as revenue after 24 months, at which time the likelihood of redemption is considered remote based on our historical redemption data. The Company reports shipping revenues and costs within sales and cost of goods sold, respectively. The Company accrues for estimated sales returns by customers based on historical sales return results. The allowance for sales returns as of February 2, 2008, February 3, 2007 and January 28, 2006 was approximately $279,000, $275,000 and $185,000, respectively. The Company offers a return policy of generally 30 days. The Company has the right to assess gift card dormancy fees in certain states, but has historically not done so.NOTES TO CONSOLIDATED FINANCIAL STATEMENTS (Continued)2. Summary of Significant Accounting Policies (Continued)The Company entered into an agreement with an unrelated third party that assumed the unredeemed liability for gift cards that had not yet reached the statutory term for unclaimed property. As a result of the agreement, certain third-party claims on unredeemed gift cards for the State of Delaware have been removed, thus allowing the company to recognize additional revenue of approximately $303,000 in fiscal 2007.The Company operates exclusively in the retail apparel industry in which the Company distributes, designs and produces clothing, accessories and related products catering to the teenage/young adult demographic through primarily mall-based retail stores. The Company has identified one operating segment as defined by Statement of Financial Accounting Standards No. 131,"Disclosures about Segments of an Enterprise and Related Information"("SFAS No. 131"). The company accounts for its business operation as one reportable segment based on the similar nature of products sold, production, merchandising and distribution processes involved, target customers, and economic characteristics.The Company presents its merchandise assortment as a percentage of net sales for the following categories: "Men's", which includes men's apparel; "Women's", which includes women's apparel; and "Accessories and Other", which includes all other merchandise (e.g., hardgoods, accessories, footwear, etc.). The percentage of net sales for each of the aforementioned categories for fiscal 2005, fiscal 2006 and fiscal 2007 was as follows:Fiscal Year Ended January 28,
2006February 3,
2007February 2,
2008Men's 30.0 % 31.9 % 32.4 % Women's 17.0 % 15.4 % 15.4 % Accessories and Other 53.0 % 52.7 % 52.2 % Total 100.0 % 100.0 % 100.0 % Cost of Goods Sold—Cost of goods sold consists of the cost of merchandise sold to customers, inbound shipping costs, distribution costs, depreciation on leasehold improvements at the distribution center, buying and merchandising costs and store occupancy costs. This may not be comparable to the way in which the Company's competitors or other retailers compute their cost of goods sold. In fiscal 2005 and 2006 the Company reported shipping costs on internet sales in selling, general and administrative expense. During 2007 the Company reclassified these costs to costs of goods sold. The company reclassified approximately $349,000 and $236,000 for fiscal 2006 and 2005, respectively, from selling, general and administrative expense to cost of goods sold to conform to 2007 presentation. The Company does receive insignificant amounts of cash consideration from vendors which have been reported as a reduction of expenses or inventory on hand as the amounts are reimbursements of specific, incremental and identifiable costs of selling the vendors' products.With respect to the freight component of our internet sales, we arrange and pay the freight for our customers and bill them for this service. Such amounts billed are included in revenue and the related freight cost is charged to cost of goods sold. For fiscal years 2007, 2006, and 2005, the Company incurred shipping costs related to internet sales for approximately $534,000, $349,000 and $236,000 respectively.Selling, General and Administrative Expense—Selling, general and administrative expenses consist primarily of store personnel wages and benefits, administrative staff and infrastructure expenses, store supplies, depreciation on leasehold improvements at the home office and stores, facility expenses, andNOTES TO CONSOLIDATED FINANCIAL STATEMENTS (Continued)2. Summary of Significant Accounting Policies (Continued)training, advertising and marketing costs. Credit card fees, insurance and other miscellaneous operating costs are also included in selling, general and administrative expenses. This may not be comparable to the way in which the Company's competitors or other retailers compute their selling, general and administrative expenses.Advertising—The Company expenses advertising costs as incurred. Advertising expenses are net of sponsorships. Advertising expense was approximately $250,000, $651,000 and $748,000 in fiscal 2005, 2006 and 2007, respectively.Stock-Based Compensation—Effective January 29, 2006, the Company adopted the fair value method of accounting for stock-based compensation arrangements in accordance with Financial Accounting Standards Board ("FASB") Statement No. 123(R),Share-Based Payment("SFAS No. 123(R)"), using the modified prospective method of transition. Under the provisions of SFAS No. 123(R), the estimated fair value of share-based awards granted under the 2005 Stock Incentive Plan are recognized as compensation expense over the vesting period. Using the modified prospective method, compensation expense is recognized beginning with the effective date of adoption of SFAS No. 123(R) for all share-based payments (i) granted after the effective date of adoption and (ii) granted prior to the effective date of adoption and after the Company's initial public offering on May 5, 2005. Prior to January 29, 2006, the Company accounted for stock-based employee compensation plans using the intrinsic value method of accounting in accordance with Accounting Principles Board Opinion No. 25, Accounting for Stock Issued to Employees ("APB 25"), and its related interpretations. Under the provisions of APB 25, no compensation expense was recognized when stock options were granted with exercise prices equal to or greater than market value on the date of grant. The fair value of stock option grants are estimated on the date of grant using the Black-Scholes option pricing method with the following weighted-average assumptions used for grants issued during the fiscal years ended February 2, 2008 and February 3, 2007.The fair value of stock option grants are estimated on the date of grant using the Black-Scholes option pricing method. We estimate the expected term consistent with the simplified method identified in SAB 107 for share-based awards granted during fiscal 2007 and 2006. The simplified method calculates the expected term as the average of the vesting and contractual terms of the award with the following weighted-average assumptions used for grants issued during the fiscal years ended February 3, 2007 and February 2, 2008.Fiscal Year Ended February 3,
2007February 2,
2008Dividend yield 0.0 % 0.0 % Volatility rate 35.0 % 53.4 % Forfeiture rate 8.0 % 10.0 % Average expected life (in years): Expected lives—Eight years 6.38 6.38 Expected lives—Five years 6.00 6.00 Average risk-free interest rate 4.77 % 4.55 % NOTES TO CONSOLIDATED FINANCIAL STATEMENTS (Continued)2. Summary of Significant Accounting Policies (Continued)The following table summarizes the Company's stock option and restricted stock activity for the year ended February 2, 2008 (in thousands except weighted-average exercise price):Stock Options Restricted Stock Weighted-Average
Exercise PriceOutstanding at February 3, 2007 2,675 — $ 6.76 Granted 515 16 $ 36.54 Exercised (1,095 ) — $ (2.05 ) Forfeited (137 ) — $ (17.55 ) Outstanding at February 2, 2008 1,958 16 $ 16.29 Exercisable at February 2, 2008 561 — $ 5.50 During the year ended February 2, 2008, the Company granted 515,000 stock options with a Black-Scholes weighted average fair value of $21.02 and a weighted average exercise price of $36.54. Included in the total stock options granted during the year ended February 2, 2008 were 40,000 options granted to the Board of Directors with a Black-Scholes weighted average fair value of $22.36 and an exercise price of $37.95. In connection with these grants of stock options, the Company recognized approximately $3.3 million in stock-based compensation expense during the year ended February 2, 2008 of which approximately $0.5 million was attributable to the Board of Directors.During the year ended February 2, 2008, the Company granted 16,000 shares of restricted stock to employees with an average fair market value on the date of grant of $37.19 per share. In connection with these grants, the Company recognized approximately $69,000 in stock-based compensation expense during the year ended February 2, 2008.The Company recorded $4.6 million, $2.1 million and $0.2 million of total stock-based compensation expense for the years ended February 2, 2008, February 3, 2007 and January 28, 2006, of which approximately $0.8 million, $0.3 million and $0, respectively, was attributable to the Board of Directors. The stock-based compensation expense is calculated on an accelerated method over the vesting periods of the related options. This charge had no impact on the Company's reported cash flows. For the years ended February 2, 2008, February 3, 2007 and January 28, 2006, the Company recorded approximately $0.2 million each year, respectively, in stock based compensation expense pursuant to APB 25. Under the modified prospective method of transition of SFAS No. 123(R), the Company is not required to restate its prior period financial statements to reflect expensing of share-based compensation under SFAS No. 123(R). At February 2, 2008 and February 3, 2007, there was approximately $9.2 million and $4.6 million, respectively, of total unrecognized compensation cost related to unvested stock options of which approximately $0.5 million, each year, was attributable to the Board of Directors. This cost is expected to be recognized over a period of approximately three to eight years.The Company accounts for unvested stock-based employee compensation arrangements granted prior to its initial public offering on the intrinsic value method in accordance with the provisions of APB No. 25, and related amendments and interpretations. For these awards, the Company complies with the disclosure provisions of SFAS 123.Net Income per Share—Basic net income per share is based on the weighted average number of common shares outstanding during the period. Diluted net income per share is based on the weighted average number of common shares and common share equivalents outstanding during the period. Common share equivalents included in the computation represent shares issuable upon assumed exercise of outstanding stock options and non-vested restricted stock. Potentially anti-dilutive securitiesNOTES TO CONSOLIDATED FINANCIAL STATEMENTS (Continued)2. Summary of Significant Accounting Policies (Continued)not included in the calculation of diluted earnings per share include options to purchase common stock where the option exercise price is greater than the average market price of the Company's common stock during the period reported. Total anti-dilutive common stock options not included in the calculation of diluted earnings per share were approximately 130,000, 40,000 and 0for the fiscal years endedFebruary 2, 2008 and February 3, 2007,January 29, 2011, January 30, 2010 and January28, 2006, respectively.31, 2009.IfIn 2008, we acquired thecomputed fair valuesassets of an Island Snow store from Kodama Incorporated located in Honolulu, Hawaii. In connection with theawards had been amortized to expense overpurchase, thevesting period of the awards, pro forma net income and net income per share would have been reduced to the fiscal 2005 pro forma amounts indicated in the following table (in thousands, except per share data):Fiscal Year Ended January 28,
2006Net income, as reported $ 12,851 Add: Stock-based compensation expense, as reported, net of tax 102 Deduct: Stock-based employee compensation expense determined under fair-value-based method, net of tax (362 ) Pro forma net income $ 12,591 Net income per share: Basic-as reported $ 0.50 Basic-pro forma $ 0.49 Diluted-as reported $ 0.47 Diluted-pro forma $ 0.46 Merchandise Risk—The Company's success is largely dependent upon its ability to gauge the fashion tastes of its customers and provide merchandise that satisfies customer demand. Any inability to provide appropriate merchandise in sufficient quantities inCompany entered into atimely manner could have a material adverse effect on the Company's business, operating results and financial condition.Recent accounting pronouncementsIn June 2006, the FASB issued Interpretation ("FIN") No. 48, "Accounting for Uncertainty in Income Taxes"—an Interpretation of FASB Statement No. 109. FIN 48 prescribes a recognition threshold and measurement attribute for the financial statement recognition and measurement of a tax position taken or expected to be taken in a tax return, and provides guidance on de-recognition, classification, interest and penalties, accounting in interim periods, disclosure, and transition. FIN No. 48 is effective for fiscal years beginning after December 15, 2006. The Company adopted FIN No. 48 in fiscal 2007. The adoption of FIN No. 48 did not have a material effect on the Company's consolidated financial position or results of operations in fiscal 2007.In September 2006 the FASB issued SFAS No. 157,"Fair Value Measurements". SFAS No. 157 defines fair value, establishes framework for measuring fair value in accordance with generally accepted accounting principles and expands disclosures about fair value measurements. SFAS No. 157 is effective for financial statements issued for fiscal years beginning after November 15, 2007, however the FASB has delayed the effective date of SFAS 157 to fiscal years beginning after November 15, 2008 for nonfinancial assets and nonfinancial liabilities, except those items recognized or disclosed at fair value on an annual or more frequently occurring basis.NOTES TO CONSOLIDATED FINANCIAL STATEMENTS (Continued)2. Summary of Significant Accounting Policies (Continued)The Company does not expect the adoption of SFAS No. 157 to have a material effect on the Company's consolidated financial position or results of operations.In September 2006 The SEC released Staff Accounting Bulletin ("SAB") No. 108,"Considering the Effects of Prior Year Misstatements When Quantifying Misstatements in Current Year Financial Statements". SAB 108 provides guidance on how the effects of the carryover or reversal of prior year financial statement misstatements should be considered in quantifying a current year misstatement. The Company adopted the guidance in SAB 108 beginning in the fourth quarter of fiscal year 2006. The adoption of SAB 108 did not have a material impact on the Company's consolidated financial position or consolidated results of operations for fiscal 2006.In February 2007, the FASB issued SFAS No. 159,"The Fair Value Option for Financial Assets and Financial Liabilities"including an amendment of FASB Statement No. 115, which provides entities with an option to report selected financial assets and liabilities at fair value. SFAS No.159 also establishes presentation and disclosure requirements designed to facilitate comparisons between entities that choose different measurement attributes for similar types of assets and liabilities. This statement is effective as of the beginning of the first fiscal year that begins after November 15, 2007. The Company does not expect the adoption of SFAS No. 159 to have a material effect on the Company's consolidated financial position or results of operations.In December 2007, the FASB issued SFAS No. 141 (revised 2007), "Business Combinations" ("SFAS 141(R)"), which replaces SFAS No. 141, "Business Combinations" ("SFAS 141"). SFAS 141(R) retains the underlying concepts of SFAS 141 in that all business combinations are still required to be accounted for at fair value under the acquisition method of accounting but SFAS 141(R) changed the method of applying the acquisition method in a number of significant aspects. Acquisition costs will generally be expensed as incurred; non-controlling interests will be valued at fair value at the acquisition date; in-process research and development will be recorded at fair value as an indefinite-lived intangible asset at the acquisition date; restructuring costs associated with a business combination will generally be expensed subsequent to the acquisition date; and changes in deferred tax asset valuation allowances and income tax uncertainties after the acquisition date generally will affect income tax expense. SFAS 141(R) is effective on a prospective basis for all business combinationsnoncompetition agreement for which theacquisition date is on or afterCompany paid $0.1 million and recorded an intangible asset. Under this agreement, Kodama Incorporated agreed not to compete with Zumiez for a period of two years. We amortized thebeginningnon-compete agreement over the term of thefirst annual period subsequent to December 15, 2008, withagreement and at January 29, 2011, this intangible asset has been fully amortized.7. Other Liabilities
At January 29, 2011 and January 30, 2010, other liabilities on the
exceptionconsolidated balance sheets consisted of theaccounting for valuation allowances on deferred taxes and acquired tax contingencies. SFAS 141(R) amends SFAS No. 109, "Accounting for Income Taxes," such that adjustments made to valuation allowances on deferred taxes and acquired tax contingencies associated with acquisitions that closed prior to the effective date of SFAS 141(R) would also apply the provisions of SFAS 141(R). Early adoption is not permitted. We are currently evaluating the effects, if any, that SFAS 141(R) may have on our consolidated financial statements.In December 2007, the FASB issued SFAS No. 160, "Non-controlling Interests in Consolidated Financial Statements." SFAS No. 160 amends Accounting Research Bulletin No. 51, "Consolidated Financial Statements" and requires (i) classification of non-controlling interests, commonly referred to as minority interests, within stockholders' equity, (ii) net income to include the net income attributable to the non-controlling interest and (iii) enhanced disclosure of activity related to non-controlling interests. SFAS No. 160 is effective for fiscal years beginning after December 15, 2008. We are currently assessing the impact of SFAS No. 160 on our consolidated financial statements.In December 2007, the Securities and Exchange Commission issued SAB No. 110, "Share-Based Payment"("SAB 110"). SAB 110 amends SAB 107, and allows for the continued use, under certain circumstances, of the "simplified method" in developing an estimate of the expected term on stockNOTES TO CONSOLIDATED FINANCIAL STATEMENTS (Continued)2. Summary of Significant Accounting Policies (Continued)options accounted for under SFAS 123R. SAB 110 is effective for stock options granted after December 31, 2007. We are currently evaluating the impact of the new provisions of SAB 110 for stock option awards granted in the future.3. Leasehold Improvements and Equipmentfollowing (in thousands):Leasehold improvements and equipment consist of the following:Fiscal Year Ended February 3,
2007February 2,
2008(In thousands) Leasehold improvements and other equipment $ 52,773 $ 68,669 Computer equipment 7,347 10,002 Fixtures and other 26,392 35,797 86,512 114,468 Less accumulated depreciation (36,623 ) (48,531 ) $ 49,889 $ 65,937 Depreciation expense on leasehold improvements and equipment was $14.6 million, $10.4 million, and $7.5 million for fiscal 2007, 2006 and 2005, respectively.January 29, 2011 January 30, 2010 Accrued sales tax
$ 3,906 $ 1,497 Unredeemed gift cards
3,260 2,930 Accrued payables
3,092 2,695 Accrued legal
2,211 1,512 Other current liabilities
1,214 489 $ 13,683 $ 9,123 4.8. Revolving Credit FacilityWe have aOn June 10, 2009, we renewed and amended our secured credit agreement with Wells Fargo HSBC Trade Bank, N.A., and the prior facility agreement was terminated. The credit agreement provides us with a secured revolving credit facility untilAugust 30, 2009September 1, 2011 of up to $25.0 million.This facility replaces our $20.0 million secured revolving credit facility with Bank of America, N.A., which terminated effective August 31, 2006.The secured revolving credit facility provides for the issuance of a standbycommercial lettersletter of credit in an amount not to exceed $5.0 million outstanding at any time and with a term not to exceed 365days, althoughdays. The commercial line of credit provides for the issuance of a commercial letter of credit in an amount not to exceed $10.0 million and with terms not to exceed 120 days. The amount of borrowings available at any time under our secured revolving credit facility is reduced by the amount of standby and commercial letters of credit outstanding at that time. There were no outstanding borrowings under the secured revolving credit facility atFebruary 2, 2008January 29, 2011 orFebruary 3, 2007. The CompanyJanuary 30, 2010. We had open commercial letters of credit outstanding under our secured revolving credit facility ofapproximately$0.5 million atFebruary 2, 2008January 29, 2011 andapproximately $0.7$0.6 million atFebruary 3, 2007.January 30, 2010. The secured revolving credit facility bears interest atfloating rates based onthelower of the prime rate (6.00% at February 2, 2008) minus 0.50% or theDaily One Month LIBOR rate(4.22% at February 2, 2008),plus 1.00%for advances over $500,000 for a minimum of 30 days and a maximum of 180 days.. The credit agreement contains a number of restrictions and covenants that generally limit our ability to, among other things, (1) incur additional debt, (2) undergo a change in ownership and (3) enter into certain transactions. The credit agreement also contains financial covenants that require us to meet certain specified financial tests and ratios, including,minimuma maximum net loss not to exceed $10.0 million after taxes on a trailing four-quarter basis provided, that, there shall be added to net incomeafter taxes, maximum total liabilitiesall charges for impairment of goodwill and store assets not to exceed $5.0 million in aggregate, and a minimum quick ratio of 1.25. The quick ratio is defined as our cash and near cash equivalents plus certain defined receivables divided bytangible net worth and minimum quick asset ratio.the outstanding borrowings. All of our personal property, including, among other things, our inventory, equipment and fixtures, has been pledged to secure our obligations under the credit agreement. We must also provide financial information and statements to our lender. We were in compliance with all such covenants atFebruary 2, 2008.January 29, 2011.NOTES TO CONSOLIDATED FINANCIAL STATEMENTS (Continued)9. Commitments and Contingencies5. Income TaxesDuringLeases—We are committed under operating leases for all of our retail store locations and our combined home office and ecommerce fulfillment center generally with terms of five to ten years. Total rent expense, base rent expense and contingent and other rent expense for the fiscal2007, we adopted the provisions of FIN 48. FIN 48 prescribes a comprehensive model for how a company should recognize, measure, present,years ended January 29, 2011, January 30, 2010 anddisclose in its financial statements uncertain tax positions that the company has taken or expects to take on a tax return. FIN 48 states that a tax benefit from an uncertain position may be recognized only if it is "more likely than not" that the position is sustainable, based on its technical merits. The tax benefit of a qualifying position is the largest amount of tax benefit that is greater than fifty percent likely of being realized upon ultimate settlement with a taxing authority having full knowledge of all relevant information. Interest recognized in accordance with this Interpretation may be classified in the financial statements as either income taxes or interest expense, based on the accounting policy election of the enterprise. The Company has elected to classify any interest expense recognized under this Interpretation as income taxes. The Company files income tax returns in the U.S. federal jurisdiction and various state jurisdictions. The majority of the Company's returns are no longer subject to U.S. federal and state examinations by tax authorities for years before fiscal 2004.The components of deferred income taxes are:Fiscal Year Ended February 3,
2007February 2,
2008(In thousands) Deferred tax assets: Charitable contributions $ — $ 456 Deferred rent 5,184 7,808 Inventory 1,507 2,131 Employee benefits, including stock based compensation 1,088 2,742 Total deferred tax assets 7,779 13,137 Deferred tax liabilities: Property and equipment (6,422 ) (8,016 ) Goodwill (444 ) (773 ) Prepaid expenses (203 ) (1,812 ) Total deferred tax liabilities (7,069 ) (10,601 ) Net deferred tax asset $ 710 $ 2,536 NOTES TO CONSOLIDATED FINANCIAL STATEMENTS (Continued)5. Income Taxes (Continued)The components of the provision (benefit) for income taxes are:Fiscal Year Ended January 28,
2006February 3,
2007February 2,
2008(In thousands) Current Federal $ 7,243 $ 11,870 $ 14,554 State 1,334 2,195 2,616 Total current 8,577 14,065 17,170 Deferred Federal (656 ) (1,110 ) (1,550 ) State (77 ) (205 ) (276 ) Total deferred (733 ) (1,315 ) (1,826 ) Provision for income taxes $ 7,844 $ 12,750 $ 15,344 The reconciliation of the income tax provision at the U.S. federal statutory rate to the Company's effective income tax rateJanuary 31, 2009 is as follows (in thousands). Included in other rent expense are payments of real estate taxes, insurance and common area maintenance costs.Fiscal Year Ended January 29, 2011 January 30, 2010 January 31, 2009 Base rent expense
$ 37,140 $ 35,208 $ 31,772 Contingent and other rent expense
24,660 22,774 21,101 Total rent expense
$ 61,800 $ 57,982 $ 52,873 At January 29, 2011, we were committed to property owners for operating lease obligations for $347.8 million. A majority of our leases provide for ongoing co-tenancy requirements or early cancellation clauses that would further lower rental rates, or permit lease terminations, or both, in the event that co-tenants cease to operate for specific periods or if certain sales levels are not met in specific periods. Most of the store leases require payment of a specified minimum rent and a contingent rent based on a percentage of the store’s net sales in excess of a specified threshold. Amounts in the table below do not include percentage rent, common area maintenance charges or real estate taxes unless these costs are fixed and determinable. Future minimum commitments on all leases at January 29, 2011 are as follows (in thousands):
Operating Lease
ObligationsFiscal 2011
$ 46,721 Fiscal 2012
47,013 Fiscal 2013
46,750 Fiscal 2014
44,975 Fiscal 2015
42,329 Thereafter
120,013 Total
$ 347,801 Purchase Commitments—At January 29, 2011 and January 30, 2010, we had outstanding purchase orders to acquire merchandise from vendors of $76.5 million and $47.6 million, including $0.5 million and $0.6 million of letters of credit outstanding. We have an option to cancel these commitments with no notice prior to shipment, except for private label purchase orders in which we are obligated to repay certain contractual amounts upon cancellation.
Litigation—We are involved from time to time in claims, proceedings and litigation arising in the ordinary course of business. We have made accruals with respect to these matters, where appropriate, which are reflected in our consolidated financial statements. For some matters, the amount of liability is not probable or the amount cannot be reasonable estimated and therefore accruals have not been made. We may enter into discussions regarding settlement of these matters, and may enter into settlement agreements, if we believe settlement is in the best interest of the Company’s shareholders.
On March 5, 2008, a former employee commenced an action against the Company in California state court (Evan Johnson v. Zumiez, Inc., et al.,Case No. RG08374968, Alameda County Superior Court, filed March 5, 2008) alleging that we failed to pay all overtime wages owing to him and other employees in California, failed to provide meal breaks as required by California law, failed to provide employees with proper itemized wage statements (pay stubs) as required by California law, and failed to pay terminated employees waiting time penalties under California Labor Code section 203. The court granted preliminary approval of the settlement on March 16, 2010, and issued an order granting final approval on July 23, 2010. No class members objected to the settlement and only four class members opted out of the settlement. The total amount of the negotiated settlement is $1.4 million. This entire amount was paid out in settlement awards to the class members, attorneys’ fees and costs, claims administration fees and other payments required by the settlement, with no reversion of unclaimed funds to the Company. This accrued charge was recorded in selling, general and administrative expenses on the consolidated statement of operations for the fiscal year
ended:Fiscal Year Ended January 28,
2006February 3,
2007February 2,
2008Expected U.S. federal income taxes at statutory rates 35.0 % 35.0 % 35.0 % State and local income taxes, net of federal effect 4.0 3.8 3.7 Permanent differences 0.6 (0.7 ) (1.1 ) Other (1.7 ) (0.2 ) 0.1 37.9 % 37.9 % 37.7 % 6. Stock Optionsended January 30, 2010, and was paid out on August 10, 2010.During fiscal 1997A putative class action,Chandra Berg et al. v. Zumiez Inc., was filed against the Companyadoptedin the1993 Stock Option Plan (the "1993 Plan")Los Angeles Superior Court under case number BC408410 on February 25, 2009. The Complaint alleged causes of action for failure to pay overtime wages to present and former store managers in California, failure to provide meal periods and rest breaks to store managers, failure to reimburse retail employees for clothing required by the Company’s dress code, failure to reimburse retail employees for business expenses, failure to provide storemanagers with accurate itemized wage statements, failure to pay terminated store managers all wages due at the time of termination, unfair business practices and declaratory relief. Plaintiff filed a First Amended Complaint on April 2, 2010 which added an additional plaintiff/class representative and a new cause of action for penalties for alleged Labor Code violations under the Private Attorneys General Act. We filed an answer to the First Amended Complaint and conducted discovery. On February 8, 2010, we attended a mediation wherein no settlement was reached. Plaintiffs filed their motion for class certification, and we filed our opposition to class certification. Plaintiffs’ reply papers were filed on August 2, 2010. On September 1, 2010, the Company announced that it had reached an agreement to settle. The settlement agreement is $2.1 million, which includes settlement awards to class members, incentive payments to the two plaintiffs, attorneys’ fees and costs and claims administration costs. The court granted preliminary approval of the settlement on November 3, 2010, and granted final approval of the settlement on February 23, 2011. The claims administrator will now distribute the settlement funds pursuant to the Court’s order and the settlement agreement. The accrued charge of $2.1 million was recorded in selling, general and administrative expenses on the consolidated statements of operations for the
granting of nonqualified stock optionsfiscal year ended January 29, 2011 and was paid out on March 10, 2011.Insurance Reserves—We are responsible for medical and dental insurance claims up to
executive officersa specified aggregate amount. We maintain a reserve for estimated medical andkey employees of the Company as determined by a committee of the Company's board of directors, the 1993 Plan Committee (the "Committee").The date of grant, option price, vesting perioddental insurance claims based on historical claims experience and otherterms specificestimated assumptions. The insurance reserve at January 29, 2011 and January 30, 2010 was $0.4 million and $0.3 million.10. Fair Value Measurements
We apply the following fair value hierarchy, which prioritizes the inputs used to
options granted undermeasure fair value into three levels and bases the1993 Plan are determined bycategorization within theCommittee. All stock options granted underhierarchy upon the1993 Plan vest over a fixed periodlowest level of input that is available andexpire no later than ten years from the date of grant. No additional awards may be granted under the 1993 Plan. Prior to fiscal 2004, the option price for all options granted was equalsignificant to the fair value measurement:Level 1—Quoted prices in active markets for identical assets or liabilities;
Level 2—Quoted prices for similar assets or liabilities in active markets or inputs that are observable; and
Level 3—Inputs that are unobservable.
We follow the guidelines for assessing fair value measurements consistent with GAAP that requires an assessment of whether certain factors exist to indicate that the market for an instrument is not active at the measurement date. If, after evaluating those factors, the evidence indicates the market is not active, a company must determine whether recent quoted transaction prices are associated with distressed transactions.
The following tables summarize assets measured at fair value on a recurring basis at January 29, 2011 and January 30, 2010 (in thousands):
January 29, 2011 Level 1 Level 2 Level 3 Cash equivalents:
Money market funds
$ 928 $ — $ — State and local government securities
— 3,269 — Marketable securities:
Treasury and agency securities
— 6,069 — State and local government securities
— 102,170 — Variable-rate demand notes
— 9,205 — Long-term investments:
State and local government securities
— — 870 Equity method investment
— — 1,896 Total assets
$ 928 $ 120,713 $ 2,766 January 30, 2010 Level 1 Level 2 Level 3 Cash equivalents:
Money market funds
$ 487 $ — $ — Marketable securities:
Treasury and agency securities
— 15,316 — State and local government securities
— 69,785 — Variable-rate demand notes
— 21,382 — Long-term investments:
State and local government securities
— — 872 Total assets
$ 487 $ 106,483 $ 872 Our policy is to recognize transfers into and transfers out of hierarchy levels as of the actual date of the event or change in circumstances that caused the transfer.
The Level 2 marketable securities primarily include state and local municipal securities, U.S. Treasury securities, U.S. Agency securities and variable-rate demand notes. Fair values are based on quoted market prices for similar assets or liabilities or determined using inputs that use readily observable market data that are actively quoted and can be validated through external sources, including third-party pricing services, brokers and market transactions.
The Level 3 state and local government securities at January 29, 2011 and January 30, 2010 represents a $1.0 million par value auction rate security, net of temporary impairment charge of $0.1 million. Our valuation method for the auction rate security is based on numerous assumptions including assessments of the underlying security, expected cash flows, credit ratings, liquidity and other relevant factors. The equity method investment is valued using comparative market multiples adjusted by an estimated discount factor. The assumptions, assessments and the interpretations of relevant market data are subject to uncertainties and are difficult to predict and require significant judgment. The use of different assumptions, applying different judgment to inherently subjective matters and changes in future market conditions could result in significantly different estimates of fair value.
The following tables present the changes in the Level 3 fair value category for the fiscal years ended January 29, 2011 and January 30, 2010 (in thousands):
State and Local
Government
SecuritiesEquity
InvestmentBalance at January 31, 2009
$ 1,767 $ — Sales
(1,000 ) — Unrealized gain included in accumulated other comprehensive income
105 — Balance at January 30, 2010
872 — Purchases
— 2,000 Unrealized loss included in accumulated other comprehensive income
(2 ) — Unrealized loss included in other income (expense), net
— (104 ) Balance at January 29, 2011
$ 870 $ 1,896 The following table represents the fair value hierarchy for assets measured at fair value on a nonrecurring basis at January 29, 2011 and January 30, 2010 (in thousands):
Long-Lived Assets Held and Used
Fair Value (as of
period end)Using Significant
Unobservable
Inputs (Level 3
Measurements)Net Loss (for
the fiscal year
ended)January 29, 2011
$ 117 $ 117 $ 105 January 30, 2010
$ 30 $ 30 $ 2,538 During the fiscal year ended January 29, 2011, in accordance with the accounting for impairments of long-lived assets classified as held and used, two stores with a net fixed asset carrying amount of $0.2 million were written down to their fair value of $0.1 million, resulting in a net impairment charge of $0.1 million. During the
Company's common stockfiscal year ended January 30, 2010, 21 stores with a net fixed asset carrying amount of $2.6 million were written down to their fair value of less than $0.1 million, resulting in a net impairment charge of $2.5 million. These non-cash impairment charges are included in selling, general and administrative expenses. The fair value was determined using a discounted cash flow model at a store level. Store impairment expense was recorded net of thedateremaining tenant allowance. The estimation ofgrant.future cash flows from operating activities requires significant judgments of factors that include future sales, gross profit and operating expenses. If our actual sales, gross profit or operating expenses differ from our estimates, the carrying value of certain store assets may prove unrecoverable and we may incur additional impairment charges in the future.11. Equity Awards
General Description of Equity Awards Plans—During fiscal 2004, the Company adopted the 2004 Stock Option Plan (the
"2004 Plan"“2004 Plan”) to provide for the granting of incentive stock options and nonqualified stock options to executive officers and key employees of the Company as determined by the 2004 Plan Committee of theCompany'sCompany’s board of directors. The terms of the 2004 Plan are generally the same as the 1993 Plan. The Company hasNOTES TO CONSOLIDATED FINANCIAL STATEMENTS (Continued)6. Stock Options (Continued)authorized 7,365,586 split adjusted shares of common stock for issuance under the 2004 Plan. The Company does not plan on making any new stock option grants under the 2004 Plan.
The Company adopted the 2005 Equity Incentive Plan (the
"2005 Plan"“2005 Plan”) on January 24, 2005 and theCompany'sCompany’s shareholders approved it on April 27, 2005. Unless sooner terminated by the Board, the 2005 Plan will terminate on the day before the tenth anniversary of the date that the 2005 Plan was approved by theCompany'sCompany’s shareholders. The 2005 Incentive Plan provides for the grant of incentive stock options, nonqualified stock options, stock bonuses, restricted stock awards, restricted stock units and stock appreciation rights, which may be granted to theCompany'sCompany’s employees (including officers), directors and consultants.The aggregate number of shares of common stock that may be issued pursuant to awards granted under the 2005 Plan will not exceed 5,850,000 plus (1) the number of shares that are subject to awards under the 2005 Plan, the 1993 Plan or the 2004 Plan that have been forfeited or repurchased by us or that have otherwise expired or terminated, (2) at our option, the number of shares that were reserved for issuance under the 2004 Plan but that were not subject to a grant under such plan at the completion of the
Company'sCompany’s initial public offering in May 2005, and (3) an annual increase on the first business day of each fiscal year such that the total number of shares available for issuance under the 2005 Plan shall equal 15% of the total number of shares of common stock outstanding on such business day; provided, that with respect to such annual increase, theBoardboard may designate a lesser number of additional shares or no additional shares during such fiscal year. In no event, however, will the aggregate number of shares available for award under the 2005 Plan exceed 8,775,000 split adjusted shares. As a result of this limitation on the aggregate number of shares available for award under the 2005 Plan, and the 6,614,594 split adjusted shares of theCompany'sCompany’s common stock that were reserved for issuance under our 2004 Plan but that were not subject to grants under that plan at the completion of the initial public offering, up to 2,925,000 split adjusted shares, may currently be added to the shares of common stock that may be issued pursuant to awards granted under the 2005 Plan pursuant to clause (2) of the first sentence of this paragraph; however, the Company does not currently intend to add any of those shares to the 2005 Plan.During fiscal 2004 the Company issuedStock Options—On July 21, 2009, we completed an offer to exchange certain employee stock options
to certain employees with exercise prices below the fair market value of the Company's common stock at the date of grant. In accordance with the requirements of APB 25, the Company has recorded stock-based compensation for the difference between the exercise price of the stock options and the fair market value of the Company's stock at the grant date. During fiscal 2007, 2006 and 2005, the Company recorded stock-based compensation of approximately $0.2 million each year, respectively, related to these options. Stock-based compensation expense is currently recognized over the vesting period of the awards, generally five to eight years. Excluding the impact of the adoption of FAS 123R, future compensation expense to be recognized through fiscal 2013 associated with these grants will be $0.5 million. There were 515,000, 517,600 and 0 stock options granted during fiscal years 2007, 2006 and 2005, respectively. In addition the Company issued 16,000 shares of restricted stock in fiscal 2007.As of January 28, 2006 no options to purchase shares of common stock were outstanding and no shares had beenissued under the 2005Plan. AsEquity Incentive Plan (“Exchange Offer”). Certain previously granted stock options were exchanged for new, lower-priced stock options granted on a one and one half-for-one basis (1.5:1). An aggregate ofFebruary 2, 2008460,700 previously granted stock options were exchanged for an aggregate of 307,138 new stock options granted pursuant to the Exchange Offer with an exercise price of $8.64 per share. The new stock option grants will vest annually over a four-year period beginning on the first anniversary of the date granted. The Exchange Offer resulted in a nominal increase in stock-based compensation expense.The following table summarizes our stock option activity for the fiscal years ended January 29, 2011, January 30, 2010 and
February 3, 2007 there were, respectively, 898,100January 31, 2009 (in thousands except weighted-average exercise price and484,600weighted-average remaining contractual life):Stock Options Grant Date
Weighted-
Average Exercise
PriceWeighted-Average
Remaining
Contractual Life
(in Years)Intrinsic
Value (1)Outstanding at February 2, 2008
1,958 $ 16.29 Granted
160 $ 14.25 Exercised
(211 ) $ 2.46 Forfeited
(114 ) $ 28.20 Outstanding at January 31, 2009
1,793 $ 17.13 Granted
528 $ 8.03 Exercised
(258 ) $ 1.64 Forfeited
(568 ) $ 29.50 Outstanding at January 30, 2010
1,495 $ 11.88 Granted (2)
58 $ 19.13 Exercised
(392 ) $ 3.70 Forfeited (3)
(43 ) $ 18.68 Outstanding at January 29, 2011
1,118 $ 14.86 6.06 $ 11,512 Exercisable at January 29, 2011
466 $ 19.43 5.43 $ 3,800 Vested or expected to vest at January 29, 2011 (4)
1,051 $ 15.04 6.01 $ 10,735 (1) Intrinsic value for stock options is defined as the difference between the market price of the Company’s common stock on the last business day of the fiscal year and the weighted average exercise price of in-the-money options outstanding at the end of the fiscal year. The market value per share was $22.31 at January 29, 2011. (2) Includes 307,138 stock options issued pursuant to the Exchange Offer. (3) Includes 460,700 stock options exchanged in the Exchange Offer. (4) Includes outstanding vested options as well as outstanding, non-vested options after a forfeiture rate is applied. The following table summarizes additional information related to
purchase shares of commonstockissuedoption activity for the fiscal years ended January 29, 2011, January 30, 2010 andoutstanding under the 2005 Plan.NOTES TO CONSOLIDATED FINANCIAL STATEMENTS (Continued)6. Stock Options (Continued)January 31, 2009:Fiscal Year Ended January 29, 2011 January 30, 2010 January 31, 2009 Weighted-average fair value per share of stock options granted
$ 12.24 $ 4.44 $ 7.89 Aggregate intrinsic value of stock options exercised (in thousands)
$ 7,909 $ 2,489 $ 3,410 Vest-date fair value of stock options vested (in thousands)
$ 2,094 $ 1,400 $ 3,046 The following table summarizes information concerning outstanding and exercisable options at
February 2, 2008:Options Outstanding Options
ExercisableExercise Price Number of
OptionsWeighted-Average
Remaining
Contractual LifeNumber of
Options$ 1.09 187,894 1.3 187,894 $ 1.78 405,746 3.6 190,553 $ 3.87 466,150 5.3 112,203 $24.89-27.31 344,800 8.1 43,316 $30.52-33.59 50,000 8.4 16,670 $35.85-39.05 488,300 9.1 10,000 $41.15-41.86 15,000 9.6 — Total 1,957,890 560,636 7. Related Party TransactionsJanuary 29, 2011:During fiscal 2005, the Company paid $1,000 in fees on behalf of its Parent, resulting in a balance of $149,000, which was forgiven and the Parent was subsequently dissolved in connection with the Company's initial public offering. This amount was reported in shareholders' equity and expensed to selling, general and administrative expense.Options Outstanding Options
ExercisableExercise Price
Number of
Options
(in thousands)Weighted
Average
Remaining
Contractual LifeNumber of
Options
(in thousands)$ 1.78 33 0.6 33 3.87 164 3.6 81 6.88 202 8.1 42 8.64 250 5.7 34 14.00-19.23 192 7.7 62 27.31-33.59 120 5.2 99 $ 35.85-38.19 157 6.3 115 Total
1,118 466 In fiscal 2005 the Company paid Brentwood Private Equity III, LLC a consulting fee of $53,000 under a Corporate Development and Administrative Services Agreement. This agreement was subsequently terminated in connection with the initial public offering.Restricted Stock—The
Company committed charitable contributions to Zumiez Foundation in fiscal 2007 and fiscal 2006 of approximately $581,000 and $537,000, respectively. The Company has accrued charitable contributions payable to Zumiez Foundationfollowing table summarizes our restricted stock activity for the fiscal years endedFebruary 2, 2008January 29, 2011, January 30, 2010 andFebruary 3, 2007 of approximately $738,000 and $485,000. Zumiez Foundation is a charitable based non profit organization focused on meeting the various needs of the under-privileged in communities where the Company has retail stores. The Company's Chairman of the Board is also the President of Zumiez Foundation.8. Commitments and ContingenciesJanuary 31, 2009 (in thousands except weighted-average fair value):Leases—The Company is committed under operating leases for all of its retail store locations. In addition to minimum future lease payments, substantially all store leases provide for additional rental payments based on sales, as well as common area maintenance charges. During fiscal 2004 the Company entered into a lease for a new combined home office and distribution center under a non-cancelable operating lease agreement that expires in July 2012 with two renewal options. For leases that have fixed escalation clauses, minimum rents are recognized on a straight-line basis over the term of the lease. The Company expenses escalated percentage rent payments in the period they become known. In September 2006 the Company entered into a new lease agreement for an additional 37,000 square feet of warehouse space. The new lease agreement terminated and replaced the original fiscal 2004 lease with the Landlord. The new lease agreement provides for an initial lease term of 126 months within which we have an option to extend the lease term for an additional period of five years.Restricted Stock Grant Date
Weighted-
Average Fair
ValueIntrinsic Value (1) Outstanding at February 2, 2008
16 $ 37.19 Granted
333 $ 14.52 Vested
(5 ) $ 37.54 Forfeited
(59 ) $ 14.05 Outstanding at January 31, 2009
285 $ 15.49 Granted
450 $ 7.17 Vested
(81 ) $ 16.17 Forfeited
(32 ) $ 9.80 Outstanding at January 30, 2010
622 $ 9.67 Granted
196 $ 19.19 Vested
(195 ) $ 10.11 Forfeited
(31 ) $ 11.99 Outstanding at January 29, 2011
592 $ 12.55 $ 13,213 NOTES TO CONSOLIDATED FINANCIAL STATEMENTS (Continued)(1) Intrinsic value for restricted stock is defined as the market value of the outstanding restricted stock on the last business day of the fiscal year. The market value per share was $22.31 at January 29, 2011. 8. Commitments and Contingencies (Continued)Total rent expense, base rent and contingent rent for the three years ended February 2, 2008, February 3, 2007 and January 28, 2006 (in thousands) are as follows:Fiscal Year Ended January 28,
2006February 3,
2007February 2,
2008Base Rent Expense $ 12,155 $ 17,692 $ 24,931 Contingent and Other Rent Expense 9,996 14,205 18,548 Total Rent Expense $ 22,151 $ 31,897 $ 43,479 Future minimum commitments (in thousands) on all leases at February 2, 2008 are as follows:Retail Stores Home Office Total Fiscal 2008 $ 27,121 $ 755 $ 27,876 Fiscal 2009 27,126 775 27,901 Fiscal 2010 26,685 795 27,480 Fiscal 2011 25,489 816 26,305 Fiscal 2012 23,676 847 24,523 Thereafter 83,470 4,014 87,484 $ 213,567 $ 8,002 $ 221,569 Purchase Commitments—The Company had outstanding purchase orders to acquire merchandise from vendors for approximately $59.5 million and $70.5 million at February 2, 2008 and February 3, 2007, respectively. These purchases are expected to be financed by cash flows from operations and the Company's revolving credit facility. The Company has an option to cancel such commitments with no notice prior to shipment.Litigation—On December 10, 2007, a putative class action complaint was filed in the U.S. District Court for the Western District of Washington against the Company and certain of its current and former directors and officers. The complaint asserts claims under Sections 10(b) and 20(a) of the Securities Exchange Act of 1934, as amended, and Rule 10b-5 promulgated thereunder. A substantially similar complaint was filed in the same court on December 14, 2007. These cases, which were subsequently consolidated, purport to be brought on behalf of a class of purchasers of the Company's stock during the period March 14, 2007 to November 7, 2007. Plaintiffs allege that the defendants violated the federal securities laws during this period of time by, among other things, making misrepresentations about the Company's projected financial results in order to artificially inflate the Company's stock price. Plaintiffs are seeking compensatory damages in an unspecified amount, interest, and an award of attorneys' fees and costs. Plaintiffs have until May 5, 2008 to file a consolidated amended complaint.NOTES TO CONSOLIDATED FINANCIAL STATEMENTS (Continued)8. Commitments and Contingencies (Continued)In addition, on December 20, 2007, a shareholder derivative action was filed in the Superior Court of the State of Washington (Snohomish County), allegedly on behalf of and for the benefit of the Company, against certain of the Company's current and former directors and officers. The Company was named as a nominal defendant. The derivative complaint is based on the same allegations of fact as in the securities class action, and claims that the defendant directors and officers breached fiduciary duties, abused their control, engaged in gross mismanagement, wasted corporate assets, unjustly enriched themselves, and engaged in insider trading. The complaint seeks unspecified damages, restitution, disgorgement of profits, equitable and injunctive relief, attorneys' fees, costs, and expenses. Because the complaint is derivative in nature it does not seek monetary damages from the Company. However, the Company may be required throughout the pendency of the action to advance the legal fees and costs incurred by the defendant directors and officers.The Company is unable to predict the outcome of these cases. A court determination in any of these actions against the Company could result in significant liability and could have a material adverse effect on the Company's business, results of operations or financial condition.Insurance Reserves—The Company is responsible for medical insurance claims up to a specified aggregate amount. The Company maintains a reserve for estimated medical insurance claims based on historical claims experience and other estimated assumptions.Employment Agreement—The Company has an employment agreement in place with a key employee. The agreement provides that if the Company terminates the employee's employment without cause or if he terminates his employment for good reason, the employee could be entitled to continue to receive his base salary for a time period not to exceed eighteen months.9. GoodwillIn connection with the acquisition of Action Concepts Fast Forward, Ltd., on June 24, 2006 the Company recorded goodwill in accordance with SFAS 141"Business Combinations."As of November 3, 2007, the Company had $250,000 of restricted cash held in escrow that was payable to Action Concepts Fast Forward, Ltd. This was accounted for as an addition to goodwill resulting in an increase in the total purchase price of the acquisition. The Company recorded $13.2 million of goodwill as the excess of the purchase price of $15.5 million over the fair value of the net amounts assigned to assets acquired and liabilities assumed. In accordance with SFAS 142,"Goodwill and Other Intangible Assets,"the Company will continue to assess, in accordance with our "goodwill" policy as stated in Note 2, whether goodwill is impaired.10. Business AcquisitionIn June, 2006, we completed the acquisition of 100% of the ownership of Action Concepts Fast Forward, Ltd., an apparel and accessory retail sales company which operated 20 stores (17 in Texas, 2 in Oklahoma and 1 in California). The ability to expand operations into Texas with a full complement of stores at one time was the primary reason for the acquisition. Total costs of the acquisition were $15.5 million and were paid in cash plus assumption of liabilities. The Company completed an independent appraisal to determine the final allocation of the purchase price.NOTES TO CONSOLIDATED FINANCIAL STATEMENTS (Continued)10. Business Acquisition (Continued)The following table summarizes
the allocation of fair values of the assets acquired and liabilities assumed (in thousands):Cash in stores $ 15 Prepaid expenses 143 Other current assets 168 Merchandise inventory 4,227 Property & equipment 1,819 Goodwill 13,154 Checks drawn in excess of bank balance (608 ) Accounts payable (1,712 ) Short-term debt (732 ) Other current liabilities (957 ) Fair value of net assets acquired, including Goodwill $ 15,517 The transaction was accounted for under the purchase method of accounting and, accordingly, the purchased assets and assumed liabilities were recorded at their estimated fair values. The purchase price allocation resulted in an excess of purchase price over net tangible assets acquired of $13.2 million. All of the excess of purchase price over net tangible assets acquired was attributed to goodwill, which is not subject to amortization for book purposes. The Company is amortizing the goodwill for tax purposes utilizing the 338(h)(10) Federal tax code election. At February 2, 2008, $250,000 was held in escrow and due to the ownership of Action Concepts Fast Forward, Ltd. for payment of future claims. Accordingly, this amount is reflected in the purchase price of the related acquisition and allocated to goodwill.The following summarized unaudited pro formaadditional information(in thousands) assumes the acquisition of Fast Forward had occurred at the beginning of the period presented. The pro forma information does not purport to indicate what would have occurred had the acquisition been made at the beginning of the period presented, nor of the results which may occur in the future.Fiscal Year Ended January 28,
2006February 3,
2007Pro Forma Information (Unaudited) Net Sales $ 229,517 $ 306,761 Net Income $ 13,242 $ 20,082 Basic Earnings Per Share $ 0.51 $ 0.73 Diluted Earnings Per Share $ 0.48 $ 0.70 The Company incurred transaction expenses of approximately $663,000related to restricted stock activity for theemployee severancefiscal years ended January 29, 2011, January 30, 2010 andtransitionJanuary 31, 2009:Fiscal Year Ended January 29, 2011 January 30, 2010 January 31, 2009 Vest-date fair value of restricted stock vested (in thousands)
$ 3,734 $ 674 $ 73 Stock-Based Compensation—We recorded $4.9 million, $4.1 million and $4.4 million of total stock-based compensation expense
offor theacquisition. To date, this amount has been paid in full. These costs were accounted for under Emerging Issues Task Force 95-3"Recognition of Liabilities in Connection with a Purchase Business Combination."fiscal years ended January 29, 2011, January 30, 2010 and January 31, 2009.11. Employee Benefit PlansAt January 29, 2011, there was $6.7 million of total unrecognized compensation cost related to unvested stock options and restricted stock grants. This cost has a weighted-average recognition period of 1.1 years.12. Employee Benefit Plans The Zumiez Investment Plan (Z.I.P.) is a qualified plan under Section 401(k) of the Internal Revenue Code. Employees that have been with the Company for a year, work an average of thirty
NOTES TO CONSOLIDATED FINANCIAL STATEMENTS (Continued)11. Employee Benefit Plans (Continued)hours a week and are twenty-one or older are eligible to participate in the Z.I.P.
The Company'sOur 401(k) matching and profit-sharing contributions are discretionary and are determined annually bythe Company. The Company contributed $250,000, $250,000,management. We committed $0.4 million, $0.2 million and$225,000$0.3 million to the planduringfor the fiscal2007, 2006years ended January 29, 2011, January 30, 2010 and2005, respectively.January 31, 2009.The Company offersWe offer an Employee Stock Purchase Plan (the"ESPP"“ESPP”) for eligible employees to purchase theCompany'sCompany’s common stock at a 15% discount of the lesser of fair market value of the stock on the first business day or the last business day of the offering period. The ESPP provides for six month offering periods commencing on October 1 and April 1 of each year. Employees can contribute up to 15% of their pay but may not exceed $25,000 of aggregate stock value in a calendar year. The maximum number of shares an employee may purchase during an offering period is 2,000 shares. Employees are eligible to participate in the ESPP if they work at least 20 hours a week and at least five months in a calendar year.12. Net Income Per Share, Basic13. Income Taxes The components of deferred income taxes at January 29, 2011 and
DilutedJanuary 30, 2010 are (in thousands):Basic netJanuary 29, 2011 January 30, 2010 Deferred tax assets:
Deferred rent
$ 12,172 $ 11,496 Employee benefits, including stock based compensation
6,001 5,547 Accrued liabilities
1,783 1,158 Inventory
897 1,945 Other
333 167 Total deferred tax assets
21,186 20,313 Deferred tax liabilities:
Property and equipment
(10,986 ) (9,973 ) Goodwill and other intangibles
(1,714 ) (1,422 ) Other
(365 ) (336 ) Total deferred tax liabilities
(13,065 ) (11,731 ) Net deferred tax asset
$ 8,121 $ 8,582 The components of the provision for income
per sharetaxes for the fiscal years ended January 29, 2011, January 30, 2010 and January 31, 2009 are (in thousands):Fiscal Year Ended January 29, 2011 January 30, 2010 January 31, 2009 Current:
Federal
$ 11,813 $ 7,760 $ 9,164 State
2,324 2,002 1,556 Total current
14,137 9,762 10,720 Deferred:
Federal
662 (3,872 ) (1,147 ) State
(147 ) (1,014 ) (74 ) Total deferred
515 (4,886 ) (1,221 ) Provision for income taxes
$ 14,652 $ 4,876 $ 9,499 The reconciliation of the income tax provision at the U.S. federal statutory rate to our effective income tax rate is
based onas follows for theweighted average number of common shares outstanding during the period. Diluted netfiscal years ended January 29, 2011, January 30, 2010 and January 31, 2009:Fiscal Year Ended January 29, 2011 January 30, 2010 January 31, 2009 Expected U.S. federal income taxes at statutory rates
35.0 % 35.0 % 35.0 % State and local income taxes, net of federal effect
3.4 4.6 3.6 Tax exempt interest
(1.2 ) (2.9 ) (1.9 ) Other
0.5 (1.9 ) (1.1 ) Effective tax rate
37.7 % 34.8 % 35.6 % The Company files income
per share is based on the weighted average number of common shares and common share equivalents outstanding during the period. Common share equivalents includedtax returns in the U.S. federal jurisdiction and various state jurisdictions. The Company’s U.S. federal income tax returns are no longer subject to examination for years before fiscal 2007.14. Comprehensive Income Comprehensive income represents all changes in equity during a period except those resulting from investments by and distributions to shareholders. Comprehensive income for the fiscal years ended January 29, 2011, January 30, 2010 and January 31, 2009 is as follows (in thousands):
Fiscal Year Ended January 29, 2011 January 30, 2010 January 31, 2009 Net income
$ 24,203 $ 9,131 $ 17,204 Net change in unrealized losses on available-for-sale investments, net of tax of $76, $7 and $213
(118 ) (16 ) (347 ) Comprehensive income
$ 24,085 $ 9,115 $ 16,857 15. Earnings per Share, Basic and Diluted The following table sets forth the computation
represent shares issuable upon assumed exerciseofoutstanding stock optionsbasic andnon-vested restricted stock. Potentially anti-dilutive securities not included in the calculation ofdiluted earnings per shareinclude options to purchase common stock where the option exercise price is greater than the average market price of the Company's common stock during the period reported.(in thousands, except per share amounts):Fiscal Year Ended January 29, 2011 January 30, 2010 January 31, 2009 Net income
$ 24,203 $ 9,131 $ 17,204 Weighted average common shares for basic earnings per share
29,971 29,499 29,127 Dilutive effect of stock options and restricted stock
823 634 567 Weighted average common shares for diluted earnings per share
$ 30,794 $ 30,133 $ 29,694 Basic earnings per share
$ 0.81 $ 0.31 $ 0.59 Diluted earnings per share
$ 0.79 $ 0.30 $ 0.58 Total anti-dilutive common stock options not included in the calculation of diluted earnings per share were
130,000, 40,000,0.3 million, 0.4 million and00.8 million for the fiscal years endedFebruary 2, 2008, February 3, 2007,January 29, 2011, January 30, 2010 and January26, 2006, respectively.31, 2009.16. Exit or Disposal Activities On March 2, 2010, we acquired a 168,450 square foot building in Corona, California for $11.8 million and we have relocated our distribution facility from Everett, Washington to this facility. We believe that we will be more effective distributing our products through a distribution center located in Corona, California due to the majority of our vendors being located in Southern California. In July 2010, we entered into an amendment of the lease for our combined home office, ecommerce fulfillment center and the exited distribution facility in Everett, Washington, which terminated our lease commitments for a portion of the leased space in exchange for additional charges to be paid over the life of the remaining lease period. The
following table sets forthlease termination costs recorded reflect thecomputation of basic and diluted net income per share (in thousands, except share and per share data):Fiscal Year ended January 28,
2006February 3,
2007February 2,
2008Net income $ 12,851 $ 20,856 $ 25,326 Weighted average common shares for basic net income per share 25,879,675 27,542,891 28,608,818 Dilutive effect of stock options and restricted stock 1,497,009 1,160,146 713,519 Weighted average common shares for diluted net income per share 27,376,684 28,703,037 29,322,337 Basic net income per share $ 0.50 $ 0.76 $ 0.89 Diluted net income per share $ 0.47 $ 0.73 $ 0.86 Options to purchase 130,000 shares of common stock with a weighted averagepresent value of$38.58 per share were outstanding atthese future charges.In conjunction with the
endclosure of the Everett, Washington distribution facility, during the fiscal2007 but were notyear ended January 29, 2011, we have recorded $0.9 million of employee benefit costs (severance and performance bonuses), $0.6 million of lease termination costs and $0.8 million of other costs to exit the facility. Additionally, we incurred a $0.3 million charge on disposal of long-lived assets and we recognized a $0.2 million benefit related to deferred rent liability. These amounts are included in cost of goods sold on thecomputationconsolidated statements ofdiluted earnings per share becauseoperations. We do not expect to incur material additional costs related to theoptions' exercise price was greater thanrelocation.Exit or disposal provisions recorded during the
$36.62 average market pricefiscal year ended January 29, 2011 as a result of this relocation are as follows (in thousands):January 30, 2010 Additions Payments Adjustments (1) January 29, 2011 (2) Employee benefit costs
$ — $ 882 $ (876 ) $ 9 $ 15 Lease termination costs
— 1,051 (305 ) (453 ) 293 Other exit costs
— 806 (806 ) — — Total
$ — $ 2,739 $ (1,987 ) $ (444 ) $ 308 (1) The lease termination cost adjustment primarily represents the difference between the calculated lease termination cost as a result of the amended lease and our initial estimate of lease termination costs recorded on the cease use date. (2) The exit or disposal provisions are included in accrued payroll and payroll taxes, other liabilities and long-term other liabilities on the consolidated balance sheets. 17. Related Party Transactions We committed charitable contributions to Zumiez Foundation of $0.6 million, $0.3 million and $0.4 million for fiscal years ended January 29, 2011, January 30, 2010 and January 31, 2009. We have accrued charitable contributions payable to Zumiez Foundation at January 29, 2011 and January 30, 2010 of $0.6 million and $0.2 million. Zumiez Foundation is a charitable based nonprofit organization focused on meeting the
Company's common shares.various needs of the under-privileged in communities where we have retail stores. The Company’s Chairman of the Board is also the President of Zumiez Foundation.NOTES TO CONSOLIDATED FINANCIAL STATEMENTS (Continued)13. Subsequent Event—LitigationEXHIBIT INDEXOn March 05, 2008 a putative class action lawsuit was filed against the Company in the Superior Court of the State of California, County of Alameda, wherein it is alleged that the Company had violated certain California wage and hour laws. The Lawsuit purports to be brought on behalf of a class of all persons who are employed or who have worked as hourly employees for the Company in the State of California from March 5, 2004 through the date of resolution of the Lawsuit. The Complaint alleges that the Company, in violation to Californian law, failed to: (1) pay overtime wages, and (2) provide meal periods, among other claims. The Company is preparing a response to the allegations of the Lawsuit. The outcome of the Lawsuit cannot be ascertained at this time.3.1
Articles of Incorporation. [Incorporated by reference to Exhibit 3.1 to theCompany'sCompany’s Registration Statement on Form S-1 (file No. 333-122865)]3.2
Bylaws. [Incorporated by reference to Exhibit3.23.1 to theCompany's Registration StatementCompany’s Current Report on FormS-1 (file No. 333-122865)]8-K filed on August 25, 2008]4.1
Form of Common Stock Certificate of Zumiez Inc. [Incorporated by reference to Exhibit 4.1 to theCompany'sCompany’s Registration Statement on Form S-1 (file No. 333-122865)]10.1
Business Loan Agreement dated May 29, 2003 between Bank of America, N.A. and Zumiez Inc., as modified by Loan Modification Agreement dated September 30, 2004. [Incorporated by reference to Exhibit 10.1 to theCompany'sCompany’s Registration Statement on Form S-1 (file No. 333-122865)]10.2
Lease Agreement between Merrill Creek Holdings, LLC and Zumiez Inc. dated August 2, 2004. [Incorporated by reference to Exhibit 10.2 to theCompany'sCompany’s Registration Statement on Form S-1 (file No. 333-122865)]10.3Executive Agreement, dated as of November 4, 2002 between Zumiez Inc. and Richard M. Brooks. [Incorporated by reference to Exhibit 10.3 to the Company's Registration Statement on Form S-1 (file No. 333-122865)]
10.4
Carrier Agreement between United Parcel Service Inc. and Zumiez Inc. dated July 4, 2005. [Incorporated by reference to Exhibit 10.4 to theCompany'sCompany’s Quarterly Report on Form 10-Q for the period ended July 30, 2005 as filed on September 13, 2005]10.5Zumiez Inc. 1993 Stock Option Plan. [Incorporated by reference to Exhibit 10.5 to the Company's Registration Statement on Form S-1 (file No. 333-122865)]
10.6
Zumiez Inc. 2004 Stock Option Plan. [Incorporated by reference to Exhibit 10.6 to theCompany'sCompany’s Registration Statement on Form S-1 (file No. 333-122865)]10.7
Zumiez Inc. 2005 Equity Incentive Plan. [Incorporated by reference to Exhibit 10.7 to theCompany'sCompany’s Registration Statement on Form S-1 (file No. 333-122865)]10.8
Zumiez Inc. 2005 Employee Stock Purchase Plan. [Incorporated by reference to Exhibit 10.8 to theCompany'sCompany’s Registration Statement on Form S-1 (file No. 333-122865)]10.9
Form of Indemnity Agreement between Zumiez Inc. and each of its officers and directors. [Incorporated by reference to Exhibit 10.9 to theCompany'sCompany’s Registration Statement on Form S-1 (file No. 333-122865)]10.10
Limited Liability Company Agreement of Zumiez Holdings LLC. [Incorporated by reference to Exhibit 10.10 to theCompany'sCompany’s Registration Statement on Form S-1 (file No. 333-122865)]10.11
Modification dated May 11, 2005 to Business Loan Agreement dated May 29, 2003 between Bank of America, N.A. and Zumiez Inc., as modified by Loan Modification Agreement dated September 30, 2004. [Incorporated by reference to Exhibit 10.11 to theCompany'sCompany’s Quarterly Report on Form 10-Q for the period ended July 30, 2005 as filed on September 13, 2005]10.12
Equity Purchase Agreement with Gerald R. Anderson, Brandon C. Batton, AC Fast Forward LLC and AC Fast Forward Mgt., LLC dated May 16, 2006. [Incorporated by reference to Exhibit 10.12 to theCompany'sCompany’s Quarterly Report on Form 10-Q for the period ended July 29, 2006 as filed on September 12, 2006].10.13
Lease Agreement between Merrill Creek Holdings, LLC and Zumiez Inc. dated October 2, 2006. [Incorporated by reference to Exhibit 10.13 to theCompany'sCompany’s Form 8-K filed on October 4, 2006]10.1410.15 Zumiez Inc. 2005 Equity Incentive Plan, as amended and restated effective May 27, 2009. [Incorporated by reference from Exhibit 10.15 to the Form 8-K filed by the Company on June 1, 2009] 10.16 Credit Agreement, including Revolving Line of Credit Note, with Wells Fargo HSBC Trade Bank, N.A. dated September 1, 2006..June 10, 2009. [Incorporated by referencetofrom Exhibit10.1410.16 to theCompany's Quarterly ReportForm 8-K filed by the Company onForm 10-Q for the period ended October 28, 2006 as filed on December 8, 2006].June 11, 2009]10.17 Purchase and Sale Agreement and Joint Escrow Instructions with Railroad Street Land Holdings, LLC dated February 18, 2010. [incorporated by reference from Exhibit 10.17 to the Form 8-K filed by the Company on February 22, 2010] 21.1
Subsidiaries of the Company.[Incorporated by reference to Exhibit 21.1 to the Company's Registration Statement on Form S-1 filed on October 18, 2005 (file No. 333-129101)]23.1
Consent of Moss Adams LLP, Independent Registered Public Accounting Firm.23.2Consent of PricewaterhouseCoopers LLP, Independent Registered Public Accounting Firm.
31.1
Certification of the ChiefPrincipal Executive Officer pursuant to Rule 13a-14(a)/15d-14(a) of the Securities Exchange Act of 1934, as amended, as adopted pursuant to Section 302 of the Sarbanes-Oxley Act of 2002.31.2
Certification of theChiefPrincipal Financial Officer (Principal Accounting Officer) pursuant to Rule 13a-14(a)/15d-14(a) of the Securities Exchange Act of 1934, as amended, as adopted pursuant to Section 302 of the Sarbanes-Oxley Act of 2002.32.1
Certifications of theChiefPrincipal Executive Officer andChiefPrincipal Financial Officer (Principal Accounting Officer) pursuant to Section 906 of the Sarbanes-Oxley Act of 2002, 18 U.S.C. Section 1350.Copies of Exhibits may be obtained upon request directed to the attention of our Chief Financial Officer and Chief Administrative Officer, 6300 Merrill Creek Parkway, Suite B, Everett, WA 98203, and
manyare available at theSEC'sSEC’s website found at www.sec.gov.DOCUMENTS INCORPORATED BY REFERENCEZUMIEZ INC. FORM 10-K PART I.Item 1. BUSINESSItem 1A. RISK FACTORSItem 1B. UNRESOLVED STAFF COMMENTSItem 2. PROPERTIESItem 3. LEGAL PROCEEDINGSItem 4. SUBMISSION OF MATTERS TO A VOTE OF SECURITY HOLDERSPART IIItem 5. MARKET FOR REGISTRANT'S COMMON EQUITY, RELATED STOCKHOLDER MATTERS AND ISSUER PURCHASES OF EQUITY SECURITIESItem 6. SELECTED FINANCIAL INFORMATIONItem 7. MANAGEMENT'S DISCUSSION AND ANALYSIS OF FINANCIAL CONDITION AND RESULTS OF OPERATIONSItem 7A. QUANTITATIVE AND QUALITATIVE DISCLOSURES ABOUT MARKET RISKItem 8. CONSOLIDATED FINANCIAL STATEMENTS AND SUPPLEMENTARY DATAItem 9. CHANGES IN AND DISAGREEMENTS WITH ACCOUNTANTS ON ACCOUNTING AND FINANCIAL DISCLOSUREItem 9A. CONTROLS AND PROCEDURESItem 9B. OTHER INFORMATIONPART IIIItem 10. DIRECTORS EXECUTIVE OFFICERS AND CORPORATE GOVERNANCEItem 12. SECURITY OWNERSHIP OF CERTAIN BENEFICIAL OWNERS AND MANAGEMENT AND RELATED SHAREHOLDER MATTERSItem 13. CERTAIN RELATIONSHIPS AND RELATED TRANSACTIONS AND DIRECTOR INDEPENDENCEItem 14. PRINCIPAL ACCOUNTANT FEES AND SERVICESPART IVItem 15. EXHIBITS AND CONSOLIDATED FINANCIAL STATEMENTS.MANAGEMENT'S ANNUAL REPORT ON INTERNAL CONTROL OVER FINANCIAL REPORTINGSIGNATURESREPORT OF INDEPENDENT REGISTERED PUBLIC ACCOUNTING FIRMINDEX TO CONSOLIDATED FINANCIAL STATEMENTS Years ended January 28, 2006, February 3, 2007 and February 2, 2008REPORT OF INDEPENDENT REGISTERED PUBLIC ACCOUNTING FIRMREPORT OF INDEPENDENT REGISTERED PUBLIC ACCOUNTING FIRMZUMIEZ INC. CONSOLIDATED BALANCE SHEETS (In thousands, except share amounts)ZUMIEZ INC. CONSOLIDATED STATEMENTS OF OPERATIONS (In thousands, except share and per share amounts)ZUMIEZ INC. CONSOLIDATED STATEMENTS OF CHANGES IN SHAREHOLDERS' EQUITY (In thousands)ZUMIEZ INC. CONSOLIDATED STATEMENTS OF CASH FLOWS (In thousands)EXHIBIT INDEX