- *
- $100 invested on
December 31, 200312/31/06 in stock or index, including reinvestment of dividends. Fiscal year ending December 31. - (1)
- For the year ended December 31, 2011, net income includes the following net pre-tax costs: restructuring charges of $10.0 million, intangibles and goodwill impairment charges of $17.4 million, pension curtailment charges of $1.5 million, separation costs related to our former CEO of $6.3 million, and costs related to our acquisition of Danfoss Socla S.A.S (Socla) in France of $5.8 million offset by pre-tax gains of $1.2 million for an earn-out adjustment, $7.7 million related to the sale of Tianjin Watts Valve Company Ltd. (TWVC) in China and $1.1 million from legal settlements. Additionally, net income includes a tax benefit of $4.2 million relating to the sale of TWVC offset by a $1.1 million tax charge in Europe related to our France restructuring. The after-tax cost of these items was $17.0 million.
- (2)
- For the year ended December 31, 2010, net income includes the following net pre-tax costs: restructuring charges of $14.1 million, intangible impairment charges of $1.4 million, and costs related to acquisitions and other items of $7.1 million offset by pre-tax gains of $4.5 million primarily for product liability and workers compensation accrual adjustments. Additionally, net income includes a tax benefit of $4.3 million related to the release of a valuation allowance in Europe offset by a tax charge of $1.5 million relating to the repatriation of earnings recognized upon our decision to dispose of a China subsidiary. The after-tax cost of these items was $10.3 million.
- (3)
- For the year ended December 31, 2009, net income includes the following net pre-tax costs: restructuring charges of $18.9 million and intangible impairment charges of $3.3 million, offset by pre-tax gains on the sale of Tianjin Tanggu Watts Valve Co. Ltd. (TWT) in China of $1.1 million, favorable product liability and workers compensation accrual adjustments of $4.9 million and legal
- (4)
- For the year ended December 31, 2008, net income includes the following net pre-tax costs: restructuring charges of $5.7 million, goodwill impairment
severance costs, asset write-downs and other costs in North Americacharges of $22.0 million$2.6 million, $0.4 million and $1.5 million respectively; accelerated depreciation and other costs in China of $1.0 million and $0.2 million, respectivelyand minority interest incomeof $0.2 million; severance costs in Europeof $0.2 million. The after-tax cost of these items was $21.2 million. (2)(5)- For the year ended December 31, 2007, net income includes the following net pre-tax costs: change in estimate of workers' compensation costs of $2.9 million, severance and product line discontinuance costs in North America of $0.4 million and $3.1 million, respectively; accelerated depreciation and asset write-downs, product line discontinuance costs and severance costs in
ChinaAsia of $2.9 million, $0.7 million and $0.4 million, respectively, and minority interest income of $0.9 million. The after-tax cost of these items was $6.9 million. (3)For the year ended December 31, 2006, net income includes the following net pre-tax gain: gain on sales of buildings of $8.2 million, restructuring costs consisting primarily of European severance of $2.2 million and amortization of $0.4 million, other costs consisting of accelerated depreciation and severance in our Chinese joint venture of $4.7 million and minority interest income of $1.5 million. The after-tax gain of these items was $1.5 million.(4)For the year ended December 31, 2005, net income includes the following pre-tax costs: restructuring of $0.7 million and other costs consisting of accelerated depreciation and asset write-downs of $1.8 million. The after-tax cost of these items was $1.6 million.(5)For the year ended December 31, 2005, net income includes a net after-tax charge of $0.9 million for a selling, general and administrative expense charge of $1.5 million related to a contingent earn-out agreement.- (6)
For the year ended December 31, 2004, net income includes a net after-tax charge of $2.3 million for certain accrued expense adjustments, which are included in selling, general and administrative expense after-tax charges of $3.5 million related to a contingent earn-out agreement and $0.7 million for various accrual adjustments and $0.5 million recorded as an income tax benefit.(7)For the year ended December 31, 2004, net income includes the following pre-tax costs: restructuring of $0.1 million and other costs consisting of accelerated depreciation of $2.9 million. The after-tax cost of these items was $1.8 million.(8)- In
December 2004, we decided to divest our interestSeptember 2009, the Company's Board of Directors approved the sale of its investment inour minority-owned subsidiary, Jameco International, LLC (Jameco LLC). We recordedCWV and subsequently sold CWV indiscontinuedJanuary 2010. Results from operationaand estimated loss on disposal are included net of taximpairment charge of $0.7 millionforthe year ended December 31, 2004. Also includedCWV in discontinued operationsisfor 2010, 2009, 2008 and 2007. In May 2009, the Company liquidated its TEAM Precision Pipework, Ltd. (TEAM) business. Results from operation and loss on disposal are included net of taxoperating resultsfrom the deconsolidation ofJameco LLC of $0.1 million of lossTEAM in discontinued operations for 2011, 2010, 2009, 2008 and$0.1 million of income for the year ended December 31, 2004 and 2003, respectively.2007. In September 1996, we divested our Municipal Water Group of businesses, which included Henry Pratt, James Jones Company and Edward Barber and Company Ltd. Costs and expenses related to the Municipal Water Group, for 2011, 2010, 2009, 20082007, 2006, 2005and20042007 relate to legal and settlement costs associated with the James JonesLitigation. The loss,Litigation and other miscellaneous costs. Discontinued operating income (loss) for 2011 and 2010 include an estimated settlement reserve adjustment in connection with the FCPA investigation at CWV (see Note 15) and in 2010 and 2009, includes legal costs associated with the FCPA investigation. Income (loss) for total discontinued operations, net of taxes, consists of$ 0.7$1.7 million,$0.2($4.3) million,$3.4($23.6) million,$0.4$1.4 million and$1.1$1.7 million for the years ended December 31, 2011, 2010, 2009, 20082007, 2006, 2005and2004,2007, respectively. - •
- Residential & commercial flow control products—includes products typically sold into plumbing and hot water
quality products, includingapplications such as backflow preventers, water pressure regulators, temperature andcheckpressure relief valves,for preventing reverse flow within water linesandfire protection systems and point-of-use water filtration and reverse osmosis systems for both commercial and residential applications;thermostatic mixing valves. - •
a wide range of water pressure regulators for both commercialHVAC & gas products—includes hydronic andresidential applications;•drainage products for industrial, commercial, marine and residential applications;•water supply products for commercial and residential applications;•temperature and pressure relief valves for water heaters, boilers and associated systems;•thermostatic mixing valves for tempering water in commercial and residential applications;•- electric heating systems for under-floor radiant applications,
and hydraulichydronic pump groups forgasboiler manufacturers andrenewablealternative energyapplications, including solarcontrol packages, andheat pump control packages; •- flexible stainless steel connectors for natural and liquid propane gas in commercial food service and residential
applications;applications. HVAC is an acronym for heating, ventilation and air conditioning. - •
large diameter butterfly valvesDrains & water re-use products—includes drainage products and engineered rain water harvesting solutions foruse in China'scommercial, industrial, marine and residential applications.- •
- Water quality products—includes point-of-use and point-of-entry water
infrastructure.filtration, conditioning and scale prevention systems for both commercial and residential applications. - (a)
- as recognized in the consolidated balance sheet
- (b)
- assumes the balance on the revolving credit facility remains at
$55.0$13.0 million and the interest rate remains at approximately3.6%3.0% for the presented periods - (c)
- includes commodity and capital
expenditurecommitments, acquisition of tekmar, CEO separation costs and other benefits at December 31,20082011 - 1)
- A review of the most recent fair value calculation to identify the extent of the cushion between fair value and carrying amount, to determine if a substantial cushion existed.
- 2)
- A review of events and circumstances that have occurred since the most recent fair value calculation to determine if those events or circumstances would have affected our previous fair value assessment. Items identified and reviewed include macroeconomic conditions, industry and market changes, cost factor changes, events that affect the reporting unit, financial performance against expectations and the reporting unit's performance relative to peers.
- •
- Weighted average discount rate—this rate is used to estimate the current value of future benefits. This rate is adjusted based on movement in long-term interest rates.
- •
- Expected long-term rate of return on assets—this rate is used to estimate future growth in investments and investment earnings. The expected return is based upon a combination of historical market performance and anticipated future returns for a portfolio reflecting the mix of equity, debt and other investments indicative of our plan assets.
- •
- Rates of increase in compensation levels—this rate is used to estimate projected annual pay increases, which are used to determine the wage base used to project employees' pension benefits at retirement.
- (i)
- pertain to the maintenance of records that, in reasonable detail, accurately and fairly reflect the transactions and dispositions of the assets of the Company;
- (ii)
- provide reasonable assurance that transactions are recorded as necessary to permit preparation of financial statements in accordance with generally accepted accounting principles, and that receipts and expenditures of the Company are being made only in accordance with authorizations of management and directors of the Company; and
- (iii)
- provide reasonable assurance regarding prevention or timely detection of unauthorized acquisition, use or disposition of the Company's assets that could have a material effect on the financial statements.
- (1)
- Represents
1,216,4711,271,892 outstanding options under the 1991 Directors' Non-Qualified Stock Option Plan, 1996 Incentive Stock Option Plan, 2003 Non-Employee Directors' Stock Option Plan and 2004 Stock Incentive Plan, and296,635392,345 outstanding restricted stock units under the Management Stock Purchase Plan. - (2)
- Includes
1,864,393999,610 shares available for future issuance under the 2004 Stock Incentive Plan, and962,825596,472 shares available for future issuance under the Management Stock Purchase Plan. - (a)
- Includes investments in common stock from diverse industries
- (b)
- Includes investments in index and exchange-traded funds
- (c)
- Includes investment grade bonds from diverse industries
- (d)
- Includes investments in real estate investment funds, exchange-traded funds, commodity mutual funds and accrued interest
- (1)
- Included in other, net on the Company's consolidated balance sheet.
- (2)
- Included in other noncurrent liabilities on the Company's consolidated balance sheet.
(1)Included in long-term investment securities on the Company's consolidated balance sheet.(2)Included in other, net on the Company's consolidated balance sheet.(3)Included in accrued expenses and other liabilities on the Company's consolidated balance sheet.(4)Included in other noncurrent liabilities on the Company's consolidated balance sheet.- *
- Corporate expenses are primarily for compensation expense, Sarbanes-Oxley compliance, professional fees, including legal and audit expenses, shareholder services and benefit administration costs. These costs are not allocated to the geographic segments as they are viewed as corporate functions that support all activities. Corporate costs in 2011 include $6.3 million in charges related to the separation agreement with the Company's former CEO.
- (1)
- Incorporated by reference to the Registrant's Current Report on Form 8-K dated
February 5, 2007July 12, 2010 (File No. 001-11499). - (2)
- Incorporated by reference to the Registrant's Current Report on Form 8-K dated November 14, 1991 (File No. 001-11499).
- (3)
- Incorporated by reference to the Registrant's Annual Report on Form 10-K for the year ended December 31, 2002 (File No. 001-11499).
- (4)
- Incorporated by reference to the Registrant's Current Report on Form 8-K dated April 27, 2006 (File No. 001-11499).
- (5)
- Incorporated by reference to the Registrant's Form S-1 (No. 33-6515) as part of the Second Amendment to such Form S-1 dated August 21, 1986.
- (6)
- Incorporated by reference to
Amendment No. 1 tothe Registrant'sAnnualQuarterly Report on Form10-K10-Q foryearthe quarter endedJune 30, 1992October 2, 2011 (File No. 001-11499). - (7)
- Incorporated by reference to the Registrant's Current Report on Form 8-K dated May 15, 2003 (File No. 001-11499).
- (8)
- Incorporated by reference to the Registrant's Current Report on Form 8-K dated May 14, 2008 (File No. 001-11499).
- (9)
- Incorporated by reference to the Registrant's Annual Report on Form 10-K for year ended June 30, 1996 (File No. 001-11499).
- (10)
- Incorporated by reference to Amendment No. 1 to the Registrant's Annual Report on Form
S-8 (No. 333-32685) dated August 1, 1997.10-K for the year ended June 30, 1992 (File No. 001-11499). - (11)
- Incorporated by reference to the Registrant's
CurrentAnnual Report on Form8-K dated September 4, 199610-K for the year ended December 31, 2009 (File No. 001-11499). - (12)
- Incorporated by reference to the Registrant's Annual Report on Form 10-K for year ended June 30,
1997(File1997 (File No. 001-11499). - (13)
- Incorporated by reference to notes to Consolidated Financial Statements, Note 2 of this Report.
- (14)
- Incorporated by reference to the Registrant's Quarterly Report on Form 10-Q for the quarter ended July 3, 2005 (File No. 001-11499).
- (15)
- Incorporated by reference to the Registrant's Annual Report on Form 10-K for year ended June 30, 1999 (File No. 001-11499).
- (16)
- Incorporated by reference to the Registrant's Quarterly Report on Form 10-Q for quarter ended September 30, 2000 (File No. 001-11499).
- (17)
- Incorporated by reference to the Registrant's
AnnualQuarterly Report on Form10-K10-Q for theyearquarter endedDecember 31, 2003July 4, 2010 (File No. 001-11499). - (18)
Incorporated by reference to the Registrant's Current Report on Form 8-K dated April 8, 2008 (File No. 001-11499).(19)- Incorporated by reference to the Registrant's Quarterly Report on Form 10-Q for the quarter ended September 26, 2004 (File No. 001-11499).
(20)(19)- Incorporated by reference to the Registrant's Quarterly Report on Form 10-Q for the quarter ended July 1, 2007 (File No. 001-11499).
(21)Incorporated by reference to the Registrant's Quarterly Report on Form 10-Q for the quarter ended March 30, 2008 (File No. 001-11499).(22)(20)- Incorporated by reference to the Registrant's Annual Report on Form 10-K for the year ended December 31, 2007 (File No. 001-11499).
- (21)
- Incorporated by reference to the Registrant's Current Report on Form 8-K dated June 18, 2010 (File No. 001-11499).
- (22)
- Incorporated by reference to the Registrant's Current Report on Form 8-K dated January 26, 2011 (File No. 001-11499).
- (23)
- Incorporated by reference to the Registrant's Current Report on Form 8-K dated July 6, 2011 (File No. 001-11499).
- (24)
- Incorporated by reference to the Registrant's Annual Report on Form 10-K for the year ended December 31, 2010 (File No. 001-11499).
- (25)
- Incorporated by reference to the Registrant's Current Report on Form 8-K dated April 1, 2011 (File No. 001-11499).
- *
- Management contract or compensatory plan or arrangement.
- **
- Attached as Exhibit 101 to this report are the following formatted in XBRL (Extensible Business Reporting
one million shares of Class A Common Stock in open market purchases or in privately negotiated transactions. On October 28, 2008, the Company announced that it had temporarily suspended its stock repurchase program. No shares were repurchased during the quarter ended December 31, 2008. Asauthorized by our Board of December 31, 2008, we had repurchased 2.45 million shares of stock forDirectors at a total cost of $68.1$27.2 million.
As a result of such repurchases, our August 2011 repurchase program expired by its terms.
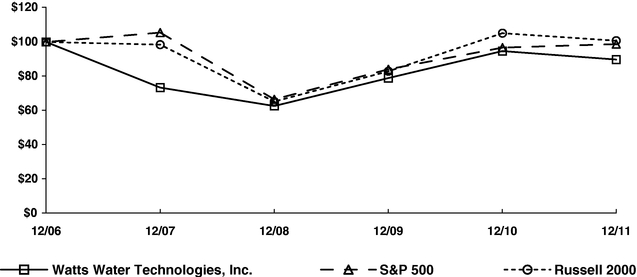
Set forth below is a line graph comparing the cumulative total shareholder return on our Class A Common Stock for the last five years with the cumulative return of companies on the Standard & Poor's 500 Stock Index and the Russell 2000 Index. We chose the Russell 2000 Index because it represents companies with a market capitalization similar to that of Watts. The graph assumes that the value of the investment in our Class A Common Stock and each index was $100 at December 31, 20032006 and that all dividends were reinvested.
COMPARISON OF 5 YEAR CUMULATIVE TOTAL RETURN*
Among Watts Water Technologies, Inc., Thethe S&P 500 Index
and Thethe Russell 2000 Index
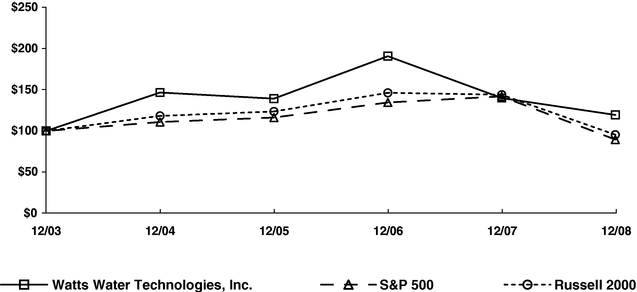
| | 12/31/03 | 12/31/04 | 12/31/05 | 12/31/06 | 12/31/07 | 12/31/08 | |||||||||||||
|---|---|---|---|---|---|---|---|---|---|---|---|---|---|---|---|---|---|---|---|
Watts Water Technologies, Inc | 100.00 | 146.82 | 139.36 | 191.03 | 140.11 | 119.52 | |||||||||||||
S&P 500 | 100.00 | 110.88 | 116.33 | 134.70 | 142.10 | 89.53 | |||||||||||||
Russell 2000 | 100.00 | 118.33 | 123.72 | 146.44 | 144.15 | 95.44 | |||||||||||||
| | 12/31/06 | 12/31/07 | 12/31/08 | 12/31/09 | 12/31/10 | 12/31/11 | |||||||||||||
|---|---|---|---|---|---|---|---|---|---|---|---|---|---|---|---|---|---|---|---|
Watts Water Technologies, Inc | 100.00 | 73.34 | 62.57 | 78.92 | 94.70 | 89.73 | |||||||||||||
S & P 500 | 100.00 | 105.49 | 66.46 | 84.05 | 96.71 | 98.75 | |||||||||||||
Russell 2000 | 100.00 | 98.43 | 65.18 | 82.89 | 105.14 | 100.75 | |||||||||||||
The above Performance Graph and related information shall not be deemed "soliciting material" or to be "filed" with the Securities and Exchange Commission, nor shall such information be incorporated by reference into any future filing under the Securities Act of 1933 or Securities Exchange Act of 1934, each as amended, except to the extent that we specifically incorporate it by reference into such filing.
Item 6. SELECTED FINANCIAL DATA.
The selected financial data set forth below should be read in conjunction with our consolidated financial statements, related Notes thereto and "Management's Discussion and Analysis of Financial Condition and Results of Operations" included herein.
FIVE-YEAR FINANCIAL SUMMARY
(Amounts in millions, except per share and cash dividend information)
| | Year Ended 12/31/08(1)(8) | Year Ended 12/31/07(2)(8) | Year Ended 12/31/06(3)(8) | Year Ended 12/31/05(4)(5)(8) | Year Ended 12/31/04(6)(7)(8) | |||||||||||
|---|---|---|---|---|---|---|---|---|---|---|---|---|---|---|---|---|
Statement of operations data: | ||||||||||||||||
Net sales | $ | 1,459.4 | $ | 1,382.3 | $ | 1,230.8 | $ | 924.3 | $ | 824.6 | ||||||
Income from continuing operations | 47.3 | 77.6 | 77.1 | 55.0 | 48.7 | |||||||||||
Loss from discontinued operations, net of taxes | (0.7 | ) | (0.2 | ) | (3.4 | ) | (0.4 | ) | (1.9 | ) | ||||||
Net income | 46.6 | 77.4 | 73.7 | 54.6 | 46.8 | |||||||||||
Income per share from continuing operations—diluted | 1.28 | 1.99 | 2.29 | 1.67 | 1.49 | |||||||||||
Loss per share from discontinued operations—diluted | (0.02 | ) | (0.01 | ) | (0.10 | ) | (0.01 | ) | (0.06 | ) | ||||||
Net income per share—diluted | 1.26 | 1.99 | 2.19 | 1.66 | 1.43 | |||||||||||
Cash dividends declared per common share | $ | 0.44 | $ | 0.40 | $ | 0.36 | $ | 0.32 | $ | 0.28 | ||||||
Balance sheet data (at year end): | ||||||||||||||||
Total assets | $ | 1,660.1 | $ | 1,729.3 | $ | 1,660.9 | $ | 1,101.0 | $ | 922.7 | ||||||
Long-term debt, net of current portion | $ | 409.8 | $ | 432.2 | $ | 441.7 | $ | 293.4 | $ | 180.6 | ||||||
| | Year Ended 12/31/11(1)(6) | Year Ended 12/31/10(2)(6) | Year Ended 12/31/09(3)(6) | Year Ended 12/31/08(4)(6) | Year Ended 12/31/07(5)(6) | |||||||||||
|---|---|---|---|---|---|---|---|---|---|---|---|---|---|---|---|---|
Statement of operations data: | ||||||||||||||||
Net sales | $ | 1,436.6 | $ | 1,274.6 | $ | 1,225.9 | $ | 1,431.4 | $ | 1,356.3 | ||||||
Net income from continuing operations attributable to Watts Water Technologies, Inc. | 64.7 | 63.1 | 41.0 | 45.2 | 75.7 | |||||||||||
Income (loss) from discontinued operations, net of taxes | 1.7 | (4.3 | ) | (23.6 | ) | 1.4 | 1.7 | |||||||||
Net income attributable to Watts Water Technologies, Inc. | 66.4 | 58.8 | 17.4 | 46.6 | 77.4 | |||||||||||
DILUTED EPS | ||||||||||||||||
Income (loss) per share attributable to Watts Water Technologies, Inc.: | ||||||||||||||||
Continuing operations | 1.73 | 1.69 | 1.10 | 1.23 | 1.94 | |||||||||||
Discontinued operations | 0.05 | (0.12 | ) | (0.63 | ) | 0.04 | 0.04 | |||||||||
NET INCOME | 1.78 | 1.57 | 0.47 | 1.26 | 1.99 | |||||||||||
Cash dividends declared per common share | $ | 0.44 | $ | 0.44 | $ | 0.44 | $ | 0.44 | $ | 0.40 | ||||||
Balance sheet data (at year end): | ||||||||||||||||
Total assets | $ | 1,697.5 | $ | 1,646.1 | $ | 1,599.2 | $ | 1,660.1 | $ | 1,729.3 | ||||||
Long-term debt, net of current portion | $ | 397.4 | $ | 378.0 | $ | 304.0 | $ | 409.8 | $ | 432.2 | ||||||
settlements of $1.5 million. Additionally, net income includes a tax charge of $3.9 million relating to previously realized tax benefits, which were expected to be recaptured as a result of our decision to restructure our operations in China. The after-tax cost of these items was $16.7 million.
Item 7. MANAGEMENT'S DISCUSSION AND ANALYSIS OF FINANCIAL CONDITION AND RESULTS OF OPERATIONS.
Overview
We are a leading supplier of products for use in the water quality, water safety, water flow control and water conservation markets in both North America and Europe with an expandinga presence in Asia. For over 130137 years, we have designed and manufactured products that promote the comfort and safety of people and the quality and conservation of water used in commercial and residential applications. We earn revenue and income almost exclusively from the sale of our products. Our principal product lines include:
Our business is reported in three geographic segments,segments: North America, Europe and China.Asia. We distribute our products through three primary distribution channels,channels: wholesale, do-it-yourself (DIY) and original equipment manufacturers (OEMs). Interest rates have an indirect effect on the demand for our products due to the effect such rates have on the number of new residential and commercial construction starts and remodeling projects. All three of these activities have an impact on our sales and earnings. An additional factor that has had an effect on our sales is fluctuation in foreign currencies, as a portion of our sales and certain portions of our costs, assets and liabilities are denominated in currencies other than the U.S. dollar.
We believe that the factors relating to our future growth include our ability to continue to make selective acquisitions, both in our core markets as well as in new complementary markets, regulatory requirements relating to the quality and conservation of water, safe use of water, increased demand for clean water, with continued enforcement of plumbing and building codes and a healthy economic environment. We have completed 3236 acquisitions since divesting our industrial and oil and gas business in 1999. Our acquisition strategy focuses on businesses that manufacture preferred brand name products that address our themes of water quality, water conservation, water safety and water flow control and related complementary markets. We target businesses that will provide us with one or more of the following: an entry into new markets, an increase in shelf space with existing customers, a new or improved technology or an expansion of the breadth of our water quality, water conservation, water safety and water flow control products for the commercial, industrial and residential and commercial markets. In 2008 and 2007, sales from acquisitions contributed approximately 4.6% and 3.9%, to our total sales growth over the prior year.
Products representing a majority of our sales are subject to regulatory standards and code enforcement, which typically require that these products meet stringent performance criteria. Together with our commissioned manufacturers' representatives, we have consistently advocated for the
development and enforcement of such plumbing codes. We are focused on maintaining stringent quality control and testing procedures at each of our manufacturing facilities in order to manufacture products in compliance with code requirements and take advantage of the resulting demand for compliant products. We believe that the product development, product testing capability and investment in plant and equipment needed to manufacture products in compliance with code requirements, represent a barriercompetitive advantage for us.
In 2011, we experienced many of the same macro challenges that affected our business in the previous year. The commercial marketplace continued to entrystruggle, we saw low residential activity and commodity prices remained volatile. Despite the challenging end markets, we were able to grow sales organically by 2.3% and grow income from continuing operations by 2.5%. Organic sales growth
excludes the impacts of acquisitions, divestitures and foreign exchange from year-over-year comparisons. We believe this provides investors with a more complete understanding of underlying sales trends by providing sales growth on a consistent basis. We continued our restructuring programs to right size our manufacturing footprint and we sustained our continuous improvement initiatives to gain productivity in our operations.
Our performance improved as 2011 progressed. During the first half of 2011, increases in the cost of copper reduced margins for competitors.our high copper content products and we encountered operational inefficiencies as a result of our French restructuring efforts. Copper costs increased during the later portion of 2010 and into early 2011, reaching an all-time high in April 2011. We were able to balance commodity costs through price increases by mid-year, providing better results during the second half of 2011. In general, we were more successful in North America than in Europe in passing on price increases to our end customers during the year. Europe has and continues to experience uncertainties regarding its economy, driven largely by sovereign debt concerns. We believe the economic uncertainty is affecting how our competitors are pricing in end markets. We believe that over the long term, there is an increasing demand among consumers for productsprice increases may continue to ensure water quality, which creates growth opportunities forbe difficult to achieve in many of our products.
Adverse economic developmentsEuropean markets in 2008 created a challenging environment for us. The credit crisis and recessionary pressures negatively impacted the primary markets we serve. We took steps2012. Copper costs abated somewhat during the yearsecond half of 2011, but have begun to reduce coststrend upward again through early February 2012. We have announced selected price increases for 2012 in certain markets but we cannot determine whether such initiatives will be successful in the marketplace.
We continually review our business and conserve cash. During the fourth quarter of 2008, we reduced our workforce by 10%implement restructuring plans as needed. We recently completed restructuring projects in the U.S. This step is expectedand Europe which have shut down and consolidated certain of our operations. Please see Note 4 of the Notes to save us approximately $10.0 million to $11.0 million per year.Consolidated Financial Statements for a more detailed explanation of our restructuring activities.
In addition to the reductionMarch 2010, in force, we took several steps to help conserve cash into 2009, including suspending our stock repurchase program, first freezing U.S. wages and salaries and later implementing salary reductions, controlling capital spending levels and continuing to focus on working capital levels. We also announced a further operational restructuring program to consolidateconnection with our manufacturing footprint consolidation, we closed the operations of Tianjin Watts Valve Company Ltd. (TWVC) and relocated its manufacturing to other facilities in North America and China. We will continueOn April 12, 2010, we signed a definitive equity transfer agreement with a third party to evaluate acquisition candidates during 2009, but we expect funds to be spent on acquisitions will be less than that spentsell our equity ownership and remaining assets of TWVC. The sale was finalized in 2008. We are enhancing our focus on productivity and continuous improvement, and on managing our working capital levels as well as positioning many of our products to benefit when the market returns. We believe that we are well positioned to weather the current economic crisis due to our ability to continue to generate positive cash flows and control spending levels. We are not faced with any major liquidity events until 2010, at which time $50.0 million of our debt will come due.
We require substantial amounts of raw materials to produce our products, including bronze, brass, cast iron, steel and plastic, and substantially all of the raw materials we require are purchased from outside sources. We have experienced volatility in the costs of certain raw materials, particularly copper. Bronze and brass are copper-based alloys. During the fourth quarter of 2008, prices2011. We received net proceeds of copper droppedapproximately $6.1 million from highs experiencedthe sale. We recognized a net pre-tax gain of $7.7 million and an after-tax gain of approximately $11.4 million, or $0.30 per share, relating mainly to a favorable cumulative translation adjustment and a tax benefit related to the reversal of the China tax clawback.
In 2009, our Board of Directors approved the sale of our Watts Valve (Changsha) Co., Ltd. (CWV) subsidiary. We also liquidated our TEAM Precision Pipework, Ltd. (TEAM) subsidiary through an administration process under United Kingdom law, as more fully described in Note 3 of Notes to Consolidated Financial Statements. We classified CWV's and TEAM's results of operations and any related losses as discontinued operations for all periods presented in this report.
Acquisitions
On April 29, 2011, the Company completed the acquisition of Danfoss Socla S.A.S. (Socla) and the related water controls business of certain other entities controlled by Danfoss A/S, in a share and asset purchase transaction. The aggregate consideration paid was EUR 120.0 million, less than nine months earlier.
A risk we face is our ability to deal effectively with changesEUR 3.7 million in raw material costs. We manage this risk by monitoring related market prices, working with our suppliers to achieve the maximum level of stability in their costscapital and related pricing, seeking alternative supply sources when necessary, implementing cost reduction programsadjustments. The net purchase price of EUR 116.3 million was financed with cash on hand and passing increaseseuro-based borrowings under our Credit Agreement. The net purchase price is equal to approximately $172.4 million based on the exchange rate of Euro to U.S. dollars as of April 29, 2011.
Socla is a manufacturer of water protection valves and flow control solutions for the water market and the heating, ventilation and air conditioning market. Its major product lines include backflow preventers, check valves and pressure reducing valves. Socla is based in costsFrance, and its products are distributed worldwide for commercial, residential, municipal and industrial use. Socla's annual revenue for 2010 was approximately $130.0 million. Socla strengthens the Company's European residential and commercial plumbing and flow control products and also adds to our customers. Additionally from time to time we may use commodity futures contracts on a limited basis to manage this risk. We are not able to predict whether or for how long this volatility will continue. If costs continue to decrease, we may experience pressure from customers to reduce product pricing. We are unable to predict the timing and impact that these pricing decreases could have to our profit margins.its HVAC products.
Another risk we face in all areas of our business is competition. We consider brand preference, engineering specifications, code requirements, price, technological expertise, delivery times and breadth of product offerings to be the primary competitive factors. As mentioned previously, we believe that the product development, product testing capability and investment in plant and equipment needed to manufacture products in compliance with code requirements, represent a barrier to entry for competitors. We are committed to maintaining our capital equipment at a level consistent with current technologies, and thus we spent approximately $26.6 million in 2008 and $37.8 million in 2007.
Recent Developments
On February 10, 2009,January 31, 2012, we completed the acquisition of tekmar Control Systems (tekmar) in a plan was approved by the Boardshare purchase transaction. A designer and manufacturer of Directors to expand our program to consolidate our manufacturing footprintcontrol systems used in North Americaheating, ventilation, and China. The plan provides for the closure of three plants, with the relocation of those operations to existing facilities in either North America or China or to a new central facility in the United States.
The footprint consolidation pre-tax charge will be approximately $11.7 million, including severance charges of approximately $3.2 million, relocation costs of approximately $3.3 million and asset write-downs of approximately $5.2 million. We also expect to record a net gain on property sales of $2.4 million. One-time tax charges of approximately $7.0 million regarding the payback of prior tax holiday benefits are also expected to be incurred as part of the building relocations. Approximately 400 positions will be eliminated in connection with this consolidation. The net after tax charge for this manufacturing consolidation programair conditioning applications, tekmar is expected to be approximately $14.9enhance our hydronic systems product offerings in the U.S. and Canada. The initial purchase paid was CAD $18.0 million, ($4.4 million non cash), with costsan earn-out based on future earnings levels being incurred through December 2009. We expect to spend approximately $4.8 millionachieved. The total purchase price will not exceed CAD $26.2 million. Sales for tekmar in capital expenditures to consolidate operations. We expect this entire project will be self-funded through net proceeds from the sale of buildings and other assets being disposed of as part of the plan.2011 approximated CAD $11.0 million.
On February 9, 2009,7, 2012, we declared a quarterly dividend of eleven cents ($0.11) per share on each outstanding share of Class A Common Stock and Class B Common Stock.
Results of Operations
Year Ended December 31, 20082011 Compared to Year Ended December 31, 20072010
Net Sales. Our business is reported in three geographic segments: North America, Europe and China.Asia. Our net sales in each of these segments for the years ended December 31, 20082011 and 20072010 were as follows:
| | Year Ended December 31, 2008 | Year Ended December 31, 2007 | | | |||||||||||||||
|---|---|---|---|---|---|---|---|---|---|---|---|---|---|---|---|---|---|---|---|
| | | Change to Consolidated Net Sales | |||||||||||||||||
| | Net Sales | % Sales | Net Sales | % Sales | Change | ||||||||||||||
| | (Dollars in millions) | ||||||||||||||||||
North America | $ | 866.2 | 59.4 | % | $ | 871.0 | 63.0 | % | $ | (4.8 | ) | (0.4 | )% | ||||||
Europe | 546.0 | 37.4 | 452.6 | 32.7 | 93.4 | 6.8 | |||||||||||||
China | 47.2 | 3.2 | 58.7 | 4.3 | (11.5 | ) | (0.8 | ) | |||||||||||
Total | $ | 1,459.4 | 100.0 | % | $ | 1,382.3 | 100.0 | % | $ | 77.1 | 5.6 | % | |||||||
| | Year Ended December 31, 2011 | Year Ended December 31, 2010 | | | |||||||||||||||
|---|---|---|---|---|---|---|---|---|---|---|---|---|---|---|---|---|---|---|---|
| | | Change to Consolidated Net Sales | |||||||||||||||||
| | Net Sales | % Sales | Net Sales | % Sales | Change | ||||||||||||||
| | (Dollars in millions) | ||||||||||||||||||
North America | $ | 819.4 | 57.0 | % | $ | 785.5 | 61.6 | % | $ | 33.9 | 2.7 | % | |||||||
Europe | 595.5 | 41.5 | 468.3 | 36.8 | 127.2 | 9.9 | |||||||||||||
Asia | 21.7 | 1.5 | 20.8 | 1.6 | 0.9 | 0.1 | |||||||||||||
Total | $ | 1,436.6 | 100.0 | % | $ | 1,274.6 | 100.0 | % | $ | 162.0 | 12.7 | % | |||||||
The change in net sales iswas attributable to the following:
| | | | | | Change As a % of Consolidated Net Sales | Change As a % of Segment Net Sales | ||||||||||||||||||||||||||||
|---|---|---|---|---|---|---|---|---|---|---|---|---|---|---|---|---|---|---|---|---|---|---|---|---|---|---|---|---|---|---|---|---|---|---|
| | North America | Europe | China | Total | North America | Europe | China | Total | North America | Europe | China | |||||||||||||||||||||||
| | (Dollars in millions) | |||||||||||||||||||||||||||||||||
Organic growth | $ | (18.2 | ) | $ | 11.3 | $ | (12.1 | ) | $ | (19.0 | ) | (1.3 | )% | 0.8 | % | (0.9 | )% | (1.4 | )% | (2.1 | )% | 2.5 | % | (20.6 | )% | |||||||||
Foreign exchange | 0.5 | 31.3 | 3.8 | 35.6 | — | 2.3 | 0.3 | 2.6 | — | 6.9 | 6.5 | |||||||||||||||||||||||
Acquisitions | 12.9 | 50.8 | — | 63.7 | 0.9 | 3.7 | — | 4.6 | 1.5 | 11.2 | — | |||||||||||||||||||||||
Disposal | — | — | (3.2 | ) | (3.2 | ) | — | — | (0.2 | ) | (0.2 | ) | — | — | (5.5 | ) | ||||||||||||||||||
Total | $ | (4.8 | ) | $ | 93.4 | $ | (11.5 | )$ | 77.1 | (0.4 | )% | 6.8 | % | (0.8 | )% | 5.6 | % | (0.6 | )% | 20.6 | % | (19.6 | )% | |||||||||||
| | | | | | Change As a % of Consolidated Net Sales | Change As a % of Segment Net Sales | ||||||||||||||||||||||||||||
|---|---|---|---|---|---|---|---|---|---|---|---|---|---|---|---|---|---|---|---|---|---|---|---|---|---|---|---|---|---|---|---|---|---|---|
| | North America | Europe | Asia | Total | North America | Europe | Asia | Total | North America | Europe | Asia | |||||||||||||||||||||||
| | (Dollars in millions) | |||||||||||||||||||||||||||||||||
Organic | $ | 22.2 | $ | 8.6 | $ | (1.8 | ) | $ | 29.0 | 1.8 | % | 0.6 | % | (0.1 | )% | 2.3 | % | 2.8 | % | 1.9 | % | (8.7 | )% | |||||||||||
Foreign exchange | 3.1 | 24.0 | 0.9 | 28.0 | 0.2 | 1.9 | 0.1 | 2.2 | 0.4 | 5.1 | 4.3 | |||||||||||||||||||||||
Acquisitions | 8.6 | 94.6 | 1.8 | 105.0 | 0.7 | 7.4 | 0.1 | 8.2 | 1.1 | 20.2 | 8.7 | |||||||||||||||||||||||
Total | $ | 33.9 | $ | 127.2 | $ | 0.9 | $ | 162.0 | 2.7 | % | 9.9 | % | 0.1 | % | 12.7 | % | 4.3 | % | 27.2 | % | 4.3 | % | ||||||||||||
Organic net sales for 2008in 2011 into the North American wholesale market increased by $26.6 million, or 4.3%, compared to 2010. This increase was primarily due to improved recovery of commodity costs across our four principal product lines with larger increases in residential and commercial products sales of approximately $16.0 million and in drains and water re-use products of approximately $5.7 million. Organic sales into the North American DIY market in 2011 decreased in North America$4.4 million, or 2.6%, compared to 2010, primarily due to decreased product sales approximating $4.3 million, mostly in the wholesale market, where sales were 2.5% lower than in 2007. Unit sale declines, due in large part to the soft economy, were widespread across a number of product lines, with our backflow product line impacted the most. Organic sales in our North American retail market for 2008 remained relatively flat compared with 2007, decreasing 0.6%. Unit sale reductions in the retail market due to the soft economy were offset by selected price increasesresidential and new product rollouts. Given the current recession and more stringent bank lending standards, we believe that both the commercial and residential construction markets, which we sell into through our wholesale and DIY channels, will continue to be soft through 2009. As a result, we believe that our sales in North America may decline in 2009. Growth
in North America due to acquisitions is due to the inclusion of sales from Topway acquired in November 2007.products.
Organic net sales for 2008 increased in Europe primarilythe European wholesale market by $2.8 million, or 1.0%, compared to 2010. Wholesale sales increased marginally due to an 11.0% increasestronger sales in drains and pre-insulated pipe products along with increased sales into Eastern Europe and from geographic expansion into the Middle East. Increases were offset partially by lower unit sales into southern Europe, especially the Italian marketplace. Organic sales into the European OEM market asin 2011 increased by $9.2 million, or 4.9%, compared to 2007. OEM sales were positively impacted in Germany where sales of our products into alternative energy and energy conservation markets were strong. Sales into the wholesale market for 2008 decreased by 4.5% as compared to 2007 and were negatively affected by declines in construction activity. Acquired sales growth in Europe was2010 primarily due to the inclusion of Blücher for seven months in 2008. We expectincreased sales in Europe will increase on a constant currency basis in 2009 as Blücher will be reported for a full year and we expect alternative energy products sales to grow, hydronic under-floor manifold packages
offset by unit declines in our core product lines. Core sales are expected to be impacted by the widening recession in Europe.
Organic net sales for 2008 declined in China due to decreasedlower sales in both the Chinese domesticheat pump and export markets. China salessolar packages, which had been driven by renewable energy subsidies which either were also negatively affected as compared to 2007 from the disposal of a commodity butterfly valve business during the fourth quarter of 2008. This decrease was partially offset by an increase in sales of large diameter butterfly valves to our water infrastructure customers during 2008.reduced or had expired.
The increasesnet increase in net sales due to foreign exchange in North America, Europe and China werewas primarily due to the appreciation of the Canadian dollar, euro and yuan, respectively,the Canadian dollar against the U.S. dollar. We cannot predict whether these currencies will continue to appreciate or depreciate against the U.S. dollar in future periods or whether future foreign exchange rate fluctuations will have a positive or negative impact on our net sales. Recent fluctuations
Acquired net sales in foreign currency rates portend a reductionEurope related to the Socla and Austroflex Rohr-Isoliersysteme GmbH (Austroflex) acquisitions and in those currencies against the U.S. dollar.North America was due to Socla and Blue Ridge Atlantic Enterprises, Inc. (BRAE) acquisitions.
Gross Profit. Gross profit and gross profit as a percent of net sales (gross margin) for 20082011 and 20072010 were as follows:
| | Year Ended December 31, | | ||||||||
|---|---|---|---|---|---|---|---|---|---|---|
| | Point Change | |||||||||
| | 2008 | 2007 | ||||||||
| | (dollars in millions) | | ||||||||
Gross profit | $ | 488.4 | $ | 461.6 | ||||||
Gross margin | 33.5 | % | 33.4 | % | 0.1 | % | ||||
| | Year Ended December 31, | ||||||
|---|---|---|---|---|---|---|---|
| | 2011 | 2010 | |||||
| | (Dollars in millions) | ||||||
Gross profit | $ | 515.5 | $ | 464.9 | |||
Gross margin | 35.9 | % | 36.5 | % | |||
Gross margin improved by 10 basisdecreased 0.6 percentage points to 33.5% in 20082011 compared to 2007. The improvement was attributable primarily2010 for a variety of reasons. First, we were unable to margin improvements in North America and Europe offset by declines in China. North America's margin improved 70 basis points to 34.4% primarily due to the price increases implemented to offset prior raw materialcompletely recover commodity cost increases in Europe and to a lesser extent,in the mix of product sold. Further, 2007 North American gross margins were negatively impacted by approximately $6.5DIY market. Second, we incurred acquisition accounting adjustments of $4.7 million or approximately 100 basis points onin connection with the prior year gross margin, for charges associated with product discontinuances and a change in estimate for workers' compensation costs. Gross margin in Europe increased to 32.3% from 31.0% primarily due to our ability to leverage additional volume from alternative energy product sales with better factory absorption levels due to the rationalization efforts made over the last two years in Italy. China gross margin deteriorated when compared to 2007 primarily due to excess capacity due to sales declines, value added tax increases, negative impact from the increaseSocla acquisition. Third, we experienced inefficiencies in the value of the Chinese yuan against the U.S. dollar and disruptions from a plant move and labor disputes.
During 2007, we initiated a global restructuring program that was approved by our Board of Directors on October 30, 2007. The program includes plans to shut down five manufacturing facilities, right-size a sixth facility and incur costs to relocate one of our China facilities. In addition, we performed an evaluation of certain product lines in 2007. After completing this evaluation, we initiated a plan to discontinue certain product lines. In accordance with the restructuring program and product line discontinuance commenced in 2007, we anticipated spending $12.9 million. To date, we have
incurred $8.9 million of costs associated with the plans and have successfully shut down two manufacturing facilities and right sized another facility. Management is reviewing the status of the program and the timing of charges for the Europe segment. We anticipate the restructuring program will not be completed until 2010, with the expectation that our Europe segment will incur most of its costs during 2010. As such, previous estimates of savings from the programs will likely be achieved in 2010 rather than in the secondfirst half of 2009.
The following table presents the total estimated pre-tax charges2011 as our French plant consolidation project was being completed. Fourth, productivity initiatives were offset to be incurred for the global restructuring program and product line discontinuances initiated in 2007some extent by our reportable segments and amounts charged to date:higher inbound freight costs.
Reportable Segment | Total | Spent to Date | |||||
|---|---|---|---|---|---|---|---|
| | (in millions) | ||||||
North America | $ | 5.7 | $ | 5.8 | |||
Europe | 3.9 | 0.2 | |||||
China | 3.3 | 2.9 | |||||
Total | $ | 12.9 | $ | 8.9 | |||
Selling, General and Administrative Expenses. Selling, general and administrative expenses, or SG&A expenses, for 20082011 increased $27.5$43.2 million, or 8.3%12.8%, compared to 2007.2010. The increase in SG&A expenses iswas attributable to the following:
| | (in millions) | % Change | |||||
|---|---|---|---|---|---|---|---|
Organic growth | $ | 3.2 | 1.0 | % | |||
Foreign exchange | 7.7 | 2.3 | |||||
Acquisitions | 17.8 | 5.4 | |||||
Disposal | (1.2 | ) | (0.4 | ) | |||
Total | $ | 27.5 | 8.3 | % | |||
| | (in millions) | % Change | |||||
|---|---|---|---|---|---|---|---|
Organic | $ | 8.4 | 2.5 | % | |||
Foreign exchange | 6.5 | 1.9 | |||||
Acquisitions | 28.3 | 8.4 | |||||
Total | $ | 43.2 | 12.8 | % | |||
The organic increase in SG&A expenses was primarily due to increased incentive compensationseparation costs and increasedof our former CEO of $6.3 million, an increase of approximately $4.4 million in variable European selling expensescosts due to increasedthe increase in year-over-year sales, volumes partiallyand an increase in IT costs of approximately $3.0 million due primarily to the implementation of a new enterprise resource planning system (ERP system) and other licensing costs, offset by decreased shipping costs and other variable North American selling expenses due to decreased sales volumes.approximately $7.0 million in lower legal costs. The increase in SG&A expenses from foreign exchange was primarily due to the appreciation of the euro yuan and Canadian dollar against the U.S. dollar. The increase inAcquired SG&A expenses from acquisitions was duecosts related to the inclusion of BlücherSocla, Austroflex and Topway.BRAE acquisitions. Total SG&A expenses, as a percentage of sales, was 24.7%remained constant at 26.4% in 2008 compared to 24.1% 2007.both 2011 and 2010.
Restructuring and Other (Income) Charges. In 2008,2011, we recorded $5.6a net charge of $8.8 million primarily for severance and other costs incurred as part of our previously announced restructuring programs, as compared to $12.6 million for severance, asset write-downs2010. For a more detailed description of our current restructuring plans, see Notes 4 and accelerated depreciation5 of Notes to Consolidated Financial Statements in North America, China and Europe. In 2007, we recorded $3.2 million for asset write-downs, accelerated depreciation and severance in North America and China.this Annual Report on Form 10-K.
Goodwill and Other Long-Lived Asset Impairment Charge.Charges. In 2011, we recorded asset impairment charges of $17.4 million, including $14.8 million for impairment charges on long-lived assets at Austroflex, $1.4 million in goodwill and long-lived intangible asset impairments at BRAE and
$1.2 million of impairment charges in certain European trade names. The long-lived asset and goodwill impairment chargeimpairments were based on historical results being below our expectations, uncertain economic conditions in 2008 of approximately $22.0 millionEurope related to oneAustroflex, and a reduction in the expected future cash flows to be generated by these entities. In 2010, the impairment charges of our North American reporting units (Water Quality).$1.4 million relate to write-downs of certain trade names in Europe. See Note 2 of notesNotes to consolidated financial statementsConsolidated Financial Statements in this Annual Report on Form 10-K, for additional information regarding these impairments.
Gain on Disposal of Business. In 2011, we recorded a net gain of approximately $7.7 million relating primarily to the impairment.recognition of currency translation adjustments resulting from the sale of TWVC.
Operating Income. Operating income by geographic segment for 20082011 and 20072010 was as follows:
| | Years Ended | | | ||||||||||
|---|---|---|---|---|---|---|---|---|---|---|---|---|---|
| | | % Change to Consolidated Operating Income | |||||||||||
| | December 31, 2008 | December 31, 2007 | Change | ||||||||||
| | (Dollars in millions) | ||||||||||||
North America | $ | 67.8 | $ | 93.3 | $ | (25.5 | ) | (20.3 | )% | ||||
Europe | 65.7 | 53.6 | 12.1 | 9.6 | |||||||||
China | (5.7 | ) | 7.9 | (13.6 | ) | (10.8 | ) | ||||||
Corporate | (27.2 | ) | (29.1 | ) | 1.9 | 1.5 | |||||||
Total | $ | 100.6 | $ | 125.7 | $ | (25.1 | ) | (20.0 | )% | ||||
| | Year Ended | | | ||||||||||
|---|---|---|---|---|---|---|---|---|---|---|---|---|---|
| | | % Change to Consolidated Operating Income | |||||||||||
| | December 31, 2011 | December 31, 2010 | Change | ||||||||||
| | (Dollars in millions) | ||||||||||||
North America | $ | 112.0 | $ | 106.4 | $ | 5.6 | 4.9 | % | |||||
Europe | 28.7 | 43.7 | (15.0 | ) | (13.1 | ) | |||||||
Asia | 12.2 | (0.5 | ) | 12.7 | 11.1 | ||||||||
Corporate | (35.8 | ) | (35.4 | ) | (0.4 | ) | (0.4 | ) | |||||
Total | $ | 117.1 | $ | 114.2 | $ | 2.9 | 2.5 | % | |||||
The change in operating income iswas attributable to the following:
| | | | | | | Change As a % of Consolidated Operating Income | Change As a % of Segment Operating Income | ||||||||||||||||||||||||||||||||||||
|---|---|---|---|---|---|---|---|---|---|---|---|---|---|---|---|---|---|---|---|---|---|---|---|---|---|---|---|---|---|---|---|---|---|---|---|---|---|---|---|---|---|---|---|
| | North America | Europe | China | Corp. | Total | North America | Europe | China | Corp. | Total | North America | Europe | China | Corp. | |||||||||||||||||||||||||||||
| | (Dollars in millions) | ||||||||||||||||||||||||||||||||||||||||||
Organic growth | $ | (2.1 | ) | $ | 5.7 | $ | (16.7 | ) | $ | 1.9 | $ | (11.2 | ) | (1.6 | )% | 4.5 | % | (13.3 | )% | 1.5 | % | (8.9 | )% | (2.3 | )% | 10.6 | % | (211.4 | )% | 6.5 | % | ||||||||||||
Foreign exchange | — | 3.9 | (0.4 | ) | — | 3.5 | — | 3.1 | (0.2 | ) | — | 2.9 | — | 7.3 | (5.1 | ) | — | ||||||||||||||||||||||||||
Acquisitions | (0.6 | ) | 2.7 | — | — | 2.1 | (0.4 | ) | 2.1 | — | — | 1.7 | (0.6 | ) | 5.0 | — | — | ||||||||||||||||||||||||||
Disposal | — | — | 0.8 | — | 0.8 | — | — | 0.6 | — | 0.6 | — | — | 10.1 | — | |||||||||||||||||||||||||||||
Restructuring, goodwill and other | (22.8 | ) | (0.2 | ) | 2.7 | — | (20.3 | ) | (18.3 | ) | (0.1 | ) | 2.1 | — | (16.3 | ) | (24.4 | ) | (0.4 | ) | 34.2 | — | |||||||||||||||||||||
Total | $ | (25.5 | ) | $ | 12.1 | $ | (13.6 | ) | $ | 1.9 | $ | (25.1 | ) | (20.3 | )% | 9.6 | % | (10.8 | )% | 1.5 | % | (20.0 | )% | (27.3 | )% | 22.5 | % | (172.2 | )% | 6.5 | % | ||||||||||||
| | | | | | | Change as a % of Consolidated Operating Income | Change as a % of Segment Operating Income | ||||||||||||||||||||||||||||||||||||
|---|---|---|---|---|---|---|---|---|---|---|---|---|---|---|---|---|---|---|---|---|---|---|---|---|---|---|---|---|---|---|---|---|---|---|---|---|---|---|---|---|---|---|---|
| | North America | Europe | Asia | Corp. | Total | North America | Europe | Asia | Corp. | Total | North America | Europe | Asia | Corp. | |||||||||||||||||||||||||||||
| | (Dollars in millions) | ||||||||||||||||||||||||||||||||||||||||||
Organic | $ | 1.8 | $ | (6.2 | ) | $ | 4.4 | $ | (0.4 | ) | $ | (0.4 | ) | 1.6 | % | (5.4 | )% | 3.8 | % | (0.4 | )% | (0.4 | )% | 1.7 | % | (14.2 | )% | 880.0 | % | (1.1 | )% | ||||||||||||
Foreign exchange | 0.7 | 2.6 | 0.2 | — | 3.5 | 0.6 | 2.3 | 0.2 | — | 3.1 | 0.7 | 6.0 | 40.0 | — | |||||||||||||||||||||||||||||
Acquisitions | 0.1 | 2.9 | (0.2 | ) | — | 2.8 | 0.1 | 2.5 | (0.2 | ) | — | 2.4 | 0.1 | 6.6 | (40.0 | ) | — | ||||||||||||||||||||||||||
Restructuring, impairment charges and other | 3.0 | (14.3 | ) | 8.3 | — | (3.0 | ) | 2.6 | (12.5 | ) | 7.3 | — | (2.6 | ) | 2.8 | (32.7 | ) | 1,660.0 | — | ||||||||||||||||||||||||
Total | $ | 5.6 | $ | (15.0 | ) | $ | 12.7 | $ | (0.4 | ) | $ | 2.9 | 4.9 | % | (13.1 | )% | 11.1 | % | (0.4 | )% | 2.5 | % | 5.3 | % | (34.3 | )% | 2,540.0 | % | (1.1 | )% | |||||||||||||
The decrease in consolidated organic operating income was due primarily to underutilization of capacity,a reduction in both Chinagross margins and to a lesser extent,an increase in North America caused by recessionary unit volume declines and one-off events in China such as the labor strike, a plant move and natural disasters. Also, SG&A expenses, such as salaries, product liabilityfor reasons discussed above. Acquired operating income relates to the Socla, Austroflex and other fixed spending increased. These items were partially offset by higher sales and better productivity in Europe and reductions in certain SG&A expenses such as shipping, pension costs and bad debts. Corporate costs decreased as the result of lower benefit costs, including lower stock based compensation and reduced costs from our nonqualified deferred compensation plan, and lower costs related to our Sarbanes Oxley compliance efforts and reduced legal costs.
The Blücher acquisition accounts for the net increase in operating profits fromBRAE acquisitions.
The net increase in operating income from foreign exchange was primarily due to the appreciation of the euro and Canadian dollar against the U.S. dollar. We cannot predict whether these currencies will continue to appreciate or depreciate against the U.S. dollar in future periods or whether future foreign exchange rate fluctuations will have a positive or negative impact on our operating income.
Interest Income. Interest income decreased $9.4 million, or 64.8%, in 2008 compared to 2007, primarily due to cash used to fund the Blücher acquisition and the stock buy-back program initiated in November 2007, as well as, a lower interest rate environment in 2008 as compared to 2007.
Interest Expense. Interest expense decreased $0.7increased $3.0 million, or 2.6%13.2%, in 20082011 compared to 2007,2010, primarily due to lower outstanding balances on the revolving credit facility partially offset by an increase in the average variable rates chargedamounts outstanding during the year on theour revolving credit facility.facility that was used to partially finance the Socla acquisition and interest incurred for all 2011 from the June 2010 issuance of $75.0 million of senior notes. See Note 11 of Notes to Consolidated Financial Statements in this Annual Report on Form 10-K, for additional information regarding financing arrangements.
Other, (Income) Expense.net. Other, expensenet increased $6.8$2.9 million or 295.7%, in 20082011 compared to 2007,2010, primarily due tobecause foreign currency transactiontransactions resulted in net losses losses on metal commodity transactions and negative changes in asset valuation of our nonqualified deferred compensation plan. Foreign currency transaction losses increased2011, while in China, Europe and Canada in 2008 as compared to 2007.2010 net gains were recognized.
Income Taxes. Our effective tax rate for continuing operations increaseddecreased to 34.6% for 200829.3% in 2011 from 31.8% for 2007.33.2% in 2010. The main driverprimary cause of the increasedecrease was goodwill impairment. A portion of the goodwill relates to stock acquisitions, which when impaired is not tax deductible. Our European effective rate declined due to provision releases and favorablethe tax treatments related tobenefit realized in connection with the Blücher acquisition financing.disposition of our TWVC facility in China.
Net Income From Continuing Operations.Operation. IncomeNet income from continuing operations in 2008 decreased $30.3for 2011 was $64.7 million, or 39.0%, to $47.3 million, or $1.28$1.73 per common share, from $77.6compared to $63.1 million, or $1.99$1.69 per common share, for 2007, in each case, on a diluted basis. Repurchased shares had an accretive impact of $0.07 per common share in 2008. Income from continuing operations included2010. Results for 2011 include an after-tax goodwill impairment charge of $17.3$6.6 million, or $0.47$0.18 per common share, for 2008. Income from continuing operations for 2007 includes a tax refundrestructuring and other charges compared to an after-tax restructuring and other charge of $1.9$11.2 million, or $0.05$0.29 per common share. Income from continuing operationsshare, for 2008 and 2007 included costs, net of tax, from our restructuring plan, reduction-in-force and product line discontinuances2010. Additionally, 2011 results include an after-tax charge of $3.9 million, or $0.10$0.11 per common share, and $5.1related to our former Chief Executive Officer's separation agreement. Results for 2011 include an after-tax charge of $13.0 million, or $0.13$0.35 per common share, respectively.for goodwill and asset impairment charges compared to an after-tax asset impairment charge of $1.2 million, or $0.03 per common share, for 2010. Results for 2011 include an after-tax gain related to the sale of TWVC of $11.4 million, or $0.30 per common share. The appreciation of the euro Chinese yuan and Canadian dollar against the U.S. dollar in 2011 resulted in a positive impact on income from continuingour operations of $0.07 per common share for 20082011 compared to the comparable period last year.2010. We cannot predict whether the euro, Canadian dollar or Chinese yuan will appreciate or depreciate against the U.S. dollar in future periods or whether future foreign exchange rate fluctuations will have a positive or negative impact on our net income.
LossIncome (Loss) From Discontinued Operations. LossIncome from discontinued operations in 2008 and 20072011 was $0.7primarily attributable to a reserve adjustment of $1.7 million, or $0.02$0.05 per common share, related to the FCPA investigation originally recorded in 2010. The adjustment reflects the final disposition of the FCPA investigation. See Notes 3 and $0.2 million, or $0.01 per common share, on a diluted basis14 of Notes to Consolidated Financial Statements for the comparable period. The losses for 2008 and 2007 were primarily attributable to increased legal fees associated with the James Jones Litigation, as described in Part I, Item 1, "Business-Product Liability, Environmental and Other Litigation Matters." The 2007 loss was partially offset by reserve adjustments.additional discussion of this matter.
Year Ended December 31, 20072010 Compared to Year Ended December 31, 20062009
Net Sales. Our net sales in each of our three geographicthese segments for the years ended December 31, 20072010 and 20062009 were as follows:
| | Year Ended December 31, 2007 | Year Ended December 31, 2006 | | | |||||||||||||||
|---|---|---|---|---|---|---|---|---|---|---|---|---|---|---|---|---|---|---|---|
| | | Change to Consolidated Net Sales | |||||||||||||||||
| | Net Sales | % Sales | Net Sales | % Sales | Change | ||||||||||||||
| | (Dollars in millions) | ||||||||||||||||||
North America | $ | 871.0 | 63.0 | % | $ | 821.3 | 66.7 | % | $ | 49.7 | 4.0 | % | |||||||
Europe | 452.6 | 32.7 | 367.5 | 29.9 | 85.1 | 6.9 | |||||||||||||
China | 58.7 | 4.3 | 42.0 | 3.4 | 16.7 | 1.4 | |||||||||||||
Total | $ | 1,382.3 | 100.0 | % | $ | 1,230.8 | 100.0 | % | $ | 151.5 | 12.3 | % | |||||||
| | Year Ended December 31, 2010 | Year Ended December 31, 2009 | | | |||||||||||||||
|---|---|---|---|---|---|---|---|---|---|---|---|---|---|---|---|---|---|---|---|
| | | Change to Consolidated Net Sales | |||||||||||||||||
| | Net Sales | % Sales | Net Sales | % Sales | Change | ||||||||||||||
| | (Dollars in millions) | ||||||||||||||||||
North America | $ | 785.5 | 61.6 | % | $ | 738.5 | 60.2 | % | $ | 47.0 | 3.8 | % | |||||||
Europe | 468.3 | 36.8 | 466.5 | 38.1 | 1.8 | 0.2 | |||||||||||||
Asia | 20.8 | 1.6 | 20.9 | 1.7 | (0.1 | ) | — | ||||||||||||
Total | $ | 1,274.6 | 100.0 | % | $ | 1,225.9 | 100.0 | % | $ | 48.7 | 4.0 | % | |||||||
The increasechange in net sales iswas attributable to the following:
| | | | | | Change As a % of Consolidated Net Sales | Change As a % of Segment Net Sales | ||||||||||||||||||||||||||||
|---|---|---|---|---|---|---|---|---|---|---|---|---|---|---|---|---|---|---|---|---|---|---|---|---|---|---|---|---|---|---|---|---|---|---|
| | North America | Europe | China | Total | North America | Europe | China | Total | North America | Europe | China | |||||||||||||||||||||||
| | (Dollars in millions) | |||||||||||||||||||||||||||||||||
Organic growth | $ | 41.0 | $ | 13.7 | $ | 8.5 | $ | 63.2 | 3.3 | % | 1.1 | % | 0.7 | % | 5.1 | % | 5.0 | % | 3.7 | % | 20.3 | % | ||||||||||||
Foreign exchange | 3.9 | 34.1 | 2.4 | 40.4 | 0.3 | 2.8 | 0.2 | 3.3 | 0.5 | 9.3 | 5.8 | |||||||||||||||||||||||
Acquisitions | 4.8 | 37.3 | 5.8 | 47.9 | 0.4 | 3.0 | 0.5 | 3.9 | 0.6 | 10.2 | 13.8 | |||||||||||||||||||||||
Total | $ | 49.7 | $ | 85.1 | $ | 16.7 | $ | 151.5 | 4.0 | % | 6.9 | % | 1.4 | % | 12.3 | % | 6.1 | % | 23.2 | % | 39.9 | % | ||||||||||||
| | | | | | Change As a % of Consolidated Net Sales | Change As a % of Segment Net Sales | ||||||||||||||||||||||||||||
|---|---|---|---|---|---|---|---|---|---|---|---|---|---|---|---|---|---|---|---|---|---|---|---|---|---|---|---|---|---|---|---|---|---|---|
| | North America | Europe | Asia | Total | North America | Europe | Asia | Total | North America | Europe | Asia | |||||||||||||||||||||||
| | (Dollars in millions) | |||||||||||||||||||||||||||||||||
Organic | $ | 38.8 | $ | 11.7 | $ | (0.2 | ) | $ | 50.3 | 3.2 | % | 1.0 | % | — | % | 4.2 | % | 5.3 | % | 2.5 | % | (1.0 | )% | |||||||||||
Foreign exchange | 7.0 | (20.5 | ) | 0.1 | (13.4 | ) | 0.6 | (1.7 | ) | — | (1.1 | ) | 0.9 | (4.4 | ) | 0.5 | ||||||||||||||||||
Acquisitions | 1.2 | 10.6 | — | 11.8 | — | 0.9 | — | 0.9 | 0.2 | 2.3 | — | |||||||||||||||||||||||
Total | $ | 47.0 | $ | 1.8 | $ | (0.1 | ) | $ | 48.7 | 3.8 | % | 0.2 | % | — | % | 4.0 | % | 6.4 | % | 0.4 | % | (0.5 | )% | |||||||||||
The organic growth inOrganic net sales in 2010 into the North AmericaAmerican wholesale market increased by $34.6 million or 6.1% compared to 2009. This increase was primarily due to increased unit selling prices and increased unit sales of certain product lines into the wholesale market. Our sales into the wholesale market in 2007, excluding the sales from the acquisition of Calflex Manufacturing, Inc. (Calflex) and Topway, grew by 7.7% compared to 2006. This was primarily due to increased sales of our plumbing and heating and backflow products. Ourproduct lines. Organic sales into the North American DIY market in 2007 decreased by 4.4%2010
increased $4.2 million or 2.5% compared to 20062009, primarily from increased product sales volume associated with repair and remodeling activity and new product introductions.
Organic net sales increased in the European wholesale market by $12.9 million or 5.3% compared to 2009. This increase was primarily due to a stronger repair and remodeling market, strong sales in our discontinuing certaindrain product line and higher sales into Eastern Europe. Organic sales into the European OEM market in 2010 were essentially flat with 2009 primarily due to increased sales in hydronic under-floor manifold packages offset by heat pump and solar packages whose lower margin product lines,sales were driven by renewable energy subsidies which had expired. Organic sales into the European DIY market in 2010 increased $1.5 million or 6.4% compared to 2009, primarily from initial new store sales to a major retail customer.
The net decrease in sales due to foreign exchange was primarily due to the depreciation of the euro, partially offset by price increases and new product rollouts.the appreciation of the Canadian dollar against the U.S. dollar.
The acquiredAcquired net sales growth in net sales inEurope and North America was due to the inclusion of net sales of Calflex, acquired on June 2, 2006,Austroflex and Topway, acquired on November 9, 2007.
The organic sales growth in Europe was broad-based, especially in Eastern Europe and in the OEM market, which was partially offset by a weak German market. Our sales into the wholesale and OEM markets in 2007, excluding the sales from the acquisitions of ATS Expansion Group (ATS), Kim Olofsson Safe Corporation (Kimsafe) and Black Teknigas, Limited (Teknigas), grew by 3.1% and 4.4%, respectively, compared to 2006.
The acquired growth in net sales in Europe was due to the inclusion of the net sales of ATS, acquired on May 19, 2006, Kimsafe, acquired on June 7, 2006, and Teknigas, acquired on August 14, 2006.
The organic sales growth in China was primarily due to increased export sales to Europe, increased sales into the domestic Chinese markets and the elimination of the one-month reporting lag in two of our Chinese entities.
The acquired growth in net sales in China was due to the inclusion of net sales of Changsha Valve Works (Changsha), acquired on April 26, 2006.
The increases in net sales due to foreign exchange in North America, Europe and China were primarily due to the appreciation of the Canadian dollar, euro and yuan, respectively, against the U.S. dollar.BRAE, respectively.
Gross Profit. Gross profit and gross profit as a percent of net sales (gross margin)margin for 20072010 and 20062009 were as follows:
| | Year Ended December 31, | | ||||||||
|---|---|---|---|---|---|---|---|---|---|---|
| | Point Change | |||||||||
| | 2007 | 2006 | ||||||||
| | (dollars in millions) | | ||||||||
Gross profit | $ | 461.6 | $ | 425.0 | ||||||
Gross margin | 33.4 | % | 34.5 | % | (1.1 | %) | ||||
| | Year Ended December 31, | ||||||
|---|---|---|---|---|---|---|---|
| | 2010 | 2009 | |||||
| | (Dollars in millions) | ||||||
Gross profit | $ | 464.9 | $ | 435.1 | |||
Gross margin | 36.5 | % | 35.5 | % | |||
Gross margin decreasedincreased 1.0 percentage point in 20072010 compared to 20062009. North America's gross margin improvement was primarily dueattributable to increased material costs,sales volumes, better absorption at the write-off of inventory related to the discontinuance of certain product linesfactories and an increase inproductivity gains from our workers' compensation reserve primarily due to a change in estimate. The North American margin for 2007 was affected by a charge related to our discontinuance of certain product linesLean and forSix Sigma cost increases for copper-based alloys and stainless steel products, which exceeded realized sales price increases for most of the year. The European margin remained relatively flat primarily due to higher margins contributed by price increases that weresavings initiatives, partially offset by increased materialraw materials costs and a shift in sales to lower margin products primarily in the OEM market. Our China segment's gross margin decreased primarily due to higher material costs, underutilized capacity in certain locations primarilyinefficiencies due to the relocation of our joint venture facility, a chargemanufacturing operations related to our restructuring program in the U.S. Europe's gross margin remained relatively flat as a result of better product mix, with the discontinuance of certain product lines, value added tax increasesvarious low-margin products, increased sales volumes and a shiftbetter absorption at the factories was offset by increased commodity costs and inefficiencies from our restructuring program in product mix.France.
Selling, General and Administrative Expenses. SG&A expenses for 20072010 increased $32.5$13.2 million, or 10.8%4.1%, compared to 2006.2009. The increase in SG&A expenses iswas attributable to the following:
| | (in millions) | % Change | |||||
|---|---|---|---|---|---|---|---|
Organic growth | $ | 13.1 | 4.4 | % | |||
Foreign exchange | 7.9 | 2.6 | |||||
Acquisitions | 11.5 | 3.8 | |||||
Total | $ | 32.5 | 10.8 | % | |||
| | (in millions) | % Change | |||||
|---|---|---|---|---|---|---|---|
Organic | $ | 12.4 | 3.8 | % | |||
Foreign exchange | (3.3 | ) | (1.0 | ) | |||
Acquisitions | 4.1 | 1.3 | |||||
Total | $ | 13.2 | 4.1 | % | |||
The organic increase in SG&A expenses was primarily due to legal, due diligence and other acquisition costs of $8.1 million, increased product liabilitypersonnel-related costs increased stock-based compensation costsof $4.4 million and increased variable selling expenses due to increasedhigher sales volumes of $3.4 million, partially offset by decreased incentive compensation costs.reduced product liability costs of $3.5 million. Legal costs were higher in 2010 as a result of a legal settlement we entered into in 2009 pursuant to which we received $4.1 million, which reduced legal expense. The increasedecrease in SG&A expenses from foreign exchange was primarily due to the appreciationdepreciation of the euro Canadian dollar and the yuan against the U.S. dollar. The increase in SG&A expenses from acquisitions was due to the inclusion of Changsha, ATS, Calflex, Watts Valve (Ningbo) Co, Ltd. (Ningbo), Kimsafe, Teknigas and Topway. Total SG&A expenses, as a percentage of sales, were 24.1%remained constant at 26.4% in 2007 compared to 24.4% 2006.each of 2010 and 2009.
Restructuring and Other (Income) Charges. In 2007,2010, we recorded $3.2a charge of $12.6 million primarily for severance and other costs incurred as part of our previously announced restructuring programs, as
compared to $17.2 million for asset write-downs, accelerated depreciation2009. Included in the 2009 restructuring and severance in North Americaother charges was a $1.1 million gain from the 2008 disposition of Tianjin Tanggu Watts Valve Co. Ltd. (TWT). The gain was deferred until all legal and China. In 2006, we recorded income of $5.7 million primarily due to a gain of approximately $8.2 million relatedregulatory matters relating to the sale of two buildingsTWT were resolved. For a more detailed description of our current restructuring plans, see Notes 4 and 5 of Notes to Consolidated Financial Statements in Italy partially offset by a charge of $2.5this Annual Report on Form 10-K.
Goodwill and Other Long-Lived Asset Impairment Charges. We recorded $1.4 million primarilyand $3.3 million in 2010 and 2009, respectively, for severance costsintangible impairment charges related to our European restructuring programs.certain trademarks and technology. See Note 2 of Notes to Consolidated Financial Statements in this Annual Report on Form 10-K, for additional information regarding these impairments.
Operating Income. Operating income by geographic segment for 20072010 and 20062009 was as follows:
| | Years Ended | | | ||||||||||
|---|---|---|---|---|---|---|---|---|---|---|---|---|---|
| | | % Change to Consolidated Operating Income | |||||||||||
| | December 31, 2007 | December 31, 2006 | Change | ||||||||||
| | (Dollars in millions) | ||||||||||||
North America | $ | 93.3 | $ | 98.5 | $ | (5.2 | ) | (4.0 | )% | ||||
Europe | 53.6 | 50.0 | 3.6 | 2.8 | |||||||||
China | 7.9 | 7.2 | 0.7 | 0.5 | |||||||||
Corporate | (29.1 | ) | (25.2 | ) | (3.9 | ) | (3.0 | ) | |||||
Total | $ | 125.7 | $ | 130.5 | $ | (4.8 | ) | (3.7 | )% | ||||
| | Years Ended | | | ||||||||||
|---|---|---|---|---|---|---|---|---|---|---|---|---|---|
| | | % Change to Consolidated Operating Income | |||||||||||
| | December 31, 2010 | December 31, 2009 | Change | ||||||||||
| | (Dollars in millions) | ||||||||||||
North America | $ | 106.4 | $ | 78.6 | $ | 27.8 | 30.2 | % | |||||
Europe | 43.7 | 51.0 | (7.3 | ) | (7.9 | ) | |||||||
Asia | (0.5 | ) | (6.6 | ) | 6.1 | 6.6 | |||||||
Corporate | (35.4 | ) | (30.8 | ) | (4.6 | ) | (5.0 | ) | |||||
Total | $ | 114.2 | $ | 92.2 | $ | 22.0 | 23.9 | % | |||||
The change in operating income iswas attributable to the following:
| | | | | | | Change As a % of Consolidated Operating Income | Change As a % of Segment Operating Income | ||||||||||||||||||||||||||||||||||||
|---|---|---|---|---|---|---|---|---|---|---|---|---|---|---|---|---|---|---|---|---|---|---|---|---|---|---|---|---|---|---|---|---|---|---|---|---|---|---|---|---|---|---|---|
| | North America | Europe | China | Corp. | Total | North America | Europe | China | Corp. | Total | North America | Europe | China | Corp. | |||||||||||||||||||||||||||||
| | (Dollars in millions) | ||||||||||||||||||||||||||||||||||||||||||
Organic growth | $ | (1.3 | ) | $ | 0.9 | $ | (1.5 | ) | $ | (3.9 | ) | $ | (5.8 | ) | (1.0 | )% | 0.7 | % | (1.3 | )% | (3.0 | )% | (4.6 | )% | (1.4 | )% | 1.8 | % | (20.8 | )% | (15.5 | )% | |||||||||||
Foreign exchange | 0.9 | 4.0 | 0.4 | — | 5.3 | 0.7 | 3.1 | 0.3 | — | 4.1 | 0.9 | 8.0 | 5.5 | — | |||||||||||||||||||||||||||||
Acquisitions | (1.3 | ) | 4.8 | 0.8 | — | 4.3 | (1.0 | ) | 3.6 | 0.7 | — | 3.3 | (1.3 | ) | 9.6 | 11.1 | — | ||||||||||||||||||||||||||
Restructuring/other | (3.5 | ) | (6.1 | ) | 1.0 | — | (8.6 | ) | (2.7 | ) | (4.6 | ) | 0.8 | — | (6.5 | ) | (3.5 | ) | (12.2 | ) | 13.9 | — | |||||||||||||||||||||
Total | $ | (5.2 | ) | $ | 3.6 | $ | 0.7 | $ | (3.9 | ) | $ | (4.8 | ) | (4.0 | )% | 2.8 | % | 0.5 | % | (3.0 | )% | (3.7 | )% | (5.3 | )% | 7.2 | % | 9.7 | % | (15.5 | )% | ||||||||||||
| | | | | | | Change as a % of Consolidated Operating Income | Change as a % of Segment Operating Income | ||||||||||||||||||||||||||||||||||||
|---|---|---|---|---|---|---|---|---|---|---|---|---|---|---|---|---|---|---|---|---|---|---|---|---|---|---|---|---|---|---|---|---|---|---|---|---|---|---|---|---|---|---|---|
| | North America | Europe | Asia | Corp. | Total | North America | Europe | Asia | Corp. | Total | North America | Europe | Asia | Corp. | |||||||||||||||||||||||||||||
| | (Dollars in millions) | ||||||||||||||||||||||||||||||||||||||||||
Organic | $ | 24.7 | $ | 0.5 | $ | (0.7 | ) | $ | (4.8 | ) | $ | 19.7 | 26.8 | % | 0.5 | % | (0.7 | )% | (5.2 | )% | 21.4 | % | 31.4 | % | 1.0 | % | (10.6 | )% | 15.6 | % | |||||||||||||
Foreign exchange | 1.4 | (2.6 | ) | — | — | (1.2 | ) | 1.5 | (2.8 | ) | — | — | (1.3 | ) | 1.8 | (5.1 | ) | — | — | ||||||||||||||||||||||||
Acquisitions | (0.6 | ) | (1.4 | ) | — | — | (2.0 | ) | (0.7 | ) | (1.5 | ) | — | — | (2.2 | ) | (0.7 | ) | (2.7 | ) | — | — | |||||||||||||||||||||
Restructuring, impairment charges, and other | 2.3 | (3.8 | ) | 6.8 | 0.2 | 5.5 | 2.6 | (4.1 | ) | 7.3 | 0.2 | 6.0 | 2.9 | (7.5 | ) | 103.0 | (0.7 | ) | |||||||||||||||||||||||||
Total | $ | 27.8 | $ | (7.3 | ) | $ | 6.1 | $ | (4.6 | ) | $ | 22.0 | 30.2 | % | (7.9 | )% | 6.6 | % | (5.0 | )% | 23.9 | % | 35.4 | % | (14.3 | )% | 92.4 | % | 14.9 | % | |||||||||||||
The decreaseincrease in consolidated organic operating income inwas due primarily to increased unit volume sales and stronger gross margins, partially offset by increased SG&A expenses. The North America margin increase was primarily due to increased material costs partially offset by unit price increases, a net increase insales volumes, better factory absorption levels and the impact of cost savings initiatives. In 2009, our workers' compensation reserve primarily due to a change in estimate and increased product liability costs, partially offset by decreased incentive compensation costs. In 2007, wecorporate segment recorded a chargethe recovery of $3.1 million related to our discontinuance of certain product lines and $0.4 million for primarily for severance costs related to our global restructuring program.
The acquired decrease was primarily due to the amortization of certain costs associated with the acquisition of Topway.
Europe's organic growth in operating income was due to our ability to leverage SG&Apast legal expenses, increased selling prices partially offset by increased material costs and a shift in sales to lower margin products primarily in the OEM market. In 2007, wewhich did not record any costs associated with restructuring compared to a gain of $6.0 million for the same periodrecur in 2006. We recorded a gain of $8.2 million for the building sales in Italy partially offset by $2.2 million of primarily severance costs.
The acquired growth in Europe was due to the inclusion of the operating income from ATS, Kimsafe and Teknigas.
The decrease in organic operating income in China was primarily attributable to decreased production levels at our wholly owned manufacturing plants. The acquired growth in China was due to the inclusion of the operating income of Changsha and Ningbo. In 2007, we recorded $3.3 million for asset write-downs, accelerated depreciation and severance related to our global restructuring program and $0.7 million related to our discontinuance of certain product lines. The elimination of a one-month reporting lag in two of our Chinese entities did not have a material impact on China's operating income.
The decrease in organic operating income in Corporate was primarily attributable to increased stock-based compensation costs and legal costs, partially offset by decreased incentive compensation costs.2010.
The net increasedecrease in operating income from foreign exchange was primarily due to the depreciation of the euro against the U.S. dollar, partially offset by the appreciation of the euro, Canadian dollar and yuan against the U.S. dollar.
Interest Income. Interest income increased $9.5 million, or 190.0%, in 2007 compared to 2006, primarily due to the investment of the net proceeds of approximately $219.0 million from the public offering of 5.75 million shares of our Class A Common Stock in November 2006.
Interest Expense. Interest expense increased $4.8$0.8 million, or 21.7%3.6%, in 20072010 compared to 2006,2009, primarily due to our April 27, 2006the issuance of $225.0$75.0 million 5.85%of senior notes due in 2016 and an increase in the average variable rates charged on the revolving credithigher facility partially offset by decreased debt levels for acquisitions.
Effective July 1, 2005, we entered into an interest rate swap for a notional amount of €25.0 million outstandingfees on our revolving credit facility. We swapped an adjustable rateagreement partially offset by the payment of three month EURIBOR plus 0.6%$50.0 million of outstanding notes. See Note 10 of Notes to Consolidated Financial Statements in this Annual Report on Form 10-K, for a fixed rate of 3.02%. We recorded a reduction to interest expense of approximately $0.7 million to recognize the fair value of the swap for 2006. The swap was terminated on October 3, 2006.additional information regarding financing arrangements.
Other, (Income) Expense.net. Other, (income) expensenet increased $3.2$0.9 million, or 355.6%75.0%, in 20072010 compared to 2006,2009, primarily due tobecause foreign currency movements and losses on forward currency contracts. Foreign currencytransactions resulted in net gains in 2010, while in 2009 net losses were recorded in Europe, Canada and China in 2007, whereas foreign currency gains were recorded in 2006.
Minority interest. Minority interest increased $1.0 million, or 55.6%, for 2007 compared to 2006, primarily due to the credit recorded for the 40% liability of our joint venture partner's share in the recording of the $2.4 million TWT restructuring costs.recognized.
Income Taxes. Our effective tax rate for continuing operations decreased to 31.8%33.2% in 20072010 from 33.6%43.3% in 2006.2009. The decrease was primarily due to reversal of a one-time benefit associated withvaluation allowance in Europe recorded during 2010. Also, in 2009 we had a refundsignificant write-down of withholding taxesassets at one of our China facilities on which we derived no tax benefit. Additionally, we recorded the reversal of previously recognized tax benefits in Italy andChina in 2006 the recording of higher taxes on the sale of two buildings.2009. These China-related items did not recur in 2010. This decreasefavorable impact was partially offset by higher European taxes due to mix of income by country and recognition of tax expense for the recordingrepatriation of a $3.2 million valuation allowance onearnings of TWVC in China upon our decision to dispose of the deferred tax assets of our 60% owned Chinese joint venture.entity.
Net Income From Continuing Operations. Income from continuing operations in 2007 increased $0.5 million, or 0.6%, to $77.6 million, or $1.99 per common share, from $77.1 million, or $2.29 per
common share, for 2006, in each case, on a diluted basis. IncomeNet income from continuing operations for 2007 included a tax refund of $1.92010 was $63.1 million, or $0.05 per common share. Income from continuing operations for 2007 and 2006 included costs, net of tax, from our restructuring plan and product line discontinuances of $5.1 million, or $0.13$1.69 per common share, and included income, net of tax, of $1.5compared to $41.0 million, or $0.04$1.10 per common share, for 2009. Results for 2010 include an after-tax charge of $11.2 million, or $0.29 per common share, for restructuring and other charges related primarily to severance and accelerated depreciation compared to an after-tax restructuring and other charge of $18.1 million, or $0.49 per common share, for 2009. The release of the valuation allowance on net operating losses in Europe as noted above contributed a tax benefit of $0.08 per common share to 2010. Results for 2010 and 2009 included a non-cash net after-tax charge of $0.9 million, or $0.03 per share, respectively. In 2006, the gains on the sales of our buildings in Italy resulted in an after-tax gain of $5.1and $2.6 million, or $0.15$0.07 per share.share, respectively, to write off certain intangible assets. The appreciationdepreciation of the euro, Chinese yuan andpartially offset by the appreciation of Canadian dollar against the U.S. dollar, resulted in a positivenegative impact on income from continuingour operations of $0.09$0.04 per common share for 20072010 compared to the comparable period last year.
Additionally, in November 2006, the Company completed a public offering of 5.75 million shares of Class A Common Stock and received net proceeds of approximately $219.0 million. The interest earned on the net proceeds provided approximately $7.1 million in after-tax income in 2007. The issuance of an additional 5.75 million shares had a dilutive impact on earnings per share of $0.11 per share in 2007, after considering the interest income from the net proceeds.2009.
LossIncome (Loss) From Discontinued Operations. LossThe loss from discontinued operations in 2007 and 20062010 was $0.2 million, or $0.01 per common share, and $3.4 million, or $0.10 per common share, on a diluted basis for the comparable period. The losses for 2007 and 2006 were primarily attributable to increased deductible costs in 2006estimated profits disgorgement and legal fees associated withcosts related to the FCPA investigation of our former subsidiary in China. The loss from discontinued operations in 2009 was primarily attributable to the deconsolidation of TEAM and the loss on the disposal and loss from operations of CWV offset by the resolution of the James Jones Litigation as described in Part I, Item 1, "Business-Product Liability, Environmental and Other Litigation Matters." The 2007 loss was partially offset by reserve adjustments.Note 3 of Notes to Consolidated Financial Statements.
Liquidity and Capital Resources
We believe that effectively managing cash is necessary given the uncertainty in the current credit markets. To achieve our cash management goals and manage any potential downside liquidity events, we have taken steps to control spending, increase productivity, reduce net working capital levels, control capital expenditures and to spend more conservatively on acquisitions. With available cash of $165.6 million at December 31, 2008, available capacity on our line of credit as discussed below, continued working capital management focus, no large debt payments due until 2010, and with spending and cost-cutting programs in place, we believe that we are well positioned to transition through what will be a challenging 2009. There are two recent negative developments related to inventory that could affect 2009 cash flows. We have recently experienced de-stocking issues within our customer base, which delay our ability to sell inventory. Further, more of our customers are adopting just-in-time inventory techniques to minimize their inventory investment, which puts pressure on our plants to hold inventory to meet expected near-term customer demand. Both these developments could affect our ability to reduce inventory levels during 2009 and, therefore could reduce our cash flows. Also, we may have to consider external sources of financing for any large future acquisitions.2011 Cash Flows
In 2008,2011, we generated $146.4$128.2 million of cash from operating activities as compared to $91.7$113.4 million in 2007. With management's enhanced focus in 2008 on working2010. We generated approximately $106.3 million of free cash flow (a non-GAAP financial measure, which we reconcile below, defined as net cash provided by continuing operating activities minus capital management, net working capitalexpenditures plus proceeds from sale of assets), compared to free cash outflows have decreased from $25.1flow of $91.0 million in 2007, to2010. Free cash flow as a net working capital cash inflowpercentage of $43.4 million in 2008, a $68.5 million positive change. Better overall management of our inventory, accounts receivable and accounts payable drove the improvement in working capital. This change was offset to some extent by lowernet income from continuing operations.operations was 164.3% in 2011 as compared to 144.2% in 2010.
WeIn 2011, we used $172.2$188.3 million of net cash forfrom investing activities in 2008.primarily for the purchase of Socla and for capital equipment. We usedanticipate investing approximately $167.9 million of net cash to fund a current year acquisition and spent $9.3 million for acquisition costs related to prior years acquisitions. We received proceeds of $33.3 million from the sale of auction rate securities. We invested $26.6$36.0 million in capital equipment as part of our ongoing commitmentin 2012 to improve our manufacturing capabilities. We expect to invest approximately $27.0 in capital equipment in 2009.
As of December 31, 2008,In 2011, we held $6.0 million in investments with an auction reset feature, or auction rate securities. Since December 31, 2007, we have reduced our exposure to auction rate
securities by $30.6 million. We recorded an impairment of approximately $2.4 million on the remaining securities in other expense in the Consolidated Statement of Operations, as the decline in fair value is no longer considered to be temporary. At the time of purchase, all the auction rate securities carried an AAA credit rating. The auction rate securities we currently hold are all long-term debt obligations secured by municipal bonds and student loans, and carry an AA or better credit rating.
Liquidity for these auction rate securities (ARS) is typically provided by an auction process, which allows holders to sell their notes, and resets the applicable interest rate at pre-determined intervals, usually every 7 to 35 days. Each of the auction rate securities in our investment portfolio as of December 31, 2008 has experienced failed auctions. There is no assurance that future auctions for these securities will succeed. During the fourth quarter of 2008, the Company and its broker elected to participate in a settlement offer by UBS AG (UBS). Under the terms of the settlement, the Company and its broker were issued rights by UBS. Each right entitles the holder to sell the underlying ARS at par to UBS at any time during the period June 30, 2010, through July 2, 2012. UBS could elect at any time from the settlement through the expiration of the settlement agreement to purchase the ARS, in which case UBS would be required to pay par value for the ARS. We have determined that the rights are a separate investment and have recorded the value of approximately $2.3 million in other income in our Consolidated Statement of Operations. We have classified the investment in ARS and the UBS rights as long-term investments as we can not predict if UBS will purchase or sell the ARS before the earliest date at which we can require UBS to purchase the ARS at par.
We used $92.4$23.9 million of net cash from financing activities in 2008. This wasactivities. Borrowings and repayments primarily duerelated to payments for our stock repurchase program, payments of debt and dividend payments, partially offset by increased borrowingsfunds borrowed under our credit agreement for the purchase of Socla and then partially repaid. Other cash outflows included $27.2 million used to repurchase one million shares of Class A common stock during 2011 and for $16.3 million of dividend payments.
On June 18, 2010, we entered into a credit agreement (the Credit Agreement) among the Company, certain subsidiaries of the Company who become borrowers under the Credit Agreement, Bank of America, N.A., as Administrative Agent, swing line lender and letter of credit issuer, and the other lenders referred to therein. The Credit Agreement provides for a $300 million, five-year, senior unsecured revolving credit facility which may be increased by an additional $150 million under certain
circumstances and subject to the terms of the Credit Agreement. The Credit Agreement has a sublimit of up to $75 million in letters of credit.
Our $350.0 million revolving credit facility with a syndicate of banks is being used to support our acquisition program, working capital requirements and for general corporate purposes. Outstanding indebtednessBorrowings outstanding under the revolving credit facility bearsCredit Agreement bear interest at a fluctuating rate determined byper annum equal to (i) in the typecase of loanEurocurrency rate loans, the British Bankers Association LIBOR rate plus an applicable marginpercentage, ranging from 1.70% to 2.30%, determined by reference to our debt rating, depending onconsolidated leverage ratio plus, in the applicablecase of certain lenders, a mandatory cost calculated in accordance with the terms of the Credit Agreement, or (ii) in the case of base rate loans and swing line loans, the highest of (a) the federal funds rate plus 0.5%, (b) the rate of interest in effect for such day as announced by Bank of America, N.A. as its "prime rate," and (c) the British Bankers Association LIBOR rate plus 1.0%, plus an applicable percentage, ranging from 0.70% to 1.30%, determined by reference to our bond rating. For 2008, the averageconsolidated leverage ratio. In addition to paying interest rate under the revolvingCredit Agreement, we are also required to pay certain fees in connection with the credit facility, for euro-based borrowings was approximately 5.2%. There were no U.S. dollar borrowings at December 31, 2008.including, but not limited to, a facility fee and letter of credit fees.
The revolving credit facility includes operationalCredit Agreement matures on June 18, 2015. We may repay loans outstanding under the Credit Agreement from time to time without premium or penalty, other than customary breakage costs, if any, and financial covenants customary for facilitiessubject to the terms of this type, including, among others, restrictions on additional indebtedness, liens and investments and maintenance of certain leverage ratios.the Credit Agreement.
As of December 31, 2008,2011, we held $250.6 million in cash and cash equivalents. Our ability to fund operations from this balance could be limited by the liquidity in the market as well as possible tax implications of moving proceeds across jurisdictions. Of this amount, approximately $99.3 million of cash and cash equivalents were held by foreign subsidiaries. Our U.S. operations currently generate sufficient cash flows to meet our domestic obligations. We also have the ability to borrow funds at reasonable interest rates, utilize the committed funds under our Credit Agreement or recall intercompany loans. However, if amounts held by foreign subsidiaries were needed to fund operations in the United States, we could be required to accrue and pay taxes to repatriate these funds. Such charges may include a federal tax of up to 35.0% on dividends received in the U.S., potential state income taxes and an additional withholding tax payable to foreign jurisdictions of up to 10.0%. However, our intent is to permanently reinvest undistributed earnings of foreign subsidiaries and we do not have any current plans to repatriate them to fund operations in the United States.
Covenant compliance
Under the Credit Agreement, we are required to satisfy and maintain specified financial ratios and other financial condition tests. The financial ratios include a consolidated interest coverage ratio based on consolidated earnings before income taxes, interest expense, depreciation, and amortization (Consolidated EBITDA) to consolidated interest expense, as defined in the Credit Agreement. Our Credit Agreement defines Consolidated EBITDA to exclude unusual or non-recurring charges and gains. We are also required to maintain a consolidated leverage ratio of consolidated funded debt to Consolidated EBITDA. Consolidated funded debt, as defined in the Credit Agreement, includes all long and short-term debt, capital lease obligations and any trade letters of credit that are outstanding. Finally, we are required to maintain a consolidated net worth that exceeds a minimum net worth calculation. Consolidated net worth is defined as the total stockholders' equity as reported adjusted for any cumulative translation adjustments and goodwill impairments.
As of December 31, 2011, our actual financial ratios calculated in accordance with our Credit Agreement compared to the required levels under the Credit Agreement were as follows:
| Actual Ratio | Required Level | |||
|---|---|---|---|---|
| Minimum level | ||||
Interest Charge Coverage Ratio | 7.13 to 1.00 | 3.50 to 1.00 | ||
Maximum level | ||||
Leverage Ratio | 1.06 to 1.00 | 3.25 to 1.00 | ||
Minimum level | ||||
Consolidated Net Worth | $940.8 million | $750.0 million |
As of December 31, 2011, our actual financial ratio calculated in accordance with our senior note agreements compared to the required ratios therein was as follows:
| Actual Ratio | Required Level | |||
|---|---|---|---|---|
| Minimum level | ||||
Fixed Charge Coverage Ratio | 5.47 to 1.00 | 2.00 to 1.00 |
In addition to the above financial ratios, the Credit Agreement and senior note agreements contain affirmative and negative covenants that include limitations on disposition or sale of assets, prohibitions on assuming or incurring any liens on assets with limited exceptions and limitations on making investments other than those permitted by the agreements.
We have several note agreements as further detailed in Note 10 of Notes to Consolidated Financial Statements. These note agreements require us to maintain a fixed charge coverage ratio of consolidated EBITDA plus consolidated rent expense during the period to consolidated fixed charges. Consolidated fixed charges are the sum of consolidated interest expense for the period and consolidated rent expense.
As of December 31, 2011, we were in compliance with all covenants related to the revolving credit facility,Credit Agreement and had $260.0$252.4 million of unused and potentially available credit under the revolving credit facilityCredit Agreement and had $55.0$34.6 million of euro-based borrowings outstanding and $35.0 million for stand-by letters of credit outstanding on our revolving credit facility.the Credit Agreement and $13.0 million in euro based borrowings under the Credit Agreement at December 31, 2011.
We used $0.6$1.9 million of net cash from operating activities of discontinued operations in 2008. We paid approximately $1.2 million for defense and other legal costs we incurred in2011 primarily to settle the James Jones Litigation. We also received $1.3 million for reimbursements of defense costs.FCPA investigation.
Working capital (defined as current assets less current liabilities) as of December 31, 20082011 was $504.7$531.0 million compared to $667.0$578.4 million as of December 31, 2007. This2010. The decrease was primarily due to decreasescash used to fund the Socla acquisition offset partially by increases in cashaccounts receivable and investment securities. Cash and cash equivalents decreased to $165.6 million as of December 31, 2008 compared to $290.3 million as of December 31, 2007 primarily due to funding of acquisitions and for payments for our stock repurchase program.inventories. The ratio of current assets to current liabilities was 2.72.9 to 1 as of December 31, 20082011 compared to 3.33.1 to 1 as of December 31, 2007.2010.
2010 Cash Flows
WeIn 2010, we generated $91.7$113.4 million of cash from operating activities as compared to $204.6 million in 2009. We generated approximately $91.0 million of free cash flow, compared to free cash flow of $181.2 million in 2009. Free cash flow as a percentage of net income from continuing operations was 144.2% in 2007. We experienced increases2010 as compared to 442.0% in inventory in North America and China.2009. The increases2009 free cash flow results were primarily due to increased raw material costs. There was also a decreaseaffected by the reduction of investment in accounts payable, accrued expensesreceivable and other liabilities, primarily in Europe and North America.inventory driven by the worldwide recession.
In Europe, accounts payable declined in 2007 due to a decline in inventory. In North America, payments for cash compensation increased in 2007. Also, cash payments to cover income tax obligations were greater during 2007. Accounts receivable decreased in all three segments.
We2010, we used $87.4$57.2 million of net cash forfrom investing activities primarily for the purchase of Austroflex and for capital equipment. We elected to participate in 2007. We invested $37.8 million in capital equipment as parta settlement offer from UBS, AG
(UBS) for all of our ongoing commitment to improve our manufacturing capabilities. We invested $27.5 million in investment gradeoutstanding auction rate securities.securities (ARS) investments. Under the terms of the settlement offer, we were issued rights by UBS entitling the holder to require UBS to purchase the underlying ARS at par value during the period from June 30, 2010, through July 2, 2012. We used $18.1elected to exercise this right in 2010 and received $6.5 million to fund the acquisitionsfrom UBS in settlement of Topway. We paid $4.5 million for additional acquisition costs related to prior years acquisitions.all outstanding ARS investments. In addition, during 2010, we invested in nine-month certificates of deposits totaling approximately $4.0 million.
We used $66.5In 2010, we generated $6.9 million of net cash from financing activities primarily from issuing $75.0 million, 10-year private placement notes in 2007.June (the Notes), partially offset by the repayment of $50.0 million in private placement notes and $16.4 million of dividend payments.
The Notes were issued pursuant to a Note Purchase Agreement (the 2010 Note Purchase Agreement). We will pay interest on the outstanding balance of the Notes at the rate of 5.05% per annum, payable semi-annually on June 18 and December 18 until the principal on the Notes shall become due and payable. We may, at our option, upon notice, subject to the terms of the 2010 Note Purchase Agreement, prepay at any time all or part of the Notes in an amount not less than $1 million by paying the principal amount plus a make-whole amount (as defined in the 2010 Note Purchase Agreement).
The 2010 Note Purchase Agreement includes operational and financial covenants, with which we are required to comply, including, among others, maintenance of certain financial ratios and restrictions on additional indebtedness, liens and dispositions. Events of defaults under the 2010 Note Purchase Agreement include failure to comply with the financial and operational covenants, as well as bankruptcy and other insolvency events. If an event of default occurs and is continuing, then a majority of the note holders have the right to accelerate and require us to repay all the outstanding notes under the 2010 Note Purchase Agreement. In limited circumstances, such acceleration is automatic. As of December 31, 2010 we were in compliance with all covenants related to the 2010 Note Purchase Agreement.
2009 Cash Flows
In 2009, we generated $204.6 million of cash from operating activities as compared to $145.0 million in 2008. We generated approximately $181.2 million of free cash flow, which compares favorably to free cash flow of $119.9 million in 2008. Free cash flow as a percentage of net income from continuing operations was 442.0% in 2009 as compared to 265.3% in 2008 primarily due to better working capital management, temporary decreases in commodity costs, cost containment measures and careful monitoring of our capital spending.
In 2009, we used $21.3 million of net cash from investing activities primarily for purchases of capital equipment. We received proceeds of $1.7 million from the sale of auction rate securities. We received $1.1 million of cash for a purchase price settlement related to a prior-year acquisition. We paid $0.4 million for earn-out payments related to an acquisition from prior years.
As of December 31, 2009, we held $5.4 million in investments in ARS with a total par value of $6.6 million. These auction rate securities were all long-term debt obligations secured by municipal bonds and student loans. During the fourth quarter of 2008, we elected to participate in a settlement offer by UBS. We exercised our rights under the settlement in June 2010.
We used $77.2 million of net cash from financing activities during 2009. This was primarily due to payments of debt payments for our stock repurchase program and dividend payments, partially offset by increased borrowings under our line of credit and tax benefits from the exercise of stock awards.payments.
We generated $0.1used $21.2 million of net cash from operating activities of discontinued operations in 2007. We paid approximately $0.5 million for defense costs and approximately $0.5 million for other legal costs we incurred in the James Jones Litigation. We also received $1.0 million for indemnity payments.
We generated $83.0 million of cash from continuing operations for 2006. We experienced an increase in inventory and accounts receivable in North America, Europe and China. The increase in accounts receivable of $17.0 million was2009 primarily due to increased sales volume and selling prices. The increase in inventorythe settlement of $37.3 million was primarily due to increased cost of raw materials and planned increases in European safety stocks. The increase in inventory and accounts receivable was partially offset by increased accounts payable, accrued expenses and other liabilities of $29.5 million.
We used $119.2 million of net cash for investing activities in 2006. We used $91.1 million to fund the acquisitions of Changsha, ATS, Calflex and Ningbo, Kimsafe and Teknigas, $1.9 million in additional costs related to 2005 acquisitions and $0.4 million to complete the planned increase of our ownership in Stern. We invested $11.8 million in investment grade auction rate securities and $44.7 million in capital equipment. Capital expenditures consisted of approximately $26.7 million for manufacturing machinery and equipment and approximately $18.0 million for the purchase of land and a building and for infrastructure improvements for a site in Italy. We subsequently entered into a sale-leaseback transaction with respect to the building. We received proceeds of $31.9 million, which primarily included $16.0$15.3 million related to the sale-leaseback in Italy and $13.4 millionJames Jones litigation. In addition, separate from the sales of two facilitiessettlement, we paid our outside counsel an additional $5.0 million for services rendered in northern Italy. We also received proceeds from two buildings held for sale, totaling approximately $2.5 million during 2006.connection with the litigation.
We generated $331.3used $0.3 million of net cash from financinginvesting activities for 2006. On November 21, 2006, we completed a public offering of 5.75 million shares of newly issued Class A Common Stock at $40.00 per share. Net proceeds were approximately $218.6 million after taking into account underwriting discounts and expenses associated with the transaction. Additionally, we generated cash through the completion of our $225.0 million private placement of 5.85% notes in April 2006, increased borrowings under our line of credit for use in Europe and proceeds from the exercise of stock options, partially offset by payments of debt, dividend payments and debt issue costs.
We generated $0.9 million of net cash by operations from discontinued operations in 2006. We also received approximately $2.8 million in cash for reimbursement of defense costs related to the James Jones Litigation. During 2006, we paid approximately $0.6 million for defense costs and approximately $0.5 million for indemnity costs we incurred in the James Jones Litigation.
We had free cash flow of $120.9 million (a non-GAAP financial measure defined as net cash provided by continuing operations minus capital expenditures plus proceeds from sale of assets) during the year ended December 31, 2008 versus free cash flow of $54.5 million in 2007. This increase in 2008 compared to 2007 was2009 primarily due to growth in cash generated by operations from more focused workingpurchasing capital management. Our net debt to capitalization ratio (a non-GAAP financial measure defined as short and long-term interest-bearing liabilities less cash and cash equivalents as a percentage of the sum of short and long term interest-bearing liabilities less cash and cash equivalents plus total stockholders' equity) increased to 22.8% for 2008 from 13.5% for 2007. The increase resulted from the use of cash to purchase Blücher and for funds used in our stock repurchase program.equipment.
We had free cash flow of $54.5 million during the year ended December 31, 2007 versus free cash flow of $70.2 million in 2006. This decrease in 2007 compared to 2006 was primarily due to the proceeds from the sale of property, plant and equipment in 2006 partially offset by growth in cash generated by operations.Non-GAAP Financial Measures
We believe free cash flow to be an appropriate supplemental measure of our operating performance because it provides investors with a measure of our ability to generate cash, to repay debt and to fund acquisitions. We may not be comparable to otherOther companies that may define free cash flow differently. Free cash flow does not represent cash generated from operating activities in accordance with GAAP. Therefore it should not be considered an alternative to net cash provided by operations as an indication of our performance. Free cash flow should also not be considered an alternative to net cash provided by operations as defined by GAAP. The cash conversion rate of free cash flow to net income from continuing operations is also a measure of our performance in cash flow generation.
A reconciliation of net cash provided by continuing operations to free cash flow and calculation of our cash conversion rate is provided below:
| | Years Ended December 31, | |||||||||
|---|---|---|---|---|---|---|---|---|---|---|
| | 2008 | 2007 | 2006 | |||||||
| | (in millions) | |||||||||
Net cash provided by continuing operations | $ | 146.4 | $ | 91.7 | $ | 83.0 | ||||
Less: additions to property, plant, and equipment | (26.6 | ) | (37.8 | ) | (44.7 | ) | ||||
Plus: proceeds from the sale of property, plant, and equipment | 1.1 | 0.6 | 31.9 | |||||||
Free cash flow | $ | 120.9 | $ | 54.5 | $ | 70.2 | ||||
| | Years Ended December 31, | |||||||||
|---|---|---|---|---|---|---|---|---|---|---|
| | 2011 | 2010 | 2009 | |||||||
| | (in millions) | |||||||||
Net cash provided by continuing operations | $ | 128.2 | $ | 113.4 | $ | 204.6 | ||||
Less: additions to property, plant, and equipment | (22.7 | ) | (24.6 | ) | (24.2 | ) | ||||
Plus: proceeds from the sale of property, plant, and equipment | 0.8 | 2.2 | 0.8 | |||||||
Free cash flow | $ | 106.3 | $ | 91.0 | $ | 181.2 | ||||
Net income from continuing operations—as reported | $ | 64.7 | $ | 63.1 | $ | 41.0 | ||||
Cash conversion rate of free cash flow to net income from continuing operations | 164.3 | % | 144.2 | % | 442.0 | % | ||||
Our net debt to capitalization ratio, is also a non-GAAP financial measure used by management.management, increased to 13.9% for 2011 from 5.2% for 2010. The increase resulted from cash used for and debt incurred, as part of the Socla acquisition. Management believes it to be an appropriate supplemental measure because it helps investors understand our ability to meet our financing needs and as a basis to evaluate our financial structure. Our computation may not be comparable to other companies that may define net debt to capitalization differently.
A reconciliation of long-term debt (including current portion) to net debt and our net debt to capitalization ratio is provided below:
| | December 31, | ||||||
|---|---|---|---|---|---|---|---|
| | 2008 | 2007 | |||||
| | (in millions) | ||||||
Current portion of long-term debt | $ | 4.5 | $ | 1.3 | |||
Plus: long-term debt, net of current portion | 409.8 | 432.2 | |||||
Less: cash and cash equivalents | (165.6 | ) | (290.3 | ) | |||
Net debt | $ | 248.7 | $ | 143.2 | |||
| | December 31, | ||||||
|---|---|---|---|---|---|---|---|
| | 2011 | 2010 | |||||
| | (in millions) | ||||||
Current portion of long-term debt | $ | 2.0 | $ | 0.7 | |||
Plus: long-term debt, net of current portion | 397.4 | 378.0 | |||||
Less: cash and cash equivalents | (250.6 | ) | (329.2 | ) | |||
Net debt | $ | 148.8 | $ | 49.5 | |||
A reconciliation of capitalization is provided below:
| | December 31, | ||||||
|---|---|---|---|---|---|---|---|
| | 2008 | 2007 | |||||
| | (in millions) | ||||||
Net debt | $ | 248.7 | $ | 143.2 | |||
Total stockholders' equity | 842.4 | 915.5 | |||||
Capitalization | $ | 1,091.1 | $ | 1,058.7 | |||
Net debt to capitalization ratio | 22.8 | % | 13.5 | % | |||
| | December 31, | ||||||
|---|---|---|---|---|---|---|---|
| | 2011 | 2010 | |||||
| | (in millions) | ||||||
Net debt | $ | 148.8 | $ | 49.5 | |||
Total stockholders' equity | 919.8 | 901.5 | |||||
Capitalization | $ | 1,068.6 | $ | 951.0 | |||
Net debt to capitalization ratio | 13.9 | % | 5.2 | % | |||
Contractual Obligations
Our contractual obligations as of December 31, 20082011 are presented in the following table:
| | Payments Due by Period | |||||||||||||||
|---|---|---|---|---|---|---|---|---|---|---|---|---|---|---|---|---|
Contractual Obligations | Total | Less than 1 year | 1–3 years | 3–5 years | More than 5 years | |||||||||||
| | (in millions) | |||||||||||||||
Long-term debt obligations, including current maturities(a) | $ | 414.3 | $ | 4.5 | $ | 106.5 | $ | 76.5 | $ | 226.8 | ||||||
Operating lease obligations | 26.0 | 7.7 | 7.9 | 4.3 | 6.1 | |||||||||||
Capital lease obligations(a) | 14.6 | 1.3 | 2.8 | 2.5 | 8.0 | |||||||||||
Pension contributions | 23.8 | 6.3 | 6.1 | 3.1 | 8.3 | |||||||||||
Interest(b) | 129.6 | 22.6 | 39.5 | 33.4 | 34.1 | |||||||||||
Earnout payments(a) | 0.4 | 0.4 | — | — | — | |||||||||||
Other(c) | 29.7 | 25.3 | 2.0 | 1.2 | 1.2 | |||||||||||
Total | $ | 638.4 | $ | 68.1 | $ | 164.8 | $ | 121.0 | $ | 284.5 | ||||||
| | Payments Due by Period | |||||||||||||||
|---|---|---|---|---|---|---|---|---|---|---|---|---|---|---|---|---|
Contractual Obligations | Total | Less than 1 year | 1-3 years | 3-5 years | More than 5 years | |||||||||||
| | (in millions) | |||||||||||||||
Long-term debt obligations, including current maturities(a) | $ | 399.4 | $ | 2.0 | $ | 79.3 | $ | 243.1 | $ | 75.0 | ||||||
Operating lease obligations | 30.6 | 9.3 | 13.3 | 4.8 | 3.2 | |||||||||||
Capital lease obligations(a) | 10.2 | 1.1 | 2.2 | 2.2 | 4.7 | |||||||||||
Pension contributions | 15.0 | 1.0 | 2.0 | 2.2 | 9.8 | |||||||||||
Interest(b) | 104.6 | 23.0 | 38.0 | 28.1 | 15.5 | |||||||||||
Earnout payments(a) | 1.1 | — | — | 1.1 | — | |||||||||||
Other(c) | 51.2 | 41.0 | 6.9 | 2.7 | 0.6 | |||||||||||
Total | $ | 612.1 | $ | 77.4 | $ | 141.7 | $ | 284.2 | $ | 108.8 | ||||||
We maintain letters of credit that guarantee our performance or payment to third parties in accordance with specified terms and conditions. Amounts outstanding were approximately $39.3$34.9 million as of December 31, 20082011 and $45.0 million as of December 31, 2007.2010. Our letters of credit are primarily associated with insurance coverage and, to a lesser extent, foreign purchases and generally expire within one year of issuance. These instruments may exist or expire without being drawn down, therefore they do not necessarily represent future cash flow obligations.
Off-Balance Sheet Arrangements
Except for operating lease commitments, we have no off-balance sheet arrangements that have or are reasonably likely to have a current or future effect on our financial condition, changes in financial condition, revenues or expenses, results of operations, liquidity, capital expenditures or capital resources that is material to investors.
Application of Critical Accounting Policies and Key Estimates
The preparation of our consolidated financial statements in accordance with U.S. GAAP requires management to make judgments, assumptions and estimates that affect the amounts reported. A critical accounting estimate is an assumption about highly uncertain matters and could have a material effect on the consolidated financial statements if another, also reasonable, amount were used, or, a change in the estimate is reasonably likely from period to period. We base our assumptions on historical experience and on other estimates that we believe are reasonable under the circumstances. Actual results could differ significantly from these estimates. There were no changes in our accounting policies or significant changes in our accounting estimates during 2008.2011 except for a change in the amortization period of pension gains and losses as discussed below under the caption "Pension benefits".
We periodically discuss the development, selection and disclosure of the estimates with our Audit Committee. Management believes the following critical accounting policies reflect its more significant estimates and assumptions.
Revenue recognition
We recognize revenue when all of the following criteria are met: (1) we have entered into a binding agreement, (2) the product has shipped and title has passed, (3) the sales price to the customer
is fixed or is determinable and (4) collectibilitycollectability is reasonably assured. We recognize revenue based upon a determination that all criteria for revenue recognition have been met, which, based on the majority of our shipping terms, is considered to have occurred upon shipment of the finished product. Some shipping terms require the goods to be received by the customer before title passes. In those instances, revenues are not recognized until the customer has received the goods. We record estimated reductions to revenue for customer returns and allowances and for customer programs. Provisions for returns and allowances are made at the time of sale, derived from historical trends and form a portion of the allowance for doubtful accounts. Customer programs, which are primarily annual volume incentive plans, allow customers to earn credit for attaining agreed upon purchase targets from us. We record estimated reductions to revenue, made at the time of sale, for customer programs based on estimated purchase targets.
Allowance for doubtful accounts
The allowance for doubtful accounts is established to represent our best estimate of the net realizable value of the outstanding accounts receivable. The development of our allowance for doubtful accounts varies by region but in general is based on a review of past due amounts, historical write-off experience, as well as aging trends affecting specific accounts and general operational factors affecting all accounts. In North America, management specifically analyzes individual accounts receivable and establishes specific reserves against financially troubled customers. In addition, factors are developed in certain regions utilizing historical trends in bad debts,of sales and returns and allowances. The ratio of these factorsallowances and cash discount activities to sales onderive a rolling twelve-month basis is applied to total outstanding receivables (net of accounts specifically identified) to establish a reserve. In Europe, management develops their bad debt allowance through an aging analysis of all their accounts. In China, management specifically analyzes individual accounts receivablereserve for returns and establishes specific reserves as needed. In addition, for waterworks customers, whose payment terms are generally extended, we reserve the majority of accounts receivable in excess of one year from the invoice date.allowances and cash discounts.
We uniformly consider current economic trends and changes in customer payment terms when evaluating the adequacy of the allowance for doubtful accounts. We also aggressively monitor the creditworthiness of our largest customers, and periodically review customer credit limits to reduce risk. If circumstances relating to specific customers change or unanticipated changes occur in the general business environment, our estimates of the recoverability of receivables could be further adjusted.
Inventory valuation
Inventories are stated at the lower of cost or market with costs determined primarily on a first-in first-out basis. We utilize both specific product identification and historical product demand as the basis for determining our excess or obsolete inventory reserve. We identify all inventories that exceed a range of one to four years in sales. This is determined by comparing the current inventory balance against unit sales for the trailing twelve months. New products added to inventory within the past twelve months are excluded from this analysis. A portion of our products contain recoverable materials, therefore the excess and obsolete reserve is established net of any recoverable amounts. Changes in market conditions, lower than expectedlower-than-expected customer demand or changes in technology or features could result in additional obsolete inventory that is not saleable and could require additional inventory reserve provisions.
In certain countries, additional inventory reserves are maintained for potential shrinkage experienced in the manufacturing process. The reserve is established based on the prior year's inventory losses adjusted for any change in the gross inventory balance.
Goodwill and other intangibles
We have made numerous acquisitions over the years which included the recognition of a significant amount of goodwill. Goodwill and intangible assets with indefinite lives areis tested annually for impairment in accordance withannually or more frequently if an event or circumstance indicates that an impairment loss may have been incurred. Application of the provisionsgoodwill impairment test requires judgment, including the identification of Financial Accounting Standards Board Statement No. 142 "Goodwillreporting units, assignment of assets and liabilities to reporting units, and determination of the fair value of each reporting unit. We
and Other Intangible Assets" (FAS 142). We use our judgment in assessing whether assets may have become impaired between annual impairment tests. Due toestimate the current economic conditions as well as other business factors, we concluded that the goodwillfair value of our Water Quality reporting unit was impairedunits using an income approach based on October 26, 2008, the timepresent value of estimated future cash flows. We believe this approach yields the most appropriate evidence of fair value as our latest annual review. We recorded a charge of $22.0 millionreporting units are not easily compared to other corporations involved in the fourth quarter in accordance with FAS 142. We perform our annual test for indicators of goodwill and non-amortizable intangible assets impairment in the fourth quarter of our fiscal year or sooner if indicators of impairment exist.similar businesses.
Intangible assets such as purchased technology are generally recorded in connection with a business acquisition. Values assigned to intangible assets are determined by an independent valuation firm based on our estimates and judgments regarding expectations of the success and life cycle of products and technology acquired. During 2011, 2010 and 2009, we recognized non-cash pre-tax charges of approximately $1.4 million, $1.4 million and $3.3 million, respectively, as an impairment of some of our indefinite-lived intangible assets. In addition, during 2011, we recognized non-cash pretax charges of $13.5 million as an impairment of certain amortizable intangible assets in our Europe segment.
In 2011, the Company determined that the prospects for Austroflex Rohr-Isoliersysteme GmbH (Austroflex), part of our Europe segment, were lower than originally estimated due to current operating profits below forecast and tempered future growth expectations. Accordingly, the Company performed a fair value assessment and, as a result, wrote down the long-lived assets by $14.8 million, or approximately 78%, including customer relationships of $12.1 million, trade names of $1.4 million, and property, plant and equipment of $1.3 million. Fair value was based on discounted cash flows using market participant assumptions and utilized an estimated weighted average cost of capital.
Revised accounting guidance issued in September 2011 allows us to review goodwill for impairment utilizing either qualitative or quantitative analyses. We have the option to first assess qualitative factors to determine whether the existence of events or circumstances leads to a determination that it is more likely than not that the fair value of a reporting unit is less than its carrying amount. If, after assessing the totality of events and circumstances, we determine it is more likely than not that the fair value of a reporting unit is greater than its carrying amount, then performing the two-step (quantitative) impairment test is unnecessary.
We usefirst identify those reporting units that we believe could pass a discounted cash flow methodqualitative assessment to determine whether further impairment testing is necessary. For each reporting unit identified, our qualitative analysis includes:
We then compile this information and make our assessment of whether it is more likely than not that the fair value of the reporting unit is less than its carrying amount. If we determine it is not more likely than not, then no further quantitative analysis is required. We determined we have eight reporting units in continuing operations, one of which, Water Quality, has no goodwill. In 2011, we performed a qualitative analysis for the Residential and Commercial (formerly Regulator), Dormont and Asia reporting units and concluded further impairment testing was not required.
The second analysis for goodwill impairment involves a quantitative two-step process. We performed a quantitative impairment analysis for our Drains and water re-use (formerly Orion), BRAE, Europe and Blücher reporting units. The first step of the impairment test requires a comparison of the fair value of each reporting unit. We have eightof our reporting units based onto the guidance containedrespective carrying value. If the carrying value of a reporting unit is less than its fair value, no indication of impairment exists and a second step is not performed. If the carrying amount of a reporting unit is higher than its fair value, there is an indication that impairment may exist and a second step must be performed. In the second step, the impairment is computed by comparing the implied fair value of the reporting unit's goodwill with the carrying amount
of the goodwill. If the carrying amount of the reporting unit's goodwill is greater than the implied fair value of its goodwill, an impairment loss must be recognized for the excess and charged to operations.
Inherent in FAS 142 and related literature. The discounted cash flow model includes a numberour development of estimatesthe present value of future cash flows.flow projections are assumptions and estimates derived from a review of our operating results, business plans, expected growth rates, cost of capital and tax rates. We also make certain assumptions about future economic conditions and other market data. We develop our assumptions based on our historical results including sales growth, operating profits, working capital levels and tax rates. In our 2008 testing, we also incorporated assumptions regarding the current economic environment, including expectations regarding when the recession would end and at what point we would see orders return to historical levels.
We believe that the discounted cash flow model is sensitive to the selected discount rate. We use third-party expertsvaluation specialists to help develop appropriate discount rates for each reporting unit. We use standard valuation practices to arrive at a weighted average cost of capital based on the market and guideline public companies. The higher the discount rate, the lower the discounted cash flows. While we believe that our estimates of future cash flows are reasonable, different assumptions could significantly affect our valuations and result in impairments in the future.
Other changesDuring the fourth quarter of 2011, we recognized apre-tax non-cash goodwill impairment charge of $1.2 million related to our BRAE reporting unit within our North America segment.
As of our October 30, 2011 testing date, we had approximately $513.7 million of goodwill on our balance sheet. Our impairment testing indicated that may affectthe fair values of the reporting units, except for BRAE, exceeded the carrying values, thereby resulting in no impairment. The results of this impairment analysis are summarized in the table below:
| | Goodwill balance at October 30, 2011 | Book value of equity of reporting unit at October 30, 2011 | Estimated fair value (implied value of equity) at October 30, 2011 | |||||||
|---|---|---|---|---|---|---|---|---|---|---|
| | (in millions) | |||||||||
Reporting unit | ||||||||||
Europe | $ | 223.0 | $ | 427.2 | $ | 464.3 | ||||
Blücher | 81.8 | 157.9 | 186.7 | |||||||
Drains & water re-use | 34.6 | 57.6 | 106.7 | |||||||
BRAE | 2.6 | 2.4 | 1.2 | |||||||
The underlying analyses supporting our valuations include, but are not limitedfair value assessment related to product acceptancesour outlook of the business' long-term performance, which included key assumptions as to the appropriate discount rate and regulatory approval. If actual product acceptance differs significantlylong-term growth rate. In connection with our October 30, 2011 impairment test, we utilized discount rates ranging from 12.5% to 28.5%, growth rates beyond our estimates, weplanning periods ranging from 3% to 7% and long-term terminal growth rates from 3% to 4%.
Operating results for our Europe segment have been hindered by the downturn in the economic environment in Europe. Should Europe's sales decline because the European marketplace deteriorates beyond our current expectations, then the reporting unit's goodwill may be required to record an impairment charge to write down the assets to their realizable value. A severe decline in market value could result in an unexpected impairment charge to goodwill, which could have a material impact on the results of operations and financial position. Although we have not experienced goodwillat risk for impairment in the future. Europe's goodwill balance as of December 31, 2011 was $210.5 million. As of October 30, 2011, our remaininglast impairment analysis date, the fair value of Europe's reporting units, there canunit exceeded the carrying value by 9%.
The Blücher reporting unit's operating results have also been hindered by the downturn in the economic environment in Europe. Should Blücher's sales decline because the European marketplace deteriorates beyond our current expectations, then the reporting unit's goodwill may be no assurances that futureat risk for impairment in the future. Blücher's goodwill balance as of December 31, 2011 was $74.8 million. As of October 30, 2011, our last impairment will not occur.analysis date, the fair value of Blücher's reporting unit exceeded the carrying value by 18%.
Product liability and workers' compensation costs
Because of retention requirements associated with our insurance policies, we are generally self-insured for potential product liability claims and for workers' compensation costs associated with
workplace accidents. We are subject to a variety of potential liabilities in connection with product liability cases and we maintain product liability and other insurance coverage, which we believe to be generally in accordance with industry practices. For product liability cases in the U.S., management estimates expected settlement costsestablishes its product liability accrual by utilizing third party actuarial valuations which incorporates historical trend factors and our specific claims experience derived from loss reports provided by our third-party administrators as well as developing internal historical trend factors based on our specific claims experience. Management utilizes the internal trend factors that reflect final expected settlement costs.administrators. In other countries, we maintain insurance coverage with relatively high deductible payments, as product liability claims tend to be smaller than those experienced in the U.S. Changes in the nature of claims or the actual settlement amounts could affect the adequacy of this estimate and require changes to the provisions. Because the liability is an estimate, the ultimate liability may be more or less than reported.
Workers' compensation liabilities in the U.S. are recognized for claims incurred (including claims incurred but not reported) and for changes in the status of individual case reserves. At the time a workers' compensation claim is filed, a liability is estimated to settle the claim. The liability for workers' compensation claims is determined based on management's estimates of the nature and severity of the claims and based on analysis provided by third partythird-party administrators and by various state statutes and reserve requirements. We have developed our own trend factors based on our specific claims experience.experience, discounted based on risk-free interest rates. We employ third party actuarial valuations to help us estimate our workers' compensation accrual. In other countries where workers' compensation costs are applicable, we maintain
insurance coverage with limited deductible payments. Because the liability is an estimate, the ultimate liability may be more or less than reported.reported and is subject to changes in discount rates.
We determine the trend factors for product liability and workers' compensation liabilities based on consultation with outside actuaries.
We maintain excess liability insurance with outside insurance carriers to minimize our risks related to catastrophic claims in excess of all self-insured positions. Any material change in the aforementioned factors could have an adverse impact on our operating results.
Legal contingencies
We are a defendant in numerous legal matters including those involving environmental law and product liability as discussed furtherin more detail in Part I, Item 1,1. "Business—Product Liability, Environmental and Other Litigation Matters." As required by Statement of Financial Accounting Standards No. 5 "Accounting for Contingencies" (FAS 5),GAAP, we determine whether an estimated loss from a loss contingency should be accrued by assessing whether a loss is deemed probable and the loss amount can be reasonably estimated, net of any applicable insurance proceeds. When it is possible to estimate reasonably possible loss or range of loss above the amount accrued, that estimate is aggregated and disclosed. Estimates of potential outcomes of these contingencies are developed in consultation with outside counsel. While this assessment is based upon all available information, litigation is inherently uncertain and the actual liability to fully resolve this litigation cannot be predicted with any assurance of accuracy. Final resolutionIn the event of thesean unfavorable outcome in one or more legal matters, could possibly resultthe ultimate liability may be in significant effectsexcess of amounts currently accrued, if any, and may be material to our operating results or cash flows for a particular quarterly or annual period. However, based on information currently known to us, management believes that the ultimate outcome of all legal contingencies, as they are resolved over time, is not likely to have a material effect on our financial position, results of operations, cash flows and financial position.or liquidity.
Pension benefits
We account for our pension plans in accordance with StatementGAAP, which involves recording a liability or asset based on the projected benefit obligation and the fair value of Financial Accounting Standards No. 87 "Employers Accounting for Pensions" (FAS 87) and Statement of Financial Accounting Standards No. 158, "Employers' Accounting for Defined Benefit Pension and Other Postretirement Plans—an amendment of FASB Statements No. 87, 88, 106, and 132(R)," (FAS 158). In applying FAS 87 and FAS 158, assumptionsplan assets. Assumptions are made
regarding the valuation of benefit obligations and the performance of plan assets. The primary assumptions are as follows:
We determine these assumptions based on consultation with outside actuaries and investment advisors. Any variance in these assumptions could have a significant impact on future recognized pension costs, assets and liabilities.
On October 31, 2011, our Board of Directors voted to cease accruals effective December 31, 2011 under both the Pension Plan and Supplemental Employees Retirement Plan. We recorded a curtailment charge of approximately $1.5 million in the fourth quarter of 2011 in connection with this action. Effective November 1, 2011, we began amortizing the unamortized gains and losses over the remaining life expectancy of the participants instead of our former policy of average remaining service period.
Income taxes
We estimate and use our expected annual effective income tax rates to accrue income taxes. Effective tax rates are determined based on budgeted earnings before taxes, including our best estimate of permanent items that will affect the effective rate for the year. Management periodically reviews these rates with outside tax advisors and changes are made if material variances from expectations are identified.
We recognize deferred taxes for the expected future consequences of events that have been reflected in the consolidated financial statements in accordance with the rules of Statement of Financial Accounting Standards No. 109 "Accounting for Income Taxes" (FAS 109). Under FAS 109, deferredstatements. Deferred tax assets and liabilities are determined based on differences between the book values and tax bases of particular assets and liabilities, using tax rates in effect for the years in which the differences are expected to reverse. A valuation allowance is provided to offset any net deferred tax assets if, based upon the available evidence, it is more likely than not that some or all of the deferred tax assets will not be realized. We consider estimated future taxable income and ongoing prudent tax planning strategies in assessing the need for a valuation allowance.
On January 1, 2007, we adopted the provisions of Financial Interpretation No. 48 "Accounting for Uncertainty in Income Taxes" (FIN 48). The purpose of FIN 48 is to increase the comparability in financial reporting of income taxes. FIN 48 requires that in order for a tax benefit to be booked in the income statement, the item in question must meet the more-likely-than-not (greater than 50% likelihood of being sustained upon examination by the taxing authorities) threshold. The adoption of FIN 48 did not have a material effect on our financial statements. No cumulative effect was booked through beginning retained earnings.
During 2008, we reduced our unrecognized tax benefits by approximately $2.2 million as a result of finalizing federal and state income tax audits. We estimate that it is reasonably possible that a portion of the currently remaining unrecognized tax benefit may be recognized by the end of 2009 as a result of the conclusion of the federal income tax audit. The amount of expense accrued for penalties and interest is $1.1 million worldwide.
As of December 31, 2008, we had gross unrecognized tax benefits of approximately $2.3 million of which, approximately $1.9 million if recognized, would affect the effective tax rate. The difference between the amount of unrecognized tax benefits and the amount that would impact the effective tax rate consists of the federal tax benefit of state income tax items.
New Accounting Standards
In June 2008,2011, the Financial Accounting Standards Board (FASB) issued FASB Staff Position (FSP) EITF Issue No. 03-6-1, "Determining Whether Instruments Granted in Share-Based Payment Transactions Are Participating Securities" (FSP EITF 03-6-1). FSP EITF 03-6-1 requires that unvested share-based payment awards that contain rights to receive non-forfeitable dividends or dividend equivalents to be included in the two-class method of computing earnings per share as described in Statement of Financial Accounting Standards (FAS)Update (ASU) No. 128, "Earnings per Share.2011-05, "Comprehensive Income." This FSP is effectiveASU intends to enhance comparability and transparency of other comprehensive income components. The guidance provides an option to present total comprehensive income, the components of net income and the components of other comprehensive income in a single continuous statement or two separate but consecutive statements. This ASU eliminates the option to present other comprehensive income components as part of the statement of changes in stockholders' equity. The provisions of this ASU will be applied retrospectively for financial statements issued for fiscal yearsinterim and annual periods beginning after December 15, 2008, and interim periods within those years. Accordingly, we will adopt FSP EITF 03-6-1 in fiscal year 2009. The adoption of FSP EITF 03-6-12011. Early application is not expected to have a material impact on our consolidated financial statements.
In May 2008, the FASB issued FAS No. 162, "The Hierarchy of Generally Accepted Principles," (FAS 162), which identifies the sources of accounting principles and the framework for selecting the principles to be used in the preparation of financial statements of nongovernmental entities that are presented in conformity with generally accepted accounting principles (GAAP) in the United States (the GAAP hierarchy). FAS 162 is effective 60 days following the SEC's approval of the Public Company Accounting Oversight Board amendments to AU Section 411, "The Meaning of Present Fairly in Conformity With Generally Accepted Accounting Principles." The adoption of FAS 162 is not expected to have an impact on our consolidated financial statements.
In April 2008, the FASB issued FSP No. FAS 142-3, "Determination of the Useful Life of Intangible Assets." This FSP amends the factors that should be considered in developing renewal or extension assumptions used to determine the useful life of a recognized intangible asset under FAS No. 142, "Goodwill and Other Intangible Assets" (FAS 142). The objective of this FSP is to improve the consistency between the useful life of a recognized intangible asset under FAS 142 and the period
of expected cash flows used to measure the fair value of the asset under FAS 141(R), and other principles of GAAP. This FSP applies to all intangible assets, whether acquired in a business combination or otherwise, and shall bepermitted. We early adopted ASU 2011-05 effective for financial statements issued for fiscal years beginning afterthe year ended December 15, 2008, and interim periods within those fiscal years and applied prospectively to intangible assets acquired after the effective date. Early adoption is prohibited. The adoption of this FSP will not have a significant impact on our consolidated financial statements.
In March 2008, the FASB issued FAS No. 161, "Disclosures about Derivative Instruments and Hedging Activities-an amendment of FASB Statement No. 133," (FAS 161), which expands the current disclosure requirements of FAS 133, "Accounting for Derivative Instruments and Hedging Activities," such that entities must now provide enhanced disclosures on a quarterly basis regarding how and why the entity uses derivatives; how derivatives and related hedged items are accounted for under FAS 133 and how derivatives and related hedged items affect the entity's financial position, performance and cash flow. FAS 161 is effective prospectively for annual and interim periods beginning on or after November 15, 2008. Accordingly, we will adopt FAS 161 in 2009.
In December 2007, the FASB issued FAS No. 141 (R)," Business Combinations," (FAS 141R), which requires most identifiable assets, liabilities, non-controlling interests, and goodwill acquired in a business combination to be recorded at "full fair value." Under FAS 141R, all business combinations will be accounted for under the acquisition method. Significant changes, among others, from current guidance resulting from FAS 141R includes the requirement that contingent assets and liabilities and contingent consideration shall be recorded at estimated fair value as of the acquisition date, with any subsequent changes in fair value charged or credited to earnings. Further, acquisition-related costs will be expensed rather than treated as part of the acquisition. FAS 141R is effective for periods beginning on or after December 15, 2008. We expect the adoption of FAS 141R will increase costs charged to operations made after January 1, 2009.
In December 2007, the FASB issued FAS No. 160, "Non-controlling Interests in Consolidated Financial Statements, an amendment of ARB NO. 151," (FAS 160), which requires non-controlling interests (previously referred to as minority interest) to be treated as a separate component of equity, not outside of equity as is current practice. FAS 160 applies to non-controlling interests and transactions with non-controlling interest holders in consolidated financial statements. FAS 160 is effective for periods beginning on or after December 15, 2008. We do not expect the adoption of FAS 160 will have a material impact on its consolidated financial statements.
In February 2007, the FASB issued FAS No. 159, "The Fair Value Option for Financial Assets and Financial Liabilities—including an Amendment to FAS No. 115," (FAS 159), which permits entities to choose to measure many financial instruments and certain other items at fair value. FAS 159 is effective for financial statements issued for fiscal years beginning after November 15, 2007 and interim periods within those fiscal years. Earlier application is encouraged. We have elected not to measure our eligible financial instruments at fair value and therefore the adoption of FAS 159 did not have an impact on our consolidated financial statements.31, 2011.
In September 2006,2011, accounting guidance was issued by FASB in Accounting Standards Codification (ASC) Topic 350, "Intangibles—Goodwill and Other". This guidance amends the Securities and Exchange Commission issued Staff Accounting Bulletin No. 108, "Considering the Effects of Prior Year Misstatements When Quantifying Misstatements in Current Year Financial Statements" (SAB 108), which provides interpretive guidance on how the effects of the carryover or reversal of prior year misstatements should be considered in quantifying a current year misstatement. SAB 108 is effectiverequirements for fiscal years ending after November 15, 2006. The impact of SAB 108 was not material to our consolidated financial statements.
In September 2006, the FASB issued FAS No. 158, "Employers' Accounting for Defined Benefit Pension and Other Postretirement Plans—an amendment of FASB Statements No. 87, 88, 106, and 132(R)" (FAS 158), which requires an employer to: (a) recognize in its statement of financial position an asset for a plan's overfunded status or a liability for a plan's underfunded status; (b) measure a plan's assets and its obligations that determine its funded status as of the end of the employer's fiscal year; and (c) recognize changes in the funded status of a defined benefit postretirement plan in the
year in which the changes occur. Those changes are reported in other comprehensive income. The requirement to recognize the funded status of a benefit plan and the disclosure requirements are effective as of the end of the fiscal year ending after December 15, 2006 for companies with publicly traded equity securities. The requirement to measure plan assets and benefit obligations as of the date of the employer's fiscal year-end statement of financial position is effective for fiscal years ending after December 15, 2008, although earlier adoption is permitted. As a result of the requirement to recognize the funded status of our benefit plans as of December 31, 2006, we recorded an increase in our pension liability of approximately $8.3 million, a decrease of approximately $1.3 million in other assets: other, net and a decrease in accumulated other comprehensive income of approximately $5.8 million, net of tax. We have early-adopted the measurement date provisions of FAS 158 effective January 1, 2007. Our pension plans previously used a September 30 measurement date. All plans are now measured as of December 31, consistent with our fiscal year end. The non-cash effect of the adoption of the measurement date provisions of FAS 158 was not material and there was no effect on our results of operations.
In September 2006, the FASB issued FAS No. 157, "Fair Value Measurements," (FAS 157), which defines fair value, establishes guidelines for measuring fair value and expands disclosures regarding fair value measurements. FAS 157 does not require any new fair value measurements but rather eliminates inconsistencies in guidance found in various prior accounting pronouncements and was effective for fiscal years beginning after November 15, 2007. In February 2008, the FASB issued FASB FSP 157-2 which delayed the effective date of FAS 157 for all nonfinancial assets and nonfinancial liabilities, except those that are recognized or disclosed at fair value in the financial statements on a recurring basis (at least annually), until fiscal years beginning after November 15, 2008, and interim periods within those fiscal years. These nonfinancial items include assets and liabilities such as reporting units measured at fair value in a goodwill impairment test and nonfinancial assets acquired and liabilities assumed intesting. The Company has the option to first assess qualitative factors to determine whether the existence of events or circumstances leads to a business combination. Effective January 1, 2008, we adopted FAS 157 for financial assets and liabilities recognized at fair value on a recurring basis. The partial adoption of FAS 157 for financial assets and liabilities did not have a material impact on our consolidated financial position, results of operations or cash flows.
In July 2006, the FASB issued Financial Interpretation No. 48, "Accounting for Uncertainty in Income Taxes" (FIN 48), which clarifies the accounting for uncertainty in income taxes recognized in the financial statements in accordance with SFAS No. 109, "Accounting for Income Taxes." FIN 48 providesdetermination that a tax benefit from an uncertain tax position may be recognized when it is more likely than not that the position will be sustained upon examination, based on the technical merits. This interpretation also provides guidance on measurement, de-recognition, classification, interest and penalties, accounting in interim periods, disclosure and transition. We adopted the provisions of FIN 48 as of January 1, 2007 and the impact was not material to our consolidated financial statements.
In March 2006, the FASB issued FAS No. 156, "Accounting for Servicing of Financial Assets—an amendment of FASB Statement No. 140" (FAS 156). FAS 156 amends FAS Statement No. 140, "Accounting for Transfers and Servicing of Financial Assets and Extinguishments of Liabilities," with respect to the accounting for separately recognized servicing assets and servicing liabilities. FAS 156 addresses the recognition and measurement of separately recognized servicing assets and liabilities and provides an approach to simplify efforts to obtain hedge-like (offset) accounting. We adopted FAS 156 as of January 1, 2007 and the impact was not material to our consolidated financial statements.
In February 2006, the FASB issued FAS No. 155, "Accounting for Certain Hybrid Financial Instruments—an amendment of FASB Statements No. 133 and 140" (FAS 155). FAS 155 amends FAS 133, "Accounting for Derivatives and Hedging Activities," and FAS 140, "Accounting for Transfers and Servicing of Financial Assets and Extinguishments of Liabilities," and allows an entity to remeasure at fair value of a hybrid financial instrumentreporting unit is less than its carrying amount. If, after assessing the totality of events or circumstances, the Company determines it is more likely than not that contains an embedded derivative that otherwise would require bifurcation from the host, if the holder irrevocably elects to account for the whole instrument on a fair value basis. Subsequent changes in the fair value of a reporting unit is greater than its carrying amount, then performing the instrument would be recognized intwo-step impairment test is unnecessary. We early adopted this standard for the year ended December 31, 2011.
earnings. We adopted FAS 155 as of January 1, 2007 and the impact was not material to our consolidated financial statements.
Item 7A.QUANTITATIVE AND QUALITATIVE DISCLOSURES ABOUT MARKET RISK.
We use derivative financial instruments primarily to reduce exposure to adverse fluctuations in foreign exchange rates, interest rates and costs of certain raw materials used in the manufacturing process. We do not enter into derivative financial instruments for trading purposes. As a matter of policy, all derivative positions are used to reduce risk by hedging underlying economic exposure. The derivatives we use are instruments with liquid markets. See Note 15 of Notes to the Consolidated Financial Statements in our Annual Report on Form 10-K for the year ended December 31, 2011.
Our consolidated earnings, which are reported in United States dollars, are subject to translation risks due to changes in foreign currency exchange rates. This risk is concentrated in the exchange rate between the U.S. dollar and the euro; the U.S. dollar and the Canadian dollar; and the U.S. dollar and the Chinese yuan.
Our foreign subsidiaries transact most business, including certain intercompany transactions, in foreign currencies. Such transactions are principally purchases or sales of materials and are denominated in European currencies or the U.S. or Canadian dollar. We use foreign currency forward exchange contracts to manage the risk related to intercompany purchases that occur during the course of a year and certain open foreign currency denominated commitments to sell products to third parties. For 2008, the amounts2011, we recorded a $0.6 million gain in other income forassociated with the change in the fair value of such contracts was immaterial.contracts.
We have historically had a low exposure on the cost of our debt to changes in interest rates. Information about our long-term debt including principal amounts and related interest rates appears in Note 11 of notesNotes to the consolidated financial statementsConsolidated Financial Statements in our Annual Report on Form 10-K for the year ended December 31, 2008.2011.
We purchase significant amounts of bronze ingot, brass rod, cast iron, steel and plastic, which are utilized in manufacturing our many product lines. Our operating results can be adversely affected by changes in commodity prices if we are unable to pass on related price increases to our customers. We manage this risk by monitoring related market prices, working with our suppliers to achieve the maximum level of stability in their costs and related pricing, seeking alternative supply sources when necessary and passing increases in commodity costs to our customers, to the maximum extent possible, when they occur.
During 2008, we entered into a series of copper swap contracts to fix the price per pound of copper for one customer. These swaps are classified as economic hedges, as more fully explained in Note 16 of notes to the consolidated financial statements. For the period ended December 31, 2008, we recorded $1.8 million in losses associated with the copper swaps in other expense. We believe that if copper prices continue to decrease that the open copper swap contracts will result in additional losses that may occur in a period different from when that cost is recovered from the customer.
The Company used a discounted cash flow model for determining the value of the ARS and the UBS rights. As there is no active market for the ARS and the rights are non-transferable, we believe that the discounted cash flow model gives the best estimate of fair value at December 31, 2008. The model includes assumptions that are more fully explained in Note 16 of notes to the consolidated financial statements. The most sensitive of these assumptions is the illiquidity spread. We engaged valuation experts to develop the models. The illiquidity spread increases the discount rate, thereby decreasing the estimated fair value. To value the rights issued by UBS, we used a discounted cash flow model to estimate the fair value of the ARS with the rights. The value of the rights was determined by looking at the difference between the ARS as determined compared to the ARS with the rights. While we believe the assumptions used are consistent with the current market view on the ARS and are reasonable, different assumptions could significantly affect our valuation of ARS.
Item 8. FINANCIAL STATEMENTS AND SUPPLEMENTARY DATA.
The financial statements listed in section (a) (1) of "Part IV, Item 15. Exhibits and Financial Statement Schedules" of this annual report are incorporated herein by reference.
Item 9. CHANGES IN AND DISAGREEMENTS WITH ACCOUNTANTS ON ACCOUNTING AND FINANCIAL DISCLOSURE.
None.
Item 9A.CONTROLS AND PROCEDURES.
As required by Rule 13a-15(b) under the Securities Exchange Act of 1934, as amended, or Exchange Act, as of the end of the period covered by this report, we carried out an evaluation under the supervision and with the participation of our management, including our Chief Executive Officer and Chief Financial Officer, of the effectiveness of our disclosure controls and procedures. In designing and evaluating our disclosure controls and procedures, we recognize that any controls and procedures, no matter how well designed and operated, can provide only reasonable assurance of achieving the desired control objectives, and our management necessarily applies its judgment in evaluating and implementing possible controls and procedures. The effectiveness of our disclosure controls and procedures is also necessarily limited by the staff and other resources available to us and the geographic diversity of our operations. Based upon that evaluation, the Chief Executive Officer and
Chief Financial Officer concluded that, as of the end of the period covered by this report, our disclosure controls and procedures were effective, in that they provide reasonable assurance that information required to be disclosed by us in the reports we file or submit under the Exchange Act is recorded, processed, summarized and reported within the time periods specified in the Securities and Exchange Commission's rules and forms and are designed to ensure that information required to be disclosed by us in the reports that we file or submit under the Exchange Act are accumulated and communicated to our management, including our Chief Executive Officer and Chief Financial Officer, as appropriate to allow timely decisions regarding required disclosure.
There was no change in our internal control over financial reporting that occurred during the quarter ended December 31, 2008,2011, that has materially affected, or is reasonably likely to materially affect, our internal control over financial reporting. In connection with these rules, we will continue to review and document our disclosure controls and procedures, including our internal control over financial reporting, and may from time to time make changes aimed at enhancing their effectiveness and to ensure that our systems evolve with our business.
Management's Annual Report on Internal Control Over Financial Reporting
Management of the Company is responsible for establishing and maintaining adequate internal control over financial reporting as defined in Rules 13a-15(f) and 15d-15(f) under the Securities Exchange Act of 1934. The Company's internal control over financial reporting is designed to provide reasonable assurance regarding the reliability of financial reporting and the preparation of financial statements for external purposes in accordance with generally accepted accounting principles. The Company's internal control over financial reporting includes those policies and procedures that:
Because of its inherent limitations, internal control over financial reporting may not prevent or detect misstatements. Also, projections of any evaluation of effectiveness to future periods are subject to the risk that controls may become inadequate because of changes in conditions, or that the degree of compliance with the policies or procedures may deteriorate.
Management, including our Chief Executive Officer and Chief Financial Officer, assessed the effectiveness of the Company's internal control over financial reporting as of December 31, 2008.2011. In making this assessment, management used the criteria set forth by the Committee of Sponsoring Organizations of the Treadway Commission (COSO) in Internal Control—Integrated Framework.
Based on our assessment and those criteria, management believes that the Company maintained effective internal control over financial reporting as of December 31, 2008.2011.
On April 29, 2011, the Company completed its acquisition of Danfoss Socla S.A.S. and the related water controls business of certain other entities controlled by Danfoss A/S in a share and asset purchase transaction (collectively, "Socla"). The audited consolidated financial statements of the Company include the results of Blücher Metal A/SSocla, including total assets of $206 million and its subsidiaries, which the Company acquired on May 30, 2008,total revenues of $95 million, but management's assessment does not include an assessment of the internal controlcontrols over financial reporting of these entities.Socla.
The independent registered public accounting firm that audited the Company's consolidated financial statements included elsewhere in this Annual Report on Form 10-K has issued an attestationaudit report on the Company's internal control over financial reporting. That report appears immediately following this report.
Report of Independent Registered Public Accounting Firm
The Board of Directors and Stockholders
Watts Water Technologies, Inc.:
We have audited Watts Water Technologies, Inc.'s internal control over financial reporting as of December 31, 2008,2011, based on criteria established inInternal Control—Integrated Framework issued by the Committee of Sponsoring Organizations of the Treadway Commission (COSO). Watts Water Technologies, Inc.'s management is responsible for maintaining effective internal control over financial reporting and for its assessment of the effectiveness of internal control over financial reporting, included in the accompanyingManagement's Annual Report on Internal Control Over Financial Reporting. Our responsibility is to express an opinion on the Company's internal control over financial reporting based on our audit.
We conducted our audit in accordance with the standards of the Public Company Accounting Oversight Board (United States). Those standards require that we plan and perform the audit to obtain reasonable assurance about whether effective internal control over financial reporting was maintained in all material respects. Our audit included obtaining an understanding of internal control over financial reporting, assessing the risk that a material weakness exists, and testing and evaluating the design and operating effectiveness of internal control based on the assessed risk. Our audit also included performing such other procedures as we considered necessary in the circumstances. We believe that our audit provides a reasonable basis for our opinion.
A company's internal control over financial reporting is a process designed to provide reasonable assurance regarding the reliability of financial reporting and the preparation of financial statements for external purposes in accordance with generally accepted accounting principles. A company's internal control over financial reporting includes those policies and procedures that (1) pertain to the maintenance of records that, in reasonable detail, accurately and fairly reflect the transactions and dispositions of the assets of the company; (2) provide reasonable assurance that transactions are recorded as necessary to permit preparation of financial statements in accordance with generally accepted accounting principles, and that receipts and expenditures of the company are being made only in accordance with authorizations of management and directors of the company; and (3) provide reasonable assurance regarding prevention or timely detection of unauthorized acquisition, use, or disposition of the company's assets that could have a material effect on the financial statements.
Because of its inherent limitations, internal control over financial reporting may not prevent or detect misstatements. Also, projections of any evaluation of effectiveness to future periods are subject to the risk that controls may become inadequate because of changes in conditions, or that the degree of compliance with the policies or procedures may deteriorate.
In our opinion, Watts Water Technologies, Inc. maintained, in all material respects, effective internal control over financial reporting as of December 31, 2008,2011, based on criteria established inInternal Control—Integrated Framework issued by the Committee of Sponsoring Organizations of the Treadway Commission.
Watts Water Technologies, Inc. acquired Blücher MetalDanfoss Socla S.A.S and the related water controls business of certain other entities controlled by Danfoss A/S and subsidiaries(collectively Socla) during 2008,2011, and management excluded from its assessment of the effectiveness of Watts Water Technologies, Inc.'s internal control over financial reporting as of December 31, 2008, Blücher Metal A/S and subsidiaries'2011, Socla's internal control over financial reporting associated with total assets of $190.3$206 million and total revenues of $50.8$95 million included in the consolidated financial statements of Watts Water Technologies, Inc. and subsidiaries as of and for the year ended December 31, 2008.2011. Our audit of internal control over financial reporting of Watts Water Technologies, Inc. also excluded an evaluation of the internal control over financial reporting of Blücher Metal A/S and subsidiaries.Socla.
We also have audited, in accordance with the standards of the Public Company Accounting Oversight Board (United States), the consolidated balance sheets of Watts Water Technologies, Inc. and subsidiaries as of December 31, 20082011 and 2007,2010, and the related consolidated statements of operations,
comprehensive income, stockholders' equity and cash flows for each of the years in the three-year period ended December 31, 2008,2011, and our report dated February 27, 200928, 2012 expressed an unqualified opinion on those consolidated financial statements.
![]()
Boston, Massachusetts
February 27, 200928, 2012
None.
Item 10. DIRECTORS, EXECUTIVE OFFICERS AND CORPORATE GOVERNANCE.
Information with respect to the executive officers of the Company is set forth in Part I, Item 1 of this Report under the caption "Executive Officers and Directors" and is incorporated herein by reference. The information provided under the captions "Information as to Nominees for Director," "Corporate Governance," and "Section 16(a) Beneficial Ownership Reporting Compliance" in our definitive Proxy Statement for our 20092012 Annual Meeting of Stockholders to be held on May 13, 200916, 2012 is incorporated herein by reference.
We have adopted a Code of Business Conduct and Ethics applicable to all officers, employees and Board members. The Code of Business Conduct and Ethics is posted in the Investor Relations section of our website,www.wattswater.com. We will provide you with a print copy of our Code of Business Conduct and Ethics free of charge on written request to Kenneth R. Lepage, Secretary, Watts Water Technologies, Inc., 815 Chestnut Street, North Andover, MA 01845. Any amendments to, or waivers of, the Code of Business Conduct and Ethics which apply to our chief executive officer, chief financial officer, corporate controller or any person performing similar functions will be disclosed on our website promptly following the date of such amendment or waiver.
Item 11.EXECUTIVE COMPENSATION.
The information provided under the captions "Director Compensation," "Corporate Governance," "Compensation Discussion and Analysis," "Executive Compensation," "Compensation Committee Interlocks and Insider Participation," and "Compensation Committee Report" in our definitive Proxy Statement for our 20092012 Annual Meeting of Stockholders to be held on May 13, 200916, 2012 is incorporated herein by reference.
The "Compensation Committee Report" contained in our Proxy Statement shall not be deemed "soliciting material" or "filed" with the Securities and Exchange Commission or otherwise subject to the liabilities of Section 18 of the Securities Exchange Act of 1934, nor shall it be deemed incorporated by reference in any filings under the Securities Act of 1933 or the Exchange Act, except to the extent we specifically request that such information be treated as soliciting material or specifically incorporate such information by reference into a document filed under the Securities Act or Exchange Act.
Item 12. SECURITY OWNERSHIP OF CERTAIN BENEFICIAL OWNERS AND MANAGEMENT AND RELATED STOCKHOLDER MATTERS.
The information appearing under the caption "Principal Stockholders" in the Registrant'sour definitive Proxy Statement relating to the 2009for our 2012 Annual Meeting of Stockholders to be held on May 13, 200916, 2012 is incorporated herein by reference.
Securities Authorized for Issuance Under Equity Compensation Plans
The following table provides information as of December 31, 2008,2011, about the shares of Class A Common Stock that may be issued upon the exercise of stock options issued under the Company's 2004 Stock Incentive Plan, 1991 Directors' Non-Qualified Stock Option Plan, 1996 Stock Option Plan and 2003 Non-Employee Directors' Stock Option Plan and the settlement of restricted stock units granted
granted under our Management Stock Purchase Plan as well as the number of shares remaining for future issuance under our 2004 Stock Incentive Plan and Management Stock Purchase Plan.
| | Equity Compensation Plan Information | | |||||||||||||||||||||||||||||||||||||||||||||||||||||||||||||||||||||||||||||||||||||||||||||||||||||||||||||||||||||||||||||||||||||||||||||||||||||||||||||||||||||||||||||||||||||||||||||||||||||||||||||||||||||||||||||||||||||||||||||||||||||||||||||||||||||||||||||||||||||||||||||||||||||||||||||||||||||||||||||||||||||||||||||||||||||||||||||||||||||||||||||||||||||||||||||||||||||||||||||||||||||||||||||||||||||||||||||||||||||||||||||||||||||||||||||||||||||||||||||||||||||||||||||||||||||||||||||||||||||||||||||||||||||||||||||||||||||||||||||||||||||||||||||||||||||||||||||||||||||||||||||||||||||||||||||||||||||||||||||||||||||||||||||||||||||||||||||||||||||||||||||||||||||||||||||||||||||||||||||||||||||||||||||||||||||||||||||||||||||||||||||||||||||||||||||||||||||||||||||||||||||||||||||||||||||||||||||||||||||||||||||||||||||||||||||||||||||||||||||||||||||||||||||||||||||||||||||||||||||||||||||||||||||||||||||||||||||||||||||||||||||||||||||||||||||||||||||||||||||
|---|---|---|---|---|---|---|---|---|---|---|---|---|---|---|---|---|---|---|---|---|---|---|---|---|---|---|---|---|---|---|---|---|---|---|---|---|---|---|---|---|---|---|---|---|---|---|---|---|---|---|---|---|---|---|---|---|---|---|---|---|---|---|---|---|---|---|---|---|---|---|---|---|---|---|---|---|---|---|---|---|---|---|---|---|---|---|---|---|---|---|---|---|---|---|---|---|---|---|---|---|---|---|---|---|---|---|---|---|---|---|---|---|---|---|---|---|---|---|---|---|---|---|---|---|---|---|---|---|---|---|---|---|---|---|---|---|---|---|---|---|---|---|---|---|---|---|---|---|---|---|---|---|---|---|---|---|---|---|---|---|---|---|---|---|---|---|---|---|---|---|---|---|---|---|---|---|---|---|---|---|---|---|---|---|---|---|---|---|---|---|---|---|---|---|---|---|---|---|---|---|---|---|---|---|---|---|---|---|---|---|---|---|---|---|---|---|---|---|---|---|---|---|---|---|---|---|---|---|---|---|---|---|---|---|---|---|---|---|---|---|---|---|---|---|---|---|---|---|---|---|---|---|---|---|---|---|---|---|---|---|---|---|---|---|---|---|---|---|---|---|---|---|---|---|---|---|---|---|---|---|---|---|---|---|---|---|---|---|---|---|---|---|---|---|---|---|---|---|---|---|---|---|---|---|---|---|---|---|---|---|---|---|---|---|---|---|---|---|---|---|---|---|---|---|---|---|---|---|---|---|---|---|---|---|---|---|---|---|---|---|---|---|---|---|---|---|---|---|---|---|---|---|---|---|---|---|---|---|---|---|---|---|---|---|---|---|---|---|---|---|---|---|---|---|---|---|---|---|---|---|---|---|---|---|---|---|---|---|---|---|---|---|---|---|---|---|---|---|---|---|---|---|---|---|---|---|---|---|---|---|---|---|---|---|---|---|---|---|---|---|---|---|---|---|---|---|---|---|---|---|---|---|---|---|---|---|---|---|---|---|---|---|---|---|---|---|---|---|---|---|---|---|---|---|---|---|---|---|---|---|---|---|---|---|---|---|---|---|---|---|---|---|---|---|---|---|---|---|---|---|---|---|---|---|---|---|---|---|---|---|---|---|---|---|---|---|---|---|---|---|---|---|---|---|---|---|---|---|---|---|---|---|---|---|---|---|---|---|---|---|---|---|---|---|---|---|---|---|---|---|---|---|---|---|---|---|---|---|---|---|---|---|---|---|---|---|---|---|---|---|---|---|---|---|---|---|---|---|---|---|---|---|---|---|---|---|---|---|---|---|---|---|---|---|---|---|---|---|---|---|---|---|---|---|---|---|---|---|---|---|---|---|---|---|---|---|---|---|---|---|---|---|---|---|---|---|---|---|---|---|---|---|---|---|---|---|---|---|---|---|---|---|---|---|---|---|---|---|---|---|---|---|---|---|---|---|---|---|---|---|---|---|---|---|---|---|---|---|---|---|---|---|---|---|---|---|---|---|---|---|---|---|---|---|---|---|---|---|---|---|---|---|---|---|---|---|---|---|---|---|---|---|---|---|---|---|---|---|---|---|---|---|---|---|---|---|---|---|---|---|---|---|---|---|---|---|---|---|---|---|---|---|---|---|---|---|---|---|---|---|---|---|---|---|---|---|---|---|---|---|---|---|---|---|---|---|---|---|---|---|---|---|---|---|---|---|---|---|---|---|---|---|---|---|---|---|---|---|---|---|---|---|---|---|---|---|---|---|---|---|---|---|---|---|---|---|---|---|---|---|---|---|---|---|---|---|---|---|---|---|---|---|---|---|---|---|---|---|---|---|---|---|---|---|---|---|---|---|---|---|---|---|---|---|---|---|---|---|---|---|---|---|---|---|---|---|---|---|---|---|---|---|---|---|---|---|---|---|---|---|---|---|---|---|---|---|---|---|---|---|---|---|---|---|---|---|---|---|---|---|---|---|---|---|---|---|---|---|---|---|---|---|---|---|---|---|---|---|---|---|---|---|---|---|---|---|---|---|---|---|---|---|---|---|---|---|---|---|---|---|---|---|---|---|---|---|---|---|---|---|---|---|---|---|---|---|---|---|---|---|---|---|---|---|---|---|---|---|---|---|---|---|---|---|---|---|---|---|---|---|---|---|---|---|---|---|---|---|---|---|---|---|---|---|---|---|---|---|---|---|---|---|---|---|---|---|---|---|---|---|---|---|---|---|---|---|---|---|---|---|---|---|---|---|---|---|---|---|---|---|---|---|---|---|---|---|---|---|---|
| | Number of securities remaining available for future issuance under equity compensation plan (excluding securities reflected in column (a)) (c) | ||||||||||||||||||||||||||||||||||||||||||||||||||||||||||||||||||||||||||||||||||||||||||||||||||||||||||||||||||||||||||||||||||||||||||||||||||||||||||||||||||||||||||||||||||||||||||||||||||||||||||||||||||||||||||||||||||||||||||||||||||||||||||||||||||||||||||||||||||||||||||||||||||||||||||||||||||||||||||||||||||||||||||||||||||||||||||||||||||||||||||||||||||||||||||||||||||||||||||||||||||||||||||||||||||||||||||||||||||||||||||||||||||||||||||||||||||||||||||||||||||||||||||||||||||||||||||||||||||||||||||||||||||||||||||||||||||||||||||||||||||||||||||||||||||||||||||||||||||||||||||||||||||||||||||||||||||||||||||||||||||||||||||||||||||||||||||||||||||||||||||||||||||||||||||||||||||||||||||||||||||||||||||||||||||||||||||||||||||||||||||||||||||||||||||||||||||||||||||||||||||||||||||||||||||||||||||||||||||||||||||||||||||||||||||||||||||||||||||||||||||||||||||||||||||||||||||||||||||||||||||||||||||||||||||||||||||||||||||||||||||||||||||||||||||||||||||||||||||||||
Item 13. CERTAIN RELATIONSHIPS AND RELATED TRANSACTIONS, AND DIRECTOR INDEPENDENCE. The information provided under the captions "Corporate Governance" and Item 14. PRINCIPAL ACCOUNTANT FEES AND SERVICES. The information provided under the caption "Ratification of Independent Registered Public Accounting Firm" in our definitive Proxy Statement for our Item 15. EXHIBITS AND FINANCIAL STATEMENT SCHEDULES. (a)(1) Financial Statements The following financial statements are included in a separate section of this Report commencing on the page numbers specified below:
(a)(2) Schedules
All other required schedules for which provision is made in the applicable accounting regulations of the Securities and Exchange Commission are included in the Notes to the Consolidated Financial Statements. (a)(3) Exhibits The exhibits listed in the Exhibit Index immediately preceding the exhibits are filed as part of this Annual Report on Form 10-K. Pursuant to the requirements of Section 13 or 15(d) of the Securities Exchange Act of 1934, the registrant has duly caused this report to be signed on its behalf by the undersigned, thereunto duly authorized.
Pursuant to the requirements of the Securities Exchange Act of 1934, this report has been signed below by the following persons on behalf of the registrant and in the capacities and on the dates indicated.
The Board of Directors and Stockholders We have audited the accompanying consolidated balance sheets of Watts Water Technologies, Inc. and subsidiaries as of December 31, We conducted our audits in accordance with the standards of the Public Company Accounting Oversight Board (United States). Those standards require that we plan and perform the audit to obtain reasonable assurance about whether the financial statements are free of material misstatement. An audit includes examining, on a test basis, evidence supporting the amounts and disclosures in the financial statements. An audit also includes assessing the accounting principles used and significant estimates made by management, as well as evaluating the overall financial statement presentation. We believe that our audits provide a reasonable basis for our opinion. In our opinion, the consolidated financial statements referred to above present fairly, in all material respects, the financial position of Watts Water Technologies, Inc. and subsidiaries as of December 31,
We also have audited, in accordance with the standards of the Public Company Accounting Oversight Board (United States), Watts Water Technologies, Inc.'s internal control over financial reporting as of December 31,
Boston, Massachusetts
The accompanying notes are an integral part of these consolidated financial statements.
The accompanying notes are an integral part of these consolidated financial statements.
The accompanying notes are an integral part of these consolidated financial statements.
The accompanying notes are an integral part of these consolidated financial statements.
The accompanying notes are an integral part of these consolidated financial statements.
(1) Description of Business Watts Water Technologies, Inc. (the Company) designs, manufactures and sells an extensive line of water safety and flow control products primarily for the water quality, water conservation, water safety and water flow control markets located predominantly in North America and Europe (2) Accounting Policies Principles of Consolidation The consolidated financial statements include the accounts of the Company and its majority and wholly owned subsidiaries. Upon consolidation, all significant intercompany accounts and transactions are eliminated. Cash Equivalents Cash equivalents consist of Investment Securities Investment securities at December 31, Trading securities are recorded at fair value. The Company determines the fair value by obtaining market value when available from quoted prices in active markets. In the absence of quoted prices, the Company uses other inputs to determine the fair value of the investments. All changes in the fair value as well as any realized gains and losses from the sale of the securities are recorded when incurred to the
Allowance for Doubtful Accounts Allowance for doubtful accounts includes reserves for bad debts, Concentration of Credit The Company sells products to a diversified customer base and, therefore, has no significant concentrations of credit
Inventories Inventories are stated at the lower of cost (using primarily the first-in, first-out method) or market. Market value is determined by replacement cost or net realizable value. Historical
Notes to Consolidated Financial Statements (Continued) (2) Accounting Policies (Continued) Assets Held for Sale The Company accounts for assets held for sale when management has committed to a plan to sell the asset or group of assets, is actively marketing the asset or group of assets, the asset or group of assets can be sold in its current condition in a reasonable period of time and the plan is not expected to change. As of December 31, 2011, the Company was actively marketing two properties. In 2010, the Company recorded estimated losses of $1.0 million to reduce these assets to their estimated fair value, less any costs to sell. These amounts are recorded as a component of restructuring and other costs in the consolidated statements of operations. See Note 4 for additional information associated with the Company's restructuring charges. Goodwill and Other Intangible Assets Goodwill is recorded when the consideration paid for acquisitions exceeds the fair value of net tangible and intangible assets acquired. Goodwill and other intangible assets with indefinite useful lives are not amortized, but rather are tested annually for impairment. The test was performed as of October Impairment of Goodwill and Long-Lived Assets The changes in the carrying amount of goodwill by geographic segment are as follows:
Goodwill
Notes to Consolidated Financial Statements (Continued) (2) Accounting The Intangible assets with estimable lives and other long-lived assets are reviewed for impairment whenever events or changes in circumstances indicate that the carrying amount of an asset or asset group may not be
Intangible assets include the following:
Aggregate amortization expense for amortized intangible assets for In 2011, the Company determined that the prospects for Austroflex Rohr-Isoliersysteme GmbH (Austroflex), part of our Europe segment, were lower than originally estimated due to current
Notes to Consolidated Financial Statements (Continued) (2) Accounting Policies (Continued) operating profits being below plan and tempered future growth expectations. Accordingly, the Company performed an evaluation of the asset group utilizing the undiscounted cash flows and determined the carrying value of the assets were no longer recoverable. The Company performed a fair value assessment and, as a result, wrote down the long-lived assets, including customer relationships, trade names, and property, plant and equipment, by $14.8 million. Fair value was based on discounted cash flows using market participant assumptions and utilized an estimated weighted average cost of capital. Adjustments to indefinite-lived intangible assets during the year ended December 31, 2011 relate primarily to recording the value of an additional trade name in connection with the acquisition of Danfoss Socla S.A.S (Socla) offset by an impairment of certain trade names in our European and North America segments and a reassessment of $6.1 million of trade names in our North America and Europe segments to amortizable intangibles. Property, Plant and Equipment Property, plant and equipment are recorded at cost. Depreciation is provided on a straight-line basis over the estimated useful lives of the assets, which range from 10 to 40 years for buildings and improvements and 3 to 15 years for machinery and equipment. Taxes, Other than Income Taxes Taxes assessed by governmental authorities on sale transactions are recorded on a net basis and excluded from sales, in the Company's consolidated statements of operations. Income Taxes Income taxes are accounted for under the asset and liability method. Deferred tax assets and liabilities are recognized for the future tax consequences attributable to differences between the financial statement carrying amounts of existing assets and liabilities and their respective tax bases and operating loss and tax credit carry forwards. Deferred tax assets and liabilities are measured using enacted tax rates expected to apply to taxable income in the years in which those temporary differences are expected to be recovered or settled. The effect on deferred tax assets and liabilities of a change in tax rates is recognized in income in the period that includes the enactment date.
As of December 31,
Notes to Consolidated Financial Statements (Continued) (2) Accounting Policies (Continued) A reconciliation of the beginning and ending amount of unrecognized tax benefits and
The Company accounts for interest and penalties related to uncertain tax positions as a component of income tax expense. The statute of limitations in our major jurisdictions is open in the U.S. for the year Foreign Currency Translation The financial statements of subsidiaries located outside the United States generally are measured using the local currency as the functional currency. Balance sheet accounts, including goodwill, of foreign subsidiaries are translated into United States dollars at year-end exchange rates. Income and expense items are translated at weighted average exchange rates for each period. Net translation gains or losses are included in other comprehensive income, a separate component of stockholders' equity. The Company does not provide for U.S. income taxes on foreign currency translation adjustments since it does not provide for such taxes on undistributed earnings of foreign subsidiaries. Gains and losses from foreign currency transactions of these subsidiaries are included in net earnings. Stock-Based Compensation and Chief Executive Officer Separation Costs At December 31, 2011, the Company had three stock-based compensation plans with total unrecognized compensation costs related to
Notes to Consolidated Financial Statements (Continued) (2) Accounting Policies (Continued)
On January 26, 2011, Patrick S. O'Keefe resigned from his positions as Chief Executive Officer, President and Director. Pursuant to a separation agreement, the Company recorded a charge of $6.3 million consisting of $3.3 million in expected cash severance and a non-cash charge of $3.0 million for the modification of stock options and restricted stock awards. Net Income Per Common Share Basic net income per common share is calculated by dividing net income by the weighted average number of common shares outstanding. The calculation of diluted income per share assumes the conversion of all dilutive securities (see Note 13). Net income and number of shares used to compute net income per share, basic and assuming full dilution, are reconciled below:
The computation of diluted net income per share for the years ended December 31, On August 2, 2011 the Board of Directors authorized a stock repurchase program. Under the program, the Company was authorized to repurchase up to one million shares of our Class A Common Stock. During the
In the normal course of business, the Company manages risks associated with commodity prices, foreign exchange rates and interest rates through a variety of strategies, including the use of hedging transactions, executed in accordance with the Company's policies. The Company's hedging transactions include, but are not limited to, the use of various derivative financial and commodity instruments. As a matter of policy, the Company does not use derivative instruments unless there is an underlying exposure. Any change in value of the derivative instruments would be substantially offset by an opposite change in the value of the underlying hedged items. The Company does not use derivative instruments for trading or speculative purposes.
Notes to Consolidated Financial Statements (Continued) (2) Accounting Policies (Continued)
If a fair value or cash flow hedge were to cease to qualify for hedge accounting or be terminated, it would continue to be carried on the balance sheet at fair value until settled, but hedge accounting would be discontinued prospectively. If a forecasted transaction Foreign currency derivatives include forward foreign exchange contracts primarily for Canadian dollars. Metal derivatives Portions of the Company's outstanding debt are exposed to interest rate risks. The Company monitors its interest rate exposures on an ongoing basis to maximize the overall effectiveness of its interest rates. Fair Value Measurements Fair value is defined as the exchange price that would be received for an asset or paid to transfer a liability (an exit price) in the principal or most advantageous market for the asset or liability in an orderly transaction between market participants on the measurement date. An entity is required to maximize the use of observable inputs, where available, and minimize the use of unobservable inputs when measuring fair value. The Company
Notes to Consolidated Financial Statements (Continued) (2) Accounting Policies (Continued) Assets and liabilities subject to this hierarchy are classified in their entirety based on the lowest level of Shipping and Handling Shipping and handling costs included in selling, general and administrative expense amounted to Research and Development Research and development costs included in selling, general, and administrative expense amounted to Revenue Recognition The Company recognizes revenue when all of the following criteria have been met: the Company has entered into a binding agreement, the product has been shipped and title passes, the sales price to the customer is fixed or is determinable, and collectability is reasonably assured. Provisions for
estimated returns and allowances are made at the time of sale, and are recorded as a reduction of sales and included in the allowance for doubtful accounts in the Consolidated Balance Sheets. The Company records provisions for sales incentives (primarily volume rebates), as an adjustment to net sales, at the time of sale based on estimated purchase targets. Basis of Presentation Certain amounts in Estimates The preparation of financial statements in conformity with accounting principles generally accepted in the United States requires management to make estimates and assumptions that affect the reported amounts of assets and liabilities and disclosure of contingent assets and liabilities at the date of the financial statements and the reported amounts of revenues and expenses during the reporting period. Actual results could differ from those estimates. New Accounting Standards In June
Notes to Consolidated Financial Statements (Continued) (2) Accounting Policies (Continued)
In September 2011, accounting guidance was issued by FASB in ASC Topic 350, "Intangibles—Goodwill and Other". This guidance amends the requirements for goodwill impairment testing. The Company has the option to first assess qualitative factors to determine whether the existence of events or circumstances leads to a determination that it is more likely than not that the fair value of a reporting unit is less than its carrying amount. If, after assessing the totality of events or circumstances, the Company determines it is more likely than not that the fair value of a reporting unit is greater than its carrying amount, then performing the two-step impairment test is unnecessary. The Company early adopted this (3) Discontinued Operations In the first quarter of 2010, the Company recorded an estimated reserve of $5.3 million in discontinued operations in connection with its investigation of potential violations of the Foreign Corrupt Practices Act (FCPA) at Watts Valve (Changsha) Co., Ltd. (CWV), a former indirect wholly-owned subsidiary of the Company in China. On October 13, 2011, the Company entered into a settlement for $3.8 million with the Securities and Exchange Commission to resolve allegations concerning potential violations of the FCPA at CWV. (See Note 14) In May 2009, the Company liquidated its TEAM business, located in Ammanford, U.K. TEAM custom designed and manufactured manipulated pipe and hose tubing assemblies and served the heating, ventilation and air conditioning and automotive markets in Western Europe. Management determined the business no longer fit strategically with the Company and that a sale of TEAM was not feasible. On May 22, 2009, the Company appointed an administrator for TEAM under the United Kingdom Insolvency Act of 1986. During the administration process, the administrator had sole control over, and responsibility for, TEAM's operations, assets and liabilities. The Company deconsolidated TEAM when the administrator obtained control of TEAM. The deconsolidation resulted in the recognition of a $18.1 million pre-tax non-cash loss. The Company evaluated the operations of TEAM and determined that it would not have a
Notes to Consolidated Financial Statements (Continued)
The Company did not recognize any tax benefits on the write down of net assets of CWV as the Company
Revenues reported in
The
The
Notes to Consolidated Financial Statements (Continued) (4) Restructuring and Other program. The Company accounts for these costs in the period that the individual employees are notified or the liability is incurred. These costs are included in restructuring and other charges in the Company's consolidated statements of operations. In 2011, the Board approved an integration program in association with the acquisition of Socla. The program was designed to integrate certain operations and management structures in the Watts and Socla organizations with a total estimated pre-tax cost of $6.4 million with costs being incurred through 2012. As of December 31, 2011, the Company revised its forecast to $5.1 million due to reduced expected severance costs. During A summary of the pre-tax cost by restructuring program is as follows:
The Company recorded net pre-tax restructuring and other charges in its business segments as follows:
Notes to Consolidated Financial Statements (Continued) (4) Restructuring and Other Charges, Net (Continued) Also, during 2011, the Company recorded a tax charge of $1.1 million related to restructuring in France offset by a tax benefit of $4.2 million realized in connection with the disposition of TWVC. 2011 Actions The following table summarizes the total expected, incurred and remaining pre-tax costs for the 2011 Socla integration program:
The Company expects to spend the remaining costs by the end of 2012. Details of the Company's 2011 Socla integration reserves for the year ended December 31, 2011 are as follows:
The Company expects to exhaust the remaining reserve by mid-2012. The following table summarizes expected, incurred and remaining costs for 2011 Socla integration actions by type:
2010 Actions On February 8, 2010, the Board approved a restructuring program with respect to the Company's operating facilities
Notes to Consolidated Financial Statements (Continued) (4) Restructuring and Other The Company recorded certain severance costs related to this program in 2009 as the amounts related to contractual or statutory obligations. This program is complete. On September 13, 2010, the Board approved a restructuring program with respect to certain of the Company's The following table summarizes the
Details of the Company's
Notes to Consolidated Financial Statements (Continued) (4) Restructuring and Other Charges, Net (Continued) The following table summarizes expected, incurred and remaining costs for the Company's 2010 Europe and North America footprint consolidation-restructuring actions by type:
2009 Actions In February 2009, the Board approved a plan to consolidate its manufacturing footprint in North America and Asia. The final plan provided for the closure of two plants, with those operations being moved to existing facilities in either North America or Asia or relocated to a new central facility in the United States. The project was completed in 2010. The following table summarizes the total estimated pre-tax charges expected, incurred and remaining cost for the footprint consolidation- restructuring program initiated in 2009 by the Company's reportable segments:
Details of the Company's footprint consolidation-restructuring program through December 31, 2010 are as follows:
Notes to Consolidated Financial Statements (Continued) (5) Business Acquisitions and Disposition Socla On Socla is a manufacturer of water protection valves and flow control solutions for the water market and the The Company is accounting for the transaction as a business
The purchase price allocation for the acquisition noted above is preliminary pending the final determinations of fair values of intangible assets and certain assumed assets and liabilities. The consolidated
Notes to Consolidated Financial Statements (Continued) (5) Business Acquisitions and Disposition (Continued) Supplemental pro-forma information (unaudited) Had the Company completed the acquisition of Socla at the beginning of 2010, net sales, net income from continuing operations and earnings per share from continuing operations would have been as follows:
Net income from continuing operations for the year ended December 31, 2011 and December 31, 2010 was adjusted to include $0.7 million and $2.1 million, respectively, of net interest expense related to the financing and $0.8 million and $2.3 million, respectively, of net amortization expense resulting from the estimated allocation of purchase price to amortizable tangible and intangible assets. Net income from continuing operations for the year ended December 31, 2011 and December 31, 2010 was also adjusted to exclude $4.3 million and $1.5 million, respectively, of net acquisition-related charges and third-party costs. Austroflex On June 28, 2010, the Company acquired 100% of the outstanding stock of Austroflex for approximately $33.7 million. Austroflex is an Austrian-based manufacturer of pre-insulated flexible pipe systems for district heating, solar applications and under-floor radiant heating systems. The acquisition of Austroflex provides the Company with a full range of pre-insulated PEX tubing, pre-insulated solar tubes, under-floor heating insulation, and distribution capability and positions the Company as a major supplier of pre-insulated pipe systems in Europe. The Company completed a purchase price allocation that resulted in the recognition of $17.2 million of intangible assets and $12.3 million of goodwill. Intangible assets were BRAE On April 13, 2010, the Company acquired 100% of the outstanding stock of BRAE located in Oakboro, North Carolina for up to $5.3 million, net of cash acquired. Of the total purchase price, $0.5 million was paid at closing and the remaining $4.8 million is contingent upon BRAE achieving a certain performance metric during the year ending December 31, 2014, which, to the extent achieved, is expected to be paid in cash in 2015. The Company recognized a liability of $1.9 million as an estimate of the acquisition date fair value of the contingent consideration, based on the net present value of $3.7 million which is derived from the weighted probability of achievement of the performance metric as of the date of the acquisition. Failure to meet the performance metric would reduce this liability to $0,
Notes to Consolidated Financial Statements (Continued) (5) Business Acquisitions and Disposition (Continued) while complete achievement would increase this liability to the full remaining purchase price of $4.8 million. Any change in the fair value of the acquisition-related contingent consideration subsequent to the acquisition date is recognized in earnings in the period the estimated fair value changes. The excess fair value of the consideration transferred over the fair value of the net assets acquired of $2.7 million was allocated to goodwill and The In March 2010, in connection with the Company's manufacturing footprint consolidation, the Company closed the operations of Tianjin Watts valve Company Ltd. (TWVC) and relocated its manufacturing to other facilities. On April 12, 2010, the Company signed a definitive equity transfer agreement with a third party to sell the Company's equity ownership and remaining assets of TWVC. The sale was finalized in the fourth quarter of 2011. The Company received net proceeds of approximately $6.1 million from the sale. The Company recognized a net pre-tax gain of $7.7 million and an after-tax gain of approximately $11.4 million, or $0.30 per share, relating mainly to the recognition of a cumulative translation adjustment and a tax benefit related to the reversal of a tax clawback in China. (6)
Inventories consist of the following:
Notes to Consolidated Financial Statements (Continued) (7) Property, Plant and Equipment Property, plant and equipment
(8) Income Taxes The significant components of the Company's deferred income tax liabilities and assets are as follows:
Notes to Consolidated Financial Statements (Continued)
The provision for income taxes from continuing operations is based on the following pre-tax income:
The provision for income taxes from continuing operations consists of the following:
Actual income taxes reported from continuing operations are different than would have been computed by applying the federal statutory tax rate to income from continuing operations before income taxes. The reasons for this difference are as follows:
At December 31,
Notes to Consolidated Financial Statements (Continued) (8) Income Taxes (Continued) At December 31,
Enacted changes in income tax laws had no material effect on the Company in Undistributed earnings of the Company's foreign subsidiaries amounted to approximately
Accrued expenses and other liabilities consist of the following:
Notes to Consolidated Financial Statements (Continued)
Long-term debt consists of the following:
Principal payments during each of the next five years and thereafter are due as follows (in millions): The Company maintains letters of credit that guarantee its performance or payment to third parties in accordance with specified terms and conditions. Amounts outstanding were approximately On June 18, 2010, the Company entered into a note purchase agreement with certain institutional investors (the 2010 Note Purchase Agreement). Pursuant to the 2010 Note Purchase Agreement, the Company issued senior notes of $75.0 million in principal, due June 18, 2020. The Company will pay interest on the outstanding balance of the Notes at the rate of 5.05% per annum, payable semi-annually on June 18 and December 18 until the principal on the Notes shall become due and payable. The Company may, at its option, upon notice, and subject to the terms of the 2010 Note Purchase Agreement, prepay at any time all or part of the Notes in an amount not less than $1 million by paying the principal amount plus a make-whole amount (as defined in the 2010 Note Purchase Agreement). The 2010 Note Purchase Agreement includes operational and financial covenants, with which the Company is required to comply, including, among others, maintenance of certain financial ratios and restrictions on additional indebtedness, liens and dispositions. As of December 31, 2011, the Company was in compliance with all covenants related to the 2010 Note Purchase Agreement. On June 18, 2010, the Company entered into a credit agreement (the Credit Agreement) among the Company, certain subsidiaries of the Company who become borrowers under the Credit Agreement, Bank of America, N.A., as Administrative Agent, swing line lender and letter of credit issuer, and the other lenders referred to therein. The Credit Agreement provides for a $300 million, five-year, senior unsecured revolving credit facility which may be increased by an additional $150 million under certain circumstances and subject to the terms of the Credit Agreement. The Credit Agreement has a sublimit of up to $75.0 million in letters of credit. Borrowings outstanding under the
Notes to Consolidated Financial Statements (Continued) (10) Financing Arrangements (Continued) Credit Agreement bear interest at a fluctuating rate per annum equal to (i) in the case of Eurocurrency rate loans, the British Bankers Association LIBOR rate plus an applicable percentage, ranging from 1.70% to 2.30%, determined by reference to the Company's consolidated leverage ratio plus, in the case of certain lenders, a mandatory cost calculated in accordance with the terms of the Credit Agreement, or (ii) in the case of base rate loans and swing line loans, the highest of (a) the federal funds rate plus 0.5%, (b) the rate of interest in effect for such day as announced by Bank of America, N.A. as its "prime rate," and (c) the British Bankers Association LIBOR rate plus 1.0%, plus an applicable percentage, ranging from 0.70% to 1.30%, determined by reference to the Company's consolidated leverage ratio. In addition to paying interest under the Credit Agreement, the Company is also required to pay certain fees in connection with the credit facility, including, but not limited to, a facility fee and letter of credit fees. The Credit Agreement expires on June 18, 2015. The Company may repay loans outstanding under the Credit Agreement from time to time without premium or penalty, other than customary breakage costs, if any, and subject to the terms of the Credit Agreement. Under the Credit Agreement, the Company is required to satisfy and maintain specified financial ratios and other financial condition tests. As of December 31, 2011, the Company was in compliance with all covenants related to the Credit Agreement and had $252.4 million of unused and available credit under the Credit Agreement, $34.6 million of stand-by letters of credit outstanding on the Credit Agreement and $13.0 million in euro-based borrowings under the Credit Agreement. On April 27, 2006, the Company completed a private placement of $225.0 million of 5.85% senior unsecured notes due April 2016 (the 2006 Note Purchase Agreement). The 2006 Note Purchase Agreement includes operational and financial covenants, with which the Company is required to comply, including, among others, maintenance of certain financial ratios and restrictions on additional indebtedness, liens and dispositions. Events of default under the 2006 Note Purchase Agreement include failure to comply with its financial and operational covenants, as well as bankruptcy and other insolvency events. The Company may, at its option, upon notice to the
On May 15, 2003, the Company completed a private placement of $125.0 million of senior unsecured notes consisting of $50.0 million principal amount of 4.87% senior notes due 2010 and $75.0 million principal amount of 5.47% senior notes due May 2013. The payment of interest on the senior unsecured notes is due semi-annually on May 15th and November 15th of each year.
The Class A Common Stock and Class B Common Stock have equal dividend and liquidation rights. Each share of the Company's Class A Common Stock is entitled to one vote on all matters submitted to stockholders and each share of Class B Common Stock is entitled to ten votes on all such matters. Shares of Class B Common Stock are convertible into shares of Class A Common Stock, on a one-to-one basis, at the option of the holder. As of December 31,
Notes to Consolidated Financial Statements (Continued) (11) Common Stock (Continued) total of (12) Stock-Based Compensation As of December 31,
currently available for the grant of new equity The Company The Company also has a Management Stock Purchase Plan that allows for the granting of restricted stock units (RSUs) to key employees. On an annual basis, key employees may elect to receive a portion of their annual incentive compensation in RSUs instead of cash. Each RSU provides the key employee with the right to purchase a share of Class A Common Stock at 67% of the fair market value on the date of grant. RSUs vest 2004 Stock Incentive Plan At December 31, The
Notes to Consolidated Financial Statements (Continued)
The following is a summary of stock option activity and related information:
As of December 31, Upon exercise of options, the Company issues shares of Class A Common Stock. The following table summarizes information about options outstanding at December 31,
The fair value of each option granted under the 2004 Stock Incentive Plan is estimated on the date of grant, using the Black-Scholes-Merton Model, based on the following weighted average assumptions:
Notes to Consolidated Financial Statements (Continued) (12) Stock-Based Compensation (Continued) The risk-free interest rate is based upon the U.S. Treasury yield curve at the time of grant for the respective expected life of the option. The expected life (estimated period of time outstanding) of options and volatility were calculated using historical data. The expected dividend yield of stock is the Company's best estimate of the expected future dividend yield. The Company applied an estimated forfeiture rate of The above assumptions were used to determine the weighted average grant-date fair value of stock options of
The following is a summary of unvested restricted stock activity and related information:
The total fair value of shares vested during The Company applied an estimated forfeiture rate of Management Stock Purchase Plan Total unrecognized compensation cost related to unvested RSUs was approximately
Notes to Consolidated Financial Statements (Continued)
A summary of the Company's
As of December 31, The following table summarizes information about RSUs outstanding at December 31,
Notes to Consolidated Financial Statements (Continued)
The fair value of each share issued under the Management Stock Purchase Plan is estimated on the date of grant, using the Black-Scholes-Merton Model, based on the following weighted average assumptions:
The risk-free interest rate is based upon the U.S. Treasury yield curve at the time of grant for the respective expected life of the The above assumptions were used to determine the weighted average grant-date fair value of RSUs granted of The Company distributed dividends of $0.44 per share for
The Company sponsors funded and unfunded non-contributing defined benefit pension plans that together cover substantially all of its domestic employees. Benefits are based primarily on years of service and employees' compensation. The funding policy of the Company for these plans is to contribute an annual amount that does not exceed the maximum amount that can be deducted for federal income tax purposes. On October 31, 2011, the
Notes to Consolidated Financial Statements (Continued)
The funded status of the defined benefit plans and amounts recognized in the consolidated balance sheet are as follows:
Amounts recognized in the consolidated balance sheet are as follows:
Amounts recognized in accumulated other comprehensive income consist of:
Notes to Consolidated Financial Statements (Continued)
Information for pension plans with an accumulated benefit obligation in excess of plan assets are as follows:
Information for pension plans with plan assets in excess of accumulated benefit obligation are as follows:
The components of net periodic benefit cost are as follows:
The estimated net actuarial loss Assumptions: Weighted-average assumptions used to determine benefit obligations:
Notes to Consolidated Financial Statements (Continued) (13) Employee Benefit Plans (Continued) Weighted-average assumptions used to determine net periodic benefit costs:
Discount rates are selected based upon rates of return at the measurement date utilizing a bond matching approach to match the expected benefit cash flows. In selecting the expected long-term rate of return on assets, the Company considers the average rate of earnings expected on the funds invested or to be invested to provide for the benefits of this plan. This includes considering the trust's asset allocation and the expected returns likely to be earned over the life of the plan. This basis is consistent with the prior year.
Plan assets: The weighted average asset allocations by asset category
The Company's written Retirement Plan Investment Policy sets forth the investment policy, objectives and constraints of the Watts Water Technologies, Inc. Pension Plan. This Retirement Plan Investment Policy, set forth by the Pension Plan Committee, defines general investment principles and directs investment management policy, addressing preservation of capital, risk aversion and adherence to investment discipline. Investment managers are to make a reasonable effort to control risk and are evaluated quarterly against commonly accepted benchmarks to ensure that the risk assumed is commensurate with the given investment style and objectives. The portfolio is designed to achieve a balanced return of current income and modest growth of capital, while achieving returns in excess of the rate of inflation over the investment horizon in order to preserve purchasing power of Plan assets. All Plan assets are required to be invested in liquid securities. Derivative investments are not allowed. Prohibited investments include, but are not limited to the following: Prohibited transactions include, but are not limited to the following: short selling and margin transactions. Allowable assets include: cash equivalents, fixed income securities, equity securities, mutual funds, and GICs.
Notes to Consolidated Financial Statements (Continued) (13) Employee Benefit Plans (Continued) Specific guidelines regarding allocation of assets are The following table presents the investments in the pension plan measured at fair value at December 31, 2011 and 2010:
Cash flows: The information related to the Company's pension funds cash flow is as follows:
The Company expects to contribute approximately $0.6 million in 2012.
Notes to Consolidated Financial Statements (Continued)
Expected benefit payments to be paid by the pension plans are as follows:
Additionally, substantially all of the Company's domestic employees are eligible to participate in certain 401(k) savings plans. Under these plans, the Company matches a specified percentage of employee contributions, subject to certain limitations. The Company's match contributions (included in selling, general and administrative expense) for the years ended December 31, The Company entered into a Supplemental Compensation Agreement (the Agreement) with Timothy P. Horne on September 1, 1996. Per the Agreement, upon ceasing to be an employee of the Company, Mr. Horne must make himself available, as requested by the Board, to work a minimum of 300 but not more than 500 hours per year as a consultant in return for certain annual compensation as long as he is physically able to do so. If Mr. Horne complies with the consulting provisions of the agreement above, he shall receive supplemental compensation on an annual basis of
Notes to Consolidated Financial Statements (Continued) (14) Contingencies and Environmental Remediation Accrual and Disclosure Policy The Company is a defendant in numerous legal matters arising from its ordinary course of operations, including those involving product liability, environmental matters and commercial disputes. The Company reviews its lawsuits and other legal proceedings on an ongoing basis and follows appropriate accounting guidance when making accrual and disclosure decisions. The Company establishes accruals for matters when the Company assesses that it is probable that a loss has been incurred and the amount of the loss can be reasonable estimated, net of any applicable insurance proceeds. The Company does not establish accruals for such matters when the Company does not believe both that it is probable that a loss has been incurred and the amount of the loss can be reasonable estimated. The Company's assessment of whether a loss is probable is based on its assessment of the ultimate outcome of the matter following all appeals. There may continue to be exposure to loss in excess of any amount accrued. When it is possible to estimate the reasonably possible loss or range of loss above the amount accrued for the matters disclosed, that estimate is aggregated and disclosed. As of December 31, 2011, the Company estimates that the aggregate amount of reasonably possible loss in excess of the amount accrued for its legal contingencies is approximately $3.3 million pre-tax. With respect to the estimate of reasonably possible loss, management has estimated the upper end of the range of reasonably possible loss based on (i) the amount of money damages claimed, where applicable, (ii) the allegations and factual development to date, (iii) available defenses based on the allegations, and/or (iv) other potentially liable parties. This estimate is based upon currently available information and is subject to significant judgment and a variety of assumptions, and known and unknown uncertainties. The matters underlying the estimate will change from time to time, and actual results may vary significantly from the current estimate. In the event of an unfavorable outcome in one or more of the matters described below, the ultimate liability may be in excess of amounts currently accrued, if any, and may be material to the Company's operating results or cash flows for a particular quarterly or annual period. However, based on information currently known to it, management believes that the ultimate outcome of all matters described below, as they are resolved over time, is not likely to have a material effect on the financial position of the Company. James Jones Litigation The Company was party to a lawsuit filed by Nora Armenta in California Superior Court against the Company, James Jones Company, Mueller Co. and Tyco International (the "Armenta case") and a separate lawsuit filed in California Superior Court on behalf of the City of Banning, California and 42 other cities and water districts in California against the Company, James Jones Company and Mueller Co. (the "City of Banning case"). At a mediation session held with the California Superior Court on June 9-10, 2009, the parties to the Armenta case and the City of Banning case agreed in principle to settle both cases. An agreement in principle also was reached in 2009 to settle the related insurance coverage casesWatts Industries, Inc. vs. Zurich American Insurance Company, et al., andZurich American Insurance Company vs. Watts Industries, Inc., et al., pending in California Superior Court;and Zurich American Insurance Company vs. Watts Industries, Inc. and James Jones Company, pending in the United States District Court for the Northern District of Illinois, Eastern Division. The settlement of the insurance coverage cases was effective and binding upon approval of the settlement of the underlying Armenta case and City of Banning case.
Notes to Consolidated Financial Statements (Continued)
As a result of the settlement of the above described litigation, the Company recorded a non-cash, pre-tax gain in discontinued operations of approximately $9.5 million in 2009 to reduce previously recorded estimates of the loss and related fees to the Foreign Corrupt Practices Act (FCPA) Settlement On October 13, 2011, the Company entered into a settlement with the SEC to resolve allegations concerning potential violations of the FCPA at CWV, a former indirect wholly-owned subsidiary of the Company in China. Under the terms of the settlement, without admitting or denying the SEC's allegations, the Company consented to entry of an administrative cease-and-desist order under the books and records and internal controls provisions of the FCPA. The Company also agreed to pay The amounts paid by the Company
The Company
Environmental Remediation The Company has been named as a potentially responsible party with respect to a limited number of identified contaminated sites. The levels of contamination vary significantly from site to site as do the related levels of remediation efforts. Environmental liabilities are recorded based on the most probable cost, if known, or on the estimated minimum cost of remediation. Accruals are not discounted to their present value, unless the amount and timing of expenditures are fixed and reliably determinable. The Company accrues estimated environmental liabilities based on assumptions, which are subject to a number of factors and uncertainties. Circumstances
Notes to (14) Contingencies and Asbestos Litigation The Company is defending approximately Other Litigation Other lawsuits and proceedings or claims, arising from the ordinary course of operations, are also pending or threatened against
Fair Value The carrying amounts of cash and cash equivalents, short-term investments, trade receivables and trade payables approximate fair value because of the short maturity of these financial instruments. The fair value of the Company's
variable rate debt approximates its carrying value. The carrying amount and the estimated fair market value of the Company's long-term debt, including the current portion, are as follows:
The Company
Notes to Consolidated Financial Statements (Continued) (15) Financial Instruments (Continued) are no cash flow hedges as of December 31, 2011. The fair value of these certain financial assets and liabilities were determined using the following inputs at December 31, 2011 and 2010:
The table below provides a summary of the changes in fair value of all financial assets and liabilities measured at fair value on a recurring basis using significant unobservable inputs (Level 3) for the period December 31, 2010 to December 31, 2011.
Notes to Consolidated Financial Statements (Continued) (15) Financial Instruments (Continued) As discussed in Note 5, in 2010 a contingent liability of $1.9 million was recognized as an estimate of the acquisition date fair value of the contingent consideration in the BRAE acquisition. This liability was classified as Level 3 under the fair value hierarchy as it was based on the weighted probability of achievement of a future performance metric as of the date of the acquisition, which was not observable in the market. During the year ended December 31, 2011, the estimate of the fair value of the contingent consideration was reduced to $1.1 million based on the revised probability of achievement of the future performance metric. The gain resulting from the decrease in the contingent liability was classified in operating earnings as restructuring and other charges, net. At December 31, 2009, the Company had short term investments of $6.5 million in auction rate securities (ARS). The Company elected to participate in a settlement offer from UBS AB (UBS) for all of its outstanding ARS investments. Under the terms of the settlement offer, the Company was issued rights by UBS entitling the Company to require UBS to purchase the underlying ARS at par value during the period from June 30, 2010, through July 2, 2012. The Company elected to exercise this right and, on July 1, 2010 received $6.3 million from UBS in settlement of all outstanding ARS investments. Short-term investment securities as of December 31, 2011 consist of a certificate of deposit with a remaining maturity of greater than three months at the date of purchase, for which the carrying amount is a reasonable estimate of fair value. Cash equivalents consist of instruments with remaining maturities of three months or less at the date of purchase and consist primarily of certificates of deposit and money market funds, for which the carrying amount is a reasonable estimate of fair value. The Company uses financial instruments from time to time to enhance its ability to manage risk, including foreign currency and commodity pricing exposures, which exist as part of its ongoing business operations. The use of derivatives exposes the Company to counterparty credit risk for nonperformance and to market risk related to changes in currency exchange rates and commodity prices. The Company manages its exposure to counterparty credit risk through diversification of counterparties. The Company's counterparties in derivative transactions are substantial commercial banks with significant experience using such derivative instruments. The impact of market risk on the fair value and cash flows of the Company's derivative instruments is monitored and the Company restricts the use of derivative financial instruments to hedging activities. The Company does not enter into contracts for trading purposes nor does the Company enter into any contracts for speculative purposes. The use of derivative instruments is approved by senior management under written guidelines. The Company has exposure to a number of foreign currency rates, including the Canadian Dollar, the Euro, the Chinese Yuan and the British Pound. To manage this risk, the Company generally uses a layering methodology whereby at the end of any quarter, the Company has generally entered into forward exchange contracts which hedge approximately 50% of the projected intercompany purchase transactions for the next twelve months. The Company primarily uses this strategy for the purchases between Canada and the U.S. The average volume of contracts can vary but generally approximates $9 to $15 million in open contracts at the end of any given quarter. At December 31, 2011, the Company had contracts for notional amounts aggregating approximately $9.0 million. The Company accounts for the forward exchange contracts as an economic
Notes to Consolidated Financial Statements (Continued) (15) Financial Instruments (Continued) entered into a series of copper swaps to fix the price per pound for copper from October 2008 through September 2009 for 1 million pounds to be delivered over 12 months for one customer. The Company
The Company
Leases The Company leases certain manufacturing facilities, sales offices, warehouses, and equipment. Generally, the leases carry renewal provisions and require the Company to pay maintenance costs. Future minimum lease payments under capital leases and non-cancelable operating leases as of December 31, 2011 are as follows:
Carrying amounts of assets under capital lease include:
Notes to Consolidated Financial Statements (Continued) (16)
The following is a summary of the Company's significant accounts and balances by segment, reconciled to its consolidated totals:
Notes to Consolidated Financial Statements (Continued)
The following includes U.S. net sales and U.S. property, plant and equipment of the Company's North American segment:
The following includes intersegment sales for North America, Europe and Asia:
The Company sells its products into various end markets around the world and groups net sales to third parties into four product categories. Because many of the Company's sales are through distributors and third-party manufacturers' representatives, a portion of the product categorization is based on management's understanding of final product use and, as such, allocations have been made to align sales into a product category. Net sales to third parties for the four product categories are as follows:
Notes to Consolidated Financial Statements (Continued) (17) Quarterly Financial Information (unaudited)
(18) Subsequent Events On
On February
For the Three Years Ended December 31:
In accordance with Rule 406T of Regulation S-T, the XBRL-related information in Exhibit 101 to this Annual Report on Form 10-K is deemed not filed or part of a registration statement or prospectus for purposes of sections 11 or 12 of the Securities Act, is deemed not filed for purposes of section 18 of the Exchange Act, and | |||||||||||||||||||||||||||||||||||||||||||||||||||||||||||||||||||||||||||||||||||||||||||||||||||||||||||||||||||||||||||||||||||||||||||||||||||||||||||||||||||||||||||||||||||||||||||||||||||||||||||||||||||||||||||||||||||||||||||||||||||||||||||||||||||||||||||||||||||||||||||||||||||||||||||||||||||||||||||||||||||||||||||||||||||||||||||||||||||||||||||||||||||||||||||||||||||||||||||||||||||||||||||||||||||||||||||||||||||||||||||||||||||||||||||||||||||||||||||||||||||||||||||||||||||||||||||||||||||||||||||||||||||||||||||||||||||||||||||||||||||||||||||||||||||||||||||||||||||||||||||||||||||||||||||||||||||||||||||||||||||||||||||||||||||||||||||||||||||||||||||||||||||||||||||||||||||||||||||||||||||||||||||||||||||||||||||||||||||||||||||||||||||||||||||||||||||||||||||||||||||||||||||||||||||||||||||||||||||||||||||||||||||||||||||||||||||||||||||||||||||||||||||||||||||||||||||||||||||||||||||||||||||||||||||||||||||||||||||||||||||||||||||||||||||||||||||||||||||||||