Table of Contents
UNITED STATES
SECURITIES AND EXCHANGE COMMISSION
Washington, D.C. 20549
FORM 10-K
ANNUAL REPORT PURSUANT TO SECTION 13 OR 15(d) OF
THE SECURITIES EXCHANGE ACT OF 1934
For the fiscal year ended September 30, 2009
2010
Commission file number: 1-12997
MAXIMUS, INC.
(Exact name of registrant as specified in its charter)
| | |
VIRGINIA
(State or other jurisdiction of incorporation or organization) |
| 54-1000588
(I.R.S. Employer Identification No.) |
|
|
|
11419 Sunset Hills Road, Reston, Virginia
(Address of principal executive offices) |
|
20190
(Zip Code) |
Registrant'sRegistrant’s telephone number, including area code:(703) 251-8500
Securities registered pursuant to Section 12(b) of the Act:
| | |
Title of each class | | |
| Name of each exchange on which registered |
|---|
Common Stock, no par value |
| New York Stock Exchange |
Securities registered pursuant to Section 12(g) of the Act:None
Indicate by check mark if the registrant is a well-known seasoned issuer, as defined in Rule 405 of the Securities Act. Yes ýx No o
Indicate by check mark if the registrant is not required to file reports pursuant to Section 13 or Section 15(d) of the Act. Yes o No ýx
Indicate by check mark whether the registrant (1) has filed all reports required to be filed by Section 13 or 15(d) of the Securities Exchange Act of 1934 during the preceding 12 months (or for such shorter period that the registrant was required to file such reports), and (2) has been subject to such filing requirements for the past 90 days. Yes ýx No o
Indicate by check mark whether the registrant has submitted electronically and posted on its corporate Web site, if any, every Interactive Data File required to be submitted and posted pursuant to Rule 405 of Regulation S-T (§232.405 of this chapter) during the preceding 12 months (or for such shorter period that the registrant was required to submit and post such files). Yes £ No £
Indicate by check mark if disclosure of delinquent filers pursuant to Item 405 of Regulation S-K is not contained herein, and will not be contained, to the best of registrant'sregistrant’s knowledge, in definitive proxy or information statements incorporated by reference in Part III of this Form 10-K or any amendment to this Form 10-K. o
Indicate by check mark whether the registrant is a large accelerated filer, an accelerated filer, or a non-accelerated filer. See definition of "accelerated“accelerated filer and large accelerated filer"filer” in Rule 12b-2 of the Exchange Act. (Check one):
| | | | | | |
Large accelerated filer ox | | Accelerated filer ýo |
| | |
Non-accelerated filer o
(Do not check if a smaller
reporting company) | | Smaller reporting company o |
Indicate by check mark whether the registrant is a shell company (as defined in Rule 12b-2 of the Act). Yes o No ýx
The aggregate market value of outstanding voting stock held by non-affiliates of the registrant as of March 31, 20092010 was $687,368,720$925,056,016 based on the last reported sale price of the registrant'sregistrant’s Common Stock on The New York Stock Exchange as of the close of business on that day.
There were 17,653,43617,210,381 shares of the registrant'sregistrant’s Common Stock outstanding as of October 30, 2009.November 1, 2010.
DOCUMENTS INCORPORATED BY REFERENCE
Portions of the registrant'sregistrant’s definitive Proxy Statement for its 20102011 Annual Meeting of Shareholders to be held on March 18, 2010,2011, which definitive Proxy Statement will be filed with the Securities and Exchange Commission not later than 120 days after the end of the registrant'sregistrant’s fiscal year, are incorporated by reference into Part III of this Form 10-K.
Table of Contents
PART I
ITEM 1. Business.
Business.
General
General
We provide operations program management and consultingbusiness process outsourcing services focused in the areas ofto government health and human services agencies under our mission of Helping Government Serve the People.®Our business is primarily forfocused on administering government-sponsored programs such as Medicaid, and the Children'sChildren’s Health Insurance Program (CHIP)., health care reform, welfare-to-work, Medicare, child support enforcement and other government programs. Founded in 1975, we are one of the largest pure-play health and human services provideradministrative providers to governmentgovernments in the United States, Australia, Canada and are at the forefront of innovation in meeting our mission ofHelping Government Serve the People®.United Kingdom. We use our expertise, experience,innovative business processes and advanced technological solutions to help government agencies run more efficient, and cost-effective programs and to improve program accountability, while improvingenhancing the quality of services provided to program beneficiaries. We operate in the United States, Australia, Canada, the United Kingdom, and Israel. We have held contracts with government agencies in all 50 states in the U.S.
Over the last five years, our core health and human services business has continued to expand. This growth was offset by isolated program challenges, which have since been largely resolved. Fiscal 2007 results were impacted by a $25.2 million loss on the Texas Integrated Eligibility project where MAXIMUS served as a subcontractor to Accenture to provide services to the Texas Health and Human Services Commissions (TX HHSC). In February 2007, we terminated our subcontract with Accenture. In March 2007, TX HHSC terminated its contract with Accenture and contracted directly with us to provide support services for its CHIP and Medicaid programs. We continue to provide services under these programs, but on a profitable basis. In 2008, TX HHSC, Accenture and MAXIMUS settled all claims relating to those programs. In connection with that settlement, MAXIMUS paid a total of $40.0 million and agreed to provide services, valued at an additional $10.0 million, to TX HHSC over the next five years.
Our core health and human services business has benefited from steady demand over the last five years. In fiscal 2008 and fiscal 2009, many states experienced budgetary challenges; however, weWe have not experienced any material adverse change in demand. Legislation suchdemand as a result of government budgetary pressures. We believe the Deficit Reduction Actcritical nature of 2005, Medicare Improvements for Patientsour services in helping governments provide and Providers Act (MIPPA), the American Recovery and Reinvestment Act (ARRA), the Reauthorization of the Children's Health Insurance Program (CHIP) in 2009, The Flexible New Dealadminister important safety net programs in the United Kingdom,States, such as Medicaid, welfare-to-work and CHIP, to the recent expansion of the Australian Human Service program has kept demand levels high. We believe that demand formost vulnerable populations helps insulate our services is reasonably insulated since we provide domestic state and federal clients with administrative services for critical programs including Medicaid, Medicare, and CHIP, and, abroad, wefrom significant downward pressure, particularly during an economic downturn. We also administer several international government-sponsored health and human services programs. We believe we remain well positionedprograms, most notably welfare-to-work, to benefit from pending initiatives relatedhelp people find employment and achieve self-sufficiency in Australia and the United Kingdom. Favorable legislation and austerity measures that seek to health care reform, as well as increasinghelp governments run more efficiently and cost effectively will continue to create demand from domesticfor our core services.
During fiscal 2010, the Company acquired DeltaWare, an eHealth business in Canada, and international government clients who are dealing with increasing caseloads in government-run health and human service programs. Nevertheless, protracted fiscal pressures could adversely impact our business.
In fiscal 2009, MAXIMUS committed to the divesture ofsold the non-strategic ERP business unit. This isIn fiscal 2008, MAXIMUS acquired a workforce services business in addition tothe United Kingdom and divested five non-core business units divested in fiscal 2008.units. These divestitures aretransactions were designed to enableallow the Company to better focus on ourits core health and human services business portfolio where we are the leading pure-play provider in the administrationbusinesses, as well as expand our geographic presence and enhance our service offerings through complementary acquisitions. For more details on these transactions, see “Note 3. Acquisition” and “Note 21. Discontinued Operations” within Item 8 of government health and human services programs.this Form 10-K.
For the fiscal year ended September 30, 2009,2010, we had revenue from continuing operations of $717.3$831.7 million and net income from continuing operations of $46.5$69.4 million.
Market Overview
We expect that demand for our core health and human services offerings will continue to increase driven by new legislation, austerity measures and increasing caseloads as governments strive to deliver more services with fewer resources. New legislation such as the Affordable Care Act (ACA) in the United States and welfare reform initiatives abroad has created increased demand for our services and should continue to create increased demand for our services over the next several years. We believe that we remain well-positioned to benefit from this increasing demand as governments look for ways to improve overall program efficiency and achieve value for funds spent on social programs.
Demand for our services is contingent upon factors that affect government, including:
·The need for state governments, which run federally mandated and federally funded programs such as Medicaid and CHIP, to deliver efficient, cost-effective services to program beneficiaries while meeting requirements to maintain federal matching funds.
·The requirement of state governments to implement federal initiatives, such as the ACA (health care reform), which will expand health insurance coverage to millions of Americans.
·The impact of continued budgetary pressures, which compels governments to operate more programs with the same level of resources and/or implement austerity measures as a method to address rising costs associated with social benefits programs.
·The need to improve business processes, innovate, and update technology. In the United States, governments are likely to seek outside sources as they face the possibility of an increasing number of government workers eligible for retirement, coupled with the stovepipe systems and antiquated processes that cannot scale effectively to support projected caseload growth.
3
Table of Contents
As a result, governments utilize business process outsourcing companies, such as MAXIMUS, to help them deliver efficient, cost-effective services to beneficiaries on their behalf. MAXIMUS possesses the knowledge and resources to efficiently operate government health and human programs and maintain requirements to achieve the maximum ongoing federal funding. With the ability to tightly balance resources with demand, MAXIMUS also offer flexibility and scalability that governments do not always possess.
Health Services Market Environment
Over the past decade, health care costs have substantially risen in the United States, a trend likely to continue over the long term. U.S. health care spending, among the highest of all industrialized countries, is increasing at a rate that outpaces inflation and national income growth. Stemming these costs as well as improving quality and access to health care is a major policy priority for government.
As a result, in March 2010, Congress passed the Affordable Care Act (ACA),a comprehensive overhaul of the health insurance system in the United States that initially seeks to expand beneficiaries’ access to health care, while ultimately improving quality and reducing overall costs of health care delivery. Most notably, ACA aims to expand health insurance coverage to over 30 million Americans in 2014 and beyond, primarily by expanding the Medicaid program through federal matching funds to cover more low-income individuals and families. In the interim, state fiscal realities have also prompted the expansion of Medicaid managed care to new populations — including the aged, blind and disabled populations — that have historically been served through fee-for-service Medicaid. Although these populations represent only 30% of the Medicaid population, they are responsible for approximately 70% of the costs. We believe we are well-positioned to benefit from the expected volume increases associated with Medicaid expansion due to our existing client base of states where we serve as the administrative enrollment vendor for 13 Medicaid managed care programs, which is 64% of the market served by third party administrators. ACA also extends CHIP through 2019, provides increased matching federal funds, and guarantees funding through 2015. We currently serve as the administrative vendor for CHIP in five states, which comprises approximately 68% of the market served by third party administrators.
The law also promotes the integration of new health insurance exchanges with existing state Medicaid and CHIP programs to provide for “no wrong door” of entry for program beneficiaries. A health insurance exchange is an insurance marketplace where individuals and small businesses can shop, compare and buy affordable and qualified health benefit plans. As a consequence, and in light of persistent budget pressures, state priorities now include the modernization of eligibility and enrollment processes for public health insurance programs such as Medicaid and CHIP. The goal of these modernization efforts is to improve access to health insurance for beneficiaries by simplifying and streamlining the eligibility and enrollment process, and allow for the seamless movement of subsidized populations among the various programs. We are currently supporting efforts in Colorado and New York to modernize their eligibility and enrollment processes for their subsidized health insurance programs. These programs may serve as the model as these states seek to set up their health insurance exchange to meet the ACA requirement of establishing an operational health insurance exchange by January 1, 2014. Many of the functions of a health insurance exchange are similar to the functions that we provide under Medicaid and CHIP: consumer outreach and education, eligibility and enrollment, customer contact centers, and comprehensive business process managed services to help beneficiaries navigate the new health insurance exchanges.
Other important features of ACA include funding for long-term care allowing states to offer home and community based services to elderly and disabled individuals through Medicaid rather than institutional care in nursing homes. As the population continues to age there is an increasing demand for quality and cost effective, long-term care in the least restrictive environment.
ACA also includes enhanced consumer protections for health insurance appeals. The law requires an independent, evidence-based external review process and the option for individuals to appeal coverage determinations or claims to insurance companies. This expands the requirement to ERISA plans which previously were not required to have an objective independent health appeals process. We are one of the largest providers of evidence-based health insurance appeals to Medicare and over 30 state agencies.
We believe the current health environment positions us to benefit from demand as governments must meet the requirements established under ACA. We believe states may be challenged to achieve these requirements and, as a result, are turning to business process outsourcers such as MAXIMUS to provide repeatable processes, proven solutions and consumer-friendly services. Overall, we expect the underlying demand for our services to increase due to the fundamental need for governments to provide these services to beneficiaries on an expanding and ongoing basis.
4
Table of Contents
Human Services Market Environment
The Human Services market has experienced increased demand driven by the need for governments to reduce costs and improve efficiency. The most dynamic portion of the market is in the welfare-to-work area where governments worldwide are seeking to model new welfare reforms after the Wisconsin Works (W-2) program. Since 1997, we have provided welfare-to-work services in Wisconsin when the W-2 program was launched and we continue to serve as one of its vendor agencies today. W-2 is considered to be one of the most ambitious and comprehensive welfare reform initiatives undertaken and is credited with breaking the cycle of poverty and beneficiaries remaining on welfare for life. The “Wisconsin Model” also paved the way for privatization of welfare-to-work programs and demanded accountability from its vendor partners through performance-based measures and employment outcomes. This model, with which MAXIMUS has a substantial amount of knowledge and expertise, is being emulated around the world and privatized, with MAXIMUS being a leading provider.
We believe we are well positioned to compete for these global welfare-to-work opportunities because of our established presence, strong brand recognition and ability to achieve the requisite performance requirements and outcomes outlined in the new reform measures. We offer clients demonstrated results and over twenty years of proven experience in administering welfare-to-work programs. MAXIMUS provides welfare-to-work services in several states and countries. In Australia, MAXIMUS is one of the largest and highest rated welfare-to-work providers where we operate 74 sites and 40 outreach locations. We also have an established presence in the U.K.’s welfare-to-work market and presently provide employment and job training services under the UK’s previous Flexible New Deal program which is planned to be consolidated into the new Work Programme. We believe reform initiatives coupled with our experience, expertise and proven solutions will continue to drive demand for our welfare-to-work services.
In 2010, the United Kingdom’s coalition government unveiled an austerity program to reduce mounting debt. A key feature of the plan involves comprehensive system-wide welfare reform, which is expected to yield a total savings of approximately £18 billion each year by 2014-2015. Under the Department of Work and Pensions (DWP), the welfare system overhaul will be complemented by the new Work Programme. The new Work Programme consolidates many of the U.K.’s disparate welfare-to-work programs — including the Flexible New Deal, Pathways to Work and Work Choice — into a single back-to-work program. Eligible providers must bid onto the Buying Framework prior to bidding for the 11 regional lots. DWP expects to appoint between three to eight organizations to each of the 11 regional lots and use the Buying Framework to identify organizations that have the capacity and expertise to deliver not only the Work Programme, but other potential employment related support services contracts, including those that may attract European Social Fund (ESF) support.
In addition to welfare reform, we have seen an increase in initiatives to utilize private firms for children’s services such as child support enforcement. MAXIMUS currently provides services to the Family Maintenance Enforcement Program in British Columbia as well as several jurisdictions’ throughout the United States including Shelby County, Tennessee, which was one of the largest child support privatization efforts in the United States.
As a result of measures to reduce costs and improve efficiency, coupled with our established presence, we believe we are well-positioned to benefit from an increase in demand for our core human services business across several geographies.
Our Clients
Our primary customers are government agencies.agencies at the federal and state level and, to a lesser extent, at the county and municipal level. In the United States, while certain of our direct customers may be state governments, a significant amount of our revenue from states is ultimately provided by the federal government in the form of cost sharing arrangements with the states, such as is the case with Medcaid programs. In fiscal 2009,2010, approximately 66%59% of our total revenue was derived from state and local government agencies whose programs received significant federal
Table of Contents
funding, 17%27% from foreign government agencies, 9% from U.S.-based federal government agencies, and 8%5% from other sources (such as municipal or commercial customers).
We believe
For the year ended September 30, 2010, we are well positioned to benefit from demand for operations program managementderived approximately 12% and consulting services in an environment where governments are required to maintain or improve services to an increasing number of constituents.
We believe governments will continue to review current program operations and seek improved operating capability and cost savings through the use of partnering and managed services. For example, many states are in the process of considering changes to how they administer government-sponsored programs and implementing legislative changes such as the reauthorization of CHIP. Additionally, states are seeking new ways to find cost savings by implementing new systems and business process reengineering. Much18% of our work in the United States is related to federally mandated and federally funded programs such as Medicaid, CHIP, and Temporary Assistance to Needy Families (TANF). International governments are also grappling with many of the same social issues related to the delivery of cost effective health and human services programs and, as a result, they are turning to managed services providers such as MAXIMUS to provide repeatable process and proven solutions. Overall, we expect the underlying demand for our existing programs to increase due to the fundamental need for governments worldwide to provide these services to program recipients.
We deliver valued-added services to government agencies by providing operations program management and consulting services that help governments operate more efficiently and effectively. Demand for our services is contingent upon factors that affect government spending and drive demand for our services, including:
•The requirement of state governments that are running federally mandated and federally funded programs to efficiently and cost-effectively meet minimum federal requirements to maintain federal funding levels.
•The requirement of state governments to implement federal initiatives, such the reauthorization of the Children's Health Insurance Program in 2009, which increases federal matching dollars to statesconsolidated revenue from contracts with the goal to increase participants overStates of California and Texas, respectively, and 16% of our consolidated revenue from the next five years from seven million to 11 million children.
•The need for governments to operate more programs with the same levelGovernment of resources. We believe that clients may seek additional partnering or managed services options to manage increasing demand for government-funded programs and will seek providers that offer greater flexibility in balancing resources (e.g. workforce) with demand.
•The impact of continued budgetary pressures on governments and the need for most states to maintain balanced budgets. These budgetary requirements increase the desire by governments to seek and maximize federal funding to which they are entitled.
•The need to improve business processes and update technology as governments face the possibility of an increasing number of workers eligible for retirement. It is estimated that over the next five years, one-fifth of state and local government managers, and one-third of the federal government's full-time permanent workforce will be eligible for retirement.
Australia. As a result, governments utilize outside companies, such as MAXIMUS, that possess the knowledge and resources to efficiently operate federally funded programs and maintain minimum federal requirements to achieve maximum efficiency and ongoing federal funding.
5
Table of Contents
We typically contract with government clients under four primary contract types including performance based, cost plus, fixed fee for service, and time and materials. For the year ended September 30, 2010, 47% of our contracts were performance based, 29% were cost plus, 21% were fixed fee for service, and 3% were time and materials.
Generally, the relationships with our clients are long-term multi-year contracts, subject to option years and periodic rebids. See below under “Backlog” for more details.
Our Business Segments
During the last threefourth quarter, the Company aligned its organization of the business to reflect its focus on the administration of government health and human services programs. As a result of this organizational realignment, the Company has reclassified its segment financial information to reflect the two new operating segments of Health Services and Human Services. The results of the segments have been reclassified for all periods shown. For more information concerning our segment presentation, including comparative revenue, gross profit, operating profit, identifiable assets and related financial information for the 2008, 2009 and 2010 fiscal years, our revenues by segment were as follows (in thousands):
| | | | | | | | | | |
| | Year ended September 30, | |
|---|
| | 2007 | | 2008 | | 2009 | |
|---|
Operations | | $ | 507,486 | | $ | 629,226 | | $ | 659,204 | |
Consulting | | $ | 75,534 | | $ | 64,437 | | $ | 58,095 | |
| | | | | | | | |
Total | | $ | 583,020 | | $ | 693,663 | | $ | 717,299 | |
The following discussion describes our business segments and eachsee “Note 19. Business Segments” within Item 8 of our operating divisions within the business segments as they existed on September 30, 2009. From time to time, we implement certain organizational or management changes that realign our internal infrastructure and enable us to manage our business better.
Operations Segment:this Form 10-K.
Health Services Segment
Our OperationsHealth Services Segment generated 92%62% of our total revenue in fiscal 2009. Financial information with respect to this segment is provided in Notes 16 and 17 of our consolidated financial statements (See Item 8 below).2010. The OperationsHealth Services Segment provides a variety of program managementbusiness process outsourcing (BPO) and operationsadministrative support services, as well as consulting services for state, provincial, and federal national,government programs, such as: Medicaid, CHIP, SNAP (Supplemental Nutrition Assistance Program), Medicare and county funded publicHealth Insurance BC (British Columbia). The segment’s services help improve the efficiency, cost effectiveness, quality and accountability of government sponsored health benefit programs. Our BPO services are centered on legislative initiatives and mandated programs such as the Affordable Care Act (Health Care Reform), Medicaid, CHIP, Medicare and focuses onLong-term Care. In this segment, our BPO and consulting services include:
·Comprehensive government health insurance program administration
·Health insurance program eligibility and enrollment services to improve access to health care for citizens and help beneficiaries make the delivery of administrative servicesbest choice for their health insurance coverage
·Eligibility and enrollment modernization for government health benefit programs
·Consumer outreach and education to support government health insurance programs and provide multi-channel self-service options, including consumer friendly toll-free phone numbers, Websites and Web-based portals for easy enrollment
·Application assistance and enrollment counseling to beneficiaries
·Premium payment processing and administration such as invoicing and reconciliation
·Multilingual customer contact centers
·Objective, evidence-based health appeals
·Comprehensive eHealth solutions with the Medigent® product suite
·Independent medical reviews
·Health plan oversight
·Medicaid Management Information System (MMIS) planning and oversight
·Specialized program consulting services
Human Services Segment
Our Human Services Segment generated 38% of our total revenue in fiscal 2010, with over half generated outside the United States, primarily in Australia and the United Kingdom. The Human Services Segment provides a variety of administrative support and case management services for federal, national, state and county human services agencies including welfare-to-work programs, including: Medicare, Medicaid, CHIP, TANF and related workforce services programs, and child support enforcement, programs.higher education services and K-12 special education services. Our Operations Segment provides these services through the following support organizations:include:
Child Support.· Child Support provides managedComprehensive workforce services consulting,— including eligibility determination, case management, job-readiness preparation, job search and system supportemployer outreach, job retention and career advancement, and selected educational and training services — to state and local agencies. These services include fullhelp disadvantaged individuals transition from government assistance programs to employment
·Full and specialized child support case management services, call center operations, and program and systems consulting services. Child Support engages with child support enforcement agencies to locate non-custodial parents, establish paternity and support orders, and enforce payments to families. This operation also provides Supplemental Security Income advocacy services for children in foster care, as well as Title IV-E, which sets forth standards for federal payments for foster care, TANF, and adoption assistance eligibility services. Child Support develops, implements, and operates full-service child care programs and associated systems.
Federal Operations.· Federal Operations contracts with federal agencies to support health, human services, and justice programs. Our federal operations group provides independent appeals of health insurance denials for government health plan enrollees and providers for Medicare Parts A, B (South), C, and D, the U.S. Office of Personnel Management Federal Employees Health Benefits Plan, the Department of Defense TRICARE program, and over 30 state health insurance regulatory agencies. Federal Operations provides quality of care services including protected medical peer review, evaluation of medical malpractice claims, quality of care standards definition and screening, provider facility review, quality assurance plan review, and health data monitoring. They also provide financial investigations and compliance oversight for the U.S. Department of Justice, which includes monitoring of federally seized businesses to ensure compliance with court-ordered monitoring requirements for the U.S. Marshals Service and conducting a wide range of forensic and investigative services for the Drug Enforcement Agency. In addition, MAXIMUS Federal partners with the Social Security Administration to serve individuals with disabilities through the Ticket to Work and Self-Sufficiency Program.
Health Services. Health Services provides a range of administrative support for publicly funded health services and health insurance programs, with a particular emphasis on eligibility and enrollment for state programs such as Medicaid Managed Care and CHIP. Health Services also operates one of the largest health claims processing systems in Canada, administering British Columbia's medical and drug
Table of Contents
insurance plans. Under these public health programs, the Division provides the following services: beneficiary outreach and education, application assistance, eligibility support services, enrollment counseling, program data collection and reporting, and premium collection and processing. The Division delivers these services through customized automated information systems; design and development of print and web-based program educational materials; and full-service multi-contact customer service centers that include on-site multilingual assistance. Through the MAXIMUS Center for Health Literacy (CHL), Health Services also develops easy-to-read print materials and easy-to-use websites, and provides adapted translations to help individuals with educational, cultural, or linguistic barriers understand and use important information related to government health programs.
Workforce Services. Workforce Services manages government workforce-centered service programs in the United States, Australia, the United Kingdom, and Israel. Workforce Services helps disadvantaged individuals transition from government assistance programs to employment and economic independence by providing comprehensive services, including eligibility determination, case management, job-readiness preparation and search, job development and employer outreach, job retention and career advancement, and selected educational and training services. We also provide advocacy service for youth and disabled persons in the United States and rehabilitation services in Australia. Additionally, Workforce Services provides employers with tax credit and electronic I-9 management services, which are fully compliant with U.S. Department of Homeland Security guidelines and integrated with the U.S. Citizenship and Immigration Services E-Verify program.
Consulting Segment:
Our Consulting Segment generated 8% of our total revenue in fiscal 2009. Financial information with respect to this segment is provided in Notes 16 and 17 of our consolidated financial statements (See Item 8 below). The Consulting Segment provides management and financial consulting services for state and local clients, focusing on services that both directly support health and welfare and improve program operations, performance, and integrity. The Segment serves to create business opportunities for our core Operations Segment by providing the government market with a consulting option for improving program operations, performance and integrity. The Consulting Segment provides services, which oftentimes complement our Operations Segment services, through the following practice areas:
Program Performance Services. Program Performance Services helps clients analyze and optimize their business operations. Our services and solutions focus on the health and human services marketplace, including optimizing the eligibility and enrollment process and call center design for government-run programs such as CHIP and designing and creating outreach and education materials, client advocacy programs, human capital management strategies, program analytics, quality assurance processes and practices, as well as client portals. This practice area provides cost allocation advisory services, user fee program design and implementation, activity-based cost accounting and related financial services.
Program and Systems Integrity Services. Program and Systems Integrity Services helps government organizations plan and monitor large-scale program and technology systems initiatives including planning, funding, procuring, and implementing information systems. Program and Systems Integrity Services also provides standards-based project management, quality assurance and independent verification and validation services for government programs such as Medicaid, child welfare, child support, unemployment compensation, eligibility/TANF and WIC/EBT.
Educational Services. Educational Services provides a unique set of innovative management tools and professional consulting services for all levels of the educational system. Education Services offers higher education institutions
·K-12 special education case management solutions including our TIENET® software application, which helps schools manage special education instruction, assessment and intervention. The application includes Individualized Educational Programs (IEPs) to ensure compliance with federal and state laws
6
Table of Contents
including the No Child Left Behind Act of 2001 (NCLB). The Division also offers AutismPro®, a Web-based solution that helps schools drive positive outcomes for special education students, and provides higher education
·Program consulting services that help institutions plan, manageincluding independent verification and secure federal fundingvalidation, cost allocation plans, and grants for researchrepeatable management services and other sponsored programs.specialized consulting offerings
·Business and tax credit services for employers
Foreign Operations
The Company operates in the United States, Australia, Canada, the United Kingdom and Israel. The distribution of revenues and assets between the United States, Australia and the rest of the world are included in “Note 19. Business Segments” within Item 8 of this Form 10-K.
Competitive Advantages
We offer a private sector alternative for the administration and management of critical government-funded programs as well as offering consulting services.health and human services programs. Our reputation and extensive experience over the last 3035 years give us a competitive advantage as governments value the level of expertise and brand recognition that MAXIMUS brings to its customers. The following are the competitive advantages that allow us to capitalize on various market opportunities:
Proven track record and exceptional brand recognition. Since 1975, we have successfully assisted governments in delivering cost-effective services to beneficiaries on government programs. We operate large-scale program management operations on behalf of government agencies, improving the quality of services provided to beneficiaries, which has further enhanced our brand recognition with government agencies.
Single-market focus.Subject matter expertise. Our workforce includes many individuals who possess substantial subject matter expertise in areas critical to the successful design, implementation, administration, and operation of government health and human services programs. Many of our employees have worked for governments in management positions and are better able to understand and advance service capabilities that are of the most value, practical, and effective for our clients.
Intellectual property that supports the administration of government programs. We have proprietary case management solutions to support our health and human services business lines. By leveraging a common framework, MAXIMUS shortens, and sometimes eliminates, the development lifecycle to enable configuration for accelerated takeover of operations, providing clients with a significant amount of flexibility and support. By taking advantage of a large number of shared technical and business components, we reduce development costs and deliver clients increased capabilities and efficiencies related to workflow, calendaring and action plan management. As a market-share leader in CHIP and enrollment Broker, our shared core infrastructure provides price competitive advantages over other potential competitors. We have deployed these proven product solutions across several health and human services projects for clients such as Pennsylvania, New York and the United Kingdom. We have also made investments in business process modeling and monitoring tools to further enhance our operational efficiency. These assets, when combined with our subject matter expertise offer clients significant advantages over pure service providers who depend on third-party software.
Financial strength. We maintain a strong balance sheet, generate consistent annual cash flow, and have minimal long-term debt. We possess the financial flexibility and sufficient cash on-hand to support client operations including ongoing technology investments and working capital for high-profile public health and human services programs.
Focused portfolio of services with a single-market emphasis. We are one of the largest publicly traded companies whose primary focus is offeringthat provide a portfolio of operations program managementBPO health and consultinghuman services specifically to government customers. This single-market concentration allows us to dedicate time and resources fully in providing quality, customized solutions to government customers. Our extensive experience and detailed understanding of the regulation and operation of government programs allow us to apply our methodologies, skills, and solutions to new projects in a cost-effective and timely fashion. We believe our government program expertise differentiates us from other firms and non-profit organizations with limited resources and skill sets, as well as from large consulting firms that serve multiple industries but lack the focus necessary to manage the complexities of pursuing opportunities and serving government agencies efficiently.
Financial strength. We maintain a strong balance sheet, generate consistent annual cash flow and do not have any long-term debt. Many government clients have become concerned with the financial wherewithal of their vendors. We possess sufficient cash on-hand to support client operations including ongoing technology investments and start up operations. Clients are more comfortable engaging with vendors who have financial flexibility to support their needs, especially those related to high-profile public health and human services programs.
Focusedgovernment agencies efficiently. Our focused portfolio of services. Customers seekoffers clients a continuum of service capabilities from consulting engagements to component services to full-service solutions in their health and human services programs. Engagements often require creative or complex solutions and we are able to draw upon our health and human services subject matter experts within our organization. Our focused range of capabilities, as described in the "Our Business Segments" discussion above, enables us to better pursue new business opportunities and positions us as a single-source provider of health and human services program management and consulting services to government agencies.solutions.
Established international presence. International governments are seeking to expandimplement austerity measures as a means to improve government-sponsored health and human services programs as demand for social services continues to rise and governments seek to contain costs. We have an established presence in Australia, Canada and the United Kingdom and Israel as one of the preeminent providers in certain core health and human services programs including workforce serviceswith a focus on delivering cost effective welfare-to-work and health insurance eligibility and enrollment operations. Our established presence and proven solutions have contributedservices to our success in competing for new contracts internationally.beneficiaries on behalf of governments.
Proven track record and exceptional brand recognition. Since 1975, we have successfully and profitably assisted governments by offering efficient, cost-effective solutions. We have provided hundreds of large-scale program management operations for government agencies, many of which we continue to run today, serving millions of beneficiaries. The successful execution of these projects has improved the quality of services provided to program beneficiaries, which has enhanced our brand
Table of Contents
recognition with government agencies. Our proven records of accomplishment and exceptional brand recognition have contributed significantly to our ability to compete successfully and win new contracts.
Expertise in competitive bidding. Government agencies typically award contracts to third-party providers through a comprehensive, complex and competitive bidding process. With over 30 years of experience responding to Requests for Proposals (RFPs) and executing oral presentations,bidding process. With over 35 years of experience in responding to RFPs, we have the necessary experience to navigate these government procurement processes. The complex nature of competitive bidding creates significant barriers to entry for potential new competitors unfamiliar with the nature of government procurement. We possess the expertise and experience to assess and allocate the appropriate resources necessary for successful project completion in accordance with contractual terms. Our proposals demonstrate our ability to meet all customer requirements at a price that is both attractive to the customer and profitable to MAXIMUS. Given the reluctance of government agencies to award contracts to unproven companies, we believe that our expertise in the competitive bidding process has contributed significantly to our success.
Intellectual property that supports the administration of government programs. We have software products that enhance our operations program management offerings. Further, our ability to focus our subject matter experts to aid in the support and enhancement of our product offerings provides advantages over pure service providers who are dependent on third-party software.
MAXIMUS develops proprietary case management solutions to support our health and human services business lines. By leveraging a common framework, MAXIMUS can shorten our development lifecycle, and possibly eliminate it, to enable configuration for accelerated takeover
7
Table of operations, providing clients with a significant amount of flexibility and support. By taking advantage of a large number of shared technical and business components, we can reduce development costs and deliver clients increased capabilities and efficiencies related to workflow, calendaring, and action plan management. We have deployed these proven product solutions across several health and human services projects for clients such as Pennsylvania, New York, and the United Kingdom.
CompetitionContents
Competition
The market for providing our services to government agencies iscan be competitive and subject to rapid change. Our Consulting Segment typically competes against large global consulting firms, as well as smaller niche players. Our Operations Segment, which primarily serves healthHowever, given the specialized nature of our services and human services departmentsthe programs we serve, the market is difficult for new, unknown competitors. The complex nature of competitive bidding and agencies, competesrequired investment in subject-matter expertise, repeatable processes, and support infrastructure creates significant barriers to entry for program management contractspotential new competitors unfamiliar with the nature of government services divisions of large organizations, such as Affiliated Computerprocurement.
Our primary competitors in the Health Services Inc.,Segment in the United States are ACS, a Xerox Company (ACS); EDS, an HP Company and International Business Machines Corporation, as well as more specialized private service providers,providers. Our primary competitors in the Human Services Segment market include Serco, Atos Origin, private services and localspecialized consulting companies and non-profit organizations, such as the United Way of America, Goodwill Industries, and Catholic Charities USA.organizations.
Business Growth Strategy
Our goal is to enable future growth by remaining a leading provider of operations program management and consulting services to government agencies. The key components of our business growth strategy include the following:
•·Pursue new domestic and international business opportunities and expand our customer base. With over 30 years of business expertise in the government market, we continue to be a leader in developing innovative solutions to meet the evolving needs of government agencies. We will continue to seek to grow our domestic and international base business by leveraging our existing core capabilities and pursuing opportunities with new and current clients.
·
•- Grow long-term, recurring revenue
streams.streams. We seek to enter into long-term relationships with clients to meet their ongoing and long-term business objectives. As a result, long-term contracts
Table of Contents
See Exhibit 99.1 of this Annual Report on Form 10-K under the caption "Special“Special Considerations and Risk Factors"Factors” for information on risks and uncertainties that could affect our business growth strategy.
8
Table of Contents
Marketing and Sales
We generate new business opportunities by establishing and maintaining relationships with key government officials, policy makers and decision makers to understand the evolving needs of government agencies as they seek to optimize their programs. We have a team of business development professionals who ensure that we understand the needs, requirements, legislative initiatives, and priorities of our current and prospective customers. In conjunction with our subject matter experts and marketing consultants, our business development professionals create and identify new business opportunities and ensure that we proactively introduce our solutions and services early in the procurement cycle. We also subscribeAs part of the procurement, we respond to competitive requests for bids through the government procurement databases that track government bid activity and make every effort to ensure that we are on bidders' lists as well as approved vendor lists for government procurement offices. We participate in professional associations of government administrators and industry seminars featuring presentations by our executives and employees. Senior executives also develop leads through on-site presentations to decision-makers.process.
For the year ended September 30, 2009, we derived approximately 11% and 18% of our consolidated revenue from contracts with the States of California and Texas, respectively, principally within our Operations Segment.
Table of Contents
Legislative Initiatives
During
MAXIMUS actively monitors legislative initiatives and responds to opportunities as they develop. Over the lastpast several years, federal and state legislative initiatives created new growth opportunities and potential markets for MAXIMUS. Legislation passed in Congress hasthe United States and in the United Kingdom have large public policy implications for state and localall levels of government and presentspresent viable business opportunities notably in the health and human services arena. MAXIMUS is well positionedwell-positioned to meet the operations program management and consulting needs resulting from legislative actions and subsequent regulatory and program implementation efforts. MAXIMUS is actively monitoring these initiatives to respond to opportunities that develop.
Some recent federal legislative initiatives that have created new growth opportunities for us in the government market include the following:
Medicare Improvements for PatientsAffordable Care Act. In March 2010, the United States enacted comprehensive health care reform, known as the Affordable Care Act (ACA). This new law expands access to health coverage to more than 30 million Americans, protects consumer rights, controls health care costs, and Providers Act (MIPPA). Enacted in July 15, 2008, MIPPA made several changes toimproves the Medicare program, including improvements tooverall health care delivery system over the low-income assistance provisionscourse of the Part D prescription drug program. We analyzednext four years and beyond. Many components of the billACA will require states to pass legislation and provisionscreate program regulations. The law presents several business opportunities for any impact on MAXIMUS businessto offer our expertise in the administration of public programs, including:
·Establishment of Exchanges, insurance marketplaces where individuals and potential opportunities arising from the bill. In particular, new funding is provided in Section 119 for an information clearing housesmall businesses can buy affordable and technical assistance and training to improve services to low-income Medicare beneficiaries.qualified health benefit plans.
Children's·Expansion of Medicaid where states will receive federal matching funds to cover more low-income individuals and families.
·Extension of CHIP through 2019 and the extension of funding through 2015, which is two additional years beyond the Children’s Health Insurance Program Reauthorization Act (CHIPRA) of 2009 .
·Modernization of eligibility and enrollment processes for public health insurance programs.
·Development of consumer-friendly education and outreach materials, including easy-to-use Websites, so beneficiaries with varying literacy levels can compare options and select the appropriate health insurance coverage.
·Funding for long-term care allowing states to offer home and community based services to elderly and disabled individuals through Medicaid rather than institutional care in nursing homes.
·Creation of Pre-Existing Condition Insurance Plans (PCIP) to provide health coverage to individuals, who have been denied health insurance by private insurance companies because of a pre-existing condition, through high risk pools.
·Consumer protection through an external review process and the option for individuals to appeal coverage determinations or claims to insurance companies.
·Implementation of eHealth requirements for a secure, confidential and electronic exchange of health information.
Education, Jobs and Medical Assistance Act. Signed into law in August 2010, this act extends the 6.2% increase in the Federal Medical Assistance Percentage (FMAP) set by the American Recovery and Reinvestment Act (ARRA) through June 30, 2011. The passage of this bill has both preserved and expanded Medicaid potential business for MAXIMUS.
Children’s Health Insurance Program Reauthorization Act (CHIPRA). CHIPRA was signed into law on February 2, 2009, extending the previous SCHIP program. This billAs part of the Affordable Care Act of 2010 (ACA), CHIP has been extended federal support for CHIP through 2013, while adding an2019 and funding has been extended through 2015, which is two additional $44 billion between 2009 and 2013 toyears beyond the baseline funding of $5 billion a year.original CHIPRA Act. By expanding state options to find and enroll studentseligible children through "express“express lane eligibility"eligibility” and "auto-enrollment,"“auto enrollment,” CHIPRA has presented MAXIMUS with an opportunity to expand our partnerships with states administeringfor the administration of CHIP programs.
9
Table of Contents
Work Programme in the United Kingdom. The Work Programme, part of the new Coalition government’s austerity and debt reduction measures, is a new government-sponsored welfare-to-work model that consolidates several existing employment programs into a single comprehensive back-to-work program in an effort to achieve higher quality, longer-term and sustainable employment outcomes for job seekers in the United Kingdom. MAXIMUS previously performed work under the Flexible New Deal. In 2010, the Department of Work and Pensions notified all FND vendors and vendors under several other welfare-to-work programs that all current contracts will expire on June 30, 2011 and that vendors may bid for a spot on a contract vehicle called the Buying Framework for the new Work Programme. Vendors who successfully bid to be a qualified vendor on the Buying Framework will then be eligible to bid for the estimated 11 regions throughout the United Kingdom, where it is expected that these 11 regions will be served by three to eight vendor organizations in each region.
American Recovery and Reinvestment Act of 2009 (ARRA).ARRA provides states with a 6.2% increaseopportunities to accelerate the adoption of health information technology under the Health Information Technology for Economic and Clinical Health (HITECH) provisions. ARRA also contains an expansion of HIPAA (Health Information Portability and Accountability Act) rules beyond “covered entities” to include business associates of covered entities. These provisions provide MAXIMUS with business opportunities in the Federal Medical Assistance Percentage(FMAP) for fiscal years 2009 through 2011, with states with the highest unemployment rates receiving a higher percentage increase. The passage of this bill has both preservedhealth information technology and expanded Medicaid potential business for MAXIMUS. ARRA also created a new Temporary Assistance for Needy Families (TANF) Emergency Fund of $5 billion available to states, territories, and tribes for federal fiscal years 2009 and 2010 that experience a rise in TANF caseloads.eHealth market.
Health Reform Legislation. Health reform legislation is pending and has a variety of provisions that have the potential to increase MAXIMUS business. The four areas that present business opportunities are: eligibility determination for subsidies, enrollment brokers for plans in the exchange, increased appeals work, and, as Medicaid will likely expand, the bill may provide the opportunity for MAXIMUS to increase its Medicaid work.
President's Emergency Plan for AIDS Relief (PEPFAR). PEPFAR authorizes $48 billion to combat Global HIV/AIDS, tuberculosis and malaria. This legislation responds to the President's call to expand the U.S. Government's commitment to this successful program for five additional years, from 2009 through 2013. We continue to monitor the PEPFAR program and Congressional appropriations and pursue business opportunities for MAXIMUS in assisting governments in strengthening their health systems and developing their capacity to address the HIV/AIDS epidemic.
The Flexible New Deal (FND) The FND is a government-sponsored program designed to provide skills, support, and employment assistance to job seekers in the United Kingdom. In October of 2009, the FND replaced the New Deal employment programs in England, Scotland, and Wales under phase one of the program. Under the FND, unemployed program participants receive 12 months of allowance and job search assistance and, after the initial 12 month period, are passed on to private and non-profit contractors with payment based on the number of participants receiving job placement.
Table of Contents
Deficit Reduction Act of 2005 (DRA). Enacted in the spring of 2006, the DRA reauthorized the TANF program of 1996 and provides states with additional flexibility to make reforms to their Medicaid Programs. This legislation touches uponthrough 2010. On September 30, 2010, a TANF block grant was signed as part of a continuing resolution that extends government funding of programs through December 3, 2010. The DRA includes a number of key health and human service issues important to the MAXIMUS base business. In reauthorizing TANF,core health and human service businesses in the United States. The DRA requires states to engage more TANF cases in productive activities leading to self-sufficiency. The law recalibrates a caseload reduction credit, increases childcare funding, retains maintenance of level of effort and promotes healthy marriage and responsible fatherhood initiatives. States are also requiredfind employment in order to achieve self-sufficiency, as well as establish and maintain work participation rates and verification procedures with new penalties of one to five percent for failure to comply.procedures. The DRA allowsalso provides states with additional flexibility to changemake reforms to their Medicaid benefit packages to mirror certain commercial insurance packages (termed alternative or benchmark packages) and allows states to vary the premiums and cost sharing they charge and gives them the option to require paymentprograms.
Backlog
At September 30, 2010, we estimated that we had approximately $2.1 billion of alternative premiums as a condition of eligibility. These provisions, and many othersrevenue in the DRA, are central to the MAXIMUS health and human service experience base in our Operations and Consulting segments. The new requirements of the TANF program will create certain new challenges for states and localities, which in turn provide opportunities for companies like MAXIMUS. Additionally, the flexibility and encouragement offered in the DRA to innovate state Medicaid programs should be a catalyst for new operations and consulting opportunities.
Backlog
backlog. Backlog represents an estimate of the remaining future revenue from existing signed contracts and revenue from contracts that have been awarded, but not yet signed. Our backlog estimate includes revenue expected under the current terms of executed contracts and revenue from contracts in which the scope and duration of the services required are not definite but estimable (such as performance-basedperformance- based contracts), but does not assume any contract renewals.
Changes
Increases in backlog result from additions to future revenue from the executionawarding of new contracts or the extension or renewal of existing contracts reductionsand option periods. Reductions come from fulfilling contracts reductions from theand early termination of contractscontracts. Increases and adjustments to estimates of previously-included contracts. decreases can follow from changes in estimates.
Our contracts typically contain provisions permitting government customers to terminate the contract on short notice, with or without cause. The backlog associated with our performance-based contracts are generally estimates based upon management experience of case loads and similar transaction volume from which actual results may vary.
We believe that period-to-period backlog comparisons are difficult and do not necessarily accurately reflect future revenue we may receive. The actual timing of revenue receipts, if any, on projects included in backlog could change for any of the aforementioned reasons. The dollar amount by segment of our backlog as of September 30, 20082009 and 2009,2010, were as follows:
| | | | | | | | |
| | As of
September 30, | |
|---|
| | 2008 | | 2009 | |
|---|
| | (In millions)
| |
|---|
Operations | | $ | 1,162 | | $ | 1,702 | |
Consulting | | | 138 | | | 98 | |
| | | | | | |
| | Total | | $ | 1,300 | | $ | 1,800 | |
| | | | | | |
Of the $1.8 billion balance outstanding at
| | As of
September 30, | |
| | 2009 | | 2010 | |
| | (In millions) | |
Health Services | | $ | 1,050 | | $ | 1,515 | |
Human Services | | 750 | | $ | 585 | |
Total | | $ | 1,800 | | $ | 2,100 | |
The Company’s BPO businesses typically involve contracts covering a number of years. At September 30, 2009,2010, the average weighted life of these contracts was in excess of five years, including options. Although the exercise of options is uncertain, we believe the incumbent enjoys significant advantages. The longevity of these contracts assists management in predicting revenues, operating income and cash flows. The Company anticipate recognizingexpects approximately 41% of this total during fiscal 2010. Management also estimates that approximately 93% of forecasted fiscal 2010 revenue is in the form of backlog and option periods. Option periods are not included in the backlog calculation.balance to be recognized in fiscal 2011 and expects backlog, in addition to anticipated option period renewals, to represent 97% of estimated 2011 revenues.
10
Table of Contents
Seasonal Nature of Business
We may experience seasonality in our Operations Segmentbusiness particularly in our fourth fiscal quarter as a result of tax credit work.work in the Human Services Segment. In addition, the summer and winter holiday vacations can impact the financial
Table of Contents
results for all of our segments. Specifically, reductions in working days due to holidays and vacations may impact our sales and accounts receivable, primarily in our first fiscal quarter.
Employees
As of September 30, 2009,2010, we had 6,5946,834 employees, consisting of 6,2044,470 employees in the OperationsHealth Services Segment, 2012,187 employees in the ConsultingHuman Services Segment and 189177 corporate administrative employees. Our success depends in large part on attracting, retaining, and motivating talented, innovative, and experienced professionals at all levels.
As of September 30, 2009, 3892010, 343 of our employees in Canada were covered under three different collective bargaining agreements, each of which has different components and requirements. There are 219184 employees covered by the MAXIMUS BC Health Benefits Operations, Inc. collective bargaining agreement with the British Columbia Government and Services Employees'Employees’ Union ("BCGEU"(“BCGEU”). Within our subsidiary Themis Program Management and Consulting Limited, we have two agreements. Under the first agreement, 159148 employees are covered by a collective bargaining agreement with the BCGEU and, under the second agreement, 11 employees are covered by a collective bargaining agreement with the Professional Employees Association ("PEA"(“PEA”). These collective bargaining agreements expire on March 31, 2010.2011.
As of September 30, 2009, 7462010, 1,019 of our employees in Australia were covered under a Collective Agreement, which is similar in form to a collective bargaining agreement. The Collective Agreement is renewed annually.
None of our other employees are covered under any such agreement. We consider our relations with our employees to be good.
Foreign Operations
We currently operate predominantly in the United States. Our revenues derived from operations in foreign countries for fiscal years 2007, 2008 and 2009 were $88.0 million, $121.2 million and $119.1 million, respectively. We had $43.0 million and $57.2 million of long-lived assets located in foreign countries at September 30, 2008 and 2009, respectively.
Website Access to U.S. Securities and Exchange Commission Reports
Our Internet address ishttp://www.maximus.com and includes access to our corporate governance materials and our code of business conduct and ethics. Through our website, we make available, free of charge, access to all reports filed with the U.S. Securities and Exchange Commission (SEC) including our Annual Reports on Form 10-K, our Quarterly Reports on Form 10-Q, our Current Reports on Form 8-K, Section 16 filings by our officers and directors, as well as amendments to these reports, as filed with or furnished to the SEC pursuant to Section 13(a) or 15(d) of the Securities Exchange Act of 1934, after we electronically file such material with, or furnish it to, the SEC. Copies of any materials we file with, or furnish to, the SEC can also be obtained free of charge through the SEC'sSEC’s website athttp://www.sec.gov or at the SEC'sSEC’s Public Reference Room at 100 F St., N.E., Washington, DC 20549. You may obtain information on the operation of the Public Reference Room by calling the SEC at 1-800-SEC-0330.
ITEM 1A. Risk Factors.
Our operations are subject to many risks that could adversely affect our future financial condition and performance and, therefore, the market value of our securities. See Exhibit 99.1 of this Annual Report on Form 10-K under the caption "Special“Special Considerations and Risk Factors"Factors” for information on
Table of Contents
risks and uncertainties that could affect our future financial condition and performance. The information in Exhibit 99.1 is incorporated by reference into this Item 1A.
ITEM 2. Properties.
We own a 60,000 square foot office building in Reston, Virginia. We also lease offices for management and administrative functions in connection with the performance of our services. At September 30, 2009,2010, we leased 7967 offices in the United States totaling approximately 1,158,0001,055,000 square feet. In four countries outside the United States, we leased 103113 offices containing approximately 368,000430,000 square feet. The lease terms vary from month-to-month to six-yearseven-year leases and are generally at market rates.
We believe that our properties are maintained in good operating condition and are suitable and adequate for our purposes.
11
Table of Contents
ITEM 3. Legal Proceedings.
The Company is involved in various legal proceedings, including contract and employment claims,the matters described below, in the ordinary course of its business. The matters reported on below involve significant pending or potential claims against us.
(a) In December 2008, MAXIMUS, Accenture LLP and the Texas Health and Human Services Commission ("HHSC") entered into an agreement settling all claims among the parties arising from a prime contract between Accenture and HHSC for integrated eligibility services and a subcontract between MAXIMUS and Accenture in support of the prime contract. In connection with that settlement, MAXIMUS paid a total of $40.0 million and agreed to provide services to HHSC valued at an additional $10.0 million. The Company's primary insurance carrier paid $12.5 million of the amount due from MAXIMUS. In May 2009, the Company recovered an additional $6.3 million from one of its excess insurance carriers. The Company continues to pursue additional insurance recoveries from its other excess insurance carriers; however, such recoveries are not assured.
(b) In November 2007, MAXIMUS was sued by the State of Connecticut in the Superior Court in the Judicial District of Hartford. MAXIMUS had entered into a contract in 2003 with the Connecticut Department of Information Technology to update the State's criminal justice information system. The State claims that MAXIMUS breached its contract and also alleges negligence and breach of the implied warranty of fitness for a particular purpose. MAXIMUS has sued its primary subcontractor on the effort (ATS Corporation) which abandoned the project before completing its obligations. Although the State did not specify damages in its complaint, it demanded payment of alleged damages of approximately $6.2 million in a letter sent to the Company in September 2007. The Company denies that it breached its contract with the State. The Company cannot predict the outcome of the legal proceedings or any settlement negotiations or the impact they may have on the Company's operating results or financial condition.
(c) In March 2009, a state Medicaid agency asserted a claim against MAXIMUS in the amount of $2.3 million in connection with a contract MAXIMUS had through February 1, 2009 to provide Medicaid administrative claiming services to school districts in the state. MAXIMUS entered into separate agreements with the school districts under which MAXIMUS helped the districts prepare and submit claims to the state Medicaid agency which, in turn, submitted claims for reimbursement to the Federal government. No legal action has been initiated. The state has asserted that its agreement with MAXIMUS requires the Company to reimburse the state for the amounts owed to the Federal government. However, the Company'sCompany’s agreements with the school districts require them to reimburse MAXIMUS for such payments and therefore MAXIMUS believes the school districts are responsible for any amounts disallowed by the state Medicaid agency or the Federal government. Accordingly, the Company believes its exposure in this matter is limited to its fees associated with this work and that the
Table of Contents
school districts will be responsible for the remainder. During the second quarter of fiscal 2009,MAXIMUS recorded a $0.7 million reduction of revenue reflecting the fees it earned under the contract in the accompanying condensed consolidated statements of operations. No additional charges have been recorded since then.contract. MAXIMUS has exited the Federal healthcare claiming business and no longer provides the services at issue in this matter.
(d)
In July 2009August 2010 the District of Columbia ("District") initiatedCompany received a civil action against MAXIMUS in the Superior Court of the District of Columbia, Civil Division. The District alleged violations of the District's False Claims Act ("Act"), fraud and unjust enrichment arising from the Company's preparation and submission of federal Medicaid reimbursement claimsdraft audit report prepared on behalf of one of its former SchoolMAX customers. The SchoolMAX business line was sold as part of the District.divestiture of the MAXIMUS Education Systems division in 2008. The District was seeking treble its actual damages plusdraft audit report recommends a penaltyrefund of $10,000 per claim as provided underapproximately $11.6 million primarily arising out of the Act.alleged failure of MAXIMUS previously settled a Federal investigation and related whistleblower lawsuit concerning these same activities in 2007. In connection with that settlement, MAXIMUS entered into a two-year Deferred Prosecution Agreement ("DPA"), a five-year Corporate Integrity Agreement ("CIA") and paid a settlement of $30.5 million. The DPA has since expired by its terms and the CIA has been suspended in lightbuyer of the Company's exit fromdivision to observe the Federal health care claiming business.most favored customer pricing term of the contract. MAXIMUS believes the audit report is incorrect and that no amounts are owed as a refund. The District was, in fact,Company is working with the customer to resolve this matter before the audit report is finalized. To the extent that a named partyresolution is not reached, MAXIMUS will contest the matter through the dispute resolution process set forth in the prior whistleblower lawsuit that was dismissed with prejudice, and MAXIMUS believes that the District's claims are barred. In October 2009, the District voluntarily dismissed the lawsuit without prejudice.contract.
12
Table of Contents
PART II
ITEM 5. Market for Registrant'sRegistrant’s Common Equity, Related Stockholder Matters and Issuer Purchases of Equity Securities.
Our common stock trades on the New York Stock Exchange under the symbol "MMS."“MMS.” The following table sets forth, for the fiscal periods indicated, the range of high and low sales prices for our common stock and the cash dividends per share declared on the common stock.
| | | | | | | | | | | |
| | Price Range | |
| |
|---|
| | High | | Low | | Dividends | |
|---|
Year Ended September 30, 2008: | | | | | | | | | | |
| | First Quarter | | $ | 48.33 | | $ | 37.05 | | $ | 0.10 | |
| | Second Quarter | | | 38.91 | | | 33.76 | | | 0.10 | |
| | Third Quarter | | | 39.09 | | | 34.49 | | | 0.10 | |
| | Fourth Quarter | | | 38.59 | | | 32.82 | | | 0.10 | |
Year Ended September 30, 2009: | | | | | | | | | | |
| | First Quarter | | $ | 37.02 | | $ | 25.94 | | $ | 0.10 | |
| | Second Quarter | | | 40.93 | | | 32.78 | | | 0.12 | |
| | Third Quarter | | | 43.61 | | | 37.27 | | | 0.12 | |
| | Fourth Quarter | | | 48.49 | | | 39.10 | | | 0.12 | |
| | Price Range | | | |
| | High | | Low | | Dividends | |
Year Ended September 30, 2009: | | | | | | | |
First Quarter | | $ | 37.02 | | $ | 25.94 | | $ | 0.10 | |
Second Quarter | | 40.93 | | 32.78 | | 0.12 | |
Third Quarter | | 43.61 | | 37.27 | | 0.12 | |
Fourth Quarter | | 48.49 | | 39.10 | | 0.12 | |
Year Ended September 30, 2010: | | | | | | | |
First Quarter | | $ | 51.28 | | $ | 43.41 | | $ | 0.12 | |
Second Quarter | | 62.01 | | 47.57 | | 0.12 | |
Third Quarter | | 65.21 | | 57.00 | | 0.12 | |
Fourth Quarter | | 62.25 | | 53.52 | | 0.12 | |
As of October 30, 2009,31, 2010, there were 7663 holders of record of our outstanding common stock. The number of holders of record is not representative of the number of beneficial owners due to the fact that many shares are held by depositories, brokers, or nominees. We estimate there are approximately 9,98411,075 beneficial owners of our common stock.
We declared quarterly cash dividends on our common stock at the rate of $0.10 per share beginning with the quarter ended March 31, 2005, increasing the rate to $0.12 per share beginning with the period ended March 31, 2009. We expect to continue our policy of paying regular cash dividends, although there is no assurance as to future dividends. Future cash dividends, if any, will be paid at the discretion of our Board of Directors and will depend, among other things, upon our future operations and earnings, capital requirements and surplus, general financial condition, contractual restrictions and such other factors as our Board of Directors may deem relevant.
The following table sets forth the information required regarding repurchases of common stock that we made during the three months ended September 30, 2010:
Period | | Total
Number of
Shares
Purchased | | Average
Price Paid
per Share | | Total Number of
Shares Purchased as
Part of Publicly
Announced Plans (1) | | Approximate Dollar
Value of Shares that
May Yet Be
Purchased
Under the Plan
(in thousands) | |
Jul. 1, 2010 — Jul. 31, 2010 | | 40,000 | | $ | 57.23 | | 40,000 | | $ | 36,116 | |
| | | | | | | | | |
Aug. 1, 2010 — Aug 31, 2010 | | 239,752 | | 56.35 | | 239,752 | | $ | 23,813 | |
| | | | | | | | | |
Sep. 1, 2010 — Sep. 30, 2010 | | 28,235 | | 56.46 | | 28,235 | | $ | 122,755 | |
| | | | | | | | | |
Total | | 307,987 | | $ | 56.48 | | 307,987 | | | |
(1)Under a resolution adopted on July 22, 2008, which rescinds and supersedes all previous resolutions, the Board of Directors has authorized the repurchase, at management’s discretion, of up to an aggregate of $75.0 million of the Company’s common stock. The resolution also authorized the use of option exercise proceeds for the repurchase of the Company’s common stock. In September 2010, a further board resolution increased the authorized purchases by an additional $100 million. The Board of Directors has not set an expiration date for this authorized repurchase.
13
Table of Contents
Stock Performance Graph
The following graph compares the cumulative total shareholder return on our common stock for the five-year period from September 30, 20042005 to September 30, 2009,2010, with the cumulative total return for the NYSE Stock Market (U.S. Companies) Index and a peer group comprising Accenture, CGI, Hewlett Packard, IBM and Xerox. The peer group companies represent a mix of information technology, outsourcing and management consultancy businesses and reflect a cross section of businesses against whom the Company competes for business and executive talent. The peer group is weighted by market capitalization. In prior years, the cumulative shareholder return of our stock has been compared with the NYSE/AMEX/NASDAQ Stocks (SIC 8740-8749 U.S. Companies) Management and Public Relations Services Index. As MAXIMUS has divested a number of businesses, the index is no longer seen as an appropriate gauge against which to monitor the Company’s performance. It has been included below for reference. This graph assumes the investment of $100 on September 30, 20042005 in our common stock, the NYSE Stock Market (U.S. Companies) Index, our peer group and the NYSE/AMEX/NASDAQ Stocks (SIC 8740-8749 U.S. Companies) Management and Public Relations Services Index and assumes dividends are reinvested.
Comparison of Five—Year Cumulative Total Returns
Performance Graph for
MAXIMUS, INC.
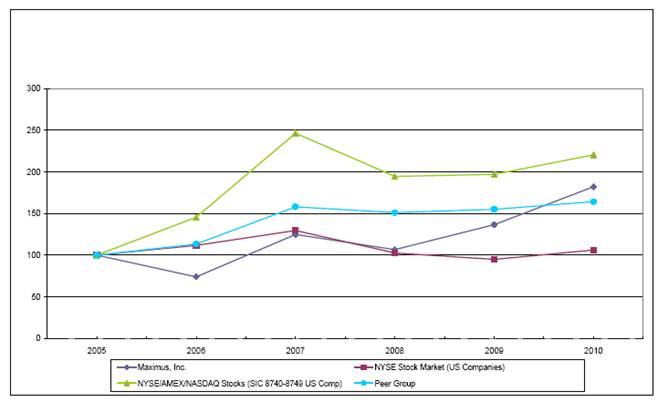
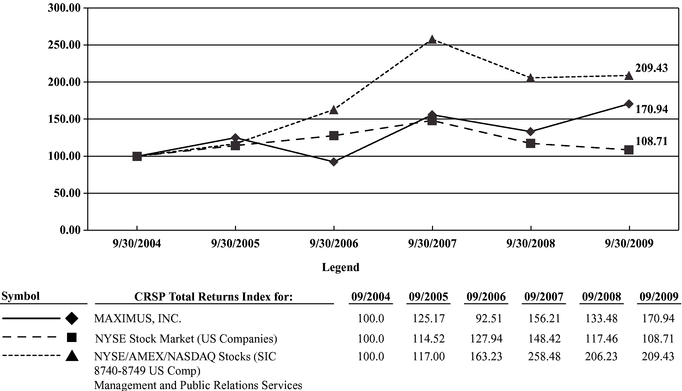
Notes:
A.
- The lines represent index levels derived from compounded daily returns that include all dividends.
B.
- The indexes are reweighted daily, using the market capitalization on the previous trading day.
C.
- If the monthly interval, based on the fiscal year-end, is not a trading day, the preceding trading day is used.
D.
- The index level for all series was set to $100.0 on 09/30/
2004.
2005.
Prepared by Zacks Investment Research, Inc. Copyright 1960-20091960-2010 CRSP Center for Research in Security Prices, Graduate School of Business, University of Chicago. Used with permission. All rights reserved.
14
Table of Contents
ITEM 6. Selected Financial Data.
We have derived the selected consolidated financial data presented below, as adjusted for discontinued operations, from our consolidated financial statements and the related notes. The revenue and operating results related to the acquisition of companies using the purchase accounting method are included from the respective acquisition dates. The selected financial data should be read in conjunction with "Management's“Management’s Discussion and Analysis of Financial Condition and Results of Operations"Operations” included as Item 7 of this Annual Report on Form 10-K and with the Consolidated Financial Statements and related Notes included as Item 8 of this Annual Report on Form 10-K. The historical results set forth in this Item 6 are not necessarily indicative of the results of operations to be expected in the future.
| | Year Ended September 30, | |
| | 2006 | | 2007 | | 2008 | | 2009 | | 2010 | |
| | (In thousands, except per share data) | |
Statement of Operations Data: | | | | | | | | | | | |
Revenue | | $ | 557,974 | | $ | 584,586 | | $ | 699,552 | | $ | 720,108 | | $ | 831,749 | |
Legal and settlement expense (recovery), net (1) | | 9,394 | | 44,438 | | 38,358 | | (4,271 | ) | (5,351 | ) |
Write-off of deferred contract costs (2) | | 17,109 | | — | | — | | — | | — | |
Gain on sale of building (3) | | — | | — | | 3,938 | | — | | — | |
Operating income (loss) from continuing operations | | (13,590 | ) | (7,146 | ) | 46,028 | | 88,589 | | 107,406 | |
Income (loss) from continuing operations | | (4,053 | ) | (10,954 | ) | 29,462 | | 53,841 | | 69,397 | |
Income (loss) from discontinued operations (4) | | 6,513 | | 2,699 | | (22,785 | ) | (7,301 | ) | 1,012 | |
Net income (loss) (5) | | $ | 2,460 | | $ | (8,255 | ) | $ | 6,677 | | $ | 46,540 | | $ | 70,409 | |
Basic Earnings (loss) per share: | | | | | | | | | | | |
Income (loss) from continuing operations | | $ | (0.19 | ) | $ | (0.50 | ) | $ | 1.55 | | $ | 3.06 | | $ | 3.99 | |
Income (loss) from discontinued operations | | 0.30 | | 0.12 | | (1.20 | ) | (0.41 | ) | 0.05 | |
Basic earnings (loss) per share | | $ | 0.11 | | $ | (0.38 | ) | $ | 0.35 | | $ | 2.65 | | $ | 4.04 | |
Diluted Earnings (loss) per share: | | | | | | | | | | | |
Income (loss) from continuing operations | | $ | (0.19 | ) | $ | (0.50 | ) | $ | 1.53 | | $ | 3.01 | | $ | 3.86 | |
Income (loss) from discontinued operations | | 0.30 | | 0.12 | | (1.18 | ) | (0.41 | ) | 0.06 | |
Diluted earnings (loss) per share | | $ | 0.11 | | $ | (0.38 | ) | $ | 0.35 | | $ | 2.60 | | $ | 3.92 | |
Weighted average shares outstanding: | | | | | | | | | | | |
Basic | | 21,465 | | 21,870 | | 19,060 | | 17,570 | | 17,413 | |
Diluted | | 21,465 | | 21,870 | | 19,305 | | 17,886 | | 17,965 | |
Cash dividends per share of common stock | | $ | 0.40 | | $ | 0.40 | | $ | 0.40 | | $ | 0.46 | | $ | 0.48 | |
15
| | | | | | | | | | | | | | | | | |
| | Year Ended September 30, | |
|---|
| | 2005 | | 2006(1) | | 2007 | | 2008(2) | | 2009 | |
|---|
| | (In thousands, except per share data)
| |
|---|
Statement of Operations Data: | | | | | | | | | | | | | | | | |
Revenue | | $ | 491,295 | | $ | 557,974 | | $ | 583,020 | | $ | 693,663 | | $ | 717,299 | |
Legal and settlement expense (recovery), net(3) | | | 7,000 | | | 9,394 | | | 44,438 | | | 38,358 | | | (4,271 | ) |
Write-off of deferred contract costs(4) | | | — | | | 17,109 | | | — | | | — | | | — | |
Gain on sale of building(5) | | | — | | | — | | | — | | | 3,938 | | | — | |
Operating income (loss) from continuing operations | | | 31,199 | | | (13,590 | ) | | (7,048 | ) | | 46,616 | | | 89,815 | |
Income (loss) from continuing operations | | | 20,898 | | | (4,052 | ) | | (10,893 | ) | | 29,818 | | | 54,583 | |
Income (loss) from discontinued operations | | | 15,171 | | | 6,512 | | | 2,638 | | | (23,141 | ) | | (8,043 | ) |
| | | | | | | | | | | | |
Net income (loss) | | | 36,069 | | | 2,460 | | | (8,255 | ) | | 6,677 | | | 46,540 | |
| | | | | | | | | | | | |
Basic Earnings (loss) per share: | | | | | | | | | | | | | | | | |
| | Income (loss) from continuing operations | | $ | 0.98 | | $ | (0.19 | ) | $ | (0.50 | ) | $ | 1.56 | | $ | 3.11 | |
| | Income (loss) from discontinued operations | | $ | 0.71 | | $ | 0.30 | | $ | 0.12 | | $ | (1.21 | ) | $ | (0.46 | ) |
| | | | | | | | | | | | |
| | Basic earnings (loss) per share | | $ | 1.69 | | $ | 0.11 | | $ | (0.38 | ) | $ | 0.35 | | $ | 2.65 | |
| | | | | | | | | | | | |
Diluted Earnings (loss) per share: | | | | | | | | | | | | | | | | |
| | Income (loss) from continuing operations | | $ | 0.97 | | $ | (0.19 | ) | $ | (0.50 | ) | $ | 1.54 | | $ | 3.05 | |
| | Income (loss) from discontinued operations | | $ | 0.70 | | $ | 0.30 | | $ | 0.12 | | $ | (1.19 | ) | $ | (0.45 | ) |
| | | | | | | | | | | | |
| | Diluted earnings (loss) per share | | $ | 1.67 | | $ | 0.11 | | $ | (0.38 | ) | $ | 0.35 | | $ | 2.60 | |
| | | | | | | | | | | | |
Weighted average shares outstanding: | | | | | | | | | | | | | | | | |
| | Basic | | | 21,331 | | | 21,465 | | | 21,870 | | | 19,060 | | | 17,570 | |
| | Diluted | | | 21,653 | | | 21,465 | | | 21,870 | | | 19,305 | | | 17,886 | |
Cash dividends per share of common stock | | $ | 0.30 | | $ | 0.40 | | $ | 0.40 | | $ | 0.40 | | $ | 0.46 | |
Table of Contents
| | At September 30, | |
| | 2006 | | 2007 | | 2008 | | 2009 | | 2010 | |
| | (In thousands) | |
Balance Sheet Data: | | | | | | | | | | | |
Cash, cash equivalents, and marketable securities | | $ | 156,860 | | $ | 196,682 | | $ | 119,605 | | $ | 87,815 | | $ | 155,321 | |
Working capital | | 254,811 | | 267,145 | | 149,966 | | 164,646 | | 191,461 | |
Total assets | | 558,501 | | 564,464 | | 454,954 | | 433,234 | | 527,741 | |
Long-term debt, including capital lease obligations | | 2,044 | | 417 | | — | | — | | 1,411 | |
Total shareholders’ equity | | 404,899 | | 409,400 | | 275,706 | | 297,128 | | 338,789 | |
| | | | | | | | | | | | | | | | |
| | | | | | | | | | | | | | | | |
| | At September 30, | |
|---|
| | 2005 | | 2006 | | 2007 | | 2008 | | 2009 | |
|---|
| | (In thousands)
| |
|---|
Balance Sheet Data: | | | | | | | | | | | | | | | | |
Cash, cash equivalents, and marketable securities | | $ | 178,363 | | $ | 156,860 | | $ | 196,682 | | $ | 119,605 | | $ | 87,815 | |
Working capital | | | 246,595 | | | 254,811 | | | 267,145 | | | 149,966 | | | 164,646 | |
Total assets | | | 534,562 | | | 558,501 | | | 564,464 | | | 454,954 | | | 433,234 | |
Total capital lease obligations, less current portion | | | 3,606 | | | 2,044 | | | 417 | | | — | | | — | |
Total shareholders' equity | | | 405,954 | | | 404,899 | | | 409,400 | | | 275,706 | | | 297,128 | |
(1)
During fiscal year 2005, the Company valued stock option grants using the intrinsic value at date of grant. For fiscal years 2006 and following, stock option grants were valued based upon the fair value using a Black-Scholes model. At October 1, 2005, options which had previously been granted but had not vested were revalued based upon their grant date fair value and the fair value related to the remaining vesting period was expensed over the remaining vesting period of the options. The results for 2005 and prior periods were not restated to reflect this change in accounting policy.
(2)Since October 1, 2007, the Company has accounted for uncertain tax positions by recognizing the financial statement effects of a tax position only when, based upon the technical merits, it is "more-likely-than-not" that the position will be sustained upon examination. See "Note 12. Income Taxes" to our consolidated financial statements.
(3)- Legal and settlement expense (recovery), net consists of costs, net of reimbursed insurance claims, related to significant legal settlements and non-routine legal matters, including future probable legal costs estimated to be incurred in connection with those matters. Legal expenses incurred in the ordinary course of business are included in selling, general and administrative expense. See
"Note 20.“Note 17. Legal and Settlement Expense (Recovery), Net"Net” to our consolidated financial statements for additional information.
(4)(2)During the quarter ended June 30, 2006, we determined that the estimated undiscounted cash flows associated with the Texas Integrated Eligibility project over its remaining term were insufficient to recover the project'sproject’s deferred contract costs. As a result, we recognized a non-cash impairment charge of $17.1 million to write off the full unamortized balance of the project'sproject’s deferred contract costs. The write-off is included in the results of the Operations Segment. Additional information regarding the Texas Integrated Eligibility project is disclosed in "Note 19. Texas Integrated Eligibility Project" to our consolidated financial statements.
(5)(3)During the quarteryear ended JuneSeptember 30, 2008, the Company sold a 21,000 square foot administrative building in McLean, Virginia and recognized a pre-tax gain on the sale of $3.9 million. This gain has been classified as a gain on sale of building in the consolidated statement of operations. See "Note“Note 22. Sale of Building"Building” to our consolidated financial statements for additional information.
(4)On September 30, 2010, the Company sold its ERP division for cash proceeds of $5.6 million, net of transaction costs of $0.7 million, and recognized a pre-tax loss on sale of less than $0.1 million. The Company previously recorded a pre-tax loss on sale of $1.3 million in fiscal 2009. In completing this sale, the Company elected to retain a single contract that had previously been included within the ERP division. This contract had identifiable cash flows and requires MAXIMUS to provide services which are dissimilar to other projects within the ERP division. The retained contract has been transferred to another business division within continuing operations. The results of this contract have been included in continuing operations for all the periods shown above. See “Note 21. Discontinued Operations” to our consolidated financial statements for additional information.
(5)Under new accounting guidance effective since October 1, 2007, the Company has accounted for uncertain tax positions by recognizing the financial statement effects of a tax position only when, based upon the technical merits, it is “more-likely-than-not” that the position will be sustained upon examination. See “Note 18. Income Taxes” to our consolidated financial statements.
16
Table of Contents
ITEM 7. Management'sManagement’s Discussion and Analysis of Financial Condition and Results of Operation.
The following discussion and analysis of financial condition and results of operations is provided to enhance the understanding of, and should be read in conjunction with, our Consolidated Financial Statements and the related Notes.
Forward-Looking Statements
Included in this Annual Report on Form 10-K are forward-looking statements within the meaning of the Private Securities Litigation Reform Act of 1995. These forward-looking statements are based on current expectations, estimates, forecasts and projections about our company, the industry in which we operate and other matters, as well as management'smanagement’s beliefs and assumptions and other statements that are not historical facts. Words such as "anticipate," "believe," "could," "expect," "estimate," "intend," "may," "opportunity," "plan," "potential," "project," "should,"“anticipate,” “believe,” “could,” “expect,” “estimate,” “intend,” “may,” “opportunity,” “plan,” “potential,” “project,” “should,” and "will"“will” and similar expressions are intended to identify forward-looking statements and convey uncertainty of future events or outcomes. These statements are not guarantees and involve risks, uncertainties and assumptions that are difficult to predict. Actual outcomes and results may differ materially from such forward-lookingforward- looking statements due to a number of factors, including without limitation, the factors set forth in Exhibit 99.1 of this Annual Report on Form 10-K under the caption "Special“Special Considerations and Risk Factors."” As a result of these and other factors, our past financial performance should not be relied on as an indication of future performance. Additionally, we caution investors not to place undue reliance on any forward-looking statements as these statements speak only as of the date when made. We undertake no obligation to publicly update or revise any forward-looking statements, whether resulting from new information, future events or otherwise.
Business Overview
We provide operations program management and consultingbusiness process outsourcing services focused in the areas ofto government health and human services primarily foragencies under our mission of Helping Government Serve the People.®Our business is focused almost exclusively on administering government-sponsored programs such as Medicaid, and the Children'sChildren’s Health Insurance Program (CHIP)., health care reform, welfare-to-work, Medicare, child support enforcement and other government programs. Founded in 1975, we are one of the largest pure-play health and human services provideradministrative providers to governmentgovernments in the United States, Australia, Canada and are at the forefront of innovation in meeting our mission ofHelping Government Serve the People®.United Kingdom. We use our expertise, experience and advanced technological solutions to help government agencies run more efficient, and cost-effective programs and to improve program accountability, while improvingenhancing the quality of services provided to program beneficiaries. We operate
During recent years, the Company has made a number of changes to the business to eliminate unprofitable lines of business, focus on the Company’s core health and human services business, and put into place a risk management structure to enable focus on profitable growth. These steps have included the expansion of the Company’s core business, both domestically and internationally, the divestiture of several non-core businesses during 2008 and 2010, and the exit from an unprofitable contract in 2008, which resulted in a large legal and settlement expense in that year. The growth in 2010 in the United States,welfare-to-work business in Australia Canada,and the United Kingdom and Israel.has increasingly made the company a global competitor. We have held contracts with government agenciesbelieve the growth in all 50 states in the U.S.
For the fiscal year ended September 30, 2009, we had revenue of $717.3 millionrevenues and net income in these periods reflects the steps taken to improve the focus of $46.5 million.this business.
We report each
During the fourth quarter, the Company aligned its organization of ourthe business to reflect its focus on the administration of government health and human services programs. As a result of this organizational realignment, the Company has reclassified its segment financial information to reflect the two linesnew operating segments of business (i.e., OperationsHealth Services and Consulting) as separate external reporting segments.Human Services. All historical results have been recast to reflect the organization in its current form. See Note 17“Note 20. Quarterly Information” to our consolidated financial statements for our unaudited quarterly segment income statement data.
17
Table of Contents
Results of Operations
Consolidated
The following table sets forth, for the fiscal year ends indicated, selected statements of operations data:
| | | | | | | | | | | |
| | Year ended September 30, | |
|---|
| | 2007 | | 2008 | | 2009 | |
|---|
| | (dollars in thousands,
except per share data)
| |
|---|
Revenue | | $ | 583,020 | | $ | 693,663 | | $ | 717,299 | |
Gross profit | | $ | 134,869 | | $ | 189,022 | | $ | 192,267 | |
Selling, general and administrative expense | | $ | 97,930 | | $ | 107,986 | | $ | 106,723 | |
Selling, general and administrative expense as a percentage of revenue | | | 16.8 | % | | 15.6 | % | | 14.9 | % |
Legal and settlement expense (recovery), net | | $ | 44,438 | | $ | 38,358 | | $ | (4,271 | ) |
Gain on sale of building | | $ | — | | $ | 3,938 | | $ | — | |
Gain on sale of business | | | 451 | | | — | | | — | |
Operating income (loss) from continuing operations | | $ | (7,048 | ) | $ | 46,616 | | $ | 89,815 | |
Operating margin (loss) from continuing operations percentage | | | (1.2 | )% | | 6.7 | % | | 12.5 | % |
Income (loss) from discontinued operations, net of income taxes | | $ | 2,638 | | $ | (23,141 | ) | $ | (8,043 | ) |
Net income (loss) | | $ | (8,255 | ) | $ | 6,677 | | $ | 46,540 | |
Basic Earnings (loss) per share: | | | | | | | | | | |
| | Income (loss) from continuing operations | | $ | (0.50 | ) | $ | 1.56 | | $ | 3.11 | |
| | Income (loss) from discontinued operations | | $ | 0.12 | | $ | (1.21 | ) | $ | (0.46 | ) |
| | | | | | | | |
| | Basic earnings (loss) per share | | $ | (0.38 | ) | $ | 0.35 | | $ | 2.65 | |
Diluted Earnings (loss) per share: | | | | | | | | | | |
| | Income (loss) from continuing operations | | $ | (0.50 | ) | $ | 1.54 | | $ | 3.05 | |
| | Income (loss) from discontinued operations | | $ | 0.12 | | $ | (1.19 | ) | $ | (0.45 | ) |
| | | | | | | | |
| | Diluted earnings (loss) per share | | $ | (0.38 | ) | $ | 0.35 | | $ | 2.60 | |
| | Year ended September 30, | |
| | 2008 | | 2009 | | 2010 | |
| | (dollars in thousands,
except per share data) | |
Revenue | | $ | 699,552 | | $ | 720,108 | | $ | 831,749 | |
Gross profit | | 190,891 | | 191,346 | | 220,833 | |
Selling, general and administrative expense | | 110,443 | | 107,028 | | 118,778 | |
Selling, general and administrative expense as a percentage of revenue | | 15.8 | % | 14.9 | % | 14.3 | % |
Gain on sale of building | | 3,938 | | — | | — | |
Legal and settlement expense (recovery), net | | 38,358 | | (4,271 | ) | (5,351 | ) |
Operating income from continuing operations | | 46,028 | | 88,589 | | 107,406 | |
Operating margin from continuing operations | | 6.6 | % | 12.3 | % | 12.9 | % |
Interest and other income, net | | 2,423 | | 145 | | 916 | |
Provision for income taxes | | 18,989 | | 34,893 | | 38,925 | |
Income (loss) from discontinued operations, net of income taxes | | (17,150 | ) | (5,734 | ) | 1,040 | |
Loss on disposal | | (5,635 | ) | (1,567 | ) | (28 | ) |
Net income | | $ | 6,677 | | $ | 46,540 | | $ | 70,409 | |
Basic Earnings (loss) per share: | | | | | | | |
Income from continuing operations | | $ | 1.55 | | $ | 3.06 | | $ | 3.99 | |
Income (loss) from discontinued operations | | (1.20 | ) | (0.41 | ) | 0.05 | |
Basic earnings per share | | $ | 0.35 | | $ | 2.65 | | $ | 4.04 | |
Diluted Earnings (loss) per share: | | | | | | | |
Income from continuing operations | | $ | 1.53 | | $ | 3.01 | | $ | 3.86 | |
Income (loss) from discontinued operations | | (1.18 | ) | (0.41 | ) | 0.06 | |
Diluted earnings per share | | $ | 0.35 | | $ | 2.60 | | $ | 3.92 | |
We discuss constant currency revenue information to provide a framework for assessing how our business performed excluding the effect of foreign currency rate fluctuations. To provide this information, revenue from foreign operations is converted tointo United States dollars using the average exchange rates from 2008. All our foreign operationsthe previous fiscal year.
We also discuss organic growth revenue information to provide a framework for assessing how the business performed excluding the effect of business combinations. To provide this information, revenue from recently-acquired entities is removed from the current and prior years with no full-year comparative revenues.
Both constant currency and organic growth revenue information are non-GAAP numbers. We believe that these numbers provide a useful basis for assessing the Company’s performance. The presentation of these non-GAAP numbers is not meant to be considered in the Operations Segment.isolation, or as an alternative to revenue growth as a measure of performance.
Revenue increased 3.4%, and increased 6.5% on15.5% to $831.7 million for the year ended September 30, 2010, compared with the prior year. Organic growth was responsible for 14.5% of this growth. On a constant currency basis, in fiscalthe revenue growth would have been 11.2%.
The principal driver of growth was the Human Services Segment. See “Human Services Segment” below.
Revenue increased 2.9% to $720.1 million for the year ended September 30, 2009, compared with the prior year. Organic growth was responsible for 2.0% of this growth. On a constant currency basis, the revenue increase would have been 6.1%.
18
Table of Contents
The principal driver of growth for the 2009 fiscal 2008.year was strong results in our Health Services Segment. The adverse impact of aHuman Services Segment was adversely affected by the strong United States Dollar, on foreign sourced revenuewhich was partially offset strong revenue growth in our domestic health services division, federal operations and international workforce operations, as well asby the benefit of a full year of operations from the Company’s UK subsidiary, which was acquired in the fourth quarter of fiscal 2008.
Revenue increased 19.0% in fiscal 2008 compared to fiscal 2007. The increase in revenue is attributable to organic growth driven by new work in the Operations Segment and the transformation of the Texas contract to a direct service agreement.
Operating income from continuing operations increased 93% in fiscal 2009, compared to fiscal 2008, from $46.6 million to $89.8 million. The increase of $43.2 is primarily attributable to a $4.3 million legal and settlement recovery in 2009 compared with a charge of $38.4 million in 2008. See the discussion of Legal and Settlement expense below for a breakdown of this balance. In addition, Consulting Segment operating income improved $3.6 million in fiscal 2009 compared to fiscal 2008. Fiscal 2008 benefited from a non-recurring $3.9 million gain on the sale of a property in McLean, Virginia.
Operating income from continuing operations in fiscal 2008 was $46.6 million, compared to an operating loss of $7.0 million in fiscal 2007. The increase in operating income from continuing
Table of Contents
operations of $53.7 million is primarily attributable to (1) $50.0 million of improved performance in the Operations Segment as a result of the Texas project where we entered into a direct contract agreement with the Texas Health and Human Services Commission, (2) a $6.1 million decrease in legal and settlement expense, (3) a $3.9 million gain on sale of building, offset by (4) a $4.5 million decrease in operating income in the Consulting Segment. Fiscal 2007 also included a $4.2 million loss on the completed Ontario Child Support systems implementation project.
Selling, general and administrative expense (SG&A) consists of costs related to general management, marketing and administration. These costs include salaries, benefits, bid and proposal efforts, travel, recruiting, continuing education, employee training, non-chargeable labor costs, facilities costs, printing, reproduction, communications, equipment depreciation, intangible amortization, and legal expenses incurred in the ordinary course of business,business. In fiscal 2008, SG&A includes an additional charge of $2.2 million related to the under-estimation of stock option charges in 2006 and non-cash equity based compensation.2007. Without this adjustment, SG&A expenses in that year as a percentage of revenue would have been 15.5%. In 2010, SG&A included a bad debt charge of $2.2 million related to a long-term receivable balance. Without this charge, SG&A as a percentage of revenue would have been 14.0%. SG&A as a percentage of revenue has declined year-on-year for fiscal years 2007, 2008 and 2009 was 16.8%, 15.6%, and 14.9%, respectively.each of the last two years. This is the result of improved efficiencies within the business.
Also included
Operating income from continuing operations increased 21.2% in SG&A were $3.8fiscal 2010 compared to fiscal 2009, from $88.6 million $9.5to $107.4 million. The increase of $18.8 million has been driven by growth in the business, the benefits of favorable exchange rates on foreign-sourced income, and $7.3 millionincreasing economies of non-cash, equity-based compensation relatedscale in operating the business.
Operating income from continuing operations increased 92% in fiscal 2009, compared to stock options and RSUs for fiscal years 2007, 2008 and 2009. During the first quarter of fiscal 2008, the Company identified an errorfrom $46.0 million to $88.6 million. The increase of $42.6 million is primarily attributable to a $4.3 million legal and settlement recovery in prior periods in recorded stock-based compensation expense related to stock options and RSUs. The error was due, in part, to how the software used by the Company applied estimated forfeiture rates to fully vested stock options and RSUs. The impact was to underestimate stock compensation expense by $1.12009 compared with a charge of $38.4 million in each2008. See the discussion of Legal and Settlement expense below for a breakdown of this balance. In addition, fiscal 2006 and 2007. The Company corrected this error by recording additional stock compensation expense2008 benefited from a non-recurring $3.9 million gain on the sale of $2.2 milliona property in the first quarter of fiscal 2008.McLean, Virginia.
Legal and settlement expense (recovery), net for fiscal years 2007, 2008, 2009 and 20092010 was $44.4 million, $38.4 million, ($4.3 million), and ($4.35.4 million), respectively. Legal and settlement expense (recovery) consists of costs, net of reimbursed insurance claims, related to significant legal settlements and non-routine legal matters, including future probable legal costs estimated to be incurred in connection with those matters. Legal expenses incurred in the ordinary course of business are included in selling, general and administrative expense.
Following a change in accounting standards, from October 1, 2009 the incremental costs of acquisitions, including legal fees, brokerage fees, and valuation reports, are included in this balance. Under previous accounting guidance, these expenses were included as part of the acquisition consideration of successful acquisitions. The following table sets forth the matters that represent legal and settlement expense (recovery), net (dollarsnet:
| | Year ended September 30, | |
| | 2008 | | 2009 | | 2010 | |
| | (Dollars in thousands) | |
Acquisition expenses | | $ | — | | $ | — | | $ | 254 | |
Accenture Arbitration, Related Settlement and Insurance Recoveries, net | | 38,377 | | (6,300 | ) | (7,500 | ) |
Other | | (19 | ) | 2,029 | | 1,895 | |
Total | | $ | 38,358 | | $ | (4,271 | ) | $ | 5,351 | |
In December 2008, MAXIMUS, Accenture LLP and the Texas Health and Human Services Commission (“HHSC”) entered into an agreement settling all claims among the parties arising from a prime contract between Accenture and HHSC for integrated eligibility services and a subcontract between MAXIMUS and Accenture in thousands):
| | | | | | | | | | |
| | Year ended September 30, | |
|---|
| | 2007 | | 2008 | | 2009 | |
|---|
Accenture Arbitration, Related Settlement and Insurance Recoveries, Net | | $ | 10,000 | | $ | 38,377 | | $ | (6,300 | ) |
District of Columbia Contract Investigation and Related Settlement | | | 31,980 | | | (19 | ) | | — | |
Computer Equipment Leases Settlement | | | (150 | ) | | — | | | — | |
Ontario Child Support Project Settlement | | | 2,608 | | | — | | | — | |
Other | | | — | | | — | | | 2,029 | |
| | | | | | | | |
Total | | $ | 44,438 | | $ | 38,358 | | $ | (4,271 | ) |
| | | | | | | | |
Legalsupport of the prime contract. In connection with that settlement, MAXIMUS paid a total of $40.0 million and settlement expense (recovery) net foragreed to provide services to HHSC valued at an additional $10.0 million. The Company’s primary insurance carrier paid $12.5 million of the amount due from MAXIMUS at the time of the settlement. In fiscal 2009, includes athe Company recovered an additional $6.3 million recovery from one of the Company'sits excess insurance carriers, forand in fiscal 2010 the Accenture arbitration matter. The Company continues to pursue additional insurance recoveriesrecovered $7.5 million from its otheranother excess insurance carriers; however, such recoveries are not assured.carrier.
Provisions for
The decrease in interest and other income taxesbetween 2008 and 2010 is primarily attributable to declines in market rates. At the beginning of fiscal 2008, the Company held a balance of cash and 2009 were 39.2%cash equivalents and 39.3%marketable securities of income from continuing operations for fiscal 2008$196.7 million. During the first quarter, $150 million was used as part of a share buyback, significantly reducing the cash balance and 2009, respectively. Provision for income taxes for fiscal 2007 was $9.6the consequent interest income. At the current time, the Company holds cash and cash equivalents in excess of $150 million which included:
•a $9.3 million tax benefit relatedbut is generating significantly lower returns on this balance due to legal and settlement expensesthe decline of $44.4 million (portionsmarket rates. Approximately half of the settlement expenseinterest earned in 2010 relates to interest on the loan note related to the Districtsale of Columbia matter are not tax deductible)Unison MAXIMUS Inc.,
discussed below under Discontinued Operations.19
Table of Contents
•a $0.7 million valuation allowance on certain deferred tax assets related to a foreign subsidiary's net operating losses, and
•a $18.8 million tax provision at 42.0% onProvisions for income taxes from continuing operations were 39.2%, 39.3%, and 35.9% in 2008, 2009 and 2010, respectively. The principal reason for the decline in the tax rate reflects the increasing amount of $43.2profit being recorded in foreign jurisdictions where income tax rates are lower than those within the United States of America. Certain non-recurring items, including adjustments to tax uncertainties and our operations in Israel, were responsible for a decline of 0.8% in the tax rate in 2010.
Health Services Segment
| | Year ended September 30, | |
| | 2008 | | 2009 | | 2010 | |
| | (dollars in thousands) | |
Revenue | | $ | 465,660 | | $ | 495,141 | | $ | 514,258 | |
Gross profit | | 126,729 | | 131,547 | | 130,276 | |
Operating income | | 70,176 | | 72,874 | | 64,725 | |
Operating margin percentage | | 15.1 | % | 14.7 | % | 12.6 | % |
| | | | | | | | | | |
The Health Services Segment provides a variety of business process outsourcing and administrative support services, as well as consulting services for state, provincial and federal programs, such as Medicaid, CHIP, Medicare, and the British Columbia Health Insurance Program.
In fiscal 2010, revenue increased 3.9% compared to fiscal 2009 driven by the acquisition of DeltaWare in 2010, which accounted for 1.4% of this growth, with the rest of the growth attributable to new work. Operating margin in 2010 was lower compared to fiscal 2009, principally due to the timing on contract rebids and the expansion of lower-risk, cost-reimbursable programs, where margins are typically lower.
Revenue increased 6.3% to $495.1 million (loss from continuing operationsin fiscal 2009 compared with fiscal 2008, driven by new work. Operating margin in fiscal 2009 was slightly lower compared to fiscal 2008, driven principally by the timing of $1.2 million offset by legal and settlement expenses of $44.4 million).
| | | | | | | | | | |
| | Year ended September 30, | |
|---|
| | 2007 | | 2008 | | 2009 | |
|---|
| | (dollars in thousands)
| |
|---|
Revenue | | $ | 507,486 | | $ | 629,226 | | $ | 659,204 | |
Gross profit | | | 102,886 | | | 163,308 | | | 169,749 | |
Operating income (loss) | | | 33,890 | | | 83,869 | | | 83,805 | |
Operating margin (loss) percentage | | | 6.7 | % | | 13.3 | % | | 12.7 | % |
Human Services Segment
| | Year ended September 30, | |
| | 2008 | | 2009 | | 2010 | |
| | (dollars in thousands) | |
Revenue | | $ | 233,892 | | $ | 224,967 | | $ | 317,491 | |
Gross profit | | 64,162 | | 59,799 | | 90,557 | |
Operating income | | 12,196 | | 12,353 | | 39,490 | |
Operating margin percentage | | 5.2 | % | 5.5 | % | 12.4 | % |
| | | | | | | | | | |
The OperationsHuman Services Segment includes healtha variety of business process outsourcing, case management, job training, and support services workforce services,for programs such as welfare-to-work programs, child support enforcement, K-12 special education, and federal managed services and operations work.other specialized consulting services.
Revenue
Revenues increased 4.8%41.1% to $317.5 million in fiscal 2010 compared to fiscal 2009. The increase is primarily driven by program expansion in Australia (which commenced in the fourth quarter of fiscal 2009) and new work in the United Kingdom (which commenced in the first quarter fiscal 2010). Operating margin improvement in fiscal 2010 compared to fiscal 2009 was driven by margin improvement attributed to revenue growth in Australia and the United Kingdom, with the results tempered by cost growth on a fixed price education contract in the United States.
Revenues decreased 3.8% to $225.0 million in fiscal 2009 compared to fiscal 2008. Revenue in fiscal 2008 included $6.9 million of non-recurring revenue related to hardware and software for a large health project. Normalized for non-recurring revenues and currency fluctuations, revenue increased 9.4% in fiscal 2009 compared to fiscal 2008. This increase was driven by growth in health services, federal operations and international workforce services operations. Operating income in fiscal 2009 was consistent with that in fiscal 2008. Although the Company recorded significant growth in federal and domestic health operations, this growthAustralia was offset by the effect of currency fluctuations as well as the start of a new contract which was successfully rebid in 2008. The reduced operating profit margin in 2009 also reflects required upfront investments and lagging revenue recognition related to operating costs for new work in Australia and Shelby County, Tennessee.
Revenue increased 24.0% in fiscal 2008 compared to fiscal 2007. The increase in revenue was primarily driven by new and expanding domestic and international work in our human and health services operations and the transformation of the Texas contract to a direct service agreement. Operating income in fiscal 2008 was $83.9 million, compared to $33.9 million in fiscal 2007. The increase in operating income of $50.0 million was driven by improvementsdeclines related to the optimization of the business portfolio; new awards; and the resolution of certain legacy contracts, including the transformation of the Texas contract to a direct service agreement.
| | | | | | | | | | |
| | Year ended September 30, | |
|---|
| | 2007 | | 2008 | | 2009 | |
|---|
| | (dollars in thousands)
| |
|---|
Revenue | | $ | 75,534 | | $ | 64,437 | | $ | 58,095 | |
Gross profit | | | 31,983 | | | 25,714 | | | 22,518 | |
Operating income (loss) | | | 3,586 | | | (909 | ) | | 2,652 | |
Operating margin percentage | | | 4.7 | % | | (1.4 | )% | | 4.6 | % |
The Consulting Segment includes program performance services, program and systems integrity services, and educational services.
Revenues declined from $75.5 million in 2007 to $64.4 million in 2008 and $58.1 million in 2009. Year-over-year revenue declines are principally related to the Company'sCompany’s wind down of its federal healthcareFederal claiming business, which the Company formally exited in fiscal 2009, as well as a general2009. The Company had approximately $6.1 million of acquired growth from the United Kingdom business acquired in 2008, offset by $15.0 million of decline caused by foreign exchange. Operating margin of 5.5% was consistent with an operating margin of 5.2% in consulting demand. Revenues for 2008 were also adversely affected by a charge of $2.7 million relating to a legacy federal claiming contract and revenues for 2009 benefited from $4.8 million related to hardware sales on a large Educational services project during the year.fiscal 2008.
20
Table of Contents
Operating income was $3.6 million in 2007, a loss of $0.9 million in 2008, and income of $2.7 million in 2009. The overall decline in income relates to the Company's wind down of its federal healthcare claiming work, with 2008 being adversely affected by a charge of $2.7 million relating to a federal healthcare claiming contract.
Interest and Other Income, Net
| | | | | | | | | | |
| | Year ended September 30, | |
|---|
| | 2007 | | 2008 | | 2009 | |
|---|
| | (dollars in thousands)
| |
|---|
Interest and other income, net | | $ | 5,804 | | $ | 2,423 | | $ | 145 | |
Percentage of revenue | | | 0.9 | % | | 0.3 | % | | 0.0 | % |
The decrease in interest and other income between 2007 and 2009 is primarily attributable to market rates and the use of $150 million of cash and marketable securities as part of the Accelerated Share Repurchase, completed in the first quarter of fiscal 2008, and a further $44.1 million used in additional share repurchases between the fourth quarter of fiscal 2008 and the second quarter of fiscal 2009.
Discontinued Operations
In
On September 2009,30, 2010, the Company committed tosold its ERP division for cash proceeds of $5.6 million, net of transaction costs of $0.7 million, and recognized a pre-tax loss on sale of its ERP business. We are actively pursuing a buyer and expect to complete this sale by the end of the 2010 fiscal year.less than $0.1 million. The Company has recordedpreviously recognized a pre-tax loss on sale of $1.3 million during 2009 relatingin fiscal 2009. In completing this sale, the Company elected to retain a single contract that had previously been included within the long-term fixed assetsERP division. This contract had identifiable cash flows and goodwill relatingrequires MAXIMUS to this business.provide services which are dissimilar to other projects within the ERP division. The retained contract has been transferred to another business division within the Health Services segment.
In fiscal 2008, this division also recorded a loss of $7.6 million relating to goodwill. In fiscal 2009, the division recorded a charge of $14.3 million attributable to a fixed-price ERP contract. These charges are included in losses from discontinued operations.
On April 30, 2008, the Company sold its Security Solutions division for cash proceeds of $4.6 million, net of transaction costs of $0.4 million, and recognized a pre-tax gain on the sale of $2.9 million.
On May 2, 2008, the Company sold its Unison MAXIMUS, Inc. subsidiary for proceeds of $6.5 million. The sale transaction is structured as a sale of stock to the current management team of the subsidiary. The sale price of $6.5 million consists of $0.1 million in cash and $6.4 million in the form of a promissory note secured by (1) a security interest in all of the assets of the former subsidiary; (2) a pledge of shares by the buyer; and (3) a personal guaranty by members of the current management team who are shareholders of the buyer. The Company has deferred recognition of a pre-tax gain on the sale of $3.9 million, and interest income on the promissory note, until realization is more fully assured. The deferred gain and deferred interest of $4.6 million and $4.5 million is reflected as a deduction from the note receivable on the consolidated balance sheetsheets as of September 30, 2009.2009 and 2010, respectively.
Justice Solutions, Education Systems and Asset Solutions
On September 30, 2008, the Company sold its Justice Solutions, Education Systems, and Asset Solutions divisions, which were previously reported as part of its Systems Segment. At that time, the Company recognized a pre-tax loss of $12.2 million, subject to adjustment for purchase price adjustments and estimated transaction costs. During fiscal 2009, the Company reached a final settlement with the purchaser, resulting in a pre-tax gain of $0.7 million.
Table of Contents
The following table summarizes the operating results of the discontinued operations included in the Consolidated Statements of Operations (in thousands):
| | | | | | | | | | | | | Year Ended September 30, | |
|
| | Year Ended September 30, | | | 2008 | | 2009 | | 2010 | |
|---|
|
| | 2007 | | 2008 | | 2009 | | | (Dollars in thousands) | |
|---|
Revenue | Revenue | | $ | 155,626 | | $ | 137,002 | | $ | 32,202 | | | $ | 131,113 | | $ | 29,393 | | $ | 27,054 | |
Income (loss) from operations before income taxes | Income (loss) from operations before income taxes | | $ | 4,362 | | $ | (28,920 | ) | $ | (10,704 | ) | | $ | (28,332 | ) | $ | (9,478 | ) | $ | 1,664 | |
Provision (benefit) for income taxes | Provision (benefit) for income taxes | | 1,724 | | (11,414 | ) | | (4,228 | ) | | (11,182 | ) | (3,744 | ) | 624 | |
| | | | | | | | | |
| | Income (loss) from discontinued operations | | $ | 2,638 | | $ | (17,506 | ) | $ | (6,476 | ) | |
| | | | | | | | | |
Income (loss) from discontinued operations | | | $ | (17,150 | ) | $ | (5,734 | ) | $ | 1,040 | |
Loss on disposal before income taxes | Loss on disposal before income taxes | | $ | — | | $ | (9,314 | ) | $ | (686 | ) | | $ | (9,314 | ) | $ | (686 | ) | $ | (45 | ) |
Provision (benefit) for income taxes | Provision (benefit) for income taxes | | — | | (3,679 | ) | | 881 | | | (3,679 | ) | 881 | | (17 | ) |
| | | | | | | | | |
| | Loss on disposal | | $ | — | | $ | (5,635 | ) | $ | (1,567 | ) | |
| | | | | | | | | |
| | Income (loss) from discontinued operations | | $ | 2,638 | | $ | (23,141 | ) | $ | (8,043 | ) | |
| | | | | | | | | |
Loss on disposal | | | $ | (5,635 | ) | $ | (1,567 | ) | $ | (28 | ) |
Income (loss) from discontinued operations | | | $ | (22,785 | ) | $ | (7,301 | ) | $ | 1,012 | |
Quarterly Results
Set forth in "Note 17.“Note 20. Quarterly Information (unaudited)"” to our consolidated financial statements (Item 8 of this Annual Report on Form 10-K) is selected income statement data for the eight quarters ended September 30, 2009.2010. We derived this information from unaudited quarterly financial statements that include, in the opinion of our management, all adjustments necessary for a fair presentation of the information for such periods. You should read this information in conjunction with the audited consolidated financial statements and notes thereto. Results of operations for any fiscal quarter are not necessarily indicative of results for any future period.
21
Table of Contents
Our revenue and operating results are subject to significant variation from quarter to quarter depending on a number of factors, including:
•·the progress of contracts;
·
•- the revenue earned on contracts;
·
•- the timing of revenue on license sales;
·
•- the timing of revenue on performance-based contracts;
·
•- the commencement and completion of contracts during any particular quarter;
·
•- the schedule of government agencies for awarding contracts; and
·
•- the term of each contract that we have been awarded.
Because a significant portion of our expenses are relatively fixed, successful contract performance and variation in the volume of activity as well as in the number of contracts commenced or completed during any quarter may cause significant variations in operating results from quarter to quarter. Further, we have occasionally experienced a pattern in our results of operations pursuant to which we incur greater operating expenses during the start-up and early stages of significant contracts prior to receiving related revenue. Our quarterly results may fluctuate, causing a material adverse effect on our operating results and financial condition.
Table of Contents
Obligations and Commitments
The following table summarizes our contractual obligations at September 30, 20092010 that require the Company to make future cash payments (in thousands):
| | Payments due by period | |
Contractual Obligations | | Total | | Less than
1 year | | 1-3 years | | 3-5 years | | More than
5 years | |
| | (Dollars in thousands) | |
Operating leases | | $ | 74,894 | | $ | 28,984 | | $ | 30,102 | | $ | 10,702 | | $ | 5,106 | |
Long-term debt | | 1,411 | | — | | 176 | | 282 | | 953 | |
Acquisition-related contingent consideration(1) | | 3,061 | | 923 | | 2,138 | | — | | — | |
Deferred compensation plan liabilities | | 9,893 | | — | | 1,080 | | 269 | | 8,544 | |
Total(2) | | $ | 89,259 | | $ | 29,907 | | $ | 33,496 | | $ | 11,253 | | $ | 14,603 | |
| | | | | | | | | | | | | | | | |
| | Payments due by period | |
|---|
Contractual Obligations | | Total | | Less than
1 year | | 1-3 years | | 3-5 years | | More than
5 years | |
|---|
Operating leases | | | 74,619 | | | 27,747 | | | 36,054 | | | 7,599 | | | 3,219 | |
Contingent consideration on business combination | | | 961 | | | 961 | | | — | | | — | | | — | |
| | | | | | | | | | | | |
Total(1) | | $ | 75,580 | | $ | 28,708 | | $ | 36,054 | | $ | 7,599 | | $ | 3,219 | |
| | | | | | | | | | | | |
(1)
- Acquisition related contingent liabilities are based upon the achievement of profitability and sales targets. The fair value was determined based on a probability-weighted approach derived from management’s estimates. The timing and amount of these contingent payments are based upon our current assessment of the fair value of the liability. See “Note 3. Acquisition.”
(2)Due to the uncertainty with respect to the timing of future cash flows associated with the Company'sCompany’s unrecognized income tax benefits at September 30, 2009,2010, we are unable to reasonably estimate settlements with taxing authorities. The above Contractual Obligations table does not reflect unrecognized income tax benefits of approximately $1.9$1.5 million, of which approximately $0.1$0.3 million is related interest expense for fiscal 2009.and penalties. See "Note 12.“Note 18. Income Taxes"Taxes” of the Consolidated Financial Statements for a further discussion on income taxes
taxes.22
Table of Contents
Liquidity and Capital Resources
With
Within the United States, in a very significant recession, the current economic environment facing state and local governments is extremely challenging. Not only are they experiencing declining tax revenues, but they are also facing increasing demand for critical services from the most vulnerable members of society. At the same time, states are generally required to balance their budgets each year. Certain states may delay payments to vendors as a result of budgetary constraints. In prior periods, the Company has faced short-term payment delays from state customers, all of which were ultimately recovered. The Company believes its liquidity and capital positions are adequate to weather short-term payment delays. In the event of more protracted delays, the Company may be required to seek additional capital sources, amend payment terms or take other actions. Extended payment delays could adversely affect the Company'sCompany’s cash flows, operations and profitability.
The Federal government has passed economic stimulus legislation to address some of the pressures facing state and local governments. The Company believes that demand for its services in its core areas of health, education and human services will remain strong and that the economic stimulus package could ultimately increase demand for such services. However, any increases in demand resulting from the economic stimulus legislation will depend largely upon the timing, amount and nature of the stimulus targeted at the states as well as the timing and nature of the states'states’ actions in response to such funding.
| | | | | | | |
| | Year ended September 30, | |
|---|
| | 2008 | | 2009 | |
|---|
| | (dollars in thousands)
| |
|---|
Net cash provided by (used in): | | | | | | | |
Operating activities—continuing operations | | $ | 56,756 | | $ | 34,155 | |
Operating activities—discontinued operations | | | (1,206 | ) | | (3,522 | ) |
Investing activities—continuing operations | | | 151,393 | | | (26,946 | ) |
Investing activities—discontinued operations | | | (2,933 | ) | | (90 | ) |
Financing activities—continuing operations | | | (154,877 | ) | | (35,574 | ) |
Financing activities—discontinued operations | | | — | | | — | |
Effect of exchange rates on cash and cash equivalents | | | — | | | 187 | |
| | | | | | |
Net increase (decrease) in cash and cash equivalents | | $ | 49,133 | | $ | (31,790 | ) |
| | | | | | |
TableThe situation for international governments is also challenging, with each of Contentsthe areas in which MAXIMUS operates offering unique local issues in addition to general global economic factors. Both Australia and the United Kingdom have had recent changes in government leadership and both appear set to attempt austerity measures to deal with significant debt and commitments.
| | Year ended September 30, | |
| | 2008 | | 2009 | | 2010 | |
| | (dollars in thousands) | |
Net cash provided by (used in): | | | | | | | |
Operating activities—continuing operations | | $ | 54,144 | | $ | 32,534 | | $ | 140,971 | |
Operating activities—discontinued operations | | 1,406 | | (1,901 | ) | (2,530 | ) |
Investing activities—continuing operations | | 151,393 | | (26,946 | ) | (32,395 | ) |
Investing activities—discontinued operations | | (2,933 | ) | (90 | ) | — | |
Financing activities—continuing operations | | (154,877 | ) | (35,574 | ) | (42,402 | ) |
Financing activities—discontinued operations | | — | | — | | — | |
Effect of exchange rates on cash and cash equivalents | | — | | 187 | | 3,862 | |
Net increase (decrease) in cash and cash equivalents | | $ | 49,133 | | $ | (31,790 | ) | $ | 67,506 | |
Cash provided by operating activities from continuing operations was $34.2$141.0 million in fiscal 2009,2010, an increase of $108.4 million compared to fiscal 2009. Principal drivers for this increase were an increase in net income of $23.9 million, favorable payment terms on certain contracts resulting in significant deferred revenue of $25.5 million, timing on cash collections of receivables of $22.2 million, and a declinenon-recurring payment of $22.6 million from the comparable 2008 cash inflow. The principal causes of this decrease were payments totaling $40 million made in conjunction with the legal settlement with TX HHSC and Accenture in December 2008, offset by the receipt of $18.8 million of insurance recoveries and the consequent tax effects of these transactions.recoveries. The legal settlement was recorded as an expense in fiscal 2008 but not paid until fiscal 2009.
In
Cash provided by operating activities from continuing operations in 2009 cashwas $32.5 million, a decline of $21.6 million compared to fiscal 2008, notwithstanding improved profitability in 2009. The decline was principally driven by the payments of $40 million offset by recoveries of $18.8 million related to the legal settlement with TX HHSC and Accenture in December 2008.
Cash used in investing activities from continuing operations was $32.4 million in fiscal 2010, compared with $26.9 million in 2009. The increase of $5.5 million is principally driven by (1) $12 million of acquisition payments related to DeltaWare and other acquisitions in 2010, compared with $0.4 million in 2009, offset by (2) declines in overall capital spending of approximately $4.0 million following significant build out for contract expansions in Australia and the United Kingdom, as well as the completion of an Enterprise Resource Planning system for internal use in 2009, and (3) $1.7 million of cash received from the sale of the Company’s ERP division in 2010, compared with cash payments of $1.6 million related to other disposals in 2009.
Cash used in investing activities from continuing operations was $26.9 million for continuing operations,in fiscal 2009, compared towith cash provided by investing activitiesoperations of $151.4 million in fiscal 2008. The fiscal 2008 cash inflowdifference of $178.3 million was primarily driven by the sale of $126.2 million of marketable securities, representing the entire balance held by the Company at the beginning of the year,fiscal 2008, $37.7 million from the disposition of the Company'sCompany’s Systems businesses in 2008, and $5.9 million from the sale of a building in 2008, offset by $3.1 million of cash outflow from the purchase of a business in the United Kingdom. There were no similar transactions of significance in 2009. The balance of the difference is driven principally by an increase in acquisitions of capital assets as the result of contract expansions in Australia and new work in the United Kingdom, and Australia andas well as the installation of an ERP system for internal use in the United States.
23
Table of Contents
Cash used in financing activities in 2009 was $35.6 million. This balance consisted of $30 million for the repurchase of the Company's common stock, $8.1 million of dividends paid and $0.4 million of principal payments on capital leases, offset by $2.9 million of cash inflows related to employee stock transactions. Cash used in financing activities in 2008from continuing operations was $154.9 million, consisting of$35.6 million, and $42.4 million in fiscal years 2008, 2009, and 2010, respectively. These cash flows were principally driven by repurchases of common stock, of $164.5 million, $7.8 million of dividends paid and $1.6 million of principal payments on capital leases, offset byincluding a price adjustment under the Accelerated Share Repurchasean accelerated share repurchase agreement in 2008, of $13.9$150.6 million, $30.0 million, and $5.1$40.2 million relating to employee stock transactions.in 2008, 2009, and 2010, respectively. Details of the Company'sCompany’s share repurchase activity isare set forth in "Note“Note 13. Shareholders'Equity"Shareholders’ Equity”. The Company also paid $7.8 million, $8.1 million and $8.4 million in dividends in 2008, 2009, and 2010, respectively.
The beneficial effect of exchange rates of cash and cash equivalents of $3.9 million in the current year reflects the weakening of the United States Dollar and increases in our overseas cash balances, notably in Australia.
To supplement our statements of cash flows presented on a GAAP basis, we use the non-GAAP measure of free cash flows from continuing operations to analyze the funds generated from operations. We believe free cash flow from continuing operations is a useful basis for comparing our performance with our competitors. The presentation of non-GAAP free cash flows from continuing operations is not meant to be considered in isolation, or as an alternative to net income as an indicator of performance, or as an alternative to cash flows from operating activities as a measure of liquidity. We calculate free cash flow from continuing operations as follows:
| | Year ended September 30, | |
| | 2008 | | 2009 | | 2010 | |
| | (dollars in thousands) | |
| | | | | | | |
Cash provided by operating activities – continuing operations | | $ | 54,144 | | $ | 32,534 | | $ | 140,971 | |
Purchases of property and equipment | | (10,380 | ) | (19,694 | ) | (13,936 | ) |
Capitalized software costs | | (5,131 | ) | (6,888 | ) | (8,672 | ) |
Free cash flow from continuing operations | | $ | 38,633 | | $ | 5,952 | | $ | 118,363 | |
Repurchases of the Company'sCompany’s common stock
On November 14, 2007, the Company announced that its Board of Directors had authorized the repurchase of up to $150.0 million of the Company'sCompany’s outstanding common stock under an Accelerated Share Repurchase ("ASR"(“ASR”) program. Under the ASR agreement, the Company acquired and retired 3,758,457 shares at an initial price of $39.91 per share for $150.0 million plus fees of approximately $0.4 million. The counter-party purchased an equivalent number of shares in the open market over the nine-month period endingended August 15, 2008. Pursuant to the ASR agreement, at its completion the Company'sCompany’s initial price under the ASR agreement was adjusted down based on the volume-weighted average price ("VWAP"(“VWAP”) of the Company'sCompany’s stock during this period. Such adjustment could be settled in cash or stock at the Company'sCompany’s discretion. On July 11, 2008, the counter-party completed the purchase of shares in the open market, and the Company elected to receive the price adjustment of $13.9 million in cash. In the fourth quarter of fiscal 2008, this receipt of cash was recorded as a decrease to common stock in the full amount of $13.9 million.
Under a resolution adopted in July 2008, the Board of Directors has authorized the repurchase, at management'smanagement’s discretion, of up to an aggregate of $75.0 million of the Company'sCompany’s common stock. The resolution also authorized the use of option exercise proceeds for the repurchase of the Company'sCompany’s common stock. UnderIn September 2010, a further board resolution increased the resolution, the Company acquired and retired 1,314,290 shares atauthorized repurchases by an average price of $33.56 peradditional $100 million.
Total share for $44.1 million. At September 30, 2009, $56.7 million remained available for future stock repurchasespurchases under the resolution. these plans are summarized as follows (in thousands):
| | Year ended September 30, | |
| | 2008 | | 2009 | | 2010 | |
Number of share acquired under: | | | | | | | |
ASR Agreement | | 3,758,457 | | — | | — | |
July 2008 and September 2010 resolutions | | 386,600 | | 927,690 | | 750,764 | |
Total | | 4,145,057 | | 927,690 | | 750,764 | |
Total cost of shares (in thousands of dollars) acquired under: | | | | | | | |
ASR Agreement | | $ | 150,400 | | $ | — | | $ | — | |
Price adjustment under ASR Agreement | | (13,903 | ) | — | | — | |
July 2008 and September 2010 resolutions | | 14,066 | | 30,046 | | 40,217 | |
Total | | $ | 150,563 | | $ | 30,046 | | $ | 40,217 | |
As of November 17, 2009,19, 2010, the Company hashad repurchased 25,400 commonan additional 37,500 shares at a cost of $1.1$2.3 million during the first quarter of fiscal 2010.2011.
In total, the Company repurchased 4,145,057 common shares at a cost of $164.5 million and 927,690 shares at a cost of $30.0 million in 2008 and 2009, respectively. The Company did not repurchase any shares in 2007.
24
Table of Contents
On January 25, 2008, the Company entered into a Revolving Credit Agreement providing for a senior secured revolving credit facility, with SunTrust Bank as administrative agent, issuing bank and swingline lender, and a syndicate of other lenders (the "Credit Facility"“Credit Facility”). The Credit Facility provides for a $35.0 million revolving line of credit commitment, which may be used (i) for revolving loans, (ii) for swingline loans, subject to a sublimit of $5.0 million, and (iii) to request the issuance of letters of credit on the Company'sCompany’s behalf, subject to a sublimit of $25.0 million. The Company may request an increase in the commitment under the Credit Facility, such that the aggregate commitments under the Credit Facility shall at no time exceed $75.0 million. The credit available under the Credit Facility may be used, among other purposes, to refinance the Company'sCompany’s current indebtedness, to repurchase shares of the Company'sCompany’s capital stock and to finance the ongoing working capital, capital expenditure, and general corporate needs of the Company.
Subject to applicable conditions, the Company may elect interest rates on its revolving borrowings calculated by reference to (i) the prime lending rate as announced by SunTrust Bank (or, if higher, the federal funds effective rate plus 0.50%) (a “Base Rate Borrowing”), or (ii) the reserve adjusted rate per annum equal to the offered rate for deposits in U.S. dollars for a one (1), two (2), three (3) or six (6) month period in the London Inter-Bank Market (a “LIBOR Borrowing”), and, in each case, plus an applicable margin that is determined by reference to the Company’s then-current leverage ratio. For swingline borrowings, the Company will pay interest at the rate of interest for a one (1) month LIBOR Borrowing, plus the applicable margin, or at a rate to be separately agreed upon by the Company and the administrative agent.
At September 30, 2009,2010, the Company had issued three letters of credit under the credit facility totaling $10.3 million. A letter of credit for $10 million may be called by a customer in the event that the Company defaults under the terms of a contract. The letter was renewed in March 2010 and expires in March 2011. Two letters of credit totaling $10.3$0.3 million were outstandinghave been issued in relation to the Company’s insurance policies. These letters of credit expire in May 2011 and may be renewed annually thereafter. At September 30, 2010, the Company has capacity to borrow, subject to covenant constraints, of up to $23.3 million under the credit facility.this agreement.
The Credit Facility matures on January 25, 2013, at which time all outstanding borrowings must be repaid and all outstanding letters of credit must be terminated or cash collaterized.collateralized.
The Credit Facility, as amended by the Company and its lender on December 12, 2008, provides for the payment of specified fees and expenses, including an up-front fee and commitment and letter of credit fees, and contains customary financial and other covenants that require the maintenance of certain ratios including a maximum leverage ratio and a minimum fixed charge coverage ratio. The Company was in compliance with all covenants in the amended Credit Facility as of September 30, 2009.2010. The Company'sCompany’s obligations under the Credit Facility are guaranteed by certain of the Company'sCompany’s direct and indirect subsidiaries (collectively, the "Guarantors"“Guarantors”) and are secured by substantially all of MAXIMUS'MAXIMUS’ and the Guarantors'Guarantors’ present and future tangible and intangible assets, including the capital stock of subsidiaries and other investment property.
In addition to this credit facility, the Company has a loan agreement with the Atlantic Innovation Fund of Canada, which was acquired as part of the DeltaWare acquisition (see “Note 3. Acquisition”). This provides for a loan of up to 1.7 million Canadian Dollars, which must be used for specific technology-based research and development. The loan has no interest charge and is repayable in installments between 2012 and 2022. At September 30, 2010, $1.4 million (1.4 million Canadian Dollars) was outstanding under this agreement. The balance will be repayable in forty quarterly installments commencing from July 1, 2012, with the final payment no later than fiscal 2022. Borrowings using this facility reduce the availability of credit under the Revolving Credit Agreement.
Other
Our working capital at September 30, 20082009 and 20092010 was $150.0$164.6 million and $164.6$191.5 million, respectively. At September 30, 2009,2010, we had cash and cash equivalents of $87.8$155.3 million and no debt.debt of $1.4 million. Management believes this liquidity and financial position, along with the revolving credit facility discussed above, provides sufficient liquidity to continue any contemplated stock repurchase program (depending on the price of the Company'sCompany’s common stock), to pursue selective acquisitions, and to consider the continuation of dividends on a quarterly basis. Restricted cash represents amounts collected on behalf of certain customers and its use is restricted to the purposes specified under our contracts with these customers.
25
Table of Contents
Under the provisions of certain long-term contracts, we may incur certain reimbursable transition period costs. During the transition period, these expenditures result in the use of our cash and in our entering into lease financing arrangements for a portion of the costs. Reimbursement of these costs may occur in the set-up phase or over the contract operating period. Related revenue may also be deferred during the set-up phase. As of September 30, 2009, $8.22010, $6.7 million in net costs had been incurred and reported as deferred contract costs on our consolidated balance sheet.
On October 9, 2009,8, 2010, the Company'sCompany’s Board of Directors declared a quarterly cash dividend of $0.12 for each share of the Company'sCompany’s common stock outstanding. The dividend will be paid on November 30, 20092010 to shareholders of record on November 13, 2009.15, 2010. Based on the number of shares outstanding, the payment will be approximately $2.1 million.
We believe that we will have sufficient resources to meet our currently anticipated capital expenditure and working capital requirements for at least the next twelve months.
Table of Contents
Off-balance sheet arrangements
We believe that we do not have material off-balance sheet risk or exposure to liabilities that are not recorded or disclosed in our financial statements.
Effects of Inflation
As measured by revenue, approximately 31%29% of our business is conducted under cost-reimbursable contracts which adjust revenue to cover costs increased by inflation. Approximately 2%3% of the business is time-and-material contracts where labor rates are often fixed for several years. We generally have been able to price these contracts in a manner that accommodates the rates of inflation experienced in recent years. The remaining portions of our contracts are fixed price and performance based and are typically priced to account for the likely inflation from period to period to mitigate the risk of our business being adversely affected by inflation.
Critical Accounting Policies and Estimates
Our discussion and analysis of financial condition and results of operations are based on our consolidated financial statements, which have been prepared in accordance with accounting principles generally accepted in the United States. The preparation of these financial statements requires us to make estimates and assumptions that affect the reported amounts of assets and liabilities, the disclosure of contingent liabilities and the reported amounts of revenue and expenses. On an ongoing basis, we evaluate our estimates including those related to revenue recognition and cost estimation on certain contracts, the realizability of goodwill, and amounts related to income taxes, certain accrued liabilities and contingencies and litigation. We base our estimates on historical experience and on various other assumptions that are believed to be reasonable under the circumstances, the results of which form the basis for making judgments about the carrying values of assets and liabilities. Actual results could differ from those estimates.
We believe that we do not have material off-balance-sheetoff-balance sheet risk or exposure to liabilities that are not recorded or disclosed in our financial statements. While we have significant operating lease commitments for office space, those commitments are generally tied to the period of performance under related contracts. Additionally, although on certain contracts we are bound by performance bond commitments and standby letters of credit, we have not had any defaults resulting in draws on performance bonds. Also, we do not speculate in derivative transactions.
We believe the following critical accounting policies affect the significant judgments and estimates used in the preparation of our consolidated financial statements:
Revenue Recognition.In fiscal 2009,2010, approximately 66%59% of our total revenue was derived from state and local government agencies; 27% from foreign customers; 9% from federal government agencies; 17% from foreign customers; and 8%5% from other sources, such as commercial customers. Revenue is generated from contracts with various pricing arrangements, including: (1) fixed-price; (2) performance-based criteria; (3) costs incurred plus a negotiated fee ("cost-plus"(“cost-plus”); and (4) time and materials. Also, some contracts contain "not-to-exceed"“not-to-exceed” provisions. Of the contracts with "not-to-exceed"“not-to-exceed” provisions, to the extent we estimate we will exceed the contractual limits, we treat these contracts as fixed price. For fiscal 2009, revenue from fixed-price contracts was approximately 27% of total revenue;2010, revenue from performance-based contracts was approximately 40%47% of total revenue; revenue from cost-plus contracts was approximately 31%29% of total revenue; revenue from fixed-price contracts was approximately 21% of total revenue; and revenue from time and materials contracts was approximately 2%3% of total revenue. A majority of the contracts with state and local government agencies have been fixed-price and performance-based, and our contracts with the federal government generally have been cost-plus. Fixed-price and performance-based contracts generally offer higher margins but typically involve more risk than cost-plus or time and materials reimbursement contracts.
26
Table of Contents
We recognize revenue on general service arrangements as work is performed and amounts are earned. We consider amounts to be earned once evidence of an arrangement has been obtained, services are delivered, fees are fixed or determinable, and collectability is reasonably assured.
Table of Contents
We recognize revenue on fixed-pricedfixed-price contracts when earned, as services are provided. For certain fixed-price contracts, primarily systems design, development and implementation, we recognize revenue based on costs incurred using estimates of total expected contract revenue and costs to be incurred. The cumulative impact of any revisions in estimated revenue and costs is recognized in the period in which the facts that give rise to the revision become known. Provisions for estimated losses on incomplete contracts are provided for in full in the period in which such losses become known.
For other fixed-price contracts, revenue is recognized on a straight-line basis unless evidence suggests that revenue is earned or obligations are fulfilled in a different pattern. Where obligations are fulfilled in a different pattern, revenue is generally recognized as services are provided, based upon outputs provided to the customer. With fixed-price contracts, we are subject to the risk of potential cost overruns. Costs related to contracts may be incurred in periods prior to recognizing revenue. These costs are generally expensed. However, certain direct and incremental set-up costs may be deferred until services are provided and revenue begins to be recognized, when such costs are recoverable from a contractual arrangement. Set-up costs are costs related to activities that enable us to provide contractual services to a client. The timing of expense recognition may result in irregular profit margins.
We recognize revenue on performance-based contracts as such revenue becomes fixed or determinable, which generally occurs when amounts are billable to customers. For certain contracts, this may result in revenue being recognized in irregular increments.
Revenue on cost-plus contracts is recognized based on costs incurred plus an estimate of the negotiated fee earned. Revenue on time and materials contracts is recognized based on hours worked and expenses incurred.
Our most significant expense is cost of revenue, which consists primarily of project-related costs such as employee salaries and benefits, subcontractors, computer equipment and travel expenses. Our management uses its judgment and experience to estimate cost of revenue expected on projects. Our management'smanagement’s ability to accurately predict personnel requirements, salaries and other costs as well as to effectively manage a project or achieve certain levels of performance can have a significant impact on the gross margins related to our fixed-price, performance-based and time and materials contracts. If actual costs are higher than our management'smanagement’s estimates, profitability may be adversely affected. Service cost variability has little impact on cost-plus arrangements because allowable costs are reimbursed by the customer.
We also license software under license agreements. Software license revenue is recognized when a customer enters into a non-cancelable license agreement, the software product has been delivered, there are no uncertainties surrounding product acceptance, there are no significant future performance obligations, the license fees are fixed or determinable and collection of the license fee is considered probable. Amounts received in advance of meeting these criteria are deferred and classified as deferred revenue in the accompanying consolidated balance sheets. The Company determines the value of the software component of its multiple-element arrangements using the residual method as vendor specific objective evidence ("VSOE"(“VSOE”) of fair value exists for the undelivered elements such as the support and maintenance agreements and related implementation and training services, but not for all delivered elements such as the software itself. The residual method requires revenue to be allocated to the undelivered elements based on the fair value of such elements, as indicated by VSOE. VSOE is based on the price charged when the element is sold separately. Maintenance and post-contract customer support revenue are recognized ratably over the term of the related agreements, which in most cases is one year. Revenue from software-related consulting services under time and material contracts and for training is recognized as services are performed. Revenue from other software-related contract services requiring significant modification or customization of software is recognized under the percentage-of-completion method.
Where contracts have multiple deliverables, we evaluate these deliverables at the inception of each contract and as each item is delivered. As part of this evaluation, we consider whether (i) a delivered
Table of Contents
item has value to a customer on a stand-alone basis; (ii) there is objective and reliable evidence of the fair market value of the undelivered items; and (iii) whether the delivery of the undelivered items is considered probable and substantially within our control, if a general right of return exists. Where deliverables, or groups of deliverables, have all three of these characteristics, we treat each deliverable item as a separate unit of accounting and apply the relevant revenue recognition guidance to each deliverable. For transactions entered into after September 30, 2010, the Company will adopt updated accounting rules with respect to multiple-element arrangements. See “Note 2. Recent Accounting Pronouncements” in Item 8 of this Form 10-K.
27
Table of Contents
Impairment of Goodwill. Goodwill is typically obtained by the Company as a result of business combinations. Goodwill represents the difference between the consideration paid in acquiring the business including those costs directly incurred as a result of the acquisition, and the fair value of the identifiable net assets acquired.
Goodwill is not amortized but is subject to impairment testing on an annual basis, or more frequently if impairment indicators arise. Impairment testing is performed at the reporting unit level. Performing the goodwill impairment test requires judgment, including how we define reporting units and determine their fair value. A reporting unit is the operating segment, or a business one level below that operating segment (the component level) if discrete financial information is prepared and reviewed regularly by segment management. However, components are aggregated if they have similar economic characteristics. We recognize an impairment charge for any amount by which the carrying amount of a reporting unit'sunit’s goodwill exceeds its fair value. We use discounted cash flows to establish fair values. When available and as appropriate, we use comparative market multiples to corroborate the discounted cash flow results. When a portion of a reporting unit is disposed of, goodwill is allocated to using the relative fair value method for purposes of identifyingcalculating the gain or loss on disposal. In addition, a goodwill impairment test is performed for the remaining portion of the reporting unit.
The Company performs its annual impairment test as of July 1st of each year. Based on the analysis performed as ofAt July 1, 2009,2010, the Company performed the annual impairment test based upon the reporting units in existence at this time, which were consistent with the Company’s operating segments at this time, Consulting and Operations. Based upon this test, management determined that there had been no impairment of goodwill. FollowingUpon the decisionreorganization of the business in the fourth quarter, goodwill balances were reallocated to sell the ERP division,new reporting units and a further test for goodwill impairment was performed. This also did not demonstrate any evidence of goodwill impairment.
Changes in estimates and assumptions we make in conducting our goodwill impairment assessment could affect the estimated future fair value of one or more of our reporting units and could result in a goodwill impairment in the future. However, a 25% decline in the estimated fair value of any of our reporting units at July 1, 2010 or September 30, 2010 would not have resulted in a goodwill impairment charge.
Acquisition-related contingent consideration. For all acquisitions occurring after October 1, 2009, the Company allocatedis required to calculate the goodwill held byfair value of any contingent consideration included within the Consulting segment betweenacquisition agreement. Subsequent changes to the ERP division andfair value of the remaining Consulting segment,contingent consideration will be included as an expense or a benefit in the financial statements of the Company. The Company reassesses the most likely value of the consideration payable at each reporting period, based upon a relative fair value methodology. Fair value was determined usingthe financial performance or sales performance of the acquired entities and adjusts the liability to reflect these revised estimates. Any differences from the Company’s expectations of future profitability, both a discounted cash flowbeneficially and comparative market multiple approach based upon data available at September 30, 2009. The Company performed goodwill impairment tests overadverse, will have an effect on the ERP division and the remaining Consulting segment as of September 30, 2009. The Company recorded a $1.2 million goodwill impairment charge related to the ERP division, which is reflected in the loss on disposal of discontinued operations for the year ended September 30, 2009.acquisition-related contingent consideration liability.
Capitalized Software Development Costs. Software development costs are capitalized and amortized using different methodologies, depending upon the intended use of the asset.
All of the software development costs included within continuing operations relate to software which is intended to be used byfor the Company.Company’s internal use. Direct costs of time and material incurred for the development of application software for internal use are capitalized and amortized using the straight-line method over the estimated useful life of the software, ranging from three to eight years.
Allowance for Doubtful Accounts. We maintain an allowance for doubtful accounts at an amount we estimate to be sufficient to cover the risk of collecting less than full payment on our receivables. On a regular basis we re-evaluate our client receivables, especially receivables that are past due, and reassess our allowance for doubtful accounts based on specific client collection issues. If our clients were to express dissatisfaction with the services we have provided, additional allowances may be required.
Deferred Contract Costs. Deferred contract costs consist of contractually recoverable direct set-up costs relating to long-term service contracts in progress. These costs include direct and incremental costs incurred prior to the commencement of us providing service to enable us to provide the contracted services to our customer. Such costs are expensed over the period services are provided
Table of Contents
under the long-term service contract. We review deferred contract costs for impairment whenever events or changes in circumstances indicate that the carrying amount may not be recoverable. Our review is based on our projection of the undiscounted future operating cash flows of the related customer project. To the extent such projections indicate that future undiscounted cash flows are not sufficient to recover the carrying amount, we recognize a non-cash impairment charge to reduce the carrying amount to equal projected future discounted cash flows. No impairment charges were recorded in the three years ending September 30, 2010.
Contingencies. From time to time, we are involved in legal proceedings, including contract and employment claims, in the ordinary course of business. We assess the likelihood of any adverse judgments or outcomes to these contingencies as well as potential ranges of probable losses and establish reserves accordingly. The amount of reserves required may change in future periods due to new developments in each matter or changes in approach to a matter such as a change in settlement strategy.
28
Table of Contents
Legal and Settlement Expense (Recovery), Net. Legal and settlement expense consists of costs, net of reimbursed insurance claims, related to significant legal settlements and non-routine legal matters, including future probable legal costs estimated to be incurred in connection with those matters. Legal expenses incurred in the ordinary course of business are included in selling, general and administrative expense.
Income taxes. To record income tax expense, we are required to estimate our income taxes in each of the jurisdictions in which we operate. In addition, income tax expense at interim reporting dates requires us to estimate our expected effective tax rate for the entire year. This process involves estimating our actual current tax liability together with assessing temporary differences that result in deferred tax assets and liabilities and expected future tax rates. Circumstances that could cause our estimates of income tax expense to change include: the impact of information that subsequently becomes available as we prepare our tax returns; revision to tax positions taken as a result of further analysis and consultation; changes in the geographic mix of our business; the actual level of pre-tax income; changes in tax rules, regulations and rates; and changes mandated as a result of audits by taxing authorities.
We may also establish tax reserves when, despite our belief that our tax return positions are fully supportable, we believe that certain positions are subject to challenge and that we may not fully succeed. We adjust these reserves in light of changing facts, such as the progress of a tax audit, new case law, or expiration of a statute of limitations.
Since October 1, 2007, the
The Company has accountedaccounts for uncertain tax positions by recognizing the financial statement effects of a tax position only when, based upon the technical merits, it is "more-likely-than-not"“more-likely-than-not” that the position will be sustained upon examination. The cumulative effect of this change in accounting policy was an increase in the liability for unrecognized tax benefits of $0.4 million, which was accounted for as a decrease in the October 1, 2007 balance of retained earnings on our consolidated balance sheet.
As of September 30, 2009, the Company had $5.2 million of net operating loss carryforwards related to a Canadian subsidiary. A full valuation allowance of $1.8 million has been established against the related deferred tax asset. Evaluating the net operating loss carryforwards requires us to make certain estimates, which we believe are reasonable. In the event that actual circumstances differ from management's estimates, or to the extent that these estimates are adjusted in the future, any changes to the valuation allowance could be material.
Table of Contents
ITEM 7A. Quantitative and Qualitative Disclosures About Market Risk.
We believe that our exposure to market risk related to the effect of changes in interest rates, commodity prices and other market risks with regard to instruments entered into for trading or for other purposes is immaterial.
The Company is exposed to foreign exchange fluctuations in the Australian Dollar, Canadian Dollar, British Pound and Israeli Shekel. During the year ended September 30, 2009,2010, the Company earned approximately 17%27% of revenues and 12%39% of operating income from foreign subsidiaries. At September 30, 2009,2010, approximately 22%35% of the Company'sCompany’s assets are held by foreign subsidiaries. The Company mitigates its foreign exchange risks through maintaining sufficient capital within its foreign subsidiaries to support the short-term and long-term capital requirements of these businesses. The Company'sCompany’s foreign subsidiaries typically incur costs in the same currency as they earn revenues, thus limiting the Company'sCompany’s exposure to unexpected expenditures. The operations of the U.S. business do not depend upon cash flows from foreign subsidiaries.
29
Table of Contents
ITEM 8. Financial Statements and Supplementary Data.
The following consolidated financial statements and supplementary data are included as part of this Annual Report on Form 10-K:
| | |
Report of Independent Registered Public Accounting Firm | | 3431 |
Consolidated Balance Sheets at September 30, 20082009 and 20092010 | |
3532 |
Consolidated Statements of Operations for the years ended September 30, 2007, 2008, 2009 and 20092010 | |
3633 |
Consolidated Statements of Changes in Shareholders'Shareholders’ Equity for the years ended September 30, 2007, 2008, 2009 and 20092010 | |
3734 |
Consolidated Statements of Cash Flows for the years ended September 30, 2007, 2008, 2009 and 20092010 | |
3835 |
Notes to Consolidated Financial Statements | |
3936 |
30
Table of Contents
REPORT OF INDEPENDENT REGISTERED PUBLIC ACCOUNTING FIRM
The Board of Directors and Shareholders of MAXIMUS, Inc.
We have audited the accompanying consolidated balance sheets of MAXIMUS, Inc. as of September 30, 20082009 and 2009,2010, and the related consolidated statements of operations, changes in shareholders'shareholders’ equity, and cash flows for each of the three years in the period ended September 30, 2009.2010. These financial statements are the responsibility of the Company'sCompany’s management. Our responsibility is to express an opinion on these financial statements based on our audits.
We conducted our audits in accordance with the standards of the Public Company Accounting Oversight Board (United States). Those standards require that we plan and perform the audit to obtain reasonable assurance about whether the financial statements are free of material misstatement. An audit includes examining, on a test basis, evidence supporting the amounts and disclosures in the financial statements. An audit also includes assessing the accounting principles used and significant estimates made by management, as well as evaluating the overall financial statement presentation. We believe that our audits provide a reasonable basis for our opinion.
In our opinion, the financial statements referred to above present fairly, in all material respects, the consolidated financial position of MAXIMUS, Inc. at September 30, 20082009 and 2009,2010, and the consolidated results of its operations and its cash flows for each of the three years in the period ended September 30, 2009,2010, in conformity with U.S. generally accepted accounting principles.
We also have audited, in accordance with the standards of the Public Company Accounting Oversight Board (United States), MAXIMUS, Inc.'s’s internal control over financial reporting as of September 30, 2009,2010, based on criteria established in Internal Control-Integrated Framework issued by the Committee of Sponsoring Organizations of the Treadway Commission and our report dated November 17, 200919, 2010 expressed an unqualified opinion thereon.
McLean, Virginia
November 17, 200919, 2010
31
Table of Contents
MAXIMUS, Inc.
CONSOLIDATED BALANCE SHEETS
(Dollars in thousands)
|
|
| | September 30, | | | September 30, | |
|---|
|
| | 2008 | | 2009 | | | 2009 | | 2010 | |
|---|
ASSETS | ASSETS | | | | | | |
Current assets: | Current assets: | | | | | | |
| | Cash and cash equivalents | | $ | 119,605 | | $ | 87,815 | | |
| | Restricted cash | | 2,736 | | 3,919 | | |
| | Accounts receivable—billed, net | | 119,712 | | 132,058 | | |
| | Accounts receivable—unbilled | | 9,166 | | 16,706 | | |
| | Current portion of note receivable | | 746 | | 736 | | |
| | Deferred income taxes | | 21,901 | | 5,389 | | |
| | Due from insurance carrier | | 12,500 | | — | | |
| | Prepaid income taxes | | — | | 7,501 | | |
| | Prepaid expenses and other current assets | | 7,820 | | 19,749 | | |
| | Current assets of discontinued operations | | 26,909 | | 18,238 | | |
| | | | | | | |
| | | Total current assets | | 321,095 | | 292,111 | | |
Cash and cash equivalents | | | $ | 87,815 | | $ | 155,321 | |
Restricted cash | | | 3,919 | | 4,182 | |
Accounts receivable—billed, net | | | 133,485 | | 136,260 | |
Accounts receivable—unbilled | | | 19,510 | | 17,245 | |
Current portion of note receivable | | | 736 | | — | |
Prepaid income taxes | | | 7,501 | | 4,149 | |
Deferred income taxes | | | 5,389 | | 13,290 | |
Prepaid expenses and other current assets | | | 19,749 | | 25,702 | |
Current assets of discontinued operations | | | 14,007 | | — | |
Total current assets | | | 292,111 | | 356,149 | |
Property and equipment, net | Property and equipment, net | | 33,721 | | 45,286 | | | 45,286 | | 48,873 | |
Capitalized software, net | Capitalized software, net | | 14,125 | | 18,969 | | | 18,969 | | 24,715 | |
Deferred contract costs, net | Deferred contract costs, net | | 5,324 | | 8,206 | | | 8,206 | | 6,708 | |
Goodwill | Goodwill | | 59,459 | | 61,029 | | | 61,029 | | 71,251 | |
Intangible assets, net | Intangible assets, net | | 3,699 | | 2,455 | | | 2,455 | | 7,778 | |
Note receivable | | 1,338 | | — | | |
Deferred income taxes | Deferred income taxes | | 10,933 | | 1,239 | | | 1,239 | | 1,844 | |
Deferred compensation plan assets | | | — | | 8,317 | |
Other assets | Other assets | | 3,785 | | 3,939 | | | 3,939 | | 2,106 | |
Noncurrent assets of discontinued operations | | 1,475 | | — | | |
| | | | | | | |
| | | Total assets | | $ | 454,954 | | $ | 433,234 | | |
| | | | | | | |
LIABILITIES AND SHAREHOLDERS' EQUITY | | |
Total assets | | | $ | 433,234 | | $ | 527,741 | |
LIABILITIES AND SHAREHOLDERS’ EQUITY | | | | | | |
Current liabilities: | Current liabilities: | | | | | | |
| | Accounts payable | | $ | 42,612 | | $ | 44,368 | | |
| | Accrued compensation and benefits | | 25,610 | | 31,713 | | |
| | Current portion of deferred revenue | | 15,958 | | 22,177 | | |
| | Current portion of income taxes payable | | 12,661 | | — | | |
| | Current portion of capital lease obligations | | 417 | | — | | |
| | Other accrued liabilities | | 53,892 | | 15,083 | | |
| | Current liabilities of discontinued operations | | 19,979 | | 14,124 | | |
| | | | | | | |
| | | Total current liabilities | | 171,129 | | 127,465 | | |
Accounts payable | | | $ | 44,644 | | $ | 49,200 | |
Accrued compensation and benefits | | | 31,738 | | 40,807 | |
Deferred revenue | | | 22,177 | | 58,070 | |
Acquisition-related contingent consideration | | | — | | 923 | |
Income taxes payable | | | — | | 7,120 | |
Accrued liabilities | | | 15,083 | | 7,934 | |
Liabilities of discontinued operations | | | 13,823 | | 634 | |
Total current liabilities | | | 127,465 | | 164,688 | |
Deferred revenue, less current portion | Deferred revenue, less current portion | | 6,502 | | 6,527 | | | 6,527 | | 4,083 | |
Long-term debt | | | — | | 1,411 | |
Acquisition-related contingent consideration, less current portion | | | — | | 2,138 | |
Income taxes payable, less current portion | Income taxes payable, less current portion | | 1,617 | | 1,871 | | | 1,871 | | 1,793 | |
Deferred income taxes | Deferred income taxes | | — | | 243 | | | 243 | | 4,946 | |
| | | | | | | |
| | | Total liabilities | | 179,248 | | 136,106 | | |
Commitments and contingencies (Notes 10 and 14) | | |
Shareholders' equity: | | |
| | Common stock, no par value; 60,000,000 shares authorized; 26,937,498 and 27,161,849 shares issued and 18,302,368 and 17,599,029 outstanding at September 30, 2008 and September 30, 2009, at stated amount, respectively | | 328,323 | | 338,739 | | |
| | Treasury stock, at cost; 8,635,130 and 9,562,820 shares at September 30, 2008 and September 30, 2009, respectively | | (289,103 | ) | | (319,149 | ) | |
| | Accumulated other comprehensive income | | 5,536 | | 8,268 | | |
| | Retained earnings | | 230,950 | | 269,270 | | |
| | | | | | | |
| | | Total shareholders' equity | | 275,706 | | 297,128 | | |
| | | | | | | |
| | | Total liabilities and shareholders' equity | | $ | 454,954 | | 433,234 | | |
| | | | | | | |
Deferred compensation plan liabilities | | | — | | 9,893 | |
Total liabilities | | | 136,106 | | 188,952 | |
Commitments and contingencies (Notes 11 and 12) | | | | | | |
Shareholders’ equity: | | | | | | |
Common stock, no par value; 60,000,000 shares authorized; 27,161,849 and 27,487,725 shares issued and 17,599,029 and 17,174,141 outstanding at September 30, 2009 and September 30, 2010, at stated amount, respectively | | | 338,739 | | 352,696 | |
Treasury stock, at cost; 9,562,820 and 10,313,584 shares at September 30, 2009 and September 30, 2010, respectively | | | (319,149 | ) | (359,366 | ) |
Accumulated other comprehensive income | | | 8,268 | | 14,530 | |
Retained earnings | | | 269,270 | | 330,929 | |
Total shareholders’ equity | | | 297,128 | | 338,789 | |
Total liabilities and shareholders’ equity | | | $ | 433,234 | | $ | 527,741 | |
See notes to consolidated financial statements.
32
Table of Contents
MAXIMUS, Inc.
CONSOLIDATED STATEMENTS OF OPERATIONS
(In thousands, except per share data)
|
|
| | Year ended September 30, | | | Year ended September 30, | |
|---|
|
| | 2007 | | 2008 | | 2009 | | | 2008 | | 2009 | | 2010 | |
|---|
Revenue | Revenue | | $ | 583,020 | | $ | 693,663 | | $ | 717,299 | | | $ | 699,552 | | $ | 720,108 | | $ | 831,749 | |
Cost of revenue | Cost of revenue | | 448,151 | | 504,641 | | 525,032 | | | 508,661 | | 528,762 | | 610,916 | |
| | | | | | | | | |
| | Gross profit | | 134,869 | | 189,022 | | 192,267 | | |
Gross profit | | | 190,891 | | 191,346 | | 220,833 | |
Selling, general and administrative expenses | Selling, general and administrative expenses | | 97,930 | | 107,986 | | 106,723 | | | 110,443 | | 107,028 | | 118,778 | |
Gain on sale of building | Gain on sale of building | | — | | 3,938 | | — | | | 3,938 | | — | | — | |
Gain on sale of business | | 451 | | — | | — | | |
Legal and settlement expense (recovery) (Note 20) | | 44,438 | | 38,358 | | (4,271 | ) | |
| | | | | | | | | |
| | Operating income (loss) from continuing operations | | (7,048 | ) | | 46,616 | | 89,815 | | |
Legal and settlement expense (recovery), net (Note 17) | | | 38,358 | | (4,271 | ) | (5,351 | ) |
Operating income from continuing operations | | | 46,028 | | 88,589 | | 107,406 | |
Interest and other income, net | Interest and other income, net | | 5,804 | | 2,423 | | 145 | | | 2,423 | | 145 | | 916 | |
| | | | | | | | | |
| | Income (loss) from continuing operations before income taxes | | (1,244 | ) | | 49,039 | | 89,960 | | |
Income from continuing operations before income taxes | | | 48,451 | | 88,734 | | 108,322 | |
Provision for income taxes | Provision for income taxes | | 9,649 | | 19,221 | | 35,377 | | | 18,989 | | 34,893 | | 38,925 | |
| | | | | | | | | |
| | Income (loss) from continuing operations | | (10,893 | ) | | 29,818 | | 54,583 | | |
Income from continuing operations | | | 29,462 | | 53,841 | | 69,397 | |
Discontinued operations, net of income taxes: | Discontinued operations, net of income taxes: | | | | | | | | |
| | Income (loss) from discontinued operations | | 2,638 | | (17,506 | ) | | (6,476 | ) | |
| | Loss on disposal | | — | | (5,635 | ) | | (1,567 | ) | |
| | | | | | | | | |
| | Income (loss) from discontinued operations | | 2,638 | | (23,141 | ) | | (8,043 | ) | |
| | | | | | | | | |
| | | Net income (loss) | | $ | (8,255 | ) | $ | 6,677 | | $ | 46,540 | | |
| | | | | | | | | |
Income (loss) from discontinued operations | | | (17,150 | ) | (5,734 | ) | 1,040 | |
Loss on disposal | | | (5,635 | ) | (1,567 | ) | (28 | ) |
Income (loss) from discontinued operations | | | (22,785 | ) | (7,301 | ) | 1,012 | |
Net income | | | $ | 6,677 | | $ | 46,540 | | $ | 70,409 | |
Basic earnings (loss) per share: | Basic earnings (loss) per share: | | | | | | | | |
| | Income (loss) from continuing operations | | $ | (0.50 | ) | $ | 1.56 | | $ | 3.11 | | |
| | Income (loss) from discontinued operations | | 0.12 | | (1.21 | ) | | (0.46 | ) | |
| | | | | | | | | |
| | Basic earnings (loss) per share | | $ | (0.38 | ) | $ | 0.35 | | $ | 2.65 | | |
| | | | | | | | | |
Income from continuing operations | | | $ | 1.55 | | $ | 3.06 | | $ | 3.99 | |
Income (loss) from discontinued operations | | | (1.20 | ) | (0.41 | ) | 0.05 | |
Basic earnings per share | | | $ | 0.35 | | $ | 2.65 | | $ | 4.04 | |
Diluted earnings (loss) per share: | Diluted earnings (loss) per share: | | | | | | | | |
| | Income (loss) from continuing operations | | $ | (0.50 | ) | $ | 1.54 | | $ | 3.05 | | |
| | Income (loss) from discontinued operations | | 0.12 | | (1.19 | ) | | (0.45 | ) | |
| | | | | | | | | |
| | Diluted earnings (loss) per share | | $ | (0.38 | ) | $ | 0.35 | | $ | 2.60 | | |
| | | | | | | | | |
Income from continuing operations | | | $ | 1.53 | | $ | 3.01 | | $ | 3.86 | |
Income (loss) from discontinued operations | | | (1.18 | ) | (0.41 | ) | 0.06 | |
Diluted earnings per share | | | $ | 0.35 | | $ | 2.60 | | $ | 3.92 | |
Dividends per share | Dividends per share | | $ | 0.40 | | $ | 0.40 | | $ | 0.46 | | | $ | 0.40 | | $ | 0.46 | | $ | 0.48 | |
| | | | | | | | | |
Weighted average shares outstanding: | Weighted average shares outstanding: | | | | | | | | |
| | Basic | | 21,870 | | 19,060 | | 17,570 | | |
| | | | | | | | | |
| | Diluted | | 21,870 | | 19,305 | | 17,886 | | |
| | | | | | | | | |
Basic | | | 19,060 | | 17,570 | | 17,413 | |
Diluted | | | 19,305 | | 17,886 | | 17,965 | |
See notes to consolidated financial statements.
33
Table of Contents
MAXIMUS, Inc.
CONSOLIDATED STATEMENTS OF CHANGES IN SHAREHOLDERS'SHAREHOLDERS’ EQUITY
(In thousands)
| | | | | | | | | | | | | | | | | | | | |
| | Common
Shares
Outstanding | | Common
Stock | | Accumulated
Other
Comprehensive
Income (Loss) | | Retained
Earnings | | Treasury
Stock | | Total
Shareholders'
Equity | |
|---|
Balance at September 30, 2006 | | | 21,545 | | $ | 280,986 | | $ | (916 | ) | $ | 249,466 | | $ | (124,637 | ) | $ | 404,899 | |
| | Net income | | | — | | | — | | | — | | | (8,255 | ) | | — | | | (8,255 | ) |
| | Foreign currency translation | | | — | | | — | | | 2,646 | | | — | | | — | | | 2,646 | |
| | | | | | | | | | | | | | | | | | | |
| | Comprehensive income | | | | | | | | | | | | | | | | | | (5,609 | ) |
| | Employee stock transactions | | | 649 | | | 12,953 | | | — | | | — | | | — | | | 12,953 | |
| | Cash dividends | | | — | | | — | | | — | | | (8,750 | ) | | — | | | (8,750 | ) |
| | Non-cash equity based compensation | | | — | | | 3,829 | | | — | | | — | | | — | | | 3,829 | |
| | Tax benefit due to option exercises | | | — | | | 2,078 | | | — | | | — | | | — | | | 2,078 | |
| | | | | | | | | | | | | | |
Balance at September 30, 2007 as previously reported | | | 22,194 | | | 299,846 | | | 1,730 | | | 232,461 | | | (124,637 | ) | | 409,400 | |
| | Cumulative impact of the adoption of new accounting standards (see "Note 12. Income Taxes") | | | — | | | — | | | — | | | (390 | ) | | — | | | (390 | ) |
| | | | | | | | | | | | | | |
| | Balance at September 30, 2007, adjusted | | | 22,194 | | | 299,846 | | | 1,730 | | | 232,071 | | | (124,637 | ) | | 409,010 | |
| | Net income | | | — | | | — | | | — | | | 6,677 | | | — | | | 6,677 | |
| | Foreign currency translation | | | — | | | — | | | 3,806 | | | — | | | — | | | 3,806 | |
| | | | | | | | | | | | | | | | | | | |
| | Comprehensive income | | | | | | | | | | | | | | | | | | 10,483 | |
| | Employee stock transactions | | | 253 | | | 4,422 | | | — | | | — | | | — | | | 4,422 | |
| | Cash dividends | | | — | | | — | | | — | | | (7,798 | ) | | — | | | (7,798 | ) |
| | Repurchases of common stock | | | (4,145 | ) | | — | | | — | | | — | | | (164,466 | ) | | (164,466 | ) |
| | Price adjustment under Accelerated Share Repurchase agreement | | | — | | | 13,903 | | | — | | | — | | | — | | | 13,903 | |
| | Non-cash equity based compensation | | | — | | | 9,463 | | | — | | | — | | | — | | | 9,463 | |
Tax benefit due to option exercises | | | — | | | 689 | | | — | | | — | | | — | | | 689 | |
| | | | | | | | | | | | | | |
Balance at September 30, 2008, adjusted | | | 18,302 | | | 328,323 | | | 5,536 | | | 230,950 | | | (289,103 | ) | | 275,706 | |
| | Net income | | | — | | | — | | | — | | | 46,540 | | | — | | | 46,540 | |
| | Foreign currency translation | | | — | | | — | | | 2,732 | | | — | | | — | | | 2,732 | |
| | | | | | | | | | | | | | | | | | | |
| | Comprehensive income | | | | | | | | | | | | | | | | | | 49,272 | |
| | Employee stock transactions | | | 225 | | | 2,292 | | | — | | | — | | | — | | | 2,292 | |
| | Cash dividends | | | — | | | — | | | — | | | (8,054 | ) | | — | | | (8,054 | ) |
| | Repurchases of common stock | | | (928 | ) | | — | | | — | | | — | | | (30,046 | ) | | (30,046 | ) |
| | Dividends on RSUs | | | — | | | 166 | | | — | | | (166 | ) | | — | | | — | |
| | Non-cash equity based compensation | | | — | | | 7,307 | | | — | | | — | | | — | | | 7,307 | |
| | Tax benefit due to option exercises | | | — | | | 651 | | | — | | | — | | | — | | | 651 | |
| | | | | | | | | | | | | | |
Balance at September 30, 2009 | | | 17,599 | | $ | 338,739 | | $ | 8,268 | | $ | 269,270 | | $ | (319,149 | ) | $ | 297,128 | |
| | | | | | | | | | | | | | |
| | Common
Shares
Outstanding | | Common
Stock | | Accumulated
Other
Comprehensive
Income | | Retained
Earnings | | Treasury
Stock | | Total
Shareholders’
Equity | |
Balance at September 30, 2007 | | 22,194 | | $ | 299,846 | | $ | 1,730 | | $ | 232,071 | | $ | (124,637 | ) | $ | 409,010 | |
Net income | | — | | — | | — | | 6,677 | | — | | 6,677 | |
Foreign currency translation | | — | | — | | 3,806 | | — | | — | | 3,806 | |
Comprehensive income | | | | | | | | | | | | 10,483 | |
Employee stock transactions | | 253 | | 4,422 | | — | | — | | — | | 4,422 | |
Cash dividends | | — | | — | | — | | (7,798 | ) | — | | (7,798 | ) |
Repurchases of common stock | | (4,145 | ) | — | | — | | — | | (164,466 | ) | (164,466 | ) |
Price adjustment under Accelerated Share Repurchase agreement | | — | | 13,903 | | — | | — | | — | | 13,903 | |
Non-cash equity based compensation | | — | | 9,463 | | — | | — | | — | | 9,463 | |
Tax benefit due to option exercises | | — | | 689 | | — | | — | | — | | 689 | |
Balance at September 30, 2008 | | 18,302 | | 328,323 | | 5,536 | | 230,950 | | (289,103 | ) | 275,706 | |
Net income | | — | | — | | — | | 46,540 | | — | | 46,540 | |
Foreign currency translation | | — | | — | | 2,732 | | — | | — | | 2,732 | |
Comprehensive income | | | | | | | | | | | | 49,272 | |
Employee stock transactions | | 225 | | 2,292 | | — | | — | | — | | 2,292 | |
Cash dividends | | — | | — | | — | | (8,054 | ) | — | | (8,054 | ) |
Repurchases of common stock | | (928 | ) | — | | — | | — | | (30,046 | ) | (30,046 | ) |
Dividends on RSUs | | — | | 166 | | — | | (166 | ) | — | | — | |
Non-cash equity based compensation | | — | | 7,307 | | — | | — | | — | | 7,307 | |
Tax benefit due to option exercises | | — | | 651 | | — | | — | | — | | 651 | |
Balance at September 30, 2009 | | 17,599 | | 338,739 | | 8,268 | | 269,270 | | (319,149 | ) | 297,128 | |
Net income | | — | | — | | — | | 70,409 | | — | | 70,409 | |
Foreign currency translation | | — | | — | | 6,262 | | — | | — | | 6,262 | |
Comprehensive income | | | | | | | | | | | | 76,671 | |
Employee stock transactions | | 326 | | 2,763 | | — | | — | | — | | 2,763 | |
Cash dividends | | — | | — | | — | | (8,375 | ) | — | | (8,375 | ) |
Repurchases of common stock | | (751 | ) | — | | — | | — | | (40,217 | ) | (40,217 | ) |
Dividends on RSUs | | — | | 375 | | — | | (375 | ) | — | | — | |
Non-cash equity based compensation | | — | | 7,918 | | — | | — | | — | | 7,918 | |
Tax benefit due to option exercises | | — | | 2,901 | | — | | — | | — | | 2,901 | |
Balance at September 30, 2010 | | 17,174 | | $ | 352,696 | | $ | 14,530 | | $ | 330,929 | | $ | (359,366 | ) | $ | 338,789 | |
See notes to consolidated financial statements.
34
Table of Contents
MAXIMUS, Inc.
CONSOLIDATED STATEMENTS OF CASH FLOWS
(Dollars in thousands)
|
|
| | Year ended September 30, | | | Year ended September 30, | |
|---|
|
| | 2007 | | 2008 | | 2009 | | | 2008 | | 2009 | | 2010 | |
|---|
Cash flows from operating activities: | Cash flows from operating activities: | | | | | | | | |
| | Net income (loss) | | $ | (8,255 | ) | $ | 6,677 | | $ | 46,540 | | |
| | Adjustments to reconcile net income to net cash provided by operating activities: | | |
| | (Income) loss from discontinued operations | | (2,638 | ) | | 23,141 | | 8,043 | | |
| | Depreciation | | 9,534 | | 8,845 | | 8,882 | | |
| | Amortization | | 2,450 | | 3,396 | | 3,350 | | |
| | Deferred income taxes | | (12,598 | ) | | (28,851 | ) | | 26,719 | | |
| | Gain on sale of business | | (451 | ) | | — | | — | | |
| | Gain on sale of building | | — | | (3,938 | ) | | — | | |
| | Gain on sale of fixed assets | | — | | — | | (51 | ) | |
| | Deferred interest income on note receivable | | — | | 147 | | 376 | | |
| | Non-cash equity based compensation | | 3,962 | | 9,123 | | 7,307 | | |
| | Changes in assets and liabilities, net of effects from divestitures: | | |
| | | Accounts receivable—billed | | (4,125 | ) | | (13,458 | ) | | (12,040 | ) | |
| | | Accounts receivable—unbilled | | 1,338 | | 2,516 | | (7,649 | ) | |
| | | Due from insurance carrier | | — | | (12,500 | ) | | 12,500 | | |
| | | Prepaid expenses and other current assets | | (143 | ) | | (1,207 | ) | | (11,801 | ) | |
| | | Deferred contract costs | | 3,049 | | 2,792 | | (2,882 | ) | |
| | | Other assets | | 4,375 | | (1,250 | ) | | (824 | ) | |
| | | Accounts payable | | 358 | | 266 | | 1,855 | | |
| | | Accrued compensation and benefits | | 3,815 | | 2,422 | | 5,476 | | |
| | | Deferred revenue | | 2,267 | | (90 | ) | | 5,820 | | |
| | | Income taxes | | 14,490 | | 11,223 | | (20,751 | ) | |
| | | Other liabilities | | 1,167 | | 47,502 | | (36,715 | ) | |
| | | | | | | | | |
| | Cash provided by operating activities—continuing operations | | 18,595 | | 56,756 | | 34,155 | | |
| | Cash provided by (used in) operating activities—discontinued operations | | 32,595 | | (1,206 | ) | | (3,522 | ) | |
| | | | | | | | | |
| | Cash provided by operating activities | | 51,190 | | 55,550 | | 30,633 | | |
Net income | | | $ | 6,677 | | $ | 46,540 | | $ | 70,409 | |
Adjustments to reconcile net income to net cash provided by operating activities: | | | | | | | | |
(Income) loss from discontinued operations | | | 22,785 | | 7,301 | | (1,012 | ) |
Depreciation | | | 8,845 | | 8,882 | | 12,857 | |
Amortization | | | 3,396 | | 3,350 | | 5,483 | |
Deferred income taxes | | | (28,851 | ) | 26,471 | | (3,172 | ) |
Gain on sale of building | | | (3,938 | ) | — | | — | |
Gain on sale of fixed assets | | | — | | (51 | ) | — | |
Deferred interest income on note receivable | | | 147 | | 376 | | 263 | |
Non-cash equity based compensation | | | 9,123 | | 7,307 | | 7,918 | |
Changes in assets and liabilities, net of effects from divestitures: | | | | | | | | |
Accounts receivable—billed | | | (12,694 | ) | (13,052 | ) | 38 | |
Accounts receivable—unbilled | | | (1,259 | ) | (6,677 | ) | 2,415 | |
Due from insurance carrier | | | (12,500 | ) | 12,500 | | — | |
Prepaid expenses and other current assets | | | (1,207 | ) | (11,801 | ) | (1,740 | ) |
Deferred contract costs | | | 2,792 | | (2,882 | ) | 1,541 | |
Other assets | | | (1,250 | ) | (822 | ) | (6,773 | ) |
Accounts payable | | | 1,021 | | 993 | | (407 | ) |
Accrued compensation and benefits | | | 2,422 | | 5,497 | | 7,883 | |
Deferred revenue | | | (90 | ) | 5,820 | | 31,294 | |
Income taxes | | | 11,223 | | (20,503 | ) | 6,374 | |
Other liabilities | | | 47,502 | | (36,715 | ) | 7,600 | |
Cash provided by operating activities—continuing operations | | | 54,144 | | 32,534 | | 140,971 | |
Cash provided by (used in) operating activities—discontinued operations | | | 1,406 | | (1,901 | ) | (2,530 | ) |
Cash provided by operating activities | | | 55,550 | | 30,633 | | 138,441 | |
Cash flows from investing activities: | Cash flows from investing activities: | | | | | | | | |
| | Proceeds (payments) from sales of discontinued operations, net of transaction costs | | — | | 37,678 | | (1,626 | ) | |
| | Proceeds from sale of business, net of transaction costs | | 1,871 | | — | | — | | |
| | Proceeds from sale of building, net of transaction costs | | — | | 5,929 | | — | | |
| | Acquisition of business, net of cash acquired | | — | | (3,150 | ) | | (406 | ) | |
| | Proceeds from note receivable | | — | | 237 | | 972 | | |
| | Purchases of property and equipment | | (12,152 | ) | | (10,380 | ) | | (19,694 | ) | |
| | Capitalized software costs | | (2,350 | ) | | (5,131 | ) | | (6,888 | ) | |
| | (Increase) decrease in marketable securities | | (8,895 | ) | | 126,210 | | — | | |
| | Proceeds from sale of equipment | | — | | — | | 696 | | |
| | | | | | | | | |
| | Cash provided by (used in) investing activities—continuing operations | | (21,526 | ) | | 151,393 | | (26,946 | ) | |
| | Cash used in investing activities—discontinued operations | | (3,328 | ) | | (2,933 | ) | | (90 | ) | |
| | | | | | | | | |
| | Cash provided by (used in) investing activities | | (24,854 | ) | | 148,460 | | (27,036 | ) | |
Proceeds (payments) from sales of discontinued operations, net of transaction costs | | | 37,678 | | (1,626 | ) | 1,700 | |
Proceeds from sale of building, net of transaction costs | | | 5,929 | | — | | — | |
Acquisition of businesses, net of cash acquired | | | (3,150 | ) | (406 | ) | (11,960 | ) |
Proceeds from note receivable | | | 237 | | 972 | | 473 | |
Purchases of property and equipment | | | (10,380 | ) | (19,694 | ) | (13,936 | ) |
Capitalized software costs | | | (5,131 | ) | (6,888 | ) | (8,672 | ) |
Decrease in marketable securities | | | 126,210 | | — | | — | |
Proceeds from sale of equipment | | | — | | 696 | | — | |
Cash provided by (used in) investing activities—continuing operations | | | 151,393 | | (26,946 | ) | (32,395 | ) |
Cash used in investing activities—discontinued operations | | | (2,933 | ) | (90 | ) | — | |
Cash provided by (used in) investing activities | | | 148,460 | | (27,036 | ) | (32,395 | ) |
Cash flows from financing activities: | Cash flows from financing activities: | | | | | | | | |
| | Employee stock transactions | | 12,953 | | 4,422 | | 2,292 | | |
| | Repurchases of common stock | | — | | (164,466 | ) | | (30,046 | ) | |
| | Price adjustment under Accelerated Share Repurchase agreement | | — | | 13,903 | | — | | |
| | Payments on capital lease obligations | | (1,690 | ) | | (1,627 | ) | | (417 | ) | |
| | Tax benefit due to option exercises and restricted stock units vesting | | 2,078 | | 689 | | 651 | | |
| | Cash dividends paid | | (8,750 | ) | | (7,798 | ) | | (8,054 | ) | |
| | | | | | | | | |
| | Cash provided by (used in) financing activities—continuing operations | | 4,591 | | (154,877 | ) | | (35,574 | ) | |
| | Cash provided by financing activities—discontinued operations | | — | | — | | — | | |
| | | | | | | | | |
| | Cash provided by (used in) financing activities | | 4,591 | | (154,877 | ) | | (35,574 | ) | |
| | | | | | | | | |
Employee stock transactions | | | 4,422 | | 2,292 | | 2,763 | |
Repurchases of common stock | | | (164,466 | ) | (30,046 | ) | (40,217 | ) |
Price adjustment under Accelerated Share Repurchase agreement | | | 13,903 | | — | | — | |
Payments on capital lease obligations | | | (1,627 | ) | (417 | ) | — | |
Tax benefit due to option exercises and restricted stock units vesting | | | 689 | | 651 | | 2,901 | |
Repayment of long-term debt | | | — | | — | | (7 | ) |
Issuance of long-term debt | | | — | | — | | 533 | |
Cash dividends paid | | | (7,798 | ) | (8,054 | ) | (8,375 | ) |
Cash used in financing activities—continuing operations | | | (154,877 | ) | (35,574 | ) | (42,402 | ) |
Cash provided by financing activities—discontinued operations | | | — | | — | | — | |
Cash used in financing activities | | | (154,877 | ) | (35,574 | ) | (42,402 | ) |
Effect of exchange rate changes on cash | Effect of exchange rate changes on cash | | — | | — | | 187 | | | — | | 187 | | 3,862 | |
| | | | | | | | | |
| | | Net increase (decrease) in cash and cash equivalents | | 30,927 | | 49,133 | | (31,790 | ) | |
Net increase (decrease) in cash and cash equivalents | | | 49,133 | | (31,790 | ) | 67,506 | |
Cash and cash equivalents, beginning of period | Cash and cash equivalents, beginning of period | | 39,545 | | 70,472 | | 119,605 | | | 70,472 | | 119,605 | | 87,815 | |
| | | | | | | | | |
Cash and cash equivalents, end of period | Cash and cash equivalents, end of period | | $ | 70,472 | | $ | 119,605 | | $ | 87,815 | | | $ | 119,605 | | $ | 87,815 | | $ | 155,321 | |
| | | | | | | | | |
See notes to consolidated financial statements.
35
Table of Contents
MAXIMUS, Inc.
Notes to Consolidated Financial Statements
For the years ended September 30, 2007, 2008, 2009 and 2009
2010
1. Business and Summary of Significant Accounting Policies
MAXIMUS, Inc. (the "Company"“Company” or "we"“we”) provides operations program management and consultingbusiness process outsourcing services primarily to government health and governmenthuman services agencies in the United States and to foreign governments. TheDuring the year, management made changes to the manner in which they operated the business. Following this reorganization, the Company conducts its operations through two business segments: OperationsHealth Services and Consulting.Human Services. The OperationsHealth Services Segment provides a variety of programbusiness process managed services and administrative support services for state, federal, national and local government programs, including: Medicaid, Medicaid Managed Care, CHIP, Health Care Reform, Medicare and Health Insurance BC (British Columbia). The Human Services Segment provides a variety of administrative support and case management services primarily the delivery of administrativefor federal, national, state and county human services for government health and human service programs. The Consulting Segment provides specialized financial consulting services such as assisting states, local agencies and schools in obtaining federal funding reimbursements for theirincluding welfare-to-work programs, and implementing cost reductions strategies, as well as providing technicalchild support enforcement, higher education services and software products.K-12 special education services.
Other than disclosed in Note 2,21, the Notes to Consolidated Financial Statements reflect operating results from continuing operations.
The Company operates predominantly in the United States. Revenue from foreign-based projects and offices was 15%17%, 17%, and 17%27% of total revenue for the years ended September 30, 2007, 2008, 2009 and 2009,2010, respectively.
The consolidated financial statements include the accounts of MAXIMUS, Inc. and its wholly-owned subsidiaries. In addition to the Company's wholly owned subsidiaries, the financial statements as of and for the fiscal years ended September 30, 2007, 2008 and 2009 include a majority (55%) owned international subsidiary. All significant intercompany balances and transactions have been eliminated in consolidation.
In fiscal 2009,2010, approximately 66%59% of our total revenue was derived from state and local government agencies; 27% from foreign customers; 9% from federal government agencies; 17% from foreign customers; and 8%5% from other sources, such as commercial customers. Revenue is generated from contracts with various pricing arrangements, including: (1) fixed-price; (2) performance-based criteria; (3) costs incurred plus a negotiated fee ("cost-plus"(“cost-plus”); and (4) time and materials. Also, some contracts contain "not-to-exceed"“not-to-exceed” provisions. Of the contracts with "not-to-exceed"“not-to-exceed” provisions, to the extent we estimate we will exceed the contractual limits, we treat these contracts as fixed price. For fiscal 2009, revenue from fixed-price contracts was approximately 27% of total revenue;2010, revenue from performance-based contracts was approximately 40%47% of total revenue; revenue from cost-plus contracts was approximately 31%29% of total revenue; revenue from fixed-price contracts was approximately 21% of total revenue; and revenue from time and materials contracts was approximately 2%3% of total revenue. A majority of the contracts with state and local government agencies have been fixed-price and performance-based, and our contracts with the federal government generally have been cost-plus. Fixed-price and performance-based contracts generally offer higher margins but typically involve more risk than cost-plus or time and materials reimbursement contracts.
We recognize revenue on general service arrangements as work is performed and amounts are earned. We consider amounts to be earned once evidence of an arrangement has been obtained, services are delivered, fees are fixed or determinable, and collectability is reasonably assured.
Table of Contents
MAXIMUS, Inc.
Notes to Consolidated Financial Statements (Continued)
For the years ended September 30, 2007, 2008 and 2009
1. Business and Summary of Significant Accounting Policies (Continued)
We recognize revenue on fixed-priced contracts when earned, as services are provided. For certain fixed-price contracts, primarily systems design, development and implementation, we recognize revenue based on costs incurred using estimates of total expected contract revenue and costs to be incurred. The cumulative impact of any revisions in estimated revenue and costs is recognized in the period in which the facts that give rise to the revision become known. Provisions for estimated losses on incomplete contracts are provided for in full in the period in which such losses become known.
36
Table of Contents
For other fixed-price contracts, revenue is recognized on a straight-line basis unless evidence suggests that revenue is earned or obligations are fulfilled in a different pattern. Where obligations are fulfilled in a different pattern, revenue is generally recognized as services are provided, based upon outputs provided to the customer. With fixed-price contracts, we are subject to the risk of potential cost overruns. Costs related to contracts may be incurred in periods prior to recognizing revenue. These costs are generally expensed. However, certain direct and incremental set-up costs may be deferred until services are provided and revenue begins to be recognized, when such costs are recoverable from a contractual arrangement. Set-up costs are costs related to activities that enable us to provide contractual services to a client. The timing of expense recognition may result in irregular profit margins.
We recognize revenue on performance-based contracts as such revenue becomes fixed or determinable, which generally occurs when amounts are billable to customers. For certain contracts, this may result in revenue being recognized in irregular increments.
Revenue on cost-plus contracts is recognized based on costs incurred plus an estimate of the negotiated fee earned. Revenue on time and materials contracts is recognized based on hours worked and expenses incurred.
Our most significant expense is cost of revenue, which consists primarily of project-related costs such as employee salaries and benefits, subcontractors, computer equipment and travel expenses. Our management uses its judgment and experience to estimate cost of revenue expected on projects. Our management'smanagement’s ability to accurately predict personnel requirements, salaries and other costs as well as to effectively manage a project or achieve certain levels of performance can have a significant impact on the gross margins related to our fixed-price, performance-based and time and materials contracts. If actual costs are higher than our management'smanagement’s estimates, profitability may be adversely affected. Service cost variability has little impact on cost-plus arrangements because allowable costs are reimbursed by the customer.
We also license software under license agreements. Software license revenue is recognized when a customer enters into a non-cancelable license agreement, the software product has been delivered, there are no uncertainties surrounding product acceptance, there are no significant future performance obligations, the license fees are fixed or determinable and collection of the license fee is considered probable. Amounts received in advance of meeting these criteria are deferred and classified as deferred revenue in the accompanying consolidated balance sheets. The Company determines the value of the software component of its multiple-element arrangements using the residual method as vendor specific objective evidence ("VSOE"(“VSOE”) of fair value exists for the undelivered elements such as the support and maintenance agreements and related implementation and training services, but not for all delivered elements such as the software itself. The residual method requires revenue to be allocated to the undelivered elements based on the fair value of such elements, as indicated by VSOE. VSOE is based on the price charged when the element is sold separately. Maintenance and post-contract customer support revenue are recognized ratably over the term of the related agreements, which in most cases is
Table of Contents
MAXIMUS, Inc.
Notes to Consolidated Financial Statements (Continued)
For the years ended September 30, 2007, 2008 and 2009
1. Business and Summary of Significant Accounting Policies (Continued)
one year. Revenue from software-related consulting services under time and material contracts and for training is recognized as services are performed. Revenue from other software-related contract services requiring significant modification or customization of software is recognized under the percentage-of-completion method.
Where contracts have multiple deliverables, we evaluate these deliverables at the inception of each contract and as each item is delivered. As part of this evaluation, we consider whether (i) a delivered item has value to a customer on a stand-alone basis; (ii) there is objective and reliable evidence of the fair market value of the undelivered items; and (iii) whether the delivery of the undelivered items is considered probable and substantially within our control, if a general right of return exists. Where deliverables, or groups of deliverables, have all three of these characteristics, we treat each deliverable item as a separate unit of accounting and apply the relevant revenue recognition guidance to each deliverable. For transactions entered into after September 30, 2010, the Company will adopt updated accounting rules with respect to multiple-element arrangements. See “Note 2. Recent Accounting Pronouncements.”
The Company considers all highly liquid investments with an original maturity of three months or less when purchased to be cash equivalents. Cash equivalents are valued at cost, which approximates market.
Restricted cash represents amounts collected on behalf of certain customers and its use is restricted to the purposes specified under our contracts with these customers.
Table of Contents
(f) Accounts Receivable and Allowance for Doubtful Accounts
Accounts receivable are recorded at their face amount less an allowance for doubtful accounts. We maintain an allowance for doubtful accounts at an amount we estimate to be sufficient to cover the risk of collecting less than full payment on our receivables. On a regular basis we re-evaluate our client receivables, especially receivables that are past due, and reassess our allowance for doubtful accounts based on specific client collection issues.
Property and equipment is stated at cost and depreciated using the straight-line method based on estimated useful lives not to exceed 39.5 years for the Company'sCompany’s buildings and between three and seven years for office furniture and equipment. Leasehold improvements are amortized over their useful life or the remaining term of the lease, whichever is shorter.
Software development costs are capitalized and amortized using different methodologies, depending upon the intended use of the asset.
All of the software development costs included within continuing operations relate to software which is intended to be used byfor the Company.Company’s internal use. Direct costs of time and material incurred for the
Table of Contents
MAXIMUS, Inc.
Notes to Consolidated Financial Statements (Continued)
For the years ended September 30, 2007, 2008 and 2009
1. Business and Summary of Significant Accounting Policies (Continued)
development of application software for internal use are capitalized and amortized using the straight-line method over the estimated useful life of the software, ranging from three to eight years.
Deferred contract costs consist of contractually recoverable direct set-up costs relating to long-term service contracts in progress. These costs include direct and incremental costs incurred prior to the commencement of us providing service to enable us to provide the contracted services to our customer. Such costs are expensed over the period services are provided under the long-term service contract. We review deferred contract costs for impairment whenever events or changes in circumstances indicate that the carrying amount may not be recoverable. Our review is based on our projection of the undiscounted future operating cash flows of the related customer project. To the extent such projections indicate that future undiscounted cash flows are not sufficient to recover the carrying amount, we recognize a non-cash impairment charge to reduce the carrying amount to equal projected future discounted cash flows. No impairment charges were recorded in the three years ending September 30, 2010.
Goodwill is typically obtained by the Company as a result of business combinations. Goodwill represents the difference between the consideration paid in acquiring the business including those costs directly incurred as a result of the acquisition, and the fair value of the identifiable net assets acquired.
Goodwill is not amortized but is subject to impairment testing on an annual basis, or more frequently if impairment indicators arise. Impairment testing is performed at the reporting unit level. A reporting unit is the operating segment, or a business one level below that operating segment (the component level) if discrete financial information is prepared and reviewed regularly by segment management. However, components are aggregated if they have similar economic characteristics. We recognize an impairment charge for any amount by which the carrying amount of a reporting unit'sunit’s goodwill exceeds its fair value. We use discounted cash flows to establish fair values. When available and as appropriate, we use comparative market multiples to corroborate the discounted cash flow results. When a portion of a reporting unit is disposed of, goodwill is allocated using the relative fair value method for purposes of calculating the gain or loss on disposal. In addition, a goodwill impairment test is performed for the remaining portion of the reporting unit.
The Company performs its annual impairment test as of July 1st of each year. Based on the analysis performed as ofAt July 1, 2009,2010, the Company performed the annual impairment test based upon the reporting units in existence at this time, which were consistent with the Company’s operating segments, Consulting and Operations. Based upon this test, management determined that there had been no impairment of goodwill. Following
During the decision to sellfourth quarter, management reorganized the ERP division,manner in which the Company allocated the goodwill held by the Consulting segment between the ERP division and the remaining Consulting segment, based upon a relative fair value methodology. Fair value was determined using both a discounted cash flow and comparative market multiple approach based upon data available at September 30, 2009. The Company performed goodwill impairment tests over the ERP division and the remaining Consulting segment as of September 30, 2009. The Company recorded a $1.2 million goodwill impairment charge relatedis operated, which resulted in changes to the ERP division, which is reflected in the loss on disposaloperating segments and reporting units. A further assessment was made of discontinued operations for the year ended September 30, 2009.goodwill at this time, and no impairment was noted.
38
Table of Contents
MAXIMUS, Inc.
Notes to Consolidated Financial Statements (Continued)
For the years ended September 30, 2007, 2008 and 2009
1. Business and Summary of Significant Accounting Policies (Continued)
Intangible assets from acquisitions, which consist primarily of customer contracts and relationships, technology-based intangibles and non-competition agreements, are amortized using the straight-line method over one to ten years, based on their estimated useful lives.
The Company reviews long-lived assets for impairment whenever events or circumstances indicate that the carrying amount of an asset may not be fully recoverable. An impairment loss is recognized if the sum of the long-term undiscounted cash flows is less than the carrying amount of the long-lived assets being evaluated and a determination is made that the fair value of the asset is less than its book value. Any write-downs are treated as permanent reductions in the carrying amount of the assets. The Company believes that the carrying values of its assets as of September 30, 20092010 are fully realizable.
(l) Legal and Settlement Expense (Recovery), Net
Legal and settlement expense consists of costs, net of reimbursed insurance claims, related to significant legal settlements and non-routine legal matters, including future probable legal costs estimated to be incurred in connection with those matters. Legal expenses incurred in the ordinary course of business are included in selling, general and administrative expense.
(l)(m) Income Taxes
Deferred tax liabilities and assets are determined based on the difference between the financial statement and tax basis of assets and liabilities using enacted rates expected to be in effect during the year in which the differences reverse. The effect on deferred tax assets and liabilities due to a change in tax rates is recognized in income tax expense in the period that includes the enactment date. A tax benefit or expense is recognized for the net change in the deferred tax asset or liability during the year and the current tax liability for the year. As of September 30, 2009,2010, the Company had $5.2$4.0 million of net operating loss carryforwards related to a Canadian subsidiary. A full valuation allowance of $1.8$1.1 million has been established against the related deferred tax asset. Evaluating the net operating loss carryforwards requires us to make certain estimates relating to the future operating results and cash flows to assess the valuation of the deferred tax assets.
Since October 1, 2007, the
The Company has accountedaccounts for uncertain tax positions by recognizing the financial statement effects of a tax position only when, based upon the technical merits, it is "more-likely-than-not"“more-likely-than-not” that the position will be sustained upon examination. The cumulative effect of this change in accounting policy was an increase in the liability for unrecognized tax benefits of $0.4 million, which was accounted for as a decrease in the October 1, 2007 balance of retained earnings on our consolidated balance sheet.
Comprehensive income (loss) includes changes in the balances of the items that are reported directly as separate components of shareholder'sshareholder’s equity. Comprehensive income (loss) includes net income plus changes in the net unrealized gain (loss) on investments, net of taxes, and changes in cumulative foreign currency translation adjustments.
The assets and liabilities of foreign operations are translated into U.S. dollars at current exchange rates, and revenue and expenses are translated at average exchange rates for the period. The resulting cumulative translation adjustment is included in accumulated other comprehensive income (loss) on the consolidated balance sheet. For the years ended September 30, 2007, 2008, 2009, and 2009,2010, accumulated foreign currency gains (losses) included in accumulated other comprehensive income (loss) were
Table of Contents
MAXIMUS, Inc.
Notes to Consolidated Financial Statements (Continued)
For the years ended September 30, 2007, 2008 $3.8 million, $2.7 million, and 2009
1. Business and Summary of Significant Accounting Policies (Continued)
$2,646,000, $3,806,000 and $2,723,000,$6.3 million, respectively. Foreign currency transaction gains (losses), including foreign currency gains (losses) on short-term loans with our foreign subsidiaries, are included in other income and were $(194,000), $157,000$0.2 million, $0.2 million, and $178,000($0.1 million) for the years ended September 30, 2007, 2008, 2009 and 2009,2010, respectively.
The Company presents both basic and diluted earnings per share on the face of the Consolidated Statements of Operations.
Basic earnings per share exclude dilution and are computed by dividing net income by the weighted average number of common shares outstanding for the period.
39
Table of Contents
Diluted earnings per share reflect potential dilution that could occur if securities or other contracts to issue common stock were exercised or converted into common stock. Diluted earnings per share include the incremental effect of stock options and restricted stock units calculated using the treasury stock method.
The Company considers the recorded value of its financial assets and liabilities, which consist primarily of cash and cash equivalents, accounts receivable and accounts payable, acquisition-related contingent consideration and deferred compensation plan liabilities, to approximate the fair value of the respective assets and liabilities at September 30, 20082009 and 2009.2010.
The preparation of financial statements in conformity with accounting principles generally accepted in the United States requires management to make estimates and assumptions that affect the reported amounts of assets and liabilities, the disclosure of contingent assets and liabilities, and the reported amounts of revenue and expenses during the reporting period. Actual results could differ from those estimates. Significant estimates used by the Company include estimates of profits or loss on contracts in process, estimates of collectability of receivables, evaluation of asset impairment, and accrual of estimated liabilities, and valuation of acquisition-related contingent consideration liabilities.
(r) Legal and Settlement Expense (Recovery), Net
Legal and settlement expense consists of costs, net of reimbursed insurance claims, related to significant legal settlements and non-routine legal matters, including future probable legal costs estimated to be incurred in connection with those matters. Legal expenses incurred in the ordinary course of business are included in selling, general and administrative expense.
Certain financial results have been reclassified to conform to the current year presentation. Such reclassifications include the qualification of our Enterprise Resource Performance (ERP) division as discontinued operations. We reclassified
In fiscal 2009, we presented our consolidated balance sheet as of September 30, 20082009 to show the assets and liabilities of the ERP division as discontinued operations. We also previously reclassified our
Table of Contents
MAXIMUS, Inc.
Notes to Consolidated Financial Statements (Continued)
For the years ended September 30, 2007, 2008 and 2009
1. Business and Summary of Significant Accounting Policies (Continued)
consolidated statements of operations and statements of cash flows for the years ended September 30, 20072008 and 20082009 to show the results of this division as discontinued operations. The sale of the ERP division was concluded in 2010 but the company retained a single contract. Accordingly, this contract has been removed from discontinued operations for all comparative periods and shown within continuing operations.
From time to time, we are involved in legal proceedings, including contract and employment claims, in the ordinary course of business. We assess the likelihood of any adverse judgments or outcomes to these contingencies as well as potential ranges of probable losses and establish reserves accordingly. The amount of reserves required may change in future periods due to new developments in each matter or changes in approach to a matter such as a change in settlement strategy.
2. Recent Accounting Pronouncements
In December 2007, the Financial Accounting Standards Board (“FASB”) issued a new accounting standard that provides guidance for business combinations. Under this standard, more transactions will be recorded as business combinations, as it changes the definitions of a business, which would no longer be required to be self-sustaining or revenue generating, and a business combination, which would include combinations that occur by contract alone or due to changes in substantive participation rights, such as a lapse in minority veto rights. Certain acquired contingencies will be recorded initially at fair value on the acquisition date. After the acquisition, if new information is available, contingent liabilities will be measured at the higher of the likely amount to be paid and the acquisition-date fair value. Contingent assets will be measured subsequently at the lower of the current estimated future amount to be realized and the acquisition-date fair value. Transaction and restructuring costs generally will be expensed as incurred. The Company adopted this standard in the current fiscal year, and applied the standard to the acquisition of DeltaWare (see “Note 3. Acquisition”). The Company will utilize this standard on all such future transactions.
In December 2007, the FASB issued a new accounting standard that provides guidance on the accounting and reporting requirements for noncontrolling interests in financial statements. The guidance requires ownership interests in subsidiaries other than MAXIMUS, Inc. to be clearly identified, labeled and presented in the consolidated statement of financial position within equity, but separate from MAXIMUS, Inc.’s equity. It also requires the amount of consolidated net income attributable to MAXIMUS, Inc. and to the noncontrolling interest to be clearly identified and presented on the face of the consolidated statement of income. The Company does not have any material noncontrolling interests and, accordingly, there was no material impact on the adoption of this standard.
40
Table of Contents
In February 2008, the FASB issued revised guidance delaying the effective date for requirements relating to the fair valuation of non-financial assets and liabilities, except for items that are recognized or disclosed at fair value in the financial statements on a recurring basis. For items within its scope, the update deferred the effective date of the fair value measurement to the start of the Company’s current fiscal year, or October 1, 2009. The Company has assessed the impact of this guidance for its non-financial assets and liabilities and determined that there was no material impact.
In September 2009, the FASB issued revised guidance for accounting for arrangements that contain more than one contract element. The revised guidance establishes a selling price hierarchy for determining the selling price of each contract element. The guidance also expands the required disclosures. The Company will adopt this standard on a prospective basis on October 1, 2010. We do not believe the adoption of this standard would have materially affected the accounting treatment for our existing contracts.
3. Acquisition
DeltaWare
On February 10, 2010 (the acquisition date), the Company acquired 100% of the share capital of DeltaWare, Inc. (DeltaWare). DeltaWare is a Canadian company specializing in health administration management systems. MAXIMUS acquired DeltaWare, among other reasons, to broaden its core health services offerings and strengthen its position in the administration of public health programs. The acquired assets and business have been integrated into the Company’s Health Services segment.
The estimated acquisition date fair value of consideration transferred, assets acquired and liabilities are presented below and represent management’s best estimates (in thousands).
Cash, net of cash acquired | | $ | 10,385 | |
Contingent consideration obligations | | 3,015 | |
Total fair value of consideration | | $ | 13,400 | |
| | | |
Accounts receivable | | $ | 2,010 | |
Other tangible assets | | 1,571 | |
Intangible assets | | 6,060 | |
Total identifiable assets acquired | | 9,641 | |
| | | |
Accounts payable and other liabilities | | 2,125 | |
Loans payable | | 870 | |
Deferred revenue | | 723 | |
Total liabilities assumed | | 3,718 | |
| | | |
Net identifiable assets acquired | | 5,923 | |
| | | |
Goodwill | | 7,477 | |
Net assets acquired | | $ | 13,400 | |
On the acquisition date, we paid $9.1 million to the previous owners of DeltaWare in return for all of the outstanding ownership interests. Additional payments of $1.3 million were made to the previous owners based upon the final calculation of the tangible net worth of the business acquired.
In addition, we may make future additional payments (contingent consideration) totaling up to seven million Canadian Dollars in cash over the course of the next seven years. The contingent consideration payments are based upon the achievement of profitability and sales targets over the seven year period.
A liability totaling $3.0 million was recognized for an estimate of the acquisition date fair value of the contingent consideration. We determined the fair value of the liability based on a probability-weighted approach derived from management’s own estimates of profitability and sales targets. Any change in the estimated liability subsequent to the acquisition date fair value will be recognized in earnings in the period in which the change of estimate occurs. From the acquisition date through September 30, 2010, there has been no change to the estimated liability except foreign exchange fluctuations.
41
Table of Contents
The identifiable assets acquired and liabilities assumed were recognized and measured as of the acquisition date based upon their estimated fair values. The excess of the acquisition date fair value of consideration over the estimated fair value of the net assets acquired was recorded as goodwill. The Company considers the goodwill to represent a number of potential strategic and financial benefits that are expected to be realized as a result of the acquisition, including, but not limited to bringing new capabilities to MAXIMUS in the adjacent markets and opportunities to expand its geographic reach
The valuation of the intangible assets acquired is summarized below (in thousands).
| | Useful life | | Fair value | |
Technology-based intangibles | | 8.5 years | | $ | 3,733 | |
Customer contracts and relationships | | 8-10 years | | 1,474 | |
Non-compete arrangements | | 4 years | | 239 | |
Trade name | | 10 years | | 614 | |
Total intangible assets | | | | $ | 6,060 | |
The total weighted average amortization period is 8.6 years.
The fair value of the accounts receivable balance comprises gross receivables of $2.0 million. There is no material valuation allowance against this balance at acquisition.
Of the total fair value of consideration, $7.5 million was allocated to goodwill. Goodwill is not expected to be deductible for income tax purposes.
DeltaWare contributed $7.0 million of revenue and $0.6 million of net income for the year ending September 30, 2010.
4. Goodwill and Intangible Assets
Changes in goodwill for the years ended September 30, 2009 and 2010 are as follows (in thousands):
| | Health Services | | Human Services | | Total | |
Balance as of September 30, 2008 | | $ | 35,678 | | $ | 23,781 | | $ | 59,459 | |
Goodwill activity during year related to acquisitions | | — | | 724 | | 724 | |
Foreign currency translation | | — | | 846 | | 846 | |
Balance as of September 30, 2009 | | 35,678 | | 25,351 | | 61,029 | |
Goodwill activity during year related to acquisitions | | 7,477 | | 1,058 | | 8,535 | |
Foreign currency translation | | 115 | | 1,572 | | 1,687 | |
Balance as of September 30, 2010 | | $ | 43,270 | | $ | 27,981 | | $ | 71,251 | |
During the year ended September 30, 2010, the Company acquired DeltaWare, resulting in additional goodwill of $7.5 million (see “Note 3. Acquisition”). The Company also had an adjustment to goodwill of approximately $1.1 million relating to the finalization of amounts related to previous acquisitions.
During the year ended September 30, 2008, the Company acquired 100% of the shares of Westcountry Training and Consultancy Services Limited. The transaction included additional purchase consideration contingent upon the attainment of certain business performance criteria. These criteria were attained during the year ended September 30, 2009.
Included within discontinued operations for 2008 and 2009 were goodwill impairment charges of $7.6 million and $1.2 million respectively. Both charges relate to our ERP division which we sold in the current year.
The following table sets forth the components of intangible assets (in thousands):
| | As of September 30, 2009 | | As of September 30, 2010 | |
| | Cost | | Accumulated
Amortization | | Intangible
Assets, net | | Cost | | Accumulated
Amortization | | Intangible
Assets, net | |
| | | | | | | | | | | | | |
Technology-based intangible assets | | $ | 3,370 | | $ | 3,370 | | $ | — | | $ | 7,160 | | $ | 3,654 | | $ | 3,506 | |
Customer contracts and relationships | | 6,100 | | 3,645 | | 2,455 | | 8,989 | | 5,504 | | 3,485 | |
Non-compete arrangements | | — | | — | | — | | 243 | | 39 | | 204 | |
Trademark | | — | | — | | — | | 622 | | 39 | | 583 | |
Total | | $ | 9,470 | | $ | 7,015 | | $ | 2,455 | | $ | 17,014 | | $ | 9,236 | | $ | 7,778 | |
42
Table of Contents
The intangible assets include $3.4 million of fully-amortized technology-based assets still in use by the Company. Excluding these assets, the Company’s intangible assets have a weighted average remaining life of 6.4 years, comprising 7.9 years for technology-based intangible assets, 4.5 years for customer contracts and relationships, 3.4 years for non-compete arrangements and 9.4 years for the trademark. Amortization expense for the year ended September 30, 2010 was $2.1 million. Future amortization expense is estimated as follows (in thousands):
Year ending September 30, 2011 | | $ | 2,106 | |
Year ending September 30, 2012 | | 1,141 | |
Year ending September 30, 2013 | | 1,063 | |
Year ending September 30, 2014 | | 700 | |
Year ending September 30, 2015 | | 677 | |
Thereafter | | 2,091 | |
Total | | $ | 7,778 | |
5. Contract Receivables and Deferred Revenue
Uncompleted contracts consist of the following components (in thousands):
| | Accounts
receivable—
unbilled | | Deferred
revenue | |
September 30, 2009: | | | | | |
Revenue | | $ | 507,178 | | $ | 1,109,228 | |
Billings | | 487,668 | | 1,137,932 | |
Total | | $ | 19,510 | | $ | (28,704 | ) |
September 30, 2010: | | | | | |
Revenue | | $ | 328,505 | | $ | 1,637,295 | |
Billings | | 311,260 | | 1,699,448 | |
Total | | $ | 17,245 | | $ | (62,153 | ) |
Unbilled accounts receivable and deferred revenue relate primarily to contracts wherein the timing of billings to customers varies based on individual contracts and often differs from the period of revenue recognition. At September 30, 2009 and 2010, there was $1.5 million and $3.3 million, respectively, billed but not paid by customers pursuant to contractual retainage provisions. Such balances are included in billed accounts receivable in the accompanying consolidated balance sheets.
At September 30, 2009 and 2010, $2.2 million and $3.1 million of billed long-term contract receivables, net of reserves of $0.6 million and $3.1 million, are included in other assets.
In evaluating the net realizable value of accounts receivable, the Company considers such factors as current economic trends, customer credit-worthiness, and changes in the customer payment terms and collection trends. Changes in the assumptions used in analyzing a specific account receivable may result in a reserve being recognized in the period in which the change occurs.
Changes in the reserves against current billed accounts receivable were as follows (in thousands):
| | Year ended September 30, | |
| | 2008 | | 2009 | | 2010 | |
Balance at beginning of year | | $ | 27,993 | | $ | 4,930 | | $ | 5,249 | |
Additions to cost and expense | | 4,158 | | 1,486 | | 1,594 | |
Deductions | | (27,221 | ) | (1,167 | ) | (4,998 | ) |
Balance at end of year | | $ | 4,930 | | $ | 5,249 | | $ | 1,845 | |
43
Table of Contents
Deductions from reserves against billed accounts receivable in fiscal year 2008 of $27.2 million include $21.9 million related to the write-off of a fully-reserved account receivable due from Accenture. The write-off of the fully-reserved account receivable due from Accenture arose from the related settlement with Accenture in the fourth quarter of fiscal 2008.
6. Property and Equipment
Property and equipment, at cost, consist of the following (in thousands):
| | As of September 30, | |
| | 2009 | | 2010 | |
Land | | $ | 1,800 | | $ | 1,800 | |
Building and improvements | | 11,318 | | 11,393 | |
Office furniture and equipment | | 79,382 | | 97,714 | |
Leasehold improvements | | 6,281 | | 4,833 | |
| | 98,781 | | 115,740 | |
Less: Accumulated depreciation and amortization | | (53,495 | ) | (66,867 | ) |
Total property and equipment, net | | $ | 45,286 | | $ | 48,873 | |
Fixed asset depreciation expense for the years ended September 30, 2008, 2009 and 2010 was $8.8 million, $8.9 million, and $12.9 million respectively.
7. Software Development Costs
Software development costs consist of the following (in thousands):
| | As of September 30, | |
| | 2009 | | 2010 | |
Capitalized software development costs | | $ | 26,475 | | $ | 35,648 | |
Less: Accumulated amortization | | (7,506 | ) | (10,933 | ) |
Total Software development costs, net | | $ | 18,969 | | $ | 24,715 | |
Capitalized software amortization expense for the years ended September 30, 2008, 2009 and 2010 was $1.8 million, $2.0 million, and $3.4 million respectively.
8. Deferred Contract Costs
Deferred contract costs consist of contractually recoverable direct set-up costs relating to long-term service contracts in progress. These costs include direct and incremental costs incurred prior to the commencement of us providing contracted services to our customers totaling $13.0 million and $9.8 million at September 30, 2009 and 2010, respectively. Deferred contract costs are expensed ratably as services are provided under the contracts. At September 30, 2009 and 2010, accumulated amortization of deferred contract costs was $4.8 million and $3.1 million, respectively.
9. Fair Value Measurements
The Company is required to disclose the fair value of all assets and liabilities subject to fair value measurement and the nature of the valuation techniques, including their classification within the fair value hierarchy, utilized by the Company in performing these measurements.
The FASB provides a fair value framework which requires the categorization of assets and liabilities into three levels based upon the assumptions (or inputs) used to price the assets or liabilities. Level 1 provides the most reliable measure of fair value, whereas Level 3 generally requires significant management judgment. The three levels are defined as follows:
44
Table of Contents
Level 1: | Observable inputs such as quoted prices (unadjusted) in active markets for identical assets or liabilities. |
| |
Level 2: | Inputs other than quoted prices that are observable for the asset or liability, either directly or indirectly. These include quoted prices for similar assets or liabilities in active markets and quoted prices for identical or similar assets or liabilities in markets that are not active. |
| |
Level 3: | Unobservable inputs that reflect the reporting entity’s own assumptions. |
The Company’s financial assets subject to fair value measurements and the necessary disclosures are as follows (in thousands):
| | Fair Value as of
September 30, | | Fair Value Measurements as of September 30, 2010 Using Fair
Value Hierarchy | |
Description | | 2010 | | Level 1 | | Level 2 | | Level 3 | |
Current portion of acquisition-related contingent consideration | | $ | (923 | ) | $ | — | | $ | — | | $ | (923 | ) |
Acquisition-related contingent consideration, less current portion | | (2,138 | ) | — | | — | | (2,138 | ) |
Deferred compensation plan liabilities | | (9,893 | ) | — | | (9,893 | ) | — | |
| | | | | | | | | | | | | |
The Company’s only acquisition-related contingent consideration liability resulted from the acquisition of DeltaWare in the current fiscal year. The fair value of the acquisition-related contingent consideration liability is based on a probability-weighted approach derived from management’s own estimates of profitability and sales targets. There has been no change to management’s estimates of profitability and sales targets between the acquisition date and September 30, 2010 and the only change to the value of the liability relates to foreign-exchange adjustments, which have been recorded as a component of other comprehensive income.
10. Credit Facilities
On January 25, 2008, the Company entered into a Revolving Credit Agreement providing for a senior secured revolving credit facility, with SunTrust Bank as administrative agent, issuing bank and swingline lender, and a syndicate of other lenders (the “Credit Facility”). The Credit Facility provides for a $35.0 million revolving line of credit commitment, which may be used (i) for revolving loans, (ii) for swingline loans, subject to a sublimit of $5.0 million, and (iii) to request the issuance of letters of credit on the Company’s behalf, subject to a sublimit of $25.0 million. The Company may request an increase in the commitment under the Credit Facility, such that the aggregate commitments under the Credit Facility shall at no time exceed $75.0 million. The credit available under the Credit Facility may be used, among other purposes, to refinance the Company’s current indebtedness, to repurchase shares of the Company’s capital stock and to finance the ongoing working capital, capital expenditure, and general corporate needs of the Company.
Subject to applicable conditions, the Company may elect interest rates on its revolving borrowings calculated by reference to (i) the prime lending rate as announced by SunTrust Bank (or, if higher, the federal funds effective rate plus 0.50%) (a “Base Rate Borrowing”), or (ii) the reserve adjusted rate per annum equal to the offered rate for deposits in U.S. dollars for a one (1), two (2), three (3) or six (6) month period in the London Inter-Bank Market (a “LIBOR Borrowing”), and, in each case, plus an applicable margin that is determined by reference to the Company’s then-current leverage ratio. For swingline borrowings, the Company will pay interest at the rate of interest for a one (1) month LIBOR Borrowing, plus the applicable margin, or at a rate to be separately agreed upon by the Company and the administrative agent.
At September 30, 2010, the Company had issued three letters of credit totaling $10.3 million. A letter of credit for $10 million may be called by a customer in the event that the Company defaults under the terms of a contract. The letter was renewed in March 2010 and expires in March 2011. Two letters of credit totaling $0.3 million have been issued in relation to the Company’s insurance policies. These letters of credit expire in May 2011 and may be renewed annually thereafter. At September 30, 2010, the Company has capacity to borrow, subject to covenant constraints, of up to $23.3 million under this agreement.
The Credit Facility matures on January 25, 2013, at which time all outstanding borrowings must be repaid and all outstanding letters of credit must be terminated or cash collateralized.
45
Table of Contents
The Credit Facility, as amended by the Company and its lender on December 12, 2008, provides for the payment of specified fees and expenses, including an up-front fee and commitment and letter of credit fees, and contains customary financial and other covenants that require the maintenance of certain ratios including a maximum leverage ratio and a minimum fixed charge coverage ratio. The Company was in compliance with all covenants in the amended Credit Facility as of September 30, 2010. The Company’s obligations under the Credit Facility are guaranteed by certain of the Company’s direct and indirect subsidiaries (collectively, the “Guarantors”) and are secured by substantially all of MAXIMUS’ and the Guarantors’ present and future tangible and intangible assets, including the capital stock of subsidiaries and other investment property.
In addition to this credit facility, the Company has a loan agreement with the Atlantic Innovation Fund of Canada, which was acquired as part of the DeltaWare acquisition (see “Note 3. Acquisition”). This provides for a loan of up to 1.7 million Canadian Dollars, which must be used for specific technology-based research and development. The loan has no interest charge. At September 30, 2010, $1.4 million (1.4 million Canadian Dollars) was outstanding under this agreement. The balance will be repayable in forty quarterly installments commencing from July 1, 2012, with the final payment no later than fiscal 2022. Borrowings using this facility reduce the availability of credit under the Revolving Credit Agreement.
Certain contracts require us to provide a surety bond as a guarantee of performance. At September 30, 2009 and September 30, 2010, the Company had performance bond commitments totaling $71.1 million and $33.5 million, respectively. These bonds are typically renewed annually and remain in place until the contractual obligations have been satisfied. Although the triggering events vary from contract to contract, in general, we would only be liable for the amount of these guarantees in the event of default in our performance of our obligations under each contract, the probability of which we believe is remote.
11. Commitments and Contingencies
Litigation
The Company is involved in various legal proceedings, including the matters described below, in the ordinary course of its business.
In March 2009, a state Medicaid agency asserted a claim against MAXIMUS in the amount of $2.3 million in connection with a contract MAXIMUS had through February 1, 2009 to provide Medicaid administrative claiming services to school districts in the state. MAXIMUS entered into separate agreements with the school districts under which MAXIMUS helped the districts prepare and submit claims to the state Medicaid agency which, in turn, submitted claims for reimbursement to the Federal government. No legal action has been initiated. The state has asserted that its agreement with MAXIMUS requires the Company to reimburse the state for the amounts owed to the Federal government. However, the Company’s agreements with the school districts require them to reimburse MAXIMUS for such payments and therefore MAXIMUS believes the school districts are responsible for any amounts disallowed by the state Medicaid agency or the Federal government. Accordingly, the Company believes its exposure in this matter is limited to its fees associated with this work and that the school districts will be responsible for the remainder. During the second quarter of fiscal 2009, MAXIMUS recorded a $0.7 million reduction of revenue reflecting the fees it earned under the contract. MAXIMUS has exited the Federal healthcare claiming business and no longer provides the services at issue in this matter.
In August 2010 the Company received a draft audit report prepared on behalf of one of its former SchoolMAX customers. The SchoolMAX business line was sold as part of the divestiture of the MAXIMUS Education Systems division in 2008. The draft audit report recommends a refund of approximately $11.6 million primarily arising out of the alleged failure of MAXIMUS and the buyer of the division to observe the most favored customer pricing term of the contract. MAXIMUS believes the audit report is incorrect and that no amounts are owed as a refund. The Company is working with the customer to resolve this matter before the audit report is finalized. To the extent that a resolution is not reached, MAXIMUS will contest the matter through the dispute resolution process set forth in the contract.
Employment Agreements
The Company has an employment agreement with its chief executive officer with a term ending in fiscal 2014.
Collective bargaining agreements
Approximately 20% of our employees are covered by collective bargaining agreements or similar arrangements. These agreements are typically renewed annually.
46
Table of Contents
12. Leases
The Company leases office space under various operating leases which typically contain clauses permitting cancellation upon certain conditions, including the early termination, non-renewal or material alteration of the related customer contract. The terms of these leases typically provide for certain minimum payments as well as increases in lease payments based upon the operating cost of the facility and the consumer price index. Rent expense for the years ended September 30, 2008, 2009, and 2010 was $19.5 million, $24.5 million, and $30.2 million respectively.
Minimum future payments under leases in effect as of September 30, 2010 are as follows (in thousands):
| | Operating
Leases | |
Year ended September 30, | | | |
2011 | | $ | 28,984 | |
2012 | | 20,661 | |
2013 | | 9,441 | |
2014 | | 6,117 | |
2015 | | 4,585 | |
Thereafter | | 5,106 | |
Total minimum lease payments | | $ | 74,894 | |
13. Concentrations of Credit Risk and Major Customers
Financial instruments that potentially subject the Company to significant concentrations of credit risk consist primarily of accounts receivable, billed and unbilled. To date, these financial instruments have been derived from contract revenue earned primarily from federal, state and local government agencies located in the United States.
For the years ended September 30, 2008, 2009, and 2010, the Company derived approximately 16%, 11% and 12% respectively, of its consolidated revenue from contracts with the State of California, principally within our Health Services segment.
For the years ended September 30, 2008, 2009 and 2010, the Company derived approximately 15%, 18% and 16% respectively, of its consolidated revenue from contracts with the State of Texas, principally within our Health Services segment.
For the years ended September 30, 2008, 2009 and 2010, the Company derived approximately 7%, 8% and 16% respectively, of its consolidated revenue from contracts with the Government of Australia, wholly within our Human Services segment.
14. Earnings Per Share
The following table sets forth the components of basic and diluted earnings per share (in thousands):
| | Year ended September 30, | |
| | 2008 | | 2009 | | 2010 | |
Numerator: | | | | | | | |
Income from continuing operations | | $ | 29,462 | | $ | 53,841 | | $ | 69,397 | |
Income (loss) from discontinued operations | | (22,785 | ) | (7,301 | ) | 1,012 | |
Net income | | $ | 6,677 | | $ | 46,540 | | $ | 70,409 | |
Denominator: | | | | | | | |
Weighted average shares outstanding | | 19,060 | | 17,570 | | 17,413 | |
Effect of dilutive securities: | | | | | | | |
Employee stock options and unvested restricted stock awards | | 245 | | 316 | | 552 | |
Denominator for diluted earnings per share | | 19,305 | | 17,886 | | 17,965 | |
In computing diluted earnings per share for the years ended September 30, 2009, 76,000 employee stock options were excluded from the computation of diluted loss per share as a result of their anti-dilutive effect. No shares were excluded from the computation in computing earnings per share in the years ended September 30, 2008 and 2010.
47
Table of Contents
15. Employee Benefit Plans and Deferred Compensation
The Company has 401(k) plans and other defined contribution plans for the benefit of all employees who meet certain eligibility requirements. The plans provide for Company match, specified Company contributions, and/or discretionary Company contributions. During the years ended September 30, 2008, 2009, and 2010, the Company contributed $3.9 million, $3.2 million, and $3.2 million to the 401(k) plans, respectively.
The Company also has a deferred compensation plan, which is a non-qualified plan available to a restricted number of highly-compensated employees. The plan enables participants to defer compensation for tax purposes. These deferred employee contributions are held within a rabbi trust with investments directed by the respective employees. The assets of the rabbi trust are available to satisfy the claims of general creditors in the event of bankruptcy of the Company.
During the current year, the Company determined the assets and liabilities associated with the defined compensation plan should be recorded in the consolidated financial statements. The cumulative effect of the correction during the year resulted in an additional pre-tax charge of $0.3 million and an after tax charge of $0.3 million. The impact to both the balance sheet and income statement are not material for the year or any previous periods. The plan assets contain life insurance policies, which are valued at cash surrender value. The balance sheet at September 30, 2010 includes an addition $0.6 million of cash and cash equivalents, an asset of $8.3 million related to the other rabbi trust assets, which are held at cash surrender value, and a long-term liability of $9.9 million related to the deferred compensation plan liabilities.
16. Shareholders’ Equity
Stock-Based Compensation
The Company’s Board of Directors established stock option plans during 1997 pursuant to which the Company may grant non-qualified stock options to officers, employees and directors of the Company. Such plans also provide for stock awards and direct purchases of the Company’s common stock. At September 30, 2010, 1.4 million shares remained available for grants under the Company’s stock plans. The Company typically issues new shares in satisfying its obligations under its stock plans.
The Company previously granted stock options to certain employees. These were granted at exercise prices equal to the fair market value of the Company’s common stock at the date of grant and generally vest ratably over a period of four years. Options issued prior to fiscal 2005 expire ten years after date of grant; those issued since expire after six years. The Company has transitioned towards providing Restricted Stock Units rather than options and, accordingly, no options have been granted since 2008. For the fiscal years ended September 30, 2008, 2009, and 2010, compensation expense related to stock options was $2.7 million, $1.4 million, and $0.8 million, respectively.
The Company issues Restricted Stock Units (RSUs) to officers, employees and directors of the Company under its 1997 Equity Incentive Plan (“Plan”). Generally, RSUs issued before 2009 vest ratably over six years. RSUs issued since then vest ratably over five years. The fair value of the RSUs, based on the Company’s stock price at the grant date, is expensed over the vesting period. For the fiscal years ended September 30, 2008, 2009 and 2010, compensation expense recognized related to RSUs was $6.8 million, $5.9 million and $7.1 million, respectively.
In calculating stock-based compensation cost, the Company takes into account the expected fair value of the awards to be granted to employees and recognizes this over the service period. The methodology for calculating fair value of stock options typically utilizes the Black-Scholes method. The valuation of RSUs is based upon the share price on the day of grant. The Company considers the effect of estimated forfeitures and adjusts for changes in these estimates over the life of each grant. Stock-based compensation was $9.5 million, $7.3 million and $7.9 million for the fiscal years ended September 30, 2008, 2009 and 2010, respectively.
48
Table of Contents
During the first quarter of fiscal 2008, the Company identified an error in prior periods in recorded stock-based compensation expense related to stock options and RSUs. The error was due, in part, to how the software used by the Company applied estimated forfeiture rates to fully vested stock options and RSUs. The impact was to underestimate stock compensation expense by $1.1 million in each of fiscal 2006 and 2007. The Company corrected this error by recording additional stock compensation expense of $2.2 million in the first quarter of fiscal 2008.
The total income tax benefit recognized in the income statement for share- based compensation arrangements was $3.8 million, $2.9 million and $3.1 million for the fiscal years ended September 30, 2008, 2009 and 2010, respectively.
The weighted average fair value of stock options was estimated at the date of the grant using the Black-Scholes option pricing method with the following assumptions for the fiscal year ended September 30, 2008:
| | 2008 | |
Dividend yield | | 0.9 | % |
Risk-free interest rate | | 4.1 | % |
Expected volatility | | 33 | % |
Expected life of option term (in years) | | 4.3 | |
Weighted average fair value at grant date | | $ | 14.12 | |
| | | | |
The dividend yield is based on historical experiences and expected future changes. The risk-free interest rate is derived from the U.S. Treasury yields in effect at the time of grant. Expected volatilities are based on the historical volatility of our common stock. The expected life of the option is derived from historical data pertaining to option exercises and employee terminations.
A summary of the Company’s stock option activity for the year ended September 30, 2010, is as follows:
| | Options | | Weighted Average
Exercise Price | |
Outstanding at September 30, 2009 | | 956,257 | | $ | 32.27 | |
Exercised | | (186,417 | ) | 31.91 | |
Forfeited or expired | | (441 | ) | 27.04 | |
Outstanding at September 30, 2010 | | 769,399 | | 32.36 | |
Exercisable at September 30, 2010 | | 754,399 | | 32.21 | |
| | | | | | |
The intrinsic value of exercisable stock options at September 30, 2010, was $22.2 million with a weighted average remaining life of 2.4 years.
The following table summarizes information pertaining to the stock options vested and exercised for the years presented:
| | Year ended September 30, | |
| | 2008 | | 2009 | | 2010 | |
Aggregate fair value of all stock options vesting | | $ | 3,300 | | $ | 1,735 | | $ | 1,233 | |
Aggregate intrinsic value of all stock options exercised | | 2,000 | | 1,752 | | 4,730 | |
| | | | | | | | | | |
The following table provides certain information with respect to stock options outstanding at September 30, 2010:
Range of
Exercise Prices | | Stock Options
Outstanding | | Weighted Average
Exercise Price | | Weighted Average
Remaining Life | |
$19.88-$46.20 | | 769,399 | | 32.36 | | 2.01 | |
The following table provides certain information with respect to stock options exercisable at September 30, 2010:
Range of
Exercise Prices | | Stock Options
Exercisable | | Weighted Average
Exercise Price | |
$19.88-$46.20 | | 754,399 | | 32.21 | |
A summary of the Company’s RSU activity for the year ended September 30, 2010, is as follows:
49
Table of Contents
| | Shares | | Weighted-
Average
Grant-Date
Fair Value | |
Non-vested shares outstanding at September 30, 2009 | | 639,465 | | $ | 33.38 | |
Granted | | 262,884 | | 47.16 | |
Vested | | (158,950 | ) | 36.48 | |
Forfeited | | (16,400 | ) | 35.28 | |
Non-vested shares outstanding at September 30, 2010 | | 726,999 | | 37.64 | |
| | | | | | |
As of September 30, 2010, the total remaining unrecognized compensation cost related to unvested stock options and RSUs was $0.1 million and $22.0 million, respectively. This charge is expected to be realized over one year for stock options and 4.5 years for RSUs.
Cash flows resulting from the tax benefits generated from tax deductions in excess of the compensation costs recognized for those options and RSUs (excess tax benefits) are classified as financing cash flows.
Stock Repurchase Programs
On November 14, 2007, the Company announced that its Board of Directors had authorized the repurchase of up to $150.0 million of the Company’s outstanding common stock under an Accelerated Share Repurchase (“ASR”) program. Under the ASR agreement, the Company acquired and retired 3,758,457 shares at an initial price of $39.91 per share for $150.0 million plus fees of approximately $0.4 million. The counter-party purchased an equivalent number of shares in the open market over the nine-month period ended August 15, 2008. Pursuant to the ASR agreement, at its completion the Company’s initial price under the ASR agreement was adjusted down based on the volume-weighted average price (“VWAP”) of the Company’s stock during this period. Such adjustment could be settled in cash or stock at the Company’s discretion. On July 11, 2008, the counter-party completed the purchase of shares in the open market, and the Company elected to receive the price adjustment of $13.9 million in cash. In the fourth quarter of fiscal 2008, this receipt of cash was recorded as a decrease to common stock in the full amount of $13.9 million.
Under a resolution adopted in July 2008, the Board of Directors authorized the repurchase, at management’s discretion, of up to an aggregate of $75.0 million of the Company’s common stock. The resolution also authorized the use of option exercise proceeds for the repurchase of the Company’s common stock. In September 2010, a further board resolution increased the authorized repurchases by an additional $100 million.
Total share purchases under these plans are summarized as follows (in thousands):
| | Year ended September 30, | |
| | 2008 | | 2009 | | 2010 | |
Number of share acquired under: | | | | | | | |
ASR Agreement | | 3,758,457 | | — | | — | |
July 2008 and September 2010 resolutions | | 386,600 | | 927,690 | | 750,764 | |
Total | | 4,145,057 | | 927,690 | | 750,764 | |
Total cost of shares (in thousands of dollars) acquired under: | | | | | | | |
ASR Agreement | | $ | 150,400 | | $ | — | | $ | — | |
Price adjustment under ASR Agreement | | (13,903 | ) | — | | — | |
July 2008 and September 2010 resolutions | | 14,066 | | 30,046 | | 40,217 | |
Total | | $ | 150,563 | | $ | 30,046 | | $ | 40,217 | |
As of November 19, 2010, the Company had repurchased an additional 37,500 shares at a cost of $2.3 million during the first quarter of fiscal 2011.
17. Legal and Settlement Expense (Recovery), Net
Legal and settlement expense (recovery), net consists of costs, net of reimbursed insurance claims, related to significant legal settlements and non-routine legal matters, including future probable legal costs estimated to be incurred in connection with those matters. Legal expenses incurred in the ordinary course of business are included in selling, general and administrative expense.
50
Table of Contents
Following a change in accounting standards, from October 1, 2009 the incremental costs of acquisitions, including legal fees, brokerage fees, and valuation reports, are included in this balance. Under previous accounting guidance, these expenses were included as part of the acquisition consideration of successful acquisitions. The following table sets forth the matters that represent legal and settlement expense (recovery), net (in thousands):
| | Year ended September 30, | |
| | 2008 | | 2009 | | 2010 | |
Acquisition expenses | | $ | — | | $ | — | | $ | 254 | |
Accenture Arbitration, Related Settlement and Insurance Recoveries, net | | 38,377 | | (6,300 | ) | (7,500 | ) |
Other | | (19 | ) | 2,029 | | 1,895 | |
Total | | $ | 38,358 | | $ | (4,271 | ) | $ | 5,351 | |
In December 2008, MAXIMUS, Accenture LLP and the Texas Health and Human Services Commission (“HHSC”) entered into an agreement settling all claims among the parties arising from a prime contract between Accenture and HHSC for integrated eligibility services and a subcontract between MAXIMUS and Accenture in support of the prime contract. In connection with that settlement, MAXIMUS paid a total of $40.0 million and agreed to provide services to HHSC valued at an additional $10.0 million. The Company’s primary insurance carrier paid $12.5 million of the amount due from MAXIMUS at the time of the settlement. In fiscal 2009, the Company recovered an additional $6.3 million from one of its excess insurance carriers, and in fiscal 2010 the Company recovered $7.5 million from another excess insurance carrier.
18. Income Taxes
The Company’s provision for income taxes is as follows (in thousands):
| | Year ended September 30, | |
| | 2008 | | 2009 | | 2010 | |
Current provision: | | | | | | | |
Federal | | $ | 39,410 | | $ | 5,013 | | $ | 23,712 | |
State and local | | 5,611 | | 1,143 | | 5,197 | |
Foreign | | 2,819 | | 2,266 | | 13,188 | |
Total current provision | | 47,840 | | 8,422 | | 42,097 | |
Deferred tax expense (benefit): | | | | | | | |
Federal | | $ | (25,573 | ) | $ | 21,203 | | $ | (1,678 | ) |
State and local | | (4,633 | ) | 4,534 | | (278 | ) |
Foreign | | 1,355 | | 734 | | (1,216 | ) |
Total deferred tax expense (benefit) | | (28,851 | ) | 26,471 | | (3,172 | ) |
Income tax expense | | $ | 18,989 | | $ | 34,893 | | $ | 38,925 | |
The provision for income taxes differs from that which would have resulted from the use of the federal statutory income tax rate as follows (in thousands):
| | Year ended September 30, | |
| | 2008 | | 2009 | | 2010 | |
Federal income tax provision at statutory rate of 35% | | $ | 16,958 | | $ | 31,057 | | $ | 37,913 | |
Valuation allowance on net operating loss carryforwards | | — | | (330 | ) | (33 | ) |
Permanent items | | 886 | | 512 | | 1,263 | |
Municipal interest | | (264 | ) | — | | — | |
State income taxes, net of federal benefit | | 2,217 | | 3,811 | | 3,153 | |
Foreign taxes | | (595 | ) | (518 | ) | (2,177 | ) |
Other | | (213 | ) | 361 | | (1,194 | ) |
Income tax expense | | $ | 18,989 | | $ | 34,893 | | $ | 38,925 | |
51
Table of Contents
The significant items comprising the Company’s deferred tax assets and liabilities as of September 30, 2009 and 2010 are as follows (in thousands):
| | As of September 30, | |
| | 2009 | | 2010 | |
Deferred tax assets—current: | | | | | |
Costs deductible in future periods | | $ | 6,823 | | $ | 8,060 | |
Deferred revenue | | 8,043 | | 13,177 | |
| | | | | |
Total deferred tax assets—current | | 14,866 | | 21,237 | |
Deferred tax liabilities—current: | | | | | |
Accounts receivable—unbilled | | 9,035 | | 6,701 | |
Other | | 442 | | 1,246 | |
Total deferred tax liabilities—current: | | 9,477 | | 7,947 | |
Net deferred tax asset —current | | $ | 5,389 | | $ | 13,290 | |
Deferred tax assets (liabilities)—non-current: | | | | | |
Non-cash equity compensation | | $ | 4,432 | | $ | 4,852 | |
Costs deductible in future periods | | 3,512 | | 5,093 | |
Net operating loss carryforwards | | 1,853 | | 1,079 | |
Valuation allowance on net operating loss carryforwards | | (1,773 | ) | (1,079 | ) |
Amortization of intangible assets | | (243 | ) | (2,064 | ) |
Amortization of goodwill | | 1,591 | | (164 | ) |
Depreciation | | (5,909 | ) | (6,723 | ) |
Capitalized software | | (3,779 | ) | (4,332 | ) |
Deferred contract costs | | 177 | | 464 | |
Other | | 1,135 | | (228 | ) |
Net deferred tax asset (liability) — non-current | | $ | 996 | | $ | (3,102 | ) |
Due to deferred tax assets and liabilities in different tax jurisdictions, the net long-term assets and liabilities are reflected on the accompanying consolidated balance sheet as follows (in thousands):
| | As of September 30, | |
| | 2009 | | 2010 | |
Long-term assets | | $ | 1,239 | | $ | 1,844 | |
Long-term liabilities | | 243 | | 4,946 | |
Net deferred tax asset (liability)—non-current | | $ | 996 | | $ | (3,102 | ) |
We do not provide for U.S. income taxes on the undistributed earnings of our foreign subsidiaries, as we consider these to be permanently reinvested in the operations of such subsidiaries. If some of these earnings were distributed, some countries may impose withholding taxes; in addition, as foreign taxes have been previously paid on these earnings, we would expect to be entitled to a U.S. foreign tax credit that would reduce the U.S. taxes owed on such distributions. As at September 30, 2010, the approximate amount of cumulative earnings from foreign subsidiaries is $44.3 million. The amount of taxes that may be applicable on earnings planned to be reinvested indefinitely outside the United States is not readily determinable given the various tax planning alternatives the Company could employ should it decide to repatriate these earnings.
As of September 30, 2010, the Company had $4.0 million of net operating loss carryforwards related to a Canadian subsidiary. A full valuation allowance of $1.1 million has been established against the related deferred tax asset. These net operating loss carryforwards begin to expire at the end of fiscal 2013 through fiscal 2017.
Cash paid for income taxes during the years ended September 30, 2008, 2009, and 2010 was $23.8 million, $24.1 million, and $33.3 million, respectively.
Approximately 60% of the Company’s total goodwill is expected to be deductible for income tax purposes.
The Company accounts for uncertain tax positions by recognizing the financial statement effects of a tax position only when, based upon the technical merits, it is “more-likely-than-not” that the position will be sustained upon examination. The Company’s net unrecognized tax benefits totaled $2.0 million, $1.9 million, and $1.5 million at September 30, 2008, 2009, and 2010, respectively. The total amount of unrecognized tax benefits that, if recognized, would affect the annual effective income tax rate is $1.5 million at September 30, 2010.
52
Table of Contents
The Company has elected to report interest and penalties as a component of income tax expense. In the fiscal years ending September 30, 2008, 2009, and 2010, the Company recognized interest expense relating to unrecognized tax benefits of less than $0.1 million in each year. The net liability balance at September 30, 2008, 2009 and 2010 includes approximately $0.2 million, $0.3 million, and $0.3 million, respectively, of interest and penalties.
It is reasonably possible that the total amount of unrecognized tax benefits could decrease by as much as $0.1 million within the next twelve months as a result of settlement of expiration of statute of limitations, which could have an impact on the effective tax rate. The anticipated reversals are related to state tax items, none of which individually are significant.
The Company recognizes and presents uncertain tax positions on a gross basis (i.e., without regard to likely offsets for deferred tax assets, deductions, and/or credits that would result from payment of uncertain tax amounts). The reconciliation of the beginning and ending amount of gross unrecognized tax benefits is as follows (in thousands):
| | Year Ended
September 30 | |
| | 2008 | | 2009 | | 2010 | |
Balance at beginning of year | | $ | 2,439 | | $ | 2,291 | | $ | 2,045 | |
Additions based on tax positions related to the current year | | 79 | | — | | 45 | |
Reductions for tax positions of prior years | | (85 | ) | — | | (196 | ) |
Lapse of statute of limitations | | (142 | ) | (68 | ) | — | |
Settlements | | — | | (178 | ) | (341 | ) |
Balance at end of year | | $ | 2,291 | | $ | 2,045 | | $ | 1,553 | |
The Company files income tax returns in the United States Federal jurisdiction and in various state and foreign jurisdictions. The Company is no longer subject to U.S. Federal income tax examinations for years before 2006 and is no longer subject to state and local, or foreign income tax examinations by tax authorities for years before 2004.
53
Table of Contents
19. Business Segments
During the fourth quarter, the Company aligned its organization of the business to reflect its focus on the administration of government health and human services programs. As a result of this organizational realignment, the Company has reclassified its segment financial information to reflect the two new operating segments of Health Services and Human services. The results of the segments for the three years ended September 30, 2010, as well as information related to their asset base, are shown below (in thousands):
| | Year ended September 30, | |
| | 2008 | | 2009 | | 2010 | |
Revenue: | | | | | | | |
Health Services | | $ | 465,660 | | $ | 495,141 | | $ | 514,258 | |
Human Services | | 233,892 | | 224,967 | | 317,491 | |
Total | | $ | 699,552 | | $ | 720,108 | | $ | 831,749 | |
Gross Profit: | | | | | | | |
Health services | | $ | 126,729 | | $ | 131,547 | | $ | 130,276 | |
Human Services | | 64,162 | | 59,799 | | 90,557 | |
Total | | $ | 190,891 | | $ | 191,346 | | $ | 220,833 | |
Selling, General and Administrative expense: | | | | | | | |
Health Services | | $ | 56,553 | | $ | 58,673 | | $ | 65,551 | |
Human Services | | 51,966 | | 47,442 | | 51,067 | |
Corporate / Other | | 1,924 | | 913 | | 2,160 | |
Total | | $ | 110,443 | | $ | 107,028 | | $ | 118,778 | |
Operating income from continuing operations (before income taxes): | | | | | | | |
Health Services | | $ | 70,176 | | $ | 72,874 | | $ | 64,725 | |
Human Services | | 12,196 | | 12,357 | | 39,490 | |
Consolidating adjustments | | (1,924 | ) | (913 | ) | (2,160 | ) |
Gain on sale of building | | 3,938 | | — | | — | |
Legal and settlement expense (recovery), net | | 38,358 | | (4,271 | ) | (5,351 | ) |
Total | | $ | 46,028 | | $ | 88,589 | | $ | 107,406 | |
Identifiable assets: | | | | | | | |
Health Services | | $ | 169,705 | | $ | 192,121 | | $ | 202,339 | |
Human Services | | 95,394 | | 93,881 | | 190,695 | |
Corporate / Other | | 189,855 | | 147,232 | | 134,707 | |
Total | | $ | 454,954 | | $ | 433,234 | | $ | 527,741 | |
Depreciation and amortization: | | | | | | | |
Health Services | | $ | 5,504 | | $ | 6,545 | | $ | 9,055 | |
Human Services | | 4,481 | | 4,006 | | 6,623 | |
Corporate / Other | | 2,256 | | 1,681 | | 2,662 | |
Total | | $ | 12,241 | | $ | 12,232 | | $ | 18,340 | |
The Company operates in the United States, Australia, Canada, the United Kingdom and Israel.
Revenues for the Company were distributed as follows (in thousands):
| | Year ended September 30, | |
| | 2008 | | 2009 | | 2010 | |
United States | | $ | 578,346 | | $ | 601,060 | | $ | 606,396 | |
Australia | | 51,570 | | 54,487 | | 135,635 | |
Rest of World | | 69,636 | | 64,561 | | 89,718 | |
Total | | $ | 699,552 | | $ | 720,108 | | $ | 831,749 | |
54
Table of Contents
Total assets of the Company were distributed as follows (in thousands):
| | Year Ended
September 30 | |
| | 2009 | | 2010 | |
United States | | $ | 348,545 | | $ | 349,795 | |
Australia | | 41,105 | | 84,777 | |
Rest of World | | 43,584 | | 93,169 | |
Total | | $ | 433,234 | | $ | 527,741 | |
20. Quarterly Information (Unaudited)
Set forth below are selected quarterly income statement data for the fiscal years ended September 30, 2009 and 2010. The Company derived this information from unaudited quarterly financial statements that include, in the opinion of Company’s management, all adjustments necessary for a fair presentation of the information for such periods. Results of operations for any fiscal quarter are not necessarily indicative of results for any future period.
The information below differs from information previously reported by the Company on Forms 10-K and 10-Q. As discussed in “Note 19. Business Segments”, the Company has reclassified its segment financial information to reflect the two new operating segments of Health Services and Human services. As discussed in “Note 21. Discontinued Operations”, in completing this sale of the ERP business, the Company retained a single contract that was previously reported in discontinued operations. The results of this contract have been reclassified as continuing operations for all periods presented.
Earnings per share amounts are computed independently each quarter. As a result, the sum of each quarter’s earnings per share amount may not equal the total earnings per share amount for the respective year.
| | Quarter Ended | |
| | Dec. 31,
2008 | | March 31,
2009 | | June 30,
2009 | | Sept. 30,
2009 | |
| | | | (In thousands, except per share data) | | | |
Fiscal Year 2009 | | | | | | | | | |
Revenue: | | | | | | | | | |
Health Services | | $ | 121,995 | | $ | 121,228 | | $ | 122,415 | | $ | 129,503 | |
Human Services | | 47,715 | | 55,930 | | 56,019 | | 65,303 | |
Total revenue | | 169,710 | | 177,158 | | 178,434 | | 194,806 | |
Gross profit | | 46,904 | | 46,534 | | 47,370 | | 50,538 | |
Selling, general and administrative expenses | | 26,414 | | 26,714 | | 27,255 | | 26,645 | |
Operating income from continuing operations: | | | | | | | | | |
Health Services | | 20,625 | | 18,429 | | 14,804 | | 19,016 | |
Human Services | | 100 | | 1,746 | | 5,355 | | 5,156 | |
Consolidating adjustments | | (235 | ) | (355 | ) | (44 | ) | (279 | ) |
Legal and settlement expense (recovery) | | — | | 368 | | (4,829 | ) | 190 | |
Operating income from continuing operations | | 20,490 | | 19,452 | | 24,944 | | 23,703 | |
Discontinued operations, net of income taxes | | | | | | | | | |
Loss from discontinued operations | | (485 | ) | (763 | ) | (186 | ) | (4,300 | ) |
Loss on disposal | | (5 | ) | — | | — | | (1,562 | ) |
Loss from discontinued operations | | (490 | ) | (763 | ) | (186 | ) | (5,862 | ) |
Net income | | $ | 11,963 | | $ | 11,027 | | $ | 14,983 | | $ | 8,567 | |
Basic earnings (loss) per share: | | | | | | | | | |
Income from continuing operations | | $ | 0.70 | | $ | 0.68 | | $ | 0.87 | | $ | 0.82 | |
Loss from discontinued operations | | (0.03 | ) | (0.05 | ) | (0.01 | ) | (0.33 | ) |
Basic earnings per share | | $ | 0.67 | | $ | 0.63 | | $ | 0.86 | | $ | 0.49 | |
Diluted earnings (loss) per share: | | | | | | | | | |
Income from continuing operations | | $ | 0.69 | | $ | 0.66 | | $ | 0.85 | | $ | 0.80 | |
Loss from discontinued operations | | (0.02 | ) | (0.04 | ) | (0.01 | ) | (0.32 | ) |
Diluted earnings (loss) per share | | $ | 0.67 | | $ | 0.62 | | $ | 0.84 | | $ | 0.48 | |
55
Table of Contents
| | Quarter Ended | |
| | Dec. 31,
2009 | | March 31,
2010 | | June 30,
2010 | | Sept. 30,
2010 | |
| | (In thousands, except per share data) | |
Fiscal Year 2010 | | | | | | | | | |
Revenue: | | | | | | | | | |
Health Services | | $ | 130,640 | | $ | 127,279 | | $ | 127,307 | | $ | 129,032 | |
Human Services | | 72,680 | | 77,107 | | 84,220 | | 83,484 | |
Total revenue | | 203,320 | | 204,386 | | 211,527 | | 212,516 | |
Gross profit | | 52,175 | | 50,551 | | 57,013 | | 61,094 | |
Selling, general and administrative expenses | | 27,429 | | 28,787 | | 31,658 | | 30,904 | |
Operating income from continuing operations: | | | | | | | | | |
Health Services | | 17,508 | | 12,723 | | 14,509 | | 19,985 | |
Human Services | | 7,379 | | 9,037 | | 10,684 | | 12,390 | |
Consolidating adjustments | | (141 | ) | 4 | | 162 | | (2,185 | ) |
Legal and settlement expense (recovery), net | | 686 | | (6,037 | ) | — | | — | |
Operating income from continuing operations | | 24,060 | | 27,801 | | 25,355 | | 30,190 | |
Discontinued operations, net of income taxes | | | | | | | | | |
Income (loss) from discontinued operations | | (1,972 | ) | 752 | | 1,200 | | 1,060 | |
Loss on disposal | | — | | — | | — | | (28 | ) |
Income (loss) from discontinued operations | | (1,972 | ) | 752 | | 1,200 | | 1,032 | |
Net income | | $ | 12,628 | | $ | 18,743 | | $ | 17,325 | | $ | 21,713 | |
Basic earnings per share: | | | | | | | | | |
Income from continuing operations | | $ | 0.83 | | $ | 1.03 | | $ | 0.93 | | $ | 1.20 | |
Income (loss) from discontinued operations | | (0.11 | ) | 0.05 | | 0.06 | | 0.06 | |
Basic earnings per share | | $ | 0.72 | | $ | 1.08 | | $ | 0.99 | | $ | 1.26 | |
Diluted earnings per share: | | | | | | | | | |
Income from continuing operations | | $ | 0.81 | | $ | 1.00 | | $ | 0.90 | | $ | 1.16 | |
Loss from discontinued operations | | (0.11 | ) | 0.04 | | 0.06 | | 0.06 | |
Diluted earnings per share | | $ | 0.70 | | $ | 1.04 | | $ | 0.96 | | $ | 1.22 | |
56
Table of Contents
21. Discontinued Operations
The Company has classified the results of the following divisions within discontinued operations: Enterprise Resource Planning (ERP), Security Solutions, Justice Solutions, Education Systems and Asset Solutions. The results of these divisions were previously reported within the Company's Systems segment. FollowingIn completing the sale of the other divisions in 2008, the results of the ERP division, a single contract was reportednot transferred to the buyer. The remaining contract has been included within the Company's ConsultingHuman Services segment.
The Company has also classified the results of its Unison MAXIMUS, Inc. subsidiary (Unison) within discontinued operations. Unison's
The results wereof these entities had previously reportedbeen recorded within operating segments which no longer correspond to the Company's Operating Segment.
operating segments disclosed in these financial statements. The associated financial position, results of operations, and cash flows of these businesses are reported separatelyas discontinued operations for all periods presented.
In
On September 2009,30, 2010, the Company committed tosold its ERP division for cash proceeds of $5.6 million, net of transaction costs of $0.7 million, and recognized a pre-tax loss on sale of its ERP business. We are actively pursuing a buyer and expect to complete this sale by the end of the 2010 fiscal year.less than $0.1 million. The Company haspreviously recorded a pre-tax loss on sale of $1.3 million as of September 30, 2009 relatingin fiscal 2009. In completing this sale, the Company elected to retain a single contract that had previously been included within the impairment of long-term fixed assetsERP division. This contract had identifiable cash flows and goodwill of this business.requires MAXIMUS to provide services which are dissimilar to other projects within the ERP division.
In fiscal 2008, this division also recorded a loss of $7.6 million relating to goodwill. In fiscal 2009, the division recorded a charge of $14.3 million attributable to a fixed price ERP contract. These charges are included in losses from discontinued operations.
On April 30, 2008, the Company sold its Security Solutions division for cash proceeds of $4.6 million, net of transaction costs of $0.4 million, and recognized a pre-tax gain on the sale of $2.9 million.
On May 2, 2008, the Company sold its Unison MAXIMUS, Inc. subsidiary for proceeds of $6.5 million. The sale transaction iswas structured as a sale of stock to the management team of the subsidiary. The sale price of $6.5 million consists of $0.1 million in cash and $6.4 million in the form of a promissory note secured by (1) a security interest in all of the assets of the former subsidiary; (2) a pledge of shares by the buyer; and (3) a personal guaranty by members of the management team who are shareholders of the buyer. The Company has deferred recognition of a pre-tax gain on the sale of $3.9 million, and interest income on the promissory note, until realization is more fully assured. The deferred gain and deferred interest of $4.6 million and $4.5 million is reflected as a deduction from the note receivable on the consolidated balance sheetsheets as of September 30, 2009.
Table of Contents2009 and 2010, respectively.
MAXIMUS, Inc.
Notes to Consolidated Financial Statements (Continued)
For the years ended September 30, 2007, 2008 and 2009
2. Discontinued Operations (Continued)
Justice Solutions, Education Systems and Asset Solutions
On September 30, 2008, the Company sold its Justice Solutions, Education Systems, and Asset Solutions divisions, which were previously reported as part of its Systems Segment. At that time, the Company recognized a pre-tax loss of $12.2 million, subject to adjustment for purchase price adjustments and estimated transaction costs. During fiscal 2009, the Company reached a final settlement with the purchaser, resulting in a pre-tax gain of $0.7 million.
The following table summarizes the operating results of the discontinued operations included in the Consolidated Statements of Operations (in thousands):
| | Year Ended September 30, | |
| | 2008 | | 2009 | | 2010 | |
Revenue | | $ | 131,113 | | $ | 29,393 | | $ | 27,054 | |
Income (loss) from operations before income taxes | | $ | (28,332 | ) | $ | (9,478 | ) | $ | 1,664 | |
Provision (benefit) for income taxes | | (11,182 | ) | (3,744 | ) | 624 | |
Income (loss) from discontinued operations | | $ | (17,150 | ) | $ | (5,734 | ) | $ | 1,040 | |
Loss on disposal before income taxes | | $ | (9,314 | ) | $ | (686 | ) | $ | (45 | ) |
Provision (benefit) for income taxes | | (3,679 | ) | 881 | | (17 | ) |
Loss on disposal | | $ | (5,635 | ) | $ | (1,567 | ) | $ | (28 | ) |
Income (loss) from discontinued operations | | $ | (22,785 | ) | $ | (7,301 | ) | $ | 1,012 | |
57
| | | | | | | | | | | |
| | Year Ended September 30, | |
|---|
| | 2007 | | 2008 | | 2009 | |
|---|
Revenue | | $ | 155,626 | | $ | 137,002 | | $ | 32,202 | |
Income (loss) from operations before income taxes | |
$ |
4,362 | |
$ |
(28,920 |
) |
$ |
(10,704 |
) |
Provision (benefit) for income taxes | | | 1,724 | | | (11,414 | ) | | (4,228 | ) |
| | | | | | | | |
| | Income (loss) from discontinued operations | | $ | 2,638 | | $ | (17,506 | ) | $ | (6,476 | ) |
| | | | | | | | |
Loss on disposal before income taxes | | $ | — | | $ | (9,314 | ) | $ | (686 | ) |
Provision (benefit) for income taxes | | | — | | | (3,679 | ) | | 881 | |
| | | | | | | | |
| | Loss on disposal | | $ | — | | $ | (5,635 | ) | $ | (1,567 | ) |
| | | | | | | | |
| | Income (loss) from discontinued operations | | $ | 2,638 | | $ | (23,141 | ) | $ | (8,043 | ) |
| | | | | | | | |
The following table summarizes the carrying values of the assets and liabilities associated with discontinued operations included in the Consolidated Balance Sheets (in thousands):
| | | | | | | | |
| | As of
September 30,
2008 | | As of
September 30,
2009 | |
|---|
Accounts receivable—billed | | $ | 9,299 | | $ | 6,677 | |
Accounts receivable—unbilled | | | 17,537 | | | 11,508 | |
Prepaid expenses and other current assets | | | 73 | | | 53 | |
| | | | | | |
| | Current assets of discontinued operations | | $ | 26,909 | | $ | 18,238 | |
| | | | | | |
Property and equipment, net | | $ | 272 | | $ | — | |
Goodwill | | | 1,200 | | | — | |
Other assets, net | | | 3 | | | — | |
| | | | | | |
| | Noncurrent assets of discontinued operations | | $ | 1,475 | | $ | — | |
| | | | | | |
Accounts payable | | $ | 16,641 | | $ | 6,199 | |
Accrued compensation and benefits | | | 1,798 | | | 930 | |
Current portion of deferred revenue | | | 1,540 | | | — | |
Other accrued liabilities | | | — | | | 6,995 | |
| | | | | | |
| | Current liabilities of discontinued operations | | $ | 19,979 | | $ | 14,124 | |
| | | | | | |
| | As of
September 30,
2009 | | As of
September 30,
2010 | |
Accounts receivable—billed | | $ | 5,250 | | $ | — | |
Accounts receivable—unbilled | | 8,704 | | — | |
Prepaid expenses and other current assets | | 53 | | — | |
Current assets of discontinued operations | | $ | 14,007 | | $ | — | |
Accounts payable | | $ | 5,919 | | $ | 95 | |
Accrued compensation and benefits | | 909 | | 539 | |
Other accrued liabilities | | 6,995 | | — | |
Current liabilities of discontinued operations | | $ | 13,823 | | $ | 634 | |
Table22. Sale of ContentsBuilding
MAXIMUS, Inc.
Notes to Consolidated Financial Statements (Continued)
For the years ended September 30, 2007, 2008 and 2009
3. Contract Receivables and Deferred Revenue
Uncompleted contracts consist of the following components (in thousands):
| | | | | | | | |
| | Accounts
receivable—
unbilled | | Deferred
revenue | |
|---|
September 30, 2008: | | | | | | | |
Revenue | | $ | 643,844 | | $ | 853,332 | |
Billings | | | 634,678 | | | 875,792 | |
| | | | | | |
| | Total | | $ | 9,166 | | $ | 22,460 | |
| | | | | | |
September 30, 2009: | | | | | | | |
Revenue | | $ | 710,738 | | $ | 1,559,320 | |
Billings | | | 694,032 | | | 1,588,024 | |
| | | | | | |
| | Total | | $ | 16,706 | | $ | 28,704 | |
| | | | | | |
Unbilled accounts receivable and deferred revenue relate primarily to contracts wherein the timing of billings to customers varies based on individual contracts and often differs from the period of revenue recognition. At September 30, 2008 and 2009, there was $0.4 million and $1.5 million, respectively, billed but not paid by customers pursuant to contractual retainage provisions. Such balances are included in billed accounts receivable in the accompanying consolidated balance sheets.
At September 30, 2008 and 2009, $2.2 million of billed long-term contract receivables, net of reserves of $0.6 million, are included in other assets.
In evaluating the net realizable value of accounts receivable, the Company considers such factors as current economic trends, customer credit-worthiness, and changes in the customer payment terms and collection trends. Changes in the assumptions used in analyzing a specific account receivable may result in a reserve being recognized in the period in which the change occurs.
Changes in the reserves against billed accounts receivable were as follows (in thousands):
| | | | | | | | | | |
| | Year ended September 30, | |
|---|
| | 2007 | | 2008 | | 2009 | |
|---|
Balance at beginning of year | | $ | 5,383 | | $ | 28,579 | | $ | 5,493 | |
Additions to cost and expense | | | 25,579 | | | 4,158 | | | 1,486 | |
Deductions | | | (2,383 | ) | | (27,244 | ) | | (1,167 | ) |
| | | | | | | | |
Balance at end of year | | $ | 28,579 | | $ | 5,493 | | $ | 5,812 | |
| | | | | | | | |
Deductions from reserves against billed accounts receivable in fiscal year 2008 of $27.2 million include $21.9 million related to the write-off of a fully-reserved account receivable due from Accenture. The write-off of the fully-reserved account receivable due from Accenture arose from the related settlement with Accenture in the fourth quarter of fiscal 2008.
Table of Contents
MAXIMUS, Inc.
Notes to Consolidated Financial Statements (Continued)
For the years ended September 30, 2007, 2008 and 2009
4. Property and Equipment
Property and equipment, at cost, consist of the following (in thousands):
| | | | | | | |
| | As of September 30, | |
|---|
| | 2008 | | 2009 | |
|---|
Land | | $ | 1,800 | | $ | 1,800 | |
Building and improvements | | | 11,041 | | | 11,318 | |
Office furniture and equipment | | | 60,928 | | | 79,382 | |
Leasehold improvements | | | 4,363 | | | 6,281 | |
| | | | | | |
| | | 78,132 | | | 98,781 | |
Less: Accumulated depreciation and amortization | | | (44,411 | ) | | (53,495 | ) |
| | | | | | |
Total property and equipment, net | | $ | 33,721 | | $ | 45,286 | |
| | | | | | |
5. Software Development Costs
Software development costs consist of the following (in thousands):
| | | | | | | |
| | As of September 30, | |
|---|
| | 2008 | | 2009 | |
|---|
Capitalized software development costs | | $ | 19,979 | | $ | 26,475 | |
Less: Accumulated amortization | | | (5,854 | ) | | (7,506 | ) |
| | | | | | |
Total Software development costs, net | | $ | 14,125 | | $ | 18,969 | |
| | | | | | |
Capitalized software amortization expense for the years ended September 30, 2007, 2008 and 2009 was $1.2 million, $1.8 million, and $2.0 million respectively.
6. Deferred Contract Costs
Deferred contract costs consist of contractually recoverable direct set-up costs relating to long-term service contracts in progress. These costs include direct and incremental costs incurred prior to the commencement of us providing contracted services to our customers totaling $30.9 million and $13.0 million at September 30, 2008 and 2009, respectively. Deferred contract costs are expensed ratably as services are provided under the contracts. At September 30, 2008 and 2009, accumulated amortization of deferred contract costs was $25.6 million and $4.8 million, respectively.
At September 30, 2008, the balance included $7.6 million of leased equipment assets, net of $7.2 million of accumulated amortization. The balance included no leased equipment at September 30, 2009.
Table of Contents
MAXIMUS, Inc.
Notes to Consolidated Financial Statements (Continued)
For the years ended September 30, 2007, 2008 and 2009
7. Goodwill and Intangible Assets
Changes in goodwill for the years ended September 30, 2008 and 2009 are as follows (in thousands):
| | | | | | | | | | |
| | Consulting | | Operations | | Total | |
|---|
Balance as of September 30, 2007 | | $ | 18,646 | | $ | 33,030 | | $ | 51,676 | |
Goodwill activity during year related to acquisition | | | — | | | 4,260 | | | 4,260 | |
Foreign currency translation | | | — | | | 3,523 | | | 3,523 | |
| | | | | | | | |
Balance as of September 30, 2008 | | | 18,646 | | | 40,813 | | | 59,459 | |
Goodwill activity during year related to acquisition | | | — | | | 724 | | | 724 | |
Foreign currency translation | | | — | | | 846 | | | 846 | |
| | | | | | | | |
Balance as of September 30, 2009 | | $ | 18,646 | | $ | 42,383 | | $ | 61,029 | |
| | | | | | | | |
During the year ended September 30, 2008, the Company acquired 100% of the shares of Westcountry Training and Consultancy Services Limited. The transaction included additional purchase consideration contingent upon the attainment of certain business performance criteria. These criteria were attained in fiscal 2009 and the balance is expected to be paid to the seller during fiscal 2010.
The following table sets forth the components of intangible assets (in thousands):
| | | | | | | | | | | | | | | | | | | | |
| | As of September 30, 2008 | | As of September 30, 2009 | |
|---|
| | Cost | | Accumulated
Amortization | | Intangible
Assets, net | | Cost | | Accumulated
Amortization | | Intangible
Assets, net | |
|---|
Non-competition agreements | | $ | 1,882 | | $ | 1,844 | | $ | 38 | | $ | — | | $ | — | | $ | — | |
Technology-based intangibles | | | 3,370 | | | 2,909 | | | 461 | | | 3,370 | | | 3,370 | | | — | |
Customer contracts and relationships | | | 7,077 | | | 3,877 | | | 3,200 | | | 6,100 | | �� | 3,645 | | | 2,455 | |
| | | | | | | | | | | | | | |
| | Total | | $ | 12,329 | | $ | 8,630 | | $ | 3,699 | | $ | 9,470 | | $ | 7,015 | | $ | 2,455 | |
| | | | | | | | | | | | | | |
Intangible assets from acquisitions are amortized over a period of five to ten years. The weighted-average amortization periods for non-competition agreements, technology-based intangibles, and customer contracts and relationships are approximately five years, five years, and ten years, respectively. The weighted-average amortization period for total intangible assets is approximately six years. The amortization charge for the year ended September 30, 2009 was $1.4 million. The estimated amortization expense for the years ending September 30, 2010 and 2011 is $1.4 million and $1.0 million, respectively. Amortization expense in 2012, 2013 and 2014 is expected to be less than $0.1 million in total.
Table of Contents
MAXIMUS, Inc.
Notes to Consolidated Financial Statements (Continued)
For the years ended September 30, 2007, 2008 and 2009
8. Earnings (Loss) Per Share
The following table sets forth the components of basic and diluted earnings per share (in thousands):
| | | | | | | | | | | |
| | Year ended September 30, | |
|---|
| | 2007 | | 2008 | | 2009 | |
|---|
Numerator: | | | | | | | | | | |
| | Income (loss) from continuing operations | | $ | (10,893 | ) | $ | 29,818 | | $ | 54,583 | |
| | Income (loss) from discontinued operations | | | 2,638 | | | (23,141 | ) | | (8,043 | ) |
| | | | | | | | |
| | Net income (loss) | | $ | (8,255 | ) | $ | 6,677 | | $ | 46,540 | |
| | | | | | | | |
Denominator: | | | | | | | | | | |
| | Weighted average shares outstanding | | | 21,870 | | | 19,060 | | | 17,570 | |
| | Effect of dilutive securities: | | | | | | | | | | |
| | Employee stock options and unvested restricted stock awards | | | — | | | 245 | | | 316 | |
| | | | | | | | |
Denominator for diluted earnings per share | | | 21,870 | | | 19,305 | | | 17,886 | |
| | | | | | | | |
In computing diluted loss per share for the years ended September 30, 2007, 2008 and 2009, 336,000, zero and 76,000 employee stock options were excluded from the computation of diluted loss per share as a result of their antidilutive effect.
9. Credit Facilities
On January 25, 2008, the Company entered into a Revolving Credit Agreement providing for a senior secured revolving credit facility, with SunTrust Bank as administrative agent, issuing bank and swingline lender, and a syndicate of other lenders (the "Credit Facility"). The Credit Facility provides for a $35.0 million revolving line of credit commitment, which may be used (i) for revolving loans, (ii) for swingline loans, subject to a sublimit of $5.0 million, and (iii) to request the issuance of letters of credit on the Company's behalf, subject to a sublimit of $25.0 million. The Company may request an increase in the commitment under the Credit Facility, such that the aggregate commitments under the Credit Facility shall at no time exceed $75.0 million. The credit available under the Credit Facility may be used, among other purposes, to refinance the Company's current indebtedness, to repurchase shares of the Company's capital stock and to finance the ongoing working capital, capital expenditure, and general corporate needs of the Company.
Subject to applicable conditions, the Company may elect interest rates on its revolving borrowings calculated by reference to (i) the prime lending rate as announced by SunTrust Bank (or, if higher, the federal funds effective rate plus 0.50%) (a "Base Rate Borrowing"), or (ii) the reserve adjusted rate per annum equal to the offered rate for deposits in U.S. dollars for a one (1), two (2), three (3) or six (6) month period in the London Inter-Bank Market (a "LIBOR Borrowing"), and, in each case, plus an applicable margin that is determined by reference to the Company's then-current leverage ratio. For swingline borrowings, the Company will pay interest at the rate of interest for a one (1) month LIBOR Borrowing, plus the applicable margin, or at a rate to be separately agreed upon by the Company and the administrative agent.
Table of Contents
MAXIMUS, Inc.
Notes to Consolidated Financial Statements (Continued)
For the years ended September 30, 2007, 2008 and 2009
9. Credit Facilities (Continued)
At September 30, 2009, the Company had issued three letters of credit totaling $10.3 million. A letter of credit for $10 million may be called by a customer in the event that the Company defaults under the terms of a contract. The letter was renewed in March 2009 and expires in March 2010. Two letters of credit totaling $0.3 million have been issued in relation to the Company's insurance policies. These letters of credit expire in May 2010 and may be renewed annually thereafter.
The Credit Facility matures on January 25, 2013, at which time all outstanding borrowings must be repaid and all outstanding letters of credit must be terminated or cash collateralized.
The Credit Facility, as amended by the Company and its lender on December 12, 2008, provides for the payment of specified fees and expenses, including an up-front fee and commitment and letter of credit fees, and contains customary financial and other covenants that require the maintenance of certain ratios including a maximum leverage ratio and a minimum fixed charge coverage ratio. The Company was in compliance with all covenants in the amended Credit Facility as of September 30, 2009. The Company's obligations under the Credit Facility are guaranteed by certain of the Company's direct and indirect subsidiaries (collectively, the "Guarantors") and are secured by substantially all of MAXIMUS' and the Guarantors' present and future tangible and intangible assets, including the capital stock of subsidiaries and other investment property.
At September 30, 2008 and 2009, the Company had performance bond commitments totaling $83.4 million and $71.1 million, respectively.
10. Leases
The Company leases office space under various operating leases which typically contain clauses permitting cancellation upon certain conditions, including the early termination, non-renewal or material alteration of the related customer contract. The terms of these leases typically provide for certain minimum payments as well as increases in lease payments based upon the operating cost of the facility and the consumer price index. Rent expense for the years ended September 30, 2007, 2008, and 2009 was $21.0 million, $19.5 million, and $24.5 million respectively.
Minimum future payments under leases in effect as of September 30, 2009 are as follows (in thousands):
| | | | |
| | Operating
Leases | |
|---|
Year ended September 30, | | | | |
2010 | | $ | 27,747 | |
2011 | | | 20,190 | |
2012 | | | 15,864 | |
2013 | | | 5,594 | |
2014 | | | 2,005 | |
Thereafter | | | 3,219 | |
| | | | |
Total minimum lease payments | | $ | 74,619 | |
| | | | |
Table of Contents
MAXIMUS, Inc.
Notes to Consolidated Financial Statements (Continued)
For the years ended September 30, 2007, 2008 and 2009
11. Employee Benefit Plans and Deferred Compensation
The Company has 401(k) plans and other defined contribution plans for the benefit of all employees who meet certain eligibility requirements. The plans provide for Company match, specified Company contributions, and/or discretionary Company contributions. During the years ended September 30, 2007, 2008, and 2009, the Company contributed $3.2 million, $3.9 million, and $3.2 million to the plans, respectively.
12. Income Taxes
Since October 1, 2007, the Company has accounted for uncertain tax positions by recognizing the financial statement effects of a tax position only when, based upon the technical merits, it is "more-likely-than-not" that the position will be sustained upon examination. The cumulative effect of this change in accounting policy was an increase in the liability for unrecognized tax benefits of $0.3 million, which was accounted for as a decrease in the October 1, 2007 balance of retained earnings on our consolidated balance sheet.
The Company's net unrecognized tax benefits totaled $2.0 million and $1.9 million at September 30, 2008 and 2009, respectively. The total amount of unrecognized tax benefits that, if recognized, would affect the annual effective income tax rate is $1.9 million at September 30, 2009.
It is reasonably possible that the total amount of unrecognized tax benefits could decrease by as much as $0.6 million within the next twelve months as a result of settlement of audit issues, expiration of statute of limitations and/or payment of uncertain tax liabilities, which could have an impact on the effective tax rate. The anticipated reversals are related to state tax items, none of which individually are significant.
The Company recognizes and presents uncertain tax positions on a gross basis (i.e., without regard to likely offsets for deferred tax assets, deductions, and/or credits that would result from payment of uncertain tax amounts). The reconciliation of the beginning and ending amount of gross unrecognized tax benefits is as follows (in thousands):
| | | | | | | |
| | Fiscal Year Ended
September 30 | |
|---|
| | 2008 | | 2009 | |
|---|
Balance at beginning of year | | $ | 2,439 | | $ | 2,291 | |
Additions based on tax positions related to the current year | | | 79 | | | — | |
Additions for tax positions of prior years | | | — | | | — | |
Reductions for tax positions of prior years | | | (85 | ) | | — | |
Lapse of statute of limitations | | | (142 | ) | | (68 | ) |
Settlements | | | — | | | (178 | ) |
| | | | | | |
Balance at end of year | | $ | 2,291 | | $ | 2,045 | |
| | | | | | |
The Company files income tax returns in the United States Federal jurisdiction and in various state and foreign jurisdictions. The Company is no longer subject to U.S. Federal income tax examinations for years before 2005 and is no longer subject to state and local, or foreign income tax examinations by tax authorities for years before 2003.
Table of Contents
MAXIMUS, Inc.
Notes to Consolidated Financial Statements (Continued)
For the years ended September 30, 2007, 2008 and 2009
12. Income Taxes (Continued)
The Company has elected to report interest and penalties as a component of income tax expense. In the fiscal year ending September 30, 2009, the Company recognized interest expense relating to unrecognized tax benefits of less than $0.1 million. The net liability balance at September 30, 2008 and 2009 of $2.0 million and $1.9 million includes approximately $0.2 million and $0.3 million, respectively, of interest and penalties.
The Company's provision for income taxes is as follows (in thousands):
| | | | | | | | | | | | |
| | Year ended September 30, | |
|---|
| | 2007 | | 2008 | | 2009 | |
|---|
Current provision: | | | | | | | | | | |
| | Federal | | $ | 16,576 | | $ | 39,616 | | $ | 5,442 | |
| | State and local | | | 3,745 | | | 5,637 | | | 1,198 | |
| | Foreign | | | 1,926 | | | 2,819 | | | 2,266 | |
| | | | | | | | |
| | | Total current provision | | | 22,247 | | | 48,072 | | | 8,906 | |
| | | | | | | | |
Deferred tax expense (benefit): | | | | | | | | | | |
| | Federal | | | (10,994 | ) | | (25,573 | ) | | 21,203 | |
| | State and local | | | (2,337 | ) | | (4,633 | ) | | 4,534 | |
| | Foreign | | | 733 | | | 1,355 | | | 734 | |
| | | | | | | | |
| | | Total deferred tax expense (benefit) | | | (12,598 | ) | | (28,851 | ) | | 26,471 | |
| | | | | | | | |
| | Income tax expense | | $ | 9,649 | | $ | 19,221 | | $ | 35,377 | |
| | | | | | | | |
The provision for income taxes differs from that which would have resulted from the use of the federal statutory income tax rate as follows (in thousands):
| | | | | | | | | | |
| | Year ended September 30, | |
|---|
| | 2007 | | 2008 | | 2009 | |
|---|
Federal income tax provision at statutory rate of 35% | | $ | (435 | ) | $ | 17,164 | | $ | 31,486 | |
District of Columbia settlement | | | 7,641 | | | — | | | — | |
Valuation allowance on net operating loss carryforwards | | | 2,069 | | | — | | | (330 | ) |
Permanent items | | | 594 | | | 886 | | | 512 | |
Municipal interest | | | (1,833 | ) | | (264 | ) | | — | |
State income taxes, net of federal benefit | | |
927 | | |
2,243 | | |
3,866 | |
Reserve for state income tax audits | | | 646 | | | — | | | — | |
Other | | | 40 | | | (808 | ) | | (157 | ) |
| | | | | | | | |
Income tax expense | | $ | 9,649 | | $ | 19,221 | | $ | 35,377 | |
| | | | | | | | |
Table of Contents
MAXIMUS, Inc.
Notes to Consolidated Financial Statements (Continued)
For the years ended September 30, 2007, 2008 and 2009
12. Income Taxes (Continued)
The significant items comprising the Company's deferred tax assets and liabilities as of September 30, 2008 and 2009 are as follows (in thousands):
| | | | | | | | | | | |
| |
| | As of September 30, | |
|---|
| |
| | 2008 | | 2009 | |
|---|
Deferred tax assets—current: | | | | | | | | | | |
| | Costs deductible in future periods | | $ | 25,258 | | $ | 6,823 | |
| | Deferred revenue | | | 6,910 | | | 8,043 | |
| | | | | | | | | |
Total deferred tax assets—current | | | 32,168 | | | 14,866 | |
Deferred tax liabilities—current: | | | | | | | | | | |
| | Accounts receivable—unbilled | | | 10,267 | | | 9,035 | |
| | Other | | | — | | | 442 | |
| | | | | | | | | |
Total deferred tax liabilities—current: | | | 10,267 | | | 9,477 | |
| | | | | | | | | |
Net deferred tax asset (liability)—current | | $ | 21,901 | | $ | 5,389 | |
| | | | | | | | | |
Deferred tax assets (liabilities)—non-current: | | | | | | | | | | |
| | Non-cash equity compensation | | $ | 3,813 | | $ | 4,432 | |
| | Costs deductible in future periods | | | 3,800 | | | 3,512 | |
| | Net operating loss carryforwards | | | 2,291 | | | 1,853 | |
| | Valuation allowance on net operating loss carryforwards | | | (1,404 | ) | | (1,773 | ) |
| | Amortization of goodwill | | | 3,666 | | | 1,591 | |
| | Depreciation | | | (1,185 | ) | | (5,909 | ) |
| | Capitalized software | | | (354 | ) | | (3,779 | ) |
| | Deferred contract costs | | | 1,398 | | | 177 | |
| | Other | | | (1,092 | ) | | 1,135 | |
| | | | | | | | | |
Net deferred tax asset (liability)—non-current | | $ | 10,933 | | $ | 1,239 | |
| | | | | | | | | |
We do not provide for U.S. income taxes on the undistributed earnings of our foreign subsidiaries, as we consider these to be permanently reinvested in the operations of such subsidiaries. If some of these earnings were distributed, some countries may impose withholding taxes; in addition, as foreign taxes have been previously paid on these earnings, we would expect to be entitled to a U.S. foreign tax credit that would reduce the U.S. taxes owed on such distributions. As at September 30, 2009, the approximate amount of earnings from Foreign subsidiaries is $20.8 million. The amount of taxes that may be applicable on earnings planned to be reinvested indefinitely outside the United States is not readily determinable given the various tax planning alternatives the Company could employ should it decide to repatriate these earnings.
As of September 30, 2009, the Company had $5.2 million of net operating loss carryforwards related to a Canadian subsidiary. A full valuation allowance of $1.8 million has been established against the related deferred tax asset. These net operating loss carryforwards begin to expire at the end of fiscal 2013 through fiscal 2017.
Cash paid for income taxes during the years ended September 30, 2007, 2008, and 2009 was $10.3 million, $23.8 million, and $24.1 million, respectively.
Table of Contents
MAXIMUS, Inc.
Notes to Consolidated Financial Statements (Continued)
For the years ended September 30, 2007, 2008 and 2009
12. Income Taxes (Continued)
Approximately 90% of the Company's total goodwill is expected to be deductible for income tax purposes.
13. Shareholders' Equity
The Company's Board of Directors established stock option plans during 1997 pursuant to which the Company may grant non-qualified stock options to officers, employees and directors of the Company. Such plans also provide for stock awards and direct purchases of the Company's common stock. At September 30, 2009, 1.6 million shares remained available for grants under the Company's stock plans. The Company typically issues new shares in satisfying its obligations under its stock plans.
The Company previously granted stock options to certain employees. These were granted at exercise prices equal to the fair market value of the Company's common stock at the date of grant and generally vest ratably over a period of four years. Options issued prior to fiscal 2005 expire ten years after date of grant; those issued since expire after six years. The Company has transitioned towards providing Restricted Stock Units rather than options and, accordingly, no options have been granted since 2008. For the fiscal years ended September 30, 2007, 2008, and 2009, compensation expense related to stock options was $0.8 million, $2.7 million, and $1.4 million, respectively.
The Company issues Restricted Stock Units (RSUs) to officers, employees and directors of the Company under its 1997 Equity Incentive Plan ("Plan"). Generally, these RSUs vest ratably over six years with full vesting upon the sixth anniversary of the date of grant. The fair value of the RSUs, based on the Company's stock price at the grant date, is expensed over the vesting period. For the fiscal years ended September 30, 2007, 2008 and 2009, compensation expense recognized related to RSUs was $3.1 million, $6.8 million and $5.9 million, respectively.
In calculating stock-based compensation cost, the Company takes into account the expected fair value of the awards to be granted to employees and recognizes this over the service period. The methodology for calculating fair value of stock options typically utilizes the Black-Scholes method. The valuation of RSUs is based upon the share price on the day of grant. The Company considers the effect of estimated forfeitures and adjusts for changes in these estimates over the life of each grant. Stock-based compensation was $3.8 million, $9.5 million and $7.3 million for the fiscal years ended September 30, 2007, 2008 and 2009, respectively.
During the first quarter of fiscal 2008, the Company identified an error in prior periods in recorded stock-based compensation expense related to stock options and RSUs. The error was due, in part, to how the software used by the Company applied estimated forfeiture rates to fully vested stock options and RSUs. The impact was to underestimate stock compensation expense by $1.1 million in each of fiscal 2006 and 2007. The Company corrected this error by recording additional stock compensation expense of $2.2 million in the first quarter of fiscal 2008.
The total income tax benefit recognized in the income statement for share-based compensation arrangements was $2.1 million, $3.8 million and $2.9 million for the fiscal years ended September 30, 2007, 2008 and 2009, respectively.
Table of Contents
MAXIMUS, Inc.
Notes to Consolidated Financial Statements (Continued)
For the years ended September 30, 2007, 2008 and 2009
13. Shareholders' Equity (Continued)
The weighted average fair value of stock options was estimated at the date of the grant using the Black-Scholes option pricing method with the following assumptions for the fiscal years ended September 30, 2007 and 2008:
| | | | | | | |
| | 2007 | | 2008 | |
|---|
Dividend yield | | | 1.5 | % | | 0.9 | % |
Risk-free interest rate | | | 4.5 | % | | 4.1 | % |
Expected volatility | | | 37 | % | | 33 | % |
Expected life of option term (in years) | | | 4.3 | | | 4.3 | |
Weighted average fair value at grant date | | $ | 8.71 | | $ | 14.12 | |
The dividend yield is based on historical experiences and expected future changes. The risk-free interest rate is derived from the U.S. Treasury yields in effect at the time of grant. Expected volatilities are based on the historical volatility of our common stock. The expected life of the option is derived from historical data pertaining to option exercises and employee terminations.
A summary of the Company's stock option activity for the year ended September 30, 2009, is as follows:
| | | | | | | | |
| | Options | | Weighted Average
Exercise Price | |
|---|
Outstanding at September 30, 2008 | | | 1,148,492 | | $ | 30.24 | |
| | Exercised | | | (156,846 | ) | | 29.83 | |
| | Forfeited or expired | | | (35,389 | ) | | 30.39 | |
| | | | | | | |
Outstanding at September 30, 2009 | | | 956,257 | | $ | 32.27 | |
Exercisable at September 30, 2009 | | | 832,495 | | $ | 32.11 | |
The intrinsic value of exercisable stock options at September 30, 2009, was $8.5 million with a weighted average remaining life of 2.6 years.
The following table summarizes information pertaining to the stock options vested and exercised for the years presented:
| | | | | | | | | | |
| | Year ended September 30, | |
|---|
| | 2007 | | 2008 | | 2009 | |
|---|
Aggregate fair value of all stock options vesting | | $ | 8,900 | | $ | 3,300 | | | 1,735 | |
Aggregate intrinsic value of all stock options exercised | | | 7,300 | | | 2,000 | | | 1,752 | |
The following table provides certain information with respect to stock options outstanding at September 30, 2009:
| | | | | | | | | | |
Range of
Exercise Prices | | Stock Options
Outstanding | | Weighted Average
Exercise Price | | Weighted Average
Remaining Life | |
|---|
$19.88-$46.20 | | | 956,257 | | | 32.27 | | | 2.62 | |
Table of Contents
MAXIMUS, Inc.
Notes to Consolidated Financial Statements (Continued)
For the years ended September 30, 2007, 2008 and 2009
13. Shareholders' Equity (Continued)
The following table provides certain information with respect to stock options exercisable at September 30, 2009:
| | | | | | | |
Range of
Exercise Prices | | Stock Options
Exercisable | | Weighted Average
Exercise Price | |
|---|
$19.88-$46.20 | | | 832,495 | | $ | 32.11 | |
A summary of the Company's RSU activity for the year ended September 30, 2009, is as follows:
| | | | | | | | |
| | Shares | | Weighted-
Average
Grant-Date
Fair Value | |
|---|
Non-vested shares outstanding at September 30, 2008 | | | 488,528 | | $ | 33.80 | |
| | Granted | | | 334,920 | | | 30.53 | |
| | Vested | | | (154,190 | ) | | 33.16 | |
| | Forfeited | | | (29,793 | ) | | 33.70 | |
| | | | | | | |
Non-vested shares outstanding at September 30, 2009 | | | 639,465 | | $ | 33.38 | |
As of September 30, 2009, the total remaining unrecognized compensation cost related to unvested stock options and RSUs was $0.8 million and $14.8 million, respectively. This charge is expected to be realized over 2.0 years for stock options and 5.5 years for RSUs.
Cash flows resulting from the tax benefits generated from tax deductions in excess of the compensation costs recognized for those options and RSUs (excess tax benefits) are classified as financing cash flows.
The Company previously offered an employee stock purchase plan (ESPP) that allowed eligible employees to purchase shares of the Company's common stock each quarter at 95% of the market value on the last day of the quarter. The ESPP was terminated in fiscal 2007 with 6,838 shares of common stock being acquired at an average price of $29.24. No expense was recorded relating to the ESPP.
On November 14, 2007, the Company announced that its Board of Directors had authorized the repurchase of up to $150.0 million of the Company's outstanding common stock under an Accelerated Share Repurchase ("ASR") program. Under the ASR agreement, the Company acquired and retired 3,758,457 shares at an initial price of $39.91 per share for $150.0 million plus fees of approximately $0.4 million. The counter-party purchased an equivalent number of shares in the open market over the nine-month period ended August 15, 2008. Pursuant to the ASR agreement, at its completion the Company's initial price under the ASR agreement was adjusted down based on the volume-weighted average price ("VWAP") of the Company's stock during this period. Such adjustment could be settled in cash or stock at the Company's discretion. On July 11, 2008, the counter-party completed the purchase of shares in the open market, and the Company elected to receive the price adjustment of
Table of Contents
MAXIMUS, Inc.
Notes to Consolidated Financial Statements (Continued)
For the years ended September 30, 2007, 2008 and 2009
13. Shareholders' Equity (Continued)
$13.9 million in cash. In the fourth quarter of fiscal 2008, this receipt of cash was recorded as a decrease to common stock in the full amount of $13.9 million.
Under a resolution adopted in July 2008, the Board of Directors authorized the repurchase, at management's discretion, of up to an aggregate of $75.0 million of the Company's common stock. The resolution also authorized the use of option exercise proceeds for the repurchase of the Company's common stock. Under the resolution, the Company acquired and retired 1,314,290 shares at an average price of $33.56 per share for $44.1 million. At September 30, 2009, $56.7 million remained available for future stock repurchases under the resolution. As of November 17, 2009, the Company has acquired 25,400 common shares at a cost of $1.1 million during the first quarter of fiscal 2010.
In total, the Company repurchased 4,145,057 common shares at a cost of $164.5 million and 927,690 shares at a cost of $30.0 million in 2008 and 2009, respectively. The Company did not repurchase any shares in 2007.
14. Commitments and Contingencies
The Company is involved in various legal proceedings, including contract and employment claims, in the ordinary course of its business. The matters reported on below involve significant pending or potential claims against us.
(a) In December 2008, MAXIMUS, Accenture LLP and the Texas Health and Human Services Commission ("HHSC") entered into an agreement settling all claims among the parties arising from a prime contract between Accenture and HHSC for integrated eligibility services and a subcontract between MAXIMUS and Accenture in support of the prime contract. In connection with that settlement, MAXIMUS paid a total of $40.0 million and agreed to provide services to HHSC valued at an additional $10.0 million. The Company's primary insurance carrier paid $12.5 million of the amount due from MAXIMUS. In May 2009, the Company recovered an additional $6.3 million from one of its excess insurance carriers. The Company continues to pursue additional insurance recoveries from its other excess insurance carriers; however, such recoveries are not assured.
(b) In November 2007, MAXIMUS was sued by the State of Connecticut in the Superior Court in the Judicial District of Hartford. MAXIMUS had entered into a contract in 2003 with the Connecticut Department of Information Technology to update the State's criminal justice information system. The State claims that MAXIMUS breached its contract and also alleges negligence and breach of the implied warranty of fitness for a particular purpose. MAXIMUS has sued its primary subcontractor on the effort (ATS Corporation) which abandoned the project before completing its obligations. Although the State did not specify damages in its complaint, it demanded payment of alleged damages of approximately $6.2 million in a letter sent to the Company in September 2007. The Company denies that it breached its contract with the State. The Company cannot predict the outcome of the legal proceedings or any settlement negotiations or the impact they may have on the Company's operating results or financial condition.
(c) In March 2009, a state Medicaid agency asserted a claim against MAXIMUS in the amount of $2.3 million in connection with a contract MAXIMUS had through February 1, 2009 to provide
Table of Contents
MAXIMUS, Inc.
Notes to Consolidated Financial Statements (Continued)
For the years ended September 30, 2007, 2008 and 2009
14. Commitments and Contingencies (Continued)
Medicaid administrative claiming services to school districts in the state. MAXIMUS entered into separate agreements with the school districts under which MAXIMUS helped the districts prepare and submit claims to the state Medicaid agency which, in turn, submitted claims for reimbursement to the Federal government. No legal action has been initiated. The state has asserted that its agreement with MAXIMUS requires the Company to reimburse the state for the amounts owed to the Federal government. However, the Company's agreements with the school districts require them to reimburse MAXIMUS for such payments and therefore MAXIMUS believes the school districts are responsible for any amounts disallowed by the state Medicaid agency or the Federal government. Accordingly, the Company believes its exposure in this matter is limited to its fees associated with this work and that the school districts will be responsible for the remainder. During the second quarter of fiscal 2009, MAXIMUS recorded a $0.7 million reduction of revenue reflecting the fees it earned under the contract. No additional charges have been recorded since then. MAXIMUS has exited the Federal healthcare claiming business and no longer provides the services at issue in this matter.
(d) In July 2009 the District of Columbia ("District") initiated a civil action against MAXIMUS in the Superior Court of the District of Columbia, Civil Division. The District alleged violations of the District's False Claims Act ("Act"), fraud and unjust enrichment arising from the Company's preparation and submission of federal Medicaid reimbursement claims on behalf of the District. The District was seeking treble its actual damages plus a penalty of $10,000 per claim as provided under the Act. MAXIMUS previously settled a Federal investigation and related whistleblower lawsuit concerning these same activities in 2007. In connection with that settlement, MAXIMUS entered into a two-year Deferred Prosecution Agreement ("DPA"), a five-year Corporate Integrity Agreement ("CIA") and paid a settlement of $30.5 million. The DPA has since expired by its terms and the CIA has been suspended in light of the Company's exit from the Federal health care claiming business. The District was, in fact, a named party in the prior whistleblower lawsuit that was dismissed with prejudice, and MAXIMUS believes that the District's claims are barred. In October 2009, the District voluntarily dismissed the matter without prejudice.
The Company has an employment agreement with its chief executive officer with a term ending in fiscal 2010.
15. Concentrations of Credit Risk and Major Customers
Financial instruments that potentially subject the Company to significant concentrations of credit risk consist primarily of accounts receivable, billed and unbilled. To date, these financial instruments have been derived from contract revenue earned primarily from federal, state and local government agencies located in the United States.
For the years ended September 30, 2007, 2008, and 2009, the Company derived approximately 18%, 16% and 11% respectively, of its consolidated revenue from contracts with the State of California, principally within our Operations Segment.
For the years ended September 30, 2007, 2008 and 2009, the Company derived approximately 10%, 15% and 18% respectively, of its consolidated revenue from contracts with the State of Texas, principally within our Operations Segment.
Table of Contents
MAXIMUS, Inc.
Notes to Consolidated Financial Statements (Continued)
For the years ended September 30, 2007, 2008 and 2009
16. Business Segments
The following table provides certain financial information for each business segment (in thousands).
| | | | | | | | | | | |
| | 2007 | | 2008 | | 2009 | |
|---|
Revenue: | | | | | | | | | | |
Operations | | $ | 507,486 | | $ | 629,226 | | $ | 659,204 | |
Consulting | | | 75,534 | | | 64,437 | | | 58,095 | |
| | | | | | | | |
| | Total | | $ | 583,020 | | $ | 693,663 | | $ | 717,299 | |
Gross Profit: | | | | | | | | | | |
Operations | | $ | 102,886 | | $ | 163,308 | | $ | 169,749 | |
Consulting | | | 31,983 | | | 25,714 | | | 22,518 | |
| | | | | | | | |
| | Total | | $ | 134,869 | | $ | 189,022 | | $ | 192,267 | |
| | | | | | | | |
Selling, General and Administrative expense: | | | | | | | | | | |
Operations | | $ | 68,996 | | $ | 79,439 | | $ | 85,944 | |
Consulting | | | 28,397 | | | 26,623 | | | 19,866 | |
Corporate / Other | | | 537 | | | 1,924 | | | 913 | |
| | | | | | | | |
| | Total | | $ | 97,930 | | $ | 107,986 | | $ | 106,723 | |
| | | | | | | | |
Operating income (loss) from continuing operations (before income taxes): | | | | | | | | | | |
Operations | | $ | 33,890 | | $ | 83,869 | | $ | 83,805 | |
Consulting | | | 3,586 | | | (909 | ) | | 2,652 | |
Consolidating adjustments | | | (537 | ) | | (1,924 | ) | | (913 | ) |
Gain on sale of business | | | 451 | | | — | | | — | |
Gain on sale of building | | | — | | | 3,938 | | | — | |
Legal and settlement expense (recovery), net | | | 44,438 | | | 38,358 | | | (4,271 | ) |
| | | | | | | | |
| | Total | | $ | (7,048 | ) | $ | 46,616 | | $ | 89,815 | |
| | | | | | | | |
Identifiable assets: | | | | | | | | | | |
Operations | | $ | 183,552 | | $ | 218,714 | | $ | 210,646 | |
Consulting | | | 65,308 | | | 41,231 | | | 45,228 | |
Corporate / Other | | | 315,604 | | | 195,009 | | | 177,360 | |
| | | | | | | | |
| | Total | | $ | 564,464 | | $ | 454,954 | | $ | 433,234 | |
| | | | | | | | |
Depreciation and amortization: | | | | | | | | | | |
Operations | | $ | 8,779 | | $ | 9,678 | | $ | 9,546 | |
Consulting | | | 1,430 | | | 992 | | | 844 | |
Corporate / Other | | | 1,775 | | | 1,571 | | | 1,842 | |
| | | | | | | | |
| | Total | | $ | 11,984 | | $ | 12,241 | | $ | 12,232 | |
| | | | | | | | |
Revenue from foreign operations was $88.0 million, $121.2 million and $119.1 million for fiscal years 2007, 2008, and 2009, respectively. Total assets of foreign operations were $79.9 million and $94.6 million at September 30, 2008 and 2009, respectively.
Table of Contents
MAXIMUS, Inc.
Notes to Consolidated Financial Statements (Continued)
For the years ended September 30, 2007, 2008 and 2009
17. Quarterly Information (Unaudited)
�� Set forth below are selected quarterly income statement data for the fiscal years ended September 30, 2008 and 2009. The Company derived this information from unaudited quarterly financial statements that include, in the opinion of Company's management, all adjustments necessary for a fair presentation of the information for such periods. Results of operations for any fiscal quarter are not necessarily indicative of results for any future period.
Earnings per share amounts are computed independently each quarter. As a result, the sum of each quarter's earnings per share amount may not equal the total earnings per share amount for the respective year.
| | | | | | | | | | | | | | |
| | Quarter Ended | |
|---|
| | Dec. 31,
2007 | | March 31,
2008 | | June 30,
2008 | | Sept. 30,
2008 | |
|---|
| | (In thousands, except per share data)
| |
|---|
Fiscal Year 2008 | | | | | | | | | | | | | |
Revenue: | | | | | | | | | | | | | |
Operations | | $ | 146,807 | | $ | 160,982 | | $ | 157,917 | | $ | 163,520 | |
Consulting | | | 17,314 | | | 15,342 | | | 17,833 | | | 13,948 | |
| | | | | | | | | | |
| | Total revenue | | | 164,121 | | | 176,324 | | | 175,750 | | | 177,468 | |
Gross profit | | | 42,489 | | | 47,746 | | | 49,174 | | | 49,613 | |
Selling, general and administrative expenses | | |
24,914 | | |
26,885 | | |
27,018 | | |
29,169 | |
Operating income (loss) from continuing operations: | | | | | | | | | | | | | |
Operations | | | 17,429 | | | 22,295 | | | 22,316 | | | 21,829 | |
Consulting | | | 526 | | | (1,016 | ) | | 431 | | | (850 | ) |
Consolidating adjustments | | | (380 | ) | | (418 | ) | | (591 | ) | | (535 | ) |
Gain on sale of building | | | — | | | — | | | 3,938 | | | — | |
Legal and settlement expense | | | — | | | 931 | | | 700 | | | 36,727 | |
| | | | | | | | | | |
| | Operating income (loss) from continuing operations | | | 17,575 | | | 19,930 | | | 25,394 | | | (16,283 | ) |
Discontinued operations, net of income taxes | | | | | | | | | | | | | |
Loss from discontinued operations | | | (652 | ) | | (2,506 | ) | | (6,599 | ) | | (7,749 | ) |
Gain (loss) on disposal | | | — | | | — | | | 1,726 | | | (7,361 | ) |
| | | | | | | | | | |
| | Loss from discontinued operations | | | (652 | ) | | (2,506 | ) | | (4,873 | ) | | (15,110 | ) |
Net income (loss) | |
$ |
10,605 | |
$ |
9,627 | |
$ |
11,405 | |
$ |
(24,960 |
) |
Basic earnings (loss) per share: | | | | | | | | | | | | | |
| | Income (loss) from continuing operations | | $ | 0.55 | | $ | 0.65 | | $ | 0.87 | | $ | (0.53 | ) |
| | Loss from discontinued operations | | | (0.03 | ) | | (0.13 | ) | | (0.26 | ) | | (0.82 | ) |
| | | | | | | | | | |
| | Basic earnings (loss) per share | | $ | 0.52 | | $ | 0.52 | | $ | 0.61 | | $ | (1.35 | ) |
| | | | | | | | | | |
Diluted earnings (loss) per share: | | | | | | | | | | | | | |
| | Income (loss) from continuing operations | | $ | 0.54 | | $ | 0.65 | | $ | 0.86 | | $ | (0.53 | ) |
| | Loss from discontinued operations | | | (0.03 | ) | | (0.14 | ) | | (0.25 | ) | | (0.82 | ) |
| | | | | | | | | | |
| | Diluted earnings (loss) per share | | $ | 0.51 | | $ | 0.51 | | $ | 0.61 | | $ | (1.35 | ) |
| | | | | | | | | | |
Table of Contents
MAXIMUS, Inc.
Notes to Consolidated Financial Statements (Continued)
For the years ended September 30, 2007, 2008 and 2009
17. Quarterly Information (Unaudited) (Continued)
| | | | | | | | | | | | | | |
| | Quarter Ended | |
|---|
| | Dec. 31,
2008 | | March 31,
2009 | | June 30,
2009 | | Sept. 30,
2009 | |
|---|
| | (In thousands, except per share data)
| |
|---|
Fiscal Year 2009 | | | | | | | | | | | | | |
Revenue: | | | | | | | | | | | | | |
Operations | | $ | 156,338 | | $ | 155,626 | | $ | 165,522 | | $ | 181,718 | |
Consulting | | | 13,372 | | | 21,532 | | | 10,871 | | | 12,320 | |
| | | | | | | | | | |
| | Total revenue | | | 169,710 | | | 177,158 | | | 176,393 | | | 194,038 | |
Gross profit | | |
46,904 | | |
46,534 | | |
48,352 | | |
50,477 | |
Selling, general and administrative expenses | | |
26,414 | | |
26,714 | | |
27,017 | | |
26,578 | |
Operating income from continuing operations: | | | | | | | | | | | | | |
Operations | | | 21,027 | | | 19,663 | | | 19,127 | | | 23,988 | |
Consulting | | | (302 | ) | | 512 | | | 2,252 | | | 190 | |
Consolidating adjustments | | | (235 | ) | | (355 | ) | | (44 | ) | | (279 | ) |
Legal and settlement expense (recovery), net | | | — | | | 368 | | | (4,829 | ) | | 190 | |
| | | | | | | | | | |
| | Operating income from continuing operations | | | 20,490 | | | 19,452 | | | 26,164 | | | 23,709 | |
Discontinued operations, net of income taxes | | | | | | | | | | | | | |
Loss from discontinued operations | | | (485 | ) | | (763 | ) | | (924 | ) | | (4,304 | ) |
Loss on disposal | | | (5 | ) | | — | | | — | | | (1,562 | ) |
| | | | | | | | | | |
| | Loss from discontinued operations | | | (490 | ) | | (763 | ) | | (924 | ) | | (5,866 | ) |
Net income | |
$ |
11,963 | |
$ |
11,027 | |
$ |
14,983 | |
$ |
8,567 | |
Basic earnings (loss) per share: | | | | | | | | | | | | | |
| | Income from continuing operations | | $ | 0.70 | | $ | 0.68 | | $ | 0.91 | | $ | 0.82 | |
| | Loss from discontinued operations | | | (0.03 | ) | | (0.05 | ) | | (0.05 | ) | | (0.33 | ) |
| | | | | | | | | | |
| | Basic earnings per share | | $ | 0.67 | | $ | 0.63 | | $ | 0.86 | | $ | 0.49 | |
| | | | | | | | | | |
Diluted earnings (loss) per share: | | | | | | | | | | | | | |
| | Income from continuing operations | | $ | 0.69 | | $ | 0.66 | | $ | 0.89 | | $ | 0.80 | |
| | Loss from discontinued operations | | | (0.02 | ) | | (0.04 | ) | | (0.05 | ) | | (0.32 | ) |
| | | | | | | | | | |
| | Diluted earnings per share | | $ | 0.67 | | $ | 0.62 | | $ | 0.84 | | $ | 0.48 | |
| | | | | | | | | | |
18. Recent Accounting Pronouncements
In December 2007, the FASB issued SFAS No. 141 (revised) ("SFAS 141(R)"), "Business Combinations." This standard is included within the FASB Accounting Standards Codification at ASC 805 "Business Combinations." The new requirements are effective for business combinations entered into in fiscal years beginning on or after December 15, 2008, which is the Company's 2010 fiscal year. As a consequence of the requirements, more transactions will be recorded as business combinations, as it changes the definitions of a business, which would no longer be required to be self-sustaining or revenue generating, and a business combination, which would include combinations that occur by
Table of Contents
MAXIMUS, Inc.
Notes to Consolidated Financial Statements (Continued)
For the years ended September 30, 2007, 2008 and 2009
18. Recent Accounting Pronouncements (Continued)
contract alone or due to changes in substantive participation rights, such as a lapse in minority veto rights. Certain acquired contingencies will be recorded initially at fair value on the acquisition date. After the acquisition, if new information is available, contingent liabilities will be measured at the higher of the likely amount to be paid and the acquisition-date fair value. Contingent assets will be measured subsequently at the lower of the current estimated future amount to be realized and the acquisition-date fair value. Transaction and restructuring costs generally will be expensed as incurred. In partial acquisitions, companies generally will record 100 percent of the assets and liabilities at fair value, including goodwill. This will likely result in higher related depreciation and amortization charges in subsequent periods than under the current standard. The effect of the new requirements will depend upon the number and size of businesses acquired in future years.
Concurrent with the issuance of SFAS 141(R), the FASB issued SFAS No. 160, "Noncontrolling Interests in Consolidated Financial Statements." This standard is included within the FASB Accounting Standards Codification at ASC 810 "Consolidation." The new requirements are effective for fiscal years beginning on or after December 15, 2008, which is the Company's 2010 fiscal year. This statement will be applied prospectively as of October 1, 2009 except for the presentation and disclosure requirements. The standard changes the accounting and reporting for minority interests and requires the ownership interests in subsidiaries held by parties other than the parent be clearly identified, labeled, and presented in the consolidated statement of financial position within equity, but separate from the parent's equity. It also requires that the amount of consolidated net income attributable to the parent and to the noncontrolling interest be clearly identified and presented on the face of the consolidated statement of income. At September 30, 2009, the Company does not have a subsidiary with a significant noncontrolling interest and, accordingly, the effect of the adoption of these new requirements is not expected to be material.
On September 23, 2009, the FASB ratified EITF 08-1, "Revenue Arrangements with Multiple Deliverables" This standard has amended the FASB Accounting Standards Codification at ASC 605 "Revenue Recognition". The new requirements are effective for fiscal years beginning after June 15, 2010, which is the Company's 2011 fiscal year. Early adoption of the standard is allowed and various options for prospective or retroactive adoption are available. Where vendor specific objective evidence or third party evidence for deliverables in an arrangement cannot be determined, a Company will be required to develop a best estimate of the selling price of separate deliverables and allocate arrangement consideration using the relative selling price method. These new requirements will not apply to many arrangements involving software, which will continue to require vendor specific objective evidence in assessing selling price. We are in the process of reviewing and evaluating these new requirements and therefore their ultimate impact is not yet known.
Concurrent with the ratification of EITF 08-1, the FASB ratified EITF 09-3, "Certain Revenue Arrangements That Include Software Elements." This standard has amended the FASB Accounting Standards Codification at ASC 985 "Software". The new requirements are effective for fiscal years beginning after June 15, 2010, which is the Company's 2011 fiscal year. Early adoption of the standard is allowed and various options for prospective or retroactive adoption are available. Under these requirements, tangible products which have software components which are "essential to the functionality" of the tangible product will be scoped out of software revenue recognition guidance. We
Table of Contents
MAXIMUS, Inc.
Notes to Consolidated Financial Statements (Continued)
For the years ended September 30, 2007, 2008 and 2009
18. Recent Accounting Pronouncements (Continued)
are in the process of reviewing and evaluating these new requirements and therefore their ultimate impact is not yet known.
19. Texas Integrated Eligibility Project
Our fiscal 2007 results were respectively impacted by a $25.2 million operating loss on the Texas Integrated Eligibility project. Up until February 2007, we served as a subcontractor to Accenture as part of the Texas Access Alliance, which provided services under the Texas Health and Human Services Commissions' (TX HHSC) Integrated Eligibility Program. We were awarded the five-year, $370 million subcontract in June 2005. In June 2006, we amended our subcontract with Accenture to reduce scope and realign responsibilities. In November 2006, we announced that we commenced negotiations with Accenture to further reduce our scope on the project. In January 2007, we initiated arbitration to resolve certain disputes under the subcontract and in February 2007, we terminated our subcontract with Accenture. In March 2007, the TX HHSC terminated its contract with Accenture and contracted directly with us to provide support services for its State Children's Health Insurance Program (SCHIP) and to provide enrollment broker services for its Medicaid program. We continue to provide services under these programs, but on a profitable basis. See "Note 14. Commitments and Contingencies" above for additional information.
20. Legal and Settlement Expense (Recovery), Net
Legal and settlement expense (recovery) consists of costs, net of reimbursed insurance claims, related to significant legal settlements and non-routine legal matters, including future probable legal costs estimated to be incurred in connection with those matters. Legal expenses incurred in the ordinary course of business are included in selling, general and administrative expense.
The following table sets forth the matters that represent legal and settlement expense (recovery) (dollars in thousands):
| | | | | | | | | | |
| | Year ended September 30, | |
|---|
| | 2007 | | 2008 | | 2009 | |
|---|
Accenture Arbitration, Related Settlement and Insurance Recoveries, net | | $ | 10,000 | | $ | 38,377 | | $ | (6,300 | ) |
District of Columbia Contract Investigation and Related Settlement | | | 31,980 | | | (19 | ) | | — | |
Computer Equipment Leases Settlement | | | (150 | ) | | — | | | — | |
Ontario Child Support Project Settlement | | | 2,608 | | | — | | | — | |
Other | | | — | | | — | | | 2,029 | |
| | | | | | | | |
Total | | $ | 44,438 | | $ | 38,358 | | $ | (4,271 | ) |
| | | | | | | | |
See "Note 14. Commitments and Contingencies" above for additional information.
Table of Contents
MAXIMUS, Inc.
Notes to Consolidated Financial Statements (Continued)
For the years ended September 30, 2007, 2008 and 2009
21. Sale of Corrections Services Business
On October 5, 2006, the Company sold its Corrections Services business for proceeds of $1.9 million, net of transaction costs of $0.8 million, and recognized a pre-tax gain on the sale of $0.5 million. During the fiscal year ended September 30, 2006, this business had revenue of $9.1 million and generated an operating loss of approximately $0.6 million.
22. Sale of Building
During the quarter ended June 30, 2008, the Company sold a 21,000 square foot administrative office building in McLean, Virginia for proceeds of $5.9 million, net of transactions costs of $0.2 million, and recognized a pre-tax gain on the sale of $3.9 million. This gain has been classified as gain on sale of building in the consolidated statement of operations.
23. Fair Value MeasurementsRelated Party Transactions
Effective October 1,
Governor James R. Thompson, one of our outside directors who the Company’s Board of Directors has determined to be independent, is Senior Chairman of the law firm of Winston & Strawn in Chicago. Winston & Strawn has provided certain legal services to the Company. These services were provided in the normal course of business on terms and conditions consistent with the standard practices of Winston & Strawn and MAXIMUS. Governor Thompson had no personal involvement in the services provided. In 2008, 2009, and 2010, the Company is required to disclose the fair valuepaid Winston & Strawn $620,800, $934,391 and $150,609, respectively. These transactions do not represent a significant portion of all financial assets subject to fair value measurement and the nature of the valuation techniques, including their classification within the fair value hierarchy, utilized by the Company in performing these measurements. The only financial assets subject to fair value measurements held by the Company at September 30, 2009 were the Company's cash and cash equivalents. These assets are considered to be 'Level 1' assets as their valuation is based upon observable inputs such as unadjusted quoted prices in active markets for identical assets.Winston & Strawn’s annual revenues.
The Company has taken advantage of a one year deferral in the requirement to provide fair value disclosures for non-financial assets and liabilities except for those that are recognized or disclosed in the financial statements at fair value at least annually.
24. Subsequent Events
In preparing these financial statements, the Company's management has evaluated subsequent events through November 17, 2009, the date the financial statements were issued.
On October 9, 2009,8, 2010, the Company'sCompany’s Board of Directors declared a quarterly cash dividend of $0.12 for each share of the Company'sCompany’s common stock outstanding. The dividend will be paid on November 30, 20092010 to shareholders of record on November 13, 2009.15, 2010. Based on the number of shares outstanding, the payment will be approximately $2.1 million.
As of November 17, 2009,19, 2010, the Company hashad repurchased 25,400 commonan additional 37,500 shares at a cost of $1.1$2.3 million during the first quarter of fiscal 2010.2011.
58
Table of Contents
ITEM 9. Changes in and Disagreements with Accountants on Accounting and Financial Disclosure.
None.
ITEM 9A. Controls and Procedures.
Evaluation of Disclosure Controls and Procedures. Our management, with the participation of our principal executive officer and principal financial officer, has evaluated the effectiveness of the design and operation of our disclosure controls and procedures (as defined in Rule 13a-15(e) under the Securities Exchange Act of 1934 (the "Exchange Act"“Exchange Act”)) as of the end of the period covered by this Annual Report on Form 10-K. Based on this evaluation, our principal executive officer and principal financial officer concluded that our disclosure controls and procedures are effective and designed to ensure that the information required to be disclosed in our reports filed or submitted under the Exchange Act is recorded, processed, summarized and reported within the requisite time periods.
Management'sManagement’s Report on Internal Control Over Financial Reporting. Our management is responsible for establishing and maintaining adequate internal control over financial reporting (as defined in Rule 13a-15(f) under the Exchange Act). Our internal control over financial reporting is designed to provide reasonable assurance regarding the reliability of our financial reporting and the preparation of published financial statements in accordance with generally accepted accounting principles.
Because of its inherent limitations, internal control over financial reporting may not prevent or detect misstatements. Therefore, even those systems determined to be effective can provide only reasonable assurance with respect to financial statement preparation and presentation. Also, projections of any evaluation of effectiveness to future periods are subject to the risk that controls may become inadequate because of changes in conditions, or that the degree of compliance with the policies or procedures may deteriorate.
Management assessed the effectiveness of our internal control over financial reporting as of September 30, 2009.2010. In making this assessment, management used the criteria set forth by the Committee of Sponsoring Organizations of the Treadway Commission (COSO) inInternal Control—Integrated Framework. Based on our assessment, we believe that as of September 30, 2009,2010, our internal control over financial reporting was effective based on criteria set forth by COSO inInternal Control—Integrated Framework.
The attestation report concerning the effectiveness of our internal control over financial reporting as of September 30, 2009,2010, issued by Ernst & Young LLP, the independent registered public accounting firm who also audited our consolidated financial statements, is included following this Item 9A.
Changes in Internal Control Over Financial Reporting. During 2009,the fourth quarter of fiscal 2010, the Company completed the installation of a phased implementation of an Enterprise Resource Planning (ERP)enterprise resource planning system transferring theand completed installation of core financialsfinancial modules for certain divisions of the Company to the new ERP system.all US based divisions. We have updated the Company'sCompany’s internal controls over financial reporting as necessary to accommodate modifications to business processes orand accounting procedures. However, the internal control design remained substantially unchanged for the initial implementation. Further phases of implementation were implemented at the beginning of fiscal 2010 and these changes, as well as others planned for fiscal 2010, will continue to be monitored and tested as part of management's annual evaluation of internal control over financial reporting.
Other than the matter noted above, there was no change in our internal control over financial reporting (as defined in Rules 13a-15(f) and 15d-15(f) under the Exchange Act) identified in connection with the evaluation of our internal control that occurred during our fourth fiscal quarter of 20092010 that has materially affected, or is reasonably likely to materially affect, our internal control over financial reporting.
59
Table of Contents
REPORT OF INDEPENDENT REGISTERED PUBLIC ACCOUNTING FIRM
The Board of Directors and Shareholders of MAXIMUS, Inc.
We have audited MAXIMUS, Inc.'s’s internal control over financial reporting as of September 30, 2009,2010, based on criteria established in Internal Control—Integrated Framework issued by the Committee of Sponsoring Organizations of the Treadway Commission (the COSO criteria). MAXIMUS, Inc'sInc’s management is responsible for maintaining effective internal control over financial reporting, and for its assessment of the effectiveness of internal control over financial reporting included in the accompanying Management Report on Internal Control Over Financial Reporting. Our responsibility is to express an opinion on the company'scompany’s internal control over financial reporting based on our audit.
We conducted our audit in accordance with the standards of the Public Company Accounting Oversight Board (United States). Those standards require that we plan and perform the audit to obtain reasonable assurance about whether effective internal control over financial reporting was maintained in all material respects. Our audit included obtaining an understanding of internal control over financial reporting, assessing the risk that a material weakness exists, testing and evaluating the design and operating effectiveness of internal control based on the assessed risk, and performing such other procedures as we considered necessary in the circumstances. We believe that our audit provides a reasonable basis for our opinion.
A company'scompany’s internal control over financial reporting is a process designed to provide reasonable assurance regarding the reliability of financial reporting and the preparation of financial statements for external purposes in accordance with generally accepted accounting principles. A company'scompany’s internal control over financial reporting includes those policies and procedures that (1) pertain to the maintenance of records that, in reasonable detail, accurately and fairly reflect the transactions and dispositions of the assets of the company; (2) provide reasonable assurance that transactions are recorded as necessary to permit preparation of financial statements in accordance with generally accepted accounting principles, and that receipts and expenditures of the company are being made only in accordance with authorizations of management and directors of the company; and (3) provide reasonable assurance regarding prevention or timely detection of unauthorized acquisition, use, or disposition of the company'scompany’s assets that could have a material effect on the financial statements.
Because of its inherent limitations, internal control over financial reporting may not prevent or detect misstatements. Also, projections of any evaluation of effectiveness to future periods are subject to the risk that controls may become inadequate because of changes in conditions, or that the degree of compliance with the policies or procedures may deteriorate.
In our opinion, MAXIMUS, Inc. maintained, in all material respects, effective internal control over financial reporting as of September 30, 2009,2010, based on the COSO criteria.
We also have audited, in accordance with the standards of the Public Company Accounting Oversight Board (United States), the 20092010 consolidated financial statements of MAXIMUS, Inc. and our report dated November 17, 200919, 2010 expressed an unqualified opinion thereon.
McLean, Virginia
November 17, 200919, 2010
60
Table of Contents
ITEM 9B. Other Information.
Certifications. Our principal executive officer and principal financial officer file the certifications required by Section 302 of the Sarbanes-Oxley Act of 2002 regarding the quality of our public disclosure as Exhibits 31.1 and 31.2 to this Annual Report on Form 10-K. In addition, our principal executive officer annually certifies to the New York Stock Exchange that he is not aware of any violation by MAXIMUS of the New York Stock Exchange's corporate governance listing standards. This certification was submitted, without qualification, as required after the 2009 annual meeting of MAXIMUS shareholders.
PART III
The information required by Items 10, 11, 12, 13 and 14 of Part III of Form 10-K has been omitted in reliance on General Instruction G(3) to Form 10-K and is incorporated herein by reference to the Company'sCompany’s Proxy Statement relating to its Annual Meeting of Shareholders scheduled for March 18, 20102011 (the "Proxy Statement"“Proxy Statement”) to be filed with the SEC, except as otherwise indicated below:
ITEM 10. Directors, Executive Officers and Corporate Governance.
The information required by this Item is incorporated by reference to the Proxy Statement.
ITEM 11. Executive Compensation.
The information required by this Item is incorporated by reference to the Proxy Statement.
ITEM 12. Security Ownership of Certain Beneficial Owners and Management and Related Stockholder Matters.
Except for the information disclosed in this Item below, the information required by this Item is incorporated by reference to the Proxy Statement.
Securities Authorized for Issuance Under Equity Compensation Plans
The following table provides information as of September 30, 20092010 with respect to shares of our common stock that may be issued under our existing equity compensation plans:
| | Number of securities to be
issued upon exercise of
outstanding options,
warrants and rights | | Weighted average
exercise price of
outstanding options,
warrants and rights | | Number of securities remaining
available for future issuance under
equity compensation plans(1) | |
Equity compensation plans/arrangements approved by the shareholders(2) | | 1,496,398 | | $ | 16.56 | | 1,406,442 | |
Equity compensation plans/arrangements not approved by the shareholders | | — | | — | | — | |
Total | | 1,496,398 | | $ | 16.56 | | 1,406,442 | |
| | | | | | | | | | |
| | Number of securities to be
issued upon exercise of
outstanding options,
warrants and rights | | Weighted average
exercise price of
outstanding options,
warrants and rights | | Number of securities remaining
available for future issuance under
equity compensation plans(1) | |
|---|
Equity compensation plans/arrangements approved by the shareholders(2) | | | 1,595,722 | | $ | 19.34 | | | 1,649,283 | |
Equity compensation plans/arrangements not approved by the shareholders | | | — | | | — | | | — | |
| | | | | | | | |
Total | | | 1,595,722 | | $ | 19.34 | | | 1,649,283 | |
(1)
- In addition to being available for future issuance upon exercise of options that may be granted after September 30,
2009,2010, all shares under the 1997 Equity Incentive Plan may be issued in the form of restricted stock, performance shares, stock appreciation rights, stock units, or other stock-based awards.
(2)
- Includes the 1997 Equity Incentive Plan, the 1997 Employee Stock Purchase Plan and the 1997 Director Stock Option Plan.
Table of Contents
ITEM 13. Certain Relationships and Related Transactions, and Director Independence.
The information required by this Item is incorporated by reference to the Proxy Statement.
ITEM 14. Principal Accounting Fees and Services.
The information required by this Item is incorporated by reference to the Proxy Statement.
61
Table of Contents
PART IV
ITEM 15. Exhibits, Financial Statement Schedules.
(a) | 1. | | | Financial Statements. |
(a) | | 1. | | Financial Statements. |
| | | | The consolidated financial statements are listed under Item 8 of this Annual Report on Form 10-K. |
|
2. |
2. |
|
Financial Statement Schedules. |
| | | | None. Financial statement schedules are either not required under the related instructions or are inapplicable and therefore have been omitted. |
|
3. |
3. |
|
Exhibits. |
| | | | The Exhibits filed as part of this Annual Report on Form 10-K are listed on the Exhibit Index immediately preceding such Exhibits, which Exhibit Index is incorporated herein by reference. |
(b) |
|
|
|
Exhibits—see Item 15(a)(3) above. |
(c) |
|
|
|
Financial Statement Schedules—see Item 15(a)(2) above. |
62
Table of Contents
SIGNATURESSIGNATURES
Pursuant to the requirements of Section 13 or 15(d) of the Securities Exchange Act of 1934, as amended, the registrant has duly caused this Annual Report on Form 10-K to be signed on its behalf by the undersigned, thereunto duly authorized on the 1719th day of November 2009.2010.
| | | | MAXIMUS, INC. |
| By: | MAXIMUS, INC. |
|
|
By: |
|
/s/ RICHARD A. MONTONI
|
| | Richard A. Montoni
|
| | Chief Executive Officer |
Pursuant to the requirements of the Securities Exchange Act of 1934, as amended, this Annual Report on Form 10-K has been signed below by the following persons on behalf of the registrant and in the capacities and on the dates indicated.
| | | | |
| | | | |
|---|
|
|
|
|
|
/s/ RICHARD A. MONTONI
Richard A. Montoni | | President, Chief Executive Officer and Director (principal executive officer) | | November 17, 200919, 2010 |
Richard A. Montoni | | | |
| | | | |
/s/ DAVID N. WALKER
David N. Walker |
|
| Chief Financial Officer and Treasurer (principal financial and accounting officer) |
|
November 17, 2009 19, 2010 |
David N. Walker | | | |
| | | | |
/s/ PETER B. POND
Peter B. Pond |
|
| Chairman of the Board of Directors |
|
November 17, 2009 19, 2010 |
Peter B. Pond | | | | |
| | | | |
/s/ RUSSELL A. BELIVEAU
| | Director | | November 19, 2010 |
Russell A. Beliveau |
|
Director
|
|
November 17, 2009 | |
| | | | |
/s/ JOHN J. HALEY
| | Director | | November 19, 2010 |
John J. Haley |
|
Director
|
|
November 17, 2009 | |
| | | | |
/s/ PAUL R. LEDERER
| | Director | | November 19, 2010 |
Paul R. Lederer |
|
Director
|
|
November 17, 2009 | |
| | | | |
/s/ RAYMOND B. RUDDY
| | Director | | November 19, 2010 |
Raymond B. Ruddy |
|
Director
|
|
November 17, 2009 | |
| | | | |
/s/ MARILYN R. SEYMANN
| | Director | | November 19, 2010 |
Marilyn R. Seymann |
|
Director
|
|
November 17, 2009 | |
| | | | |
/s/ JAMES R. THOMPSON, JR.
| | Director | | November 19, 2010 |
James R. Thompson, Jr. |
|
Director
|
|
November 17, 2009 | |
| | | | |
/s/ WELLINGTON E. WEBB
| | Director | | November 19, 2010 |
Wellington E. Webb |
|
Director
|
|
November 17, 2009 | |
63
Table of Contents
EXHIBIT INDEX
Exhibit
Number |
| |
|
Exhibit
Number | |
|
|---|
3.1 | 3.1 | | Amended and Restated Articles of Incorporation of the Company, as amended.(1) |
3.2 |
3.2 |
|
Amended and Restated Bylaws of the Company.(2) |
4.1 |
4.1 |
|
Specimen Common Stock Certificate.(3) |
10.1 |
10.1 |
|
1997 Equity Incentive Plan, as amended.(4)* |
10.2 |
10.2 |
|
First Amendment to the 1997 Equity Incentive Plan, as amended.(5)* |
10.3 |
10.3 |
|
1997 Director Stock Option Plan, as amended.(6)* |
10.4 |
10.4 |
|
1997 Employee Stock Purchase Plan, as amended.(7)* |
10.5 |
10.5 |
|
Executive Employment, Non-Compete and Confidentiality Agreement by and between the Company and Richard A. Montoni.(8)* |
10.6 |
10.6 |
|
First Amendment to the Executive Employment, Non-Compete and Confidentiality Agreement by and between the Company and Richard A. Montoni.(5)* |
10.7 |
10.7 |
|
Executive Employment, Non-Compete and Confidentiality Agreement by and between the Company and Bruce Caswell.(5)* |
10.8 |
10.8 |
|
First Amendment to the Executive Employment, Non-Compete and Confidentiality Agreement by and between the Company and Bruce Caswell.(5)* |
10.9 |
10.9 |
|
Form of Indemnification Agreement by and between the Company and each of the directors of the Company.(9)* |
10.10 |
10.10 |
|
Amended and Restated Income Continuity Program.(5)* |
10.11 |
10.11 |
|
Deferred Compensation Plan, as amended.(5)* |
10.12 |
10.12 |
|
1997 Equity Incentive Plan—Restricted Stock Units—Terms and Conditions.(10) |
10.13 |
10.13 |
|
1997 Equity Incentive Plan—Non-Qualified Stock Option—Terms and Conditions.(10) |
10.14 |
10.14 |
|
Purchase Agreement between MAXIMUS, Inc. and UBS AG, London Branch, dated November 15, 2007.(11) |
10.15 |
10.15 |
|
Revolving Credit Agreement, dated January 25, 2008, by and among MAXIMUS, Inc., as borrower, SunTrust Bank as administrative agent, issuing bank and swingline lender and the other lender parties thereto.(12) |
10.16 |
10.16 |
|
Security Agreement, dated January 25, 2008, among MAXIMUS, Inc. and certain subsidiaries of MAXIMUS, Inc., in favor of SunTrust Bank.(12) |
10.17 |
10.17 |
|
Pledge Agreement, dated January 25, 2008, by and among MAXIMUS, Inc. and certain subsidiaries of MAXIMUS, Inc., in favor of SunTrust Bank.(12) |
10.18 |
21.1 |
|
Extension of Employment Agreement of Richard A. Montoni, dated December 22, 2009 (13)* |
21.1 | | | Subsidiaries of the Company. Filed herewith. |
23.1 |
23.1 |
|
Consent of Independent Registered Public Accounting Firm. Filed herewith. |
31.1 |
31.1 |
|
Certification Pursuant to Section 302 of the Sarbanes-Oxley Act of 2002. Filed herewith. |
31.2 |
31.2 |
|
Certification Pursuant to Section 302 of the Sarbanes-Oxley Act of 2002. Filed herewith. |
32.1 |
32.1 |
|
Section 906 Principal Executive Officer Certification. Furnished herewith. |
Table of Contents
| | | |
Exhibit
Number | |
|
|---|
32.2 | 32.2 | | Section 906 Principal Financial Officer Certification. Furnished herewith. |
99.1 |
99.1 |
|
Special Considerations and Risk Factors. Filed herewith. |
*Denotes management contract or compensation plan.
(1)Filed as an exhibit to the Company'sCompany’s Quarterly Report on Form 10-Q for the quarter ended June 30, 2000 (File No. 1-12997) on August 14, 2000 and incorporated herein by reference.
(2)Filed as an exhibit to the Company'sCompany’s Quarterly Report on Form 10-Q for the quarter ended December 31, 2007, (File No. 1-12997) on February 8, 2008 and incorporated herein by reference.
(3)Filed as an exhibit to the Company'sCompany’s Quarterly Report on Form 10-Q for the quarter ended June 30, 1997 (File No. 1-12997) on August 14, 1997 and incorporated herein by reference.
(4)Filed as an exhibit to the Company'sCompany’s Registration Statement on Form S-8 (File No. 333-136400) on August 8, 2006 and incorporated herein by reference.
(5)Filed as an exhibit to the Company'sCompany’s Current Report on Form 8-K (File No. 1-12997) on November 27, 2007 and incorporated herein by reference.
(6)Filed as an exhibit to the Company'sCompany’s Annual Report on Form 10-K for the year ended September 30, 1997 (File No. 1-12997) on December 22, 1997 and incorporated herein by reference.
64
Table of Contents
(7)Filed as an exhibit to the Company'sCompany’s Registration Statement on Form S-8 (File No. 333-122711) on February 10, 2005 and incorporated herein by reference.
(8)Filed as an exhibit to the Company'sCompany’s Current Report on Form 8-K (File No. 1-12997) on April 26, 2006 and incorporated herein by reference.
(9)Filed as an exhibit to the Company'sCompany’s Registration Statement on Form S-1 (File No. 333-21611) on February 12, 1997 and incorporated herein by reference.
(10)Filed as an exhibit to the Company'sCompany’s Current Report on Form 8-K (File No. 1-12997) on June 23, 2006 and incorporated herein by reference.
(11)Filed as an exhibit to the Company'sCompany’s Current Report on Form 8-K (File No. 1-12997) on November 20, 2007 and incorporated herein by reference.
(12)Filed as an exhibit to the Company'sCompany’s Current Report on Form 8-K (File No. 1-12997) on January 29, 2008 and incorporated herein by reference.
(13)Filed as an exhibit to the Company’s Quarterly Report on Form 10-Q for the Quarter ended December 31, 2009 (File No. 1-12997) on February 4, 2010 and incorporated herein by reference.
65