Use these links to rapidly review the document
TABLE OF CONTENTS
Index to Consolidated Financial Statements
TABLE OF CONTENTS
Table of Contents
UNITED STATES
SECURITIES AND EXCHANGE COMMISSION
Washington, D.C. 20549
FORM 10-K
ANNUAL REPORT
| | |
| (Mark One) | | |
ý |
|
ANNUAL REPORT PURSUANT TO SECTION 13 OR 15(d) OF THE SECURITIES EXCHANGE ACT OF 1934 |
For the fiscal year ended September 30, 20092010 |
OR |
o |
|
TRANSITION REPORT PURSUANT TO SECTION 13 OR 15(d) OF THE SECURITIES EXCHANGE ACT OF 1934 |
For the transition period from to
|
Commission file number 0-19654001-31614
VITESSE SEMICONDUCTOR CORPORATION
(Exact name of registrant as specified in its charter)
| | |
Delaware
(State or other jurisdiction of
incorporation or organization) | | 77-0138960
(I.R.S. Employer
Identification No.) |
741 Calle Plano |
|
|
Camarillo, California
(Address of principal executive offices) |
|
93012
(Zip Code) |
Registrant's telephone number, including area code:(805) 388-3700
Securities registered pursuant to Section 12(b) of the Act:
NONE
Securities registered pursuant to Section 12(g) of the Act:
Common Stock, Par Value $0.01
Indicate by check mark if the registrant is a well-known seasoned issuer, as defined in Rule 405 of the Securities Act. YES o NO ý
Indicate by check mark if the registrant is not required to file reports pursuant to Section 13 or Section 15(d) of the Act. YES o NO ý
Indicate by check mark whether the registrant (1) has filed all reports required to be filed by Section 13 or 15(d) of the Securities Exchange Act of 1934 during the preceding 12 months (or for such shorter period that the Registrant was required to file such reports), and (2) has been subject to such filing requirements for the past 90 days. YES ý NO o
Indicate by check mark whether the registrant has submitted electronically and posted on its corporate Web site, if any, every Interactive Data File required to be submitted and posted pursuant to Rule 405 of Regulation S-T (§232.405 of this chapter) during the preceding 12 months (or for such shorter period that the registrant was required to submit and post such files). Yes o No o
Indicate by check mark if disclosure of delinquent filers pursuant to Item 405 of Regulation S-K (§ 229.405 of this chapter) is not contained herein, and will not be contained, to the best of registrant's knowledge, in definitive proxy or information statements incorporated by reference in Part III of this Form 10-K or any amendment to this Form 10-K. oý
Indicate by check mark whether the registrant is a large accelerated filer, an accelerated filer, a non-accelerated filer, or a non-accelerated filer.smaller reporting company. See definitiondefinitions of "large accelerated filer," "accelerated filerfiler" and large accelerated filer""smaller reporting company" in Rule 12b-2 of the Exchange Act. (Check one):
| | | | | | |
| Large accelerated filer o | | Accelerated filer ý | | Non-accelerated filer o
(Do not check if a smaller
reporting company) | | Smaller reporting company o |
Indicate by check mark whether the registrant is a shell company (as defined in Rule 12b-2 of the Exchange Act). YES o NO ý
As of March 31, 2009,2010, the aggregate market value of the voting and non-voting common equity held by non-affiliates was $54,169,320,$56,561,579, based on the closing price on that date. As of December 11, 20091, 2010 there were 403,841,80223,986,531 shares of the registrant's $0.01 par value common stock outstanding.
Documents Incorporated by Reference
Portions of the Registrant's Proxy Statement for the 2011 Annual Meeting of Stockholders are incorporated by reference into Part III of this Form 10-K.
Table of Contents
VITESSE SEMICONDUCTOR CORPORATION
2009
2010 ANNUAL REPORT ON FORM 10-K
TABLE OF CONTENTS
| | | | | | |
PART I.I. | | | | |
Item 1. | | Business | | |
1 | |
Item 1A. | | Risk Factors | | | 1815 | |
Item 1B. | | Unresolved Staff Comments | | | 2827 | |
Item 2. | | Properties | | | 2827 | |
Item 3. | | Legal Proceedings | | | 2827 | |
Item 4. | | Submission of Matters to a Vote of Security HoldersRemoved and Reserved
| | | 3027 | |
PART II.II. | | | | |
Item 5. | | Market for Company'sRegistrant's Common StockEquity, Related Stockholder Matters and Related Condition and ResultsIssuer Purchases of OperationsEquity Securities | | |
3128 | |
Item 6. | | Selected Financial Data | | | 3330 | |
Item 7. | | Management's Discussion and Analysis of Financial Condition and Results of Operations | | | 3432 | |
Item 7A. | | Quantitative and Qualitative Disclosures About Market Risk | | | 7360 | |
Item 8. | | Financial Statements and Supplementary Data | | | 7360 | |
Item 9. | | Changes in and Disagreements with Accountants on Accounting and Financial Disclosure | | | 12194 | |
Item 9A. | | Controls and Procedures | | | 12294 | |
Item 9B. | | Other Information | | | 97 | |
PART III.III. | | | | |
Item 10. | | Directors, Executive Officers and Corporate Governance | | |
12797 | |
Item 11. | | Executive Compensation | | | 12797 | |
Item 12. | | Security Ownership of Certain Beneficial Owners and Management and Related Stockholder Matters | | | 12797 | |
Item 13. | | Certain Relationships and Related Transactions, and Director Independence | | | 12797 | |
Item 14. | | Principal Accountant Fees and Services | | | 12797 | |
PART IV.IV. | | | | |
Item 15. | | Exhibits and Financial Statement Schedules | | |
12797 | |
Signatures | | | 13299 | |
i
Table of Contents
PART I
SPECIAL NOTE REGARDING FORWARD-LOOKING STATEMENTS
The Business section and other parts of thisThis Annual Report on Form 10-K (this "Annual Report") contain forward-looking statements that involve risks, in particular the discussion in "Business" and uncertainties. Many of the forward-looking statements are located in "Management's Discussion and Analysis of Financial Condition and Results of Operations."Operation" contains forward-looking statements that involve risks and uncertainties. Forward-looking statements provide current expectations of future events based on certain assumptions and include any statements that do not directly relate to any historical or current fact. Forward-looking statements can also be identified by words such as "anticipates," "believes," "estimates," "expects," "intends," "plans," "predicts," and similar terms. Forward-looking statements are not guarantees of future performance and the Company's actual results may differ significantly from the results discussed in the forward-looking statements. Factors that might cause such differences include, but are not limited to, those discussed in the subsection entitled "Risk Factors" under Part I, Item 1A of this Annual Report. The Company assumes no obligation to revise or update any forward-looking statements for any reason, except as required by law.
ITEM 1. BUSINESS
Overview
Vitesse Semiconductor Corporation ("Vitesse"we," "us," "Vitesse," or the "Company") is a leading providersupplier of advancedhigh-performance integrated circuits ("ICs") that are utilized primarily by manufacturers of networking systems for Carrier and Enterprise and Storage communicationsNetworking applications. Vitesse designs, develops, and markets a diverse portfolio of high-performance, low-power, and cost-competitive semiconductor products. For more than 25 years, Vitesse has ledbeen a leader in the transition of new technologies in communications networks.
OurThe Company's customers include leading communications and enterprise original equipment manufacturers ("OEMs") worldwide such as Alcatel-Lucent, Ciena, Corporation, Cisco Systems, Inc., IBM, Telefonaktiebolaget LM Ericsson, Fujitsu, Limited, Hewlett-Packard, Co., Hitachi, Ltd., Huawei Technologies, Co., Ltd., H3C Technologies Co., Limited, Nortel Networks Corp., Nokia Siemens Networks, B.V., Tellabs, Inc., and ZTE Corporation.
We have a worldwide presence.ZTE. As of September 30, 2009, we operated2010, the Company operates four domestic design centers in the U.S.,United States, in California, Oregon, Massachusetts, and Texas, and four international design centers in Taiwan, Denmark, Germany, and India.
Vitesse was incorporated in the State of Delaware in 1987. OurThe Company's principal offices areoffice is located at 741 Calle Plano, Camarillo, California, and ourthe Company's phone number is (805) 388-3700. OurThe Company's stock trades on the OTCQB Marketplace of the Pink SheetsOTC Markets, Inc. ("Pink Sheets") under the ticker symbol VTSS.PK.
Industry Background—Background
Communications Industry
TheThis past decade experienced dramatic growth in traffic in public and private communications networks, such as those used by long-distance and local exchange service providers, as well as specialized networks, such as those used by Internet service providers. This growth has beenis driven by rapid adoption of data-intensive applications such as Internet access, e-commerce, e-mail, Voice-over-Internet-ProtocolVoice-over-Internet Protocol ("VoIP"), video conferencing and telepresence, Internet Protocol Television ("IPTV"), expansion in wireless networks driven by smartphones such as Apple's iPhone, and the movementprospect of large blocksthe rapid adoption of stored data across networks. We expectcloud computing and software-as-a-service by Enterprises. The Company expects the pace of this growth in bandwidth and the related deployment of new services to continue inwell into the future. As a result, telecomtelecommunications service providers and Enterprises are facing the need to evolve their networks to support these new services. In addition,services and associated increased bandwidth demands, while limiting capital expenditures and curtailing the growth of the Internet has created the needtremendous increases to manage, move, and store increasing amounts of mission-critical information. This has led to increasing demand for data storage systems and changes in the way companies are interconnecting these systems.
Table of Contents
power requirements. To address these challenges, communications service providers (i.e., Carriers) and Enterprises have begun to
Table of Contents
deploy equipment that is capable of more efficiently handling and transporting the various types of data-based traffic required by these new services. TheyCommunication providers are also upgrading their infrastructure to serve the variety of unique communications standards and protocols that deliver and process data. Increasingly, these new applications and services are created and delivered using Ethernet and Internet Protocol networking technologies.
Carrier Networking
The telecommunications service provider Carrier network,Network, which includes networks delivering voice, data, and datavideo communication services to business, customers as well as voice, data,residential, and video services to residentialmobile customers, ("triple play"), has grown dramatically into a complex combination of interconnected networks. These networks are often classified into groups such as Wide Area Networks ("WANs"), Metropolitan Area Networks ("MANs"), Multi-Service Access Networks ("MSANs"), and Radio Access Networks ("RANs") for wireless and mobile communication services. These evolving networks must deliver more bandwidth, and increasingly, data-based capabilities to provide improved average revenue per user ("ARPU"). These requirements are forcing service providers to make substantial capital investments to significantly expand their network coverage and upgrade their service offerings.
Since the 1990's, the Synchronous Optical Network ("SONET/SDH") has been the standard network transport protocol for high-speed transmission of communication over optical fiberCarrier Networks throughout the world. Originally developed for the voice network prior to the advent of the Internet, SONET/SDH networks are limited in their ability to provide low-cost, flexible transport of data-based services such as Internet traffic and video. With exponential increases in data traffic, "Internet Protocol" has become the dominant traffic over all communications networks. As a result, Carriers, who have a large installed base of equipment that uses SONET technology, must find ways to evolve this installed base to more efficiently deal with Ethernet traffic.
Over the last several years,As a first step, in an effort to address the increasing demand for new data-based services, service providers have started to deploy next-generation SONET/SDH networks using an enhanced Ethernet-over-SONET/SDH ("EoS") based-based technology. These next-generation SONET/SDH networks enable Ethernet, the primary protocol used in Local Area Networks ("LANs"), to be embedded inside the SONET/SDH protocol, so they can be efficiently transported over Wide Area Carrier Networks. EoS has become a major technology driver in Carrier networks by providing a simple evolutionary path for service providers to enable more Ethernet-based data services while extending their existing investment in SONET/SDH infrastructure. The transition from SONET/SDH to next-generation SONET/SDHEthernet-optimized EoS networks started several years ago and we expectthe Company expects it to continue for at least the next fivefew years as Carriers slowly evolvegradually upgrade their installed base of SONET/SDH, particularly in Carrier networks.Eastern Europe, India, and China.
With exponential increases in data traffic over the last several years, data has become the dominant traffic over all networks. To address this need,As a next step, the industry is developing new standards that will enable the deployment of additional Ethernet-based technologies deeper into the network. Broadly, Ethernet technology upgraded to meet the requirements of Carrier networksNetworks is being called "Carrier Ethernet." It is, in effect, an adaptation of Ethernet to provide the same features and functions, such as reliability, manageability, network timing, and scalability, which traditionally have traditionally been provided by "telecom" protocols such as SONET/SDH. As these Carrier Ethernet standards evolve, networks based on Carrier Ethernet technology will soon augment and eventuallygradually replace legacy telecom-basedtelecommunications networks. This transition, which is in its infancy, startingstarted with residential access and will quickly expandexpanded into wireless access networks. This transition is expected to continue for at least the next 10 years.
The new data-handling capabilities of the network enabled by EoS and Carrier Ethernet allow Carrierscarriers to more readily deploy new revenue-generating, high-bandwidth services such as VoIP, HDTV, IPTV, high-speed Internet, and business-class Ethernet services to homes and businesses. To deliver these services, they are deploying new access networks and new gateway devices in the office and home that are capable of delivering and terminating these various services. These networks will beare deployed over a variety of physical layer alternatives such as DSL and fiber. In addition, wireless networks are migrating from 2G to 3G and eventually to 4G technologies such as LTE and WiMax to provide the capability to handle more
Table of Contents
and moregrowing data and video. The growth of these wireless networks, and the wired backhaul networks that interconnect them, is expected to continue at double digitdouble-digit rates into the foreseeable future. Increasingly, allAll these networks willare expected to migrate to using EthernetInternet Protocol as the common communication protocol.protocol and Carrier Ethernet as the underlying networking technology.
Table of Contents
Enterprise Networking
Enterprise networksNetworks include equipment that is deployed in businesses, offices, and homes for voice, data, and video communications. These networks range from large, complex networks for financial institutions, retailers, and other large businesses, to LANs for the home and small office. Typical categories are large enterprise, data center switching, small-medium enterprise ("SME"), small-medium business ("SMB"), and small office home office ("SOHO"). The networks generally include equipment such as routers, and switches, as well as products such asand wired and wireless gateways. These networks provide the following connections: computers-to-servers, servers-to-storageconnect computers to servers, servers to storage systems, and LANs-to-publicLANs to public Carrier networks.Networks.
From a speed perspective, most present-day Enterprise networks,Networks, particularly LANs,Local Area Networks ("LANs"), use Ethernet operating at speeds of 10 Mbps or 100 Mbps ("Fast Ethernet") with uplinks or trunks running at 1one Gbps ("Gigabit Ethernet") or 10 Gbps ("10 Gigabit Ethernet"). Only recently has Gigabit Ethernet started to appear on the desktop. In order toTo support the migration of desktop computers to these higher data rates, LAN backbones and servers increasingly employ Gigabit Ethernet and 10 Gigabit Ethernet standards. We,The Company therefore expectexpects to see a proliferation of higher performancehigher-performance equipment within the Enterprisefor Enterprises that will not only address higher bandwidth demands, but will also be capable of providing routing functionality handlingto handle different types of traffic.
Similar to Carrier networks,Networks, Enterprise networksNetworks and data centers are going throughundergoing an evolution to provide more bandwidth, reliability, interoperability, and scalability. Ethernet-based networks, which are already widely deployed in LANs, are becoming more prevalent in other enterpriseEnterprise applications such as data center switching. Enterprises are paring down their multiple networks (phone, LAN, video conferencing, wireless, and remote mirroring/backup) to a common switched IP/Ethernet-basedInternet Protocol /Ethernet-based infrastructure. Ethernet technology that is being upgraded to meet thesethe new requirements and is generally being referred to as "Converged Ethernet." Converged Ethernet requires better Quality-of-Service ("QoS")quality-of-service features than traditional data-only LANs, advanced separation between the different services, as well asand advanced classification and access control capabilities for enhanced security.
In the data center, there is a similar trend towards Converged Ethernet. The proliferation of the Internet and the resulting need to manage, move, and store increasing amounts of mission-critical data has led to a growing demand for storage systems and their connection to servers, LANs, and WANs. While today's LANs, Storage Area Networks ("SANs"), and Server Clustering can sometimes use three separate networks based on Ethernet for LAN, Fibre Channel for SAN, and InfiniBand for the server clustering, in the future these multiple networks are expected to converge into a common infrastructure to reduce capital and operating costs.
Another important trend is the emergenceadvent of cloud computing.computing provides another important growth trend. Although in its infancy, cloud computing will increasingly move Enterprise applications and data into secure hosted applications and data "in the cloud," where itthey can be securely accessed from multiple locations, multiple devices, and multiple technologies. Cloud computing will increase the need for Enterprises and datacenters to be abledata centers to provide high-bandwidth, high reliabilityhigh-reliability networks to interconnect elements of "the cloud.the "cloud." We expectThe Company expects that thisthe need to interconnect will lead to a unification of Enterprise and Carrier Networking requirements, centered aroundon the concept of "Converged Ethernet.Ethernet,"
Table of Contents
Storage Networking
The proliferation of the Internet and the resulting need to manage, move, and store increasing amounts of mission-critical data has led to increasing demand for storage systems. It has also resulted in changesdrive a new investment cycle in the way companies are connecting these systems using specialized networks called SANs.
The evolution of SANs, which require networking at high speeds over long distances, has driven the adoption of Fibre Channel, a practical and expandable standard that enables high-speed data transfer among workstations, mainframes, data storage devices, and other peripherals. Another important emerging protocol in the storage market is Serial Attached SCSI ("SAS"). SAS is expected to expand the market for lower-cost storage networks that do not require the performance or robustness that Fibre Channel offers.
More recently, there has been further migration of the Storage Networks to new protocols based on Ethernet and "Enhanced Ethernet" technologies. One example of this is Fibre Channel over Ethernet ("FCoE"). This is another example of the trend towards "Converged Ethernet." We believe that, like Carrier and Enterprise Networking, Storage Networking will evolve over time to deploy more networks based on Ethernet technology. We continue to supply products to the Storage market based on our capabilities in Ethernet switching, Ethernet physical layer signaling, signal integrity and crosspoint switch products.industry.
Increasing Demands for Next-Generation Networking"Next-Generation Networking" Integrated Circuits
We believeThe Company believes that the market for communications infrastructure equipment, both Carrier Networking and Enterprise Networking, will benefit from several significant trends that will provide attractive growth opportunitiesopportunity for us, based on our strategy to enable the transition to Ethernet and the transition to higher speeds over existing infrastructure and media:growth.
- •
Growing demand for higher-bandwidth, higher-capacity networks.
A dramatic shift towards "packet networking" from "circuit networking", requiring deployment of new systems based on Ethernet technologies.The emergence ofCompany believes the requirements to deploy networks to service new data-intensive applications such as video-on-demand ("VoD"), IPTV, and wireless services including data and video, will spur demand for communications network systems based primarily on Ethernet technologies. This demand will provide high-growth opportunities for silicon solutions that address these new systems developed with Carrier Ethernet and Converged Ethernet technologies.
- •
- Growing demand for higher-bandwidth, higher-capacity networks. The emergence of applications such as VoD, IPTV, next-generation wireless services including data and video, as well as data
Table of Contents
centers and cloud computing are expected to create substantial growth in the volume of traffic growthpassing through the communications infrastructure. This is expected togrowth will drive the deployment of additional equipment to meet capacity needs as well as new networks with new capabilities to simplify and reduce costs. This deployment of new equipment involves increasing the data rate at which signals are transmitted over fiber connections, backplanes, connectors, and cables. The Company believes that this growth will result in an increased demand for its products.
- •
A dramatic shift towards Ethernet for all types of networking.
The requirements to deploy networks to service these new data intensive applications will spur demand for systems that augment and evolve, rather than replace, existing equipment in the infrastructure. These networks will move from systems based on a variety of protocols to systems based primarily on Ethernet technologies. This will provide high-growth opportunities for silicon solutions that address these new systems based on so-called Carrier Ethernet and Converged Ethernet technologies. We expect these trends to occur in Carrier, Enterprise, and Storage Networking.
•- Increasing complexity of
integrated circuits ("ICs")ICs for communications applications and a related trend for OEMs to purchase rather than manufacture these ICs.
We believe The Company believes OEMs are increasingly focusing their efforts on providing superior software and services as a means of differentiating themselves from their competition. This increased focus, in conjunction with rising costs of developing custom Application Specific Integrated Circuits ("ASIC") and maintaining the associated component design teams, has led OEMs to work with companies such as Vitesse to develop merchant applications specific standard productsApplications Specific Standard Products ("ASSPs") that can be flexibly used within their systems. As a result of this trend away from customer-specificcustomer specific ASIC developments, we believe that the availableCompany believes the market for ourits products will increase in the future.
Table of Contents
•Service providers and Enterprises are driven to provide more bandwidth, (i.e., more data at higher speeds). To do this, they must increase the speed at which their networks operate. This trend is seen across nearly all communication markets that we address, in particular:
The majority of the WANs are deployed at speeds of 10 Gbps. New technology is being developed to increase these speeds to 40 Gbps and even 100 Gbps. These higher speeds must be deployable over existing installed fiber, and also must be more cost effective to deploy than 10 Gbps networks in order to reduce the cost-per-Gbps. The industry is focusing on Ethernet over Optical Transport Network ("OTN") and Forward Error Correction ("FEC") coding as the WAN transport technology of choice for these higher speeds.
There are also increased traffic demands in the data center driven by rapidly increasing Internet traffic, the proliferation of web-based personal and business applications, and the requirements for geographically redundant data centers to support business continuity and disaster recovery ("BC/DR"). These data center networks are increasingly based on Ethernet technology, and will transition from 1 Gbps to 10 Gbps, and then to 40 Gbps in the near future. We expect these trends to drive additional business for our Ethernet Media Access Controllers ("MACs"), Switches and PHYs.
- •
Present-dayThe transition of Local Area Networks from "Fast Ethernet" to "Gigabit Ethernet." LANs now use the Ethernet transmission protocol operating at speeds of 10 Mbps or 100 Mbps (Fast Ethernet). Only recently has Gigabit Ethernet started to appear on the desktop. In order to support the migration of desktop computers to these higher data rates, LAN backbones and servers are increasingly employingdeploying the Gigabit Ethernet and 10 Gigabit Ethernet standards.
•Our customers often face the task of upgrading systems to higher capacity to address higher bandwidth demands. This involves increasing the data rate at which signals are transmitted over existing legacy backplanes, connectors, and cables. We believe that this will result in a significant increase in demand for our Ethernet as well as Electronic Dispersion Compensation ("EDC") physical layer and signal integrity products.
Strategy
OurThe Company's objective is to be a leading supplier of high-performance ICs for the global communications infrastructure markets, primarily Carrier Networking and Enterprise Networking markets. In order to attain this goal, ourthe Company's corporate strategy encompasses the following elements:
Target Growing Markets
We targetThe Company targets high-growth areas in the communications infrastructure market in both Carrier and Enterprise Networks to provide solutions that adhere tofor the major networking protocols andthat perform common networking functions required by the most widely deployed networking equipment. Within the networking market, the Company is addressing the two largest and fastest growing segments—Carrier Networking and Enterprise Networking.
In Access Networks we are targetingThe Company expects the Carrier Wireless and Microwave Backhaul, as well as Base StationNetworking equipment which are undergoing a rapid transition from traditional telecom protocols to Carrier Ethernet. This transition is driven by increasing data and video bandwidth requirement from 3G and future 4G and LTE wireless deployments. These deployments are expected to start in the immediate timeframe (2010 and 2011). As our customers develop new equipment for these deployments we will be able to serve these markets with our telecom-optimized Gigabit Copper PHYs, our EoS Mappers, Carrier Ethernet MACs, and our next-generation Carrier Ethernet Switches. These products incorporate advanced Operations, Administration, and Maintenance ("OAM"), Service Provisioning, and Network Timing features that are important for this new market segment.
In MANs and WANs we are targeting Carrier equipment providing Ethernet services and connectivity over SONET/SDH as well as future converged Packet Optical Transport networks. This is
Table of Contents
consistent with our vision that Optical Transport will evolve to Packet and OTN/FEC Processing over time, leading to significant synergies with our Carrier Ethernet Packet Processing as well as OTN/FEC Processing Intellectual Property and expertise. We expect this market to grow rapidly as a consequence of the increased bandwidth being generated from new wired and wireless applications being deployed to customers, as well as the emerging trend towardstoward Enterprise cloud computing that will drive significantly more bandwidth into MANsCarrier Networks. Based on industry market projections and WANs.the Company's internal market growth estimates, the Company expects the market that can be addressed, with its products in this segment, to increase at an annual rate of approximately 30%, approaching $500 million in 2014 as the Company continues to deploy new products for this market.
We are targeting SME/SMB Local Area Networks with our highly integrated, low-powerThe Enterprise Networking market is driven by the speed transition to Gigabit PHYsEthernet and Switches. In large Enterprise and datacenter networks, we are targeting the fast-growing 10-Gigabit10 Gigabit Ethernet, market with our 10Gconvergence of data center protocols to Ethernet, MACs, PHYs and SFP+ LRM-compliant EDC devices, as well as government initiatives worldwide to reduce power consumption in networking equipment. Based on industry market projections and the Company's internal market growth estimates, the Company expects the market that can be addressed, with our signal integrity products. Theseits products enable customers to upgrade their system interconnect and backplane speeds from 1-3 Gbps to 6-11 Gbps to increasein this segment, will approach $400 million in 2014. The products the capacity of large datacenter switches, blade servers, and storage systems. These markets are expected to grow faster than the overall market as ever larger datacenters are being built by large EnterprisesCompany introduced in 2010 as well as content and search providers. We expect thisthe devices currently in development address substantially larger segments of the Enterprise Networking market to benefit from future cloud computing applications.
Our signal integrity products target a wide varietythan the Company's prior generation of markets segments in both Carrier and Enterprise networks. These include markets such as SONET/DH and Ethernet transport, backplane applications in datacenter servers and storage systems, and production video systems for both standard and high-definition broadcast television.products.
Table of Contents
Focus and Specialization
We specializeThe Company specializes in Ethernet Networking—the dominant networking protocol in both Carrier and Enterprise Networks today. The trend to Carrier Ethernet and Converged Ethernet, where multiple services and networks are converged on a common Ethernet Networking infrastructure, is widely expected to accelerate in the next few years. In ourthe key markets we arethe Company is focused on:
- •
- Carrier Networks—
we specializethe Company specializes in transitioning access, metro, and core Carrier networksNetworks to deliver new Ethernet-based services over a variety of network transport technologies such as native Carrier Ethernet, Ethernet over SONET/SDH,EoS, as well as Ethernet over Wavelength division multiplex ("WDM")/Ethernet-over-Wavelength Division Multiplex/Optical transport network ("OTN"). We are,Transport Network and Packet Transport Networks. The Company is therefore uniquelywell positioned to enable Carrier OEMs and their service provider customers to deliver Ethernet-based services globally over all their networks, thus preserving their investment in their installed base.base;
- •
- Enterprise and Data Center Networks—
we specializethe Company specializes in supporting the transition from 10/100-MegabitFast Ethernet desktops and network attachments to Gigabit Ethernet and 10-Gigabit10 Gigabit Ethernet (and higher speeds in data centers) with highly integrated, low-power designs. WeThe Company also specializespecializes in supporting the convergence of multiple Enterprise networksNetworks for data, voice, storage, and video onto a common, Ethernet-based networking infrastructure.Networking infrastructure; and
- •
High-speed Physical Layer communication and Signal Integrity—Connectivity Solutions—in both the Carrier and Enterprise markets, and in some closely adjacent markets, we developthe Company develops products to address high-speed signaling issues arising from ever-increasing signal speeds over copper traces on boards, across connectors and backplanes, copper cables, as well as multi-mode and single modeoptical fiber. These signal integrity issues are expected to gain more importance as Carrier, as well as Enterprise and data center networking equipment manufacturers scale line card and systems capacity to higher speeds.
Leverage Technology Leadership into New Applications
The markets for semiconductor devices periodically experience technology shifts caused by, among other things, increased speeds or changing protocols. OurThe Company's strategy is to use ourits 25 years of design experience to introduce innovative products in these markets that solve ourits customers' business
Table of Contents
problems and gain market share through ourthe customers' adoption of ourits products. OurThe Company's advanced technology and intellectual property ("IP") developments are focused on:
- •
- Advanced packet processing technologies for Ethernet
networking: We haveNetworking: the Company has created unique packet processingpacket-processing technologies for our Ethernet MACs and Switches that will become increasingly importantare critical as networks become dominated by Ethernet.Ethernet-based data and video traffic. These technologies allow carriersenable Carriers to build packet networks based on Ethernet networks that have the same or better Quality-of-Service ("QoS"),quality of service, availability, manageability, security, and network timing characteristics as their current networks that are based on legacy technologies.technologies;
- •
Signal Integrity: We provide world-class signal integrity solutions for a broad variety of applications from 100Mbps to over 10Gbps, including latest-generation EDC that enables transmission of very-high speed signals over fiber, copper cables"Green Networking" and backplanes. These include products for 10 Gbps SFP+ Enterprise and data center applications, 10 Gbps single-mode XFP applications for WDM networks, as well as for backplane applications for 2/4/8Gbps FibreChannel, 10Gbps InfiniBand, and 10Gbps KR Ethernet. We are also leveraging our patented V-Scope™ waveform viewing technology into most of our signal integrity products.
•Lowest-power PHY technology: We havelow power: the Company has been at the forefront of the Energy Efficient Ethernet standardization effort and have been ahead ofis leading the industry with pre-standardin the application of power-saving techniques for networking. The Company was the first to introduce low-power EcoEthernet™ Copper PHY technology, also known as:as ActiPHY™ and PerfectReach™. Our next-generation 65nm Copper PHYs will be fully standards-compliant with the 802.3az Energy-Efficient Ethernet standard and set new benchmarks for power and performance. We apply the same low-power benchmarks to all our optical PHYs and SerDes.;
- •
Forward Error Correction (FEC) Codes: We have developed industry-leading FEC codes that will allow longer distance transmission with better quality in Packet Optical Transport systems. These advanced codes and technologies are becoming more important asConnectivity Solutions: the speedsCompany provides world-class connectivity solutions for a broad variety of transmission in networks increaseapplications from today's100 Mbps to 10 Gbps to tomorrow's 40 Gbps and 100 Gbps.above. The Company's high-performance, mixed-signal, CMOS technology provides superior signaling capabilities at the lowest power and cost; and
- •
InIntellectual Property Licensing: in several markets, we arethe Company is beginning to leverage these key technology advantages and IPtechnology cores into licensing opportunities with third parties. In areas such as Gigabit Ethernet Copper PHYs, high-speed signaling,parties for use in adjacent or similar markets to Carrier and signal integrity, our basic mixed-signal complementary metal-oxide-semiconductor ("CMOS") technology has application in many markets other than those in which we participate. We anticipate being able to exploit our many years of technology development by providing this technology to systems suppliers and other non-competing semiconductor suppliers in the form of intellectual property via licensing arrangements. We believe we are in a unique position to supply such IP to other IC vendors as we are either the technology or low-power leader for such IP, or such IP is only available from IC vendorsEnterprise Networking equipment that are competing in the same markets as the companies looking for such IP. As a smaller, more focused and specialized IC vendor, we are less likely todo not directly compete with those companies.the Company's customer base.
Table of Contents
Maintain and Build Solid Relationships with Tier 1 Customers and OEM Leaders in Networking
OurThe Company's major customers are savvy buyers who have carefully investigated ourits ability to serve them with products and technology reliably, on a continuous basis, over the long-term.long term. One of ourthe Company's highest priorities has been to preserve existing business while expanding ourits customer base through new programs. The key to this strategy is demonstrating the right technology and product solutions, as well as solving specific business or technology challenges. WeThe Company must also assure customers of the progress on ourthe Company's stated initiatives.
Table of Contents
A key element of ourthe Company's strategy is to work closely with ourits customers' product managers and systems design teams, as well as business unit and corporate management teams. We believeThe Company believes that these relationships enable us to better understand ourunderstanding of its customers' business and technology needs and enable usthe Company to develop solutions to problems that result inaddress the customers' design winsissues and provide customers' with differentiated feature sets for existing and newtheir systems.
Engage the Right People for Success
CloseThe Company has given close attention has been given to ensuring that the people within our organization to ensure we haveCompany has the right people in its organization for success and that ourits costs and resources are aligned with ourits opportunities. At ourits core, we arethe Company is a technology company. OurCompany. The Company's technology comes from the minds of ourits employees. We endeavorThe Company endeavors to hire the best and brightest and give them an environment fromin which they can be successful. WeThe Company has have also made important changesadded new members to ourits Board membership and are taking steps to improve our Corporate Governance practices.of Directors ("Board".)
ProductsProduct Overview
We developThe Company has developed and manufacturemanufactured a wide variety of new products that are primarily marketed to Carrier and Enterprise communication networkingNetworking and data center infrastructure OEMs. While many of ourthe Company's products are targeted at specific markets, some of them find applications in multiple types of communications equipment across all of ourits focus markets. OurIn fiscal year 2010 the Company achieved an ambitious goal of introducing 30 new products to market. A list of selected new product introductions in fiscal year 2010 can be found on the Company's website at www.vitesse.com. The information on the Company's website is not incorporated by reference into and is not made a part of this report. The Company's products fall into the following broad categories.categories:
Transport Processing Product Line
OurThe Company's goal is to address the needs of Carrier and Enterprise networkNetwork providers as they undergo a migration to new Ethernet packet networks that provide increased bandwidth and lower cost. We will do this by providing a complete family of transport processing functions that enable this smooth migration from today's networks to future networks based on Ethernet.
Transport processing products include Framers,framers, Mappers, Network Processors, and Switches. Ourswitches. The Company's product line includes devices supporting data rates up to 10 Gbps, which are used in a variety of communications equipment including Add-Drop-Multiplexers ("ADMs"), Multi-ServiceMultiservice Provisioning Platforms ("MSPPs"), core switching and Reconfigurable Optical Add-Drop-Multiplexers ("ROADMs"), Dense Wavelength-DivisionWavelength Division Multiplexing ("DWDM") systems, and core and edge routers. These processing functions evolve as the requirements of the networks migrate from a variety of protocols toward Ethernet as the standard networking protocol.
Framers are devices that take incoming data traffic from the physical layer ("PHY") and process the framing information used for transporting data. Mappers convert data from one protocol to another. Forward Error Correction ("FEC") is used in Optical Transport Networks ("OTN") for ensuring reliable data transmission. We offerThe Company offers a complete line Framersof framers and Mappers for SONET/SDH, Ethernet over SONET ("EoS"),EoS, and OTN applications. Our latest-generationThe Company's latest generation products, andas well as its new products in development, integrate increasing amounts of Ethernet packet processing technology. These products operate at speeds up to 10 Gbps, and are targeted principally for next-generation systems in the Corecore and Metrometro segments of the Carrier networks.Networks.
Network Processors are software-programmable microprocessors that are optimized for networking and communications functions such as classification, filtering, policing, grooming, forwarding, and routing. While we continue to sell and support these products, we no longer invest in the developmentTable of Network Processing Units ("NPUs") or traffic management products, and they are therefore considered "non-core" products.Contents
A switch receives data from a line card and routes the data to its proper destination. We supplyThe Company supplies a family of Time Slot Interchange ("TSI") switches for use in SONET/SDH equipment. We haveThe Company has various
Table of Contents
TSI switches in ourits product portfolio that provide aggregate bandwidth up to 1.5 Tbps. OurThe Company's switches provide higher bandwidth and lower power than competitive solutions. WeThe Company also provideprovides switch fabric chip sets for a variety of packet backplane applications. These Switch Fabricswitch fabric solutions allow total system interface bandwidths from 20 GbpsGigabits Per Second ("Gbps") to 160 Gbps and higher.
Ethernet Switches, MACs, and TransceiversSwitching Product Line
OurThe Company's Ethernet switch product line addresses Gigabit Ethernet applications in Carrier and Enterprise markets. This product line consists of Ethernet switches, Ethernet Media Access Controllers ("MACS"), and Ethernet transceivers ("Copper PHYs").
In Enterprise applications, the Enterprise LAN. This family of triple-speed (10/100/1000 Mbps) Layer-2 and Layer-3 switches are available in port counts ranging from 5 to 48. TheseCompany's Ethernet switches are targeted at desktop, workgroup, and LAN infrastructure boxes and enable these systems to migrate to Gigabit Ethernet speeds in a cost-effective manner. In 2005, we started shipping 5-port and 8-port integrated ICs that combine the transceiver and switch functions. We haveThe Company has shipped over 100175 million Gigabit Ethernet ports to date. Ourdate into Enterprise applications. The Company's Ethernet switch products provide a high-level of integration, leading to a significant reduction in part count and reduced BOMmaterial cost for ourits customers. Switches and routers with integrated Ethernet transceivers also provide all the energy-efficient ActiPHY™ and PerfectReach™ features we introduced on our standalone Ethernet transceivers. In 2008, wethe Company began to see applications for ourits Ethernet switch product line within Carrier Networking applications. Our latest-generation ofThe Company's latest generation switches for "stackable" applications incorporates a variety of functions that enable improved QoS and security functions within these types of networks. We have targetedtarget these applications for our next-generation products that will includewith additional features to enable true Carrier Ethernet networking. We expect to seeNetworking. The Company sees a broad range of applications in Customer Premisecustomer premise equipment, ("CPE"), Access Networkaccess network equipment, wireless base station, wireless backhaul equipment, and Metro Networkmetro network equipment.
Ethernet MACs provide addressing and channel control mechanisms that make it possible for several network nodes to communicate within a multipoint network. OurThe Company's MAC products are designed for use in Enterprise-classEnterprise class modular Ethernet switch platforms as well as in Ethernet over SONET/SDHEoS and Ethernet-over-OTN systems used in access, metro, and long-haul Carrier Networking systems. Our family of Ethernet MACs enables system OEMs to focus on the value-add of the packet processing function by simplifying the Ethernet system interface design. OurThe Company's Ethernet MACs provide single-chip solutions for both 1 GbpsGigabit Ethernet and 10 GbpsGigabit Ethernet applications, reducing software development costs for 1 Gbps and 10 Gbpsthese applications. They also provide support for intelligent oversubscription, allowing OEMs to efficiently and securely manage bandwidth and bandwidth usage. Our MACs incorporate industry-standard XAUI/XAUI+ and SPI-4.2 interfaces for connection to a wide variety of ICs, such as packet processors, traffic managers, switch fabrics, and transport mappers. We are a leading supplier of 1 Gbps and 10 Gbps Ethernet and Carrier Ethernet MACs in the industry.
Ethernet transceivers ("Copper PHYs")PHYs allow transmission of 10/100/1000 BASE-T data over Category 5 copper cable and fiber optic cabling. This technology is widely deployed in applications ranging from Carrier and Enterprise Networking topersonal computing, home electronics, and personal computing. We offerLAN applications to Enterprise and data center applications, and more recently in Carrier Networking applications. The Company offers a broad range of products in this category, including single, quad, and octal devices that offer a combination of low power, reduced bill of material ("BOM")low cost, and a high-levelhigh level of integration that eliminates hundreds of passive components from the printed circuit board.
Ourintegration. The Company's SimpliPHY™ Ethernet transceivers provide industry-leading low -power operation generally (20%-30% lower power operation. We havethan any of the Company's competitors). This technology has been recognized with a Frost and Sullivan industry award. The Company has recently introduced furtheradditional power savings-saving features such as ActiPHY™ and PerfectReach™ that provide energy savings of up to 80% in any network infrastructure device or CPE. This technology has been recognized with a Frost and Sullivan industry award.. These power savingpower-saving features are also included in ourthe Company's E-StaX™ and SparX™ and G-RocX™ switch and router products with integrated Ethernet transceivers. For timing-sensitive applications, such as Wireless Aggregation networks, we also offer Ethernet transceivers with advanced synchronization capabilities.
Table of Contents
Physical Media Devices, Physical Layer Devices, and Signal Integrity DevicesConnectivity Product Line
The Company's connectivity product line includes mixed-signal physical layer devices for connection of systems via optical fiber, copper cable, or backplanes. These devices are deployed across a very wide range of application and markets. Connectivity product lines include Physical Media DeviceDevices ("PMD"PMDs") serves as the actual physical connection, Physical Layer Devices ("PHYs"), crosspoint switches, and signal integrity devices.
A PMD is a mixed signal device that connects an electrical signal to the fiber optic cable by converting the incomingan optical signal into an electric signal. Similarly, for data flowing in the opposite direction, the PMD converts electric signals into optical signals. We offercomponent. The Company offers laser drivers, trans-impedancetransimpedance amplifiers and post-amplifiers operating at speeds ranging from 1.25 Gbps to 12.514 Gbps. These products are currently being used in a variety of
Table of Contents
applications from Carrier Long-haullong-haul and metro networks to Enterprise Gigabit Ethernet and 10-Gigabit10 Gigabit Ethernet networks including Storagestorage networks and systems. WeThe Company also developdevelops products for application in Passive Optical Networks ("PON") that enable Fiber-to-the-Home ("FTTH") deployments. Typically, we sellthe Company sells these products to optical module manufacturers who service the equipment manufacturers, or directly to OEMs who build discrete board-based solutions.
The Physical Layer Device ("PHY")A PHY converts high-speed analog signals from the PMD to low-speed digital signals. It includes the high-speed analog functions of clocksignals in fiber optic, copper cable, and data recovery ("CDR"), multiplexing ("MUX"), and demultiplexing ("DMUX").backplane applications. The CDR recovers the clock and retimes the signal to synchronize it with the overall system clock, while the MUX/DMUX converts low-speed parallel data into higher speed serial data and vice versa. We haveCompany has incorporated many industry leadingindustry-leading features into theseits PHY products such as VScope™, an integrated equalization waveform viewing VScope™technology and FlexEQ™, an adaptive equalization and EDC.Electronic Dispersion Compensation technology. These technologies dramatically improve signal integrity transmission and reception for applications at 6 Gbps and above, particularly for protocols such as 10 Gbps Ethernet and 8 Gbps Fibre Channel systems. We develop ourabove. The Company develops its products in low-cost CMOS and high-performance Silicon Germanium ("SiGe") silicon process technologies depending on the technology requirements of the product and application. We offerThe Company offers a broad line of PHY products for the SONET/SDH, Fibre Channel, and Ethernet markets at speeds ranging from 155 Mbps to 12.514 Gbps.
Other signal integrity products include Crosspoint Switches, Repeaters and Retimer Signal Conditioners and Backplane Transceivers with integrated signal equalization and pre-emphasis technology that enable the reception and transmission of high-speed signals across system backplanes, long traces of printed circuit boards, and through copper cables at speeds from 155 Mbps up to 11 Gbps. Once a niche technology for very high-speed switching systems, these products are becoming more main-stream as systems continue to increase in speed and density. They now have very broad applications across systems in Carrier and Enterprise Networking as well as Storage and high-definition television ("HDTV") applications.
Our Crosspoint SwitchThe Company's crosspoint switch family provides asynchronous, unblocked switching matrices from 4x4 to 144x144 matrices with industry-leading performance up to 11 Gbps. This range of speeds and package form factors enable a wide variety of solutions for SONET/SDH switching, blade servers and Gigabit Ethernet, Fibre Channels,data center switches, high-density routers, switching, and HDTV video equipment. Once a niche technology for very high-speed switching systems, crosspoint switches are becoming more main stream as systems continue to increase in speed and density. Crosspoint switches now have very broad applications across systems in Carrier and Enterprise Networking as well as storage and HDTV applications.
Our RepeaterThe Company provides a broad portfolio of devices for generic signal integrity applications. These devices include repeater and Retimer Signal Conditionerre-timer ICs that support data rates from 155 Mbps to 11.314 Gbps for applications,protocols, including SONET/SDH, Gigabit Ethernet, Fibre Channel, and Fast Ethernet, with per IC channel counts ranging from two to 12.
Our Backplane Transceivers with integrated signal processing and transcoding provide transmission of 5 Gbps to 11 Gbps signals. We provide SerDes with support for dual XGMII to dual XAUI, or single XGMII to dual (redundant) XAUI with working and protection channels.
Our Signal Integrity PHY and PMDEthernet. The Company's products provide leading-edge performance and low-power features for 10 Gbps applications such as the emerging SFP+ 10G pluggable transceiver industry standard, as well as superior signal integrity features including EDC that allow propagation over longer distancesare deployed in multi-mode and single-mode fiber applications, copper cabling, as well as new and legacy backplanes. Our Crosspoints, Repeater/Retimers, and Signal Conditioners provide best-in-class signal
Table of Contents
integrity improvements for a wide variety of applicationssystems in Carrier, Enterprise, data center, and high-definition video applications, both within systems as well as connecting between them.systems.
In 2010, the Company achieved its goal of introducing 30 new products:
Carrier Ethernet Switch Engines and MACs for Carrier metro aggregation, wired and wireless access, and wireless backhaul applications:
- •
- Jaguar Switch Engine Family: VSC7460/7462/7464/7466. This completely new high-density switch engine architecture brings full Carrier Ethernet features such as network timing, management and trafficking traditionally used in older circuit-based TDM telecom networks to modern packet-based Ethernet networks.
- •
- Caracal Switch Engine Family: VSC7428/7429. A smaller, more compact version of the Jaguar Carrier Ethernet Switch family, this family offers the highest level of switch integration in the industry. The same rich Carrier Ethernet feature set is targeted for smaller, more cost conscious equipment such as mobile backhaul, access routers and PON which need migration paths from legacy T1/E1 PDH protocols to packet-based protocols of emerging 3G and 4G wireless networks.
Enterprise Ethernet Switches for SME/SMB network applications:
- •
- SparX-III Switch Engine Family: VSC7420/7421/7422/7424/7425/7426/7427. This new Layer 2 Enterprise switch engine architecture provides the industry's only 2-chip implementation of a 25-port Gigabit Ethernet switch. It includes Vitesse's EcoEthernet™ 2.0 power management architecture for green energy efficiency to meet IEEE802.3az standards. Its low latency
Table of Contents
EcoEthernet™ 2.0 Energy Efficient Ethernet (EEE) Optical and Copper PHYs:
- •
- SimpliPHY Transceivers: VSC851/VSC86622. The Company again set the standard for technology in Gigabit Ethernet Copper PHYs with the introduction of the industry's first and only 12-port device. The newest members of this family offer unprecedented energy efficiency via the Company's unique EcoEthernet™ 2.0 power management architecture. Breakthrough power dissipation of 370 mW per port for 1000 Base-T copper and 150mW per port for fiber are achieved through the use such features as ActiPHY™, automatic link power down, and PerfectReach™, intelligent cable algorithm. These PHYs also meet IEEE802.3az specification for EEE idle power savings.
- •
- High-density, high-speed PHYs for 10G/40G/100G backplane, line card, optical fiber and copper cable: VSC8486/VSC8238/VSC8247/VSC8248/VSC8484/VSC8488/VSC711. A complete family of single, dual, and quad channel transceivers and CDRs for 10 Gigabit Ethernet and above applications in SONET, Ethernet, and Fiber Channel systems. All include advanced signal integrity technologies such as VScope and FlexEQ.
- •
- High-speed, high-port count crosspoint switches with advanced FlexEQ technology: VSC3340/VSC3340-31/VSC3316/VSC3308/VSC3144-11. These products add to a versatile product portfolio for high-performance switching applications. These products scale up to 144 ports with speeds up to 11Gbps.
Intellectual Property ("IP") Licensing
In 2008, wethe Company began to leverage ourits substantial IP portfolio by entering into licensing opportunitieslicenses with third parties. We offerThe Company offers a variety of IPtechnology "cores" for license and design services in deep submicron, 130 nano-meter130-nanometer ("nm") and 65 nm,65-nm and 40-nm process technologies. To date, ourthe Company's primary focus has been ourits Gigabit Ethernet Coppercopper PHY and switch technologies as well as high-speed PHYscores. In 2010 the Company announced the availability of licenses for its enhanced forward error correction ("eFEC") technology for implementation in ASICs, Systems-On-a-Chip ("SOCs") and signal integrity "cores."Field Programmable Gate Arrays ("FPGAs".)
We anticipateThe Company anticipates being able to exploit ourits many years of technology development, as well as its track record of high-quality products, by providinglicensing this technology to systems suppliers and other non-competing semiconductor suppliers in the form of intellectual property via licensing arrangements. We believe we aresuppliers. The Company believes it is in a unique position to supply such IPtechnology to other IC vendors as we are either the technology orCompany is an innovation and low-power leader for such IP, or such IPthis technology. Such technology is only available from IC vendors that are competing in the same markets as the companies looking for such IP. As a smaller, more focusedthe technology. In many cases the Company can also leverage these IP partnerships towards accelerating its own product developments and specialized IC vendor, we are less likely to compete with those companies.its process node roadmaps.
Customers
We marketThe Company markets and sell oursells its semiconductor products directly to leading OEMs and original design manufacturers, ("ODMs") as well as through third-party electronic component distributors and manufacturing service providers. Sales to distributors accounted for approximately 63.0%50.4%, 76.0%63.0%, and 78.0%76.0% of ourthe Company's net revenues for fiscal years 2010, 2009, 2008, and 2007,2008, respectively. For fiscal 2009, distributorsyear 2010, distributor Nu Horizons Electronics Corp. (including its subsidiary, Titan Supply Chain Services), Weikeng Industrial Co. Ltd. and direct customer Huawei Technologies Co.accounted for 23.9% and 13.3%, Ltd.respectively, of the Company's net revenues. For fiscal year 2009, Nu Horizons Electronics and Huawei Technologies accounted for 36.0%, 7.5%, and 12.0%, respectively, of ourthe Company's net revenues. For fiscal year 2008, distributors Nu Horizons
Table of Contents
Electronics Corp. (including its subsidiary Titan Supply Chain Services), Weikeng Industrial Co. Ltd. and direct customer IBM accounted for 48.8%, 9.2% and 11.3%, respectively, of our net revenues. For fiscal 2007, distributors Nu Horizons Electronics, Corp. (including its subsidiary Titan Supply Chain Services), Weikeng Industrial Co. Ltd. and direct customer IBM accounted for 50.1%, 7.1% and 11.0%, respectively, of ourthe Company's net revenues.
OurThe Company's top OEM customers for fiscal yearyears 2010, 2009 and 2008 were Alcatel-Lucent, IBM, HP,Cisco, Huawei Technologies, Co., Ltd.,Nokia Siemens, and ZTE Corporation. OurZTE. The Company's sales to these customers accounted for a total of approximately 32.4%, 37.5%, and 34.4% of ourthe Company's fiscal year 2010, 2009 and 2008 net revenues, respectively. Our top five OEM customers for fiscal year 2007 were EMC Corporation, IBM, HP, Huawei Technologies Co., Ltd., and ZTE Corporation. They accounted for approximately 31.0% of our net revenues for fiscal 2007.
OurThe Company's customer base is widely dispersed geographically. Sales to customers located outside the United StatesNorth America have historically accounted for a significant percentage of ourthe Company's revenue. We anticipateThe Company anticipates that such sales will continue to be a significant percentage of ourthe Company's revenue. International sales constituted 59%60%, 59% and 49% and 48% of ourthe Company's net revenue in fiscal years 2010, 2009 2008 and 2007,2008, respectively. Note 10—8—Significant Customers, Concentration of Credit Risk, Segment Reporting, and Geographic Information in the accompanying financial statements provides more specific data on revenue by geographic area.
Future sales of ourthe Company's technology products will be based on, among other elements, continued expansion of ourthe Company's product line, the acceptance of ourthe Company's products, ourthe Company's customer service levels, expansion into additional domestic and international markets, and ourthe Company's ability to maintain a competitive position against other technology providers who are producing similar products.
Table of Contents
Manufacturing and Operations
Wafer Fabrication
OurThe Company's products make use of the state-of-the-art CMOS semiconductor technology with feature sizes down to 65 nmnanometer as well as other semiconductor technologies such as SiGe. As a fabless semiconductor company,Company, wafer fabrication for ourthe Company's products is outsourced to third-party silicon wafer foundries such as Taiwan Semiconductor Manufacturing Corporation ("TSMC"), Chartered Semiconductor Manufacturing,Global Foundries, IBM, LSI Logic and United Microelectronics Corporation. Outsourcing ourthe Company's wafer manufacturing requirements enables usthe Company to eliminate the high costs of owning, operating, and upgrading fabrication facilities, and focuses ourthe Company's resources on design and test applications where we believe we haveit believes it has greater competitive advantages.
Limitation of any of our five independent foundry subcontractors to provide the necessary capacity or output for our products could result in significant production delays and could materially and adversely affect our business, financial condition, and results of operations. While we currently believe we have adequate capacity to support our current sales levels, we continue to work with our existing foundries to obtain more production capacity, and we intend to qualify new foundries to provide additional production capacity if required. It is possible that from time-to-time adequate foundry capacity may not be available on acceptable terms, if at all. In the event a foundry experiences financial difficulties or suffers any damage to or destruction of its facilities, or in the event of any other disruption of foundry capacity, we may not be able to qualify alternative manufacturing sources for existing or new products in a timely manner.
Through fiscal 2007, we manufactured a portion of our IC products, including Gallium Arsenide ("GaAs") and Indium Phosphide ("InP") products, at our fabrication ("fab") operations in Camarillo, California. At the end of September 2007, we closed our Camarillo fab operations and ceased manufacturing products with our GaAs process technology. The severance and related costs associated with the fab closure was approximately $0.5 million. These costs were captured as part of research and development ("R&D") in the income statement at September 30, 2007. The fab assets with a zero book value at September 30, 2007, were ultimately sold for $2.5 million in February 2008.
Because wafer fabrication for a great majority of our products is outsourced, we depend on third-party wafer foundries to allocate a portion of their manufacturing capacity sufficient to meet our needs and to produce products of acceptable quality in a timely manner. There are significant risks associated with our reliance on third-party wafer foundries, including:
•The lack of assured wafer supply and the potential for wafer shortages;
•Limited control over delivery schedules, manufacturing yields, production costs, and product quality; and
•Unavailability of or delays in obtaining, access to key fabrication process technologies.
These and other risks associated with our reliance on third-party wafer foundries could materially and adversely affect our business, financial condition, and results of operations. For example, the third-party foundries that manufacture our wafers have, from time-to-time, experienced manufacturing defects and reductions in manufacturing yields. In addition, disruptions and shortages in wafer foundry capacity may impair our ability to meet our customers' needs and negatively impact our operating results. Our third-party wafer foundries fabricate products for other companies and, in certain cases, manufacture products of their own design. Historically, there have been periods in which there has been a worldwide shortage of foundry capacity for the production of high-performance ICs such as ours. We do not have long-term agreements with any of our third-party foundries, but, instead, subcontract our manufacturing requirements on a purchase order basis. As a result, although we believe that we currently have access to adequate foundry capacity to support our sales levels, it is
Table of Contents
possible that the capacity we will need in the future may not be available to us on acceptable terms, if at all.
Probe, Assembly and Final Test
CompletedOnce manufactured by the Company's wafer foundries, completed wafers are "probed" to determine which of the die on the wafer meet functional and performance specifications. This step in the manufacturing process determines the "yield" of good die per wafer for wafer probe. We supportversus the majorityscrap of our products from our in-house probe and test facility in Camarillo, California. We outsource some of our higher volume products. In most cases where we outsource, we maintain the capability to probe and test these wafers at our own facilities. We, and our subcontractors, utilize advanced automated testers as well as high-performance bench test equipment.non-functioning die.
ProbedGood probed die are "assembled" into packages. We outsource ourThe Company outsources its IC packaging to multiple assembly subcontractors in Asia and the United States. Following assembly, the packaged products are returned to us for final testing prior to shipment to customers.
Following assembly, packaged products go through "final test"testing" where they are tested in packaged form to ensure that they meet all functional, performance, and quality requirements. This step in the process determines the "final yield" thatand will include any yield loss in the assembly process. For final test, we support
In 2010, the Company transitioned the majority of ourits probe and final testing facility from its internal operations in California to an outsource model with an offshore manufacturer. Today, the Company outsources the majority of its probe and test functions. The Company outsourced its test operations to reduce its manufacturing cycle times to better address customer requirements, to increase inventory turns, and to reduce its overall fixed cost of probe and testing. In most cases, the Company maintains the capability to probe and test products from our in-housein small volumes at its own facilities. The Company, and its subcontractors, utilize advanced automated testers as well as high-performance bench test facility in Camarillo, California.equipment.
Table of Contents
As with wafer fabrication, worldwide assembly and test capacity is limited and we arethe Company is dependent on ourits suppliers to provide enough capacity in the correct mix to address all of ourits requirements. WeThe master service agreements with the Company's assembly subcontractors have provisions requiring them to maintain inventory stocks based on forecast, but do not have long-term agreements withinclude any of our assembly or test subcontractors, but instead we subcontract our manufacturing requirements on a purchase order basis.guaranteed capacity agreement clauses. As a result, it is possible that the capacity wethe Company will need in the future may not be available to us on acceptable terms, if at all, and wethe Company could experience shortages or assembly problems in the future. As part of the Company's test outsourcing agreement, Vitesse consigned testing equipment to its test subcontractor. The availability of assembly and test services from these subcontractors could be materially and adversely affected in the event a subcontractor experiences financial difficulties or suffers any damage to its facilities.
In 2009, we began the process of preparing to move a substantial amount of our probe and test facility to an offshore subcontractor. We are doing this to reduce our manufacturing cycle times to better address customer requirements, to increase inventory turns, and to reduce our overall fixed cost of probe and test. We expect to be able to transition to an outsourced model over a nine month period and complete this transition by the end of fiscal 2010.
Many of ourthe Company's products have very long life cycles, often exceeding 10ten years or more. These life cycles may be longer than what is typically supported by wafer and/or assembly manufacturers. Accordingly, we arethe Company is sometimes subjected to End-of-Life ("EOL") notices on certain material and/or products provided by these subcontract manufacturers. This long life cycle may impact ourthe Company's ability to continue to support certain products, forcing usthe Company to EOL ourits products if weit cannot obtain a replacement source of material. This ability to obtain source materials may impact revenue and/or require usthe Company to incur additional costs to provideobtain alternative sources for these materials.
Engineering, Research and Development
The market for ourthe Company's products is characterized by continually evolving industry standards, rapid advancements in process technologies, and increasing levels of functional integration. We believeThe Company believes that ourits future success will depend largely on ourits ability to continue to improve ourits products and ourits process technologies, to develop new technologies, and to adopt emerging industry standards. OurThe Company's product development efforts are focused on designing new products for the high-performance communications infrastructure markets, based on understanding the evolving needs of ourits customers. We haveThe Company has a dedicated team of engineers who follow industry standards development, technology
Table of Contents
changes, and the product directions of ourits customers in an effort to provide forward-looking guidance to the development teams in the form of a "Product Roadmap." We workThe Company works closely with ourits customers to co-specify and/or co-develop products. We referThe Company refers to these early adoption customers as "alpha-site customers." Occasionally, ourthe Company's relationships with ourits alpha-site customers will involve non-recurring development charges or commitments to purchase products. OurThe Company's customers had no long-term purchase agreements with us atthe Company as of September 30, 2010, 2009 and 2008.
We areThe Company is expending considerable design efforts to increase the speed and complexity and to reduce the power dissipation of ourits products and to create new, value-added functionality. We have,The Company has, and will continue to develop, common IP cores and standard blocks that can be reused in multiple products, thereby reducing design cycle time and increasing first-time design correctness.
We haveThe Company has significant research, engineering, and product development resources located in four design centers in the United States, combined with four international design centers in Asia and Europe. To continue to improve the cost efficiency of ourthe Company's development organization, we havethe Company has expanded ourits capabilities in low-cost regions such as Taiwan and India. Many of ourthe Company's design centers are located in areas of strong technical talent pools and/or in areas where there are strong concentrations of ourits customers.
OurThe Company's engineering, research and development expenses in fiscal years 2010, 2009, and 2008 and 2007 were $51.1 million, $45.7 million and $50.0 million, respectively. The Company has continued to invest a substantial portion of its revenue in research and $47.2 million, respectively.development. The Company has increased the percentage of its staff involved in R&D from 37% in 2008 to 42% in 2009 to 47% in 2010.
Table of Contents
Competition
The markets for ourthe Company's products are highly competitive and subject to rapid technological advancement in design technology, wafer manufacturing techniques, and alternatealternative networking technologies. WeThe Company must identify and capture future market opportunities by developing and deploying value-added products to offset the rapid price erosion that characterizes ourits industry.
WeThe Company typically facefaces competition at the "designdesign stage," where customers evaluate alternative design approaches in the development of their systems. OurThe Company's customers typically evaluate ourthe Company's products along with ourthe Company's competition and make a selection based on a variety of factors including features, functionality, availability, and pricing. TheyThe Company's customers then "design-in""design in" the product by developing their system in conjunction with the various components. TheyThe Company's customers invest substantial resources in systems, hardware, and software designs that, in many cases, are dependent on the ICs that they have selected. We useThe Company uses the term "design win" to classify a design where we havethe Company has strong indication from the customer that they have selected ourthe Company's device in preference to ourthe Company's competitor. In many cases, when the complex hardware and software is developed to be dependent on ourthe Company's IC, we are "single-sourced,"the Company is single sourced, that is, we arethe Company is the only supplier selected for the available opportunity. Once we have "won"the Company wins a single-sourcedsingle sourced design it is often difficult for ourits competitors to replace usthe Company until the next "designdesign stage." Because of shortened product life and design-in cycles in many of our customers' products, particularly in low-end Enterprise applications, our competitors have increasingly frequent opportunities to supplant our products in next-generation systems.
Competition is particularly strong in the market for communications ICs, in part due to the market's historical growth rate, which attracts larger competitors, and in part due to the number of smaller companies focused on this area. Larger competitors in ourthe Company's market have acquired both mature and early-stageearly stage companies with advanced technologies. These acquisitions could enhance the ability of larger competitors to obtain new business that wethe Company may have otherwise won.
Table of Contents
In the Communications Networkingcommunications networking market, which includes ourthe Company's Carrier and Enterprise Networking markets, ourthe Company's competitors include Applied Micro Circuits, Corporation, Broadcom, Corporation, EZChip Semiconductor, Inc., Gennum, Corporation, LSI, Corporation, Marvell Technology Group, Ltd., Maxim Integrated Products, Inc., Mindspeed Technologies, Inc., PMC-Sierra, Inc., and TranSwitch Corporation.TranSwitch. In the Signal Integritysignal integrity market, ourthe Company's competitors include Gennum, Corporation, National Semiconductor Corporation, Mindspeed Technologies, Inc., Maxim Integrated Products, Inc.,National Semiconductor, Netlogic, Inc. and PMC-Sierra, Inc.PMC-Sierra. Over the next few years, we expectthe Company expects additional competitors, some of whom may have greater financial and other resources than the Company has, to enter the market with new products. In addition, we arethe Company is aware of smaller, privately-heldprivately held companies that focus on specific portions of oursubsets within the Company's range of products. These companies, individually and collectively, represent future competition for design wins and subsequent product sales.
Sales and Customer Support
We haveThe Company has worldwide sales, marketing, and application support organizations. OurThe Company's direct sales force is responsible for servicing ourits Tier 1 and Tier 2 customer requirements. We relyThe Company relies on distributors to service ourthe Company's Tier 3 customers and for order fulfillment for some Tier 1 and Tier 2 customers. Because of the significant engineering support required in connection with the sale of high-performance ICs, we provide ourthe Company provides its customers with both field engineering and application engineering support prior to the sale. These sales support services, which are provided by ourthe Company's field engineering and application engineering personnel, are utilized in the sales process in order to educate customers, and develop and close sales. OurThe Company's sales cycle is typically lengthy, often six to 12 months or more, and requires the continued participation of salespeople, field engineers, application engineers, and senior management.
Table of Contents
The steps in the typical sales cycle of Vitesse's product are as follows:
Prior to the Sale of Product
- •
- Vitesse field applications engineers work with the customer in order to design Vitesse products into their systems.
- •
- Applicable Vitesse product capabilities and performance are demonstrated to the customer via evaluation boards and/or evaluation systems.
- •
- Product samples are provided to the customer and the Vitesse field applications engineers assist in bringing the product to a working level in the customer's lab.
Prior to the Order Being Placed
- •
- Extensive testing is performed in the customer's lab to determine the viability and performance of the Vitesse product in addressing the customer's needs.
Once the order is placed, the customer is provided a standard product warranty, and no further sales support services are provided. The Company will generally warrant the Company's products against defects in materials and workmanship for a period of one year.
OurThe Company's sales headquarters isare located in Camarillo, California. We haveThe Company has additional sales and field application support offices in the United States, Canada, China, Europe, Japan, India, and Taiwan.
We generally warrant our products against defects in materials and workmanship for a minimum period of one year.
Information regarding financial data by geographic segment is set forth in Part II, Item 8 of this Form 10-K and in Note 10—8—Significant Customers, Concentration of Credit Risk, Segment Reporting, and Geographic Information in the accompanying financial statements.
Table of Contents
Intellectual Property
We relyThe Company relies on a combination of patent, copyright, trademark, and trade secret protections, as well as confidentiality agreements and other methods, to protect ourits proprietary technologies and processes. For example, we enterthe Company enters into confidentiality agreements with ourits employees, consultants, and business partners, and controlcontrols access to and distribution of ourits proprietary information. As of September 30, 2009, we2010, the Company had 8789 U.S. patents, 1520 foreign patents, and 2718 patent applications pending in the U.S. We areThe Company is preparing to file several moreadditional patent applications.
The semiconductor industry is characterized by vigorous pursuit and protection of intellectual property rights. As is common in the industry, from time-to-time third-parties have asserted patent, copyright, trademark, and other intellectual property rights to technologies that are important to our business and have demanded that we license their patents and technology. To date, none of these claims have resulted in the commencement of any litigation against us, nor have we believed that it was necessary to license any of the rights referred to in such claims. We expect, however, that we will continue to receive such claims in the future, and any litigation to determine their validity, regardless of their merit or resolution, could be costly and divert the efforts and attention of our management and technical personnel. We cannot assure you that we would prevail in such disputes given the complex technical issues and inherent uncertainties in intellectual property litigation. If such litigation were to result in an adverse ruling, we could be required to:
•Pay substantial damages;
•Discontinue the use of infringing technology, which includes ceasing the manufacture, use, or sale of infringing products;
•Expend significant resources to develop non-infringing technology; and
•License technology, if available, from the party claiming infringement.
Cyclicality
The semiconductor industry is highly cyclical and is characterized by constant and rapid technological change, rapid product obsolescence, price erosion, evolving technical standards, short product life cycles, and wide fluctuations in product supply and demand. From time-to-time, theseThese factors and other factors,others, together with changes in general economic conditions, cause significant upturns and downturns in the industry and within ourthe Company's business.
In addition, ourthe Company's operating results are subject to substantial quarterly and annual fluctuations due to a number of factors, such as demand for network infrastructure equipment, the timing of receipts,receipt, reduction or cancellation of significant orders, fluctuations in the levels of component inventories held by ourthe Company's customers and channel partners, the gain or loss of significant customers, market acceptance of ourthe Company's products and ourthe Company's customers' products, ourthe Company's ability to develop, introduce, and market new products and technologies on a timely basis, the availability and cost of products from ourthe Company's suppliers, new product and technology introductions by competitors, intellectual property disputes, and the timing and extent of product development costs.
Table of Contents
Backlog
OurThe Company's sales are made primarily pursuant to standard purchase orders for delivery of products. Quantities of ourthe Company's products to be delivered and delivery schedules are frequently revised to reflect changes in customer needs. For these reasons, ourthe Company's backlog, as of any particular date, is not necessarily representative of actual sales for any succeeding period. We,The Company, therefore, dodoes not believe that backlog alone is a reliable indicator of future revenue levels.
Table The Company's accounting policy uses the "sell-through" model. The "sell-through" model recognizes revenue only upon shipment of Contentsthe merchandise from its distributor to the final customer. Because the Company uses the "sell-through" methodology it may have variability in its revenue from quarter to quarter as customers have substantial flexibility to reschedule backlog with most of the Company's channel partners as part of the terms and conditions of sale.
Environmental Management
We monitorThe Company monitors the environmental impact of ourits products. Due to environmental concerns, the need for lead-free solutions in electronic components and systems is receiving increasing attention within the semiconductor industry and many companies are moving toward becoming compliant with the Restriction of Hazardous Substances Directive ("RoHS"), the European legislation that restricts the use of a number of substances, including lead, effective July 2006. We believeThe Company believes that ourits products are compliant with the RoHS directive. Additionally, some of ourthe Company's subcontractors may be required to register processing materials as required by the Registration, Evaluation, Authorization and Restriction of Chemicals ("REACH") European Union Regulation, EC/2006/1907. There are other international environmental directives, regulations, and initiatives that are currently evolving in the electronicelectronics industry, such as the halogen-free initiative, which may also impact material suppliers and processing subcontractors. We believe ourThe Company believes its parts will be compliant and that materials will be available to meet these emerging regulations. However, it is possible that unanticipated supply shortages or delays may occur as a result of these environmental factors.
Employees
As of September 30, 2009, weNovember 15, 2010, the Company had 476467 employees, including 238219 in engineering and R&D, with the balance of employees, listed in population size order, in operations, marketing and sales, and finance and administration. OurThe Company's ability to attract and retain qualified personnel is essential to ourits continued success. None of ourthe Company's employees areis represented by a collective bargaining agreement, nor have wehas it ever experienced a work stoppage. We believe ourThe Company believes its employee relations are good.
Available Information
We file The Company files annual, quarterly, and special reports, as well as proxy statements and other information, with the SEC. Any document that we filethe Company files with the SEC may be read or copied at the SEC's public reference room at 100 F Street, N.E., Washington, D.C. 20549. Please call the SEC at 1-800-SEC-0330 for information on the public reference room. OurThe Company's SEC filings are also available at the SEC's website athttp://www.sec.gov, and through ourits website, free of charge, athttp://www.vitesse.com. www.vitesse.com. The information on ourthe Company's website is not incorporated by reference into and is not made a part of this report.
We, through our Board of Directors, have adopted a Code of Ethics and Business Conduct ("the Code") designed to reflect requirements of the Sarbanes-Oxley Act of 2002 and other applicable laws, rules and regulations. The Code applies to all of the Company's directors, officers and employees. We have also adopted a Code of Business Conduct and Ethics for Members of the Board of Directors and a Code of Ethics for the CEO and Senior Financial Officers (hereinafter collectively "the Codes"). Any amendments to the Codes will be posted promptly on our website.
We, through our Board of Directors, also have adopted Corporate Governance Guidelines ("the Guidelines"). The Guidelines set forth the responsibilities and standards under which the major Board committees and management shall function. The Codes, the Guidelines, and the charters of the Audit, Nominating and Corporate Governance, and Compensation committees are posted on the Investors' section of our website under "Corporate Governance" and are available free of charge by calling us at (800) 848-3773 or (805) 388-3700 or by writing to:
Vitesse Semiconductor Corporation
Attn: Corporate Secretary
741 Calle Plano
Camarillo, CA 93012
Table of Contents
ITEM 1A. RISK FACTORS
You should carefully consider the risks described below before investing in ourthe Company's securities. We haveThe Company has organized ourits risks into the following categories:
- •
- Risks Relating to
Our Liquidity, Financing Arrangements, and Capital Commitments;
•Risks Relating to OurThe Company's Business; and
- •
- Risks Relating to
our Current and Prior Financial Statements and Related Matters.an Investment in the Company.
Risks Relating to Our Liquidity and Financing Arrangements
We could incur significant interest penalties and cash demands associated with our 8.0% Convertible Second Lien Debentures Due 2014 which could cause us to file for bankruptcy if our shareholders do not approve an increase in our authorized shares.
On October 30, 2009, we closed a debt restructuring transaction with our major creditors pursuant to which we issued approximately $50.0 million of new 8.0% Convertible Second Lien Debentures Due 2014 (the "2014 Notes"). The 2014 Notes are convertible into shares of common stock at a conversion price of $0.225 per share (equivalent to an initial conversion price of approximately 4,444 shares per $1,000 principal amount of 2014 Notes), subject to customary adjustments. Full conversion of the currently outstanding principal amount of the 2014 Notes would result in the issuance of approximately 222.2 million shares of common Stock. We currently do not have sufficient authorized shares to permit full conversion of the 2014 Notes. The holders of the 2014 Notes have the right to receive additional shares of common stock upon conversion in connection with certain change of control events, depending upon the timing of the change of control event and the trading price of our common stock at the time of such change of control event. The maximum number of additional shares of common stock issuable upon conversion following a change of control event would be approximately 125 million shares if the change of control event occurred on or about November 15, 2009 and our common stock price was $0.16 per share. We will be holding a special meeting of our shareholder on January 7, 2010 to approve an amendment to our certificate of incorporation to increase the number of authorized shares of common stock to permit the conversion of the 2014 Notes and to provide additional shares of common stock for general corporate purposes. Under the terms of the indenture governing the 2014 Notes, if we do not receive shareholder approval of an increase in our authorized shares of common stock on or prior to February 15, 2010, we will be obligated to pay $500,000 per month in additional interest until stockholder approval of this increase is obtained. If we are obligated to pay this additional interest, it will have a significant negative impact on our cash position and our results of operations. In addition, if we are unable to obtain this stockholder approval prior to February 15, 2011, the holders of the 2014 Notes will have the right to convert the 2014 Notes into cash. Should the holder(s) require the Company to repurchase the securities for cash, the repurchase price would be equal to (i) the as-converted amount of the shares that would have been issued to the holder had the increase in authorized shares occurred and the holder(s) had exercised its conversion option plus (ii) the Make-Whole Amount that would have been applicable if the holder(s) had exercised its conversion right or assuming the repurchase of all of the 2014 Notes, $58.0 million. We do not believe that we will have sufficient cash by February 15, 2011 to permit a cash conversion of the 2014 Notes. If we have insufficient cash to convert all of 2014 Notes submitted for conversion, we would be in default under the terms of the 2014 Notes, which would give the holders the of the 2014 the rights to accelerate the maturity of the Notes and could jeopardize our ability to continue as a going concern.
Table of Contents
Our shareholders holding shares purchased prior to October 30, 2009 will experience significant dilution in connection with the conversion of our Series B Preferred Stock and our 8.0% Convertible Second Lien Debentures Due 2014.
We currently have approximately 403.0 million shares of common stock outstanding. In connection with the October 30, 2009 debt restructuring transaction we issued approximately 771,000 shares of our Series B Preferred Stock that are convertible into an aggregate of approximately 77.1 million shares of our common stock. In addition, full conversion of the currently outstanding principal amount of the 2014 Notes would result in the issuance of approximately 222.2 million shares of common stock. The holders of the 2014 Notes have the right to receive a maximum of approximately 125 million additional shares of common stock upon conversion in connection with certain change of control events, depending upon the timing of the change of control event and the trading price of our common stock at the time of such change of control event. The conversion of our shares of Series B Preferred Stock and the conversion of our 2014 Notes could have a significant dilutive impact on the ownership rights of our shareholders.
Risks Relating to OurCompany's Business
We haveThe Company has experienced losses from operations and we anticipateit anticipates future losses from operations.
For the twelve monthsyear ended September 30, 2009,2010, the Company had a net loss of $194.0$20.1 million, primarily due to an impairment charge to fully write offinterest expense and a goodwill balanceloss on extinguishment of $191.4 million.debt. There can be no assurance that wethe Company will not have operating losses in future periods. Due to general economic conditions and slowdowns in purchases of networking equipment, it has become increasinglycontinues to be difficult for usthe Company to predict the purchasing activities of ourthe Company's customers. We expectThe Company expects that ourits operating results will fluctuate substantially in the future; we anticipatefuture and the Company anticipates future losses from operations. Future fluctuations in operating results may also be caused by a number of factors, many of which are outside our control. Additional factors that could affect our future operating results includethe Company's control, including, but not limited to, the following:
- •
Thethe loss of major customers;
- •
Variations, delaystiming, scheduling or cancellationscancellation of significant customer orders and shipments of our products;shipments;
- •
Increasedincreased competition from current and future competitors;
- •
Reductionsreductions in the selling prices of ourthe Company's products;
- •
Significantsignificant changes in the type and mix of products being sold;
- •
Delaysdelays in introducing new products;
- •
Designdesign changes made by ourthe Company's customers;
- •
Failurefailure by third-party foundries and other subcontractors to manufacture and ship products on time;
- •
Changeschanges in third-party foundries' and other subcontractors' manufacturing capacity, utilization of their capacity and manufacturing yields;
- •
Variationsvariations in product development costs;
- •
Changeschanges in ourthe Company's or ourthe Company's customers' inventory levels;
•Expenses or operational disruptions resulting from acquisitions; and
- •
Salessales or closures of discontinued operations.
In order to achieve and sustain profitability, wethe Company must achieve a combination of substantial revenue growth and/or a reduction in operating expenses.
If the Company is unable to accurately predict its future sales and to appropriately budget for its expenses, its operating results could be materially and adversely affected.
The rapidly changing natures of the markets in which the Company sells its products limit its ability to accurately forecast quarterly and annual sales. The Company's sales cycle is often lengthy, particularly for larger transactions. As a result, the Company devotes substantial time and effort and incurs significant upfront expense in its sales efforts without any assurance that its efforts will result in a customer purchase. Therefore, it often is difficult to predict when, or even if, the Company will make a sale with a potential customer. Additionally, the Company makes investment decisions and budgets its
Table of Contents
If we are unable to accurately predict our futureexpense levels based primarily on sales and to appropriately budget for our expenses, our operating results could suffer.
The rapidly changing natureforecasts. Because a substantial portion of the markets in which we sell our products limit our ability to accurately forecast quarterly and annual sales. Additionally, because many of ourCompany's expenses are fixed in the short-termshort term or are incurred in advance of anticipated sales, wethe Company may not be able to decrease ourits expenses in a timely manner to offset any shortfall of sales. The Company's operating results will be adversely affected if revenues fall below its expectations in a particular quarter, which could cause the price of its common stock to decline significantly.
OurThe Company's quarterly revenues and operating results have fluctuated in the past and may fluctuate and be difficult to predict in the future, and such fluctuations could adversely affect its stock price.
The Company's quarterly revenues and operating results have fluctuated significantly in the past and the Company believes they may continue to do so. As a result, you should not rely on the results of any one quarter or fiscal period as an indication of future performance and period-to-period comparisons of the Company's revenues and operating results may not be meaningful.
Fluctuations in the Company's quarterly operating results could result in decreases in its stock price. The Company's quarterly operating results may fluctuate as a result of a variety of factors, including, among others, those described elsewhere in this section and those listed below, many of which are outside of the Company's control.
- •
- fluctuations in demand for network infrastructure equipment;
- •
- the timing of receipt, reduction or cancellation of significant orders;
- •
- fluctuations in the levels of component inventories held by the Company's customers and channel partners;
- •
- the gain or loss of significant customers;
- •
- market acceptance of the Company's products and the Company's customers' products;
- •
- the Company's ability to develop, introduce and market new products and technologies on a timely basis;
- •
- the availability and cost of products from the Company's suppliers;
- •
- new product and technology introductions by competitors;
- •
- intellectual property disputes; and
- •
- the timing and extent of product development costs.
The Company's operating results may be adversely impacted by worldwide politicaleconomic conditions and economic uncertainties and specific conditions in the markets we address,it addresses, including the cyclical nature of and volatility in the semiconductor industry. As a result, the market price of ourthe Company's common stock may decline.
We operateThe Company operates primarily in the semiconductor industry, which is cyclical and subject to rapid change and evolving industry standards. From time to time, the semiconductor industry has experienced significant and extended downturns. These downturns are characterized by decreases in product demand, excess customer inventories, and accelerated erosion of prices. These factors could cause substantial fluctuations in our revenuethe Company's revenues and in ourits results of operations. Any downturns in the semiconductor industry may be severe and prolonged and any failure of the industry or wired and wireless communications markets to fully recover from downturns could seriously impact our revenuethe Company's revenues and harm ourits business, financial condition, and results of operations. The semiconductor industry also periodically experiences increased demand and production capacity constraints which may affect ourthe Company's ability to manufacture and ship products. Accordingly, ourthe Company's operating results may vary significantly as a result of the general conditions in the semiconductor industry, which could cause large fluctuations in ourits stock price.
Additionally, recently general worldwide economic conditions have experienced a significant downturn due to slower economic activity, an increase in bankruptcy filings, concerns about inflation and deflation, increased energy costs, decreased consumer confidence, reduced corporate profits and capital spending, adverse business conditions and liquidity concerns in the wired and wireless communications markets, recent international conflicts and terrorist and military activity, and the impactTable of natural disasters and public health emergencies. These conditions make it extremely difficult for our customers, our vendors and us to accurately forecast and plan future business activities, and they could cause U.S. and foreign businesses to slow spending on our products and services, which would delay and lengthen sales cycles. We cannot predict the timing, strength or duration of any slowdown or subsequent recovery in the worldwide economy, the semiconductor industry or the wired and wireless communications markets. If the economy or markets in which we operate do not return to historical levels, our business, financial condition and results of operations will likely be materially and adversely affected. Additionally, the combination of our lengthy sales cycle coupled with challenging macroeconomic conditions could have a negative impact on the results of our operations.Contents
The short life cycles of some of ourthe Company's products may leave usit with obsolete or excess inventories, which could have an adverse impact on ourits operating profit and net income.income results.
The life cycles of some of ourthe Company's products depend heavily upon the life cycles of the end products for which ourits products are designed. Products with short life cycles require usthe Company to manage production and inventory levels closely. We cannot assure you thatWrite-offs of obsolete or excess inventories which may resultresulting from unanticipated changes in the estimated total demand for ourthe Company's products and/or the estimated life cycles of the end products for which ourits products are designed will not result in significant charges that willmay negatively affect ourits operating profit and net income.income results.
Table of Contents
We haveThe Company has limited control over the indirect channels of distribution we utilize,the Company utilizes, which makes it difficult to accurately forecast orders and could result in the loss of certain sales opportunities.
OurA portion of the Company's sales is realized through independent resellers and distributors that are not under its control. These independent sales organizations generally represent product lines offered by several companies and thus could reduce their sales efforts applied to the Company's products or terminate their representation of the Company. The Company's revenues could be adversely affected if ourits relationships with resellers or distributors were to deteriorate or if the financial condition of theseone or more significant resellers or distributors were to decline.
In addition, as ourthe Company's business grows, there may be an increased reliance on indirect channels of distribution. There can be no assurance that wethe Company will be successful in maintaining or expanding these indirect channels of distribution. This uncertainty could result in the loss of certain sales opportunities. Furthermore, the reliance on indirect channels of distribution may reduce visibility with respect to future business, thereby, making it more difficult to accurately forecast orders.
The Company's accounting policy uses the "sell-through" model. The "sell-through" model recognizes revenue only upon shipment of the merchandise from its distributor to the final customer. Because the Company uses the "sell-through" methodology it may have variability in its revenue from quarter to quarter as customers have substantial flexibility to reschedule backlog with most of its channel partners as part of their terms and conditions of sale.
Order or shipment cancellations or deferrals could cause our revenue to decline or fluctuate.unplanned inventory growth resulting in excess inventory, which may adversely affect the Company's operating results.
We sell,The Company sells, and expectexpects to continue selling, a significant number of products pursuant to purchase orders that customers may cancel or defer on short notice without incurring a significant penalty. Cancellations or deferrals could cause us to hold excess inventory, which could adversely affect our results of operations. If a customer cancels or defers product shipments or refuses to accept shipped products, wethe Company may incur unanticipated reductions or delays in recognizing revenue. If a customer does not payrevenues and be required to hold excess inventory. Holding excess inventory could reduce the Company's profit margins by reducing sales prices or requiring inventory write-downs or write-offs for products in a timely manner, we could incur significant charges against income, which could materially and adversely affect our revenue and cash flows.excess or obsolete inventory.
OurThe Company's international sales and operations subject usit to risks that could adversely affect our revenueits revenues and operating results.
Sales to customers located outside North America account for a significant percentage of the U.S.Company's revenues. International sales constituted 60%, 59% and 49% of the Company's net revenue in fiscal year 2010, 2009 and 2008, respectively. Development and customer support operations located outside North America have historically accounted for a significant percentage of our revenue and we anticipate that such sales will continue to be a significant percentage of our revenue. International sales constituted 59%, 49%, and 48% of our net revenue in fiscal 2009, 2008, and 2007 respectively. Development and customer support operations located outside the U.S. have historically accounted for a significant percentage of ourCompany's operating expenses and we anticipateit anticipates that such operations will continue to be aaccount for significant percentage of ourits expenses. International sales and operations involve a variety of risks and uncertainties, including risks related to:
- •
Reliancereliance on strategic alliance partners;
Table of Contents
- •
Compliancecompliance with changing foreign regulatory requirements and tax laws;
- •
Difficultiesdifficulties in staffing and managing foreign operations;
- •
Reducedreduced protection for intellectual property rights in some countries;
- •
Longerlonger payment cycles to collect accounts receivable in some countries;
- •
Politicalpolitical and economic instability;
- •
Economiceconomic downturns in international markets;
- •
Currencycurrency risks;
- •
Changingchanging restrictions imposed by U.S.United States export laws;laws, including increasing restrictions based on security concerns; and
- •
Competitioncompetition from U.S.-based companies based in North America that have established significant international operations.
Failure to successfully address these risks and uncertainties could adversely affect ourthe Company's international sales and operations, which could in turn have a material and adverse effect on ourits results of operations and financial condition.
Table of Contents
If we arethe Company is unable to develop and introduce new products successfully or to achieve market acceptance of ourits new products, ourits revenues and operating incomeresults will be adversely affected.
OurThe Company's future success will depend on ourits ability to develop new, high-performance ICs for existing and new markets the cost-effective and timely introduction of such products,its success in developing and our ability to convince leading communications equipment manufacturers to selectdelivering these products. Our financial results in the past have been, and are expected in the future to continue to be, dependent on the introduction of a relatively small number of new products and the timely completion and delivery of those products to customers. The development of new ICs is highly complex, and from time to time, we have experienced delays in completing the development and introduction of new products. Our ability to develop and deliver new products successfully will depend on various factors, including ourits ability to:
- •
Accuratelyaccurately predict market requirements and evolving industry standards;
- •
Accuratelyaccurately define new products;
- •
Completecomplete and introduce new products in a cost-effective and timely manner;
- •
Qualifyqualify and obtain industry interoperability certification of ourthe Company's products and ourthe Company's customers' products into which ourthe Company's products will be incorporated;
- •
Workwork with ourthe Company's wafer foundry, assembly, and probe and test subcontractors to achieve high manufacturing yields;
- •
- convince leading communications equipment manufacturers to select these products; and
- •
Gaingain market acceptance of ourthe Company's products and ourthe Company's customers' products.
If we arethe Company is not able to develop and introduce new products successfully ourand in a timely manner, its revenues and operating incomeresults will be materially and adversely affected. In particular, our revenue growth and profitability could be impacted by substantial delays in introducing new
Demand for the Company's products is dependent on demand for its customers' products. Our
The Company's success will also depend on the ability of ourits customers to successfully develop new products and enhance existing products for the Carrier and Enterprise Networking and Storage markets. These markets may not develop in the manner or in the time periods that ourthe Company's customers anticipate. If they do not, or if ourthe Company's customers' products do not gain widespread acceptance in these markets, ourits revenues and operating incomeresults may be materially and adversely affected.
Table of Contents
Demand for ourthe Company's products may be negatively affected if ourits expectations regarding market demand for particular products are not accurate.
Product introductions as well as plans for future roadmap products are based on ourthe Company's expectations regarding market demand and direction. If ourthe Company's expectations regarding market demand and direction are incorrect, the rate of development or acceptance of ourits current and next-generation solutions do not meet market demand and customer expectation, the sales of ourits legacy or current Carrier and Enterprise Networking and Storage Productsstorage products decline more rapidly than we anticipate,the Company anticipates, or if the rate of decline continues to exceed the rate of growth of ourits new products, it could negatively affect demand for our products, consolidatedits revenues and profitability.operating results could be materially and adversely affected.
The Company's ability to accurately forecast customer demand may also be impaired by the delays inherent in its lengthy sales cycle. After the Company has developed and delivered a product to a customer, its customers need time to test, evaluate and adopt its products and additional time to begin production of the equipment that incorporates its products. Due to this lengthy cycle, the Company may experience significant delays from the time the Company increases its operating expenses and makes investments in inventory until the time that the Company generates revenues from these products. It is possible that the Company may never generate any revenues from these products after incurring such expenditures. Even if a customer selects the Company's product to incorporate into their equipment or devices, the Company has no assurance that the customer will ultimately bring its product to market or that such effort by the Company's customer will be successful. If the Company incurs significant research and development expenses, marketing expenses, and investments in inventory in the future that the Company is not able to recover its operating results could be adversely affected.
We areThe Company is dependent on a small number of customers in a few industries for a significant amount of net revenues. A decrease in sales to or the loss of, one or more significant customers could adversely impact ourthe Company's revenues and results of operations.
We focus ourThe Company focuses its sales efforts on a small number of customers in the Carrier and Enterprise Networking and Storagestorage markets that require high-performance ICs and intendICs. The Company intends to continue doing so in the future. Some of these customers are also ourthe Company's competitors. If any of ourthe Company's major customers were to delay orders of ourthe Company's products or stop buying ourthe Company's products, ourthe Company's business and financial condition would be severely affected. Additionally, if any of ourthe Company's customers are impacted by consolidation, experience financial difficulty, including filing for bankruptcy protection, or are impacted by adverse economic
Table of Contents
conditions that would delay networking infrastructure upgrades, build-outs or new installations, thisthe Company could also result inexperience increased competition for ourits products and downward pressure on the pricing for ourof its products.
Defects, errors, or failures in our products could result in higher costs than we expect and could harm our reputation and adversely affect our revenues and level of customer satisfaction.
Due to the highly complex nature of our products, on occasion an undetected defect, error, or failure may occur when one of our products is deployed in the field. The occurrence of defects, errors, or failures in our products could result in cancellation of orders, product returns, and the loss of, or delay in, market acceptance of our IC solutions. Our customers could, in turn, bring legal actions against us, resulting in the diversion of our resources, legal expenses and judgments, fines or other penalties, or losses. Any of these occurrences could adversely affect our business, results of operations, and financial condition.
We dependCompany depends on third-party wafer foundries and other suppliers and subcontract manufacturers to manufacture and test substantially all of ourits current products and any delays in materials or packaging, oravailability of manufacturing capacity, or failure to meet quality control requirements could have material adverse effects on ourits customer relationships, revenues, and cash flows.
Wafer fabrication for ourthe Company's products is outsourced to third-party silicon wafer foundry subcontractors such as Taiwan Semiconductor Manufacturing Corporation ("TSMC"), Chartered Semiconductor Manufacturing,TSMC, Global Foundries, IBM, LSI Logic and United Microelectronics Corporation. As a result, we dependMicroelectronics. The Company depends on these third-party wafer foundries to allocate a portion of their manufacturing capacity sufficient to meet ourits needs and to produce productswafers of acceptable quality in a timely manner. There are significant risks associated with ourthe Company's reliance on third-party foundries, including:
- •
Lacklack of assured wafer supply, the potential for wafer shortages, and possible increase in wafer prices;
- •
Limitedlimited control over delivery schedules, manufacturing yields, product costs, and product quality; and
- •
Unavailabilityunavailability of, or delays in, obtaining access to key process technologies.
Table of Contents
These and other risks associated with ourthe Company's reliance on third-party wafer foundries could materially and adversely affect ourits revenues, cash flows, operating results, and relationships with ourits customers. For example, the third-party foundries that manufacture our wafers have from time to time experienced manufacturing defects and reductions in manufacturing yields. In addition, disruptions and shortages in wafer foundry capacity may impair our ability to meet our customers' needs and negatively impact our operating results. Our
The Company's third-party wafer foundries fabricate products for other companies and, in certain cases, manufacture products of their own design. Historically, there have been periods in which there has been a worldwide shortage of wafer foundry capacity for the production of high-performance integrated circuitsICs such as ours.the Company's. Instead of having long-term agreements with any of ourthe Company's third-party foundries, we instead subcontract ourit subcontracts its manufacturing requirements on a purchase order basis. As a result, it is possible that the capacity wethe Company will need in the future may not be available to usit on acceptable terms, if at all.
A significant portion of the Company's manufacturing operations are located in Asia. These areas are subject to natural disasters such as earthquakes, tsunamis and floods. A significant natural disaster or other catastrophic event could significantly disrupt the Company's foundries' production capabilities and could result in the Company experiencing a significant delay in delivery or substantial shortage of wafers and possibly in higher wafer prices. Any supply disruption or business interruption could materially and adversely affect the Company's business, financial condition and results of operations.
If any of the Company's foundries do not have adequate available capacity for it for any reason, the Company may encounter supply delays or disruptions, and it may need to qualify an alternative foundry. The Company's current foundries need to have new manufacturing processes qualified if there is a disruption in an existing process. The Company typically requires several months to qualify a new foundry or process before it can begin shipping products from the new foundry. If the Company cannot accomplish this qualification in a timely manner, it may experience a significant interruption in supply of the affected products.
In addition to third-party wafer foundries, wethe Company also dependdepends on third-party subcontractors in Asia and the United States for the assembly, and in some cases, wafer probe and package testing of ourits products. As with ourthe wafer foundries, any difficulty in obtaining parts or services from these subcontractors could affect ourits ability to meet scheduled product deliveries to customers, which could in turn have a materiallymaterial adverse effect on ourthe Company's customer relationships, revenues, and cash flows.operating results.
These third-party subcontractors purchase materials used in the assembly process based on ourthe Company's forecast. In
Table of Contents
the event we failthe Company fails to meet ourits obligations by placing purchase orders that are inconsistent with ourits forecast, wethe Company may be required to pay compensation for material forecasted, but not ordered. This obligation may have an adverse effect on revenues, operating results, and cash flows.
Finally, we are subjectAs with wafer fabrication, worldwide assembly and testing capacity is limited and the Company is dependent on its suppliers to occasionalprovide enough capacity in the correct mix to address all of its requirements. The master service agreements with the Company's assembly subcontractors have provisions for the subcontractors to maintain inventory stocks based on forecast, but do not include any guaranteed capacity agreement clauses. As a result, it is possible that the capacity the Company will need in the future may not be available to it on acceptable terms, if at all, and the Company could experience shortages or assembly problems in the future. As part of the Company's test outsourcing agreement, it consigned testing equipment to its test subcontractor. The availability of assembly and test services from these subcontractors could be materially and adversely affected in the event a subcontractor experiences financial difficulties or suffers any damage to its facilities.
Many of the Company's products have very long life cycles, often exceeding ten years or more. These life cycles may be longer than what is typically supported by wafer and/or assembly manufacturers. Accordingly, the Company is sometimes subjected to end-of-life ("EOL") notices on certain materialmaterials and/or products thatprovided by these manufacturers. This longer life cycle may impact our ability to continue to support certain products. This may impact ourthe Company's ability to continue to support certain products, forcing usit to EOL ourcease offering these products if we
Table of Contents
it cannot obtain a replacement source of material. This longer life cycle may impact revenuerevenues and/or require usthe Company to incur additional costs to provideobtain alternative sources for these materials.
If we dothe Company does not achieve satisfactory manufacturing yields or quality, ourits business will be harmed because of increases in ourits business expenses.
The fabrication of ICs is a highly-complexhighly complex and technically-demandingtechnically demanding process. Defects in designs, problems associated with transitions to newer manufacturing processes, and the inadvertent use of defective or contaminated materials can result in unacceptable manufacturing yields and performance. These problems are frequently difficult to detect in the early stages of the production process and can be time consumingtime-consuming and expensive to correct once detected. Even though we procurethe Company procures substantially all of ourits wafers from third-party foundries, wethe Company may be responsible for low yields when these wafers are tested against ourits quality control standards. In addition, defects in the Company's existing or new products may require the Company to incur significant warranty, support and repair costs, and could divert the attention of the Company's engineering personnel away from the development of new products.
In the past, we havethe Company has experienced difficulties in achieving acceptable probe and/or final test yields on some of ourits products, particularly with new products, which frequently involve new manufacturing processes and smaller geometry features than previous generations. Maintaining high numbers of good die per wafer is critical to our operating results, as decreasedDecreased yields can result in higher unit costs, shipment delays, and increased expenses associated with resolving yield problems. Because wethe Company also use estimatedestimates yields to value work-in-process inventory, yields below ourits estimates may require usit to increase the value of inventory and related reserves reflected on ourits financial statements. In addition, defects in our existing or new products may require us to incur significant warranty, support and repair costs, and could divert the attention of our engineering personnel away from the development of new products. As a result, poorPoor manufacturing yields, defects or other performance problems with ourthe Company's products could adversely affect ourits ability to provide competitively priced products.products and its operating results.
We must attractDefects, errors, or failures in the Company's products could result in higher costs than it expects and retain key employees in a highly competitive environment.could harm its reputation and adversely affect its revenues and level of customer satisfaction.
Our success depends in part upon our abilityDue to retain key employees. In somethe highly complex nature of the fields in which we operate, there are only a limited numberCompany's products, on occasion an undetected defect, error, or failure may occur when one of peopleits products is deployed in the job market who possessfield. The occurrence of defects, errors, or failures in the requisite skills. We have experienced difficultyCompany's products could result in hiringcancellation of orders, product returns, and retaining sufficient numbers of qualified engineers in parts of our business. Thethe loss of, servicesor delay in, market acceptance of any key personnelits IC solutions. The Company's customers could, in turn, bring legal actions against it, resulting in the diversion of its resources, legal expenses and judgments, fines or other penalties, or losses. Any of these occurrences could adversely affect the inability to hire new personnel with the requisite skills could restrict our ability to develop new products or enhance existing products in a timely matter, to sell products to customers, or to manage ourCompany's business, effectively.results of operations, and financial condition.
We faceThe Company faces significant emerging and existing competition and, therefore, may not be able to maintain ourits market share or may be negatively impacted by competitive pricing practices.
The markets for ourthe Company's products are intensely competitive and subject to rapid technological advancement in design technology, wafer-manufacturingwafer manufacturing techniques, and alternative networking technologies. WeThe Company must identify andcompete to capture future market opportunities to offset the rapid price erosion that characterizes ourits industry. We may not be able to develop new products at competitive pricing and performance levels. Even if we are able to do so, we may not complete a new product and introduce it to market in a timely manner.
Table of Contents
WeThe Company typically facefaces competition at the design stage, where customers evaluate alternative design approaches that require ICs. OurThe Company's competitors have increasingly frequent opportunities to supplant ourits products in next-generation systems because of shortened product life and design cycles in many of ourits customers' products. The Company's customers may substitute use of the Company's products in their next-generation equipment with those of current or future competitors.
Competition is particularly strong inIn the communications market, for communications ICs, in part, due towhich includes the market's historical growth rate, which attracts largerCompany's Carrier and Enterprise Network markets, competitors include Applied Micro Circuits, Broadcom, Marvell Technology Group, Maxim Integrated Products, Mindspeed Technologies, and in part, to the number of smaller companies focused on this area.PMC-Sierra. Larger competitors in our the Company's
Table of Contents
market have acquired both mature and early stage companies with advanced technologies. These acquisitions could enhance the ability of larger competitors to obtain new business that wethe Company might have otherwise won.
Our customers may substitute use In addition, the Company is aware of our products in their next-generation equipment with thosesmaller privately held companies that focus on specific portions of current or future competitors. In the communications market, which includes our Carrier and Enterprise Network markets, our competitors include Applied Micro Circuits Corporation, Broadcom Corporation, Marvell Technology Group Ltd., Maxim Integrated Products, Inc., Mindspeed Technologies, Inc., and PMC-Sierra, Inc.Company's range of products. Over the next few years, we expectthe Company expects additional competitors, some of which may have greater financial and other resources than the Company has, to enter the market with new products. In addition, we are aware of smaller privately-held companies that focus on specific portions of our range of products. These companies, individually and collectively, represent future competition during the design stage and in subsequent product sales.
WeThe Company must keep pace with rapid technological change and evolving industry standards in order to grow ourits revenues and ourits business.
We sellThe Company sells products in markets that are characterized by rapid technological changes in both product and process technologies, including evolving industry standards, frequent new product introductions, short product life cycles, and increasing demand for higher-levelshigher levels of integration and smaller process geometries. We believeThe Company believes that ourits success, to a large extent, depends on ourits ability to adapt to these changes, to continue to improve ourits product technologies, and to develop new products and technologies to maintain ourits competitive position. OurThe Company's failure to accomplish any of the abovethese objectives could have a negative impact on ourits business and financial results. If new industry standards emerge, ourthe Company's products or ourits customers' products could become unmarketable or obsolete, and wethe Company could lose market share. WeThe Company may also have to incur substantial unanticipated costs to comply with these new standards.
Development costs for new product technologies continue to increase. WeThe Company may incur substantially higher R&Dresearch and development costs for next-generation products, as these products are typically more complex and must be implemented in more advanced wafer fabrication processes and assembly technologies.
OurThe Company's operating results may be adversely impacted by worldwide political and economic conditions and uncertainties. As a result, the market price of its common stock may decline.
Recent general worldwide economic conditions have included slower economic activity, an increase in bankruptcy filings, concerns about inflation and deflation, increased energy costs, decreased consumer confidence, reduced corporate profits and capital spending, adverse business conditions, liquidity concerns in the wired and wireless communications markets, international conflicts, terrorist and military activity, and the impact of natural disasters and public health emergencies. These conditions make it extremely difficult for the Company's customers, its vendors, and it to accurately forecast and plan future business activities, and these conditions have caused, and may continue to cause, United States and foreign businesses to slow spending on the Company's products and services, which delays and lengthens sales cycles. Although some economic conditions have improved in recent months, the Company cannot predict the timing, strength or duration of any slowdown or subsequent recovery in the worldwide economy, the semiconductor industry or the wired and wireless communications markets. If the economy or markets in which the Company operates do not return to historical levels, its business, financial condition and results of operations will likely be materially and adversely affected.
The Company's business is subject to environmental regulations that could increase ourits operating expenses.
We areThe Company is subject to a variety of federal, state, and local environmental regulations relating to the use, storage, discharge, and disposal of toxic, volatile, and other hazardous chemicals used in ourthe Company's designing and manufacturing processes. In some circumstances, these regulations may require usthe Company to fund remedial action regardless of fault. Consequently, it is often difficult to estimate the future impact of environmental matters, including the potential liabilities associated with chemicals used in our designingthe Company's design and manufacturing processes. If we failthe Company fails to comply
Table of Contents
with these regulations, weit could be subject to fines or be required to suspend or cease ourits operations. In addition, these regulations may restrict ourthe Company's ability to expand operations at ourits present locations in the United States and worldwide or require usit to incur significant compliance-relatedcompliance related expenses.
Table Laws and regulations have been enacted in several jurisdictions in which the Company sells its products, including various European Union, or EU, member countries. For example, the RoHS directive restricts the use of Contentscertain hazardous substances, including lead, used in the construction of component parts of electrical and electronic equipment. The Company believes that its products comply with the RoHS directive; however, if the Company fails to comply with these regulations in the future the Company may be forced to recall products and cease their manufacture and distribution, and the Company could be subject to civil or criminal penalties. The Company may incur increased manufacturing costs, and some products may be subject to production delays to comply with future legislation which implements this directive, but the Company cannot currently estimate the extent of such increased costs or production delays, if any. To the extent that any such cost increases or delays are substantial, the Company's operating results could be materially adversely affected. Also, the Company is aware that lead times for new, compliant components are longer and that older, non-compliant components are being discontinued at a fast pace. The Company or its customers may be impacted by shortages if parts that comply with the RoHS directive are not available.
Similar legislation may be enacted in other countries or regions where the Company sells the Company's products. The Company will need to ensure that it complies with these laws and regulations as they are enacted, and that its subcontractors also comply with these laws and regulations. If the Company or its subcontractors fail to comply with the legislation, its customers may refuse or be unable to purchase its products, which could harm its business, operating results and financial condition. If the Company has to make significant capital expenditures to comply with environmental laws, or if it is subject to significant expenses in connection with a violation of these laws, its business, operating results and financial condition could be materially and adversely affected.
If we arethe Company is not successful in protecting ourits intellectual property rights, it may harm ourits ability to compete or maintain market share.share may be harmed.
We relyThe Company relies on a combination of patent, copyright, trademark, and trade secret protections, as well as confidentiality agreements and other methods, to protect ourthe Company's proprietary technologies and processes. For example, we enterthe Company enters into confidentiality agreements with ourits employees, consultants, and business partners, and controlcontrols access to and distribution of ourthe Company's proprietary information. As of September 30, 2009, we2010, the Company had 8789 U.S. patents and 1520 foreign patents for various aspects of design and process innovations and havehas a number of pending U.S. and foreign patent applications.
However, despite ourthe Company's efforts to protect ourits intellectual property, wethe Company cannot assure you that:
- •
Steps we takesteps the Company takes to prevent misappropriation or infringement of ourits intellectual property will be successful;
- •
Anyany existing or future patents will not be challenged, invalidated or circumvented;
- •
Anyany pending patent applications or future applications will be approved;
- •
Othersothers will not independently develop similar products or processes to oursthe Company's or design around ourthe Company's patents; or
- •
Anyany of the measures described above will provide meaningful protection.
A failure by us to meaningfully protect our intellectual property could have a materially adverse effect on our business, financial condition, operating results, and ability to compete, including maintaining our competitive position in the market. In addition, effective patent, copyright, trademark, and trade secret protection may be unavailable or limited in certain countries. We have begun to find opportunities to license our intellectual property. While this may provide a substantial business opportunity for us, it may also increase the potential for others to misappropriate or infringe upon our intellectual property.Table of Contents
WeThe Company may be subject to claims of infringement of third-party intellectual property rights or demands that weit license third-party technology, which could result in significant expense and loss of ourits proprietary rights.
The semiconductor industry is characterized by vigorous protection and pursuit of intellectual property rights. As is common in the industry, from time to time, third parties have asserted patent, copyright, trademark, and other intellectual property rights to technologies that are important to ourthe Company's business and have demanded that wethe Company license their patents and technology. To date, none of these claims has resulted in the commencement of any litigation against us,the Company, nor have wehas the Company believed that it is necessary to license any of the rights referred to in such claims. We expect,The Company expects, however, that weit will continue to receive such claims in the future, and any litigation to determine their validity, regardless of theirits merit or resolution, could be costly and divert the efforts and attention of ourits management and technical personnel. We have begun to find opportunitiesThe Company's recent efforts to license ourits intellectual property. While this may provide a substantial business opportunity for the Company, itproperty to third parties may also increase the potential for others to initiate claims against us. Weit. The Company cannot assure that weit would prevail in such disputes given the complex technical issues and inherent uncertainties in intellectual property litigation. If such litigation were to result in an adverse ruling wethe Company could be required to:
- •
Paypay substantial damages;
- •
Discontinuediscontinue the use of infringing technology, including ceasing the manufacture, use or sale of infringing products;
- •
Expendexpend significant resources to develop non-infringing technology; or
- •
Licenselicense technology from the party claiming infringement, which license may not be available on commercially reasonable terms.
Litigation resulting in any of the above could materially and adversely affect the Company's business, financial condition and operating results.
The Company is subject to United States Customs and Export Regulations
The Company is subject to United States Customs and Export Regulations, including United States International Traffic and Arms Regulations and similar laws, which collectively control import, export and sale of technologies by United States companies. Failure to comply with such regulations may result in civil and criminal enforcement, including monetary fines and possible injunctions against shipment of product, which could have a material adverse impact on its results of operations and financial condition.
Risks Relating to an Investment in The Company
The Company has significant debt in the form of its Senior Term Loan and 2014 Debentures.
The Company has $25.0 million in original principal of its senior term loan with Whitebox VSC, Ltd. ("Whitebox"), plus $1.3 million of accrued payment-in-kind ("PIK") interest outstanding ("Senior Term Loan"). On October 29, 2011, the Company is obligated to repay the full remaining principal, amount of the notes, plus accrued PIK interest through that date. The Company has $46.5 million of its 8.00% Convertible Second Lien Debentures Due 2014 (the "2014 Debentures") outstanding. On October 29, 2014, the Company is obligated to repay the principal amount of the 2014 Debentures. The Company's debt could materially and adversely affect its ability to obtain financing for working capital, acquisitions or other purposes and could make it vulnerable to industry downturns and competitive pressures. The Company's ability to meet its debt service obligations will be dependent upon its future performance, which will be subject to financial, business and other factors affecting its operations, many of which are beyond its control. The Company believes that its existing sources of liquidity, along with cash expected to be generated from product sales, will be sufficient to fund its
Table of Contents
Risks Relating to our Current and Prior Financial Statements and Related Matters
Since 2006, we have had material weaknesses in our internal control over financial reporting and cannot provide assurance that additional material weaknesses will not be identified infinancing requirements for at least the future. If our internal control over financial reporting or disclosure control and procedures are not effective, there may be errors in our financial statements that could require a restatement or our filingsnext 12 months. However, this may not be timelythe case. If the Company incurs operating losses and investorsnegative cash flows in the future, the Company may lose confidenceneed to further reduce its operating costs or obtain alternate sources of financing, or both. The Company may need additional capital in our reported financial information, which could leadthe future and may not have access to a declineadditional sources of capital on favorable terms or at all. If the Company raises additional funds through the issuance of equity-based or debt securities, such securities may have rights, preferences or privileges senior to those of its common stock and its stockholders may experience dilution of their ownership interests.
The Company's stockholders will experience significant dilution in our stock price.connection with the conversion of its Series B Preferred Stock and its 2014 Debentures.
Commencing in mid-2006, in order to rectify identified material weaknesses in our internal control over financial reporting,As of September 30, 2010, the Company began: (i) hiring more experienced and senior finance and legal personnel; (ii) developing additional financial policies and procedures; (iii) establishing processes and procedures to increase communications betweenhad 23,986,531 million shares of common stock outstanding. In connection with the financial reporting, accounting functions and senior management; and (iv) instituting a formal Code of Business Conduct and Ethics and whistle-blower policy.
In addition,October 30, 2009 debt restructuring, the Company has implemented, or is currently implementingissued 771,000 shares of its Series B Preferred Stock convertible into an aggregate of 3,855,000 shares of its common stock and $50.0 million in aggregate principal amount of 2014 Debentures convertible into 11,109,556 shares of its common stock. As of September 30, 2010, the following:
•EngagementCompany had outstanding 185,709 shares of third-party administrator for share-based compensation;
•Enhancementits convertible Series B Preferred Stock and $46.5 million of Corporate Governance and oversight;
•Development and implementation of several new policies and procedures to address key weaknesses; and
•Development of specific accounting and finance policies and standardized processes in all critical accounting areas.
While we are committed to the changes made to our internal control over financial reporting, and believe we have made progress towards resolving our material weaknesses, until sufficient time has passed as to evaluate the effectiveness2014 Debentures. Full conversion of the modifications of our internal control over financial reporting, we cannot assure you that there will not be errors in our financial statements that could require a restatement or delay in filings,currently outstanding Series B Preferred Stock and as a result investors may lose confidence in our reported financial information, which could lead to a decline in our stock price.
In fact, management's most recent evaluationprincipal amount of the design and operating effectiveness of our internal control over financial reporting identified material weaknesses resulting from design and operating deficiencies2014 Debentures would result in the internal control system, including that we did not maintain: (i) sufficient controls in information systems limiting access to key applications and data; and (ii) effective controls over inventory, including lackissuance of accuracy and basis for valuation resulting in adjustments to the amount11,260,323 shares of costcommon stock. The conversion of revenuesits shares of Series B Preferred Stock and the carrying amountconversion of inventory. Management is committed to remediating these material weaknesses.its 2014 Debentures could have a significant dilutive impact on the ownership rights of its stockholders.
The market price for ourthe Company's common stock has been volatile due, in part, to ourthe Company's delisting from the NASDAQ National Market in June 2006 and future volatility could cause the value of investments in ourthe Company to fluctuate.
As a result of ourthe Company's failure to comply fully with ourits reporting requirements under the Exchange Act, ourthe Company's common stock has been delisted from the NASDAQ National Market. WeThe Company currently areis quoted under the symbol VTSS.PK on the OTCQB Marketplace of the Pink Sheets,OTC Markets, Inc., an electronic quotation service for securities traded over-the-counter.over-the-counter by companies that are registered with, and reporting under the rules and regulations of, the Securities and Exchange Commission. As a result, there may be significantly less liquidity in the market for ourthe Company's common stock.
The Company's stock is deemed to be a "penny stock" (generally, any equity security not listed on a national securities exchange or quoted on the NASDAQ Stock Market that has a market price of less than $5.00 per share, subject to certain exceptions) subject to the requirements of certain rules promulgated under the Securities Exchange Act of 1934, which require additional disclosure by broker-dealers in connection with any trade in the Company's stock. Many brokerage firms are reluctant to recommend low-priced stocks to their clients. Moreover, various regulations and policies restrict the ability of stockholders to borrow against or "margin" low-priced stocks, and declines in the stock price below certain levels may result in unexpected margin calls. Additionally, because brokers' commissions on low-priced stocks generally represent a higher percentage of the stock price than commissions on higher priced stocks, the current price of the common stock can result in an individual stockholder paying transaction costs that represent a higher percentage of total share value than would be the case if the Company's share price were higher. This factor may also limit the willingness of institutions to purchase the Company's common stock. Finally, the additional burdens imposed upon broker-dealers by these requirements could discourage broker-dealers from facilitating trades in the Company's common stock, which could severely limit the market liquidity of the stock and the ability of investors to trade the Company's common stock.
In addition, ourthe Company's ability to raise additional capital through equity financing, and attract and retain personnel by means of equity compensation, may be impaired. Furthermore, we the Company
Table of Contents
may experience decreases in institutional and other investor demand, analyst coverage, market-makingmarket making activity, and information available concerning trading prices and volume, and fewer broker-dealers may be willing to execute trades with respect to ourthe Company's common stock. The delisting has decreased the attractiveness of our
Table of Contents
the Company's common stock and caused the trading volume of ourthe Company's common stock to decline significantly, which has resulted in a significant decline in the market price of ourits common stock.
We intendThe Company intends to seek to be relisted on a securities exchange in the future. There can be no assurance whether wethe Company will satisfy the standards for listing on an exchange or that an exchange will approve ourthe Company's listing. Nor can there be any assurance at this time, when a relisting would occur. Continuing to be quoted only on Pink Sheets could result in continued volatility in the trading price of ourthe Company's common stock and could cause its value to fluctuate.
The holders of the 2014 Debentures have significant influence over the Company and could act in a manner with which other stockholders may disagree or that is not necessarily in the interests of other stockholders.
As of September 30, 2010, the holders of the 2014 Debentures owned approximately 51.9% of the Company's outstanding common stock and all of the Company's Series B Preferred Stock (convertible into 3.9% of the Company's common stock). These stockholders have significant influence over all matters submitted to the Company's stockholders for approval, including the election of directors and any merger, consolidation or sale of all or substantially all of the Company's assets. For as long as these holders own the 2014 Debentures, they may have interests that are different from those of other stockholders who do not also own 2014 Debentures. For example, the holders of the 2014 Debentures may support proposals and actions with which other stockholders may disagree or which are not in their interests. In addition, their combined ownership of common stock, Series B Preferred Stock and 2014 Debentures could motivate them to support a sale of the Company at a price that is not attractive to many of the Company's stockholders. Furthermore, the concentration of ownership could delay or prevent a change in control of the Company or otherwise discourage a potential acquirer from attempting to obtain control of the Company, which in turn could reduce the price of the Company's common stock.
The Company had material weaknesses in internal control over financial reporting in the recent past and the Company cannot provide assurance that additional material weaknesses will not be identified in the future.
The material weaknesses in internal control over financial reporting, previously referenced in the Company's quarterly and annual reports for fiscal years 2006 through 2009 and the Company's quarterly reports for fiscal 2010, have been remediated. The Company concluded that, as of September 30, 2010, the Company has remediated these material weaknesses as a result of the following remedial actions:
- •
- Increased IT controls to limit access to key applications and data;
- •
- Increased review controls over access to key applications and data;
- •
- Utilized outside experts to redesign and test processes, reviews, and controls; and
- •
- Expanded operational and finance management review over key inventory metrics and transactions and increased controls over inventory cut-off.
The Company regularly reviews its system of internal control over financial reporting and makes changes to its processes and systems to improve controls and increase efficiency, while ensuring that the Company maintains an effective internal control environment. Changes may include such activities as implementing new, more efficient systems, consolidating activities, and migrating processes. However, the Company cannot provide assurance that additional material weaknesses will not be identified in the future. If the Company's internal control over financial reporting or disclosure control and procedures
Table of Contents
are not effective, there may be errors in the Company's financial statements that could require a restatement or delay the Company's filings and, as a result, investors may lose confidence in the Company's reported financial information, which could lead to a decline in the Company's stock price.
ITEM 1B. UNRESOLVED STAFF COMMENTS
None
ITEM 2. PROPERTIES
OurThe Company's executive offices and principal R&D facility is located in Camarillo, California and is leased pursuant to a non-cancellable operating lease. In September 2008, the Company extended the term of this lease through January 31, 2014 with an annual base rent of $1.2 million. The total space occupied in this building is approximately 111,000 square feet. WeThe Company also leaseleases an additional 58,000 square foot facility in Camarillo for product development, pursuant to a sale-leaseback agreement. We also owned a 107,000 square foot facility in Colorado Springs, Colorado,agreement, which was the site of our wafer fabrication facility until its closure in 2004, and was used as a design center until 2007. We sold this facility inis leased through December 20082015. (See Note 3—Discontinued Operations10-Commitments and Assets Held for SaleContingencies in the accompanying consolidated financial statements)Consolidated Financial Statements). WeThe Company also leaseleases space in 18 additional locations that include domestic and international offices in California, Denmark, Germany, India, Massachusetts, Oregon, and Texas. OurThe Company's sales and field support offices are located in the United States, Canada, Europe, China, Japan, Germany, India, and Taiwan. As of September 30, 2009, we2010, the Company leased total space of approximately 287,000282,000 square feet. The Company's current space is sufficient to accommodate current operations.
ITEM 3. LEGAL PROCEEDINGS
As of September 30, 2009, the end of the period covered by this report, we were subject to material pendingThe Company is involved in legal proceedings other than ordinary routine litigation incidental to our business, to which we were a party or of which our property was the subject, as well as any such proceedings known to be contemplated by government authorities, as described below. In addition, we were subject to certain material legal proceedings completed during the annual period covered by this report as described below.
The Derivative and Securities Class Actions
On April 7, 2008, the District Court approved the settlement of the consolidated securities class actions filed against Vitesse and certain current or former directors and officers of Vitesse alleging violations of Sections 10(b) and 20(a) of the Exchange Act and Rule 10b-5 promulgated thereunder on behalf of a class of purchasers of Vitesse common stock. The settlement of the consolidated securities class actions included a cash payment to a settlement fund of $10.2 million: $8.75 million to be paid by Vitesse's directors' and officers' liability insurers and the remainder of $1.45 million to be paid by Louis R. Tomasetta and Eugene F. Hovanec, two of the former executives of Vitesse. The same two former executives also contributed all shares of Vitesse common stock that they owned, 1,272,669 shares, to the settlement. In addition, on September 22, 2008, Vitesse contributed 2,650,000 shares of Vitesse common stock with a fair market value of $2.4 million, but no cash, to the settlement fund.
On August 11, 2008, the Court granted final approval of settlements in the federalordinary course of business, including actions against it which assert or may assert claims or seek to impose fines and state derivative actions filed on behalf of Vitesse against certain current or former directors and officers of Vitesse, and nominally against Vitesse alleging claims for breach of fiduciary duty, abuse of control,
Table of Contents
gross mismanagement, waste of corporate assets, unjust enrichment, constructive trust, rescission, accounting manipulations, and violations of California Corporations Code Sections 25402 and 25403. As part ofpenalties in substantial amounts, such as the settlement of the federal and state derivative actions, the Company adopted certain Corporate Governance measures. Three former executives of Vitesse, Messrs. Tomasetta, Hovanec, and Mody, released the Company from its obligation to provide future indemnification and defense costs in the related SEC and Department of Justice investigations. Vitesse retained the right to continue its state court action against KPMG, LLP, its former independent registered public accounting firm.
On January 14, 2009, Vitesse contributed 4,700,000 shares of Vitesse common stock, with a fair market value of $4.2 million to cover the attorneys' fees and expenses of the derivative plaintiffs' counsel. The Court entered final judgment implementing all of the above referenced terms and the case is concluded in all respects.
The Corporate Governance measures include implementing certain policies, procedures and guidelines relating to stock option grants and compensation decisions, incorporating greater shareholder participation in the procedures for nominating independent directors, adopting additional standards of director independence, adding a "lead independent director," and incorporating additional accounting policies, procedures and guidelines to be incorporated as part of these measures.
In addition, the Company and certain current and former officers and directors of the Company who were named as defendants were dismissed from the lawsuits and have obtained releases from the class and derivative plaintiffs.
The Dupuy Action
On April 10, 2007, an individual shareholder of Vitesse, Jamison John Dupuy, filed a complaint in the Superior Court of California, County of Ventura, against Vitesse and three of its former officers (Case No. CIV 247776). Mr. Dupuy's complaint included causes of action for fraud, deceit and concealment, and violation of California Corporations Code Sections 25400 et seq. Vitesse filed an answer, asserting numerous affirmative defenses. On March 3, 2008, Mr. Dupuy filed an amended complaint that named six new defendants, all former employees, and included new causes of action for negligent misrepresentation and violations of California Corporations Code § 1507. On April 4, 2008, after mediation before a retired United States District Judge for the Central District of California, the parties entered into a confidential settlement agreement and the plaintiff filed a dismissal of the action. The Company settled this lawsuit in the third quarter of 2008.matter described below.
The DOJ Subpoena and SEC Investigation
In May 2006, wethe Company received a grand jury subpoena from the office of the United States Attorney for the Southern District of New York requesting documents from 1999 through the present.1995 and later. The Division of Enforcement of the SEC also conducted an investigation of Vitesse. The Division of Enforcement requested documents from January 1, 1995 through the present.and later. Vitesse has cooperated with both government agencies in their investigations. While the investigation by the United States Attorney is still on-going,ongoing, the staff of the SEC's Division of Enforcement of the SEC has agreed to recommend to the Commission a proposed settlement whichthat would conclude for the Company all matters arising from the SEC investigation into historical stock option practices and certain other accounting irregularities. Under the proposed settlement, the Company would pay a $3.0 million civil penalty and consent to the entry of a final judgment by a federal court permanently enjoining the Company from violations of the antifraud and other provisions of the federal securities laws. In connection with the Company's proposed settlement with the staff of the Division of Enforcement, offor the SEC, wefiscal year ended September 30, 2009, the Company recorded a $3.0 million expense related to the civil penalty payable to the SEC. The proposed settlement is contingent on the review and approval of final documentation by the Company and the staff of the SEC's Division of Enforcement, of the SEC, and is subject to final approval by the Commission.
Table of Contents
KPMG Lawsuit
On June 13, 2007, the Company filed a lawsuit in the Superior Court for the County of Los Angeles against KMPG LLP ("KPMG"), its former independent registered public accounting firm, alleging that KPMG was negligent in auditing the Company's stock option grants and financial statements during the years 1994 to 2000. The Company later amended its Complaint to include the years 2001 to 2004.
On June 15, 2009, the Company announced that it had reached a settlement with KPMG. Pursuant to this settlement, KPMG agreed to pay the Company $22.5 million and forgive all past indebtedness. Additionally, the parties agreed to execute mutual general releases of all claims. In June 2009, the Company received full payment of the settlement amount, net of fees, expenses and outstanding indebtedness. The Company recorded the net proceeds and the forgiveness of the debt, totaling $16.0 million, as a credit to accounting remediation and reconstruction expense and litigation costs in the statement of operations in the accompanying consolidated financial statements.
Potential Payroll Tax Liabilities Related to Backdating of Stock Options
On June 29, 2009, the Company obtained final determination from the Internal Revenue Service ("IRS") regarding a settlement of payroll taxes, penalties and interest related to the exercise of backdated stock options during the calendar years 2004 through 2006. During that period, certain non-qualified stock options were improperly classified and treated as incentive stock options for tax purposes, resulting in underpayment of payroll taxes. The Company paid approximately $0.9 million in full satisfaction of the federal income tax liabilities in July 2009.
ITEM 4. SUBMISSION OF MATTERS TO A VOTE OF SECURITY HOLDERSREMOVED AND RESERVED
None.
Table of Contents
PART II
ITEM 5. MARKET FOR REGISTRANT'S COMMON EQUITY, RELATED SHAREHOLDERSTOCKHOLDER MATTERS AND ISSUER PURCHASES OF EQUITY SECURITIES
OnThe Company's common stock began trading on the OTCQB Marketplace of the Pink OTC Markets Inc. on June 28, 2006. Prior to June 28, 2006, the Company's stock was delisted from the NASDAQ National Market due to failure to provide timely regulatory filings as a result of the improprieties discussed below under the caption "Options Backdating and Accounting Irregularities." The Company's stock has been subsequently traded in the Pink Sheets electronic quotation system under the symbol VTSS.PK. Prior to June 28, 2006, our stock was traded on the NASDAQ National Market under the symbol VTSS. The following table sets forth the high and low and closing pricesbid quotations of ourthe Company's common stock, as reported on the respective trading systems,OTCQB Marketplace for the periods shown. We can provide no assurance that we will be successful in relistingshown (all prices have been adjusted for the Company's securitiesone-for-20 reverse stock split on a national securities exchange.June 30, 2010). Quotations from Pink OTC Markets Inc. reflect inter-dealer prices, without retail mark-up, markdown or commission, and may not necessarily represent actual transactions.
|
| | High | | Low | | Close | | | High | | Low | |
|---|
Fiscal Year Ended 2010 | | |
October 1 through December 31, 2009 | | | $ | 7.40 | | $ | 4.00 | |
January 1 through March 31, 2010 | | | 5.80 | | 5.00 | |
April 1 through June 30, 2010 | | | 8.80 | | 5.80 | |
July 1 through September 30, 2010 | | | 5.70 | | 2.80 | |
Fiscal Year Ended 2009 | | |
October 1 through December 31, 2008 | |
$ |
0.58 | |
$ |
0.09 | |
$ |
0.36 | | | $ | 11.60 | | $ | 1.80 | |
January 1 through March 31, 2009 | | 0.48 | | 0.21 | | 0.32 | | | 9.60 | | 4.20 | |
April 1 through June 30, 2009 | | 0.45 | | 0.24 | | 0.29 | | | 9.00 | | 4.80 | |
July 1 through September 30, 2009 | | 0.45 | | 0.25 | | 0.37 | | | 9.00 | | 5.00 | |
Fiscal Year Ended 2008 | | |
October 1 through December 31, 2007 | |
$ |
1.16 | |
$ |
0.80 | |
$ |
0.87 | | |
January 1 through March 31, 2008 | | 0.94 | | 0.61 | | 0.67 | | |
April 1 through June 30, 2008 | | 0.74 | | 0.61 | | 0.64 | | |
July 1 through September 30, 2008 | | 0.94 | | 0.49 | | 0.54 | | |
As of September 30, 2009, weDecember 1, 2010, the Company had 1,501 shareholdersapproximately 1,300 stockholders of record. Because many of our shares are held by brokers or other institutions on behalf of shareholders, we are unable to state the totalThe number of beneficial ownersholders of our common stock.record does not include the number of persons whose stock is held in nominee or "street name" accounts through brokers.
We haveThe Company has never paid cash dividends and presently intendintends to retain any future earnings for business development. Further, ourthe Company's existing loan agreements limit the payment of dividends without the consent of the lender.lenders.
Table There have been no sales of Contentsunregistered securities during the year ended September 30, 2010. There were no shares withheld for taxes upon vesting of restricted stock or other stock repurchases.
Five-Year Stock Performance Graph
The following performance graph compares the cumulative total shareholderstockholder return on ourthe Company's common stock with the NASDAQ Composite Index, the NASDAQ Stock Market-U.S. Index and the NASDAQ Electronics Components Index from market close on the last trading day in September 20032005 through the last trading day in September 2009.2010. The graph is based on the assumption that $100 was invested in each of ourthe Company's common stock, the NASDAQ Composite Index, the NASDAQ Stock Market-U.S. Index and the NASDAQ ElectronicElectronics Components Index on the last trading day in September 2004.2005.
The stock price performance graph depicted below shall not be deemed incorporated by reference by any general statement incorporating by reference this Report into any filing under the Securities Act of 1933 (the "Securities Act"), or under the Exchange Act. The stock price performance on this graph is not necessarily an indicator of future price performance.
Table of Contents
COMPARISON OF 5-YEAR CUMULATIVE TOTAL RETURN
AMONG VITESSE SEMICONDUCTOR CORPORATION,
THE NASDAQ COMPOSITE INDEX
THE NASDAQ STOCK MARETMARKET (U.S.) INDEX AND
THE NASDAQ ELECTRONIC COMPONENTSELECTRONICS COMPONENT INDEX
COMPARISON OF CUMULATIVE TOTAL RETURN
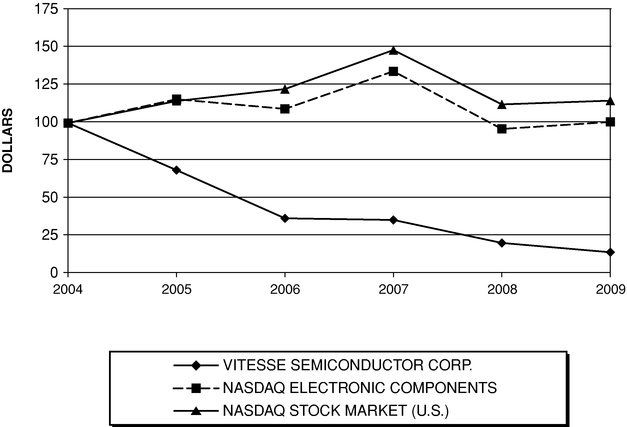
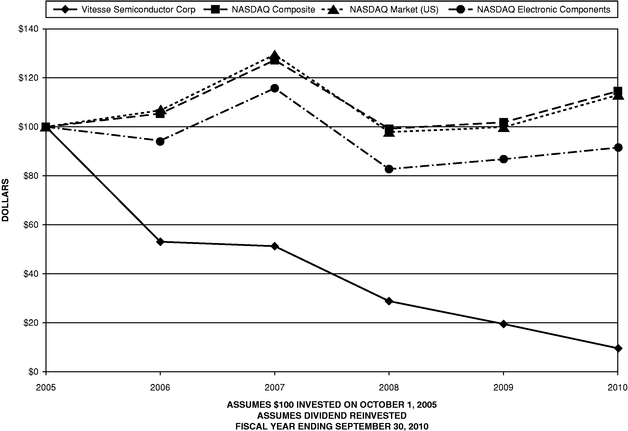
ASSUMES $100 INVESTED ON OCT. 1, 2004
ASSUMES DIVIDEND REINVESTED
FISCAL YEAR ENDED SEPT. 30, 2009
Table of Contents
ITEM 6. SELECTED FINANCIAL DATA
In fiscal year 2008, we completed a voluntary review of our historical stock option grant practices and other accounting practices. The review was initiated by the Special Committee appointed by the Board of Directors (as discussed in the Overview section "Options Backdating and Accounting Irregularities") and was conducted by our Audit Committee, comprised solely of independent directors, with the assistance of legal counsel and outside consultants. Accounting errors and irregularities prior to fiscal 2006 involved improper revenue recognition, unrecorded transactions, misapplied credits, and altered or non-existent supporting documentation. Based on the findings of this review, we have adjusted our historical financial statements to record additional non-cash share-based compensation and related expenses, adjustments to revenue and cost of revenue resulting from the correction of improper revenue recognition, as well as other adjustments. The table below includes selected consolidated financial data for the fourfive years in the period ended September 30, 2009. Consolidated financial data is not available for periods prior to October 1, 2005.
The selected consolidated financial data presented below2010 and should be read in conjunction with Item 7, "Management's Discussion and Analysis of Financial Condition and Results of Operations" and our consolidated financial statementsthe Company's Consolidated Financial Statements in this Annual Report on Form 10-K. OurThe Company's consolidated selected financial data have been derived from ourthe Company's audited consolidated financial statements.Consolidated Financial Statements.
|
|
| | As of and for the years ended September 30, | |
| | As of and for the years ended September 30, | |
|---|
|
| | 2009 | | 2008 | | 2007 | | 2006 | |
| | 2010 | | 2009 | | 2008 | | 2007 | | 2006 | |
|---|
|
| | (in thousands, except per share data)
| |
| |
| | (in thousands, except per share data)
| |
| |
|---|
Statement of Operations Data: | Statement of Operations Data: | | Statement of Operations Data: | |
Product revenues | Product revenues | | $ | 154,927 | | $ | 218,536 | | $ | 221,948 | | $ | 203,289 | | Product revenues | | $ | 165,633 | | $ | 154,927 | | $ | 218,536 | | $ | 221,948 | | $ | 203,289 | |
Intellectual property revenues | Intellectual property revenues | | 13,250 | | 10,000 | | — | | — | | Intellectual property revenues | | 357 | | 13,250 | | 10,000 | | — | | — | |
| | | | | | | | | | | | | | | | | | | | | | | |
| | Net revenues | | 168,177 | | 228,536 | | 221,948 | | 203,289 | | | Net revenues | | 165,990 | | 168,177 | | 228,536 | | 221,948 | | 203,289 | |
(Loss) income from operations | | (179,005 | ) | | 8,378 | | (1,799 | ) | | (50,094 | ) | |
(Loss) income from continuing operations | | (194,112 | ) | | 7,510 | | (4,825 | ) | | (52,003 | ) | |
Gain (loss) from discontinued operations | | 71 | | 9,044 | | (16,822 | ) | | (15,282 | ) | |
| | | Income (loss) from operations | | 3,991 | | (179,005 | ) | | 8,378 | | (1,799 | ) | | (50,094 | ) |
| | | Net (loss) income from continuing operations | | (20,177 | ) | | (194,193 | ) | | 8,170 | | (4,825 | ) | | (52,003 | ) |
Income (loss) from discontinued operations | | Income (loss) from discontinued operations | | 121 | | 71 | | 9,044 | | (16,822 | ) | | (15,282 | ) |
| | | | | | | | | | | | | | |
Net (loss) income | Net (loss) income | | (194,041 | ) | | 16,554 | | (21,647 | ) | | (67,285 | ) | Net (loss) income | | $ | (20,056 | ) | $ | (194,122 | ) | $ | 17,214 | | $ | (21,647 | ) | $ | (67,285 | ) |
Net (loss) earnings attributable to noncontrolling interest | | Net (loss) earnings attributable to noncontrolling interest | | (1 | ) | | (81 | ) | | 660 | | — | | — | |
Fair value adjustment of Preferred Stock—Series B | | Fair value adjustment of Preferred Stock—Series B | | 126 | | — | | — | | — | | — | |
| | | | | | | | | | | | | | |
| | | Net (loss) income available to common stockholders | | $ | (20,181 | ) | $ | (194,041 | ) | $ | 16,554 | | $ | (21,647 | ) | $ | (67,285 | ) |
| | | | | | | | | | | | | | |
Net (loss) income per share: | Net (loss) income per share: | | Net (loss) income per share: | |
Basic and diluted: | | |
Basic and Diluted: | | Basic and Diluted: | |
| | Continuing operations | | $ | (0.85 | ) | $ | 0.03 | | $ | (0.02 | ) | $ | (0.23 | ) | | Continuing operations | | $ | (0.96 | ) | $ | (16.92 | ) | $ | 0.73 | | $ | (0.43 | ) | $ | (4.68 | ) |
| | Discontinued operations | | 0.00 | | 0.04 | | (0.08 | ) | | (0.07 | ) | | Discontinued operations | | 0.01 | | 0.01 | | 0.81 | | (1.50 | ) | | (1.38 | ) |
| | | | | | | | | | | | | | | | | | | | | | | |
| | | Net (loss) income per share | | $ | (0.85 | ) | $ | 0.07 | | $ | (0.10 | ) | $ | (0.30 | ) | | Net (loss) income per share | | $ | (0.95 | ) | $ | (16.91 | ) | $ | 1.54 | | $ | (1.94 | ) | $ | (6.06 | ) |
| | | | | | | | | | | | | | |
| | | | Net (loss) earnings attributable to noncontrolling interest | | (0.00 | ) | | (0.01 | ) | | 0.06 | | — | | — | |
| | | | Fair value adjustment of Preferred Stock—Series B | | 0.01 | | — | | — | | — | | — | |
| | | | | | | | | | | | | | |
Net (loss) income available to common stockholders | | Net (loss) income available to common stockholders | | $ | (0.96 | ) | $ | (16.91 | ) | $ | 1.48 | | $ | (1.94 | ) | $ | (6.06 | ) |
| | | | | | | | | | | | | | | | | | | | | | | |
Weighted average shares outstanding: | Weighted average shares outstanding: | | Weighted average shares outstanding: | |
| | Basic and diluted | | 229,554 | | 223,614 | | 223,556 | | 222,137 | | | Basic and Diluted | | 21,074 | | 11,478 | | 11,181 | | 11,178 | | 11,107 | |
Balance Sheet Data: | Balance Sheet Data: | | Balance Sheet Data: | |
Cash and short-term investments | Cash and short-term investments | | $ | 57,544 | | $ | 36,722 | | $ | 33,576 | | $ | 28,653 | | Cash and short-term investments | | $ | 38,127 | | $ | 57,544 | | $ | 36,722 | | $ | 33,576 | | $ | 28,653 | |
Working capital | Working capital | | 39,397 | | 49,198 | | 55,287 | | 14,431 | | Working capital | | 48,037 | | 39,397 | | 49,198 | | 55,287 | | 14,431 | |
Total assets | Total assets | | 105,568 | | 292,277 | | 327,348 | | 352,199 | | Total assets | | 97,529 | | 109,273 | | 292,277 | | 327,348 | | 352,199 | |
Long-term debt | Long-term debt | | 111,352 | | 126,123 | | 155,118 | | 146,752 | | Long-term debt | | 80,571 | | 111,352 | | 126,123 | | 155,118 | | 146,752 | |
Total shareholders' (deficit) equity | | (61,359 | ) | | 125,361 | | 106,243 | | 117,810 | | |
Total stockholders' (deficit) equity | | Total stockholders' (deficit) equity | | (21,206 | ) | | (61,273 | ) | | 125,361 | | 106,243 | | 117,810 | |
On October 29, 2007, the Company completed its sale of a portion of its Storage Products business, as discussed in Note 3—Discontinued Operations and Assets Held for Sale in the accompanying consolidated financial statements. We havebusiness. The Company reported the results of operations and financial position of the Storage Products business in discontinued operations within the Company's statements of operations and as
Table of Contents
assets and liabilities held for sale in the Company's balance sheet as of September 30, 2007. For the year ended September 30, 2008, we havethe Company reported the results of
Table of Contents
operations of the Storage Products business, along with the gain recognized on the sale, in gainincome (loss) from discontinued operations within the Company's statement of operations. For the year ended September 30, 2010, the Company reported revenue of $0.1 million, net of taxes of $0.2 million related to the final earn-out payments resulting from the sale of the Storage Products business.
During the quarter ended December 31, 2008, wethe Company identified changes in key factors indicating a possible impairment of the value of ourits goodwill. As a result of the additional analyses performed, wethe Company recorded an impairment charge to fully write-off ourits goodwill balance of $191.4 million for the quarter ended December 31, 2008.
In October 2009, Vitesse completed a debt restructuring transaction. The debt restructuring resulted in the conversion of 96.7% of the Company's 2024 Debentures into a combination of cash, common stock, Series B Preferred Stock and 2014 Debentures. With respect to the remaining 3.3% of the 2024 Debentures, Vitesse settled its obligations in cash. Additionally, Vitesse repaid approximately $5.0 million of its $30.0 million Senior Term Loan, the terms of which were amended as part of the debt restructuring transactions. Under the terms of the debt restructuring transactions, Vitesse:
- •
- Paid $3.6 million in cash to satisfy its obligations to the holders of 2024 Debentures who did not participate in the transaction.
- •
- Paid $6.4 million in cash consideration to the holders of the 2024 Debentures who participated in the transaction.
- •
- Issued $50.0 million in aggregate principal amount of 2014 Debentures to the holders of the 2024 Debentures who participated in the transaction. The 2014 Debentures have a five-year term, an 8.0% annual interest rate and a conversion price of $4.50 per share. The indebtedness under these 2014 Debentures is secured by a second-priority security interest in substantially all of Vitesse's assets and is subordinated to the security interest for the Senior Term Loan.
- •
- Issued to the holders of the 2024 Debentures who participated in the exchange, 8,646,811 shares of common stock, and to some of those holders, an aggregate of 771,000 shares of a new Series B Preferred Stock, which are convertible into common stock on a five-to-one basis and have a dividend preference relative to the common stock. The Series B Preferred Stock and the 2014 Debentures include restrictions on conversion prohibiting holders of those securities from converting if it would result in the holder beneficially owning more than 9.99% of Vitesse's outstanding common stock.
On May 14, 2010, the Company received a conversion notice from one of the holders of the 2014 Debentures of its intent to convert $3.5 million face amount of its holdings. The Company converted the principal amount of the submitted debentures into shares of common stock and elected to pay the "Make-Whole Amount" (as defined in the Indenture for the 2014 Debentures) in shares of common stock. 777,778 shares of the Company's common stock were issued on May 20, 2010 in settlement of the $3.5 million of debentures based on a conversion price of $4.50 per share. On June 7, 2010, 91,753 shares of common stock were issued in settlement of the Make-Whole Amount obligation.
Table of Contents
ITEM 7. MANAGEMENT'S DISCUSSION AND ANALYSIS OF FINANCIAL CONDITION AND RESULTS OF OPERATIONS
You should read the following discussion and analysis in conjunction with the Company's Consolidated Financial Statements and related Notes thereto included in Part II, Item 8 of this Report and the "Risk Factors" included in Part I, Item 1A of this Report, as well as other cautionary statements and risks described elsewhere in this Report, before deciding to purchase, hold or sell the Company's common stock.
The discussion and analysis set forth below in this Item 7 reflects the adoption of policies and procedures and adjustments relating to the review of ourthe Company's historical financial statements. These adjustments include the recording of additional non-cash share-based compensation expense, additional payroll tax related expenses resulting from the exercise of backdated options through fiscal 2006, adjustments to revenue and cost of revenue due to corrections of our revenue recognition procedures, and certain other adjustments. For this reason, the data set forth in this Item 7 may not be comparable to discussions and data in our Annual Reports on Form 10-K filed for the years ended September 30, 2005 and prior, as discussed under the caption "Option Backdating and Accounting Irregularities." All dollar amounts are presented in thousands unless otherwise noted.
Management's discussion and analysis of financial condition and results of operations ("MD&A") is provided as a supplement to the accompanying consolidated financial statements and footnotes to help provide an understanding of our financial condition, changes in our financial condition, and results of our operations. The MD&A is organized as follows:
•Overview. This section provides an introductory overview, including detailed description and timeline of the circumstances and events related to prior stock option grants and other improper accounting practices, including the findings of the Special Committee and context for the discussion and analysis that follows in the MD&A, including industry trends and characteristics, significant events, and a review of our business product lines.
•Critical accounting policies and estimates. This section discusses those accounting policies that are both considered important to our financial condition and operating results and require significant judgment and estimates on the part of management with their application.
•Impact of recent accounting pronouncements. This section discusses recent accounting pronouncements, their impact on our Company, and a brief description of the pronouncements.
•Results of operations. This section provides an analysis of our results of operations for the three fiscal years ended September 30, 2009, 2008 and 2007. Brief descriptions are provided of transactions and events that impact the comparability of the results being analyzed.
•Financial condition and liquidity. This section provides an analysis of our cash position and cash flows, as well as a discussion of our financing arrangements and financial commitments.
Overview
Over the last 10 years, the worldwide proliferation of the Internet and the rapid growth in the volume of data being sent over Local Area Networks ("LANs")LANs and Wide Area Networks ("WANs")WANs has placed a tremendous strain on the existing communications infrastructure. Communication service providers have sought to increase their revenues by delivering a growing range of data services to their customers in a cost-effective manner. The resulting demand for increased bandwidth and services has created a need for faster, larger and more complex networks. Additionally, due to increasing needs for moving, managing and storing mission-critical data, the market for storage equipment has been growing significantly.
Table of Contents
We areThe Company is a leading supplier of high-performance integrated circuits ("ICs")ICs principally targeted at systems manufacturers in the communications and storage industries.industry. Within the communications industry, ourthe Company's products address Carrier and Enterprise networking,Networking, where they enable data to be transmitted at high-speeds and processed and switched under a variety of protocols.
In recent years, we havethe Company has focused ourits product development and marketing efforts on products that leverage the convergence of Carrier and Enterprise Networking onto IP-basedInternet Protocol based networks. These Next-Generation Networks"Next-Generation Networks" share the requirements of high reliability, scalability, interoperability and low cost. Increasingly, these networks will be delivered based on Ethernet technology. We believeThe Company believes that products in this emerging technology area represent the best opportunity for usthe Company to provide differentiation in the market.
In Storage, our products address primarily Enterprise-class storage systems and blade-servers using Fibre Channel and Serial Attached SCSI ("SAS"Debt Restructuring
Effective October 16, 2009, the Company entered into an agreement to amend the Senior Term Loan with Whitebox (the "Debt Modification")/Serial Attached ATA ("SATA") protocols. Our customers include leading communications and storage OEMs.. On October 29, 2007,2010, the Company completed its saleentered into a Debt Conversion Agreement (the "Conversion Agreement") with the beneficial owners of a portion of the Storage Products business to Maxim Integrated Products, Inc. ("Maxim"). Maxim acquired the Company's SAS/SATA expander product, enclosure and baseboard management devices and certain other assets of the Storage Product business.
Debt Restructuring
In October 2009, Vitesse completed its debt restructuring transactions. The debt restructuring agreements call for the conversion ofmore than 96.7% of the Company's approximately $110 million aggregate principal amount of 1.5% Convertible Subordinated2024 Debentures due(the "Noteholders"). Pursuant to the Conversion Agreement, the Noteholders agreed to exchange their 2024 intoDebentures for a combination of cash, equity securities, and secured convertible debentures. With respect to the remaining 3.3% of those convertible debentures, the Company is settling its obligations in cash. Additionally, Vitesse has made cash payment of approximately $5 million of its $30 million senior secured loan, the terms of which had been amended to facilitate the debt restructuring. In order to authorize additional shares of common stock, necessary to permit the conversionand newly issued 2014 Debentures, convertible into shares of common stock (the "Debt Exchange"). Certain Noteholders received Series B Preferred Stock. The Debt Modification was completed on October 30, 2009. The treatment of the equity securities issuedDebt Modification and the Debt Exchange are described in Note 4—Debt in the restructuring, we will be holding a special meeting of our shareholders on January 7, 2010 to approve an amendment to our certificate of incorporation.accompanying Consolidated Financial Statements.
Options Backdating and Accounting Irregularities
The following is a description of some significant events that have occurred since April 2006, including, but not limited to, activities related to errors and irregularities in the disclosure of, and accounting for, stock options granted by the Company to its employees and the Board. A number of these events contributed directly to the delayed and/or restated filing of the prior years' Annual Reports with the SEC.
Chronology of Events
In April 2006, Vitesse's Board of Directors appointed a Special Committee of independent directors to conduct an internal investigation relating to past stock option grants, the timing of such grants, and related accounting and documentation for stock option grants from January 1, 2005 to April 2006. The results of this review are discussed below at "The Special Committee—Findings and Recommended Actions."
The Board of Directors determined that the following should not be relied upon:
•Vitesse's previously reported financial statements for the three months ended December 31, 2005, and the three years ended September 30, 2005, and possibly earlier periods;
Table of Contents
•The Management Report on Internal Control over Financial Reporting as of September 30, 2005, which was included in the Company's Annual Report on Form 10-K for the year ended September 30, 2005; and
•The Auditor's Report of KPMG, LLP, the Company's former independent registered public accounting firm, relating to the effectiveness of the Company's internal controls over financial reporting and management's assessment thereof as of September 30, 2005, which was included in the Company's Annual Report on Form 10-K for the year ended September 30, 2005.
In May 2006, both the office of the United States Attorney for the Southern District of New York and the SEC's Division of Enforcement commenced investigations into Vitesse's practices relating to the grant of stock options. While the investigation by the United States Attorney is still ongoing, the staff of the Division of Enforcement has agreed to recommend a settlement to the Commission. Details of this settlement are discussed below at "Item 5. Legal Procedures—The DOJ Subpoena and the SEC Investigation."
In June 2006, Vitesse's common stock was delisted from the NASDAQ National Market, due to the length of time that would be necessary for Vitesse to become fully compliant with applicable listing requirements. Later that same month Vitesse received a letter from the Trustee under the Indenture for Vitesse's 1.5% Convertible Subordinated Debentures due 2024 ("2024 Debentures") alleging that absent a cure, an event of default would occur within 60 days as a result of Vitesse's failure to file its Quarterly Report on Form 10-Q for the quarter ended March 31, 2006.
In August 2006, Vitesse received an acceleration notice from the Trustee under the Indenture for $96.7 million.
In September 2006, Vitesse completed a Consent Solicitation with respect to the 2024 Debentures. In the Consent Solicitation, the holders of a majority of the 2024 Debentures consented to amendments to the Indenture governing the 2024 Debentures that:
•Rescinded and annulled the previous asserted acceleration of the 2024 Debentures and any Events of Default asserted in connection with that asserted acceleration;
•Provided that our failure to file required reports with the SEC would not be a Default or Event of Default under the Indenture prior to the earlier of (A) the date on which we have filed all our required reports with the SEC for a period of 12 consecutive months and (B) December 31, 2012; and
•Increased the interest payable at the October 1, 2007 interest payment date by $20.00 per $1,000 principal amount of the 2024 Debentures.
In November 2006, Vitesse completed a second Consent Solicitation of the holders of Vitesse's 2024 Debentures resulting in the following:
•The holders of the Debentures and the Trustee under the Indenture agreed that, for 18 months after effectiveness of the amendments the Trustee would forbear from taking any action to exercise any rights or remedies that relate to the filing of reports required under the Exchange Act;
•The Company agreed not to repay the Debentures pursuant to the purported acceleration request sent by the Trustee to the Company during the last six months of the forbearance period;
•The Company and the holders of the Debentures agreed to amend the Indenture to decrease the conversion price of the Debentures permanently from $3.92 per share of Vitesse's common stock to $2.546 per share of Vitesse's common stock, subject to further adjustment as set forth in the Indenture; and
Table of Contents
•The Company agreed to increase the repurchase price with respect to the October 1, 2009 repurchase right from 100% to 113.76% of the principal amount of the Debentures to be purchased, plus accrued and unpaid interest (the October 1, 2014 and October 1, 2019 repurchase rights would not be changed).
In December 2006, the Company announced that the Special Committee had completed its review and presented details of its finding in a Financial Release and Form 8-K filing. These results are discussed in detail below under "The Special Committee—Findings and Recommended Actions."
In June 2007, the Board of Directors engaged BDO Seidman, LLP as Vitesse's independent registered public accountants.
In October 2007, Vitesse entered into a proposed settlement of all federal securities class action claims that were filed against the Company and all related federal and state shareholder derivative actions relating to allegations of stock option backdating and accounting manipulations. The proposed settlement is discussed in more detail under "Legal Proceedings."
In April 2008, the District Court approved the settlement of the consolidated securities class actions filed against Vitesse and certain current or former directors and officers of Vitesse alleging violations of Sections 10(b) and 20(a) of the Exchange Act and Rule 10b-5 promulgated thereunder on behalf of a class of purchasers of Vitesse common stock. The settlement is discussed in more detail under "Legal Proceedings."
In August 2008, the District Court granted final approval of settlements in the federal and state derivative actions filed on behalf of Vitesse against certain current or former directors and officers of Vitesse, and nominally against Vitesse alleging breach of fiduciary duty, abuse of control, gross mismanagement, waste of corporate assets, unjust enrichment, constructive trust, rescission, accounting manipulations, and violations of California Corporations Code Sections 25402 and 25403. The settlement is discussed in more detail under "Legal Proceedings."
In September 2008, Vitesse completed and filed its Annual Report on Form 10-K containing audited financial statements for the years ending September 30, 2006 and 2007.
In December 2008, Vitesse completed and filed its periodic reports on Form 10-Q for the periods ended December 31, 2007, March 31, 2008 and June 30, 2008 and its annual report on Form 10-K for the fiscal year ended September 30, 2008.
On June 15, 2009, Vitesse announced that it had reached a settlement of its lawsuit against KPMG, its former auditors, for malpractice; pursuant to which, KPMG agreed to pay the Company $22.5 million. The final settlement is discussed in more detail under "Legal Proceedings."
The Special Committee—Findings and Recommended Actions
In December 2006, the Special Committee completed its investigation and released its report to the public in a Financial Release and Form 8-K. The Special Committee found that members of prior management utilized improper accounting practices primarily related to revenue recognition and inventory, and prepared or altered financial records. Based on the review of the Special Committee, our management determined that it would likely be unable to prepare and publish audited financial statements for its fiscal year ended September 30, 2005 and prior periods, but would be able to do so for periods thereafter, upon reconstruction of the beginning account balances for the year ended September 30, 2006. The Special Committee's findings are discussed in more detail below.
Table of Contents
Stock Options
The Special Committee found that:
•Members of the Company's former senior management team backdated and manipulated the grant dates of stock options granted by the Company over a number of years;
•Such backdating and manipulation resulted in lower exercise prices for the stock options; and
•Members of the former senior management team of the Company subsequently attempted to create or alter documents to conceal these practices from the Board of Directors, outside counsel, and the Special Committee.
The Special Committee did not find any evidence that members of the Board of Directors, other than Mr. Tomasetta, the Compensation Committee, or remaining members of senior management were aware of improper practices related to stock options. The Special Committee also did not find evidence that members of the Board of Directors, other than Mr. Tomasetta, profited from such practices, although, the Special Committee did identify a single option grant to members of the Board of Directors in 1996, which appeared to be inadvertent, that had the effect of increasing the profit to some members of the Board of Directors upon exercise by approximately $18,000 each. In December 2006, all of the members of the Board of Directors who received the 1996 grant, other than Mr. Tomasetta, voluntarily agreed to remit such amount to the Company. Finally, the Special Committee instructed management to finalize a review of all stock options granted from the inception of the Company's issuance of options and the related historical measurement dates to determine the appropriate amount to be reflected as a restatement of accumulated deficit.
All members of the senior management team that were found to have been involved in the backdating and document integrity issues are no longer with the Company and included Louis R. Tomasetta, the Company's former Chief Executive Officer, Yatin Mody, the Company's former Chief Financial Officer, and Eugene F. Hovanec, the Company's former Executive Vice President.
Revenue Recognition and Inventory
As part of its investigation into the Company's option practices, the Special Committee found evidence of improper accounting practices. Moreover, the Special Committee found evidence that certain officers and employees prepared and altered documents and our financial records in an attempt to conceal some of these practices from our Board of Directors and our then independent public accountants, KPMG, LLP. All of the employees identified by the Special Committee as having been aware of, and involved with, these accounting issues are no longer employed by us. In addition, in its report the Special Committee directed management to undertake the necessary steps to remediate the shortcomings in its accounting environment.
Review of All Options Issued by the Company through September 30, 2007
At the direction of the Special Committee and, subsequently, the Audit Committee, the Company's new senior management team, assisted by its consultants, undertook a comprehensive review of every option issued by the Company from its initial option issuance in 1987 through the year ended September 30, 2007 ("Options Grant Period"). During the Options Grant Period the Company granted stock options pursuant to employee stock option plans and director stock option plans to acquire approximately 146.1 million shares of Vitesse common stock. Such plans at all relevant times provided for option grants to be approved by the Board of Directors, a designated committee of non-employee directors, or in the case of the director stock option plans, by the Board of Directors. Approximately 14,680 stock option grants were awarded during the Options Grant Period with 566 recorded grant dates. The Company reviewed all stock options granted during the Options Grant Period, including option grants to the Company's directors, officers, and employees (including grants to new employees,
Table of Contents
grants awarded in connection with Company acquisitions, and grants made as individual or group performance awards). The Company's review of the prior stock option granting practices included a comprehensive examination of available relevant physical and electronic documents as well as interviews with relevant personnel.
The Company's review focused on determining the amount of accounting charges and extent of adjustment to periods prior to September 30, 2005 that would be required to:
•Issue current financial statements that are in compliance with all applicable regulatory requirements, so that the Company could file any required curative disclosures with the SEC and re-establish its eligibility for listing on the NASDAQ National Market; and
•Provide an informed basis for the Company's response to the identified issues, including appropriate corrective and remedial actions.
Due to its review, the Company identified approximately $268.8 million of unrecorded additional compensation related expenses. This unrecorded additional compensation related expense was due to the difference between the fair market value of the common stock on the appropriate measurement date and the stated exercise price as well as modifications made to the original grants during the Option Grant Period. This was reflected as an adjustment to the beginning accumulated deficit balance as of October 1, 2005.
The following is a summary of the Company's additional key option related findings:
•Fair market value strike prices were supported by insufficient anecdotal evidence.
•Several grant agreements were modified by the Company, triggering variable accounting; however, such accounting treatment was not applied by the Company at the time of the modification.
•Several grants were found to have measurement dates that differed from the grant date reflected in the Company's accounting records as determined under APB 25,"Accounting for Stock Issued to Employees," resulting in intrinsic value for the grants that was not recognized and recorded by the Company at the time of the grant.
•Many option grants were found to have not been approved in accordance with the Company's stock option plans.
•The Company's historical administration of its options program included certain shortfalls relating to proper adherence to plan requirements, corporate recordkeeping, documentation, and proper accounting treatment for transactions.
Restatement Methodologies
As of October 1, 2005, the Company adopted Accounting Standard Codification ("ASC") Topic 718 Compensation—Stock Compensation ("ASC 718"); originally issued as Statement of Financial Accounting Standards ("SFAS") 123(R),"Share Based Payment," using the modified prospective transition method. Under this transition method, compensation expense is to be recognized for all share based compensation awards granted following the date of adoption as well as for all unvested awards existing on the date of adoption. Prior to October 1, 2005, the Company accounted for share based compensation awards using the intrinsic method in accordance with APB 25, as allowed under ASC 718. Under the intrinsic value method, no share based compensation expense is recognized if the exercise price of the stock option was at least equal to the fair market value of the common stock on the "measurement date." APB 25 defines the measurement date as the first date on which both the number of shares that an individual grant recipient is entitled to receive and the option or purchase price, if any, are known.
Table of Contents
In light of the findings of the Special Committee and analysis performed by the Company, the Company determined that historic measurement dates could not be relied upon and that it was necessary for the Company to remeasure all stock option awards and record the relevant charges in accordance with APB 25. In doing so, the Company utilized or considered several sources of information including, but not limited to: (i) meeting minutes of the Board and committees thereof as well as related materials; (ii) the dates on which stock option grants were entered into the Company's stock option database; (iii) other correspondence reflecting grant approval actions; and (iv) individual stock option agreements and related materials.
As a result of the problems identified above, the Company undertook a project with the help of its consultants to reflect the appropriate measurement dates and related intrinsic value information in its accounting records. As a result of this analysis, the Company recognized an additional $268.8 million in compensation related expenses, before taxes, related to fiscal years prior to and including the year ended September 30, 2005. In addition to the compensation expense resulting from the correction of option measurement dates, the Company recognized expense for payroll taxes, interest, and penalties related to the historical underreporting of employees' gains on the exercise of misdated options. The Company's settled the employee payroll taxes and related interest and penalties resulting from the misdating of stock options in the third quarter of fiscal 2009 in the amount of $0.9 million.
As a result of the investigation described above, we recorded an additional charge for cumulative compensation expense of approximately $268.8 million to our accumulated deficit balance as of October 1, 2005.
Remedial Actions of the Company
The Company's management, Board of Directors, Audit Committee, and other relevant governing committees and bodies are committed to the ongoing review, implementation, and enhancement of the Company's procedures and controls as a result of the aforementioned findings. The Company is currently continuing its assessment of a wide range of possible procedural enhancements and remedial actions as a result of the findings of the Special Committee, the Company's consultants, and current management.
While the Company has not completed its considerations for all such actions, procedural improvements and enhancements include but are not limited to the following:
•Louis R. Tomasetta, the Company's former Chief Executive Officer, Yatin Mody, the Company's former Chief Financial Officer, and Eugene F. Hovanec, the Company's former Executive Vice President, were immediately placed on administrative leave at the commencement of the review of the Special Committee and were terminated as officers and employees in May 2006;
•Shortly after Louis R. Tomasetta was placed on administrative leave, the Board formed an Executive Committee of the Board comprised of all directors of the Company other than Mr. Tomasetta. Since that time, all Board action has been taken either by the Executive Committee or at meetings of the Board in which Mr. Tomasetta was provided notice but did not participate;
•Several senior management changes have been made including the appointment of Christopher R. Gardner as Chief Executive Officer in May 2006, the appointment of Richard C. Yonker as Chief Financial Officer in December 2006, and the engagement of Alvarez & Marsal, LLC, specifically Shawn C.A. Hassel of that firm, in April 2006, as interim Chief Financial Officer until Mr. Yonker was appointed as Chief Financial Officer. In December 2006, Mr. Hassel was appointed Chief Restructuring Officer to assist Mr. Gardner with continued improvements to operations and to assist Mr. Yonker in the continued re-staffing of the Company's financial group and the implementation of remedial actions recommended by the
Table of Contents
We have incurred substantial expenses for legal, accounting, tax, and other professional services in connection with the Special Committee investigation and related findings, the Company's internal review of historical financial statements, internal and external investigations and inquiries, related litigation, and renegotiations of our debt arrangements due to violations of our covenants and other filing requirements. These expenses totaled $4.1 million and $10.8 million for the years ended September 30, 2009 and 2008, respectively. Similar expenses incurred through September 30, 2007 were in excess of $30.1 million.
Industry Trends and Characteristics that Affect Ourthe Company's Business
In order to achieve sustained, increasing profitability, wethe Company must achieve a combination of revenue growth, increases in margins, and reductions incareful control of its operating expenses. We continueThe Company continues to focus on improving each of these components of ourits financial model.
In 2009, we faced particularly strong challenges due tofiscal year 2010, the very poor market environment for semiconductors. Our customers took aggressive actions to reduce orders and adjust inventories. As a result we saw sequential declines of our product revenues in both the first quarter ended December 31, 2008 and in the second quarter ended March 31, 2009. Overall, product revenue declined from $218.5 million in fiscal 2008 to $154.9 million in fiscal 2009, a decline of 29.1%. Our core business, Carrier and Enterprise networking, had a smaller proportional decline,Networking markets showed improvements from $169.5 millionthe severely depressed conditions in fiscal 2008year 2009. While improved, market conditions have not yet returned to $129.4 millionthe strength seen prior to the recession. The recovery was generally stronger in fiscal 2009, a decline of 23.7%. In addition, our non-core product revenues continuedEnterprise segments than in Carrier segments, where demand has remained highly variable from quarter to decline from $49.1 million in fiscal 2008 to $25.6 million in fiscal 2009, a decrease of 47.9%. In response, we reduced overall operating expenses from $220.2 million in fiscal 2008 to $155.8 million in fiscal 2009 a decrease of 29.2%. This was done by implementing a variety of aggressive cost-cutting measures including reduction in workforce of approximately 12%, reduction in salaries for almost all employees, and improved efficiencies in operations. We saw improving economic trends in the second half of the year that allowed us to show sequential revenue growth in third and fourth quarter of fiscal 2009.
Table of Contents
quarter. During the year, the supply chain for semiconductor products, including wafer fabrication, assembly, and testing, experienced extended lead times and periodic shortages as the overall demand for consumer electronics recovered. Due to the depressedthese market conditions, many of ourthe Company's major customers and the industry in general, have been going through substantial consolidations,experienced increasing the unpredictability of these end markets.and variability in their business. In spite of these difficultcontinued challenging business conditions, we believethe Company believes that the long-term prospects for the markets that we participatethe Company participates in remain strong. We believe we are investing in the fastest growing segments of these markets.
OurThe Company's ability to achieve sustained revenue growth will depend on several factors including increasing demand from ourits end markets, ourits ability to capture and maintain market share in growing markets, the rate at which these new markets ramp into production, and the continuing trend by systems companies to outsource the designing and manufacturing of ICs to companies such as ours.Vitesse.
OurThe Company believes it is investing in the fastest growing segments of its target markets. The Company has invested in two major trends in networking:
- 1.
- The migration of almost all networks to Ethernet-based technologies. This migration is happening now in Enterprise and Carrier Networks, and the Company anticipates further opportunities in cloud computing and smart grids in the future.
- 2.
- The need for more bandwidth that will drive increasing speeds in the networks.
The Company's new products address the two largest and fastest growing segments—Carrier Ethernet and Enterprise Networking. Many also serve the biggest market—Carrier Mobile Infrastructure—as that market starts to require Carrier Ethernet capabilities.
The Company's future revenue opportunities will, in part, be determined by ourthe Company's ability to participate and capture new "design wins" within ourthe Company's major customer base. This opportunity depends in large part on ourthe Company's ability to develop, deploy, and sell these products in a timely manner with features that compete effectively against the competitors in ourthe Company's markets.
In 2010, the Company set an aggressive goal to deploy 30 new products to the market. On September 29, 2010, the Company announced the VSC7111, an 11.5-Gbps quad-channel signal conditioner for PCIe Gen3 applications as the 30th new product released in fiscal year 2010, an increase of 260% from the average number of new products introduced over the prior three year period. The majorityincrease is a result of our sales effort isthe Company's focus on deploying its intellectual property into products based on Ethernet technology that can be leveraged across large markets in Enterprise and Carrier Networking. The Company's new product releases were focused in four growth product lines: 20 products in its Ethernet Switching and PHY product line, 10 products in its Connectivity product line.
The Ethernet Switch and PHY products allow the Company's customers to develop highly integrated, low power switches in SME and other Enterprise Networking applications, as well as wireless cell site routers, microwave backhaul equipment, and switching subsystems in Carrier Networking applications. The Company's new products in connectivity include new crosspoint switches and signal conditioners with data rates from 1 Gbps to 12 Gbps. These products have very earlybroad applications across a variety of markets, and again, re-affirm Vitesse's leadership in low-power connectivity solutions for telecom, data center, and video equipment. The Company believes that the developmentnew products introduced in fiscal year 2010 will substantially improve its ability to address the needs of our customers' systems, where we competeits customer base.
The Company competes for market share based on its customers' selection of ourthe Company's components over our competitors.its competitors during the design phase of its customers' systems. The Company's ability to compete is dependent on the needs of its customers, how well its products address these needs, its corporate relationships, and a variety of other factors. Once selected for a "design win," we havethe
Table of Contents
Company has a high probability of holding the majority market share for this product. Many of ourthe Company's large customers have their own internal design teams, which causes usthe Company to compete against these teams when ourits customers makeconsider a "make vs. buy" decision. The trend in the industry has been, and continues to be, to outsource more designs to companies such as ours.Vitesse. While we expectthe Company expects this trend to continue, we view thisthe Company views these "internal" design effortefforts as a significant competitive threat. The "design win" is a critical milestone in the path to generating revenue, as ourthe Company's products, and ourthe Company's customers' products, are highly complex and typically require many years of development, testing, and qualification before they reach full production. As a result, it may be difficult to forecast the potential revenue from new and existing products at the time we begin ourthe Company begins its development efforts or achieve ourachieves its "design wins." In fiscal 2009, we attained our internal design win goals set at the beginning of the year.
OurThe Company's ability to improve margins depends upon several factors, including ourthe Company's ability to continue to reduce ourits cost of revenues, including ourits wafer, assembly, and test costs, ourits ability to improve manufacturing yields, ourits ability to continue to migrate ourits products to next-generation process nodes, and ourits ability to reduce average selling price ("ASP") erosion. The Company has active programs in place to address each of these factors.
As a fabless semiconductor company, we outsource a substantial amountCompany, the Company outsources the majority of our manufacturing, including 100% of our wafer and package assembly fabrication.its manufacturing. As such, wethe Company must manage ourits supply chain efficiently to ensure competitive materials pricing and effective lead-times for the materials that we purchase.the Company purchases. The semiconductor industry in which we competethe Company competes is highly cyclical. Typically, in periods of strong demand in the semiconductor industry, wethe Company may experience longer lead times, difficulties in obtaining capacity and/or meeting commitments to ourfor its required deliveries. In addition, we are subject to occasional supply chain issues such as EOL notices on certain material and/or products that may impact our ability to continue to support certain products that may impact revenue and/or require us to incur additional costs to provide alternative sources. WhileToday, 100% of ourits wafer fabfabrication and assembly is outsourced, today, we performoutsourced. During 2010, the Company successfully moved 'wafer probe' and 'final test' at ourtesting' from its in-house test facility in Camarillo, California. In 2009, we began a process to move the large majority of this facilityCalifornia to an outsourced test operation in Asia. We expect this process to take 9-12 months to complete, at the end of which the majority of our products will be tested in Asia at an outsourced test facility.Asian subcontractor. This production model haswill provide the Company substantial advantages in terms of lower fixed cost, reduced cycle times, and lower inventory levels.
Improving product yields is critical to maintaining and improving ourthe Company's cost of revenues. We haveThe Company has a team of engineers focused on yield improvements. Yields are affected by a variety of factors including design quality, wafer fabrication, assembly and test processes and controls, product volumes, and life cycles. We workThe Company works closely with all ourits manufacturing subcontractors to improve product manufacturability and yields. We manufactureThe Company manufactures a wide variety of products, some at low volumes, which likely limits our
Table of Contents
its ability to improve yields on some products. Cost of revenues
Gross margin is also impacted by the ASP of ourthe Company's products, which is primarily determined by competitive factors within the specific markets we serve.the Company serves. Average margins vary widely within the markets we serve,the Company serves, with the Carrier Networking market having the highest average margins and the Enterprise Networking market having the lowest average margins. We endeavorThe Company endeavors to increase margins by providing products that have substantial added value relative to ourits competition.
We continueThe Company continues to focus on improving our operational efficiencies. We reduced ourhave tight control over its operating expenditures from $220.2 million in fiscal 2008 to $155.8 million in fiscal 2009. We continue to focus onexpenses. The Company considers cost of revenues, engineering, research and development ("R&D") and, selling, general and administrative costs ("SG&A") that areexpenses as operating expenses. The Company reduced overall operating expenses from $206.9 million in fiscal year 2008 to $164.3 million in fiscal year 2009 and to $161.1 million in fiscal year 2010. This reduction in spending was accomplished through implementing a variety of aggressive cost-cutting measures including reduction in workforce and improved efficiencies in operations. The Company reduced its overall headcount by 6% in 2010 while increasing its headcount in R&D. The Company continues to focus on R&D and SG&A as the major elements of operating expense.
To remain competitive, wethe Company must efficiently deploy ourits R&D resources into markets that will provide ourits future revenue growth. OurThe Company's R&D costs were reducedincreased from $50.0$45.7 million in fiscal 2008
Table of Contents
year 2009 to $45.6$51.1 million in fiscal 2009 through several cost reduction efforts including closingyear 2010 as the result of our InP fabrication facility in Camarillo, California,its stated commitment to develop and a substantial reduction in the costs of our CAD tools used to execute our designs. We believe that the majority of ourrelease 30 new products. The Company's R&D cost reductions have beencosts decreased from $50.1 million in areas outside our strategic focus and were achieved through leveraging design efficiencies derived from standardization on Ethernet-based products. In fact, we increased our headcount in R&D by 6 people or 2.5% from fiscal year 2008 to $45.7 million in fiscal year 2009. The percentage of its total headcount that is attributed to R&D has steadily increased during the last three years from 37% in 2008 to 42% in 2009 to 47% in 2010. A large part of this growth is in ourits Hyderabad, India design center where wethe Company can more efficiently execute product verification and validation. OurThe Company's India design center has been re-targeted from storage products ontoto products for Carrier and Enterprise Networking applications. We continueThe Company continues to focus ourits R&D efforts and to seek opportunities to more efficiently deploy ourits R&D resources into larger, growing markets. In 2007, we created a Strategy
The Company continues to reduce SG&A expenses. The Company's primary focus is on reducing legal, accounting and Technology Office to better identify and exploit emerging opportunities in the marketplace.
It is critical that we efficiently deploy our capital. We have continued to improve the critical operational metrics of the company, reducing cycle times, reducing total inventory,other administrative costs, and reducing the ratioits cost of slow-moving and obsolete inventory. In 2009, we continued our solid progress in this area. We reduced inventory levels from $37.5 million in fiscal 2008 to $18.8 million in fiscal 2009; increasing inventory turns from 2.8 to 4.2. We expect our move to an offshore testing facility to help us further reduce inventory levels and increase inventory turns.distribution.
As is common in the industry, we sellthe Company sells semiconductor products directly to OEMs and also useuses a number of distributors and logistics providers to sell products indirectly to ourits customer base. These channel partners enable usIn 2010, the Company continued its plans to provide improved customer support and local inventorymove more of its business to our highly distributed customer base. Oura direct model. The Company's direct gross shipments to customers were $63.0$82.5 million or 40.7%49.8% of total product revenue in fiscal 2009year 2010, compared with $55.3$49.8 million or 25.3% of total product revenue32.1% in fiscal 2008. Our indirect gross channel shipments were $105.1year 2009, and $45.3 million or 20.7% in fiscal 2009 and $175.6 million in fiscalyear 2008.
In 2009, we accelerated our plans to move more of our business to a direct model. By the fourth quarter of fiscal 2009 we shipped 49.3% of our product direct to customers. We expect to continue to transition to more direct shipments. Our The Company's accounting policy is to include all distributor channel inventory on our balance sheet as part ofuses the "sell-through" model. The "sell-through" model recognizes revenue only upon shipment of the merchandise from ourits distributor to the final customer. ForBecause the Company uses the "sell-through" methodology the Company may have variability in its revenue from quarter to quarter as customers have substantial flexibility to reschedule backlog with most of the Company's channel partners as part of the terms and conditions of sale. In addition, the "sell-through" policy requires that the Company include all distributor channel inventory on its balance sheet as part of its reported inventory. The Company's indirect gross channel sales were $83.1 million, $105.1 million, and $173.2 million in fiscal year 2010, 2009, distributors Nu Horizons Electronics, Corp. (including its subsidiary Titan Supply Chain Services), Weikeng Industrial Co. Ltd. and direct customer Huawei Technologies Co., Ltd. accounted for 36.0%, 7.5%, and 12.0%, respectively, of our net revenues. For fiscal 2008, distributors Nu Horizons Electronics, Corp. (including its subsidiary Titan Supply Chain Services), Weikeng Industrial Co. Ltd. and direct customer IBM accounted for 48.8%, 9.2% and 11.3%, respectively, of our net revenues. For fiscal 2007, distributors Nu Horizons Electronics, Corp. (including its subsidiary Titan Supply Chain Services), Weikeng Industrial Co. Ltd. and direct customer IBM accounted for 50.1%, 7.1% and 11.0%, respectively, of our net revenues.
Table of Contentsrespectively.
OurThe Company's sales are distributed geographically acrossaround the world. In 2009, 36%2010, 40.3% of ourthe Company's sales were to North America, 52%44.3% to Asia, and 12%15.4% to Europe. In 2008, 51%2009, 36.0% of ourthe Company's sales were to North America, 38%52.0% to Asia, and 11%12.0% to Europe. In 2007, 52%2008, 50.8% of ourthe Company's sales were to North America, 34%38.6% to Asia, and 14%10.6% to Europe.
It is critical that the Company efficiently deploy its capital. Inventory levels increased to $27.3 million as of September 30, 2010, from $18.8 million as of September 30, 2009. Inventory increased as its channel partners and distributors took action to increase their inventory in response to stronger demand. The Company was able to respond quickly to the change in demand by increasing orders to its suppliers.
Implementation of Ourthe Company Strategy
During the last three years, Vitessethe Company accelerated aits comprehensive strategic transformation that began in 2001 following the general decline of the telecommunications industry after the bursting of the "Internet Bubble." We havetransformation. The Company has invested heavily to enter new markets, develop new products, and penetrate new customers in an effort to diversify the Company and provide new opportunities for growth. During the last three years we have:the Company has:
- •
- Expanded its business in Europe and Asia, primarily in China, as the result of improved penetration into Tier 1 Networking OEMs. In 2010, its top customer was Huawei Technologies, the leading provider of Carrier Networking equipment in China.
- •
- Redeployed and focused its R&D resources on product developments primarily in the Carrier and Enterprise Networking markets; in 2009, despite challenging economic conditions, the Company continued to invest in R&D at a level necessary to drive future growth. In fiscal year 2010, the Company accelerated the deployment of a new generation of technology with 30 new products that will substantially advance its position in critical new markets.
Table of Contents
- •
- Transitioned to a fully outsourced manufacturing model by moving the majority of its California probe and test facility to an outsourced, offshore Asian test contractor, which was completed in 2010. This production model substantially reduced its fixed costs, reduced overall cost of test, and will allow the Company to reduce its manufacturing cycle times and better serve its growing customer base in Asia.
- •
- Divested portions of its Storage Products business that were not consistent with other areas of the Company whose products are based on Ethernet technology. The Company completed the sale of those portions to Maxim Integrated Products, Inc. ("Maxim"), on October 29, 2007, for $62.8 million plus earn-outs based on the business meeting certain criteria, as detailed in the agreement.
- •
- Exited the GaAs and InP product business and closed
ourits Camarillo, California wafer fabrication facility. Fixed assets with a zero net book value were sold for $2.5 million, net of commissions, on February 27, 2008. In 2010, we are planning
The Company is improving the efficiency of its R&D primarily by focusing its resources on two large, but independent markets: Carrier Networking and Enterprise Networking. Both of these markets rely increasingly on Ethernet technology to substantially reduce the remaining portion of our in-house manufacturing, our probedeploy next-generation networks and test facility, and move these operations to an outsourced, offshore facility.
•Divested portions of our Storage Products business that were not consistent with other areas ofservices, which allows the Company whose products are based on Ethernet technology. We completedto maximize the saleimpact of those portions to Maxim Integrated Products, Inc. ("Maxim"), on October 29, 2007, for $62.8 million plus a potential earn-out basedits R&D budget. The Company believes its focus on the business meeting certain criteria, as detailed in the agreement.
•Redeployed and focused our R&D resources on product developments primarilygrowth of Ethernet technology in Carrier and Enterprise Networking markets; In 2009, despite challenging economic conditions, we continuedNetworks is beginning to investpay dividends. New products released in R&D at a level necessary to drive future growth. In fiscal 2010 we will accelerate the deployment of a new generation of products that will substantially advance our positionexpand its served markets, allowing the Company to compete in critical newlarge, growing markets.
•Expanded our business in Europe and Asia, primarily China, as the result of improved penetration into Tier 1 networking OEMs; In 2009, our top customer was Huawei Technologies Co., Ltd., the leading provider of Carrier networking equipment in China; and
•Enhanced our top customer list to include new names such as IBM and HP in the Enterprise server, storage and networking markets and key Taiwanese ODMs in the Enterprise switch and router markets. In 2009, we continued to expand our customer list with new top 20 customers from Asia and Europe.
We continueThe Company continues to strengthen our business with a focus on improvingits operational performance and execution, creating efficiencies in our R&D efforts, and identifying critical emerging growth opportunities that can be addressed with our available resources. Ourexecution. Its efforts in operations include reduction in materials costs and cycle times, improved product yields, implementation of programs such as lean manufacturing, and an increased emphasis on the importance of ourits customers. These efforts are producing results, as we receiveddemonstrated by the multiple supplier awards the Company received during the year, including "Supplier of the Year"Technical Support Award from ourits largest customer, Huawei Technologies Co., Ltd.
We are improving the efficiency of our R&D primarily by focusing our resources on two large, but independent markets: Carrier Networking and Enterprise Networking. Both of these markets rely increasingly on Ethernet technology to deploy next-generation networks and services, which allows us to maximize the impact of our R&D budget. We believe our focus on the growth of Ethernet technology in Carrier and Enterprise networks is beginning to pay dividends. New products introduced in 2009 and next-generation products to be released in 2010 will substantially expand our served markets, allowing us to compete in large, new markets with high growth profiles.
Table of ContentsTechnologies.
Fiscal 20092010 Actions
On January 26, 2009, the Company reduced the base salaries of its named executive officers, effective February 1, 2009, as follows: (i) Mr. Christopher R. Gardner—20% reduction; (ii) Mr. Richard C. Yonker—10% reduction; (iii) Mr. Michael B. Green—10% reduction;In an effort to reduce costs and (iv) Mr. Martin Nuss—10% reduction. Also effective February 1, 2009, the Company suspended all matching contributions for its named executive officers in connection with the Company's 401(k) plan. In addition, there were reduced wages and benefits to substantially all other employees of the Company. These actions remained effective through the end of the Company's 2009 fiscal year. On October 1, 2009, the salaries of the Company's employees other than Mssrs. Gardner, Yonker, Green and Nuss were reinstated to the same levels as in effect prior to the reduction. On October 12, 2009, the Compensation Committee of the Company's Board of Directors reinstated the annual base salaries of Mssrs. Gardner, Yonker, Green and Nuss to the same level as in effect prior to the reduction. Such reinstatement was effective on a retroactive basis to October 1, 2009.
As of March 31, 2009,shorten manufacturing time, the Company eliminated 64 positions; approximately 12%test activities at the Camarillo, California location and outsourced testing to a third-party facility. This restructuring plan was approved in October 2009 with implementation efforts starting immediately and full transition of our total workforce. Of these 53 positions, or approximately 10%testing to the third-party completed during the third quarter of the reductionsfiscal year 2010. This restructuring plan included the termination of approximately 50 employees. In connection with this restructuring, the Company recorded restructuring charges of approximately $0.7 million in the workforce, relatedfirst quarter for severance costs to full-time employees;be incurred during the remaining reductions related to temporary staffing.fiscal year ended September 30, 2010. The Company did not incur anycosts for impairment of fixed assets or facilities costs related to workforce reductions. All actions related to workforce reductions through March 31, 2009 are complete and the Company does not have any additional reductions planned for the remainderas part of the fiscal year. A severance expense of $0.5 million is included in our operating results for the twelve months ended September 30, 2009.restructuring plan.
OurThe Company's Business Product Lines
Beginning in 2008, Vitesse classified product revenues into three markets: Carrier Networking, Enterprise Networking and Non-Core. These classifications reflect the major trends in ourthe Company's product lines and how they map into ourits customer base. In addition, we havethe Company has an IP revenue stream that was introduced in the last quarter of 2008 and continued with the sale of certain patents in the third quarter of 2009.2008.
Carrier Networking
The global telecommunications Carrier Network, which includes networks delivering voice and data services, has grown dramatically to a complex combination of networks. These networks are often
Table of Contents
classified into groups such as Wide Area Networks ("WANs"), Metropolitan Area Networks ("MANs"), Multi-Service Access Networks ("MSANs"), and Radio Access Networks ("RANs"). Each of these types of networks has theirits own set of technical and operational challenges. These evolving networks must deliver more bandwidth and provide increasing data-based capabilities to provide "quadruple play" services that integrate voice, data and video traffic over both wired and wireless networks. To address this problem,the technical and operational problems, Carriers are increasingly trying to map Ethernet services and connectivity more efficiently into their existing networks. TheyCarriers may even replace their legacy network with new all-IP/Ethernet-based networks. Broadly, Ethernet technology upgraded to meet these requirements is being referred to as "Carrier Ethernet." ItThe upgrade is, in effect, an adaptation of Ethernet to provide the same features and functions that have traditionally been provided by "telecom" protocols such as Synchronous Optical Network ("SONET/SDH"),SDH and Plesiochronous Digital Hierarchy ("PDH"), etc.. Because of the complexity of the Carrier networks,Networks, products sold into these applications have long design cycles, typically two to four years from design start to production, and long life cycles, typically five to 10ten years or more.
Vitesse provides a variety of products intofor Carrier networkingNetworking applications. These products generally include: (i) Ethernet-over-SONET
- i.
- EoS Mappers, SONET/SDH Framers and Switches;
(ii)
- ii.
- Next-Generation OTN Mappers;
- iii.
- Signal Integrity products including Backplane Transceivers, CDR, and Crosspoint Switches;
- iv.
- Ethernet MACs and Ethernet Switches;
- v.
- Optoelectronic Physical Media Devices ("PMDs") and Physical Layer Devices ("PHYs") such as Transceivers and
Table of Contents
Clock and Data Recovery ("CDR"); (iii) Signal Integrity Products including Backplane Transceivers, CDR, for SONET and Crosspoint Switches; (iv) Ethernet Media Access Controllers ("EMACs") and Switches; (v)10 Gigabit Ethernet and;
- vi.
- Ethernet Copper
PHYs; and (vi) Next-Generation Optical Transport Network ("OTN") Mappers.PHYs that contain specialized timing capabilities for Carrier Networks
Enterprise Networking
Enterprise Networks generally include equipment dedicated to the communication of voice and data services within large Enterprise organizations. An Enterprise Network will typically be comprised of one or more LANsLocal Area Networks ("LANs") interconnecting computer systems, including workstations and servers, as well as one or more Service Access NetworksNetwork ("SANs"SAN"). Enterprise Networks will also typically include broadband connections to Carrier Networks for the broader communication of voice and/or data outside of the enterprise. Enterprise Networks are often classified into groups depending on their size and complexity. Typical categoriesCategories are large Enterprise, data center switching, small-medium enterprise ("SME"), small-medium business ("SMB"),SME, SMB, and small office home office ("SOHO").SOHO. Similar to Carrier Networks, Enterprise Networks are going through an evolution to provide more bandwidth, (i.e. more data at higher speeds) and more reliability, interoperability, and scalability. Ethernet-based networks, which are already widely deployed in LANs, are becoming more prevalent in other Enterprise applications such as data center switching and SANs. Enterprises are paring down their multiple networks (telephone, LAN, video conferencing, wireless, and remote mirroring/backup) to a common switched IP/Ethernet-based infrastructure. Ethernet technology that is being upgraded to meet these new requirements is generally referred to as "Converged Enhanced Ethernet." In addition, Enterprise Networks are migrating from fast 100 Mbps Ethernet to Gigabit Ethernet and from Gigabit Ethernet to 10 Gigabit Ethernet. This transition is still in the early stages and expected to accelerate over the next several years. The complexity of products within the Enterprise Networks varies dramatically based on the product application. Products at the "low-end" of the network, in SOHO, SME, and low-end SME applications typically have fast design cycles in the order of six to 12 months and short life cycles, in the order of two to four years. Products sold into applications at the "high-end" of Enterprise such as data center switching and high-end SME have
Table of Contents
longer design cycles, typically one to two years from design start to production and long life cycles, typically three to five years or more.
Vitesse provides a variety of products into Enterprise Networking applications. These products generally include: (i)
- i.
- Ethernet
MACs, Switches and Routers; (ii)Ethernet MACs;
- ii.
- Ethernet Copper PHYs;
- iii.
- Integrated Ethernet Switch and Copper PHYs;
- iv.
- Physical Layer Devices such as Transceivers and Clock and Data Recovery for 10 Gigabit Ethernet
Copper PHYs; (iii) Integrated Copper PHY and Switch products; and (iv) applications, and;
- v.
- Signal Integrity products including Backplane Transceivers, CDRs and Crosspoint Switches.
Non-Core
Products that do not substantially sell into the Carrier or Enterprise Networking markets, or require little orhave no current or future investment, have been classified as Non-Core products. Today, these products include legacy products from ourits Fibre Channel storage products line, ourits Raid-on-Chip processor line, ourits Network Processor product line and ourits packet-based Switch Fabric product line.
Intellectual Property
In 2008, we began to leverage our substantial IP portfolio into licensing opportunities with third-parties. We offer a variety of IP "cores" and design services in deep submicron, 130 nm and 65 nm process technologies. To date, our primary focus has been our Gigabit Ethernet Copper PHY and switch technologies as well as high-speed PHYs and signal integrity "cores."
We anticipate being able to exploit our many years of technology development by providing this technology to systems suppliers and other, non-competing semiconductor suppliers in the form of IP via licensing arrangements. We believe we are in a unique position to supply such IP to other IC vendors as we are either the technology or low-power leader for such intellectual property, or such IP is only
Table of Contents
available from IC vendors that are competing in the same markets as the companies looking for such IP. As a smaller, more focused and specialized IC vendor, we are less likely to compete with those companies.
On June 30, 2009, the Company completed the sale, assignment and transfer of certain patents (the "Vitesse Patents") from its intellectual property portfolio for consideration of IP revenue of $8.25 million. Payment was due and received on July 15, 2009. The Company incurred $1.8 million in broker's fees related to the sale. The Company recorded the broker's fees in selling, general and administrative expense. The Vitesse Patents relate to the Company's non-core business, specifically its Network Processing products.
Critical Accounting Policies and Estimates
The preparation of financial statements in accordance with U.S. generally accepted accounting principles requires usthe Company to make estimates and assumptions that affect the reported amounts of assets and liabilities at the date of the financial statements, and the reported amounts of net revenue and expenses during the reporting period. WeThe Company regularly evaluate ourevaluates its estimates and assumptions related to revenue recognition, allowance for doubtful accounts, sales returns, inventory valuation, goodwill and purchased intangible asset valuations, share-based compensation expense, income taxes and income taxes. We base ourR&D. The Company bases its estimates and assumptions on current facts, historical experience and on various other factors that we believethe Company believes to be reasonable under the circumstances, the results of which form the basis for making judgments about the carrying values of assets and liabilities and the recording of revenues and costs and expenses that are not apparent from other sources. The actual results experienced by usthe Company may differ materially and adversely from ourits estimates. To the extent there are material differences between ourits estimates and the actual results, ourits future results of operations will be affected.
We believeThe Company believes the following are either: (i) critical accounting policies that require usthe Company to make significant judgments and estimates in the preparation of our consolidated financial statements;its Consolidated Financial Statements; or (ii) other key accounting policies that generally do not require usthe Company to make estimates or judgments but may be difficult or subjective.
Revenue Recognition, Sales ReturnsWarranty Reserve and Allowance for Doubtful Accounts
In accordance with ASC Topic 605 Revenue Recognition ("ASC 605"); originally issued as SEC Staff Accounting Bulletin ("SAB") No. 101,"Revenue Recognition in Financial Statements," as codified by SAB 104, "Revenue Recognition," ("SAB 104") we recognize the Company recognizes product revenue when the following fundamental criteria are met: (i) persuasive evidence of an arrangement exists; (ii) delivery has occurred; (iii) the price to the customer is fixed or determinable;determinable, and (iv) collection of the sales price is reasonably assured. Delivery occurs when goods are shipped and title and risk of loss transfer to the customer, in accordance with the terms specified in the arrangement with the customer. Revenue recognition is deferred in all instances where the earnings process is incomplete. We recognizeThe Company recognizes revenue on goods shipped directly to customers at the time of shipping, as that is when title passes to the customer and all revenue recognition criteria specified above are met.
Table of Contents
Vitesse has a distribution network through which it sells most of its products. The Company recognizes revenue on a sell-through basis for all distributors, utilizing information provided by the distributors. This revenue recognition method does not allow revenue to be recognized when shipped to a distributor, i.e., into the channel, but only when the distributor sells inventory to the end-user.
As of September 30, 2010 and 2009, these distributors maintainedheld inventory balances of $6.0 million and $3.6 million, which are carried on the books of Vitesse, andVitesse. The distributors are given business terms tothat allow for the return of a portion of inventory and receivedistributor credits for changes in selling prices to end customers.customers, respectively. At the time Vitesse ships inventory to the distributors, the magnitude of future returns and price adjustments is not known. Therefore, revenue recognition for shipments to distributors does not occur until the distributors sell inventory to end customers. Payments received from distributors for inventory shipped to them, in
Table of Contents
advance of the sale of that inventory to the end-user, are shown as deferred revenue. Vitesse personnel are often involved with the sales from the distributors to end customers.
AtAs of September 30, 2010 and 2009, approximately 1.2% and 2.2% of ourthe Company's inventory is consigned and located with two customers.customers, respectively. Consistent with ourits revenue recognition policy, we recognizethe Company recognizes revenue when the customer pulls the inventory for use, as that is when title passes to the customer and all revenue recognition criteria specified above are met.
Revenues from development contracts are recognized upon attainment of specific milestones established under customer contracts. Revenues from products deliverable under development contracts, including design tools and prototype products, are recognized upon delivery. Costs related to development contracts are expensed as incurred.
In accordance with ASC 605, when licensing technology and other intangibles, delivery is not deemed to occur for revenue recognition purposes until the license term begins. Revenues are recognized in a manner consistent with the nature of the transaction and related earnings process. Based on management's analysis of the license terms, and pursuant to the guidance in ASC 605, revenue related to the licensing of intellectual property ("IP") is deferred until delivery has occurred and final acceptance of the contracted deliverables is received from the licensee.
We record aThe Company generally warrants its products against defects for one year from date of shipment. A warranty reserve is recorded against revenue when products are shipped. At each reporting period, the Company adjusts its reserve for estimated sales returns and allowances in the same period as the related revenues are recognized. Sales returns typically occur for quality related issues and allowances arewarranty claims based on specific criteria suchits actual warranty claims experience as rebate agreements. We base these estimates on oura percentage of net revenue for the preceding 12 months and also considers the impact of known operational issues that may have a greater impact than historical experience or the specific identificationtrends. Historically, its warranty returns have not been material. As of an event necessitating a reserve. To the extent actual sales returns or allowances differ from our estimates; our future results of operations may be affected.September 30, 2010 and 2009, its warranty reserve was $385,000 and $295,000, respectively.
We also maintain an allowance for doubtful accounts for estimated losses resulting from customers' inability to meet their financial obligations to us. We evaluateThe Company evaluates the collectability of accounts receivable on a monthly basis based onusing a combination of factors.factors, including whether any receivables will potentially be uncollectible. The Company includes any accounts receivable balances that are determined to be uncollectible in the overall allowance for doubtful accounts using the specific identification method. After all attempts to collect a receivable have failed, the receivable is written off against the allowance. Management believesThe Company has assessed the allowance for doubtfulcollectability of accounts as ofreceivable at September 30, 2010 and September 30, 2009 and 2008,determined that no allowance is adequate.required. However, if the financial condition of any customer were to deteriorate, resulting in an impairment of its ability to make payments, additional allowancesan allowance could be required.
Inventory Valuation
Inventories are stated at the lower of cost or market (net realizable value). Costs associated with the development of a new product are charged to engineering, research and development expense as incurred, until the product is proven through testing and acceptance by the customer. At each balance
Table of Contents
sheet date, the Company evaluates its ending inventory for excess quantities and obsolescence. This evaluation includes analyses of sales levels by product and projections of future demand.
We writeThe Company writes down ourits inventory for estimated obsolete or unmarketable inventory in an amount equal to the difference between the cost of inventory and the estimated market value based upon assumptions about future demand and market conditions. If actual market conditions are less favorable than ourits estimates, additional inventory write-downswrite-down may be required. In the event we experiencethe Company experiences unanticipated demand and areis able to sell a portion of the inventory we haveit has previously written down, ourits gross margins will be favorably affected.
Valuation of Goodwill Purchasedand Intangible Assets, and Long-Lived Assets
Goodwill is recorded as the difference, if any, between the aggregate consideration paid for an acquisition and the fair value of the net tangible and intangible assets acquired. The amounts and
Table of Contents
useful lives assigned to intangible assets acquired, other than goodwill, impact the amount and timing of future amortization, and the amount assigned to in-process research & development is expensed immediately. The value of intangible assets, including goodwill, can be impacted by adverse changes such as declines in operating results, a decrease in stock value, changes in the worldwide economy or a specific industry or a failure to meet performance projections.
We account for goodwill and other intangible assets in accordance with ASC Topic 350 Intangibles—Goodwill and Other ("ASC 350"); originally issued as SFAS No. 142, "Accounting for Goodwill and Other Intangible Assets." We evaluate these assets, including purchased intangible assets deemed to have indefinite lives, on an annual basis in the fourth quarter, or more frequently, if we believe indicators of impairment exist or changes in circumstances indicate that the carrying value may not be recoverable. Factors we consider important that could trigger an impairment review include significant underperformance to historical or projected operating results, substantial changes in our business strategy, and significant negative industry or economic trends.
If such indicators are present, we compare the fair value of the goodwill to its carrying value. Fair value of goodwill is determined by considering the Company's market capitalization, discounted cash flows, and a market approach as of the valuation date. In considering the Company's market capitalization, an estimated premium to reflect the fair value on a control basis is applied. This premium is estimated based on an evaluation of control premiums identifiable in comparable transactions.
For other intangible assets and long-lived assets, in accordance with ASC Topic 360 Property, Plant, and Equipment ("ASC 360"); originally issued as SFAS No. 144, "Accounting for the Impairment or Disposal of Long-Lived Assets" we determine whether the sum of the estimated undiscounted cash flows attributable to each asset in question is less than its carrying value. If less, we recognize an impairment loss based on the excess of the carrying amount of the assets over their respective fair values. Fair value of other intangible assets is determined by discounted future cash flows, appraisals, or other methods. Fair value of long-lived assets is determined based on market value. If the long-lived asset determined to be impaired is to be held and used, we recognize an impairment charge to the extent the fair value attributable to the asset is less than the asset's carrying value. The fair value of the long-lived asset then becomes the asset's new carrying value, which we amortize over the remaining estimated useful life of the asset.
These approaches use significant estimates and assumptions, including projection and timing of future cash flows, discount rates reflecting the risk inherent in future cash flows, and long-term growth rates. It is reasonably possible that the estimates and assumptions used to value these assets differ from future actual results. If our actual results, or the estimates and assumptions used in future impairment analyses, are lower than the original estimates and assumptions used to assess the recoverability of these assets, we could incur additional impairment charges.
During the quarter ended December 31, 2008, we identified changes in key factors indicating a possible impairmentthe Company performed an analysis of the value of our goodwill. Notable indicators were significantly depressed market conditions and industry trends, market capitalization below book value of equity and some downward revisions to our forecasts due to current economic conditions. These continually changing market conditions make it difficult to project how long the current economic downturn may last. Declining market values have negatively impacted our valuations, which are a component of ourits goodwill impairment tests. Based on this information we completed the first step of our goodwill impairment test and determined that additional impairment analysis was required by ASC 350.
The second step of the goodwill impairment test compared the implied fair value of our Company's goodwill with the carrying amount of that goodwill. Since the carrying amount of goodwill exceeded the implied fair value of that goodwill, an impairment loss was recognized in an amount equal to that excess. The implied fair value of goodwill was determined in the same manner as the
Table of Contents
amount of goodwill recognized in a business combination. The fair value was determined through an analysis of: (i) the market capitalization; (ii) comparable public company valuations; and (iii) the future cash flows expected to be generated by the Company. The calculated fair value was then allocated to individual assets and liabilities (including any unrecognized intangible assets) as if the Company had been acquired in a business combination and the fair value of the Company was the purchase price paid to acquire the Company. In performing this allocation, the fair values of the assets of the Company were calculated using generally accepted valuation methodologies, including analysis of: (i) the future cash flows expected to be generated; (ii) the estimated market value; or (iii) the estimated cost to replace. Any variance in the assumptions used to value the assets and liabilities could have had a significant impact on the estimated fair value of the assets and liabilities and consequently the amount of identified goodwill impairment.goodwill. As a result of the additional analyses performed, weanalysis, the Company recorded an impairment charge to fully write-off ourwrite off its goodwill balance of $191.4 million forduring the quarter ended December 31, 2008.
Other intangibleIntangible assets which consist primarily of technology and IP, are amortized over their estimated useful lives. The remaininglives unless these lives are determined to be indefinite. Intangible assets are carried at cost less accumulated amortization. Amortization is computed over the useful lives of thesethe respective assets, range from less than one yeargenerally two to threeten years. As required by ASC 360 we verified our long-lived assets were not impaired as of the time of the goodwill impairment.
Valuation of Repurchase Right onCompound Embedded Derivative related to Subordinated Debentures
In accordance with ASC Topic 815 Derivatives and Hedging ("ASC 815"); originally issued SFAS No. 133,, "Accounting for Derivative Instruments and Hedging Activities," embedded derivatives must be bifurcated from the underlying debt instrument and valued as a separate financial instrument. Our 1.5% Convertible Subordinated Debentures due 2024 (the "2024 Debentures") includes a repurchase right for 113.76%Management evaluated the terms and features of the principal amount of the 20242014 Debentures on October 1, 2009and identified an embedded derivative (the "premium put""compound embedded derivative" or "derivative liability") that we have identified as an embedded derivative requiring bifurcation and accounting at fair value because the economic and contractual characteristics of the premium putcompound embedded derivative meet the criteria for bifurcation and separate accounting as set forth in ASC 815. We estimate815 due to the conversion price not being indexed to the Company's own stock. Any gain or loss on the fair value of the compound embedded derivative will be reflected in current earnings. The compound embedded derivative is comprised of the conversion option and a make-whole payment for foregone interest if the holder converts the debenture early. The Company estimated the approximate fair value of the premium putcompound embedded derivative as the difference between the estimated value of the 20242014 Debentures with and without the premium put feature.compound embedded derivative features. The fair value of the 20242014 Debentures with the embedded premium put feature was estimated using a scenario analysis that incorporated the investment and settlement alternatives available to the debt holders in connection with the premium put feature. The scenario analysis valuation model combined expected cash outflows with market-based assumptions and an estimate of the probability of each scenario occurring. The fair value of the 2024 Debentures without the embedded premium put feature was estimated using a convertible bond valuation model within a lattice framework. These valuations were determined using Level 3 inputs. The convertible bond valuation model combined expected cash outflows with market-based assumptions regarding risk-adjusted yields, stock price volatility and recent price quotes and trading information regarding shares of ourits common stock into which the 20242014 Debentures are convertible. OurThe Company's analysis iswas premised on the assumption that the holder would act in a manner that maximizes the potential return, or "payoff","payoff," at any given point in time. Included in this premise iswas the assumption that the holder would compare the potential return associated with each available alternative, including, as specified in the terms of the contract,2014 Debentures, holding the debt instrument, exercising an equity conversion option, or exercising a put option. As a component of this, we incorporated a market participant consideration as to the Company's capacity to fulfill the contractual obligations associated with each alternative, including the Company's ability to fulfill any cash settlement obligation associated with exercise of the put option, as well as the Company's ability to refinance the contractual obligation. Based on our analysis, we determined that the fair value of the premium put is most sensitive to the estimated amount of funds available for settlement of the liability on October 1, 2009. More specifically, fair value of the premium put is positively correlated to the estimated amount of cash proceeds and other securities expected to be received at exercise. Should the premium put have value, any gain or loss on the fair value of the premium put will be reflected in current earnings. The
Table of Contents
result On October 30, 2009, the date of our valuation analysisissuance, the fair value of the bifurcated compound derivative was that premium put$28.0 million. As of September 30, 2010, the fair value of the bifurcated compound derivative was estimated$15.5 million, with the change reflected in the Consolidated Statement of Operations for the year ended September 30, 2010. The change in the fair value of the bifurcated compound derivative is a non-cash item resulting from the increase or decrease in the market price of the underlying common stock. Should the holders convert the 2014 Debentures and receive the make-whole payments, settlement may be, at the Company's election, in shares of the Company's common stock. Should the holders exercise their rights to have $12.2 million fair valueconvert, the Company intends to settle these obligations in common shares. As the Company intends to, and has the ability to, satisfy the obligations with equity securities, in accordance with ASC 470, the Company has classified the liability as a long-term liability on its Consolidated Balance Sheet as of September 30, 2009 and no fair value as of September 30, 2008. Upon exercise of the put option related to the 2024 Debentures on October 1, 2009 (See Note 14—Subsequent Events), the liability associated with the premium put was recorded at $13.3 million representing the contractual amount owed to the debenture holders upon exercise of the put. The fair value of the premium put is measured using Level 3 inputs. The primary driver of the change in fair value between these dates was an increase in the amount of funds, both cash and other securities, available for settlement between the measurement dates.2010.
Accounting for Share-BasedShare based Compensation
The Company adopted Accounting Standard Codification Topic 718 Compensation—Stock Compensation ("ASC 718"). ASC 718 requires all share-based payments, including grants of stock options and employee stock purchase rights, to be recognized in ourthe Company's financial statements based on their respective grant date fair values. Under this standard,
ASC 718 requires companies to calculate the faircompensation cost of full-value awards, such as restricted stock, based on the market value of each employeethe underlying stock option and employee stock purchase right is estimated onat the date of grant using an option-pricing model that meets certain requirements.
the grant. ASC 718 requires companies to estimate the fair value of share-based payment awards on the date of grant using an option-pricing model. The value of the portion of the award that is ultimately expected to vest is recognized as expense ratably over the requisite service periods. We haveThe Company has estimated the fair value of each award as of the date of grant using the Black-Scholes option pricing model, which was developed for use in estimating the value of traded options that have no vesting restrictions and that are freely transferable. The Black-Scholes model considers, among other factors, the expected life of the award and the expected volatility of the Company's stock price. Although the Black-Scholes model meets the requirements of ASC 718, the fair values generated by the model may not be indicative of the actual fair values of ourthe Company's awards, as it does not consider other factors important to those share-based payment awards, such as continued employment, periodic vesting requirements, and limited transferability. Because the share-based compensation expense recognized in the statements of operations for the periodsyears ended JuneSeptember 30, 2010, 2009 and 2008 is based on awards ultimately expected to vest, it has been reduced for estimated forfeitures. ASC 718 requires forfeitures to be estimated at the time of grant and revised, if necessary, in subsequent periods if actual forfeitures differ from those estimates. Changes in forfeitures from the estimates made at grant date could result in more or less non-cash compensation expense in comparable periods.
Assets and Liabilities of a Business Held for Sale
In accordance with ASC 360 we classify the assets and liabilities of a business as held for sale when management approves and commits to a formal plan of sale and it is probable that the sale will be completed. The carrying value of the net assets of the business held for sale are then recorded at the lower of their carrying value or fair market value, less costs to sell. On December 22, 2008, we closed the sale of the Colorado land and building to a third-party. The gross sales price was $6.5 million. The facility, which was previously used for the Storage Products business, remained unused since the sale of that business on October 29, 2007. As a result, the net book value of $3.2 million was reported as "Asset Held for Sale" on the September 30, 2008 balance sheet. We recognized a gain of approximately $2.9 million on this sale in the first quarter of fiscal 2009.
Income Taxes
The Company accounts for income taxes using ASC Topic 740 740—Income Taxes ("ASC 740"); originally issued as SFAS No. 109, "Accounting for Income Taxes.". Under ASC 740, income taxes are accounted for under the asset and liability method. Deferred tax assets and liabilities are recognized for the future tax consequences attributable to differences between the financial statement carrying amounts of existing assets and liabilities and their respective tax basisbases and operating loss and tax credit carryforwards. Deferred tax assets and liabilities are measured using enacted tax rates expected to apply
Table of Contents
to taxable income in the years in which those temporary differences are expected to be recovered or settled. The effect on deferred tax assets and liabilities of a change in tax rates is recognized in income in the period that includes the enactment date. The Company adopted the provisions of the Financial Accounting Standards Board ("FASB") Interpretation No. 48,ASC Subtopic 740-10, "Accounting for Uncertainty in Income Taxes" (ASC 740), and an interpretation of SFAS 109 (ASC 740), on October 1, 2007formerly Fin 48 ("ASC 740-10") and assessed the impact of FIN 48 (ASC 740)ASC 740-10 on its financial statements and determined that no adjustment to retained earnings was necessary.
Table of Contents
The Company maintains a valuation allowance on the deferred tax assets for which it is more likely than not that the Companyit will not realize the benefits of these deferred tax assets in future tax periods. The valuation allowance is based on estimates of future taxable income byin each tax jurisdiction in which the Company operates, the number of years over which the deferred tax assets will be recoverable, and scheduled reversals of deferred tax liabilities. ASC 718 allows the benefit related to deductible temporary differences attributable to non-qualified stock options to be credited to additional paid-in-capital when realized. Because the Company iswas in a net operating loss position as of September 30, 20082010 and 2007,2009, it maydid not recognize a benefit arising from non-qualified stock options for those respective years.
In assessing the realizability of deferred tax assets, management considers, on a periodic basis, whether it is more likely than not that some portion or all of the deferred tax assets will not be realized. As of September 30, 20082010 and 2007,2009, management has placed a valuation allowance against all deferred tax assets based on its overall assessment of the risks and uncertainties. Accordingly, management believes the current valuation allowance on deferred tax assets is sufficient and properly stated at June 30, 2009 and September 30, 2008.2010 and 2009.
Research and Development
Research and development expense consists primarily of salaries and related costs of employees engaged in research, design and development activities, including share-based compensation expense. Research and development expense also includes costs related to engineering design tools, masks and prototyping costs, subcontracting costs and facilities expenses.
Impact of Recent Accounting Pronouncements
In June 2009, For information with respect to recent accounting pronouncements and the FASB issued ASC Topic 105 Generally Accepted Accounting Principles ("ASC 105"); originally issued as SFAS No. 168 "The FASB Accounting Standards Codification and Hierarchyimpact of Generally Accepted Accounting Principles, a replacement of FASB Statement No. 162." ASC 105 establishes the FASB Standards Accounting Codification ("Codification") as the source of authoritative U.S. GAAP recognized by the FASB to be applied to nongovernmental entities and rules and interpretive releases of the SEC as authoritative GAAP for SEC registrants. The Codification will supersede all the existing non-SEC accounting and reporting standards upon its effective date and subsequently, the FASB will not issue new standards in the form of Statements, FASB Staff Positions or Emerging Issues Task Force Abstracts. ASC 105 also replaces FASB Statement No. 162, "The Hierarchy of Generally Accepted Accounting Principles" given that once in effect, the Codification will carry the same level of authority. The Company does not anticipate that the adoption of this statement will have a material impactthese pronouncements on its consolidated financial statement footnote disclosures. ASC 105 is effective for financial statements issued for interim and annual periods ending after September 15, 2009, which includes our fiscal year ended September 30, 2009. The adoption of this statement does not have a material impact on our results of operations, financial position or cash flows.
Table of Contents
In December 2007, the FASB issued ASC Topic 805 Business Combinations ("ASC 805"); originally issued as SFAS No. 141R,"Business Combinations." ASC 805 establishes principles and requirements for how the acquirer of a business recognizes and measures in its financial statements the identifiable assets acquired, the liabilities assumed and any non-controlling interest in the acquiree. The statement also provides guidance for recognizing and measuring the goodwill acquired in the business combination and determines what information to disclose to enable users of financial statements to evaluate the nature and financial effects of the business combination. ASC 805 is effective for financial statements issued for fiscal years beginning after December 15, 2008. Accordingly, ASC 805 is applicable to the Company's accounting for business combinations closing on or after October 1, 2009. We expect ASC 805 will have an impact on our consolidated financial statements, but the nature and magnitude of the specific effects will depend upon the nature, terms and size of the acquisitions we consummate after the effective date of October 1, 2009. The adoption of this statement did not have a material impact on our results of operations, financial position or cash flows during the year ended September 30, 2009.
In April 2009 the FASB issued ASC Topic 805 Business Combinations ("ASC 805"); originally issued as FSP No. 141R-1,"Accounting for Assets Acquired and Liabilities Assumed in a Business Combination That Arise from Contingencies." ASC 805 amends the provisions in Statement 141R for the initial recognition and measurement, subsequent measurement and accounting and disclosures for assets and liabilities arising from contingencies in business combinations. The FSP eliminates the distinction between contractual and non-contractual contingencies, including the initial recognition and measurement criteria in Statement 141R and instead carries forward most of the provisions in ASC 805 for acquired contingencies. ASC 805 is effective for contingent assets and contingent liabilities acquired in business combinations for which the acquisition date is on or after the beginning of the first annual reporting period beginning on or after December 15, 2008. We expect ASC 805 will have an impact on our consolidated financial statements, but the nature and magnitude of the specific effects will depend upon the nature, term and size of the acquired contingencies. The adoption of this statement did not have a material impact on our results of operations, financial position or cash flows during the year ended September 30, 2009.
In December 2007, the FASB issued ASC Topic 810 Consolidation ("ASC 810"); originally issued as SFAS No. 160,"Non-controlling Interests in Consolidated Financial Statements—an amendmentStatements, see Note 1 of ARB No. 51." ASC 810 addresses the accounting and reporting standards for ownership interests in subsidiaries held by parties other than the parent, the amount of consolidated net income attributableNotes to the parent and to the non-controlling interest, changes in a parent's ownership interest, and the valuation of retained non-controlling equity investments when a subsidiary is deconsolidated. ASC 810 is effective for fiscal years beginning after December 15, 2008. We do not anticipate that the adoption of ASC 810 will have a material impact on our financial statements.
In March 2008, the FASB issued ASC Topic 815 Derivatives and Hedging ("ASC 815"); originally issued as SFAS No. 161, "Disclosures about Derivative Instruments and Hedging Activities—an Amendment of FASB Statement No. 133." ASC 815 requires enhanced disclosures about an entity's derivative and hedging activities and is effective for financial statements issued for fiscal years and interim periods beginning after November 15, 2008. We adopted ASC 815 in the second quarter of fiscal 2009. ASC 815 only required additional disclosure, the adoption did not impact our consolidated financial position, results of operations or cash flows.
In May 2008, the FASB issued ASC Topic 470 Debt ("ASC 470"); originally issued as FASB Staff Position APB 14-1, "Accounting for Convertible Debt Instruments That May Be Settled in Cash upon Conversion (Including Partial Cash Settlement)." ASC 470 requires us to separately account for the liability and equity components of a convertible debt security by measuring the fair value of a similar nonconvertible debt security when interest cost is recognized in subsequent periods. ASC 470 requires us to retroactively separate the liability and equity components of such debt in our consolidatedConsolidated Financial Statements.
Table of Contents
balance sheets on a fair value basis. ASC 470 is effective for fiscal years beginning after December 15, 2008. We anticipate that ASC 470 will affect the accounting for our convertible debt and we are currently evaluating the impact that it will have on our financial statements.
In June 2008, the FASB ratified ASC Topic 815 Derivatives and Hedging ("ASC 815"); originally issued as Emerging Issues Task Force ("EITF") Issue No. 07-5, "Determining Whether an Instrument (or an Embedded Feature) Is Indexed to an Entity's Own Stock." ASC 815 provides that an entity should use a two step approach to evaluate whether an equity-linked financial instrument (or embedded feature) is indexed to its own stock, including evaluating the instrument's contingent exercise and the instrument's settlement provisions. ASC 815 clarifies the impact of foreign currency denominated strike prices and market-based employee stock option valuation instruments on the evaluation. ASC 815 is effective for the financial statements issued for fiscal years and interim periods within those fiscal years, beginning after December 15, 2008 and will be applied to outstanding instruments as of the beginning of the fiscal year in which it is adopted. Upon adoption, a cumulative effect adjustment will be recorded, if necessary, based on amounts that would have been recognized if this guidance had been applied from the issuance date of the affected instruments. We are currently determining the impact that ASC 815 will have on our financial statements, if any.
In April 2009 the FASB issued three related Staff Positions: (i) ASC Topic 820 Fair Value Measurements and Disclosures; originally issued as FSP 157-4,"Determining Fair Value When the Volume and Level of Activity for the Asset or Liability have Significantly Decreased and Identifying Transactions That Are Not Orderly," (ii) ASC Topic 320 Investments—Debt and Equity Securities ("ASC 320") and ASC Topic 958-320 Investments—Debt and Equity Securities ("ASC 958-320"); originally issued as SFAS 124-2,"Recognition and Presentation of Other-Than-Temporary Impairments," and (iii) ASC Topic 825 Financial Instruments ("ASC 825") originally issued as SFAS 107-1 and ASC Topic 270 Interim Reporting ("ASC 270"); originally issued as APB 28-1, "Interim Disclosures about Fair Value of Financial Instruments," which will be effective for interim and annual periods ending after June 15, 2009. ASC 820 provides guidance on how to determine the fair value of assets and liabilities under ASC 820 in the current economic environment and reemphasizes that the objective of a fair value measurement remains an exit price. If we were to conclude that there has been a significant decrease in the volume and level of activity of the asset or liability in relation to normal market activities, quoted market values may not be representative of fair value and we may conclude that a change in valuation technique or the use of multiple valuation techniques may be appropriate. ASC 320 and ASC 958-320 modify the requirements for recognizing other-than-temporarily impaired debt securities and revise the existing impairment model for such securities, by modifying the current intent and ability indicator in determining whether a debt security is other-than-temporarily impaired. ASC 825 and ASC 270 enhance the disclosure of instruments under the scope of ASC 820 for both interim and annual periods. We adopted this statement for our quarter ended June 30, 2009. The adoption of this statement did not have an impact on our results of operation, financial position or cash flow.
In May 2009, the FASB issued ASC Topic 855 Subsequent Events ("ASC 855"); originally issued as FAS No. 165,"Subsequent Events." ASC 855 establishes general standards of accounting for and disclosure of events that occur after the balance sheet date but before financial statements are issued. ASC 855 is effective for interim and annual periods ending after June 15, 2009. We adopted this statement for our quarter ended June 30, 2009, and the adoption did not have an impact on our results of operations, financial position or cash flows. The Company has evaluated subsequent events through December 11, 2009, which coincides with the issuance of its financial statements for the period ended September 30, 2009.
Other recent accounting pronouncements issued by the FASB (including its Emerging Issues Task Force), the American Institute of Certified Public Accountants or the SEC did not or are not believed
Table of Contents
by management to have a material impact on the Company's present or future consolidated financial statements.
Results of Operations
The following table sets forth statements of operations data expressed as a percentage of net revenues for the fiscal years indicated:
| | | | | | | | | | | | |
| | Year Ended September 30, | |
|---|
| | 2009 | | 2008 | | 2007 | |
|---|
Net revenues | | | 100.0 | % | | 100.0 | % | | 100.0 | % |
Costs and expenses: | | | | | | | | | | |
| | Cost of revenues | | | 46.6 | % | | 46.5 | % | | 51.3 | % |
| | Engineering, research and development | | | 27.2 | % | | 21.9 | % | | 21.3 | % |
| | Selling, general and administrative | | | 23.9 | % | | 22.1 | % | | 19.1 | % |
| | Accounting remediation & reconstruction expense & litigation costs | | | (5.9 | )% | | 4.7 | % | | 6.1 | % |
| | Goodwill impairment | | | 113.8 | % | | — | | | — | |
| | | | | | | | | |
| | Amortization of intangible assets | | | 0.8 | % | | 1.1 | % | | 3.0 | % |
| | | | | | | | |
| | | Costs and expenses | | | 206.4 | % | | 96.3 | % | | 100.8 | % |
| | | | | | | | |
(Loss) income from operations | | |
(106.4 |
)% | |
3.7 |
% | |
(0.8 |
)% |
Other (expense) income: | | | | | | | | | | |
Interest expense, net | | | (10.0 | )% | | (1.7 | )% | | (1.2 | )% |
Loss on extinguishment of debt | | | 0.0 | % | | 0.0 | % | | (0.9 | )% |
Other income, net | | | 0.1 | % | | 2.1 | % | | 0.8 | % |
| | | | | | | | |
| | | Other (expense) income , net | | | (9.9 | )% | | 0.4 | % | | (1.3 | )% |
Income tax (benefit) expense | | | (0.9 | )% | | 0.5 | % | | 0.1 | % |
Minority interest in loss (earnings) of consolidated subsidiary | | | 0.0 | % | | (0.3 | )% | | 0.0 | % |
| | | | | | | | |
(Loss) income from continuing operations before discontinued operations | | | (115.4 | )% | | 3.3 | % | | (2.2 | )% |
Discontinued operations | | | | | | | | | | |
| | Income (loss) from discontinued operations, net of tax | | | 0.0 | % | | 4.0 | % | | (7.6 | )% |
| | | | | | | | |
Net (loss) income | | | (115.4 | )% | | 7.3 | % | | (9.8 | )% |
| | | | | | | | |
| | | | | | | | | | | | |
| | Year Ended September 30, | |
|---|
| | 2010 | | 2009 | | 2008 | |
|---|
Net revenues | | | 100.0 | % | | 100.0 | % | | 100.0 | % |
Costs and expenses: | | | | | | | | | | |
| | Cost of revenues | | | 43.5 | % | | 46.6 | % | | 46.5 | % |
| | Engineering, research and development | | | 30.8 | % | | 27.2 | % | | 21.9 | % |
| | Selling, general and administrative | | | 22.8 | % | | 23.9 | % | | 22.1 | % |
| | Accounting remediation & reconstruction expense & litigation costs | | | 0.0 | % | | (5.9 | )% | | 4.7 | % |
| | Goodwill impairment | | | 0.0 | % | | 113.8 | % | | — | |
| | Amortization of intangible assets | | | 0.5 | % | | 0.8 | % | | 1.1 | % |
| | | | | | | | |
| | | Costs and expenses | | | 97.6 | % | | 206.4 | % | | 96.3 | % |
| | | | | | | | |
Income (loss) from operations | | | 2.4 | % | | (106.4 | )% | | 3.7 | % |
Other expense (income): | | | | | | | | | | |
| | Interest expense, net | | | 5.7 | % | | 2.8 | % | | 1.7 | % |
| | (Gain) loss on embedded derivative | | | (4.7 | )% | | 7.3 | % | | 0.0 | % |
| | Loss on extinguishment of debt | | | 12.8 | % | | 0.0 | % | | 0.0 | % |
| | Other income, net | | | (0.2 | )% | | (0.1 | )% | | (2.1 | )% |
| | | | | | | | |
| | | Other expense (income), net | | | 13.6 | % | | 9.9 | % | | (0.4 | )% |
(Loss) income before income tax expense (benefit) | | | (11.2 | )% | | (116.3 | )% | | 4.1 | % |
Income tax expense (benefit) | | | 0.9 | % | | (0.9 | )% | | 0.5 | % |
| | | | | | | | |
Net (loss) income from continuing operations | | | (12.1 | )% | | (115.4 | )% | | 3.6 | % |
Income from discontinued operations, net of tax | | | 0.1 | % | | 0.0 | % | | 4.0 | % |
| | | | | | | | |
Net (loss) income | | | (12.0 | )% | | (115.4 | )% | | 7.5 | % |
| | Net (loss) earnings attributable to noncontrolling interest | | | 0.0 | % | | (0.0 | )% | | 0.3 | % |
| | Fair value adjustment of Preferred Stock—Series B | | | 0.1 | % | | 0.0 | % | | 0.0 | % |
| | | | | | | | |
Net (loss) income available to common stockholders | | | (12.1 | )% | | (115.4 | )% | | 7.2 | % |
| | | | | | | | |
Fiscal Years Ended September 30, 20092010 and 20082009
Product Revenues
We classify ourThe Company classifies its IC products into three categories: (i) Carrier Networking Products; (ii) Enterprise Networking Products; and (iii) Non-Core Products. The Carrier Networking Products line servicesservice core, metro and access networks, also known as Carrier Networks. Our products are focused on enabling Ethernet data services to be deployed more broadly across these networks. The Enterprise Networking Products line servicesservice the market for Ethernet switching and transmission within LANslocal area networks in SMB and SME markets. Non-Core Products are those product lines where we have chosen to exit marketsnot received additional investment over the prior three years and no longer continue to invest.as a result have generally been in decline.
Table of Contents
The following table summarizes ourthe Company's product revenues. Our referencesrevenues by product line.
| | | | | | | | | | | | | |
| | September 30, | | Change | |
|---|
| | 2010 | | 2009 | | $ | | % | |
|---|
| | (in thousands)
| |
| |
| |
|---|
Carrier Networking Products | | $ | 72,380 | | $ | 69,020 | | $ | 3,360 | | | 4.9 | % |
Enterprise Networking Products | | | 75,975 | | | 60,356 | | | 15,619 | | | 25.9 | % |
Non-Core Products | | | 17,278 | | | 25,551 | | | (8,273 | ) | | (32.4 | )% |
| | | | | | | | | | | |
Net Product Revenues | | $ | 165,633 | | $ | 154,927 | | $ | 10,706 | | | 6.9 | % |
| | | | | | | | | | | |
Net product revenues in fiscal year 2010 were $165.6 million, an increase of 6.9% from the $154.9 million recorded in fiscal year 2009. The increase was driven primarily by overall strengthening customer demand for the Company's core products, particularly the Company's newer products targeted at Ethernet-based applications.
Net product revenues from Carrier Networking Products were $72.4 million in fiscal 2010, compared with $69.0 million in fiscal year 2009. The increase of 4.9% was due to years areimproved market conditions within North American and European markets, partially offset by some weakness in Asia, particularly China. Ethernet switch and PHY products grew by over 40% to $8.8 million from 2009 to 2010. This increase was partially offset by a decrease in legacy SONET mapper products of 20% to $6.8 million in fiscal 2010. In the Connectivity product line, Crosspoint switch revenue grew nearly 170% to $6.9 million and 10 Gigabit Ethernet grew 180% to $2.1 million. Again this revenue growth came at the expense of some of the Company's older SONET products. Revenues from the Company's older generation low-speed SONET PHYs decreased 53% to $6.0 million from 2009 to 2010.
Net product revenues from Enterprise Networking Products in fiscal year 2010 were $76.0 million, an increase of 25.9% from $60.4 million in fiscal year 2009. The increase was primarily due to increased strength in connectivity products, including the Company's crosspoint switch and 10 Gigabit Ethernet products selling into large Enterprise and datacenter applications. Crosspoint switch products grew 23% from 2009 to 2010 to $12.3 million. Revenues from the Company's 10 Gigabit Ethernet and PMD products grew 105% from 2009 to 2010 to $10.7 million.
Net product revenues from Non-Core Products were $17.3 million in fiscal 2010, compared with $25.6 million in fiscal year 2009. The decrease of $8.3 million, or 32.4%, was primarily due to a decline of the Company's legacy Raid-on-Chip and legacy Fibre Channel PHY products, partially offset by growth in the contextCompany's Network Processing Unit ("NPU") product line. NPU products increased 13% from 2009 to 2010 to just over $5.5 million.
IP Revenues
| | | | | | | | | | | | | |
| | September 30, | | Change | |
|---|
| | 2010 | | 2009 | | $ | | % | |
|---|
| | (in thousands)
| |
| |
| |
|---|
IP revenues | | $ | 357 | | $ | 13,250 | | $ | (12,893 | ) | | (97.3 | )% |
IP revenues were $0.4 million in fiscal 2010, compared with $13.3 million in fiscal year 2009. IP revenue in 2010 was primarily related to engineering design fees. In fiscal year 2009, IP revenue of our$13.3 million included licensing revenues of $8.3 million from the sale of patents from the Company's IP portfolio and $5.0 million from an arrangement, entered into in the first quarter of 2008, to license IP to a third-party. No material royalties were received or recognized for the fiscal years ended September 30:30, 2010 or 2009.
Table of Contents
Cost of Revenues
| | | | | | | | | | | | | |
| | September 30, | | Change | |
|---|
| | 2009 | | 2008 | | $ | | % | |
|---|
| | (in thousands)
| |
| |
| |
|---|
Carrier Networking Products | | $ | 69,020 | | $ | 92,952 | | $ | (23,932 | ) | | (25.7 | )% |
Enterprise Networking Products | | | 60,356 | | | 76,524 | | | (16,168 | ) | | (21.1 | )% |
Non-Core Products | | | 25,551 | | | 49,060 | | | (23,509 | ) | | (47.9 | )% |
| | | | | | | | | | | |
Product Revenues | | $ | 154,927 | | $ | 218,536 | | $ | (63,609 | ) | | (29.1 | )% |
| | | | | | | | | | | |
| | | | | | | | | | | | | |
| | September 30, | | Change | |
|---|
| | 2010 | | 2009 | | $ | | % | |
|---|
| | (in thousands)
| |
| |
| |
|---|
Cost of Revenues | | $ | 72,238 | | $ | 78,393 | | $ | (6,155 | ) | | (7.9 | )% |
Percent of net revenues | | | 43.5 | % | | 46.6 | % | | | | | | |
As a fabless semiconductor Company, the Company's cost of revenues consists predominantly of: (i) purchased finished wafers; (ii) assembly services; and (iii) labor and overhead costs associated with product procurement and testing. There was no cost of revenues associated with intellectual property revenues for any periods presented in this report.
The Company's cost of net revenues was $72.2 million in fiscal year 2010 compared to $78.4 million in fiscal year 2009. As a percentage of net revenues, the Company's cost of net revenues was 43.5% in fiscal year 2010 compared to 46.6% in fiscal year 2009. Excluding IP revenue, the Company's cost of net product revenue was 43.6% in fiscal year 2010 and 50.6% in fiscal year 2009. The decrease in the cost of net product revenues by 7.9% is primarily attributable to improved product yields and the transition of the Company's test manufacturing activities from its California facility to an outsource model using an offshore facility. This transition resulted in reduced costs of tests.
As it is customary in the semiconductor industry for product prices of maturing products to decline over time, it is imperative that the Company continues to reduce its cost of revenues. The Company continued to focus its efforts on improving operating efficiencies, including improving product yields, reducing scrap, and improving cycle times.
Engineering, Research and Development
| | | | | | | | | | | | | |
| | September 30, | | Change | |
|---|
| | 2010 | | 2009 | | $ | | % | |
|---|
| | (in thousands)
| |
| |
| |
|---|
Engineering, research and development | | $ | 51,100 | | $ | 45,706 | | $ | 5,394 | | | 11.8 | % |
Percent of net revenues | | | 30.8 | % | | 27.2 | % | | | | | | |
Engineering, research and development expenses consist primarily of salaries and related costs, including share-based compensation expense of employees engaged in research, design and development activities. Engineering, research and development also includes costs of mask sets and electronic design automation tools, software licensing contracts, subcontracting and fabrication costs, depreciation and amortization, and facilities expenses. The Company will continue to concentrate its spending in this area to meet its customer requirements and respond to market conditions.
Engineering, research and development expenses for fiscal year 2010 were $51.1 million, an increase of $5.4 million or 11.8% from $45.7 million in fiscal year 2009. The increase is mainly attributable to increased engineering tool costs of $2.9 million, primarily mask sets, and Electronic Design Automation tools required in the support of new product development. In addition, labor costs increased approximately $2.3 million due to the reinstatement of salaries that had been temporarily reduced in fiscal year 2009, as well as higher medical and dental insurance premiums.
Engineering, research and development investment in fiscal year 2010 as a percentage of net revenues increased to 30.8% from 27.2% in fiscal year 2009. The Company continues to concentrate its investments in areas that match its customers' requirements and market conditions.
Table of Contents
Selling, General and Administrative
| | | | | | | | | | | | | |
| | September 30, | | Change | |
|---|
| | 2010 | | 2009 | | $ | | % | |
|---|
| | (in thousands)
| |
| |
| |
|---|
Selling, general and administrative | | $ | 37,791 | | $ | 40,227 | | $ | (2,436 | ) | | (6.1 | )% |
Percent of net revenues | | | 22.8 | % | | 23.9 | % | | | | | | |
Selling, general and administrative expense consists primarily of personnel-related expenses, including share based compensation expense, legal and other professional fees, facilities expenses, outside labor and communications expenses.
SG&A expense for fiscal year 2010 decreased by 6.1% or $2.4 million compared to fiscal year 2009. As a percentage of net revenues, SG&A expense for fiscal year 2010 decreased to 22.8% from 23.9% in fiscal year 2009. The decrease in selling, general, and administrative expense is primarily due to the Company's extensive cost-reduction efforts, including a legal fee reduction of $2.3 million, an accounting fee reduction of $2.1 million, as well as other cost reductions including travel, supplies and facilities costs of approximately $1.3 million. The Company also reduced compensation costs by $1.6 million as a result of headcount reductions.
During fiscal year 2009, the Company recognized a gain on the sale of its Colorado building, which offset selling, general and administrative expense in that year by $2.9 million. The Company also recovered a net $1.9 million in sales tax, returned by a foreign authority.
Accounting Remediation and Reconstruction Expense and Litigation Costs
| | | | | | | | | | | | | |
| | September 30, | | Change | |
|---|
| | 2010 | | 2009 | | $ | | % | |
|---|
| | (in thousands)
| |
| |
| |
|---|
Accounting remediation & reconstruction expense & litigation costs | | $ | 73 | | $ | (9,922 | ) | $ | 9,995 | | | (100.7 | )% |
Percent of net revenues | | | 0.0 | % | | (5.9 | )% | | | | | | |
Accounting remediation and reconstruction expense and litigation costs consists of fees incurred to resolve certain legal issues, remediate control deficiencies, and transition accounting and reporting responsibilities to full-time staff, in addition to the settlement of audits, investigations and lawsuits related to prior accounting periods.
For the year ended September 30, 2010, these costs totaled $73,000 and the Company recognized a net credit of $9.9 million, for the year ended September 30, 2009.
During fiscal year 2009, the Company recorded a settlement with KPMG, its former independent registered public accountant, which resulted in a net credit of $16.0 million. The Company recorded costs of $4.1 million for work performed on stock option accounting and inventory valuation, revision of its revenue recognition policies, and other legal and financial issues. The Company recorded a $3.0 million accrual due to the proposed settlement with the SEC's Division of Enforcement related to its investigation of the Company's historical stock option practices and certain other accounting irregularities. Lastly, the Company reached a settlement with the IRS related to the exercise of backdated options, resulting in a credit of $1.0 million as the settlement was less that the Company had previously estimated and accrued.
Table of Contents
Goodwill Impairment
| | | | | | | | | | | | | |
| | September 30, | | Change | |
|---|
| | 2010 | | 2009 | | $ | | % | |
|---|
| | (in thousands)
| |
| |
| |
|---|
Goodwill impairment | | $ | — | | $ | 191,418 | | $ | (191,418 | ) | | 100.0 | % |
Percent of net revenues | | | 0.0 | % | | 113.8 | % | | | | | | |
During the first quarter of the fiscal year ended September 30, 2009, the Company performed an analysis of its goodwill and determined that the carrying amount of goodwill exceeded the implied fair value of that goodwill. As a result of the analysis, the Company recorded an impairment charge to fully write off its goodwill balance of $191.4 million. (See Note 2—Goodwill and Intangible Assets in the accompanying Consolidated Financial Statements).
Amortization of Intangible Assets
| | | | | | | | | | | | | |
| | September 30, | | Change | |
|---|
| | 2010 | | 2009 | | $ | | % | |
|---|
| | (in thousands)
| |
| |
| |
|---|
Amortization of intangible assets | | $ | 797 | | $ | 1,360 | | $ | (563 | ) | | (41.4 | )% |
Percent of net revenues | | | 0.5 | % | | 0.8 | % | | | | | | |
Amortization of intangible assets was $0.8 million in fiscal 2010, compared to $1.4 million in fiscal year 2009. The decrease is primarily due to intangible assets related to the Company's prior acquisition of Adaptec becoming fully amortized during fiscal year 2009.
Interest Expense, net
| | | | | | | | | | | | | |
| | September 30, | | Change | |
|---|
| | 2010 | | 2009 | | $ | | % | |
|---|
| | (in thousands)
| |
| |
| |
|---|
Interest expense, net | | $ | 9,495 | | $ | 4,653 | | $ | 4,842 | | | 104.1 | % |
Percent of net revenues | | | 5.7 | % | | 2.8 | % | | | | | | |
Interest expense, net of interest income, was $9.5 million in fiscal 2010, compared to $4.7 million in fiscal year 2009. The expense is comprised of interest expense, amortization of debt discount and amortization of debt issuance costs. For fiscal year 2010, interest expense and amortization of the debt discount and debt issuance costs related to the 2014 Debentures was $3.5 million and $1.8 million, respectively. The interest expense and amortization of debt issue costs for the Senior Term Loan was $3.4 million and $0.8 million, respectively. For fiscal year 2009, the interest expense and amortization of debt issuance costs for the Senior Term Loan was $4.0 million and $0.8 million, respectively. The 2014 Debenture did not exist in fiscal year 2009; as such, there were no related interest or amortization costs. For fiscal year 2009, the interest expense for the 2024 Debentures was $1.5 million for twelve months compared to one month of interest in fiscal year 2010 of $0.1 million. The increase in interest expense is the result of the higher combined effective interest rate on indebtedness as a result of the debt exchange and increase in the interest rate on the Company's Senior Term Loan.
Table of Contents
(Gain) Loss on Embedded Derivative
| | | | | | | | | | | | | |
| | September 30, | | Change | |
|---|
| | 2010 | | 2009 | | $ | | % | |
|---|
| | (in thousands)
| |
| |
| |
|---|
(Gain) loss on embedded derivative | | $ | (7,869 | ) | $ | 12,209 | | $ | (20,078 | ) | | (164.4 | )% |
Percent of net revenues | | | (4.7 | )% | | 7.3 | % | | | | | | |
The gain on the embedded derivative in fiscal year 2010 was $7.9 million compared to a loss of $12.2 million in fiscal year 2009. The gain on the embedded derivative related to the change in the fair value of the derivative liability related to the 2014 Debentures, which was $9.0 million in fiscal 2010.
The loss on embedded derivative, which related to the change in the fair value of the premium put on the 2024 Debentures, was $1.1 million in fiscal 2010 compared to $12.2 million in fiscal year 2009. The decrease of $11.1 million, from fiscal year 2009 to fiscal year 2010, is related to the change in fair value of the premium put on the 2024 Debentures. (See Note 4—Debt in the accompanying Consolidated Financial Statements.)
Loss on Extinguishment of Debt
| | | | | | | | | | | | | |
| | September 30, | | Change | |
|---|
| | 2010 | | 2009 | | $ | | % | |
|---|
| | (in thousands,
except
percentages)
| |
| |
| |
|---|
Loss on extinguishment of debt | | $ | 21,311 | | $ | — | | $ | 21,311 | | | 100.0 | % |
Percent of net revenues | | | 12.8 | % | | 0.0 | % | | | | | | |
Effective October 30, 2009, the Company finalized negotiations with the Noteholders of the 2024 Debentures to settle the obligations under the debentures, including all amounts owed under the derivative liability for the premium put option, with a combination of cash, shares of the Company's common stock, shares of the Company's Series B Preferred Stock and a new issuance of $50.0 million of 2014 Debentures. The Company recorded the new instruments issued in conjunction with the extinguishment of the 2024 Debentures at fair value and recognized a $21.6 million loss for the difference between the fair values of the new instruments and the old instruments. For the purposes of calculating this loss on extinguishment, the net carrying amount of the 2024 Debentures included the $96.7 million principal amount of the 2024 Debentures and $13.3 million of the premium put derivative, recorded at fair value. During the year ended September 30, 2010, the Company recognized a gain of $0.3 million on the conversion of $3.5 million face value of 2014 Debentures and the associated "Make Whole Amount" into shares of the Company's common stock (see Note 4—Debt in the accompanying Consolidated Financial Statements).
Other Income, net
| | | | | | | | | | | | | |
| | September 30, | | Change | |
|---|
| | 2010 | | 2009 | | $ | | % | |
|---|
| | (in thousands)
| |
| |
| |
|---|
Other income, net | | $ | (290 | ) | $ | (223 | ) | $ | (67 | ) | | (30.0 | )% |
Percent of net revenues | | | (0.2 | )% | | (0.1 | )% | | | | | | |
Other income, net of other expense, was $0.3 million in fiscal year 2010 compared to $0.2 million in fiscal year 2009. The change in other income primarily relates to changes in foreign exchange rates.
Table of Contents
Income Tax Expense (Benefit)
| | | | | | | | | | | | | |
| | September 30, | | Change | |
|---|
| | 2010 | | 2009 | | $ | | % | |
|---|
| | (in thousands)
| |
| |
| |
|---|
Income tax expense (benefit) | | $ | 1,521 | | $ | (1,451 | ) | $ | 2,972 | | | 204.8 | % |
Percent of net revenues | | | 0.9 | % | | (0.9 | )% | | | | | | |
Income tax expense was $1.5 million for fiscal year 2010 compared to income tax benefit of $1.5 million for fiscal year 2009, an increase in expense of $3.0 million. The increase is primarily due to limitations on the Company's NOL carryforwards as a result of an "ownership change" experienced for tax purposes on October 30, 2009. Net income tax expense for the year ended September 30, 2010 represents minimum federal, state, and foreign income tax on income not eligible for offset by loss carryforwards.
Income from Discontinued Operations
| | | | | | | | | | | | | |
| | September 30, | | Change | |
|---|
| | 2010 | | 2009 | | $ | | % | |
|---|
| | (in thousands)
| |
| |
| |
|---|
Income from discontinued operations, net of tax | | $ | 121 | | $ | 71 | | $ | 50 | | | 70.4 | % |
Percent of net revenues | | | 0.1 | % | | 0.0 | % | | | | | | |
Income from discontinued operations, which consisted solely of income from the earn-out, in connection with the Company's sale of a portion of its Storage Products business to Maxim Integrated Products, Inc. ("Maxim") in October 2007. The income, net of tax, was $0.1 million for each of the years ended September 30, 2010 and 2009, respectively. The contract with Maxim is complete and the Company does not anticipate any additional gains or losses to be incurred from this transaction.
Fiscal Years Ended September 30, 2009 and 2008
Product Revenues
The Company classifies its IC products into three categories: (i) Carrier Networking Products; (ii) Enterprise Networking Products; and (iii) Non-Core Products. The Carrier Networking Products service core, metro and access networks. The Enterprise Networking Products service the market for Ethernet switching and transmission within local area networks in SMB and SME markets. The Company's Non-Core Products have not received additional investment over the past three years and as a result have generally been in decline.
The following table summarizes the Company's product revenues.
| | | | | | | | | | | | | |
| | September 30, | | Change | |
|---|
| | 2009 | | 2008 | | $ | | % | |
|---|
| | (in thousands)
| |
| |
| |
|---|
Carrier Networking Products | | $ | 69,020 | | $ | 92,952 | | $ | (23,932 | ) | | (25.7 | )% |
Enterprise Networking Products | | | 60,356 | | | 76,524 | | | (16,168 | ) | | (21.1 | )% |
Non-Core Products | | | 25,551 | | | 49,060 | | | (23,509 | ) | | (47.9 | )% |
| | | | | | | | | | | |
Net Product Revenues | | $ | 154,927 | | $ | 218,536 | | $ | (63,609 | ) | | (29.1 | )% |
| | | | | | | | | | | |
Net product revenues in fiscal year 2009 were $154.9 million, a decrease of 29.1% from the $218.5 million recorded in fiscal year 2008. The decrease is driven primarily by overall weaker customer demand and inventory corrections that ourthe Company's customers have implemented in response to the severely depressed global economic environment.
Table of Contents
ProductNet product revenues from Carrier Networking Products were $69.0 million in fiscal year 2009, compared with $93.0 million in fiscal year 2008. The decrease of 25.7% is due to overall weakness across the majority of product segments, particularly older optical physical layer and processing products. This decrease was offset by relative strength from our Ethernet over SONET Mappersthe Company's mappers and Gigabit Ethernet and 10 Gigabit Ethernet Physical Layerphysical layer products.
ProductNet product revenues from Enterprise Networking Products in fiscal year 2009 were $60.4 million, a decrease of 21.1% from $76.5 million in fiscal year 2008. The decrease was primarily due to overall weakness across all product segments.
ProductNet product revenues from Non-Core Products were $25.6 million in fiscal year 2009, compared with $49.1 million in fiscal year 2008. The decrease of $23.5 million, or 47.9%, was primarily due to a strong decline in Raid-on-Chip Processor products. OurThe Company's legacy Network ProcessorNPU and FiberFibre Channel Physical Layerphysical layer components also saw a substantial decline of approximately 50%. We haveThe Company has chosen to exit these markets and are no longer making any additional investments in these products.
In fiscal year 2009, wethe Company shipped approximately $9.4 million in products that are now classified as end-of-life ("EOL"), compared to sales of $22.1 million in EOL products in fiscal year 2008. These products are older generation storage products, including ourthe Company's 2G Fibre Channel products and Enclosure Managementenclosure management products classified as Non-Core products, certain older generation Ethernet Switch and MAC products classified as Enterprise products, and certain products originally manufactured in ourthe Company's Camarillo, California GaAs fabrication facility classified as Carrier Networking products.
LicensingIP Revenues
| | | | | | | | | | | | | |
| | September 30, | | Change | |
|---|
| | 2009 | | 2008 | | $ | | % | |
|---|
| | (in thousands)
| |
| |
| |
|---|
Licensing revenues | | $ | 13,250 | | $ | 10,000 | | $ | 3,250 | | | 32.5 | % |
| | | | | | | | | | | | | |
| | September 30, | | Change | |
|---|
| | 2009 | | 2008 | | $ | | % | |
|---|
| | (in thousands)
| |
| |
| |
|---|
IP revenues | | $ | 13,250 | | $ | 10,000 | | $ | 3,250 | | | 32.5 | % |
LicensingIP revenues were $13.3 million in fiscal year 2009, compared with $10.0 million in fiscal year 2008. For theIn fiscal year ended September 30, 2009, IP revenue of $13.3 million included licensing revenues included IP revenue of $8.3 million from the sale of patents from ourthe Company's IP portfolio and $5.0 million from an arrangement, entered into in the first quarter of fiscal year 2008, to license IP to a third-party. On December 28, 2007, the Company entered into an arrangement to license IP to a third-party. Specific deliverables to the licensee were defined in the agreement and required acceptance from the licensee. Under the agreement, Vitesse received $15.0 million in license fees for the rights to certain products and technology. Of the fees, $10.0 million
Table of Contents
was recognized upon delivery and acceptance of the licensed technologyIP in the fourth quarter of fiscal year 2008. The remaining $5.0 million was recognized upon the one-year anniversary of the agreement in the first quarter of fiscal year 2009. No royalties were received or recognized for the fiscal year ended September 30, 2009.
Cost of Revenues
|
| | September 30, | | Change | | | September 30, | | Change | |
|---|
| | 2009 | | 2008 | | $ | | % | | | 2009 | | 2008 | | $ | | % | |
|---|
| | (in thousands)
| |
| |
| | | (in thousands)
| |
| |
| |
|---|
Cost of Revenues | | $ | 78,414 | | $ | 106,344 | | $ | (27,930 | ) | | (26.3 | )% | | $ | 78,393 | | $ | 106,344 | | $ | (27,951 | ) | | (26.3 | )% |
Percent of net revenues | | 46.6 | % | | 46.5 | % | | | | | | | 46.6 | % | | 46.5 | % | | | | | |
As a fabless semiconductor company, we use third-parties (including TSMC, IBM, Chartered Amkor, ASAT, and ASE) for wafer fabrication and assembly services. OurCompany, the Company's cost of revenues consists predominantlyprimarily of: (i) purchased finished wafers; (ii) assembly services; and (iii) labor and overhead costs associated with product procurement and testing.
Table of Contents
OurThe Company's cost of revenues was $78.4 million in fiscal year 2009 compared to $106.3 million in fiscal year 2008. As a percentage of net revenues, ourthe Company's cost of revenues was 46.6% in fiscal year 2009 compared to 46.5% in fiscal year 2008. Excluding intellectual propertyIP revenue, ourthe Company's cost of revenue for products was $78.4 million, or 50.6% of product revenue in fiscal year 2009 compared with $106.3 million or 48.7% of product revenue in fiscal 2008.year 2008, an increase in the cost of revenue, as a percentage of product sales, of 1.9%.
The increase in the cost of revenues, byas a percentage of product sales, of 1.9% is attributable primarily to three factors:
1.Aseveral factors, one of which was a $1.7 million write offwrite-off of obsolete inventory in the second quarter of fiscal 2009
2.Under-utilization of fixed sizedyear 2009. In addition, the Company's manufacturing facilities, primarily ourits probe and test manufacturing facility, were under-utilized due to reduced sales volume
3.Avolume. Lastly, there was a slight shift in product mix from lower cost physical and processing products, to higher cost productsEnterprise switching products. This shift in the Enterprise Switching product line from lower cost Physical and Processing products. Thismix was the result of ourthe Company's focus in prior years to diversify ourits business in areas outside the Carrier Networking markets. While products in these new markets provide good diversification and growth opportunities, they come at a higher overall cost of revenues.
As it is customary in the semiconductor industry for product prices of maturing products to decline over time, it is imperative that we continue to reduce our cost of revenues. We continued to focus our efforts on improving operating efficiencies, including improving product yields, reducing scrap, and improving cycle times.
In fiscal year 2009, ourthe Company's cost of revenues was impacted by substantially lower sales volumes. Under-utilization of ourthe Company's fixed sized manufacturing facilities, primarily ourits test manufacturing facility, increased ourits cost of revenue as a percentage of net revenues in fiscal year 2009 relative to fiscal year 2008. During fiscal year 2009, wethe Company took steps to reduce ourits fixed cost of manufacturing by re-evaluating ourits testing procedures. In an effort to reduce costs and shorten manufacturing time, the Company has decided to eliminate test activities at the Camarillo, California location. This will reduceelimination reduced headcount, maintenance, and facilities costs. We have begun planning to moveThe Company moved a substantial portion of ourits test facility to a subcontractor in fiscal year 2010 to further reduce ourits fixed manufacturing costs. (See Note 14—Subsequent Events in the accompanying consolidated financial statements).
Table of Contents
Engineering, Research and Development
|
| | September 30, | | Change | | | September 30, | | Change | |
|---|
| | 2009 | | 2008 | | $ | | % | | | 2009 | | 2008 | | $ | | % | |
|---|
| | (in thousands)
| |
| |
| | | (in thousands)
| |
| |
| |
|---|
Engineering, research and development | | $ | 45,685 | | $ | 49,982 | | $ | (4,297 | ) | | (8.6 | )% | | $ | 45,706 | | $ | 49,982 | | $ | (4,276 | ) | | (8.6 | )% |
Percent of net revenues | | 27.2 | % | | 21.9 | % | | | | | | | 27.2 | % | | 21.9 | % | | | | | |
Engineering, research and development expenses consist primarily of salaries and related costs, including share-based compensation expenses, of engineering employees engaged in research, design, and development activities. Other expenses included are mask sets, electronic design automation tools, software licensing contracts, subcontracting and fabrication costs, depreciation and amortization, and facilities expenses.
Engineering, research and development expenses for 2009 were $45.7 million, a decrease of $4.3 million or 8.6% from $50.0 million in 2008. The decrease in expenses is primarily due to lower mask set expenditures of $1.4 million, lower employment costs of $1.2 million and lower facility costs of $1.3 million. Engineering activities transferred to lower cost geographies accounted for the lower employment and facility costs.
Engineering, research and development investment in 2009 as a percentage of net revenues increased to 27.2% from 21.9% in 2008. The continued commitment to engineering investment and the engineering productivity improvement in 2009, despite the decrease in revenue, demonstrates the Company's continued commitment to the design and development of future products as vital to maintaining a competitive edge for the Company and its customers. The Company closely monitors its engineering expense in relationship to revenue expectations in future periods. We continue to concentrate our investments in areas that match our customers' requirements and market conditions.
Table of Contents
Selling, General and Administrative
| | | | | | | | | | | | | |
| | September 30, | | Change | |
|---|
| | 2009 | | 2008 | | $ | | % | |
|---|
| | (in thousands)
| |
| |
| |
|---|
Selling, general and administrative | | $ | 40,227 | | $ | 50,557 | | $ | (10,330 | ) | | (20.4 | )% |
Percent of net revenues | | | 23.9 | % | | 22.1 | % | | | | | | |
Selling, general and administrative ("SG&A") expense consists primarily of personnel-related expenses, including share-based compensation expense, legal and other professional fees, facilities expenses, outside labor and communications expenses.
SG&A expense for fiscal year 2009 decreased by 20.4% or $10.3 million compared to the year ended September 30, 2008. As a percentage of net revenues, SG&A expense increased from 22.1% to 23.9%. The reductions in costs were driven by a decrease in compensation-relatedcompensation related charges of $2.7 million as a result of salary and head countheadcount reductions. Due to extensive cost-reduction efforts, facilities,expenses related to facility, travel, and supplies expenses decreased by a total of $2.0 million. Share-based compensation decreased by $0.6 million due to the vesting of a substantial number of stock options during the first fiscal quarter of 2009, net of increases due to the issuance of new awards during the year. During the year, professional fees decreased by $3.2 million compared to fiscal year 2008 due to the transitioning of accounting and finance functions from contract employees to full-time staff.
During fiscal year 2009, the fourth quarter of fiscal 2009, weCompany incurred $2.1 million in legal and professional fees related to the restructuring of ourits 2024 Debentures and our senior note with Whitebox VSC, LTD.
During fiscal 2009, uponits Senior Term Loan. The Company also recognized $1.8 million in broker fees related to the sale of certain intellectual property patents, we recognized $1.8 million in brokers fees related to the sale. Otherpatents. In addition, sales related costs decreased by $1.4 million
Table of Contents
during the year due to lower operating results, resulting in a net increase in sales related costs of $0.4 million.
In Lastly, the third quarterCompany recognized a gain on the sale of fiscal 2008, we recognized $0.4 million in bad debt from a customer that went outits Colorado building of business.$2.9 million. In fiscal 2009, we did not recognize any specific write-offsyear 2008, the Company recognized a gain on the sale of fixed assets of $3.2 million, a difference and collected receivables that had previously been written off in the amountnet increase to SG&A expense of $0.2$0.3 million.
WeThe Company also recorded a $2.9 million credit to SG&A expense for the recovery of sales tax withheld by foreign authorities. At the time ofauthorities, which offset the sales tax accrual of $1.0 million in the first quarter of 2009. The tax accrual and recovery were in relation to the intellectual property patent sale in fiscal year 2008 and the first quarter of 2009, wewhereby the Company did not estimate that the recovery of these withholdings was likely and wethe Company recorded charges to SG&A expense in the amounts of $2.0 million in fiscal year 2008 and $1.0 million in the first quarter of 20092009. The net change in SG&A expense related to these charges in 2008 and the subsequent recovery in 2009 was $3.9 million.
Additionally, in fiscal 2009, we recognized a gain on the sale of our Colorado building of $2.9 million. In fiscal year 2008, wethe Company recognized $0.4 million in bad debt from a gain oncustomer that went out of business. In fiscal year 2009, the saleCompany did not recognize any specific write-offs and collected receivables that had previously been written off in the amount of fixed assets of $3.2 million, a difference and net increase to SG&A expense of $0.3$0.2 million.
Accounting Remediation and Reconstruction Expense and Litigation Costs
| | | | | | | | | | | | | |
| | September 30, | | Change | |
|---|
| | 2009 | | 2008 | | $ | | % | |
|---|
| | (in thousands)
| |
| |
| |
|---|
Accounting remediation & reconstruction expense & litigation costs | | $ | (9,922 | ) | $ | 10,761 | | $ | (20,683 | ) | | (192.2 | )% |
Percent of net revenues | | | (5.9 | )% | | 4.7 | % | | | | | | |
Accounting remediation and reconstruction expense and litigation costs consists of fees incurred to resolve certain legal issues, remediate control deficiencies, and transition accounting and reporting
Table of Contents
responsibilities to full-time staff, in addition to the settlement of audits, investigations and lawsuits related to prior accounting periods.
For the years ended September 30, 2009 and 2008, weThe Company recognized a net credit of $9.9 million and a chargein 2009, compared to expense of $10.8 million respectively.in 2008, a decrease of $20.7 million. As the remediation and reconstruction work came to a completionwas substantially completed during fiscal year 2009, $6.7 million of the $20.7 million difference is the result of a decrease in professional fees.
We reachedDuring fiscal year 2009, the Company recorded a settlement with KPMG, ourits former independent registered public accounting firm in fiscal 2009. Pursuant to the settlement, KPMG agreed to pay us $22.5 million and forgive all of our past indebtedness. During the third quarter, we recorded the settlement amount, net of fees and expenses, resultingaccountant, which resulted in a net credit of $16.0 million.
In June 2009, we The Company recorded costs of $4.1 million for work performed on stock option accounting and inventory valuation, revision of its revenue recognition policies, and other legal and financial issues. The Company recorded a $3.0 million accrual due to the proposed settlement with the SEC's Division of Enforcement related to its investigation of the Company's historical stock option practices and certain other accounting irregularities. Lastly, the Company reached a settlement with the IRS related to the exercise of backdated stock options. Theoptions, resulting in a credit of $1.0 million as the settlement was less than wethat the Company had previously estimated and accrued, and we recorded a credit to accounting remediation and reconstruction expense and litigation costs of $1.0 million during fiscal 2009.
In connection with our pending settlement with the SEC, as proposed by the staff of the Division of Enforcement, related to their investigation into the Company's historical stock option practices and certain other accounting irregularities, we recorded a $3.0 million accrual during the third quarter of fiscal 2009.
Table of Contentsaccrued.
Goodwill Impairment
| | | | | | | | | | | | | |
| | September 30, | | Change | |
|---|
| | 2009 | | 2008 | | $ | | % | |
|---|
| | (in thousands)
| |
| |
| |
|---|
Goodwill impairment | | $ | 191,418 | | $ | — | | $ | 191,418 | | | 100.0 | % |
Percent of net revenues | | | 113.8 | % | | 0.0 | % | | | | | | |
During the first quarter of fiscal year 2009, wethe Company identified changes in key factors indicating a possible impairment of the value of ourits goodwill. Notable indicators were significantly depressed market conditions and industry trends, market capitalization below book value of equity and some downward revisions to ourthe Company's forecasts due to current economic conditions. Continually changing market conditions make it difficult to project how long the current economic downturn may last. Declining market values have negatively impacted ourthe Company's valuations which are a component of ourits goodwill impairment tests. Upon completion of the first step of ourits impairment test, wethe Company determined that additional impairment analysis was required by ASC 350. The second step of the goodwill impairment test compared the implied fair value of our Company's goodwill with the carrying amount of that goodwill. Since the carrying amount of goodwill exceeded the implied fair value of that goodwill, an impairment loss was recognized in an amount equal to that excess. The implied fair value of goodwill is determined in the same manner as the amount of goodwill recognized in a business combination. The fair value was determined through an analysis of: (i) market capitalization; (ii) comparable public company valuations; and (iii) future cash flows expected to be generated by the Company. The calculated fair value is then allocated to individual assets and liabilities (including any unrecognized intangible assets) as if the Company had been acquired in a business combination and the fair value of the Company was the purchase price paid to acquire the Company. In performing this allocation, the fair values of the assets and liabilities of the Company were calculated using generally accepted valuation methodologies, including analysis of: (i) the future cash flows expected to be generated; (ii) the estimated market value; or (iii) the estimated cost to replace. Any variance in the assumptions used to value the assets and liabilities could have had a significant impact on the estimated fair value of the assets and liabilities and, consequently, the amount of identified goodwill impairment. As a result of the additional analyses performed, wethe Company recorded an impairment charge to fully write off ourits goodwill balance of $191.4 million in the first quarter of fiscal year 2009. (See Note 3—2—Goodwill and Intangible Assets in the accompanying consolidated financial statements)Consolidated Financial Statements).
Amortization of Intangible Assets
| | | | | | | | | | | | | |
| | September 30, | | Change | |
|---|
| | 2009 | | 2008 | | $ | | % | |
|---|
| | (in thousands)
| |
| |
| |
|---|
Amortization of intangible assets | | $ | 1,360 | | $ | 2,514 | | $ | (1,154 | ) | | (45.9 | )% |
Percent of net revenues | | | 0.8 | % | | 1.1 | % | | | | | | |
Amortization of intangible assets was $1.4 million in fiscal year 2009, compared to $2.5 million in fiscal year 2008. The decrease from 2008 to 2009 is primarily due to intangible assets related to ourthe Company's prior acquisition of Cicada Semiconductor Corporation becoming fully amortized during fiscal year 2008 and ourthe Company's prior acquisitions of Vermont Scientific Technologies and Adaptec becoming fully amortized during fiscal year 2009.
Table of Contents
Interest Expense, net
|
| | September 30, | | Change | | | September 30, | | Change | |
|---|
| | 2009 | | 2008 | | $ | | % | | | 2009 | | 2008 | | $ | | % | |
|---|
| | (in thousands)
| |
| |
| | | (in thousands)
| |
| |
| |
|---|
Interest expense, net | | $ | 16,862 | | $ | 3,868 | | $ | 12,994 | | 335.9 | % | | $ | 4,653 | | $ | 3,868 | | $ | 785 | | 20.3 | % |
Percent of net revenues | | 10.0 | % | | 1.7 | % | | | | | | | 2.8 | % | | 1.7 | % | | | | | |
Interest expense, net of interest income, increasedwas $4.7 million in fiscal year 2009, compared to $3.9 million in fiscal year 2008. The expense is comprised of interest expense and amortization of debt issuance costs. For fiscal years 2009 and 2008, the interest expense for the 2024 Debentures was $1.5 million. For fiscal year 2009, the interest expense and amortization of debt issuance costs for the Senior Term Loan was $2.6 million and $0.8 million, respectively. For fiscal year 2008, the interest expense and amortization of debt issuance costs for the Senior Term Loan was $2.2 million and $0.4 million, respectively. The increase in interest expense was offset by $13.0interest income of $0.6 million.
The decrease in interest expense of $0.8 million is mainly due to $16.9the Company replacing its debt to Tennenbaum Capital Partners ("TCP") with Senior Term Loan. Interest expense of approximately $0.7 million forincurred on the TCP debt in fiscal 2009. Duringyear 2008 was recorded as a component of discontinued operations. Interest on the Senior Term Loan is included in interest expense.
Although the Company maintained higher average cash balances, significant declines in interest rates earned on deposit accounts from fiscal year ended September 30,2008 to fiscal year 2009 we recorded areduced the amount of interest income included in net interest expense by approximately $0.6 million.
Loss on embedded derivative
| | | | | | | | | | | | | |
| | September 30, | | Change | |
|---|
| | 2009 | | 2008 | | $ | | % | |
|---|
| | (in thousands)
| |
| |
| |
|---|
Loss on embedded derivative | | $ | 12,209 | | $ | — | | $ | 12,209 | | | 100.0 | % |
Percent of net revenues | | | 7.3 | % | | 0.0 | % | | | | | | |
Derivative expense related to the change in the fair value adjustment toof the premium put on the 2024 Debentures ofwas $12.2 million. Wemillion in fiscal year 2009. The Company did not record a fair value adjustment during fiscal year 2008. The primary driver of the change in fair value from September 30, 2008 to September 30, 2009 was an increase in the amount of funds available for cash settlement between the measurement dates.
Interest expense on outstanding debt was $4.8 million for the year ended September 30, 2009, an increase of $0.2 million from fiscal 2008. In October 2007, in connection with the sale of the Storage Products business, the Company replaced its debt to Tennenbaum Capital Partners ("TCP") with a note to Whitebox VSC, Ltd. ("Whitebox"). Interest expense of approximately $0.7 million incurred on the TCP debt in fiscal 2008 was recorded as a component of discontinued operations. Interest on the debt with Whitebox is included in interest expense. For fiscal 2009, twelve months of interest was incurred on the Whitebox debt compared to eleven months of interest incurred on the debt during fiscal 2008. Interest expense on the subordinated 2024 Debentures for fiscal 2009 was consistent with fiscal 2008.
Although the Company maintained higher average cash balances, significant declines in interest rates earned on deposit accounts from fiscal 2008 to fiscal 2009 reduced the amount of interest income included in net interest expense by approximately $0.6 million.
Other Income, net
|
| | September 30, | | Change | | | September 30, | | Change | |
|---|
| | 2009 | | 2008 | | $ | | % | | | 2009 | | 2008 | | $ | | % | |
|---|
| | (in thousands)
| |
| |
| | | (in thousands)
| |
| |
| |
|---|
Other income, net | | $ | 223 | | $ | 4,882 | | $ | (4,659 | ) | | (95.4 | )% | | $ | (223 | ) | $ | (4,882 | ) | $ | 4,659 | | 95.4 | % |
Percent of net revenues | | 0.1 | % | | 2.1 | % | | | | | | | (0.1 | )% | | (2.1 | )% | | | | | |
Other income, net of other expense, was $0.2 million in fiscal year 2009 compared to $4.9 million in fiscal year 2008. This decrease is primarily due to the sale of available-for-sale securities held by Vitesse and its subsidiaries in the third quarter of fiscal year 2008. WeThe Company also recognized income related to the settlement of a breach of contract lawsuit and a gain on the sale of scrap material in the first quarter of fiscal year 2008. WeThe Company did not record similar transactions in fiscal year 2009. The change in other income also includes gains and losses due to changes in foreign exchange rates.
Table of Contents
Income Tax (Benefit) Expense
| | | | | | | | | | | | | |
| | September 30, | | Change | |
|---|
| | 2009 | | 2008 | | $ | | % | |
|---|
| | (in thousands)
| |
| |
| |
|---|
Income tax (benefit) expense | | $ | (1,451 | ) | $ | 1,222 | | $ | (2,673 | ) | | (218.8 | )% |
Percent of net revenues | | | (0.9 | )% | | 0.5 | % | | | | | | |
Income tax expense represents state and foreign income tax expense not eligible for offset by loss carry forwards.
Table of Contentscarryforwards.
Minority Interest in EarningsLoss (Earnings) of Consolidated Subsidiary
|
| | September 30, | | Change | | | September 30, | | Change | |
|---|
| | 2009 | | 2008 | | $ | | % | | | 2009 | | 2008 | | $ | | % | |
|---|
| | (in thousands)
| |
| |
| | | (in thousands)
| |
| |
| |
|---|
Minority interest in (loss) earnings of consolidated subsidiary | | $ | (81 | ) | $ | 660 | | $ | (741 | ) | | 112.2 | % | |
Minority interest in loss (earnings) of consolidated subsidiary | | | $ | 81 | | $ | (660 | ) | $ | 741 | | 112.3 | % |
Percent of net revenues | | (0.0 | )% | | 0.3 | % | | | | | | | 0.0 | % | | (0.3 | )% | | | | | |
We recordThe Company recorded a minority interest in the operations of ourits consolidated joint ventures, the Vitesse Venture Fund, L.P. and the Vitesse Venture Fund, L.P. II (together, "the Funds"), representing the limited partners' interest in the Funds' operating income and expenses. A minority interest in the income of ourthe Company's consolidated joint venture was recorded in the third quarter of fiscal year 2008, representing the limited partners' interest in the Funds' gain on the sale of available-for-sale securities. The limited partners' portion of the gain totaled $0.7 million. In the fourth quarter of fiscal year 2009, the Funds recorded an impairment charge to write off an investment that was determined to have an other-than-temporary impairment. WeThe Company recorded a minority interest charge of $0.1 million for the limited partners' portion of the impairment.
Income and Gain on the Sale offrom Discontinued Storage ProductsOperations
|
| | September 30, | | Change | | | September 30, | | Change | |
|---|
| | 2009 | | 2008 | | $ | | % | | | 2009 | | 2008 | | $ | | % | |
|---|
| | (in thousands)
| |
| |
| | | (in thousands)
| |
| |
| |
|---|
Gain on Discontinued Storage Products business, net of tax | | $ | 71 | | $ | 9,044 | | $ | (8,973 | ) | | (99.2 | )% | |
Income from discontinued operations, net of tax | | | $ | 71 | | $ | 9,044 | | $ | (8,973 | ) | | (99.2 | )% |
Percent of net revenues | | 0.0 | % | | 4.0 | % | | | | | | | 0.0 | % | | 4.0 | % | | | | | |
On October 29, 2007, the Company completed its sale of a portion of theits Storage Products business to Maxim Integrated Products, Inc. ("Maxim") for $62.8 million, with a gain on the sale of approximately $21.5 million, plus a potential earn-out based on the business meeting certain criteria, as detailed in the agreement. Maxim acquired the Company's SAS/SATA Expander Product Markets,expander product markets, enclosure and baseboard management devices and certain other assets of the Storage Product business. Assets sold included inventory, property &and equipment, goodwill and intangible assets of $35.5 million. As part of the sale, Maxim assumed a liability for employees' accrued vacation of $0.3 million. The gain was reduced by costs of completing the sale in the amount of $1.6 million.
Debt issuance costs related to the TCP debt of $3.5 million were included in the calculation of the gain on the sale pursuant to the accounting guidance in ASC Topic 205-20 Discontinued Operations ("ASC 205-20"); originally issued asEITF Issue 87-24, "Allocation of Interest to Discontinued Operations." ASC 205-20 which requires any costs related to financing that must be paid off with the proceeds of the sale of specific assets to be included in the determination of the gain or loss on the sale. In accordance with ASC 205-20, we allocated to discontinued operations interest expense associated with debt instruments that were required to be repaid upon the sale of the Storage Product business.. Pursuant to an amendment to the debt agreement with TCP we werethe Company was required to pay the debt owing to TCP from the Storage Products division sale proceeds. Accordingly, for the nine months ended June 30, 2008, interestInterest expense of approximately $16.9 million was included in discontinued operations.operations for the nine months ended June 30, 2008. Interest expense included a "make-whole" payment of $16.4 million and interest expense and amortization of deferred financing fees of $0.5 million.
Table of Contents
ForAlso in accordance with ASC 205-20, for the year ended September 30, 2009, income from discontinued operations consisted solely of income from the earn-out, net of tax, in the amount of $0.1 million.
For the year ended September 30, 2008, income from discontinued operations was $9.0 million, which included $1.7 million of income from the earn-out and residual operations, net of tax. For fiscal
Table of Contents
2008, we reported the results of operations of the Storage Products business as discontinued operations in the Company's statement of operations in accordance with ASC 360.
The following table sets forth selected operating results:
| | | | | | | |
| | September 30, | |
|---|
| | 2009 | | 2008 | |
|---|
| | (in thousands)
| |
|---|
Net revenues of discontinued operations | | $ | — | | $ | 2,656 | |
| | | | | | |
(Loss) income from continuing operations before income taxes | | | (195,644 | ) | | 9,392 | |
Provision for income tax (benefit) expense | | | (1,451 | ) | | 1,222 | |
Minority interest in loss (earnings) of consolidated subsidiary | | | 81 | | | (660 | ) |
Income from discontinued operations, net of tax | | | 71 | | | 9,044 | |
| | | | | | |
Net (loss) income | | $ | (194,041 | ) | $ | 16,554 | |
| | | | | | |
Fiscal Years Ended September 30, 2008 and 2007
Product Revenues
We classify our IC products into three categories: 1) Carrier Networking Products; 2) Enterprise Networking Products;Financial Condition and 3) Non-Core Products. The Networking Products line services Core and Metro WANs, also known as Carrier Networks. Our products are focused on enabling Ethernet data services to be deployed more broadly across these networks. The Enterprise Networking Products line services the market for Ethernet switching and transmission within LANs in SMB and SME markets. Non-Core Products are those product lines where we have chosen to exit markets and no longer continue to invest. The following tables summarize our net product mix by product line.
The following table summarizes our product revenues:
| | | | | | | | | | | | | |
| | September 30, | | Change | |
|---|
| | 2008 | | 2007 | | $ | | % | |
|---|
| | (in thousands)
| |
| |
| |
|---|
Carrier Networking Products | | $ | 92,952 | | $ | 91,670 | | $ | 1,282 | | | 1.4 | % |
Enterprise Networking Products | | | 76,524 | | | 76,089 | | | 435 | | | 0.6 | % |
Non-Core Products | | | 49,060 | | | 54,189 | | | (5,129 | ) | | (9.5 | )% |
| | | | | | | | | | | |
Product Revenues | | $ | 218,536 | | $ | 221,948 | | $ | (3,412 | ) | | (1.5 | )% |
| | | | | | | | | | | |
Product revenues in fiscal year 2008 were $218.5 million, a decrease of 1.5% from the $221.9 million recorded in fiscal year 2007. The revenues reported from the Storage Products exclude revenues generated from product lines sold to Maxim in October 2007.
Product revenues from Carrier Networking Products were $93.0 million in fiscal 2008, compared with $91.7 million in fiscal 2007. The increase of 1.4% was primarily due to growth in Optical PHY and signal integrity product lines.
Product revenues from Enterprise Networking Products in fiscal 2008 were $76.5 million, an increase of 0.6%, compared with $76.1 million in fiscal 2007. The increase was primarily due to growth in our Ethernet switch and Cu PHY products, our signal integrity products. This was partially offset by a decrease in sales from our legacy packet switch product family.
Product revenues from Non-Core Products were $49.1 million in fiscal 2008, compared with $54.2 million in fiscal 2007. The decrease of $5.1 million, or 9.5%, in revenues, was primarily due to
Table of Contents
weaker demand for our products that are at or nearing their end-of-life in markets that we have chosen to exit. Accordingly we are not actively pursuing sales of these products.
In fiscal 2008, we shipped approximately $22.1 million in products that are now classified as EOL compared with $34.9 million in fiscal 2007. These products were older generation storage products including our 2G Fibre Channel products and Enclosure Management products classified as Non Core products, certain older generation Ethernet Switch and MAC products classified as Enterprise products, and certain of our Network Processor ("NPU") products and older generation products manufactured in our Camarillo, California GaAs fabrication facility classified as Carrier Networking products.
Licensing Revenues
| | | | | | | | | | | | | |
| | September 30, | | Change | |
|---|
| | 2008 | | 2007 | | $ | | % | |
|---|
| | (in thousands)
| |
| |
| |
|---|
Licensing revenues | | $ | 10,000 | | $ | — | | $ | 10,000 | | | — | |
Licensing revenues were $10.0 million in fiscal 2008, compared with $0 in fiscal 2007. On December 28, 2007, the Company entered into an arrangement to license intellectual property to a third-party. Specific deliverables to the licensee were defined in the agreement and required acceptance from the licensee. We received confirmation of the deliverables from the licensee and recognized $10.0 million of licensing revenues in September 2008. In 2008, we began to leverage our substantial intellectual property ("IP") portfolio into licensing opportunities with third parties. We offer a variety of IP "cores" and design services in deep submicron, 130 nm and 65 nm, process technologies. To date, our primary focus has been our Gigabit Ethernet Copper PHY and Switch technologies as well as high-speed PHYs and Signal Integrity "cores."
Cost of Revenues
| | | | | | | | | | | | | |
| | September 30, | | Change | |
|---|
| | 2008 | | 2007 | | $ | | % | |
|---|
| | (in thousands)
| |
| |
| |
|---|
Cost of Revenues | | $ | 106,344 | | $ | 113,754 | | $ | (7,410 | ) | | (6.51 | )% |
Percent of net revenues | | | 46.5 | % | | 51.3 | % | | | | | | |
As a fabless semiconductor company, we use third-parties (including TSMC, IBM, Chartered Amkor, ASAT, and ASE) for wafer fabrication and assembly services. Our cost of revenues consists predominantly of: (i) purchased finished wafers; (ii) assembly services; and (iii) labor and overhead costs associated with product procurement and testing.
Our cost of revenues was $106.3 million in fiscal 2008 compared to $113.8 million in fiscal 2007. As a percentage of net revenues, our cost of revenues was 46.5% in fiscal 2008 compared to 51.3% in fiscal 2007.
Substantial portions of our revenue growth in 2008 were from lower margin products in our Enterprise Networking product lines. This was the result of our focus in prior years to diversify our business in areas outside the Carrier Networking markets. While products in these new markets provide good diversification and growth opportunities, they come at a higher overall cost of revenues in these new markets.
During 2008, revenues from these higher cost products increased, while total cost of revenues improved compared to 2007 due to:
•Substantial cost containment efforts by the Company. This cost containment is primarily attributed to efforts to reduce the purchase price of materials such as wafers and packages, and
Table of Contents
improvements in the efficiency of operations, including product yields. As it is customary for product prices in the semiconductor industry to decline over time, it is imperative that we continue to reduce our cost of revenues. Our efforts continued to be focused on improving operating efficiencies, including improving product yields, reducing scrap, and improving cycle times; and
•There was no cost of revenues associated with intellectual property licensing revenues of $10.0 million in fiscal 2008.
Engineering, Research and Development
| | | | | | | | | | | | | |
| | September 30, | | Change | |
|---|
| | 2008 | | 2007 | | $ | | % | |
|---|
| | (in thousands)
| |
| |
| |
|---|
Engineering, research and development | | $ | 49,982 | | $ | 47,199 | | $ | 2,783 | | | 5.9 | % |
Percent of net revenues | | | 21.9 | % | | 21.3 | % | | | | | | |
Engineering, research and development expenses consist primarily of salaries and related costs, including share-based compensation expense of employees engaged in research, design, and development activities. Engineering, research, and development also includes costs of mask sets, electronic design automation tools, software licensing contracts, subcontracting and fabrication costs, depreciation and amortization, and facilities expenses.
Engineering, research and development expenses for 2008 were $50.0 million, an increase of $2.8 million or 5.9% from $47.2 million in 2007. The increase in engineering, research and development expenses is primarily due to increased headcount and related employment costs resulting from our engineering efforts in the development of new products.
We believe that continued investment in the design and development of future products is vital to maintaining a competitive edge. We have closely monitored our known and forecasted revenues, demand, and operating expense run rates. We continue to seek opportunities to focus research and development activities and will continue to closely monitor both our costs and our revenue expectations in future periods. We will continue to concentrate our spending in this area to meet our customer requirements and respond to market conditions.
Selling, General and Administrative
| | | | | | | | | | | | | |
| | September 30, | | Change | |
|---|
| | 2008 | | 2007 | | $ | | % | |
|---|
| | (in thousands)
| |
| |
| |
|---|
Selling, general and administrative | | $ | 50,557 | | $ | 42,459 | | $ | 8,098 | | | 19.1 | % |
Percent of net revenues | | | 22.1 | % | | 19.1 | % | | | | | | |
Selling, general and administrative ("SG&A") expense consists primarily of personnel-related expenses, including share-based compensation expense, legal and other professional fees, facilities expenses, outside labor and communications expenses.
SG&A expenses were $50.6 million in fiscal 2008 compared to $42.5 million in fiscal 2007. The $8.1 million increase in our SG&A expenses for fiscal 2008, is primarily due to higher accounting fees paid to our auditors for services related to the auditing and issuing of our 2006 and 2007 financial statements. Audit fees are considered recurring costs and are not included in the accounting remediation costs discussed below. We also experienced increases in bonus and commission expense as a result of improved operating performance and expense related to the cost of outside labor to prepare our Colorado Springs facility for sale. These increased costs are partially offset by a $3.2 million gain on the sale of fixed assets.
Table of Contents
Accounting Remediation & Reconstruction Expense and Litigation Costs
| | | | | | | | | | | | | |
| | September 30, | | Change | |
|---|
| | 2008 | | 2007 | | $ | | % | |
|---|
| | (in thousands)
| |
| |
| |
|---|
Accounting remediation & reconstruction expense & litigation costs | | $ | 10,761 | | $ | 13,558 | | $ | (2,797 | ) | | (20.6 | )% |
Percent of net revenues | | | 4.7 | % | | 6.1 | % | | | | | | |
Accounting remediation and reconstruction expense and litigation costs consist of fees incurred in connection with the preparation and issuance of our fiscal 2006 and fiscal 2007 financial statements. We recorded $10.8 million in 2008 and $13.6 million in 2007 related to work performed on stock option accounting and inventory valuation, revision of our revenue recognition policies, and other legal and financial reporting issues. Of these costs, legal fees constituted $4.1 million and $7.6 million, respectively, and other professional and accounting fees were $6.7 million and $6.0 million, respectively.
Accounting remediation and reconstruction costs are expected to decrease significantly in fiscal 2009 as we resolve certain legal issues, complete and file all outstanding financial reports, and transition accounting and reporting responsibilities to full-time staff.
Amortization of Intangible Assets
| | | | | | | | | | | | | |
| | September 30, | | Change | |
|---|
| | 2008 | | 2007 | | $ | | % | |
|---|
| | (in thousands)
| |
| |
| |
|---|
Amortization of intangible assets | | $ | 2,514 | | $ | 6,777 | | $ | (4,263 | ) | | (62.9 | )% |
Percent of net revenues | | | 1.1 | % | | 3.0 | % | | | | | | |
Amortization of intangible assets was $2.5 million in fiscal 2008, compared to $6.8 million in fiscal 2007. The decrease from 2007 to 2008 is due to intangible assets related to our prior acquisitions of Exbit Technology A/S, APT Technologies, Inc, and Multilink Technology Corporation becoming fully amortized during 2007. See Note 2—Goodwill and Other Intangible Assets in the accompanying consolidated financial statements for additional information.
Interest Expense, net
| | | | | | | | | | | | | |
| | September 30, | | Change | |
|---|
| | 2008 | | 2007 | | $ | | % | |
|---|
| | (in thousands)
| |
| |
| |
|---|
Interest expense, net | | $ | 3,868 | | $ | 2,580 | | $ | 1,288 | | | 49.9 | % |
Percent of net revenues | | | 1.7 | % | | 1.2 | % | | | | | | |
Interest expense, net of interest income increased approximately $1.3 million to $3.9 million in 2008. In October 2007, in connection with the sale of the Storage Products business, the Company replaced its debt to Tennenbaum Capital ("TCP") with a note to Whitebox VSC, Ltd. ("Whitebox"). Interest expense incurred on the TCP debt in fiscal 2007 and 2008 was higher than the fiscal 2008 Whitebox interest expense, but all interest expense related to the TCP debt was recorded as a component of discontinued operations in fiscal 2007 and 2008, resulting in $3.1 million higher net interest expense in fiscal 2008. This increase is offset by a decrease in interest on the subordinated 2024 Debentures. In the second half of fiscal 2007, we incurred an additional 4% interest on the debentures in connection with the Second Supplemental Indenture dated September 24, 2007. As a result, interest expense related to the subordinated debentures decreased by $1.9 million in fiscal 2008 compared to fiscal 2007. We did not record a fair value adjustment during the fiscal 2008.
Table of Contents
Loss on Extinguishment of Debt
| | | | | | | | | | | | | |
| | September 30, | | Change | |
|---|
| | 2008 | | 2007 | | $ | | % | |
|---|
| | (in thousands,
except
percentages)
| |
| |
| |
|---|
Loss on extinguishment of debt | | $ | — | | $ | (1,977 | ) | $ | 1,977 | | | 100.0 | % |
Percent of net revenues | | | 0.0 | % | | (0.9 | )% | | | | | | |
In connection with the amendment to the 2024 Debentures in the first quarter of fiscal 2007, (See Note 6—Debt in the accompanying consolidated financial statements), the conversion price of the 2024 Debentures was permanently decreased from $3.92 to $2.546 per share of common stock, resulting in debt terms that were substantially different from the original debt terms. In accordance with 470 Debt ("ASC 470"); originally issued as EITF 96-19"Debtor's Accounting for a Modification or Exchange of Debt Instruments," the Company recognized a loss of $2.0 million on the extinguishment of debt in the first quarter of fiscal 2007 as a result of the write-off of unamortized debt issuance costs.
Other Income, net
| | | | | | | | | | | | | |
| | September 30, | | Change | |
|---|
| | 2008 | | 2007 | | $ | | % | |
|---|
| | (in thousands)
| |
| |
| |
|---|
Other income, net | | $ | 4,882 | | $ | 1,755 | | $ | 3,127 | | | 178.2 | % |
Percent of net revenues | | | 2.1 | % | | 0.8 | % | | | | | | |
Other income, net of expense, was $4.9 million in fiscal 2008 compared to $1.8 million in fiscal 2007. Other income in fiscal 2008 was primarily related to gains on the sale of available-for-sale securities held by Vitesse and its subsidiaries of $3.4 million, $0.4 million income from the settlement of a breach of contract lawsuit, a $0.5 million gain on scrap materials. In fiscal 2007, other income primarily consisted of miscellaneous, non-recurring royalty payments generated from the licensing of intellectual property to third parties.
Income Tax Expense
| | | | | | | | | | | | | |
| | September 30, | | Change | |
|---|
| | 2008 | | 2007 | | $ | | % | |
|---|
| | (in thousands)
| |
| |
| |
|---|
Income tax expense | | $ | 1,222 | | $ | 224 | | $ | 998 | | | 445.5 | % |
Percent of net revenues | | | 0.5 | % | | 0.1 | % | | | | | | |
Income tax expense represents state and foreign income tax expense not eligible for offset by loss carry forwards.
Minority Interest in Earnings of Consolidated Subsidiary
| | | | | | | | | | | | | |
| | September 30, | | Change | |
|---|
| | 2008 | | 2007 | | $ | | % | |
|---|
| | (in thousands)
| |
| |
| |
|---|
Minority interest in earnings of consolidated subsidiary | | $ | 660 | | $ | — | | $ | 660 | | | — | |
Percent of net revenues | | | 0.3 | % | | 0.0 | % | | | | | | |
Table of Contents
A minority interest in the income of our consolidated joint venture, the Vitesse Venture Fund, L.P. ("the Fund"), was recorded in the third quarter of fiscal 2008, representing the limited partners' interest in the Fund's gain on the sale of available-for-sale securities. The limited partners' portion of the gain totaled $0.7 million for the year ended September 30, 2008.
Income and Gain on the Sale of Discontinued Storage Products
| | | | | | | | | | | | | |
| | September 30, | | Change | |
|---|
| | 2008 | | 2007 | | $ | | % | |
|---|
| | (in thousands)
| |
| |
| |
|---|
Gain (loss) on Discontinued Storage Products business, net of tax | | $ | 9,044 | | $ | (16,822 | ) | $ | 25,866 | | | 153.8 | % |
Percent of net revenues | | | 4.0 | % | | (7.6 | )% | | | | | | |
On October 29, 2007, the Company completed its sale of a portion of its Storage Products business, as discussed in Note 3—Discontinued Operations and Assets Held for Sale in the accompanying financial statements, for $62.8 million, with a with a gain on the sale of approximately $21.5 million, plus a potential earn-out based on the business meeting certain criteria, as detailed in the agreement. Assets sold include inventory, property & equipment, goodwill and intangible assets of $35.5 million. As part of the sale, Maxim assumed a liability for employees' accrued vacation of $0.3 million. Debt issuance costs related to the debt with TCP of $3.5 million were included in the calculation of the gain on the sale. The gain was reduced by costs of completing the sale in the amount of $1.6 million.
In accordance with ASC 205-20, we have allocated to discontinued operations interest expense associated with debt instruments that were required to be repaid upon the sale of Storage Products. For the year ended September 30, 2008, interest expense of approximately $16.9 million was included in discontinued operations. Interest expense included a "make-whole" payment of $16.4 million, and interest expense and amortization of deferred financing fees of $0.5 million. For the year ended September 30, 2007, interest and amortization of deferred financing fees was $10.2 million.
For the year ended September 30, 2008, results of discontinued operations increased $25.8 million, from a loss of $16.8 million in fiscal 2007 to income of $9.0 million in fiscal 2008. The increase is the result of a gain on the sale of $21.5 million, offset by the loss on discontinued operations of $12.5 million, net of tax of $0.9 million, compared with the loss on discontinued operations of $16.8 million for fiscal 2007.
Results of discontinued operations for the year ended September 30, 2008 compared to the same period in fiscal 2007 increased $12.1 million, from a loss of $6.6 million to income of $5.5 million. This increase includes $4.0 million of income related to the earn-out, $1.4 million related to the final delivery on an end-of-life product, and approximately $6.7 million as a result of the inclusion of only one month of operations through the date of sale for the year ended September 30, 2008 compared to a full year of operations recorded in the period ended September 30, 2007.
We recorded amounts in discontinued operations in accordance ASC 360. Accordingly, we have reported the results of operations and financial position of the Storage Products business in discontinued operations within the Company's statements of operations and as assets and liabilities held for sale in the Company's balance sheet as of September 30, 2007.
Table of Contents
Selected operating results were as follows:
| | | | | | | |
| | 2008 | | 2007 | |
|---|
| | (in thousands)
| |
|---|
Net revenues of discontinued operations | | $ | 2,656 | | $ | 18,057 | |
| | | | | | |
Income (loss) from continuing operations before income taxes | | | 8,732 | | | (4,601 | ) |
Provision for income taxes | | | 1,222 | | | 224 | |
Income (loss) from discontinued operations, net of tax | | | 9,044 | | | (16,822 | ) |
| | | | | | |
Net income (loss) | | $ | 16,554 | | $ | (21,647 | ) |
| | | | | | |
Liquidity
Cash and cash equivalents increaseddecreased to $38.1 million at September 30, 2010, from $57.5 million at September 30, 2009, and increased from $36.7 million at September 30, 2008, as a result of the following:
|
| | September 30, | | | September 30, | |
|---|
| | 2009 | | 2008 | | | 2010 | | 2009 | | 2008 | |
|---|
| | (in thousands)
| | | (in thousands)
| |
|---|
Net cash provided by (used in) operating activities | | $ | 19,197 | | $ | (22,620 | ) | |
Net cash provided by investing activities | | 1,649 | | 65,588 | | |
Net cash provided by operating activities | | | $ | 1,472 | | $ | 19,197 | | $ | (22,620 | ) |
Net cash (used in) provided by investing activities | | | (3,188 | ) | | 1,649 | | 65,588 | |
Net cash used in financing activities | | (24 | ) | | (32,222 | ) | | (17,701 | ) | | (24 | ) | | (32,222 | ) |
| | | | | | | | | | | | | |
Net increase in cash and cash equivalents | | 20,822 | | 10,746 | | |
Net (decrease) increase in cash and cash equivalents | | | (19,417 | ) | | 20,822 | | 10,746 | |
Cash and cash equivalents at beginning of year | | 36,722 | | 25,976 | | | 57,544 | | 36,722 | | 25,976 | |
| | | | | | | | | | | | | |
Cash and cash equivalents at end of year | | $ | 57,544 | | $ | 36,722 | | | $ | 38,127 | | $ | 57,544 | | $ | 36,722 | |
| | | | | | | | | | | | | |
Net Cash provided by Operating Activities
In 2010, the Company's operating activities provided $1.5 million in cash. The Company's net loss of $20.1 million included noncash charges of $20.8 million for the loss on extinguishment of debt, $3.5 million of depreciation expense, $2.2 million of share-based compensation expense, $1.3 million in capitalized interest related to long-term debt, $1.8 million of amortization of debt discounts, $1.1 million fair value adjustment to the premium put on the 2024 Debentures, $0.8 million of amortization for debt issuance costs, and $0.3 million for the gain on the conversion of 2014 Debentures, offset by a $7.9 million gain on the change in fair value of the embedded derivative liability for the 2014 Debentures,
In 2009, ourthe Company's operating activities provided $19.2 million in cash. OurThe Company's net loss of $194.0 million included noncash charges of a $191.4 million goodwill impairment charge, $12.2 million fair value adjustment to the premium put, $4.2 million of depreciation expense, $3.1 million of stock-basedshare-based compensation expense, a $3.0 million accrual for ourthe Company's pending settlement with the SEC related to past accounting irregularities, and, a $1.0 million adjustment of our stock option backdating payroll tax liability due to our settlement with the IRS for less than estimated, and a $191.4 million goodwill impairment charge, offset by a gain on the sale of the Colorado building of $2.9 million. Cash expenses for fiscal 2009 include $4.1 million, in costs relatedand a $1.0 million adjustment of the Company's stock option backdating payroll tax liability due to our restructuring and remediation efforts and $2.1 million in legal and professional fees related to the restructuring of our 2024 Debentures and our senior note with Whitebox VSC, Ltd. These costs were offset by a $16.0 million credit related to theits settlement with our former independent registered public accounting firm (See Item 2—Management's Discussion and Analysis of Financial Condition and Results of Operations).the IRS for less than estimated.
In 2008, ourthe Company's operating activities usedprovided $22.6 million in cash. This was primarily the result of $7.5 million of income from continuing operationscash and a $9.0 million gain from discontinued operations, offset by $18.0 million in net non-cash operating expenses and $21.2 million provided by changes in operating assets and liabilities.
Accounts receivable increased $5.0 million from $6.3 million at September 30, 2008 to $11.4 million at September 30, 2009. The increase is primarily due to higher sales at the end of the fiscal year. Inventories decreased $18.7 million from $37.5 million at September 30, 2008 to $18.8 million at September 30, 2009, reflecting the decrease in our sales demand, and consequently our inventory purchases, and our channel partners and distributors taking action to reduce their inventory in response to the current economic slowdown. We were able to respond quickly to the change in demand, reducing orders to our suppliers. Our inventory levels will continue to be determined based upon the level of purchase orders we receive, and our ability and the ability of our customers to
Table of Contents
manage inventory levels. Such considerations are balanced against the risk of obsolescence or potentially excess inventory levels.
Accrued expenses decreased by $4.7 million, including reductions of accrued income taxes and accrued wages. The decrease is primarily due to $0.9 million paid to the IRS upon the settlement of taxes related to backdated stock options. Accrued wages, including accrued bonuses and commissions were further reduced by $1.0 million due to headcount and salary reductions and lower sales volume during the year. Accrued income taxes decreased by $2.4 million primarily due to tax payments made during fiscal 2009. In addition, deferred revenue decreased by $1.4 million as a result of the decline in distributor purchases.
In 2008, cash used in operating activities was primarily related to a reduction in deferred revenue resulting from a change in payment terms on distributor activity. The Company eliminated the option of its distributors to deduct 2% from invoice amounts if the distributors pay their invoice within 10 days of the invoice date. There was no change in revenue recognition policy, but rather a change in terms and conditions of payment policy. Additionally, wethe Company used cash to increase ourits investment in wafer die bank and finished goods inventory in order to improve ourthe Company's on-time delivery, particularly in ourits Ethernet product line. WeThe Company also experienced a decrease in accrued expenses due to the timing of payments to ourits vendors and other service providers. Cash used in operations was partially offset by a decrease in accounts receivable due to increased focus on cash management and collection efforts.
Table of Contents
Investing activities provided cashCash expenses for fiscal year 2010 include $4.6 million paid for interest related to the 2014 Debentures and Senior Term Loan, and $0.6 million for income taxes.
Cash expenses for fiscal year 2009 include $4.1 million in costs related to the Company's restructuring and remediation efforts and $2.1 million in legal and professional fees related to the restructuring of its 2024 Debentures and its Senior Term Loan. These costs were offset by a $16.0 million credit related to the settlement with the Company's former independent registered public accounting firm.
Accounts receivable increased $0.7 million from $15.1 million at September 30, 2009 to $15.8 million at September 30, 2010. The increase is primarily due to higher sales at the end of the fiscal year. Accounts receivable increased $5.0 million from $10.1 million at September 30, 2008 to $15.1 million at September 30, 2009. The increase is primarily due to higher sales at the end of the fiscal year.
Inventories increased $8.5 million from $18.8 million at September 30, 2009 to $27.3 million at September 30, 2010, reflecting the increase in the Company's sales demand, and consequently the Company's inventory purchases. In fiscal year 2009, inventories decreased by $18.7 million from $37.5 million at September 30, 2008 to $18.8 million at September 30, 2009, reflecting the decrease in the Company's sales demand, and consequently the Company's inventory purchases, and its channel partners and distributors taking action to reduce their inventory in response to the economic slowdown. The Company's inventory levels will continue to be determined based upon the level of purchase orders it receives, and its ability and the ability of its customers to manage inventory levels. Such considerations are balanced against the risk of obsolescence or potentially excess inventory levels.
Prepaid and other current assets decreased by $2.0 million in fiscal year 2010 compared to fiscal year 2009 primarily due to the Company collecting a $1.5 million refund for personal property taxes, as well as a reduction in short term deposits related to the expiration of building leases overseas and software licensing deposits, and was offset by an increase in payroll related prepaid expenses of $0.8 million.
Accounts payable increased by $2.0 million in fiscal year 2010 compared to fiscal year 2009, as a result of the increase in inventory purchases at year-end. Accrued expenses increased by $2.1 million in fiscal year 2010 compared to fiscal year 2009, due to an increase in accruals for software licensing, interest payable and payroll. Accrued income taxes increased by $0.2 million in fiscal year 2010 compared to fiscal year 2009, primarily due to the decrease in NOL's. The increase was offset by tax payments made during fiscal 2010. In addition, deferred revenue increased by $2.4 million in fiscal year 2010 compared to fiscal year 2009, as a result of the increase in distributor purchases.
Accrued expenses decreased by $6.0 million in fiscal year 2009 compared to fiscal year 2008, including reductions of accrued income taxes and accrued wages. The decrease is primarily due to $0.9 million paid to the IRS upon the settlement of taxes related to backdated stock options. Accrued wages, including accrued bonuses and commissions were further reduced by $1.0 million due to headcount and salary reductions and lower sales volume during the year. Accrued income taxes decreased by $2.4 million in fiscal year 2009 compared to fiscal year 2008, primarily due to tax payments made during fiscal year 2009. In addition, deferred revenue increased by $1.6 million in fiscal year 2009 compared to fiscal year 2008, as a result of the increase in distributor purchases.
Net Cash (used in) provided by Investing Activities
Investing activities used $3.2 million in cash in fiscal 2010, which was primarily the result of capital expenditures of $3.1 million and the purchase of intangibles of $0.1 million. In 2009, the Company's investing activities provided $1.6 million in cash, which was primarily the result of the proceeds from the sale of the Colorado building of $6.0 million, net of commissions and transaction costs, partially
Table of Contents
offset by capital expenditures of $2.3 million and the purchase of to intangibles of $2.0 million. In 2008, ourthe Company's investing activities provided $65.6 million primarily as a result of the sale of ourits Storage Products business.
Net Cash used in Financing Activities
In 2010, the Company's financing activities used $17.7 million in cash, which was primarily due to a cash payment of $10.0 million to the holders of the 2024 Debentures, $5.0 million to pay down the principal amount of the Senior Term Loan, equity issuance costs of $1.1 million, debt issuance costs of $1.4 million, and $0.2 million in payments on capital leases. In 2008, ourthe Company's financing activities used $32.2 million in cash, which was primarily a result of the repayment of ourits $59.5 million debt with TCP, offset by the proceeds received from Whitebox forits Senior Term Loan of $29.3 million. (See Debt Note in the accompanying financial statements).
On October 30, 2009, we closed a debt restructuring transaction with our major creditors pursuant to which we issued approximately $50.0 million of new 8.0% Convertible Second Lien Debentures Due 2014 (the "2014 Notes") (See Note 6—Debt in the accompanying consolidated financial statements). Under the terms of the indenture governing the 2014 Notes, if we do not receive shareholder approval of an increase in our authorized shares of common stock on or prior to February 15, 2010, we will be obligated to pay $500,000 per month in additional interest until stockholder approval of this increase is obtained. If we are unable to obtain this stockholder approval prior to February 15, 2011, the holders of the 2014 Notes will have the right to convert the 2014 Notes into cash. If we are obligated to pay this additional interest, it will have a significant negative impact on our cash position and our results of operations. We believe that our available cash will be adequate to finance our operating needs and meet our obligations for the next 12 months; however, we do not believe that we will have sufficient cash by February 15, 2011 to permit a cash conversion of the 2014 Notes. Annual interest payments on the 2014 Notes will be $4.0 million annually, an increase of $2.5 million over the annual interest payments on the 2024 Debentures. The first interest payment on the 2014 notes is due April 1, 2010.
Concurrent with the issue of the 2014 Notes, the Company amended the terms of the Senior Secured Loan Agreement (the "Amended Senior Secured Loan," the "Senior Secured Loan") with Whitebox VSC, Ltd (See Note 14—Subsequent Event in the accompanying consolidated financial statements). The amendment of the Senior Secured Loan Agreement included a $5.0 million repayment of principal; a fee of 1% of the amount of repayments; and a change to the interest terms on the note. The amended interest terms on the Senior Secured Note will not materially impact the amount of quarterly interest payments over the remaining life of the note but additional interest expense accrued under a payment-in-kind interest ("PIK") provision will increase the final payment due on the Senior
Table of Contents
Secured Loan at maturity in the fiscal year ending September 30, 2012 by approximately $2.6 million over the face value of the note.
As part of the debt restructure, On October 30, 2009, the Company paid $10.1 million to repay a portion of the 2024 Debentures. The Company also incurred approximately $6.0 million in legal and other fees to complete the transaction.
On December 28, 2007, the Company entered into an arrangement to license IP to a third-party. The contract is a perpetual, nonexclusive, non-transferable, irrevocable license for specified IP. As part of the contract, we were granted a perpetual, nonexclusive, non-transferable, irrevocable license to improvements to the technology made by the licensee, subject to certain limitations. Under the agreement, Vitesse received $15.0 million in license fees and royalties for the rights to certain products and technology. Of the fees and royalty payments, $10.0 million in fees was received upon delivery and acceptance of the licensed technology. The remaining $5.0 million of fees was received upon the one-year anniversary of the agreement. For a period of seven years from the effective date of the contract, licensee will pay royalties on a per unit basis, on each commercial sale incorporating the licensed products. Royalties will be accounted for when received. No royalties were received or recognized for the twelve months ended September 30, 2009.
Capital Resources, including Long-Term Debt, Contingent Liabilities and Operating Leases
Debt Restructuring
In October 2009, Vitesse completed itsa debt restructuring transactions.transaction for the 2024 Debentures. The debt restructuring agreements call forresulted in the conversion of 96.7% of the Company's approximately $110 million aggregate principal amount of 1.5% Convertible Subordinated2024 Debentures due 2024 into a combination of cash, equity securities,common stock, Series B Preferred Stock and secured convertible debentures. With respect to the remaining 3.3%2014 Debentures. The holders of those convertible debentures, the Company is settling its obligations in cash. Additionally, Vitesse has made cash payment of approximately $5 million of its $30 million senior secured loan, the terms of which had been amended to facilitate the debt restructuring.
Under the terms96.7% of the debt restructuring transaction, Vitesse is:2024 Debentures received:
- •
Paying approximately $3.6$6.4 million in cash to satisfy its obligations to those holders of 2024 Debentures that did not participate.
- •
Paying approximately $6.4 million as cash consideration to those holders of the 2024 Debentures that participated in the exchange.
•Issuing approximately $50$50.0 million in aggregate principal amount of new convertible secured debentures [to those holders of the 20242014 Debentures. The 2014 Debentures that participated in the exchange]. These new convertible secured debentures have a five-year term, an 8.0% annual interest rate and a conversion price of $0.225$4.50 per share. The indebtedness under these new convertible secured debentures2014 Debentures is secured by a second-priority security interest in substantially all of Vitesse's assets.assets that is subordinated to the security of the Senior Term Loan. Annual interest payments on the 2014 Debentures will be $3.7 million annually, an increase of $2.2 million over the annual interest payments on the 2024 Debentures.
- •
Issuing approximately 173 million8,646,811 shares of common stock along with approximatelystock; some holders also received an aggregate of 771,000 shares of a new Series B Preferred Stock, that will bewhich are convertible into common stock on a 100:1five-to-one basis and that will have a dividend preference relative to the common stock [to those holders of the 2024 Debentures that participated in the exchange].stock. The Series B Preferred Stock and the new convertible secured debentures2014 Debentures include restrictions on conversion that prohibit a holderprohibits holders of these securities from converting them if it would result in the holder beneficially owning more than 9.9%9.99% of Vitesse's outstanding common stock. .
- •
- Vitesse also paid $3.6 million in cash to satisfy its obligations to the holders of 3.3% of the 2024 Debentures who did not participate in the transaction.
Concurrent with debt restructuring, the Company amended the terms of the Senior Term Loan Agreement. The amendment of the Senior Term Loan included a $5.0 million repayment of principal, a fee of 1.0% of the amount of repayments, and agreed to an increase in the interest rate. The amended interest terms on the Senior Term Loan will not materially impact the amount of quarterly interest payments over the remaining life of the associated note, but additional interest expense accrued under a payment-in-kind interest ("PIK") provision will increase the final payment due on the Senior Term Loan at maturity in the fiscal year ending September 30, 2012 by approximately $2.7 million over the face value of the note. (See Note 14—Subsequent Events4—Debt in the accompanying consolidated financial statements).Consolidated Financial Statements.)
We will be holding aAt the special meeting of our shareholderthe Company's stockholders on January 7, 2010, to approvethe stockholders approved an amendment to our certificate of incorporation to increase in the number of authorized shares of common stock from 500,000,000 to 5,000,000,000 shares. This increase permits the conversion of the 2014 Debentures into shares of common stock and provides available shares for other general corporate purposes. In addition, the Company's stockholders authorized the Board to effect a reverse stock-split. On May 17, 2010, the
Table of Contents
Company announced its plans to complete a one-for-20 reverse stock split of its common stock, effective on June 30, 2010. All share and per share amounts have been retroactively adjusted to permitreflect the conversionreverse stock split. There was no net effect on total stockholders' equity as a result of the 2014 Notes andreverse stock split.
Prospective Capital Needs
On October 29, 2011, the Company is obligated to provide additional shares of common stock for general corporate purposes. Underrepay all amounts outstanding under its Senior Term Loan. The Company is exploring renegotiating the terms of the indenture governingSenior Term Loan as well as alternative sources of funding to repay or refund the 2014 Notes, if we do not receive shareholder approval of an increasedebt such as selling debt securities through privately negotiated transactions, exchange offers (for new debt or other securities) and redemptions on terms and conditions that the Company may determine appropriate. If the Company is unsuccessful in our authorized shares of common stock onrenegotiating, repaying or prior to February 15, 2010, werefunding the debt, the Company believes it will be obligatedable to pay $500,000 per month in additional interest until stockholder approvalmeet its debt obligations through working capital and projected cash flows from operations
The Company believes that its existing sources of this increase is obtained. If we are unableliquidity, along with cash expected to obtain this stockholder approval prior to February 15, 2011, the holders of the 2014 Notes will have the right to convert the 2014 Notes into cash. Should the holder(s) require the Company to repurchase the securities for cash, the repurchase price would be equal to (i) the as-converted amount of the shares that would have been issued to the holder had the increase in authorized shares occurredgenerated from product sales and the holder(s) had exercisedsale and licensing of intellectual property, will be sufficient to fund its conversion option plus (ii)operations research and development efforts, anticipated capital expenditures, working capital and other financing requirements for the Make-Whole Amount that would have been applicable if the holder(s) had exercised its conversion right, or assuming the repurchase of all of the 2014 Notes, $58.0 million. We do not believe that we will have sufficient cash by February 15, 2011 to permit a cash conversion of the 2014 Notes. If we have insufficient cash to convert all of 2014 Notes submitted for conversion, we would be in default under the terms of the 2014 Notes, which would give the holders the of the 2014 the rights to accelerate the maturity of the Notes.next 12 months.
Contractual Obligations
The following table summarizes ourthe Company's significant contractual obligations as of September 30, 2009:2010:
|
|
| | Payment Obligations by Year | |
| | Payment Obligations by Year | |
|---|
|
| | <1 Year | | 1 - 3 Years | | 3 - 5 Years | | >5 Years | | Total | |
| | <1 Year | | 1 - 3 Years | | 3 - 5 Years | | >5 Years | | Total | |
|---|
Current Portion—Whitebox Debt | | $ | 5,000 | | $ | 25,000 | | $ | — | | $ | — | | $ | 30,000 | | |
Convertible subordinated debt | Convertible subordinated debt | | 10,000 | | 86,700 | | — | | — | | 96,700 | | Convertible subordinated debt | | $ | — | | $ | 46,500 | | $ | — | | $ | — | | $ | 46,500 | |
Long term debt | | Long term debt | | — | | 25,000 | | — | | — | | 25,000 | |
PIK interest(1) | | PIK interest(1) | | — | | 2,741 | | — | | — | | 2,741 | |
Operating leases | Operating leases | | 3,050 | | 6,089 | | 4,717 | | 1,266 | | 15,122 | | Operating leases | | 3,285 | | 7,789 | | 1,336 | | — | | 12,410 | |
Software Licenses | | 6,426 | | 8,563 | | 6,400 | | — | | 21,389 | | |
Software licenses | | Software licenses | | 7,782 | | 12,625 | | — | | — | | 20,407 | |
Inventory and related purchase obligations | Inventory and related purchase obligations | | 15,517 | | — | | — | | — | | 15,517 | | Inventory and related purchase obligations | | 12,304 | | — | | — | | — | | 12,304 | |
| | | | | | | | | | | | | | | | | | | | | | | | | |
| | Total | | $ | 39,993 | | $ | 126,352 | | $ | 11,117 | | $ | 1,266 | | $ | 178,728 | | Total | | $ | 23,371 | | $ | 94,655 | | $ | 1,336 | | $ | — | | $ | 119,362 | |
| | | | | | | | | | | | | | | | | | | | | | | | | |
- (1)
- Represents maturity value of accrued PIK interest on Senior Term Loan.
As of September 30, 2009, $96.72010, the 2014 Debentures, with a face value of $46.5 million, were outstanding. Additionally, the Company also has outstanding $25.0 million original principal of long-term debt, plus $1.3 million of accrued PIK interest as of September 30, 2010. Payments with respect to the 2024 Debentures are outstanding. Additionally, we have $30.0 million in long-term debt with Whitebox. Payments to WhiteboxSenior Term Loan are interest only until the maturity date of October 29, 2011. (See Note 6—Debt and Note 14—Subsequent Events in the accompanying consolidated financial statements). According to the terms of the Whitebox Agreement, under certain circumstances, repayment of the 2024 Debentures would require that the
The Company to immediately pay to Whitebox the lesser of (A) the aggregate principal amount of the outstanding Whitebox debt, including accrued and unpaid interest and (B) 25% of the aggregate amount of the 2024 Debentures redeemed. As of September 30, 2009, the Company classified as short-term liabilities the $5.0 million in cash paid to the Senior Lender of the senior secured loan; $10.0 million of cash used to pay down (a) $3.6 million to settle with the holders of the 2024 Debentures that are not parties to the Conversion Agreement and (b) 6.4 million in partial repayment to the holders of the 2024 Debentures that are parties to the Conversion Agreement; and $12.2 million related to the fair value of the derivative liability arising from the premium put obligation on the 2024 Debentures. This reclassification is in accordance with ASC 470.
We leaseleases facilities under non-cancellable operating leases that expire through 2015. Approximate minimum rental commitments under all non-cancellable operating leases as of September 30, 2009,2010, are included in the table above.
Software license commitments represent non-cancellable licenses of intellectual property from third-parties used in the development of the Company's products. Inventory and related purchase obligations represent non-cancellable purchase commitments for wafers and substrate parts. Software license commitments represent non-cancellable licenses of intellectual property from third- parties used in the development of the Company's products.
Table of Contents
For purposes of the table above, obligations for the purchase of goods or services are defined as agreements that are enforceable and legally binding and that specify all significant terms. OurThe
Table of Contents
Company's purchase orders are based on ourits current manufacturing needs and are typically fulfilled by ourits vendors within a relatively short time horizon.time.
Off-Balance Sheet Arrangements
At September 30, 2010 the Company had no material off-balance sheet arrangements.
ITEM 7A. QUANTITATIVE AND QUALITATIVE DISCLOSURES ABOUT MARKET RISK
Market risk represents the risk of loss that may impact ourthe Company's financial position due to adverse changes in financial market prices and rates. OurThe Company's market risk exposure is primarily a result of fluctuations in foreign exchange rates and interest rates. We doThe Company does not hold or issue financial instruments for trading purposes.
Cash Equivalents and Investments
OurThe Company's cash and cash equivalents are not subject to significant interest rate risk due to the short maturities of these instruments. As of September 30, 2009,2010, the carrying value of ourthe Company's cash and cash equivalents approximated fair value because of the ready market for the cash instruments.
Foreign Currency Exchange Risk
We consider ourThe Company considers its direct exposure to foreign exchange rate fluctuations to be minimal. Currently, sales to customers and arrangements with third-party manufacturers provide for pricing and payment in United States dollars, and, therefore, are not subject to exchange rate fluctuations. Increases in the value of the United States' dollar relative to other currencies could make ourthe Company's products more expensive, which could negatively impact ourits ability to compete. Conversely, decreases in the value of the United States' dollar relative to other currencies could result in ourthe Company's suppliers raising their prices to continue doing business with us.the Company. The Company funds operations in international jurisdictions. All disbursements from these locations are made in the local currency of the foreign country. Fluctuations in the value of the United States' dollar relative to the currencies of these other countries could make the cost of operations in these other countries more expensive and negatively impact the Company's cash flows.
ITEM 8. FINANCIAL STATEMENTS AND SUPPLEMENTARY DATA
The financial statements and supplementary data required by this item are included in Part IV, Item 15 of this Report.
Table of Contents
Index to Consolidated Financial Statements
| | | | |
| | Page | |
|---|
Report of Independent Registered Public Accounting Firm | | | 7562 | |
Consolidated Financial Statements: | | | | |
Consolidated Balance Sheets at September 30, 20092010 and 20082009 | | | 7663 | |
Consolidated Statements of Operations for the Years Ended September 30, 2010, 2009 2008 and 20072008 | | | 7764 | |
Consolidated Statements of Shareholders'Stockholders' (Deficit) Equity and Comprehensive Income Loss(Loss) for the Years Ended September 30, 2010, 2009 2008 and 20072008 | | | 7865 | |
Consolidated Statements of Cash Flows for the Years Ended September 30, 2010, 2009 2008 and 20072008 | | | 7966 | |
Notes to Consolidated Financial Statements | | | 8067 | |
Schedule II Valuation and Qualifying Accounts | | | 12898 | |
Table of Contents
REPORT OF INDEPENDENT REGISTERED PUBLIC ACCOUNTING FIRMReport of Independent Registered Public Accounting Firm
The Board of Directors and ShareholdersStockholders of Vitesse Semiconductor Corporation
Camarillo, California
We have audited the accompanying consolidated balance sheets of Vitesse Semiconductor Corporation (a Delaware corporation) as of September 30, 20092010 and 20082009 and the related consolidated statements of operations, shareholders'stockholders' (deficit) equity and comprehensive income (loss), and cash flows for each of the three years in the period ended September 30, 2009.2010. In connection with our audits of the financial statements, we have also audited the financial statement schedule listed in the index at Item 15(a). These financial statements and schedule are the responsibility of the Company's management. Our responsibility is to express an opinion on these consolidated financial statements and schedule based on our audits.
We conducted our audits in accordance with the standards of the Public Accounting Oversight Board (United States). Those standards require that we plan and perform the audit to obtain reasonable assurance about whether the consolidated financial statements are free of material misstatement. An audit also includes examining, on a test basis, evidence supporting the amounts and disclosures in the financial statements, assessing the accounting principles used and significant estimates made by management, as well as evaluating the overall presentation of the financial statements and schedule. We believe that our audits provide a reasonable basis for our opinion.
In our opinion, the consolidated financial statements referred to above present fairly, in all material respects, the financial position of Vitesse Semiconductor Corporation at September 30, 20092010 and 2008,2009, and the results of its operations and its cash flows for each of the three years in the period ended September 30, 20092010, in conformity with accounting principles generally accepted in the United States of America.
Also, in our opinion, the financial statement schedule, when considered in relation to the basic consolidated financial statements taken as a whole, presentpresents fairly, in all material respects, the information set forth therein.
We also have audited, in accordance with the standards of the Public Company Accounting Oversight Board (United States), Vitesse Semiconductor Corporation's internal control over financial reporting as of September 30, 2009,2010, based on criteria established inInternal Control—Integrated Framework issued by the Committee of Sponsoring Organizations of the Treadway Commission (COSO) and our report dated December 11, 20091, 2010 expressed an adverseunqualified opinion on the effectiveness of the Company's internal controls over financial reporting.
/s/ BDO Seidman, LLP
BDO Seidman,USA, LLP
Los Angeles, California
December 11, 20091, 2010
Table of Contents
VITESSE SEMICONDUCTOR CORPORATION
CONSOLIDATED BALANCE SHEETS
| | | | | | | | | |
| | September 30, | |
|---|
| | 2009 | | 2008 | |
|---|
| | (in thousands,
except share data)
| |
|---|
ASSETS | |
Current assets: | | | | | | | |
| | Cash and cash equivalents | | $ | 57,544 | | $ | 36,722 | |
| | Accounts receivable, net | | | 11,369 | | | 6,307 | |
| | Inventory | | | 18,809 | | | 37,466 | |
| | Assets held for sale | | | — | | | 3,164 | |
| | Restricted cash | | | 398 | | | 592 | |
| | Prepaid expenses and other current assets | | | 4,956 | | | 4,011 | |
| | | | | | |
| | | Total current assets | | | 93,076 | | | 88,262 | |
Property, plant and equipment, net | | | 7,874 | | | 8,084 | |
Goodwill | | | — | | | 191,418 | |
Other intangible assets, net | | | 1,541 | | | 913 | |
Other assets | | | 3,077 | | | 3,600 | |
| | | | | | |
| | $ | 105,568 | | $ | 292,277 | |
| | | | | | |
LIABILITIES, MINORITY INTEREST AND SHAREHOLDERS' (DEFICIT) EQUITY
|
|
Current liabilities: | | | | | | | |
| | Accounts payable | | $ | 14,191 | | $ | 16,101 | |
| | Accrued expenses and other current liabilities | | | 10,887 | | | 20,242 | |
| | Derivative liability | | | 12,209 | | | — | |
| | Deferred revenue | | | 1,156 | | | 2,721 | |
| | Current portion of debt and capital leases | | | 5,236 | | | — | |
| | Convertible subordinated debt | | | 10,000 | | | — | |
| | | | | | |
| | | Total current liabilities | | | 53,679 | | | 39,064 | |
Other long-term liabilities | | | 1,810 | | | 1,564 | |
Long-term debt, net of discount | | | 24,652 | | | 29,423 | |
Convertible subordinated debt | | | 86,700 | | | 96,700 | |
| | | | | | |
| | | Total liabilities | | | 166,841 | | | 166,751 | |
| | | | | | |
Minority interest | | | 86 | | | 165 | |
Commitments and contingencies (See Note 12) | | | | | | | |
Shareholders' (deficit) equity: | | | | | | | |
| | Preferred stock, $0.01 par value. 10,000,000 shares authorized; none outstanding | | | — | | | — | |
| | Common stock, $.01 par value. 500,000,000 shares authorized; 230,905,580 and 226,205,580 shares outstanding at September 30, 2009 and 2008, respectively | | | 2,314 | | | 2,267 | |
| | Additional paid-in-capital | | | 1,754,598 | | | 1,747,324 | |
| | Accumulated deficit | | | (1,818,271 | ) | | (1,624,230 | ) |
| | | | | | |
| | | Total shareholders' (deficit) equity | | | (61,359 | ) | | 125,361 | |
| | | | | | |
| | $ | 105,568 | | $ | 292,277 | |
| | | | | | |
| | | | | | | | | |
| | September 30, | |
|---|
| | 2010 | | 2009 | |
|---|
| | (in thousands, except share data)
| |
|---|
ASSETS | | | | | | | |
| | Current assets: | | | | | | | |
| | Cash and cash equivalents | | $ | 38,127 | | $ | 57,544 | |
| | Accounts receivable | | | 15,765 | | | 15,074 | |
| | Inventory | | | 27,273 | | | 18,809 | |
| | Restricted cash | | | 394 | | | 398 | |
| | Prepaid expenses and other current assets | | | 2,913 | | | 4,956 | |
| | | | | | |
| | | Total current assets | | | 84,472 | | | 96,781 | |
Property, plant and equipment, net | | |
8,196 | | |
7,874 | |
Other intangible assets, net | | | 864 | | | 1,541 | |
Other assets | | | 3,997 | | | 3,077 | |
| | | | | | |
| | $ | 97,529 | | $ | 109,273 | |
| | | | | | |
LIABILITIES AND STOCKHOLDERS' DEFICIT | | | | | | | |
Current liabilities: | | | | | | | |
| | Accounts payable | | $ | 13,216 | | $ | 11,191 | |
| | Accrued expenses and other current liabilities | | | 16,283 | | | 14,182 | |
| | Derivative liability | | | — | | | 12,209 | |
| | Deferred revenue | | | 6,926 | | | 4,566 | |
| | Current portion of debt and capital leases | | | 10 | | | 5,236 | |
| | Convertible subordinated debt | | | — | | | 10,000 | |
| | | | | | |
| | | Total current liabilities | | | 36,435 | | | 57,384 | |
| | Other long-term liabilities | | |
1,729 | | |
1,810 | |
| | Long-term debt, net of discount | | | 26,070 | | | 24,652 | |
| | Derivative liability | | | 15,476 | | | — | |
| | Convertible subordinated debt, net of discount | | | 39,025 | | | 86,700 | |
| | | | | | |
| | | Total liabilities | | | 118,735 | | | 170,546 | |
| | | | | | |
Commitments and contingencies (See Note 10) | | | | | | | |
Stockholders' deficit: | | | | | | | |
| | Preferred stock, $0.01 par value. 10,000,000 shares authorized; 185,709 and no shares outstanding at September 30, 2010 and 2009, respectively | | | 2 | | | — | |
| | Common stock, $0.01 par value. 250,000,000 shares authorized; 23,986,531, and 11,544,803 shares outstanding at September 30, 2010 and 2009, respectively | | |
240 | | |
115 | |
| | Additional paid-in-capital | | | 1,816,796 | | | 1,756,797 | |
| | Accumulated deficit | | | (1,838,326 | ) | | (1,818,271 | ) |
| | | | | | |
| | | Total Vitesse Semiconductor Corporation stockholders' deficit | | | (21,288 | ) | | (61,359 | ) |
| | | | | | |
| | Noncontrolling interest | | | 82 | | | 86 | |
| | | | | | |
| | | Total stockholders' deficit | | | (21,206 | ) | | (61,273 | ) |
| | | | | | |
| | $ | 97,529 | | $ | 109,273 | |
| | | | | | |
See accompanying notes to consolidated financial statements.
Table of Contents
VITESSE SEMICONDUCTOR CORPORATION
CONSOLIDATED STATEMENTS OF OPERATIONS
| | | | | | | | | | | | |
| | Fiscal Year Ended September 30, | |
|---|
| | 2009 | | 2008 | | 2007 | |
|---|
| | (in thousands, except per share data)
| |
|---|
Product revenues | | $ | 154,927 | | $ | 218,536 | | $ | 221,948 | |
Intellectual property revenues | | | 13,250 | | | 10,000 | | | — | |
| | | | | | | | |
| | Net revenues | | | 168,177 | | | 228,536 | | | 221,948 | |
Costs and expenses: | | | | | | | | | | |
| | Cost of revenues | | | 78,414 | | | 106,344 | | | 113,754 | |
| | Engineering, research and development | | | 45,685 | | | 49,982 | | | 47,199 | |
| | Selling, general and administrative (including a gain on the sale of building of $2.9 million in 2009 and a gain on sale of fixed assets of $3.2 million in 2008) | | | 40,227 | | | 50,557 | | | 42,459 | |
| | Accounting remediation & reconstruction expense & litigation costs (including a $16.0 million gain on settlement of lawsuit in 2009) | | | (9,922 | ) | | 10,761 | | | 13,558 | |
| | Goodwill impairment | | | 191,418 | | | — | | | — | |
| | Amortization of intangible assets | | | 1,360 | | | 2,514 | | | 6,777 | |
| | | | | | | | |
| | | Costs and expenses | | | 347,182 | | | 220,158 | | | 223,747 | |
| | | | | | | | |
(Loss) income from operations | | |
(179,005 |
) | |
8,378 | | |
(1,799 |
) |
Other (expense) income: | | | | | | | | | | |
| | Interest expense, net | | | (16,862 | ) | | (3,868 | ) | | (2,580 | ) |
| | Loss on extinguishment of debt | | | — | | | — | | | (1,977 | ) |
| | Other income, net | | | 223 | | | 4,882 | | | 1,755 | |
| | | | | | | | |
| | | Other (expense) income, net | | | (16,639 | ) | | 1,014 | | | (2,802 | ) |
Income tax (benefit) expense | | | (1,451 | ) | | 1,222 | | | 224 | |
Minority interest in loss (earnings) of consolidated subsidiary | | | 81 | | | (660 | ) | | — | |
| | | | | | | | |
(Loss) income from continuing operations before discontinued operations | | | (194,112 | ) | | 7,510 | | | (4,825 | ) |
Discontinued operations | | | | | | | | | | |
| | Income (loss) from discontinued operations, net of tax of $997 and gain on sale of $21,500 in 2008 | | | 71 | | | 9,044 | | | (16,822 | ) |
| | | | | | | | |
Net (loss) income | | $ | (194,041 | ) | $ | 16,554 | | $ | (21,647 | ) |
| | | | | | | | |
Basic and diluted (loss) income per share: | | | | | | | | | | |
| | Continuing operations | | $ | (0.85 | ) | $ | 0.03 | | $ | (0.02 | ) |
| | Discontinued operations | | | 0.00 | | | 0.04 | | | (0.08 | ) |
| | | | | | | | |
| | | Net (loss) income per share | | $ | (0.85 | ) | $ | 0.07 | | $ | (0.10 | ) |
| | | | | | | | |
Weighted average shares outstanding: | | | | | | | | | | |
| | Basic and diluted | | | 229,554 | | | 223,614 | | | 223,556 | |
| | | | | | | | |
| | | | | | | | | | | | |
| | Fiscal Year Ended September 30, | |
|---|
| | 2010 | | 2009 | | 2008 | |
|---|
| | (in thousands, except per share data)
| |
|---|
Product revenues | | $ | 165,633 | | $ | 154,927 | | $ | 218,536 | |
Intellectual property revenues | | | 357 | | | 13,250 | | | 10,000 | |
| | | | | | | | |
| | Net revenues | | | 165,990 | | | 168,177 | | | 228,536 | |
Costs and expenses: | | | | | | | | | | |
| | Cost of revenues | | | 72,238 | | | 78,393 | | | 106,344 | |
| | Engineering, research and development | | | 51,100 | | | 45,706 | | | 49,982 | |
| | Selling, general and administrative (including a gain on the sale of building of $2.9 million in 2009 and a gain on sale of fixed assets of $3.2 million in 2008) | | | 37,791 | | | 40,227 | | | 50,557 | |
| | Accounting remediation & reconstruction expense & litigation costs (including a $16.0 million gain on settlement of lawsuit in 2009) | | | 73 | | | (9,922 | ) | | 10,761 | |
| | Goodwill impairment | | | — | | | 191,418 | | | — | |
| | Amortization of intangible assets | | | 797 | | | 1,360 | | | 2,514 | |
| | | | | | | | |
| | | Costs and expenses | | | 161,999 | | | 347,182 | | | 220,158 | |
| | | | | | | | |
Income (loss) from operations | | | 3,991 | | | (179,005 | ) | | 8,378 | |
Other expense (income): | | | | | | | | | | |
| | Interest expense, net | | | 9,495 | | | 4,653 | | | 3,868 | |
| | (Gain) loss on embedded derivative | | | (7,869 | ) | | 12,209 | | | — | |
| | Loss on extinguishment of debt | | | 21,311 | | | — | | | — | |
| | Other income, net | | | (290 | ) | | (223 | ) | | (4,882 | ) |
| | | | | | | | |
| | | Other expense (income), net | | | 22,647 | | | 16,639 | | | (1,014 | ) |
(Loss) income before income tax expense (benefit) | | | (18,656 | ) | | (195,644 | ) | | 9,392 | |
Income tax expense (benefit) | | | 1,521 | | | (1,451 | ) | | 1,222 | |
| | | | | | | | |
Net (loss) income from continuing operations | | | (20,177 | ) | | (194,193 | ) | | 8,170 | |
Income from discontinued operations, net of tax (including tax of $0.9 and gain on sale of $21.5 in 2008) | | | 121 | | | 71 | | | 9,044 | |
| | | | | | | | |
Net (loss) income | | | (20,056 | ) | | (194,122 | ) | | 17,214 | |
| | Net (loss) earnings attributable to noncontrolling interest | | | (1 | ) | | (81 | ) | | 660 | |
| | Fair value adjustment of Preferred Stock—Series B | | | 126 | | | — | | | — | |
| | | | | | | | |
Net (loss) income available to common stockholders | | $ | (20,181 | ) | $ | (194,041 | ) | $ | 16,554 | |
| | | | | | | | |
Net (loss) income per common share—basic and diluted | | | | | | | | | | |
| | Continuing operations | | $ | (0.96 | ) | $ | (16.92 | ) | $ | 0.73 | |
| | Discontinued operations | | | 0.01 | | | 0.01 | | | 0.81 | |
| | | | | | | | |
Net (loss) income | | | (0.95 | ) | | (16.91 | ) | | 1.54 | |
| | Net (loss) earnings attributable to noncontrolling interest | | | (0.00 | ) | | (0.01 | ) | | 0.06 | |
| | Fair value adjustment of Preferred Stock—Series B | | | 0.01 | | | — | | | — | |
| | | | | | | | |
Net (loss) income available to common stockholders | | $ | (0.96 | ) | $ | (16.91 | ) | $ | 1.48 | |
| | | | | | | | |
Weighted average common shares outstanding: | | | | | | | | | | |
Basic and Diluted | | | 21,074 | | | 11,478 | | | 11,181 | |
See accompanying notes to consolidated financial statements.
Table of Contents
VITESSE SEMICONDUCTOR CORPORATION
CONSOLIDATED STATEMENTS OF SHAREHOLDERS'STOCKHOLDERS' (DEFICIT)
EQUITY AND
COMPREHENSIVE INCOME (LOSS)
| | | | | | | | | | | | | | | | | | | | | | |
| |
| |
| |
| |
| |
| |
| |
| | Total Vitesse
Semiconductor
Corporation
Stockholders'
Equity (Deficit) | |
| |
| |
|---|
|
| | Common Stock | |
| | Accumulated
Other
Comprehensive
Income (Loss) | |
| | Total
Shareholders'
Equity
(Deficit) | |
| | Preferred Stock | | Common Stock | |
| | Accumulated
Other
Comprehensive
Income (Loss) | |
| |
| | Total
Stockholders'
Equity
(Deficit) | |
|---|
|
| | Additional
Paid-in-
Capital | | Accumulated
Deficit | |
| | Additional
Paid-in-
Capital | | Accumulated
Deficit | | | Total Vitesse
Semiconductor
Corporation
Stockholders'
Equity (Deficit) |
|---|
(In thousands, except share data) | (In thousands, except share data) | | Shares | | Amount | Total
Shareholders'
Equity
(Deficit) | (In thousands, except share data) | | Shares | | Amount | | Shares | | Amount | |
|---|
Balance at September 30, 2006 | | 223,555,580 | | $ | 2,240 | | $ | 1,734,223 | | $ | 484 | | $ | (1,619,137 | ) | $ | 117,810 | |
Comprehensive loss: | | |
| | Net loss | | — | | — | | — | | — | | (21,647 | ) | | (21,647 | ) | |
| | Unrealized gain on investments | | | | | | | | 3,255 | | | | 3,255 | | |
| | | | | |
| | Comprehensive loss | | | | | | | | | | | | (18,392 | ) | |
Compensation expense related to stock options | | — | | — | | 6,825 | | — | | — | | 6,825 | | |
| | | | | | | | | | | | | | | |
Balance at September 30, 2007 | Balance at September 30, 2007 | | 223,555,580 | | $ | 2,240 | | $ | 1,741,048 | | $ | 3,739 | | $ | (1,640,784 | ) | $ | 106,243 | | Balance at September 30, 2007 | | — | | $ | — | | 11,177,303 | | $ | 112 | | $ | 1,743,176 | | $ | 3,739 | | $ | (1,640,784 | ) | $ | 106,243 | | $ | 1,289 | | $ | 107,532 | |
| | | | | | | | | | | | | | | | | | | | | | | | | | | | | | | | | | | | | |
| | Net income | | — | | — | | — | | — | | 16,554 | | 16,554 | | Comprehensive income: | |
| | | Unrealized loss on investments | | | | | | | | (1,028 | ) | | | | | | Net income | | — | | — | | — | | — | | — | | — | | 16,554 | | 16,554 | | 660 | | 17,214 | |
| | | Reclassification of gain realized to net income | | | | | | | | (2,711 | ) | | | | | | Reclassification of gain realized to net income | | | | | | | | | | | | (3,739 | ) | | | | (3,739 | ) | | (829 | ) | | (4,568 | ) |
| | | | | | | | | | | | | | | |
| | Change in unrealized gain on investments | | — | | — | | — | | (3,739 | ) | | — | | (3,739 | ) | Comprehensive loss | | — | | — | | — | | — | | — | | — | | — | | 12,815 | | (169 | ) | | 12,646 | |
| | | | | |
| | Comprehensive loss | | — | | — | | — | | — | | — | | 12,815 | | |
Compensation expense related to stock options | Compensation expense related to stock options | | — | | — | | 3,891 | | — | | — | | 3,891 | | Compensation expense related to stock options | | — | | — | | — | | — | | 3,891 | | — | | — | | 3,891 | | | | 3,891 | |
Shares issued pursuant to securities class-action settlement | | 2,650,000 | | 27 | | 2,385 | | — | | — | | 2,412 | | |
Stock issued pursuant to securities class-action settlement | | Stock issued pursuant to securities class-action settlement | | — | | — | | 132,500 | | 1 | | 2,411 | | — | | — | | 2,412 | | | | 2,412 | |
Distribution to minority interest holders | | Distribution to minority interest holders | | — | | — | | — | | — | | — | | — | | — | | — | | (955 | ) | | (955 | ) |
| | | | | | | | | | | | | | | | | | | | | | | | | | | | | | | | | | | | | |
Balance at September 30, 2008 | Balance at September 30, 2008 | | 226,205,580 | | $ | 2,267 | | $ | 1,747,324 | | $ | — | | $ | (1,624,230 | ) | $ | 125,361 | | Balance at September 30, 2008 | | — | | $ | — | | 11,309,803 | | $ | 113 | | $ | 1,749,478 | | $ | — | | $ | (1,624,230 | ) | $ | 125,361 | | $ | 165 | | $ | 125,526 | |
| | | | | | | | | | | | | | | | | | | | | | | | | | | | | | | | | | | | | |
Net loss | Net loss | | — | | — | | — | | — | | (194,041 | ) | | (194,041 | ) | Net loss | | — | | — | | — | | — | | — | | — | | (194,041 | ) | | (194,041 | ) | | (81 | ) | | (194,122 | ) |
Compensation expense related to stock options | Compensation expense related to stock options | | — | | — | | 3,138 | | — | | — | | 3,138 | | Compensation expense related to stock options | | — | | — | | — | | — | | 3,138 | | — | | — | | 3,138 | | — | | 3,138 | |
Shares issued pursuant to derivative class-action settlement | | 4,700,000 | | 47 | | 4,136 | | — | | — | | 4,183 | | |
Stock issued pursuant to securities class-action settlement | | Stock issued pursuant to securities class-action settlement | | — | | — | | 235,000 | | 2 | | 4,181 | | — | | — | | 4,183 | | — | | 4,183 | |
Distribution to minority interest holders | | Distribution to minority interest holders | | — | | — | | — | | — | | — | | — | | — | | — | | (2 | ) | | (2 | ) |
| | | | | | | | | | | | | | | | | | | | | | | | | | | | | | | | | | | | | |
Balance at September 30, 2009 | Balance at September 30, 2009 | | 230,905,580 | | $ | 2,314 | | $ | 1,754,598 | | $ | — | | $ | (1,818,271 | ) | $ | (61,359 | ) | Balance at September 30, 2009 | | — | | $ | — | | 11,544,803 | | $ | 115 | | $ | 1,756,797 | | $ | — | | $ | (1,818,271 | ) | $ | (61,359 | ) | $ | 86 | | $ | (61,273 | ) |
| | | | | | | | | | | | | | | | | | | | | | | | | | | | | | | | | | | | | |
Net loss | | Net loss | | | | | | | | | | | | | | (20,055 | ) | | (20,055 | ) | | (1 | ) | | (20,056 | ) |
Compensation expense related to stock options and awards | | Compensation expense related to stock options and awards | | — | | — | | — | | — | | 2,236 | | — | | — | | 2,236 | | — | | 2,236 | |
Stock issued pursuant to debt restructuring | | Stock issued pursuant to debt restructuring | | 770,786 | | 8 | | 8,646,811 | | 87 | | 52,409 | | — | | — | | 52,504 | | — | | 52,504 | |
Debt restructuring costs | | Debt restructuring costs | | — | | — | | — | | — | | (1,050 | ) | | — | | — | | (1,050 | ) | | — | | (1,050 | ) |
Conversion of Series B Preferred Shares | | Conversion of Series B Preferred Shares | | (585,077 | ) | | (6 | ) | | 2,925,386 | | 29 | | (23 | ) | | — | | — | | — | | — | | — | |
Conversion of 8% Debentures | | Conversion of 8% Debentures | | — | | — | | 869,531 | | 9 | | 6,004 | | — | | — | | 6,013 | | — | | 6,013 | |
Tax expense on debt transaction | | Tax expense on debt transaction | | — | | — | | — | | — | | 423 | | — | | — | | 423 | | — | | 423 | |
Distribution to minority interest holders | | Distribution to minority interest holders | | — | | — | | — | | — | | — | | — | | — | | — | | (3 | ) | | (3 | ) |
| | | | | | | | | | | | | | | | | | | | | | | | |
Balance at September 30, 2010 | | Balance at September 30, 2010 | | 185,709 | | $ | 2 | | 23,986,531 | | $ | 240 | | $ | 1,816,796 | | $ | — | | $ | (1,838,326 | ) | $ | (21,288 | ) | $ | 82 | | $ | (21,206 | ) |
| | | | | | | | | | | | | | | | | | | | | | | | |
See accompanying notes to consolidated financial statements.
Table of Contents
VITESSE SEMICONDUCTOR CORPORATION
CONSOLIDATED STATEMENTS OF CASH FLOWS
|
|
| | Fiscal Year Ended September 30, | |
| | Fiscal Year Ended
September 30, | |
|---|
|
| | 2009 | | 2008 | | 2007 | |
| | 2010 | | 2009 | | 2008 | |
|---|
|
| | (in thousands)
| |
| | (in thousands)
| |
|---|
Cash flows from operating activities: | Cash flows from operating activities: | | Cash flows from operating activities: | |
Net (loss) income | Net (loss) income | | $ | (194,041 | ) | $ | 16,554 | | $ | (21,647 | ) | Net (loss) income | | $ | (20,056 | ) | $ | (194,122 | ) | $ | 17,214 | |
Adjustments to reconcile net (loss) income to net cash provided by (used in) operating activities: | Adjustments to reconcile net (loss) income to net cash provided by (used in) operating activities: | | Adjustments to reconcile net (loss) income to net cash provided by (used in) operating activities: | |
| | Depreciation and amortization | | 4,158 | | 5,380 | | 10,660 | | |
| | Share-based compensation | | 3,133 | | 3,896 | | 7,001 | | Depreciation and amortization | | 3,540 | | 4,158 | | 5,380 | |
| | Fair value adjustment to derivative liability | | 12,209 | | — | | — | | Share-based compensation | | 2,236 | | 3,133 | | 3,896 | |
| | Impairment of goodwill | | 191,418 | | — | | — | | Change in market value of embedded derivative liability | | (7,869 | ) | | 12,209 | | — | |
| | Allowance for doubtful accounts | | — | | — | | 249 | | Gain on conversion of debt | | (265 | ) | | — | | — | |
| | Allowance for sales return reserve | | (35 | ) | | (89 | ) | | (28 | ) | Impairment of goodwill | | — | | 191,418 | | — | |
| | Loss on extinguishment of debt | | — | | — | | 1,977 | | Loss on extinguishment of debt | | 20,765 | | — | | — | |
| | Non-cash interest expense | | — | | — | | 6,244 | | Capitalization of interest to principal | | 1,268 | | — | | — | |
| | Amortization of debt issuance costs and debt discounts | | 758 | | 756 | | 920 | | Amortization of debt issuance costs | | 813 | | 758 | | 756 | |
| | Gain on sale of Storage Products business | | — | | (21,509 | ) | | — | | Amortization of debt discounts | | 1,784 | | — | | — | |
| | Gain on sale of Colorado Building | | (2,924 | ) | | — | | — | | Gain on sale of business unit | | — | | — | | (21,509 | ) |
| | (Loss)/gain on disposal of fixed assets | | 7 | | (3,225 | ) | | — | | Gain on sale of fixed assets | | — | | (2,924 | ) | | (3,225 | ) |
| | Realized (loss) gain on investments | | 248 | | (3,372 | ) | | 129 | | Realized loss (gain) on investments | | — | | 248 | | (3,372 | ) |
| | Forgiveness of interest | | — | | (497 | ) | | — | | Forgiveness of interest | | — | | — | | (497 | ) |
| | Minority interest in (loss) earnings of consolidated subsidiary | | (81 | ) | | 660 | | — | | Other | | 412 | | (28 | ) | | (89 | ) |
Change in operating assets and liabilities: | Change in operating assets and liabilities: | | Change in operating assets and liabilities: | |
| | Accounts receivable | | (5,027 | ) | | 928 | | (3,087 | ) | Accounts receivable | | (691 | ) | | (5,027 | ) | | 928 | |
| | Inventory | | 18,657 | | (4,767 | ) | | 24,679 | | Inventory | | (8,464 | ) | | 18,657 | | (4,767 | ) |
| | Restricted cash | | 194 | | 1,556 | | 238 | | Restricted cash | | 4 | | 194 | | 1,556 | |
| | Prepaids and other current assets | | (1,256 | ) | | 2,552 | | (1,803 | ) | Prepaids and other assets | | 1,590 | | (1,256 | ) | | 2,552 | |
| | Accounts payable | | (1,910 | ) | | 1,113 | | (11,276 | ) | Accounts payable | | 2,025 | | (1,910 | ) | | 1,113 | |
| | Accrued expenses and other liabilities | | (4,745 | ) | | (3,452 | ) | | 403 | | Accrued expenses and other liabilities | | 2,020 | | (4,745 | ) | | (3,452 | ) |
| | Deferred revenue | | (1,566 | ) | | (19,104 | ) | | (8,881 | ) | Deferred revenue | | 2,360 | | (1,566 | ) | | (19,104 | ) |
| | | | | | | | | | | | | | | | | |
| | | Net cash provided by (used in) operating activities | | 19,197 | | (22,620 | ) | | 5,778 | | | Net cash provided by (used in) operating activities | | 1,472 | | 19,197 | | (22,620 | ) |
| | | | | | | | | | | | | | | | | |
Cash flows from investing activities: | Cash flows from investing activities: | | Cash flows from investing activities: | |
| | Proceeds from sale of investments | | — | | 6,073 | | — | | Proceeds from sale of investments | | — | | — | | 6,073 | |
| | Net purchase of short-term investments | | — | | — | | (311 | ) | Disposal of fixed assets | | — | | — | | 3,280 | |
| | Restricted cash | | 17 | | (13 | ) | | 716 | | Sale of Storage Products business | | — | | — | | 62,845 | |
| | Disposal of fixed assets | | — | | 3,280 | | — | | Sale of Colorado Building | | — | | 6,500 | | — | |
| | Sale of Storage Products business | | — | | 62,845 | | — | | Transaction costs on sale of building | | — | | (547 | ) | | (1,636 | ) |
| | Transaction costs for sale of Storage Products business | | — | | (1,636 | ) | | — | | Capital expenditures | | (3,075 | ) | | (2,340 | ) | | (4,961 | ) |
| | Sale of Colorado Building | | 6,500 | | — | | — | | Purchase of intangibles | | (110 | ) | | (1,981 | ) | | — | |
| | Transaction costs on Sale of Building | | (547 | ) | | — | | — | | Other | | (3 | ) | | 17 | | (13 | ) |
| | Capital expenditures | | (2,340 | ) | | (4,961 | ) | | (879 | ) | | | | | | | | |
| | Purchase of intangibles | | (1,981 | ) | | — | | (539 | ) | | Net cash (used in) provided by investing activities | | (3,188 | ) | | 1,649 | | 65,588 | |
| | | | | | | | | | | | | | | | | |
| | | Net cash provided by (used in) investing activities | | 1,649 | | 65,588 | | (1,013 | ) | |
| | | | | | | | | |
Cash flows from financing activities: | Cash flows from financing activities: | | Cash flows from financing activities: | |
| | Repayment of debt | | — | | (59,471 | ) | | — | | Payment of convertible debentures | | (10,000 | ) | | — | | — | |
| | Proceeds from debt | | — | | 29,250 | | — | | Payment of senior debt | | (5,000 | ) | | — | | — | |
| | Debt issuance costs | | — | | (1,046 | ) | | (1,233 | ) | Repayment of debt | | — | | — | | (59,471 | ) |
| | Repayment of capital lease obligations | | (24 | ) | | — | | (2,868 | ) | Proceeds from debt | | — | | — | | 29,250 | |
| | Distribution to minority interest holders | | — | | (955 | ) | | — | | Equity issuance costs | | (1,050 | ) | | — | | — | |
| | | | | | | | | | Debt issuance costs | | (1,365 | ) | | — | | — | |
| | | Net cash used in financing activities | | (24 | ) | | (32,222 | ) | | (4,101 | ) | Prepayment fee on senior debt | | (50 | ) | | — | | — | |
| | | | | | | | | | Repayment of capital lease obligations | | (236 | ) | | (24 | ) | | (1,046 | ) |
Net increase in cash | | 20,822 | | 10,746 | | 664 | | |
| | | Distribution to minority interest holders | | — | | — | | (955 | ) |
| | | | | | | | | | |
| | | | Net cash used in financing activities | | (17,701 | ) | | (24 | ) | | (32,222 | ) |
| | | | | | | | | | |
Net (decrease) increase in cash | | Net (decrease) increase in cash | | (19,417 | ) | | 20,822 | | 10,746 | |
Cash and cash equivalents at beginning of year | Cash and cash equivalents at beginning of year | | 36,722 | | 25,976 | | 25,312 | | Cash and cash equivalents at beginning of year | | 57,544 | | 36,722 | | 25,976 | |
| | | | | | | | | | | | | | | | | |
Cash and cash equivalents at end of year | Cash and cash equivalents at end of year | | $ | 57,544 | | $ | 36,722 | | $ | 25,976 | | Cash and cash equivalents at end of year | | $ | 38,127 | | $ | 57,544 | | $ | 36,722 | |
| | | | | | | | | | | | | | | | | |
Cash paid during the year for: | | |
Supplemental disclosure of non cash transactions: | | Supplemental disclosure of non cash transactions: | |
| | Interest | | $ | 4,054 | | $ | 23,499 | | $ | 4,773 | | Cash paid during the year for: | |
| | Income taxes | | $ | 3,072 | | $ | 294 | | $ | 796 | | | Interest | | $ | 4,568 | | $ | 4,054 | | $ | 23,499 | |
Non-cash investing and financing activities: | | |
| | | | Income taxes | | $ | 565 | | $ | 3,072 | | $ | 294 | |
Non cash investing and financing activites: | | Non cash investing and financing activites: | |
| | Shares issued pursuant to class-action settlement | | $ | 4,183 | | $ | 2,412 | | $ | — | | Shares issued pursuant to class-action settlement | | $ | — | | $ | 4,183 | | $ | 2,412 | |
| | Purchase of assets in exchange for future obligations | | $ | 260 | | $ | — | | $ | — | | Purchase of assets in exchange for future obligations | | $ | — | | $ | 260 | | $ | — | |
| | | Issuance of 2014 convertible debentures | | $ | 40,343 | | $ | — | | $ | — | |
| | | Common stock issued in exchange for 2024 debentures | | $ | 36,317 | | $ | — | | $ | — | |
| | | Preferred stock—Series B issued in exchange for 2024 debentures | | $ | 16,187 | | $ | — | | $ | — | |
| | | Compound embedded derivative issued in exchange for 2024 debentures | | $ | 27,925 | | $ | — | | $ | — | |
| | | Common stock issued in exchange for 2014 debentures | | $ | 6,013 | | $ | — | | $ | — | |
| | | Common stock issued in exchange for Series B Preferred Stock | | $ | 29,254 | | $ | — | | $ | — | |
See accompanying notes to consolidated financial statements.
Table of Contents
NOTES TO CONSOLIDATED FINANCIAL STATEMENTS
NOTE 1—THE COMPANY AND ITS SIGNIFICANT ACCOUNTING POLICIES
Description of Business
Vitesse Semiconductor Corporation ("Vitesse"Vitesse," the "Company," "us" or "the Company""we") is a leadingworldwide supplier of high-performance integrated circuits ("ICs") that are utilized primarily by manufacturers of networking systems for Carrier, Enterprise and Storage communications applications. Vitesse designs, develops and markets a diverse portfolio of high-performance, cost-competitive semiconductor products. For more than 25 years, Vitesse has led the transition of new technologies in communications networks.
Vitesse was incorporated underin the lawsState of Delaware in 1987. OurThe Company's principal offices areoffice is located at 741 Calle Plano, Camarillo, California, and ourits phone number is (805) 388-3700. OurThe Company's stock trades on the Pink SheetsOTCQB marketplace under the ticker symbol VTSS.PK.VTSS.PK
Fiscal Periods
The Company's fiscal year is October 1 through September 30.
Basis of Presentation
The accompanying consolidated financial statementsConsolidated Financial Statements have been prepared pursuant to the rules and regulations of the Securities and Exchange Commission ("SEC") and accounting principles generally accepted in the United States of America ("GAAP"). The Company's reporting currency is the United States dollar. As of September 30, 2010, 2009 and 2008, and 2007, our consolidated financial statementsthe Company's Consolidated Financial Statements include the accounts of Vitesse and ourits subsidiaries. All intercompany accounts and transactions have been eliminated in consolidation.
On January 7, 2010, the Company's stockholders approved an amendment to the Company's Amended and Restated Certificate of Incorporation to effect a reverse stock split of the Company's common stock at a ratio between one-for-20 and one-for-50. The Board approved a one-for-20 reverse split of the Company's common stock that took effect on June 30, 2010. The Company did not issue fractional shares in connection with the reverse stock split and stockholders otherwise entitled to receive fractional shares received cash in lieu of fractional shares. All share and per share amounts have been retroactively adjusted to reflect the reverse stock split. There was no net effect on total stockholders' deficit as a result of the reverse stock split.
Subsequent EventsReclassifications
In May 2009, the FASB issued ASC 855, which establishes general standards of accounting forCertain reclassifications have been made to prior year amounts and disclosure of events that occur after the balance sheet date but before financial statements are issued. We have considered subsequent events for recognition or disclosure through December 11, 2009, the date of issuance, in preparing the consolidated financial statements and notes thereto (See Note 14—Subsequent Events).related footnotes to conform to current-year presentation.
Use of Estimates
The preparation of financial statements in accordance with United States generally accepted accounting principlesGAAP requires management to make estimates and assumptions that affect the amounts reported in the financial statements and disclosures made in the accompanying notes to the financial statements. WeThe Company regularly evaluateevaluates estimates and assumptions related to revenue recognition, allowances for doubtful accounts, sales returns and allowances, warranty reserves, inventory reserves, share-based compensation, premium put,derivative valuation, goodwill and purchased intangible asset valuations and useful lives, and deferred income tax asset valuation allowances. These estimates and assumptions are based on current facts, historical experience and various other factors that we believethe Company believes to be reasonable under the circumstances, the results of which form the basis for making judgments about the carrying values of assets and liabilities that are not readily apparent from other sources. The actual results we experience may differ materially and adversely from our original estimates. To the extent there are material differences between the estimates and the actual results, our future results of operations will be affected.
Table of Contents
NOTES TO CONSOLIDATED FINANCIAL STATEMENTS (Continued)
NOTE 1—THE COMPANY AND ITS SIGNIFICANT ACCOUNTING POLICIES (Continued)
apparent from other sources. The actual results the Company experiences may differ materially and adversely from its original estimates. To the extent there are material differences between the estimates and the actual results, its future results of operations will be affected.
Foreign Currency Translation
The functional currency of ourthe Company's foreign subsidiaries is the United States dollar, however ourits foreign subsidiaries transact in local currencies. Consequently, assets and liabilities are translated into United States dollars at the exchange rate on the balance sheet date. Revenues and expenses are translated at the average exchange rate prevailing during the period. Foreign currency transaction gains and losses are included in results of operations.
Concentrations of Risk
Financial instruments, which potentially subject the Company to concentrations of credit risk, consist principally of cash equivalents, short-term and long-term investments and accounts receivable. Cash equivalents consist of demand deposits and money market funds maintained with several financial institutions. Deposits held with banks have exceededexceed the amount of insurance provided on such deposits. The Company maintains its cash in commercial accounts with high-credit quality financial institutions. Although the financial institutions are considered creditworthy, balances with any one financial institution may exceed the Federal Deposit Insurance Corporation (the "FDIC") limit of $250,000. At September 30, 2009,2010, the Company's bank cash balance exceeded the deposit insurance limits provided by the FDIC by $60,673,694.$39,387,338. Cash balances held in foreign bank accounts are also not insured by the FDIC, and at September 30, 20092010 these balances totaled $222,147.$636,847. At September 30, 2009,2010, the Company's foreign subsidiaries reflected $730,906,$726,871 of cash on their financial statements, which is also not insured by the FDIC.
The Company believes that the credit risk in its accounts receivable is mitigated by the Company's credit evaluation process and maintaining an allowance for anticipated losses. For the year ended September 30, 2009,2010, one direct customer accounted for more than 10% of ourthe Company's net revenues. Total sales to this customer were 12.0%13.3%, 7.0%12.0% and 6.0%7.0% of net revenues for the twelve monthsyears ended September 30, 2010, 2009 and 2008, and,2007, respectively. No other direct customer accounted for more than 10% of ourthe Company's net revenues.
The Company currently purchases wafers from a limited number of vendors. Additionally, since we dothe Company does not maintain manufacturing facilities, we dependthe Company depends upon close relationships with contract manufacturers to assemble ourits products. We believeThe Company believes there are available to the Companythem other vendors who can provide the same quality wafers at competitive prices and other contract manufacturers that can provide comparable services at competitive prices. We anticipateThe Company anticipates the continued use of a limited number of vendors and contract manufacturers in the near future.
Advertising Costs
Advertising costs are expensed as incurred. Advertising expenses The Company is also dependent upon third parties for its probe testing. Under the years ended September 30, 2009, 2008, and 2007 were $0.1 million, $0.2 million, and $0.1 million, respectively.Company's fabless business model, its long-term revenue growth is dependent on its ability to obtain sufficient external manufacturing capacity, including wafer production capacity. The Company believes that in addition to the vendors currently utilized by the Company, other vendors would be able to provide these services.
Contingencies
We assess ourThe Company assesses its exposure to loss contingencies, including environmental, legal, and income tax matters, and provideprovides an accrual for an exposure if it is judged to be probable and reasonably estimable. If the actual loss from a loss contingency differs from management's estimates, results of operations could be adjusted upward or downward.
Table of Contents
NOTES TO CONSOLIDATED FINANCIAL STATEMENTS (Continued)
NOTE 1—THE COMPANY AND ITS SIGNIFICANT ACCOUNTING POLICIES (Continued)
Shipping and Handling
In accordance withestimable. If the ASC Topic 605-45-19 Shipping and Handling Fees and Costs ("ASC 605-45-19"); originally issued as Emerging Issues Task Force ("EITF") 00-10,"Accounting for Shipping and Handling Fees and Costs," the Company incurred shipping costsactual loss from a loss contingency differs from management's estimates, results of $0.7 million, $1.0 million, and $1.0 million for fiscal years 2009, 2008, and 2007 that were included in selling, general and administrative expense.operations could be adjusted upward or downward.
Warranty
The Company generally warrants its products against defects for one year from date of shipment. The salesA warranty reserve allowance includes a provision for products under warranty, which is recorded against revenue when products are shipped. At each reporting period, the Company adjusts its reserve for warranty claims based on its actual warranty claims experience as a percentage of net revenue for the preceding 12 months and also considers the impact of known operational issues that may have a greateran impact thanthat differs from historical trends. Historically, ourthe Company's warranty returns have not been material. As of September 30, 2010 and 2009, the Company's warranty reserve was $385,000 and $295,000, respectively.
Revenue Recognition
In accordance with SEC Staff Accounting Bulletin ("SAB") 101, "Revenue Recognition in Financial Statements" or SAB 101, as amended by Staff Accounting Bulletin No. 104, "Revision of Topic 13" or ASC 605, we recognizethe Company recognizes product revenue when the following fundamental criteria are met: (i) persuasive evidence of an arrangement exists; (ii) delivery has occurred; (iii) the price to the customer is fixed or determinable; and (iv) collection of the sales price is reasonably assured. Delivery occurs when goods are shipped and title and risk of loss transfer to the customer, in accordance with the terms specified in the arrangement with the customer. Revenue recognition is deferred in all instances where the earnings process is incomplete.
Vitesse has a distribution network through which it sells most of its products. The Company recognizes revenue on a sell-through basis for all products sold through distributors, utilizing information provided by the distributors. These distributors maintained inventory balances of $3.6$6.0 million and $9.6$3.6 million as of September 30, 2010 and 2009, and September 30, 2008, respectively, which arerespectively. This inventory is carried on the books of Vitesse, and are giventhe related business terms allow for the distributors to return a portion of the inventory and receive credits for changes in the selling pricesprice to end customers andor if the inventory obsolescence.becomes obsolete. At the time Vitesse ships inventory to the distributors, the magnitude of future returns and price adjustments is not known. Therefore, revenue recognition for shipments to distributors does not occur until the distributors sell the inventory to end customers. The payments received from distributors for inventory shipped to them in advance of the sale of that inventory to an end-user are, therefore, shown as deferred revenue. Vitesse personnel are often involved in the sales from the distributors to end customers, providing both field engineering and application engineering support prior to the sale. OurThe Company's product sales do not include service elements aside from the standard product warranty.
Revenues from development contracts are recognized upon attainment of specific milestones established under customer contracts. Revenues from products deliverable under development contracts, including design tools and prototype products, are recognized upon delivery. Costs related to development contracts are expensed as incurred.
Approximately 1.2% and 2.2% and 0.93% of ourthe Company's inventory iswas consigned and located with two customers at September 30, 20092010 and one customer at September 30, 2008,2009, respectively. Consistent with ourits revenue recognition policy, the Company recognizes revenue when the customer pulls the inventory for use, as that is when title passes to the customer and all revenue recognition criteria specified above are met.
In accordance with ASC 605, when licensing technology and intangibles, delivery is not deemed to occur for revenue recognition purposes until the license term begins. Revenues are recognized in a
Table of Contents
NOTES TO CONSOLIDATED FINANCIAL STATEMENTS (Continued)
NOTE 1—THE COMPANY AND ITS SIGNIFICANT ACCOUNTING POLICIES (Continued)
recognition policy, we recognize revenue when the customer pulls the inventory for use, that is when title passes to the customer and all revenue recognition criteria specified above are met.
In accordance with ASC 605, when licensing technology and other intangibles, delivery is not deemed to occur for revenue recognition purposes until the license term begins. Revenues are recognized in a manner consistent with the nature of the transaction and related earnings process. Based on management's analysis of the license terms, and pursuant to the guidance in ASC 605, revenue related to the licensing of intellectual property ("IP") is deferred until delivery has occurred and final acceptance of the contracted deliverables is received from the licensee.
On December 28, 2007, the Company entered into an arrangement to license IP to a third-party. The contract is a perpetual, nonexclusive, non-transferable, irrevocable license for specified IP. As part of the contract, we werethe Company was granted a perpetual, nonexclusive, non-transferable, irrevocable license to improvements to the technology made by the licensee, subject to certain limitations. Under the agreement, Vitesse received $15.0 million in license fees and royalties for the rights to certain products and technology. Of the fees and royalty payments, $10.0 million in fees was received upon delivery and acceptance of the licensed technology. The remaining $5.0 million of fees was received upon the one-year anniversary of the agreement.agreement in December 2009. For a period of seven years from the effective date of the contract, licensee will pay royalties on a per unit basis, on each commercial sale incorporating the licensed products. Royalties will be accounted for when received. No royalties wereRoyalties received or recognized for the twelve months ended September 30, 2009.to date have not been significant.
In fiscal year 2009, licensing revenuesIP revenue of $13.3 million included IP revenuelicensing revenues of $8.3 million from the sale of patents from ourthe Company's IP portfolio and $5.0 million from anthe licensing arrangement entered into in the first quarter of 2008, to license IP to a third-party.described above. On June 30, 2009, the Company entered into a Sale and Purchase Agreement (the "Agreement") and completed the sale, assignment and transfer of certain patents (the "Vitesse Patents") from its IP portfolio for consideration of IP revenue of $8.3 million, paymentmillion. Payment was received on July 15, 2009. The Company incurred $1.8 million in brokersbroker fees related to the sale. The Company recorded the broker's fees in selling, general and administrative expense. The Vitesse Patents relate to the Company's non-core business, specifically its network processing products. Under the Agreement, the Company shall retainretains a non-exclusive, revocable, non-assignable, non-divisible, worldwide, fully-paid-up, royalty-free, perpetual right and license to the Vitesse Patents for the full life of such Vitesse Patents.
Sales Returns, Pricing Adjustments and Allowance for Doubtful Accounts
We record reductions to revenue for estimated product returns and pricing adjustments, such as rebates, in the same period that the related revenue is recorded. The amount of these reductions is based on historical sales returns, analysis of credit memo data, specific criteria included in rebate agreements, and other factors known at the time. Additional reductions to revenue would result if actual product returns or pricing adjustments exceed our estimates. We currently do not have any existing or on-going rebate programs or policies. We also maintain an allowance for doubtful accounts for estimated losses resulting from customers' inability to meet their financial obligations to us. We evaluateCompany evaluates the collectability of accounts receivable on a monthly basis using a combination of factors, including whether any receivables will potentially be uncollectible. The Company includes any accounts receivable balances that are determined to be uncollectible in the overall allowance for doubtful accounts using the specific identification method. After all attempts to collect a receivable have failed, the receivable is written off against the allowance. Management believesThe Company has assessed the allowance for doubtful
Tablecollectability of Contents
NOTES TO CONSOLIDATED FINANCIAL STATEMENTS (Continued)
NOTE 1—THE COMPANY AND ITS SIGNIFICANT ACCOUNTING POLICIES (Continued)
accounts as ofreceivable at September 30, 2010 and 2009 and September 30, 2008,determined that no allowance is adequate.required. However, if the financial condition of any customer were to deteriorate, resulting in an impairment of its ability to make payments, additional allowancesan allowance could be required. We record a reserve for estimated sales returns and allowances in the same period as the related revenues are recognized. Sales returns typically occur for quality related issues and allowances are based on specific criteria such as rebate agreements. We base these estimates on our historical experience or the specific identification of an event necessitating a reserve. To the extent actual sales returns or allowances differ from our estimates, our operations may be affected. As of September 30, 2009 and September 30, 2008, our sales return reserve was $19,000 and $54,000, respectively.
Cash and Cash Equivalents
Cash and cash equivalents include highly liquid investments with original maturities of three months or less at the time of acquisition. Due to their liquidity and their remaining time to maturity, the fair value of these investments approximates their carrying value.
Financial Instruments
ASC Topic 825, "Financial Instruments," defines fair value of a financial instrument as the amount at which the instrument could be exchanged in a current transaction between willing parties.
Our financial instruments include cash equivalents, short-term investments, restricted deposits, accounts receivable, long-term investments, accounts payable and accrued expenses. Restricted deposits are interest-bearing Certificates of Deposit ("CD") collateralizing Letters of Credit ("LOC") and other commitments. Interest earned on the CD's accrues to the Company. As of September 30, 2009 and 2008, the Company had approximately $2.0 and $2.1 million, respectively, in CD's. The CD's will renew annually for the duration of the underlying LOC or commitment. The Company is subject to penalties for early withdrawal of the funds in any of the CD's, including forfeiture of interest earned for the period. These financial instruments are stated at their carrying values, which are reasonable estimates of their fair values.
Additionally, our financial instruments include our 2024 Debentures and a $30 million senior note with Whitebox VSC, Ltd. ("Whitebox") (See Note 6—Debt). We have estimated the fair value of the 2024 Debentures using a convertible bond valuation model within a lattice framework (Level 3). The valuation model combined expected cash outflows with market-based assumptions regarding risk-adjusted yields, stock price volatility, and recent price quotes and trading information regarding shares of our common stock into which the debentures are convertible. The estimated fair value of the 2024 Debentures was $43.9 million and $36.5 million, as of September 30, 2009 and 2008, respectively.
Additionally, we have identified a derivative embedded in the 2024 Debentures that is bifurcated and accounted for at fair value. We refer to this embedded derivative as the premium put (See Note 6—Debt for further discussion of the accounting and the basis for valuation). The fair value of the premium put was determined to be $12.2 million as of September 30, 2009 and no fair value as of September 30, 2008.
The senior note with Whitebox is stated at carrying value, net of unamortized debt discount, which is a reasonable estimate of fair value.
Table of Contents
NOTES TO CONSOLIDATED FINANCIAL STATEMENTS (Continued)
NOTE 1—THE COMPANY AND ITS SIGNIFICANT ACCOUNTING POLICIES (Continued)
Company's financial instruments include cash equivalents, restricted cash, accounts receivable, accounts payable, accrued expenses and various debt instruments. These financial instruments are stated at their carrying values, which are estimates of their fair values because of their nearness to cash settlement or the comparability of their terms to the terms the Company could obtain, for similar instruments, in the current market.
Restricted cash consists of interest-bearing certificates of deposit ("CDs") collateralizing letters of credit and other commitments and such amounts are included in restricted cash and other assets in the Consolidated Balance Sheets. As of September 30, 2010 and 2009, the Company had $1.9 million and $2.0 million, respectively, in CDs.
The Company's Senior Term Loan is stated at carrying value of $25.0 million, plus $1.3 million of accrued payment-in-kind ("PIK") interest, as of September 30, 2010 and $30.0 million as of September 30, 2009, which are estimates of its fair value.
The Company estimates the fair values of the 2014 Debentures and embedded derivatives using a convertible bond valuation model within a lattice framework. These valuations are determined using Level 3 inputs. The valuation model combines expected cash outflows with market-based assumptions regarding risk-adjusted yields, stock price volatility, recent price quotes and trading information of the Company's common stock into which the 2014 Debentures are convertible. The fair value of the 2014 Debentures includes the $46.5 million face value of the debentures plus the $9.0 million discount, which is amortized as interest expense over the life of the debentures. The fair value of the 2014 Debentures was $44.8 million as of September 30, 2010. The carrying value of the 2014 Debentures is $39.0 million as of September 30, 2010. On October 30, 2009, the date of issuance, the fair value of the bifurcated compound derivative was $28.0 million. In May 2010 $3.5 million of the 2014 Debentures was converted to Common Stock. As of September 30, 2010, the fair value of the bifurcated compound derivative was $15.5 million. The change in fair value is reflected as gain on embedded derivative in the Consolidated Statement of Operations for the year ended September 30, 2010.
The Company will continue to mark the bifurcated compound derivative to market due to the conversion price not being indexed to the Company's own stock. Specifically, the feature requiring the Company to redeem foregone interest upon conversion by the holder causes the exercise price not to be indexed to the Company's own stock. The change in the fair value of the bifurcated compound derivative is primarily related to the change in price of the underlying common stock. T he change in value of the bifurcated compound derivative is a non-cash item; further, the Company can elect to settle the embedded derivative in either cash or common shares. As of September 30, 2010, the Company has enough common shares to settle all of its potential conversion obligations. The Company intends to settle these obligation in common shares should they be exercised by the holders. As the Company intends to, and has the ability to, satisfy the obligations with equity securities, in accordance with ASC Topic 470 Debt ("ASC 470"), the Company has classified the liability as a long-term liability on its Consolidated Balance Sheet as of September 30, 2010.
InventoriesInventory
Inventory is stated at the lower of cost or market (net realizable value). Costs associated with the development of a new product are charged to engineering, research and development expense as incurred, until the product is proven through testing and acceptance by the customer. At each balance sheet date, the Company evaluates its ending inventory for excess quantities and obsolescence. This evaluation includes analyses of sales levels by product and projections of future demand. Inventory was $18.8 million and $37.5 million at September 30, 2009 and 2008, respectively.
Table of Contents
NOTES TO CONSOLIDATED FINANCIAL STATEMENTS (Continued)
NOTE 1—THE COMPANY AND ITS SIGNIFICANT ACCOUNTING POLICIES (Continued)
Property, Plant and Equipment
Property, plant and equipment are carried at cost. Depreciation and amortization are provided using the straight-line method over the assets' remaining estimated useful lives, ranging from three to five years, except for leasehold improvements, which are stated at cost and amortized over the shorter of the term of the related lease or their estimated useful lives. Depreciation and amortization costs from continuing operations were $2.8 million and 2.9 million for each of the fiscal years 2009ended September 30, 2010 and 2008, respectively.2009.
Goodwill and Other Intangible Assets
Goodwill is recorded when the purchase price paid for an acquisition exceeds the estimated fair value of the net identified tangible and intangible assets acquired. We performed a two-step process at December 31, 2008 to determine: (i) whether the fair value of the Company exceeds the carrying value; and (ii) to measure the amount of an impairment loss. In the first step, we identified changes in key factors indicating an impairment of the value of our goodwill. Notable indicators were significantly depressed market conditions and industry trends, market capitalization below book value of equity and some downward revisions to our forecasts due to current economic conditions. Continually changing market conditions make it difficult to project how long the current economic downturn may last. Declining market values have negatively impacted our asset and equity valuations, which are a component of our goodwill impairment tests. Upon completion of the first step of the impairment test for the quarter ended December 31, 2008, we determined that additional impairment analysis was required by ASC 350. The second step of the goodwill impairment test compared the implied fair value of our Company's goodwill with the carrying amount of that goodwill. Since the carrying amount of goodwill exceeded the implied fair value of that goodwill, an impairment loss was recognized in an amount equal to that excess. The implied fair value of goodwill was determined in the same manner as the amount of goodwill recognized in a business combination. The fair value was determined through an analysis of: (i) the market capitalization; (ii) comparable public company valuations; and (iii) the future cash flows expected to be generated by the Company. The calculated fair value was then allocated to individual assets and liabilities (including any unrecognized intangible assets) as if the Company had been acquired in a business combination and the fair value of the Company was the purchase price paid to acquire the Company. In performing this allocation, the fair values of the assets and liabilities of the Company were calculated using generally accepted valuation methodologies, including analysis of: (i) the future cash flows expected to be generated; (ii) the estimated market value; or (iii) the estimated cost to replace. Any variance in the assumptions used to value the assets and liabilities could have had a significant impact on the estimated fair value of the assets and liabilities and, consequently, the amount of identified goodwill impairment. As a result of the additional analyses performed, we recorded an impairment charge to fully write off our goodwill balance of $191.4 million for the quarter ended December 31, 2008.
Table of Contents
NOTES TO CONSOLIDATED FINANCIAL STATEMENTS (Continued)
NOTE 1—THE COMPANY AND ITS SIGNIFICANT ACCOUNTING POLICIES (Continued)
Intangible assets, other than goodwill, are amortized over their useful lives unless these lives are determined to be indefinite. Other intangibleIntangible assets are carried at cost less accumulated amortization. Amortization is computed over the useful lives of the respective assets, generally two to ten years. Amortization costs were $0.8 million and $1.4 million for the fiscal years ended September 30, 2010 and 2009, respectively.
Income Taxes
We account The Company accounts for income taxes pursuant to the provisions of ASC 740. Under the asset and liability method of ASC 740, deferred tax assets and liabilities are recognized for the future tax consequences attributable to differences between the financial statement carrying amounts of existing assets and liabilities and their respective tax bases and operating loss and tax credit carryforwards. We assessThe Company assesses the likelihood that ourits deferred tax assets will be recovered from future taxable income and to the extent we believethe Company believes that recovery is not likely, we establishthe Company establishes a valuation allowance. To the extent we establishthe Company establishes a valuation allowance or increase this allowance in a period, wethe Company must include an expense within the tax provision in the statement of operations. ASC Topic 740-10 prescribes a recognition threshold and measurement attribute for the financial statement recognition and measurement of a tax position taken or expected to be taken in a tax return. The Company adopted the provisions of ASC 740; originally issued as the Financial Accounting Standards Board ("FASB") Interpretation No. 48, "Accounting for Uncertainty in Income Taxes" an interpretation of SFAS 109,740 on October 1, 2007 and assessed the impact of ASC 740 on its financial statements and determined that no adjustment to retained earnings was necessary.2007.
Research and Development Costs
Research and development costs are expensed when incurred. Manufacturing costs associated with the development of a new fabrication process or a new product are expensed until such time as these processes or products are proven through final testing and initial acceptance by the customer.
Computation of Net Income and Loss per Share
In accordance with ASC Topic 260 Earnings Perper Share ("ASC 260"); originally issued as SFAS 128, "Earnings per Share,", basic net income and loss per share is computed by dividing net income or loss by the weighted average number of common shares outstanding during the period.
For periods in which we reportthe Company reports income from continuing operations, the weighted average number of shares used to calculate diluted income per share is inclusive of common stock equivalents from unexercised stock options, restricted stock units, warrants, convertible preferred stock and convertible debentures. Unexercised stock options, restricted stock units and warrants are considered to be common stock equivalents if, using the treasury stock method, they are determined to be dilutive. The dilutive effect of the convertible preferred stock and convertible debentures is determined using the if-converted method.method, which assumes any proceeds that could be obtained upon
Table of Contents
NOTES TO CONSOLIDATED FINANCIAL STATEMENTS (Continued)
NOTE 1—THE COMPANY AND ITS SIGNIFICANT ACCOUNTING POLICIES (Continued)
the exercise of stock options, warrants and vesting of restricted stock units would be used to purchase common shares at the average market price for the period.
For the yearyears ended September 30, 2010 and 2009, the Company recorded a loss from operations and in accordance with ASC 260 all outstanding potential common shares were excluded from the diluted earnings per share computation. For periods in which the Company reports a loss from operations, diluted loss per share is calculated using only the weighted average number of shares outstanding during each of the periods, as the inclusion of any common stock equivalents would be anti-dilutive.
For the year ended September 30, 2008, the Company recorded income from operations and accordingly included common stock equivalents from the convertible debentures and stock options in the diluted earnings per share calculation, if they were dilutive.
The potential common shares excluded from the diluted earningscomputation are as follows:
| | | | | | | | | | |
| | September 30, | |
|---|
| | 2010 | | 2009 | | 2008 | |
|---|
| | (in thousands)
| |
|---|
Outstanding stock options | | | 990 | | | 1,078 | | | 1,005 | |
Outstanding restriced stock units | | | 108 | | | 31 | | | — | |
Outstanding warrants | | | 8 | | | 8 | | | 8 | |
Convertible preferred stock | | | 929 | | | — | | | — | |
2014 Convertible debentures | | | 10,332 | | | — | | | — | |
2024 Convertible debentures | | | — | | | 1,899 | | | 1,899 | |
| | | | | | | | |
Total potential common stock excluded from calculation | | | 12,367 | | | 3,016 | | | 2,912 | |
| | | | | | | | |
The computation for basic and diluted income and loss per share computation were determined to be anti-dilutive in accordance with ASC 260. Under the treasury stock method, due to the decreasing fair market value of the Company's common stock, none of its stock options or warrants was considered to be dilutive for the year endedis as follows:
| | | | | | | | | | | |
| | September 30, | |
|---|
| | 2010 | | 2009 | | 2008 | |
|---|
| | (in thousands, except per share data)
| |
|---|
Net (loss) income from continuing operations | | $ | (20,177 | ) | $ | (194,193 | ) | $ | 8,170 | |
Income from discontinued operations, net of tax | | | 121 | | | 71 | | | 9,044 | |
| | | | | | | | |
Net (loss) income | | | (20,056 | ) | | (194,122 | ) | | 17,214 | |
| | | | | | | | |
| | Net (loss) earnings attributable to noncontrolling interest | | | (1 | ) | | (81 | ) | | 660 | |
Fair value adjustment of Preferred Stock—Series B | | | 126 | | | — | | | — | |
| | | | | | | | |
Net (loss) income available to common stockholders | | $ | (20,181 | ) | $ | (194,041 | ) | $ | 16,554 | |
| | | | | | | | |
Weighted average number of shares—basic and diluted | | | 21,074 | | | 11,478 | | | 11,181 | |
Net (loss) income per common share—basic and diluted: | | | | | | | | | | |
Net (loss) income from continuing operations | | $ | (0.96 | ) | $ | (16.92 | ) | $ | 0.73 | |
| | Income from discontinued operations, net of tax | | | 0.01 | | | 0.01 | | | 0.81 | |
| | | | | | | | |
Net (loss) income | | | (0.95 | ) | | (16.91 | ) | | 1.54 | |
| | | | | | | | |
| | Net (loss) earnings attributable to noncontrolling interest | | | (0.00 | ) | | (0.01 | ) | | 0.06 | |
| | Fair value adjustment of Preferred Stock—Series B | | | 0.01 | | | — | | | — | |
| | | | | | | | |
Net (loss) income available to common stockholders | | $ | (0.96 | ) | $ | (16.91 | ) | $ | 1.48 | |
| | | | | | | | |
Table of Contents
NOTES TO CONSOLIDATED FINANCIAL STATEMENTS (Continued)
NOTE 1—THE COMPANY AND ITS SIGNIFICANT ACCOUNTING POLICIES (Continued)
September 30, 2008. Using the if-converted method, the Company determined that the convertible debentures did not have a dilutive effect on earnings for the year.
The potential common shares excluded from the diluted computation are as follows:
| | | | | | | | | | |
| | September 30, | |
|---|
| | 2009 | | 2008 | | 2007 | |
|---|
| | (in thousands)
| |
|---|
Outstanding stock options | | | 21,566 | | | 20,101 | | | 25,544 | |
Outstanding restricted stock units | | | 611 | | | — | | | — | |
Outstanding warrants | | | 150 | | | 150 | | | 102 | |
Convertible debentures | | | 37,981 | | | 37,981 | | | 37,981 | |
| | | | | | | | |
Total potential common shares excluded from calculation | | | 60,308 | | | 58,232 | | | 63,627 | |
| | | | | | | | |
The computation for basic and diluted income and loss per share is as follows:
| | | | | | | | | | | |
| | September 30, | |
|---|
| | 2009 | | 2008 | | 2007 | |
|---|
| | (in thousands, except per share data)
| |
|---|
(Loss) income from continuing operations | | $ | (194,112 | ) | $ | 7,510 | | $ | (4,825 | ) |
Income (loss) from discontinued operations | | | 71 | | | 9,044 | | | (16,822 | ) |
| | | | | | | | |
| | Net (loss) income | | $ | (194,041 | ) | $ | 16,554 | | $ | (21,647 | ) |
| | | | | | | | |
Weighted average number of shares—basic and diluted | | |
229,554 | | |
223,614 | | |
223,556 | |
(Loss) income per share—basic and diluted | | | | | | | | | | |
| | Continuing operations | | $ | (0.85 | ) | $ | 0.03 | | $ | (0.02 | ) |
| | Discontinued operations | | | 0.00 | | | 0.04 | | | (0.08 | ) |
| | | | | | | | |
| | Net (loss) income | | $ | (0.85 | ) | $ | 0.07 | | $ | (0.10 | ) |
| | | | | | | | |
Long-Lived Assets
The Company reviews long-lived assets and certain identifiable intangibles for impairment whenever events or changes in circumstances indicate that the carrying amount of an asset may not be recoverable. Recoverability of assets to be held and used is measured by a comparison of the carrying amount of an asset to future undiscounted operating cash flows expected to be generated by the asset, or fair market value. Assets held for sale are recorded at the lesser of fair value less costs to sell or carrying value. If such assets are considered to be impaired, the impairment to be recognized is measured by the amount by which the carrying amount of the assets exceeds the fair value of the assets. As required by ASC 360, we verified our long-lived assets were not impaired as of the time of the goodwill impairment. There were no impairment charges for the fiscal year 2009years 2010 and 2008.
Table of Contents2009.
NOTES TO CONSOLIDATED FINANCIAL STATEMENTS (Continued)
NOTE 1—THE COMPANY AND ITS SIGNIFICANT ACCOUNTING POLICIES (Continued)
Share-BasedShare-based Compensation
The Company has in effect several stockshare-based plans that have expired, but under which incentive and non-qualified stock options have been granted to employees, contractors and directors. These plans includeare still outstanding. In February 2010, its Board approved its new plan, the 2001 Stock2010 Vitesse Semiconductor Corporation Incentive Plan (the "2001"2010 Incentive Plan"),. On May 11, 2010, the 1991stockholders approved the 2010 Incentive Plan. The 2010 Incentive Plan permits the grant of stock options, stock appreciation rights, stock awards, restricted stock and stock units, and other stock and cash-based awards. The 2010 Incentive Plan replaced the Vitesse Semiconductor Corporation 2001 Stock Option Plan, the 1991 Directors' Stock Option Plan, and the 1999 International Stock OptionIncentive Plan. ASC 718 requires all share-based payments to employees, including grants of employee stock options and employee stock purchase rights, to be recognized in the financial statements based on their respective grant date fair values. ASC 718 also requires the benefits of tax deductions in excess of recognized compensation cost be reported as a financing cash flow, rather than operating cash flow, as required under previous literature.
ASC 718 required companies to calculate the compensation cost of full-value awards such as restricted stock based on the market value of the underlying stock at the date of the grant. ASC 718 requires companies to estimate the fair value of share-based payment awards on the date of grant using an option-pricing model. The value of the portion of the award that is ultimately expected to vest is recognized as expense ratably over the requisite service periods. The Company has estimated the fair value of each award as of the date of grant using the Black- ScholesBlack-Scholes option pricing model, which was developed for use in estimating the value of traded options that have no vesting restrictions and that are freely transferable. The Black-Scholes model considers, among other factors, the expected life of the award and the expected volatility of the Company's stock price. Although the Black-Scholes model meets the requirements of ASC 718, the fair values generated by the model may not be indicative of the actual fair values of the Company's awards, as it does not consider other factors important to those share-based payment awards, such as continued employment, periodic vesting requirements, and limited transferability.
Upon adoption of ASC 718, wethe Company elected to recognize compensation expense for all share-based awards granted after September 30, 2005 on a straight-line basis over the requisite service period for the entire award. The amount of compensation cost recognized through the end of each reporting period is equal to the portion of the grant-date value of the awards that have vested, or for partially vested awards, the value of the portion of the award that is ultimately expected to vest for which the requisite services have been provided.
Recent Accounting Pronouncements
In June 2009, the FASB issued ASC Topic 105 Generally Accepted Accounting Principles ("ASC 105"); originally issued as SFAS No. 168 "The FASB Accounting Standards Codification and Hierarchy of Generally Accepted Accounting Principles, a replacement of FASB Statement No. 162." ASC 105 establishes the FASB Standards Accounting Codification ("Codification") as the source of authoritative U.S. GAAP recognized by the FASB to be applied to nongovernmental entities and rules and interpretive releases of the SEC as authoritative GAAP for SEC registrants. The Codification will supersede all the existing non-SEC accounting and reporting standards upon its effective date and subsequently, the FASB will not issue new standards in the form of Statements, FASB Staff Positions or Emerging Issues Task Force Abstracts. ASC 105 also replaces FASB Statement No. 162, "The Hierarchy of Generally Accepted Accounting Principles" given that once in effect, the Codification will carry the same level of authority. ASC 105 is effective for financial statements issued for interim and annual periods ending after September 15, 2009, which includes our fiscal year ended September 30, 2009. The adoption of this statement does not have a material impact on our results of operations, financial position or cash flows.
Table of Contents
NOTES TO CONSOLIDATED FINANCIAL STATEMENTS (Continued)
NOTE 1—THE COMPANY AND ITS SIGNIFICANT ACCOUNTING POLICIES (Continued)
In December 2007, the FASB issued ASC Topic 805 Business Combinations ("ASC 805"); originally issued as SFAS No. 141R,"Business Combinations.". ASC 805 establishes principles and requirements for how the acquirer of a business recognizes and measures in its financial statements the identifiable assets acquired, the liabilities assumed and any non-controlling interest in the acquiree. The statement also provides guidance for recognizing and measuring the
Table of Contents
NOTES TO CONSOLIDATED FINANCIAL STATEMENTS (Continued)
NOTE 1—THE COMPANY AND ITS SIGNIFICANT ACCOUNTING POLICIES (Continued)
goodwill acquired in the business combination and determines what information to disclose to enable users of financial statements to evaluate the nature and financial effects of the business combination. ASC 805 is effective for financial statements issued for fiscal years beginning after December 15, 2008. Accordingly, ASC 805 is applicable to the Company's accounting for business combinations closing on or after October 1, 2009. We expect ASC 805 will have an impact on our consolidated financial statements, but the nature and magnitude of the specific effects will depend upon the nature, terms and size of the acquisitions we consummate after the effective date of October 1, 2009. The adoption of this statement did not have a materialan impact on ourthe Company's results of operations, financial position or cash flows duringas of and for the year ended September 30, 2009.2010 due to the absence of conditions to which it would apply.
In April 2009 the FASB issued ASC Topic 805 Business Combinations ("ASC 805"); originally issued as FSP No. 141R-1,"Accounting for Assets Acquired and Liabilities Assumed in a Business Combination That Arise from Contingencies." ASC 805 amends the provisions in Statement 141R for the initial recognition and measurement, subsequent measurement and accounting and disclosures for assets and liabilities arising from contingencies in business combinations. The FSP eliminates the distinction between contractual and non-contractual contingencies, including the initial recognition and measurement criteria in Statement 141R and instead carries forward most of the provisions in ASC 805 for acquired contingencies. ASC 805 is effective for contingent assets and contingent liabilities acquired in business combinations for which the acquisition date is on or after the beginning of the first annual reporting period beginning on or after December 15, 2008. We expect ASC 805 will have an impact on our consolidated financial statements, but the nature and magnitude of the specific effects will depend upon the nature, term and size of the acquired contingencies. The adoption of this statement did not have a material impact on our results of operations, financial position or cash flows during the year ended September 30, 2009.
In December 2007, the FASB issued ASC Topic 810 Consolidation ("ASC 810"); originally issued as SFAS No. 160,"Non-controlling Interests in Consolidated Financial Statements—an amendment of ARB No. 51.". ASC 810 addresses the accounting and reporting standards for ownership interests in subsidiaries held by parties other than the parent, the amount of consolidated net income attributable to the parent and to the non-controlling interest, changes in a parent's ownership interest, and the valuation of retained non-controlling equity investments when a subsidiary is deconsolidated. The Company adopted ASC 810 is effective for fiscal years beginning after December 15, 2008. We do not anticipate that the adoption of ASC 810 will have a material impact on our financial statements.
In March 2008, the FASB issued ASC Topic 815 Derivatives and Hedging ("ASC 815"); originally issued as SFAS No. 161, "Disclosures about Derivative Instruments and Hedging Activities—an Amendment of FASB Statement No. 133." ASC 815 requires enhanced disclosures about an entity's derivative and hedging activities and is effective for financial statements issued for fiscal years and interim periods beginning after November 15, 2008. We adopted ASC 815 in the second quarter of fiscal 2009. ASC 815 only required additional disclosure, the adoption did not impact our consolidated financial position, results of operations or cash flows.
Table of Contents
NOTES TO CONSOLIDATED FINANCIAL STATEMENTS (Continued)
NOTE 1—THE COMPANY AND ITS SIGNIFICANT ACCOUNTING POLICIES (Continued)
In May 2008, the FASB issued ASC Topic 470 Debt ("ASC 470"); originally issued as FASB Staff Position APB 14-1, "Accounting for Convertible Debt Instruments That May Be Settled in Cash upon Conversion (Including Partial Cash Settlement)." ASC 470 requires us to separately account for the liability and equity components of a convertible debt security by measuring the fair value of a similar nonconvertible debt security when interest cost is recognized in subsequent periods. ASC 470 requires us to retroactively separate the liability and equity components of such debt in our consolidated balance sheets on a fair value basis. ASC 470 is effective for fiscal years beginning after December 15, 2008. We anticipate that ASC 470 will affect the accounting for our convertible debt and we are currently evaluating the impact that it will have on our financial statements.
In June 2008, the FASB ratified ASC Topic 815 Derivatives and Hedging ("ASC 815"); originally issued as Emerging Issues Task Force ("EITF") Issue No. 07-5, "Determining Whether an Instrument (or an Embedded Feature) Is Indexed to an Entity's Own Stock." ASC 815 provides that an entity should use a two step approach to evaluate whether an equity-linked financial instrument (or embedded feature) is indexed to its own stock, including evaluating the instrument's contingent exercise and the instrument's settlement provisions. ASC 815 clarifies the impact of foreign currency denominated strike prices and market-based employee stock option valuation instruments on the evaluation. ASC 815 is effective for the financial statements issued for fiscal years and interim periods within those fiscal years, beginning after December 15, 2008 and will be applied to outstanding instruments as of the beginning of the fiscal year in which it is adopted. Upon adoption, a cumulative effect adjustment will be recorded, if necessary, based on amounts that would have been recognized if this guidance had been applied from the issuance date of the affected instruments. We are currently determining the impact that ASC 815 will have on our financial statements, if any.
In April 2009 the FASB issued three related Staff Positions: (i) ASC Topic 820 Fair Value Measurements and Disclosures; originally issued as FSP 157-4,"Determining Fair Value When the Volume and Level of Activity for the Asset or Liability have Significantly Decreased and Identifying Transactions That Are Not Orderly," (ii) ASC Topic 320 Investments—Debt and Equity Securities ("ASC 320") and ASC Topic 958-320 Investments—Debt and Equity Securities ("ASC 958-320"); originally issued as SFAS 124-2,"Recognition and Presentation of Other-Than-Temporary Impairments," and (iii) ASC Topic 825 Financial Instruments ("ASC 825") originally issued as SFAS 107-1 and ASC Topic 270 Interim Reporting ("ASC 270"); originally issued as APB 28-1, "Interim Disclosures about Fair Value of Financial Instruments," which will be effective for interim and annual periods ending after June 15, 2009. ASC 820 provides guidance on how to determine the fair value of assets and liabilities under ASC 820 in the current economic environment and reemphasizes that the objective of a fair value measurement remains an exit price. If we were to conclude that there has been a significant decrease in the volume and level of activity of the asset or liability in relation to normal market activities, quoted market values may not be representative of fair value and we may conclude that a change in valuation technique or the use of multiple valuation techniques may be appropriate. ASC 320 and ASC 958-320 modify the requirements for recognizing other-than-temporarily impaired debt securities and revise the existing impairment model for such securities, by modifying the current intent and ability indicator in determining whether a debt security is other-than-temporarily impaired. ASC 825 and ASC 270 enhance the disclosure of instruments under the scope of ASC 820 for both interim and annual periods. We adopted this statement for our quarter ended June 30,October 1, 2009. The adoption of this statement did not have ana material impact on our results of operation, financial position or cash flow.
Table of Contents
NOTES TO CONSOLIDATED FINANCIAL STATEMENTS (Continued)
NOTE 1—THE COMPANY AND ITS SIGNIFICANT ACCOUNTING POLICIES (Continued)
In May 2009, the FASB issued ASC Topic 855 Subsequent Events ("ASC 855"); originally issued as FAS No. 165,"Subsequent Events." ASC 855 establishes general standards of accounting for and disclosure of events that occur after the balance sheet date but before financial statements are issued. ASC 855 is effective for interim and annual periods ending after June 15, 2009. We adopted this statement for our quarter ended June 30, 2009, and the adoption did not have an impact on ourCompany's results of operations, financial position or cash flows. The Company has evaluated subsequent events through December 11, 2009, which coincides with the issuanceflows as of its financial statementsand for the periodyear ended September 30, 2009.2010.
Other recent accounting pronouncements issued by the FASB (including its Emerging Issues Task Force), the American Institute of Certified Public Accountants or the SEC did not or are not believed by management to have a material impact on the Company's present or future consolidated financial statements.Consolidated Financial Statements.
NOTE 2—GOODWILL AND OTHER INTANGIBLE ASSETS
We accountThe Company accounts for goodwill and other intangible assets in accordance with ASC 350. We evaluateThe Company evaluates these assets, including purchased intangible assets deemed to have indefinite lives, on an annual basis in the fourth quarter, or more frequently if we believethe Company believes indicators of impairment exist. Factors we considerthe Company considers important that could triggerresult in an impairment review include significant underperformance to historical or projected operating results, substantial changes in ourits business strategy and significant negative industry or economic trends. If such indicators are present, we comparethe Company compares the fair value of the goodwill to its carrying value. Fair value of goodwill is determined by using a valuation model based on an analysis of: (i) the Company's market capitalization; (ii) comparable public company valuations (a market approach); and (iii) the future cash flows expected to be generated by the Company (an income approach). Fair value of other intangible assets is determined by discounted future cash flows, appraisals or other methods. Carrying value of goodwill as of September 30, 2009 and September 30, 2008 was $0 and $191.4 million, respectively. No activity or adjustments to goodwill except for the impairment charge forIn the quarter ended December 31, 2008, occurred forthe Company recorded an impairment charge to fully write off its goodwill. There has been no other impairment activity or adjustments to intangible assets during the years ended September 30, 2010, 2009 and September 30,or 2008.
Other Intangible Assets
Other intangible assets consist primarily of existing technologies and intellectual property. Acquired intangibles are amortized on a straight-line basis over the respective estimated useful lives of the assets. The carrying value of intangible assets at September 30, 2009 and 2008 was $1.5 million and $0.9 million, respectively. For other intangible assets and long-lived assets, in accordance with ASC 360, we determine whether the sum of the estimated undiscounted cash flows attributable to each asset in question is less than its carrying value. If less, we recognize an impairment loss based on the excess of the carrying amount of the assets over their respective fair values. Fair value of long-lived assets is determined based on market value. If the long-lived asset determined to be impaired is to be held and used, we recognize an impairment charge to the extent the fair value attributable to the asset is less
Table of Contents
NOTES TO CONSOLIDATED FINANCIAL STATEMENTS (Continued)
NOTE 2—GOODWILL AND OTHER INTANGIBLE ASSETS (Continued)
than the asset'sThe carrying value. The fair value of the long-lived asset then becomes the asset's new carrying value, which we amortize over the remaining estimated useful life of the asset.intangible assets at September 30, 2010 and 2009 was $0.9 million and $1.5 million, respectively.
|
| |
| | Gross Carrying
Amount | | Accumulated
Amortization | | Net Carrying
Amount | |
|---|
September 30, 2010 | | September 30, 2010 | |
| | | Intellectual property | | $ | 3,595 | | $ | (2,731 | ) | $ | 864 | |
| | | | | | | | | | |
| | | | | | | | | | | | | | Total | | $ | 3,595 | | $ | (2,731 | ) | $ | 864 | |
|
| | Gross Carrying
Amount | | Accumulated
Amortization | | Net Carrying
Amount | | | | | | | | | |
|---|
September 30, 2009 | September 30, 2009 | | September 30, 2009 | |
| | Technology | |
$ |
1,650 | |
$ |
(1,581 |
) |
$ |
69 | | Technology | | $ | 1,650 | | $ | (1,581 | ) | $ | 69 | |
| | Intellectual property | | 3,485 | | (2,013 | ) | | 1,472 | | Intellectual property | | 3,485 | | (2,013 | ) | | 1,472 | |
| | | | | | | | | | | | | | | | | |
| | | Total | | $ | 5,135 | | $ | (3,594 | ) | $ | 1,541 | | | Total | | $ | 5,135 | | $ | (3,594 | ) | $ | 1,541 | |
| | | | | | | | | | | | | | | | | |
September 30, 2008 | | |
| | Customer relationships | |
$ |
2,700 | |
$ |
(2,700 |
) |
$ |
— | | |
| | Technology | | 40,350 | | (39,803 | ) | | 547 | | |
| | Covenants not to compete | | 4,000 | | (4,000 | ) | | — | | |
| | Intellectual property | | 2,178 | | (1,812 | ) | | 366 | | |
| | | | | | | | | |
| | | Total | | $ | 49,228 | | $ | (48,315 | ) | $ | 913 | | |
| | | | | | | | | |
The future amortization expense of other intangible assets is as follows (in thousands):
| Fiscal Year | Fiscal Year | |
| | Fiscal Year | |
| |
|---|
2010 | | $ | 779 | | |
2011 | 2011 | | 315 | | 2011 | | $ | 330 | |
2012 | 2012 | | 211 | | 2012 | | 226 | |
2013 | 2013 | | 142 | | 2013 | | 158 | |
2014 | 2014 | | 52 | | 2014 | | 68 | |
2015 | | 2015 | | 48 | |
Thereafter | Thereafter | | 42 | | Thereafter | | 34 | |
| | | | | | | | | |
| | Total | | $ | 1,541 | | Total | | $ | 864 | |
| | | | | | | | | |
NOTE 3—DISCONTINUED OPERATIONS AND ASSETS HELD FOR SALE
On October 29, 2007, the Company completed its sale of a portion of the Storage Products business to Maxim Integrated Products, Inc. ("Maxim") for $62.8 million, with a gain on the sale of approximately $21.5 million, plus a potential earn-out based on the business meeting certain criteria, as detailed in the agreement. Maxim acquired the Company's SAS/SATA expander product markets, enclosure and baseboard management devices, and certain other assets of the Storage Product business. Assets sold include inventory, property and equipment, goodwill and intangible assets of $35.5 million. As part of the sale, Maxim assumed a liability for employees' accrued vacation of $0.3 million. The gain was reduced by costs of completing the sale in the amount of $1.6 million.
Debt issuance costs related to the Tennenbaum Capital Partners ("TCP") debt of $3.5 million were included in the calculation of the gain on the sale pursuant to the accounting guidance in ASC 205 which requires any costs related to financing that must be paid off with the proceeds of the sale of specific assets to be included in the determination of the gain or loss on sale. In accordance with ASC 205 we allocated interest expense associated with debt instruments that were required to be repaid upon the sale of the Storage Product business to discontinued operations. Pursuant to an
Table of Contents
NOTES TO CONSOLIDATED FINANCIAL STATEMENTS (Continued)
NOTE 3—DISCONTINUED OPERATIONS AND ASSETS HELD FOR SALE (Continued)
amendment to the debt agreement with TCP, we were required to pay the debt to TCP from the Storage Products division sale proceeds. Accordingly, for the year ended September 30, 2008, interest expense of approximately $17.0 million was included in discontinued operations.
We recorded amounts in discontinued operations in accordance with ASC 360. Accordingly, we reported the results of operations of the Storage Products business in discontinued operations within the Company's statement of operations for the years ended September 30, 2009 and 2008. The sale of the Storage Products business closed on October 29, 2007.
On December 22, 2008, we closed the sale of the Colorado land and building to a third-party. The gross sales price was $6.5 million. The facility was previously used for the Storage Products business, which was discontinued and sold on October 29, 2007 and had remained unused from the time of the sale of the business. As a result, the net book value of $3.2 million was reported as "Asset Held for Sale" on the September 30, 2008 balance sheet. We recognized a gain of approximately $2.9 million on this sale in the first quarter of fiscal 2009.
Selected operating results of discontinued operations were as follows:
| | | | | | | |
| | September 30, | |
|---|
| | 2009 | | 2008 | |
|---|
| | (in thousands)
| |
|---|
Net revenues of discontinued operations | | $ | — | | $ | 2,656 | |
| | | | | | |
(Loss) income from continuing operations before income taxes | | |
(195,644 |
) | |
9,392 | |
Provision for income tax (benefit) expense | | | (1,451 | ) | | 1,222 | |
Minority interest in loss (earnings) of consolidated subsidiary | | | 81 | | | (660 | ) |
Income from discontinued operations, net of tax | | | 71 | | | 9,044 | |
| | | | | | |
Net (loss) income | | $ | (194,041 | ) | $ | 16,554 | |
| | | | | | |
In accordance with ASC 205, we have allocated interest expense to discontinued operations associated with debt instruments that were required to be paid upon the sale of Storage Products business. Interest expense included in income (loss) from discontinued operations, which includes interest incurred and amortization expense of deferred financing fees for our former loan totaled $17.0 million for fiscal year 2008 and none in fiscal year 2009.
NOTE 4—ACCOUNTING REMEDIATION & RECONSTRUCTION EXPENSE, & LITIGATION COSTS
The Company has incurred substantial costs in connection with its restructuring and remediation efforts. During the year ended September 30, 2009 we recognized a net credit of $9.9 million, consisting of $4.1 million in legal and professional fees related the remediation and litigation and a $3.0 million accrual for our pending settlement with the SEC related to their investigation into the Company's historical stock option practices and certain other accounting irregularities. These costs were offset by a $16.0 million credit related to our settlement with KPMG, our former public accounting firm pursuant to which KPMG agreed to pay us $22.5 million and forgive all of our past indebtedness and a $1.0 million credit related to the settlement of and adjustment to our liability to the IRS related to prior management's stock option backdating practices. For the year ended September 30, 2008, we recognized $10.8 million in legal and professional fees related to work performed in correcting and
Table of Contents
NOTES TO CONSOLIDATED FINANCIAL STATEMENTS (Continued)
NOTE 4—ACCOUNTING REMEDIATION & RECONSTRUCTION EXPENSE, & LITIGATION COSTS (Continued)
reporting errors in our stock option grants, revenue recognition policies, inventory valuation, and other legal and financial issues.
NOTE 5—BALANCE SHEET DETAIL
The following tables provide details of selected balance sheet items (in thousands):
|
|
| | September 30, | |
| | September 30, | |
|---|
|
| | 2009 | | 2008 | |
| | 2010 | | 2009 | |
|---|
Inventory: | Inventory: | | Inventory: | |
Raw materials | Raw materials | | $ | 1,411 | | $ | 3,067 | | Raw materials | | $ | 2,815 | | $ | 1,411 | |
Work-in-process | Work-in-process | | 8,335 | | 13,926 | | Work-in-process | | 12,854 | | 8,335 | |
Finished goods | Finished goods | | 9,063 | | 20,473 | | Finished goods | | 11,604 | | 9,063 | |
| | | | | | | | | | | | | |
| | Total | | $ | 18,809 | | $ | 37,466 | | Total | | $ | 27,273 | | $ | 18,809 | |
| | | | | | | | | | | | | |
Property, Plant and Equipment: | Property, Plant and Equipment: | | Property, Plant and Equipment: | |
Machinery and equipment | Machinery and equipment | | $ | 90,884 | | $ | 90,493 | | Machinery and equipment | | $ | 91,440 | | $ | 90,884 | |
Furniture and fixtures | Furniture and fixtures | | 769 | | 678 | | Furniture and fixtures | | 764 | | 769 | |
Computer equipment | Computer equipment | | 10,018 | | 8,942 | | Computer equipment | | 10,188 | | 10,018 | |
Leasehold improvements | Leasehold improvements | | 5,657 | | 5,692 | | Leasehold improvements | | 5,709 | | 5,657 | |
Construction In Progress | | 76 | | 1,027 | | |
Construction in progress | | Construction in progress | | 433 | | 76 | |
| | | | | | | | | | | | | |
| | | 107,404 | | 106,832 | | | | 108,534 | | 107,404 | |
Less: Accumulated depreciation and amortization | Less: Accumulated depreciation and amortization | | 99,530 | | 98,748 | | Less: Accumulated depreciation and amortization | | 100,338 | | 99,530 | |
| | | | | | | | | | | | | |
| | Total | | $ | 7,874 | | $ | 8,084 | | Total | | $ | 8,196 | | $ | 7,874 | |
| | | | | | | | | | | | | |
Other Assets: | | Other Assets: | |
Debt issuance costs | | Debt issuance costs | | $ | 1,651 | | $ | 1,184 | |
Long term deposits | | Long term deposits | | 1,877 | | 1,813 | |
Other | | Other | | 469 | | 80 | |
| | | | | | | | |
| | | Total | | $ | 3,997 | | $ | 3,077 | |
| | | | | | | | |
Liabilities: | | Liabilities: | |
Accrued legal fees and settlements | | Accrued legal fees and settlements | | $ | 153 | | $ | 139 | |
Accrued wages and benefits | | Accrued wages and benefits | | 3,377 | | 3,586 | |
Accrued vacation | | Accrued vacation | | 2,768 | | 2,813 | |
Accrued software license agreements | | Accrued software license agreements | | 6,423 | | 5,025 | |
Accrued commissions | | Accrued commissions | | 209 | | 118 | |
Miscellaneous taxes | | Miscellaneous taxes | | 179 | | 197 | |
Interest payable | | Interest payable | | 2,332 | | 1,271 | |
Customer prepayments and deposits | | Customer prepayments and deposits | | — | | 149 | |
Other | | Other | | 842 | | 884 | |
| | | | | | | | |
| | | Total | | $ | 16,283 | | $ | 14,182 | |
| | | | | | | | |
| | | | | | | | |
| | September 30, | |
|---|
| | 2009 | | 2008 | |
|---|
Other Assets: | | | | | | | |
Debt issue costs | | $ | 1,184 | | $ | 1,754 | |
Restricted cash | | | 1,813 | | | 1,517 | |
Other | | | 80 | | | 329 | |
| | | | | | |
| | Total | | $ | 3,077 | | $ | 3,600 | |
| | | | | | |
Accrued Expenses and Other Current Liabilities: | | | | | | | |
Accrued legal fees and settlements | | $ | 139 | | $ | 4,588 | |
Accrued wages and benefits | | | 3,586 | | | 6,203 | |
Accrued vacation | | | 2,813 | | | 2,720 | |
Accrued software license agreements | | | 1,535 | | | 326 | |
Accrued subsequent payments | | | 490 | | | 1,675 | |
Accrued commissions | | | 118 | | | 89 | |
Miscellaneous taxes | | | 197 | | | 353 | |
Interest payable | | | 1,271 | | | 1,270 | |
Customer prepayments and deposits | | | 149 | | | 143 | |
Other | | | 589 | | | 2,875 | |
| | | | | | |
| | Total | | $ | 10,887 | | $ | 20,242 | |
| | | | | | |
Table of Contents
NOTES TO CONSOLIDATED FINANCIAL STATEMENTS (Continued)
NOTE 6—4—DEBT
During 2004,As of September 30, 2010, the outstanding 2014 Debentures, with a face value of $46.5 million, were carried on the balance sheet at $39.0 million, net of a $7.5 million remaining discount. Additionally, the Company issued $96.7has outstanding Senior Term Loans with a face value of $25.0 million, in aggregate principal amountcarried on the balance sheet net of its 1.5% Convertible Subordinated Debentures due 2024 (the "2024 Debentures"$1.3 million of accrued PIK interest and a remaining discount of $0.2 million. The Senior Term Loan has an interest rate of 8.5% and includes 2.0% payment-in-kind ("PIK") to qualified institutional buyers in reliance on Rule 144A under the Securities Act of 1933 (the "Securities Act"). The 2024 Debentures are unsecured obligations and are subordinated in right of payment to all of the Company's existing and future senior indebtedness. Interest is payable in arrears semiannually on October 1 and April 1 of each year, beginning April 1, 2005. On August 15, 2006, the Company received notification from the Trustee under the Indenture, dated as of September 22, 2004, relating to the Company's 2024 Debentures. The Trustee alleged compliance deficiencies under the Indenture relating to the Company's failure to file with the Securities and Exchange Commission the Company's Quarterly Report on Form 10-Q for the quarter ended March 31, 2006. Although the Company did not believe there were compliance deficiencies under the Indenture, and that an Event of Default did not occur, the Company negotiated with the holders of a majority of the 2024 Debentures to reach a resolution to the dispute. On September 24, 2007, the Company entered into a Second Supplemental Indenture amending Section 1.1 of the Indenture related to the "Interest Rate"; Section 4.1(d) of the Indenture related to "Default" or "Event of Default"; and Section 4.2 of the Indenture related to "Acceleration of Maturity." As part of the amendment, the Company agreed to increase the interest, payable for the period starting April 1, 2007, through, but not including October 1, 2007, by $20 per $1,000 principal amount of the 2024 Debentures. On October 1, 2007, the Company includedplus an additional $1.90.3% PIK interest for every $1.0 million payment with the semiannual payment of interest due.
On October 23, 2006, the Company solicited consents from the holdersabove $15.0 million of the 2024 Debentures that, if received, would provide: (i) the holders of the 2024 Debentures and the Trustee under the Indenture would agree that, for 18 months after the date the proposed amendments are effective, the Trustee would forbear from taking any action to exercise any rights or remedies that relate to the filing of reports required under the Exchange Act; (ii) the Company would agree not to repay the 2024 Debentures pursuant to the purported acceleration request sent by the Trustee to the Company during the last six months of the forbearance period; (iii) the indenture for the 2024 Debentures would be amended so that the conversion price of the 2024 Debentures would be decreased permanently from $3.92 per share of common stock to $2.546 per share of common stock, subject to further adjustment as set forth in the indenture; and (iv) the repurchase price with respect to the October 1, 2009, repurchase right was increased from 100% to 113.76% of the principal amount of the 2024 Debentures to be purchased, plus accrued and unpaid interest (the October 1, 2014 and October 1, 2019 repurchase rights would not be changed). The consents were received and the amendments became effective November 3, 2006.
The modification of the conversion feature discussed above resulted in an increase in the initial conversion rate to approximately 392.773 shares of common stock per $1,000 principal amount of the 2024 Debentures from approximately 255.102 shares of common stock per $1,000 principal amount of the debentures. Upon conversion, the Company will have the option to deliver cash in lieu of shares of its common stock or a combination of cash and shares of common stock. The Company may redeem the 2024 Debentures after October 1, 2007 if its stock price is at least 170% of the conversion price, or approximately $4.32 per share, for 20 trading days within any consecutive 30-day trading period, and may also redeem the 2024 Debentures beginning October 1, 2009, without being subject to such condition. Holders of the 2024 Debentures have the right to require the Company to repurchase the 2024 Debentures on October 1 of 2009, 2014, and 2019.
In accordance with the November 3, 2006 amendments to the 2024 Debentures, the October 1, 2009 repurchase right was increased from 100% to 113.76% of the principal amount of the 2024
Table of Contents
NOTES TO CONSOLIDATED FINANCIAL STATEMENTS (Continued)
NOTE 6—4—DEBT (Continued)
Senior Term Loan that is not paid down by the Company for the period from October 17, 2009 until maturity or full payment of the note. Payments with respect to the Senior Term Loan are interest only until the maturity date of October 29, 2011. As part of the debt restructuring transaction, the Company paid $5.0 million of the original $30.0 million principal balance of the Senior Term Loan. The Senior Term Loan includes a nonrefundable prepayment fee equal to 1.0% of the aggregate principal amount that is prepaid.
As of September 30, 2009, the Company had outstanding a $30.0 million Senior Term Loan. Effective October 16, 2009, the Company entered into an agreement to amend the Senior Term Loan. Pursuant to the amendment to the Senior Term Loan, the Company repaid $5.0 million of the original $30.0 million and agreed to an interest rate increase on the remaining $25.0 million outstanding. The amended interest terms on the Senior Term Loan will not materially impact the amount of quarterly interest payments over the remaining life of the associated note, but additional interest expense accrued under the PIK provision will increase the final payment due on the Senior Term Loan at maturity on October 29, 2011 by $2.7 million over the face value of the note. In accordance with ASC 470, this transaction was accounted for as a debt modification whereby fees of $0.5 million incurred pursuant to the modification were expensed as incurred.
As of September 30, 2009, the Company had outstanding $96.7 million in aggregate principal amount 2024 Debentures. The Company entered into a Debt Conversion Agreement (the "Conversion Agreement") with the beneficial owners of more than 96.7% of the 2024 Debentures (the "Noteholders"). Pursuant to the Conversion Agreement, the Noteholders agreed to exchange their 2024 Debentures for a combination of $6.4 million in cash, 8,646,811 shares of common stock, and $50.0 million in newly issued 2014 Debentures convertible into 11,109,556 shares of common stock. 771,000 shares of Series B Preferred Stock were also issued to certain Noteholders. The Conversion Agreement was consummated on October 30, 2009. The Company also paid $3.6 million in cash to 3.3% of the holders of the 2024 Debentures who declined to participate in the Conversion Agreement.
In accordance with ASC 470, this transaction was accounted for as a debt extinguishment, pursuant to which the Company recognized a $21.6 million loss. The loss on the extinguishment of debt was calculated as the difference between the aggregate fair values of the new instruments, including the compound embedded derivative associated with the 2014 Debentures, totaling $130.8 million, plus $0.8 million in additional amounts and fees paid to the creditors, compared to the net carrying values of the 2024 Debentures and related premium put derivative of $96.7 million and $13.3 million, respectively.
In connection with the debt exchange and the debt modification, the Company incurred third-party costs of $2.9 million that were allocated to the underlying financial instruments issued based on the relative fair value of each instrument. Of the total fees incurred, $0.5 million was allocated to the modification of the Senior Term Loan and expensed as incurred, $1.0 million was allocated to the issuance of the common and preferred shares and charged against additional paid-in capital, and $1.4 million was allocated to the issuance of the 2014 Debentures and was capitalized in other assets as debt issuance costs, to be purchased. The increase inamortized as interest expense over the repurchase right would result in an additional paymentterm of $13.3 million on the $96.7 million outstanding 2024 Debentures. Holders also have the option, subject to certain conditions, to requireloan. Unamortized debt issuance costs as of September 30, 2010 were $1.8 million.
On May 14, 2010, the Company received a Conversion Notice from one of the Noteholders of the 2014 Debentures, notifying the Company of its intent to repurchase any 2024 Debentures held by such holder in the eventconvert $3.5 million face amount of a fundamental change, at a price equal to 100% ofits holdings. The Company converted the principal amount of the 2024 Debentures plus accruedsubmitted debentures into shares of common stock and unpaid interest plus, under certain circumstances,elected to pay the "Make-Whole Amount" (as defined in the Indenture) in shares
Table of Contents
NOTES TO CONSOLIDATED FINANCIAL STATEMENTS (Continued)
NOTE 4—DEBT (Continued)
of common stock. 777,778 shares of the Company's common stock were issued on May 20, 2010 in settlement of the $3.5 million of debentures based on a make-whole premium. Interest expense relating toconversion price of $4.50 per share. On June 7, 2010, 91,753 shares of common stock were issued in settlement of the 2024 Debentures was $1.5 million, $1.5 million and $3.4 million for the fiscal years ended September 30, 2009, 2008 and 2007, respectively. Outstanding 2024 Debentures were $96.7 million at September 30, 2009 and 2008.Make-Whole Amount obligation.
In accordance with ASC 815, embedded derivatives must be bifurcated from the underlying debt instrument and valued470, this conversion was accounted for as a separatedebt extinguishment. The Company recognized a gain of $0.3 million in the accompanying financial instrument.statements. The 2024 Debentures include a repurchase right for 113.76%gain on the extinguishment of the principal amount of the 2024 Debentures on October 1, 2009 (the "premium put" or "derivative liability") that we have identified as an embedded derivative requiring bifurcation and accounting at fair value because the economic and risk characteristics of the premium put meet the criteria for separate accounting as set forth in ASC 815. We estimate the approximate fair value of the premium putdebt was calculated as the difference between the estimated value of the 2024 Debentures with and without the premium put feature. The fair value of the 2024 Debentures withshares of common stock issued and the recorded value of the debt extinguished, which included a pro rata share of 1) debt issuance costs, 2) debt discount, and 3) fair value of the embedded derivative on the date of the conversion.
NOTE 5—FAIR VALUE MEASUREMENTS
Assets and liabilities measured at fair value on a recurring basis include the following at September 30, 2010 and September 30, 2009 (in thousands):
| | | | | | | | | | | | | |
| | Fair Value
Measurements Using | |
| |
|---|
| | Level 1 | | Level 2 | | Level 3 | | Total | |
|---|
September 30, 2010 | | | | | | | | | | | | | |
Derivative liability—premium put | | $ | — | | $ | — | | $ | — | | $ | — | |
Derivative liability—compound embedded derivative | | | — | | | — | | | 15,476 | | | 15,476 | |
September 30, 2009 | | | | | | | | | | | | | |
Derivative liability—premium put | | $ | — | | $ | — | | $ | 12,209 | | $ | 12,209 | |
Derivative liability—compound embedded derivative | | | — | | | — | | | — | | | — | |
The following table provides a reconciliation of the beginning and ending balances for the derivative liability—premium put and derivative liability—compound embedded derivative measured at fair value using significant unobservable inputs (Level 3) (in thousands):
| | | | | | | | |
| | Derivative
liability—premium
put related to
2024 Debentures | | Compound
Embedded Derivative
related to
2014 Debentures | |
|---|
Balance at September 30, 2009 | | $ | 12,209 | | $ | — | |
| | Transfers in and /or out of Level 3 | | | — | | | 24,453 | |
| | Total (gain) losses included in earnings | | | 1,108 | | | (8,977 | ) |
| | Settlement | | | (13,317 | ) | | — | |
| | | | | | |
Balance at September 30, 2010 | | $ | — | | $ | 15,476 | |
| | | | | | |
The compound embedded derivative liability, which is included in long term liabilities, represents the value of the equity conversion feature was estimatedand a "make-whole" feature of the 2014 Debentures.
There is no current observable market for this type of derivative and, as such, the Company determined the value of the embedded derivative using a scenario analysis that incorporated the investment and settlement alternatives available to the debt holders in connection with the premium put feature. The scenario analysislattice-based convertible bond valuation model that combined expected cash outflows with market-based assumptions and an estimate of the probability of each scenario occurring.assumptions. The fair value of the 20242014 Debentures without the embedded premium putcompound derivative feature was also estimated using a convertible bond valuation model within a lattice framework. The convertible bond valuation model combined expected cash outflows with market-based assumptions regarding risk-adjusted yields, stock price volatility, and recent price quotes and trading information regarding shares of our common stock into which the 2024 Debentures are convertible. Our analysis is premised on the assumption that the holder would act in a manner that maximizes the potential return, or "payoff," at any given point in time. Included in this premise is the assumption that the holder would compare the potential return associated with each available alternative, including, as specified in the terms of the contract, holding the debt instrument, exercising an equity conversion option, or exercising a put option. As a component of this, we incorporated a market participant consideration as to the Company's capacity to fulfill the contractual obligations associated with each alternative, including the Company's ability to fulfill any cash settlement obligation associated with exercise of the put option, as well as the Company's ability to refinance the contractual obligation. Based on our analysis, we determined that the fair value of the premium put is most sensitive to the estimated amount of funds available for settlement of the liability on October 1, 2009. More specifically, fair value of the premium put is positively correlated to the estimated amount of cash proceeds and other securities expected to be received at exercise. Should the premium put have value, any gain or loss on the fair value of the premium put will be reflected in current earnings. As a result of our valuation analysis the premium put was estimated to have a fair value of $12.2 million as of September 30, 2009 and no fair value as of September 30, 2008. Upon exercise of the put option related to the 2024 Debentures on October 1, 2009 (See Note 14—Subsequent Events), the liability associated with the premium put was recorded at $13.3 million representing the contractual amount owed to the debenture holders upon exercise of the put. The fair value of the premium put is measured using Level 3 inputs. The primary driver of the change in fair value between these dates was an increase in the amount of funds, both cash and other securities, available for settlement between the measurement dates.
Table of Contents
NOTES TO CONSOLIDATED FINANCIAL STATEMENTS (Continued)
NOTE 6—DEBT (Continued)
On October 1, 2009, the Trustee of the 2024 Debentures, provided a written notice to the Company that holders representing $95.7 million of the principal amount of the 2024 Debentures had exercised their repurchase rights under the Indenture. Pursuant to the written notice, the Company was required to deposit the repurchase price of $108.9 million with the Trustee as soon as practicable. As the Company had insufficient cash to repurchase all of the 2024 Debentures tendered for repurchase it could not fulfill its legal responsibility to repurchase the debt, which constituted an event of default under both the Indenture and the $30.0 million financing with Whitebox. Accordingly, management of the Company completed a series of transactions with its Lenders to restructure the 2024 Debentures and Senior Secured Debt (See Note 14—Subsequent Events).
Other long-term debt at September 30, 2009 and 2008 consists of the following (in thousands):
| | | | | | | |
| | September 30, | |
|---|
| | 2009 | | 2008 | |
|---|
Whitebox VSC, LTD., net of discount of $0.4 and $0.6 million at September 30, 2009 and 2008, respectively | | $ | 24,610 | | $ | 29,423 | |
Capital lease liabilities | | | 42 | | | — | |
| | | | | | |
Total long-term debt | | $ | 24,652 | | $ | 29,423 | |
| | | | | | |
Years ended September 30, | | | | | | | |
2010 | | | | | $ | — | |
2011 | | | | | | 11 | |
2012 | | | | | | 24,621 | |
2013 | | | | | | 12 | |
2014 | | | | | | 8 | |
Thereafter | | | | | | 86,700 | |
| | | | | | | |
| | | | | $ | 111,352 | |
| | | | | | | |
As of September 30, 2009, other long-term debt consisted of a $30.0 million loan with Whitebox VSC, Ltd. (Whitebox), net of $0.4 million of unamortized debt discount. On October 29, 2007, we completed a $30.0 million financing with Whitebox, net of $0.8 million of debt discount. The loan has a four-year term. Unamortized debt discount as of September 30, 2009 and 2008 was approximately $0.4 million and $0.6 million, respectively. In connection with securing the debt, the Company paid approximately $2.3 million in fees that are recorded as debt issuance costs in Other Assets on the accompanying balance sheets. These fees are being amortized as interest expense over the term of the loan. Unamortized debt issuance costs as of September 30, 2009 and 2008 were approximately $1.2 million and $1.8 million, respectively. The annual interest rate on the unpaid principal is the greater of 8.5% or LIBOR plus 4% during the interest period ending on the interest date. The loan is secured by substantially all of our assets. The Company and Whitebox also entered into a Senior Unsecured Convertible Note Purchase Agreement that gives Whitebox the right, until the third anniversary of the initial funding, to purchase convertible notes in an aggregate principal amount of up to $30.0 million, which we would use to repay amounts outstanding under the loan. These convertible notes, if issued, would be convertible into the common stock of Vitesse at a conversion price of $2.00 per share, subject to adjustment. The Senior Unsecured convertible Note Purchase Agreement is not an embedded derivative as described in ASC 815 and had no accounting impact on the financial statements. At September 30, 2009 and 2008, the effective interest rate on the loan was 10.6128% and
Table of Contents
NOTES TO CONSOLIDATED FINANCIAL STATEMENTS (Continued)
NOTE 6—DEBT (Continued)
11.082%, respectively. For the fiscal years ended September 30, 2009 and 2008, interest expense was $2.6 million and $2.4 million, respectively. The agreement contains various restrictive covenants. As of September 30, 2009, we were in compliance with the terms of the covenants. According to the terms of the Whitebox Agreement, under certain circumstances, repayment of the 2024 Debentures would require that the Company to immediately pay to Whitebox the lesser of (A) the aggregate principal amount of the outstanding Whitebox debt, including accrued and unpaid interest and (B) 25% of the aggregate amount of the 2024 Debentures redeemed. The Company was pursuing alternatives to refinance or raise funds to pay the convertible subordinated debt that, in management's judgment, met the terms in the Whitebox debt agreement that did not require payment of the Whitebox debt simultaneously with the payment of the convertible subordinated debt.
Effective October 16, 2009, the Company entered into a Debt Conversion Agreement (the "Conversion Agreement") with the beneficial owners of more than 96.7% of the 2024 Debentures (the "Noteholders") whereby the Noteholders agreed to exchange their 2024 Debentures for a combination of cash, shares of common stock, $50.0 million in debentures under a new indenture agreement (the "New Notes") and, in some cases, shares of Series B Preferred Stock. The Conversion Agreement was consummated on October 30, 2009 (the "Closing Date").(See Note 14—Subsequent Events).
The terms of the Whitebox note were amended to include a non-refundable prepayment fee equal to 1.0% of the aggregate principal amount that is prepaid; an interest rate increase to 10.5% per annum in cash for the period from October 1, 2009 until October 16, 2009 and to 8.5% per annum in cash, plus 2.0% payment-in-kind interest ("PIK"), plus an additional 0.3% PIK interest for every $1.0 million above $15.0 million of the senior term loan that is not paid down by the Company for the period from October 17, 2009 until maturity or payment of the original note. Subsequent to the $5.0 million pay-down of the Whitebox note, the Company has the ability to reduce the rate of interest by 0.3% for every $1.0 million of additional prepayment. The maturity date of the note is still October 29, 2011.
The Company issued $50.0 million of New Notes pursuant to the Conversion Agreement in partial satisfaction of the 2024 Debentures. The New Notes bear cash interest at 8.0% per annum beginning on October 30, 2009 and payable semiannually in arrears on April 1 and October 1 of each year, commencing April 1, 2010 and maturing on October 30, 2014 unless earlier converted or repurchased. The New Notes are secured by second priority security interests on substantially all of the assets of the Company and its subsidiaries. This second priority security interest is subordinated to the lien existing under the Senior Secured Loan Agreement. The New Notes are convertible into shares of common stock at a conversion price of $0.225 per share (equivalent to an initial conversion rate of approximately 4,444 shares per $1,000 principal amount of New Notes). Full conversion of the $50.0 million in aggregate principal amount of the New Notes would result in the issuance of up to 222,191,111 shares of common stock.
The Company will initially record the New Notes at fair value. The difference between the fair value and the face value of the New Notes will be amortized as interest expense over the life of the New Notes, increasing the Company's effective rate of interest on the New Notes from the stated rate of 8% per annum. The effective rate of interest will vary, decreasing over the life of the New Notes as the excess of the face value over the fair value of the notes is amortized.
Prior to the closing of the debt transactions on October 30, 2009, as discussed above, during fiscal year 2009 the Company had classified its obligations related to the 2024 Debentures and the Whitebox
Table of Contents
NOTES TO CONSOLIDATED FINANCIAL STATEMENTS (Continued)
NOTE 6—DEBT (Continued)
debt in short-term liabilities based on the exercise date of October 1, 2009 of the premium put option related to the 2024 Debentures.
After the completion of such debt refinancing transactions, the Company has reclassified $111.3 million related to the portion of their obligations under the 2024 Debentures and the senior secured note which are refinanced on a long-term basis, from short-term liabilities to long-term liabilities on its Consolidated Balance Sheet as of September 30, 2009.
As of September 30, 2009, the Company classified as short-term liabilities the $5.0 million in cash paid to the Senior Lender of the senior secured loan; $10.0 million of cash used to pay $3.6 million to settle with the holders of the 2024 Debentures that are not parties to the Conversion Agreement and $6.4 million in partial repayment to the holders of the 2024 Debentures that are parties to the Conversion Agreement; and $12.2 million related to the fair value of the derivative liability arising from the premium put obligation on the 2024 Debentures. This reclassification is in accordance with ASC 470.
NOTE 7—FAIR VALUE MEASUREMENTS
In September 2006, FASB issued FASB ASC 820 Fair Value Measurements and Disclosures ("ASC 820"); originally issued as Statement of Financial Accounting Standards No. 157,"Fair Value Measurements." ASC 820 applies to other accounting pronouncements that require or permit fair value measurements and does not require any new fair value measurements.
Effective June 30, 2009, the Company adopted the provisions of ASC 820 for financial assets and liabilities, as well as for any other assets and liabilities that are carried at fair value on a recurring basis. The adoption of this statement did not have an impact on our results of operation, financial position or cash flow, but required additional disclsoures.
ASC 820 defines fair value as the exchange price that would be received for an asset or paid to transfer a liability (an exit price) in the principal or most advantageous market for the asset or liability in an orderly transaction between market participants on the measurement date. ASC 820 also establishes a fair value hierarchy, which requires an entity to maximize the use of observable inputs and minimize the use of unobservable inputs when measuring fair value. ASC 820 describes three levels of inputs that may be used to measure fair value:
| | |
Level 1 | | Quoted prices are available in active markets for identical assets or liabilities as of the reporting date. Active markets are those in which transactions for the asset or liability occur in sufficient frequency and volume to provide pricing information on an ongoing basis. Level 1 primarily consists of financial instruments such as exchange-traded derivatives, listed equities and U.S. government treasury securities. |
Table of Contents
NOTES TO CONSOLIDATED FINANCIAL STATEMENTS (Continued)
NOTE 7—5—FAIR VALUE MEASUREMENTS (Continued)
| | |
Level 2 |
|
Pricing inputs are other than quoted prices in active markets included in Level 1, which are either directly or indirectly observable as of the reporting date. Level 2 includes those financial instruments that are valued using models or other valuation methodologies. These models are primarily industry-standard models that consider various assumptions, including quoted forward prices for commodities, time value, volatility factors and current market and contractual prices for the underlying instruments, as well as other relevant economic measures. Substantially all of these assumptions are observable in the marketplace throughout the full term of the instrument, can be derived from observable data or are supported by observable levels at which transactions are executed in the marketplace. Instruments in this category include non-exchange-traded derivatives such as over-the-counter forwards, options and repurchase agreements. |
Level 3 |
|
Pricing inputs include significant inputs that are generally less observable from objective sources. These inputs may be used with internally developed methodologies that result in management's best estimate of fair value from the perspective of a market participant. Level 3 instruments include those that may be more structured or otherwise tailored to customers' needs. At each balance sheet date, the Company performs an analysis of all instruments subject to ASC 820 and includes in Level 3 all of those whose fair value is based on significant unobservable input. |
Financial instrument's level within the fair value hierarchy is based on the lowest level of any input that is significant to the fair value measurement.
Assets and liabilities measured at fair value on a recurring basis include the following at September 30, 2009 (in thousands):
| | | | | | | | | | | | | |
| | Fair Value
Measurements Using | |
| |
|---|
| | Level 1 | | Level 2 | | Level 3 | | Total | |
|---|
Derivative liability—premium put | | $ | — | | $ | — | | $ | 12,209 | | $ | 12,209 | |
| | | | | | | | | | |
The derivative liability—premium put liability, which is included within other current liabilities, represents the value associated with the right of the holders of the 2024 Debentures to require the Company to repurchase the debentures for 113.76% of the principal amount of the 2024 Debentures on October 1, 2009. There is no current observable market for this type of derivative and, as such, we determined the value of the embedded derivative using a scenario analysis that incorporated the investment and settlement alternatives available to the debt holders in connection with the premium put feature. The scenario analysis valuation model combined expected cash outflows with market-based assumptions and an estimate of the probability of each scenario occurring. The fair value of the 2024 Debentures without the embedded premium put feature was estimated using a convertible bond valuation model within a lattice framework. The convertible bond valuation model combined expected cash outflows with market-based assumptions regarding risk-adjusted yields, stock price volatility and recent price quotes and trading information regarding shares of ourthe Company's common stock into which the 20242014 Debentures are convertible.
Table The Company will mark the embedded derivative to market due to the conversion price not being indexed to the Company's own stock. The change in the fair value of Contents
NOTES TO CONSOLIDATED FINANCIAL STATEMENTS (Continued)
NOTE 7—FAIR VALUE MEASUREMENTS (Continued)the bifurcated compound embedded derivative is primarily related to the change in price of the underlying common stock. At the Company's option it can settle the embedded derivative in either cash or common shares. As of September 30, 2010, the Company has enough common shares to settle the entire obligation in shares. The Company intends to settle this obligation in common shares. As the Company intends to, and has the ability to, satisfy the obligations with equity securities, in accordance with ASC 470, the Company has classified the liability as a long-term liability on its Consolidated Balance Sheet as of September 30, 2010. The change in fair value of the compound embedded derivative liability is recorded in the Consolidated Statement of Operations.
The valuation methodologies used by the Company as described above may produce a fair value calculation that may not be indicative of net realizable value or reflective of future fair values. Furthermore, although management believes its valuation methods are appropriate and consistent with other market participants, the use of different methodologies or assumptions to determine the fair value of certain financial instruments could result in a different fair value measurement at the reporting date.
The following table provides a reconciliation of the beginning and ending balances for the derivative liability—premium put measured at fair value using significant unobservable inputs (Level 3) (in thousands):
| | | | | |
| | Derivative liability—
premium put | |
|---|
Balance at October 1, 2008 | | $ | — | |
| | Total unrealized losses included in earnings | | | 12,209 | |
| | | | |
Balance at September 30, 2009 | | $ | 12,209 | |
| | | | |
NOTE 8—SHAREHOLDERS'6—STOCKHOLDERS' EQUITY
Preferred Stock
The Company is authorized to issue up to 10,000,000 shares of non-voting convertible preferred stock, with a par value of $0.01 per share and none were outstanding as of September 30, 2009 and 2008.
Common Stock
The Company is authorized to issue up to 500,000,000 shares of common stock, with a par value of $0.01 per share, of which 230,905,580800,000 shares and 226,205,580have been designated as Series B Participating Non-Cumulative Convertible Preferred Stock, par value of $0.01 per share ("Series B Preferred Stock"). As of September 30, 2010, 185,709 shares of Series B Preferred Stock that are convertible into common stock on a five-to-one basis were outstanding. No preferred shares were outstanding as of September 30, 2009 and 2008, respectively.2009.
During the year ended September 30, 2010, 585,077 preferred shares issued in connection with the 2014 Debentures, were converted to 2,925,386 shares of common stock. The conversion rate for the shares of Series B Preferred Stock was adjusted to five-to-one from 100-to-one as a result of the June 30, 2010 one-for-20 reverse stock split.
Common Stock Option Plans
TheAs of September 30, 2010 and 2009 the Company haswas authorized to issue up to 250,000,000 and 25,000,000 shares of common stock, par value of $0.01 per share, and preferred stock, par value of $0.01 per share, respectively. On October 30, 2009, in effect several share-based plans under which non-qualifiedconnection with its debt restructuring, the Company issued 8,646,811 shares of common stock. As of September 30, 2010 and incentive2009, 23,986,531 and 11,544,803 shares of common stock options have been granted to employees, consultants, and outside directors. Options generally vest over four years and have contractual lives of 10 years.were outstanding, respectively.
On January 23, 2001,7, 2010, the Company's shareholdersstockholders approved the adoption of the 2001 Stock Incentive Plan ("2001 Plan"), which replaced the 1991 Plan that expired in August 2001 and the 1991 Directors' Stock Option Plan that expired in January 2002. The 2001 Plan provides for the grant to employees of incentive stock options within the meaning of Section 422 of the Internal Revenue Code of 1986, as amended, and for the grant to employees, consultants, and directors of non-qualified stock options for certain share-based awards as determined by the Board of Directors or the Compensation Committee of the Board of Directors.
Prior to the September 2008an amendment to the 2001 Plan, the numberCompany's Amended and Restated Certificate of shares reserved for issuance automatically increased byIncorporation to effect a number of shares equal to the lesser of: (i) 4%reverse stock split of the Company's common stock outstanding at a reverse split ratio between one-for-20 and one-for-50, to be selected by the endBoard. On May 17, 2010, the Board approved a one-for-20 reverse stock split of each fiscal year and (ii) 17.5 million shares. Under all stock option plans, a total of 82,065,918 shares ofits common stock, effective on June 30, 2010. All share and per share amounts have been reserved for issuance andretroactively adjusted to reflect the reverse stock split. There was no net effect on total stockholders' deficit as a result of the reverse stock split.
Table of Contents
NOTES TO CONSOLIDATED FINANCIAL STATEMENTS (Continued)
NOTE 8—SHAREHOLDERS'6—STOCKHOLDERS' EQUITY (Continued)
52,781,231The Company did not issue fractional shares remainedin connection with the reverse stock split and stockholders otherwise entitled to receive fractional shares received cash in lieu of fractional shares.
Stock Option Plans
Under all stock option plans, a total of 5,154,905 shares of common stock have been reserved for issuance and 2,691,759 shares remain available for future grant as of September 30, 2009. In the future, any increase to the number of shares reserved for issuance under the 2001 Plan may only be achieved through amendment of the 2001 Plan. If the company is listed on a national securities exchange, such amendment may require stockholder approval.
2010. The following table summarizes compensation costs related to the Company's share-based compensation plans for the years ended September 30:(in thousands):
|
| | September 30, | | | September 30, | |
|---|
| | 2009 | | 2008 | | 2007 | | | 2010 | | 2009 | | 2008 | |
|---|
Cost of revenues | | $ | 689 | | $ | 801 | | $ | 1,287 | | | $ | 387 | | $ | 689 | | $ | 801 | |
Engineering, research and development | | 940 | | 1,322 | | 2,402 | | | 766 | | 940 | | 1,322 | |
Selling, general and administrative | | 1,504 | | 2,057 | | 1,805 | | | 1,083 | | 1,504 | | 2,057 | |
| | | | | | | | | | | | | | | |
Share-based compensation expense related to continuing operations | | 3,133 | | 4,180 | | 5,494 | | | 2,236 | | 3,133 | | 4,180 | |
Share-based compensation expense related to discontinued operations | | — | | (284 | ) | | 1,331 | | | — | | — | | (284 | ) |
| | | | | | | | | | | | | | | |
Total share-based compensation expense | | $ | 3,133 | | $ | 3,896 | | $ | 6,825 | | | $ | 2,236 | | $ | 3,133 | | $ | 3,896 | |
| | | | | | | | | | | | | | | |
In addition to the share-basedshare based compensation expense related to the Company's plans, wethe Company recorded $5,000 of share-basedshare based compensation expense in fiscal year 2008 related to the employee stock appreciation rights and $176,000 of share-based compensation expense in fiscal 2007 related to warrants issued to Alvarez and Marsal to purchase 150,000 shares of common stock.during the year. These rights were cancelled in the first quarter of fiscal year 2009, resulting in a credit to share-basedshare based compensation of $5,000. Pursuant to ASC 718, stock appreciation rights and stock warrants are considered liability awards and as such, these amounts were accrued in the liability section of the balance sheet.
Table of Contents
NOTES TO CONSOLIDATED FINANCIAL STATEMENTS (Continued)
NOTE 6—STOCKHOLDERS' EQUITY (Continued)
Activity under all stock option plans for the three years ended September 30, 2010 was as follows:
| | | | | | | | | | | | | |
| | Shares | | Weighted
average
exercise
price | | Weighted
average
remaining
contractual
life (in
years) | | Aggregate
intrinsic
value | |
|---|
Options outstanding, September 30, 2007 | | | 1,193,574 | | $ | 146.19 | | | 4.07 | | $ | 363,854 | |
| | | | | | | | | | | | | |
Granted | | | 17,500 | | $ | 19.03 | | | | | | | |
Exercised | | | — | | | | | | | | | | |
Cancelled or expired | | | (297,933 | ) | $ | 156.88 | | | | | | | |
| | | | | | | | | | | | | |
Options outstanding, September 30, 2008 | | | 913,141 | | $ | 140.27 | | | 4.34 | | $ | 209 | |
| | | | | | | | | | | | | |
Granted | | | 235,724 | | $ | 7.42 | | | | | | | |
Exercised | | | — | | | | | | | | | | |
Cancelled or expired | | | (87,049 | ) | $ | 158.00 | | | | | | | |
| | | | | | | | | | | | | |
Options outstanding, September 30, 2009 | | | 1,061,816 | | $ | 109.32 | | | 4.61 | | $ | 2,000 | |
| | | | | | | | | | | | | |
Granted | | | 574,699 | | $ | 5.12 | | | | | | | |
Exercised | | | — | | | | | | | | | | |
Cancelled or expired | | | (146,151 | ) | $ | 280.06 | | | | | | | |
| | | | | | | | | | | | | |
Options outstanding, September 30, 2010 | | | 1,490,364 | | $ | 52.40 | | | 6.16 | | $ | — | |
| | | | | | | | | | | | | |
Options exercisable, September 30, 2010 | | | 816,518 | | $ | 90.89 | | | 3.72 | | $ | — | |
The aggregate intrinsic values in the preceding table for the options outstanding represent the total pretax intrinsic value, based on the Company's closing stock prices of $3.61, $7.40, and $10.80, as of September 30, 2010, 2009, and 2008, respectively, which would have been received by the option holders had those option holders exercised their in-the-money options as of those dates. There were no in-the-money stock options that were exercisable as of September 30, 2010. As of September 30, 2010, 816,518 outstanding stock options were exercisable and the weighted average exercise price of those options was $90.89. As of September 30, 2010, there was $5.3 million of unrecognized share-based compensation expense related to non-vested stock options. The weighted average period over which the unearned share-based compensation is expected to be recognized is approximately 2.9 years. An estimated forfeiture rate of 5.57% has been applied to all unvested options and restricted stock outstanding as of September 30, 2010. Future share-based compensation expense and unearned share-based compensation will increase to the extent that the Company grants additional equity awards. The weighted average fair value at the date of grant of options granted in fiscal years 2010, 2009 and 2008 was $3.80, $4.58, and $10.80, respectively.
The fair value of share-based awards is estimated at the date of grant using the Black-Scholes option valuation model. Expected volatility is based on the historical volatilitiesvolatility of the Company's common stock. The risk-free interest rate is based on the U.S. Treasury constant maturity rate for the expected life of the stock option. The expected life of a stock award is the period of time that the award is expected to be outstanding. Expected lives were estimated based upon historical exercise data.in accordance with SEC Staff Accounting Bulletin No. 107 ("SAB 107"). The Company has never paid cash dividends and intends to retain any future earnings for business development. The per share fair values of stock options granted
Table of Contents
NOTES TO CONSOLIDATED FINANCIAL STATEMENTS (Continued)
NOTE 6—STOCKHOLDERS' EQUITY (Continued)
in connection with stock incentive plans have been estimated using the following weighted average assumptions:
|
|
| | Employee Stock Option Plans | |
| | Employee Stock Option Plans | |
|---|
|
| | 2009 | | 2008 | | 2007 | |
| | 2010 | | 2009 | | 2008 | |
|---|
Expected life (in years) | Expected life (in years) | | 5.86 | | 4.68 | | 4.68 | | Expected life (in years) | | 6.22 | | 5.86 | | 4.68 | |
Expected volatility: | Expected volatility: | | Expected volatility: | |
| | Weighted-average | | 66.7 | % | | 66.0 | % | | 81.1 | % | Weighted-average | | 86.4 | % | | 66.7 | % | | 66.0 | % |
| | Range | | 65% - 85.1 | % | | 65.2% - 66.4 | % | | 69.6% - 85.4 | % | Range | | 86.2% - 89.1 | % | | 65.0% - 85.1 | % | | 65.2% - 66.4 | % |
Expected dividend | Expected dividend | | — | | — | | — | | Expected dividend | | — | | — | | — | |
Risk-free interest rate | Risk-free interest rate | | 1.8% - 3.2 | % | | 2.3% - 4.2 | | 4.6% - 4.9 | % | Risk-free interest rate | | 1.8% - 2.8 | % | | 1.8% - 3.2 | % | | 2.3% - 4.2 | |
Weighted-average estimated value | Weighted-average estimated value | | $ | 0.23 | | $ | 0.54 | | $ | 0.59 | | Weighted-average estimated value | | $ | 3.80 | | $ | 4.58 | | $ | 10.80 | |
Table of Contents
NOTES TO CONSOLIDATED FINANCIAL STATEMENTS (Continued)
NOTE 8—SHAREHOLDERS' EQUITY (Continued)
The Company's determination of the fair value of share-based payment awards is affected by assumptions regarding a number of highly complex and subjective variables. These variables include, but are not limited to;to: the Company's expected stock price volatility over the term of the awards, and actual and projected employee stock option exercise behaviors. The fair value of employee stock options is determined in accordance with ASC 718 and SEC Staff Accounting Bulletin No.SAB 107, ("SAB 107"), as amended by SAB No. 110, which provides supplemental application guidance based on the views of the SEC, using an option-pricing model, however, that value may not be indicative of the fair value observed in a willing buyer/willing seller market transaction, or actually realized by the employee upon exercise.
Activity under all stock option plansThe following table provides additional information in 2009, 2008 and 2007 are set forth below:regards to options outstanding as of September 30, 2010:
| | | | | | | | | | | | | |
| | Shares | | Weighted
average
exercise price | | Weighted
average
remaining
contractual life
(in years) | | Aggregate
intrinsic value | |
|---|
Options outstanding, September 30, 2006 | | | 35,294,699 | | $ | 8.08 | | | 6.18 | | $ | 644,446 | |
Granted(1) | | | 450,000 | | $ | 0.95 | | | | | | | |
Exercised(2) | | | — | | | | | | | | | | |
Cancelled or expired | | | (11,862,338 | ) | $ | 9.75 | | | | | | | |
| | | | | | | | | | | | | |
Options outstanding, September 30, 2007 | | | 23,882,361 | | $ | 7.11 | | | 5.61 | | $ | 363,933 | |
| | | | | | | | | | | | | |
Granted(1) | | | 350,000 | | $ | 0.95 | | | | | | | |
Exercised(2) | | | — | | | | | | | | | | |
Cancelled or expired | | | (5,958,729 | ) | $ | 7.84 | | | | | | | |
| | | | | | | | | | | | | |
Options outstanding, September 30, 2008 | | | 18,273,632 | | $ | 7.02 | | | 4.86 | | $ | 212 | |
| | | | | | | | | | | | | |
Granted | | | 4,718,130 | | $ | 0.37 | | | | | | | |
Exercised(2) | | | — | | | | | | | | | | |
Cancelled or expired | | | (1,742,079 | ) | $ | 7.90 | | | | | | | |
| | | | | | | | | | | | | |
Options outstanding, September 30, 2009 | | | 21,249,683 | | $ | 5.47 | | | 5.12 | | $ | 2,000 | |
| | | | | | | | | | | | | |
Options exercisable, September 30, 2009 | | | 15,107,749 | | $ | 7.27 | | | 3.84 | | $ | — | |
| | | | | | | | | | | | | | | | | | |
Range of Exercise Prices | | Options
Outstanding | | Weighted
Average
Remaining
Contractual
Life (Years) | | Weighted
Average
Exercise
Price | | Options
Exercisable | | Weighted
Average
Exercise
Price | |
|---|
| $ 3.83 - $ 5.00 | | | | | 47,850 | | | 9.57 | | $ | 4.10 | | | — | | $ | — | |
| 5.20 - 5.20 | | | | | 515,463 | | | 9.33 | | | 5.20 | | | — | | | — | |
| 7.20 - 47.80 | | | | | 372,711 | | | 6.08 | | | 14.28 | | | 262,519 | | | 16.71 | |
| 48.00 - 1,416.25 | | | | | 554,340 | | | 2.97 | | | 126.09 | | | 553,999 | | | 126.04 | |
| | | | | | | | | | | | | | |
| $ 3.83 - $1,416.25 | | | | | 1,490,364 | | | 6.16 | | $ | 52.40 | | | 816,518 | | $ | 90.89 | |
(1)The grants reported in 2007 and 2008 were to newly elected or hired Board members or executives only.
(2)No options were exercised during the periods covered by this report.
The aggregate intrinsic values in the preceding table for the options outstanding represent the total pretax intrinsic value, based on the Company's closing stock prices of $0.37, $0.54, and $0.96, as of September 30, 2009, 2008, and 2007, respectively, which would have been received by the option holders had those option holders exercised their in-the-money options as of those dates. There were no in-the-money stock options that were exercisable as of September 30, 2009. As of September 30, 2009, 15,107,749 outstanding stock options were exercisable and the weighted-average exercise price of those options was $7.27. As of September 30, 2009, there was $3.4 million of unrecognized share-based compensation expense related to non-vested stock options. The weighted-average period over which the unearned share-based compensation is expected to be recognized is approximately 0.7 years. An estimated forfeiture rate of 5.96% has been applied to all unvested options and restricted stock
Table of Contents
NOTES TO CONSOLIDATED FINANCIAL STATEMENTS (Continued)
NOTE 8—SHAREHOLDERS'6—STOCKHOLDERS' EQUITY (Continued)
outstanding as of September 30, 2009. Future share-based compensation expense and unearned share-based compensation will increase to the extent that we grant additional equity awards. The weighted average fair value at the date of grant of options granted in 2009, 2008 and 2007 was $0.23, $0.54, and $0.59, respectively.
The following table provides additional information in regards to options outstanding as of September 30, 2009:
| | | | | | | | | | | | | | | | | | |
Range of Exercise Prices | | Options
Outstanding | | Weighted
Average
Remaining
Contractual
Life (Years) | | Weighted
Average
Exercise Price | | Options
Exercisable | | Weighted
Average
Exercise Price | |
|---|
| $ 0.36 - $ 0.83 | | | | | 6,441,718 | | | 7.29 | | $ | 0.51 | | | 1,924,594 | | $ | 0.82 | |
| 0.86 - 3.18 | | | | | 8,055,464 | | | 5.78 | | | 2.53 | | | 6,513,899 | | | 2.62 | |
| 3.19 - 17.44 | | | | | 5,501,485 | | | 2.65 | | | 8.99 | | | 5,481,340 | | | 8.98 | |
| 18.85 - 78.75 | | | | | 1,251,016 | | | 0.58 | | | 34.41 | | | 1,187,916 | | | 35.24 | |
| | | | | | | | | | | | | | |
| $ 0.36 - $78.75 | | | | | 21,249,683 | | | 5.12 | | $ | 5.47 | | | 15,107,749 | | $ | 7.27 | |
Restricted Stock Units
In September 2008, the Company also amended its 2001 Plan to clarify procedures for the issuance of Restricted Stock Units ("RSUs"). The first grant of RSUs following the amendment occurred on October 13, 2008. The grants vest over a three year period with 50% vesting one year plus one day from the date of grant and 25% vesting on the second and third anniversaries of the date of grant, so long as the Vitesse common stock is listed on the NASDAQ Stock Market or such other national securities exchange as described in Section 18 of the Securities Act or in Rule 146 promulgated thereunder.
On January 16, 2009, the Company issued RSUs in connection with the tender offer discussed below. These grants vest one year plus one day from the date of grant.
A summary of RSUrestricted stock unit activity for the year ended September 30, 20092010 is as follows:
| | | | | | | |
| | Shares | | Weighted
Average Grant-
Date Fair Value
per Share | |
|---|
Restricted stock outstanding, September 30, 2008 | | | — | | $ | — | |
Awarded | | | 3,609,233 | | | 0.35 | |
Vested | | | — | | | | |
Forfeited | | | (165,980 | ) | | 0.36 | |
| | | | | | | |
Restricted stock outstanding, September 30, 2009 | | | 3,443,253 | | $ | 0.35 | |
| | | | | | | |
| | | | | | | |
| | Shares | | Weighted
Average Grant-
Date Fair
Value per
Share | |
|---|
Restricted stock units outstanding, September 30, 2009 | | | 171,907 | | $ | 7.05 | |
Awarded | | | 618,241 | | | 5.37 | |
Released | | | — | | | | |
Forfeited | | | (19,362 | ) | | 6.24 | |
| | | | | | | |
Restricted stock units outstanding, September 30, 2010 | | | 770,786 | | $ | 5.72 | |
| | | | | | | |
Tender Offer
On December 1, 2008, Vitesse commenced a tender offer on Schedule TO (the "Offer") to amend Eligible Options (as defined below) that had been granted under the 1991 Plan and the 2001 Plan
Table of Contents
NOTES TO CONSOLIDATED FINANCIAL STATEMENTS (Continued)
NOTE 8—SHAREHOLDERS' EQUITY (Continued)
(together, the "Plans"). An option to purchase Vitesse common stock was eligible for the Offer (an "Eligible Option") only if each of the following conditions was met:
•The option was granted under the Plans;
•The option had an original exercise price per share that was less than the fair market value per share of the common stock underlying the option on the date the grant was actually finalized;
•The option was not vested as of December 31, 2004 (if only a portion of an option was not vested as of December 31, 2004, the unvested portion of the option may be an "eligible option"); and
•The option was outstanding as of December 30, 2008.
Vitesse undertook the Offer solely to avert the severe and, in Vitesse's view, unintended tax consequences to its option holders imposed by Section 409A of the Internal Revenue Code of 1986 and similar state laws on some of its current employee stock option holders. Vitesse determined that certain stock options were erroneously assigned grant dates other than the actual date of finalization of those grants. As a result, the exercise prices of those stock options were lower than they would have been if the options had been dated when the grants were actually finalized. Therefore, those options may have subjected option holders to adverse tax consequences under Section 409A of the Internal Revenue Code of 1986 if the fair market value of the shares were to exceed the exercise price for such shares at the end of any calendar year in which the option would have been exercisable or at the time of exercise.
These tax consequences include ordinary income tax on the spread between the exercise price and the value of the underlying shares (even if the option was not exercised), an additional 20% federal tax, and potential interest charges. In addition, some states, including California, impose an additional 20% state tax. In order to avoid these significant adverse tax consequences, Vitesse completed the Offer on December 31, 2008.
The Offer was accepted by all current employee holders of Eligible Options.
In connection with the Offer, the Company amended the Eligible Options and granted restricted stock to all holders of the Eligible Options. In accordance with ASC 718, the Offer constituted a modification of the tendered options in combination with an inducement to accept the modification in the form of a grant of RSUs. The Company recorded compensation expense as a result of the modification of the options and the grant of the inducement award equal to the change in the fair value of the original options immediately before the modification and that fair value of the modified options combined the inducement award immediately after the modification. Option fair values were determined using the Black-Scholes valuation model and the fair value of the restricted stock was equal to the market price of the Company's stock on the date of modification.
The amount of compensation cost related to the modified options and restricted stock that is recognized through the end of each reporting period is equal to the incremental fair value of the portion of the aggregate awards that have vested, or for partially vested awards, value of the portion of the awards that is ultimately expected to vest, for which the requisite services have been provided.
Table of Contents
NOTES TO CONSOLIDATED FINANCIAL STATEMENTS (Continued)
NOTE 9—7—INCOME TAXES
The components of (loss) income from continuing operations before provision for income taxes for the years ended September 30, 2010, 2009 2008 and 20072008 were as follows (amounts in thousands):
| | | | | | | | | | | |
| | September 30, | |
|---|
| | 2009 | | 2008 | | 2007 | |
|---|
(Loss) income before income taxes: | | | | | | | | | | |
| | Domestic | | $ | (183,571 | ) | $ | 38,860 | | $ | 20,991 | |
| | Foreign | | | (11,921 | ) | | (30,128 | ) | | (25,592 | ) |
| | | | | | | | |
| | $ | (195,492 | ) | $ | 8,732 | | $ | (4,601 | ) |
| | | | | | | | |
| | | | | | | | | | | |
| | September 30, | |
|---|
| | 2010 | | 2009 | | 2008 | |
|---|
(Loss) income before income taxes: | | | | | | | | | | |
| | Domestic | | $ | (15,141 | ) | $ | (183,642 | ) | $ | 38,860 | |
| | Foreign | | | (3,514 | ) | | (11,921 | ) | | (30,128 | ) |
| | | | | | | | |
| | $ | (18,655 | ) | $ | (195,563 | ) | $ | 8,732 | |
| | | | | | | | |
Income tax (benefit) expense consists of the following for the years ended September 30, 2009, 2008 and 2007 (in thousands):
| | | | | | | | | | | | |
| | September 30, | |
|---|
| | 2009 | | 2008 | | 2007 | |
|---|
Income tax (benefit) expense: | | | | | | | | | | |
| | Current: | | | | | | | | | | |
| | | Federal | | $ | (1,675 | ) | $ | 849 | | $ | — | |
| | | State | | | (103 | ) | | 239 | | | — | |
| | | Foreign | | | 327 | | | 134 | | | 224 | |
| | | | | | | | |
| | | Total Current | | $ | (1,451 | ) | $ | 1,222 | | $ | 224 | |
| | | | | | | | |
| | Deferred: | | | | | | | | | | |
| | | Federal | | $ | — | | $ | — | | $ | — | |
| | | State | | | — | | | — | | | — | |
| | | Foreign | | | — | | | — | | | — | |
| | | | | | | | |
| | | Total Current | | $ | — | | $ | — | | $ | — | |
| | | | | | | | |
| | Total: | | | | | | | | | | |
| | | Federal | | $ | (1,675 | ) | $ | 849 | | $ | — | |
| | | State | | | (103 | ) | | 239 | | | — | |
| | | Foreign | | | 327 | | | 134 | | | 224 | |
| | | | | | | | |
| | | Total Current | | $ | (1,451 | ) | $ | 1,222 | | $ | 224 | |
| | | | | | | | |
Income tax (benefit) expense amounted to $(1.4) million, $1.2 million, and $0.2 million for the years ended September 30, 2009, 2008 and 2007, respectively. A reconciliation of the (benefit) provision
Table of Contents
NOTES TO CONSOLIDATED FINANCIAL STATEMENTS (Continued)
NOTE 9—7—INCOME TAXES (Continued)
Income tax expense (benefit) consists of the following for the years ended September 30, 2010, 2009 and 2008 (in thousands):
| | | | | | | | | | | | |
| | September 30, | |
|---|
| | 2010 | | 2009 | | 2008 | |
|---|
Income tax expense (benefit): | | | | | | | | | | |
| | Current: | | | | | | | | | | |
| | | Federal | | $ | 843 | | $ | (1,675 | ) | $ | 849 | |
| | | State | | | 452 | | | (103 | ) | | 239 | |
| | | Foreign | | | 226 | | | 327 | | | 134 | |
| | | | | | | | |
| | | Total Current | | $ | 1,521 | | $ | (1,451 | ) | $ | 1,222 | |
| | | | | | | | |
| | Deferred: | | | | | | | | | | |
| | | Federal | | $ | — | | $ | — | | $ | — | |
| | | State | | | — | | | — | | | — | |
| | | Foreign | | | — | | | — | | | — | |
| | | | | | | | |
| | | Total Deferred | | $ | — | | $ | — | | $ | — | |
| | | | | | | | |
| | Total: | | | | | | | | | | |
| | | Federal | | $ | 843 | | $ | (1,675 | ) | $ | 849 | |
| | | State | | | 452 | | | (103 | ) | | 239 | |
| | | Foreign | | | 226 | | | 327 | | | 134 | |
| | | | | | | | |
| | | Total Deferred | | $ | 1,521 | | $ | (1,451 | ) | $ | 1,222 | |
| | | | | | | | |
Income tax expense (benefit) amounted to $1.5 million, $(1.5) million and $1.2 million for the years ended September 30, 2010, 2009 and 2008, respectively. A reconciliation of the provision (benefit) for income tax expense by applying the statutory U.S. federal income tax rate to income is as follows (in thousands):
|
|
| | September 30, | |
| | September 30, | |
|---|
|
| | 2009 | | 2008 | | 2007 | |
| | 2010 | | 2009 | | 2008 | |
|---|
Federal income tax (benefit) provision at statutory rate | Federal income tax (benefit) provision at statutory rate | | $ | (68,422 | ) | $ | 2,581 | | $ | (1,610 | ) | Federal income tax (benefit) provision at statutory rate | | $ | (6,343 | ) | $ | (68,422 | ) | $ | 2,581 | |
State tax provision, net of federal benefit | State tax provision, net of federal benefit | | 362 | | 239 | | 171 | | State tax provision, net of federal benefit | | (476 | ) | | 362 | | 239 | |
Foreign taxes | Foreign taxes | | 327 | | 134 | | 191 | | Foreign taxes | | 226 | | 327 | | 134 | |
Goodwill impairment | Goodwill impairment | | 65,792 | | — | | — | | Goodwill impairment | | — | | 65,792 | | — | |
Nondeductible expenses | Nondeductible expenses | | 714 | | 30 | | 240 | | Nondeductible expenses | | 194 | | 714 | | 30 | |
Other | | Other | | 366 | | — | | — | |
Change in valuation allowance | Change in valuation allowance | | (224 | ) | | (1,762 | ) | | 1,232 | | Change in valuation allowance | | 328,862 | | (224 | ) | | (1,762 | ) |
Rate change/other adjustments on deferred taxes | | Rate change/other adjustments on deferred taxes | | (321,308 | ) | | — | | — | |
| | | | | | | | | | | | | | | | | |
| | Income tax (benefit) provision | | $ | (1,451 | ) | $ | 1,222 | | $ | 224 | | Income tax expense (benefit) | | $ | 1,521 | | $ | (1,451 | ) | $ | 1,222 | |
| | | | | | | | | | | | | | | | | |
Table of Contents
NOTES TO CONSOLIDATED FINANCIAL STATEMENTS (Continued)
NOTE 7—INCOME TAXES (Continued)
Deferred tax assets and liabilities are recognized for future tax consequences between the carrying amounts of assets and liabilities and their respective tax bases using enacted tax rates in effect for the year in which the differences are expected to reverse. Significant deferred tax assets and liabilities consist of the following (in thousands):
| | | | | | | | | | | | |
| | September 30, | |
|---|
| | 2009 | | 2008 | | 2007 | |
|---|
Deferred tax assets: | | | | | | | | | | |
| | Net operating loss carryforward | | $ | 301,106 | | $ | 283,226 | | $ | 319,321 | |
| | Research and development tax credits | | | 23,066 | | | 20,689 | | | 21,926 | |
| | Alternative Minimum Tax credit | | | 179 | | | 1,901 | | | — | |
| | Research and development IRC 59(e) capitalization | | | 11,640 | | | 14,721 | | | 18,061 | |
| | Stock options | | | 26,959 | | | 31,298 | | | 36,570 | |
| | Fixed assets and intangible property | | | 34,295 | | | 48,044 | | | 38,613 | |
| | Inventory | | | 4,979 | | | 9,214 | | | 9,610 | |
| | Allowances and reserves | | | 10,172 | | | 3,893 | | | 3,934 | |
| | State taxes | | | 959 | | | 566 | | | 501 | |
| | Other | | | 8,746 | | | 27,982 | | | 21,886 | |
| | | | | | | | |
| | | Total deferred tax assets | | | 422,101 | | | 441,534 | | | 470,422 | |
| | Valuation allowance | | | (422,101 | ) | | (441,534 | ) | | (470,422 | ) |
| | | | | | | | |
| | | Net deferred tax assets | | $ | — | | $ | — | | $ | — | |
| | | | | | | | |
Table of Contents
NOTES TO CONSOLIDATED FINANCIAL STATEMENTS (Continued)
NOTE 9—INCOME TAXES (Continued)
The following table details the amount and expiration of the federal net operating loss carryforwards included in the deferred tax asset (in thousands):
| | | | | | | | | | |
| | Gross
Amount | | Amount without
Limitation | | Year of expiration | |
|---|
Federal net operating loss carryforwards | | $ | 147,561 | | $ | 105,896 | | | 2020 - 2021 | |
| | | 337,040 | | | 206,258 | | | 2022 - 2023 | |
| | | 111,240 | | | 71,147 | | | 2024 - 2025 | |
| | | 50,981 | | | 50,981 | | | 2026 - 2028 | |
| | | 49,586 | | | 49,586 | | | 2029 | |
| | | | | | | | | |
Total federal net operating loss carryforwards | | $ | 696,408 | | $ | 483,868 | | | | |
| | | | | | | | | |
We have available federal research and development tax credit carryforwards of approximately $16.0 million, net of a FIN 48 allowance. The following table details the amount and expiration of the federal research and development tax credit carryforwards included in the deferred tax asset (in thousands):
| | | | | | | |
| | Amount | | Year of expiration | |
|---|
Federal research and development credit carryforwards | | $ | 1,086 | | | 2010 - 2012 | |
| | | 3,163 | | | 2013 - 2019 | |
| | | 7,415 | | | 2020 - 2021 | |
| | | 4,348 | | | 2022 - 2026 | |
| | | | | | | |
Total federal research and development credit carryforwards | | $ | 16,012 | | | | |
| | | | | | | |
| | | | | | | | | | | | |
| | September 30, | |
|---|
| | 2010 | | 2009 | | 2008 | |
|---|
Deferred tax assets: | | | | | | | | | | |
| | Net operating loss carryforward | | $ | 47,854 | | $ | 301,106 | | $ | 283,226 | |
| | Research and development tax credits | | | 6,564 | | | 23,066 | | | 20,689 | |
| | Alternative Minimum Tax credit | | | — | | | 179 | | | 1,901 | |
| | Research and development IRC 59(e) capitalization | | | — | | | 11,640 | | | 14,721 | |
| | Stock options | | | 12,602 | | | 26,959 | | | 31,298 | |
| | Fixed assets and intangible property | | | 7,400 | | | 34,295 | | | 48,044 | |
| | Inventory | | | 6,738 | | | 4,979 | | | 9,214 | |
| | Allowances and reserves | | | 9,974 | | | 10,172 | | | 3,893 | |
| | State taxes | | | (104 | ) | | 959 | | | 566 | |
| | Other | | | 2,211 | | | 8,746 | | | 27,982 | |
| | | | | | | | |
| | | Total deferred tax assets | | | 93,239 | | | 422,101 | | | 441,534 | |
| | Valuation allowance | | | (93,239 | ) | | (422,101 | ) | | (441,534 | ) |
| | | | | | | | |
| | | Net deferred tax assets | | $ | — | | $ | — | | $ | — | |
| | | | | | | | |
The provision for income taxes as a percentage of income from continuing operations before income taxes was 0.74%(8.13%) for the year ended September 30, 2009.2010. The Company's effective tax rate for fiscal 2009year 2010 is primarily impacted by the $191.4 million goodwill impairment recorded during the first quarter of 2009 and benefited from the utilization of Net Operating Loss ("NOL") carryforwards and the reversal of the related valuation reserve previously recorded. There was approximately $0.06 million tax expense related to discontinued operations for the year ended September 30, 2010 and no tax expense related to discontinued operations for the year ended September 30, 2009 and approximately $1.0 million for the year ended September 30, 2008.2009.
Because we have consistentlythe Company has historically experienced net tax losses, we havethe Company has placed a valuation allowance against ourits otherwise recognizable deferred tax assets. We haveThe Company has a net operating loss carry forwardNOL carryforward of approximately $696.0$56.4 million, $588.0$30.0 million, and $253.0$236.7 million for federal, state, and foreign income tax purposes at September 30, 2009,2010, respectively, which can be carried forward to offset future taxable income. We haveThe Company has available federal and state research and development tax credit carry forwards of approximately $16.0 million and $10.9 million, respectively and state alternative minimum tax credit carryforwards of approximately $0.1$9.9 million. OurThe federal net operating lossesNOLs may be carried forward through 2029; state net operating lossesNOLs may be carried forward through 2019;2029; foreign net operating lossesNOLs have various carry forwardcarryforward provisions in several jurisdictions; and some federal, state, and foreign net operating lossesNOLs may have begun to expire in 2006.
Deferred tax assets are primarily composed of federal and state tax net operating losses ("NOL")NOL carryforwards; timing differences relating to stock options; tangible and intangible assets recovery; and research and
Table of Contents
NOTES TO CONSOLIDATED FINANCIAL STATEMENTS (Continued)
NOTE 9—INCOME TAXES (Continued)
development credits. Due to uncertainties surrounding the Company's ability to generate future taxable income, there is a full valuation allowance against the deferred tax assets.
Additionally, there is potential that an ownership change can occur that would impair the usage of the NOL's and credits in future taxable periods. An ownership change occurs whenever there is a shift in ownership by more than fifty percentage points by one or more five-percent shareholders within a three year period. Based on our current analysis of shareholders we believe that an ownership change has not occurred as of September 30, 2009. Accordingly, we have not presented any amounts as an uncertain tax position under FIN 48. Any carryforwards that will expire prior to utilization will be removed from deferred tax assets with a corresponding reduction in the valuation allowance.
Effective October 16, 2009, the Company entered into a Debt Conversion Agreement (the "Conversion Agreement") with the beneficial owners of more than 96.7% of the 2024 Debentures (the "Noteholders") whereby the Noteholders agreed to exchange their 2024 Debentures for a combination of cash, shares of common stock, the New Notes (as defined below) and, in some cases, shares of Series B Preferred Stock. The Conversion Agreement was consummated on October 30, 2009 (the "Closing Date"). (See Note 14—Subsequent Events).
The Federal Tax Reform Act of 1986, and similar state laws, contains provisions that may limit the net operating loss carry forwardsand tax credits carryforwards to be used in any given year upon the occurrence of certain events, including a significant change in ownership interests. We maintain a study to understand the status of net operating losses. Based on that study, we believe that, as of September 30, 2009 we have not undergone an Internal Revenue Code (IRC) Section 382 change of control that would trigger an impairment of the use of our NOLs as of the fiscal year ended September 30, 2009. Under IRC Section 382 and
Table of Contents
NOTES TO CONSOLIDATED FINANCIAL STATEMENTS (Continued)
NOTE 7—INCOME TAXES (Continued)
383 rules, a change in ownership can occur whenever there is a shift in ownership by more than fifty percentage points by one or more five-percent shareholdersstockholders within a three-year period. When a change of ownership is triggered,occurs, the NOLs and credits may be impaired.
As a result of the conversion agreement discussed above, the Company experienced an "ownership change" as defined for U.S. federal income tax purposes as of October 30, 2009. As a result of the "ownership change", the Company could realize a permanent loss of a significant portion of its U.S. federal and state deferred tax assets and lose certain built-in losses that have not been recognized for tax purposes. As of September 30, 2009, the Company's deferred tax asset was $422.1 million, which was fully reserved.
The total amount of gross unrecognized tax benefits was approximately $29.3 million as of October 1, 2007 and September 30, 2008. The total amount of gross unrecognized tax benefits decreased by $3.0 million related to R&D credits and the potential state tax liabilities.
Included in the balance of unrecognized tax benefits of $26.3 million as of September 30, 2009, there were no unrecognized tax benefits that, if recognized, would impact the effective tax rate.
A reconciliation of the beginning and ending amount of unrecognized tax benefit is as follows (in thousands):
| | | | |
Balance as of September 30, 2008 | | $ | (29,297 | ) |
Gross increases—tax positions in prior period | | | — | |
Gross decreases—tax positions in prior period | | | — | |
Gross increases—current-period tax positions | | | 3,009 | |
Decrease relating to settlements | | | — | |
Reductions as a result of a lapse of statue of limitations | | | — | |
Balance as of September 30, 2009 | | $ | (26,288 | ) |
Table of Contents
NOTES TO CONSOLIDATED FINANCIAL STATEMENTS (Continued)
NOTE 9—INCOME TAXES (Continued)
The Company recognizes accrued interest and penalties related to unrecognized tax benefits in income tax expense. As of September 30, 2009, there was no material interest or penalties were accrued due to significant net operating loss.
The Company is subject to taxation in the US and various state and foreign jurisdictions. The Company recently completed an examination by the Internal Revenue Service for the tax years ended September 30, 2004 through September 30, 2006. The audit resulted in an adjustment that reduced the Company's federal NOL carryforwards. Effectively, all the Company's tax years in which a tax net operating loss is carried forward to the present are subject to examination by the federal, state, and foreign tax authorities. Therefore, the Company cannot estimate the range of unrecognized tax benefits that may significantly change within the next twelve months.
NOTE 10—SIGNIFICANT CUSTOMERS, CONCENTRATION OF CREDIT RISK, SEGMENT REPORTING, AND GEOGRAPHIC INFORMATION
The Company's end customers generally are engaged in the design and/or manufacturing of technology products either recently introduced or not yet introduced to the marketplace. The Company ships certain products to contract manufacturers of its end customers and through distributors. The allocation of revenues that follows is based on end customer, rather than contract manufacturer or distributor. For fiscal 2009, distributors Nu Horizons Electronics, Corp. (including its subsidiary Titan Supply Chain Services), Weikeng Industrial Co. Ltd. and direct customer Huawei Technologies Co., Ltd. accounted for 36.0%, 7.5%, and 12.0%, respectively, of our net revenues. For fiscal 2008, distributors Nu Horizons Electronics, Corp. (including its subsidiary Titan Supply Chain Services), Weikeng Industrial Co. Ltd. and direct customer IBM accounted for 48.8%, 9.2% and 11.3%, respectively, of our net revenues. For fiscal 2007, distributors Nu Horizons Electronics, Corp. (including its subsidiary Titan Supply Chain Services), Weikeng Industrial Co. Ltd. and direct customer IBM accounted for 50.1%, 7.1% and 11.0%, respectively, of our net revenues.
Based on direct shipments, net revenues to customers that exceeded 10% of total net revenues in any of the three years ended September 30, 2009 were as follows:
| | | | | | | | | | |
| | 2009 | | 2008 | | 2007 | |
|---|
Nu Horizons Electronics Corp. (distributor) | | | 22.6 | % | | 22.8 | % | | 21.3 | % |
Titan Supply Chain Services (distributor) | | | 13.4 | % | | 26.0 | % | | 28.8 | % |
Huawei | | | 12.0 | % | | * | | | * | |
IBM | | | * | | | 11.3 | % | | 11.0 | % |
*Less than 10% of total net revenues for period indicated.
The Company has one reportable operating segment as defined by ASC Topic 280 Segment Reporting ("ASC 280"); originally issued as SFAS No. 131, "Disclosure about Segments of an Enterprise and Related Information." Substantially all long-lived assets are located in the United States.
The Company principally targets two markets within the communications industry: Carrier Networking and Enterprise Networking systems.
Accordingly, we classify our IC products into three categories: 1) Carrier Networking Products; 2) Enterprise Networking Products; and 3) Non-Core Products. The Networking Products line services core and metro WANs, also known as Carrier Networks. Our products are focused on enabling
Table of Contents
NOTES TO CONSOLIDATED FINANCIAL STATEMENTS (Continued)
NOTE 10—SIGNIFICANT CUSTOMERS, CONCENTRATION OF CREDIT RISK, SEGMENT REPORTING, AND GEOGRAPHIC INFORMATION (Continued)
Ethernet data services to be deployed more broadly across these networks. The Enterprise Networking Products line services the market for Ethernet switching and transmission within LANs in SMB and SME markets. Non-Core Products are those product lines where we have chosen to exit markets and no longer continue to invest.
Revenues are summarized by geographic area as follows (in thousands):
| | | | | | | | | | | |
| | September 30, | |
|---|
| | 2009 | | 2008 | | 2007 | |
|---|
North America | | $ | 69,717 | | $ | 116,191 | | $ | 115,696 | |
Asia Pacific | | | 79,720 | | | 88,045 | | | 76,046 | |
Europe | | | 18,740 | | | 24,300 | | | 30,206 | |
| | | | | | | | |
| | Total net revenues | | $ | 168,177 | | $ | 228,536 | | $ | 221,948 | |
| | | | | | | | |
(1)North America includes USA, Canada and Mexico
Revenue by geographic area is based upon where the design win for the work originated. North America revenue includes $13.3 million and $10 million of intellectual property activity for fiscal years ended September 30, 2009 and 2008, respectively. The Company believes a substantial portion of the product sold to OEMs and third-party manufacturing service providers in the Asia Pacific region are ultimately shipped to end-markets in North America and Europe.
Long-lived assets (excluding goodwill and other intangible assets) by country (in thousands):
| | | | | | | | |
| | September 30, | |
|---|
| | 2009 | | 2008 | |
|---|
USA | | $ | 10,234 | | $ | 11,320 | |
Denmark | | | 113 | | | 190 | |
Germany | | | 604 | | | 174 | |
| | | | | | |
| | Total | | $ | 10,951 | | $ | 11,684 | |
| | | | | | |
NOTE 11—RETIREMENT SAVINGS PLAN
The Company has a qualified retirement plan under the provisions of Section 401(k) of the Code covering substantially all employees. Participants in this plan may defer up to the maximum annual amount allowable under IRS regulations. The contributions are fully vested and nonforfeitable at all times. From January 1, 2007 through February 1, 2009, the Company matched 50% of the first 6% of employee contributions. The Company's 401(k) match totaled $0.3 million, $0.8 million and $0.6 million for the years ended September 30, 2009, 2008, and 2007. In compliance with governing regulations, the Company also made contributions to the retirement savings plans of employees of its foreign subsidiaries in the amounts of $0.3 million, $0.3 million and $0.2 million for the years ended September 30, 2009, 2008, and 2007.
Table of Contents
NOTES TO CONSOLIDATED FINANCIAL STATEMENTS (Continued)
NOTE 12—COMMITMENTS AND CONTINGENCIES
The Company leases facilities under non-cancellable operating leases expiring at various dates through fiscal 2015. Rent expense under operating leases totaled $3.9 million, $3.7 million, and $3.4 million for the years ended September 30, 2009, 2008, and 2007, respectively.
On December 29, 2005, the Company entered into a sale-leaseback arrangement on a building in Camarillo, California. The Company is committed to lease the facility through December 2015. The lease includes annual rent escalations. Rent expense related to the sale-leaseback of $0.7 million for the years 2010-2013; $0.8 million for 2014; and $1.0 thereafter is included in the schedule below. The Company has a deferred lease incentive liability recorded to reflect the amount of the leasehold improvements and is amortizing the liability on a straight-line basis over the term of the lease.
Future minimum lease payments under non-cancellable operating leases that have remaining non-cancellable lease terms in excess of one year and software licenses are as follows (in thousands):
| | | | | | | | | | | | | | | | | | | | | | | |
| | Payment Obligations by Year | |
|---|
| | 2010 | | 2011 | | 2012 | | 2013 | | 2014 | | Thereafter | | Total | |
|---|
Operating leases | | $ | 3,050 | | $ | 3,108 | | $ | 2,981 | | $ | 2,949 | | $ | 1,768 | | $ | 1,266 | | $ | 15,122 | |
Software licenses | | | 6,426 | | | 4,698 | | | 3,865 | | | 3,200 | | | 3,200 | | | — | | | 21,389 | |
| | | | | | | | | | | | | | | | |
| | Total | | $ | 9,476 | | $ | 7,806 | | $ | 6,846 | | $ | 6,149 | | $ | 4,968 | | $ | 1,266 | | $ | 36,511 | |
| | | | | | | | | | | | | | | | |
Software license commitments represent non-cancellable licenses of intellectual property from third-parties used in the development of the Company's products.
The Company is a party to various investigations, lawsuits, and claims arising in the normal course of business. In the opinion of management, the ultimate disposition of these matters could have a material adverse affect on the Company's consolidated financial position, results of operations, and/or liquidity.
The Company and certain current or former directors and officers of Vitesse were named in multiple shareholder derivative and securities class actions. These actions were filed starting in April 2006 and were based on allegations of stock option backdating and accounting manipulations. Settlements have been reached in the class action suit and the derivative suit against the Company, with both suits settled with distribution of Vitesse common stock. An expense was accrued in the amount of $6.6 million in the financial statements for the year ended September 30, 2006 to reflect the fair market value of the stock as of the date of the settlements. These settlements were non-cash settlements and did not have a material adverse affect on the Company's liquidity. Final distribution of the Company's common stock in settlement of the lawsuits was made during the fiscal year ended September 30, 2009. No additional expense was recognized in the financial statements for the period. We also have received a grand jury subpoena from the United States Attorney's Office and were notified that the SEC commenced an investigation of Vitesse. The Company has reached a tentative settlement with the SEC in settlement of their investigation. An expense was accrued in the amount of $3.0 million in the accompanying financial statements for the year ended September 30, 2009.
The Derivative and Securities Class Actions
On April 7, 2008, the District Court approved the settlement of the consolidated securities class actions filed against Vitesse and certain current or former directors and officers of Vitesse alleging violations of Sections 10(b) and 20(a) of the Exchange Act and Rule 10b-5 promulgated thereunder on
Table of Contents
NOTES TO CONSOLIDATED FINANCIAL STATEMENTS (Continued)
NOTE 12—COMMITMENTS AND CONTINGENCIES (Continued)
behalf of a class of purchasers of Vitesse common stock. The settlement of the consolidated securities class actions included a cash payment to the settlement fund of $10.2 million: $8.75 million to be paid by Vitesse's directors' and officers' liability insurers and the remainder of $1.45 million to be paid by Louis R. Tomasetta and Eugene F. Hovanec, two of the former executives of Vitesse. The same two former executives also contributed all shares of Vitesse common stock that they owned, 1,272,669 shares, to the settlement. In addition, on September 22, 2008, Vitesse contributed 2,650,000 shares of Vitesse common stock with a fair market value of $2.4 million, but no cash, to the settlement fund.
On August 11, 2008, the Court granted final approval of settlements in the federal and state derivative actions filed on behalf of Vitesse against certain current or former directors and officers of Vitesse, and nominally against Vitesse alleging claims for breach of fiduciary duty, abuse of control, gross mismanagement, waste of corporate assets, unjust enrichment, constructive trust, rescission, accounting manipulations, and violations of California Corporations Code Sections 25402 and 25403. As part of the settlement of the federal and state derivative actions, the Company adopted certain Corporate Governance measures. Three former executives of Vitesse, Messrs. Tomasetta, Hovanec, and Mody, released the Company from its obligation to provide future indemnification and defense costs in the related SEC and Department of Justice investigations. Vitesse retained the right to continue its state court action against KPMG, LLP, its former independent registered public accounting firm.
On January 14, 2009, Vitesse contributed 4,700,000 shares of Vitesse common stock, with a fair market value of $4.2 million to cover the attorneys' fees and expenses of the derivative plaintiffs' counsel. The Court entered final judgment implementing all of the above referenced terms and the case is concluded in all respects.
The Corporate Governance measures include implementing certain policies, procedures and guidelines relating to stock option grants and compensation decisions, incorporating greater shareholder participation in the procedures for nominating independent directors, adopting additional standards of director independence, adding a "lead independent director," and incorporating additional accounting policies, procedures and guidelines to be incorporated as part of these measures.
In addition, the Company and certain current and former officers and directors of the Company who were named as defendants were dismissed from the lawsuits and have obtained releases from the class and derivative plaintiffs.
The Dupuy Action
On April 10, 2007, an individual shareholder of Vitesse, Jamison John Dupuy, filed a complaint in the Superior Court of California, County of Ventura, against Vitesse and three of its former officers (Case No. CIV 247776). Mr. Dupuy's complaint included causes of action for fraud, deceit and concealment, and violation of California Corporations Code Sections 25400 et seq. Vitesse filed an answer, asserting numerous affirmative defenses. On March 3, 2008, Mr. Dupuy filed an amended complaint that named six new defendants, all former employees, and included new causes of action for negligent misrepresentation and violations of California Corporations Code § 1507. On April 4, 2008, after mediation before a retired United States District Judge for the Central District of California, the parties entered into a confidential settlement agreement and the plaintiff filed a dismissal of the action. The Company settled this lawsuit in the third quarter of 2008.
Table of Contents
NOTES TO CONSOLIDATED FINANCIAL STATEMENTS (Continued)
NOTE 12—COMMITMENTS AND CONTINGENCIES (Continued)
The DOJ Subpoena and SEC Investigation
In May 2006, we received a grand jury subpoena from the office of the United States Attorney for the Southern District of New York requesting documents from 1999 through the present. The Division of Enforcement of the SEC also conducted an investigation of Vitesse. The Division of Enforcement requested documents from January 1, 1995 through the present. Vitesse has cooperated with both government agencies in their investigations. While the investigation by the United States Attorney is still on-going, the staff of the Division of Enforcement of the SEC has agreed to recommend to the Commission, a proposed settlement which would conclude for the Company all matters arising from the SEC investigation into historical stock option practices and certain other accounting irregularities. Under the proposed settlement, the Company would pay a $3.0 million civil penalty and consent to the entry of a final judgment by a federal court permanently enjoining the Company from violations of the antifraud and other provisions of the federal securities laws. In connection with the Company's settlement with the staff of the Division of Enforcement of the SEC, we recorded a $3.0 million expense related to the civil penalty payable to the SEC. The proposed settlement is contingent on the review and approval of final documentation by the Company and the staff of the Division of Enforcement of the SEC, and is subject to final approval by the Commission.
KPMG Lawsuit
On June 13, 2007, the Company filed a lawsuit in the Superior Court for the County of Los Angeles against KMPG LLP ("KPMG"), its former independent registered public accounting firm, alleging that KPMG was negligent in auditing the Company's stock option grants and financial statements during the years 1994 to 2000. The Company later amended its Complaint to include the years 2001 to 2004.
On June 15, 2009, the Company announced that it had reached a settlement with KPMG. Pursuant to this settlement, KPMG agreed to pay the Company $22.5 million and forgive all past indebtedness. Additionally, the parties agreed to execute mutual general releases of all claims. In June 2009, the Company received full payment of the settlement amount, net of fees, expenses and outstanding indebtedness. The Company recorded the net proceeds and the forgiveness of the debt, totaling $16.0 million, as a credit to accounting remediation and reconstruction expense and litigation costs.
Potential Payroll Tax Liabilities Related to Backdating of Stock Options
On June 29, 2009, the Company obtained final determination from the Internal Revenue Service ("IRS") regarding a settlement of payroll taxes, penalties and interest related to the exercise of backdated stock options during the calendar years 2004 through 2006. During that period, certain non-qualified stock options were improperly classified and treated as incentive stock options for tax purposes, resulting in underpayment of payroll taxes. The Company paid approximately $0.9 million in full satisfaction of the federal income tax liabilities in July 2009.
Table of Contents
NOTES TO CONSOLIDATED FINANCIAL STATEMENTS (Continued)
NOTE 13—QUARTERLY FINANCIAL DATA (UNAUDITED)
The following tables set forth the consolidated statements of operations for each of our last eight quarters. This quarterly information is derived from unaudited interim financial statements and has been prepared on the same basis as the annual Consolidated Financial Statements. In management's opinion, this quarterly information reflects all adjustments necessary for fair presentation of the information for the periods presented. The operating results for any quarter are not necessarily indicative of results for any future period.
| | | | | | | | | | | | | | | | | | |
| | First
Quarter | | Second
Quarter | | Third
Quarter | | Fourth
Quarter | | Total
Year | |
|---|
Fiscal Year 2009: | | | | | | | | | | | | | | | | |
Product revenues | | $ | 44,810 | | $ | 34,577 | | $ | 36,356 | | $ | 39,184 | | $ | 154,927 | |
Licensing revenues | | | 5,000 | | | — | | | 8,250 | | | — | | | 13,250 | |
| | | | | | | | | | | | |
| | Net revenues | | | 49,810 | | | 34,577 | | | 44,606 | | | 39,184 | | | 168,177 | |
Cost of revenues | | | 22,447 | | | 18,228 | | | 17,282 | | | 20,457 | | | 78,414 | |
(Loss) income from continuing operations before discontinued operations | | | (189,958 | ) | | (7,085 | ) | | 12,410 | | | (9,479 | ) | | (194,112 | ) |
Discontinued operations | | | | | | | | | | | | | | | | |
| | Income from operations of Storage Products business, net of tax | | | — | | | — | | | 71 | | | — | | | 71 | |
| | | | | | | | | | | | |
Net (loss) income | | $ | (189,958 | ) | $ | (7,085 | ) | $ | 12,481 | | $ | (9,479 | ) | $ | (194,041 | ) |
| | | | | | | | | | | | |
Basic and diluted (loss) income per share: | | | | | | | | | | | | | | | | |
| | Continuing operations | | | (0.84 | ) | | (0.03 | ) | | 0.05 | | | (0.04 | ) | | (0.85 | ) |
| | Discontinued operations | | | — | | | — | | | — | | | — | | | — | |
| | | | | | | | | | | | |
| | | Net (loss) income per share | | $ | (0.84 | ) | $ | (0.03 | ) | $ | 0.05 | | $ | (0.04 | ) | $ | (0.85 | ) |
| | | | | | | | | | | | |
Weighted average shares outstanding: | | | | | | | | | | | | | | | | |
Basic | | | 226,206 | | | 230,227 | | | 230,906 | | | 230,906 | | | 229,554 | |
Diluted | | | 226,206 | | | 230,227 | | | 231,735 | | | 230,906 | | | 229,554 | |
Fiscal Year 2008: | | | | | | | | | | | | | | | | |
Product revenues | | $ | 52,542 | | $ | 55,593 | | $ | 55,041 | | $ | 55,360 | | $ | 218,536 | |
Licensing revenues | | | — | | | — | | | — | | | 10,000 | | | 10,000 | |
| | | | | | | | | | | | |
| | Net revenues | | | 52,542 | | | 55,593 | | | 55,041 | | | 65,360 | | | 228,536 | |
Cost of revenues | | | 26,498 | | | 25,514 | | | 27,965 | | | 26,367 | | | 106,344 | |
(Loss) income from continuing operations before discontinued operations | | | (3,519 | ) | | 2,366 | | | (591 | ) | | 9,254 | | | 7,510 | |
Discontinued operations | | | | | | | | | | | | | | | | |
| | Income from operations of Storage Products business, net of tax (including gain on sale) | | | 4,978 | | | 1,420 | | | 1,703 | | | 943 | | | 9,044 | |
| | | | | | | | | | | | |
Net income | | $ | 1,459 | | $ | 3,786 | | $ | 1,112 | | $ | 10,197 | | $ | 16,554 | |
| | | | | | | | | | | | |
Basic (loss) income per share: | | | | | | | | | | | | | | | | |
| | Continuing operations | | | (0.02 | ) | | 0.01 | | | — | | | 0.04 | | | 0.03 | |
| | Discontinued operations | | | 0.02 | | | 0.01 | | | 0.01 | | | 0.01 | | | 0.04 | |
| | | | | | | | | | | | |
| | | Net income per share | | $ | — | | $ | 0.02 | | $ | 0.01 | | $ | 0.05 | | $ | 0.07 | |
| | | | | | | | | | | | |
Diluted (loss) income per share: | | | | | | | | | | | | | | | | |
| | Continuing operations | | | (0.02 | ) | | 0.01 | | | — | | | 0.04 | | | 0.03 | |
| | Discontinued operations | | | 0.02 | | | 0.01 | | | 0.01 | | | — | | | 0.04 | |
| | | | | | | | | | | | |
| | | Net income per share | | $ | — | | $ | 0.02 | | $ | 0.01 | | $ | 0.04 | | $ | 0.07 | |
| | | | | | | | | | | | |
Weighted average shares outstanding: | | | | | | | | | | | | | | | | |
Basic | | | 223,556 | | | 223,556 | | | 223,556 | | | 223,786 | | | 223,614 | |
Diluted | | | 223,556 | | | 223,556 | | | 223,556 | | | 261,767 | | | 223,614 | |
Table of Contents
NOTES TO CONSOLIDATED FINANCIAL STATEMENTS (Continued)
NOTE 14 SUBSEQUENT EVENTS
Debt Restructuring
Exercise of 2024 Debenture Repurchase Rights
On October 1, 2009, the Trustee of the 2024 Debentures provided a written notice to the Company that holders representing $95.7 million of the principal amount of the 2024 Debentures had exercised their repurchase rights under the Indenture. Pursuant to the written notice, the Company was required to deposit the repurchase price of $108.9 million with the Trustee as soon as practicable. As the Company had insufficient cash to repurchase the entire Indenture tendered for repurchase it could not fulfill its legal responsibility to repurchase the debt which constituted an event of default under both the Indenture and the $30.0 million financing with Whitebox (the "Senior Secured Loan Agreement," or "Senior Term Loan"). Accordingly, management of the Company completed a series of transactions with its Lenders to restructure the Senior Term Loan and 2024 Debentures. These transactions and the accounting for these transactions are described below.
Amendment to the Senior Secured Loan Agreement
Effective October 16, 2009, the Company and Whitebox (the "Senior Lenders") amended the terms of the Senior Secured Loan Agreement to allow the Company to enter into the "Debt Conversion Agreement" described below, pay down $5.0 million of the principal amount of its Senior Secured Loan and amend the terms of the Senior Secured Loan.
The terms of the Senior Secured Loan were amended (the "Amended Senior Secured Loan" or "Senior Secured Loan") as follows: the maturity date is October 2011; each prepayment of the Senior Secured Loan requires the Company to pay a non-refundable prepayment fee equal to 1.0% of the aggregate principal amount that is prepaid; the interest rate was increased to 10.5% per annum in cash for the period from October 1, 2009 until October 16, 2009 and to 8.5% per annum in cash, plus 2.0% payment-in-kind interest ("PIK"), plus an additional 0.3% PIK interest for every $1.0 million above $15.0 million of the senior term loan that is not paid down by the Company for the period from October 17, 2009 until maturity or payment. Further, subsequent to the $5.0 million pay-down of the Senior Secured Loan, the Company has the ability to reduce the rate of interest by 0.3% for every $1.0 million of additional prepayment and any future proceeds of any sale or disposition of the Company's property is required to be used to reduce the principal balance of the Senior Secured Loan.
As the Company consummated the debt restructuring described in this note before November 16, 2009 and satisfied certain other conditions, the senior lenders waived the defaults discussed in "Exercise of 2024 Debenture Repurchase Rights" above.
Accounting For the Amended Senior Secured Loan
Pursuant to the guidance in ASC 470, the Company has determined that it has not received any concessions from the lender. As a result, the amendment to the Senior Secured Loan will not be accounted for as a troubled debt restructuring ("TDR") but as a debt modification. Accordingly, the amended Senior Secured Loan was recorded at the principal amount to be repaid of $25.0 million, which is the $30.0 million dollar original principal balance less the subsequent period principal payment of $5.0 million. In connection with the amendment, fees of $0.1 million were paid to the lender which resulted in an increase in the debt discount to $0.5 million. Furthermore the debt issuance costs incurred at the time of the original debt issuance of $1.2 million remain capitalized and the third party costs of approximately $0.6 million incurred as part of the amendment were expensed. The debt
Table of Contents
NOTES TO CONSOLIDATED FINANCIAL STATEMENTS (Continued)
NOTE 14 SUBSEQUENT EVENTS (Continued)
issuance costs of $1.2 million and the debt discount of $0.5 million will be amortized as interest expenses over the term of the modified loan. The Senior Secured Loan will bear interest at a rate pursuant to the amended terms.
Debt Conversion Agreement
Effective October 16, 2009, the Company entered into a Debt Conversion Agreement (the "Conversion Agreement") with the beneficial owners of more than 96.7% of the 2024 Debentures (the "Noteholders") whereby the Noteholders agreed to exchange their 2024 Debentures for a combination of cash, shares of common stock, the New Notes (as defined below) and, in some cases, shares of Series B Preferred Stock. The Conversion Agreement was consummated on October 30, 2009 (the "Closing Date").
Cash Payments
The Company used $10.1 millionperformed a study to evaluate the status of cash to repayNOLs. Based on that study, the Company believes that, as a portionresult of the 2024 Debentures amounts due as follows; $3.6 million was used to settle the Company's obligations with respect to the 2024 Debentures of holders that are not parties to the Conversion Agreement $6.4 million was paid to parties todiscussed above, the Conversion Agreement in partial repayment of the 2024 Debentures and $0.1 million in accrued interest was paid to all beneficial owners of the 2024 DebenturesCompany experienced an "ownership change" as defined for U.S. federal income tax purposes as of October 30, 2009.2009 that resulted in an impairment of the use of the NOLs and credits as of the fiscal year ended September 30, 2010. As a result of the ownership change, the Company only has approximately $56.4 million of Federal NOLs that can be used in future tax years and is subject to an annual limitation of $3.1 million in utilizing its NOLs. The NOLs will expire in fiscal year 2029. Also, due to the ownership change, the research and development credits have been limited as to usage such that the Company does not anticipate being able to use any of its research and development credits existing as of October 30, 2010 in future tax years.
ASC Topic 740 Income Taxes ("ASC 740"), originally issued as FIN 48,"Accounting for Uncertainty in Income Taxes—An Interpretation of FASB Statement No. 109," prescribes a recognition threshold and measurement attribute for the financial statement recognition and measurement of a tax position taken or expected to be taken in a tax return. Due to significant net operating losses, the cumulative effect of applying this interpretation upon adoption on October 1, 2007, had no impact on accumulated deficit.
The Company issued the following instruments in exchange for the $100.0total amount of gross unrecognized tax benefits was approximately $26.3 million in aggregate principalas of October 1, 2009 and approximately $ 10.6 million as of September 30, 2010. The total amount of gross unrecognized tax benefits decreased by $16.0 million due to an "ownership change" and premiumincreased by $0.3 million related to potential state tax liabilities.
As of the 2024 Debentures remaining after the $10 million cash settlement:
•172,936,222 shares of common stock in satisfaction of $50.0September 30, 2010, approximately $0.7 million of the outstanding obligation under$10.6 million FIN 48 unrecognized tax benefits, related to the 2024 Debentures;
•$50.0Company's state tax liability, is recorded in accrued expenses and other current liabilities on the Consolidated Balance Sheet. The remaining $9.9 million, aggregate principal amountrelated to research and development tax credits that have not been utilized, is reflected as a reduction to the deferred tax asset arising from the research and development tax credits. As of convertible debt (the "New Notes") which is convertible into 222,191,111 shares of common stock; and
•770,785 shares of Series B Preferred Stock in satisfaction of $15.4September 30, 2009, approximately $0.4 million of the outstanding obligation under the 2024 Debentures. Each share of Series B Preferred Stock is convertible into 100 shares of common stock for an aggregate of 77,078,565 shares of common stock. The Series B Preferred Stock is non-voting and has a dividend preference equal to $0.001 per share of Series B Preferred Stock, which is payable when, and if, dividends are declared and payable with respect$26.3 million FIN 48 unrecognized tax benefits, related to the common stock.
Issuance of Common StockCompany's state tax liability, is recorded in accrued expenses and Series B Preferred Stock
On October 30, 2009,other current liabilities on the Noteholders exchanged approximately 50.0% of their 2024 Debentures (afterConsolidated Balance Sheet, the partial repurchase for cash described in "Debt Conversion Agreement" above) for 172,936,222 shares of common stock,remaining $25.9 million, related to research and in some cases Series B Preferred Stock. Pursuantdevelopment tax credits that have not been utilized, is reflected as a reduction to the Conversion Agreement,deferred tax asset arising from the Noteholders were limited to ownership of 9.99% of the outstanding common stock ("Limit on Ownership"). Accordingly, Noteholders received one share of Series B Preferred Stock for every 100 shares of common stock that they would have otherwise received in the debt restructuring transaction in excess of the Limit on Ownership; this amount totaled 770,785 shares of Series B Preferred Stock.research and development tax credits.
Table of Contents
NOTES TO CONSOLIDATED FINANCIAL STATEMENTS (Continued)
NOTE 14 SUBSEQUENT EVENTS7—INCOME TAXES (Continued)
Issuance of New Notes
As described above, the Company also issued $50.0 million of New Notes pursuant to the Conversion Agreement. The New Notes bear cash interest at 8.0% per annum beginning on October 30, 2009 and payable semiannually in arrears on April 1 and October 1 of each year, commencing April 1, 2010 and maturing on October 30, 2014, unless earlier converted or repurchased. The New Notes are secured by second priority security interests on substantially all A reconciliation of the assets of the Companybeginning and its subsidiaries. This second priority security interest is subordinated to the lien existing under the Senior Secured Loan Agreement. The New Notes are convertible into shares of common stock at a conversion price of $0.225 per share (equivalent to an initial conversion rate of approximately 4,444 shares per $1,000 principalending amount of New Notes). Full conversion of the $50.0 million in aggregate principal amount of the New Notes would result in the issuance of up to 222,191,111 shares of common stock.unrecognized tax benefit is as follows (in thousands):
Accounting for the Debt Conversion
| | | | |
Balance as of October 1, 2007 | | $ | (29,297 | ) |
| | | | |
Gross increases—tax positions in prior period | | | — | |
Gross decreases—tax positions in prior period | | | — | |
Gross increases—current-period tax positions | | | — | |
Decrease relating to settlements | | | — | |
Reductions as a result of a lapse of statue of limitations | | | — | |
| | | | |
Balance as of September 30, 2008 | | | (29,297 | ) |
| | | | |
Gross increases—tax positions in prior period | | | — | |
Gross decreases—tax positions in prior period | | | — | |
Gross increases—current-period tax positions | | | 3,009 | |
Decrease relating to settlements | | | — | |
Reductions as a result of a lapse of statue of limitations | | | — | |
| | | | |
Balance as of September 30, 2009 | | | (26,288 | ) |
| | | | |
Gross increases—tax positions in prior period | | | — | |
Gross decreases—tax positions in prior period | | | 16,013 | |
Gross increases—current-period tax positions | | | (340 | ) |
Decrease relating to settlements | | | — | |
Reductions as a result of a lapse of statue of limitations | | | — | |
| | | | |
Balance as of September 30, 2010 | | $ | (10,615 | ) |
| | | | |
Initially, the Company evaluated the issuance of common stock, New Notes and Series B Preferred Stock in exchange for the 2024 Debentures pursuant to the guidance in ASC 470. The Company determined that it has not received any concessions from the Noteholders pursuantrecognizes accrued interest and penalties related to the Conversion Agreement and accordingly the transaction will not be accounted for as a TDR. However,unrecognized tax benefits in income tax expense. As of September 30, 2010, there was no material interest or penalties were accrued due to the significant change in the expected remaining cash flows, the Company will account for the exchange of instruments in settlement for the 2024 Debentures pursuant to the Conversion Agreement as a debt extinguishment pursuant to the guidance in ASC 470.net operating loss.
The Company will initially recordis subject to taxation in the new instruments (i.e.,US and various state and foreign jurisdictions. The Company previously completed an examination by the New Notes, common stock and Series B Preferred Stock) issued in extinguishment of the 2024 Debentures at fair value and recognize an $11.8 million lossInternal Revenue Service for the difference betweentax years ended September 30, 2004 through September 30, 2006. The audit resulted in an adjustment that reduced the fair values ofCompany's federal NOL carryforwards. Effectively, all the new instruments plus additional amounts and fees paidCompany's tax years in which a tax NOL is carried forward to the creditors comparedpresent are subject to examination by federal, state, and foreign tax authorities. Therefore, the Company cannot estimate the range of unrecognized tax benefits that may significantly change within the next twelve months.
NOTE 8—SIGNIFICANT CUSTOMERS, CONCENTRATION OF CREDIT RISK AND GEOGRAPHIC INFORMATION
The Company's end customers generally are engaged in the design and/or manufacturing of technology products either recently introduced or not yet introduced to the net carrying valuemarketplace. The Company ships certain products to contract manufacturers of the 2024 Debentures.its end customers and through distributors. The allocation of revenues that follows is based on end customer, rather than contract manufacturer or distributor. For the purposes of calculating this loss on extinguishment, the net carrying amount of the 2024 Debentures includes the $96.7 million amount of the 2024 Debenturesfiscal 2010, distributor Nu Horizons Electronics (including its subsidiary, Titan Supply Chain Services), and $13.3 million of the premium put derivative, recorded at fair value as required by ASC 470. Additionally, $1.2 million of fees paid to the New Note lenders will be included in the measurement of the loss pursuant to ASC 470. Third party costs of approximately $1.9 million will be capitalizeddirect customer Huawei Technologies accounted for 23.9% and amortized as additional interest expense over the term of the New Notes.
On the Closing Date, the fair value of the underlying common stock was $0.21 per share. On that same date, the Company estimated the effective conversion price was $0.18 per common share pursuant to the terms of the Series B Preferred Stock. Accordingly, pursuant to ASC470, the Company will recognize in additional paid in capital approximately $2.0 million of beneficial conversion feature related to the issuance of the Series B Preferred Stock. Since the Series B Preferred Stock is redeemable upon issuance, the resulting discount on the Series B Preferred Stock arising from the beneficial conversion feature will be recognized immediately and reflected as a deemed dividend.
The fair value of the New Notes was estimated to be $42.0 million, which is net of $22.5 million related to the fair value of bifurcated embedded derivatives. The bifurcated embedded derivatives were identified pursuant to ASC 815 and arise from terms of the New Notes which give the Noteholders the right to demand redemption of the New Notes at a price equal to the notes on an as-if-converted basis in the event that 50% or more13.3%, respectively, of the Company's common stock is exchanged for, converted into, or acquired for consideration which is less than 90% of the outstanding common stock. This is innet revenues. For fiscal year 2009, Nu Horizons Electronics and Huawei
Table of Contents
NOTES TO CONSOLIDATED FINANCIAL STATEMENTS (Continued)
NOTE 14 SUBSEQUENT EVENTS8—SIGNIFICANT CUSTOMERS, CONCENTRATION OF CREDIT RISK AND GEOGRAPHIC INFORMATION (Continued)
substance a conversion settlement right where the holders could require the Company to settle in cash. The fair values of the New NotesTechnologies accounted for 36.0% and embedded derivatives were determined using a convertible bond valuation model within a lattice framework Level 3). The valuation model combined expected cash outflows with market based assumptions regarding risk-adjusted yields, stock price volatility, recent price quotes and trading information12.0%, respectively, of the Company's common stock into whichnet revenues. For fiscal year 2008, Nu Horizons Electronics and direct customer IBM accounted for 48.8% and 11.3%, respectively, of the New Notes are convertible.
Authorized Common SharesCompany's net revenues.
Immediately priorBased on direct shipments, net revenues to customers that exceeded 10% of total net revenues in any of the Closing, 230,905,580 sharesthree years ended September 30, 2010 were as follows:
| | | | | | | | | | |
| | 2010 | | 2009 | | 2008 | |
|---|
Nu Horizons Electronics, including its subsidiary, Titan Supply Chain Services (distributor) | | | 23.9 | % | | 36.0 | % | | 48.8 | % |
Huawei | | | 13.3 | % | | 12.0 | % | | * | |
IBM | | | * | | | * | | | 11.3 | % |
- *
- Less than 10% of
common stock were outstanding, none of which were held by the Noteholders that are parties to the Conversion Agreement. After the Closing, 403,841,802 shares of common stock were outstanding. Approximately 42.8%, or 172,936,222, of which are held by the Noteholders that are parties to the Conversion Agreement. In addition to the outstanding shares, there are outstanding instruments that allowtotal net revenues for the issuance of common stock.period indicated.
The Company has options and restricted stock units outstanding which, if converted, require the issuanceone reportable operating segment as defined by ASC Topic 280 Segment Reporting ("ASC 280"), originally issued as SFAS No. 131, "Disclosure about Segments of an additional 23.8Enterprise and Related Information." Substantially all long-lived assets are located in the United States.
Revenues are summarized by geographic area as follows (in thousands):
| | | | | | | | | | | |
| | September 30, | |
|---|
| | 2010 | | 2009 | | 2008 | |
|---|
North America(1) | | $ | 66,899 | | $ | 69,717 | | $ | 116,191 | |
Asia Pacific | | | 73,466 | | | 79,720 | | | 88,045 | |
Europe | | | 25,625 | | | 18,740 | | | 24,300 | |
| | | | | | | | |
| | Total net revenues | | $ | 165,990 | | $ | 168,177 | | $ | 228,536 | |
| | | | | | | | |
- (1)
- North America includes USA, Canada and Mexico
Revenue by geographic area is based upon where the design win for the work originated. North America revenue includes $0.4 million sharesand $13.3 million of common stock.intellectual property revenue for fiscal years ended September 30, 2010 and 2009, respectively. The Series B Preferred Stock is convertible into 77.1 million sharesCompany believes a substantial portion of common stock. In aggregate, the exercise or conversionproduct sold to OEMs and third-party manufacturing service providers in the Asia Pacific region are ultimately shipped to end-markets in North America and Europe.
Long-lived assets (excluding goodwill and intangible assets) by country (in thousands):
| | | | | | | | |
| | 2010 | | 2009 | |
|---|
USA | | $ | 11,377 | | $ | 10,234 | |
Denmark | | | 263 | | | 113 | |
Germany | | | 553 | | | 604 | |
| | | | | | |
| | Total | | $ | 12,193 | | $ | 10,951 | |
| | | | | | |
Table of these instruments when combined with the outstanding shares of common stock after closing, requires the Company to have 504.8 million shares of common stock available for issuance.Contents
NOTES TO CONSOLIDATED FINANCIAL STATEMENTS (Continued)
NOTE 9—RETIREMENT SAVINGS PLAN
The Company currently has 500.0 million sharesa qualified retirement plan under the provisions of common stock authorized. As a result, the Company will not have a sufficient amount of common stock authorized to permit the conversion of all the instruments as described above. Accordingly, pursuant to ASC 815, the Company has determined based on a first-in, first-out (FIFO) accounting policy election based upon the issuance date of the instruments, it will not have sufficient shares for the conversion of all of the Series B Preferred Stock into shares of common stock. As such, approximately 48,000 shares of Series B Preferred Stock or $0.8 million will be initially classified as mezzanine equity. At each subsequent balance sheet date, the Company will adjust the carrying value of its Series B Preferred Stock classified in mezzanine equity up to its redemption amount until the Company has sufficient authorized shares.
Tax Matters
As a result of the debt modifications and exchanges discussed above, the Company experienced an "ownership change" as defined for U.S. federal income tax purposes. In the event of an "ownership change" under Section 382401(k) of the Internal Revenue Code of 1986, as amended,covering substantially all employees. Participants in this plan may defer up to the maximum annual amount allowable under IRS regulations. The contributions are fully vested and nonforfeitable at all times. From January 1, 2007 through February 1, 2009, the Company could realize a permanent lossmatched 50% of a significant portionthe first 6% of employee contributions. The Company's 401(k) match totaled $0.0, $0.3 million and $0.8 million for the years ended September 30, 2010, 2009, and 2008, respectively. In compliance with governing regulations, the Company also made contributions to the retirement savings plans of employees of its U.S. federalforeign subsidiaries in the amount of $0.3 million for each of the years ended September 30, 2010, 2009, and state2008.
NOTE 10—COMMITMENTS AND CONTINGENCIES
The Company leases facilities under non-cancellable operating leases expiring at various dates through fiscal 2015. Rent expense under operating leases totaled $3.2 million, $3.9 million, and $3.7 million for the years ended September 30, 2010, 2009, and 2008, respectively.
On December 29, 2005, the Company entered into a sale-leaseback arrangement on a building in Camarillo, California. The Company is committed to lease the facility through December 2015. The lease includes annual rent escalations. Rent expense related to the sale-leaseback of $0.7 million for the years 2011-2013; $0.8 million for the years 2014-2015; and $0.2 million thereafter, is included in the schedule below. The Company has a deferred tax assetslease incentive liability recorded to reflect the amount of the leasehold improvements and lose certain built-in lossesis amortizing the liability on a straight-line basis over the term of the lease.
Future minimum lease payments under non-cancellable operating leases that have not been recognized for tax purposes. Asremaining non-cancellable lease terms in excess of September 30, 2009,one year and software licenses are as follows (in thousands):
| | | | | | | | | | | | | | | | | | | | | | | |
| | Payment Obligations by Year | |
| |
|---|
| | 2011 | | 2012 | | 2013 | | 2014 | | 2015 | | Thereafter | | Total | |
|---|
Operating leases | | $ | 3,285 | | $ | 3,047 | | $ | 2,878 | | $ | 1,864 | | $ | 1,137 | | $ | 199 | | $ | 12,410 | |
Software licenses | | | 7,782 | | | 6,225 | | | 3,200 | | | 3,200 | | | — | | | — | | | 20,407 | |
| | | | | | | | | | | | | | | | |
| | Total | | $ | 11,067 | | $ | 9,272 | | $ | 6,078 | | $ | 5,064 | | $ | 1,137 | | $ | 199 | | $ | 32,817 | |
| | | | | | | | | | | | | | | | |
Software license commitments represent non-cancellable licenses of intellectual property from third-parties used in the development of the Company's deferred tax asset was $422.1 million, which was fully reserved.
Classification of Liabilitiesproducts.
PriorOn September 29, 2010 the Company announced to its affected employees that it would be closing the closing of the debt transactions on October 30, 2009, as discussed in Note 6,engineering department at its Westford, Massachusetts location. Engineering operations will be phased out during fiscal year 20092011. The total cost of the closure is anticipated to be approximately $0.6 million with $0.4 million to be recognized in the first quarter of the 2011 fiscal year. Engineering assets will be transferred to other facilities, and the Company had classifiedwill continue to operate its obligations related tosales division from that location.
The Company is involved in legal proceedings in the 2024 Debentures and senior secured loan in short-term liabilities based on the exercise dateordinary course of October 1, 2009 of the premium put option related to the 2024 Debentures.
After the completion of such debt refinancing transactions,business, including actions against the Company has reclassified $111.3 million relatedwhich assert or may assert claims or seek to impose fines and penalties in substantial amounts, such as the portion of their obligations under the 2024 Debentures and the seniormatter described below.
Table of Contents
NOTES TO CONSOLIDATED FINANCIAL STATEMENTS (Continued)
NOTE 14 SUBSEQUENT EVENTS10—COMMITMENTS AND CONTINGENCIES (Continued)
secured note which are refinanced onThe DOJ Subpoena and SEC Investigation
In May 2006, the Company received a long-term basis,grand jury subpoena from short-term liabilitiesthe office of the United States Attorney for the Southern District of New York requesting documents from 1995 and later. The Division of Enforcement of the SEC also conducted an investigation of Vitesse. The Division of Enforcement requested documents from 1995 and later. Vitesse has cooperated with both government agencies in their investigations. While the investigation by the United States Attorney is ongoing, the staff of the SEC's Division of Enforcement has agreed to long-term liabilities on its Consolidated Balance Sheet asrecommend to the Commission a proposed settlement that would conclude for the Company all matters arising from the SEC investigation into historical stock option practices and certain other accounting irregularities. Under the proposed settlement, the Company would pay a $3.0 million civil penalty and consent to the entry of a final judgment by a federal court permanently enjoining the Company from violations of the antifraud and other provisions of the federal securities laws. In connection with the Company's proposed settlement with the staff of the Division of Enforcement, for the fiscal year ended September 30, 2009.2009, the Company recorded a $3.0 million expense related to the civil penalty payable to the SEC. The proposed settlement is contingent on the review and approval of final documentation by the Company and the staff of the SEC's Division of Enforcement, and subject to final approval by the Commission.
Table of Contents
NOTES TO CONSOLIDATED FINANCIAL STATEMENTS (Continued)
NOTE 11—QUARTERLY FINANCIAL DATA (UNAUDITED)
OnThe following tables set forth the Consolidated Statements of Operations for each of the Company's last eight quarters. This quarterly information is derived from unaudited interim financial statements and has been prepared on the same basis as the annual Consolidated Financial Statements. In management's opinion, this quarterly information reflects all adjustments necessary for fair presentation of the information for the periods presented. The operating results for any quarter are not indicative of results for any future period.
| | | | | | | | | | | | | | | | | | |
| | First
Quarter | | Second
Quarter | | Third
Quarter | | Fourth
Quarter | | Total
Year | |
|---|
Fiscal Year 2010: | | | | | | | | | | | | | | | | |
Product revenues | | $ | 41,611 | | $ | 43,661 | | $ | 37,533 | | $ | 42,829 | | $ | 165,633 | |
Intellectual property revenues | | | 40 | | | 250 | | | — | | | 67 | | | 357 | |
| | | | | | | | | | | | |
| | Net revenues | | | 41,651 | | | 43,911 | | | 37,533 | | | 42,896 | | | 165,990 | |
Cost of revenues | | | 19,103 | | | 19,362 | | | 15,702 | | | 18,071 | | | 72,238 | |
(Loss) income from operations | | | (262 | ) | | 3,008 | | | (694 | ) | | 1,939 | | | 3,991 | |
(Loss) income from continuing operations | | | (33,860 | ) | | (34,061 | ) | | 33,029 | | | 14,715 | | | (20,177 | ) |
| | Income from discontinued operations, net of tax | | | — | | | — | | | — | | | 121 | | | 121 | |
| | | | | | | | | | | | |
Net (loss) income | | | (33,860 | ) | | (34,061 | ) | | 33,029 | | | 14,836 | | | (20,056 | ) |
| | | | | | | | | | | | |
| | Net loss attributable to noncontrolling interest | | | — | | | (1 | ) | | — | | | — | | | (1 | ) |
| | Fair value adjustment of Preferred Stock—Series B | | | 126 | | | — | | | — | | | — | | | 126 | |
| | | | | | | | | | | | |
Net (loss) income available to common stockholders | | $ | (33,986 | ) | $ | (34,060 | ) | $ | 33,029 | | $ | 14,836 | | $ | (20,181 | ) |
| | | | | | | | | | | | |
Basic (loss) income per share: | | | | | | | | | | | | | | | | |
| | Continuing operations | | $ | (1.95 | ) | $ | (1.69 | ) | $ | 1.38 | | $ | 0.61 | | $ | (0.96 | ) |
| | Discontinued operations | | | — | | | — | | | — | | | 0.01 | | | 0.01 | |
| | | | | | | | | | | | |
| | | Net (loss) income per share | | $ | (1.95 | ) | $ | (1.69 | ) | $ | 1.38 | | $ | 0.62 | | $ | (0.95 | ) |
| | | | | | | | | | | | |
Diluted (loss) income per share: | | | | | | | | | | | | | | | | |
| | Continuing operations | | $ | (1.95 | ) | $ | (1.69 | ) | $ | 0.96 | | $ | 0.42 | | $ | (0.96 | ) |
| | Discontinued operations | | | — | | | — | | | — | | | 0.00 | | | 0.01 | |
| | | | | | | | | | | | |
| | | Net (loss) income per share | | $ | (1.95 | ) | $ | (1.69 | ) | $ | 0.99 | | $ | 0.42 | | $ | (0.95 | ) |
| | | | | | | | | | | | |
Weighted average shares outstanding: | | | | | | | | | | | | | | | | |
Basic | | | 17,373 | | | 20,195 | | | 22,780 | | | 23,948 | | | 21,074 | |
Diluted | | | 17,373 | | | 20,195 | | | 34,544 | | | 35,213 | | | 21,074 | |
Fiscal Year 2009: | | | | | | | | | | | | | | | | |
Product revenues | | $ | 44,810 | | $ | 34,577 | | $ | 36,356 | | $ | 39,184 | | $ | 154,927 | |
Intellectual property revenues | | | 5,000 | | | — | | | 8,250 | | | — | | | 13,250 | |
| | | | | | | | | | | | |
| | Net revenues | | | 49,810 | | | 34,577 | | | 44,606 | | | 39,184 | | | 168,177 | |
Cost of revenues | | | 22,447 | | | 18,228 | | | 17,282 | | | 20,436 | | | 78,393 | |
(Loss) income from operations | | | (188,323 | ) | | (6,421 | ) | | 17,556 | | | (1,817 | ) | | (179,005 | ) |
(Loss) income from continuing operations | | | (189,958 | ) | | (7,085 | ) | | 12,410 | | | (9,560 | ) | | (194,193 | ) |
| | Income from discontinued operations, net of tax | | | — | | | — | | | 71 | | | — | | | 71 | |
| | | | | | | | | | | | |
Net (loss) income | | | (189,958 | ) | | (7,085 | ) | | 12,481 | | | (9,560 | ) | | (194,122 | ) |
| | | | | | | | | | | | |
| | Net (loss) attributable to noncontrolling interest | | | — | | | — | | | — | | | (81 | ) | | (81 | ) |
| | | | | | | | | | | | |
Net (loss) income available to common stockholders | | $ | (189,958 | ) | $ | (7,085 | ) | $ | 12,481 | | $ | (9,479 | ) | $ | (194,041 | ) |
| | | | | | | | | | | | |
Basic (loss) income per share: | | | | | | | | | | | | | | | | |
| | Continuing operations | | $ | (16.80 | ) | $ | (0.62 | ) | $ | 1.07 | | $ | (0.83 | ) | $ | (16.92 | ) |
| | Discontinued operations | | | — | | | — | | | 0.01 | | | — | | | 0.01 | |
| | | | | | | | | | | | |
| | | Net (loss) income per share | | $ | (16.80 | ) | $ | (0.62 | ) | $ | 1.08 | | $ | (0.83 | ) | $ | (16.91 | ) |
| | | | | | | | | | | | |
Diluted (loss) income per share: | | | | | | | | | | | | | | | | |
| | Continuing operations | | $ | (16.80 | ) | $ | (0.62 | ) | $ | 1.07 | | $ | (0.83 | ) | $ | (16.92 | ) |
| | Discontinued operations | | | — | | | — | | | 0.01 | | | — | | | 0.01 | |
| | | | | | | | | | | | |
| | | Net (loss) income per share | | $ | (16.80 | ) | $ | (0.62 | ) | $ | 1.08 | | $ | (0.83 | ) | $ | (16.91 | ) |
| | | | | | | | | | | | |
Weighted average shares outstanding: | | | | | | | | | | | | | | | | |
Basic | | | 11,310 | | | 11,511 | | | 11,545 | | | 11,545 | | | 11,478 | |
Diluted | | | 11,310 | | | 11,511 | | | 11,587 | | | 11,545 | | | 11,478 | |
Table of Contents
NOTES TO CONSOLIDATED FINANCIAL STATEMENTS (Continued)
NOTE 11—QUARTERLY FINANCIAL DATA (UNAUDITED) (Continued)
Correction of Error
During the first quarter of 2010, the Company identified an error in its Consolidated Balance Sheetfinancial statements as of September 30, 2009 and for the quarter and year then ended. This error was the result of an operational change that was not appropriately reflected in the Company's inventory costing and accounting processes. In accordance with Accounting Standards Codification ("ASC") Topic 250, "Accounting Changes and Error Corrections," originally issued as SAB No. 99,"Materiality" and SAB No. 108,"Considering the Effects of Prior Year Misstatements when Quantifying Misstatements in Current Year Financial Statements," management evaluated the materiality of the error from a qualitative and quantitative perspective and concluded that the error was not material to any prior periods. Further, the Company classified as short-term liabilitiesevaluated the $5.0 million in cash paid to the Senior Lender of senior secured loan: $10.0 million of cash used to pay $3.6 million to settle with the holdersmateriality of the 2024 Debentures that are not parties to the Conversion Agreement and $6.4 million in partial repayment to the holders of the 2024 Debentures that are parties to the Conversion Agreement; and $12.2 million related to the fair value of the derivative liability arising from the premium put obligationerror on the 2024 Debentures. This reclassification is in accordance with ASC 470.
Restructuring Costs
In an effort to reduce costs and shorten manufacturing time,results of operations for the Company has decided to eliminate test activities at their Camarillo, California location and outsource testing to a third-party facility. This restructuring plan was approved during October 2009 with implementation efforts starting immediately and full transition of testing to the third-party expected by the thirdfirst quarter of 2009 and for the fiscalfull year endingended September 30, 2010. This restructuring plan will include2009 and concluded that the termination of approximately 50 employees. In connection with this restructuring, the Company will record restructuring charges of approximately $0.7 millionerror in the first quarter for severance costswas quantitatively significant to be incurred duringthe first quarter Consolidated Statements of Operations but was not material to the full year or the trend of financial results. Accordingly, the Company corrected the error in the first quarter. The effects of the adjustment to correct the error on specific line items of the Consolidated Statements of Operations for the year ended September 30, 2010. The Company will not incur costs for impairment of fixed assets or facilities2010 were as part of the restructuring plan.follows:
| | | | |
| | Year Ended
September 30,
2010 | |
|---|
Decrease in cost of revenues | | $ | 934 | |
Decrease in loss from continuing operations | | | 934 | |
Decrease in net loss | | | 934 | |
Decrease in net loss per share—basic and diluted | | $ | 0.04 | |
Table of Contents
ITEM 9. CHANGES IN AND DISAGREEMENTS WITH ACCOUNTANTS ON ACCOUNTING AND FINANCIAL DISCLOSURE
On December 14, 2006, our Board of Directors and our Audit Committee dismissed KPMG, LLP as our independent registered public accountants and disclosed such dismissal in a Form 8-K, while requesting that KPMG furnish Vitesse with a letter addressed to the Securities and Exchange Commission stating whether it agrees with the statements made by Vitesse in the Form 8-K. In the Form 8-K, we also stated that from October 1, 2004, until the dismissal of KPMG as Vitesse's independent public accountant on December 14, 2006:None
•There were no disagreements with KPMG on any matter of accounting principles or practices, financial statement disclosure, or auditing scope or procedure, which disagreements, if not resolved to the satisfaction of KPMG, would have caused it to make a reference to the subject matter of the disagreement in connection with its report;
•None of the "reportable events" identified in Item 304(a)(1)(v)(A) through (D) of Regulation S-K have occurred; and
•The report of KPMG on Vitesse's consolidated financial statements at September 30, 2005 and 2004, and for the years in the three-year period ended September 30, 2005, did not contain an adverse opinion or a disclaimer of opinion, nor was it qualified or modified as to uncertainty, audit scope, or accounting principles.
By letter dated January 2, 2007 from KPMG commenting on Vitesse's original filing of a Form 8-K regarding the dismissal of KPMG (the "KPMG Letter"), KPMG informed Vitesse that it believes its audit procedures were impeded and its audit scope was restricted. KPMG has stated that, notwithstanding its requests, KPMG was not provided with sufficient access to the conclusions reached by the Special Committee of Vitesse's Board of Directors, the report to the Special Committee of its investigating counsel, Munger Tolles & Olson LLP ("Munger"), and the documentation supporting that report, as evidenced by the following:
•The Company and the Special Committee's refusal to provide KPMG adequate information regarding the results of Munger's investigation into Vitesse employee e-mail and other documents;
•The Company and the Special Committee's refusal to provide KPMG adequate information regarding the results of Munger's investigation into the conduct of certain members of the Company's sales organization and the current Chief Executive Officer; and
•The Company and the Special Committee's refusal to provide KPMG with adequate information as it relates to Munger's investigation into manual journal entries.
In the KPMG Letter, KPMG also informed Vitesse that it believes that the following are reportable events, as they constitute matters that could have caused KPMG to be unwilling to rely on management's representations or be associated with the Company's financial statements, but, due to audit scope limitations asserted by KPMG above and the dismissal of KPMG, remained unresolved:
•The conclusions that may have been reached and basis for such conclusions regarding discussions held between senior management of Vitesse, members of the Board of Directors and/or members of the Audit Committee and Vitesse's external counsel between November 2005 and April 2006 regarding the dating of stock option grants;
•KPMG's ability to exercise its responsibilities under Section 10A of the Securities Exchange Act of 1934 and to assess the appropriateness of the remedial actions associated with certain individuals in accounting positions who appear to have had knowledge of or participated in possible illegal acts; and
Table of Contents
•The conclusions that may have been reached and basis for such conclusions regarding interviews conducted by Munger, of members of the Vitesse Board of Directors and of Vitesse's external counsel.
Therefore, the Company believes that it does have a disagreement with KPMG regarding auditing scope, which disagreement, if not resolved to the satisfaction of KPMG, would have caused it to make a reference to the subject matter of the disagreement in connection with its report; and without being resolved, could have caused KPMG to be unwilling to rely on management's representations or be associated with the Company's financial statements, which would be considered a "reportable event" identified in Item 304(a)(1)(v)(A) through (D) of Regulation S-K.
On June 4, 2007, our Audit Committee engaged BDO Seidman, LLP, as our new independent registered public accounting firm. There are no disagreements between the BDO Seidman, LLP, and the Company.
On June 13, 2007, we filed a lawsuit against our former independent registered public accounting firm KPMG, LLP, alleging KPMG failed to properly provide auditing and other services during the time period 1994 to 2000 and seeking damages in excess of $100 million.
On June 15, 2009, the Company announced that it had reached a settlement with KPMG, pursuant to which KPMG agreed to pay the Company $22.5 million and forgive all past indebtedness. Additionally, the parties agreed to execute mutual general releases of all claims. In June 2009, the Company received full payment of the settlement amount, net of fees, expenses and outstanding indebtedness. The Company recorded the net proceeds and the forgiveness of the debt, totaling $16.0 million, as a credit to accounting remediation and reconstruction expense and litigation costs.
ITEM 9A. CONTROLS AND PROCEDURES
Evaluation of Disclosure Controls and Procedures
WeUnder the supervision and with the participation of the Company's management, including its Chief Executive Officer and the Company's Chief Financial Officer, the Company has evaluated the effectiveness of the design and operating effectivenessoperation of ourits disclosure controls and procedures as of September 30, 2009,2010. Disclosure controls and procedures are defined under SEC rules as controls and other procedures that are designed to ensure that information required to be disclosed by the Company in the reports the Company files or submits under the supervisionExchange Act is recorded, processed, summarized and withreported within required time periods. Based upon that evaluation, the participation of our management, including theCompany's Chief Executive Officer and the Company's Chief Financial Officer pursuant to Rule 13a-15(b) of the Exchange Act. Based on this evaluation, our Chief Executive Officer and Chief Financial Officerhave concluded that, as of September 30, 2009 our2010, these disclosure controls and procedures were not effective.
Management's Report on Internal Control over Financial Reporting
ManagementThe Company's management is responsible for establishing and maintaining an adequate system of internal control over the Company's financial reporting. Internal control over financial reporting pursuant to Rule 13a-15(c) of the Exchange Act. This system is intendeda process to provide reasonable assurance regarding the reliability of the Company's financial reporting and the preparation of financial statements for external purposes in accordance with GAAP.
A Company's internalgenerally accepted accounting principles. Internal control over financial reporting includes policies and procedures that: (i) pertain to the maintenance ofmaintaining records that in reasonable detail accurately and fairly reflect the transactions and dispositions of the assets of the company;Company's transactions; (ii) provide reasonable assurance that transactions are recorded as necessary to permitfor preparation of the Company's financial statements in accordance with GAAP, and that receipts and expenditures of the company assets are being made only in accordance with authorizations of management and directors of the company;authorization; and (iii) provide reasonable assurance regarding prevention or timely detection ofthat unauthorized acquisition, use or disposition of the company'scompany assets that could have a material affecteffect on the financial statements.
In accordance with the internal control reporting requirements of the SEC, our management completed an assessment of the effectiveness of our internal control over financial reporting as of September 30, 2009. In making this assessment, management used the criteria set forth in by the
Table of Contents
Committee of Sponsoring Organizations of the Treadway Commission ("COSO"). The COSO framework summarizes each of the components of a company's internal control system, including the: (i) control environment; (ii) risk assessment; (iii) information and communication; and (iv) monitoring (collectively, the "entity-level controls"), as well as a company's control activities (process-level controls). Management's evaluation of the design and operating effectiveness of our internal controls over financial reporting identified material weaknesses resulting from design and operating deficiencies in the internal control system. A "material weakness" is a deficiency, or a combination of deficiencies, in internal control over financial reporting, such that there is a reasonable possibility that a material misstatement of the company's annual or interimCompany's financial statements will notwould be prevented or detected on a timely basis. Because of its inherent limitations, internal control over financial reporting is not intended to provide absolute assurance that a misstatement of the Company's financial statements would be prevented or detected.
The Company's management evaluated the effectiveness of the Company's internal control over financial reporting based on the framework inInternal Control—Integrated Framework issued by the Committee of Sponsoring Organizations of the Treadway Commission. Based upon that evaluation, management concluded that the Company's internal control over financial reporting was effective as of September 30, 2010.
Remediation of Previously Reported Material Weakness and Changes in Internal Control over Financial Reporting
Management hasAs of September 30, 2009, the Company's assessment of the effectiveness of its disclosure controls and procedures and internal control over financial reporting identified material weaknesses in its internal control over financial reporting, which the Company's management reported in its Annual Report on Form 10-K for the year ended September 30, 2009. The Company identified the following material weaknesses in ourits internal control over financial reporting:
- •
OurThe Company's information systems lacklacked sufficient controls limiting access to key applications and data; and
Table of Contents
- •
- Effective controls to ensure the accuracy, valuation and timeliness of the financial accounting process around inventory, including a lack of accuracy and basis for valuation resulting in adjustments to the amount of cost of revenues and the carrying amount of inventory.
Due toThe Company concluded that, as of September 30, 2010, the identifiedCompany has remediated the previously reported material weaknesses in internal control over financial reporting as a result of the following remedial actions:
- •
- Increased IT controls to limit access to key applications and data;
- •
- Increased review controls over access to key applications and data;
- •
- Utilized outside experts to redesign and test processes, reviews, and controls; and
- •
- Expanded operational and finance management
has concludedreview over key inventory metrics and transactions and increased controls over inventory cut-off.
The Company regularly reviews its system of internal control over financial reporting and makes changes to its processes and systems to improve controls and increase efficiency, while ensuring that the Company maintains an effective internal control environment. Changes may include such activities as implementing new, more efficient systems, consolidating activities, and migrating processes.
The changes the Company made to remedy the prior year material weaknesses described above were the only changes in the Company's internal control over financial reporting was not effective as of September 30, 2009.
BDO Seidman, LLP,during the independent registered public accounting firm that audited the consolidated financial statements included in this Annual Report on Form 10-K, has issued an attestation report on our internal control over financial reporting as of September 30, 2009. A copy of this report is set forth below.
Changes in Internal Control over Financial Reporting and Remediation of the Material Weaknesses
During the quarter ended September 30, 2009, no other changes to our internal control over financial reporting were identified,last fiscal year that materially affected, or wereare reasonably likely to materially affect, ourthe Company's internal control over financial reporting. Based on the procedures performed as part of the Company's ongoing remediation of its financial controls, management has concluded that as of September 30, 2009, certain material weaknesses were remediated. The following changes to our internal control over financial reporting were made during the quarter ended September 30, 2009:
•Fully implementing controls to help prevent or detect instances of intentional override or intervention of our controls or intentional misconduct by employees or management.
•Maintaining sufficient policies and procedures over the administration and accounting for stock options.
•Maintaining a sufficient segregation of duties to decrease the risk of inappropriate accounting.
•Properly and timely performing account reconciliations of balance sheet accounts and ensuring reconciliations and their supporting documentation are consistently reviewed.
•Fully designing and implementing effective controls to ensure the completeness, accuracy, and timeliness of the financial accounting process are fully designed and implemented.
•Maintaining a sufficient complement of personnel with an appropriate level of accounting knowledge, experience, and training in the application of GAAP commensurate with our financial reporting requirements and business environment.
During our fourth quarter of fiscal 2009 we continued our ongoing remediation of financial controls, as well as completed the documentation of our controls process and implemented and
Table of Contents
completed controls testing to allow management to determine the effectiveness of the controls developed and implemented in previous quarters of fiscal year 2009.
As a result of the above actions, we believe our control environment and specifically controls over our financial reporting process, have improved substantially. We are investing in ongoing efforts to continuously improve the control environment and have committed considerable resources to the continuous improvement of the design, implementation, documentation, testing, and monitoring of our internal controls.
Remediation Plans
Management, in coordination with the input, oversight and support of our Audit Committee, has identified the following measures to strengthen our internal control over financial reporting and to address the material weaknesses described above. In addition to improving the effectiveness and compliance with key controls, our remediation efforts involve ongoing business and accounting process improvements and the implementation of key system enhancements. The process and system enhancements are generally designed to simplify and standardize business practices and to improve timeliness and access to associated accounting data through increased systems automation appropriate limitations around IT access as well as timely testing of controls throughout the fiscal year. We began implementing certain of these measures prior to the filing of this Form 10-K. While we expect remedial actions to be essentially implemented in fiscal 2010, some may not be in place for a sufficient period of time to help us certify that material weaknesses have been fully remediated as of the end of fiscal year 2010. We will continue to develop our remediation plans and implement additional measures during fiscal 2010 and possibly into fiscal 2011.
Inherent Limitation on the Effectiveness of Internal Controls
The effectiveness of any system of internal control over financial reporting is subject to inherent limitations, including the exercise of judgment in designing, implementing, operating, and evaluating the controls and procedures, and the inability to eliminate misconduct completely. Accordingly, any system of internal control over financial reporting can only provide reasonable, not absolute, assurances. In addition, projections of any evaluation of effectiveness to future periods are subject to the risk that controls may become inadequate because of changes in conditions, or that the degree of compliance with the policies or procedures may deteriorate. We intendThe Company intends to continue to monitor and upgrade ourits internal controls as necessary or appropriate for ourthe business, but cannot assure you that such improvements will be sufficient to provide us with effective internal control over financial reporting.
Table of Contents
Report of Independent Registered Public Accounting Firm
The Board of Directors and ShareholdersStockholders of Vitesse Semiconductor Corporation
Camarillo, California
We have audited Vitesse Semiconductor Corporation's internal control over financial reporting as of September 30, 2009,2010, based on criteria established inInternal Control—Integrated Framework issued by the Committee of Sponsoring Organizations of the Treadway Commission (the COSO criteria). Vitesse Semiconductor Corporation's management is responsible for maintaining effective internal control over financial reporting and for its assessment of the effectiveness of internal control over financial reporting, included in the accompanying Item 9A, Controls and Procedures—Management's Report on Internal Control Overover Financial Reporting".Reporting. Our responsibility is to express an opinion on the company'sCompany's internal control over financial reporting based on our audit.
We conducted our audit in accordance with the standards of the Public Company Accounting Oversight Board (United States). Those standards require that we plan and perform the audit to obtain reasonable assurance about whether effective internal control over financial reporting was maintained in all material respects. Our audit included obtaining an understanding of internal control over financial reporting, assessing the risk that a material weakness exists, and testing and evaluating the design and operating effectiveness of internal control based on the assessed risk. Our audit also included performing such other procedures as we considered necessary in the circumstances. We believe that our audit provides a reasonable basis for our opinion.
A company's internal control over financial reporting is a process designed to provide reasonable assurance regarding the reliability of financial reporting and the preparation of financial statements for external purposes in accordance with generally accepted accounting principles. A company's internal control over financial reporting includes those policies and procedures that (1) pertain to the maintenance of records that, in reasonable detail, accurately and fairly reflect the transactions and dispositions of the assets of the company; (2) provide reasonable assurance that transactions are recorded as necessary to permit preparation of financial statements in accordance with generally accepted accounting principles, and that receipts and expenditures of the company are being made only in accordance with authorizations of management and directors of the company; and (3) provide reasonable assurance regarding prevention or timely detection of unauthorized acquisition, use, or disposition of the company's assets that could have a material effect on the financial statements.
Because of its inherent limitations, internal control over financial reporting may not prevent or detect misstatements. Also, projections of any evaluation of effectiveness to future periods are subject to the risk that controls may become inadequate because of changes in conditions, or that the degree of compliance with the policies or procedures may deteriorate.
A material weakness is a deficiency, or a combination of deficiencies, in internal control over financial reporting, such that there is a reasonable possibility that a material misstatement of the company's annual or interim financial statements will not be prevented or detected on a timely basis. The following material weaknesses have been identified and included in management's assessment as of September 30, 2009:
1.The Company did not design, implement and maintain effective controls over the accounting for the accuracy and valuation of inventory.
2.The Company did not design, implement and maintain effective security management controls that would limit and enforce access to applications and data.
These material weaknesses were considered in determining the nature, timing, and extent of audit tests applied in our audit of the 2009 financial statements, and this report does not affect our report dated December 11, 2009 on those financial statements.
Table of Contents
In our opinion, Vitesse Semiconductor Corporation did not maintain,maintained, in all material respects, effective internal control over financial reporting as of September 30, 2009,2010, based on the COSO criteria.
We also have audited, in accordance with the standards of the Public Company Accounting Oversight Board (United States), the consolidated balance sheets of Vitesse Semiconductor Corporation as of September 30, 20092010 and 2008,2009 and the related consolidated statements of operations, shareholders'stockholders' (deficit) equity and comprehensive income (loss), and cash flows for each of the three years in the period ended September 30, 20092010 and our report dated December 11, 20091, 2010 expressed an unqualified opinion thereon.
BDO USA, LLP
Los Angeles, California
| | |
/s/ BDO Seidman, LLP | | |
Los Angeles, California
December 11, 2009 |
|
|
December 1, 2010
Table of Contents
ITEM 9B. OTHER INFORMATION
None.
PART III
ITEM 10. DIRECTORS, EXECUTIVE OFFICERS AND CORPORATE GOVERNANCE
The information required by this item is incorporated by reference from the Company's Proxy Statement for the 20092011 Annual Meeting of Stockholders under the headings "Election of Directors," "Executive Officers," "Corporate Governance, Board"Board Meetings and Committees," and "Section 16(a) Beneficial Ownership Reporting Compliance."
ITEM 11. EXECUTIVE COMPENSATION
The information required by this item is incorporated by reference from the Company's Proxy Statement for the 20092011 Annual Meeting of Stockholders under the headings "Executive Compensation" andCompensation," "Director Compensation," "Compensation Committee Interlocks and Insider Participation," and "Compensation Committee Report."
ITEM 12. SECURITY OWNERSHIP OF CERTAIN BENEFICIAL OWNERS AND MANAGEMENT AND RELATED STOCKHOLDER MATTERS
The information required by this item if any, is incorporated by reference from the Company's Proxy Statement for the 20092011 Annual Meeting of Stockholders under the heading "Ownership"Security Ownership of Certain Beneficial Owners and Management" and "Equity Compensation Plan Information."
ITEM 13. CERTAIN RELATIONSHIPS AND RELATED TRANSACTIONS, AND DIRECTOR INDEPENDENCE
The information required by this item if any, is incorporated by reference from the Company's Proxy Statement for the 20092011 Annual Meeting of Stockholders under the heading "Corporate Governance, Board Meetings"Director Independence" and Committees""Certain Relationships and "Transactions with Related Persons.Person Transactions."
ITEM 14. PRINCIPAL ACCOUNTANT FEES AND SERVICES
The information required by this item is incorporated by reference from the Company's Proxy Statement for the 20092011 Annual Meeting of Stockholders under the heading "Audit Matters."Principal Accountant Fees and Services" and "Pre-Approval Policies and Procedures."
PART IV
ITEM 15. EXHIBITS AND FINANCIAL STATEMENT SCHEDULES
(a)(1) and (2)
See the financial statements and financial statement schedules listed in Item 8. Financial Statements and Supplementary Data.
(b)Exhibits
Table of Contents
VITESSE SEMICONDUCTOR CORPORATION
SCHEDULE II—Valuation and Qualifying Accounts
Years ended September 30, 2009, 2008 and 2007
(in thousands)
| | | | | | | | | | | | | | | |
| | Balance at
Beginning
of Year | | Charged to
Other
Accounts | | Deductions/
Write-offs | | Balance at
End of Year | |
|---|
Year ended September 30, 2009 | | | | | | | | | | | | | |
| | Deducted from accounts receivable: | | | | | | | | | | | | | |
| | | Allowance for doubtful accounts | | $ | — | | $ | — | | $ | — | | $ | — | |
| | | Allowance for sales reserve | | | 53 | | | (35 | ) | | — | | | 18 | |
| | Deducted from deferred tax asset | | | | | | | | | | | | | |
| | | Valuation allowance | | | 441,534 | | | (224 | ) | | (19,209 | ) | | 422,101 | |
Year ended September 30, 2008 | | | | | | | | | | | | | |
| | Deducted from accounts receivable: | | | | | | | | | | | | | |
| | | Allowance for doubtful accounts | | $ | 253 | | $ | (253 | ) | $ | — | | $ | — | |
| | | Allowance for sales reserve | | | 142 | | | (89 | ) | | — | | | 53 | |
| | Deducted from deferred tax asset | | | | | | | | | | | | | |
| | | Valuation allowance | | | 470,422 | | | (15,224 | ) | | (13,664 | ) | | 441,534 | |
Year ended September 30, 2007 | | | | | | | | | | | | | |
| | Deducted from accounts receivable: | | | | | | | | | | | | | |
| | | Allowance for doubtful accounts | | | 46 | | | 249 | | | (42 | ) | | 253 | |
| | | Allowance for sales reserve | | | 170 | | | (28 | ) | | — | | | 142 | |
| | Deducted from deferred tax asset | | | | | | | | | | | | | |
| | | Valuation allowance | | | 484,263 | | | (13,841 | ) | | — | | | 470,422 | |
| | |
| (a)(1) | | See the financial statements and financial statement schedules listed in Item 8. Financial Statements and Supplementary Data. |
(a)(2) |
|
See Schedule II "Valuation and Qualifying Accounts." |
(a)(3) |
|
See Exhibit Index following the signature page to this Annual Report on Form 10-K. |
Table of Contents
EXHIBITS
VITESSE SEMICONDUCTOR CORPORATION
SCHEDULE II—Valuation and Qualifying Accounts
Years ended September 30, 2010, 2009 and 2008
(in thousands)
| | | |
| 2.1 | | Purchase and Sale Letter Agreement, dated October 29, 2007 between the Company and Maxim Integrated Products, Inc. (Incorporated by reference to Exhibit 10.2 to the Company's Form 8-K filed August 29, 2007). |
| | | |
| 3.1 | | Amended and Restated Certificate of Incorporation. (Incorporated by reference to Exhibit 3.1 to the Company's Quarterly Report on Form 10-Q for the period ended March 31, 2000 filed May 5, 2000). |
| | | |
| 3.2 | | Bylaws. (Incorporated by reference to Exhibit 3.2 to the Company's current report on Form 8-K filed on December 2, 2004). |
| | | |
| 4.1 | | Specimen of Registrant's Common Stock Certificate. (Incorporated by reference to the Company's Registration Statement on Form S-1 (File no. 33-43548), effective December 10, 1991 filed October 25, 1991). |
| | | |
| 4.2 | | Rights Agreement dated as of March 3, 2003 between Vitesse Semiconductor Corporation and EquiServe Trust Company, N.A., as Rights Agent. (Incorporated by reference to Exhibit 1 to the Form 8-A12(g) filed March 5, 2003). |
| | | |
| 4.3 | | Second Amendment to Rights Agreement, dated October 16, 2009, between the Company and EquiServe Trust Company, N.A., as Rights Agent (Incorporated by reference to Exhibit 4.2 to the Company's Form 8-K filed October 20, 2009). |
| | | |
| 4.4 | | Warrant Registration Rights Agreement, dated January 25, 2007. (Incorporated by reference to Exhibit 10.2 to the Company's Form 8-K filed January 31, 2007). |
| | | |
| 4.5 | | Certificate of Designation with respect to Series B Participating Convertible Non-Cumulative Preferred Stock (Incorporated by reference to Exhibit 4.3 to the Company's Form 8-K filed October 30, 2009). |
| | | |
| 4.6 | | Indenture between Vitesse Semiconductor Corporation and U.S. Bank National Association, as Trustee (including form of 1.50% Convertible Subordinated Debentures due 2024), dated as of September 22, 2004. (Incorporated by reference to Exhibit 10.1 to the Company's Form 8-K filed September 23, 2004). |
| | | |
| 4.7 | | First Supplemental Indenture, dated November 3, 2006 between the Company and U.S. Bank National Assoc. as Trustee. (Incorporated by reference to Exhibit 99 to the Company's Form 8-K filed November 9, 2006). |
| | | |
| 4.8 | | Second Supplemental Indenture, dated September 24, 2007 between the Company and U.S. Bank National Association. (Incorporated by reference to Exhibit 10.1 to the Company's Form 8-K filed September 27, 2007). |
| | | |
| 4.9 | | Third Supplemental Indenture, dated October 16, 2009, by and between the Company and U.S. Bank National Association, as Trustee (Incorporated by reference to Exhibit 4.1 to the Company's Form 8-K filed October 20, 2009). |
| | | |
| 4.10 | | Guaranty, dated October 16, 2009, executed by Vitesse Manufacturing & Development Corporation and Vitesse Semiconductor Sales Corporation in favor of U.S. Bank National Association, as Trustee, under the Indenture dated September 22, 2004, governing the Company's 1.5% Convertible Subordinated Debentures Due 2024 (Incorporated by reference to Exhibit 10.5 to the Company's Form 8-K filed October 20, 2009). |
| | | |
| 4.11 | | Indenture between the Company and U.S. Bank National Association, as Trustee, dated as of October 30, 2009 (Incorporated by reference to Exhibit 4.1 to the Company's Form 8-K filed October 30, 2009).. |
Table of Contents
| | | |
| | | |
| 10.1 | | Letter Agreement between the Company and Michael Green dated January 2, 2007. (Incorporated by reference to Exhibit 10.1 to the Company's Form 8-K filed January 31, 2007). |
| | | |
| 10.2 | | Change in Control Agreement between the Company and Michael Green dated February 25, 2009. (Incorporated by reference to Exhibit 10.3 to the Company's Form 8-K filed February 26, 2009). |
| | | |
| 10.3 | | Employment Agreement between the Company and Richard Yonker dated February 20, 2009. (Incorporated by reference to Exhibit 10.2 to the Company's Form 8-K filed February 26, 2009). |
| | | |
| 10.4 | | Amended and Restated Employment Agreement between the Company and Christopher Gardner dated February 25, 2009. (Incorporated by reference to Exhibit 10.1 to the Company's Form 8-K filed February 26, 2009). |
| | | |
| 10.5 | | Letter Agreement, dated October 26, 2007 between the Company and Dr. Martin C. Nuss (Incorporated by reference to Exhibit 10.1 to the Company's Form 8-K filed November 20, 2007). |
| | | |
| 10.6 | | Form of Indemnity Agreement between the directors and the Company. (Incorporated by reference to Exhibit 10.1 to the Company's Form 8-K filed August 22, 2007). |
| | | |
| 10.7 | | Loan Agreement, dated August 23, 2007 between the Company and Whitebox VSC, Ltd. (Incorporated by reference to Exhibit 10.3 to the Company's Form 8-K filed August 29, 2007). |
| | | |
| 10.8 | | First Amendment to Loan Agreement, dated as of October 16, 2009, among Vitesse Semiconductor Corporation, the Lenders named therein and Whitebox VSC Ltd., as agent (Incorporated by reference to Exhibit 10.4 to the Company's Form 8-K filed October 20, 2009). |
| | | |
| 10.9 | | Senior Unsecured Convertible Note Purchase Agreement, dated August 23, 2007 between the Company and Whitebox VSC, Ltd. (Incorporated by reference to Exhibit 10.4 to the Company's Form 8-K filed August 29, 2007). |
| | | |
| 10.10 | | Term Note, dated October 29, 2007 between the Company and Whitebox VSC, Ltd. for $30 million. (Incorporated by reference to Exhibit 4.1 to the Company's Form 8-K filed October 31, 2007). |
| | | |
| 10.11 | | Form of Forbearance Agreement, dated October 1, 2009, by and among the Company and beneficial owners of 1.5% Convertible Subordinated Debentures due 2024 (Incorporated by reference to Exhibit 10.1 to the Company's Form 8-K filed October 6, 2009). |
| | | |
| 10.12 | | Form of Forbearance Agreement, dated October 9, 2009, by and among the Company and beneficial owners of 1.5% Convertible Subordinated Debentures due 2024 (Incorporated by reference to Exhibit 10.1 to the Company's Form 8-K filed October 14, 2009). |
| | | |
| 10.13 | | Form of Forbearance Agreement, dated October 16, 2009, by and among the Company and beneficial owners of 1.5% Convertible Subordinated Debentures due 2024 (Incorporated by reference to Exhibit 10.2 to the Company's Form 8-K filed October 20, 2009). |
| | | |
| 10.14 | | Forbearance Agreement, dated October 1, 2009, between the Company and Whitebox VSC, Ltd. (Incorporated by reference to Exhibit 10.1 to the Company's Form 8-K filed October 6, 2009). |
| | | |
| 10.15 | | Second Forbearance Agreement, dated October 9, 2009, between the Company and Whitebox VSC, Ltd. (Incorporated by reference to Exhibit 10.1 to the Company's Form 8-K filed October 14, 2009). |
|
| | |
Table of Contents
| | | |
| 10.16 | | Third Forbearance Agreement, dated October 16, 2009, between the Company and Whitebox VSC Ltd. (Incorporated by reference to Exhibit 10.3 to the Company's Form 8-K filed October 20, 2009). |
| | | |
| 10.17 | | Debt Conversion Agreement, dated October 16, 2009, by and among the Company and AQR Absolute Return Master Account, L.P., Aristeia Master, L.P., Aristeia Partners, L.P., CNH Master Account, L.P., Linden Capital L.P., Whitebox Advisors, LLC, Tonga Partners, L.P., Tonga Partners QP, L.P., Anegada Master Fund, LTD., Cuttyhunk Master Portfolio and ABN AMRO Bank N.V. (Incorporated by reference to Exhibit 10.1 to the Company's Form 8-K filed October 20, 2009). |
| | | |
| 10.18 | | Form of Lock-Up Agreement, dated October 16, 2009, by and among the Company and the beneficial owners of 1.5% Convertible Subordinated Debentures due 2024 (Incorporated by reference to Exhibit 10.6 to the Company's Form 8-K filed October 20, 2009). |
| | | |
| 10.19 | | Form of 8.0% Convertible Second Lien Debentures Due 2014 (Incorporated by reference to Exhibit 4.1 to the Company's Form 8-K filed October 30, 2009). |
| | | |
| 10.20 | | Intellectual Property, Assignment and License Agreement, dated October 29, 2007 between the Company and Maxim Integrated Products, Inc. (Incorporated by reference to Exhibit 10.1 to the Company's Form 8-K filed October 31, 2007). |
| | | |
| 10.21 | | Sale and Purchase Agreement, dated June 30, 2009, between the Company and a third-party purchaser (portions of this exhibit have been omitted pursuant to a request for confidential treatment) (Incorporated by reference to Exhibit 10.11 to the Company's Form 10-Q filed August 10, 2009). |
| | | |
| 10.22 | | Vitesse Semiconductor Corporation Amended and Restated 2001 Stock Incentive Plan as of September 15, 2008. (Incorporated by reference to Exhibit 4.3 to the Company's Form S-8 filed December 31, 2008). |
| | | |
| 10.23 | | Vitesse Semiconductor Corporation Fiscal Year 2009 Executive Bonus Plan, dated as of January 16, 2009 (Incorporated by reference to Exhibit 4.9 to the Company's form 10-Q filed February 17, 2009) (portions of this exhibit have been omitted pursuant to a request for confidential treatment). |
| | | |
| 21.1 | * | Subsidiaries of the Company. |
| | | |
| 23.1 | * | Consent of BDO Seidman, LLP, Independent Registered Public Accounting Firm. |
| | | |
| 31.1 | * | Rule13a-14(a) / 302 SOX Certification of Chief Executive Officer. |
| | | |
| 31.2 | * | Rule13a-14(a) / 302 SOX Certification of Chief Financial Officer. |
| | | |
| 32.1 | * | Section 1350 Certifications of Chief Executive Officer and Chief Financial Officer. |
*Filed herewith.
| | | | | | | | | | | | | | | |
| | Balance at
Beginning
of Year | | Charged to
Other
Accounts | | Deductions/
Write-offs | | Balance at
End
of Year | |
|---|
Year ended September 30, 2010 | | | | | | | | | | | | | |
| | Deducted from deferred tax asset | | | | | | | | | | | | | |
| | | Valuation allowance | | $ | 422,101 | | $ | (328,862 | ) | $ | — | | $ | 93,239 | |
Year ended September 30, 2009 | | | | | | | | | | | | | |
| | Deducted from deferred tax asset | | | | | | | | | | | | | |
| | | Valuation allowance | | $ | 441,534 | | $ | (224 | ) | $ | (19,209 | ) | $ | 422,101 | |
Year ended September 30, 2008 | | | | | | | | | | | | | |
| | Deducted from accounts receivable: | | | | | | | | | | | | | |
| | | Allowance for doubtful accounts | | $ | 253 | | $ | (253 | ) | $ | — | | $ | — | |
| | Deducted from deferred tax asset | | | | | | | | | | | | | |
| | | Valuation allowance | | | 470,422 | | | (15,224 | ) | | (13,664 | ) | | 441,534 | |
Table of Contents
SIGNATURES
Pursuant to the requirements of Section 13 or 15(d) of the Securities Exchange Act of 1934, the Registrant has duly caused this report to be signed on its behalf by the undersigned, thereunto duly authorized.
| | | | |
| | | VITESSE SEMICONDUCTOR CORPORATION
(Registrant) |
Dated: December 11, 20091, 2010 |
|
By: |
|
/s/ CHRISTOPHER R. GARDNER
CHRISTOPHER R. GARDNER
Chief Executive Officer |
Pursuant to the requirements of the Securities Exchange Act of 1934, this report has been signed below by the following persons on behalf of the Registrant and in the capacities and on the date indicated.
| | | | |
Dated: December 11, 20091, 2010 | | By: | | /s/ CHRISTOPHER R. GARDNER
CHRISTOPHER R. GARDNER
Director and Chief Executive Officer |
Dated: December 11, 20091, 2010 |
|
By: |
|
/s/ RICHARD C. YONKER
RICHARD C. YONKER
Chief Financial Officer
(Principal Financial and Accounting Officer) |
Dated: December 11, 20091, 2010 |
|
By: |
|
/s/ STEVEN P. HANSON
STEVEN P. HANSON
Director |
Dated: December 11, 20091, 2010 |
|
By: |
|
/s/ JAMES HUGAR
JAMES HUGAR
Director |
Dated: December 11, 20091, 2010 |
|
By: |
|
/s/ G. WILLIAM LAROSA
G. WILLIAM LAROSA
Director |
Dated: December 1, 2010 |
|
By: |
|
/s/ G. GRANT LYON
G. GRANT LYON
Director |
Dated: December 11, 20091, 2010 |
|
By: |
|
/s/ EDWARD ROGAS, JR.
EDWARD ROGAS, JR.
Director |
Table of Contents
EXHIBIT INDEX
In reviewing the agreements included as exhibits to this Annual Report on Form 10-K, please remember they are included to provide you with information regarding their terms and are not intended to provide any other factual or disclosure information about Vitesse or the other parties to the agreements. The agreements may contain representations and warranties by each of the parties to the applicable agreement. These representations and warranties have been made solely for the benefit of the other party or parties to the applicable agreement and:
- •
- should not in all instances be treated as categorical statements of fact, but rather as a means of allocating the risk to one of the parties if those statements prove to be inaccurate;
- •
- may have been qualified by disclosures that were made to the other party or parties in connection with the negotiation of the applicable agreement, which disclosures are not necessarily reflected in the agreement;
- •
- may apply standards of materiality in a manner that is different from what may be viewed as material to you or other investors; and
- •
- were made only as of the date of the applicable agreement or other date or dates that may be specified in the agreement and are subject to more recent developments.
Accordingly, these representations and warranties may not describe the actual state of affairs as of the date they were made or at any other time. Additional information about Vitesse may be found elsewhere in this Annual Report on Form 10-K and Vitesse's other public filings, which are available without charge through the SEC's website at www.sec.gov.
| | | |
| Number | | Exhibit Description |
|---|
| 2.1 | † | Asset Purchase Agreement, dated August 23, 2007 between the Company and Maxim Integrated Products, Inc. (Incorporated by reference to Exhibit 10.1 to the Company's Current Report on Form 8-K filed on August 29, 2007 (File No. 001-31614)). |
|
3.1 |
|
Restated Certificate of Incorporation (Incorporated by reference to Exhibit 3.1 to the Company's Quarterly Report on Form 10-Q for the period ended June 30, 2010 filed on August 9, 2010 (File No. 001-31614)). |
|
3.2 |
|
Amended and Restated Bylaws (Incorporated by reference to Exhibit 3.2 to the Company's Current Report on Form 8-K filed on December 2, 2004 (File No. 001-31614)). |
|
4.1 |
|
Rights Agreement dated as of March 3, 2003 between Vitesse Semiconductor Corporation and EquiServe Trust Company, N.A., as Rights Agent (Incorporated by reference to Exhibit 1 to the Registration Statement on Form 8-A12 (g) filed March 5, 2003 (Registration No. 000-19654)). |
|
4.2 |
|
Second Amendment to Rights Agreement, dated October 16, 2009, between the Company and Computershare Trust Company (formerly known as EquiServe Trust Company, N.A.) as Rights Agent (Incorporated by reference to Exhibit 4.2 to the Company's Current Report on Form 8-K filed October 20, 2009 (File No. 001-31614)). |
|
4.3 |
|
Indenture between Vitesse Semiconductor Corporation and U.S. Bank National Association, as Trustee (including form of 1.50% Convertible Subordinated Debentures due 2024), dated as of September 22, 2004 (Incorporated by reference to Exhibit 10.1 to the Company's Current Report on Form 8-K filed September 23, 2004 (File No. 001-31614)). |
|
4.4 |
|
First Supplemental Indenture, dated November 3, 2006 between the Company and U.S. Bank National Assoc. as Trustee (Incorporated by reference to Exhibit 4.1 to the Company's Current Report on Form 8-K filed November 9, 2006 (File No. 001-31614)). |
Table of Contents
| | | |
| Number | | Exhibit Description |
|---|
| 4.5 | | Second Supplemental Indenture, dated September 24, 2007 between the Company and U.S. Bank National Association. (Incorporated by reference to Exhibit 10.1 to the Company's Current Report on Form 8-K filed September 27, 2007 (File No. 001-31614)). |
|
4.6 |
|
Third Supplemental Indenture, dated October 16, 2009, by and between the Company and U.S. Bank National Association, as Trustee (Incorporated by reference to Exhibit 4.1 to the Company's Current Report on Form 8-K filed October 20, 2009 (File No. 001-31614)). |
|
4.7 |
|
Guaranty, dated October 16, 2009, executed by Vitesse Manufacturing & Development Corporation and Vitesse Semiconductor Sales Corporation in favor of U.S. Bank National Association, as Trustee, under the Indenture dated September 22, 2004, governing the Company's 1.5% Convertible Subordinated Debentures Due 2024 (Incorporated by reference to Exhibit 10.5 to the Company's Current Report on Form 8-K filed October 20, 2009 (File No. 001-31614)). |
|
4.8 |
|
Indenture between the Company and U.S. Bank National Association, as Trustee, dated as of October 30, 2009 (Incorporated by reference to Exhibit 4.1 to the Company's Current Report on Form 8-K filed October 30, 2009 (File No. 001-31614)). |
|
4.9 |
|
Form of 8.0% Convertible Second Lien Debentures Due 2014 (included in Exhibit 4.8) |
|
4.10 |
|
Guaranty, dated October 30, 2009, executed by Vitesse Manufacturing & Development Corporation and Vitesse Semiconductor Sales Corporation in favor of U.S. Bank National Association, as Trustee, under the Indenture dated October 30, 2009 (Incorporated by reference to Exhibit 4.6 to the Company's Form 10-K/A filed January 28, 2010 (File No. 001-31614)). |
|
10.1 |
|
Letter Agreement between the Company and Michael Green dated January 2, 2007 (Incorporated by reference to Exhibit 10.1 to the Company's Form 8-K filed January 31, 2007 (File No. 001-31614)). |
|
10.2 |
|
Change in Control Agreement between the Company and Michael Green dated February 25, 2009. (Incorporated by reference to Exhibit 10.3 to the Company's Form 8-K filed February 26, 2009 (File No. 001-31614)). |
|
*10.3 |
|
Resignation and Separation Agreement and General Release of Claims between the Company and Michael Green dated February 5, 2010 (Incorporated by reference to Exhibit 10.1 to the Company's Quarterly Report on Form 10-Q for the period ended March 31, 2010 filed May 17, 2010 (File No. 001-31614)). |
|
*10.4 |
|
Employment Agreement between the Company and Richard Yonker dated February 20, 2009. (Incorporated by reference to Exhibit 10.2 to the Company's Current Report on Form 8-K filed February 26, 2009 (File No. 001-31614)). |
|
*10.5 |
|
Employment Agreement between the Company and Christopher Gardner dated February 12, 2010. (Incorporated by reference to Exhibit 10.2 to the Company's Quarterly Report on Form 10-Q for the period ended March 31, 2010 filed May 17, 2010 (File No. 001-31614)). |
|
*10.6 |
|
Letter Agreement, dated October 26, 2007 between the Company and Dr. Martin C. Nuss (Incorporated by reference to Exhibit 10.1 to the Company's Current Report on Form 8-K filed November 20, 2007 (File No. 001-31614)). |
|
10.7 |
|
Form of Indemnity Agreement between each of the directors and the Company (Incorporated by reference to Exhibit 10.1 to the Company's Form 8-K filed August 22, 2007 (File No. 001-31614)). |
Table of Contents
| | | |
| Number | | Exhibit Description |
|---|
| 10.8 | | Loan Agreement, dated August 23, 2007 between the Company and Whitebox VSC, Ltd. (Incorporated by reference to Exhibit 10.3 to the Company's Current Report on Form 8-K filed August 29, 2007 (File No. 001-31614)). |
|
10.9 |
|
First Amendment to Loan Agreement, dated as of October 16, 2009, among Vitesse Semiconductor Corporation, the Lenders named therein and Whitebox VSC Ltd., as agent (Incorporated by reference to Exhibit 10.4 to the Company's Current Report on Form 8-K filed October 20, 2009 (File No. 001-31614)). |
|
10.10 |
|
Term Note, dated October 29, 2007 between the Company and Whitebox VSC, Ltd. for $30 million. (Incorporated by reference to Exhibit 4.1 to the Company's Current Report on Form 8-K filed October 31, 2007 (File No. 001-31614)). |
|
10.11 |
|
Senior Unsecured Convertible Note Purchase Agreement, dated August 23, 2007 between the Company and Whitebox VSC, Ltd. (Incorporated by reference to Exhibit 10.4 to the Company's Current Report on Form 8-K filed August 29, 2007 (File No. 001-31614)). |
|
10.12 |
|
Debt Conversion Agreement, dated October 16, 2009, by and among the Company and AQR Absolute Return Master Account, L.P., Aristeia Master, L.P., Aristeia Partners, L.P., CNH Master Account, L.P., Linden Capital L.P., Whitebox Advisors, LLC, Tonga Partners, L.P., Tonga Partners QP, L.P., Anegada Master Fund, LTD., Cuttyhunk Master Portfolio and ABN AMRO Bank N.V. (Incorporated by reference to Exhibit 10.1 to the Company's Current Report on Form 8-K filed October 20, 2009 (File No. 001-31614)). |
|
10.13 |
|
Form of Lock-Up Agreement, dated October 16, 2009, by and among the Company and the beneficial owners of 1.5% Convertible Subordinated Debentures due 2024 (Incorporated by reference to Exhibit 10.6 to the Company's Current Report on Form 8-K filed October 20, 2009 (File No. 001-31614)). |
|
10.14 |
|
Intellectual Property, Assignment and License Agreement, dated October 29, 2007 between the Company and Maxim Integrated Products, Inc. (Incorporated by reference to Exhibit 10.1 to the Company's Current Report on Form 8-K filed October 31, 2007 (File No. 001-31614)). |
|
10.15 |
|
Sale and Purchase Agreement for Vitesse Patents, dated June 30, 2009, between the Company and a third-party purchaser (Incorporated by reference to Exhibit 10.11 to the Company's Quarterly Report on Form 10-Q for the period ended June 30, 2009 filed August 10, 2009 (File No. 001-31614)).(1) |
|
*10.16 |
|
Vitesse Semiconductor Corporation Amended and Restated 2001 Stock Incentive Plan as of September 4, 2009. (Incorporated by reference to Exhibit 10.13 to the Company's Form 10-K/A filed January 28, 2010 (File No. 001-31614)). |
|
*10.17 |
|
Form of Notice of Grant of Stock Options and Option Agreement under the Vitesse Semiconductor Corporation Amended and Restated 2001 Stock Incentive Plan (Incorporated by reference to Exhibit 10.14 to the Company's Form 10-K/A filed January 28, 2010). |
|
*10.18 |
|
Form of Notice of Grant of Restricted Stock Units and RSU Agreement under the Vitesse Semiconductor Corporation Amended and Restated 2001 Stock Incentive Plan (Incorporated by reference to Exhibit 10.15 to the Company's Form 10-K/A filed January 28, 2010 (File No. 001-31614)). |
|
*10.19 |
|
Vitesse Semiconductor Corporation Fiscal Year 2010 Executive Bonus Plan, dated as of January 7, 2010 (Incorporated by reference to Exhibit 10.16 to the Company's Form 10-Q for the period ended December 31, 2009 filed February 9, 2010 (File No. 001-31614)). |
Table of Contents
| | | |
| Number | | Exhibit Description |
|---|
| *10.20 | | Vitesse Semiconductor Corporation 2010 Incentive Plan (incorporated by reference to Appendix A of the Company's Definitive Proxy Statement on Schedule 14A filed on March 31, 2010 (File No. 001-31614)). |
|
*10.21 |
|
Automatic Equity Grant Program for Eligible Directors under the Vitesse Semiconductor Corporation 2010 Incentive Plan. (Incorporated by reference to Exhibit 10.2 to the Company's Quarterly Report on Form 10-Q for the period ended June 30, 2010 filed August 9, 2010 (File No. 001-31614)). |
|
*10.22 |
|
Employment Agreement between the Company and Steve M. Perna dated August 2, 2010. |
|
21.1 |
|
Subsidiaries of the Company. |
|
23.1 |
|
Consent of BDO USA, LLP, Independent Registered Public Accounting Firm. |
|
31.1 |
|
Rule13a-14(a) / 302 SOX Certification of Chief Executive Officer. |
|
31.2 |
|
Rule13a-14(a) / 302 SOX Certification of Chief Financial Officer. |
|
32.1 |
|
Section 1350 Certifications of Chief Executive Officer and Chief Financial Officer. |
- *
- Management contract or compensatory plan or arrangement.
- †
- All schedules and certain exhibits to the Asset Purchase Agreement have been omitted pursuant to Item 601(b)(2) of Regulation S-K. The Registrant agrees to furnish supplementally a copy of the omitted schedules and exhibits to the Securities and Exchange Commission upon request.
- (1)
- Confidential treatment has been granted for certain portions omitted from this exhibit pursuant to an order granted by the Commission on October 23, 2009, under Rule 24b-2 of the Securities Exchange Act of 1934, as amended. Confidential portions of this exhibit have been separately filed with the Securities and Exchange Commission.