
Use these links to rapidly review the document
TABLE OF CONTENTS
UNITED STATES
SECURITIES AND EXCHANGE COMMISSION
Washington, D.C. 20549
FORM 10-K
ANNUAL REPORT PURSUANT TO SECTION 13 OR 15(d) OF THE
SECURITIES EXCHANGE ACT OF 1934
For the Fiscal Year Ended December 31, 20092012
Commission File Number 1-4949
CUMMINS INC.
| Indiana (State of Incorporation) | 35-0257090 (IRS Employer Identification No.) |
500 Jackson Street
Box 3005
Columbus, Indiana 47202-3005
(Address of principal executive offices)
Telephone (812) 377-5000
Securities registered pursuant to Section 12(b) of the Act:
| Title of each class | Name of each exchange on which registered | |
|---|---|---|
| Common Stock, $2.50 par value | New York Stock Exchange |
Securities registered pursuant to Section 12(g) of the Act:None.
Indicate by check mark if the registrant is a well-known seasoned issuer, as defined in Rule 405 of the Securities Act. Yes ý No o
Indicate by check mark if the registrant is not required to file reports pursuant to Section 13 or Section 15(d) of the Act. Yes o No ý
Indicate by check mark whether the registrant: (1) has filed all reports required to be filed by Section 13 or 15(d) of the Securities Exchange Act of 1934 during the preceding 12 months (or for such shorter period that the registrant was required to file such reports) and (2) has been subject to such filing requirements for the past 90 days. Yes ý No o
Indicate by check mark whether the registrant has submitted electronically and posted on its corporate Web site, if any, every Interactive Data File required to be submitted and posted pursuant to Rule 405 of Regulation S-T (§ 229.405 of this chapter) during the preceedingpreceding 12 months (or for such shorter period that the registrant was required to submit and post such files). Yes ý No o
Indicate by check mark if disclosure of delinquent filers pursuant to Item 405 of Regulation S-K is not contained herein, and will not be contained, to the best of registrant's knowledge, in definitive proxy or information statements incorporated by reference in Part III of this Form 10-K or any amendment to this Form 10-K. o
Indicate by check mark whether the registrant is a large accelerated filer, an accelerated filer, a non-accelerated filer, or a smaller reporting company. See the definition of "large accelerated filer," "accelerated filer" and "smaller reporting company" in Rule 12b-2 of the Exchange Act. (Check one):
Large accelerated filer ý | Accelerated filer o | Non-accelerated filer o (Do not check if a smaller reporting company) | Smaller reporting company o |
Indicate by check mark whether the registrant is a shell company (as defined in Rule 12b-2 of the Exchange Act). Yes o No ý
The aggregate market value of the voting stock held by non-affiliates was approximately $7$18.5 billion at June 28, 2009.July 1, 2012. This value includes all shares of the registrant's common stock, except for treasury shares.
As of January 29, 2010,February 1, 2013, there were 201,359,036189,844,829 shares outstanding of $2.50 par value common stock.
Documents Incorporated by Reference
Portions of the registrant's definitive Proxy Statement for its 20102013 annual meeting of shareholders, which will be filed with the Securities and Exchange Commission on Schedule 14A within 120 days after the end of 2009,2012, will be incorporated by reference in Part III of this Form 10-K to the extent indicated therein upon such filing.
Website Access to Company's Reports
We maintain an internet website at www.cummins.com. Investors may obtain copies of our filings from this website free of charge as soon as reasonable practicable after they are electronically filed with, or furnished to, the Securities and Exchange Commission.
CUMMINS INC. AND SUBSIDIARIES
TABLE OF CONTENTS
Part | Item | | | | Page | ||||||||||||||
|---|---|---|---|---|---|---|---|---|---|---|---|---|---|---|---|---|---|---|---|
PART | ITEM | | PAGE | ||||||||||||||||
Cautionary Statements Regarding Forward-Looking Information | 3 | Cautionary Statements Regarding Forward-Looking Information | 3 | ||||||||||||||||
I | 1 | Business | 4 | 1 | Business | 5 | |||||||||||||
Overview | 5 | ||||||||||||||||||
Overview | 4 | Operating Segments | 5 | ||||||||||||||||
Operating Segments | 4 | Engine Segment | 5 | ||||||||||||||||
Engine Segment | 4 | Components Segment | 6 | ||||||||||||||||
Power Generation Segment | 5 | Power Generation Segment | 8 | ||||||||||||||||
Components Segment | 6 | Distribution Segment | 9 | ||||||||||||||||
Distribution Segment | 8 | Joint Ventures, Alliances and Non-Wholly-Owned Subsidiaries | 10 | ||||||||||||||||
Joint Ventures, Alliances and Non-Wholly-Owned Subsidiaries | 9 | Supply | 14 | ||||||||||||||||
Supply | 11 | Patents and Trademarks | 14 | ||||||||||||||||
Patents and Trademarks | 11 | Seasonality | 14 | ||||||||||||||||
Seasonality | 12 | Largest Customers | 14 | ||||||||||||||||
Largest Customers | 12 | Backlog | 15 | ||||||||||||||||
Backlog | 12 | Research and Development Expense | 15 | ||||||||||||||||
Research and Development Expense | 12 | Environmental Sustainability | 16 | ||||||||||||||||
Environmental Compliance | 13 | Environmental Compliance | 16 | ||||||||||||||||
Employees | 14 | Employees | 17 | ||||||||||||||||
Available Information | 14 | Available Information | 17 | ||||||||||||||||
Executive Officers of the Registrant | 15 | Executive Officers of the Registrant | 18 | ||||||||||||||||
| 1A | Risk Factors | 16 | 1A | Risk Factors | 20 | ||||||||||||||
| 1B | Unresolved Staff Comments | 22 | 1B | Unresolved Staff Comments | 27 | ||||||||||||||
| 2 | Properties | 23 | 2 | Properties | 27 | ||||||||||||||
| 3 | Legal Proceedings | 24 | 3 | Legal Proceedings | 28 | ||||||||||||||
| 4 | Submission of Matters to a Vote of Security Holders | 25 | 4 | Mine Safety Disclosures | 29 | ||||||||||||||
II | 5 | Market for Registrant's Common Equity, Related Stockholder Matters and Issuer Purchases of Equity Securities | 26 | 5 | Market for Registrant's Common Equity, Related Stockholder Matters and Issuer Purchases of Equity Securities | 29 | |||||||||||||
| 6 | Selected Financial Data | 28 | 6 | Selected Financial Data | 31 | ||||||||||||||
| 7 | Management's Discussion and Analysis of Financial Condition and Results of Operations | 29 | 7 | Management's Discussion and Analysis of Financial Condition and Results of Operations | 33 | ||||||||||||||
| 7A | Quantitative and Qualitative Disclosures About Market Risk | 67 | 7A | Quantitative and Qualitative Disclosures About Market Risk | 76 | ||||||||||||||
| 8 | Financial Statements and Supplementary Data | 70 | 8 | Financial Statements and Supplementary Data | 79 | ||||||||||||||
| 9 | Changes in and Disagreements with Accountants on Accounting and Financial Disclosure | 142 | Index to Financial Statements | 79 | |||||||||||||||
| 9A | Controls and Procedures | 142 | 9 | Changes in and Disagreements with Accountants on Accounting and Financial Disclosure | 152 | ||||||||||||||
| 9B | Other Information | 142 | 9A | Controls and Procedures | 152 | ||||||||||||||
| 9B | Other Information | 152 | |||||||||||||||||
III | 10 | Directors, Executive Officers and Corporate Governance | 142 | 10 | Directors, Executive Officers and Corporate Governance | 152 | |||||||||||||
| 11 | Executive Compensation | 142 | 11 | Executive Compensation | 152 | ||||||||||||||
| 12 | Security Ownership of Certain Beneficial Owners and Management and Related Stockholder Matters | 143 | 12 | Security Ownership of Certain Beneficial Owners and Management and Related Stockholder Matters | 153 | ||||||||||||||
| 13 | Certain Relationships, Related Transactions and Director Independence | 143 | 13 | Certain Relationships, Related Transactions and Director Independence | 153 | ||||||||||||||
| 14 | Principal Accountant Fees and Services | 143 | 14 | Principal Accountant Fees and Services | 153 | ||||||||||||||
IV | 15 | Exhibits and Financial Statement Schedules | 143 | 15 | Exhibits and Financial Statement Schedules | 154 | |||||||||||||
Index to Financial Statements | 70 | Signatures | 155 | ||||||||||||||||
Exhibit Index | 144 | Cummins Inc. Exhibit Index | 157 | ||||||||||||||||
Signatures | 146 | ||||||||||||||||||
Cummins Inc. and its consolidated subsidiaries are hereinafter sometimes referred to in this annual report as "Cummins," the "Company," "we," "our," or "us."
CAUTIONARY STATEMENTS REGARDING FORWARD-LOOKING INFORMATION
Certain parts of this annual report particularly "Management's Discussion and Analysis of Financial Condition and Results of Operations", contain forward-looking statements intended to qualify for the safe harbors from liability established by the Private Securities Litigation Reform Act of 1995. Forward-looking statements include those that are based on current expectations, estimates and projections about the industries in which we operate and management's beliefs and assumptions. Forward-looking statements are generally accompanied by words such as "anticipates," "expects," "forecasts," "intends," "plans," "believes," "seeks," "estimates," "could," "should," or words of similar meaning. These statements are not guarantees of future performance and involve certain risks, uncertainties and assumptions, which we refer to as "future factors," which are difficult to predict. Therefore, actual outcomes and results may differ materially from what is expressed or forecasted in such forward-looking statements. Some future factors that could cause our results to differ materially from the results discussed in such forward-looking statements are discussed below and shareholders, potential investors and other readers are urged to consider these future factors carefully in evaluating forward-looking statements. Readers are cautioned not to place undue reliance on forward-looking statements, which speak only as of the date hereof. We undertake no obligation to update publicly any forward-looking statements, whether as a resultSome of new information,the future events or otherwise. Future factors that could affect the outcome of forward-looking statements include the following:
In addition, such statements could be affected by general industry and market conditions and growth rates, general domestic and international economic conditions, including the price of crude oil (diesel fuel), interest rate and currency exchange rate fluctuations, commodity pricesShareholders, potential investors and other readers are urged to consider these factors carefully in evaluating the forward-looking statements and are cautioned not to place undue reliance on such forward-looking statements. The forward-looking statements made herein are made only as of the date of this annual report and we undertake no obligation to publicly update any forward-looking statements, whether as a result of new information, future factors.events or otherwise.
Cummins Inc. was founded in 1919 as a corporation in Columbus, Indiana, as one of the first diesel engine manufacturers. We are a global power leader that designs, manufactures, distributes and services diesel and natural gas engines electric power generation systems and engine-related component products, including filtration, exhaust aftertreatment, turbochargers, fuel systems, controls andsystems, air handling systems and electric power generation systems. We sell our products to original equipment manufacturers (OEMs), distributors and other customers worldwide. We serve our customers through a network of more than 500approximately 600 company-owned and independent distributor locations and approximately 5,2006,500 dealer locations in more than 190 countries and territories.
We have four complementary operating segments: Engine, Components, Power Generation Components and Distribution. These segments share technology, customers, strategic partners, brand recognition and our distribution network in order to gain a competitive advantagecompete more efficiently and effectively in their respective markets. In each of our operating segments, we compete worldwide with a number of other manufacturers and distributors that produce and sell similar products. Our products compete primarily compete on the basis of performance, fuel economy, speed of delivery, quality, customer support and price. Financial information about our operating segments, including geographic information, is incorporated by reference from Note 25,22, "OPERATING SEGMENTS," to ourConsolidated Financial Statements.
Engine segment sales and EBITearnings before interest and taxes (EBIT) as a percentage of consolidated results were:
| | Years ended December 31, | |||||||||
|---|---|---|---|---|---|---|---|---|---|---|
| | 2012 | 2011 | 2010 | |||||||
Percent of consolidated net sales(1) | 50 | % | 52 | % | 49 | % | ||||
Percent of consolidated EBIT(1) | 54 | % | 53 | % | 48 | % | ||||
| | Years ended December 31, | |||||||||
|---|---|---|---|---|---|---|---|---|---|---|
| | 2009 | 2008 | 2007 | |||||||
Percent of consolidated net sales(1) | 49 | % | 50 | % | 52 | % | ||||
Percent of consolidated EBIT(1)(2) | 34 | % | 41 | % | 47 | % | ||||
Our Engine segment manufactures and markets a broad range of diesel and natural gas powered engines under the Cummins brand name, as well as certain customer brand names, for the heavy- and medium-duty truck, bus, recreational vehicle (RV), light-duty automotive, agricultural, construction, mining, marine, oil and gas, rail and governmental equipment markets. We offer a wide variety of engine products including:
Our Engine segment is organized by engine displacement size and serves these end-user markets:
provide diesel or natural gas engines for school buses, transit buses and shuttle buses worldwide, with key markets including North America, Europe, Latin America Europe and Asia.
The principal customers of our heavy- and medium-duty truck engines include truck manufacturers such as PACCAR Volvo Trucks North America,Inc (PACCAR), Daimler Trucks North America, Ford Motor Company, International Truck, MAN Latin America and Volkswagen AG.Volvo. We sell our industrial engines to manufacturers of construction, agricultural and marine equipment, including Case New Holland, Komatsu, Belaz, Hyundai, Hitachi Ingersoll Rand, Brunswick and Terex.JLG. The principal customers of our light-duty on-highway engines are Chrysler and manufacturers of RVs.
In the markets served by our Engine segment, we compete with independent engine manufacturers as well as OEMs who manufacture engines for their own products. Our primary competitors in North America are Detroit Diesel Corporation, Volvo Powertrain, International Truck and Engine Corporation (Engine Division) and, Detroit Diesel Corporation, Caterpillar Inc. (CAT)., Volvo Powertrain, Ford Motor Company and Hino Power. Our primary competitors in international markets vary from country to country, with local manufacturers generally predominant in each geographic market. Other engine manufacturers in international markets include Volvo, Weichai Power Co. Ltd., GE Jenbacher, MAN Nutzfahrzeuge AG (MAN), Fiat Power Systems, GuangxiYuchai Group, GE Jenbacher, Tognum AG, GuangxiYuchai Group,CAT, Volvo, Yanmar Co., Ltd. and Deutz AG.
Components segment sales and EBIT as a percentage of consolidated results were:
| | Years ended December 31, | |||||||||
|---|---|---|---|---|---|---|---|---|---|---|
| | 2012 | 2011 | 2010 | |||||||
Percent of consolidated net sales(1) | 19 | % | 18 | % | 19 | % | ||||
Percent of consolidated EBIT(1) | 18 | % | 18 | % | 16 | % | ||||
Our Components segment supplies products which complement our Engine segment, including filtration products, turbochargers, aftertreatment systems and fuel systems for commercial diesel applications. We manufacture filtration systems for on- and off-highway heavy-duty and mid-range equipment, and we are a supplier of filtration products for industrial and passenger car applications. In addition, we develop aftertreatment systems and turbochargers to help our customers meet increasingly stringent emission standards and fuel systems which to date have primarily supplied our Engine segment and our joint venture partner Scania.
Our Components segment is organized around the following businesses:
Customers of our Components segment generally include our Engine and Distribution segments, truck manufacturers and other OEMs, many of which are also customers of our Engine segment, such as PACCAR, Daimler, Volvo, Komatsu, Ford and other manufacturers that use our components in their product platforms.
Our Components segment competes with other manufacturers of filtration, turbochargers and fuel systems. Our primary competitors in these markets include Robert Bosch GmbH, Donaldson Company, Inc., Deutz AGClarcor Inc., Mann+Hummel Group, Honeywell International, Borg-Warner, Tenneco Inc., Eberspacher Holding GmbH & Co. KG and CAT.Denso Corporation.
On July 18, 2012, we acquired the doser technology business assets from Hilite Germany GmbH (Hilite) in a $176 million cash transaction. The acquisition was accounted for as a business combination with the majority of the purchase price being allocated to goodwill and technology and customer related intangible assets. The results of the acquired entity for 2012 were included in the Components
operating segment. See Note 2, "ACQUISITIONS AND DIVESTITURES," to ourConsolidated Financial Statements for additional detail.
In the second quarter of 2011, we sold certain assets and liabilities of our exhaust business which manufactures exhaust products and select components for emission systems for a variety of applications not core to our other product offerings. This business was historically included in our Components segment. The sales price was $123 million. We recognized a gain on the sale of $68 million ($37 million after-tax), which included a goodwill allocation of $19 million. The gain was excluded from segment results as it was not considered in our evaluation of operating results for the year ended December 31, 2011.
During the fourth quarter of 2011, we sold certain assets and liabilities of our light-duty filtration business which manufactures light-duty automotive and industrial filtration solutions. The sales price was $90 million and included a note receivable from the buyer of approximately $1 million. There are no earnouts or other contingencies associated with the sales price. We recognized a gain on the sale of $53 million ($33 million after-tax), which included a goodwill allocation of $6 million. The gain was excluded from segment results as it was not considered in our evaluation of operating results for the year ended December 31, 2011.
Power Generation segment sales and EBIT as a percentage of consolidated results were:
| | Years ended December 31, | |||||||||
|---|---|---|---|---|---|---|---|---|---|---|
| | 2012 | 2011 | 2010 | |||||||
Percent of consolidated net sales(1) | 15 | % | 16 | % | 18 | % | ||||
Percent of consolidated EBIT(1) | 12 | % | 14 | % | 18 | % | ||||
| | Years ended December 31, | |||||||||
|---|---|---|---|---|---|---|---|---|---|---|
| | 2009 | 2008 | 2007 | |||||||
Percent of consolidated net sales(1) | 19 | % | 20 | % | 19 | % | ||||
Percent of consolidated EBIT(1)(2) | 22 | % | 28 | % | 26 | % | ||||
Our Power Generation segment designs and manufactures most of the components that make up power generation systems, including engines, controls, alternators, transfer switches and switchgear. This segment is a global provider of power generation systems, components and services for a diversified customer base, and includesincluding the following:
utilities, independent power producers and large power customers for use as prime or peaking power.
In 2009,the first quarter of 2012, our Power Generation segment reorganized its reporting structure and now reportsto include the following businesses:
For revised sales data by product category for 2008 and 2007 see "Management's Discussion and Analysis of Financial Condition and Results of Operations."
This segment continuously explores emerging technologies such as fuel cells, wind and hybrid solutions and provides integrated power generation products utilizingusing technologies other than reciprocating engines. We use our own research and development capabilities as well as leveragethose of our business partnerships to develop cost-effective and environmentally sound power solutions.
Our customer base for our power generation products is highly diversified, with customer groups varying based on their power needs. India, China, the United Kingdom (U.K.), Western Europe, Latin America and the Middle East Western Europe and East Asia, are our largest geographic markets outside of North America.
This operating segmentPower Generation competes with a variety of engine manufacturers and generator set assemblers across the world. Our primary compeitiors are CAT, Tognum (MTU) and Mitsubishi (MHI) remain our primary competitors,Kohler/SDMO (Kohler Group), but we also compete with GE Jenbacher, FG Wilson (Caterpillar(CAT group), Kohler, SDMO (Kohler group), Generac, Mitsubishi (MHI) and numerous regional generator set assemblers. Our Alternatorgenerator technologies business competes globally with Emerson Electric Co., Marathon Electric and Meccalte, among others.
Components segment sales and EBIT as a percentage of consolidated results were:
| | Years ended December 31, | |||||||||
|---|---|---|---|---|---|---|---|---|---|---|
| | 2009 | 2008 | 2007 | |||||||
Percent of consolidated net sales(1) | 18 | % | 18 | % | 19 | % | ||||
Percent of consolidated EBIT(1)(2) | 13 | % | 13 | % | 12 | % | ||||
Our Components segment supplies products which complement our Engine segment, including filtration products, turbochargers, aftertreatment systems, intake and exhaust systems and fuel systems for commercial diesel applications. We manufacture filtration and exhaust systems for on- and off-highway heavy-duty and mid-range equipment, and we are a supplier of filtration products for industrial and passenger car applications. In addition, we develop aftertreatment and exhaust systems to help our customers meet increasingly stringent emissions standards and fuel systems which to date have primarily supplied our Engine segment and our partner Scania.
Our Components segment is organized around the following businesses:
Customers of our Components segment generally include our Engine and Distribution segments, truck manufacturers and other OEMs, many of which are also customers of our Engine segment, such as PACCAR, CNH Global N.V., International Truck and Engine, Volvo, Iveco and other manufacturers that use our filtration products in their product platforms. Our customer base for replacement filtration parts is highly fragmented and primarily consists of various end-users of on- and off-highway vehicles and equipment.
Our Components segment competes with other manufacturers of filtration, exhaust and fuel systems and turbochargers. Our primary competitors in these markets include Donaldson Company, Inc., Clarcor Inc., Mann+Hummel Group, Tokyo Roki Co., Ltd., Borg-Warner, Bosch, Tenneco and Honeywell International.
Distribution segment sales and EBIT as a percentage of consolidated results were:
| | Years ended December 31, | |||||||||
|---|---|---|---|---|---|---|---|---|---|---|
| | 2012 | 2011 | 2010 | |||||||
Percent of consolidated net sales(1) | 16 | % | 14 | % | 14 | % | ||||
Percent of consolidated EBIT(1) | 16 | % | 15 | % | 18 | % | ||||
| | Years ended December 31, | |||||||||
|---|---|---|---|---|---|---|---|---|---|---|
| | 2009 | 2008 | 2007 | |||||||
Percent of consolidated net sales(1) | 14 | % | 12 | % | 10 | % | ||||
Percent of consolidated EBIT(1)(2) | 31 | % | 18 | % | 15 | % | ||||
Our Distribution segment consists of 1923 company-owned and 18 joint venture distributors that service and distribute the full range of our products and services to end-users at approximately 300400 locations in approximately 7080 distribution territories. Our company-owned distributors are located in key markets, including India, China, Japan,North America, Australia, Europe, the Middle East, SouthIndia, China, Africa, Russia, Japan, Brazil, Singapore and Central America, while our joint venture distributors are located in North America, South America, Africa, China, Thailand, Singapore and Russia.Vietnam.
The Distribution segment consists of the following businesses which service and/or distribute the full range of our products and services:
The Distribution segment is organized into fourfive primary geographic regions:
EMEAAsia Pacific and Asia PacificEME are composed of sevensix smaller regional distributor organizations (Greater(South Pacific, Greater Europe, Africa, the Middle East, China, India China,and Northeast/Southeast Asia and the South Pacific)Asia) which allow us to better manage these vast geographic territories.
Our largest market, North and Central America isare mostly comprised of a network of partially-owned distributors. Internationally, our network consists of independent, partially-owned and wholly-owned distributors. Through this network,these networks, we provide parts and service to our customers. These full-service solutions include maintenance contracts, engineering services and integrated products, where we customize our products to cater to specific needs of end-users. Our distributors also serve and develop dealers, predominantly OEM dealers, in their territories by providing new products, technical support, tools, training, parts and product information.
In addition to managing our investments ininvolvement with our wholly-owned and partially-owned distributors, our Distribution segment is responsible for managing the performance and capabilities of our independent distributors. Our distributors collectively serveDistribution segment serves a highly diverse customer base with approximately 4445 percent of their 2009 revenuesits 2012 sales being generated from the sale of new engines and power generation equipment, compared to 5047 percent in 2008, and the2011, with its remaining revenuesales generated by parts and filtration and service revenue.
Financial information about our distributors accounted for under the equity method are incorporated by reference from Note 1, "SUMMARY OF SIGNIFICANT ACCOUNTING POLICIES," and Note 2,3, "INVESTMENTS IN EQUITY INVESTEES," to ourConsolidated Financial Statements.
During 2008, we purchased a majority interest in three previously independent North American distributors in order to increase our ownership interests in key portions of the distribution channel. The acquisitions were accounted for under the purchase method of accounting and resulted in an aggregate purchase price of $81 million which we funded with $54 million of borrowings and $27 million of cash.
The assets of the acquired businesses were primarily accounts receivable, inventory and fixed assets. There was less than $1 million of goodwill generated from these transactions.
Our distributors compete with distributors or dealers that offer similar products. In many cases, these competing distributors or dealers are owned by, or affiliated with the companies that are listed above as competitors of our Engine, Components or Power Generation or Components segments. These competitors vary by geographical location.
In July 2012, we acquired an additional 45 percent interest in Cummins Central Power from the former principal for consideration of approximately $20 million. The acquisition was accounted for as a business combination, with the results of the acquired entity included in the Distribution operating segment in the third quarter of 2012. Distribution segment results also included a $7 million gain, as we were required to re-measure our pre-existing 35 percent ownership interest in Cummins Central Power to fair value in accordance with accounting principles generally accepted in the United State of America (GAAP). See Note 2, "ACQUISITIONS AND DIVESTITURES," to ourConsolidated Financial Statements for additional detail.
JOINT VENTURES, ALLIANCES AND NON-WHOLLY-OWNED SUBSIDIARIES
We have entered into a number of joint venture agreements and alliances with business partners around the world. Our joint ventures are either distribution or manufacturing entities. We also own a controlling interestinterests in a non-wholly-owned manufacturing subsidiary.and distribution subsidiaries. Seven entities, in
which we own more than a 50 percent equity interest, are consolidated in our Distribution segment results as well as several manufacturing joint ventures in the other operating segments.
In the event of a change of control of either party to certain of these joint ventures and other strategic alliances, certain consequences may result including automatic termination and liquidation of the venture, exercise of "put" or "call" rights of ownership by the non-acquired partner, termination or transfer of technology license rights to the non-acquired partner and increases in component transfer prices to the acquired partner. We will continue to evaluate joint venture and partnership opportunities in order to penetrate new markets, develop new products and generate manufacturing and operational efficiencies.
Financial information about our investments in joint ventures and alliances is incorporated by reference from Note 1, "SUMMARY OF SIGNIFICANT ACCOUNTING POLICIES," Note 2,3, "INVESTMENTS IN EQUITY INVESTEES," and Note 23, "VARIABLE INTEREST ENTITIES," to theConsolidated Financial Statements.
Our equity income from these investees was as follows:
| | Years ended December 31, | ||||||||||||||||||
|---|---|---|---|---|---|---|---|---|---|---|---|---|---|---|---|---|---|---|---|
| In millions | 2012 | 2011 | 2010 | ||||||||||||||||
Distribution Entities | |||||||||||||||||||
North American distributors | $ | 147 | 42 | % | $ | 134 | 36 | % | $ | 101 | 32 | % | |||||||
Komatsu Cummins Chile, Ltda. | 26 | 8 | % | 22 | 6 | % | 16 | 5 | % | ||||||||||
All other distributors | 4 | 1 | % | 4 | 1 | % | 3 | 1 | % | ||||||||||
Manufacturing Entities | |||||||||||||||||||
Chongqing Cummins Engine Company, Ltd. | 61 | 18 | % | 68 | 18 | % | 46 | 14 | % | ||||||||||
Dongfeng Cummins Engine Company, Ltd. | 52 | 15 | % | 80 | 21 | % | 99 | 31 | % | ||||||||||
Cummins Westport, Inc. | 14 | 4 | % | 14 | 4 | % | 10 | 3 | % | ||||||||||
Shanghai Fleetguard Filter Co., Ltd. | 13 | 4 | % | 15 | 4 | % | 12 | 4 | % | ||||||||||
Tata Cummins, Ltd. | 11 | 3 | % | 14 | 4 | % | 14 | 4 | % | ||||||||||
Valvoline Cummins, Ltd. | 8 | 2 | % | 7 | 2 | % | 8 | 3 | % | ||||||||||
Beijing Foton Cummins Engine Co., Ltd. | 5 | 1 | % | (7 | ) | (2 | )% | (16 | ) | (5 | )% | ||||||||
Komatsu manufacturing alliances | (3 | ) | (1 | )% | 3 | 1 | % | 11 | 3 | % | |||||||||
All other manufacturers | 9 | 3 | % | 21 | 5 | % | 17 | 5 | % | ||||||||||
Cummins share of net income(1) | $ | 347 | 100 | % | $ | 375 | 100 | % | $ | 321 | 100 | % | |||||||
| | Years ended December 31, | |||||||||||||||||||
|---|---|---|---|---|---|---|---|---|---|---|---|---|---|---|---|---|---|---|---|---|
| In millions | 2009 | 2008 | 2007 | |||||||||||||||||
Distribution Entities | ||||||||||||||||||||
North American distributors | $ | 100 | 51 | % | $ | 100 | 43 | % | $ | 83 | 43 | % | ||||||||
Komatsu Cummins Chile, Ltda. | 12 | 6 | % | 7 | 3 | % | 4 | 2 | % | |||||||||||
All other distributors | 3 | 1 | % | 5 | 2 | % | 2 | 1 | % | |||||||||||
Manufacturing Entities | ||||||||||||||||||||
Chongqing Cummins Engine Company, Ltd. | 36 | 18 | % | 30 | 13 | % | 22 | 11 | % | |||||||||||
Dongfeng Cummins Engine Company, Ltd. | 33 | 17 | % | 55 | 24 | % | 41 | 21 | % | |||||||||||
Valvoline Cummins, Ltd. | 7 | 4 | % | 2 | 1 | % | 1 | 1 | % | |||||||||||
Shanghai Fleetguard Filter Co., Ltd. | 7 | 4 | % | 8 | 4 | % | 6 | 3 | % | |||||||||||
Tata Cummins Ltd. | 5 | 3 | % | 7 | 3 | % | 13 | 7 | % | |||||||||||
Cummins MerCruiser Diesel Marine, LLC | (10 | ) | (5 | )% | 3 | 1 | % | 11 | 6 | % | ||||||||||
All other manufacturers | 3 | 1 | % | 14 | 6 | % | 9 | 5 | % | |||||||||||
Cummins share of net income(1) | $ | 196 | 100 | % | $ | 231 | 100 | % | $ | 192 | 100 | % | ||||||||
Distribution Entities
Our licensingdistribution agreements with independent and partially-owned distributors generally have a renewable three-year term and are restricted to specified territories. Our distributors develop and maintain a network of dealers with which we have no direct relationship. TheOur distributors are permitted to sell other, noncompetitive products only with our consent. We license all of our distributors to use our name and logo in connection with the sale and service of our products, with no right to assign or sublicense the marks,trademarks, except to authorized dealers, without our consent. Products are sold to the distributors at standard domestic or international distributor net prices, as applicable. Net prices are wholesale prices we establish to permit our distributors an adequate margin on their sales. Subject to local laws, we can generally refuse to renew these agreements at will and we mayupon expiration or terminate them upon 90-daywritten notice for inadequate sales, change in principal ownership and certain other reasons. Distributors also have the right to terminate the agreements upon 60-day notice without cause, or 30-day notice for cause. Upon termination or failure to renew, we are required to purchase the distributor's current inventory, signage and special tools, and may, at our option purchase other assets of the distributor, but are under no obligation to do so.
See further discussion of our distribution network under the Distribution segment section above.
ManufacturingOur manufacturing joint ventures arehave generally been formed with customers and generally are intended to allow us to increase our market penetration in geographic regions, reduce capital spending, streamline our supply chain management and develop technologies. Our largest manufacturing joint ventures are based in China and are included in the list below. Our engine manufacturing joint ventures are supplied by our Components segment in the same manner as they supplyit supplies our wholly-owned Engine segment and Power Generation segment manufacturing facilities. Our Components segment joint ventures and wholly owned entities provide fuel system, filtration and turbocharger products that are used in our engines as well as some competitors' products. TheseThe results and investments in our joint ventures in which we have 50 percent or less ownership interest are not included in "Equity, royalty and interest income from investees" and "Investments and advances related to equity method investees" in ourConsolidated Financial Statements of Income. andConsolidated Balance Sheets, respectively.
in automotive and industrial applications. Products include transmission fluids, hydraulic lubricants, automotive filters, cooling system products, greases and specialty products.
Non-Wholly-Owned Manufacturing Subsidiary
We have a controlling interest in Cummins India Ltd. (CIL), which is a publicly listed company on various stock exchanges in India. CIL produces mid-range, heavy-duty and high-horsepower engines, as well as generators for the Indian and export markets. CIL also produces compressedmarkets and natural gas spark-ignited engines licensed from anotherfor power generation, automotive and industrial applications. CIL also has distribution and power generation
Table of our joint ventures.Contents
operations. CIL's net income attributable to Cummins was $28$42 million, $36$44 million and $26$46 million for 2009, 20082012, 2011 and 2007,2010, respectively.
The performance of the end-to-end supply chain, extending through to our suppliers, is foundational to our ability to meet customers' expectations and support long-term growth. In order to ensure we meet the needs of our customers, we are committed to having a robust strategy for how we select and manage our suppliers.
We source our materialshave a strategic sourcing policy that guides decisions on what we make, when we establish supplier partnerships and manufactured components from leading suppliers both domestically and internationally. Wewhat we purchase. Today we machine and assemble some of thestrategic components used in our engines and power generation units, including blocks, heads, turbochargers, connecting rods, camshafts, crankshafts, filters, exhaust systems, alternators and fuel systems. We single source externally purchased material and manufactured components from leading suppliers both domestically and internationally. Many suppliers are managed though long-term agreements that assure capacity, delivery, quality and cost requirements are met over an extended period. We have a "take or pay" contract with an emission solutions business supplier requiring us to purchase approximately 70$73 million annually through 2018. Approximately 60 to 8070 percent of the total types of parts in our product designs. We have long-term agreements with critical suppliers whodesigns are the sole source for specific products or supply items.single sourced. Although we elect to source a relatively high proportion of our total raw materials and component requirementscomponents from sole suppliers, we have an established aannual sourcing strategy process to annuallythat evaluates risk. This annual review our sourcing strategies with a focus on the reduction of risk, whichprocess has led us to begin increasing our use of dual source critical components, where possible. We are also developingsourcing to both minimize risk and increase supply chain responsiveness.
Other important elements of our sourcing strategy include:
We own or control a significant number of patents and trademarks relating to the products we manufacture. These patents and trademarks have beenwere granted and registered over a period of years. Although these patents and trademarks are generally considered beneficial to our operations, we do not believe any patent, group of patents, or trademark (other than our leading brand house trademarks) is considered significant to our business.
While individual product lines may experience modest seasonal declinesvariation in production, there is no material effect on the demand for the majority of our products on a quarterly basis with the exception that our Power Generation segment normally experiences seasonal declines in the first quarter due to general declines in construction spending during this period and our Distribution segment normally experiences seasonal declines in its first quarter business activity due to holiday periods in Asia and Australia.
We have thousands of customers around the world and have developed long-standing business relationships with many of them. PACCAR is our largest customer, accounting for approximately 13 percent of our consolidated net sales in 2012, compared to approximately 12 percent in 2011 and 7 percent in 2010. We have long-term supply agreements with PACCAR for our heavy-duty ISX 15 liter
and ISX 11.9 liter engines and our ISL 9 liter mid-range engine. While a significant number of our sales to PACCAR are under long-term supply agreements, these agreements provide for particular engine requirements for specific vehicle models and not a specific volume of engines. PACCAR is our only customer accounting for more than 10 percent of our net sales in 2012. The loss of this customer or a significant decline in the production level of PACCAR vehicles that use our engines would have an adverse effect on our results of operations and financial condition. We have been an engine supplier to PACCAR for over 68 years. A summary of principal customers for each operating segment is included in our segment discussion.
In addition to our agreement with PACCAR, we have long-term heavy-duty engine supply agreements with PACCAR and Volvo Trucks North America. We haveAmerica and Navistar International Corporation and long-term mid-range supply agreements with PACCAR, as its exclusive engine supplier, as well as with Daimler Trucks North America, (formerly Freightliner LLC), Ford and MAN (formerly Volkswagen).MAN. We also have an agreement with Chrysler to supply engines for supplying the engine for use in Dodgeits Ram trucks. In our off-highway markets, we have various engine and component supply agreements ranging across our midrange and high-horsepower businesses with Komatsu Ltd., as well as various joint ventures and other license agreements in our Engine, Component and Distribution segments. Collectively, our net sales to these sixseven customers, including PACCAR, was approximately 2233 percent of our consolidated net sales in 2009,2012, compared to approximately 2131 percent in 20082011 and 2725 percent in 2007 and individually was2010. Excluding PACCAR, net sales to individual customers were less than nine8 percent of our consolidated net sales to any single customer in 2009,2012, compared to less than eight6 percent in both 20082011 and 2007.less than 4 percent in 2010. These agreements contain standard purchase and sale agreement terms covering engine and engine parts pricing, quality and delivery commitments, as well as engineering product support obligations. The basic nature of our agreements with OEM customers is that they are long-term price and operations agreements that help assure the availability of our products to each customer through the duration of the respective agreements. Agreements with most OEMs contain bilateral termination provisions giving either party the right to terminate in the event of a material breach, change of control or insolvency or bankruptcy of the other party.
As a result ofOur 2012 lead times for the current recessed economic conditions manymajority of our order lead times have decreased significantlybusinesses improved from lead times in prior years.their 2011 levels. While we have supply agreements with some truck and off-highway equipment OEMs, most of our business is transacted through open purchase orders. These open orders are historically subject to month-to-month releases and are subject to cancellation on reasonable notice without cancellation charges and therefore are not considered firm.
RESEARCH AND DEVELOPMENT EXPENSE
In 2012, we increased our research, development and engineering expenses as we continued to invest in future critical technologies and products. We will continue to make investments to improve our current technologies, continue to meet the future emission requirements around the world and improve fuel economy.
Our research and development program is focused on product improvements, innovations and cost reductions for our customers. We expense researchResearch and development expenditures include salaries, contractor fees, building costs, utilities, administrative expenses and allocation of corporate costs and are expensed, net of contract reimbursements, when incurred. Research and development expenses, net of contract reimbursements, were $362$721 million in 2009, $4222012, $621 million in 20082011 and $318$402 million in 2007.2010. Contract reimbursements were $92$86 million in 2009, $612012, $75 million in 20082011 and $52$68 million in 2007.2010.
For 20092011 and 2008,2010, approximately 42 percent, or $151$1 million and approximately 27$38 million or less than 1 percent or $116 million,and 9 percent, respectively, of our research and development expenditures were directly related to compliance with 2010 EPA emissionsEnvironmental Protection Agency (EPA) emission standards. For 2007, 17 percent, or $55 million, was related to compliance with2012, 2011 and 2010, EPA emissions standards. In 2009, we reduced research, development and engineering expenses but continued to invest in critical technologies and products for 2010 and beyond. We will continue to make investments to improve our current technologies, to continue to meet the future emissions requirements around the world and improve fuel economy.
approximately $101 million, $104 million and $36 million or 14 percent, 17 percent and 9 percent, of our research and development expenditures were directly related to compliance with 2013 EPA emission standards.
ENVIRONMENTAL COMPLIANCESUSTAINABILITY
Our Environmental Sustainability
In 2009, principles attempt to positively impact the environment through the products that we continuedmake, how we use our facilities and how we impact communities where we live and work. Our newly formed Corporate Action Committee for Environmental Sustainability is developing a global plan to be a leader in sustainable business development.more fully integrate environmental stewardship across all of our businesses and functions. We have investedcontinue to invest significantly in new products and technologies designed to further lower exhaustreduce emissions from and increase the efficiency of our products. We have increased our commitmentattempt to addressingwork collaboratively with customers to improve their fuel economy, reduce their carbon footprints and conserve other resources. Over the global impact of climate change and have introduced our first set of 10 climate change principles that address wayspast four years, we believe that we planhave reduced company-wide water usage intensity by approximately 45 percent, U.S.-wide process-derived hazardous waste generation by approximately 52 percent and company-wide landfill waste by approximately 28 percent, all normalized to become a greater part of the solution andtotal work hours. We also have articulated our positions on key public policy issues surrounding climate change.and on a wide range of environmental issues. We are actively engaged with regulatory, industry and other stakeholder groups around the world as GHG and fuel efficiency standards become more prevalent globally. For the fourtheighth consecutive year, we were named to the Dow Jones World Sustainability index,Index, which recognizes the top 10 percent of the world's largest 2,500 companies in economic, environmental and social leadership. We were also named the top environmentally conscious industrial company in the U.S. in Newsweek's Green Rankings. Our sustainability reportSustainability Report for 20092011/2012 as well as an addendum of more detailed environmental data is available on our website at www.cummins.com.www.cummins.com, although such report and addendum are not incorporated into this Form 10-K.
Product Environmental Compliance
Our engines are subject to extensive statutory and regulatory requirements that directly or indirectly impose standards governing emissionsemission and noise. We have substantially increased our global environmental compliance presence and expertise to better prepare for, understand and ultimately meet emerging product environmental regulations around the world. Our products comply with all current emissionsemission standards that the Environmental Protection Agency (EPA)European Union (EU), EPA, the California Air Resources Board (CARB) and other state and international regulatory agencies have established for heavy-duty on-highway diesel and gas engines and off-highway engines. Our ability to comply with these and future emissionsemission standards is an essential element in maintaining our leadership position in regulated markets. We have made, and will continue to make, significant capital and research expenditures to comply with these standards. FailureOur failure to comply with these standards could result in adverse effects on our future financial results.
EU and EPA Engine Certifications
The current on-highway emissionsemission standards came into effect in the U.S.EU on October 1, 2008 (Euro V) and on January 1, 2010.2010 for the EPA. To meet the 2010 U.S. EPAmore stringent heavy-duty on-highway emissionsemission standards, we are usingused an evolution of our proven 2007selective catalytic reduction (SCR) and exhaust gas recirculation (EGR) technology solutionsolutions and refined them for the EU and EPA certified engines to maintain power and torque with substantial fuel economy improvement and maintenance intervals comparable with our 2007previous compliant engines. We will offer a complete lineup of on-highway engines to meet the near-zero emissionsemission standards. Mid-range and heavy-duty engines for EU and EPA 2010 require nitrogen oxide (NOx)NOx aftertreatment. NOx reduction is achieved by an integrated technology solution comprised of the XPI High Pressure Common Rail fuel system, selective catalytic reduction (SCR)SCR technology, next-generation cooled exhaust gas recirculation (EGR),EGR, advanced
electronic controls, proven air handling and the Cummins Diesel Particulate Filter.Filter (DPF). The EU, EPA, and CARB have certified that our engines meet the 2010current emission requirements. EmissionsEmission standards in international markets, including Europe, Japan, Mexico, Australia, Brazil, Russia, India and China are becoming more stringent. We believe that our experience in meeting U.S. emissionsthe EU and EPA emission standards leaves us well positioned to take advantage of opportunities in these markets as the need for emissionsemission control capability grows.
FederalWe have received certification from the EPA that we have met both the EPA 2013 and California2014 GHG regulations require manufacturersand rules. The EPA 2013 regulations add the requirement of On-Board Diagnostics, which were introduced on the ISX15 in 2010, across the full on-highway product line in 2013 in addition to report failuresmaintaining the same near-zero emission levels of emissions-related components toNOx and Particulate Matter (PM) required in 2010. On-Board Diagnostics provide enhanced service capability with standardized diagnostic trouble codes, service tool interface, in-cab warning lamp and service information availability. The new GHG and fuel-efficiency regulations will be required for all heavy-duty diesel and natural gas engines beginning in January 2014. Our GHG certification is the first engine certificate issued by the EPA and CARB whenuses the failure rate reaches a specified level. At higher failure rates, a product recall may be required. In 2009, we submitted three reports tosame proven base engine with the EPA relating to two different defects affecting oxidation catalystsXPI fuel system, Variable Geometry Turbocharger (VGT™), Cummins Aftertreatment System with DPF and vehicle labels. The oxidation catalyst defect necessitated the campaign of approximately 360 engines.SCR technology and fully integrated electronics.
Other Environmental Statutes and Regulations
Expenditures for environmental control activities and environmental remediation projects at our facilities in the U.S. have not been a substantial portion of our annual capital outlays and are not
expected to be material in 2010. Except as follows, we2013. We believe we are in compliance in all material respects with laws and regulations applicable to our plants and operations.
In the U.S., pursuant to notices received from federal and state agencies and/or defendant parties in site environmental contribution actions, we have been identified as a Potentially Responsible Partypotentially responsible party (PRP) under the Comprehensive Environmental Response, Compensation and Liability Act of 1980, as amended or similar state laws, at approximately 1920 waste disposal sites. Based upon our experiences at similar sites we believe that our aggregate future remediation costs will not be significant. We have established accruals that we believe are adequate for our expected future liability with respect to these sites.
In addition, we have fourseveral other sites where we are working with governmental authorities on remediation projects. The costs for these remediation projects are not expected to be material.
As of December 31, 2009,2012, we employed approximately 34,90046,000 persons worldwide. Approximately 13,20015,750 of our employees worldwide are represented by various unions under collective bargaining agreements that expire between 20102013 and 2014. For a discussion of the effects of our 2008 and 2009 restructuring actions on employment, see "Management's Discussion and Analysis of Financial Condition and Results of Operations" and Note 3, "RESTRUCTURING AND OTHER CHARGES," to ourConsolidated Financial Statements in this Form 10-K.2015.
We file annual, quarterly and current reports, proxy statements and other information electronically with the Securities and Exchange Commission (the "SEC"). You may read and copy any document we file with the SEC at the SEC's public reference room at 100 F Street, N.E., Washington, DC 20549. Please call the SEC at 1-800-SEC-0330 for information on the public reference room. The SEC maintains an internet site that contains annual, quarterly and current reports, proxy and information statements and other information that issuers (including Cummins) file electronically with the SEC. The SEC's internet site is www.sec.gov.
Our internet site is www.cummins.com. You can access our Investors and Media webpage through our internet site, by clicking on the heading "Investors and Media."Media" followed by the "Investor
Relations" link. We make available, free of charge, on or through our Investors and Media webpage, our proxy statements, annual reports on Form 10-K, quarterly reports on Form 10-Q, current reports on Form 8-K and any amendments to those reports filed or furnished pursuant to the Securities Exchange Act of 1934 or the Securities Act of 1933, as amended, as soon as reasonably practicable after such material is electronically filed with, or furnished to, the SEC.
We also have a Corporate Governance webpage. You can access our Governance Documents webpage through our internet site, www.cummins.com, by clicking on the heading "Investors and Media," followed by the "Investor Relations" link and then the topic heading of "Governance Documents" within the "Corporate Governance" heading. Code of Conduct, Committee Charters and other governance documents are included at this site. CumminsOur Code of Conduct applies to all employees, regardless of their position or the country in which they work. It also applies to the employees of any entity owned or controlled by us. We will post any amendments to the Code of Conduct and any waivers that are required to be disclosed by the rules of either the SEC or the New York Stock Exchange LLC (NYSE), on our internet site. The information on Cumminsour internet site is not incorporated by reference into this report.
In accordance with NYSE Rules, on May 21, 2009, we filed the annual certification by our CEO that, as of the date of the certification, he was unaware of any violation by the company of the NYSE's corporate governance listing standards.
EXECUTIVE OFFICERS OF THE REGISTRANT
Following are the names and ages of theour executive officers, of Cummins Inc., their positions with us as of January 31, 2010,2013, and summaries of their backgrounds and business experience:
Name and Age | Present Cummins Inc. position and year appointed to position | Principal position during the past five years other than Cummins Inc. position currently held | ||
|---|---|---|---|---|
| Chairman of the Board of Directors and Chief Executive Officer | President and Chief Operating Officer (2008-2011), Executive Vice President and President—Power Generation (2005-2008) | |||
Partner—Law firm of Foley & Lardner (2011-2012) Deputy Under Secretary of Commerce—Intellectual Property and Partner—Law firm of Foley & Lardner (1996-2009) | ||||
Jean S. Blackwell (58) | Executive Vice President—Corporate Responsibility (2008) | Executive Vice | ||
Pamela L. Carter | Vice President and President—Distribution Business | |||
Steven M. Chapman | Group Vice President—China and Russia (2009) | Vice President—Emerging Markets and Businesses (2005-2009) | ||
Vice President— | ||||
Name and Age | Present Cummins Inc. position and year appointed to position | Principal position during the past five years other than Cummins Inc. position currently held | ||||
|---|---|---|---|---|---|---|
| Richard J. Freeland (55) | Vice President and President—Engine Business (2010) | Vice President and President—Components Group (2008-2010), Vice President and President—Worldwide Distribution Business (2005-2008) | ||||
Mark R. Gerstle (57) | Vice President—Community Relations (2011) | Vice President—Chief Administrative Officer (2008-2011), Vice President—Corporate Quality and Chief Risk Officer (2005-2008) | ||||
Richard E. Harris (60) | Vice President—Chief Investment Officer (2008) | Vice President—Treasurer (2003-2008) | ||||
Marsha L. Hunt (49) | Vice President—Corporate Controller (2003) | |||||
Marya M. Rose | Vice President—Chief Administrative Officer (2011) | Vice President—General Counsel and Corporate Secretary | (2001-2011) | |||
Livingston L. Satterthwaite | Vice President and President—Power Generation (2008) | Vice President—Generator Set Business (2003-2008) | ||||
Anant J. Talaulicar (51) | Vice President and President—Components Group (2010), Vice President and Managing Director—India ABO (2004) | Chairman and Managing Director—Cummins India Ltd. (2003-present) | ||||
John C. Wall | Vice President—Chief Technical Officer (2000) | |||||
Patrick J. Ward | Vice President—Chief Financial Officer (2008) | Vice President—Engine Business Controller | ||||
Lisa M. Yoder (49) | Vice President—Global Supply Chain & Manufacturing (2011) | Vice President—Corporate Supply Chain (2010-2011), Executive Director— |
Our Chairman and Chief Executive Officer is elected annually by our Board of Directors and holds office until the first meeting of the Board of Directors following the annual meeting of the shareholders.at which his election is next considered. Other officers are appointed by the Chairman and Chief Executive Officer, are ratified by our Board of Directors and hold office for such period as the Chairman and Chief Executive Officer or the Board of Directors may prescribe.
Set forth below and elsewhere in this Annual Report on Form 10-K are some of the principal risks and uncertainties that could cause our actual business results to differ materially from any forward-looking statements contained in this Report and could individually, or combinedin combination, have a material adverse effect on our results of operations, financial position andor cash flows. In addition, future results could be materially affected by general industry and market conditions, changes in laws or accounting rules, general U.S. and non-U.S. economic and political conditions, including a global economic slow-down, fluctuation of interest rates or currency exchange rates, terrorism, political unrest or international conflicts, political instability, major health concerns, natural disasters, commodity prices or other disruptions of expected economic and business conditions. These risk factors should be considered in addition to our cautionary comments concerning forward-looking statements in this Report, including statements related to markets for our products and trends in our business that involve a number of risks and uncertainties. Our separate section above, "CAUTIONARY STATEMENTS REGARDING FORWARD-LOOKING INFORMATION," should be considered in addition to the following statements.
Although the global economy showed mild signs of recoveryA sustained slowdown or significant downturn in late 2009, a further downturnour markets could materially and adversely affect our results of operations, financial condition andor cash flows againflows..
Although we began to see some signs of improvement in late 2009, theThe global economy remains fragile.continued to slow throughout 2012 as we experienced declining demand in emerging markets, including Brazil and China, and a decline in India as the result of foreign currency fluctuations. The global economic recession that began in late 2008developed economies, including the U.S. economy, experienced slowing demand as the year progressed and continued through 2009 had a significant adverse impact on our business, customersto experience economic uncertainty driven by unresolved federal tax and suppliers.budget issues, while Europe continued to struggle as the result of lingering high unemployment, concerns over European sovereign debt issues and the tightening of government budgets. If the global economy wereor some of our significant markets encounter a sustained slowdown or our emerging markets, particularly China and Brazil, don't recover to take another significant downturn,stronger growth rates; depending upon the length, duration and severity of such a so-called "double-dip" recession,slowdown, our results of operations, financial condition and cash flow would almost certainly be materially adversely affected again.affected. Specifically, our revenues would likely decrease, we may be forced to consider further restructuring actions, we may need to increase our allowance for doubtful accounts, our days sales outstanding may increase and we could experience impairments to assets of certain of our businesses.
The discovery of any significant problems with our new EPA compliant engine platformsA slowdown in North America could materially adversely impact our results of operations, financial condition and cash flows.
We have received EPA and CARB certification for our heavy-duty ISX15 and mid-range ISB6.7, ISC8.3 and ISL9 engines which went into commercial production in early 2010. Certification of these engines confirms that our 2010 engine line-up for on-highway applications meets the near zero emissions levels required for all engines manufactured in 2010. The launch of these new platforms, which includes the introduction of SCR technology, will impact a number of our operating segments and is crucial to our success in North America. Although these engine platforms have undergone extensive testing and we believe that they are ready for production, the discovery of any significant problems in these platforms could result in delays in our product launches, recall campaigns, increased warranty costs, reputational risk and brand risk.
We may need to write off significant investments in our new light-duty diesel engine platforms if customer commitments further deteriorate.
We beganinfrastructure development of a new light-duty diesel engine platform in July 2006 to be used in a variety of on- and off-highway applications. Since that time, and as of December 31, 2009, we have capitalized investments of approximately $216 million. Market uncertainty due to the global recession has resulted in some customers delaying or cancelling their vehicle programs, while others remain on schedule. If customer expectations or volume projections further deteriorate from our current levels and we do not identify new customers, we may need to recognize an impairment charge and write the asset down to net realizable value.
We are vulnerable to supply shortages from single-sourced suppliers.
For 2009, we single sourced approximately 70 to 80 percent of the total types of parts in our product designs. Any delay in our suppliers' deliveries may adversely affect our operations at multiple manufacturing locations, forcing us to seek alternative supply sources to avoid serious disruptions. Delays may be caused by factors affecting our suppliers, including capacity constraints, labor disputes, economic downturns, availability of credit, the impaired financial condition of a particular supplier, suppliers' allocations to other purchasers, weather emergencies or acts of war or terrorism. Any extended delay in receiving critical supplies could impair our ability to deliver products to our customers.
Government regulation could adversely affect our businessbusiness.
Infrastructure development has been a significant driver of our business in recent years, especially in the emerging markets of China and Brazil. In 2012, infrastructure spending in emerging markets steadily declined throughout the year. General weakness in economic growth or the perception that infrastructure has been overbuilt could lead to a further decline in infrastructure spending. Any sustained downturns in infrastructure development that result from these or other circumstances could adversely affect our business.
.Unpredictability in the adoption, implementation and enforcement of increasingly stringent emission standards by multiple jurisdictions around the world could adversely affect our business.
Our engines are subject to extensive statutory and regulatory requirements governing emissionsemission and noise, including standards imposed by the EPA, the European Union, state regulatory agencies such(such as the California Air Resources Board ("CARB")CARB) and other regulatory agencies around the world. We have made, and will be required to continue to make, significant capital and research expenditures to comply with these regulatoryemission standards. Developing engines to meet numerous changing government regulatory requirements, with different implementation timelines and emissionsemission requirements, makes developing engines efficiently for multiple markets complicated and could result in substantial additional costs that may be difficult to recover in certain markets. In some cases, we may be required to develop new products to comply with new regulations, particularly those relating to air emissions. For example, we were required to develop new engines to comply with stringent emissions standards in the U.S. by January 1, 2010.emission. While we were able to meet this andhave met previous deadlines, our ability to comply with other existing and future regulatory standards will be essential for us to maintain our position in the engine markets we serve. Further, theThe successful development and introduction of new and enhanced products in order to comply with new regulatory requirements are subject to other risks, such
as delays in product development, cost over-runs and unanticipated technical and manufacturing difficulties.
In addition to these risks, the nature and timing of government implementation and enforcement of increasingly stringent emission standards around the world is unpredictable and subject to change, or delays which could result in the products we developed or modified to comply with these standards becoming unnecessary or becoming necessary later than expected and in some cases negating our competitive advantage. This in turn can delay, diminish or eliminate the expected return on capital and research expenditures that we have invested in such products and may adversely affect our perceived competitive advantage in being an early, advanced developer of compliant engines.
We derive significant income from investees that we do not directly control.
Our net income includes significant equity, royalty and interest income from investees that we do not directly control. For 2012, we recognized $384 million of equity, royalty and interest income from investees, compared to $416 million in 2011. The majority of our equity, royalty and interest income from investees is from our 11 unconsolidated North American distributors and from two of our joint ventures in China, Dongfeng Cummins Engine Company, Ltd. (DCEC) and Chongqing Cummins Engine Company, Ltd. (CCEC). Our equity ownership interests in our unconsolidated North American distributors generally range from 30 percent to 50 percent. We have 50 percent equity ownership interests in DCEC and CCEC. As a result, although a significant percentage of our net income is derived from these unconsolidated entities, we do not unilaterally control their management or their operations, which puts a substantial portion of our net income at risk from the actions or inactions of these other entities. A significant reduction in the level of contribution by these entities to our net income would likely have a material adverse effect on our results of operations.
Our truck manufacturers and original equipment manufacturers (OEMs) customers may not continue to outsource their engine supply needs.
Several of our engine customers, including PACCAR, Volvo AB, Navistar International Corporation and Chrysler, are truck manufacturers or OEMs that manufacture engines for some of their own products. Despite their own engine manufacturing abilities, these customers have historically chosen to outsource certain types of engine production to us due to the quality of our engine products, our emission capabilities, our systems integration, their customers' preferences, their desire for cost reductions, their desire for eliminating production risks and their desire to maintain company focus. However, there can be no assurance that these customers will continue to outsource, or outsource as much of, their engine production in the future. Increased levels of OEM vertical integration could result from a number of factors, such as shifts in our customers' business strategies, acquisition by a customer of another engine manufacturer, the inability of third-party suppliers to meet product specifications and the emergence of low-cost production opportunities in foreign countries. Any significant reduction in the level of engine production outsourcing from our truck manufacturer or OEM customers could have a material adverse effect on our results of operations.
A downturn in the North American truck industry or other factors negatively affecting any of our truck OEM customers could materially adversely impact our results of operations.
We make significant sales of engines and components to a few large truck OEMs in North America. If the North American truck market suffers a significant downturn, or if one of our large truck OEM customers experienced financial distress or bankruptcy, such circumstance would likely lead to significant reductions in our revenues and earnings, commercial disputes, receivable collection issues, and other negative consequences that could have a material adverse impact on our results of operations.
Greenhouse gas legislation or regulation could adversely affect our business.
There is growing consensus that some form of U.S. federal legislation and/or regulation may be forthcoming with respect to regulating manufacturers' greenhouse gas emissions. Any such regulation could result in the imposition on us of significant additional costs in the form of taxes, manufacturing restrictions and/or emission allowances. The impactdiscovery of any future mandatory greenhouse gas legislative, regulatory and/or product standard requirements on our global businesses is dependent on the design, terms and applicability of the mandate or standard. We are unable to predict whether and/or the extent to which any of these potential requirements will be enacted or imposed upon us.
Our products are exposed to variability in material and commodity costs.
Our businesses establish pricessignificant problems with our customersnew engine platforms in accordance with contractual time frames; however, the timing of market price increases may prevent us from passing these additional costs on to our customers through timely pricing actions. Additionally, higher material and commodity costs around the world may offset our efforts to reduce our cost structure. While we customarily enter into financial transactions to address some of these risks, there can be no assurance that commodity price fluctuations will notNorth America could materially adversely affectimpact our results of operations, financial condition and cash flows. In addition, whileflow.
The EPA and CARB have certified all of our 2012/2013 on-highway and off-highway engines, which utilize SCR technology to meet requisite emission levels. We introduced SCR technology into our engine platforms in 2010. The effective performance of SCR technology and the useoverall performance of commodity price hedging instruments may provide us with protection from adverse fluctuationsthese engine platforms impact a number of our operating segments and remain crucial to our success in commodity prices, by utilizingNorth America. While these instruments we potentially forego2010 engine platforms have performed well in the benefits that might result from favorable fluctuationsfield, the discovery of any significant problems in price. As a result, higher material and commodity costs, as well as hedging these commodity costs during periods of decreasing prices, bothplatforms could result in declining margins.recall campaigns, increased warranty costs, reputational risk and brand risk, and could materially adversely impact our results of operations, financial condition and cash flow.
We are subject to currency exchange rate and other related risksrisks..
We conduct operations in many areas of the world involving transactions denominated in a variety of currencies. We are subject to currency exchange rate risk to the extent that our costs are denominated in currencies other than those in which we earn revenues. In addition, since our financial statements are denominated in U.S. dollars, changes in currency exchange rates between the U.S. dollar and other currencies have had, and will continue to have, an impact on our results of operations. While we customarily enter into financial transactions that attempt to address these risks and many of our supply agreements with customers include currency exchange rate adjustment provisions, there can be no assurance that currency exchange rate fluctuations will not adversely affect our results of operations, financial condition and cash flows.operations. In addition, while the use of currency hedging instruments may provide us with some protection from adverse fluctuations in currency exchange rates, by utilizing these instruments we potentially forego the benefits that might result from favorable fluctuations in currency exchange rates.
We also face risks arising from the imposition of exchange controls and currency devaluations. Exchange controls may limit our ability to convert foreign currencies into U.S. dollars or to remit dividends and other payments by our foreign subsidiaries or businesses located in or conducted within a country imposing controls. Currency devaluations result in a diminished value of funds denominated in the currency of the country instituting the devaluation.
Further deterioration in the North American and European automotive industries could adversely impact our businessWe are vulnerable to supply shortages from single-sourced suppliers..
A number of companies in the global automotive industry continueDuring 2012, we single sourced approximately 60 to experience financial difficulties. In North America, General Motors Corporation ("GM"), Ford Motor Company and Chrysler Group, LLC ("Chrysler") have experienced declining markets; furthermore, GM and Chrysler have filed for, and then exited, bankruptcy under Chapter 1170 percent of the U.S. bankruptcy code and have accepted substantial monetary infusions from the United States government. Automakers across Europe and Japan are also experiencing difficulties from a weakened economy and tightening credit markets. Because manytotal types of parts in our product designs. Any delay in our suppliers' deliveries may adversely affect our operations at multiple manufacturing locations, forcing us to seek alternative supply sources to avoid serious disruptions. Delays may be caused by factors affecting our suppliers, also supply automotive industry participants,including capacity constraints, labor disputes, economic downturns, availability of credit, the difficult automotiveimpaired financial condition of a particular supplier, suppliers' allocations to other purchasers, weather emergencies, natural disasters or acts of war or terrorism. Any extended delay in receiving critical supplies could impair our ability to deliver products to our customers and our results of operations.
Our products are exposed to variability in material and commodity costs.
Our businesses establish prices with our customers in accordance with contractual time frames; however, the timing of material and commodity market price increases may prevent us from passing these additional costs on to our customers through timely pricing actions. Additionally, higher material and commodity costs around the world may offset our efforts to reduce our cost structure. While we customarily enter into financial transactions and contractual pricing adjustment provisions with our customers that attempt to address some of these risks (notably with respect to copper, platinum and palladium), there can be no assurance that commodity price fluctuations will not adversely affect our results of operations. In addition, while the use of commodity price hedging instruments may provide
industry conditions have also adversely affected our supply base. Lower production levels forus with some protection from adverse fluctuations in commodity prices, by utilizing these instruments we potentially forego the benefits that might result from favorable fluctuations in price. As a result, higher material and commodity costs, as well as hedging these commodity costs during periods of our key suppliers, increasesdecreasing prices, could result in certain raw material, commodity and energy costs and the global credit market crisis have resulted in severe financial distress among many companies within the automotive supply base. The continuation of financial distress within the automotive industry and our shared supply base and/or the subsequent bankruptcy of one or more additional automakers may lead to further supplier bankruptcies, commercial disputes, supply chain interruptions, supplier requests for company sponsored capital support or a collapse of the supply chain.declining margins.
Significant declines inOur products are subject to recall for performance or safety-related issues.
Our products may be subject to recall for performance or safety-related issues. Product recalls subject us to harm to our reputation, loss of current and future financialcustomers, reduced revenue and stock market conditionsproduct recall costs. Product recall costs are incurred when we decide, either voluntarily or involuntarily, to recall a product through a formal campaign to solicit the return of specific products due to a known or suspected performance issue. Any significant product recalls could diminish our pension plan asset performance and adversely impacthave a material adverse effect on our results of operations, financial condition and cash flowsflows.
We face significant competition in the markets we serve..
The markets in which we operate are highly competitive. We sponsor both fundedcompete worldwide with a number of other manufacturers and unfunded domesticdistributors that produce and foreign defined benefit pensionsell similar products. We primarily compete in the market with diesel engines and related diesel products; however, new technologies continue to be developed for gasoline, natural gas and other retirement plans.technologies and we will continue to face new competition from these expanding technologies. Our pension expenseproducts primarily compete on the basis of price, performance, fuel economy, speed of delivery, quality and customer support. We also face competitors in some emerging markets who have established local practices and long standing relationships with participants in these markets. There can be no assurance that our products will be able to compete successfully with the required contributionsproducts of other companies and in other markets. For a more complete discussion of the competitive environment in which each of our segments operates, see "Operating Segments" in "Item 1 Business."
Increasing global competition among our customers may affect our existing customer relationships and restrict our ability to benefit from some of our customers' growth.
As our customers in emerging markets continue to grow in size and scope, they are increasingly seeking to export their products to other countries. This has meant greater demand for our advanced engine technologies to help these customers meet the more stringent emissions requirements of developed markets, as well as greater demand for access to our pension plans are directly affected by the valuedistribution systems for purposes of plan assets, the projectedequipment servicing. As these emerging market customers enter into and actual ratesbegin to compete in more developed markets, they may increasingly begin to compete with our existing customers in these markets. Our further aid to emerging market customers could adversely affect our relationships with developed market customers and, as a result, we may be pressured to restrict sale or support of return on plan assets and the actuarial assumptions we use to measuresome of our defined benefit pension plan obligations, including the discount rate at which future projected and accumulated pension obligations are discounted to a present value. We could experience increased pension expense due to a combination of factors, including the decreased investment performance of pension plan assets, decreasesproducts in the discount rate and changes in our assumptions relatingareas of increased competition. In addition, to the expected return on plan assets.
Significant declinesextent the competition does not correspond to overall growth in future financial and stockdemand, we may see little or no benefit from this type of expansion by our emerging market conditions could cause material losses in our pension plan assets, which could result in increased pension expense in future years and adverse changes to our financial condition. We may be legally required to make contributions to our U.S. pension plans in the future, and these contributions could be material. In addition, if local legal authorities increase the minimum funding requirements for our pension plans outside the U.S., we could be required to contribute more funds.customers.
We are exposed to political, economic and other risks that arise from operating a multinational business.
Approximately 5253 percent of our net sales for 20092012 and 59 percent in 2011 were attributable to customers outside the U.S., compared to 59 percent in 2008. Accordingly, our business is subject to the political, economic and other risks that are inherent in operating in numerous countries. These risks include:
As we continue to operate our business globally, our success will depend, in part, on our ability to anticipate and effectively manage these and other related risks. There can be no assurance that the consequences of these and other factors relating to our multinational operations will not have a material adverse effect upon us.
Unanticipated changes in our effective tax rate, the adoption of new tax legislation or exposure to additional income tax liabilities could adversely affect our profitability.
We are subject to income taxes in the U.S. and numerous international jurisdictions. Our income tax provision and cash tax liability in the future could be adversely affected by changes in the distribution of earnings in countries with differing statutory tax rates, changes in the valuation of deferred tax assets and liabilities, changes to our assertions regarding permanent re-investment of our foreign earnings, changes in tax laws and the discovery of new information in the course of our tax return preparation process. The carrying value of deferred tax assets, which are predominantly in the U.S., is dependent on our ability to generate future taxable income in the U.S. We are also subject to ongoing tax audits. These audits can involve complex issues, which may require an extended period of time to resolve and can be highly judgmental. Tax authorities may disagree with certain tax reporting positions taken by us and, as a result, assess additional taxes against us. We regularly assess the likely outcomes of these audits in order to determine the appropriateness of our tax provision. The amounts ultimately paid upon resolution of these or subsequent tax audits could be materially different from the amounts previously included in our income tax provision and, therefore, could have a material impact on our tax provision.
We are exposed to risks arising from the price and availability of energy.
The level of demand for our products and services is influenced in multiple ways by the price and availability of energy. High energy costs generally drive greater demand for better fuel economy in almost all countries in which we operate. Some of our engine products have been developed with a primary purpose of offering fuel economy improvements, and if energy costs decrease or increase less than expected, demand for these products may likewise decrease. The relative unavailability of electricity in some emerging market countries also influences demand for our electricity generating products, such as our diesel generators. If these countries add energy capacity by expanding their power grids at a rate equal to or faster than the growth in demand for energy, the demand for our generating products could also decrease or increase less than would otherwise be the case.
Our global operations are subject to laws and regulations that impose significant compliance costs and create reputational and legal risk.
Due to the international scope of our operations, we are subject to a complex system of commercial and trade regulations around the world. Recent years have seen an increase in the development and enforcement of laws regarding trade compliance and anti-corruption such as the U.S. Foreign Corrupt Practices Act and similar laws from other countries. Our numerous foreign subsidiaries, affiliates and joint venture partners are governed by laws, rules and business practices that
differ from those of the U.S. The activities of these entities may not comply with U.S. laws or business practices or our Code of Business Conduct. Violations of these laws may result in severe criminal or civil sanctions, could disrupt our business, and result in an adverse effect on our reputation, business and results of operations or financial condition. We cannot predict the nature, scope or effect of future regulatory requirements to which our operations might be subject or the manner in which existing laws might be administered or interpreted.
We face the challenge of accurately aligning our capacity with our demand.
We can experience capacity constraints and longer lead times for certain products in times of growing demand while we can also experience idle capacity as economies slow or demand for certain products decline. Accurately forecasting our expected volumes and appropriately adjusting our capacity have been, and will continue to be, important factors in determining our results of operations. We cannot guarantee that we will be able to increase manufacturing capacity to a level that meets demand for our products, which could prevent us from meeting increased customer demand and could harm our business. However, if we overestimate our demand and overbuild our capacity, we may have significantly underutilized assets and we may experience reduced margins. If we do not accurately align our manufacturing capabilities with demand it could have a material adverse effect on our results of operations.
Our business is exposed to risks of product liability claimsclaims..
We face an inherent business risk of exposure to product liability claims in the event that our products' failure to perform to specification results or is alleged to result in property damage, bodily injury and/or death. We may experience material product liability losses in the future. While we maintain insurance coverage with respect to certain product liability claims, we may not be able to obtain such insurance on acceptable terms in the future, if at all, and any such insurance may not provide adequate coverage against product liability claims. In addition, product liability claims can be expensive to defend and can divert the attention of management and other personnel for significant periods of time, regardless of the ultimate outcome. An unsuccessful defense of a significant product liability claim could have a material adverse effect upon us. In addition, even if we are successful in defending against a claim relating to our products, claims of this nature could cause our customers to lose confidence in our products and us.
Our products are subjectWe may need to recall for performance-related issueswrite off significant investments in our new North American light-duty diesel engine platform if customer commitments further deteriorate..
Our products mayWe began development of a new North American light-duty diesel engine platform in July 2006 to be subject to recall for performance-related or safety-related issues. Product recalls subject us to harm to our reputation, lossused in a variety of currenton- and future customers, reduced revenueoff-highway applications. Since that time, and product recall costs. Product recall costs are incurred whenas of December 31, 2012, we decide, either voluntarily or involuntarily, to recall a product through a formal campaign to solicit the returnhave capitalized investments of specific products due to a known or suspected performance issue.
Our truck manufacturers and OEM customers may not continue to outsource their engine supply needs.
Several of our engine customers, including PACCAR Inc., Volvo AB and Chrysler, are truck manufacturers or OEMs that manufacture engines for some of their own products. Despite their engine manufacturing abilities, these customers have historically chosen to outsource certain types of engine production to usapproximately $233 million. Market uncertainty due to the quality of our engine products, our emissions capability, our systems integration,global recession resulted in some customers delaying or cancelling their customers' preferences, their desire for cost reductions, their desire for eliminating production risks and their desire to maintain company focus. However, there can be no assurance that these customers will continue to outsource,vehicle programs, while others remain active. If customer expectations or outsource as much of, their engine production in the future. Increased levels of OEM vertical integration could result from a number of factors, such as shifts in our customers' business strategies, acquisition by a customer of another engine manufacturer, the inability of third-party suppliers to meet product specifications and the emergence of low-cost production opportunities in foreign countries. Any significant reduction in the level of engine production outsourcingvolume projections further deteriorate from our truck manufacturer or OEMcurrent expected levels and we do not identify new customers, could have a material adverse effect upon us.we may need to recognize an impairment charge and write the assets down to net realizable value.
Our operations are subject to extensiveincreasingly stringent environmental laws and regulationsregulations..
Our plants and operations are subject to increasingly stringent environmental laws and regulations in all of the countries in which we operate, including laws and regulations governing air emissions,emission, discharges to water and the generation, handling, storage, transportation, treatment and disposal of waste materials. While we believe that we are in compliance in all material respects with these environmental laws and regulations, there can be no assurance that we will not be adversely impacted by costs, liabilities or claims with respect to existing or subsequently acquired operations, under either
present laws and regulations or those that may be adopted or imposed in the future. We are also subject to laws requiring the cleanup of contaminated property. If a release of hazardous substances occurs at or from any of our current or former properties or at a landfill or another location where we have disposed of hazardous materials, we may be held liable for the contamination and the amount of such liability could be material.
We rely on income from investees that we do not directly control.Significant declines in future financial and stock market conditions could diminish our pension plan asset performance and adversely impact our results of operations, financial condition and cash flow.
We sponsor both funded and unfunded domestic and foreign defined benefit pension and other retirement plans. Our net income includes significant equity, royaltypension expense and interest income from investees thatthe required contributions to our pension plans are directly affected by the value of plan assets, the projected and actual rates of return on plan assets and the actuarial assumptions we do not directly control. For 2009, we recognized $214 millionuse to measure our defined benefit pension plan obligations, including the discount rate at which future projected and accumulated pension obligations are discounted to a present value. We could experience increased pension expense due to a combination of equity, royaltyfactors, including the decreased investment performance of pension plan assets, decreases in the discount rate and interest income from investees. The majority of our equity, royalty and interest income from investees comes from our 13 unconsolidated North American distributors, and from two of our joint ventures in China, Dongfeng Cummins Engine Company, Ltd. ("DCEC") and Chongqing Cummins Engine Company, Ltd. ("CCEC"). Our equity ownership interestschanges in our unconsolidated North American distributors generally range from 30 percentassumptions relating to 50 percent. We have 50 percent equity ownership intereststhe expected return on plan assets.
Significant declines in DCECfuture financial and CCEC. As astock market conditions could cause material losses in our pension plan assets, which could result although a significant percentagein increased pension expense in future years and adversely impact our results of our net income is derived from these unconsolidated entities,operations, financial condition and cash flow. Depending upon the severity of market declines and government regulatory changes, we do not unilaterally control their management or operations, which put a substantial portion of our net income at risk from the actions or inactions of these other entities. A significant reduction in the level of contribution by these entitiesmay be legally obligated to our net income would likely have a material adverse effect upon us.
We face reputational and legal risk from affiliations with foreign joint venture partners.
Several of our joint venture partners are domiciled in areas of the world with laws, rules and business practices that differ from thosemake pension payments in the U.S. Although we strive to select joint venture partners who share our values and understand our reporting requirements as a U.S. domiciled companyperhaps other countries and to ensure that an appropriate business culture exists within these ventures to minimize and mitigate our risk, we nonetheless face the reputational and legal risk that our joint venture partners will violate applicable laws, rules and business practices.
Unanticipated changes in our tax provisions, the adoption of new U.S. tax legislation or exposure to additional income tax liabilities could adversely affect our profitability.
We are subject to ongoing tax audits in various U.S. and foreign jurisdictions. Tax authorities may disagree with certain tax reporting positions taken by us and, as a result, assess additional taxes against us. We regularly assess the likely outcomes of these audits in order to determine the appropriateness of our tax provision. However, there can be no assurance that we will accurately predict the outcomes of these audits, and the amounts ultimately paid upon resolution of these or subsequent tax auditscontributions could be materially different from the amounts previously included in our income tax expense and, therefore, could have a material impact on our tax provision.
Our effective tax rate in the future could be adversely affected by changes to our operating structure, changes in the mix of earnings in countries with differing statutory tax rates, changes in the valuation of deferred tax assets and liabilities, changes in tax laws and the discovery of new information in the course of our tax return preparation process. In particular, the carrying value of deferred tax assets, which are predominantly in the U.S., is dependent on our ability to generate future taxable income in the U.S.
President Obama's administration has recently announced proposals for new U.S. tax legislation that, if adopted, could adversely affect our tax rate. The proposed changes that could have an impact include the deferral of certain U.S. income tax deductions and foreign tax credit reform. Although the scope of the proposed changes is unclear, it is possible that these or other changes in the U.S. tax laws could increase our effective tax rate and adversely affect our profitability. In addition, as a result of the economic recession, many states are considering new tax legislation to raise revenues and reduce their spending deficits. Implementation of any of these new tax laws could adversely affect us.material.
We may be adversely impacted by work stoppages and other labor mattersmatters..
As of December 31, 2009,2012, we employed approximately 34,90046,000 persons worldwide. Approximately 13,20015,750 of our employees worldwide are represented by various unions under collective bargaining
agreements that expire between 20102013 and 2014.2015. While we have no reason to believe that we will be materially impacted by work stoppages andor other labor matters, there can be no assurance that future issues with our labor unions will be resolved favorably or that we will not encounter future strikes, work stoppages, or other types of conflicts with labor unions or our employees. Any of these consequences may have an adverse effect on us or may limit our flexibility in dealing with our workforce. In addition, many of our customers and suppliers have unionized work forces. Work stoppages or slow-downs experienced by our customers or suppliers could result in slow-downs or closures at vehicle assembly plants where our engines are installed. If one or more of our customers experiencethat would have a material work stoppage, itadverse effect on our results of operations, financial condition and cash flow.
Our financial statements are subject to changes in accounting standards that could adversely impact our profitability or financial position.
Our financial statements are subject to the application of accounting principles generally accepted in the United States of America (GAAP), which are periodically revised and/or expanded. Accordingly, from time to time we are required to adopt new or revised accounting standards issued by recognized authoritative bodies, including the Financial Accounting Standards Board. Recently, accounting standard setters issued new guidance which further interprets or seeks to revise accounting pronouncements related to revenue recognition and lease accounting as well as to issue new standards expanding disclosures. The impact of accounting pronouncements that have been issued but not yet implemented is disclosed in our annual and quarterly reports on Form 10-K and Form 10-Q. An assessment of proposed standards is not provided, as such proposals are subject to change through the exposure process and, therefore, their effects on our financial statements cannot be meaningfully assessed. It is possible that future accounting standards we are required to adopt could change the current accounting treatment that we apply to our consolidated financial statements and that such changes could have a material adverse effect on our operations.the reported results of operations and financial position.
We face significant competition in the markets we serve.Table of Contents
The markets in which we operate are highly competitive. We compete worldwide with a number of other manufacturers and distributors that produce and sell similar products. Our products primarily compete on the basis of price, performance, fuel economy, speed of delivery, quality and customer support. There can be no assurance that our products will be able to compete successfully with the products of these other companies. For a more complete discussion of the competitive environment in which each of our segments operates, see "Operating Segments" in "Item 1 Business."
ItemITEM 1B. Unresolved Staff Comments
None.
Our principal manufacturing facilities include our plants used by the following segments in the following locations:
Segment | U.S. Facilities | Facilities Outside the U.S. | ||||
|---|---|---|---|---|---|---|
Engine | Indiana: Columbus, Seymour | |||||
| Tennessee: Memphis | ||||||
| India: Pune | ||||||
| Mexico: San Luis Potosi | ||||||
| U.K.: Darlington, Daventry, | ||||||
| Cumbernauld | ||||||
| Indiana: | Australia: Kilsyth | ||||
| Iowa: Lake Mills | Brazil: Sao Paulo | |||||
| South Carolina: Charleston | China: Beijing, Shanghai, Wuxi, Wuhan | |||||
| Tennessee: Cookeville | France: Quimper | |||||
| Wisconsin: Mineral Point, Neillsville | Germany: Marktheidenfeld | |||||
| India: Pune, Daman, Dewas, Pithampur, | ||||||
| Radurapur | ||||||
| Mexico: Ciudad Juarez, San Luis Potosi | ||||||
| South Africa: Pretoria, Johannesburg | ||||||
| South Korea: Suwon | ||||||
| Turkey: Ismir | ||||||
| U.K.: Darlington, Huddersfield | ||||||
Power Generation | Indiana: Elkhart | Brazil: Sao Paulo | ||||
| Minnesota: Fridley | China: Wuxi, Wuhan | |||||
| Germany: | ||||||
| India: | ||||||
| Mexico: San Luis Potosi | ||||||
| Romania: Craiova | ||||||
| U.K.: Margate, Manston, Stamford | ||||||
In addition, engines and engine components are manufactured by joint ventures or independent licensees at manufacturing plants in the U.K.U.S., China, India, Japan, Pakistan, South Korea, TurkeyMexico and Indonesia.Sweden.
The principal distribution facilities used by our Distribution segment are located in the following locations:
| U.S. Facilities | Facilities Outside the U.S. | |
|---|---|---|
| Australia: Scoresby | ||
| Belgium: Mechelen | ||
| Canada: Surrey, Edmonton | ||
| Nebraska: Omaha | China: Beijing, Shanghai | |
| New York: Bronx | Germany: Gross Gerau | |
| Pennsylvania: Bristol, Harrisburg | India: Pune | |
| Japan: Tokyo | ||
| Korea: Chonan | ||
| Russia: Moscow | ||
| Singapore: Singapore SG | ||
| South Africa: Johannesburg | ||
| U.K.: Wellingborough | ||
| United Arab Emirates: Dubai |
Headquarters and Other Offices
Our Corporate Headquarters are located in Columbus, Indiana. Additional marketing and operational headquarters are in the following locations:
| U.S. Facilities | Facilities Outside the U.S. | |
|---|---|---|
| Indiana: Columbus, Indianapolis | China: Beijing, Shanghai | |
| Tennessee: Franklin, Nashville | India: Pune | |
| Washington DC | U.K.: Staines, Stockton |
We are subject to numerous lawsuits and claims arising out of the ordinary course of our business, including actions related to product liability; personal injury; the use and performance of our products; warranty matters; patent, trademark or other intellectual property infringement; contractual liability; the conduct of our business; tax reporting in foreign jurisdictions; distributor termination; workplace safety; and environmental matters. We also have been identified as a potentially responsible party at multiple waste disposal sites under U.S. federal and related state environmental statutes and regulations and may have joint and several liability for any investigation and remediation costs incurred with respect to such sites, as more fully described in Item 1 of this Form 10-K under "Environmental Compliance-Other Environmental Statutes and Regulations."sites. We have denied liability with respect to many of these lawsuits, claims and proceedings and are vigorously defending such lawsuits, claims and proceedings. We carry various forms of commercial, property and casualty, product liability and other forms of insurance; however, such insurance may not be applicable or adequate to cover the costs associated with a judgment against us with respect to these lawsuits, claims and proceedings. We do not believe that these lawsuits are material individually or in the aggregate. While we believe we have also established adequate accruals for our expected future liability with respect to pending lawsuits, claims and proceedings, where the nature and extent of any such liability can be reasonably estimated based upon then presently available information, there can be no assurance that the final resolution of any existing or future lawsuits, claims or proceedings will not have a material adverse effect on our business, results of operations, financial condition or cash flows.
In June 2008, four of our sitesWe conduct significant business operations in Southern Indiana, including our Technical Center, experienced extensive flood damage. We have submitted a claim for $237 millionBrazil that are subject to our insurance carriers, which includes a claim for business interruption. Our insurance carriers have disputed certain aspects of our claimthe Brazilian federal, state and each party has filed suit against the other. Althoughlocal labor, social security, tax and customs laws. While we believe that we should be insured against the full amount ofcomply with such claim, there can be no assurance that we will be successful in pursuing these claims.
Item 4. Submission of Matters to a Vote of Security Holders
There were no matters submitted to a vote of our shareholders during the last quarter of 2009.laws, they
are complex, subject to varying interpretations and we are often engaged in litigation regarding the application of these laws to particular circumstances.
ITEM 4. Mine Safety Disclosures
Not Applicable.
ItemITEM 5. Market for Registrant's Common Equity, Related Stockholder Matters and Issuer Purchases of Equity Securities
(a) Our common stock par value $2.50 per share, is listed on the NYSE under the symbol "CMI." For information about the quoted market prices of our common stock, information regarding dividend payments and the number of common stock shareholders, see "Selected Quarterly Financial Data" in this report. For other matters related to our common stock and shareholders' equity, see Note 15, "CUMMINS INC. SHAREHOLDERS'"SHAREHOLDERS' EQUITY," to theConsolidated Financial Statements.
(b) Use of proceeds—not applicable.
(c) The following information is provided pursuant to Item 703 of Regulation S-K:
| | Issuer Purchases of Equity Securities | ||||||||||||
|---|---|---|---|---|---|---|---|---|---|---|---|---|---|
Period | (a) Total Number of Shares Purchased(1) | (b) Average Price Paid per Share | (c) Total Number of Shares Purchased as Part of Publicly Announced Plans or Programs | (d) Maximum Number of Shares that May Yet Be Purchased Under the Plans or Programs(2) | |||||||||
October 1 - November 4, 2012 | 284,881 | $ | 87.84 | 284,568 | 131,733 | ||||||||
November 5 - December 2, 2012 | 2,653 | 99.54 | — | 131,514 | |||||||||
December 3 - December 31, 2012 | 14,372 | 106.00 | — | 118,254 | |||||||||
Total | 301,906 | 88.80 | 284,568 | ||||||||||
| | ISSUER PURCHASES OF EQUITY SECURITIES | ||||||||||||
|---|---|---|---|---|---|---|---|---|---|---|---|---|---|
Period | (a) Total Number of Shares Purchased(1) | (b) Average Price Paid per Share | (c) Total Number of Shares Purchased as Part of Publicly Announced Plans or Programs | (d) Maximum Number of Shares that May Yet Be Purchased Under the Plans or Programs(2) | |||||||||
September 28 - November 1, 2009 | — | $ | — | — | 320,635 | ||||||||
November 2 - November 29, 2009 | 475,995 | 46.63 | 435,000 | 281,197 | |||||||||
November 30 - December 31, 2009 | 21,942 | 46.46 | — | 256,791 | |||||||||
Total | 497,937 | $ | 46.62 | 435,000 | |||||||||
In December 2007,2011 we completed our prior authorization, purchasing the remaining $111 million (1.1 million shares) authorized under this plan. In February 2011, the Board of Directors authorized us to acquirethe acquisition of an additional $500 million$1 billion of our common stock. This authorization does not have an expiration date. In 2008,stock beginning in 2011, and we acquired $128$518 million, followed by a further $20or 5.3 million shares, under the new authorization in 2009,2011. In 2012 we acquired $256 million, or 2.6 million shares, of our common stock leaving $352$226 million available for purchase under this authorization at December 31, 2009. We announced in February 2009 that we temporarily suspended2012. In December 2012, the Board of Directors authorized the acquisition of an additional $1 billion of our common stock upon completion of the 2011 repurchase program to conserve cash. We lifted the suspension in October 2009 and will from time to time repurchase stock.program.
During the fourth quarter of 2009,2012, we repurchased 62,93717,338 shares of common stock from employees in connection with the Key Employee Stock Investment Plan which allows certain employees, other than officers, to purchase shares of common stock on an installment basis up to an established credit limit. Loans are issued for initial five-year terms at a fixed interest rate established at the date of purchase and may be refinanced after its initial five-year period for an additional five-year period. Participants must hold
shares for a minimum of six months from date of purchase and after shares are sold must wait six months before another share purchase may be made. We hold participants' shares as security for the loans and would, in effect repurchase shares if the participant defaulted in repayment of the loan. There is no maximum amount of shares that we may purchase under this plan.
The following Performance Graph and related information shall not be deemed "soliciting material" or to be "filed" with the Securities and Exchange Commission, nor shall such information be incorporated by reference into any of our future filingfilings under the Securities Act of 1933 or Securities Exchange Act of 1934, each as amended, except to the extent that we specifically incorporate it by reference into such filing.
The following graph compares the cumulative total shareholder return on our common stock for the last five years with the cumulative total return on the S&P 500 Index and an index of peer companies selected by us. Our peer group included ArvinMeritor Inc.,includes BorgWarner Inc, Caterpillar, Inc., Daimler AG, Danaher Corporation, Deere & Company, Donaldson Company Inc., Eaton Corporation, Emerson Electric Co., W.W. Grainger Inc., Honeywell International, Illinois Tool Works Inc., Ingersoll-Rand Company Ltd., Navistar International Corporation, PACCAR Inc, Parker-Hannifin Corporation, Textron Inc. and PACCAR Inc. We have a unique business and selected peers that we believe are the most closely aligned with our business.Volvo AB. Each of the three measures of cumulative total return assumes reinvestment of dividends. The comparisons in this table are required by the SEC and are not intended to forecast or be indicative of possible future performance of our stock.
COMPARISON OF 5-YEAR5 YEAR CUMULATIVE TOTAL RETURN
AMONG CUMMINS INC.,
S&P 500 INDEX AND CUSTOM PEER GROUP
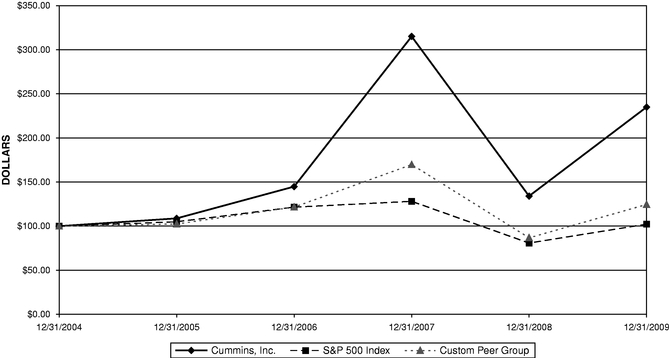
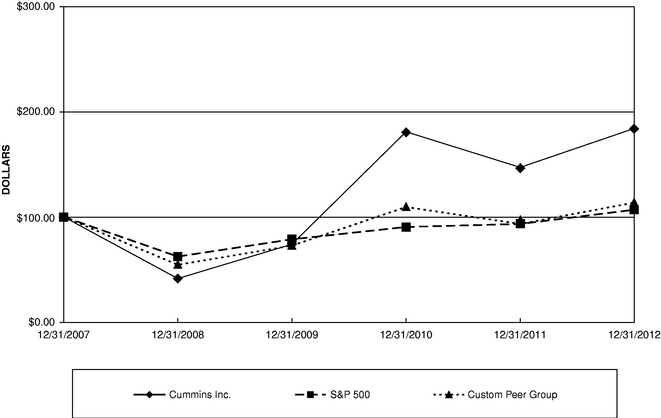
ASSUMES $100 INVESTED ON JAN. 01, 2005DEC. 31, 2007
ASSUMES DIVIDENDDIVIDENDS REINVESTED
FISCAL YEAR ENDING DEC. 31, 20092012
ItemITEM 6. Selected Financial Data
The selected financial information presented below for each of the last five years ended December 31, 2009,beginning with 2012, was derived from ourConsolidated Financial Statements. This information should be read in conjunction with ourConsolidated Financial Statements and related notes and "Management's Discussion and Analysis of Financial Condition and Results of Operations."
| In millions, except per share amounts | 2012 | 2011 | 2010 | 2009 | 2008 | |||||||||||
|---|---|---|---|---|---|---|---|---|---|---|---|---|---|---|---|---|
For the years ended December 31, | ||||||||||||||||
Net sales | $ | 17,334 | $ | 18,048 | $ | 13,226 | $ | 10,800 | $ | 14,342 | ||||||
U.S. percentage of sales | 47 | % | 41 | % | 36 | % | 48 | % | 41 | % | ||||||
Non-U.S. percentage of sales | 53 | % | 59 | % | 64 | % | 52 | % | 59 | % | ||||||
Gross margin | 4,508 | 4,589 | 3,168 | 2,169 | 2,940 | |||||||||||
Research, development and engineering expenses | 728 | 629 | 414 | 362 | 422 | |||||||||||
Equity, royalty and interest income from investees | 384 | 416 | 351 | 214 | 253 | |||||||||||
Interest expense | 32 | 44 | 40 | 35 | 42 | |||||||||||
Consolidated net income(1) | 1,738 | 1,946 | 1,140 | 484 | 818 | |||||||||||
Net income attributable to Cummins Inc.(1)(2) | 1,645 | 1,848 | 1,040 | 428 | 755 | |||||||||||
Net earnings per share attributable to Cummins Inc. | ||||||||||||||||
Basic | $ | 8.69 | $ | 9.58 | $ | 5.29 | $ | 2.17 | $ | 3.87 | ||||||
Diluted | 8.67 | 9.55 | 5.28 | 2.16 | 3.84 | |||||||||||
Cash dividends declared per share | 1.80 | 1.325 | 0.875 | 0.70 | 0.60 | |||||||||||
Cash flows from operations | $ | 1,532 | $ | 2,073 | $ | 1,006 | $ | 1,137 | $ | 987 | ||||||
Capital expenditures | 690 | 622 | 364 | 310 | 543 | |||||||||||
At December 31, | ||||||||||||||||
Cash and cash equivalents | $ | 1,369 | $ | 1,484 | $ | 1,023 | $ | 930 | $ | 426 | ||||||
Total assets | 12,548 | 11,668 | 10,402 | 8,816 | 8,519 | |||||||||||
Long-term debt | 698 | 658 | 709 | 637 | 629 | |||||||||||
Total equity(3) | 6,974 | 5,831 | 4,996 | 4,020 | 3,480 | |||||||||||
| In millions, except per share amounts | 2009 | 2008 | 2007 | 2006 | 2005 | ||||||||||||
|---|---|---|---|---|---|---|---|---|---|---|---|---|---|---|---|---|---|
For the years ended December 31, | |||||||||||||||||
Net sales | $ | 10,800 | $ | 14,342 | $ | 13,048 | $ | 11,362 | $ | 9,918 | |||||||
U.S. percentage of sales | 48 | % | 41 | % | 46 | % | 50 | % | 49 | % | |||||||
Non-U.S. percentage of sales | 52 | % | 59 | % | 54 | % | 50 | % | 51 | % | |||||||
Gross margin | 2,169 | 2,940 | 2,556 | 2,465 | 2,044 | ||||||||||||
Research, development and engineering expenses | 362 | 422 | 329 | 321 | 278 | ||||||||||||
Equity, royalty and interest income from investees | 214 | 253 | 205 | 140 | 131 | ||||||||||||
Interest expense | 35 | 42 | 58 | 96 | 109 | ||||||||||||
Net income(1) | 484 | 818 | 788 | 759 | 582 | ||||||||||||
Net income attributable to Cummins Inc.(1)(2) | 428 | 755 | 739 | 715 | 550 | ||||||||||||
Net earnings per share attributable to Cummins Inc.(3) | |||||||||||||||||
Basic | $ | 2.17 | $ | 3.87 | $ | 3.72 | $ | 3.76 | $ | 3.11 | |||||||
Diluted | 2.16 | 3.84 | 3.70 | 3.55 | 2.75 | ||||||||||||
Cash dividends declared per share | 0.70 | 0.60 | 0.43 | 0.33 | 0.30 | ||||||||||||
Cash flows from operations | $ | 1,137 | $ | 987 | $ | 810 | $ | 840 | $ | 760 | |||||||
Capital expenditures | 310 | 543 | 353 | 249 | 186 | ||||||||||||
At December 31, | |||||||||||||||||
Cash and cash equivalents | $ | 930 | $ | 426 | $ | 577 | $ | 840 | $ | 779 | |||||||
Total assets | 8,816 | 8,519 | 8,195 | 7,465 | 6,885 | ||||||||||||
Long-term debt | 637 | 629 | 555 | 647 | 1,213 | ||||||||||||
Total equity(4) | 4,020 | 3,480 | 3,702 | 3,056 | 2,089 | ||||||||||||
ItemITEM 7. Management's Discussion and Analysis of Financial Condition and Results of Operations
The following Management's Discussion and Analysis of Financial Condition and Results of Operations ("MD&A") was prepared to provide the reader with a view and perspective of our businessesbusiness through the eyes of management and should be read in conjunction with ourConsolidated Financial Statements and the accompanying notes to those financial statements. Our MD&A is presented in the following sections:
EXECUTIVE SUMMARY AND FINANCIAL HIGHLIGHTS
We are a global power leader that designs, manufactures, distributes and services diesel and natural gas engines electric power generation systems and engine-related component products, including filtration, exhaust aftertreatment, turbochargers, fuel systems, controls andsystems, air handling systems and electric power generation systems. We sell our products to original equipment manufacturers (OEMs), distributors and other customers worldwide. We have long-standing relationships with many of the leading manufacturers in the markets we serve, including PACCAR Inc.,Inc, Daimler Trucks North America, Chrysler Group, LLC, Volvo AB, Komatsu, Navistar International Corporation, Aggreko plc, Ford Motor Company Komatsu,and MAN Nutzfahrzeuge AG (formerly Volkswagen) and Case New Holland.AG. We serve our customers through a network of more than 500approximately 600 company-owned and independent distributor locations and approximately 5,2006,500 dealer locations in more than 190 countries and territories.
Our reportable operating segments consist of the following: Engine, Components, Power Generation Components and Distribution. This reporting structure is organized according to the products and markets each segment serves and allows management to focus its efforts on providing enhanced service to a wide range of customers. The Engine segment produces engines and parts for sale to customers in on-highway and various industrial markets. TheOur engines are used in trucks of all sizes, buses and recreational vehicles, as well as in various industrial applications, including construction, mining, agriculture, marine, oil and gas, rail and military.military equipment. The Components segment sells filtration products, aftertreatment, turbochargers and fuel systems. The Power Generation segment is an integrated provider of power systems which sells engines, generator sets and alternators. The Components segment sells filtration products, exhaust aftertreatment systems, turbochargers and fuel systems. The Distribution segment includes wholly-owned and partially-owned distributorships engaged in wholesaling engines, generator sets and service parts, as well as performing service and repair activities on our products and maintaining relationships with various OEMs throughout the world.
Our financial performance depends, in large part, on varying conditions in the markets we serve, particularly the on-highway, construction and general industrial markets. Demand in these markets tends to fluctuate in response to overall economic conditions and is particularly sensitive to changes in interest rate levels and our customers' access to credit.conditions. Our sales may also be impacted by OEM inventory levels and production schedules and stoppages. Economic downturns in markets we serve
generally result in reductions in sales and pricing of our products. As a worldwide business, our operations are also affected by currency, political, economic and regulatory matters, including adoption and enforcement of environmental and emissionsemission standards, in the countries we serve. As part of our growth strategy, we invest in businesses in certain countries that carry high levels of these risks such as China, Brazil, India, Mexico, Russia and countries in the Middle East and Africa. At the same time, our geographic diversity and broad product and service offerings have helped limit the impact from a drop in demand in any one industry or customer andor the economy of any single country on our consolidated results.
The global economic downturn in 2009 extensively challenged most of our businesses andeconomy continued to slow throughout 2012, although the impacts were partially offset by strong demand across several end markets in which they operate. Allthe U.S. and Canada (North America) in the first half of our operating segments incurred double digit declines in net sales and three business units incurred a decrease in EBIT ranging from 44 percent to 56 percent. Our joint ventures throughout the world also experienced severe downturns in operating results causing income from equity investees to decline 15 percent. We experienced significant decreases in market demand for many of our products. The challenging worldwide economy impacted all of our business units in different ways. Our Power Generation and Distribution businesses, which have longer lead times, began to see declines in 2009 while our other businesses started to experience declinesyear; however these markets weakened in the second half of 2008, especially in the fourth quarter. Demand in most of our markets aroundyear, particularly the world appears to have reached bottom and we believe those markets have stabilized at these lower levels. We are also seeing improvementsheavy-duty truck market. Economies in emerging markets, including China India and Brazil. The economy in the United States (U.S.), while showing some signs of recovery, still remains fragile and unemployment continues to remain high. In the second half of 2009, weBrazil experienced increased sales in our global engine markets and in North America, we experienced a temporary increase in engine (and related component) demand prior to the 2010 emissions standard change. The increased demand was consistent with sales trends we observed in prior emissions implementations and was the primary reason for sales to U.S. markets increasing to 48 percent of total net sales in 2009, compared with 41 percent of total net sales in 2008. Throughoutchallenges throughout the year we took actionsin most markets, especially the off-highway construction market in China and the medium-duty truck market in Brazil. Demand in India remained strong for power generation equipment; however, improved volumes were more than offset by unfavorable currency impacts. International (excludes the U.S. and Canada) off-highway construction markets have continued to align our businessesdeteriorate with reduced customer demand, particularlyengine shipments down 53 percent, including a 72 percent decline in the first nine months of 2009. These actions included global workforce reductions and closing certain manufacturing operations. Costs associated with these restructuring actions,China. The on-highway medium-duty truck market in conjunction with significantly reduced demand and volumes, negatively impacted our operating results in 2009 compared to 2008 and 2007 results. AtBrazil declined as the same time, we took actions which enabled us to end the year with a stronger balance sheet. We closely monitored our receivables and customer relationships, reduced inventories 25 percent, reduced capital expenditures 43 percent and increased our cash and marketable securities by over $0.6 billion, generating over $1.1 billion in cash from operations. At the same time, we lowered our debt to capital ratio, maintained our credit ratings, improved our pension funding through increased contributions and strong returns and our $1.1 billion line of credit remains unused.
As a result of the temporary increase2011 pre-buy ahead of the new 2012 emission requirements and one of our customers replacing our B6.7 engine with a proprietary engine in sales2012 contributing to international medium-duty truck shipments being down 19 percent. North American demand for heavy-duty on-highway products increased 3 percent while medium-duty truck shipments increased 15 percent in 2012 compared to 2011; although demand in both of these markets declined in the second half of 2009,2012. North American light-duty on-highway demand also improved with an increase in shipments to Chrysler of 37 percent in 2012 compared to 2011.
Slow growth in the U.S. economy and uncertainty driven by unresolved federal tax and budget issues caused businesses to hold back on capital expenditures in 2012, thus impacting demand for truck and power generation equipment. The governments of China and India have controlled inflation through tight monetary policies in the challengingform of rising interest rates and tightening access to credit, although both countries began easing these policies in response to reduced inflationary concerns in 2012. Brazil also began easing their monetary policies in the second half of 2012. Easing monetary policies could enhance our end markets; however, there likely will be a delay between when these policies are implemented and when our end markets respond. The European economy remains uncertain with continued volatility in the Euro countries. Although we do not have any significant direct exposure to European sovereign debt, we generated approximately 8 percent of our net sales from Euro zone countries in 2012. As a result of a number of markets unexpectedly slowing in mid-2012, continued weak economic data in a number of regions and increasing levels of uncertainty regarding the direction of the global economy, we implemented a number of cost reduction initiatives in the second half of 2012. In October 2012, we announced strategic actions necessary to respond to the current environment by cutting costs while maintaining investments in key growth programs. Actions include a number of measures to reduce costs including planned work week reductions, shutdowns at some manufacturing facilities and some targeted workforce reductions. We reduced our workforce by 1,300 people in the fourth quarter and incurred total restructuring charges of $52 million ($35 million after-tax), or $0.18 per diluted share.
The following table contains sales and EBIT results by operating segment for the years ended December 31, 2012 and 2011. Refer to the section titled "Operating Segment Results" for a more detailed discussion of net sales and EBIT by operating segment including the reconciliation of segment EBIT to income before taxes.
| | 2012 | 2011 | Percent change 2012 vs. 2011 | ||||||||||||||||||||||
|---|---|---|---|---|---|---|---|---|---|---|---|---|---|---|---|---|---|---|---|---|---|---|---|---|---|
| | | Percent of Total | | | Percent of Total | | |||||||||||||||||||
| In millions | Sales | EBIT | Sales | EBIT | Sales | EBIT | |||||||||||||||||||
Engine | $ | 10,733 | 62 | % | $ | 1,248 | $ | 11,307 | 63 | % | $ | 1,384 | (5 | )% | (10 | )% | |||||||||
Components | 4,012 | 23 | % | 426 | 4,063 | 23 | % | 470 | (1 | )% | (9 | )% | |||||||||||||
Power Generation | 3,268 | 19 | % | 285 | 3,498 | 19 | % | 373 | (7 | )% | (24 | )% | |||||||||||||
Distribution | 3,277 | 19 | % | 369 | 3,044 | 17 | % | 386 | 8 | % | (4 | )% | |||||||||||||
Intersegment eliminations | (3,956 | ) | (23 | )% | — | (3,864 | ) | (22 | )% | — | 2 | % | — | ||||||||||||
Non-segment | — | — | (25 | ) | — | — | 102 | — | NM | ||||||||||||||||
Total | $ | 17,334 | 100 | % | $ | 2,303 | $ | 18,048 | 100 | % | $ | 2,715 | (4 | )% | (15 | )% | |||||||||
"NM"—not meaningful information.
Net income attributable to Cummins Inc. for 2012 was $1,645 million, or $8.67 per diluted share, on sales of $17.3 billion, compared to 2011 net income attributable to Cummins Inc. of $1,848 million, or $9.55 per diluted share, on sales of $18.0 billion. The decrease in income and earnings per share was driven by higher operating expenses, lower gross margins and lower equity, royalty and interest income from investees, partially offset by a lower effective tax rate of 23.5 percent versus 27.1 percent in 2011. In addition, the significant gains we recorded in 2011 for the disposition of certain assets and liabilities of our exhaust business and light-duty filtration business and flood damage recoveries did not repeat in 2012. Diluted earnings per share for 2012 benefited $0.06 from lower shares primarily due to the stock repurchase program.
In July 2012, we completed the acquisition of Hilite Germany GmbH (Hilite) in a cash transaction for $176 million. We also acquired an additional 45 percent interest in Cummins Central Power for consideration of approximately $20 million.
We generated $1.5 billion of operating cash flows in 2012, compared to $2.1 billion in 2011. Refer to the section titled "Operating Activities" in the "Liquidity and Capital Resources" section for a discussion of items impacting cash flows.
In February 2011, the Board of Directors approved a share repurchase program and authorized the acquisition of up to $1 billion of our common stock. We repurchased $256 million of common stock in 2012. In December 2012, the Board of Directors authorized the acquisition of up to $1 billion of our common stock upon completion of the 2011 repurchase program.
In July 2012, the Board of Directors authorized a dividend increase of 25 percent from $0.40 to $0.50 per share on a quarterly basis effective in the third quarter. Our debt to capital ratio (capital is defined as debt plus equity) at December 31, 2012, was 10.0 percent, compared to 11.8 percent at December 31, 2011. As of the date of filing of this Annual Report on Form 10-K, we had an 'A' credit rating with a stable outlook from Standard & Poor's Rating Services, an 'A' credit rating and a stable outlook from Fitch Ratings and a 'Baa1' credit rating with a positive outlook from Moody's Investors Service, Inc. In addition to our $1.6 billion in cash and marketable securities on hand, we have sufficient access to our credit facilities, if necessary, to meet currently anticipated investment and funding needs.
On November 9, 2012, we entered into a five-year revolving credit agreement with a syndicate of lenders. The credit agreement provides us with a $1.75 billion senior unsecured revolving credit facility, the proceeds of which are to be used by us for working capital or other general corporate purposes.
Our global pension plans, including our unfunded non-qualified plans, were 98 percent funded at year-end 2012. Our U.S. qualified plan, which represents approximately 60 percent of our worldwide pension obligation, was 106 percent funded and our United Kingdom (U.K.) plan was 104 percent funded. Asset returns in 2012 for the U.S. qualified plan were 14 percent while the year-end 2012 discount rate was 3.95 percent, down 0.85 percentage points from the 2011 discount rate of 4.80 percent. We expect new Environmental Protection Agency (EPA) emission compliant engineto contribute $170 million of cash to our global pension plans in 2013. We do not have a required minimum pension contribution obligation for our U.S. plans in 2013. We expect pension and componentother postretirement benefit expense in 2013 to increase by approximately $35 million pre-tax, or $0.14 per diluted share, when compared to 2012. Refer to application of critical accounting estimates within MD&A and Note 12, "PENSION AND OTHER POST RETIREMENT BENEFITS," to theConsolidated Financial Statements, for additional information concerning our pension and other post-retirement benefit plans.
The global economy continued to slow throughout 2012, although the impacts were partially offset by strong demand will be weakacross several end markets in North America in the first half of 2010. Excluding the year; however these markets weakened in the second half of the year, particularly the heavy-duty truck market. Economies in emerging markets, weincluding China and Brazil experienced challenges throughout the year in most markets, especially the off-highway construction market in China and the medium-duty truck market in Brazil. Demand in India remained strong for power generation equipment; however, improved volumes were more than offset by unfavorable currency impacts.
We currently expect overallthe following positive trends in 2013:
While weWe currently expect the following challenges to our business that may reduce our earnings potential in 2013:
Net income attributable to Cummins Inc. was $428 million, or $2.16 per diluted share, on sales of $10.8 billion, compared to 2008 net income attributable to Cummins Inc. of $755 million, or $3.84 per diluted share, on sales of $14.3 billion. The decrease
Long-Term
We believe that, over the longer term, there will be economic improvements in income was driven by a 25 percent decrease in net sales and a 26 percent decrease in gross margin, as we were impacted by lower demand across most of our businesses. Focusedcurrent markets and that our opportunities for long-term profitable growth will continue in the future as the result of the following four macroeconomic trends that will benefit our businesses:
| | | | | Favorable/(Unfavorable) | |||||||||||||||||||
|---|---|---|---|---|---|---|---|---|---|---|---|---|---|---|---|---|---|---|---|---|---|---|---|
| | Years ended December 31, | 2009 vs. 2008 | 2008 vs. 2007 | ||||||||||||||||||||
| In millions, except per share amounts | 2009 | 2008 | 2007 | Amount | Percent | Amount | Percent | ||||||||||||||||
Net sales | $ | 10,800 | $ | 14,342 | $ | 13,048 | $ | (3,542 | ) | (25 | )% | $ | 1,294 | 10 | % | ||||||||
Cost of sales | 8,631 | 11,402 | 10,492 | 2,771 | 24 | % | (910 | ) | (9 | )% | |||||||||||||
Gross margin | 2,169 | 2,940 | 2,556 | (771 | ) | (26 | )% | 384 | 15 | % | |||||||||||||
Operating expenses and income | |||||||||||||||||||||||
Selling, general and administrative expenses | 1,239 | 1,450 | 1,296 | 211 | 15 | % | (154 | ) | (12 | )% | |||||||||||||
Research, development and engineering expenses | 362 | 422 | 329 | 60 | 14 | % | (93 | ) | (28 | )% | |||||||||||||
Equity, royalty and interest income from investees | 214 | 253 | 205 | (39 | ) | (15 | )% | 48 | 23 | % | |||||||||||||
Restructuring and other charges | 99 | 37 | — | (62 | ) | NM | (37 | ) | NM | ||||||||||||||
Other operating (expense) income, net | (1 | ) | (12 | ) | 22 | 11 | 92 | % | (34 | ) | NM | ||||||||||||
Operating income | 682 | 1,272 | 1,158 | (590 | ) | (46 | )% | 114 | 10 | % | |||||||||||||
Interest income | 8 | 18 | 36 | (10 | ) | (56 | )% | (18 | ) | (50 | )% | ||||||||||||
Interest expense | 35 | 42 | 58 | 7 | 17 | % | 16 | 28 | % | ||||||||||||||
Other (expense) income, net | (15 | ) | (70 | ) | 33 | 55 | 79 | % | (103 | ) | NM | ||||||||||||
Income before income taxes | 640 | 1,178 | 1,169 | (538 | ) | (46 | )% | 9 | 1 | % | |||||||||||||
Income tax expense | 156 | 360 | 381 | 204 | 57 | % | 21 | 6 | % | ||||||||||||||
Net income | 484 | 818 | 788 | (334 | ) | (41 | )% | 30 | 4 | % | |||||||||||||
Less: Net income attributable to noncontrolling interests | 56 | 63 | 49 | 7 | 11 | % | (14 | ) | (29 | )% | |||||||||||||
Net income attributable to Cummins Inc. | $ | 428 | $ | 755 | $ | 739 | $ | (327 | ) | (43 | )% | $ | 16 | 2 | % | ||||||||
Diluted earnings per share attributable to Cummins Inc. | $ | 2.16 | $ | 3.84 | $ | 3.70 | $ | (1.68 | ) | (44 | )% | $ | 0.14 | 4 | % | ||||||||
Percent of sales | |||||||||||||||||||||||
Gross margin | 20.1 | % | 20.5 | % | 19.6 | % | (0.4 | )% | 0.9 | % | |||||||||||||
Selling, general and administrative expenses | 11.5 | % | 10.1 | % | 9.9 | % | (1.4 | )% | (0.2 | )% | |||||||||||||
Research, development and engineering expenses | 3.4 | % | 2.9 | % | 2.5 | % | (0.5 | )% | (0.4 | )% | |||||||||||||
| | | | | Favorable/(Unfavorable) | ||||||||||||||||||
|---|---|---|---|---|---|---|---|---|---|---|---|---|---|---|---|---|---|---|---|---|---|---|
| | Years ended December 31, | 2012 vs. 2011 | 2011 vs. 2010 | |||||||||||||||||||
| In millions (except per share amounts) | 2012 | 2011 | 2010 | Amount | Percent | Amount | Percent | |||||||||||||||
NET SALES | $ | 17,334 | $ | 18,048 | $ | 13,226 | $ | (714 | ) | (4 | )% | $ | 4,822 | 36 | % | |||||||
Cost of sales | 12,826 | 13,459 | 10,058 | 633 | 5 | % | (3,401 | ) | (34 | )% | ||||||||||||
GROSS MARGIN | 4,508 | 4,589 | 3,168 | (81 | ) | (2 | )% | 1,421 | 45 | % | ||||||||||||
OPERATING EXPENSES AND INCOME | ||||||||||||||||||||||
Selling, general and administrative expenses | 1,900 | 1,837 | 1,487 | (63 | ) | (3 | )% | (350 | ) | (24 | )% | |||||||||||
Research, development and engineering expenses | 728 | 629 | 414 | (99 | ) | (16 | )% | (215 | ) | (52 | )% | |||||||||||
Equity, royalty and interest income from investees | 384 | 416 | 351 | (32 | ) | (8 | )% | 65 | 19 | % | ||||||||||||
Gain on sale of businesses | 6 | 121 | — | (115 | ) | (95 | )% | 121 | 100 | % | ||||||||||||
Other operating income (expense), net | (16 | ) | 21 | (16 | ) | (37 | ) | NM | 37 | NM | ||||||||||||
OPERATING INCOME | 2,254 | 2,681 | 1,602 | (427 | ) | 16 | % | 1,079 | 67 | % | ||||||||||||
Interest income | 25 | 34 | 21 | (9 | ) | (26 | )% | 13 | 62 | % | ||||||||||||
Interest expense | 32 | 44 | 40 | 12 | 27 | % | (4 | ) | (10 | )% | ||||||||||||
Other income (expense), net | 24 | — | 34 | 24 | 100 | % | (34 | ) | (100 | )% | ||||||||||||
INCOME BEFORE INCOME TAXES | 2,271 | 2,671 | 1,617 | (400 | ) | 15 | % | 1,054 | 65 | % | ||||||||||||
Income tax expense | 533 | 725 | 477 | 192 | 26 | % | (248 | ) | (52 | )% | ||||||||||||
CONSOLIDATED NET INCOME | 1,738 | 1,946 | 1,140 | (208 | ) | 11 | % | 806 | 71 | % | ||||||||||||
Less: Net income attributable to noncontrolling interests | 93 | 98 | 100 | 5 | 5 | % | 2 | 2 | % | |||||||||||||
NET INCOME ATTRIBUTABLE TO CUMMINS INC. | $ | 1,645 | $ | 1,848 | $ | 1,040 | $ | (203 | ) | (11 | )% | $ | 808 | 78 | % | |||||||
Diluted earnings per common share attributable to Cummins Inc. | $ | 8.67 | $ | 9.55 | $ | 5.28 | $ | (0.88 | ) | (9 | )% | $ | 4.27 | 81 | % | |||||||
| | | | | Favorable/(Unfavorable) Percentage Points | ||||||||||||
|---|---|---|---|---|---|---|---|---|---|---|---|---|---|---|---|---|
Percent of sales | 2012 | 2011 | 2010 | 2012 vs. 2011 | 2011 vs. 2010 | |||||||||||
Gross margin | 26.0 | % | 25.4 | % | 24.0 | % | 0.6 | 1.4 | ||||||||
Selling, general and administrative expenses | 11.0 | % | 10.2 | % | 11.2 | % | (0.8 | ) | 1.0 | |||||||
Research, development and engineering expenses | 4.2 | % | 3.5 | % | 3.1 | % | (0.7 | ) | (0.4 | ) | ||||||
Net Sales
Net sales decreased in all segmentsversus 2011 and was primarily due to lower demand as a result ofdriven by the global economic downturn. The primary drivers were:following:
The decreases above were partially offset as Distribution segment sales, declinedexcluding acquisitions, increased by 18 percent.2 percent due to higher demand for parts and filtration products especially in North and Central America, increased power generation growth in East Asia, increased demand in the South Pacific and higher service demand from South Pacific mining customers, which were partially offset by lower engine product sales due to a slowdown in the North American oil and gas markets.
A more detailed discussion of sales by segment is presented in the "OPERATING SEGMENT RESULTS" section.
Gross Margin
Significant drivers Sales to international markets were 49 percent of the change in gross margins were as follows:
| In millions | 2009 vs. 2008 Increase (Decrease) | |||
|---|---|---|---|---|
Volume/Mix | $ | (1,228 | ) | |
Price | 252 | |||
Production costs | 132 | |||
Warranty expense | 46 | |||
Material Costs | 13 | |||
Currency | 8 | |||
Other | 6 | |||
Total | $ | (771 | ) | |
Gross margin decreased by $771 million, and as a percentage of sales decreased by 0.4 percentage points. The decrease was led by lower volumes which were partially offset by increased engine purchases ahead of the January 1, 2010, emissions standards change, improved pricing and decreased production costs. The overall decrease in volumes was due to lower sales resulting from the global economic downturn. Our warranty provision ontotal net sales in 2009 was 3.3 percent2012, compared to 2.9 percent in 2008. Our 2008 warranty expense included $117 million recorded in the fourth quarter associated with increases in the estimated warranty liability primarily for certain mid-range engine products launched in 2007. The accrual rates in 2009 for these related engine products were higher than those recorded in 2008 before this change in estimate. As such, our warranty as a56 percent of total net sales for these engine families is higher on products sold in 2009 than it was in 2008. Overall, our relative product mix also impacted the rate as a percent of sales when comparing these two periods.
A more detailed discussion of margin by segment is presented in the "OPERATING SEGMENT RESULTS" section.
Selling, General and Administrative Expenses
Selling, general and administrative expenses decreased primarily due to a decrease of $74 million in discretionary spending, in order to conserve cash, and a decrease of $71 million in compensation and related expenses. Compensation and related expenses include salaries, fringe benefits and variable
compensation. Salaries and fringe benefits decreased due to severance actions taken throughout 2009. Overall selling, general and administrative expenses as a percentage of sales increased to 11.5 percent in 2009 from 10.1 percent in 2008, primarily due to the 25 percent decrease in net sales.
Research, Development and Engineering Expenses
Research, development and engineering expenses decreased primarily due to a decrease in the number of engineering projects to conserve cash while focusing on the development of critical technologies and new products and increased reimbursements from third parties for engineering projects. Overall, research, development and engineering expenses as a percentage of sales increased to 3.4 percent in 2009 from 2.9 percent in 2008, primarily due to the 25 percent decrease in net sales.
Equity, Royalty and Interest Income from Investees
Equity, royalty and interest income from investees decreased primarily due to the following changes in equity income:
| | Increase/(Decrease) | |||
|---|---|---|---|---|
| In millions | 2009 vs. 2008 | |||
Dongfeng Cummins Engine Company, Ltd. (DCEC) | $ | (22 | ) | |
Cummins MerCruiser Diesel, LLC (MerCruiser) | (13 | ) | ||
These decreases were primarily due to lower demand as a result of the global economic conditions. The effects of the global economic downturn were partially offset by modest increases in some markets.
Other Operating (Expense) Income, Net
Other operating (expense) income was as follows:
| | Years ended December 31, | ||||||
|---|---|---|---|---|---|---|---|
| In millions | 2009 | 2008 | |||||
Flood damage gain (loss)(1) | $ | 12 | $ | (5 | ) | ||
Royalty income | 8 | 12 | |||||
Royalty expense | (7 | ) | (10 | ) | |||
Amortization of other intangibles | (7 | ) | (13 | ) | |||
(Loss) gain on sale of fixed assets | (8 | ) | 5 | ||||
Other, net | 1 | (1 | ) | ||||
Total other operating (expense) income, net | $ | (1 | ) | $ | (12 | ) | |
Interest Income
Interest income decreased primarily due to lower interest rates in 2009 compared to 2008.
Interest Expense
Interest expense decreased primarily due to declining short-term interest rates.
Other (Expense) Income, Net
Other (expense) income was as follows:
| | Years ended December 31, | ||||||
|---|---|---|---|---|---|---|---|
| In millions | 2009 | 2008 | |||||
Foreign currency loss(1) | $ | (20 | ) | $ | (46 | ) | |
Bank charges | (14 | ) | (12 | ) | |||
Change in cash surrender value of corporate owned life insurance(2) | (4 | ) | (36 | ) | |||
Dividend income | 5 | 6 | |||||
Other, net | 18 | 18 | |||||
Total other (expense) income, net | $ | (15 | ) | $ | (70 | ) | |
Income Tax Expense
Our income tax rates are generally less than the 35 percent U.S. income tax rate primarily because of lower taxes on foreign earnings and research tax credits. Our effective tax rate for 2009 was 24.4 percent compared to 30.6 percent for 2008. The decrease is due to tax on foreign earnings, which are subject to lower tax rates, and an increase in research tax credits. Our 2009 income tax provision also includes a $29 million (4.5 percent) reduction in the fourth quarter related to adjustments to deferred tax accounts. We released $19 million (3.0 percent) of deferred tax liabilities on foreign earnings, now considered to be permanently reinvested outside the U.S. and recorded a deferred tax asset of $10 million (1.5 percent) related to prior period matters.
We expect our 2010 effective tax rate to be 32 percent excluding any discrete items that may arise. The research tax credit expired December 31, 2009 and has not yet been renewed by Congress. If the research credit is extended, we would anticipate the 2010 effective tax rate to drop to 30 percent.
Noncontrolling Interests
Noncontrolling interests eliminate the income or loss attributable to non-Cummins ownership interests in our consolidated entities. Noncontrolling interests decreased primarily due to lower income of $8 million at Cummins India Limited, a publicly traded company at various exchanges in India, as a result of the decline in demand due to the global economic downturn. There were no other individual fluctuations in the subsidiaries that were significant.
Net Income Attributable to Cummins Inc. and Diluted Earnings Per Share Attributable to Cummins Inc.
Net income attributable to Cummins Inc. and diluted earnings per share attributable to Cummins Inc. decreased primarily due to significantly lower volumes, restructuring and other charges and decreased equity income partially offset by a lower effective tax rate.
Outlook
Near-Term:
Many of the markets we serve have slowed significantly as a result of the credit crisis and the challenging global economic environment; however, demand in most of our markets appears to have reached bottom and we are seeing signs that markets have stabilized at these levels. We are also seeing improvement in emerging markets including China, India and Brazil. Consistent with prior emissions standards implementation, the North American on-highway markets experienced increased demand prior to the implementation of the EPA's 2010 emissions standards. Based on our prior experience we expect EPA 2010 engine and component sales to on-highway OEM customers to be very weak in the first half of 2010. In most of our other markets we expect demand to remain stable with current levels for the first half of 2010, while we expect emerging markets to have sales comparable to 2008 levels.
Long-Term:
While there is uncertainty in the near-term market as a result of the current economic conditions and market dynamics surrounding the EPA 2010 emissions standards change, we are confident that opportunities for long-term growth and profitability will continue in the future.
2008 vs. 2007
Net Sales
Net sales increased in all segments due to the following drivers.
A detailed discussion of sales by segment is presented in the "OPERATING SEGMENT RESULTS" section.
Table of Contents2011.
Gross Margin
Significant drivers of the change in gross margin were as follows:
| In millions | 2008 vs. 2007 Increase (Decrease) | |||
|---|---|---|---|---|
Price | $ | 402 | ||
Volume/Mix | 227 | |||
Production costs | 47 | |||
Currency | 47 | |||
Warranty expense | (179 | ) | ||
Material costs | (173 | ) | ||
Other | 13 | |||
Total | $ | 384 | ||
Gross margin increaseddecreased by $384$81 million and as a percentage of sales increased by 0.90.6 percentage points. Benefits from increased pricingThe increase in gross margin as a percentage of sales was primarily due to lower material costs, improved price realization, lower warranty costs and a more favorable volume/product mix, of products soldwhich were partially offset by higher material costs reflecting the increase in commodity prices during the yearlower volumes, unfavorable foreign currency fluctuations and higher warranty expense. Our warranty expense reflected favorable warranty experiencerestructuring charges of $29 million.
The provision for some engine products and our provision related to sales in 2008 was 2.9 percentwarranties issued as a percentage of sales down from 3.1was 2.1 percent in 2007. This result was more than offset by negative trends primarily in certain mid-range engine products launched in 2007 for which we recorded additional warranty liability of approximately $117 million in the fourth quarter of 2008.
both 2012 and 2011. A more detailed discussion of margin by segment is presented in the "OPERATING SEGMENT RESULTS" section.
Selling, General and Administrative Expenses
Selling, general and administrative expenses increased primarily due to increasedhigher consulting expenses of $36$45 million, increasedrestructuring and other charges of $20 million and an increase of $19 million in compensation and related expenses, which were partially offset by reduced discretionary spending in the
Table of approximately $34 million andContents
second half of the acquisitionyear. Higher compensation expense was primarily due to increased headcount to support our strategic growth initiatives launched prior to a number of a majority ownership interestmarkets unexpectedly slowing in three previously independent North American distributors. Increased headcount and compensationmid-2012. Compensation and related expenses includedinclude salaries, fringe benefits and variable compensation. Variable compensation related to 2012 performance decreased $87 million over variable compensation and fringe benefits acrossrelated to 2011 performance. In the businessthird quarter of 2012, we implemented a number of cost reduction initiatives to align our cost structure with the slowdown in supportdemand at several of higher volumes and business growth.our key markets in the second half of the year. Overall, selling, general and administrative expenses, as a percentage of sales, increased to 10.111.0 percent in 20082012 from 9.910.2 percent in 2007.2011.
Research, Development and Engineering Expenses
Research, development and engineering expenses increased significantly, primarily due to higher spending on development programs for future products including increased headcount,an increase of $54 million in compensation and related expenses.expenses and increased consulting of $32 million. Higher compensation expense was primarily due to increased headcount to support our strategic growth initiatives. Compensation and related expenses include salaries, fringe benefits and variable compensation. Variable compensation related to 2012 performance decreased $25 million over variable compensation related to 2011 performance. Research, development and fringe benefits. Fluctuationsengineering expenses in 2012 also included restructuring and other miscellaneous research and development expenses were not significant individually or in the aggregate.charges of $3 million. Overall, research, development and engineering expenses, as a percentage of sales, increased to 2.94.2 percent in 20082012 from 2.53.5 percent in 2007.
Table2011. Research activities continue to focus on development of Contentsnew products to meet future emission standards around the world and improvements in fuel economy performance.
Equity, Royalty and Interest Income fromFrom Investees
Equity, royalty and interest income from investees decreased primarily due to the following:
| | Increase/(Decrease) | |||||||
|---|---|---|---|---|---|---|---|---|
| In millions | 2008 vs. 2007 | 2012 vs. 2011 Increase/(Decrease) | ||||||
North American Distributors | $ | 17 | ||||||
Dongfeng Cummins Engine Company, Ltd. (DCEC) | 14 | $ | (28 | ) | ||||
Chongqing Cummins Engine Company, Ltd. (CCEC) | (7 | ) | ||||||
Beijing Foton Cummins Engine Co., Ltd. (BFCEC) | 12 | |||||||
North American distributors | 13 | |||||||
All other | (18 | ) | ||||||
Cummins share of net income | (28 | ) | ||||||
Royalty and interest income | 9 | (4 | ) | |||||
Chongqing Cummins Engine Company, Ltd. (CCEC) | 8 | |||||||
Shanghai Fleetguard Filter Co., Ltd. | 2 | |||||||
Tata Cummins Ltd. (TCL) | (6 | ) | ||||||
MerCruiser | (8 | ) | ||||||
Equity, royalty and interest income from investees | $ | (32 | ) | |||||
Results from ourThe decreases above were primarily due to lower sales in China at DCEC and CCEC, which were partially offset by growth in North American distributors increased primarily dueand higher sales at BFCEC.
Gain on Sale of Businesses
In the second quarter of 2011, we sold certain assets and liabilities of our exhaust business which manufactures exhaust products and select components for emission systems for a variety of applications not core to our other product offerings. This business was historically included in our Components segment. The sales price was $123 million. We recognized a gain on the sale of $68 million ($37 million after-tax), which included a goodwill allocation of $19 million. The gain was excluded from segment results as it was not considered in our evaluation of operating results for the year ended December 31, 2011.
Sales for this business were $62 million and $171 million in 2011 (through closing) and 2010, respectively. Income before income from a joint venture which we formedtaxes for this business were approximately $9 million and $22 million in 2011 (through closing) and 2010, respectively.
During the fourth quarter of 2007. DCEC2011, we sold certain assets and liabilities of our light-duty filtration business which manufactures light-duty automotive and industrial filtration solutions. The sales increased largely due to prebuy activityprice was $90 million and included a note receivable from the buyer of approximately $1 million. There are no earnouts or other contingencies associated with the sales price. We recognized a gain on the sale of $53 million ($33 million after-tax), which included a goodwill allocation of $6 million. The gain was excluded from segment results as it was not considered in the first halfour evaluation of 2008 prior to a mid-year emissions change. CCEC increased primarily due to increased sales volumes. TCL experienced decreased sales volumesoperating results for the year while MerCruiser profits declined dueended December 31, 2011.
Sales for this business were $64 million and $74 million in 2011 (through closing) and 2010, respectively. Income before income taxes for this business were approximately $13 million and $9 million in 2011 (through closing) and 2010, respectively.
In the second quarter of 2012, we recorded an additional $6 million gain ($4 million after-tax) related to significant deteriorationfinal purchase price adjustments for our 2011 divestitures. The gain was excluded from segment results as it was not considered in our evaluation of operating results for the recreational marine market and increased research, development and engineering expenses.year ended December 31, 2012.
Other Operating Income (Expense) Income,, Net
Other operating income (expense) income, net was as follows:
| | Years ended December 31, | ||||||
|---|---|---|---|---|---|---|---|
| In millions | 2008 | 2007 | |||||
Royalty income | $ | 12 | $ | 7 | |||
Gain on sale of fixed assets(1) | 5 | 22 | |||||
Flood damage loss | (5 | ) | — | ||||
Royalty expense | (10 | ) | (4 | ) | |||
Amortization of other intangibles(2) | (13 | ) | (1 | ) | |||
Other, net | (1 | ) | (2 | ) | |||
Total other operating (expense) income, net | $ | (12 | ) | $ | 22 | ||
| | Years ended December 31, | ||||||
|---|---|---|---|---|---|---|---|
| In millions | 2012 | 2011 | |||||
Royalty income | $ | 18 | $ | 12 | |||
Flood damage gain | — | 38 | |||||
Loss on sale of fixed assets | (2 | ) | (10 | ) | |||
Royalty expense | (3 | ) | (3 | ) | |||
Amortization of intangible assets | (8 | ) | (5 | ) | |||
Legal matters | (20 | ) | (5 | ) | |||
Other, net | (1 | ) | (6 | ) | |||
Total other operating income (expense), net | $ | (16 | ) | $ | 21 | ||
Interest Income
Interest income decreased primarily due to lower average cashinvestment balances in 20082012 compared to 2007.2011.
Interest Expense
Interest expense decreased primarily due to declining short-termlower capitalized interest ratesin 2011 and the termination of a benefit from our interest rate swap.capital lease in September 2011.
Other Income (Expense) Income,, Net
Other income (expense) income, net was as follows:
| | Years ended December 31, | ||||||
|---|---|---|---|---|---|---|---|
| In millions | 2012 | 2011 | |||||
Gain on sale of equity investment | $ | 13 | $ | — | |||
Dividend income | 7 | 7 | |||||
Gain on fair value adjustment for consolidated investee(1) | 7 | — | |||||
Change in cash surrender value of corporate owned life insurance | 5 | 12 | |||||
Gain on marketable securities, net | 3 | — | |||||
Foreign currency losses, net | (14 | ) | (14 | ) | |||
Bank charges | (15 | ) | (16 | ) | |||
Other, net | 18 | 11 | |||||
Total other income (expense), net | $ | 24 | $ | — | |||
| | Years ended December 31, | ||||||
|---|---|---|---|---|---|---|---|
| In millions | 2008 | 2007 | |||||
Change in cash surrender value of corporate owned life insurance(1) | $ | (36 | ) | $ | — | ||
Bank charges | (12 | ) | (12 | ) | |||
Foreign currency (losses) gains(2) | (46 | ) | 28 | ||||
Dividend income | 6 | 5 | |||||
Other, net | 18 | 12 | |||||
Total other (expense) income, net | $ | (70 | ) | $ | 33 | ||
Income Tax Expense
Our income tax rates are generally less than the 35 percent U.S. statutory income tax rate primarily because of lower taxes on foreign earnings and research tax credits. Our effective tax rate for 20082012 was 30.623.5 percent compared to 32.627.1 percent for 2007. The decrease2011. Our 2012 income tax provision includes a one-time $134 million tax benefit resulting from transactions entered into and tax return elections made with respect to our U.K. operations. Our 2011 income tax provision includes a tax benefit of $48 million related to prior year refund claims filed for additional research tax credits, as well as additional foreign income and related foreign tax credits, net of related tax reserves. Our effective tax rate for 2011 also includes a tax benefit of $19 million related to the release of deferred U.S. tax liabilities on certain foreign earnings, as a result of restructuring our foreign operations. Also included in 2011 is a tax benefit of $16 million resulting from the reduction of our unrecognized tax benefits primarily due to greater foreign earnings in 2008, which are subject to lower tax rates. Our 2008settlements with taxing authorities. The 2011 income tax provision also includedincludes other tax items totaling to a $10$2 million (0.8 percent) reductionnet tax charge, primarily relating to the enactment of state law changes in Indiana and changes in the fourthU.K. as well as adjustments to our income tax accounts based on our 2010 tax return filings.
On January 2, 2013, the American Taxpayer Relief Act of 2012 was enacted. This legislation retroactively extended the U.S. federal research credit for two years, from January 1, 2012, through December 31, 2013. We expect our 2013 effective tax rate, which will include an estimated 1 percent benefit for the 2013 research credit, to be 26 percent excluding any one-time items that may arise. Additionally, we anticipate that our first quarter due2013 results will include a one-time tax benefit of approximately $28 million representing the net benefit attributable to the legislative reinstatement2012 research credit. Earnings of our China operations generated after December 31, 2011, are considered to be permanently reinvested and additional U.S. deferred tax is no longer being provided on these earnings generated after 2011. We have $702 million of retained earnings and related cumulative translation adjustments in our China operations generated prior to December 31, 2011 and have provided a U.S. deferred tax liability of $158 million relating to these earnings and related translation adjustments. We anticipate that these earnings will be distributed to the U.S. research tax credit.within the next five years.
Noncontrolling Interests
Noncontrolling interests eliminate the income or loss attributable to non-Cummins ownership interests in our consolidated entities. Noncontrolling interests increasedin income of consolidated subsidiaries decreased primarily due to higher incomea decline of $10$5 million at Wuxi Cummins Turbo Technologies Co. Ltd., $3 million at Cummins India Limited, a publicly traded companyWestern Canada LP. and $3 million at various exchanges in India, due to the creationPower Systems India. The decreases were partially offset by an increase of a new export business in 2008$6 million at Cummins Power Solutions Ltd. and favorable price adjustments for high horsepower products. There were no other individual fluctuations in the subsidiaries that were significant.$2 million at Cummins Central Power LLC.
Net Income Attributable to Cummins Inc. and Diluted Earnings Per Share Attributable to Cummins Inc.
Net income and diluted earnings per share attributable to Cummins Inc. decreased primarily due to lower volumes, particularly in the international construction and medium-duty truck markets, higher research, development and engineering expenses, higher selling, general and administrative expenses and lower equity, royalty and interest income from investees. These decreases were partially offset by improved gross margin as a percentage of sales and a lower effective tax rate of 23.5 percent versus 27.1 percent in 2011. In addition, the significant gains we recorded in 2011 for the disposition of certain asset and liabilities of our exhaust business and light-duty filtration business and flood damage recoveries from the insurance settlement regarding a June 2008 flood in Southern Indiana did not repeat in 2012. Diluted earnings per share for 2012 also benefited $0.06 from lower shares primarily due to the stock repurchase program.
Net Sales
Sales increased in all segments primarily due to increased demand from most markets including recovery of the North American on-highway markets. The primary drivers for the increase in sales were:
A more detailed discussion of sales by segment is presented in the "OPERATING SEGMENT RESULTS" section.
Sales to international markets were 56 percent of total net sales in 2011, compared with 60 percent of total net sales in 2010.
Gross Margin
Gross margin increased by $1,421 million and as a percentage of sales increased by 1.4 percentage points. The significant improvement was led by increases in volume, improved price realization, higher product content on certain products and favorable currency impacts, partially offset by higher material costs, higher commodity costs and higher base warranty costs due to increased volumes and increasing
mix of EPA 2010 products. Gross margin in 2010 also benefited from a one-time $32 million tax recovery in Brazil. See Note 14, "COMMITMENTS AND CONTINGENCIES," in ourConsolidated Financial Statements for more information.
The provision for warranties issued as a percentage of sales in 2011 was 2.1 percent compared to 3.0 percent in 2010. Accrual rates for engines sold this year were generally lower than the rates charged in prior years as our warranty costs for EPA 2010 products have been lower than expected. A more detailed discussion of margin by segment is presented in the "OPERATING SEGMENT RESULTS" section.
Selling, General and Administrative Expenses
Selling, general and administrative expenses increased primarily due to an increase of $174 million in compensation and related expenses including increased headcount to support our strategic growth initiatives, merit increases and increased discretionary spending. Compensation and related expenses include salaries, fringe benefits and variable compensation. Variable compensation related to 2011 performance increased $42 million over variable compensation related to 2010 performance. Overall, selling, general and administrative expenses, as a percentage of sales, decreased from 11.2 percent in 2010 to 10.2 percent in 2011.
Research, Development and Engineering Expenses
Research, development and engineering expenses increased primarily due to an increase of $79 million in compensation and related expenses, an increase in the number of engineering programs with increased costs of $79 million and increased discretionary spending. Compensation and related expenses include salaries, fringe benefits and variable compensation. Variable compensation related to 2011 performance increased $8 million over variable compensation related to 2010 performance. Overall, research, development and engineering expenses, as a percentage of sales, increased to 3.5 percent in 2011 from 3.1 percent in 2010. Research activities continue to focus on development of new products to meet future emission standards around the world and improvements in fuel economy performance.
Equity, Royalty and Interest Income From Investees
Equity, royalty and interest income from investees increased primarily due to the following:
| In millions | 2011 vs. 2010 Increase/(Decrease) | |||
|---|---|---|---|---|
North American distributors | $ | 33 | ||
Chongqing Cummins Engine Company, Ltd. | 22 | |||
Beijing Foton Cummins Engine Co., Ltd. | 9 | |||
Dongfeng Cummins Engine Company, Ltd. | (19 | ) | ||
All other | 9 | |||
Cummins share of net income | 54 | |||
Royalty and interest income | 11 | |||
Equity, royalty and interest income from investees | $ | 65 | ||
These overall increases were primarily due to the economic recovery in North America, particularly in the oil and gas markets, and strong demand for power generation and mining products in China with CCEC, which was partially offset by lower sales at DCEC due to weaker demand in the on-highway truck market.
Gain on Sale of Businesses
In the second quarter of 2011, we sold certain assets and liabilities of our exhaust business which manufactures exhaust products and select components for emission systems for a variety of applications not core to our other product offerings. This business was historically included in our Components segment. The sales price was $123 million. We recognized a gain on the sale of $68 million ($37 million after-tax), which included a goodwill allocation of $19 million. The gain was excluded from segment results as it was not considered in our evaluation of operating results for the year ended December 31, 2011.
Sales for this business were $62 million, $171 million and $126 million in 2011 (through closing), 2010 and 2009, respectively. Income before income taxes for this business were approximately $9 million, $22 million and $11 million in 2011 (through closing), 2010 and 2009, respectively.
During the fourth quarter of 2011, we sold certain assets and liabilities of our light-duty filtration business which manufactures light-duty automotive and industrial filtration solutions. The sales price was $90 million and included a note receivable from the buyer of approximately $1 million. There are no earnouts or other contingencies associated with the sales price. We recognized a gain on the sale of $53 million ($33 million after-tax), which included a goodwill allocation of $6 million. The gain was excluded from segment results as it was not considered in our evaluation of operating results for the year ended December 31, 2011.
Sales for this business were $64 million, $74 million and $54 million in 2011 (through closing), 2010 and 2009, respectively. Income before income taxes for this business were approximately $13 million, $9 million and $2 million in 2011 (through closing), 2010 and 2009, respectively.
We have entered into supply and other agreements with the operations that represent ongoing involvement and as such, the results of these operations have not been presented as discontinued operations.
Other Operating Income (Expense), Net
Other operating income (expense), net was as follows:
| | Years ended December 31, | ||||||
|---|---|---|---|---|---|---|---|
| In millions | 2011 | 2010 | |||||
Flood damage gain (loss) | $ | 38 | $ | (2 | ) | ||
Royalty income | 12 | 10 | |||||
Royalty expense | (3 | ) | (3 | ) | |||
Amortization of intangible assets | (5 | ) | (15 | ) | |||
Legal matters | (5 | ) | — | ||||
Loss on sale of fixed assets | (10 | ) | (4 | ) | |||
Other, net | (6 | ) | (2 | ) | |||
Total other operating income (expense), net | $ | 21 | $ | (16 | ) | ||
In June 2008, four of our sites in Southern Indiana, including our Technical Center, experienced extensive flood damage. In October 2011, we received $40 million from our insurance carriers to settle all outstanding 2008 flood claims. As a result, we recognized a gain of approximately $38 million ($24 million after-tax), net of any remaining flood related expenses, in "Other operating income (expense), net" in ourConsolidated Statements of Income.
Interest Income
Interest income increased primarily due to higher average cash balances in addition to higher average interest rates.
Interest Expense
Interest expense increased primarily due to lower capitalized interest in 2011 and higher average debt, partially offset by lower interest rates.
Other Income (Expense), Net
Other income (expense) was as follows:
| | Years ended December 31, | ||||||
|---|---|---|---|---|---|---|---|
| In millions | 2011 | 2010 | |||||
Change in cash surrender value of corporate owned life insurance | $ | 12 | $ | 12 | |||
Dividend income | 7 | 7 | |||||
Gain on fair value adjustment for Cummins Western Canada | — | 12 | |||||
Life insurance proceeds | — | 7 | |||||
Foreign currency losses, net | (14 | ) | (1 | ) | |||
Bank charges | (16 | ) | (15 | ) | |||
Other, net | 11 | 12 | |||||
Total other income (expense), net | $ | — | $ | 34 | |||
Income Tax Expense
Our income tax rates are generally less than the 35 percent U.S. statutory income tax rate primarily because of lower taxes on foreign earnings and research tax credits. Our effective tax rate for 2011 was 27.1 percent compared to 29.5 percent for 2010. Our 2011 income tax provision includes a tax benefit of $48 million related to prior year refund claims filed for additional research tax credits, as well as additional foreign income and related foreign tax credits, net of related tax reserves. Our effective tax rate for 2011 also includes a tax benefit of $19 million related to the release of deferred U.S. tax liabilities on certain foreign earnings, as a result of restructuring our foreign operations. Also included in 2011 is a tax benefit of $16 million resulting from the reduction of our unrecognized tax benefits primarily due to settlements with taxing authorities. The 2011 income tax provision also includes other tax items totaling to a $2 million net tax charge, primarily relating to the enactment of state law changes in Indiana and changes in the U.K. as well as adjustments to our income tax accounts based on our 2010 tax return filings. Our 2010 income tax provision includes a $17 million reduction in the fourth quarter related to the legislative reinstatement of the U.S. research tax credit as well as a $3 million tax benefit related to the release of deferred U.S. tax liabilities on foreign earnings now considered to be permanently reinvested outside of the U.S.
Noncontrolling Interests
Noncontrolling interests in income of consolidated subsidiaries decreased primarily due to a decline of $9 million at Wuxi Cummins Turbo Technologies Co. Ltd. and $4 million at Cummins India Ltd., a publicly traded company on various exchanges in India. These decreases were partially offset by an increase of $6 million at Cummins Western Canada LP, $4 million at Cummins Power Systems LLC and $1 million at Cummins Northeast LLC.
Net Income Attributable to Cummins Inc. and Diluted Earnings Per Share Attributable to Cummins Inc.
Net income and diluted earnings per share attributable to Cummins Inc. increased primarily due to higher volumes in most markets and geographic regions, including the recovery of the North American on-highway truck markets, significantly improved gross margins, higher equity incomethe gain on disposition of certain assets and liabilities of our exhaust business and our light-duty filtration business, a lower effective tax rate.rate, increased equity income and the gain related to flood damage recoveries from the insurance settlement regarding a June 2008 flood in Southern Indiana. These increasesfavorable drivers were partially offset by warranty expense, restructuring chargeshigher selling, general and investment lossesadministrative expenses and research, development and engineering expenses in 2011 as compared to 2010. Diluted earnings per share for 2011 also benefited $0.17 from lower shares primarily occurring duringdue to the fourth quarter of 2008, in addition to unfavorable foreign currency effects.stock repurchase program.
RESTRUCTURING AND OTHER CHARGES
2009 Restructuring Actions
In 2009, we executed restructuring actions in response to a reduction in orders in most of our U.S. and foreign markets due to the continuing deterioration in the global economy. We reduced our global workforce by approximately 1,000 professional employees. In addition, we took numerous employee
actions at many of our manufacturing locations, including approximately 3,200 hourly employees, significant downsizing at numerous facilities and complete closure of several facilities and branch distributor locations. Employee termination and severance costs were recorded based on approved plans developed by the businesses and corporate management which specified positions to be eliminated, benefits to be paid under existing severance plans, union contracts or statutory requirements and the expected timetable for completion of the plan. Estimates of restructuring were made based on information available at the time charges were recorded. Due to the inherent uncertainty involved, actual amounts paid for such activities may differ from amounts initially recorded and we may need to revise previous estimates.
We incurred $2 million of restructuring expenses for lease terminations and $5 million of restructuring expenses for asset impairments in response to closures and downsizing noted above. During 2009, we recorded a total pre-tax restructuring charge of $85 million, comprising $90 million of charges related to 2009 actions net of the $3 million favorable change in estimate related to 2008 actions and the $2 million favorable change in estimate related to earlier 2009 actions, in "Restructuring and other charges" in ourConsolidated Statements of Income. These restructuring actions included:
| In millions | Year ended December 31, 2009 | |||
|---|---|---|---|---|
Workforce reductions | $ | 81 | ||
Exit activities | 7 | |||
Other | 2 | |||
Changes in estimate | (5 | ) | ||
Total restructuring charges | 85 | |||
Curtailment loss | 14 | |||
Total restructuring and other charges | $ | 99 | ||
In addition, as a result of the restructuring actions described above, we also recorded a $14 million curtailment loss in our pension and other postretirement plans. See Note 12, "PENSION AND OTHER POSTRETIREMENT BENEFITS," to ourConsolidated Financial Statements for additional detail.
At December 31, 2009, of the approximately 4,200 employees affected by this plan, all terminations were substantially complete. If the 2009 restructuring actions are successfully implemented, we expect the annualized savings from the professional actions to be approximately $50 million. Our charge related to the professional actions was approximately $30 million. Approximately 40 percent of the savings from the restructuring actions will be realized in cost of sales, 45 percent in selling, general and administrative expenses and 15 percent in research, development and engineering expenses. We expect the accrual to be paid in cash which will be funded with cash generated from operations.
The following table summarizes the balance of accrued restructuring charges by expense type and the changes in the accrued amounts for the applicable periods. The restructuring related accruals were recorded in "Other accrued expenses" in ourConsolidated Balance Sheets.
| In millions | Severance Costs | Exit Activities | Other | Total | |||||||||
|---|---|---|---|---|---|---|---|---|---|---|---|---|---|
2009 Restructuring charges | $ | 81 | $ | 7 | $ | 2 | $ | 90 | |||||
Cash payments for 2009 actions | (70 | ) | (1 | ) | — | (71 | ) | ||||||
Noncash items | — | (5 | ) | (2 | ) | (7 | ) | ||||||
Changes in estimates | (2 | ) | — | — | (2 | ) | |||||||
Translation | 1 | — | — | 1 | |||||||||
Balance at December 31, 2009 | $ | 10 | $ | 1 | $ | — | $ | 11 | |||||
We do not include restructuring and other charges in our operating segment results. The pre-tax impact of allocating restructuring and other charges to the segment results would have been as follows:
| In millions | Year ended December 31, 2009 | |||
|---|---|---|---|---|
Engine | $ | 47 | ||
Power Generation | 12 | |||
Components | 35 | |||
Distribution | 5 | |||
Total restructuring charges | $ | 99 | ||
2008 Restructuring Actions
We executed restructuring actions primarily in the form of voluntary and involuntary separation programs in the fourth quarter of 2008.2012. These actions were in response to the continued deterioration in our U.S. businesses and most key markets around the world in the second half of 2008,2012, as well as a reduction in orders in most U.S. and global markets for 2009.2013. We reduced our worldwide professional workforce by approximately 650 employees, or 4.53 percent. We offered a voluntary retirement package to certain active professional employees in the U.S. based on a clearly defined set of criteria. We also took voluntary and involuntary actions which included approximately 800reduced our hourly employees, the majority of which received severance benefits. The compensation packages contained salary and continuation of benefits, including health care, life insurance and outplacement services. The voluntary retirement package was acceptedworkforce by approximately 150650 employees. The remaining professional reductions of 500 employees were involuntary. The expenses recorded during the year ended December 31, 2008, included severance costs related to both voluntary and involuntary terminations. During 2008,2012, we incurred a pre-tax charge related to the professional and hourly restructuring initiativesworkforce reductions of approximately $37$49 million.
Employee termination and severance costs were recorded based on approved plans developed by the businesses and corporate management which specified positions to be eliminated, benefits to be paid under existing severance plans or statutory requirements and the expected timetable for completion of the plan. Estimates of restructuring were made based on information available at the time charges were recorded. Due to the inherent uncertainty involved, actual amounts paid for such activities may differ from amounts initially recorded and we may need to revise previous estimates.
At December 31, 2008,We incurred a $1 million charge for lease terminations and a $2 million charge for asset impairments and other non-cash charges. During 2012, we recorded restructuring and other charges of $52 million ($35 million after-tax). These restructuring actions included:
| In millions | Year ended December 31, 2012 | |||
|---|---|---|---|---|
Workforce reductions | $ | 49 | ||
Exit activities | 1 | |||
Other | 2 | |||
Restructuring and other charges | $ | 52 | ||
If the approximately 1,450 employees affected by this plan, 1,250 had been terminated. All terminations were substantially complete as of December 31, 2009. We2012 restructuring actions are successfully implemented, we expect the 2008 restructuringannualized savings from the professional actions to yieldbe approximately $45 million$39 million. Our charge related to $50 million in annual savings fromthe professional actions.actions was approximately $32 million. Approximately 4132 percent of the savings from the restructuring actions will be
realized in cost of sales, 4453 percent in selling, general and administrative expenses and 15 percent in research, development and engineering expenses. We expect the accrual to be paid in cash which will be funded with cash generated from operations.
At December 31, 2012, of the approximately 1,300 employees to be affected by this plan, 1,130 had been terminated.
Restructuring and other charges were included in each segment in our operating results as follows:
| In millions | Year ended December 31, 2012 | |||
|---|---|---|---|---|
Engine | $ | 20 | ||
Distribution | 14 | |||
Power Generation | 12 | |||
Components | 6 | |||
Restructuring and other charges | $ | 52 | ||
The table below summarizes the activity and balance of accrued restructuring expenses for 2008 actions,charges, which wereis included in the balance of "Other accrued expenses" in ourConsolidated Balance Sheets as of December 31, 2009 and 2008:
| In millions | Severance Costs | |||
|---|---|---|---|---|
2008 | ||||
Restructuring charges | $ | 37 | ||
Cash payments for 2008 actions | (3 | ) | ||
Balance at December 31, 2008 | 34 | |||
2009 | ||||
Cash payments for 2008 actions | (31 | ) | ||
Change in estimate | (3 | ) | ||
Balance at December 31, 2009 | $ | — | ||
We do not include restructuring charges in the segment results. The pre-tax impact of allocating restructuring charges for the year ended December 31, 2008, would have been as follows:2012.
| In millions | Charges | Payments | Accrued Balance at December 31, 2012 | |||||||
|---|---|---|---|---|---|---|---|---|---|---|
Restructuring charges(1) | $ | 50 | $ | 25 | $ | 25 | ||||
The table below summarizes where the restructuring and other charges are located in ourConsolidated Statements of Income for the year ended December 31, 2012.
| In millions | | |||
|---|---|---|---|---|
Engine | $ | 17 | ||
Power Generation | 3 | |||
Components | 15 | |||
Distribution | 2 | |||
Total restructuring charges | $ | 37 | ||
| In millions | Year ended December 31, 2012 | |||
|---|---|---|---|---|
Cost of sales | $ | 29 | ||
Selling, general and administrative expenses | 20 | |||
Research, development and engineering expenses | 3 | |||
Restructuring and other charges | $ | 52 | ||
There were no material changes to the estimated savings, or periods under which we expect to recognize the savings, for the 2008 actions.
Our reportable operating segments consist of the following: Engine, Components, Power Generation Components, and Distribution. This reporting structure is organized according to the products and markets each segment serves and allows management to focus its efforts on providing enhanced service to a wide range of customers. The Engine segment produces engines and parts for sale to customers in on-highway and various industrial markets. TheOur engines are used in trucks of all sizes, buses and RVs,recreational vehicles, as well as in various industrial applications, including construction, mining, agriculture, marine, oil and gas, rail and military.military equipment. The Components segment sells filtration products, aftertreatment, turbochargers and fuel systems. The Power Generation segment is an integrated provider of power systems which sells engines, generator sets and alternators. The Components segment includes sales of filtration products, exhaust and aftertreatment systems, turbochargers and fuel systems. The Distribution segment includes wholly-owned and partially-owned distributorships engaged in wholesaling engines, generator sets and service parts, as well as performing service and repair activities on our products and maintaining relationships with various OEMs.OEMs throughout the world.
We use segment EBIT (defined as earnings before interest expense, taxes and noncontrolling interests) as a primary basis for the chief operating decision-maker to evaluate the performance of each of our operating segments. Segment amounts exclude certain expenses not specifically identifiable to segments.
The accounting policies of our operating segments are the same as those applied in ourConsolidated Financial Statements. We prepared the financial results of our operating segments on a
basis that is consistent with the manner in which we internally disaggregate financial information to assist in making internal operating decisions. We have allocated certain common costs and expenses, primarily corporate functions, among segments differently than we would for stand-alone financial information prepared in accordance with accounting principles generally accepted in the United States of America (GAAP). These include certain costs and expenses of shared services, such as information technology, human resources, legal and finance. We also do not allocate debt-related items, actuarial gains or losses, prior service costs or credits, restructuring and other charges, investmentchanges in cash surrender value of corporate owned life insurance, flood damage gains or losses, flood damagedivestiture gains or losses or income taxes to individual segments. In 2012, non-segment items included a $20 million reserve ($12 million after-tax) related to legal matters and a $6 million gain related to adjustments from our 2011 divestitures, while 2011 included the gain on disposition of certain assets and liabilities of our exhaust business and our light-duty filtration business and 2010 included a Brazil revenue tax recovery. These gains were not allocated to the businesses as they were not considered in our evaluation of operating results for the year. Segment EBIT may not be consistent with measures used by other companies.
Following is a discussion of operating results for each of our business segments.
Financial data for the Engine segment was as follows:
| | | | | | Favorable/(Unfavorable) | ||||||||||||||||||||||||||||||||||||||||
|---|---|---|---|---|---|---|---|---|---|---|---|---|---|---|---|---|---|---|---|---|---|---|---|---|---|---|---|---|---|---|---|---|---|---|---|---|---|---|---|---|---|---|---|---|---|
| | | Years ended December 31, | | | | Favorable/(Unfavorable) | |||||||||||||||||||||||||||||||||||||||
| | | 2009 vs. 2008 | 2008 vs. 2007 | Years ended December 31, | 2012 vs. 2011 | 2011 vs. 2010 | |||||||||||||||||||||||||||||||||||||||
| In millions | In millions | 2009 | 2008 | 2007 | Amount | Percent | Amount | Percent | 2012 | 2011 | 2010 | Amount | Percent | Amount | Percent | ||||||||||||||||||||||||||||||
External sales | External sales | $ | 5,582 | $ | 7,432 | $ | 7,129 | $ | (1,850 | ) | (25 | )% | $ | 303 | 4 | % | $ | 9,101 | $ | 9,649 | $ | 6,594 | $ | (548 | ) | (6 | )% | $ | 3,055 | 46 | % | ||||||||||||||
Intersegment sales | Intersegment sales | 823 | 1,378 | 1,053 | (555 | ) | (40 | )% | 325 | 31 | % | 1,632 | 1,658 | 1,294 | (26 | ) | (2 | )% | 364 | 28 | % | ||||||||||||||||||||||||
Total sales | 6,405 | 8,810 | 8,182 | (2,405 | ) | (27 | )% | 628 | 8 | % | |||||||||||||||||||||||||||||||||||
Total sales | 10,733 | 11,307 | 7,888 | (574 | ) | (5 | )% | 3,419 | 43 | % | |||||||||||||||||||||||||||||||||||
Depreciation and amortization | Depreciation and amortization | 185 | 180 | 176 | (5 | ) | (3 | )% | (4 | ) | (2 | )% | 192 | 181 | 171 | (11 | ) | (6 | )% | (10 | ) | (6 | )% | ||||||||||||||||||||||
Research, development and engineering expenses | Research, development and engineering expenses | 241 | 286 | 222 | 45 | 16 | % | (64 | ) | (29 | )% | 433 | 397 | 263 | (36 | ) | (9 | )% | (134 | ) | (51 | )% | |||||||||||||||||||||||
Equity, royalty and interest income from investees | Equity, royalty and interest income from investees | 54 | 99 | 92 | (45 | ) | (45 | )% | 7 | 8 | % | 127 | 166 | 161 | (39 | ) | (23 | )% | 5 | 3 | % | ||||||||||||||||||||||||
Interest income | Interest income | 3 | 10 | 26 | (7 | ) | (70 | )% | (16 | ) | (62 | )% | 11 | 18 | 12 | (7 | ) | (39 | )% | 6 | 50 | % | |||||||||||||||||||||||
Segment EBIT | Segment EBIT | 252 | 535 | 589 | (283 | ) | (53 | )% | (54 | ) | (9 | )% | 1,248 | 1,384 | 809 | (136 | ) | (10 | )% | 575 | 71 | % | |||||||||||||||||||||||
Segment EBIT as a percentage of net sales | 3.9 | % | 6.1 | % | 7.2 | % | (2.2) percentage points | (1.1) percentage points | |||||||||||||||||||||||||||||||||||||
A summary and discussion of Engine segment net sales by market follows:
| | | | | Favorable/(Unfavorable) | |||||||||||||||||||
|---|---|---|---|---|---|---|---|---|---|---|---|---|---|---|---|---|---|---|---|---|---|---|---|
| | Years ended December 31, | 2009 vs. 2008 | 2008 vs. 2007 | ||||||||||||||||||||
| In millions | 2009 | 2008 | 2007 | Amount | Percent | Amount | Percent | ||||||||||||||||
Heavy-duty truck | $ | 1,996 | $ | 2,308 | $ | 1,948 | $ | (312 | ) | (14 | )% | $ | 360 | 18 | % | ||||||||
Medium-duty truck and bus | 1,232 | 1,550 | 1,284 | (318 | ) | (21 | )% | 266 | 21 | % | |||||||||||||
Light-duty automotive and RV | 688 | 804 | 1,340 | (116 | ) | (14 | )% | (536 | ) | (40 | )% | ||||||||||||
Total on-highway | 3,916 | 4,662 | 4,572 | (746 | ) | (16 | )% | 90 | 2 | % | |||||||||||||
Industrial | 1,821 | 3,029 | 2,676 | (1,208 | ) | (40 | )% | 353 | 13 | % | |||||||||||||
Stationary power | 668 | 1,119 | 934 | (451 | ) | (40 | )% | 185 | 20 | % | |||||||||||||
Total sales | $ | 6,405 | $ | 8,810 | $ | 8,182 | $ | (2,405 | ) | (27 | )% | $ | 628 | 8 | % | ||||||||
| | | | | Percentage Points | Percentage Points | ||||||||||||
|---|---|---|---|---|---|---|---|---|---|---|---|---|---|---|---|---|---|
Segment EBIT as a percentage of total sales | 11.6 | % | 12.2 | % | 10.3 | % | (0.6) | 1.9 | |||||||||
A summary of unitEngine segment sales by market were as follows:
| | | | | Favorable/(Unfavorable) | ||||||||||||||||||
|---|---|---|---|---|---|---|---|---|---|---|---|---|---|---|---|---|---|---|---|---|---|---|
| | Years ended December 31, | 2012 vs. 2011 | 2011 vs. 2010 | |||||||||||||||||||
| In millions | 2012 | 2011 | 2010 | Amount | Percent | Amount | Percent | |||||||||||||||
Heavy-duty truck | $ | 2,964 | $ | 2,791 | $ | 1,503 | $ | 173 | 6 | % | $ | 1,288 | 86 | % | ||||||||
Medium-duty truck and bus | 2,091 | 2,320 | 1,435 | (229 | ) | (10 | )% | 885 | 62 | % | ||||||||||||
Light-duty automotive and RV | 1,279 | 1,176 | 1,022 | 103 | 9 | % | 154 | 15 | % | |||||||||||||
Total on-highway | 6,334 | 6,287 | 3,960 | 47 | 1 | % | 2,327 | 59 | % | |||||||||||||
Industrial | 3,233 | 3,850 | 2,889 | (617 | ) | (16 | )% | 961 | 33 | % | ||||||||||||
Stationary power | 1,166 | 1,170 | 1,039 | (4 | ) | — | 131 | 13 | % | |||||||||||||
Total sales | $ | 10,733 | $ | 11,307 | $ | 7,888 | $ | (574 | ) | (5 | )% | $ | 3,419 | 43 | % | |||||||
Unit shipments by engine classification (including unit shipments to Power Generation) were as follows:
| | | | | | Favorable/(Unfavorable) | | | | Favorable/(Unfavorable) | ||||||||||||||||||||||||||||||||||||
|---|---|---|---|---|---|---|---|---|---|---|---|---|---|---|---|---|---|---|---|---|---|---|---|---|---|---|---|---|---|---|---|---|---|---|---|---|---|---|---|---|---|---|---|---|---|
| | | Years ended December 31, | 2009 vs. 2008 | 2008 vs. 2007 | Years ended December 31, | 2012 vs. 2011 | 2011 vs. 2010 | ||||||||||||||||||||||||||||||||||||||
| | | 2009 | 2008 | 2007 | Amount | Percent | Amount | Percent | 2012 | 2011 | 2010 | Amount | Percent | Amount | Percent | ||||||||||||||||||||||||||||||
Mid-range | Mid-range | 269,200 | 418,300 | 486,800 | (149,100 | ) | (36 | )% | (68,500 | ) | (14 | )% | 440,500 | 509,400 | 368,900 | (68,900 | ) | (14 | )% | 140,500 | 38 | % | |||||||||||||||||||||||
Heavy-duty | Heavy-duty | 85,900 | 108,300 | 91,400 | (22,400 | ) | (21 | )% | 16,900 | 18 | % | 119,100 | 116,300 | 61,200 | 2,800 | 2 | % | 55,100 | 90 | % | |||||||||||||||||||||||||
High-horsepower | High-horsepower | 13,400 | 20,600 | 18,500 | (7,200 | ) | (35 | )% | 2,100 | 11 | % | 19,800 | 21,600 | 18,500 | (1,800 | ) | (8 | )% | 3,100 | 17 | % | ||||||||||||||||||||||||
Total unit shipments | 579,400 | 647,300 | 448,600 | (67,900 | ) | (10 | )% | 198,700 | 44 | % | |||||||||||||||||||||||||||||||||||
Total unit shipments | 368,500 | 547,200 | 596,700 | (178,700 | ) | (33 | )% | (49,500 | ) | (8 | )% | ||||||||||||||||||||||||||||||||||
20092012 vs. 20082011
Net Sales
Engine segment sales experienced deterioration across all major markets,decreased versus 2008, as a result of2011 due to lower demand in the global economic downturn.industrial and medium-duty truck and bus businesses, partially offset by growth in the heavy-duty truck and light-duty automotive and RV businesses. The following are the primary drivers by market.market:
The decreases above were partially offset by the following:
Total on-highway-related sales for 2012 were 6159 percent of total Engineengine segment sales, compared to 5356 percent in 2008.2011.
Segment EBIT
Engine segment EBIT decreased versus 2011, primarily due to lower gross margin, andlower equity, royalty and interest income from investees, higher research, development and engineering expenses and higher selling, general and administrative expenses. Engine segment EBIT for 2012 included restructuring and other charges of $20 million in the fourth quarter. Changes in Engine segment EBIT and EBIT as a percentage of sales were as follows:
| | Year ended December 31, 2012 vs. 2011 Favorable/(Unfavorable) Change | |||||||||
|---|---|---|---|---|---|---|---|---|---|---|
| In millions | Amount | Percent | Percentage point change as a percent of sales | |||||||
Gross margin | $ | (82 | ) | (3 | )% | 0.3 | ||||
Selling, general and administrative expenses | (8 | ) | (1 | )% | (0.4 | ) | ||||
Research, development and engineering expenses | (36 | ) | (9 | )% | (0.5 | ) | ||||
Equity, royalty and interest income from investees | (39 | ) | (23 | )% | (0.3 | ) | ||||
The decrease in gross margin versus 2011 was primarily due to lower volumes and restructuring and other charges, which werewas partially offset by improved price realization, lower material costs, favorable product mix and improved product coverage. The increase in selling, general and administrative expenses was primarily due to increased headcount to support our strategic growth initiatives launched prior to a number of markets unexpectedly slowing in mid-2012, partially offset by decreased selling, generalvariable compensation expense. The increase in research, development and engineering expenses was primarily due to new product development spending and increased headcount to support our strategic growth initiatives. The decrease in equity, royalty and interest income from investees was primarily due to weaker demand for on-highway products at DCEC.
2011 vs. 2010
Sales
Engine segment sales increased in all businesses versus 2010, as demand improved in most markets including a significant rebound in North American on-highway markets, improvements in international construction markets, increased demand in global mining markets and significant increases in oil and gas markets. The following are the primary drivers by market:
Total on-highway-related sales for 2011 were 56 percent of total engine segment sales, compared to 50 percent in 2010.
Segment EBIT
Engine segment EBIT increased significantly versus 2010, primarily due to higher gross margin, partially offset by increased selling, general and administrative expenses and decreased research, development and engineering expenses. Changes in Engine segment EBIT and EBIT as a percentage of sales were as follows:
| | Year ended December 31, 2009 vs. 2008 Favorable/(Unfavorable) Change | Year ended December 31, 2011 vs. 2010 Favorable/(Unfavorable) Change | ||||||||||||||||||
|---|---|---|---|---|---|---|---|---|---|---|---|---|---|---|---|---|---|---|---|---|
| In millions | Amount | Percent | Percentage point change as a percent of sales | Amount | Percent | Percentage point change as a percent of sales | ||||||||||||||
Gross margin | $ | (330 | ) | (24 | )% | 0.6 | % | $ | 864 | 55 | % | 1.7 | ||||||||
Selling, general and administrative expenses | 57 | 9 | % | (1.7 | )% | (142 | ) | (22 | )% | 1.2 | ||||||||||
Research, development and engineering expenses | 45 | 16 | % | (0.6 | )% | (134 | ) | (51 | )% | (0.2 | ) | |||||||||
Equity, royalty and interest income from investees | (45 | ) | (45 | )% | NM | 5 | 3 | % | (0.5 | ) | ||||||||||
The decreaseincrease in gross margin versus 2010 was primarily due to lower enginehigher volumes, in most markets as a result of the global economic downturn, which wasimproved price realization and favorable mix, partially offset by increased sales in the U.S. in the fourth quarter of 2009 ahead of the January 1, 2010, emissions standards change, price improvementshigher commodity costs and by cost reduction activities at our manufacturing plants. Equity, royalty and interest income from investees decreasedhigher base warranty costs due to significantlyincreased volumes and increasing mix of EPA 2010 products. Although our warranty costs increased, our warranty cost as a percentage of sales decreased as actual accrual rates for engines sold this year were generally lower demand at DCEC, Komatsu-Cummins Engine Company (KCEC) and Cummins MerCruiser Diesel Marine LLC.than rates charged in prior years as our warranty costs for EPA 2010 engines have been lower than expected. The decreaseincreases in selling, general and administrative expenses and research, development and engineering expenses were primarily due to new product development spending and increased headcount to support our strategic growth initiatives. The increase in equity, royalty and interest income from investees was primarily due to strong demand for power generation and mining products in China with CCEC and strong export sales to Russia and Brazil in the midrange on-highway market with Beijing Foton Cummins Engine Co., Ltd., which was partially offset by lower discretionary spending, higher recovery of engineering expenses from third parties and decreased payroll costs as the result of restructuring actions.
2008 vs. 2007
Net Sales
Engine segment sales increased compared to 2007. The following are the primary drivers by market.
Financial data for the first six months of 2007 resulting from the 2006 pre-buy to replace trucks ahead of the 2007 emissions standards change and strong demand in Latin America driven by strong economic conditions in Brazil in 2008.
| | | | | Favorable/(Unfavorable) | ||||||||||||||||||
|---|---|---|---|---|---|---|---|---|---|---|---|---|---|---|---|---|---|---|---|---|---|---|
| | Years ended December 31, | 2012 vs. 2011 | 2011 vs. 2010 | |||||||||||||||||||
| In millions | 2012 | 2011 | 2010 | Amount | Percent | Amount | Percent | |||||||||||||||
External sales | $ | 2,809 | $ | 2,886 | $ | 2,171 | $ | (77 | ) | (3 | )% | $ | 715 | 33 | % | |||||||
Intersegment sales | 1,203 | 1,177 | 875 | 26 | 2 | % | 302 | 35 | % | |||||||||||||
Total sales | 4,012 | 4,063 | 3,046 | (51 | ) | (1 | )% | 1,017 | 33 | % | ||||||||||||
Depreciation and amortization | 82 | 73 | 79 | (9 | ) | (12 | )% | 6 | 8 | % | ||||||||||||
Research, development and engineering expenses | 213 | 175 | 114 | (38 | ) | (22 | )% | (61 | ) | (54 | )% | |||||||||||
Equity, royalty and interest income from investees | 29 | 31 | 23 | (2 | ) | (6 | )% | 8 | 35 | % | ||||||||||||
Interest income | 3 | 5 | 2 | (2 | ) | (40 | )% | 3 | NM | |||||||||||||
Segment EBIT | 426 | 470 | 278 | (44 | ) | (9 | )% | 192 | 69 | % | ||||||||||||
These increases were partially offset by a 50 percent decline in units sold to Chrysler. This decline was due to the deteriorating demand for light duty trucks in North America as the result of the softening U.S. economy and concerns over fuel prices earlier in the year.
| | | | | Percentage Points | Percentage Points | ||||||||||||
|---|---|---|---|---|---|---|---|---|---|---|---|---|---|---|---|---|---|
Segment EBIT as a percentage of total sales | 10.6 | % | 11.6 | % | 9.1 | % | (1.0) | 2.5 | |||||||||
Total on-highway-relatedAcquisition
In April 2012, we reached an agreement to acquire the doser technology and business assets from Hilite in a cash transaction. Dosers are products that enable compliance with emission standards in certain aftertreatment systems and complement our current product offerings. The transaction was approved by German regulators in June and closed on July 18, 2012. The purchase price was $176 million. There was no contingent consideration associated with this transaction. During 2012 we expensed approximately $4 million of acquisition related costs. See Note 2, "ACQUISITIONS AND DIVESTITURES," to theConsolidated Financial Statements for more details.
Sales for our Components segment by business were as follows:
| | | | | Favorable/(Unfavorable) | ||||||||||||||||||
|---|---|---|---|---|---|---|---|---|---|---|---|---|---|---|---|---|---|---|---|---|---|---|
| | Years ended December 31, | 2012 vs. 2011 | 2011 vs. 2010 | |||||||||||||||||||
| In millions | 2012 | 2011 | 2010 | Amount | Percent | Amount | Percent | |||||||||||||||
Emission solutions excluding acquisition | $ | 1,369 | $ | 1,262 | $ | 750 | $ | 107 | 8 | % | $ | 512 | 68 | % | ||||||||
Acquisition | 46 | — | — | 46 | 100 | % | — | — | ||||||||||||||
Total emission solutions | 1,415 | 1,262 | 750 | 153 | 12 | % | 512 | 68 | % | |||||||||||||
Turbo technologies | 1,106 | 1,223 | 948 | (117 | ) | (10 | )% | 275 | 29 | % | ||||||||||||
Filtration | 1,048 | 1,113 | 1,011 | (65 | ) | (6 | )% | 102 | 10 | % | ||||||||||||
Fuel systems | 443 | 465 | 337 | (22 | ) | (5 | )% | 128 | 38 | % | ||||||||||||
Total sales | $ | 4,012 | $ | 4,063 | $ | 3,046 | $ | (51 | ) | (1 | )% | $ | 1,017 | 33 | % | |||||||
Excluding Acquisition
Selected financial information for our Components segment excluding the impact of the acquisition was as follows:
| | | | | Favorable/(Unfavorable) | ||||||||||||||||||
|---|---|---|---|---|---|---|---|---|---|---|---|---|---|---|---|---|---|---|---|---|---|---|
| | Years ended December 31, | 2012 vs. 2011 | 2011 vs. 2010 | |||||||||||||||||||
| In millions | 2012 | 2011 | 2010 | Amount | Percent | Amount | Percent | |||||||||||||||
Excluding acquisition | ||||||||||||||||||||||
Sales | $ | 3,966 | $ | 4,063 | $ | 3,046 | $ | (97 | ) | (2 | )% | $ | 1,017 | 33 | % | |||||||
Segment EBIT | 434 | 470 | 278 | (36 | ) | (8 | )% | 192 | 69 | % | ||||||||||||
| | | | | Percentage Points | Percentage Points | ||||||||||||
|---|---|---|---|---|---|---|---|---|---|---|---|---|---|---|---|---|---|
Segment EBIT as a percentage of total sales | 10.9 | % | 11.6 | % | 9.1 | % | (0.7) | 2.5 | |||||||||
2012 vs. 2011
Sales
Components segment sales, excluding the acquisition, decreased versus 2011. The following are the primary drivers:
The decreases above were partially offset by the emission solutions business as sales increased primarily due to higher demand in the North American on-highway market in the first half of the year and new sales in 2008, comparedthe Brazilian on-highway market as the result of new emission requirements effective January 1, 2012, partially offset by lower sales due to 56 percentthe disposition of certain assets and liabilities of our exhaust business in 2007.the second quarter of 2011, lower price realization and unfavorable foreign currency fluctuations. Disposition related sales were $55 million in 2011.
Segment EBIT
EngineComponents segment EBIT decreased versus 2011, primarily due to increasedhigher research, development and engineering expenses. Components segment EBIT for 2012 included restructuring and increased selling, general and administrative expenses which were partially offset by increased gross margin.other charges of $6 million in the fourth quarter. Changes in EngineComponents segment EBIT and EBIT as a percentage of sales were as follows:
| | Year ended December 31, 2008 vs. 2007 Favorable/(Unfavorable) Change | Year ended December 31, 2012 vs. 2011 Favorable/(Unfavorable) Change | ||||||||||||||||||
|---|---|---|---|---|---|---|---|---|---|---|---|---|---|---|---|---|---|---|---|---|
| In millions | Amount | Percent | Percentage point change as a percent of sales | Amount | Percent | Percentage point change as a percent of sales | ||||||||||||||
Including acquisition | ||||||||||||||||||||
Gross margin | $ | 73 | 6 | % | (0.3 | )% | $ | (3 | ) | — | 0.2 | |||||||||
Selling, general and administrative expenses | (30 | ) | (5 | )% | (0.1 | )% | (4 | ) | (1 | )% | (0.2 | ) | ||||||||
Research, development and engineering expenses | (64 | ) | (29 | )% | (0.5 | )% | (38 | ) | (22 | )% | (1.0 | ) | ||||||||
Equity, royalty and interest income from investees | (2 | ) | (6 | )% | (0.1 | ) | ||||||||||||||
Excluding acquisition | ||||||||||||||||||||
Gross margin | (3 | ) | — | 0.4 | ||||||||||||||||
Selling, general and administrative expenses | (1 | ) | — | (0.2 | ) | |||||||||||||||
Research, development and engineering expenses | (35 | ) | (20 | )% | (1.0 | ) | ||||||||||||||
Segment EBIT Excluding Acquisition
The decrease in gross margin versus 2011 was primarily due to lower price realization, unfavorable foreign currency fluctuations, the disposition of certain assets and liabilities of our exhaust business and our light-duty filtration business in 2011 and restructuring and other charges, partially offset by higher volumes, particularly in the emission solutions business, lower material costs and improved product coverage. The increase in selling, general and administrative expenses was primarily due to increased headcount to support our strategic growth initiatives launched prior to a number of markets unexpectedly slowing in mid-2012, partially offset by decreased variable compensation expense and lower discretionary spending in the second half of 2012. The increase in research, development and engineering expenses was primarily due to new product development spending and increased headcount to support our strategic growth initiatives.
2011 vs. 2010
Sales
Components segment sales increased in all businesses versus 2010. The following are the resultprimary regional drivers by business:
Segment EBIT
Components segment EBIT increased versus 2010, primarily due to the improved gross margin which was partially offset by increased research, development and engineering expenses and higher selling, general and administrative expenses was primarily due to higher payroll costsexpenses. Changes in Components segment EBIT and EBIT as the resulta percentage of salary increases and an increase in the number of segment employees during the year.sales were as follows:
| | Year ended December 31, 2011 vs. 2010 Favorable/(Unfavorable) Change | |||||||||
|---|---|---|---|---|---|---|---|---|---|---|
| In millions | Amount | Percent | Percentage point change as a percent of sales | |||||||
Gross margin | $ | 295 | 51 | % | 2.5 | |||||
Selling, general and administrative expenses | (44 | ) | (19 | )% | 0.8 | |||||
Research, development and engineering expenses | (61 | ) | (54 | )% | (0.6 | ) | ||||
Equity, royalty and interest income from investees | 8 | 35 | % | — | ||||||
The increase in gross margin was primarily due to price improvements, especiallyhigher volumes for all businesses and increased product content on 2010 North American truck engines. The increases in industrial enginesresearch, development and parts,engineering expenses and favorableselling, general and administrative expenses were primarily due to new product mix in the on-highway market.development spending and increased headcount to support our strategic growth initiatives. The increase in gross marginequity, royalty and interest income from investees was partially offsetdriven by increased warranty expenseimproved joint venture income from both the increased mixfiltration business in China and India and the fuel systems business.
In 2011, we sold certain assets and liabilities of newer emissions-driven productsour exhaust business and higher repair costslight-duty filtration business and recognized $68 million and $53 million, respectively, in pre-tax gain on certain engines and increased material prices duethe sales. The gains have been excluded from Components results as they were not considered in our evaluation of Components operating results for the year ended 2011. See Note 2, "ACQUISITIONS AND DIVESTITURES," to higher commodity prices during the year.Consolidated Financial Statements.
Power Generation Segment Results
Financial data for the Power Generation segment was as follows:
| | | | | | Favorable/(Unfavorable) | | | | Favorable/(Unfavorable) | ||||||||||||||||||||||||||||||||||||
|---|---|---|---|---|---|---|---|---|---|---|---|---|---|---|---|---|---|---|---|---|---|---|---|---|---|---|---|---|---|---|---|---|---|---|---|---|---|---|---|---|---|---|---|---|---|
| | | Years ended December 31, | 2009 vs. 2008 | 2008 vs. 2007 | Years ended December 31, | 2012 vs. 2011 | 2011 vs. 2010 | ||||||||||||||||||||||||||||||||||||||
| In millions | In millions | 2009 | 2008 | 2007 | Amount | Percent | Amount | Percent | 2012 | 2011 | 2010 | Amount | Percent | Amount | Percent | ||||||||||||||||||||||||||||||
External sales | External sales | $ | 1,879 | $ | 2,601 | $ | 2,375 | $ | (722 | ) | (28 | )% | $ | 226 | 10 | % | $ | 2,163 | $ | 2,492 | $ | 2,150 | $ | (329 | ) | (13 | )% | $ | 342 | 16 | % | ||||||||||||||
Intersegment sales | Intersegment sales | 538 | 899 | 685 | (361 | ) | (40 | )% | 214 | 31 | % | 1,105 | 1,006 | 769 | 99 | 10 | % | 237 | 31 | % | |||||||||||||||||||||||||
Total sales | 2,417 | 3,500 | 3,060 | (1,083 | ) | (31 | )% | 440 | 14 | % | |||||||||||||||||||||||||||||||||||
Total sales | 3,268 | 3,498 | 2,919 | (230 | ) | (7 | )% | 579 | 20 | % | |||||||||||||||||||||||||||||||||||
Depreciation and amortization | Depreciation and amortization | 49 | 41 | 42 | (8 | ) | (20 | )% | 1 | 2 | % | 47 | 42 | 41 | (5 | ) | (12 | )% | (1 | ) | (2 | )% | |||||||||||||||||||||||
Research, development and engineering expenses | Research, development and engineering expenses | 33 | 41 | 34 | 8 | 20 | % | (7 | ) | (21 | )% | 76 | 54 | 36 | (22 | ) | (41 | )% | (18 | ) | (50 | )% | |||||||||||||||||||||||
Equity, royalty and interest income from investees | Equity, royalty and interest income from investees | 22 | 23 | 17 | (1 | ) | (4 | )% | 6 | 35 | % | 40 | 47 | 35 | (7 | ) | (15 | )% | 12 | 34 | % | ||||||||||||||||||||||||
Interest income | Interest income | 3 | 3 | 6 | — | — | % | (3 | ) | (50 | )% | 9 | 8 | 5 | 1 | 13 | % | 3 | 60 | % | |||||||||||||||||||||||||
Segment EBIT | Segment EBIT | 167 | 376 | 334 | (209 | ) | (56 | )% | 42 | 13 | % | 285 | 373 | 299 | (88 | ) | (24 | )% | 74 | 25 | % | ||||||||||||||||||||||||
Segment EBIT as a percentage of net sales | 6.9 | % | 10.7 | % | 10.9 | % | (3.8) percentage points | (0.2) percentage points | |||||||||||||||||||||||||||||||||||||
| | | | | Percentage Points | Percentage Points | ||||||||||||
|---|---|---|---|---|---|---|---|---|---|---|---|---|---|---|---|---|---|
Segment EBIT as a percentage of total sales | 8.7 | % | 10.7 | % | 10.2 | % | (2.0) | 0.5 | |||||||||
In 2009, the first quarter of 2012, our Power Generation segment reorganized its reporting structure to include the following businesses:
Sales for our Power Generation segment by business (including 20082011 and 2007 revised2010 reorganized balances) were as follows:
| | | | | Favorable/(Unfavorable) | |||||||||||||||||||
|---|---|---|---|---|---|---|---|---|---|---|---|---|---|---|---|---|---|---|---|---|---|---|---|
| | Years ended December 31, | 2009 vs. 2008 | 2008 vs. 2007 | ||||||||||||||||||||
| In millions | 2009 | 2008 | 2007 | Amount | Percent | Amount | Percent | ||||||||||||||||
Commercial products | $ | 1,456 | $ | 2,116 | $ | 1,761 | $ | (660 | ) | (31 | )% | $ | 355 | 20 | % | ||||||||
Alternator | 512 | 686 | 623 | (174 | ) | (25 | )% | 63 | 10 | % | |||||||||||||
Commercial projects | 177 | 328 | 219 | (151 | ) | (46 | )% | 109 | 50 | % | |||||||||||||
Consumer | 140 | 238 | 349 | (98 | ) | (41 | )% | (111 | ) | (32 | )% | ||||||||||||
Power electronics | 132 | 132 | 108 | — | — | % | 24 | 22 | % | ||||||||||||||
Total sales | $ | 2,417 | $ | 3,500 | $ | 3,060 | $ | (1,083 | ) | (31 | )% | $ | 440 | 14 | % | ||||||||
A summary of unit shipments used in power generation equipment by engine classification follows:
| | | | | Favorable/(Unfavorable) | |||||||||||||||||||
|---|---|---|---|---|---|---|---|---|---|---|---|---|---|---|---|---|---|---|---|---|---|---|---|
| | Years ended December 31, | 2009 vs. 2008 | 2008 vs. 2007 | ||||||||||||||||||||
| | 2009 | 2008 | 2007 | Amount | Percent | Amount | Percent | ||||||||||||||||
Mid-range | 23,700 | 33,400 | 31,700 | (9,700 | ) | (29 | )% | 1,700 | 5 | % | |||||||||||||
Heavy-duty | 4,800 | 8,400 | 8,000 | (3,600 | ) | (43 | )% | 400 | 5 | % | |||||||||||||
High-horsepower | 8,000 | 11,500 | 10,500 | (3,500 | ) | (30 | )% | 1,000 | 10 | % | |||||||||||||
Total unit shipments | 36,500 | 53,300 | 50,200 | (16,800 | ) | (32 | )% | 3,100 | 6 | % | |||||||||||||
| | | | | Favorable/(Unfavorable) | ||||||||||||||||||
|---|---|---|---|---|---|---|---|---|---|---|---|---|---|---|---|---|---|---|---|---|---|---|
| | Years ended December 31, | 2012 vs. 2011 | 2011 vs. 2010 | |||||||||||||||||||
| In millions | 2012 | 2011 | 2010 | Amount | Percent | Amount | Percent | |||||||||||||||
Power products | $ | 1,654 | $ | 1,636 | $ | 1,465 | $ | 18 | 1 | % | $ | 171 | 12 | % | ||||||||
Power systems | 757 | 815 | 616 | (58 | ) | (7 | )% | 199 | 32 | % | ||||||||||||
Generator technologies | 566 | 673 | 550 | (107 | ) | (16 | )% | 123 | 22 | % | ||||||||||||
Power solutions | 291 | 374 | 288 | (83 | ) | (22 | )% | 86 | 30 | % | ||||||||||||
Total sales | $ | 3,268 | $ | 3,498 | $ | 2,919 | $ | (230 | ) | (7 | )% | $ | 579 | 20 | % | |||||||
20092012 vs. 20082011
Net Sales
Power Generation segment sales decreased versus 2011, primarily due to lower demand in most businesses, versus 2008, as the result of the global economic downturn.generator technologies, power solutions and power systems businesses. The following are the primary drivers by business.business:
The decreases above were partially offset by power products as sales increased primarily due to higher volumes in North America and Western Europe and improved price realization. These increases were partially offset by demand reductions in China, the U.K., Latin America and Eastern Europe and unfavorable foreign currency fluctuations.
Segment EBIT
Power Generation segment EBIT decreased versus 2011, primarily due to a lower gross margin, which was partially offset by decreases inhigher research, development and engineering expenses, lower equity, royalty and interest income from investees and higher selling, general and administrative expenses. Power Generation segment EBIT for 2012 included restructuring and research, development and
Tableother charges of Contents
engineering expenses.$12 million in the fourth quarter. Changes in Power Generation segment EBIT and EBIT as a percentage of sales were as follows:
| | Year ended December 31, 2009 vs. 2008 Favorable/(Unfavorable) Change | Year ended December 31, 2012 vs. 2011 Favorable/(Unfavorable) Change | ||||||||||||||||||
|---|---|---|---|---|---|---|---|---|---|---|---|---|---|---|---|---|---|---|---|---|
| In millions | Amount | Percent | Percentage point change as a percent of sales | Amount | Percent | Percentage point change as a percent of sales | ||||||||||||||
Gross margin | $ | (258 | ) | (39 | )% | (2.3 | )% | $ | (60 | ) | (9 | )% | (0.4 | ) | ||||||
Selling, general and administrative expenses | 57 | 21 | % | (1.2 | )% | (6 | ) | (2 | )% | (0.8 | ) | |||||||||
Research, development and engineering expenses | 8 | 20 | % | (0.2 | )% | (22 | ) | (41 | )% | (0.8 | ) | |||||||||
Equity, royalty and interest income from investees | (1 | ) | (4 | )% | NM | (7 | ) | (15 | )% | (0.1 | ) | |||||||||
The decrease in gross margin versus 2011 was primarily due to lower volumes, unfavorable sales mixforeign currency fluctuations, higher material costs, increased product coverage and increased materialrestructuring and commodity costs other charges,
which were partially offset by improved pricing and favorable foreign currency translation.price realization. The decreaseincrease in selling, general and administrative andexpenses was primarily due to increased headcount to support our strategic growth initiatives, partially offset by lower discretionary spending in the second half of 2012 to align with slowing demand in key markets. The increase in research, development and engineering expenses was primarily due to favorable foreign currency translation,increased headcount to support our strategic growth initiatives and new product development spending. Equity, royalty and interest income from investees decreased primarily due to lower variable compensation costs, implementation of severance programsprofitability at Cummins Olayan and decreased discretionary spending.CCEC.
20082011 vs. 20072010
Net Sales
Power Generation segment sales increased compared to 2007in all businesses, versus 2010, primarily due to increased demand in the power systems, power products and generator technologies businesses. The following drivers.are the primary drivers by business:
These increases were partially offset by a significant sales decrease in our consumer business, primarily due to the softening U.S. economy.
Segment EBIT
Power Generation segment EBIT increased versus 2010, primarily due to higher gross marginmargins, partially offset by increases inhigher selling, general and administrative expenses and research, development and engineering expenses. Changes in Power Generation segment EBIT and EBIT as a percentage of sales were as follows:
| | Year ended December 31, 2008 vs. 2007 Favorable/(Unfavorable) Change | Year ended December 31, 2011 vs. 2010 Favorable/(Unfavorable) Change | ||||||||||||||||||
|---|---|---|---|---|---|---|---|---|---|---|---|---|---|---|---|---|---|---|---|---|
| In millions | Amount | Percent | Percentage point change as a percent of sales | Amount | Percent | Percentage point change as a percent of sales | ||||||||||||||
Gross margin | $ | 83 | 15 | % | — | % | $ | 135 | 25 | % | 0.7 | |||||||||
Selling, general and administrative expenses | (20 | ) | (8 | )% | 0.5 | % | (56 | ) | (22 | )% | (0.2 | ) | ||||||||
Research, development and engineering expenses | (7 | ) | (21 | )% | (0.1 | )% | (18 | ) | (50 | )% | (0.3 | ) | ||||||||
Equity, royalty and interest income from investees | 12 | 34 | % | 0.1 | ||||||||||||||||
The increase in gross margin was primarily due to significanthigher volumes and improved price realization, increased volume and favorable product mix which werewas partially offset by increased commodity and material costs, including increased engine and commodity prices.costs. The increaseincreases in selling, general and administrative expenses wasand research, development and engineering expenses were primarily due to higher payroll costsincreased headcount to support our strategic growth initiatives. Equity, royalty and increasesinterest income from investees increased at CCEC primarily as a result of improved power generation markets in the number of segment employees.China.
Financial data for the Components segment was as follows:
| | | | | Favorable/(Unfavorable) | |||||||||||||||||||
|---|---|---|---|---|---|---|---|---|---|---|---|---|---|---|---|---|---|---|---|---|---|---|---|
| | Years ended December 31, | 2009 vs. 2008 | 2008 vs. 2007 | ||||||||||||||||||||
| In millions | 2009 | 2008 | 2007 | Amount | Percent | Amount | Percent | ||||||||||||||||
External sales | $ | 1,562 | $ | 2,154 | $ | 2,007 | $ | (592 | ) | (27 | )% | $ | 147 | 7 | % | ||||||||
Intersegment sales | 793 | 998 | 925 | (205 | ) | (21 | )% | 73 | 8 | % | |||||||||||||
Total sales | 2,355 | 3,152 | 2,932 | (797 | ) | (25 | )% | 220 | 8 | % | |||||||||||||
Depreciation and amortization | 73 | 65 | 59 | (8 | ) | (12 | )% | (6 | ) | (10 | )% | ||||||||||||
Research, development and engineering expenses | 88 | 95 | 73 | 7 | 7 | % | (22 | ) | (30 | )% | |||||||||||||
Equity, royalty and interest income from investees | 13 | 14 | 4 | (1 | ) | (7 | )% | 10 | NM | ||||||||||||||
Interest income | 1 | 3 | 3 | (2 | ) | (67 | )% | — | — | % | |||||||||||||
Segment EBIT | 95 | 169 | 153 | (74 | ) | (44 | )% | 16 | 10 | % | |||||||||||||
Segment EBIT as a percentage of net sales | 4.0 | % | 5.4 | % | 5.2 | % | (1.4) percentage points | 0.2 percentage points | |||||||||||||||
Our Components segment includes the following businesses: filtration, turbochargers, emissions solutions and fuel systems. Sales for our Components segment by business were as follows:
| | | | | Favorable/(Unfavorable) | |||||||||||||||||||
|---|---|---|---|---|---|---|---|---|---|---|---|---|---|---|---|---|---|---|---|---|---|---|---|
| | Years ended December 31, | 2009 vs. 2008 | 2008 vs. 2007 | ||||||||||||||||||||
| In millions | 2009 | 2008 | 2007 | Amount | Percent | Amount | Percent | ||||||||||||||||
Filtration | $ | 851 | $ | 1,194 | $ | 1,215 | $ | (343 | ) | (29 | )% | $ | (21 | ) | (2 | )% | |||||||
Turbochargers | 704 | 979 | 860 | (275 | ) | (28 | )% | 119 | 14 | % | |||||||||||||
Emissions solutions | 495 | 553 | 448 | (58 | ) | (10 | )% | 105 | 23 | % | |||||||||||||
Fuel systems | 305 | 426 | 409 | (121 | ) | (28 | )% | 17 | 4 | % | |||||||||||||
Total sales | $ | 2,355 | $ | 3,152 | $ | 2,932 | $ | (797 | ) | (25 | )% | $ | 220 | 8 | % | ||||||||
2009 vs. 2008
Net Sales
Components segment sales for the year ended 2009 decreased in all businesses versus 2008 as the result of the global economic downturn. The following are the primary drivers by business.
Segment EBIT
Components segment EBIT decreased versus 2008, primarily due to a lower gross margin which was partially offset by decreased selling, general and administrative and research, development and engineering expenses. Changes in Components segment EBIT and EBIT as a percentage of sales were as follows:
| | Year ended December 31, 2009 vs. 2008 Favorable/(Unfavorable) Change | |||||||||
|---|---|---|---|---|---|---|---|---|---|---|
| In millions | Amount | Percent | Percentage point change as a percent of sales | |||||||
Gross margin | $ | (138 | ) | (28 | )% | (0.6 | )% | |||
Selling, general and administrative expenses | 43 | 19 | % | (0.6 | )% | |||||
Research, development and engineering expenses | 7 | 7 | % | (0.7 | )% | |||||
The decrease in gross margin was due to lower volumes for most markets, partially offset by implementation of severance programs. The decrease in selling, general and administrative and research, development and engineering expenses was primarily due to implementation of severance programs, closing certain facilities, decreased discretionary spending and decreased research and development spending.
2008 vs. 2007
Net Sales
Components segment sales increased compared to 2007 primarily due to the following drivers.
These increases were partially offset by the sale of Universal Silencer and the discontinuance of a product line in 2007, which contributed a combined $75 million in sales in the year ended December 31, 2007.
Segment EBIT
Components segment EBIT increased primarily due to higher gross margins which were partially offset by increased research, development and engineering expenses, as well as increased selling,
general and administration expenses. Changes in Components segment EBIT and EBIT as a percentage of sales were as follows:
| | Year ended December 31, 2008 vs. 2007 Favorable/(Unfavorable) Change | |||||||||
|---|---|---|---|---|---|---|---|---|---|---|
| In millions | Amount | Percent | Percentage point change as a percent of sales | |||||||
Gross margin | $ | 69 | 17 | % | 1.2 | % | ||||
Selling, general and administrative expenses | (21 | ) | (10 | )% | (0.2 | )% | ||||
Research, development and engineering expenses | (22 | ) | (30 | )% | (0.5 | )% | ||||
The increase in gross margin was primarily due to higher volumes in most of our businesses, manufacturing efficiencies achieved in all of our businesses in 2008 and price realization exceeding increased commodity costs, which was partially offset by increased warranty expense. The increase in selling, general and administrative expenses was primarily due to higher payroll costs and increases in the number of segment employees. The increased research, development and engineering spending was focused on developing new products to meet future emissions standards for both developed and emerging markets.
Financial data for the Distribution segment was as follows:
| | | | | | Favorable/(Unfavorable) | | | | Favorable/(Unfavorable) | ||||||||||||||||||||||||||||||||||||
|---|---|---|---|---|---|---|---|---|---|---|---|---|---|---|---|---|---|---|---|---|---|---|---|---|---|---|---|---|---|---|---|---|---|---|---|---|---|---|---|---|---|---|---|---|---|
| | | Years ended December 31, | 2009 vs. 2008 | 2008 vs. 2007 | Years ended December 31, | 2012 vs. 2011 | 2011 vs. 2010 | ||||||||||||||||||||||||||||||||||||||
| In millions | In millions | 2009 | 2008 | 2007 | Amount | Percent | Amount | Percent | 2012 | 2011 | 2010 | Amount | Percent | Amount | Percent | ||||||||||||||||||||||||||||||
External sales | External sales | $ | 1,777 | $ | 2,155 | $ | 1,537 | $ | (378 | ) | (18 | )% | $ | 618 | 40 | % | $ | 3,261 | $ | 3,021 | $ | 2,311 | $ | 240 | 8 | % | $ | 710 | 31 | % | |||||||||||||||
Intersegment sales | Intersegment sales | 7 | 9 | 3 | (2 | ) | (22 | )% | 6 | NM | 16 | 23 | 13 | (7 | ) | (30 | )% | 10 | 77 | % | |||||||||||||||||||||||||
Total sales | 1,784 | 2,164 | 1,540 | (380 | ) | (18 | )% | 624 | 41 | % | |||||||||||||||||||||||||||||||||||
Total sales | 3,277 | 3,044 | 2,324 | 233 | 8 | % | 720 | 31 | % | ||||||||||||||||||||||||||||||||||||
Depreciation and amortization | Depreciation and amortization | 17 | 25 | 11 | 8 | 32 | % | (14 | ) | NM | 34 | 25 | 25 | (9 | ) | (36 | )% | — | — | ||||||||||||||||||||||||||
Research, development and engineering expenses | 6 | 3 | 1 | (3 | ) | (100 | )% | (2 | ) | NM | |||||||||||||||||||||||||||||||||||
Equity, royalty and interest income from investees | Equity, royalty and interest income from investees | 125 | 117 | 92 | 8 | 7 | % | 25 | 27 | % | 188 | 172 | 132 | 16 | 9 | % | 40 | 30 | % | ||||||||||||||||||||||||||
Interest income | Interest income | 1 | 2 | 1 | (1 | ) | (50 | )% | 1 | 100 | % | 2 | 3 | 2 | (1 | ) | (33 | )% | 1 | 50 | % | ||||||||||||||||||||||||
Segment EBIT | 235 | 242 | 187 | (7 | ) | (3 | )% | 55 | 29 | % | |||||||||||||||||||||||||||||||||||
Segment EBIT as a percentage of net sales | 13.2 | % | 11.2 | % | 12.1 | % | 2.0 percentage points | (0.9) percentage points | |||||||||||||||||||||||||||||||||||||
Segment EBIT(1) | 369 | 386 | 297 | (17 | ) | (4 | )% | 89 | 30 | % | |||||||||||||||||||||||||||||||||||
| | | | | Percentage Points | Percentage Points | ||||||||||||
|---|---|---|---|---|---|---|---|---|---|---|---|---|---|---|---|---|---|
Segment EBIT as a percentage of total sales | 11.3 | % | 12.7 | % | 12.8 | % | (1.4) | (0.1) | |||||||||
Sales for our Distribution segment by region were as follows:
| | | | | | Favorable/(Unfavorable) | | | | Favorable/(Unfavorable) | ||||||||||||||||||||||||||||||||||||
|---|---|---|---|---|---|---|---|---|---|---|---|---|---|---|---|---|---|---|---|---|---|---|---|---|---|---|---|---|---|---|---|---|---|---|---|---|---|---|---|---|---|---|---|---|---|
| | | Years ended December 31, | 2009 vs. 2008 | 2008 vs. 2007 | Years ended December 31, | 2012 vs. 2011 | 2011 vs. 2010 | ||||||||||||||||||||||||||||||||||||||
| In millions | In millions | 2009 | 2008 | 2007 | Amount | Percent | Amount | Percent | 2012 | 2011 | 2010 | Amount | Percent | Amount | Percent | ||||||||||||||||||||||||||||||
Asia Pacific | Asia Pacific | $ | 755 | $ | 812 | $ | 673 | $ | (57 | ) | (7 | )% | $ | 139 | 21 | % | $ | 1,314 | $ | 1,170 | $ | 904 | $ | 144 | 12 | % | $ | 266 | 29 | % | |||||||||||||||
Europe, Middle East and Africa | 692 | 1,022 | 816 | (330 | ) | (32 | )% | 206 | 25 | % | |||||||||||||||||||||||||||||||||||
North & Central America | 278 | 260 | — | 18 | 7 | % | 260 | NM | |||||||||||||||||||||||||||||||||||||
North and Central America | 901 | 797 | 539 | 104 | 13 | % | 258 | 48 | % | ||||||||||||||||||||||||||||||||||||
Europe and Middle East | 770 | 808 | 683 | (38 | ) | (5 | )% | 125 | 18 | % | |||||||||||||||||||||||||||||||||||
Africa | 154 | 151 | 111 | 3 | 2 | % | 40 | 36 | % | ||||||||||||||||||||||||||||||||||||
South America | South America | 59 | 70 | 51 | (11 | ) | (16 | )% | 19 | 37 | % | 138 | 118 | 87 | 20 | 17 | % | 31 | 36 | % | |||||||||||||||||||||||||
Total sales | $ | 3,277 | $ | 3,044 | $ | 2,324 | $ | 233 | 8 | % | $ | 720 | 31 | % | |||||||||||||||||||||||||||||||
Total sales | $ | 1,784 | $ | 2,164 | $ | 1,540 | $ | (380 | ) | (18 | )% | $ | 624 | 41 | % | ||||||||||||||||||||||||||||||
Sales for our Distribution segment by product were as follows:
| | | | | Favorable/(Unfavorable) | ||||||||||||||||||
|---|---|---|---|---|---|---|---|---|---|---|---|---|---|---|---|---|---|---|---|---|---|---|
| | Years ended December 31, | 2012 vs. 2011 | 2011 vs. 2010 | |||||||||||||||||||
| In millions | 2012 | 2011 | 2010 | Amount | Percent | Amount | Percent | |||||||||||||||
Parts and filtration | $ | 1,235 | $ | 1,085 | $ | 882 | $ | 150 | 14 | % | $ | 203 | 23 | % | ||||||||
Power generation | 807 | 722 | 516 | 85 | 12 | % | 206 | 40 | % | |||||||||||||
Engines | 665 | 703 | 466 | (38 | ) | (5 | )% | 237 | 51 | % | ||||||||||||
Service | 570 | 534 | 460 | 36 | 7 | % | 74 | 16 | % | |||||||||||||
Total sales | $ | 3,277 | $ | 3,044 | $ | 2,324 | $ | 233 | 8 | % | $ | 720 | 31 | % | ||||||||
Acquisitions
The acquisitions represent the purchase of the majority interest in Cummins Central Power, an equity investee, in the third quarter of 2012, as explained in Note 2, "ACQUISITIONS AND DIVESTITURES," to theConsolidated Financial Statements, we well as several immaterial acquisitions.
Excluding Acquisitions
Selected financial information for our Distribution segment excluding the impact of acquisitions was as follows:
| | | | | Favorable/(Unfavorable) | ||||||||||||||||||
|---|---|---|---|---|---|---|---|---|---|---|---|---|---|---|---|---|---|---|---|---|---|---|
| | Years ended December 31, | 2012 vs. 2011 | 2011 vs. 2010 | |||||||||||||||||||
| In millions | 2012 | 2011 | 2010 | Amount | Percent | Amount | Percent | |||||||||||||||
Parts and filtration | $ | 1,174 | $ | 1,085 | $ | 882 | $ | 89 | 8 | % | $ | 203 | 23 | % | ||||||||
Power generation | 779 | 722 | 516 | 57 | 8 | % | 206 | 40 | % | |||||||||||||
Engines | 613 | 703 | 466 | (90 | ) | (13 | )% | 237 | 51 | % | ||||||||||||
Service | 552 | 534 | 460 | 18 | 3 | % | 74 | 16 | % | |||||||||||||
Sales excluding acquisitions | 3,118 | 3,044 | 2,324 | 74 | 2 | % | 720 | 31 | % | |||||||||||||
Acquisitions | 159 | — | — | 159 | 100 | % | — | — | ||||||||||||||
Total sales | $ | 3,277 | $ | 3,044 | $ | 2,324 | $ | 233 | 8 | % | $ | 720 | 31 | % | ||||||||
Segment EBIT excluding acquisitions(1) | 362 | 386 | 297 | (24 | ) | (6 | )% | 89 | 30 | % | ||||||||||||
| | | | | Percentage Points | Percentage Points | ||||||||||||
|---|---|---|---|---|---|---|---|---|---|---|---|---|---|---|---|---|---|
Segment EBIT as a percentage of total sales excluding acquisitions | 11.6 | % | 12.7 | % | 12.8 | % | (1.1) | (0.1) | |||||||||
20092012 vs. 20082011
Net Sales
Distribution segment sales, for 2009 decreasedexcluding the acquisitions, increased versus 2008,2011 due to higher demand in the parts and filtration, power generation and service businesses, partially offset by lower demand in the engine business. The following were the primary drivers by line of business:
The increases above were partially offset by the following:
Segment EBIT
Distribution segment EBIT decreased versus 2011, primarily due to lower gross margin, partially offset by decreasedhigher selling, general and administrative expenses and higher research, development and engineering expenses, which were partially offset by higher equity, royalty and interest income from investees.investees and higher gross margin. Distribution segment EBIT for 2012 included restructuring and other charges of $14 million in the fourth quarter. Changes in Distribution segment EBIT and EBIT as a percentage of sales were as follows:
| | Year ended December 31, 2009 vs. 2008 Favorable/(Unfavorable) Change | Year ended December 31, 2012 vs. 2011 Favorable/(Unfavorable) Change | ||||||||||||||||||
|---|---|---|---|---|---|---|---|---|---|---|---|---|---|---|---|---|---|---|---|---|
| In millions | Amount | Percent | Percentage point change as a percent of sales | Amount | Percent | Percentage point change as a percent of sales | ||||||||||||||
Including acquisitions | ||||||||||||||||||||
Gross margin | $ | (86 | ) | (18 | )% | (0.2 | )% | $ | 11 | 2 | % | (1.2 | ) | |||||||
Gross margin, excluding acquisition(1) | (94 | ) | (20 | )% | (0.7 | )% | ||||||||||||||
Selling, general and administrative expenses | 54 | 16 | % | (0.3 | )% | (46 | ) | (10 | )% | (0.3 | ) | |||||||||
Research, development and engineering expenses | (3 | ) | (100 | )% | (0.1 | ) | ||||||||||||||
Equity, royalty and interest income from investees | 8 | 7 | % | NM | 16 | 9 | % | — | ||||||||||||
Excluding acquisitions | ||||||||||||||||||||
Gross margin | (18 | ) | (3 | )% | (1.1 | ) | ||||||||||||||
Selling, general and administrative expenses | (23 | ) | (5 | )% | (0.4 | ) | ||||||||||||||
Segment EBIT Excluding Acquisitions
The decrease in gross margin versus 2011 was primarily due to lower sales volumes as a result of the global economic downturn and unfavorable foreign currency translation. Selling,impacts, unfavorable variations in geographic mix and restructuring and other charges, which were partially offset by higher volumes in most products. The increase in selling, general and administrative expenses decreasedwas primarily due to favorable foreign currency translation, lower sales volumes and decreased discretionary spending.
Acquisition of a business
In January 2010, we purchased an additional 50 percent ownership interest in Cummins Western Canada, bringingincreased headcount to support our total ownership interest to 80 percent. A new owner purchased the other 20 percent interest from the previous owner. The total accounting purchase price of the business is expected to be approximately $105 million to $110 million. Western Canada recorded revenues of $226 million and we recorded equity earnings of $11 million for the year ended December 31, 2009.
2008 vs. 2007
Net Sales
Distribution segment sales increased compared to 2007 as a result of strong organicstrategic growth in all regions, mainly in Europe, the South Pacific and the Middle East. We had higher sales of $260 million from the acquisition of a majority ownership interest in three previously independent distributors. We had a favorable impact from foreign currency translation. The higher sales were led by increased sales volumes in power generation, parts and engine volumes, followed by service.initiatives launched
prior to a number of markets unexpectedly slowing in mid-2012, partially offset by decreased variable compensation expense and lower discretionary spending in the second half of 2012. The increase in research, development and engineering expenses was mainly due to increased headcount to support our strategic growth initiatives. The increase in equity, royalty and interest income from investees was primarily due to increased income from North American distributors.
2011 vs. 2010
Sales
Distribution segment sales increased for all product lines versus 2010. The following were the primary drivers by line of business:
Segment EBIT
Distribution segment EBIT increased versus 2010, primarily due to higher marginsimproved gross margin and equity, royalty and interest income from investees, which werewas partially offset by increased selling, general and administrative expenses. Segment EBIT was also unfavorably impacted by the absence of a one-time gain of $12 million from the acquisition of Cummins Western Canada in 2010. Changes in Distribution segment EBIT and EBIT as a percentage of sales were as follows:
| | Year ended December 31, 2008 vs. 2007 Favorable/(Unfavorable) Change | |||||||||
|---|---|---|---|---|---|---|---|---|---|---|
| In millions | Amount | Percent | Percentage point change as a percent of sales | |||||||
Gross margin | $ | 145 | 45 | % | 0.7 | % | ||||
Gross margin, excluding acquisitions(1) | 88 | 27 | % | (1.9 | )% | |||||
Selling, general and administrative expenses | (78 | ) | (31 | )% | 1.2 | % | ||||
Equity, royalty and interest income from investees | 25 | 27 | % | NM | ||||||
| | Year ended December 31, 2011 vs. 2010 Favorable/(Unfavorable) Change | |||||||||
|---|---|---|---|---|---|---|---|---|---|---|
| In millions | Amount | Percent | Percentage point change as a percent of sales | |||||||
Gross margin | $ | 161 | 31 | % | 0.1 | |||||
Selling, general and administrative expenses | (108 | ) | (30 | )% | 0.1 | |||||
Equity, royalty and interest income from investees | 40 | 30 | % | — | ||||||
The increase in gross margin versus 2010 was primarily due to higher volumes in most products, favorable foreign currency impacts and the increaseacquisition of a previously independent distributor in sales volumes for power generation, parts and engines followed by service. These increases in gross margin were partially offset by unfavorable currency translation.2010. The increase in selling, general and administrative expenses was mainly due to higher headcount to support our strategic growth initiatives and unfavorable foreign currency impacts. The increase in equity, royalty and interest income from investees was primarily due to higher payroll costs as the result of 2008 salary increases and an increaseincome from North American distributors, especially in the numberoil and gas markets, and increased parts sales.
Reconciliation of Segment EBIT to Income Before Income Taxes
The table below reconciles the segment information to the corresponding amounts in theConsolidated Statements of IncomeIncome.:
| | Years ended December 31, | |||||||||
|---|---|---|---|---|---|---|---|---|---|---|
| In millions | 2012 | 2011 | 2010 | |||||||
Total segment EBIT | $ | 2,328 | $ | 2,613 | $ | 1,683 | ||||
Non-segment EBIT(1) | (25 | ) | 102 | (26 | ) | |||||
Total EBIT | 2,303 | 2,715 | 1,657 | |||||||
Less: Interest expense | 32 | 44 | 40 | |||||||
Income before income taxes | $ | 2,271 | $ | 2,671 | $ | 1,617 | ||||
| | Years ended December 31, | ||||||||||
|---|---|---|---|---|---|---|---|---|---|---|---|
| In millions | 2009 | 2008 | 2007 | ||||||||
Total segment EBIT | $ | 749 | $ | 1,322 | $ | 1,263 | |||||
Non-segment EBIT(1) | (74 | ) | (102 | ) | (36 | ) | |||||
Total EBIT | $ | 675 | $ | 1,220 | $ | 1,227 | |||||
Less: | |||||||||||
Interest expense | 35 | 42 | 58 | ||||||||
Income before income taxes | $ | 640 | $ | 1,178 | $ | 1,169 | |||||
LIQUIDITY AND CAPITAL RESOURCES
Management's Assessment of Liquidity
We believe ourOur financial condition and liquidity remain strong despite the difficult environment in the U.S.strong. Our solid balance sheet and global economies. Our strong financial performance, particularly in the fourth quarter of 2009, enabledcredit ratings enable us to finish the year with minimal debt and sizable cash and marketable securities balances. This cash performance was driven primarily by improved inventory management, controls on capital and discretionary spending and lower repurchases of common stock.have ready access to credit.
We assess our liquidity in terms of our ability to generate adequate cash to fund our operating, investing and financing activities. We generate significant ongoing cash flow, which has been used, in part, to fund capital expenditures, pay dividends on our common stock, fund repurchases of common stock and make acquisitions. Cash provided by operations is our principal source of liquidity. As of December 31, 2009,2012, other sources of liquidity include:included:
The maturity schedule of our existing long-term debt does not require significant cash outflows in the intermediate term. Required annual principal payments range from $17 million to $67 million over each of the next five years.
While the impact of the continued market volatility cannot be predicted, weWe believe our liquidity will provideprovides us with the financial flexibility needed to fund working capital, capital expenditures, projected pension obligations, dividend payments, common stock repurchases, acquisitions, restructuring actions and debt service obligations.
We have considered the impactTable of ongoing market instability andContents
Our new revolving credit availability in assessing the adequacy of our liquidity and capital resources and are monitoring the impact on our customers and suppliers. We have noticed an impact as reflected in our days sales in receivables, but have not seen a significant impact on our results of operations, financial position or cash flows in 2009. We expect that general market conditions could impact the rate at which we realize our receivablesagreement, completed in the future and could impact eligible receivables under our accounts receivable program, however, we expect to generate positive cash flow from operations in 2010. We will continue to diligently monitor our receivables for potential slowing in collections that could occur asfourth quarter of 2012, provides us with a result of continued difficult economic conditions and our customer's access to credit. The overall decline in market valuations negatively impacted the current value of our pension trusts in 2008; however, pension assets produced strong positive returns in 2009.
At this time, we are comfortable that the currently unused $1.07$1.75 billion credit capacity under ourunsecured revolving credit facility, is availablethe proceeds of which are to us. This assertion is based uponbe used for our general corporate purposes. See Note 10, "DEBT" to ourConsolidated Financial Statements for further information. The credit agreement includes one financial covenant: a leverage ratio. The required leverage ratio, which measures the fact that we drew uponsum of total debt plus securitization financing to consolidated earnings before interest, taxes, depreciation and amortization (EBITDA) for the four fiscal quarters may not exceed 3.25 to 1.0. At December 31, 2012, our revolving credit facility, throughout the year, with a prompt repayment,leverage ratio was 0.30 to confirm participation by the banks included in the facility. We successfully tested the facility again in February 2010. As a result, we believe our access to liquidity sources has not been materially impacted by the current credit environment and we do not expect that it will be materially impacted in the near future. There can be no assurance, however, that the cost or availability of future borrowings, if any, in the debt markets or our credit facilities will not be materially impacted by the ongoing capital market disruptions.1.0.
A significant portion of our cash flows is generated outside the U.S. More than halfAs of December 31, 2012, the total of cash, cash equivalents and marketable securities held by foreign subsidiaries was $1.3 billion, the vast majority of which was located in the U.K., China, India, Singapore and Brazil. The geographic location of our cash and cash equivalents and most of our marketable securities at December 31, 2009, are denominated in
foreign currencies.aligns well with our business growth strategy. We manage our worldwide cash requirements considering available funds among the many subsidiaries through which we conduct our business and the cost effectiveness with which those funds can be accessed. The repatriation ofAs a result, we do not anticipate any local liquidity restrictions to preclude us from funding our targeted expansion or operating needs with local resources.
If we distribute our foreign cash balances to the U.S. or to other foreign subsidiaries, we could be required to accrue and pay U.S. taxes. For example, we would be required to accrue and pay additional U.S. taxes if we repatriated cash from certain foreign subsidiaries couldwhose earnings we have adverse tax consequences; however, those balancesasserted are generally available without legal restrictionspermanently reinvested outside of the U.S. Foreign earnings for which we assert permanent reinvestment outside the U.S. consist primarily of earnings of our U.K. domiciled subsidiaries. At present, we do not foresee a need to fund ordinary business operations at the local level. We have and will continue to transfer cashrepatriate any earnings from these subsidiaries for which we have asserted permanent reinvestment. However, to us and tohelp fund cash needs of the U.S. or other international subsidiaries as they arise, we repatriate available cash from certain foreign subsidiaries whose earnings are not permanently reinvested when it is cost effective to do so. Our 2012 and subsequent earnings from our China operations are considered permanently reinvested, while earnings generated prior to 2012, for which U.S. deferred tax liabilities have been recorded, are expected to be repatriated in future years.
We continuously monitor our pension assets and believe that we have limited exposure to the European debt crisis. No sovereign debt instruments of crisis countries are held in the trusts, while any equities are held with large well-diversified multinational firms or are de minimis amounts in large index funds. Our pension plans have not experienced any significant impact on liquidity or counterparty exposure due to the volatility in the credit markets.
The maturity schedule of our existing long-term debt does not require significant cash outflows in the intermediate term. Required annual principal payments range from $13 million to $72 million over each of the next five years.
We fund our working capital with cash from operations and short-term borrowings when necessary. Various assets and liabilities, including short-term debt, can fluctuate significantly from month to month
depending on short-term liquidity needs. As a result, working capital is a prime focus of management attention.
| | | Change 2012 vs. 2011 | ||||||||||||||||||||||
|---|---|---|---|---|---|---|---|---|---|---|---|---|---|---|---|---|---|---|---|---|---|---|---|---|
| In millions | In millions | 2009 | 2008 | Change 2009 vs. 2008 | 2012 | 2011 | Amount | Percent | ||||||||||||||||
Cash and cash equivalents | Cash and cash equivalents | $ | 930 | $ | 426 | $ | 504 | $ | 1,369 | $ | 1,484 | $ | (115 | ) | (8 | )% | ||||||||
Marketable securities | 247 | 277 | (30 | ) | (11 | )% | ||||||||||||||||||
Accounts and notes receivable | Accounts and notes receivable | 2,004 | 1,782 | 222 | 2,475 | 2,526 | (51 | ) | (2 | )% | ||||||||||||||
Inventories | Inventories | 1,341 | 1,783 | (442 | ) | 2,221 | 2,141 | 80 | 4 | % | ||||||||||||||
Other current assets | Other current assets | 728 | 722 | 6 | 855 | 663 | 192 | 29 | % | |||||||||||||||
Current assets | 5,003 | 4,713 | 290 | |||||||||||||||||||||
Accounts and loans payable | 994 | 1,048 | (54 | ) | ||||||||||||||||||||
Current portion of accrued warranty | 428 | 434 | (6 | ) | ||||||||||||||||||||
Current assets | 7,167 | 7,091 | 76 | 1 | % | |||||||||||||||||||
Current maturities of long-term debt, accounts and loans payable | 1,416 | 1,671 | (255 | ) | (15 | )% | ||||||||||||||||||
Current portion of accrued product warranty | 386 | 422 | (36 | ) | (9 | )% | ||||||||||||||||||
Accrued compensation, benefits and retirement costs | 400 | 511 | (111 | ) | (22 | )% | ||||||||||||||||||
Taxes payable (including taxes on income) | 173 | 282 | (109 | ) | (39 | )% | ||||||||||||||||||
Other accrued expenses | Other accrued expenses | 1,010 | 1,157 | (147 | ) | 761 | 771 | (10 | ) | (1 | )% | |||||||||||||
Current liabilities | 3,136 | 3,657 | (521 | ) | (14 | )% | ||||||||||||||||||
Working capital | $ | 4,031 | $ | 3,434 | ||||||||||||||||||||
Current liabilities | 2,432 | 2,639 | (207 | ) | ||||||||||||||||||||
Current ratio | 2.29 | 1.94 | ||||||||||||||||||||||
Working capital | $ | 2,571 | $ | 2,074 | $ | 497 | ||||||||||||||||||
Current ratio | 2.06 | 1.79 | 0.27 | |||||||||||||||||||||
Days' sales in receivables | Days' sales in receivables | 64 | 48 | 16 | 53 | 48 | ||||||||||||||||||
Inventory turnover | Inventory turnover | 5.2 | 6.2 | (1.0 | ) | 5.7 | 6.3 | |||||||||||||||||
Current assets increased primarily1 percent as increases in other current assets (primarily related to refundable income taxes) and higher inventory levels due to an increasethe unexpected decline in demand were mostly offset by decreased cash and cash equivalents, caused by management's efforts to conserve cash, reduce inventorieslower accounts and limit discretionary spending during the global recession (see Cash Flows below)notes receivable and an increase in receivables. The increase in receivables was due to higher sales in global engine markets, higher sales in the fourth quarter of 2009 than in the fourth quarter of 2008 as a result of a temporary increase in engine (and related component) demand prior to the 2010 emissions standards change and the significant decrease in sales in the fourth quarter of 2008 as a result of the onset of the economic recession. These increases were partially offset by a decrease in inventories as a result of our efforts to reduce our working capital.lower marketable securities.
Current liabilities decreased 14 percent primarily due to a decline in other accrued expenses andlower accounts payable as a result of reduced purchasing volumes, a decrease in accrued compensation, benefits and retirement costs due to lower variable compensation expense for 2012 and a decrease in taxes payable caused by lower earnings and higher estimated tax payments in 2012 compared to 2011.
Days' sales in receivables increased five days compared to 2011. The increase was due to higher average receivable balances throughout 2012 on lower sales due to the decline in volume and controls around discretionary spending.over the second half of the year.
Inventory turnover decreased 0.6 turns compared to 2011. The decrease was due to higher average inventory balances throughout 2012 on lower sales due to the decline in volume over the second half of the year.
Cash and cash equivalents increased $504decreased $115 million during the year ended December 31, 2009,2012, compared to a $151an increase of $461 million decrease in cash and cash equivalents during the year ended December 31, 2008.comparable period in 2011. The change in cash and cash equivalents iswas as follows:
| | | | | | Change | | | | Change | ||||||||||||||||||||||||
|---|---|---|---|---|---|---|---|---|---|---|---|---|---|---|---|---|---|---|---|---|---|---|---|---|---|---|---|---|---|---|---|---|---|
| | | Years ended December 31, | Years ended December 31, | ||||||||||||||||||||||||||||||
| | | 2009 vs. 2008 | 2008 vs. 2007 | 2012 vs. 2011 | 2011 vs. 2010 | ||||||||||||||||||||||||||||
| In millions | In millions | 2009 | 2008 | 2007 | 2012 | 2011 | 2010 | ||||||||||||||||||||||||||
Net income | $ | 484 | $ | 818 | $ | 788 | $ | (334 | ) | $ | 30 | ||||||||||||||||||||||
Depreciation | 326 | 314 | 290 | 12 | 24 | ||||||||||||||||||||||||||||
Consolidated net income | $ | 1,738 | $ | 1,946 | $ | 1,140 | $ | (208 | ) | $ | 806 | ||||||||||||||||||||||
Restructuring and other charges, net of cash payments | 27 | — | — | 27 | — | ||||||||||||||||||||||||||||
Depreciation and amortization | 361 | 325 | 320 | 36 | 5 | ||||||||||||||||||||||||||||
Gain on sale of businesses | (6 | ) | (121 | ) | — | 115 | (121 | ) | |||||||||||||||||||||||||
Gain on sale of equity investment | (13 | ) | — | — | (13 | ) | — | ||||||||||||||||||||||||||
Gain on fair value adjustment for consolidated investee | (7 | ) | — | (12 | ) | (7 | ) | 12 | |||||||||||||||||||||||||
Deferred income taxes | 116 | 85 | 56 | 31 | 29 | ||||||||||||||||||||||||||||
Equity in income of investees, net of dividends | Equity in income of investees, net of dividends | 23 | (45 | ) | (75 | ) | 68 | 30 | (15 | ) | (23 | ) | (147 | ) | 8 | 124 | |||||||||||||||||
Pension expense, net of contributions | (36 | ) | (31 | ) | (152 | ) | (5 | ) | 121 | ||||||||||||||||||||||||
Pension contributions in excess of expense | (68 | ) | (131 | ) | (151 | ) | 63 | 20 | |||||||||||||||||||||||||
Other post-retirement benefits payments in excess of expense | (21 | ) | (31 | ) | (35 | ) | 10 | 4 | |||||||||||||||||||||||||
Stock-based compensation expense | 36 | 42 | 22 | (6 | ) | 20 | |||||||||||||||||||||||||||
Excess tax benefits on stock-based awards | (14 | ) | (5 | ) | (10 | ) | (9 | ) | 5 | ||||||||||||||||||||||||
Translation and hedging activities | — | 4 | 13 | (4 | ) | (9 | ) | ||||||||||||||||||||||||||
Changes in: | Changes in: | ||||||||||||||||||||||||||||||||
Receivables | (181 | ) | 88 | (203 | ) | (269 | ) | 291 | |||||||||||||||||||||||||
Inventory | 482 | (251 | ) | (255 | ) | 733 | 4 | ||||||||||||||||||||||||||
Accounts payable | (75 | ) | (174 | ) | 136 | 99 | (310 | ) | |||||||||||||||||||||||||
Accrued expenses | (132 | ) | 124 | 217 | (256 | ) | (93 | ) | |||||||||||||||||||||||||
Accounts and notes receivable | 87 | (350 | ) | (195 | ) | 437 | (155 | ) | |||||||||||||||||||||||||
Inventories | (32 | ) | (225 | ) | (574 | ) | 193 | 349 | |||||||||||||||||||||||||
Other current assets | (60 | ) | (21 | ) | (54 | ) | (39 | ) | 33 | ||||||||||||||||||||||||
Accounts payable | (256 | ) | 208 | 345 | (464 | ) | (137 | ) | |||||||||||||||||||||||||
Accrued expenses | (514 | ) | 234 | 233 | (748 | ) | 1 | ||||||||||||||||||||||||||
Changes in other liabilities and deferred revenue | 214 | 139 | 133 | 75 | 6 | ||||||||||||||||||||||||||||
Other, net | Other, net | 246 | 144 | 64 | 102 | 80 | (41 | ) | (3 | ) | (78 | ) | (38 | ) | 75 | ||||||||||||||||||
Net cash provided by operating activities | $ | 1,532 | $ | 2,073 | $ | 1,006 | $ | (541 | ) | $ | 1,067 | ||||||||||||||||||||||
Net cash provided by operating activities | $ | 1,137 | $ | 987 | $ | 810 | $ | 150 | $ | 177 | |||||||||||||||||||||||
20092012 vs. 20082011
Net cash provided by operating activities increased for the year ended December 31, 2009, compared to 2008,decreased versus 2011 primarily due to favorableunfavorable working capital fluctuations primarily inventories, as a result of management's response to the challenging global economy and increased dividends from our equity investeeslower consolidated net income, which were partially offset by decreased incomea lower non-cash gain on disposition of certain assets and liabilities of our exhaust business and our light-duty filtration business in 2012. During 2012, the net increase in working capital resulted in a cash outflow of $775 million compared to a cash outflow of $154 million in 2011. This change of $621 million was primarily driven by lower accrued expenses and a decrease in accounts payable, as volumes dropped in the resultsecond half of declining sales. Management's priorities included reducingthe year, and higher cash tax payments of approximately $159 million. These were partially offset by a decrease in accounts and notes receivable and a smaller increase in inventory aligning our cost and capacity with the real demand for our products and managing the business to generate positive cash flows by improving our working capital.in 2012.
Pensions
The funded status of our pension plans is dependent upon a variety of variables and assumptions including return on invested assets, market interest rates and levels of voluntary contributions to the plans. As a result of the credit crisis and the related market recession, our pension assets experienced significant deterioration in 2008. The financial market distress of 2008 continued into early 2009 with the debt and equity markets bottoming out in the first quarter. In the second half of 2009, the financial markets began to rebound. The recovery helped to improve our plan performance. Thus, for the year ended December 31, 2009,2012, the return for our U.S. plan was above 1814 percent while our U.K. plan return was above 16 percent. The most recent three-year average return for all of our pension invested assets was slightly above oneexceeded 7 percent. Approximately 9476 percent of our pension plan assets are investedheld in highly liquid investments such as equity and fixed income securities. The remaining six24 percent of our plan assets are investedheld in less liquid, but market valued investments, including real estate, private equity and private equity.insurance contracts. We made $129$132 million of pension contributions in 2009 and we anticipate making contributions of $175 million to $185 million to our pension plans in 2010. Expected contributions to our defined benefit pension plans in 2010 will meet or exceed the current funding requirements.2012. Claims and premiums for other postretirement benefits are expected to approximate $53approximated $41 million, net of reimbursements, in 2010.2012. The $129$132 million of pension contributions in 20092012 included voluntary contributions of $108$110 million. These contributions and payments include payments from our funds either to increase pension plan assets or to make direct payments to plan participants.
Table We anticipate making total contributions of Contents$170 million to our defined benefit pension plans in 2013. Expected contributions to our defined benefit pension plans in 2013 will meet or exceed the current funding requirements.
20082011 vs. 20072010
Net cash provided by operating activities increased for the year ended December 31, 2008, compared to 2007,versus 2010 primarily due to decreased pension funding, increasedsignificantly higher consolidated net income, excluding the gain on the sale of certain assets and liabilities of our exhaust business and our light-duty filtration business, as thea result of increasedhigher sales volumes, higher dividends from equity investees and increased equity in earnings net of dividends, which was partially offset by unfavorablefavorable working capital fluctuations. The unfavorableDuring 2011, the net increase in working capital fluctuationresulted in a cash outflow of $154 million compared to a cash outflow of $245 million in 2010. This decrease of $91 million was primarily due to andriven by a smaller increase in inventory which was primarilyin 2011 as we significantly increased inventory levels in 2010 to support strong business growth while the decreases in accounts payable and accounts receivable were more reflective of early shutdowns in many of our manufacturing facilities at the close of 2008, as demand softened throughout the fourth quarter. The increase in accrued expenses was primarily due to an increase in warranty expense.meet anticipated post-recession demand.
| | | | | | Change | | | | Change | ||||||||||||||||||||||||
|---|---|---|---|---|---|---|---|---|---|---|---|---|---|---|---|---|---|---|---|---|---|---|---|---|---|---|---|---|---|---|---|---|---|
| | | Years ended December 31, | Years ended December 31, | ||||||||||||||||||||||||||||||
| | | 2009 vs. 2008 | 2008 vs. 2007 | 2012 vs. 2011 | 2011 vs. 2010 | ||||||||||||||||||||||||||||
| In millions | In millions | 2009 | 2008 | 2007 | 2012 | 2011 | 2010 | ||||||||||||||||||||||||||
Capital expenditures | Capital expenditures | $ | (310 | ) | $ | (543 | ) | $ | (353 | ) | $ | 233 | $ | (190 | ) | $ | (690 | ) | $ | (622 | ) | $ | (364 | ) | $ | (68 | ) | $ | (258 | ) | |||
Investments in internal use software | (87 | ) | (60 | ) | (43 | ) | (27 | ) | (17 | ) | |||||||||||||||||||||||
Proceeds from disposals of property, plant and equipment | 11 | 8 | 55 | 3 | (47 | ) | |||||||||||||||||||||||||||
Investments in and advances to equity investees | Investments in and advances to equity investees | (3 | ) | (89 | ) | (66 | ) | 86 | (23 | ) | (70 | ) | (81 | ) | (2 | ) | 11 | (79 | ) | ||||||||||||||
Acquisitions of businesses, net of cash acquired | (2 | ) | (142 | ) | (20 | ) | 140 | (122 | ) | ||||||||||||||||||||||||
Proceeds from the sale of businesses | — | 64 | 35 | (64 | ) | 29 | |||||||||||||||||||||||||||
Investments in marketable securities, net | (96 | ) | 19 | (10 | ) | (115 | ) | 29 | |||||||||||||||||||||||||
Acquisition of businesses, net of cash acquired | (215 | ) | — | (104 | ) | (215 | ) | 104 | |||||||||||||||||||||||||
Proceeds from sale of businesses, net of cash sold | 10 | 199 | — | (189 | ) | 199 | |||||||||||||||||||||||||||
Investments in marketable securities-acquisitions | (561 | ) | (729 | ) | (823 | ) | 168 | 94 | |||||||||||||||||||||||||
Investments in marketable securities-liquidations | 585 | 750 | 690 | (165 | ) | 60 | |||||||||||||||||||||||||||
Proceeds from sale of equity investment | 23 | — | — | 23 | — | ||||||||||||||||||||||||||||
Purchases of other investments | — | — | (62 | ) | — | 62 | |||||||||||||||||||||||||||
Cash flows from derivatives not designated as hedges | 12 | (18 | ) | 2 | 30 | (20 | ) | ||||||||||||||||||||||||||
Other, net | Other, net | (98 | ) | (157 | ) | (101 | ) | 59 | (56 | ) | — | 1 | — | (1 | ) | 1 | |||||||||||||||||
Net cash used in investing activities | $ | (982 | ) | $ | (552 | ) | $ | (651 | ) | $ | (430 | ) | $ | 99 | |||||||||||||||||||
Net cash used in investing activities | $ | (509 | ) | $ | (848 | ) | $ | (515 | ) | $ | 339 | $ | (333 | ) | |||||||||||||||||||
20092012 vs. 20082011
Net cash used in investing activities decreased for the year ended December 31, 2009, compared to 2008,increased versus 2011 primarily due to decreased capital expenditurescash investments for the acquisitions of Hilite and lower investments in the acquisition of businesses which were partially offset by increased cash paid for investments in marketable securities and lower cashCummins Central Power, proceeds from the sale2011 disposition of a business. These decreases primarily occurred as a resultcertain
Table of management's decision to conserve cashContents
assets and maintain liquidity during the recession.liabilities of our exhaust business and light-duty filtration business, which did not repeat in 2012, and increased capital expenditures.
Capital expenditures decreased as management tightened capital spending substantially across all business by limiting expenditureswere $690 million in 2012 compared to critical projects and investments$622 million in development of new products.2011. Despite the expected challengeschallenging economies around the world, we continue to invest in somenew product lines and targeted capacity expansions. We plan to spend approximately $850 million in 2013 as we continue with product launches and facility improvements and prepare for future emission standards. Over one-half of our markets in 2010, our financial position allows us the flexibility to increase capital expenditures for 2010 to approximately $400 million.will be invested outside of the U.S. in 2013.
20082011 vs. 20072010
Net cash used in investing activities increased for the year ended December 31, 2008, compared to 2007,decreased versus 2010 primarily due to an increase in capital expendituresproceeds received from the sale of certain assets and higher investments in businesses related to the purchaseliabilities of three previously independent distributorsour exhaust business and the acquisition of Consolidated Diesel Corporation, a manufacturing facility (seeour light-duty filtration business (See Note 22,2, "ACQUISITIONS AND DIVESTITURES,"DIVESTITURES" to theourConsolidated Financial Statements for additional information).), decreased acquisitions and increased liquidations of marketable securities, the acquisition of Cummins Western Canada in 2010 and decreased purchases of other investments. These increasesdrivers were partially offset by an increase in cash generated from netincreased capital expenditures, additional investments in marketable securities and theadvances to equity investees and lower proceeds from the saledispositions of a business.
Capital expenditures for the year ended December 31, 2008 increased 54 percent over 2007 to support our growth,property, plant and included investments to increase capacity and to fund development of our new products. Our investments in capacity improvements and development of new products accelerated across all of our businesses.
Table of Contentsequipment.
| | | | | | Change | | | | Change | ||||||||||||||||||||||||
|---|---|---|---|---|---|---|---|---|---|---|---|---|---|---|---|---|---|---|---|---|---|---|---|---|---|---|---|---|---|---|---|---|---|
| | | Years ended December 31, | Years ended December 31, | ||||||||||||||||||||||||||||||
| | | 2009 vs. 2008 | 2008 vs. 2007 | 2012 vs. 2011 | 2011 vs. 2010 | ||||||||||||||||||||||||||||
| In millions | In millions | 2009 | 2008 | 2007 | 2012 | 2011 | 2010 | ||||||||||||||||||||||||||
Proceeds from borrowings | Proceeds from borrowings | $ | 76 | $ | 76 | $ | 15 | $ | — | $ | 61 | $ | 64 | $ | 127 | $ | 214 | $ | (63 | ) | $ | (87 | ) | ||||||||||
Payments on borrowings and capital lease obligations | Payments on borrowings and capital lease obligations | (97 | ) | (152 | ) | (144 | ) | 55 | (8 | ) | (145 | ) | (237 | ) | (143 | ) | 92 | (94 | ) | ||||||||||||||
Net (payments) borrowings under short-term credit agreements | (2 | ) | 33 | (12 | ) | (35 | ) | 45 | |||||||||||||||||||||||||
Net borrowings under short-term credit agreements | 11 | 6 | 9 | 5 | (3 | ) | |||||||||||||||||||||||||||
Distributions to noncontrolling interests | (62 | ) | (56 | ) | (28 | ) | (6 | ) | (28 | ) | |||||||||||||||||||||||
Dividend payments on common stock | Dividend payments on common stock | (141 | ) | (122 | ) | (89 | ) | (19 | ) | (33 | ) | (340 | ) | (255 | ) | (172 | ) | (85 | ) | (83 | ) | ||||||||||||
Proceeds from sale of common stock held by employee benefits trust | 72 | 63 | 13 | 9 | 50 | ||||||||||||||||||||||||||||
Repurchases of common stock | Repurchases of common stock | (20 | ) | (128 | ) | (335 | ) | 108 | 207 | (256 | ) | (629 | ) | (241 | ) | 373 | (388 | ) | |||||||||||||||
Proceeds from sale of common stock held by employee benefit trust | — | — | 58 | — | (58 | ) | |||||||||||||||||||||||||||
Excess tax benefits on stock-based awards | 14 | 5 | 10 | 9 | (5 | ) | |||||||||||||||||||||||||||
Other, net | Other, net | (29 | ) | (7 | ) | (24 | ) | (22 | ) | 17 | 20 | 14 | 26 | 6 | (12 | ) | |||||||||||||||||
Net cash used in financing activities | $ | (694 | ) | $ | (1,025 | ) | $ | (267 | ) | $ | 331 | $ | (758 | ) | |||||||||||||||||||
Net cash used in financing activities | $ | (141 | ) | $ | (237 | ) | $ | (576 | ) | $ | 96 | $ | 339 | ||||||||||||||||||||
20092012 vs. 20082011
Net cash used in financing activities decreased for the year ended December 31, 2009, compared to 2008,versus 2011 primarily due to the decrease insignificantly lower repurchases of common stock and lowerdecreased payments on borrowings and capital lease obligations, which waswere partially offset by a decrease inhigher dividend payments and decreased proceeds from borrowings and higher dividend payments.borrowings.
Our total debt was $704$775 million as of December 31, 2009,2012, compared with $698$783 million atas of December 31, 2008.2011. Total debt as a percent of our total capital, including total long-term debt, was 14.910.0 percent at December 31, 2009,2012, compared to 16.7with 11.8 percent at December 31, 2008.2011.
20082011 vs. 20072010
Net cash used in financing activities decreased for the year ended December 31, 2008, compared to 2007,increased versus 2010, primarily due to the decrease insignificantly higher repurchases of common stock, the increase inincreased payments on borrowings and capital lease obligations, decreased proceeds from borrowings the increase in proceeds from saleand higher dividend payments.
Our total debt as of December 31, 2008, was $698 million compared to $674$783 million as of December 31, 2007.
2011, compared with $843 million as of December 31, 2010. Total debt as a percent of our total capital, including total long-term debt, was 16.711.8 percent at December 31, 2008,2011, compared to 15.4with 14.4 percent at December 31, 2007. The 2008 debt to capital ratio was negatively impacted by a $675 million ($433 after-tax) charge to Cummins Inc. shareholders' equity to recognize the funded status of our defined benefit pension and other postretirement plans.
Revolving Credit Agreement
On June 30, 2008, we entered into a three-year revolving credit agreement with a syndicate of lenders. The credit agreement provides us with a $1.1 billion senior unsecured revolving credit facility, the proceeds of which are to be used by us for working capital or other general corporate purposes.
The credit facility matures on June 30, 2011. Amounts payable under our revolving credit facility will rank pro rata with all of our other unsecured, unsubordinated indebtedness. Up to $100 million under our credit facility is available for swingline loans denominated in U.S. dollars. Advances under the facility bear interest at (i) a base rate or (ii) a rate equal to LIBOR plus an applicable margin based on the credit ratings of our outstanding senior unsecured long-term debt. Based on our current long-term debt ratings, the applicable margin on LIBOR loans was 0.75 percent per annum as of
December 31, 2009. Advances under the facility may be prepaid without premium or penalty, subject to customary breakage costs.
The credit agreement includes various covenants, including, among others, maintaining a leverage ratio of no more than 3.0 to 1.0 and maintaining fixed charge coverage ratio of at least 1.5 to 1.0. As of December 31, 2009, we were in compliance with all such covenants, including our leverage ratio of 0.6 to 1.0 and our fixed charge coverage ratio of 22.5 to 1.0.2010.
Repurchase of Common Stock
In July 2006, the Board of Directors authorized us to acquire up to eight million shares of Cummins common stock. In 2007, we repurchased approximately $335 million of common stock, at an average cost of $55.76 per share, representing approximately six million shares. This concluded the share repurchase program authorized by the Board of Directors in July 2006.
In December 2007, the Board of Directors authorized the acquisition of up to $500 million of Cumminsour common stock. We began makingstock, which was completed in February 2011. Repurchases under this plan by year were as follows:
| In millions (except per share amounts) | Shares Purchased | Average Cost Per Share | Total Cost of Repurchases | Remaining Authorized Capacity | |||||||||
|---|---|---|---|---|---|---|---|---|---|---|---|---|---|
2008 | 2.3 | $ | 55.49 | $ | 128 | $ | 372 | ||||||
2009 | 0.4 | 46.52 | 20 | 352 | |||||||||
2010 | 3.5 | 68.57 | 241 | 111 | |||||||||
2011 | 1.1 | 104.47 | 111 | — | |||||||||
Total | 7.3 | $ | 500 | ||||||||||
In February 2011, the Board of Directors approved a new share repurchase program and authorized the acquisition of up to $1 billion of our common stock upon completion of the $500 million program. In 2011, we repurchased $518 million of shares under this authorization. In 2012, we made the following quarterly purchases under this plan:
In millions (except per share amounts) For each quarter ended | 2012 Shares Purchased | Average Cost Per Share | Total Cost of Repurchases | Remaining Authorized Capacity | |||||||||
|---|---|---|---|---|---|---|---|---|---|---|---|---|---|
April 1 | 0.1 | $ | 114.97 | $ | 8 | $ | 474 | ||||||
July 1 | 1.8 | 104.00 | 188 | 286 | |||||||||
September 30 | 0.4 | 84.95 | 35 | 251 | |||||||||
December 31 | 0.3 | 87.83 | 25 | 226 | |||||||||
Total | 2.6 | 99.47 | $ | 256 | |||||||||
In December 2012, the plan in March 2008 and purchased $128 millionBoard of stock during 2008 at an average costDirectors authorized the acquisition of $55.49 per share.
We announced in February 2009 that we had temporarily suspendedup to $1 billion of our stock repurchase program to conserve cash. In the fourth quarter of 2009, we lifted the suspension and will from time to time repurchase stock. We purchased $20 million of common stock duringupon completion of the fourth quarter at an average cost of $46.52 per common share.2011 repurchase program.
Quarterly Dividends
In July 2008,2012, the Board of Directors authorized a 25 percent increase to our quarterly cash dividend on our common stock from $0.40 per share to $0.50 per share. In July 2011, the Board of Directors approved a 52 percent increase to our quarterly cash dividend on our common stock from $0.2625 per share to $0.40 per share. In July 2010, our Board of Directors voted to approved a 50 percent
increase in our quarterly cash dividend on our common stock from $0.175 per share by 40 percent resulting in increasing our cash dividends from $0.125to $0.2625 per common share to $0.175 per common share. Cash dividends per share paid to common shareholders for the last three years were as follows:
| | Quarterly Dividends | Quarterly Dividends | ||||||||||||||||||
|---|---|---|---|---|---|---|---|---|---|---|---|---|---|---|---|---|---|---|---|---|
| | 2009 | 2008 | 2007 | 2012 | 2011 | 2010 | ||||||||||||||
First quarter | $ | 0.175 | $ | 0.125 | $ | 0.09 | $ | 0.40 | $ | 0.2625 | $ | 0.175 | ||||||||
Second quarter | 0.175 | 0.125 | 0.09 | 0.40 | 0.2625 | 0.175 | ||||||||||||||
Third quarter | 0.175 | 0.175 | 0.125 | 0.50 | 0.40 | 0.2625 | ||||||||||||||
Fourth quarter | 0.175 | 0.175 | 0.125 | 0.50 | 0.40 | 0.2625 | ||||||||||||||
Total | $ | 1.80 | $ | 1.325 | $ | 0.875 | ||||||||||||||
Total dividends paid to common shareholders in 2009, 20082012, 2011 and 20072010 were $141$340 million, $122$255 million and $89$172 million, respectively. Declaration and payment of dividends in the future depends upon our income and liquidity position, among other factors, and is subject to declaration by our Board of Directors, who meet quarterly to consider theour dividend payment. We expect to fund dividend payments fromwith cash from operations.
Credit Rating Impact on our Credit FacilitiesRatings
A number of our contractual obligations and financing agreements, such as our revolving credit facility, and our equipment sale-leaseback agreements have restrictive covenants and/or pricing modifications that may be triggered in the event of downward revisions to our corporate credit rating. There were no downgrades of our credit ratings in 20092012 that have impacted these covenants or pricing modifications.
On March 10, 2008, In September 2011, Standard & Poor's (S&P)Rating Services upgraded our senior unsecured debt ratings from "BBB-"rating to "BBB"'A' and revisedchanged our outlook to stable citingstable. In November 2011, Moody's Investors Service, Inc. raised our improved operating performance over the past several years, including during the expected emissions-related downturn in heavy-duty truck
demand in 2007, combined with significant on-rating to 'Baa1' and off-balance sheet debt reduction, and increased business diversification.
On June 17, 2008,changed our outlook to positive. In October 2012, Fitch Ratings upgraded our senior unsecured debt ratings from "BBB" to "BBB+" citing'A' and changed our recent market share gains and improving credit profile, including improvement in our geographic and business diversification. In the second quarter of 2009, Moody's Investor Service, Inc. and Fitch reaffirmed our credit ratings.outlook to stable.
Credit ratings are not recommendations to buy, and are subject to change and each rating should be evaluated independently of any other rating. In addition, we undertake no obligation to update disclosures concerning our credit ratings, whether as a result of new information, future events or otherwise. Our ratings and outlook as of December 31, 2009, from each of the credit rating agencies as of the date of filing are shown in the table below.
Credit Rating Agency | Senior Debt Rating | Outlook | ||||
|---|---|---|---|---|---|---|
Standard & Poor's Rating Services | A | Stable | ||||
Fitch Ratings | A | Stable | ||||
Moody's Investors Service, Inc. | ||||||
| ||||||
|
CONTRACTUAL OBLIGATIONS AND OTHER COMMERCIAL COMMITMENTS
A summary of payments due for our contractual obligations and commercial commitments, as of December 31, 2009,2012, is shown in the tables below:
Contractual Cash Obligations | 2013 | 2014 - 2015 | 2016 - 2017 | After 2017 | Total | |||||||||||
|---|---|---|---|---|---|---|---|---|---|---|---|---|---|---|---|---|
In millions | ||||||||||||||||
Loans payable | $ | 16 | $ | — | $ | — | $ | — | $ | 16 | ||||||
Long-term debt and capital lease obligations(1) | 120 | 200 | 116 | 1,476 | 1,912 | |||||||||||
Operating leases | 147 | 183 | 95 | 128 | 553 | |||||||||||
Capital expenditures | 549 | 310 | 24 | 18 | 901 | |||||||||||
Purchase commitments for inventory | 506 | 13 | — | — | 519 | |||||||||||
Other purchase commitments | 236 | 97 | 31 | 4 | 368 | |||||||||||
Pension funding(2) | 37 | 149 | — | — | 186 | |||||||||||
Other postretirement benefits | 47 | 88 | 78 | 265 | 478 | |||||||||||
Total | $ | 1,658 | $ | 1,040 | $ | 344 | $ | 1,891 | $ | 4,933 | ||||||
Contractual Cash Obligations | 2010 | 2011-2012 | 2013-2014 | After 2014 | Total | |||||||||||
|---|---|---|---|---|---|---|---|---|---|---|---|---|---|---|---|---|
| In millions | | | | | | |||||||||||
Loans payable | $ | 37 | $ | — | $ | — | $ | — | $ | 37 | ||||||
Long-term debt and capital lease obligations(1) | 97 | 235 | 140 | 1,462 | 1,934 | |||||||||||
Operating leases | 96 | 119 | 73 | 85 | 373 | |||||||||||
Capital expenditures | 124 | 37 | 11 | — | 172 | |||||||||||
Purchase commitments for inventory | 391 | — | — | — | 391 | |||||||||||
Other purchase commitments | 118 | 47 | 5 | — | 170 | |||||||||||
Pension funding(2) | 70 | 130 | 130 | 65 | 395 | |||||||||||
Other postretirement benefits | 53 | 104 | 98 | 249 | 504 | |||||||||||
Total | $ | 986 | $ | 672 | $ | 457 | $ | 1,861 | $ | 3,976 | ||||||
The contractual obligations reported above exclude our unrecognized tax benefits of $56$145 million all of which is non-current, as of December 31, 2009.2012. We are not able to reasonably estimate the
period in which cash outflows relating to uncertain tax contingencies could occur. See Note 4, "INCOME TAXES," to theConsolidated Financial Statements for further details.
Our other commercial commitments as of December 31, 2012, are as follows:
Other Commercial Commitments | 2010 | 2011-2012 | 2013-2014 | After 2014 | Total | 2013 | 2014 - 2015 | 2016 - 2017 | After 2017 | Total | ||||||||||||||||||||||
|---|---|---|---|---|---|---|---|---|---|---|---|---|---|---|---|---|---|---|---|---|---|---|---|---|---|---|---|---|---|---|---|---|
| In millions | | | | | | |||||||||||||||||||||||||||
Standby letters of credit under revolving credit agreement | $ | 35 | $ | — | $ | — | $ | — | $ | 35 | $ | 23 | $ | — | $ | — | $ | — | $ | 23 | ||||||||||||
International and other domestic letters of credit | 20 | 8 | 1 | 1 | 30 | 27 | 18 | — | 2 | 47 | ||||||||||||||||||||||
Performance and excise bonds | 6 | 17 | 52 | — | 75 | 14 | 52 | 3 | 1 | 70 | ||||||||||||||||||||||
Guarantees and other commitments | 1 | — | — | 74 | 75 | |||||||||||||||||||||||||||
Guarantees, indemnifications and other commitments | 3 | 13 | — | — | 16 | |||||||||||||||||||||||||||
Total | $ | 62 | $ | 25 | $ | 53 | $ | 75 | $ | 215 | $ | 67 | $ | 83 | $ | 3 | $ | 3 | $ | 156 | ||||||||||||
In July 2007, we amended our agreement with a financial institution to sell a designated pool of trade receivables to Cummins Trade Receivables, LLC (CTR), a wholly-owned special purpose subsidiary, to extend the facility until July 2010, and raised the purchase limitation from $200 million to $400 million. The agreement also provides us with an option to increase the purchase limitation up to $500 million upon approval. As necessary, CTR may transfer a direct interest in its receivables, without recourse, to the financial institution. To maintain a balance in the designated pools of receivables sold, we sell new receivables to CTR as existing receivables are collected. Receivables sold to CTR in which an interest is not transferred to the financial institution are included in "Receivables, net" on ourConsolidated Balance Sheets. The maximum interest in sold receivables that can be outstanding at any point in time is limited to the lesser of $400 million or the amount of eligible receivables held by CTR. There are no provisions in this agreement that require us to maintain a minimum investment credit rating; however, the terms of the agreement contain the same financial covenants as our revolving credit facility. As of December 31, 2009, the amount available under this program was $154 million. As of December 31, 2009 and 2008, there were no amounts outstanding under this program.
Financing Arrangements for Affiliated Parties
In accordance with the provisions of various joint venture agreements, we may purchase and/or sell products and components from/to the joint ventures and the joint ventures may sell products and components to unrelated parties. The transfer price of products purchased from the joint ventures may differ from normal selling prices. Certain joint venture agreements transfer product to us at cost, some transfer product to us on a cost-plus basis and other agreements provide for the transfer of products at market value.
APPLICATION OF CRITICAL ACCOUNTING ESTIMATES
A summary of our significant accounting policies is included in Note 1, "SUMMARY OF SIGNIFICANT ACCOUNTING POLICIES," toof ourConsolidated Financial Statements which discusses accounting policies that we have selected from acceptable alternatives.
OurConsolidated Financial Statements are prepared in accordance with GAAP which often requires management to make judgments, estimates and assumptions regarding uncertainties that affect the reported amounts presented and disclosed in the financial statements. Our managementManagement reviews these estimates and assumptions based on historical experience, changes in business conditions and other relevant factors they believe to be reasonable under the circumstances. In any given reporting period, our actual results may differ from the estimates and assumptions used in preparing ourConsolidated Financial StatementsStatements..
Critical accounting estimates are defined as follows: the estimate requires management to make assumptions about matters that were highly uncertain at the time the estimate was made; different estimates reasonably could have been used; or if changes in the estimate are reasonably likely to occur from period to period and the change would have a material impact on our financial condition or results of operations. Our senior management has discussed the development and selection of our accounting policies, related accounting estimates and the disclosures set forth below with the Audit Committee of our Board of Directors. We believe our critical accounting estimates include those addressing the recoverability of an investment related to new products, the estimation of liabilities for warranty programs, recoverability of investment related to new products, accounting for income taxes and pension benefits and annual assessment of recoverability of goodwill.
Recoverability of Investment Related to New Products
We have capitalized $216 million associated with the future launch of our light-duty diesel engine product. Market uncertainty due to the global recession has resulted in some customers delaying or cancelling their vehicle programs. We concluded that events and circumstances indicated that these assets should be reviewed for possible impairment at December 31, 2009. We used projections to assess whether future cash flows on an undiscounted basis related to the assets are likely to exceed the related carrying amount to determine if a write-down is appropriate. These projections require estimates about product volume and the size of the market for vehicles that are not yet developed. We used input from our customers in developing alternative cash flow scenarios. Our analysis indicated that the assets are recoverable at December 31, 2009. If customer expectations or projected volumes deteriorate and we do not identify alternative customers and/or product applications, we could be required to write-down these assets to net realizable value.benefits.
We estimate and record a liability for warranty programs, primarily base warranty and other than product recalls,programs at the time our products are sold. Our estimates are based on historical experience and reflect management's best estimates of expected costs at the time products are sold and subsequent adjustment to those expected costs when actual costs differ. As a result of the uncertainty surrounding the nature and frequency of product recall programs, the liability for such programs is recorded when we commit to a recall action or when a recall becomes probable and estimable, which generally occurs when it is announced. Our warranty liability is generally affected by component failure rates, repair costs and the timepoint of failure.failure within the product life cycle. Future events and circumstances related to these factors could materially change our estimates and require adjustments to our liability. New product launches require a greater use of judgment in developing estimates until historical experience becomes available. Product specific experience is typically available four or five quarters after product launch, with a clear experience trend evident eight quarters after launch. We generally record warranty expense for new products upon shipment using a preceding product's warranty history and a multiplicative factor based upon historicalpreceding similar product experience only in the first year,and new product assessment until sufficient new product data is available for warranty estimation. We then use a blend of actual new product experience and preceding product historical experience in the second yearfor several subsequent quarters, and new product specific experience thereafter. Note 11, "PRODUCT WARRANTY LIABILITY," to ourConsolidated Financial Statements contains a summary of the activity in our warranty liability account for 20092012 and 20082011 including adjustments to pre-existing warranties.
Recoverability of Investment Related to New Products
At December 31, 2012, we have capitalized $233 million associated with the future launch of our new light-duty diesel engine product. Development of this product began in 2006. Market uncertainty related to the global recession that began in 2008 resulted in some customers delaying or cancelling their vehicle programs. At December 31, 2009, we reviewed our investment of $216 million for possible impairment. We used projections to assess whether future cash flows on an undiscounted basis related to the assets are likely to exceed the related carrying amount to determine if a write-down was appropriate. These projections required estimates about product volume and the size of the market for vehicles that are not yet developed. We used input from our customers in developing alternative cash flow scenarios. Our analysis indicated that the assets were recoverable. Customers that are expected to purchase sufficient quantities to recover our investment in the new light-duty diesel engine products remained active with the development of this product through 2012, and there were no significant changes to the assumptions used in 2009. If customer expectations or projected volumes deteriorate and we do not identify alternative customers and/or product applications, we could be required to write-down these assets to net realizable value.
We determine our provision for income taxestax expense using the asset and liability method. Under this method, deferred tax assets and liabilities are recognized for the future tax effects of temporary differences between the financial statement carrying amounts of existing assets and liabilities and their respective tax bases. Future tax benefits of tax loss and credit carryforwards are also recognized as deferred tax assets. We evaluate the recoverability of our deferred tax assets each quarter by assessing the likelihood of future profitability and available tax planning strategies that could be implemented to
realize our net deferred tax assets. At December 31, 2009,2012, we recorded net deferred tax assets of $729$396 million. These assets included $151$165 million for the value of tax loss and credit carryforwards. A valuation allowance of $44$95 million was recorded to reduce the tax assets to the net value management believed was more likely than not to be realized. In the event our operating performance deteriorates, future assessments could conclude that a larger valuation allowance will be needed to further reduce the deferred tax assets. In addition, we operate within multiple taxing jurisdictions and are subject to tax audits in these jurisdictions. These audits can involve complex issues, which may require an extended period of time to resolve. We reduce our net tax assets for the estimated additional tax and interest that may result from tax authorities disputing uncertain tax positions we have taken and we believe we have made adequate provision for income taxes for all years that are subject to audit based upon the latest information available. A more complete description of our income taxes and the future benefits of our tax loss and credit carryforwards is disclosed in Note 4, "INCOME TAXES," to ourConsolidated Financial Statements.
We sponsor a number of pension plans primarily in the U.S. and the U.K. and to a lesser degree in various other countries. In the U.S. and the U.K. we have several major defined benefit plans that are separately funded. We account for our pension programs in accordance with employers' accounting for defined benefit pension and other postretirement plans under GAAP. GAAP requires that amounts recognized in financial statements be determined using an actuarial basis. As a result, our pension benefit programs are based on a number of statistical and judgmental assumptions that attempt to anticipate future events and are used in calculating the expense and liability related to our plans each year at December 31. These assumptions include discount rates used to value liabilities, assumed rates of return on plan assets, future compensation increases, employee turnover rates, actuarial assumptions relating to retirement age, mortality rates and participant withdrawals. The actuarial assumptions we use may differ significantly from actual results due to changing economic conditions, participant life span and withdrawal rates. These differences may result in a material impact to the amount of net periodic pension expense to be recorded in ourConsolidated Financial Statements in the future.
The expected long-term return on plan assets is used in calculating the net periodic pension expense. We considered several factors in developing our expected rate of return on plan assets. The long-term rate of return considers historical returns and expected returns on current and projected asset allocations and is generally applied to a 5-yearfive-year average market value of return. Projected returns are based primarily on broad, publicly traded equity and fixed income indices and forward-looking estimates of active portfolio and investment management. As of December 31, 2012, based upon our target asset allocations it is anticipated that our U.S. investment policy will generate an average annual return over the 10-year projection period equal to or in excess of 7.5 percent approximately 40 percent of the time while returns of 9.0 percent or greater are anticipated 25 percent of the time. We expect additional positive returns from active investment management. The long-term2012 one year return was 14 percent, combined with the very favorable returns in 2011 has eliminated the significant deterioration in pension assets experienced in 2008 as a result of the credit crisis and related market recession. Based on the historical returns and forward-looking return expectations, we believe an investment return assumption of 8.0 percent per year in 2013 for U.S. pension assets is reasonable.
The methodology used to determine the rate of return on pension plan assets representsin the U.K. was based on establishing an estimateequity-risk premium over current long-term bond yields adjusted based on target asset allocations. As of December 31, 2012, based upon our target asset allocations, it is anticipated that our U.K. investment policy will generate an average annual return over the 20-year projection period equal to or in excess of 5.6 percent approximately 50 percent of the time while returns of 6.5 percent or greater are anticipated 25 percent of the time. We expect additional positive returns from active investment management. The one year return for our U.K. plan exceeded 7 percent for 2012 and similar to our U.S. plan, the 2008 market related deterioration in our plan assets has been eliminated. Our strategy with respect to our investments in pension plan assets is to be invested with a long-term outlook. Therefore, the risk and return balance of our asset portfolio should reflect a long-term horizon. Based on the historical returns onand forward-looking return expectations, we believe an investment portfolio consistingreturn assumption of a mixture of equities, fixed income, real estate5.8 percent in 2013 for U.K. pension assets is reasonable. Our pension plan asset allocation at December 31, 2012 and other miscellaneous investments.2011 and target allocation for 2013 are as follows:
| | U.S. Plans | U.K. Plans | |||||||||||||||||
|---|---|---|---|---|---|---|---|---|---|---|---|---|---|---|---|---|---|---|---|
| | | Percentage of Plan Assets at December 31, | | Percentage of Plan Assets at December 31, | |||||||||||||||
| | Target Allocation 2013 | Target Allocation 2013 | |||||||||||||||||
Investment description | 2012 | 2011 | 2012 | 2011 | |||||||||||||||
Equity securities | 40.0 | % | 40.1 | % | 44.2 | % | 40.0 | % | 43.0 | % | 45.0 | % | |||||||
Fixed income | 45.0 | % | 47.5 | % | 42.2 | % | 45.0 | % | 46.0 | % | 46.0 | % | |||||||
Real estate/other | 15.0 | % | 12.4 | % | 13.6 | % | 15.0 | % | 11.0 | % | 9.0 | % | |||||||
Total | 100.0 | % | 100.0 | % | 100.0 | % | 100.0 | % | 100.0 | % | 100.0 | % | |||||||
The differences between the actual return on plan assets and expected long-term return on plan assets are recognized in the asset value used to calculate net periodic expense over five years. The table below sets forth the expected return assumptions used to develop our pension expense for the period 2007-20092010-2012 and our expected rate of return for 2010.2013.
| | Long-Term Expected Return Assumptions | Long-Term Expected Return Assumptions | ||||||||||||||||||||||||
|---|---|---|---|---|---|---|---|---|---|---|---|---|---|---|---|---|---|---|---|---|---|---|---|---|---|---|
| | 2010 | 2009 | 2008 | 2007 | 2013 | 2012 | 2011 | 2010 | ||||||||||||||||||
U.S. Plans | 8.00 | % | 8.25 | % | 8.25 | % | 8.50 | % | 8.00 | % | 8.00 | % | 8.00 | % | 8.00 | % | ||||||||||
Non-U.S. Plans | 7.25 | % | 7.25 | % | 7.25 | % | 7.24 | % | ||||||||||||||||||
U.K. Plans | 5.80 | % | 6.50 | % | 7.00 | % | 7.25 | % | ||||||||||||||||||
A lower expected rate of return will increase our net periodic pension expense and reduce profitability.
GAAP for pensions offers various acceptable alternatives to account for the differences that eventually arise between the estimates used in the actuarial valuations and the actual results. It is acceptable to delay or immediately recognize these differences. Under the delayed recognition alternative, changes in pension obligation (including those resulting from plan amendments) and changes in the value of assets set aside to meet those obligations are not recognized in net periodic pension cost as they occur but are recognized initially in comprehensive income and subsequently amortized as components of net periodic pension cost systematically and gradually over future periods. In addition to this approach, GAAP also allows immediate recognition of actuarial gains or losses. Immediate recognition introduces volatility in financial results. We have chosen to delay recognition and amortize actuarial differences over future periods. If we adopted the immediate recognition approach, we would record a loss of $1,082 million ($724 million after-tax) for our U.S. and U.K. pension plans.
The difference between the expected return and the actual return on plan assets is deferred from recognition in our results of operations and, under certain circumstances such as when the difference
exceeds 10 percent of the market value of plan assets or the projected benefit obligation (PBO),
amortized over future years of service. This is also true of changes to actuarial assumptions. As of December 31, 2009,2012, we had net pension actuarial losses of $801$734 million and $364$349 million for the U.S. and non-U.S.U.K. pension plans, respectively. Under GAAP, the actuarial gains and losses are recognized and recorded in accumulated other comprehensive loss. Increases in actuarial losses decreased our shareholders' equity by $83 million (after-tax) in 2012. The increases were due to liability losses from reduced discount rates, partially offset by improved plan asset performance in 2012. As these amounts exceed 10 percent of our PBO, the excess is amortized over the average remaining service lives of participating employees.
The table below sets forth the net periodic pension expense for the period 20072010 through 20092012 and our expected expense for 2010.2013.
| | Net Periodic Pension Expense | Net Periodic Pension Expense | ||||||||||||||||||||||||
|---|---|---|---|---|---|---|---|---|---|---|---|---|---|---|---|---|---|---|---|---|---|---|---|---|---|---|
| In millions | 2010 | 2009 | 2008 | 2007 | 2013 | 2012 | 2011 | 2010 | ||||||||||||||||||
Pension expense | $ | 71 | $ | 93 | $ | 71 | $ | 98 | $ | 97 | $ | 64 | $ | 68 | $ | 70 | ||||||||||
We expect 2013 pension expense to be increased significantly over 2012, due to the unfavorable impacts of higher service cost due to increased headcount, decreased discount rates and lower expected asset returns for our U.K. plan as we de-risk plan trust assets moving toward more conservative investments. The increasedecrease in periodic pension expense in 20092012 compared to 2011 was due to lower than historicalimproved returns on assets driven byand strong contributions in 2011. The decrease in periodic pension expense in 2011 compared to 2010 was due to improved returns on assets as the global economic recession.capital markets began to recover and strong contributions in 2010. Another key assumption used in the development of the net periodic pension expense is the discount rate. The weighted average discount rates used to develop our net periodic pension expense are set forth in the table below.
| | Discount Rates | Discount Rates | ||||||||||||||||||||||||
|---|---|---|---|---|---|---|---|---|---|---|---|---|---|---|---|---|---|---|---|---|---|---|---|---|---|---|
| | 2010 | 2009 | 2008 | 2007 | 2013 | 2012 | 2011 | 2010 | ||||||||||||||||||
U.S. Plans | 5.60 | % | 6.20 | % | 6.10 | % | 5.60 | % | 3.97 | % | 4.82 | % | 5.42 | % | 5.60 | % | ||||||||||
Non-U.S. Plans | 5.80 | % | 6.20 | % | 5.80 | % | 4.96 | % | ||||||||||||||||||
U.K. Plans | 4.70 | % | 5.20 | % | 5.80 | % | 5.80 | % | ||||||||||||||||||
Changes in the discount rate assumptions will impact the interest cost component of the net periodic pension expense calculation.
The discount rate enables us to state expected future cash payments for benefits as a present value on the measurement date. The guidelines for setting this rate are discussed in GAAP which suggests the use of a high-quality corporate bond rate. We used bond information provided by Moody's Investor Service Inc., Standard & Poors for the U.S.Poor's Rating Services, Fitch Ratings and iBoxx for the U.K.Dominion Bond Rating. All bonds used to develop our hypothetical portfolio in the U.S. and U.K. were high-quality, non-callable bonds (AA-(Aa or better) as of December 31, 2009.2012, by at least two of the bond rating agencies. The average yield of this hypothetical bond portfolio was used as the benchmark for determining the discount rate to be used to value the obligations of the plans subject to GAAP accounting for pensions and other postretirement benefits other than pensions.benefits.
Our model called for 80 years of benefit payments for the U.S. plans and 60 years of benefit payments.payments for the U.K. For both countries, our model matches the U.S. plans, the sumpresent value of the cash flows fromplan's projected benefit payments to the 60 bonds matchedmarket value of the theoretical settlement bond portfolio. A single equivalent discount rate is determined to align the present value of the required cash flow fromwith the benefit payment stream upon completionvalue of the process. The number of bonds purchased for each issue was used to determine the price of the entirebond portfolio. The resulting discount rate benchmark was set tois reflective of both the internalcurrent interest rate of return needed to discount the cash flows to arrive at the portfolio price.
In developing the U.K. discount rate, excess cash flows resulted in the early years of the 60-year period when the sum of the cash flow from the bonds maturing in later years exceeded the benefit payments in early years, thus no bonds maturing in early years are needed. As a result, the price of the entire portfolio of bonds was too high because all benefit payments were covered with excess cash flow remaining. We made no adjustment to the cash flowenvironment and the discount rate was determined as the internal rate of return needed to discount the cash flows to arrive at the portfolio price.plan's distinct liability characteristics.
The table below sets forth the estimated impact on our 20102013 net periodic pension expense relative to a change in the discount rate and a change in the expected rate of return on plan assets.
| In millions | Impact on Pension Expense Increase (Decrease) | ||||
|---|---|---|---|---|---|
Discount rate used to value liabilities: | |||||
0.25 percent increase | $ | (5 | ) | ||
0.25 percent decrease | 5 | ||||
Expected rate of return on assets: | |||||
1 percent increase | (28 | ) | |||
1 percent decrease | 28 | ||||
| In millions | Impact on Pension Expense Increase (Decrease) | |||
|---|---|---|---|---|
Discount rate used to value liabilities | ||||
0.25 percent increase | $ | (9 | ) | |
0.25 percent decrease | 9 | |||
Expected rate of return on assets | ||||
One percent increase | (34 | ) | ||
One percent decrease | 34 | |||
The above sensitivities reflect the impact of changing one assumption at a time. A higher discount rate decreases the plan obligations and decreases our net periodic pension expense. A lower discount rate increases the plan obligations and increases our net periodic pension expense. It should be noted that economic factors and conditions often affect multiple assumptions simultaneously and the effects of changes in key assumptions are not necessarily linear.
Our investment policies in the U.S. and U.K. provide for the rebalancing of assets to maintain our long-term strategic asset allocation. We are committed to its long-term strategy and do not attempt to time the market given empirical evidence that asset allocation is more critical than individual asset or investment manager selection. Rebalancing of the assets has and continues to occur. The rebalancing is critical to having the proper weighting of assets to achieve the expected total portfolio returns.
For the U.S. qualified pension plans, our assumptions for the expected return on assets was 8.25 percent in 2009. Projected returns are based primarily on broad, publicly traded equity and fixed income indices and forward-looking estimates of active portfolio and investment management. As of December 31, 2009, based upon our target asset allocations it is anticipated that our U.S. investment policy will generate an average annual return over the 20-year projection period equal to or in excess of 7.50 percent approximately 40 percent of the time while returns of 8.70 percent or greater are anticipated 25 percent of the time. We expect additional positive returns from active investment management. Except for the short-term adverse conditions in the equity markets in 2008, our recent three-year annual rates of return have all exceeded 8.50 percent. As a result, based on the historical returns and forward-looking return expectations, we believe an investment return assumption of 8.00 percent per year in 2010 for U.S. pension assets is reasonable. The methodology used to determine the rate of return on pension plan assets in the U.K. was based on establishing an equity-risk premium over current long-term bond yields adjusted based on target asset allocations. Our strategy with respect to our investments in pension plan assets is to be invested with a long-term outlook. Therefore, the risk and return balance of our asset portfolio should reflect a long-term horizon. Our pension plan asset allocation at December 31, 2009 and 2008 and target allocation for 2010 are as follows:
| | | Percentage of Plan Assets at December 31, | |||||||||
|---|---|---|---|---|---|---|---|---|---|---|---|
| | Target Allocation 2010 | ||||||||||
Investment description | 2009 | 2008 | |||||||||
Equity securities | 55.0 | % | 59.1 | % | 56.0 | % | |||||
Fixed income | 33.6 | % | 34.6 | % | 39.6 | % | |||||
Real estate/Other | 11.4 | % | 6.3 | % | 4.4 | % | |||||
Total | 100.0 | % | 100.0 | % | 100.0 | % | |||||
Actual cash funding for our U.S. pension plans is governed by employee benefit and tax laws and the Pension Protection Act of 2006 ("the Act"). The Act extends the use of an average corporate bond rate for determining current liabilities for funding purposes. Among its many provisions, the Act establishes a 100 percent funding target for plan years beginning after December 31, 2007, which has now been extended to 2011 by the U.S. Congress due to the recession. Our funding strategy is to make contributions to our various qualified plans in accordance with statutory funding requirements and any additional contributions we determine are appropriate. The table below sets forth our pension contributions for the period 2008-2009 and our expected range of contributions for 2010.
| | Pension Contributions | |||||||||
|---|---|---|---|---|---|---|---|---|---|---|
| In millions | 2010 | 2009 | 2008 | |||||||
Contributions | $ | 175 - 185 | $ | 129 | $ | 102 | ||||
Contributions beyond 2010 will depend on the funded status of our U.S. plans at that time in relation to the targeted funding established under the Act and contractual obligations negotiated in the U.K.
Our pension plans in the U.S. and outside the U.S. were under-funded at December 31, 2009, by a total of $522 million due to pension trust asset performance.
Under GAAP, the actuarial gains and losses and prior service costs (credits) are recognized and recorded in accumulated other comprehensive loss. Increases in actuarial losses reduced our shareholders' equity by $11 million (after-tax) in 2009. The increases resulted from lower discount rates and higher mortality assumptions partially offset by improved plan asset performance in 2009.
Note 12, "PENSION AND OTHER POSTRETIREMENT BENEFITS," to ourConsolidated Financial Statements provides a summary of our pension benefit plan activity, the funded status of our plans and the amounts recognized in ourConsolidated Financial Statements.
Annual Assessment for Recoverability of Goodwill
Under GAAP accounting for goodwill and other intangible assets, the carrying value of goodwill is reviewed annually. The fair value of each reporting unit was estimated by discounting the future cash flows less requirements for working capital and fixed asset additions. In accordance with GAAP, our reporting units are generally defined as one level below an operating segment. However, there were two situations where we have aggregated two or more components which share similar economic characteristics and thus are aggregated into a single reporting unit for testing purposes. These two situations are described further below. This analysis has resulted in the following reporting units for our goodwill testing:
No other reporting units have goodwill. Our valuation method requires us to make projections of revenue, operating expenses, working capital investment and fixed asset additions for the reporting units over a multi-year period. Additionally, management must estimate a weighted-average cost of capital, which reflects a market rate, for each reporting unit for use as a discount rate. The discounted cash flows are compared to the carrying value of the reporting unit and, if less than the carrying value, a separate valuation of the goodwill is required to determine if an impairment loss has occurred. In addition, we also perform a sensitivity analysis to determine how much our forecasts can fluctuate before the fair value of a reporting unit would be lower than its carrying amount. As of the end of the third quarter in 2009, we performed the annual impairment assessment required by GAAP and determined that our goodwill was not impaired. At December 31, 2009, our recorded goodwill was $364 million, approximately 90 percent of which resided in the emissions solutions plus filtration reporting unit. For this reporting unit, a 10 percent reduction in our estimated future cash flows would not have impacted our assessment. Changes in our projections or estimates, a deterioration of our operating results and the related cash flow effect or a significant increase in the discount rate could decrease the estimated fair value of our reporting units and result in a future impairment of goodwill.
RECENTLY ADOPTED AND RECENTYRECENTLY ISSUED ACCOUNTING PRONOUNCEMENTS
Accounting Pronouncements Recently Adopted
In December 2007,June 2011, the Financial Accounting Standards Board (FASB) amended its existing standards for business combinations, which isrules regarding the presentation of comprehensive income. The objective of this amendment was to improve the comparability, consistency and transparency of financial reporting and to increase the prominence of items reported in other comprehensive income. Specifically, this amendment requires that all non-owner changes in shareholders' equity be presented either in a single continuous statement of comprehensive income or in two separate but consecutive statements. In addition, the standard also requires disclosure of the location of reclassification adjustments between other comprehensive income and net income on the face of the financial statements. The new rules became effective for fiscal yearsus beginning afterJanuary 1, 2012. In December 15, 2008. The amended standards make significant changes to both2011, the accounting and disclosures related toFASB deferred certain aspects of this standard beyond the acquisition of a business and could materially impact how we account for future business combination transactions.current effective date, specifically the provisions dealing with reclassification adjustments. Because the standard will only impacts the display of comprehensive income and does not impact transactions entered into after January 1, 2009,what is included in comprehensive income, the amended standardsstandard did not have a significant impact ourConsolidated Financial Statements upon adoption.
In December 2007, the FASB amended its existing standards for noncontrolling interests in consolidated financial statements, which was effective for interim and annual fiscal periods beginning after December 15, 2008. The new standard established accounting and reporting standards for the noncontrolling interest in a subsidiary and for the accounting for future ownership changes with respect to those subsidiaries. The new standard defined a noncontrolling interest, previously called a minority interest, as the portion of equity in a subsidiary not attributable, directly or indirectly, to a parent. The new standard required, among other items, that a noncontrolling interest be included in the consolidated balance sheet within equity, separate from the parent's equity; consolidated net income to be reported at amounts inclusive of both the parent's and noncontrolling interest's shares and, separately, the amounts of consolidated net income attributable to the parent and noncontrolling interest all on the consolidated statements of income; and if a subsidiary is deconsolidated, any retained noncontrolling equity investment in the former subsidiary be measured at fair value and a gain or loss be recognized in net income based on such fair value. We adopted the new standard effective January 1, 2009 and applied it retrospectively. As a result, we reclassified noncontrolling interests of $246 million, $292 million and $253 million, respectively, from the mezzanine section to equity in the December 31, 2008, 2007 and 2006 balance sheets. Certain reclassifications have been made to prior period amounts to conform to the presentation of the current period under the new standard.
In March 2008, the FASB amended its existing standards for disclosures about derivative instruments and hedging activities, which was effective for interim and annual fiscal periods beginning after November 15, 2008. The new standards require enhanced disclosures about a company's derivative and hedging activities. We adopted the new standard effective January 1, 2009 and applied it prospectively. The new disclosures required are included in Note 20, "DERIVATIVES," to ourConsolidated Financial Statements.
In May 2011, the FASB amended its standards related to fair value measurements and disclosures. The objective of the amendment was to improve the comparability of fair value measurements presented and disclosed in financial statements prepared in accordance with U.S. GAAP and International Financial Reporting Standards. Primarily this amendment changed the wording used to describe many of the requirements in U.S. GAAP for measuring fair value and for disclosing information about fair value measurements in addition to clarifying the Board's intent about the application of existing fair value measurement requirements. The new standard also requires additional disclosures related to fair value measurements categorized within Level 3 of the fair value hierarchy and requires disclosure of the categorization in the hierarchy for items which are not recorded at fair value but fair value is required to be disclosed. The new rules were effective for us beginning January 1, 2012. As of December 31, 2012, we had no fair value measurements categorized within Level 3 outside of our pension plans. The only impact for us is the disclosure of the categorization in the fair value hierarchy for those items where fair value is only disclosed (primarily our debt
In June 2009,obligations). Our disclosure related to the FASB amended its existing standards for subsequent events, which was effective for interim and annual fiscal periods ending after June 15, 2009 and established general standards of accounting for and disclosure of events that occur after the balance sheet date but before financial statements are issued or are available to be issued. The new standard establishedis included in Note 6, "FAIR VALUE OF FINANCIAL INSTRUMENTS," to the period after the balance sheet date during which we should evaluate events or transactions that may occur for potential recognition or disclosure in the financial statements, the circumstances under which we should recognize events or transactions occurring after the balance sheet date and the disclosures that should be made about events or transactions that occurred after the balance sheet date. In preparing ourConsolidated Financial Statements, we evaluated subsequent events through February 25, 2010, which is the date our annual report was filed with the Securities and Exchange Commission..
Accounting Pronouncements Issued But Not Yet Effective
In June 2009,December 2011, the FASB amended its standards for accounting for transfers of financial assets, which is effective for interim and annual fiscal periods beginning after November 15, 2009. The new standard removes the concept of a qualifying special-purpose entity from GAAP. The new standard modifies the financial-components approach used in previous standards and limits the circumstances in which a financial asset, or portion of a financial asset, should be derecognized. The new standard also requires enhanced disclosure regarding transfers of financial interests and a transferor's continuing involvement with transferred assets. The new standard will require us to report any future activity under our sale of receivables program as secured borrowings as of January 1, 2010. As of December 31, 2009, we had no amounts outstanding under this program.
In June 2009, the FASB amended its existing standards related to the consolidation of variable interest entities, which is effective for interimoffsetting assets and annual fiscal periods beginning after November 15, 2009. The new standardliabilities. This amendment requires entities to analyze whether their variable interests give itdisclose both gross and net information about certain instruments and transactions eligible for offset in the statement of financial position and certain instruments and transactions subject to an agreement similar to a controllingmaster netting agreement. This information will enable users of the financial intereststatements to understand the effect of a variable interest entity (VIE) and outlines what defines a primary beneficiary.those arrangements on its financial position. The new rules will become effective for annual reporting periods beginning on or after January 1, 2013, and interim periods within those annual periods. It is also required that the new disclosures are applied for all comparative periods presented. In January 2013, the FASB further amended this standard amends GAAP by: (a) changing certain rules for determining whether an entity is a VIE; (b) replacing the quantitative approach previously required for determining the primary beneficiary with a more qualitative approach;to limit its scope to derivatives, repurchase and (c) requiring entities to continuously analyze whether they are the primary beneficiary of a VIE among other amendments. The new standard also requires enhanced disclosures regarding an entity's involvement in a VIE. While we are still finalizing our evaluation of the impact ofreverse repurchase agreements, securities borrowings and lending transactions. We do not believe this amendment on ourConsolidated Financial Statements, we believe the only impact will be the deconsolidation of Cummins Komatsu Engine Company (CKEC). This deconsolidation will not have a material impactsignificant effect on ourConsolidated Financial Statements. Financial information about CKEC is included in Note 23, "VARIABLE INTEREST ENTITIES,"While we are still finalizing our analysis, due to the scope limitation we also do not expect any significant changes to ourConsolidated Financial Statements. footnote disclosures.
In October 2009,February 2013, the FASB amended its rules regardingstandards on comprehensive income by requiring disclosure in the accounting for multiple element revenue arrangements. The objectivefootnotes of information about amounts reclassified out of accumulated other comprehensive income by component. Specifically, the amendment will require disclosure of the amendmentline items of net income in which the item was reclassified only if it is reclassified to allow vendorsnet income in its entirety in the same reporting period. It will also require cross reference to accountother disclosures for revenue for different deliverables separately as opposed to part of a combined unit when those deliverablesamounts that are provided at different times. Specifically, this amendment addresses how to separate deliverables and simplifiesnot reclassified in their entirety in the process of allocating revenue to the different deliverables when more than one deliverable exists.same reporting period. The new rules are effectivedisclosures will be required for us prospectively only for annual periods beginning January 1, 2011. We are in the process of evaluating the impact that this amendment will have on ourConsolidated Financial Statements.2013 and interim periods within those annual periods.
ItemITEM 7A. Quantitative and Qualitative Disclosures About Market Risk
We are exposed to financial risk resulting from volatility in foreign exchange rates, commodity prices and interest rates and commodity prices.rates. This risk is closely monitored and managed through the use of financial derivative instruments including commodity swap contracts, foreign currency forward contracts, commodity swap contracts, commodity zero-cost collars and interest rate swaps. As stated in our policies and procedures, financial derivatives are used expressly for hedging purposes, and under no circumstances are they used for speculative purposes. When material,
we adjust the value of our derivative contracts for counter-party or our credit risk. The results and status of our hedging transactions are reported to senior management on a monthly and quarterly basis.
Further information regarding financial instruments and risk management is contained in Note 20,21, "DERIVATIVES," to ourConsolidated Financial Statements.
The following describes our risk exposures and provides results of sensitivity analysis performed as of December 31, 2009.2012. The sensitivity analysis assumes instantaneous, parallel shifts in foreign currency exchange rates and commodity prices.
FOREIGN EXCHANGE RATESForeign Exchange Rates
As a result of our international business presence, we are exposed to foreign currency exchange risks. We transact business in foreign currencies and, as a result, our income experiences some volatility related to movements in foreign currency exchange rates. To help manage our exposure to exchange rate volatility, we use foreign exchange forward contracts on a regular basis to hedge forecasted intercompany and third-party sales and purchases denominated in non-functional currencies. Our internal policy allows for managing anticipated foreign currency cash flowflows for up to one year. These foreign currency forward contracts are designated and qualify as foreign currency cash flow hedges under GAAP. The effective portion of the unrealized gain or loss on the forward contract is deferred
and reported as a component of "Accumulated other comprehensive loss" (AOCL). When the hedged forecasted transaction (sale or purchase) occurs, the unrealized gain or loss is reclassified into income in the same line item associated with the hedged transaction in the same period or periods during which the hedged transaction affects income. The ineffective portion of the hedge, unrealized gain or loss, if any, is recognized in current income during the period of change. As of December 31, 2009,2012, the amount expectedwe expect to be reclassifiedreclassify from AOCL to income over the next year is not material.an unrealized net gain of $1 million. For the years ended December 31, 2009,2012 and 2008,2011, there were no circumstances that would have resulted in the discontinuance of a foreign currency cash flow hedge.
To minimize the income volatility resulting from the remeasurement of net monetary assets and payables denominated in a currency other than the functional currency, we enter into foreign currency forward contracts, which are considered economic hedges. The objective is to offset the gain or loss from remeasurement with the gain or loss from the fair market valuation of the forward contract. These derivative instruments are not designated as hedges under GAAP.
As of December 31, 2009,2012, the potential gain or loss in the fair value of our outstanding foreign currency contracts, assuming a hypothetical 10 percent fluctuation in the currencies of such contracts, would be approximately $31$45 million. The sensitivity analysis of the effects of changes in foreign currency exchange rates assumes the notional value to remain constant for the next 12 months. The analysis ignores the impact of foreign exchange movements on our competitive position and potential changes in sales levels. It should be noted that any change in the value of the contracts, real or hypothetical, would be significantly offset by an inverse change in the value of the underlying hedged items (see Note 20,21, "DERIVATIVES," to ourConsolidated Financial Statements).
INTEREST RATESInterest Rate Risk
We are exposed to market risk from fluctuations in interest rates. We manage our exposure to interest rate fluctuations through the use of interest rate swaps. The objective of the swaps is to more effectively balance our borrowing costs and interest rate risk.
In November 2005, we entered into an interest rate swap to effectively convert our $250 million debt issue, due in 2028, from a fixed rate of 7.125%7.125 percent to a floating rate based on a LIBOR spread. The terms of the swap mirror those of the debt, with interest paid semi-annually. This swap qualifies as a fair value hedge under GAAP. The gain or loss on this derivative instrument as well as the offsetting gain
or loss on the hedged item attributable to the hedged risk are recognized in current income as "Interest expense." TheseThe following table summarizes these gains and losses for the year December 31, 2009, were as follows:years presented below:
| For the years ended December 31, | ||||||||||||||||||||
|---|---|---|---|---|---|---|---|---|---|---|---|---|---|---|---|---|---|---|---|---|
| | December 31, 2009 | 2012 | 2011 | |||||||||||||||||
In millions Income Statement Classification | Gain/(Loss) on Swaps | Gain/(Loss) on Borrowings | Gain/(Loss) on Swaps | Gain/(Loss) on Borrowings | Gain/(Loss) on Swaps | Gain/(Loss) on Borrowings | ||||||||||||||
Interest expense | $ | (54 | ) | $ | 54 | $ | 6 | $ | (6 | ) | $ | 41 | $ | (41 | ) | |||||
COMMODITY PRICESCommodity Price Risk
We are exposed to fluctuations in commodity prices due to contractual agreements with component suppliers. In order to protect ourselves against future price volatility and, consequently, fluctuations in gross margins, we periodically enter into commodity swap contracts with designated banks to fix the cost of certain raw material purchases with the objective of minimizing changes in inventory cost due to market price fluctuations. TheCertain commodity swap contracts are derivative contracts that are designated as cash flow hedges under GAAP. TheWe also have commodity swap contracts that represent an economic hedge but are not designated for hedge accounting and are marked to market through earnings. For those contracts that qualify for hedge accounting, the effective
portion of the unrealized gain or loss is deferred and reported as a component of AOCL. When the hedged forecasted transaction (purchase) occurs, the unrealized gain or loss is reclassified into income in the same line item associated with the hedged transaction in the same period or periods during which the hedged transaction affects income. The ineffective portion of the hedge, if any, is recognized in current income in the period in which the ineffectiveness occurs. As of December 31, 2009,2012, we expect to reclassify an unrealized net gainloss of $5less than $1 million from AOCL to income over the next year. For the year ended December 31, 2009, we discontinued hedge accounting on certain contracts where the forecasted transactions were no longer probable. The amount reclassified to income as a result of this action was a loss of $4 million. Our internal policy allows for managing these cash flow hedges for up to three years.
As of December 31, 2009,2012, the potential gain or loss related to the outstanding commodity swap contracts, assuming a hypothetical 10 percent fluctuation in the price of such commodities, was $10$11 million. The sensitivity analysis of the effects of changes in commodity prices assumes the notional value to remain constant for the next 12 months. The analysis ignores the impact of commodity price movements on our competitive position and potential changes in sales levels. It should be noted that any change in the value of the swap contracts, real or hypothetical, would be significantly offset by an inverse change in the value of the underlying hedged items (see Note 20,21, "DERIVATIVES," to theConsolidated Financial Statements).
ItemITEM 8. Financial Statements and Supplementary Data
| NOTE 1 | SUMMARY OF SIGNIFICANT ACCOUNTING POLICIES | |
| NOTE 2 | ||
| NOTE 3 | ||
| NOTE 4 | INCOME TAXES | |
| NOTE 5 | MARKETABLE SECURITIES | |
| NOTE 6 | FAIR VALUE OF FINANCIAL INSTRUMENTS | |
| NOTE 7 | INVENTORIES | |
| NOTE 8 | PROPERTY, PLANT AND EQUIPMENT | |
| NOTE 9 | GOODWILL AND OTHER INTANGIBLE ASSETS | |
| NOTE 10 | DEBT | |
| NOTE 11 | PRODUCT WARRANTY LIABILITY | |
| NOTE 12 | PENSION AND OTHER POSTRETIREMENT BENEFITS | |
| NOTE 13 | OTHER LIABILITIES AND DEFERRED REVENUE | |
| NOTE 14 | COMMITMENTS AND CONTINGENCIES | |
| NOTE 15 | ||
| NOTE 16 | OTHER COMPREHENSIVE INCOME (LOSS) | |
| NOTE 17 | STOCK INCENTIVE AND STOCK OPTION PLANS | |
| NOTE 18 | NONCONTROLLING INTERESTS | |
| NOTE 19 | ||
| NOTE 20 | ||
| NOTE 21 | ||
| NOTE 22 | ||
| OPERATING SEGMENTS |
MANAGEMENT'S REPORT TO SHAREHOLDERS
Management's Report on Financial Statements and Practices
The accompanyingConsolidated Financial Statements of our CompanyCummins Inc. were prepared by management, which is responsible for their integrity and objectivity. The statements were prepared in accordance with generally accepted accounting principles and include amounts that are based on management's best judgments and estimates. The other financial information included in the annual report is consistent with that in the financial statements.
Management also recognizes its responsibility for conducting our affairs according to the highest standards of personal and corporate conduct. This responsibility is characterized and reflected in key policy statements issued from time to time regarding, among other things, conduct of its business activities within the laws of the host countries in which we operate, within The Foreign Corrupt Practices Act and potentially conflicting interests of its employees. We maintain a systematic program to assess compliance with these policies.
To comply with the requirements of Section 404 of the Sarbanes-Oxley Act of 2002, we designed and implemented a structured and comprehensive compliance process to evaluate our internal control over financial reporting across the enterprise.
Management's Report on Internal Control Over Financial Reporting
ManagementThe management of Cummins Inc. is responsible for establishing and maintaining adequate internal control over financial reporting. The Company's internalInternal control over financial reporting is a process designed to provide reasonable assurance regarding the reliability of financial reporting and preparation of the Company'sourConsolidated Financial Statements for external purposes in accordance with accounting principles generally accepted in the United States of America.
Management assessed the effectiveness of our internal control over financial reporting and concluded it was effective as of December 31, 2009.2012. In making its assessment, management utilized the criteria set forth by the Committee of Sponsoring Organizations of the Treadway Commission in Internal Control—Integrated Framework.
The effectiveness of the Company'sour internal control over financial reporting as of December 31, 2009,2012, has been audited by PricewaterhouseCoopers LLP, an independent registered public accounting firm, as stated in their report which appears herein.
Please refer to Exhibits 31(a) and 31(b) attached to this report for certifications required under Section 302 of the Sarbanes-Oxley Act of 2002.
| /s/ Chairman and Chief Executive Officer | /s/ PATRICK J. WARD Vice President and Chief Financial Officer |
Report of Independent Registered Public Accounting Firm
To the Board of Directors and Shareholders of Cummins Inc.:
In our opinion, the accompanying consolidated financial statements listed in the accompanying index present fairly, in all material respects, the financial position of Cummins Inc. and its subsidiaries at December 31, 20092012 and 2008,2011, and the results of their operations and their cash flows for each of the three years in the period ended December 31, 20092012 in conformity with accounting principles generally accepted in the United States of America. Also in our opinion, the Company maintained, in all material respects, effective internal control over financial reporting as of December 31, 2009,2012, based on criteria established inInternal Control—Integrated Framework issued by the Committee of Sponsoring Organizations of the Treadway Commission (COSO). The Company's management is responsible for these financial statements, for maintaining effective internal control over financial reporting and for its assessment of the effectiveness of internal control over financial reporting, included in the accompanying "Management's Report on Internal Control overOver Financial Reporting".Reporting." Our responsibility is to express opinions on these financial statements and on the Company's internal control over financial reporting based on our integrated audits. We conducted our audits in accordance with the standards of the Public Company Accounting Oversight Board (United States). Those standards require that we plan and perform the audits to obtain reasonable assurance about whether the financial statements are free of material misstatement and whether effective internal control over financial reporting was maintained in all material respects. Our audits of the financial statements included examining, on a test basis, evidence supporting the amounts and disclosures in the financial statements, assessing the accounting principles used and significant estimates made by management, and evaluating the overall financial statement presentation. Our audit of internal control over financial reporting included obtaining an understanding of internal control over financial reporting, assessing the risk that a material weakness exists, and testing and evaluating the design and operating effectiveness of internal control based on the assessed risk. Our audits also included performing such other procedures as we considered necessary in the circumstances. We believe that our audits provide a reasonable basis for our opinions.
A company's internal control over financial reporting is a process designed to provide reasonable assurance regarding the reliability of financial reporting and the preparation of financial statements for external purposes in accordance with generally accepted accounting principles. A company's internal control over financial reporting includes those policies and procedures that (i) pertain to the maintenance of records that, in reasonable detail, accurately and fairly reflect the transactions and dispositions of the assets of the company; (ii) provide reasonable assurance that transactions are recorded as necessary to permit preparation of financial statements in accordance with generally accepted accounting principles, and that receipts and expenditures of the company are being made only in accordance with authorizations of management and directors of the company; and (iii) provide reasonable assurance regarding prevention or timely detection of unauthorized acquisition, use, or disposition of the company's assets that could have a material effect on the financial statements.
Because of its inherent limitations, internal control over financial reporting may not prevent or detect misstatements. Also, projections of any evaluation of effectiveness to future periods are subject to the risk that controls may become inadequate because of changes in conditions, or that the degree of compliance with the policies or procedures may deteriorate.
/s/ PricewaterhouseCoopers LLP
Indianapolis, Indiana
February 25, 201020, 2013
CUMMINS INC. AND SUBSIDIARIES
CONSOLIDATED STATEMENTS OF INCOME
| | Years ended December 31, | |||||||||
|---|---|---|---|---|---|---|---|---|---|---|
| In millions, except per share amounts | 2012 | 2011 | 2010 | |||||||
NET SALES(a) | $ | 17,334 | $ | 18,048 | $ | 13,226 | ||||
Cost of sales | 12,826 | 13,459 | 10,058 | |||||||
GROSS MARGIN | 4,508 | 4,589 | 3,168 | |||||||
OPERATING EXPENSES AND INCOME | ||||||||||
Selling, general and administrative expenses | 1,900 | 1,837 | 1,487 | |||||||
Research, development and engineering expenses (Note 1) | 728 | 629 | 414 | |||||||
Equity, royalty and interest income from investees (Note 3) | 384 | 416 | 351 | |||||||
Gain on sale of businesses (Note 2) | 6 | 121 | — | |||||||
Other operating income (expense), net | (16 | ) | 21 | (16 | ) | |||||
OPERATING INCOME | 2,254 | 2,681 | 1,602 | |||||||
Interest income | 25 | 34 | 21 | |||||||
Interest expense (Note 10) | 32 | 44 | 40 | |||||||
Other income (expense), net | 24 | — | 34 | |||||||
INCOME BEFORE INCOME TAXES | 2,271 | 2,671 | 1,617 | |||||||
Income tax expense (Note 4) | 533 | 725 | 477 | |||||||
CONSOLIDATED NET INCOME | 1,738 | 1,946 | 1,140 | |||||||
Less: Net income attributable to noncontrolling interests | 93 | 98 | 100 | |||||||
NET INCOME ATTRIBUTABLE TO CUMMINS INC. | $ | 1,645 | $ | 1,848 | $ | 1,040 | ||||
EARNINGS PER COMMON SHARE ATTRIBUTABLE TO CUMMINS INC. (Note 20) | ||||||||||
Basic | $ | 8.69 | $ | 9.58 | $ | 5.29 | ||||
Diluted | $ | 8.67 | $ | 9.55 | $ | 5.28 | ||||
| | Years ended December 31, | ||||||||||
|---|---|---|---|---|---|---|---|---|---|---|---|
| In millions, except per share amounts | 2009 | 2008 | 2007 | ||||||||
NET SALES(a) | $ | 10,800 | $ | 14,342 | $ | 13,048 | |||||
Cost of sales | 8,631 | 11,402 | 10,492 | ||||||||
GROSS MARGIN | 2,169 | 2,940 | 2,556 | ||||||||
OPERATING EXPENSES AND INCOME | |||||||||||
Selling, general and administrative expenses | 1,239 | 1,450 | 1,296 | ||||||||
Research, development and engineering expenses | 362 | 422 | 329 | ||||||||
Equity, royalty and interest income from investees (Note��2) | 214 | 253 | 205 | ||||||||
Restructuring and other charges (Note 3) | 99 | 37 | — | ||||||||
Other operating (expense) income, net | (1 | ) | (12 | ) | 22 | ||||||
OPERATING INCOME | 682 | 1,272 | 1,158 | ||||||||
Interest income | 8 | 18 | 36 | ||||||||
Interest expense (Note 10) | 35 | 42 | 58 | ||||||||
Other (expense) income, net (Note 24) | (15 | ) | (70 | ) | 33 | ||||||
INCOME BEFORE INCOME TAXES | 640 | 1,178 | 1,169 | ||||||||
Income tax expense (Note 4) | 156 | 360 | 381 | ||||||||
NET INCOME | 484 | 818 | 788 | ||||||||
Less: Net income attributable to noncontrolling interests | 56 | 63 | 49 | ||||||||
NET INCOME ATTRIBUTABLE TO CUMMINS INC. | $ | 428 | $ | 755 | $ | 739 | |||||
EARNINGS PER COMMON SHARE ATTRIBUTABLE TO CUMMINS INC. (Note 19) | |||||||||||
Basic | $ | 2.17 | $ | 3.87 | $ | 3.72 | |||||
Diluted | $ | 2.16 | $ | 3.84 | $ | 3.70 | |||||
The accompanying notes are an integral part of our Consolidated Financial Statements.
CUMMINS INC. AND SUBSIDIARIES
CONSOLIDATED STATEMENTS OF COMPREHENSIVE INCOME
| | Years ended December 31, | |||||||||
|---|---|---|---|---|---|---|---|---|---|---|
| In millions | 2012 | 2011 | 2010 | |||||||
CONSOLIDATED NET INCOME | $ | 1,738 | $ | 1,946 | $ | 1,140 | ||||
Other comprehensive income (loss), net of tax | ||||||||||
Foreign currency translation adjustments | 29 | (147 | ) | 37 | ||||||
Change in pension and other postretirement defined benefit plans (Note 12) | (70 | ) | (78 | ) | 142 | |||||
Unrealized gain (loss) on derivatives (Note 21) | 20 | (32 | ) | 4 | ||||||
Unrealized gain (loss) on marketable securities (Note 5) | 2 | 1 | 4 | |||||||
Total other comprehensive income (loss), net of tax | (19 | ) | (256 | ) | 187 | |||||
COMPREHENSIVE INCOME | 1,719 | 1,690 | 1,327 | |||||||
Less: Comprehensive income attributable to noncontrolling interest | 86 | 60 | 112 | |||||||
COMPREHENSIVE INCOME ATTRIBUTABLE TO CUMMINS INC. | $ | 1,633 | $ | 1,630 | $ | 1,215 | ||||
The accompanying notes are an integral part of our Consolidated Financial Statements.
CUMMINS INC. AND SUBSIDIARIES
CONSOLIDATED BALANCE SHEETS
| | | December 31, | December 31, | ||||||||||||||||
|---|---|---|---|---|---|---|---|---|---|---|---|---|---|---|---|---|---|---|---|
| In millions | 2009 | 2008 | |||||||||||||||||
| In millions, except par value | 2012 | 2011 | |||||||||||||||||
ASSETS | ASSETS | ||||||||||||||||||
Current assets | Current assets | ||||||||||||||||||
Cash and cash equivalents | $ | 1,369 | $ | 1,484 | |||||||||||||||
Marketable securities (Note 5) | 247 | 277 | |||||||||||||||||
Cash and cash equivalents | $ | 930 | $ | 426 | |||||||||||||||
Total cash, cash equivalents and marketable securities | 1,616 | 1,761 | |||||||||||||||||
Accounts and notes receivable, net | |||||||||||||||||||
Trade and other | 2,235 | 2,252 | |||||||||||||||||
Nonconsolidated equity investees | 240 | 274 | |||||||||||||||||
Inventories (Note 7) | 2,221 | 2,141 | |||||||||||||||||
Prepaid expenses and other current assets | 855 | 663 | |||||||||||||||||
Marketable securities (Note 5) | 190 | 77 | |||||||||||||||||
Accounts and notes receivable, net | |||||||||||||||||||
Trade and other | 1,730 | 1,551 | |||||||||||||||||
Nonconsolidated equity investees | 274 | 231 | |||||||||||||||||
Inventories (Note 7) | 1,341 | 1,783 | |||||||||||||||||
Deferred income taxes (Note 4) | 295 | 347 | |||||||||||||||||
Prepaid expenses and other current assets | 243 | 298 | |||||||||||||||||
Total current assets | 7,167 | 7,091 | |||||||||||||||||
Total current assets | 5,003 | 4,713 | |||||||||||||||||
Long-term assets | Long-term assets | ||||||||||||||||||
Property, plant and equipment, net (Note 8) | 2,724 | 2,288 | |||||||||||||||||
Investments and advances related to equity method investees (Note 3) | 897 | 838 | |||||||||||||||||
Goodwill (Note 9) | 445 | 339 | |||||||||||||||||
Other intangible assets, net (Note 9) | 369 | 227 | |||||||||||||||||
Other assets | 946 | 885 | |||||||||||||||||
Property, plant and equipment, net (Note 8) | 1,886 | 1,841 | |||||||||||||||||
Investments and advances related to equity method investees (Note 2) | 574 | 588 | |||||||||||||||||
Goodwill (Note 9) | 364 | 362 | |||||||||||||||||
Other intangible assets, net (Note 9) | 228 | 223 | |||||||||||||||||
Deferred income taxes (Note 4) | 436 | 491 | |||||||||||||||||
Other assets | 325 | 301 | |||||||||||||||||
Total assets | $ | 8,816 | $ | 8,519 | |||||||||||||||
Total assets | $ | 12,548 | $ | 11,668 | |||||||||||||||
LIABILITIES | LIABILITIES | ||||||||||||||||||
Current liabilities | Current liabilities | ||||||||||||||||||
Loans payable (Note 10) | $ | 16 | $ | 28 | |||||||||||||||
Accounts payable (principally trade) | 1,339 | 1,546 | |||||||||||||||||
Current maturities of long-term debt (Note 10) | 61 | 97 | |||||||||||||||||
Current portion of accrued product warranty (Note 11) | 386 | 422 | |||||||||||||||||
Accrued compensation, benefits and retirement costs | 400 | 511 | |||||||||||||||||
Deferred revenue | 215 | 208 | |||||||||||||||||
Taxes payable (including taxes on income) | 173 | 282 | |||||||||||||||||
Other accrued expenses | 546 | 563 | |||||||||||||||||
Loans payable (Note 10) | $ | 37 | $ | 39 | |||||||||||||||
Accounts payable (principally trade) | 957 | 1,009 | |||||||||||||||||
Current portion of accrued product warranty (Note 11) | 426 | 427 | |||||||||||||||||
Accrued compensation, benefits and retirement costs | 366 | 364 | |||||||||||||||||
Deferred revenue | 128 | 122 | |||||||||||||||||
Taxes payable (including taxes on income) | 94 | 179 | |||||||||||||||||
Other accrued expenses | 424 | 499 | |||||||||||||||||
Total current liabilities | 3,136 | 3,657 | |||||||||||||||||
Total current liabilities | 2,432 | 2,639 | |||||||||||||||||
Long-term liabilities | Long-term liabilities | ||||||||||||||||||
Long-term debt (Note 10) | 698 | 658 | |||||||||||||||||
Postretirement benefits other than pensions (Note 12) | 432 | 432 | |||||||||||||||||
Other liabilities and deferred revenue (Note 13) | 1,308 | 1,090 | |||||||||||||||||
Long-term debt (Note 10) | 637 | 629 | |||||||||||||||||
Pensions (Note 12) | 514 | 574 | |||||||||||||||||
Postretirement benefits other than pensions (Note 12) | 453 | 452 | |||||||||||||||||
Other liabilities and deferred revenue (Note 13) | 760 | 745 | |||||||||||||||||
Total liabilities | 4,796 | 5,039 | |||||||||||||||||
Total liabilities | 5,574 | 5,837 | |||||||||||||||||
Commitments and contingencies (Note 14) | Commitments and contingencies (Note 14) | — | — | — | — | ||||||||||||||
EQUITY | EQUITY | ||||||||||||||||||
Cummins Inc. shareholders' equity (Note 15) | |||||||||||||||||||
Common stock, $2.50 par value, 500 shares authorized, 222.4 and 222.2 shares issued | 2,058 | 2,001 | |||||||||||||||||
Retained earnings | 7,343 | 6,038 | |||||||||||||||||
Treasury stock, at cost, 32.6 and 30.2 shares | (1,830 | ) | (1,587 | ) | |||||||||||||||
Common stock held by employee benefits trust, at cost, 1.5 and 1.8 shares | (18 | ) | (22 | ) | |||||||||||||||
Accumulated other comprehensive loss | |||||||||||||||||||
Defined benefit postretirement plans | (794 | ) | (724 | ) | |||||||||||||||
Other | (156 | ) | (214 | ) | |||||||||||||||
Cummins Inc. shareholders' equity (Note 15) | |||||||||||||||||||
Total accumulated other comprehensive loss | (950 | ) | (938 | ) | |||||||||||||||
Common stock, $2.50 par value, 500 shares authorized, 222.0 and 221.7 shares issued | 1,861 | 1,793 | |||||||||||||||||
Total Cummins Inc. shareholders' equity | 6,603 | 5,492 | |||||||||||||||||
Noncontrolling interests (Note 18) | 371 | 339 | |||||||||||||||||
Retained earnings | 3,575 | 3,288 | |||||||||||||||||
Total equity | 6,974 | 5,831 | |||||||||||||||||
Treasury stock, at cost, 20.7 and 20.4 shares | (731 | ) | (715 | ) | |||||||||||||||
Total liabilities and equity | $ | 12,548 | $ | 11,668 | |||||||||||||||
Common stock held by employee benefits trust, at cost, 3.0 and 5.1 shares | (36 | ) | (61 | ) | |||||||||||||||
Unearned compensation | (1 | ) | (5 | ) | |||||||||||||||
Accumulated other comprehensive loss | |||||||||||||||||||
Defined benefit postretirement plans | (788 | ) | (798 | ) | |||||||||||||||
Other | (107 | ) | (268 | ) | |||||||||||||||
Total accumulated other comprehensive loss | (895 | ) | (1,066 | ) | |||||||||||||||
Total Cummins Inc. shareholders' equity | 3,773 | 3,234 | |||||||||||||||||
Noncontrolling interests (Note 18) | 247 | 246 | |||||||||||||||||
Total equity | 4,020 | 3,480 | |||||||||||||||||
Total liabilities and equity | $ | 8,816 | $ | 8,519 | |||||||||||||||
The accompanying notes are an integral part of our Consolidated Financial Statements.
CUMMINS INC. AND SUBSIDIARIES
CONSOLIDATED STATEMENTS OF CASH FLOWS
| | | Years ended December 31, | Years ended December 31, | |||||||||||||||||||
|---|---|---|---|---|---|---|---|---|---|---|---|---|---|---|---|---|---|---|---|---|---|---|
| In millions | In millions | 2009 | 2008 | 2007 | 2012 | 2011 | 2010 | |||||||||||||||
CASH FLOWS FROM OPERATING ACTIVITIES | CASH FLOWS FROM OPERATING ACTIVITIES | |||||||||||||||||||||
Net income | $ | 484 | $ | 818 | $ | 788 | ||||||||||||||||
Adjustments to reconcile net income to net cash provided by operating activities: | ||||||||||||||||||||||
Restructuring charges, net | 16 | 34 | — | |||||||||||||||||||
Depreciation and amortization | 326 | 314 | 290 | |||||||||||||||||||
Loss on investments | — | 45 | — | |||||||||||||||||||
Deferred income tax provision (benefit) | 5 | (1 | ) | 60 | ||||||||||||||||||
Equity in income of investees, net of dividends | 23 | (45 | ) | (75 | ) | |||||||||||||||||
Pension expense, net of pension contributions | (36 | ) | (31 | ) | (152 | ) | ||||||||||||||||
Other post-retirement benefits expense, net of cash payments | (24 | ) | (35 | ) | (28 | ) | ||||||||||||||||
Stock-based compensation expense | 20 | 28 | 28 | |||||||||||||||||||
Excess tax deficiencies (benefits) on stock-based awards | 1 | (13 | ) | (11 | ) | |||||||||||||||||
Translation and hedging activities | 41 | (10 | ) | (24 | ) | |||||||||||||||||
Changes in current assets and liabilities, net of acquisitions and dispositions (Note 1) | 127 | (267 | ) | (139 | ) | |||||||||||||||||
Changes in long-term liabilities | 155 | 109 | 95 | |||||||||||||||||||
Other, net | (1 | ) | 41 | (22 | ) | |||||||||||||||||
Consolidated net income | $ | 1,738 | $ | 1,946 | $ | 1,140 | ||||||||||||||||
Adjustments to reconcile consolidated net income to net cash provided by operating activities | ||||||||||||||||||||||
Restructuring and other charges, net of cash payments (Note 19) | 27 | — | — | |||||||||||||||||||
Depreciation and amortization | 361 | 325 | 320 | |||||||||||||||||||
Gain on sale of businesses (Note 2) | (6 | ) | (121 | ) | — | |||||||||||||||||
Gain on sale of equity investment | (13 | ) | — | — | ||||||||||||||||||
Gain on fair value adjustment for consolidated investee (Note 2) | (7 | ) | — | (12 | ) | |||||||||||||||||
Deferred income taxes (Note 4) | 116 | 85 | 56 | |||||||||||||||||||
Equity in income of investees, net of dividends | (15 | ) | (23 | ) | (147 | ) | ||||||||||||||||
Pension contributions in excess of expense (Note 12) | (68 | ) | (131 | ) | (151 | ) | ||||||||||||||||
Other post-retirement benefits payments in excess of expense (Note 12) | (21 | ) | (31 | ) | (35 | ) | ||||||||||||||||
Stock-based compensation expense | 36 | 42 | 22 | |||||||||||||||||||
Excess tax benefits on stock-based awards | (14 | ) | (5 | ) | (10 | ) | ||||||||||||||||
Translation and hedging activities | — | 4 | 13 | |||||||||||||||||||
Changes in current assets and liabilities, net of acquisitions and divestitures (Note 1) | (775 | ) | (154 | ) | (245 | ) | ||||||||||||||||
Changes in other liabilities and deferred revenue | 214 | 139 | 133 | |||||||||||||||||||
Other, net | (41 | ) | (3 | ) | (78 | ) | ||||||||||||||||
Net cash provided by operating activities | Net cash provided by operating activities | 1,137 | 987 | 810 | 1,532 | 2,073 | 1,006 | |||||||||||||||
CASH FLOWS FROM INVESTING ACTIVITIES | CASH FLOWS FROM INVESTING ACTIVITIES | |||||||||||||||||||||
Capital expenditures | (310 | ) | (543 | ) | (353 | ) | ||||||||||||||||
Investments in internal use software | (35 | ) | (82 | ) | (67 | ) | ||||||||||||||||
Proceeds from disposals of property, plant and equipment | 10 | 29 | 44 | |||||||||||||||||||
Investments in and advances to equity investees | (3 | ) | (89 | ) | (66 | ) | ||||||||||||||||
Acquisitions of businesses, net of cash acquired | (2 | ) | (142 | ) | (20 | ) | ||||||||||||||||
Proceeds from the sale of businesses | — | 64 | 35 | |||||||||||||||||||
Investments in marketable securities—acquisitions | (431 | ) | (390 | ) | (405 | ) | ||||||||||||||||
Investments in marketable securities—liquidations | 335 | 409 | 395 | |||||||||||||||||||
Cash flows from derivatives not designated as hedges | (18 | ) | (53 | ) | (14 | ) | ||||||||||||||||
Purchase of other investments | (62 | ) | (62 | ) | (57 | ) | ||||||||||||||||
Other, net | 7 | 11 | (7 | ) | ||||||||||||||||||
Capital expenditures | (690 | ) | (622 | ) | (364 | ) | ||||||||||||||||
Investments in internal use software | (87 | ) | (60 | ) | (43 | ) | ||||||||||||||||
Proceeds from disposals of property, plant and equipment | 11 | 8 | 55 | |||||||||||||||||||
Investments in and advances to equity investees | (70 | ) | (81 | ) | (2 | ) | ||||||||||||||||
Acquisition of businesses, net of cash acquired (Note 2) | (215 | ) | — | (104 | ) | |||||||||||||||||
Proceeds from sale of businesses, net of cash sold (Note 2) | 10 | 199 | — | |||||||||||||||||||
Investments in marketable securities-acquisitions (Note 5) | (561 | ) | (729 | ) | (823 | ) | ||||||||||||||||
Investments in marketable securities-liquidations (Note 5) | 585 | 750 | 690 | |||||||||||||||||||
Proceeds from sale of equity investment | 23 | — | — | |||||||||||||||||||
Purchases of other investments | — | — | (62 | ) | ||||||||||||||||||
Cash flows from derivatives not designated as hedges | 12 | (18 | ) | 2 | ||||||||||||||||||
Other, net | — | 1 | — | |||||||||||||||||||
Net cash used in investing activities | Net cash used in investing activities | (509 | ) | (848 | ) | (515 | ) | (982 | ) | (552 | ) | (651 | ) | |||||||||
CASH FLOWS FROM FINANCING ACTIVITIES | CASH FLOWS FROM FINANCING ACTIVITIES | |||||||||||||||||||||
Proceeds from borrowings | 76 | 76 | 15 | |||||||||||||||||||
Payments on borrowings and capital lease obligations | (97 | ) | (152 | ) | (144 | ) | ||||||||||||||||
Net (payments) borrowings under short-term credit agreements | (2 | ) | 33 | (12 | ) | |||||||||||||||||
Distributions to noncontrolling interests | (34 | ) | (24 | ) | (18 | ) | ||||||||||||||||
Dividend payments on common stock | (141 | ) | (122 | ) | (89 | ) | ||||||||||||||||
Proceeds from sale of common stock held by employee benefits trust | 72 | 63 | 13 | |||||||||||||||||||
Repurchases of common stock | (20 | ) | (128 | ) | (335 | ) | ||||||||||||||||
Excess tax (deficiencies) benefits on stock-based awards | (1 | ) | 13 | 11 | ||||||||||||||||||
Other, net | 6 | 4 | (17 | ) | ||||||||||||||||||
Proceeds from borrowings | 64 | 127 | 214 | |||||||||||||||||||
Payments on borrowings and capital lease obligations | (145 | ) | (237 | ) | (143 | ) | ||||||||||||||||
Net borrowings under short-term credit agreements | 11 | 6 | 9 | |||||||||||||||||||
Distributions to noncontrolling interests | (62 | ) | (56 | ) | (28 | ) | ||||||||||||||||
Dividend payments on common stock (Note 15) | (340 | ) | (255 | ) | (172 | ) | ||||||||||||||||
Repurchases of common stock (Note 15) | (256 | ) | (629 | ) | (241 | ) | ||||||||||||||||
Proceeds from sale of common stock held by employee benefit trust (Note 15) | — | — | 58 | |||||||||||||||||||
Excess tax benefits on stock-based awards | 14 | 5 | 10 | |||||||||||||||||||
Other, net | 20 | 14 | 26 | |||||||||||||||||||
Net cash used in financing activities | Net cash used in financing activities | (141 | ) | (237 | ) | (576 | ) | (694 | ) | (1,025 | ) | (267 | ) | |||||||||
EFFECT OF EXCHANGE RATE CHANGES ON CASH AND CASH EQUIVALENTS | EFFECT OF EXCHANGE RATE CHANGES ON CASH AND CASH EQUIVALENTS | 17 | (53 | ) | 18 | 29 | (35 | ) | 5 | |||||||||||||
Net increase (decrease) in cash and cash equivalents | Net increase (decrease) in cash and cash equivalents | 504 | (151 | ) | (263 | ) | (115 | ) | 461 | 93 | ||||||||||||
Cash and cash equivalents at beginning of year | Cash and cash equivalents at beginning of year | 426 | 577 | 840 | 1,484 | 1,023 | 930 | |||||||||||||||
CASH AND CASH EQUIVALENTS AT END OF YEAR | $ | 930 | $ | 426 | $ | 577 | ||||||||||||||||
CASH AND CASH EQUIVALENTS AT END OF PERIOD | $ | 1,369 | $ | 1,484 | $ | 1,023 | ||||||||||||||||
The accompanying notes are an integral part of our Consolidated Financial Statements.
CUMMINS INC. AND SUBSIDIARIES
CONSOLIDATED STATEMENTS OF CHANGES IN EQUITY
| In millions | Common Stock | Additional paid-in Capital | Retained Earnings | Accumulated Other Comprehensive Loss | Treasury Stock | Common Stock Held in Trust | Unearned Compensation | Total Cummins Inc. Shareholders' Equity | Noncontrolling Interests | Total Equity | |||||||||||||||||||||
|---|---|---|---|---|---|---|---|---|---|---|---|---|---|---|---|---|---|---|---|---|---|---|---|---|---|---|---|---|---|---|---|
BALANCE AT DECEMBER 31, 2009 | $ | 555 | $ | 1,306 | $ | 3,575 | $ | (895 | ) | $ | (731 | ) | $ | (36 | ) | $ | (1 | ) | $ | 3,773 | $ | 247 | $ | 4,020 | |||||||
Net income | 1,040 | 1,040 | 100 | 1,140 | |||||||||||||||||||||||||||
Other comprehensive income (loss) | 175 | 175 | 12 | 187 | |||||||||||||||||||||||||||
Issuance of shares | 7 | 7 | — | 7 | |||||||||||||||||||||||||||
Employee benefits trust activity | 68 | 11 | 79 | — | 79 | ||||||||||||||||||||||||||
Acquisition of shares | (241 | ) | (241 | ) | — | (241 | ) | ||||||||||||||||||||||||
Cash dividends on common stock | (172 | ) | (172 | ) | — | (172 | ) | ||||||||||||||||||||||||
Distribution to noncontrolling interests | — | (29 | ) | (29 | ) | ||||||||||||||||||||||||||
Stock option exercises | 8 | 8 | — | 8 | |||||||||||||||||||||||||||
Deconsolidation of variable interest entity (Note 3) | — | (11 | ) | (11 | ) | ||||||||||||||||||||||||||
Other shareholder transactions | (1 | ) | (1 | ) | 2 | 1 | 1 | 7 | 8 | ||||||||||||||||||||||
BALANCE AT DECEMBER 31, 2010 | $ | 554 | $ | 1,380 | $ | 4,445 | $ | (720 | ) | $ | (964 | ) | $ | (25 | ) | $ | — | $ | 4,670 | $ | 326 | $ | 4,996 | ||||||||
Net income | 1,848 | 1,848 | 98 | 1,946 | |||||||||||||||||||||||||||
Other comprehensive income (loss) | (218 | ) | (218 | ) | (38 | ) | (256 | ) | |||||||||||||||||||||||
Issuance of shares | 1 | 13 | 14 | — | 14 | ||||||||||||||||||||||||||
Employee benefits trust activity | 25 | 3 | 28 | — | 28 | ||||||||||||||||||||||||||
Acquisition of shares | (629 | ) | (629 | ) | — | (629 | ) | ||||||||||||||||||||||||
Cash dividends on common stock | (255 | ) | (255 | ) | — | (255 | ) | ||||||||||||||||||||||||
Distribution to noncontrolling interests | — | (56 | ) | (56 | ) | ||||||||||||||||||||||||||
Stock option exercises | 6 | 6 | — | 6 | |||||||||||||||||||||||||||
Other shareholder transactions | 28 | 28 | 9 | 37 | |||||||||||||||||||||||||||
BALANCE AT DECEMBER 31, 2011 | $ | 555 | $ | 1,446 | $ | 6,038 | $ | (938 | ) | $ | (1,587 | ) | $ | (22 | ) | $ | — | $ | 5,492 | $ | 339 | $ | 5,831 | ||||||||
Net income | 1,645 | 1,645 | 93 | 1,738 | |||||||||||||||||||||||||||
Other comprehensive income (loss) | (12 | ) | (12 | ) | (7 | ) | (19 | ) | |||||||||||||||||||||||
Issuance of shares | 1 | 6 | 7 | — | 7 | ||||||||||||||||||||||||||
Employee benefits trust activity | 27 | 4 | 31 | — | 31 | ||||||||||||||||||||||||||
Acquisition of shares | (256 | ) | (256 | ) | — | (256 | ) | ||||||||||||||||||||||||
Cash dividends on common stock | (340 | ) | (340 | ) | — | (340 | ) | ||||||||||||||||||||||||
Distribution to noncontrolling interests | — | (76 | ) | (76 | ) | ||||||||||||||||||||||||||
Stock option exercises | 13 | 13 | — | 13 | |||||||||||||||||||||||||||
Other shareholder transactions | 23 | 23 | 22 | 45 | |||||||||||||||||||||||||||
BALANCE AT DECEMBER 31, 2012 | $ | 556 | $ | 1,502 | $ | 7,343 | $ | (950 | )(1) | $ | (1,830 | ) | $ | (18 | ) | $ | — | $ | 6,603 | $ | 371 | $ | 6,974 | ||||||||
| In millions | Common Stock | Additional paid-in Capital | Retained Earnings | Accumulated Other Comprehensive Loss | Treasury Stock | Common Stock Held in Trust | Unearned Compensation | Total Cummins Inc. Shareholders' Equity | Noncontrolling Interests | Total Equity | |||||||||||||||||||||||
|---|---|---|---|---|---|---|---|---|---|---|---|---|---|---|---|---|---|---|---|---|---|---|---|---|---|---|---|---|---|---|---|---|---|
BALANCE AT DECEMBER 31, 2006 | $ | 137 | $ | 1,500 | $ | 2,009 | $ | (525 | ) | $ | (212 | ) | $ | (92 | ) | $ | (14 | ) | $ | 2,803 | $ | 253 | $ | 3,056 | |||||||||
Comprehensive income: | |||||||||||||||||||||||||||||||||
Net income | 739 | 739 | 49 | 788 | |||||||||||||||||||||||||||||
Other comprehensive income (loss): | |||||||||||||||||||||||||||||||||
Unrealized gain on marketable securities | 1 | 1 | 3 | 4 | |||||||||||||||||||||||||||||
Unrealized loss on derivatives | (5 | ) | (5 | ) | — | (5 | ) | ||||||||||||||||||||||||||
Foreign currency translation adjustments | 110 | 110 | 15 | 125 | |||||||||||||||||||||||||||||
Change in pensions and other postretirement defined benefit plans | 133 | 133 | — | 133 | |||||||||||||||||||||||||||||
Total comprehensive income | 978 | 67 | 1,045 | ||||||||||||||||||||||||||||||
Issuance of shares | 1 | 8 | 6 | 15 | — | 15 | |||||||||||||||||||||||||||
Stock splits | 413 | (413 | ) | — | — | — | |||||||||||||||||||||||||||
Employee benefits trust activity | 52 | (52 | ) | 13 | 13 | — | 13 | ||||||||||||||||||||||||||
Acquisition of shares | (335 | ) | (335 | ) | — | (335 | ) | ||||||||||||||||||||||||||
Reduction of noncontrolling interests | — | (11 | ) | (11 | ) | ||||||||||||||||||||||||||||
Cash dividends on common stock | (89 | ) | (89 | ) | — | (89 | ) | ||||||||||||||||||||||||||
Distributions to noncontrolling interests | — | (18 | ) | (18 | ) | ||||||||||||||||||||||||||||
Stock option exercises | 1 | 1 | — | 1 | |||||||||||||||||||||||||||||
Other shareholder transactions | 20 | 1 | 3 | 24 | 1 | 25 | |||||||||||||||||||||||||||
BALANCE AT DECEMBER 31, 2007 | $ | 551 | $ | 1,168 | $ | 2,660 | $ | (286 | ) | $ | (593 | ) | $ | (79 | ) | $ | (11 | ) | $ | 3,410 | $ | 292 | $ | 3,702 | |||||||||
Comprehensive income: | |||||||||||||||||||||||||||||||||
Net income | 755 | 755 | 63 | 818 | |||||||||||||||||||||||||||||
Other comprehensive income (loss): | |||||||||||||||||||||||||||||||||
Unrealized loss on marketable securities | (1 | ) | (1 | ) | (2 | ) | (3 | ) | |||||||||||||||||||||||||
Unrealized loss on derivatives | (70 | ) | (70 | ) | — | (70 | ) | ||||||||||||||||||||||||||
Foreign currency translation adjustments | (289 | ) | (289 | ) | (34 | ) | (323 | ) | |||||||||||||||||||||||||
Change in pensions and other postretirement defined benefit plans | (418 | ) | (418 | ) | — | (418 | ) | ||||||||||||||||||||||||||
Total comprehensive income | (23 | ) | 27 | 4 | |||||||||||||||||||||||||||||
Effect of changing pension plan measurement date | (5 | ) | (2 | ) | (7 | ) | — | (7 | ) | ||||||||||||||||||||||||
Issuance of shares | 3 | 4 | 7 | 9 | 16 | ||||||||||||||||||||||||||||
Employee benefits trust activity | 46 | 18 | 64 | — | 64 | ||||||||||||||||||||||||||||
Acquisition of shares | (128 | ) | (128 | ) | — | (128 | ) | ||||||||||||||||||||||||||
Reduction of noncontrolling interests | — | (54 | ) | (54 | ) | ||||||||||||||||||||||||||||
Cash dividends on common stock | (122 | ) | (122 | ) | — | (122 | ) | ||||||||||||||||||||||||||
Distributions to noncontrolling interests | — | (24 | ) | (24 | ) | ||||||||||||||||||||||||||||
Stock option exercises | (1 | ) | 6 | 5 | — | 5 | |||||||||||||||||||||||||||
Other shareholder transactions | 22 | 6 | 28 | (4 | ) | 24 | |||||||||||||||||||||||||||
BALANCE AT DECEMBER 31, 2008 | $ | 554 | $ | 1,239 | $ | 3,288 | $ | (1,066 | ) | $ | (715 | ) | $ | (61 | ) | $ | (5 | ) | $ | 3,234 | $ | 246 | $ | 3,480 | |||||||||
CUMMINS INC. AND SUBSIDIARIESCONSOLIDATED STATEMENTS OF CHANGES IN EQUITY (Continued)
| In millions | Common Stock | Additional paid-in Capital | Retained Earnings | Accumulated Other Comprehensive Loss | Treasury Stock | Common Stock Held in Trust | Unearned Compensation | Total Cummins Inc. Shareholders' Equity | Noncontrolling Interests | Total Equity | |||||||||||||||||||||||
|---|---|---|---|---|---|---|---|---|---|---|---|---|---|---|---|---|---|---|---|---|---|---|---|---|---|---|---|---|---|---|---|---|---|
BALANCE AT DECEMBER 31, 2008 | $ | 554 | $ | 1,239 | $ | 3,288 | $ | (1,066 | ) | $ | (715 | ) | $ | (61 | ) | $ | (5 | ) | $ | 3,234 | $ | 246 | $ | 3,480 | |||||||||
Comprehensive income: | |||||||||||||||||||||||||||||||||
Net income | 428 | 428 | 56 | 484 | |||||||||||||||||||||||||||||
Other comprehensive income (loss): | |||||||||||||||||||||||||||||||||
Unrealized gain on derivatives | 75 | 75 | — | 75 | |||||||||||||||||||||||||||||
Foreign currency translation adjustments | 86 | 86 | 14 | 100 | |||||||||||||||||||||||||||||
Change in pensions and other postretirement defined benefit plans | 10 | 10 | — | 10 | |||||||||||||||||||||||||||||
Total comprehensive income | 599 | 70 | 669 | ||||||||||||||||||||||||||||||
Issuance of shares | 1 | 6 | 7 | — | 7 | ||||||||||||||||||||||||||||
Employee benefits trust activity | 61 | 25 | 86 | — | 86 | ||||||||||||||||||||||||||||
Acquisition of shares | (20 | ) | (20 | ) | — | (20 | ) | ||||||||||||||||||||||||||
Cash dividends on common stock | (141 | ) | (141 | ) | — | (141 | ) | ||||||||||||||||||||||||||
Distributions to noncontrolling interests | — | (34 | ) | (34 | ) | ||||||||||||||||||||||||||||
Stock option exercises | (2 | ) | 4 | 2 | — | 2 | |||||||||||||||||||||||||||
Conversion to capital lease (Note 14) | — | (35 | ) | (35 | ) | ||||||||||||||||||||||||||||
Other shareholder transactions | 2 | 4 | 6 | — | 6 | ||||||||||||||||||||||||||||
BALANCE AT DECEMBER 31, 2009 | $ | 555 | $ | 1,306 | $ | 3,575 | $ | (895) | (1) | $ | (731 | ) | $ | (36 | ) | $ | (1 | ) | $ | 3,773 | $ | 247 | $ | 4,020 | |||||||||
The accompanying notes are an integral part of our Consolidated Financial StatementsStatements.
CUMMINS INC. AND SUBSIDIARIES
NOTES TO CONSOLIDATED FINANCIAL STATEMENTS
NOTE 1. SUMMARY OF SIGNIFICANT ACCOUNTING POLICIES
Cummins Inc. (Cummins,was founded in 1919 as a corporation in Columbus, Indiana, as one of the Company, we, our, or us) isfirst diesel engine manufacturers. We are a leading global power providerleader that designs, manufactures, distributes and services diesel and natural gas engines electric power generation systems and engine-related component products, including filtration, and emissions solutions,aftertreatment, turbochargers, fuel systems, controls andsystems, air handling systems. We were founded in 1919 as one of the first manufacturers of diesel enginessystems and are headquartered in Columbus, Indiana.electric power generation systems. We sell our products to original equipment manufacturers (OEMs), distributors and other customers worldwide. We serve our customers through a network of more than 500approximately 600 company-owned and independent distributor locations and approximately 5,2006,500 dealer locations in more than 190 countries and territories.
OurConsolidated Financial Statements include the accounts of all wholly-owned and majority-owned domestic and foreign subsidiaries where our ownership is more than 50 percent of common stockoutstanding equity interests except for majority-owned subsidiaries that are considered Variable Interest Entitiesvariable interest entities (VIEs) where we are not deemed the primary beneficiary.to have a controlling financial interest. In addition, we also consolidate, regardless of our ownership percentage, VIEs for which we are deemed to be the primary beneficiary.have a controlling financial interest. Intercompany balances and transactions are eliminated in consolidation. Where our ownership interest is less than 100 percent, the noncontrolling ownership interests are reported in ourConsolidated Balance Sheets. The noncontrolling ownership interest in our income, net of tax, is classified as "net"Net income attributable to noncontrolling interests" in ourConsolidated Statements of Income.
Certain amounts for 20082011 and 20072010 have been reclassified to conform to the current classifications. All share amounts
We have variable interests in several businesses accounted for under the equity method of accounting that are deemed to be VIEs and per share amounts have been adjustedare subject to the provisions of accounting principles generally accepted in the United States of America (GAAP) for variable interest entities. Most of these VIEs are unconsolidated and as such are included in the impactsummary of a two-for-one stock split on April 9, 2007 and an additional two-for-one stock split on January 2, 2008.disclosures in Note 3, "INVESTMENTS IN EQUITY INVESTEES." The VIEs, including the consolidated VIEs, are not material individually or in the aggregate to ourConsolidated Balance Sheets orConsolidated Statements of Income.
Investments in Equity Investees
We use the equity method to account for our investments in joint ventures, affiliated companies and alliances in which we have the ability to exercise significant influence, generally represented by common stockequity ownership or partnership equity of at least 20 percent but not more than 50 percent. Generally, under the equity method, original investments in these entities are recorded at cost and subsequently adjusted by our share of equity in income or losses after the date of acquisition. Investment amounts in excess of our share of an investee's net assets are amortized over the life of the related asset creating the excess. If the excess is goodwill, then it is not amortized. Equity in income or losses of each investee is recorded according to our level of ownership; if losses accumulate, we record our share of losses until our investment has been fully depleted. If our investment has been fully depleted, we recognize additional losses only when we are the primary funding source. We eliminate (to the extent of our ownership percentage) in ourConsolidated Financial Statements the profit in inventory held by our equity method investees that has not yet been sold to a third-party. Our investments are classified
CUMMINS INC. AND SUBSIDIARIES
NOTES TO CONSOLIDATED FINANCIAL STATEMENTS (Continued)
NOTE 1. SUMMARY OF SIGNIFICANT ACCOUNTING POLICIES (Continued)
as "Investments and advances related to equity method investees" in ourConsolidated Balance Sheets. Our share of the results from joint ventures, affiliated companies and alliances is reported in ourConsolidated Statements of Income as "Equity, royalty and interest income from investees," and is reported net of all applicable income taxes.
Our foreign equity investees are presented net of applicable foreign income taxes in ourConsolidated Statements of Income. The vast majority of our U.S.United States (U.S.) equity investees are partnerships
CUMMINS INC. AND SUBSIDIARIES
NOTES TO CONSOLIDATED FINANCIAL STATEMENTS (Continued)
NOTE 1. SUMMARY OF SIGNIFICANT ACCOUNTING POLICIES (Continued)
(non-taxable), thus there is no difference between gross or net of tax presentation as the investees are not taxed.
Use of Estimates in the Preparation of the Financial Statements
Preparation of financial statements in conformity with accounting principles generally accepted in the United States of America (GAAP)GAAP requires management to make estimates and assumptions that affect reported amounts presented and disclosed in ourConsolidated Financial Statements. Significant estimates and assumptions in theseConsolidated Financial Statements require the exercise of judgment and are used for, but not limited to, allowance for doubtful accounts, estimates of future cash flows and other assumptions associated with goodwill and long-lived asset impairment tests, useful lives for depreciation and amortization, warranty programs, determination of discount and other rate assumptions for pension and other postretirement benefit expenses, restructuring costs, income taxes and deferred tax valuation allowances, lease classification and contingencies. Due to the inherent uncertainty involved in making estimates, actual results reported in future periods may be different from these estimates.
We recognize revenue, net of estimated costs of returns, allowances and sales incentives, when it is realized or realizable, which generally occurs when:
Products are generally sold on open account under credit terms customary to the geographic region of distribution. We perform ongoing credit evaluations of our customers and generally do not require collateral to secure our accounts receivable. For engines, service parts, service tools and other items sold to independent distributors and to partially-owned distributors accounted for under the equity method, revenues are recorded when title and risk of ownership transfers. This transfer is based on the agreement in effect with the respective distributor, andwhich in the United States (U.S.)U.S. and most international locations, generally occurs when the products are shipped. To the extent of our ownership percentage, margins on sales to distributors accounted for under the equity method are deferred until the distributor sells the product to unrelated parties.
CUMMINS INC. AND SUBSIDIARIES
NOTES TO CONSOLIDATED FINANCIAL STATEMENTS (Continued)
NOTE 1. SUMMARY OF SIGNIFICANT ACCOUNTING POLICIES (Continued)
We provide various sales incentives to both our distribution network and our OEM customers. These programs are designed to promote the sale of our product in the channel or encourage the usage of our products by OEM customers. Sales incentives primarily fall into three categories:
CUMMINS INC. AND SUBSIDIARIES
NOTES TO CONSOLIDATED FINANCIAL STATEMENTS (Continued)
NOTE 1. SUMMARY OF SIGNIFICANT ACCOUNTING POLICIES (Continued)
For volume rebates, we provide certain customers with rebate opportunities for attaining specified volumes during a particular quarter or year. We accrue for the expected amount of these rebates at the time of the original sale and update our accruals quarterly based on our best estimate of the volume levels the customer will reach during the measurement period. For market share rebates, we provide certain customers with rebate opportunities based on the percentage of their production that utilizes a Cumminsour product. These rebates are typically measured either quarterly or annually and are accrued at the time of the original sale based on the current market shares, with adjustments made as the level changes. For aftermarket rebates we provide incentives to promote sales to certain dealers and end-markets. These rebates are typically paid on a quarterly, or more frequent, basis and estimates are made at the end of each quarter as to the amount yet to be paid. These estimates are based on historical experience with the particular program. The incentives are classified as a reduction in sales in ourConsolidated Statements of Income.
Rights of return do not exist for a large portionthe majority of our sales, other than for quality issues. We do offer certain return rights in our aftermarket business, where some aftermarket customers are permitted to return small amounts of parts and filters each year and in our power generation business, which sells portable generators to retail customers. An estimate of future returns is accrued at the time of sale based on historical return rates.
Foreign Currency Transactions and Translation
We translate assets and liabilities of foreign entities to U.S. dollars, where the local currency is the functional currency, at year-end exchange rates. We translate income and expenses to U.S. dollars using weighted-average exchange rates for the year. We record adjustments resulting from translation in a separate component of accumulated other comprehensive lossincome (loss) and include the adjustments in net income only upon sale or liquidation of the underlying foreign investment.
Foreign currency transaction gains and losses are included in current net income. For foreign entities where the U.S. dollar is the functional currency, including those operating in highly inflationary economies when applicable, we remeasure inventory, property, plant and equipmentnon-monetary balances and the related income statement using historical exchange rates. We include in income the resulting gains and losses, including the effect of derivatives in ourConsolidated Statements of Income, which combined with transaction gains and losses amounted to a net loss of $20$14 million in 2009, a2012, net loss of $46$14 million in 20082011 and a net gainloss of $28$1 million in 2007.2010.
We make use of derivative instruments in foreign exchange, commodity price and interest rate hedging programs. Derivatives currently in use are foreign currency forward contracts, commodity swap
CUMMINS INC. AND SUBSIDIARIES
NOTES TO CONSOLIDATED FINANCIAL STATEMENTS (Continued)
NOTE 1. SUMMARY OF SIGNIFICANT ACCOUNTING POLICIES (Continued)
contracts, commodity zero-cost collars and an interest rate swap. These contracts are used strictly for hedging and not for speculative purposes.
Due to our international business presence, we are exposed to foreign currency exchange risk. We transact in foreign currencies and have significant assets and liabilities denominated in foreign currencies. Consequently, our income experiences some volatility related to movements in foreign currency exchange rates. In order to benefit from global diversification and after considering naturally offsetting currency positions, we enter into foreign currency forward contracts to minimize our existing exposures (recognized assets and liabilities) and hedge forecasted transactions.
CUMMINS INC. AND SUBSIDIARIES
NOTES TO CONSOLIDATED FINANCIAL STATEMENTS (Continued)
NOTE 1. SUMMARY OF SIGNIFICANT ACCOUNTING POLICIES (Continued)
We are exposed to fluctuations in commodity prices due to contractual agreements with component suppliers. In order to protect ourselves against future price volatility and, consequently, fluctuations in gross margins, we periodically enter into commodity swap contracts with designated banks to fix the cost of certain raw material purchases with the objective of minimizing changes in inventory cost due to market price fluctuations.
We record all derivatives at fair value in our financial statements. Note 2021, "DERIVATIVES," provides further information on our hedging strategy and accounting for derivative financial instruments.
We determine our income tax provisionexpense using the asset and liability method. Under this method, deferred tax assets and liabilities are recognized for the expected future tax consequenceseffects of temporary differences between the financial statement carrying amounts of existing assets and liabilities and their respective tax bases. We also recognize futureFuture tax benefits associated withof tax loss and credit carryforwards are also recognized as deferred tax assets. OurWe evaluate the recoverability of our deferred tax assets are reducedeach quarter by aassessing the likelihood of future profitability and available tax planning strategies that could be implemented to realize our net deferred tax assets. At December 31, 2012, we recorded net deferred tax assets of $396 million. These assets included $165 million for the value of tax loss and credit carryforwards. A valuation allowance when, inof $95 million was recorded to reduce the opinion oftax assets to the net value management it isbelieved was more likely than not to be realized. In the event our operating performance deteriorates, future assessments could conclude that some portion or all ofa larger valuation allowance will be needed to further reduce the deferred tax assets will not be realized. We measure deferredassets. In addition, we operate within multiple taxing jurisdictions and are subject to tax assets and liabilities using enacted tax ratesaudits in effect for the year inthese jurisdictions. These audits can involve complex issues, which we expectmay require an extended period of time to recover or settle the temporary differences. The effect of a change in tax rates on deferred taxes is recognized in the period that the change is enacted.resolve. We reduce our net tax assets for the estimated additional tax and interest that may result from tax authorities disputing uncertain tax positions we have taken. During interim reporting periods ourtaken and we believe we have made adequate provision for income tax provision istaxes for all years that are subject to audit based upon the estimated annual effectivelatest information available. A more complete description of our income taxes and the future benefits of our tax rate of those taxable jurisdictions where we conduct business.loss and credit carryforwards is disclosed in Note 4, "INCOME TAXES."
Cash equivalents are defined as short-term, highly liquid investments with an original maturity of 90 days or less at the time of purchase. The carrying amounts reflected in ourConsolidated Balance Sheets for cash and cash equivalents approximate fair value due to the short-term maturity of these investments.
CUMMINS INC. AND SUBSIDIARIES
NOTES TO CONSOLIDATED FINANCIAL STATEMENTS (Continued)
NOTE 1. SUMMARY OF SIGNIFICANT ACCOUNTING POLICIES (Continued)
| | Years ended December 31, | Years ended December 31, | ||||||||||||||||||
|---|---|---|---|---|---|---|---|---|---|---|---|---|---|---|---|---|---|---|---|---|
| In millions | 2009 | 2008 | 2007 | 2012 | 2011 | 2010 | ||||||||||||||
Changes in current assets and liabilities, net of acquisitions and dispositions, were as follows: | ||||||||||||||||||||
Accounts and notes receivable | $ | (181 | ) | $ | 88 | $ | (203 | ) | $ | 87 | $ | (350 | ) | $ | (195 | ) | ||||
Inventories | 482 | (251 | ) | (255 | ) | (32 | ) | (225 | ) | (574 | ) | |||||||||
Other current assets | 33 | (54 | ) | (34 | ) | (60 | ) | (21 | ) | (54 | ) | |||||||||
Accounts payable | (75 | ) | (174 | ) | 136 | (256 | ) | 208 | 345 | |||||||||||
Accrued expenses | (132 | ) | 124 | 217 | (514 | ) | 234 | 233 | ||||||||||||
Total | $ | 127 | $ | (267 | ) | $ | (139 | ) | $ | (775 | ) | $ | (154 | ) | $ | (245 | ) | |||
Cash payments for income taxes, net of refunds | $ | 128 | $ | 349 | $ | 294 | $ | 691 | $ | 532 | $ | 312 | ||||||||
Cash payments for interest, net of capitalized interest | $ | 31 | $ | 45 | $ | 57 | $ | 32 | $ | 47 | $ | 42 | ||||||||
We account for marketable securities in accordance with GAAP standards for the accounting for certain investments in debt and equity securities. We determine the appropriate classification of all marketable securities as "held-to-maturity, "available-for-sale" or "trading" at the time of purchase, and re-evaluate such classifications at each balance sheet date. At December 31, 20092012 and 2008,2011, all of our investments were classified as available-for-sale.
Available-for-sale securities are carried at fair value with the unrealized gain or loss, net of tax, reported in other comprehensive income. Unrealized losses considered to be "other-than-temporary" are recognized currently in income. The cost of securities sold is based on the specific identification method. The fair value of most investment securities is determined by currently available market prices. Where quoted market prices are not available, we use the market price of similar types of securities that are traded in the market to estimate fair value. See Note 5, "MARKETABLE SECURITIES," for a detailed description of our investments in marketable securities.
Accounts Receivable and Allowance for Doubtful Accounts
Trade accounts receivable are recorded at the invoiced amount, which approximates fairnet realizable value, and generally do not bear interest. We have a trade receivables sales program, which is more fully discussed in Note 21, which allows us to sell, without recourse, an interest in a pool of our trade receivables to a financial institution as necessary. The allowance for doubtful accounts is our best estimate of the amount of probable credit losses in our existing accounts receivable. We determine the allowance based on our historical collection experience and by performing an analysis of our accounts receivable in light of the current economic environment. We review our allowance for doubtful accounts on a regular basis. In addition, when necessary, we provide an allowance for the full amount of specific accounts deemed to be uncollectible. Account balances are charged off against the allowance in the period in
CUMMINS INC. AND SUBSIDIARIES
NOTES TO CONSOLIDATED FINANCIAL STATEMENTS (Continued)
NOTE 1. SUMMARY OF SIGNIFICANT ACCOUNTING POLICIES (Continued)
period in which we determine that it is probable the receivable will not be recovered. The activity in our allowance for doubtful accounts iswas as follows:
| | December 31, | December 31, | ||||||||||||||||||
|---|---|---|---|---|---|---|---|---|---|---|---|---|---|---|---|---|---|---|---|---|
| In millions | 2009 | 2008 | 2007 | 2012 | 2011 | 2010 | ||||||||||||||
Balance, beginning of year | $ | 10 | $ | 12 | $ | 11 | $ | 12 | $ | 15 | $ | 13 | ||||||||
Provision for bad debts | 11 | 9 | 7 | 6 | 6 | 5 | ||||||||||||||
Write-offs | (9 | ) | (9 | ) | (7 | ) | (5 | ) | (8 | ) | (3 | ) | ||||||||
Other | 1 | (2 | ) | 1 | — | (1 | ) | — | ||||||||||||
Balance, end of year | $ | 13 | $ | 10 | $ | 12 | $ | 13 | $ | 12 | $ | 15 | ||||||||
Our inventories are stated at the lower of cost or net realizable value. Atmarket. For the years ended December 31, 20092012 and 2008,2011, approximately 1614 percent and 1817 percent, respectively, of our consolidated inventories (primarily heavy-duty and high-horsepower engines and parts) were valued using the last-in, first-out (LIFO) cost method. The cost of other inventories is generally valued using the first-in, first-out (FIFO) cost method. Our inventories at interim and year-end reporting dates include estimates for adjustments related to annual physical inventory results and for inventory cost changes under the LIFO cost method. Due to significant movements of partially-manufactured components and parts between manufacturing plants, we do not internally measure, nor do our accounting systems provide, a meaningful segregation between raw materials and work-in-process.
We record property, plant and equipment, inclusive of assets under capital leases, at cost. We depreciate the cost of the majority ofcertain engine production equipment using a modified units-of-production method, which is based upon units produced subject to a minimum level. We depreciate the cost of all other equipment using the straight-line method with depreciable lives ranging from 20 to 40 years for buildings and three to 20 years for machinery, equipment and fixtures. Capital lease amortization is recorded in depreciation expense. We expense normal maintenance and repair costs as incurred. Depreciation expense totaled $269$287 million, $262$264 million and $256$248 million for the years ended December 31, 2009, 20082012, 2011 and 2007,2010, respectively.
We review our long-lived assets for possible impairment whenever events or circumstances indicate that the carrying value of an asset or asset group may not be recoverable. We assess the recoverability of the carrying value of the long-lived assets at the lowest level for which identifiable cash flows are largely independent of the cash flows of other assets and liabilities. An impairment of a long-lived asset or asset group exists when the expected future pre-tax cash flows (undiscounted and without interest charges) estimated to be generated by the asset or asset group is less than its carrying value. If these cash flows are less than the carrying value of such asset or asset group, an impairment loss is measured based on the difference between the estimated fair value and carrying value of the asset or asset group. Assumptions and estimates used to estimate cash flows in the evaluation of impairment and the fair values used to determine the impairment are subject to a degree of judgment and complexity. Any
CUMMINS INC. AND SUBSIDIARIES
NOTES TO CONSOLIDATED FINANCIAL STATEMENTS (Continued)
NOTE 1. SUMMARY OF SIGNIFICANT ACCOUNTING POLICIES (Continued)
changes to the assumptions and estimates resulting from changes in actual results or market conditions from those anticipated may affect the carrying value of long-lived assets and could result in a future impairment charge.
Under GAAP accounting for goodwill, and other intangible assets,we have the option to first assess qualitative factors to determine whether it is more likely than not that the fair value of a reporting unit is less than its carrying value as a basis for determining whether it is necessary to perform an annual two-step goodwill impairment test. The two-step impairment test is now only required if an entity determines through this qualitative analysis that it is more likely than not that the fair value of the reporting unit is less than its carrying value. In addition, carrying value of goodwill must be tested for impairment on an annualinterim basis and between annual tests in certain circumstances where impairment may be indicated. TheWhen we are required or opt to perform the two-step impairment test, the fair value of each reporting unit wasis estimated by discounting the after tax future cash flows less requirements for working capital and fixed asset additions. In accordance with GAAP, ourOur reporting units are generally defined as one level below an operating segment. However, there were two situations where we have aggregated two or more components which share similar economic characteristics and thus are aggregated into a single reporting unit for testing purposes. These two situations are described further below. This analysis has resulted in the following reporting units for our goodwill testing:
No other reporting units have goodwill. Our valuation method requires us to make projections of revenue, operating expenses, working capital investment and fixed asset additions for the reporting units over a multi-year period. Additionally, management must estimate a weighted-average cost of capital, which reflects a market rate, for each reporting unit for use as a discount rate. The discounted cash flows are compared to the carrying value of the reporting unit and, if less than the carrying value, a separate valuation of the goodwill is required to determine if an impairment loss has occurred. In addition, we also perform a sensitivity analysis to determine how much our forecasts can fluctuate before the fair value of a reporting unit would be lower than its carrying amount. AsWe performed the required procedures as of the end of theour fiscal third quarter in 2009, we performed the annual impairment assessment required by GAAP and determined that our goodwill was not impaired. At December 31, 2009,2012, our recorded goodwill was $364$445 million, approximately 90 percent of which resided in the emissionsemission solutions plus filtration reporting unit. For this reporting unit, the fair value of the reporting unit exceeded its carrying value by a 10 percent reduction in our estimated future cash flows would not have impacted our assessment.substantial margin. Changes in our projections or estimates, a deterioration of our operating results and the related cash flow effect or a significant increase in the discount rate could decrease the estimated fair value of our reporting units and result in a future impairment of goodwill.
CUMMINS INC. AND SUBSIDIARIES
NOTES TO CONSOLIDATED FINANCIAL STATEMENTS (Continued)
NOTE 1. SUMMARY OF SIGNIFICANT ACCOUNTING POLICIES (Continued)
significant increase in the discount rate could decrease the estimated fair value of our reporting units and result in a future impairment of goodwill.
We capitalize certain costs for software that are developed or obtained for internal use. Software costs are amortized on a straight-line basis over their estimated useful lives generally ranging from three to five12 years. Software assets are reviewed for impairment when events or circumstances indicate that the carrying value may not be recoverable over the remaining lives of the assets. Upgrades and enhancements are capitalized if they result in significant modifications that enable the software to perform tasks it was previously incapable of performing. Software maintenance, training, data conversion and business process reengineering costs are expensed in the period in which they are incurred.
We charge the estimated costs of warranty programs, other than product recalls, to income at the time products are shipped to customers. We use historical experience of warranty programs to estimatedevelop the remainingestimated liability for our various warranty programs. As a result of the uncertainty surrounding the nature and frequency of product recall programs, the liability for such programs is recorded when we commit to a recall action or when a recall becomes probable and estimable, which generally occurs when it is announced. The liability for these programs is reflected in the provision for warranties issued. We review and assess the liability for these programs on a quarterly basis. We also assess our ability to recover certain costs from our suppliers and record a receivable from the supplier when we believe a recovery is probable. At December 31, 2009,2012, we had $10$13 million of receivables related to estimated supplier recoveries of which $5$7 million was included in "Trade and other receivables, net" and $5$6 million was included in "Other assets" on ourConsolidated Balance Sheets. At December 31, 2008,2011, we had $16$14 million of receivables related to estimated supplier recoveries of which $8$7 million was included in "Trade and other receivables, net" and $8$7 million was included in "Other assets" on ourConsolidated Balance Sheets.
In addition, we sell extended warranty coverage on most of our engines. The revenue collected is initially deferred and is recognized as revenue in proportion to the costs expected to be incurred in performing services over the contract period. We compare the remaining deferred revenue balance quarterly to the estimated amount of future claims under extended warranty programs and provide an additional accrual when the deferred revenue balance is less than expected future costs.
Our research and development program is focused on product improvements, innovations and cost reductions for our customers. We expense researchResearch and development expenditures include salaries, contractor fees, building costs, utilities, administrative expenses and allocation of corporate costs and are expensed, net of contract reimbursements, when incurred. The major components of research and development expenses are salaries, fringes and consulting fees. Research and development expenses, net of contract reimbursements, were $362$721 million in 2009, $4222012, $621 million in 20082011 and $318$402 million in 2007.2010. Contract reimbursements were $92$86 million in 2009, $612012, $75 million in 20082011 and $52$68 million in 2007.
In accordance with the provisions of various joint venture agreements, we may purchase products and components from the joint ventures, sell products and components to the joint ventures and the joint ventures may sell products and components to unrelated parties. Joint venture transfer prices to us may differ from normal selling prices. Certain joint venture agreements transfer product to us at cost, some transfer product to us on a cost-plus basis, and others transfer product to us at market2010.
CUMMINS INC. AND SUBSIDIARIES
NOTES TO CONSOLIDATED FINANCIAL STATEMENTS (Continued)
NOTE 1. SUMMARY OF SIGNIFICANT ACCOUNTING POLICIES (Continued)
In accordance with the provisions of various joint venture agreements, we may purchase products and components from our joint ventures, sell products and components to our joint ventures and our joint ventures may sell products and components to unrelated parties. Joint venture transfer prices may differ from normal selling prices. Certain joint venture agreements transfer product at cost, some transfer product on a cost-plus basis, and others transfer product at market value. Our related party sales are presented on the face of ourConsolidated Statements of Income. Our related party purchases were not material to our financial position or results of operations.
RECENTLY ADOPTED AND RECENTYRECENTLY ISSUED ACCOUNTING PRONOUNCEMENTS
Accounting Pronouncements Recently Adopted
In December 2007,June 2011, the Financial Accounting Standards Board (FASB) amended its existing standards for business combinations, which isrules regarding the presentation of comprehensive income. The objective of this amendment was to improve the comparability, consistency and transparency of financial reporting and to increase the prominence of items reported in other comprehensive income. Specifically, this amendment requires that all non-owner changes in shareholders' equity be presented either in a single continuous statement of comprehensive income or in two separate but consecutive statements. In addition, the standard also requires disclosure of the location of reclassification adjustments between other comprehensive income and net income on the face of the financial statements. The new rules became effective for fiscal yearsus beginning afterJanuary 1, 2012. In December 15, 2008. The amended standards make significant changes to both2011, the accounting and disclosures related toFASB deferred certain aspects of this standard beyond the acquisition of a business and could materially impact how we account for future business combination transactions.current effective date, specifically the provisions dealing with reclassification adjustments. Because the standard will only impacts the display of comprehensive income and does not impact transactions entered into after January 1, 2009,what is included in comprehensive income, the amended standardsstandard did not have a significant impact on ourConsolidated Financial Statements upon adoption..
In May 2011, the FASB amended its standards related to fair value measurements and disclosures. The objective of the amendment was to improve the comparability of fair value measurements presented and disclosed in financial statements prepared in accordance with U.S. GAAP and International Financial Reporting Standards. Primarily this amendment changed the wording used to describe many of the requirements in U.S. GAAP for measuring fair value and for disclosing information about fair value measurements in addition to clarifying the Board's intent about the application of existing fair value measurement requirements. The new standard also requires additional disclosures related to fair value measurements categorized within Level 3 of the fair value hierarchy and requires disclosure of the categorization in the hierarchy for items which are not recorded at fair value but fair value is required to be disclosed. The new rules were effective for us beginning January 1, 2012. As of December 31, 2012, we had no fair value measurements categorized within Level 3 outside of our pension plans. The only impact for us is the disclosure of the categorization in the fair value hierarchy for those items where fair value is only disclosed (primarily our debt obligations). Our disclosure related to the new standard is included in Note 6, "FAIR VALUE OF FINANCIAL INSTRUMENTS," to theConsolidated Financial Statements.
Accounting Pronouncements Issued But Not Yet Effective
In December 2007,2011, the FASB amended its existing standards for noncontrolling interests in consolidated financial statements, which was effective for interimrelated to offsetting assets and annual fiscal periods beginning after December 15, 2008. The new standard established accountingliabilities. This amendment requires entities to disclose both gross and reporting standards for the noncontrolling interest in a subsidiary and for the accounting for future ownership changes with respect to those subsidiaries. The new standard defined a noncontrolling interest, previously called a minority interest, as the portion of equity in a subsidiary not attributable, directly or indirectly, to a parent. The new standard required, among other items, that a noncontrolling interest be included in the consolidated balance sheet within equity, separate from the parent's equity; consolidated net income to be reported at amounts inclusive of both the parent's and noncontrolling interest's shares and, separately, the amounts of consolidated net income attributable to the parent and noncontrolling interest all on the consolidated statements of income; and if a subsidiary is deconsolidated, any retained noncontrolling equity investment in the former subsidiary be measured at fair value and a gain or loss be recognized in net income based on such fair value. We adopted the new standard effective January 1, 2009, and applied it retrospectively. As a result, we reclassified noncontrolling interests of $246 million, $292 million and $253 million, respectively, from the mezzanine section to equity in the December 31, 2008, 2007 and 2006 balance sheets. Certain reclassifications have been made to prior period amounts to conform to the presentation of the current period under the new standard.
In March 2008, the FASB amended its existing standards for disclosuresinformation about derivativecertain instruments and hedging activities, which was effective for interim and annual fiscal periods beginning after November 15, 2008. The new standards require enhanced disclosures about a company's derivative and hedging activities. We adopted the new standard effective January 1, 2009, and applied it prospectively. The new disclosures required are included in Note 20.
In June 2009, the FASB amended its existing standards for subsequent events, which was effective for interim and annual fiscal periods ending after June 15, 2009, and established general standards of accounting for and disclosure of events that occur after the balance sheet date but before financial statements are issued or are available to be issued. The new standard established the period after the balance sheet date during which we should evaluate events or transactions that may occur for potential recognition or disclosure in the financial statements, the circumstances under which we should recognize events or transactions occurring after the balance sheet date and the disclosures that should be made about events or transactions that occurred after the balance sheet date. In preparing our
CUMMINS INC. AND SUBSIDIARIES
NOTES TO CONSOLIDATED FINANCIAL STATEMENTS (Continued)
NOTE 1. SUMMARY OF SIGNIFICANT ACCOUNTING POLICIES (Continued)
Consolidated Financial Statements, we evaluated subsequent events through February 25, 2010, whichtransactions eligible for offset in the statement of financial position and certain instruments and transactions subject to an agreement similar to a master netting agreement. This information will enable users of the financial statements to understand the effect of those arrangements on its financial position. The new rules will become effective for annual reporting periods beginning on or after January 1, 2013, and interim periods within those annual periods. It is also required that the date our annual report was filed with the Securities and Exchange Commission.
Accounting Pronouncements Issued But Not Yet Effective
new disclosures are applied for all comparative periods presented. In June 2009,January 2013, the FASB further amended this standard to limit its standards for accounting for transfers of financial assets, which is effective for interimscope to derivatives, repurchase and annual fiscal periods beginning after November 15, 2009. The new standard removes the concept of a qualifying special-purpose entity from GAAP. The new standard modifies the financial-components approach used in previous standardsreverse repurchase agreements, securities borrowings and limits the circumstances in which a financial asset, or portion of a financial asset, should be derecognized. The new standard also requires enhanced disclosure regarding transfers of financial interests and a transferor's continuing involvement with transferred assets. The new standard will require us to report any future activity under our sale of receivables program as secured borrowings as of January 1, 2010. As of December 31, 2009, we had no amounts outstanding under this program.
In June 2009, the FASB amended its existing standards related to the consolidation of variable interest entities, which is effective for interim and annual fiscal periods beginning after November 15, 2009. The new standard requires entities to analyze whether their variable interests give it a controlling financial interest of a variable interest entity (VIE) and outlines what defines a primary beneficiary. The new standard amends GAAP by: (a) changing certain rules for determining whether an entity is a VIE; (b) replacing the quantitative approach previously required for determining the primary beneficiary with a more qualitative approach; and (c) requiring entities to continuously analyze whether they are the primary beneficiary of a VIE among other amendments. The new standard also requires enhanced disclosures regarding an entity's involvement in a VIE. While we are still finalizing our evaluation of the impact oflending transactions. We do not believe this amendment on ourConsolidated Financial Statements, we believe the only impact will be the deconsolidation of Cummins Komatsu Engine Company (CKEC). This deconsolidation will not have a material impactsignificant effect on ourConsolidated Financial Statements. Financial information about CKEC is included in Note 23.While we are still finalizing our analysis, due to the scope limitation we also do not expect any significant changes to our footnote disclosures.
In October 2009,February 2013, the FASB amended its rules regardingstandards on comprehensive income by requiring disclosure in the accounting for multiple element revenue arrangements. The objectivefootnotes of information about amounts reclassified out of accumulated other comprehensive income by component. Specifically, the amendment will require disclosure of the amendmentline items of net income in which the item was reclassified only if it is reclassified to allow vendorsnet income in its entirety in the same reporting period. It will also require cross reference to accountother disclosures for revenue for different deliverables separately as opposed to part of a combined unit when those deliverablesamounts that are provided at different times. Specifically, this amendment addresses how to separate deliverables and simplifiesnot reclassified in their entirety in the process of allocating revenue to the different deliverables when more than one deliverable exists.same reporting period. The new rules are effectivedisclosures will be required for us prospectively only for annual periods beginning January 1, 2011. We are in the process of evaluating the impact that this amendment will have on ourConsolidated Financial Statements.
CUMMINS INC. AND SUBSIDIARIES
NOTES TO CONSOLIDATED FINANCIAL STATEMENTS (Continued)2013 and interim periods within those annual periods.
NOTE 2. INVESTMENTS IN EQUITY INVESTEESACQUISITIONS AND DIVESTITURES
Investments in and advances to equity investees and our ownership percentage is as follows:
| | | December 31, | |||||||
|---|---|---|---|---|---|---|---|---|---|
| In millions | Ownership % | 2009 | 2008 | ||||||
North American distributors | 30% - 50% | $ | 112 | $ | 113 | ||||
Dongfeng Cummins Engine Company, Ltd. | 50% | 85 | 106 | ||||||
Beijing Foton Cummins Engine Co., Ltd. | 50% | 52 | 56 | ||||||
Cummins-Scania XPI Manufacturing, LLC | 50% | 52 | 55 | ||||||
Chongqing Cummins Engine Company Ltd. | 50% | 50 | 57 | ||||||
Komatsu alliances | 20% - 50% | 48 | 41 | ||||||
Tata Cummins Ltd. | 50% | 40 | 35 | ||||||
Shanghai Fleetguard Filter Co., Ltd. | 50% | 19 | 18 | ||||||
Other | Various | 116 | 107 | ||||||
Total | $ | 574 | $ | 588 | |||||
Equity, royalty and interest income from investees, net of applicable taxes, was as follows:
| | For the years ended December 31, | ||||||||||
|---|---|---|---|---|---|---|---|---|---|---|---|
| In millions | 2009 | 2008 | 2007 | ||||||||
Distribution Entities | |||||||||||
North American distributors | $ | 100 | $ | 100 | $ | 83 | |||||
Komatsu Cummins Chile, Ltda. | 12 | 7 | 4 | ||||||||
All other distributors | 3 | 5 | 2 | ||||||||
Manufacturing Entities | |||||||||||
Chongqing Cummins Engine Company, Ltd. | $ | 36 | $ | 30 | $ | 22 | |||||
Dongfeng Cummins Engine Company, Ltd. | 33 | 55 | 41 | ||||||||
Valvoline Cummins, Ltd. | 7 | 2 | 1 | ||||||||
Shanghai Fleetguard Filter Co., Ltd. | 7 | 8 | 6 | ||||||||
Tata Cummins Ltd. | 5 | 7 | 13 | ||||||||
Cummins MerCruiser Diesel Marine, LLC | (10 | ) | 3 | 11 | |||||||
All other manufacturers | 3 | 14 | 9 | ||||||||
Cummins share of net income | 196 | 231 | 192 | ||||||||
Royalty and interest income | 18 | 22 | 13 | ||||||||
Equity, royalty and interest income from investees | $ | 214 | $ | 253 | $ | 205 | |||||
Distribution Entities Acquisitions
We haveIn April 2012, we reached an extensive worldwide distributoragreement to acquire the doser technology and dealer network through whichbusiness assets from Hilite Germany GmbH (Hilite) in a cash transaction. Dosers are products that enable compliance with emission standards in certain aftertreatment systems and complement our current product offerings. The transaction was approved by German regulators in June and closed on July 18, 2012. The purchase price was $176 million and is summarized below. There was no contingent consideration associated with this transaction. During 2012, we sell and distribute our products and services. Generally, our distributors are divided by geographic regionexpensed approximately $4 million of acquisition related costs.
The acquisition of Hilite was accounted for as a business combination, with somethe results of our distributors being wholly-owned by Cummins, some partially-ownedthe acquired entity and the goodwill included in the Components operating segment in the third quarter of 2012. The majority independently owned.of the purchase price was allocated to technology and customer related intangible assets and goodwill, most of which is expected to be fully deductible for tax purposes. We consolidate all wholly-owned distributorsexpect the Hilite acquisition to strengthen our aftertreatment product offerings. This acquisition enhances our technical capabilities and partially-owned distributors where we arekeeps us in a strong position to meet the primary beneficiaryneeds of current customers and account for other partially-owned distributors usinggrow into new markets, especially as an increasing number of regions around the equity method of accounting.world adopt tougher emission standards.
CUMMINS INC. AND SUBSIDIARIES
NOTES TO CONSOLIDATED FINANCIAL STATEMENTS (Continued)
NOTE 2. INVESTMENTS IN EQUITY INVESTEESACQUISITIONS AND DIVESTITURES (Continued)
North American Distributors
Our distribution channel in North America includes 13 partially-owned distributors. Our equity interests in these nonconsolidated entities range from 30 percent to 50 percent. While each distributor is a separate legal entity, the business of each is the same Intangible assets by asset class, including weighted average amortization life, were as that of our wholly-owned distributors based in other parts of the world. All of our distributors, irrespective of their legal structure or ownership, offer the full range of our products and services to customers and end-users in their respective markets.follows:
Komatsu Cummins Chile, Ltda.
| Dollars in millions | Purchase price allocation | Weighted average amortization life in years | |||||
|---|---|---|---|---|---|---|---|
Technology | $ | 52 | 10.6 | ||||
Customer | 23 | 4.5 | |||||
License arrangements | 8 | 6.0 | |||||
Total intangible assets | $ | 83 | 8.5 | ||||
Komatsu Cummins Chile, Ltda. is a joint venture with Komatsu America Corporation. The joint venture is a distributor that offers the full range of our products and services to customers and end-users in the Chilean market.
We also have 50 percent equity interests in three other international distributors.
We are contractually obligated to repurchase new engines, parts and components, special tools and signage from our North American distributors following an ownership transfer or termination of the distributor. In addition, in certain cases where we own a partial interest in a distributor, we are obligated to purchase the other equity holders' interests if certain events occur (such as the death of the distributor principal or a change in control of Cummins Inc.). The purchase price was allocated as follows:
| In millions | | |||
|---|---|---|---|---|
Inventory | $ | 5 | ||
Fixed assets | 5 | |||
Intangible assets | 83 | |||
Goodwill | 91 | |||
Liabilities | (8 | ) | ||
Total purchase price | $ | 176 | ||
Net sales for Hilite were $104 million for 2012, of the equity interests is determined based on the fair value of the distributor's assets. Outside of North America, repurchase obligations and practices vary by region. All distributors that are partially-owned are considered to be related partieswhich $46 million was included in ourConsolidated Financial Statements of Income. and represented less than 1 percent of consolidated sales, and $77 million in 2011.
In July 2012, we acquired an additional 45 percent interest in Cummins Central Power from the former principal for consideration of approximately $20 million. The acquisition was accounted for as a business combination, with the results of the acquired entity included in the Distribution operating segment in the third quarter of 2012. Distribution segment results also included a $7 million gain, as we were required to re-measure our pre-existing 35 percent ownership interest in Cummins Central Power to fair value in accordance with GAAP. Net sales for Cummins Central Power were $242 million in 2012, of which $115 million was included in ourConsolidated Statements of Income and represented less than 1 percent of consolidated sales, and $209 million in 2011.
Manufacturing EntitiesDivestitures
Manufacturing ventures are formed with customersIn the second quarter of 2011, we sold certain assets and allow usliabilities of our exhaust business which manufactures exhaust products and select components for emission systems for a variety of applications not core to increase market penetration in geographic regions, reduce capital spending, streamline our supply chain management and develop technologies. Our largest manufacturing ventures are based in China and areother product offerings. This business was historically included in the list below. Our engine manufacturing joint ventures are supplied by our Components segment. The sales price was $123 million. We recognized a gain on the sale of $68 million ($37 million after-tax), which included a goodwill allocation of $19 million. The gain was excluded from segment in the same mannerresults as they supply our wholly-owned engine and power generation manufacturing facilities. Components segment joint ventures provide fuel system, filtration and turbocharger products that are usedit was not considered in our engines as well as some competitors' products.
Chongqing Cummins Engine Company, Ltd.evaluation of operating results for the year ended December 31, 2011.
Chongqing Cummins Engine Company, Ltd. is a joint ventureSales for this business were $62 million and $171 million in China with Chongqing Heavy Duty Vehicle Group that manufactures several models of our heavy-duty2011 (through closing) and high-horsepower diesel engines, primarily serving the industrial2010, respectively. Income before income taxes for this business were approximately $9 million and stationary power markets$22 million in China.
Dongfeng Cummins Engine Company, Ltd.
Dongfeng Cummins Engine Company, Ltd. (DCEC) is a joint venture in China with Dongfeng Automotive Corporation, a subsidiary of Dongfeng Motor Company (Dongfeng), one of the largest medium-duty truck manufacturers in China. DCEC produces Cummins four- to nine-liter mechanical engines, full-electronic diesel engines, with a power range from 100 to 370 horsepower,2011 (through closing) and natural gas engines.2010, respectively.
CUMMINS INC. AND SUBSIDIARIES
NOTES TO CONSOLIDATED FINANCIAL STATEMENTS (Continued)
NOTE 2. INVESTMENTS IN EQUITY INVESTEESACQUISITIONS AND DIVESTITURES (Continued)
Valvoline Cummins, Ltd.
Valvoline Cummins, Ltd. is a joint venture with Ashland Inc., USA. The joint venture During the fourth quarter of 2011, we sold certain assets and liabilities of our light-duty filtration business which manufactures and distributes lubricant-oil products in India which are used inlight-duty automotive and industrial applications. Products include transmission fluids, hydraulic lubricants, automotive filters, cooling system products, greasesfiltration solutions. The sales price was $90 million and specialty products.
Shanghai Fleetguard Filter Co.included a note receivable from the buyer of approximately $1 million. There are no earnouts or other contingencies associated with the sales price. We recognized a gain on the sale of $53 million ($33 million after-tax), Ltd.which included a goodwill allocation of $6 million. The gain was excluded from segment results as it was not considered in our evaluation of operating results for the year ended December 31, 2011.
Shanghai Fleetguard Filter Co., Ltd. is a joint venture in China with Dongfeng that manufactures filtrationSales for this business were $64 million and exhaust systems.
Tata Cummins Ltd.
Tata Cummins Ltd. is a joint venture in India with Tata Motors Ltd., the largest automotive company in India and a member of the Tata group of companies. This joint venture manufactures the engines in India for use in trucks manufactured by Tata Motors, as well as for various industrial and power generation applications.
Cummins MerCruiser Diesel Marine, LLC
Cummins MerCruiser Diesel Marine, LLC is a joint venture in the United States (U.S.) with Mercury Marine, a division of Brunswick Corporation, to develop, manufacture and sell recreational marine diesel products, including engines, sterndrive packages, inboard packages, instrument and controls, service systems and replacement and service parts and assemblies, complete integration systems and other related products.
Beijing Foton Cummins Engine Co., Ltd.
Beijing Foton Cummins Engine Co., Ltd. is a 50/50 joint venture in China with Beijing Foton Motor Co., Ltd., a commercial vehicle manufacturer, to produce two new families of Cummins high performance light-duty, diesel engines in Beijing. The engines will be used in light-duty commercial trucks, pickup trucks, multipurpose and sport utility vehicles. Certain types of marine, small construction equipment and industrial applications will also be served by these engine families.
CUMMINS INC. AND SUBSIDIARIES
NOTES TO CONSOLIDATED FINANCIAL STATEMENTS (Continued)
NOTE 2. INVESTMENTS IN EQUITY INVESTEES (Continued)
Equity Investee Financial Summary
We have approximately $261$74 million in 2011 (through closing) and 2010, respectively. Income before income taxes for this business were approximately $13 million and $9 million in 2011 (through closing) and 2010, respectively.
In the second quarter of 2012, we recorded an additional $6 million gain ($4 million after-tax) related to final purchase price adjustments for our investment account at2011 divestitures. The gain was excluded from segment results as it was not considered in our evaluation of operating results for the year ended December 31, 2009, that represents cumulative undistributed income in our equity investees. Summary financial information for our equity investees is as follows:2012.
| | As of and for the years ended December 31, | |||||||||
|---|---|---|---|---|---|---|---|---|---|---|
| In millions | 2009 | 2008 | 2007 | |||||||
Net sales | $ | 5,554 | $ | 6,610 | $ | 5,716 | ||||
Gross margin | 1,365 | 1,509 | 1,320 | |||||||
Net income | 427 | 498 | 451 | |||||||
Cummins share of net income | $ | 196 | $ | 231 | $ | 192 | ||||
Royalty and interest income | 18 | 22 | 13 | |||||||
Total equity, royalty and interest income from investees | $ | 214 | $ | 253 | $ | 205 | ||||
Current assets | $ | 2,005 | $ | 2,189 | ||||||
Noncurrent assets | 1,123 | 903 | ||||||||
Current liabilities | (1,406 | ) | (1,440 | ) | ||||||
Noncurrent liabilities | (390 | ) | (358 | ) | ||||||
Net assets | $ | 1,332 | $ | 1,294 | ||||||
Cummins share of net assets | $ | 587 | $ | 599 | ||||||
NOTE 3. RESTRUCTURING AND OTHER CHARGES
2009 Restructuring ActionsINVESTMENTS IN EQUITY INVESTEES
In 2009,Investments in and advances to equity investees and our ownership percentage was as follows:
| | | December 31, | |||||||
|---|---|---|---|---|---|---|---|---|---|
| In millions | Ownership % | 2012 | 2011 | ||||||
North American distributors | 30% - 50% | $ | 139 | $ | 127 | ||||
Komatsu alliances | 20% - 50% | 132 | 115 | ||||||
Dongfeng Cummins Engine Company, Ltd. | 50% | 113 | 131 | ||||||
Beijing Foton Cummins Engine Co. Ltd. | 50% | 91 | 87 | ||||||
Cummins-Scania XPI Manufacturing, LLC | 50% | 65 | 62 | ||||||
Chongqing Cummins Engine Company, Ltd. | 50% | 58 | 71 | ||||||
Tata Cummins, Ltd. | 50% | 52 | 49 | ||||||
Cummins Olayan Energy | 49% | 34 | 30 | ||||||
Shanghai Fleetguard Filter Co., Ltd. | 50% | 31 | 29 | ||||||
Guangxi Cummins Industiral Power Co., Ltd. | 50% | 30 | — | ||||||
Valvoline Cummins, Ltd. | 50% | 25 | 20 | ||||||
Fleetguard Filters Private, Ltd. | 50% | 23 | 22 | ||||||
Other | Various | 104 | 95 | ||||||
Total | $ | 897 | $ | 838 | |||||
On January 1, 2010, with the adoption of the new FASB standard regarding consolidation of VIEs, we executed restructuring actionsdeconsolidated Cummins Komatsu Engine Corporation to account for it as an equity investee. The impact of the deconsolidation on ourConsolidated Statements of Income was minimal as all sales were eliminated in response to a reduction in orders in most of our U.S. and foreign markets due to the continuing deteriorationconsolidation in the global economy. We reducedpast. The most significant impacts on our global workforceConsolidated Balance Sheets were to decrease current assets by approximately 1,000 professional employees. In addition, we took numerous employee actions at many of our manufacturing locations, including approximately 3,200 hourly employees, significant downsizing at numerous facilities$9 million, decrease long-term assets by $10 million, increase investments and complete closure of several facilities and branch distributor locations. Employee termination and severance costs were recorded based on approved plans developed by the businesses and corporate management which specified positions to be eliminated, benefits to be paid under existing severance plans, union contracts or statutory requirements and the expected timetable for completion of the plan. Estimates of restructuring were made based on information available at the time charges were recorded. Due to the inherent uncertainty involved, actual amounts paid for such activities may differ from amounts initially recorded and we may need to revise previous estimates.
We incurred $2 million of restructuring expenses for lease terminations and $5 million of restructuring expenses for asset impairments in response to closures and downsizing noted above. During 2009, we recorded a total pre-tax restructuring charge of $85 million, comprising $90 million of chargesadvances related to 2009 actions net of the $3equity method investees by $11 million favorable changeand decrease noncontrolling interest by $11 million in estimate related to 2008 actions and the $2 million favorable change in estimate related to earlier 2009 actions, in2010.
CUMMINS INC. AND SUBSIDIARIES
NOTES TO CONSOLIDATED FINANCIAL STATEMENTS (Continued)
NOTE 3. RESTRUCTURING AND OTHER CHARGESINVESTMENTS IN EQUITY INVESTEES (Continued)
"Restructuring Equity, royalty and other charges" in ourConsolidated Statementsinterest income from investees, net of Income. These restructuring actions included:
| In millions | Year ended December 31, 2009 | |||
|---|---|---|---|---|
Workforce reductions | $ | 81 | ||
Exit activities | 7 | |||
Other | 2 | |||
Changes in estimate | (5 | ) | ||
Total restructuring charges | 85 | |||
Curtailment loss | 14 | |||
Total restructuring and other charges | $ | 99 | ||
In addition, as a result of the restructuring actions described above, we also recorded a $14 million curtailment loss in our pension and other postretirement plans. See Note 12 for additional detail.
At December 31, 2009, of the approximately 4,200 employees affected by this plan, all terminations were substantially complete.
The following table summarizes the balance of accrued restructuring charges by expense type and the changes in the accrued amounts for the applicable periods. The restructuring related accruals were recorded in "Other accrued expenses" in ourConsolidated Balance Sheets.
| In millions | Severance Costs | Exit Activities | Other | Total | |||||||||
|---|---|---|---|---|---|---|---|---|---|---|---|---|---|
2009 Restructuring charges | $ | 81 | $ | 7 | $ | 2 | $ | 90 | |||||
Cash payments for 2009 actions | (70 | ) | (1 | ) | — | (71 | ) | ||||||
Noncash items | — | (5 | ) | (2 | ) | (7 | ) | ||||||
Changes in estimates | (2 | ) | — | — | (2 | ) | |||||||
Translation | 1 | — | — | 1 | |||||||||
Balance at December 31, 2009 | $ | 10 | $ | 1 | $ | — | $ | 11 | |||||
We do not include restructuring and other charges in our operating segment results. The pre-tax impact of allocating restructuring and other charges to the segment results would have beentaxes, was as follows:
| In millions | Year ended December 31, 2009 | |||
|---|---|---|---|---|
Engine | $ | 47 | ||
Power Generation | 12 | |||
Components | 35 | |||
Distribution | 5 | |||
Total restructuring charges | $ | 99 | ||
| | For the years ended December 31, | |||||||||
|---|---|---|---|---|---|---|---|---|---|---|
| In millions | 2012 | 2011 | 2010 | |||||||
Distribution Entities | ||||||||||
North American distributors | $ | 147 | $ | 134 | $ | 101 | ||||
Komatsu Cummins Chile, Ltda. | 26 | 22 | 16 | |||||||
All other distributors | 4 | 4 | 3 | |||||||
Manufacturing Entities | ||||||||||
Chongqing Cummins Engine Company, Ltd. | 61 | 68 | 46 | |||||||
Dongfeng Cummins Engine Company, Ltd. | 52 | 80 | 99 | |||||||
Cummins Westport, Inc. | 14 | 14 | 10 | |||||||
Shanghai Fleetguard Filter Co., Ltd. | 13 | 15 | 12 | |||||||
Tata Cummins, Ltd. | 11 | 14 | 14 | |||||||
Valvoline Cummins, Ltd. | 8 | 7 | 8 | |||||||
Beijing Foton Cummins Engine Co., Ltd. | 5 | (7 | ) | (16 | ) | |||||
Komatsu manufacturing alliances | (3 | ) | 3 | 11 | ||||||
All other manufacturers | 9 | 21 | 17 | |||||||
Cummins share of net income | 347 | 375 | 321 | |||||||
Royalty and interest income | 37 | 41 | 30 | |||||||
Equity, royalty and interest income from investees | $ | 384 | $ | 416 | $ | 351 | ||||
We have an extensive worldwide distributor and dealer network through which we sell and distribute our products and services. Generally, our distributors are divided by geographic region with some of our distributors being wholly-owned by Cummins, some partially-owned and the majority independently owned. We consolidate all wholly-owned distributors and partially-owned distributors where we are the primary beneficiary and account for other partially-owned distributors using the equity method of accounting.
We also have 50 percent equity interests in six other international distributors.
CUMMINS INC. AND SUBSIDIARIES
NOTES TO CONSOLIDATED FINANCIAL STATEMENTS (Continued)
NOTE 3. RESTRUCTURING AND OTHER CHARGESINVESTMENTS IN EQUITY INVESTEES (Continued)
We are contractually obligated to repurchase new engines, parts and components, special tools and signage from our North American distributors following an ownership transfer or termination of the distributor. In addition, in certain cases where we own a partial interest in a distributor, we are obligated to purchase the other equity holders' interests if certain events occur (such as the death of the distributor principal or a change in control of Cummins Inc.). The purchase price of the equity interests is determined based on the fair value of the distributor's assets. Outside of North America, repurchase obligations and practices vary by region. All distributors that are partially-owned are considered to be related parties in ourConsolidated Financial Statements.
2008 Restructuring ActionsManufacturing Entities
We executed restructuring actions primarily Our manufacturing joint ventures have generally been formed with customers and generally are intended to allow us to increase our market penetration in geographic regions, reduce capital spending, streamline our supply chain management and develop technologies. Our largest manufacturing joint ventures are based in China and are included in the form of voluntary and involuntary separation programslist below. Our engine manufacturing joint ventures are supplied by our Components segment in the fourth quarter of 2008. These actions were in response to the continued deteriorationsame manner as it supplies our wholly-owned Engine segment and Power Generation segment manufacturing facilities. Our Components segment joint ventures and wholly owned entities provide fuel system, filtration and turbocharger products that are used in our U.S. businesses and most key markets around the world in the second half of 2008,engines as well as a reductionsome competitors' products. The results and investments in ordersour joint ventures in most U.S.which we have 50 percent or less ownership interest are included in "Equity, royalty and global markets for 2009. We reduced our worldwide professional workforce by approximately 650 employees, or 4.5 percent. We offered a voluntary retirement package to certain active professional employees in the U.S. based on a clearly defined set of criteria. We also took voluntaryinterest income from investees" and involuntary actions which included approximately 800 hourly employees, the majority of which received severance benefits. The compensation packages contained salary"Investments and continuation of benefits, including health care, life insurance and outplacement services. The voluntary retirement package was accepted by approximately 150 employees. The remaining professional reductions of 500 employees were involuntary. The expenses recorded during the year ended December 31, 2008, included severance costsadvances related to both voluntary and involuntary terminations. During 2008, we incurred a pre-tax charge related to the professional and hourly restructuring initiatives of approximately $37 million.
Employee termination and severance costs were recorded based on approved plans developed by the businesses and corporate management which specified positions to be eliminated, benefits to be paid under existing severance plans or statutory requirements and the expected timetable for completion of the plan. Estimates of restructuring were made based on information available at the time charges were recorded. Due to the inherent uncertainty involved, actual amounts paid for such activities may differ from amounts initially recorded and we may need to revise previous estimates.
At December 31, 2008, of the approximately 1,450 employees affected by this plan, 1,250 had been terminated. All terminations were substantially complete as of December 31, 2009.
The table below summarizes the balance of accrued restructuring expenses for 2008 actions, which were included in the balance of "Other accrued expenses"equity method investees" in ourConsolidated Statements of Income andConsolidated Balance Sheets, respectively.
| In millions | Severance Costs | |||
|---|---|---|---|---|
2008 | ||||
Restructuring charges | $ | 37 | ||
Cash payments for 2008 actions | (3 | ) | ||
Balance at December 31, 2008 | 34 | |||
2009 | ||||
Cash payments for 2008 actions | (31 | ) | ||
Change in estimate | (3 | ) | ||
Balance at December 31, 2009 | $ | — | ||
CUMMINS INC. AND SUBSIDIARIES
NOTES TO CONSOLIDATED FINANCIAL STATEMENTS (Continued)
NOTE 3. RESTRUCTURINGINVESTMENTS IN EQUITY INVESTEES (Continued)
which are used in automotive and industrial applications. Products include transmission fluids, hydraulic lubricants, automotive filters, cooling system products, greases and specialty products.
CUMMINS INC. AND OTHER CHARGESSUBSIDIARIES
NOTES TO CONSOLIDATED FINANCIAL STATEMENTS (Continued)
NOTE 3. INVESTMENTS IN EQUITY INVESTEES (Continued)
Equity Investee Financial Summary
We do not include restructuring chargeshave approximately $469 million in the segment results. The pre-tax impact of allocating restructuring charges for the year endedour investment account at December 31, 2008, would have been2012, that represents cumulative undistributed income in our equity investees. Dividends from our unconsolidated equity investees were $329 million, $341 million and $178 million in 2012, 2011 and 2010, respectively. Summary financial information for our equity investees was as follows:
| In millions | Year ended December 31, 2008 | |||
|---|---|---|---|---|
Engine | $ | 17 | ||
Power Generation | 3 | |||
Components | 15 | |||
Distribution | 2 | |||
Total restructuring charges | $ | 37 | ||
| | As of and for the years ended December 31, | |||||||||
|---|---|---|---|---|---|---|---|---|---|---|
| In millions | 2012 | 2011 | 2010 | |||||||
Net sales | $ | 8,296 | $ | 8,659 | $ | 7,107 | ||||
Gross margin | 1,870 | 1,948 | 1,651 | |||||||
Net income | 747 | 788 | 668 | |||||||
Cummins share of net income | $ | 347 | $ | 375 | $ | 321 | ||||
Royalty and interest income | 37 | 41 | 30 | |||||||
Total equity, royalty and interest income from investees | $ | 384 | $ | 416 | $ | 351 | ||||
Current assets | $ | 2,843 | $ | 2,892 | ||||||
Non-current assets | 1,588 | 1,440 | ||||||||
Current liabilities | (2,039 | ) | (2,055 | ) | ||||||
Non-current liabilities | (431 | ) | (391 | ) | ||||||
Net assets | $ | 1,961 | $ | 1,886 | ||||||
Cummins share of net assets | $ | 886 | $ | 855 | ||||||
NOTE 4. INCOME TAXES
| | Years ended December 31, | ||||||||||
|---|---|---|---|---|---|---|---|---|---|---|---|
| In millions | 2009 | 2008 | 2007 | ||||||||
Income (loss) before income taxes: | |||||||||||
U.S. income | $ | (47 | ) | $ | (25 | ) | $ | 391 | |||
Foreign income | 687 | 1,203 | 778 | ||||||||
| $ | 640 | $ | 1,178 | $ | 1,169 | ||||||
The provision (benefit) for income taxes consists of the following:
| | Years ended December 31, | |||||||||||
|---|---|---|---|---|---|---|---|---|---|---|---|---|
| In millions | 2009 | 2008 | 2007 | |||||||||
Current: | ||||||||||||
U.S. federal and state | $ | 4 | $ | 16 | $ | 137 | ||||||
Foreign | 147 | 345 | 184 | |||||||||
Total current | 151 | 361 | 321 | |||||||||
Deferred: | ||||||||||||
U.S. federal and state | (38 | ) | (26 | ) | 1 | |||||||
Foreign | 43 | 25 | 59 | |||||||||
Total deferred | 5 | (1 | ) | 60 | ||||||||
Income tax expense | $ | 156 | $ | 360 | $ | 381 | ||||||
| | Years ended December 31, | |||||||||
|---|---|---|---|---|---|---|---|---|---|---|
| In millions | 2012 | 2011 | 2010 | |||||||
Income before income taxes | ||||||||||
U.S. income | $ | 998 | $ | 881 | $ | 242 | ||||
Foreign income | 1,273 | 1,790 | 1,375 | |||||||
Total | $ | 2,271 | $ | 2,671 | $ | 1,617 | ||||
CUMMINS INC. AND SUBSIDIARIES
NOTES TO CONSOLIDATED FINANCIAL STATEMENTS (Continued)
NOTE 4. INCOME TAXES (Continued)
Income tax expense consists of the following:
| | Years ended December 31, | |||||||||
|---|---|---|---|---|---|---|---|---|---|---|
| In millions | 2012 | 2011 | 2010 | |||||||
Current | ||||||||||
U.S. federal and state | $ | 118 | $ | 116 | $ | 11 | ||||
Foreign | 299 | 524 | 410 | |||||||
Total current | 417 | 640 | 421 | |||||||
Deferred | ||||||||||
U.S. federal and state | 108 | 69 | 49 | |||||||
Foreign | 8 | 16 | 7 | |||||||
Total deferred | 116 | 85 | 56 | |||||||
Income tax expense | $ | 533 | $ | 725 | $ | 477 | ||||
A reconciliation of the income tax provision at the U.S. federal income tax rate of 35 percent to the actual effective tax rate iswas as follows:
| | Years ended December 31, | ||||||||||
|---|---|---|---|---|---|---|---|---|---|---|---|
| | 2009 | 2008 | 2007 | ||||||||
U.S. federal statutory rate | 35.0 | % | 35.0 | % | 35.0 | % | |||||
State income tax, net of federal effect | (0.3 | ) | — | 1.4 | |||||||
Research tax credits | (2.4 | ) | (0.8 | ) | (1.3 | ) | |||||
Differences in rates and taxability of foreign subsidiaries and joint ventures | (5.5 | ) | (4.3 | ) | (2.4 | ) | |||||
Settlement of tax audits | — | (0.1 | ) | — | |||||||
Other, net | (2.4 | ) | 0.8 | (0.1 | ) | ||||||
Effective tax rate | 24.4 | % | 30.6 | % | 32.6 | % | |||||
| | Years ended December 31, | |||||||||
|---|---|---|---|---|---|---|---|---|---|---|
| | 2012 | 2011 | 2010 | |||||||
U.S. federal statutory rate | 35.0 | % | 35.0 | % | 35.0 | % | ||||
State income tax, net of federal effect | 1.0 | 0.4 | 0.6 | |||||||
Research tax credits | (0.4 | ) | (4.7 | ) | (1.3 | ) | ||||
Differences in rates and taxability of foreign subsidiaries and joint ventures | (12.1 | ) | (4.6 | ) | (4.7 | ) | ||||
Other, net | — | 1.0 | (0.1 | ) | ||||||
Effective tax rate | 23.5 | % | 27.1 | % | 29.5 | % | ||||
Except forOur income tax rates are generally less than the 35 percent U.S. statutory income tax rate primarily because of lower taxes on foreign earnings and research tax credits. Our 2012 income tax provision includes a one-time $134 million tax benefit resulting from transactions entered into and tax return elections made with respect to our United Kingdom (U.K.) group, we provide for the additional taxes that would be due upon the dividend distribution of the incomeoperations.
Retained earnings of our foreignU.K. domiciled subsidiaries and joint ventures assuming the full utilizationcertain Singapore, German and Indian subsidiaries are considered to be permanently reinvested. In addition, earnings of foreign tax credits. The unremitted income of the U.K. group isour China operations generated after December 31, 2011, are considered to be permanently reinvested and additional U.S. deferred tax is no longer being provided on these earnings generated after 2011. China's permanently reinvested earnings are expected to be used for items such as capital expenditures and to fund joint ventures in China. The total permanently reinvested retained earnings and related cumulative translation adjustment balances for these entities were $2.3 billion, $1.5 billion and $1.2 billion for the years ended December 31, 2012, 2011 and 2010, respectively. These amounts were determined primarily based on book retained earnings balances for these subsidiaries translated at historical rates. The determination of the deferred tax liability if any, that mightrelated to these retained earnings and cumulative translation adjustment balances which are considered to be due should that income be distributedpermanently reinvested outside the U.S. is not practicable. During 2009,We may periodically repatriate a portion of these earnings to the extent we released $19 million of deferred U.S.can do so essentially tax-free or at minimal tax liabilities related to prior years unremitted income of the Singapore subsidiaries of our U.K. group now considered to also be permanently reinvested. Income before income taxes includes equity income of foreign joint ventures of $117 million, $140 million and $118 million for the years ended December 31, 2009, 2008 and 2007, respectively. This equity income is recorded net of foreign taxes. Additional U.S. income taxes of $31 million, $30 million and $18 million for the years ended December 31, 2009, 2008 and 2007, respectively, were provided for the additional U.S. taxes that will ultimately be due upon the distribution of the foreign joint venture equity income.cost.
CUMMINS INC. AND SUBSIDIARIES
NOTES TO CONSOLIDATED FINANCIAL STATEMENTS (Continued)
NOTE 4. INCOME TAXES (Continued)
For our remaining subsidiary companies and joint ventures outside the U.S., we provide for the additional taxes that would be due upon the dividend distribution of the income of those foreign subsidiaries and joint ventures assuming the full utilization of foreign tax credits. Deferred taxes on unremitted earnings of foreign subsidiaries and joint ventures, including those in China generated in years prior to 2012, were $213 million and $222 million at December 31, 2012 and 2011, respectively. We have $702 million of retained earnings and related cumulative translation adjustments in our China operations generated prior to December 31, 2011, and have provided a U.S. deferred tax liability of $158 million relating to these earnings and related translation adjustments. We anticipate that these earnings will be distributed to the U.S. within the next five years.
Income before income taxes includes equity income of foreign joint ventures of $192 million, $234 million and $218 million for the years ended December 31, 2012, 2011 and 2010, respectively. This equity income is recorded net of foreign taxes. Additional U.S. income taxes of $9 million, $49 million and $50 million for the years ended December 31, 2012, 2011 and 2010, respectively, were provided for the additional U.S. taxes that will ultimately be due upon the distribution of the foreign joint venture equity income.
Carryforward tax benefits and the tax effect of temporary differences between financial and tax reporting that give rise to net deferred tax assets arewere as follows:
| | | December 31, | December 31, | ||||||||||||
|---|---|---|---|---|---|---|---|---|---|---|---|---|---|---|---|
| In millions | In millions | 2009 | 2008 | 2012 | 2011 | ||||||||||
Deferred tax assets: | |||||||||||||||
U.S. federal and state carryforward benefits | $ | 131 | $ | 27 | |||||||||||
Foreign carryforward benefits | 20 | 13 | |||||||||||||
Employee benefit plans | 429 | 474 | |||||||||||||
Warranty and marketing expenses | 309 | 341 | |||||||||||||
Deferred research and development expenses | 40 | 68 | |||||||||||||
Other | 115 | 163 | |||||||||||||
Deferred tax asset | |||||||||||||||
U.S. federal and state carryforward benefits | $ | 115 | $ | 86 | |||||||||||
Foreign carryforward benefits | 50 | 42 | |||||||||||||
Employee benefit plans | 369 | 334 | |||||||||||||
Warranty and marketing expenses | 308 | 302 | |||||||||||||
Deferred research and development expenses | — | 6 | |||||||||||||
Accrued expenses | 75 | 73 | |||||||||||||
Other | 78 | 47 | |||||||||||||
Gross deferred tax assets | Gross deferred tax assets | 1,044 | 1,086 | 995 | 890 | ||||||||||
Valuation allowance | Valuation allowance | (44 | ) | (25 | ) | (95 | ) | (71 | ) | ||||||
Total deferred tax assets | Total deferred tax assets | 1,000 | 1,061 | 900 | 819 | ||||||||||
Deferred tax liabilities: | |||||||||||||||
Property, plant and equipment | (146 | ) | (98 | ) | |||||||||||
Unremitted income of foreign subsidiaries and joint ventures | (100 | ) | (94 | ) | |||||||||||
Other | (25 | ) | (34 | ) | |||||||||||
Deferred tax liabilities | |||||||||||||||
Property, plant and equipment | (218 | ) | (158 | ) | |||||||||||
Unremitted income of foreign subsidiaries and joint ventures | (213 | ) | (222 | ) | |||||||||||
Other | (73 | ) | (22 | ) | |||||||||||
Total deferred tax liabilities | Total deferred tax liabilities | (271 | ) | (226 | ) | (504 | ) | (402 | ) | ||||||
Net deferred tax assets | Net deferred tax assets | $ | 729 | $ | 835 | $ | 396 | $ | 417 | ||||||
Our 2012 U.S. federal and state carryforward benefits include $65 million of foreign tax credit carryforward benefits that expire in 2019, $16 million of federal general business credit carryforward benefits that expire in 2029, and $50$115 million of state credit and net operating loss carryforward benefits that begin to expire in 2012.2013. Our foreign carryforward benefits include $20$50 million of net operating loss carryforwards that begin to expire in 2013. A valuation allowance is recorded to reduce the gross deferred tax assets to an amount we believe is more likely
CUMMINS INC. AND SUBSIDIARIES
NOTES TO CONSOLIDATED FINANCIAL STATEMENTS (Continued)
NOTE 4. INCOME TAXES (Continued)
than not to be realized. The valuation allowance increased in 20092012 by a net $19$24 million and increased in 20082011 by a net $1$21 million. The valuation allowance is primarily attributable to the uncertainty regarding the realization of a portion of the U.S. state and foreign net operating loss and tax credit carryforward benefits. Prepaid and other current assets includes deferred tax assets of $232 million and $268 million for the years ended December 31, 2012 and 2011, respectively. In addition, prepaid and other current assets includes refundable income taxes of $240 million and $45 million for the years ended December 31, 2012 and 2011, respectively. Other assets includes deferred tax assets of $177 million and $167 million for the years ended December 31, 2012 and 2011, respectively. Other liabilities and deferred revenue includes deferred tax liabilities of $13 million and $18 million for the years ended December 31, 2012 and 2011, respectively.
A reconciliation of the beginning and ending amount of unrecognized tax benefits was as follows:
| In millions | | |||
|---|---|---|---|---|
Balance at December 31, 2009 | $ | 56 | ||
Additions based on tax positions related to the current year | 2 | |||
Additions based on tax positions related to the prior years | 35 | |||
Reductions for tax positions related to prior years | (5 | ) | ||
Reductions for tax positions relating to lapse of statute of limitations | (3 | ) | ||
Balance at December 31, 2010 | 85 | |||
Additions based on tax positions related to the current year | 5 | |||
Additions based on tax positions related to the prior years | 44 | |||
Reductions for tax positions related to prior years | (3 | ) | ||
Reductions for tax positions relating to settlements with taxing authorities | (39 | ) | ||
Reductions for tax positions relating to lapse of statute of limitations | (6 | ) | ||
Balance at December 31, 2011 | 86 | |||
Additions based on tax positions related to the current year | 4 | |||
Additions based on tax positions related to the prior years | 57 | |||
Reductions for tax positions related to prior years | (2 | ) | ||
Balance at December 31, 2012 | $ | 145 | ||
Included in the December 31, 2012 and 2011, balances are $87 million and $75 million related to tax positions that, if recognized, would favorably impact the effective tax rate in future periods. Also, we had accrued interest expense related to the unrecognized tax benefits of $2 million, $7 million and $30 million as of December 31, 2012, 2011 and 2010, respectively. We recognize potential accrued interest and penalties related to unrecognized tax benefits in income tax expense. During the years ending December 31, 2012, 2011 and 2010, we recognized $(3) million, $(15) million and $5 million in net interest expense, respectively. In 2011, as a result of the settlement of certain tax positions with tax authorities in China, we reduced our liability for unrecognized tax benefits by $39 million and the related net accrued interest of $16 million. The $39 million reduction was fully offset by adjustments to other income tax balance sheet accounts resulting in zero net income statement impact. As the settlement with the tax authorities included no interest or penalties being incurred, we recognized a $16 million income tax benefit in 2011 from the release of the accrued interest previously recorded related to the unrecognized tax benefits that were settled.
CUMMINS INC. AND SUBSIDIARIES
NOTES TO CONSOLIDATED FINANCIAL STATEMENTS (Continued)
NOTE 4. INCOME TAXES (Continued)
On January 1, 2007,Audit outcomes and the FASB amended its existing accounting standards relatedtiming of audit settlements are subject to significant uncertainty. Although we believe that adequate provision has been made for such issues, there is the accounting for uncertainty in income taxes. The amended standards prescribe a recognition thresholdpossibility that a tax position is required to meet before being recognizedthe ultimate resolution of such issues could have an adverse effect on our earnings. Conversely, if these issues are resolved favorably in the financial statements and provide guidancefuture, the related provision would be reduced, thus having a positive impact on derecognition, measurement, classification, interest and penalties, accounting in interim periods, disclosure and transition rules. A reconciliation of the beginning and ending amount ofearnings. We do not expect any significant change to our unrecognized tax benefits is as follows:
| In millions | | |||
|---|---|---|---|---|
Balance at December 31, 2006 | $ | 49 | ||
Additions based on tax positions related to the current year | 4 | |||
Reductions for tax positions of prior years | (4 | ) | ||
Balance at December 31, 2007 | $ | 49 | ||
Additions based on tax positions related to the current year | 5 | |||
Additions based on tax positions related to the prior years | 5 | |||
Reductions for tax positions relating to settlements with taxing authorities | (2 | ) | ||
Balance at December 31, 2008 | $ | 57 | ||
Additions based on tax positions related to the current year | 1 | |||
Additions based on tax positions related to the prior years | 4 | |||
Reductions for tax positions related to prior years | (3 | ) | ||
Reductions for tax positions relating to settlements with taxing authorities | (5 | ) | ||
Effects of foreign currency translations | 2 | |||
Balance at December 31, 2009 | $ | 56 | ||
Included inwithin the December 31, 2009 and 2008, balances are $33 million related to tax positions that, if recognized, would favorably affect the effective tax rate in future periods. Also, we had accrued interest expense related to the unrecognized tax benefits of $22 million, $14 million and $11 million as of December 31, 2009, 2008 and 2007, respectively. We recognize potential accrued interest and penalties related to unrecognized tax benefits in income tax expense. During the years ending December 31, 2009, 2008 and 2007, we recognized approximately $4 million, $2 million and $2 million in interest expense, respectively.next year.
As a result of our global operations, we file income tax returns in various jurisdictions including U.S. federal, U.S. state and foreign jurisdictions. We are routinely subject to examination by taxing authorities throughout the world, including Australia, Belgium, Brazil, Canada, China, France, India, Mexico, the U.K. and the U.S. Our U.S. federal income tax returns have been examined through 2004. With few exceptions, our U.S. federal, major U.S. state and foreign jurisdictions are no longer subject to income tax examinationsassessments for years before 2004. Various U.S. state and foreign tax audits are currently underway; however, we do not expect any significant change to our unrecognized tax benefits within the next year.2009.
CUMMINS INC. AND SUBSIDIARIES
NOTES TO CONSOLIDATED FINANCIAL STATEMENTS (Continued)
NOTE 5. MARKETABLE SECURITIES
A summary of marketable securities, all of which are classified as current, iswas as follows:
| | | December 31, | December 31, | ||||||||||||||||||||||||||||||||||||
|---|---|---|---|---|---|---|---|---|---|---|---|---|---|---|---|---|---|---|---|---|---|---|---|---|---|---|---|---|---|---|---|---|---|---|---|---|---|---|---|
| | | 2009 | 2008 | 2012 | 2011 | ||||||||||||||||||||||||||||||||||
| In millions | In millions | Cost | Gross unrealized gains/(losses) | Estimated fair value | Cost | Gross unrealized gains/(losses) | Estimated fair value | Cost | Gross unrealized gains/(losses) | Estimated Fair Value | Cost | Gross unrealized gains/(losses) | Estimated Fair Value | ||||||||||||||||||||||||||
Available-for-sale: | |||||||||||||||||||||||||||||||||||||||
Debt mutual funds | $ | 123 | $ | — | $ | 123 | $ | 63 | $ | — | $ | 63 | |||||||||||||||||||||||||||
Bank debentures | 34 | — | 34 | — | — | — | |||||||||||||||||||||||||||||||||
Certificates of deposit | 21 | — | 21 | — | — | — | |||||||||||||||||||||||||||||||||
Government debt securities—non-U.S. | 4 | (1 | ) | 3 | 5 | — | 5 | ||||||||||||||||||||||||||||||||
Corporate debt securities | 2 | — | 2 | 6 | — | 6 | |||||||||||||||||||||||||||||||||
Equity securities and other | — | 7 | 7 | — | 3 | 3 | |||||||||||||||||||||||||||||||||
Available-for-sale | |||||||||||||||||||||||||||||||||||||||
Debt mutual funds | $ | 139 | $ | 3 | $ | 142 | $ | 115 | $ | 2 | $ | 117 | |||||||||||||||||||||||||||
Bank debentures | 45 | — | 45 | 82 | — | 82 | |||||||||||||||||||||||||||||||||
Certificates of deposit | 47 | — | 47 | 66 | — | 66 | |||||||||||||||||||||||||||||||||
Government debt securities-non-U.S. | 3 | — | 3 | 3 | — | 3 | |||||||||||||||||||||||||||||||||
Corporate debt securities | 1 | — | 1 | 2 | — | 2 | |||||||||||||||||||||||||||||||||
Equity securities and other | — | 9 | 9 | — | 7 | 7 | |||||||||||||||||||||||||||||||||
Total marketable securities | Total marketable securities | $ | 184 | $ | 6 | $ | 190 | $ | 74 | $ | 3 | $ | 77 | $ | 235 | $ | 12 | $ | 247 | $ | 268 | $ | 9 | $ | 277 | ||||||||||||||
Proceeds from sales and maturities of marketable securities were $335$585 million, $409$750 million and $395$690 million in 2009, 20082012, 2011 and 2007,2010, respectively. Gross realized gains from the sale of available-for-sale (AFS) securities were $2$3 million infor the year ended 20092012, $3 million for the year ended 2011 and less than $1 million for each of the yearsyear ended 2008 and 2007.2010. Gross realized losses from the sale of available-for-saleAFS securities were less than $1 million in 2009, 2008for the years ended December 31, 2012, 2011 and 2007.2010.
At December 31, 2009,2012, the fair value of available-for-saleAFS investments in debt securities by contractual maturity iswas as follows:
Maturity date | Fair value | Fair value | ||||||
|---|---|---|---|---|---|---|---|---|
| In millions | | | ||||||
1 year or less | $ | 34 | $ | 46 | ||||
1 - 5 years | 2 | 2 | ||||||
5 - 10 years | 2 | 1 | ||||||
After 10 years | 1 | |||||||
Total | $ | 39 | $ | 49 | ||||
CUMMINS INC. AND SUBSIDIARIES
NOTES TO CONSOLIDATED FINANCIAL STATEMENTS (Continued)
NOTE 6. FAIR VALUE OF FINANCIAL INSTRUMENTS
In September 2006, the FASB amended its existing fair value standards, which defines fair value, establishes a market-based framework for measuring fair value and expands disclosures about fair value measurements. The amended standards are applicable whenever another accounting pronouncement requires or permits assets and liabilities to be measured at fair value. The amended standards do not expand or require any new fair value measures. The standards are effective for financial assets and financial liabilities for fiscal years beginning after November 15, 2007. The FASB issued a partial deferral of the effective date of the amended standards that deferred the effective date for most non-financial assets and non-financial liabilities to fiscal years beginning after November 15, 2008. We adopted the amended standards prospectively for our fiscal year beginning January 1, 2008, except for non-financial assets and non-financial liabilities as deferred until January 1, 2009. The amended
CUMMINS INC. AND SUBSIDIARIES
NOTES TO CONSOLIDATED FINANCIAL STATEMENTS (Continued)
NOTE 6. FAIR VALUE OF FINANCIAL INSTRUMENTS (Continued)
standards do not require retroactive restatement of prior periods. The adoption did not materially impact ourConsolidated Financial Statements.
As defined by the amended standards, fairFair value is the price that would be received to sell an asset or paid to transfer a liability in an orderly transaction between market participants at the measurement date (exit price). We utilize market data or assumptions that market participants would use in pricing the asset or liability, including assumptions about risk and the risks inherent in the inputs to the valuation technique. These inputs can be readily observable, market corroborated, or generally unobservable. We primarily apply the market approach for recurring fair value measurements and utilize the best available information. Accordingly, we utilize valuation techniques that maximize the use of observable inputs and minimize the use of unobservable inputs. The company isWe are able to classify fair value balances based on the observability of those inputs. The amended standards establish a fair value hierarchy that prioritizes the inputs used to measure fair value. The hierarchy givesvalue giving the highest priority to unadjusted quoted prices in active markets for identical assets or liabilities (level(Level 1 measurement) and the lowest priority to unobservable inputs (level(Level 3 measurement). The three levels of the fair value hierarchy defined by GAAP are as follows:
Level 1—Quoted prices are available in active markets for identical assets or liabilities as of the reporting date. Active markets are those in which transactions for the asset or liability occur in sufficient frequency and volume to provide pricing information on an ongoing basis. Level 1 primarily consists of financial instruments such as listed equities and publicly traded bonds.
Level 2—Pricing inputs are other than quoted prices in active markets included in level 1, which are either directly or indirectly observable as of the reported date. Level 2 includes those financial instruments that are valued using models or other valuation methodologies. These models are primarily industry-standard models that consider various assumptions, including quoted forward prices for commodities, time value, volatility factors, and current market and contractual prices for the underlying instruments, as well as other relevant economic measures. Substantially all of these assumptions are observable in the marketplace throughout the full term of the instrument, can be derived from observable data or are supported by observable levels at which transactions are executed in the marketplace. Instruments in this category include non-exchange-traded derivatives such as over-the-counter forwards and options.
Level 3—Pricing inputs include significant inputs that are generally less observable from objective sources. These inputs may be used with internally developed methodologies that result in management's best estimate of fair value. At each balance sheet date, the company performs an analysis of all instruments subject to fair value accounting under GAAP and includes, in level 3, all of those whose fair value is based on significant unobservable inputs. At December 31, 2009,2012, we did not have any levelLevel 3 financial assets or liabilities, other than those in our pension plan (see Note 12)12, "PENSION BENEFITS AND OTHER POST RETIREMENT BENEFITS").
The majority of the assets and liabilities we carry at fair value are available-for-sale (AFS)AFS securities and derivatives. AFS securities are derived from levelLevel 1 or levelLevel 2 inputs. The predominance of market inputs are actively quoted and can be validated through external sources, including brokers, market transactions and third-party pricing services.
The fair value measurement of derivatives resultsare valued primarily from levelusing Level 2 inputs. Many of our derivative contracts are valued utilizing publicly available pricing data of contracts with similar terms. In other cases, the contracts are valued using current spot market data adjusted for the appropriate current forward curves provided by external financial institutions. We participate in commodity swap contracts, commodity zero-cost collar contracts, currency forward contracts and interest rate swaps. When material, we adjust the values of our derivative contracts for counter-party or our credit risk. There were no transfers into or out of Levels 2 or 3 during 2012.
CUMMINS INC. AND SUBSIDIARIES
NOTES TO CONSOLIDATED FINANCIAL STATEMENTS (Continued)
NOTE 6. FAIR VALUE OF FINANCIAL INSTRUMENTS (Continued)
The following table summarizes our financial instruments recorded at fair value in ourConsolidated Balance Sheets at December 31, 2012:
| | Fair Value Measurements Using | ||||||||||||
|---|---|---|---|---|---|---|---|---|---|---|---|---|---|
| In millions | Quoted prices in active markets for identical assets (Level 1) | Significant other observable inputs (Level 2) | Significant unobservable inputs (Level 3) | Total | |||||||||
Available-for-sale debt securities | |||||||||||||
Debt mutual funds | $ | 100 | $ | 42 | $ | — | $ | 142 | |||||
Bank debentures | — | 45 | — | 45 | |||||||||
Certificates of deposit | — | 47 | — | 47 | |||||||||
Government debt securities-non-U.S. | — | 3 | — | 3 | |||||||||
Corporate debt securities | — | 1 | — | 1 | |||||||||
Available-for-sale equity securities | |||||||||||||
Financial services industry | 9 | — | — | 9 | |||||||||
Derivative assets | |||||||||||||
Interest rate contracts | — | 88 | — | 88 | |||||||||
Foreign currency forward contracts | — | 3 | — | 3 | |||||||||
Commodity swap contracts | — | 1 | — | 1 | |||||||||
Commodity call option contracts | — | 1 | — | 1 | |||||||||
Total assets | $ | 109 | $ | 231 | $ | — | $ | 340 | |||||
Derivative liabilities | |||||||||||||
Commodity swap contracts | — | 2 | — | 2 | |||||||||
Commodity put option contracts | — | 1 | — | 1 | |||||||||
Total liabilities | $ | — | $ | 3 | $ | — | $ | 3 | |||||
The substantial majority of our assets were valued utilizing a market approach. A description of the valuation techniques and inputs used for our Level 2 fair value measures are as follows:
Debt mutual funds—Assets in Level 2 consist of exchange traded mutual funds that lack sufficient trading volume to be classified at Level 1. The fair value measure for these investments is the daily net asset value published on a regulated governmental website. Daily quoted prices are available from the issuing brokerage and are used on a test basis to corroborate this Level 2 input.
Bank debentures and Certificates of deposit—These investments provide us with a fixed rate of return and generally range in maturity from six months to three years. The counter-parties to these investments are reputable financial institutions with investment grade credit ratings. Since these instruments are not tradable and must be settled directly by us with the respective financial institution, our fair value measure is the financial institutions' month-end statement.
Government debt securities-non-U.S. and Corporate debt securities —The fair value measure for these securities are broker quotes received from reputable firms. These securities are infrequently traded on a national stock exchange and these values are used on a test basis to corroborate our Level 2 input measure.
other cases, theTable of Contents
CUMMINS INC. AND SUBSIDIARIES
NOTES TO CONSOLIDATED FINANCIAL STATEMENTS (Continued)
NOTE 6. FAIR VALUE OF FINANCIAL INSTRUMENTS (Continued)
Foreign currency forward contracts—The fair value measure for these contracts are valued usingdetermined based on forward foreign exchange rates received from third-party pricing services. These rates are based upon market transactions and are periodically corroborated by comparing to third-party broker quotes.
Commodity swap contracts—The fair value measure for these contracts are current spot market data adjusted for the appropriate current forward curves provided by external financial institutions. The current spot price is the most significant component of this valuation and is based upon market transactions. We participate in commodity swapuse third-party pricing services for the spot price component of this valuation which is periodically corroborated by market data from broker quotes.
Commodity call and put option contracts currency forward—We utilize the month-end statement from the issuing financial institution as our fair value measure for this investment. We corroborate this valuation through the use of a third-party pricing service for similar assets and liabilities.
Interest rate contracts and—We currently have only one interest rate swaps. When material, we adjustcontract. We utilize the valuesmonth-end statement from the issuing financial institution as our fair value measure for this investment. We corroborate this valuation through the use of our derivative contractsa third-party pricing service for counter-party or our credit risk.similar assets and liabilities.
The following tables summarize our financial instruments recorded at fair value in ourConsolidated Balance Sheets at December 31, 2009 and 2008:2011:
| | Fair Value Measurements as of December 31, 2009, Using | ||||||||||||
|---|---|---|---|---|---|---|---|---|---|---|---|---|---|
| In millions | Quoted prices in active markets for identical assets (Level 1) | Significant other observable inputs (Level 2) | Significant unobservable inputs (Level 3) | Total | |||||||||
Available-for-sale securities | $ | 127 | $ | 63 | $ | — | $ | 190 | |||||
Derivative assets | — | 42 | — | 42 | |||||||||
Derivative liabilities | — | (1 | ) | — | (1 | ) | |||||||
Total | $ | 127 | $ | 104 | $ | — | $ | 231 | |||||
| | Fair Value Measurements Using | ||||||||||||
|---|---|---|---|---|---|---|---|---|---|---|---|---|---|
| In millions | Quoted prices in active markets for identical assets (Level 1) | Significant other observable inputs (Level 2) | Significant unobservable inputs (Level 3) | Total | |||||||||
Available-for-sale debt securities | |||||||||||||
Debt mutual funds | $ | 53 | $ | 64 | $ | — | $ | 117 | |||||
Bank debentures | — | 82 | — | 82 | |||||||||
Certificates of deposit | — | 66 | — | 66 | |||||||||
Government debt securities-non-U.S. | — | 3 | — | 3 | |||||||||
Corporate debt securities | — | 2 | — | 2 | |||||||||
Available-for-sale equity securities | |||||||||||||
Financial services industry | 7 | — | — | 7 | |||||||||
Derivative assets | |||||||||||||
Interest rate contracts | — | 82 | — | 82 | |||||||||
Total assets | $ | 60 | $ | 299 | $ | — | $ | 359 | |||||
Derivative liabilities | |||||||||||||
Commodity swap contracts | — | 22 | — | 22 | |||||||||
Foreign currency forward contracts | — | 8 | — | 8 | |||||||||
Total liabilities | $ | — | $ | 30 | $ | — | $ | 30 | |||||
| | Fair Value Measurements as of December 31, 2008, Using | ||||||||||||
|---|---|---|---|---|---|---|---|---|---|---|---|---|---|
| In millions | Quoted prices in active markets for identical assets (Level 1) | Significant other observable inputs (Level 2) | Significant unobservable inputs (Level 3) | Total | |||||||||
Available-for-sale securities | $ | 59 | $ | 18 | $ | — | $ | 77 | |||||
Derivative assets | — | 80 | — | 80 | |||||||||
Derivative liabilities | — | (81 | ) | — | (81 | ) | |||||||
Total | $ | 59 | $ | 17 | $ | — | $ | 76 | |||||
CUMMINS INC. AND SUBSIDIARIES
NOTES TO CONSOLIDATED FINANCIAL STATEMENTS (Continued)
NOTE 6. FAIR VALUE OF FINANCIAL INSTRUMENTS (Continued)
Fair Value of Other Financial Instruments
Based on borrowing rates currently available to us for bank loans with similar terms and average maturities, considering our risk premium, the fair value and carrying value of total debt, including current maturities, at December 31, 20092012 and 2008,December 31, 2011, are set forth in the table below. The carrying values of all other receivables and liabilities approximated fair values.values (derived from Level 2 inputs).
| | December 31, | ||||||
|---|---|---|---|---|---|---|---|
| In millions | 2009 | 2008 | |||||
Fair value | $ | 674 | $ | 567 | |||
Carrying value | 703 | 698 | |||||
| | December 31, | ||||||
|---|---|---|---|---|---|---|---|
| In millions | 2012 | 2011 | |||||
Fair value of total debt | $ | 926 | $ | 901 | |||
Carrying value of total debt | 775 | 783 | |||||
CUMMINS INC. AND SUBSIDIARIES
NOTES TO CONSOLIDATED FINANCIAL STATEMENTS (Continued)
NOTE 7. INVENTORIES
Inventories includeare stated at the lower of cost or market. Inventories included the following:
| | December 31, | December 31, | ||||||||||||
|---|---|---|---|---|---|---|---|---|---|---|---|---|---|---|
| In millions | 2009 | 2008 | 2012 | 2011 | ||||||||||
Finished products | $ | 785 | $ | 860 | $ | 1,393 | $ | 1,220 | ||||||
Work-in-process and raw materials | 638 | 1,021 | 939 | 1,019 | ||||||||||
Inventories at FIFO cost | 1,423 | 1,881 | 2,332 | 2,239 | ||||||||||
Excess of FIFO over LIFO | (82 | ) | (98 | ) | (111 | ) | (98 | ) | ||||||
Total inventories | $ | 1,341 | $ | 1,783 | $ | 2,221 | $ | 2,141 | ||||||
NOTE 8. PROPERTY, PLANT AND EQUIPMENT
Details of our property, plant and equipment balance arewere as follows:
| | December 31, | ||||||
|---|---|---|---|---|---|---|---|
| In millions | 2012 | 2011 | |||||
Land and buildings | $ | 1,228 | $ | 1,001 | |||
Machinery, equipment and fixtures | 3,910 | 3,562 | |||||
Construction in process | 738 | (1) | 682 | ||||
Property, plant and equipment, gross | 5,876 | 5,245 | |||||
Less: Accumulated depreciation | (3,152 | ) | (2,957 | ) | |||
Property, plant and equipment, net | $ | 2,724 | $ | 2,288 | |||
| | December 31, | ||||||
|---|---|---|---|---|---|---|---|
| In millions | 2009 | 2008 | |||||
Land and buildings | $ | 868 | $ | 799 | |||
Machinery, equipment and fixtures | 3,494 | 3,265 | |||||
Construction in process | 403 | (1) | 475 | ||||
| 4,765 | 4,539 | ||||||
Less: accumulated depreciation | (2,879 | ) | (2,698 | ) | |||
Property, plant and equipment, net | $ | 1,886 | $ | 1,841 | |||
Table of December 31, 2009.Contents
CUMMINS INC. AND SUBSIDIARIES
NOTES TO CONSOLIDATED FINANCIAL STATEMENTS (Continued)
NOTE 9. GOODWILL AND OTHER INTANGIBLE ASSETS
The following table summarizes the changes in the carrying amount of goodwill for 20092012 and 2008:2011:
| In millions | Components | Power Generation | Engine | Distribution | Total | ||||||||||||
|---|---|---|---|---|---|---|---|---|---|---|---|---|---|---|---|---|---|
Goodwill at December 31, 2007 | $ | 339 | $ | 13 | $ | 6 | $ | 7 | $ | 365 | |||||||
Additions | — | — | — | — | — | ||||||||||||
Dispositions | — | — | — | — | — | ||||||||||||
Translation and other | (3 | ) | — | — | — | (3 | ) | ||||||||||
Goodwill at December 31, 2008 | 336 | 13 | 6 | 7 | 362 | ||||||||||||
Additions | — | — | — | — | — | ||||||||||||
Dispositions | — | — | — | — | — | ||||||||||||
Translation and other | 1 | — | — | 1 | 2 | ||||||||||||
Goodwill at December 31, 2009 | $ | 337 | $ | 13 | $ | 6 | $ | 8 | $ | 364 | |||||||
| In millions | Components | Distribution | Power Generation | Engine | Total | |||||||||||
|---|---|---|---|---|---|---|---|---|---|---|---|---|---|---|---|---|
Goodwill at December 31, 2010 | $ | 338 | $ | 11 | $ | 12 | $ | 6 | $ | 367 | ||||||
Divestitures | (25 | ) | — | — | — | (25 | ) | |||||||||
Translation and other | (2 | ) | (1 | ) | — | — | (3 | ) | ||||||||
Goodwill at December 31, 2011 | 311 | 10 | 12 | 6 | 339 | |||||||||||
Acquisitions | 91 | 9 | — | — | 100 | |||||||||||
Translation and other | 6 | — | — | — | 6 | |||||||||||
Goodwill at December 31, 2012 | $ | 408 | $ | 19 | $ | 12 | $ | 6 | $ | 445 | ||||||
CUMMINS INC. AND SUBSIDIARIES
NOTES TO CONSOLIDATED FINANCIAL STATEMENTS (Continued)
NOTE 9. GOODWILL AND OTHER INTANGIBLE ASSETS (Continued)
We have elected to perform the annual impairment test of our recorded goodwill as required by GAAP as of the end of our third quarter. The results of this annual impairment test indicated that the fair value of each of our reporting units as of September 27, 2009 and September 28, 2008, exceeded their carrying, or book value, including goodwill, and therefore our recorded goodwill was not subject to impairment. The fair value was determined utilizing the expected present value of future cash flows.
Intangible assets that have finite useful lives are amortized over their estimated useful lives. The following table summarizes our other intangible assets with finite useful lives that are subject to amortization:
| | | December 31, | December 31, | ||||||||||||
|---|---|---|---|---|---|---|---|---|---|---|---|---|---|---|---|
| In millions | In millions | 2009 | 2008 | 2012 | 2011 | ||||||||||
Software | Software | $ | 407 | $ | 343 | $ | 495 | $ | 409 | ||||||
Accumulated amortization | (190 | ) | (138 | ) | |||||||||||
Less: Accumulated amortization | (218 | ) | (191 | ) | |||||||||||
Net software | 277 | 218 | |||||||||||||
Trademarks, patents and other | 140 | 44 | |||||||||||||
Less: Accumulated amortization | (48 | ) | (35 | ) | |||||||||||
Net software | 217 | 205 | |||||||||||||
Trademarks, patents and other | 34 | 34 | |||||||||||||
Accumulated amortization | (23 | ) | (16 | ) | |||||||||||
Net trademarks, patents and other | 11 | 18 | |||||||||||||
Net trademarks, patents and other | 92 | 9 | |||||||||||||
Total | Total | $ | 228 | $ | 223 | $ | 369 | $ | 227 | ||||||
Amortization expense for software and other intangibles totaled $55$64 million, $50$57 million and $31$69 million for the years ended December 31, 2009, 20082012, 2011 and 2007,2010, respectively. Internal and external software costs (excluding those related to research, re-engineering and training), trademarks and patents are amortized generally over a three to five-year12 year period. The following table represents the projected amortization expense of our intangible assets, assuming no further acquisitions or dispositions.
| | For the years ended | For the years ended | ||||||||||||||||||||||||||||||
|---|---|---|---|---|---|---|---|---|---|---|---|---|---|---|---|---|---|---|---|---|---|---|---|---|---|---|---|---|---|---|---|---|
| In millions | 2010 | 2011 | 2012 | 2013 | 2014 | 2013 | 2014 | 2015 | 2016 | 2017 - 2018 | ||||||||||||||||||||||
Projected amortization expense | $ | 68 | $ | 60 | $ | 49 | $ | 34 | $ | 13 | $ | 77 | $ | 74 | $ | 72 | $ | 66 | $ | 56 | ||||||||||||
NOTE 10. DEBT
Loans payable at December 31, 20092012 and 20082011 were $37$16 million and $39$28 million, respectively, and consistconsisted primarily of notes payable to financial institutions. The weighted-average interest rate for notes payable, bank overdrafts and current maturities of long-term debt at December 31, 2009, 2008 and 2007, was as follows:
| | December 31, | |||||||||
|---|---|---|---|---|---|---|---|---|---|---|
| | 2009 | 2008 | 2007 | |||||||
Weighted average interest rate | 5.61 | 7.03 | 7.43 | |||||||
CUMMINS INC. AND SUBSIDIARIES
NOTES TO CONSOLIDATED FINANCIAL STATEMENTS (Continued)
NOTE 10. DEBT (Continued)
notes payable, bank overdrafts and current maturities of long-term debt at December 31, 2012, 2011 and 2010, was as follows:
| | December 31, | |||||||||
|---|---|---|---|---|---|---|---|---|---|---|
| | 2012 | 2011 | 2010 | |||||||
Weighted average interest rate | 3.21 | 4.19 | 4.76 | |||||||
For the years ended December 31, 2009, 20082012, 2011 and 2007,2010, total interest incurred was $41$39 million, $53$48 million and $63$45 million, respectively. For the same respective periods, interest capitalized was $6$7 million, $11$4 million and $5 million.
On June 30, 2008,November 9, 2012, we entered into a three-yearfive-year revolving credit agreement with a syndicate of lenders. The credit agreement provides us with a $1.1$1.75 billion senior unsecured revolving credit facility, the proceeds of which are to be used by us for working capital or other general corporate purposes.
The credit facility matures on June 30, 2011.November 9, 2017. Amounts payable under our revolving credit facility will rank pro rata with all of our other unsecured, unsubordinated indebtedness. Up to $100$200 million under our credit facility is available for swingline loans denominated in U.S. dollars. Advances under the facility bear interest at (i) a base rate or (ii) a rate equal to the LIBOR Rate plus an applicable margin based on the credit ratings of our outstanding senior unsecured long-term debt. Based on our current long-term debt ratings, the applicable margin on LIBOR Rate loans was 0.750.875 percent per annum as of December 31, 2009.2012. Advances under the facility may be prepaid without premium or penalty, subject to customary breakage costs.
The credit agreement includes various covenants, including, among others, maintaining a leverage ratio of no more than 3.0 to 1.0 and maintaining fixed charge coverage ratio of at least 1.53.25 to 1.0. As of December 31, 2009,2012, we were in compliance with all such covenants, including our leverage ratio of 0.6 to 1.0 and our fixed charge coverage ratio of 22.5 to 1.0.the covenants.
The table below is a reconciliation of the maximum capacity of our revolver to the amount available under the facility as of December 31, 2009 and 2008.2012. There were no outstanding borrowings under this facility at December 31, 2009.2012.
| | | Revolving Credit Capacity at December 31, | ||||||||||
|---|---|---|---|---|---|---|---|---|---|---|---|---|
| In millions | In millions | 2009 | 2008 | Revolving Credit Capacity at December 31, 2012 | ||||||||
Maximum credit capacity of the revolving credit facility | Maximum credit capacity of the revolving credit facility | $ | 1,100 | $ | 1,100 | $ | 1,750 | |||||
Less: | ||||||||||||
Letters of credit against revolving credit facility | 35 | 39 | ||||||||||
Less: Letters of credit against revolving credit facility | 23 | |||||||||||
Amount available for borrowing under the revolving credit facility | Amount available for borrowing under the revolving credit facility | $ | 1,065 | $ | 1,061 | $ | 1,727 | |||||
As of December 31, 2009,2012, we also had $229$301 million available for borrowings under our international and other domestic short-term credit facilities. Commitments against the other domestic and international facilities were $37$16 million as of December 31, 20092012 and $39$28 million at the end of 2008.2011.
CUMMINS INC. AND SUBSIDIARIES
NOTES TO CONSOLIDATED FINANCIAL STATEMENTS (Continued)
NOTE 10. DEBT (Continued)
| | | December 31, | December 31, | ||||||||||||
|---|---|---|---|---|---|---|---|---|---|---|---|---|---|---|---|
| In millions | In millions | 2009 | 2008 | 2012 | 2011 | ||||||||||
Long-term debt: | |||||||||||||||
Long-term debt | |||||||||||||||
Export financing loan, 4.5%, due 2012 | $ | — | $ | 31 | |||||||||||
Export financing loan, 4.5%, due 2013 | 23 | 44 | |||||||||||||
Debentures, 6.75%, due 2027 | 58 | 58 | |||||||||||||
Debentures, 7.125%, due 2028 | 250 | 250 | |||||||||||||
Debentures, 5.65%, due 2098 (effective interest rate 7.48%) | 165 | 165 | |||||||||||||
Other | 157 | 90 | |||||||||||||
Export financing loan, 4.5%, due 2012 | $ | 49 | $ | — | |||||||||||
Debentures, 6.75%, due 2027 | 58 | 58 | 653 | 638 | |||||||||||
Debentures, 7.125%, due 2028 | 250 | 250 | |||||||||||||
Debentures, 5.65%, due 2098 (effective interest rate 7.48%) | 165 | 165 | |||||||||||||
Other | 39 | 44 | |||||||||||||
| 561 | 517 | ||||||||||||||
Unamortized discount | (36 | ) | (37 | ) | |||||||||||
Fair value adjustment due to hedge on indebtedness | 25 | 79 | |||||||||||||
Capital leases | 117 | 100 | |||||||||||||
Unamortized discount | (35 | ) | (36 | ) | |||||||||||
Fair value adjustments due to hedge on indebtedness | 88 | 82 | |||||||||||||
Capital leases | 53 | 71 | |||||||||||||
Total long-term debt | Total long-term debt | 667 | 659 | 759 | 755 | ||||||||||
Less current maturities of long-term debt | (30 | ) | (30 | ) | |||||||||||
Less: Current maturities of long-term debt | (61 | ) | (97 | ) | |||||||||||
Long-term debt | Long-term debt | $ | 637 | $ | 629 | $ | 698 | $ | 658 | ||||||
Principal payments required on long-term debt during the next five years are:
| | Required principal payments | Required Principal Payments | ||||||||||||||||||||||||||||||
|---|---|---|---|---|---|---|---|---|---|---|---|---|---|---|---|---|---|---|---|---|---|---|---|---|---|---|---|---|---|---|---|---|
| In millions | 2010 | 2011 | 2012 | 2013 | 2014 | 2013 | 2014 | 2015 | 2016 | 2017 | ||||||||||||||||||||||
Payment | $ | 30 | $ | 46 | $ | 67 | $ | 23 | $ | 17 | $ | 61 | $ | 41 | $ | 72 | $ | 20 | $ | 13 | ||||||||||||
Interest on the 6.75% debentures is payable on February 15 and August 15 each year. The debentures were redeemable at our option after February 15, 2007, at a redemption price of par value plus accrued interest or an amount designed to ensure that the debenture holders were not penalized by the early redemption.
Interest on the $250 million 7.125% debentures and $165 million 5.65% debentures is payable on March 1 and September 1 of each year. The debentures are unsecured and are not subject to any sinking fund requirements. We can redeem the 7.125% debentures and the 5.65% debentures at any time prior to maturity at the greater of par plus accrued interest or an amount designed to ensure that the debenture holders are not penalized by the early redemption.
In OctoberDuring 2010, two of our wholly-owned Brazilian subsidiaries entered into a loan agreement for a loan in local currency in an amount equivalent to US $50 million, at drawdown, at a fixed rate of 4.5 percent to finance its exports over the next three years. The principal of the loan had a two-year grace period and began amortizing in 2012.
During 2009, ourone wholly-owned subsidiary, Cummins Brasil Ltda, entered into a loan agreement with the Brazil development bank, BNDES, for a loan in local currency in an amount equivalent to US $45 million, at drawdown, at a fixed rate of 4.5 percent to finance its exports over the next three years. The principal of the loan hashad a two-year grace period and will beginwhich began amortizing in 2011.2011 and was completed in August of 2012.
Our debt agreements contain several restrictive covenants. The most restrictive of these covenants applies to our revolving credit facility which will upon default, among other things, limit our ability to
CUMMINS INC. AND SUBSIDIARIES
NOTES TO CONSOLIDATED FINANCIAL STATEMENTS (Continued)
NOTE 10. DEBT (Continued)
incur additional debt or issue preferred stock, enter into sale-leaseback transactions, pay dividends, sell or create liens on our assets, make investments and merge or consolidate with any other person. In addition, we are subject to various financial covenants including a maximum debt-to-EBITDA ratio and a minimum interest coverage ratio.financial covenant. As of December 31, 2009,2012, we were in compliance with all of the covenants under our borrowing agreements.
CUMMINS INC. AND SUBSIDIARIES
NOTES TO CONSOLIDATED FINANCIAL STATEMENTS (Continued)
NOTE 11. PRODUCT WARRANTY LIABILITY
A summaryWe charge the estimated costs of warranty programs, other than product recalls, to income at the time products are shipped to customers. We use historical claims experience to develop the estimated liability. We review product recall programs on a quarterly basis and, if necessary, record a liability when we commit to an action or when they become probable and estimable, which is reflected in the provision for warranties issued line. We also sell extended warranty coverage on several engines. The following is a tabular reconciliation of the activity in ourproduct warranty liability, account, which includes warranty provisions and payments, changes in our estimates for pre-existing warranties and changes in ourincluding the deferred revenue balances associated withrelated to our extended warranty programs is as follows:coverage and accrued recall programs:
| | December 31, | December 31, | ||||||||||||
|---|---|---|---|---|---|---|---|---|---|---|---|---|---|---|
| In millions | 2009 | 2008 | 2012 | 2011 | ||||||||||
Balance, beginning of year | $ | 962 | $ | 749 | $ | 1,014 | $ | 980 | ||||||
Provision for warranties issued | 364 | 413 | 415 | 428 | ||||||||||
Deferred revenue on extended warranty contracts sold | 109 | 103 | 210 | 124 | ||||||||||
Payments | (472 | ) | (383 | ) | (416 | ) | (409 | ) | ||||||
Amortization of deferred revenue on extended warranty contracts | (72 | ) | (64 | ) | (103 | ) | (95 | ) | ||||||
Changes in estimates for pre-existing warranties | 84 | 177 | (33 | ) | (7 | ) | ||||||||
Foreign currency translation | 14 | (33 | ) | 1 | (7 | ) | ||||||||
Balance, end of year | $ | 989 | $ | 962 | $ | 1,088 | $ | 1,014 | ||||||
CUMMINS INC. AND SUBSIDIARIES
NOTES TO CONSOLIDATED FINANCIAL STATEMENTS (Continued)
NOTE 11. PRODUCT WARRANTY LIABILITY (Continued)
The current portion of our warranty balance is presented as "Current portion of accrued product warranty." TheWarranty related deferred revenue, related to extended warranty programs at December 31, 2009 and 2008, was $262 million and $224 million, respectively. The current portion of deferred revenue is included in "Deferred revenue"supplier recovery receivables and the long-term portion is included in "Other liabilities and deferred revenue" inof the warranty liability on ourConsolidated Balance Sheets. were as follows:
During 2008 and 2009, actual cost trends for certain midrange engine products, including product launched in 2007 and for which warranty periods can extend to five years, indicated higher per claim repair cost than the product on which the initial accrual rate was developed. These products include more electronic parts than historical models contributing to the higher cost per claim. In addition, certain products introduced in 2003 and sold prior to 2007 for which the warranty period extended five years also demonstrated a higher cost per claim than that of predecessor products. We increased our liability in 2008 and 2009 as these experience trends became evident.
| | December 31, | | ||||||
|---|---|---|---|---|---|---|---|---|
| In millions | 2012 | 2011 | Balance Sheet Locations | |||||
Deferred revenue related to extended coverage programs | ||||||||
Current portion | $ | 111 | $ | 103 | Deferred revenue | |||
Long-term portion | 309 | 210 | Other liabilities and deferred revenue | |||||
Total | $ | 420 | $ | 313 | ||||
Receivables related to estimated supplier recoveries | ||||||||
Current portion | $ | 7 | $ | 7 | Trade and other receivables | |||
Long-term portion | 6 | 7 | Other assets | |||||
Total | $ | 13 | $ | 14 | ||||
Long-term portion of warranty liability | $ | 282 | $ | 279 | Other liabilities and deferred revenue | |||
NOTE 12. PENSION AND OTHER POSTRETIREMENT BENEFITS
We sponsor several contributory and noncontributory pension plans covering substantially all employees. Generally, hourly employee pension benefits are earned based on years of service and compensation during active employment while future benefits for salaried employees are determined using a cash balance formula. However, the level of benefits and terms of vesting may vary among plans. Pension plan assets are administered by trustees and are principally invested in equity securities and fixed income securities. It is our policy to make contributions to our various qualified plans in accordance with statutory and contractual funding requirements and any additional contributions we determine are appropriate.
Obligations, Assets and Funded Status
The following tables present the changes in the benefit obligations and the various plan assets, the funded status of the plans, and the amounts recognized in ourConsolidated Balance Sheets for our
CUMMINS INC. AND SUBSIDIARIES
NOTES TO CONSOLIDATED FINANCIAL STATEMENTS (Continued)
NOTE 12. PENSION AND OTHER POSTRETIREMENT BENEFITS (Continued)
significant pension plans. Non-U.S. plans represent plans sponsored in the U.K. Benefit obligation balances presented below reflect the projected benefit obligation (PBO) for our pension plans.
| | U.S. Plans | Non-U.S. Plans | |||||||||||
|---|---|---|---|---|---|---|---|---|---|---|---|---|---|
| In millions | 2009 | 2008 | 2009 | 2008 | |||||||||
Change in benefit obligation | |||||||||||||
Benefit obligation at beginning of year | $ | 1,949 | $ | 1,959 | $ | 861 | $ | 1,155 | |||||
Service cost | 47 | 52 | 18 | 28 | |||||||||
Interest cost | 115 | 124 | 57 | 70 | |||||||||
Plan participants' contributions | — | — | 1 | 1 | |||||||||
Actuarial losses (gains) | 120 | (27 | ) | 108 | (25 | ) | |||||||
Benefits paid from fund | (176 | ) | (153 | ) | (58 | ) | (43 | ) | |||||
Benefits paid directly by Company | (8 | ) | (6 | ) | — | — | |||||||
Exchange rate changes | — | — | 99 | (325 | ) | ||||||||
Curtailment loss (gain) | 5 | — | (10 | ) | — | ||||||||
Other | 1 | — | (1 | ) | — | ||||||||
Benefit obligation at end of year | $ | 2,053 | $ | 1,949 | $ | 1,075 | $ | 861 | |||||
Change in plan assets | |||||||||||||
Fair value of plan assets at beginning of year | $ | 1,484 | $ | 1,949 | $ | 745 | $ | 1,217 | |||||
Actual return on plan assets | 269 | (383 | ) | 134 | (175 | ) | |||||||
Company contributions | 100 | 70 | 21 | 36 | |||||||||
Plan participants' contributions | — | — | 1 | 1 | |||||||||
Benefits paid | (176 | ) | (153 | ) | (58 | ) | (43 | ) | |||||
Exchange rate changes | — | — | 86 | (291 | ) | ||||||||
Other | — | 1 | — | — | |||||||||
Fair value of plan assets at end of year | $ | 1,677 | $ | 1,484 | $ | 929 | $ | 745 | |||||
Funded status (including underfunded and nonfunded plans) at end of year | $ | (376 | ) | $ | (465 | ) | $ | (146 | ) | $ | (116 | ) | |
Amounts recognized in consolidated balance sheets | |||||||||||||
Accrued compensation, benefits and retirement costs—current liabilities | $ | (8 | ) | $ | (7 | ) | $ | — | $ | — | |||
Pensions—long-term liabilities | (368 | ) | (458 | ) | (146 | ) | (116 | ) | |||||
Net amount recognized | $ | (376 | ) | $ | (465 | ) | $ | (146 | ) | $ | (116 | ) | |
Amounts recognized in accumulated other comprehensive loss consist of: | |||||||||||||
Net actuarial loss | $ | 801 | $ | 837 | $ | 364 | $ | 322 | |||||
Prior service (credit) cost | (6 | ) | (8 | ) | 6 | 8 | |||||||
Net amount recognized | $ | 795 | $ | 829 | $ | 370 | $ | 330 | |||||
In addition to the pension plans in the above table, we also maintain less significant defined benefit pension plans in 11 other countries outside the U.S. and the U.K. that comprise less than three
CUMMINS INC. AND SUBSIDIARIES
NOTES TO CONSOLIDATED FINANCIAL STATEMENTS (Continued)
NOTE 12. PENSION AND OTHER POSTRETIREMENT BENEFITS (Continued)
percent of our pension plan assets and obligations. These plans are reflected in "Other liabilities and deferred revenue" on ourConsolidated Balance Sheets.
The following table presents information regarding underfunded pension plans that are included in the preceding table:
| | U.S. Plans | Non-U.S. Plans | ||||||||||||
|---|---|---|---|---|---|---|---|---|---|---|---|---|---|---|
| | December 31, | |||||||||||||
| In millions | 2009 | 2008 | 2009 | 2008 | ||||||||||
Total accumulated benefit obligation | $ | 2,033 | $ | 1,931 | $ | 1,019 | $ | 810 | ||||||
Plans with accumulated benefit obligation in excess of plan assets: | ||||||||||||||
Accumulated benefit obligation | 2,033 | 1,931 | 1,019 | 810 | ||||||||||
Fair value of plan assets | 1,677 | 1,484 | 929 | 745 | ||||||||||
Plans with projected benefit obligation in excess of plan assets: | ||||||||||||||
Projected benefit obligation | 2,053 | 1,949 | 1,075 | 861 | ||||||||||
Fair value of plan assets | 1,677 | 1,484 | 929 | 745 | ||||||||||
Components of Net Periodic Pension Cost
The following table presents the net periodic pension cost under our plans:
| | U.S. Plans | Non-U.S. Plans | |||||||||||||||||
|---|---|---|---|---|---|---|---|---|---|---|---|---|---|---|---|---|---|---|---|
| In millions | 2009 | 2008 | 2007 | 2009 | 2008 | 2007 | |||||||||||||
Service cost | $ | 47 | $ | 48 | $ | 45 | $ | 18 | $ | 26 | $ | 33 | |||||||
Interest cost | 115 | 115 | 107 | 57 | 65 | 63 | |||||||||||||
Expected return on plan assets | (142 | ) | (150 | ) | (140 | ) | (60 | ) | (73 | ) | (71 | ) | |||||||
Amortization of prior service cost (credit) | (1 | ) | (1 | ) | (1 | ) | 3 | 3 | 4 | ||||||||||
Recognized net actuarial loss | 29 | 20 | 33 | 21 | 19 | 26 | |||||||||||||
Other | — | (1 | ) | — | — | — | (1 | ) | |||||||||||
Net periodic pension cost before curtailments | $ | 48 | $ | 31 | $ | 44 | $ | 39 | $ | 40 | $ | 54 | |||||||
Curtailments | 5 | — | — | 1 | — | — | |||||||||||||
Total net periodic pension cost | $ | 53 | $ | 31 | $ | 44 | $ | 40 | $ | 40 | $ | 54 | |||||||
| | Qualified and Non-Qualified Pension Plans | ||||||||||||
|---|---|---|---|---|---|---|---|---|---|---|---|---|---|
| | U.S. Plans | U.K. Plans | |||||||||||
| In millions | 2012 | 2011 | 2012 | 2011 | |||||||||
Change in benefit obligation | |||||||||||||
Benefit obligation at beginning of year | $ | 2,243 | $ | 2,110 | $ | 1,128 | $ | 1,013 | |||||
Service cost | 58 | 51 | 21 | 20 | |||||||||
Interest cost | 103 | 109 | 59 | 58 | |||||||||
Plan participants' contributions | — | — | 1 | 1 | |||||||||
Actuarial losses | 207 | 126 | 52 | 82 | |||||||||
Benefits paid from fund | (148 | ) | (146 | ) | (42 | ) | (39 | ) | |||||
Benefits paid directly by employer | (10 | ) | (8 | ) | — | — | |||||||
Exchange rate changes | — | — | 52 | (7 | ) | ||||||||
Curtailment gain | — | — | (2 | ) | — | ||||||||
Other | 1 | 1 | — | — | |||||||||
Benefit obligation at end of year | $ | 2,454 | $ | 2,243 | $ | 1,269 | $ | 1,128 | |||||
Change in plan assets | |||||||||||||
Fair value of plan assets at beginning of year | $ | 2,091 | $ | 1,906 | $ | 1,200 | $ | 1,088 | |||||
Actual return on plan assets | 284 | 231 | 88 | 65 | |||||||||
Employer contributions | 100 | 100 | 22 | 91 | |||||||||
Plan participants' contributions | — | — | 1 | 1 | |||||||||
Benefits paid | (148 | ) | (146 | ) | (42 | ) | (39 | ) | |||||
Exchange rate changes | — | — | 55 | (6 | ) | ||||||||
Fair value of plan assets at end of year | $ | 2,327 | $ | 2,091 | $ | 1,324 | $ | 1,200 | |||||
Funded status (including underfunded and nonfunded plans) at end of year | $ | (127 | ) | $ | (152 | ) | $ | 55 | $ | 72 | |||
Amounts recognized in consolidated balance sheets | |||||||||||||
Other assets—long term assets | $ | 127 | $ | 63 | $ | 55 | $ | 72 | |||||
Accrued compensation, benefits and retirement costs-current liabilities | (10 | ) | (10 | ) | — | — | |||||||
Other liabilities and deferred revenue—long-term liabilities | (244 | ) | (205 | ) | — | — | |||||||
Net amount recognized | $ | (127 | ) | $ | (152 | ) | $ | 55 | $ | 72 | |||
Amounts recognized in accumulated other comprehensive loss consist of: | |||||||||||||
Net actuarial loss | $ | 734 | $ | 700 | $ | 349 | $ | 305 | |||||
Prior service (credit) cost | (1 | ) | (3 | ) | — | 1 | |||||||
Net amount recognized | $ | 733 | $ | 697 | $ | 349 | $ | 306 | |||||
CUMMINS INC. AND SUBSIDIARIES
NOTES TO CONSOLIDATED FINANCIAL STATEMENTS (Continued)
NOTE 12. PENSION AND OTHER POSTRETIREMENT BENEFITS (Continued)
In addition to the pension plans in the above table, we also maintain less significant defined benefit pension plans in 14 other countries outside the U.S. and the U.K. that comprise less than 2 percent and 4 percent of our pension plan assets and obligations, respectively. These plans are reflected in "Other liabilities and deferred revenue" on ourConsolidated Balance Sheets.
The following table presents information regarding total accumulated benefit obligation and underfunded pension plans that are included in the preceding table:
| | Qualified and Non-Qualified Pension Plans | ||||||||||||
|---|---|---|---|---|---|---|---|---|---|---|---|---|---|
| | U.S. Plans | U.K. Plans | |||||||||||
| In millions | 2012 | 2011 | 2012 | 2011 | |||||||||
Total accumulated benefit obligation | $ | 2,417 | $ | 2,211 | $ | 1,167 | $ | 1,027 | |||||
Plans with accumulated benefit obligation in excess of plan assets | |||||||||||||
Accumulated benefit obligation | 216 | 185 | — | — | |||||||||
Plans with projected benefit obligation in excess of plan assets | |||||||||||||
Projected benefit obligation | 254 | 215 | — | — | |||||||||
Components of Net Periodic Pension Cost
The following table presents the net periodic pension cost under our plans:
| | Qualified and Non-Qualified Pension Plans | ||||||||||||||||||
|---|---|---|---|---|---|---|---|---|---|---|---|---|---|---|---|---|---|---|---|
| | U.S. Plans | U.K. Plans | |||||||||||||||||
| In millions | 2012 | 2011 | 2010 | 2012 | 2011 | 2010 | |||||||||||||
Service cost | $ | 58 | $ | 51 | $ | 45 | $ | 21 | $ | 20 | $ | 19 | |||||||
Interest cost | 103 | 109 | 111 | 59 | 58 | 58 | |||||||||||||
Expected return on plan assets | (157 | ) | (151 | ) | (147 | ) | (81 | ) | (74 | ) | (71 | ) | |||||||
Amortization of prior service (credit) cost | (1 | ) | (1 | ) | (1 | ) | 1 | 3 | 3 | ||||||||||
Recognized net actuarial loss | 47 | 39 | 36 | 14 | 14 | 17 | |||||||||||||
Net periodic pension cost | $ | 50 | $ | 47 | $ | 44 | $ | 14 | $ | 21 | $ | 26 | |||||||
Other changes in benefit obligations and plan assets recognized in other comprehensive income in 20092012, 2011 and 2010 are as follows:
| In millions | 2009 | |||
|---|---|---|---|---|
Amortization of prior service cost | $ | (2 | ) | |
Curtailments | (1 | ) | ||
Recognized actuarial loss | (50 | ) | ||
Incurred actuarial loss | 17 | |||
Foreign exchange translation adjustments | 42 | |||
Total recognized in other comprehensive income | $ | 6 | ||
Total recognized in net periodic pension cost and other comprehensive income | $ | 99 | ||
The amounts in accumulated other comprehensive loss that are expected to be recognized as components of net periodic pension cost during the next fiscal year are as follows:
| In millions | 2010 | |||
|---|---|---|---|---|
Prior service cost | $ | 2 | ||
Net actuarial loss | 52 | |||
As disclosed in Note 3, "RESTRUCTURING AND OTHER CHARGES," to ourConsolidated Financial Statements, we executed restructuring actions in 2009. As a result, our pension benefit plans were remeasured and we recognized curtailment losses, as prescribed under GAAP pension standards, due to the significant reduction in the expected aggregate years of future service of the employees affected by the actions. In the third and fourth quarters of 2009, we recorded net curtailment losses of $5 million and $1 million for U.S. and non-U.S. plans, respectively, and $2 million for our less significant plans in other countries outside the U.S. and the U.K. The curtailment losses include recognition of the change in the PBO and a portion of the previously unrecognized prior service cost reflecting the reduction in expected future service.
The table below presents various assumptions used in determining the pension benefit obligation for each year and reflects weighted-average percentages for the various plans (Non-U.S. is the U.K.):
| | U.S. Plans | Non-U.S. Plans | |||||||||||
|---|---|---|---|---|---|---|---|---|---|---|---|---|---|
| | 2009 | 2008 | 2009 | 2008 | |||||||||
Discount rate | 5.60 | % | 6.20 | % | 5.80 | % | 6.20 | % | |||||
Compensation increase rate | 4.00 | % | 4.00 | % | 4.50 | % | 4.25 | % | |||||
| In millions | 2012 | 2011 | 2010 | |||||||
|---|---|---|---|---|---|---|---|---|---|---|
Amortization of prior service cost | $ | (1 | ) | $ | (2 | ) | $ | (2 | ) | |
Recognized actuarial loss | (61 | ) | (53 | ) | (53 | ) | ||||
Incurred prior service cost | 1 | 1 | 1 | |||||||
Incurred actuarial (gain) loss | 124 | 138 | (181 | ) | ||||||
Foreign exchange translation adjustments | 16 | — | (12 | ) | ||||||
Total recognized in other comprehensive income | $ | 79 | $ | 84 | $ | (247 | ) | |||
Total recognized in net periodic pension cost and other comprehensive income | $ | 143 | $ | 152 | $ | (177 | ) | |||
CUMMINS INC. AND SUBSIDIARIES
NOTES TO CONSOLIDATED FINANCIAL STATEMENTS (Continued)
NOTE 12. PENSION AND OTHER POSTRETIREMENT BENEFITS (Continued)
The amounts in accumulated other comprehensive loss that are expected to be recognized as components of net periodic pension cost during the next fiscal year are as follows:
| In millions | 2013 | |||
|---|---|---|---|---|
Prior service credit | $ | (1 | ) | |
Net actuarial loss | 89 | |||
Assumptions
The table below presents various assumptions used in determining the pension benefit obligation for each year and reflects weighted-average percentages for the various plans:
| | Qualified and Non-Qualified Pension Plans | ||||||||||||
|---|---|---|---|---|---|---|---|---|---|---|---|---|---|
| | U.S. Plans | U.K. Plans | |||||||||||
| | 2012 | 2011 | 2012 | 2011 | |||||||||
Discount rate | 3.97 | % | 4.82 | % | 4.70 | % | 5.20 | % | |||||
Compensation increase rate | 4.90 | % | 4.00 | % | 4.00 | % | 4.25 | % | |||||
The table below presents various assumptions used in determining the net periodic pension cost and reflects weighted-average percentages for the various plans (Non-U.S. is the U.K.):plans:
| Qualified and Non-Qualified Pension Plans | ||||||||||||||||||||||||||||||||||||||
|---|---|---|---|---|---|---|---|---|---|---|---|---|---|---|---|---|---|---|---|---|---|---|---|---|---|---|---|---|---|---|---|---|---|---|---|---|---|---|
| | U.S. Plans | Non-U.S. Plans | U.S. Plans | U.K. Plans | ||||||||||||||||||||||||||||||||||
| | 2009 | 2008 | 2007 | 2009 | 2008 | 2007 | 2012 | 2011 | 2010 | 2012 | 2011 | 2010 | ||||||||||||||||||||||||||
Discount rate | 6.20 | % | 6.10 | % | 5.60 | % | 6.20 | % | 5.80 | % | 4.96 | % | 4.82 | % | 5.42 | % | 5.60 | % | 5.20 | % | 5.80 | % | 5.80 | % | ||||||||||||||
Expected return on plan assets | 8.25 | % | 8.25 | % | 8.50 | % | 7.25 | % | 7.25 | % | 7.24 | % | 8.00 | % | 8.00 | % | 8.00 | % | 6.50 | % | 7.00 | % | 7.25 | % | ||||||||||||||
Compensation increase rate | 4.00 | % | 4.00 | % | 4.00 | % | 4.25 | % | 4.25 | % | 4.02 | % | 4.00 | % | 4.00 | % | 4.00 | % | 4.25 | % | 4.50 | % | 4.50 | % | ||||||||||||||
Our investment policies in the U.S. and U.K. provide for the rebalancing of assets to maintain our long-term strategic asset allocation. We are committed to its long-term strategy and do not attempt to time the market given empirical evidence that asset allocation is more critical than individual asset or investment manager selection. Rebalancing of the assets has and continues to occur. The rebalancing is critical to having the proper weighting of assets to achieve the expected total portfolio returns. We believe that our portfolio is highly diversified and does not have any significant exposure to concentration risk. The plan assets for our defined benefit pension plans do not include any of our common stock.
U.S. Plan Assets
For the U.S. qualified pension plans, our assumption for the expected return on assets was 8.258.0 percent in 2009.2012. Projected returns are based primarily on broad, publicly traded equity and fixed income indices and forward-looking estimates of active portfolio and investment management. As of December 31, 2009, based upon our target asset allocations it is anticipated that our U.S. investment policy will generate an average annual return over the 20-year projection period equal to or in excess of 7.50 percent, approximately 40 percent of the time, while returns of 8.70 percent or greater are anticipated 25 percent of the time. We expect additional positive returns from this active investment management. As a result, basedBased on the historical
CUMMINS INC. AND SUBSIDIARIES
NOTES TO CONSOLIDATED FINANCIAL STATEMENTS (Continued)
NOTE 12. PENSION AND OTHER POSTRETIREMENT BENEFITS (Continued)
returns and forward-looking return expectations, we have elected to use an assumption of 8.008.0 percent per year beginning in 2010.2013.
The primary investment objective is to exceed, on a net-of-fee basis, the rate of return of a policy portfolio comprised of the following:
Asset Class | Target | Range | |||||
|---|---|---|---|---|---|---|---|
U.S. equities | % | % | |||||
Non-U.S. equities | % | % | |||||
Global equities | % | % | |||||
Total equities | % | ||||||
Real estate | 7.5 | % | % | ||||
Private equity | 7.5 | % | % | ||||
| % | % | |||||
Total | % | ||||||
The fixed income component is structured to represent a custom bond benchmark constructed tothat will closely representhedge the monthly change in the value of Cummins'our liabilities. This component is structured in such a way that its benchmark covers 50approximately 90 percent of the plan's exposure to changes in its discount
CUMMINS INC. AND SUBSIDIARIES
NOTES TO CONSOLIDATED FINANCIAL STATEMENTS (Continued)
NOTE 12. PENSION AND OTHER POSTRETIREMENT BENEFITS (Continued)
rate (AA corporate bond yields). In order to achieve a hedge on more than the targeted 3046 percent of Planplan assets invested in fixed income securities, the Benefits Policy Committee may instructdoes permit the fixed income managers, other manager(s)managers or the custodian/trustee to utilize derivative securities, in an overlay fashion, which wouldas part of a liability driven investment strategy to further reduce the Plan'splan's risk of declining interest rates in what is referred to as a Liability Driven Investment strategy.rates. However, all managers hired to manage assets for the trust are prohibited from using leverage unless specifically discussed with the Committeecommittee and allowed for in their guidelines.
UKU.K. Plan Assets
For the U.K. qualified pension plans, our assumption for the expected return on assets was 6.5 percent in 2012. The methodology used to determine the rate of return on pension plan assets in the U.K. was based on establishing an equity-risk premium over current long-term bond yields adjusted based on target asset allocations. Our strategy with respect to our investments in these assets is to be invested in a suitable mixture of return-seeking assets (equities and propertyreal estate) and liability matching assets (bonds) with a long-term outlook. Therefore, the risk and return balance of our U.K. asset portfolio should reflect a long-term horizon. To achieve these objectives we have established the following targets:
Asset Class | Target | Range | |||||
|---|---|---|---|---|---|---|---|
| % | + | |||||
| |||||||
| % | ||||||
Real estate | % | % | |||||
Re-insurance | 5.0 | % | +7.5/- 5.0 | % | |||
Private equity | % | % | |||||
| % | + | % | ||||
Total | % | ||||||
As part of our strategy in the U.K. we have not prohibited the use of any financial instrument, including derivatives.
CUMMINS INC. AND SUBSIDIARIES
NOTES TO CONSOLIDATED FINANCIAL STATEMENTS (Continued)
NOTE 12. PENSION AND OTHER POSTRETIREMENT BENEFITS (Continued)
As part of our strategy in the U.K. we have not prohibited the use of any financial instrument, including derivatives. Based on the above discussion, we have elected to use our assumption of 5.8 percent per year beginning in 2013.
Fair Value of U.S. Plan Assets
The fair values of Cummins U.S. pension plan assets at December 31, 2009,2012, by asset category arewere as follows:
| | Fair Value Measurements as of December 31, 2012 | ||||||||||||
|---|---|---|---|---|---|---|---|---|---|---|---|---|---|
| In millions | Quoted prices in active markets for identical assets (Level 1) | Significant other observable inputs (Level 2) | Significant unobservable inputs (Level 3) | Total | |||||||||
Equities | |||||||||||||
U.S. | $ | 113 | $ | 542 | $ | — | $ | 655 | |||||
Non-U.S. | 177 | 127 | — | 304 | |||||||||
Fixed income | |||||||||||||
Government debt | 475 | 132 | — | 607 | |||||||||
Corporate debt | |||||||||||||
U.S. | 203 | 191 | — | 394 | |||||||||
Non-U.S. | 42 | — | — | 42 | |||||||||
Asset/mortgaged backed securities | 13 | — | — | 13 | |||||||||
Net cash equivalents(1) | 35 | — | — | 35 | |||||||||
Private equity and real estate(2) | — | — | 286 | 286 | |||||||||
Total | $ | 1,058 | $ | 992 | $ | 286 | $ | 2,336 | |||||
Pending trade/purchases/sales | (16 | ) | |||||||||||
Accruals(3) | 7 | ||||||||||||
Total | $ | 2,327 | |||||||||||
| | Fair Value Measurements as of December 31, 2009 Using | ||||||||||||||
|---|---|---|---|---|---|---|---|---|---|---|---|---|---|---|---|
| In millions | Quoted prices in active markets for identical assets (Level 1) | Significant other observable inputs (Level 2) | Significant unobservable inputs (Level 3) | Total | |||||||||||
Equities | |||||||||||||||
U.S. | $ | 157 | $ | 457 | $ | — | $ | 614 | |||||||
Non-U.S. | 128 | 219 | — | 347 | |||||||||||
Fixed income | |||||||||||||||
Government debt | 260 | — | — | 260 | |||||||||||
Corporate debt | |||||||||||||||
U.S. | 298 | — | — | 298 | |||||||||||
Non-U.S. | 68 | — | — | 68 | |||||||||||
Asset/mortgaged backed securities | 14 | — | — | 14 | |||||||||||
Net cash equivalents(1) | 9 | — | — | 9 | |||||||||||
Derivative instruments(2) | — | 3 | — | 3 | |||||||||||
Private equity and real estate(3) | — | — | 139 | 139 | |||||||||||
Total | $ | 934 | $ | 679 | $ | 139 | $ | 1,752 | |||||||
Pending trade purchases/sales | (87 | ) | |||||||||||||
Accruals(4) | 12 | ||||||||||||||
Total | $ | 1,677 | |||||||||||||
CUMMINS INC. AND SUBSIDIARIES
NOTES TO CONSOLIDATED FINANCIAL STATEMENTS (Continued)
NOTE 12. PENSION AND OTHER POSTRETIREMENT BENEFITS (Continued)
The fair values of U.S. pension plan assets at December 31, 2011, by asset category were as follows:
| | Fair Value Measurements as of December 31, 2011 | ||||||||||||
|---|---|---|---|---|---|---|---|---|---|---|---|---|---|
| In millions | Quoted prices in active markets for identical assets (Level 1) | Significant other observable inputs (Level 2) | Significant unobservable inputs (Level 3) | Total | |||||||||
Equities | |||||||||||||
U.S. | $ | 95 | $ | 511 | $ | — | $ | 606 | |||||
Non-U.S. | 149 | 168 | — | 317 | |||||||||
Fixed income | |||||||||||||
Government debt | 336 | 101 | — | 437 | |||||||||
Corporate debt | |||||||||||||
U.S. | 245 | 115 | — | 360 | |||||||||
Non-U.S. | 54 | — | — | 54 | |||||||||
Asset/mortgaged backed securities | 11 | — | — | 11 | |||||||||
Net cash equivalents(1) | 59 | — | — | 59 | |||||||||
Derivative instruments(2) | — | 4 | — | 4 | |||||||||
Private equity and real estate(3) | — | — | 266 | 266 | |||||||||
Total | $ | 949 | $ | 899 | $ | 266 | $ | 2,114 | |||||
Pending trade/purchases/sales | (30 | ) | |||||||||||
Accruals(4) | 7 | ||||||||||||
Total | $ | 2,091 | |||||||||||
CUMMINS INC. AND SUBSIDIARIES
NOTES TO CONSOLIDATED FINANCIAL STATEMENTS (Continued)
NOTE 12. PENSION AND OTHER POSTRETIREMENT BENEFITS (Continued)
The reconciliation of Level 3 assets was as follows:
| | Fair Value Measurements as of December 31, Using Significant Unobservable Inputs (Level 3) | |||||||||
|---|---|---|---|---|---|---|---|---|---|---|
| In millions | Private Equity | Real Estate | Total | |||||||
Ending balance at December 31, 2010 | $ | 126 | $ | 82 | $ | 208 | ||||
Actual return on plan assets | ||||||||||
Unrealized (losses) gains on assets still held at the reporting date | 18 | 6 | 24 | |||||||
Purchases, sales and settlements, net | 3 | 31 | 34 | |||||||
Ending balance at December 31, 2011 | 147 | 119 | 266 | |||||||
Actual return on plan assets | ||||||||||
Unrealized (losses) gains on assets still held at the reporting date | 15 | 9 | 24 | |||||||
Purchases, sales and settlements, net | (6 | ) | 2 | (4 | ) | |||||
Ending balance at December 31, 2012 | $ | 156 | $ | 130 | $ | 286 | ||||
Fair Value of U.K. Plan Assets
In July 2012, the U.K. pension plan purchased an insurance contract that will guarantee payment of specified pension liabilities. The contract defers payment for 10 years. This is included in the table below in Level 3 at a value of $424 million.
CUMMINS INC. AND SUBSIDIARIES
NOTES TO CONSOLIDATED FINANCIAL STATEMENTS (Continued)
NOTE 12. PENSION AND OTHER POSTRETIREMENT BENEFITS (Continued)
The reconciliation of level 3 assets is as follows:
| | Fair Value Measurements as of December 31, 2009 Using Significant Unobservable Inputs (Level 3) | |||||||||||
|---|---|---|---|---|---|---|---|---|---|---|---|---|
| In millions | Private Equity | Real Estate | Total | |||||||||
Beginning balance at January 1, 2009 | $ | 97 | $ | 57 | $ | 154 | ||||||
Actual return on plan assets: | ||||||||||||
Unrealized losses on assets still held at the reporting date | (6 | ) | (21 | ) | (27 | ) | ||||||
Purchases, sales and settlements | 13 | (1 | ) | 12 | ||||||||
Ending balance at December 31, 2009 | $ | 104 | $ | 35 | $ | 139 | ||||||
Fair Value of U.K. Plan Assets
The fair values of Cummins U.K. pension plan assets at December 31, 2009,2012, by asset category arewere as follows:
| | Fair Value Measurements as of December 31, 2012 | ||||||||||||
|---|---|---|---|---|---|---|---|---|---|---|---|---|---|
| In millions | Quoted prices in active markets for identical assets (Level 1) | Significant other observable inputs (Level 2) | Significant unobservable inputs (Level 3) | Total | |||||||||
Equities | |||||||||||||
U.S. | $ | — | $ | 251 | $ | — | $ | 251 | |||||
Non-U.S. | — | 325 | — | 325 | |||||||||
Fixed income | |||||||||||||
Government debt | — | 191 | — | 191 | |||||||||
Net cash equivalents(1) | 10 | — | — | 10 | |||||||||
Re-insurance | — | 61 | — | 61 | |||||||||
Private equity, real estate & insurance(2) | — | — | 486 | 486 | |||||||||
Total | $ | 10 | $ | 828 | $ | 486 | $ | 1,324 | |||||
Pending trade/purchases/sales | — | ||||||||||||
Accruals(3) | — | ||||||||||||
Total | $ | 1,324 | |||||||||||
| | Fair Value Measurements as of December 31, 2009 Using | ||||||||||||||
|---|---|---|---|---|---|---|---|---|---|---|---|---|---|---|---|
| In millions | Quoted prices in active markets for identical assets (Level 1) | Significant other observable inputs (Level 2) | Significant unobservable inputs (Level 3) | Total | |||||||||||
Equities | |||||||||||||||
U.S. | $ | — | $ | 106 | $ | — | $ | 106 | |||||||
Non-U.S. | — | 434 | — | 434 | |||||||||||
Fixed income | |||||||||||||||
Government debt | 96 | 91 | — | 187 | |||||||||||
Corporate debt | |||||||||||||||
U.S. | 23 | 15 | — | 38 | |||||||||||
Non-U.S. | 60 | 69 | — | 129 | |||||||||||
Asset/mortgaged backed securities | 16 | — | — | 16 | |||||||||||
Net cash equivalents(1) | 4 | — | — | 4 | |||||||||||
Private equity and real estate(2) | — | — | 35 | 35 | |||||||||||
Total | $ | 199 | $ | 715 | $ | 35 | $ | 949 | |||||||
Pending trade purchases/sales | (21 | ) | |||||||||||||
Accruals(3) | 1 | ||||||||||||||
Total | $ | 929 | |||||||||||||
CUMMINS INC. AND SUBSIDIARIES
NOTES TO CONSOLIDATED FINANCIAL STATEMENTS (Continued)
NOTE 12. PENSION AND OTHER POSTRETIREMENT BENEFITS (Continued)
The fair values of U.K. pension plan assets at December 31, 2011, by asset category were as follows:
| | Fair Value Measurements as of December 31, 2011 | ||||||||||||
|---|---|---|---|---|---|---|---|---|---|---|---|---|---|
| In millions | Quoted prices in active markets for identical assets (Level 1) | Significant other observable inputs (Level 2) | Significant unobservable inputs (Level 3) | Total | |||||||||
Equities | |||||||||||||
U.S. | $ | — | $ | 239 | $ | — | $ | 239 | |||||
Non-U.S. | — | 253 | — | 253 | |||||||||
Fixed income | |||||||||||||
Government debt | 162 | 311 | — | 473 | |||||||||
Corporate debt | |||||||||||||
U.S. | 17 | 9 | — | 26 | |||||||||
Non-U.S. | 90 | 45 | — | 135 | |||||||||
Asset/mortgaged backed securities | 21 | — | — | 21 | |||||||||
Net cash equivalents(1) | 10 | — | — | 10 | |||||||||
Derivative instruments(2) | — | (5 | ) | — | (5 | ) | |||||||
Re-insurance | — | 56 | — | 56 | |||||||||
Private equity and real estate(3) | — | — | 47 | 47 | |||||||||
Total | $ | 300 | $ | 908 | $ | 47 | $ | 1,255 | |||||
Pending trade/purchases/sales | (58 | ) | |||||||||||
Accruals(4) | 3 | ||||||||||||
Total | $ | 1,200 | |||||||||||
CUMMINS INC. AND SUBSIDIARIES
NOTES TO CONSOLIDATED FINANCIAL STATEMENTS (Continued)
NOTE 12. PENSION AND OTHER POSTRETIREMENT BENEFITS (Continued)
The reconciliation of levelLevel 3 assets iswas as follows:
| | Fair Value Measurements as of December 31, 2009 Using Significant Unobservable Inputs (Level 3) | |||||||||||
|---|---|---|---|---|---|---|---|---|---|---|---|---|
| In millions | Private Equity | Real Estate | Total | |||||||||
Beginning balance at January 1, 2009 | $ | 5 | $ | 36 | $ | 41 | ||||||
Actual return on plan assets: | ||||||||||||
Unrealized losses on assets still held at the reporting date | (2 | ) | (8 | ) | (10 | ) | ||||||
Purchases, sales and settlements | 1 | 3 | 4 | |||||||||
Ending balance at December 31, 2009 | $ | 4 | $ | 31 | $ | 35 | ||||||
| | Fair Value Measurements as of December 31, Using Significant Unobservable Inputs (Level 3) | ||||||||||||
|---|---|---|---|---|---|---|---|---|---|---|---|---|---|
| In millions | Insurance | Real Estate | Private Equity | Total | |||||||||
Ending balance at December 31, 2010 | $ | — | $ | 30 | $ | 10 | $ | 40 | |||||
Actual return on plan assets | |||||||||||||
Unrealized (losses) gains on assets still held at the reporting date | — | — | 2 | 2 | |||||||||
Purchases, sales and settlements, net | — | 3 | 2 | 5 | |||||||||
Ending balance at December 31, 2011 | — | 33 | 14 | 47 | |||||||||
Actual return on plan assets | |||||||||||||
Unrealized (losses) gains on assets still held at the reporting date | 13 | 1 | 1 | 15 | |||||||||
Purchases, sales and settlements, net | 411 | — | 13 | 424 | |||||||||
Ending balance at December 31, 2012 | $ | 424 | $ | 34 | $ | 28 | $ | 486 | |||||
Level 3 Assets
The investments in an insurance contract, private equity and real estate funds, for which quoted market prices are not available, are valued at their estimated fair value as determined by applicable investment managers or by quarterly financial statements of the funds. These financial statements are audited at least annually. In conjunction with our investment consultant, we monitor the fair value of the insurance contract as periodically reported by our insurer and their counterparty risk. The fair value of all real estate properties, held in the partnerships, are valued at least once per year by an independent professional real estate valuation firm. Fair value generally represents the fund's proportionate share of the net assets of the investment partnerships as reported by the general partners of the underlying partnerships. Some securities with no readily available market are initially valued at cost, utilizing independent professional valuation firms as well as market comparisons with subsequent adjustments to values which reflect either the basis of meaningful third-party transactions in the private market or the fair value deemed appropriate by the general partners of the underlying investment partnerships. In such instances, consideration is also given to the financial condition and operating results of the issuer, the amount that the investment partnerships can reasonably expect to realize upon the sale of the securities and any other factors deemed relevant. The estimated fair values are subject to uncertainty and therefore may differ from the values that would have been used had a ready market for such investments existed and such differences could be material.
Estimated Future Contributions and Benefit Payments
We plan to contribute approximately $175 million to $185$170 million to our defined benefit pension plans in 2010.2013. The table below presents expected future benefit payments under our pension plans:
| Qualified and Non-Qualified Pension Plans | ||||||||||||||||||||||||||||||||||||||
|---|---|---|---|---|---|---|---|---|---|---|---|---|---|---|---|---|---|---|---|---|---|---|---|---|---|---|---|---|---|---|---|---|---|---|---|---|---|---|
| In millions | 2010 | 2011 | 2012 | 2013 | 2014 | 2015-2019 | 2013 | 2014 | 2015 | 2016 | 2017 | 2018 - 2022 | ||||||||||||||||||||||||||
Expected benefit payments | $ | 200 | $ | 203 | $ | 207 | $ | 209 | $ | 214 | $ | 1,108 | $ | 215 | $ | 216 | $ | 222 | $ | 228 | $ | 232 | $ | 1,218 | ||||||||||||||
We also sponsor defined contribution plans for certain hourly and salaried employees. Our contributions to these plans were $42 million, $30 million, and $25 million for the years ended December 31, 2009, 2008 and 2007.
CUMMINS INC. AND SUBSIDIARIES
NOTES TO CONSOLIDATED FINANCIAL STATEMENTS (Continued)
NOTE 12. PENSION AND OTHER POSTRETIREMENT BENEFITS (Continued)
Other Pension Plans
We also sponsor defined contribution plans for certain hourly and salaried employees. Our contributions to these plans were $74 million, $72 million and $44 million for the years ended December 31, 2012, 2011 and 2010.
OTHER POSTRETIREMENT BENEFITSOther Postretirement Benefits
Our other postretirement benefit plans provide various health care and life insurance benefits to eligible employees, who retire and satisfy certain age and service requirements, and their dependents. The plans are contributory and contain cost-sharing features such as caps, deductibles, coinsurance and spousal contributions. CompanyEmployer contributions are limited by formulas in each plan. Retiree contributions for health care benefits are adjusted annually and we reserve the right to change benefits covered under these plans. There were no plan assets for the postretirement benefit plans as our policy is to fund benefits and expenses for these plans as claims and premiums are incurred.
The following tables present the changes in the benefit obligations, the funded status of the plans and the amounts recognized in ourConsolidated Balance Sheets for our significant other postretirement benefit plans. Benefit obligation balances presented below reflect the accumulated postretirement benefit obligations (APBO) for our other postretirement benefit plans.
| In millions | 2009 | 2008 | 2012 | 2011 | ||||||||||
|---|---|---|---|---|---|---|---|---|---|---|---|---|---|---|
Change in benefit obligation | ||||||||||||||
Benefit obligation at beginning of year | $ | 503 | $ | 545 | $ | 483 | $ | 490 | ||||||
Service cost | 1 | 1 | ||||||||||||
Interest cost | 29 | 34 | 21 | 24 | ||||||||||
Plan participants' contributions | 9 | 9 | 8 | 10 | ||||||||||
Amendments | — | (2 | ) | |||||||||||
Actuarial loss (gain) | 17 | (19 | ) | |||||||||||
Benefits paid directly by Company | (60 | ) | (65 | ) | ||||||||||
Curtailments | 5 | — | ||||||||||||
Plan amendments | (4 | ) | — | |||||||||||
Actuarial losses | 21 | 18 | ||||||||||||
Benefits paid directly by employer | (51 | ) | (59 | ) | ||||||||||
Benefit obligation at end of year | $ | 504 | $ | 503 | $ | 478 | $ | 483 | ||||||
Funded status at end of year | $ | (504 | ) | $ | (503 | ) | $ | (478 | ) | $ | (483 | ) | ||
Amounts recognized in consolidated balance sheets | ||||||||||||||
Accrued compensation, benefits and retirement costs—current liabilities | $ | (51 | ) | $ | (51 | ) | ||||||||
Postretirement benefits other than pensions—long-term liabilities | (453 | ) | (452 | ) | ||||||||||
Accrued compensation, benefits and retirement costs-current liabilities | $ | (46 | ) | $ | (51 | ) | ||||||||
Postretirement benefits other than pensions-long-term liabilities | (432 | ) | (432 | ) | ||||||||||
Net amount recognized | $ | (504 | ) | $ | (503 | ) | $ | (478 | ) | $ | (483 | ) | ||
Amounts recognized in accumulated other comprehensive loss consist of: | ||||||||||||||
Net actuarial loss | $ | 35 | $ | 20 | $ | 83 | $ | 66 | ||||||
Prior service credit | (20 | ) | (30 | ) | (6 | ) | (6 | ) | ||||||
Net amount recognized | $ | 15 | $ | (10 | ) | $ | 77 | $ | 60 | |||||
CUMMINS INC. AND SUBSIDIARIES
NOTES TO CONSOLIDATED FINANCIAL STATEMENTS (Continued)
NOTE 12. PENSION AND OTHER POSTRETIREMENT BENEFITS (Continued)
In addition to the other postretirement plans in the above table, we also maintain less significant postretirement plans in three other countries outside the U.S. that comprise less than 1 percent of our postretirement obligations. These plans are reflected in "Other liabilities and deferred revenue" in ourConsolidated Balance Sheets.
Components of Net Periodic Other Postretirement Benefits Cost
The following table presents the net periodic other postretirement benefits cost under our plans:
| In millions | 2009 | 2008 | 2007 | 2012 | 2011 | 2010 | ||||||||||||||
|---|---|---|---|---|---|---|---|---|---|---|---|---|---|---|---|---|---|---|---|---|
Service cost | $ | 1 | $ | 1 | $ | 1 | ||||||||||||||
Interest cost | 29 | 31 | 31 | $ | 21 | $ | 24 | $ | 27 | |||||||||||
Amortization of prior service credit | (9 | ) | (10 | ) | (10 | ) | (5 | ) | (8 | ) | (8 | ) | ||||||||
Recognized net actuarial gain | — | (1 | ) | (1 | ) | |||||||||||||||
Recognized net actuarial loss | 3 | — | — | |||||||||||||||||
Other | (1 | ) | — | (1 | ) | 1 | 1 | — | ||||||||||||
Net periodic other postretirement benefit cost before curtailments | 20 | 21 | 20 | |||||||||||||||||
Curtailment loss | 6 | — | — | |||||||||||||||||
Net periodic other postretirement benefit cost | $ | 26 | $ | 21 | $ | 20 | $ | 20 | $ | 17 | $ | 19 | ||||||||
Other changes in benefit obligations recognized in other comprehensive income in 2009 are2012, 2011 and 2010 were as follows:
| In millions | 2009 | 2012 | 2011 | 2010 | ||||||||||
|---|---|---|---|---|---|---|---|---|---|---|---|---|---|---|
Amortization of prior service credit | $ | 9 | $ | 5 | $ | 8 | $ | 8 | ||||||
Recognized net actuarial loss | (3 | ) | — | — | ||||||||||
Incurred actuarial loss | 17 | 20 | 16 | 14 | ||||||||||
Incurred prior service credit | (4 | ) | — | (2 | ) | |||||||||
Other | (1 | ) | (1 | ) | — | 1 | ||||||||
Total recognized in other comprehensive income | 25 | $ | 17 | $ | 24 | $ | 21 | |||||||
Total recognized in net periodic other postretirement benefit cost and other comprehensive income | $ | 51 | $ | 37 | $ | 41 | $ | 40 | ||||||
The amount in accumulated other comprehensive loss that is expected to be recognized as a component of net periodic other postretirement benefit cost during the next fiscal year is a prior service creditan actuarial loss of $8$6 million.
As disclosed in Note 3, "RESTUCTURING AND OTHER CHARGES," to ourConsolidated Financial StatementsAssumptions, we executed restructuring actions in 2009. As a result, our U.S. postretirement benefit plans were remeasured and we recognized curtailment losses, as prescribed under GAAP other postretirement benefit standards, due to the significant reduction in the expected aggregate years of future service of the employees affected by the actions. In the third quarter of 2009, we recorded net curtailment losses of $6 million. The curtailment losses include recognition of the change in the APBO and a portion of the previously unrecognized prior service cost reflecting the reduction in expected future service.
CUMMINS INC. AND SUBSIDIARIES
NOTES TO CONSOLIDATED FINANCIAL STATEMENTS (Continued)
NOTE 12. PENSION AND OTHER POSTRETIREMENT BENEFITS (Continued)
The table below presents assumptions used in determining the other postretirement benefit obligation for each year and reflects weighted-average percentages for our other postretirement plans:
| | 2009 | 2008 | |||||
|---|---|---|---|---|---|---|---|
Discount rate | 5.60 | % | 6.20 | % | |||
| | 2012 | 2011 | |||||
|---|---|---|---|---|---|---|---|
Discount rate | 3.70 | % | 4.70 | % | |||
The table below presents assumptions used in determining the net periodic other postretirement benefits cost and reflects weighted-average percentages for the various plans:
| | 2009 | 2008 | 2007 | |||||||
|---|---|---|---|---|---|---|---|---|---|---|
Discount rate | 6.20 | % | 6.00 | % | 5.60 | % | ||||
| | 2012 | 2011 | 2010 | |||||||
|---|---|---|---|---|---|---|---|---|---|---|
Discount rate | 4.70 | % | 5.20 | % | 5.60 | % | ||||
CUMMINS INC. AND SUBSIDIARIES
NOTES TO CONSOLIDATED FINANCIAL STATEMENTS (Continued)
NOTE 12. PENSION AND OTHER POSTRETIREMENT BENEFITS (Continued)
Our consolidated other postretirement benefit obligation is determined by application of the terms of health care and life insurance plans, together with relevant actuarial assumptions and health care cost trend rates. For measurement purposes, an 8.58.00 percent annual rate of increase in the per capita cost of covered health care benefits was assumed in 2010.2012. The rate was assumed to remain at 8.00 percent in 2013 and then decrease on a linear basis to 5.05.00 percent through 20172019 and remain at that level thereafter. An increase in the health care cost trends of one1 percent would increase our APBO by $20$27 million as of December 31, 20092012 and the net periodic other postretirement benefit expense for 20102013 by $1 million. A decrease in the health care cost trends of 1 percent would decrease our APBO by $18$23 million as of December 31, 20092012 and the net periodic other postretirement benefit expense for 20102013 by $1 million.
The Medicare Prescription Drug Improvement and Modernization Act of 2003 was reflected in the APBO beginning December 31, 2004, assuming we will continue to provide a prescription drug benefit to retirees that is at least actuarially equivalent to Medicare Part D and we will receive the federal subsidy. We received a subsidy of approximately $5 million in 2009.
The table below presents expected benefit payments under our other postretirement benefit plans and also provides the Medicare subsidy receipts expected to be received:plans:
| In millions | 2010 | 2011 | 2012 | 2013 | 2014 | 2015-2019 | |||||||||||||
|---|---|---|---|---|---|---|---|---|---|---|---|---|---|---|---|---|---|---|---|
Expected benefit payments, net of Medicare Part D subsidy—postretirement | 53 | 53 | 51 | 50 | 48 | 199 | |||||||||||||
Medicare Part D subsidy | 2 | 3 | 3 | 3 | 3 | 12 | |||||||||||||
| In millions | 2013 | 2014 | 2015 | 2016 | 2017 | 2018 - 2022 | |||||||||||||
|---|---|---|---|---|---|---|---|---|---|---|---|---|---|---|---|---|---|---|---|
Expected benefit payments | $ | 47 | $ | 45 | $ | 43 | $ | 40 | $ | 38 | $ | 157 | |||||||
CUMMINS INC. AND SUBSIDIARIES
NOTES TO CONSOLIDATED FINANCIAL STATEMENTS (Continued)
NOTE 13. OTHER LIABILITIES AND DEFERRED REVENUE
Other liabilities and deferred revenue includeincluded the following:
| | | December 31, | December 31, | ||||||||||||
|---|---|---|---|---|---|---|---|---|---|---|---|---|---|---|---|
| In millions | In millions | 2009 | 2008 | 2012 | 2011 | ||||||||||
Deferred revenue | $ | 368 | $ | 252 | |||||||||||
Accrued warranty | Accrued warranty | $ | 301 | $ | 311 | 282 | 279 | ||||||||
Deferred revenue | 215 | 173 | |||||||||||||
Pensions | 244 | 205 | |||||||||||||
Accrued compensation | Accrued compensation | 104 | 108 | 168 | 165 | ||||||||||
Other long-term liabilities | Other long-term liabilities | 140 | 153 | 246 | 189 | ||||||||||
Other liabilities and deferred revenue | $ | 1,308 | $ | 1,090 | |||||||||||
Other liabilities and deferred revenue | $ | 760 | $ | 745 | |||||||||||
NOTE 14. COMMITMENTS AND CONTINGENCIES
We are subject to numerous lawsuits and claims arising out of the ordinary course of our business, including actions related to product liability; personal injury; the use and performance of our products; warranty matters; patent, trademark or other intellectual property infringement; contractual liability; the conduct of our business; tax reporting in foreign jurisdictions; distributor termination; workplace safety; and environmental matters. We also have been identified as a potentially responsible party at multiple waste disposal sites under U.S. federal and related state environmental statutes and regulations and may have joint and several liability for any investigation and remediation costs incurred with respect to such sites, as more fully described in Item 1 of this Form 10-K under "Environmental Compliance—Other Environmental Statutes and Regulations."sites. We have denied liability with respect to many of these lawsuits, claims and proceedings and are vigorously defending such lawsuits, claims and proceedings. We carry various forms of commercial, property and casualty, product liability and other forms of insurance; however, such insurance may not be applicable or adequate to cover the costs associated with a judgment against us with respect to these lawsuits, claims and proceedings. We do not believe that these lawsuits are
CUMMINS INC. AND SUBSIDIARIES
NOTES TO CONSOLIDATED FINANCIAL STATEMENTS (Continued)
NOTE 14. COMMITMENTS AND CONTINGENCIES (Continued)
material individually or in the aggregate. While we believe we have also established adequate accruals for our expected future liability with respect to pending lawsuits, claims and proceedings, where the nature and extent of any such liability can be reasonably estimated based upon then presently available information, there can be no assurance that the final resolution of any existing or future lawsuits, claims or proceedings will not have a material adverse effect on our business, results of operation,operations, financial condition or cash flows.
We conduct significant business operations in Brazil that are subject to the Brazilian federal, state and local labor, social security, tax and customs laws. While we believe we comply with such laws, they are complex, subject to varying interpretations and we are often engaged in litigation regarding the application of these laws to particular circumstances. In 2010, it was determined that we overpaid a Brazilian revenue based tax during the period 2004-2008. Our results include a recovery of $32 million recorded in cost of sales ($21 million after-tax) related to tax credits on imported products arising from an overpayment. This recovery has been excluded from segment results as it was not considered in our evaluation of operating results for the year.
In June 2008, four of our sites in Southern Indiana, including our Technical Center, experienced extensive flood damage. We have submitted a claim for $237In October 2011, we received $40 million tofrom our insurance carriers which includesto settle all outstanding 2008 flood claims. As a claim for business interruption. Our insurance carriers have disputed certain aspectsresult, we recognized a gain of our claim and each party has filed suit against the other. Although we believe that we should be insured against the full amountapproximately $38 million ($24 million after-tax), net of such claim, there can be no assurance that we will be successfulany remaining flood related expenses, in pursuing these claims."Other operating income (expense), net" in ourConsolidated Statements of Income.
We had an agreement with a financial institution that provided financing to certain independent Cummins and Cummins Power Generation distributors in the U.S., and to certain distributors in which we own an equity interest. Under this agreement, if any distributor defaulted under its financing arrangement with the financial institution, and the maturity of amounts owed under the agreement were accelerated, then we were required to purchase from the financial institution, at amounts
CUMMINS INC. AND SUBSIDIARIES
NOTES TO CONSOLIDATED FINANCIAL STATEMENTS (Continued)
NOTE 14. COMMITMENTS AND CONTINGENCIES (Continued)
approximating fair market value, certain property, inventory and rental generator sets manufactured by Cummins that are secured by the distributor's financing agreement.
In May 2009, the financing agreement with the financial institution was refinanced and Cummins did not make any new commitments, thereby relieving Cummins of responsibility to purchase any assets from the financial institution in event of default by the distributors.
Our distribution agreements with independent and partially-owned distributors generally have a renewable three-year term and are restricted to specified territories. Our distributors develop and maintain a network of dealers with which we have no direct relationship. TheOur distributors are permitted to sell other, noncompetitive products only with our consent. We license all of our distributors to use our name and logo in connection with the sale and service of our products, with no right to assign or sublicense the trademarks, except to authorized dealers, without our consent. Products are sold to the distributors at standard domestic or international distributor net prices, as applicable. Net prices are wholesale prices we establish to permit our distributors an adequate margin on their sales. Subject to local laws, we can generally refuse to renew these agreements upon expiration or terminate them upon written notice for inadequate sales, change in principal ownership and certain other reasons. Distributors also have the right to terminate the agreements upon 60-day notice without cause, or 30-day notice for cause. Upon termination or failure to renew, we are required to purchase the distributor's current inventory, signage and special tools, and may, at our option purchase other assets of the distributor, but are under no obligation to do so.
We have various residual value guarantees on equipment leased under operating leases. The total amount of these residual value guarantees at December 31, 2009, and 2008 was $8 million.
Other Guarantees and Commitments
In addition to the guaranteesmatters discussed above, from time to time we enter into other guarantee arrangements, including guarantees of non-U.S. distributor financing, residual value guarantees on equipment under operating leases and other miscellaneous guarantees of third-party obligations. As of December 31, 2009,2012, the maximum potential loss related to these other guarantees is $75 million ($74 millionsummarized as
Table of which relatesContents
CUMMINS INC. AND SUBSIDIARIES
NOTES TO CONSOLIDATED FINANCIAL STATEMENTS (Continued)
NOTE 14. COMMITMENTS AND CONTINGENCIES (Continued)
follows (where the guarantee is in a foreign currency the amount below represents the amount in U.S. dollars at current exchange rates):
| In millions | | |||
|---|---|---|---|---|
Cummins Olayan Energy Limited debt guarantee | $ | 11 | ||
Xi'an Cummins Engine Company Limited debt guarantee | 2 | |||
Residual value guarantees | 1 | |||
Other debt guarantees | 2 | |||
Maximum potential loss | $ | 16 | ||
The amount of liabilities related to the Beijing Foton guarantee discussed below).above guarantees was $2 million.
We have arrangements with certain suppliers that require us to purchase minimum volumes or be subject to monetary penalties. The penalty amounts are less than our purchase commitments and essentially allow the supplier to recover their tooling costs in most instances. AtAs of December 31, 2009,2012, if we were to stop purchasing from each of these suppliers, the aggregate amount of the penalty would be approximately $69$94 million, of which $62$90 million relates to a six year contract with an engine parts supplier that extends from 2008 to 2013. This arrangement enables2016. In addition, we also have a "take or pay" contract with an emission solutions business supplier requiring us to purchase approximately $73 million annually through 2018. These arrangements enable us to secure critical components important to our growth. Based on current forecasts, wecomponents. We do not currently anticipate paying any penalties under these contracts.
In July 2008, Beijing Foton Cummins Engine Company, a 50 percent owned entity accounted for under the equity method, entered into a line of credit agreement with a borrowing capacity of up to $176 million (at current exchange rates). The line is being used primarily to fund equipment purchases for a new manufacturing plant. As a part of this transaction, we guaranteed 50 percent of any
CUMMINS INC. AND SUBSIDIARIES
NOTES TO CONSOLIDATED FINANCIAL STATEMENTS (Continued)
NOTE 14. COMMITMENTS AND CONTINGENCIES (Continued)
outstanding borrowings up to a maximum guarantee of $88 million (at current exchange rates). As of December 31, 2009, outstanding borrowings under this agreement were $148 million and our guarantee was $74 million (at current exchange rates). We recorded a liability for the fair value of this guarantee in accordance with guarantor's accounting and disclosure requirements for guarantees, including indirect guarantees of indebtedness of others. The amount of the liability was less than $1 million. The offset to this liability was an increase in our investment in the joint venture.
We have guarantees with certain customers that require us to satisfactorily honor contractual or regulatory obligations, or compensate for monetary losses related to nonperformance. PerformanceThese performance bonds and other performance-related guarantees were $75$70 million and $32$81 million as of December 31, 20092012 and 2008.
We had a standby commitment with Irwin Financial Corporation (Irwin) to purchase up to $25 million of its common shares in connection with a potential rights offering being planned by Irwin. Our commitment was subject to the satisfaction of several conditions. On September 18, 2009, Irwin Union Bank and Trust Company, Columbus, Indiana, was placed into receivership by the Indiana Department of Financial Institutions and Irwin Union Bank, F.S.B., Louisville, Kentucky, was placed into receivership by the Office of Thrift Supervision. In light of these actions, Cummins terminated the Standby Purchase Agreement on September 21, 2009, and no further commitments to Irwin remain.2011, respectively.
Periodically, we enter into various contractual arrangements where we agree to indemnify a third-party against certain types of losses. Common types of indemnities include:
We regularly evaluate the probability of having to incur costs associated with these indemnities and accrue for expected losses that are probable. Because the indemnities are not related to specified known liabilities and due to their uncertain nature, we are unable to estimate the maximum amount of the potential loss associated with these indemnities.indemnifications.
As of December 31, 2009,2012, we have committed to invest and fund $4an additional $86 million into existing joint ventures with $75 million to be funded in 2010.2013.
CUMMINS INC. AND SUBSIDIARIES
NOTES TO CONSOLIDATED FINANCIAL STATEMENTS (Continued)
NOTE 14. COMMITMENTS AND CONTINGENCIES (Continued)
We lease certain manufacturing equipment, facilities, warehouses, office space and equipment, aircraft and automobiles for varying periods under lease agreements. Most of the leases are
CUMMINS INC. AND SUBSIDIARIES
NOTES TO CONSOLIDATED FINANCIAL STATEMENTS (Continued)
NOTE 14. COMMITMENTS AND CONTINGENCIES (Continued)
non-cancelable operating leases with fixed rental payments, expire over the next ten10 years and contain renewal provisions. Rent expense under these leases approximated:
| December 31, | ||||||||||||||||||||
|---|---|---|---|---|---|---|---|---|---|---|---|---|---|---|---|---|---|---|---|---|
| In millions | 2009 | 2008 | 2007 | 2012 | 2011 | 2010 | ||||||||||||||
Rent expense | $ | 130 | $ | 129 | $ | 113 | $ | 176 | $ | 166 | $ | 146 | ||||||||
The following is a summary of the leased property under capital leases by major classes:
| | Asset balances at December 31, | ||||||
|---|---|---|---|---|---|---|---|
| In millions | 2012 | 2011 | |||||
Building | $ | 66 | $ | 69 | |||
Equipment | 110 | 110 | |||||
Other | 15 | 7 | |||||
Less: Accumulated amortization | (103 | ) | (91 | ) | |||
Total | $ | 88 | $ | 95 | |||
Following is a summary of the future minimum lease payments due under capital and operating leases, including leases in our rental business, discussed below, with terms of more than one year at December 31, 2009,2012, together with the net present value of the minimum payments due under capital leases:
| In millions | Capital Leases | Operating Leases | Capital Leases | Operating Leases | ||||||||||
|---|---|---|---|---|---|---|---|---|---|---|---|---|---|---|
2010 | $ | 32 | $ | 96 | ||||||||||
2011 | 21 | 69 | ||||||||||||
2012 | 31 | 50 | ||||||||||||
2013 | 17 | 40 | $ | 24 | $ | 147 | ||||||||
2014 | 19 | 33 | 9 | 107 | ||||||||||
After 2014 | 25 | 85 | ||||||||||||
2015 | 9 | 76 | ||||||||||||
2016 | 7 | 54 | ||||||||||||
2017 | 7 | 41 | ||||||||||||
After 2017 | 16 | 128 | ||||||||||||
Total minimum lease payments | $ | 145 | $ | 373 | $ | 72 | $ | 553 | ||||||
Interest | (28 | ) | (19 | ) | ||||||||||
Present value of net minimum lease payments | $ | 117 | $ | 53 | ||||||||||
In addition, we have subleased certain of the facilities under operating lease to third parties. The future minimum lease payments due from lessees under those arrangements are $1 million per year for the years 20102013 through 2014.
A significant portion of the equipment in our rental business is financed under capital leases. During the third quarter of 2006, we extended a lease related to a portion of our rental business by six years. The lease was set to expire on September 30, 2006. Instead of paying a balloon payment of approximately $42 million on September 30, 2006, the amount was financed over a six-year term at a fixed rate. In addition to extending this lease, we reduced the interest rate by approximately 2 percentage points. During the fourth quarter of 2006, we refinanced a lease related to another portion of our rental business. Under the terms of the agreement which was effective January 1, 2007, the new lease has a six-year term with a fixed rate that is approximately 2 percentage points lower than the previous lease. The total amount refinanced was approximately $28 million. These two leases are with two different lessors. Under each lease we are permitted to prepay, subject to certain conditions, the outstanding balance under the lease for the principal amount outstanding plus a prepayment penalty. For each of these leases we have the option to purchase the equipment at the end of the lease term for one dollar. The equipment under these leases is capitalized and amortized over its estimated useful life. As of December 31, 2009 and 2008, we had outstanding capital leases under this program of $9 million and $43 million, respectively. Future lease payments, including repurchase obligations, under each lease are included in the table above.
CUMMINS INC. AND SUBSIDIARIES
NOTES TO CONSOLIDATED FINANCIAL STATEMENTS (Continued)
NOTE 14. COMMITMENTS AND CONTINGENCIES (Continued)
Sale and Leaseback Transaction Amendment and Extension
During 2001, we entered into a sale-leaseback transaction with a financial institution with regard to certain heavy-duty engine manufacturing equipment. The lease was classified as an operating lease with a lease term of 11.5 years, expiring June 28, 2013. The financial institution created a grantor trust to act as the lessor in the arrangement. The financial institution owns all of the equity in the trust. The grantor trust has no assets other than the equipment and its rights to the lease agreement with us. On the initial sale, we received $125 million from the financial institution which was financed with $99 million of non-recourse debt and $26 million of equity. Our obligations to the grantor trust consisted of the payments due under the lease and a $9 million guarantee of the residual value of the equipment. In addition, we had a fixed price purchase option that was exercisable on January 14, 2009, for approximately $35 million; however, we decided not to exercise this option.
In December 2003, the grantor trust which acts as the lessor in the sale and leaseback transaction described above was consolidated as a result of the adoption of new accounting standards for variable interest entities, due primarily to the existence of the residual value guarantee. As a result of the consolidation, the manufacturing equipment and the trust's obligations under its non-recourse debt arrangement was included in ourConsolidated Balance Sheets as property, plant and equipment and long-term debt, respectively. The equity in the trust held by the financial institution was reported as noncontrolling interest. In addition, ourConsolidated Statements of Income included interest expense on the lessor's debt obligations and depreciation expense on the manufacturing equipment rather than rent expense under the lease agreement. In April 2008, the trust made the final payment on the non-recourse debt.
In February 2009, we amended the lease agreement to extend the lease for an additional two years to June 2015 and we removed the residual value guarantee. As a result of removing the residual value guarantee, we are no longer required to consolidate the grantor trust and we deconsolidated the trust in the first quarter of 2009. With the deconsolidation, we are now required to account for the leasing arrangement with the trust which qualifies as a capital lease. The deconsolidation of the trust had minimal impact on ourConsolidated Financial Statements as the present value of the minimum lease payments (including the extension) approximated the amount that was reported as noncontrolling interest as of the date of the amendment. The reduction in noncontrolling interests and increase in our capital lease liabilities was $35 million.
The future lease payments required under the amended lease are as follows:
In millions Due date | Payment amount | |||
|---|---|---|---|---|
2010 | $ | — | ||
2011 | — | |||
2012 | 12 | |||
2013 | 10 | |||
2014 | 14 | |||
Thereafter | 4 | |||
The lease agreement includes certain default provisions requiring us to make timely rent payments, maintain, service, repair and insure the equipment and maintain minimum debt ratings for our long-term senior unsecured debt obligations.2016.
CUMMINS INC. AND SUBSIDIARIES
NOTES TO CONSOLIDATED FINANCIAL STATEMENTS (Continued)
NOTE 15. CUMMINS INC. SHAREHOLDERS' EQUITY
Preferred and Preference Stock
We are authorized to issue one million shares each of zero par value preferred and preference stock with preferred shares being senior to preference shares. We can determine the number of shares of each series, and the rights, preferences and limitations of each series. At December 31, 2009,2012, there was no preferred or preference stock outstanding.
During the second quarter of 2008, our shareholders ratified a proposal to increase our common stock authorization to 500 million shares. The Board of Directors authorized a pair of two-for-one splits of Cummins stock in 2007, which were distributed on April 9, 2007 and January 2, 2008, to shareholders of record as of March 26, 2007 and December 21, 2007, respectively. All share and per share amounts in this Form 10-K have been adjusted to reflect the two-for-one stock splits.
Changes in shares of common stock, treasury stock and common stock held in trust for employee benefit plans are as follows:
| In millions | Common Stock | Treasury Stock | Common Stock Held in Trust | ||||||||
|---|---|---|---|---|---|---|---|---|---|---|---|
Balance at December 31, 2006 | 220.0 | 11.6 | 7.6 | ||||||||
Shares acquired | — | 6.0 | — | ||||||||
Shares issued | 0.8 | (0.2 | ) | — | |||||||
Employee benefits trust activity | — | 0.8 | (1.1 | ) | |||||||
Other shareholder transactions | (0.4 | ) | — | — | |||||||
Balance at December 31, 2007 | 220.4 | 18.2 | 6.5 | ||||||||
Shares acquired | — | 2.3 | — | ||||||||
Shares issued | 1.6 | (0.1 | ) | — | |||||||
Employee benefits trust activity | — | — | (1.4 | ) | |||||||
Other shareholder transactions | (0.3 | ) | — | — | |||||||
Balance at December 31, 2008 | 221.7 | 20.4 | 5.1 | ||||||||
Shares acquired | — | 0.4 | — | ||||||||
Shares issued | 0.9 | (0.1 | ) | — | |||||||
Employee benefits trust activity | — | — | (2.1 | ) | |||||||
Other shareholder transactions | (0.6 | ) | — | — | |||||||
Balance at December 31, 2009 | 222.0 | 20.7 | 3.0 | ||||||||
| In millions | Common Stock | Treasury Stock | Common Stock Held in Trust | |||||||
|---|---|---|---|---|---|---|---|---|---|---|
Balance at December 31, 2009 | 222.0 | 20.7 | 3.0 | |||||||
Shares acquired | — | 3.5 | — | |||||||
Shares issued | 0.2 | (0.2 | ) | — | ||||||
Employee benefits trust activity | — | — | (0.9 | ) | ||||||
Other shareholder transactions | (0.4 | ) | — | — | ||||||
Balance at December 31, 2010 | 221.8 | 24.0 | 2.1 | |||||||
Shares acquired | — | 6.4 | — | |||||||
Shares issued | 0.4 | (0.2 | ) | — | ||||||
Employee benefits trust activity | — | — | (0.3 | ) | ||||||
Balance at December 31, 2011 | 222.2 | 30.2 | 1.8 | |||||||
Shares acquired | — | 2.6 | — | |||||||
Shares issued | 0.4 | (0.2 | ) | — | ||||||
Employee benefits trust activity | — | — | (0.3 | ) | ||||||
Other shareholder transactions | (0.2 | ) | — | — | ||||||
Balance at December 31, 2012 | 222.4 | 32.6 | 1.5 | |||||||
In July 2008, the Board of Directors voted to increase the quarterly cash dividend per common share by 40 percent and increased cash dividends to $0.175 per common share in the third and fourth quarters of 2008.
CUMMINS INC. AND SUBSIDIARIES
NOTES TO CONSOLIDATED FINANCIAL STATEMENTS (Continued)
NOTE 15. CUMMINS INC. SHAREHOLDERS' EQUITY (Continued)
In July 2007, the Board of Directors voted to increase the quarterly cash dividend per share by 39 percent and increased cash dividends to $0.125 per common share in the third and fourth quarters of 2007. Dividends per share paid to common shareholders for the years ended December 31, were as follows:
| | Quarterly Dividends | |||||||||
|---|---|---|---|---|---|---|---|---|---|---|
| | 2009 | 2008 | 2007 | |||||||
First quarter | $ | 0.175 | $ | 0.125 | $ | 0.09 | ||||
Second quarter | 0.175 | 0.125 | 0.09 | |||||||
Third quarter | 0.175 | 0.175 | 0.125 | |||||||
Fourth quarter | 0.175 | 0.175 | 0.125 | |||||||
Total dividends paid to common shareholders for the years ended December 31, 2009, 2008 and 2007 were $141 million, $122 million, and $89 million, respectively. Declaration and payment of dividends in the future depends upon income and liquidity position, among other factors.
Shares of common stock repurchased by us are recorded at cost as treasury stock and result in a reduction of shareholders' equity in ourConsolidated Balance Sheets. From time to time, treasuryTreasury shares may be reissued as part of our stock-based compensation programs. When shares are reissued, we use the weighted-average cost method for determining cost. The gains between the cost of the shares and the issuance price are added to additional paid-in-capital. The losses are deducted from additional paid-in capital to the extent of the gains. Thereafter, the losses are deducted from retained earnings.
Treasury stock activity for the three-year period ended December 31, 2009,2012, consisting of shares issued and purchasedrepurchased is presented in ourConsolidated Statements of Changes in Equity. For the year ended December 31, 2007, we repurchased $335 million
Table of common stock, which concluded the share repurchase program authorized byContents
CUMMINS INC. AND SUBSIDIARIES
NOTES TO CONSOLIDATED FINANCIAL STATEMENTS (Continued)
NOTE 15. SHAREHOLDERS' EQUITY (Continued)
In February 2011, the Board of Directors in July 2006.approved a share repurchase program and authorized the acquisition of up to $1 billion of our common stock. In 2007,2012, we also converted 0.8 million shares from our Employee Benefit Trust into treasury stock. These shares are not consideredmade the following quarterly purchases under the Board authorized purchase plan.this plan:
In millions (except per share amounts) For each quarter ended | 2012 Shares Purchased | Average Cost Per Share | Total Cost of Repurchases | Remaining Authorized Capacity | |||||||||
|---|---|---|---|---|---|---|---|---|---|---|---|---|---|
April 1 | 0.1 | $ | 114.97 | $ | 8 | $ | 474 | ||||||
July 1 | 1.8 | 104.00 | 188 | 286 | |||||||||
September 30 | 0.4 | 84.95 | 35 | 251 | |||||||||
December 31 | 0.3 | 87.83 | 25 | 226 | |||||||||
Total | 2.6 | 99.47 | $ | 256 | |||||||||
In December 2007,2012, the Board of Directors authorized the acquisition of up to $500 million$1 billion of Cummins common stock. For the years ended December 31, 2009 and December 31, 2008, we repurchased $20 million and $128 million, respectively, ofour common stock underupon completion of the share2011 repurchase program authorized byprogram.
In July 2012, the Board of Directors authorized a 25 percent increase to our quarterly cash dividend on our common stock from $0.40 per share to $0.50 per share. In July 2011, the Board of Directors approved a 52 percent increase to our quarterly cash dividend on our common stock from $0.2625 per share to $0.40 per share. In July 2010, our Board of Directors approved a 50 percent increase in Decemberour quarterly cash dividend on our common stock from $0.175 per share to $0.2625 per share. Cash dividends per share paid to common shareholders for the last three years were as follows:
| | Quarterly Dividends | |||||||||
|---|---|---|---|---|---|---|---|---|---|---|
| | 2012 | 2011 | 2010 | |||||||
First quarter | $ | 0.40 | $ | 0.2625 | $ | 0.175 | ||||
Second quarter | 0.40 | 0.2625 | 0.175 | |||||||
Third quarter | 0.50 | 0.40 | 0.2625 | |||||||
Fourth quarter | 0.50 | 0.40 | 0.2625 | |||||||
Total | $ | 1.80 | $ | 1.325 | $ | 0.875 | ||||
Total dividends paid to common shareholders in 2012, 2011 and 2010 were $340 million, $255 million and $172 million, respectively. Declaration and payment of 2007.dividends in the future depends upon our income and liquidity position, among other factors, and is subject to declaration by our Board of Directors, who meet quarterly to consider our dividend payment. We expect to fund dividend payments with cash from operations.
In 1997, we established the Employee Benefits Trust (EBT) funded with common stock for use in meeting our future obligations under employee benefit and compensation plans. The primary sources of cash for the EBT are dividends received on unallocated shares of our common stock held by the EBT. In addition to shares of our common stock held in the Employee Stock Ownership Plan (ESOP), theThe EBT may be used to fund matching contributions to employee accounts in the 401(k) Retirement Savings Plan (RSP) made in proportion to employee contributions under the terms of the RSP. Contributions charged to income for the years ended December 31, 2009 and 2008 were $13 millionIn
CUMMINS INC. AND SUBSIDIARIES
NOTES TO CONSOLIDATED FINANCIAL STATEMENTS (Continued)
NOTE 15. CUMMINS INC. SHAREHOLDERS' EQUITY (Continued)
and $3 million, respectively. There were noaddition, we may direct the trustee to sell shares of the EBT on the open market to fund other non-qualified employee benefit plans. Matching contributions charged to income for the yearyears ended December 31, 2007.2012, 2011 and 2010 were $27 million, $28 million and $21 million, respectively. EBT shares sold on the open market and proceeds from those sales for the years ended December 31, 2012, 2011 and 2010 were as follows:
| In millions | 2009 | 2008 | 2012 | 2011 | 2010 | ||||||||||||
|---|---|---|---|---|---|---|---|---|---|---|---|---|---|---|---|---|---|
EBT shares sold on open market | 1.5 | 1.4 | — | — | 0.7 | ||||||||||||
Proceeds from sale | $ | 72 | $ | 63 | $ | — | $ | — | $ | 58 | |||||||
In 2007, we converted 0.8 million shares into treasury stock at its fair value and sold 0.3 million shares on the open market from the EBT and used the $66 million of proceeds to fund other non-qualified employee benefit plans.
We have an ESOP Trust that was established in 1989 for certain domestic salaried and non-bargained employees participating in our RSP. The ESOP has a note payable to us which will be funded through future Company contributions to the ESOP Trust.
Our annual cash contributions during plan year 2009, 2008 and 2007 along with dividends received on unallocated shares of our common stock held by the ESOP Trust and cash contributions from the EBT were equal to the required principal and interest payments due under the ESOP notes. Dividends received on allocated ESOP shares are used to purchase shares of our common stock from the Employee Benefit Trust. Those shares are then allocated to the participant accounts. As the debt is repaid, shares are released from the ESOP and are allocated to participants in proportion to their contributions to the RSP. Compensation expense is recorded as shares are allocated to plan participants each year and reduced by the common stock dividends received by the ESOP Trust. Unearned compensation is included in Cummins Inc. shareholders' equity and represents compensation expense which will be recorded in the future as the remaining shares are allocated to participants. All shares issued to the ESOP Trust are considered outstanding for purposes of computing earnings per share. Dividends on unallocated ESOP shares can be used to service a portion of the principal and interest due on the ESOP notes.
| In millions | 2009 | 2008 | 2007 | |||||||
|---|---|---|---|---|---|---|---|---|---|---|
Dividends on unallocated ESOP shares | $ | — | $ | 1 | $ | 1 | ||||
Annual cash contributions, dividends received on unallocated shares and cash contributions from EBT | 10 | 9 | 10 | |||||||
Annual compensation expense | 4 | 3 | 4 | |||||||
| ||||
| ||||
| ||||
| ||||
CUMMINS INC. AND SUBSIDIARIES
NOTES TO CONSOLIDATED FINANCIAL STATEMENTS (Continued)
NOTE 16. OTHER COMPREHENSIVE INCOME (LOSS)
Following are the items included in other comprehensive income (loss) and the related tax effects:
| In millions | Before Tax Amount | Tax (Provision) Benefit | After Tax Amount | ||||||||
|---|---|---|---|---|---|---|---|---|---|---|---|
Year ended December 31, 2009 | |||||||||||
Change in pensions and other postretirement defined benefit plans | $ | 14 | $ | (4 | ) | $ | 10 | ||||
Foreign currency translation adjustments | 95 | (9 | ) | 86 | |||||||
Unrealized (loss) gain on marketable securities: | |||||||||||
Holding gain | 2 | (1 | ) | 1 | |||||||
Reclassification of realized gain to net income | (2 | ) | 1 | (1 | ) | ||||||
Net unrealized (loss) gain | — | — | — | ||||||||
Unrealized gain on derivatives: | |||||||||||
Holding gain | 81 | (25 | ) | 56 | |||||||
Reclassification of realized loss to net income | 25 | (6 | ) | 19 | |||||||
Net unrealized gain | 106 | (31 | ) | 75 | |||||||
Other comprehensive income attributable to Cummins Inc. | 215 | (44 | ) | 171 | |||||||
Noncontrolling interests | 14 | — | 14 | ||||||||
Total other comprehensive income | $ | 229 | $ | (44 | ) | $ | 185 | ||||
Year ended December 31, 2008 | |||||||||||
Change in pensions and other postretirement defined benefit plans | $ | (643 | ) | $ | 225 | $ | (418 | ) | |||
Foreign currency translation adjustments | (312 | ) | 23 | (289 | ) | ||||||
Unrealized loss on marketable securities: | |||||||||||
Holding gain | 1 | — | 1 | ||||||||
Reclassification of realized gain to net income | (2 | ) | — | (2 | ) | ||||||
Net unrealized loss | (1 | ) | — | (1 | ) | ||||||
Unrealized loss on derivatives: | |||||||||||
Holding loss | (92 | ) | 25 | (67 | ) | ||||||
Reclassification of realized gain to net income | (5 | ) | 2 | (3 | ) | ||||||
Net unrealized loss | (97 | ) | 27 | (70 | ) | ||||||
Other comprehensive loss attributable to Cummins Inc. | (1,053 | ) | 275 | (778 | ) | ||||||
Noncontrolling interests | (37 | ) | 1 | (36 | ) | ||||||
Total other comprehensive loss | $ | (1,090 | ) | $ | 276 | $ | (814 | ) | |||
Year ended December 31, 2007 | |||||||||||
Change in pensions and other postretirement defined benefit plans | $ | 225 | $ | (92 | ) | $ | 133 | ||||
Foreign currency translation adjustments | 138 | (28 | ) | 110 | |||||||
Unrealized gain on marketable securities: | |||||||||||
Holding gain | 3 | (1 | ) | 2 | |||||||
Reclassification of realized gain to net income | (1 | ) | — | (1 | ) | ||||||
Net unrealized gain | 2 | (1 | ) | 1 | |||||||
Unrealized loss on derivatives: | |||||||||||
Holding gain | 19 | (7 | ) | 12 | |||||||
Reclassification of realized gain to net income | (26 | ) | 9 | (17 | ) | ||||||
Net unrealized loss | (7 | ) | 2 | (5 | ) | ||||||
Other comprehensive income attributable to Cummins Inc. | 358 | (119 | ) | 239 | |||||||
Noncontrolling interests | 19 | (1 | ) | 18 | |||||||
Total other comprehensive income | $ | 377 | $ | (120 | ) | $ | 257 | ||||
| In millions | Before Tax Amount | Tax (Provision) Benefit | After Tax Amount | |||||||
|---|---|---|---|---|---|---|---|---|---|---|
Year ended December 31, 2012 | ||||||||||
Change in pensions and other postretirement defined benefit plans | $ | (103 | ) | $ | 33 | $ | (70 | ) | ||
Foreign currency translation adjustments | 25 | 12 | 37 | |||||||
Unrealized gain (loss) on marketable securities | ||||||||||
Holding gain (loss) | (2 | ) | 1 | (1 | ) | |||||
Reclassification of realized gain (loss) to net income | 3 | (1 | ) | 2 | ||||||
Net unrealized gain (loss) | 1 | — | 1 | |||||||
Unrealized gain (loss) on derivatives | ||||||||||
Holding gain (loss) | 16 | (5 | ) | 11 | ||||||
Reclassification of realized gain (loss) to net income | 14 | (5 | ) | 9 | ||||||
Net unrealized gain (loss) | 30 | (10 | ) | 20 | ||||||
Other comprehensive income (loss) attributable to Cummins Inc. | (47 | ) | 35 | (12 | ) | |||||
Noncontrolling interests | (7 | ) | — | (7 | ) | |||||
Total other comprehensive income (loss) | $ | (54 | ) | $ | 35 | $ | (19 | ) | ||
Year ended December 31, 2011 | ||||||||||
Change in pensions and other postretirement defined benefit plans | $ | (107 | ) | $ | 29 | $ | (78 | ) | ||
Foreign currency translation adjustments | (120 | ) | 12 | (108 | ) | |||||
Unrealized gain (loss) on marketable securities | ||||||||||
Holding gain (loss) | (3 | ) | 1 | (2 | ) | |||||
Reclassification of realized gain (loss) to net income | 3 | (1 | ) | 2 | ||||||
Net unrealized gain (loss) | — | — | — | |||||||
Unrealized gain (loss) on derivatives | ||||||||||
Holding gain (loss) | (26 | ) | 11 | (15 | ) | |||||
Reclassification of realized gain (loss) to net income | (22 | ) | 5 | (17 | ) | |||||
Net unrealized gain (loss) | (48 | ) | 16 | (32 | ) | |||||
Other comprehensive income (loss) attributable to Cummins Inc. | (275 | ) | 57 | (218 | ) | |||||
Noncontrolling interests | (38 | ) | — | (38 | ) | |||||
Total other comprehensive income (loss) | $ | (313 | ) | $ | 57 | $ | (256 | ) | ||
Year ended December 31, 2010 | ||||||||||
Change in pensions and other postretirement defined benefit plans | $ | 207 | $ | (65 | ) | $ | 142 | |||
Foreign currency translation adjustments | 52 | (25 | ) | 27 | ||||||
Unrealized gain (loss) on marketable securities | ||||||||||
Holding gain (loss) | 2 | — | 2 | |||||||
Reclassification of realized gain (loss) to net income | — | — | — | |||||||
Net unrealized gain (loss) | 2 | — | 2 | |||||||
Unrealized gain (loss) on derivatives | ||||||||||
Holding gain (loss) | 8 | (3 | ) | 5 | ||||||
Reclassification of realized gain (loss) to net income | (2 | ) | 1 | (1 | ) | |||||
Net unrealized gain (loss) | 6 | (2 | ) | 4 | ||||||
Other comprehensive income (loss) attributable to Cummins Inc. | 267 | (92 | ) | 175 | ||||||
Noncontrolling interests | 12 | — | 12 | |||||||
Total other comprehensive income (loss) | $ | 279 | $ | (92 | ) | $ | 187 | |||
CUMMINS INC. AND SUBSIDIARIES
NOTES TO CONSOLIDATED FINANCIAL STATEMENTS (Continued)
NOTE 17. STOCK INCENTIVE AND STOCK OPTION PLANS
In September 2003,May 2012, our shareholders approved the 2003 Stock Incentive2012 Omnibus Plan (The(the Plan), which replaced and succeeded the 19932003 Stock Incentive Plan. The Plan as amended February 2009, allows for the granting of up to $13.513.5 million stock-based awards to executives and employees, of which one-half must be in the form of stock options.options or stock appreciation rights. Awards available for grant under the planPlan include, but are not limited to, stock options, stock appreciation rights performanceand stock awards. Shares issued under the Plan may be newly issued shares restricted stock and other stock awards.or reissued treasury shares.
Stock options are generally granted with a strike price equal to the fair market value of the stock on the date of grant, a life of 10 years and a two-year vesting period. The strike price may be higher than the fair value of the stock on the date of the grant, but cannot be lower. Compensation expense is recorded on a straight-line basis over the vesting period beginning on the grant date. The compensation expense is based on the fair value of each option grant using the Black-Scholes option pricing model. Options granted to employees eligible for retirement under the Company'sour retirement plan are fully expensed as of the grant date.
Stock options are also awarded through the Key Employee Stock Investment Plan (KESIP) which allows certain employees, other than officers, to purchase shares of common stock on an installment basis up to an established credit limit. Fifty stock options are granted for every even block of 100 KESIP shares purchased by the employee. The options granted through the KESIP program are considered awards under Thethe Plan and are vested immediately. Compensation expense for stock options granted through the KESIP program is recorded based on the fair value of each option grant using the Black-Scholes option pricing model.
Performance shares are granted as target awards and are earned based on our return on equity (ROE) performance. A payout factor has been established ranging from zero0 to 200 percent of the target award based on theour actual ROE performance. Shares granted during or prior to 2010, have a two-year performance during the two-yearperiod and a one year restriction period. Any shares earned are then restricted for one additional year. Employees leaving the company prior to the end of the restriction period forfeit their shares.any shares subject to the restriction period. Shares granted during 2011 or after, have a three-year performance period and no restriction period. The fair value of the award is equal to the average market price, adjusted for the present value of dividends over the vesting period, of our stock on the grant date. Compensation expense is recorded ratably over the period beginning on the grant date until the shares become unrestricted and is based on the amount of the award that is expected to be earned under the plan formula, adjusted each reporting period based on current information.
Restricted common stock is awarded from time to time at no cost to certain employees. Participants are entitled to cash dividends and voting rights. Restrictions limit the sale or transfer of the shares during a defined period. Generally, one-third of the shares are releasedbecome vested and free from restrictions after two years and one-third of the shares issued are releasedbecome vested and free from restrictions each year thereafter on the anniversary of the grant date, provided the participant remains an employee. The fair value of the award is equal to the average market price of our stock on the grant date. Compensation expense is determined at the grant date and is recognized over the four-year restriction period on a straight-line basis.
Compensation expense (net of estimated forfeitures) related to our share-based plans for the year ended December 31, 2009, 20082012, 2011 and 20072010 was approximately $20$35 million, $28$40 million and $28$20 million, respectively. The excess tax deficiency/benefitbenefit/(deficiency) associated with our share-based plans for the years ended December 31, 2009, 20082012, 2011 and 2007,2010, was $(1)$14 million, $13$5 million and $11$10 million, respectively. The total unrecognized compensation expense (net of estimated forfeitures) related to nonvested awards was approximately $6 million at December 31, 2009, and was expected to be recognized over a weighted-average period of less than one year.
CUMMINS INC. AND SUBSIDIARIES
NOTES TO CONSOLIDATED FINANCIAL STATEMENTS (Continued)
NOTE 17. STOCK INCENTIVE AND STOCK OPTION PLANS (Continued)
The tabletotal unrecognized compensation expense (net of estimated forfeitures) related to nonvested awards was approximately $39 million at December 31, 2012, and is expected to be recognized over a weighted-average period of less than two years.
The tables below summarizessummarize the activity in our stock option plans:the Plan:
| | Options | Weighted-average Exercise Price | Weighted-average Remaining Contractual Life (in years) | Aggregate Intrinsic Value | ||||||||||
|---|---|---|---|---|---|---|---|---|---|---|---|---|---|---|
Balance, December 31, 2006 | 831,760 | $ | 10.91 | |||||||||||
Granted | 21,000 | 49.42 | ||||||||||||
Exercised | (235,310 | ) | 11.73 | |||||||||||
Forfeited | (69,700 | ) | 10.11 | |||||||||||
Expired | (15,000 | ) | 13.25 | |||||||||||
Balance, December 31, 2007 | 532,750 | $ | 12.10 | |||||||||||
Granted | 105,350 | 27.34 | ||||||||||||
Exercised | (188,120 | ) | 11.21 | |||||||||||
Forfeited | (5,400 | ) | 9.93 | |||||||||||
Expired | (4,500 | ) | 13.92 | |||||||||||
Balance, December 31, 2008 | 440,080 | $ | 16.14 | |||||||||||
Granted | 598,510 | 25.31 | ||||||||||||
Exercised | (117,830 | ) | 14.66 | |||||||||||
Forfeited | (3,530 | ) | 25.05 | |||||||||||
Expired | (20,400 | ) | 10.63 | |||||||||||
Balance, December 31, 2009 | 896,830 | $ | 22.55 | 7.41 | $ | 21,520,928 | ||||||||
Exercisable, December 31, 2007 | 532,750 | $ | 12.10 | 3.44 | $ | 27,480,505 | ||||||||
Exercisable, December 31, 2008 | 440,080 | $ | 16.14 | 4.50 | $ | 5,529,723 | ||||||||
Exercisable, December 31, 2009 | 376,450 | $ | 18.50 | 4.82 | $ | 10,709,436 | ||||||||
| | Options | Weighted-average Exercise Price | Weighted- average Remaining Contractual Life (in years) | Aggregate Intrinsic Value | ||||||||
|---|---|---|---|---|---|---|---|---|---|---|---|---|
Balance at December 31, 2009 | 896,830 | $ | 22.55 | |||||||||
Granted | 387,250 | 62.74 | ||||||||||
Exercised | (195,530 | ) | 17.36 | |||||||||
Forfeited | (8,555 | ) | 41.54 | |||||||||
Expired | (6,400 | ) | 9.33 | |||||||||
Balance at December 31, 2010 | 1,073,595 | 37.92 | ||||||||||
Granted | 316,159 | 115.71 | ||||||||||
Exercised | (134,520 | ) | 23.93 | |||||||||
Forfeited | (12,197 | ) | 57.68 | |||||||||
Balance at December 31, 2011 | 1,243,037 | 59.02 | ||||||||||
Granted | 321,945 | 119.34 | ||||||||||
Exercised | (241,815 | ) | 31.73 | |||||||||
Forfeited | (13,999 | ) | 67.86 | |||||||||
Balance at December 31, 2012 | 1,309,168 | $ | 78.80 | 7.30 | $ | 44,192,177 | ||||||
Exercisable, December 31, 2010 | 222,110 | $ | 26.36 | 5.40 | $ | 18,683,972 | ||||||
Exercisable, December 31, 2011 | 721,210 | $ | 38.75 | 6.25 | $ | 37,526,500 | ||||||
Exercisable, December 31, 2012 | 785,869 | $ | 51.40 | 6.26 | $ | 44,176,663 | ||||||
The weighted-average grant date fair value of options granted during the years ended December 31, 2009, 20082012, 2011 and 2007,2010, was $10.57, $12.38$54.25, $51.23 and $14.75,$27.45, respectively. The total intrinsic value of options exercised during the years ended December 31, 2009, 20082012, 2011 and 2007,2010, was approximately $3$19 million, $9$12 million and $9$13 million, respectively.
CUMMINS INC. AND SUBSIDIARIES
NOTES TO CONSOLIDATED FINANCIAL STATEMENTS (Continued)
NOTE 17. STOCK INCENTIVE AND STOCK OPTION PLANS (Continued)
The weighted-average grant date fair value of performance and restricted shares iswas as follows:
| | Performance Shares | Restricted Shares | ||||||||||||
|---|---|---|---|---|---|---|---|---|---|---|---|---|---|---|
| | Shares | Weighted-average Fair Value | Shares | Weighted-average Fair Value | ||||||||||
Nonvested at December 31, 2006 | 2,545,180 | $ | 17.80 | 204,000 | $ | 26.80 | ||||||||
Granted | 597,240 | 38.21 | 4,800 | 42.61 | ||||||||||
Vested | (1,063,160 | ) | 12.56 | — | — | |||||||||
Forfeited | (4,624 | ) | 27.10 | — | — | |||||||||
Nonvested at December 31, 2007 | 2,074,636 | $ | 26.34 | 208,800 | $ | 27.16 | ||||||||
Granted | 1,038,842 | 34.95 | — | — | ||||||||||
Vested | (842,300 | ) | 19.08 | (70,670 | ) | 26.49 | ||||||||
Forfeited | (64,692 | ) | 32.56 | — | — | |||||||||
Nonvested at December 31, 2008 | 2,206,486 | $ | 32.98 | 138,130 | $ | 27.51 | ||||||||
Granted | 440,168 | 31.67 | — | — | ||||||||||
Vested | (1,382,720 | ) | 25.34 | (68,264 | ) | 27.33 | ||||||||
Forfeited | (50,548 | ) | 47.40 | — | — | |||||||||
Nonvested at December 31, 2009 | 1,213,386 | $ | 40.63 | 69,866 | $ | 27.68 | ||||||||
| | Performance Shares | Restricted Shares | |||||||||||
|---|---|---|---|---|---|---|---|---|---|---|---|---|---|
| | Shares | Weighted-average Fair Value | Shares | Weighted-average Fair Value | |||||||||
Nonvested at December 31, 2009 | 1,213,386 | $ | 40.63 | 69,866 | $ | 27.68 | |||||||
Granted | 186,947 | 60.92 | 68,290 | 52.16 | |||||||||
Vested | (704,931 | ) | 38.62 | (68,266 | ) | 27.33 | |||||||
Cancelled | (200,324 | ) | 56.53 | — | — | ||||||||
Forefeited | (13,307 | ) | 30.98 | — | — | ||||||||
Nonvested at December 31, 2010 | 481,771 | 45.10 | 69,890 | 51.94 | |||||||||
Granted | 229,436 | 86.65 | 13,555 | 108.51 | |||||||||
Vested | (178,653 | ) | 48.03 | (1,600 | ) | 42.61 | |||||||
Forfeited | (7,163 | ) | 59.15 | — | — | ||||||||
Nonvested at December 31, 2011 | 525,391 | 62.05 | 81,845 | 61.49 | |||||||||
Granted | 325,590 | 89.92 | 3,150 | 91.68 | |||||||||
Vested | (194,484 | ) | 25.46 | (22,766 | ) | 52.16 | |||||||
Forfeited | (26,413 | ) | 91.94 | — | — | ||||||||
Nonvested at December 31, 2012 | 630,084 | $ | 86.49 | 62,229 | $ | 66.43 | |||||||
The total fair value of performance shares vested during the years ended December 31, 2009, 20082012, 2011 and 20072010 was $35$24 million, $16$17 million and $13$42 million, respectively. The total fair value of restricted shares vested duringwas $3 million, less than $1 million and $4 million for the years ended December 31, 20092012, 2011 and 2008 was $2 million each and zero for the year ended December 31, 2007.2010.
The fair value of each option grant was estimated on the grant date using the Black-Scholes option pricing model with the following assumptions:
| | Years ended December 31, | Years ended December 31, | ||||||||||||||||||
|---|---|---|---|---|---|---|---|---|---|---|---|---|---|---|---|---|---|---|---|---|
| | 2009 | 2008 | 2007 | 2012 | 2011 | 2010 | ||||||||||||||
Expected life (years) | 5 | 7 | 7 | 5 | 5 | 5 | ||||||||||||||
Risk-free interest rate | 2.55 | % | 3.2 | % | 4.4 | % | 1.05 | % | 1.87 | % | 2.26 | % | ||||||||
Expected volatility | 50.55 | % | 49.6 | % | 24.0 | % | 58.98 | % | 55.39 | % | 54.23 | % | ||||||||
Dividend yield | 1.5 | % | 1.3 | % | 1.5 | % | 1.3 | % | 1.3 | % | 1.4 | % | ||||||||
Expected life—The expected life of employee stock options represents the weighted-average period the stock options are expected to remain outstanding based upon our historical data.
Risk-free interest rate—The risk-free interest rate assumption is based upon the observed U.S. treasury security rate appropriate for the expected life of our employee stock options.
Expected volatility—The expected volatility assumption is based upon the weighted-average historical daily price changes of our common stock over the most recent period equal to the expected option life of the grant, adjusted for activity which is not expected to occur in the future.
Dividend yield—The dividend yield assumption is based on our history and expectation of dividend payouts.
CUMMINS INC. AND SUBSIDIARIES
NOTES TO CONSOLIDATED FINANCIAL STATEMENTS (Continued)
NOTE 17. STOCK INCENTIVE AND STOCK OPTION PLANS (Continued)
Dividend yield—The dividend yield assumption is based on our history and expectation of dividend payouts.
NOTE 18. NONCONTROLLING INTERESTS
Noncontrolling interests in the equity of consolidated subsidiaries arewere as follows:
| | December 31, | December 31, | ||||||||||||
|---|---|---|---|---|---|---|---|---|---|---|---|---|---|---|
| In millions | 2009 | 2008 | 2012 | 2011 | ||||||||||
Cummins India Ltd. | $ | 185 | $ | 157 | $ | 260 | $ | 233 | ||||||
Wuxi Cummins Turbo Technologies Co. Ltd. | 36 | 31 | 75 | 75 | ||||||||||
Other | 26 | 58 | 36 | 31 | ||||||||||
Total | $ | 247 | $ | 246 | $ | 371 | $ | 339 | ||||||
NOTE 19. EARNINGS PER SHARERESTRUCTURING AND OTHER CHARGES
We calculate basic earnings per share (EPS)have executed restructuring actions primarily in the form of common stockinvoluntary separation programs in the fourth quarter of 2012. These actions were in response to deterioration in our U.S. businesses and most key markets around the world in the second half of 2012, as well as a reduction in orders in most U.S. and global markets for 2013. We reduced our worldwide professional workforce by dividing net income attributableapproximately 650 employees, or 3 percent. We also reduced our hourly workforce by approximately 650 employees. During 2012, we incurred a pre-tax charge related to Cummins Inc.the professional and hourly workforce reductions of approximately $49 million.
Employee termination and severance costs were recorded based on approved plans developed by the weighted-average number of common shares outstandingbusinesses and corporate management which specified positions to be eliminated, benefits to be paid under existing severance plans or statutory requirements and the expected timetable for the period. The calculation of diluted EPS assumes the issuance of common stock for all potentially dilutive share equivalents outstanding. We exclude shares of common stock held in the EBT (see Note 15) from the calculationcompletion of the weighted-average common shares outstanding until those shares are distributed fromplan. Estimates of restructuring were made based on information available at the EBTtime charges were recorded. Due to the RSP. Following are the computationsinherent uncertainty involved, actual amounts paid for basicsuch activities may differ from amounts initially recorded and diluted earnings per share:we may need to revise previous estimates.
We incurred a $1 million charge for lease terminations and a $2 million charge for asset impairments and other non-cash charges. During 2012, we recorded restructuring and other charges of $52 million ($35 million after-tax). These restructuring actions included:
| | Years ended December 31, | ||||||||||
|---|---|---|---|---|---|---|---|---|---|---|---|
| Dollars in millions, except per share amounts | 2009 | 2008 | 2007 | ||||||||
Net income attributable to Cummins Inc. | $ | 428 | $ | 755 | $ | 739 | |||||
Weighted-average common shares outstanding: | |||||||||||
Basic | 197,445,998 | 194,958,370 | 198,443,501 | ||||||||
Dilutive effect of stock compensation awards | 249,126 | 1,572,178 | 1,454,153 | ||||||||
Diluted | 197,695,124 | 196,530,548 | 199,897,654 | ||||||||
Earnings per common share attributable to Cummins Inc.: | |||||||||||
Basic | $ | 2.17 | $ | 3.87 | $ | 3.72 | |||||
Diluted | 2.16 | 3.84 | 3.70 | ||||||||
| In millions | Year ended December 31, 2012 | |||
|---|---|---|---|---|
Workforce reductions | $ | 49 | ||
Exit activities | 1 | |||
Other | 2 | |||
Restructuring and other charges | $ | 52 | ||
The weighted-average diluted common shares outstanding for 2009 and 2008 excludes the effect of approximately 53,750 and 16,020 weighted-average shares, respectively, of common stock options, since such options had an exercise price in excessAt December 31, 2012, of the monthly average market value of our common stock during that year.
NOTE 20. DERIVATIVES
We are exposedapproximately 1,300 employees to financial risk resulting from volatility in foreign exchange rates, commodity prices and interest rates. This risk is closely monitored and managed through the use of financial derivative instruments including foreign currency forward contracts, commodity swap contracts and interest rate swaps. As stated in our policies and procedures, financial derivatives are used expressly forbe affected by this plan, 1,130 had been terminated.
CUMMINS INC. AND SUBSIDIARIES
NOTES TO CONSOLIDATED FINANCIAL STATEMENTS (Continued)
NOTE 20. DERIVATIVES19. RESTRUCTURING AND OTHER CHARGES (Continued)
hedging purposes, Restructuring and under no circumstances are they used for speculative purposes. When material, we adjust the value ofother charges were included in each segment in our derivative contracts for counter-party or our credit risk. Theoperating results and status of our hedging transactions are reported to senior management on a monthly and quarterly basis.as follows:
| In millions | Year ended December 31, 2012 | |||
|---|---|---|---|---|
Engine | $ | 20 | ||
Distribution | 14 | |||
Power Generation | 12 | |||
Components | 6 | |||
Restructuring and other charges | $ | 52 | ||
As a result of our international business presence, we are exposed to foreign currency exchange risks. We transact business in foreign currencies and, as a result our income experiences some volatility related to movements in foreign currency exchange rates. To help manage our exposure to exchange rate volatility, we use foreign exchange forward contracts on a regular basis to hedge forecasted intercompany and third-party sales and purchases denominated in non-functional currencies. Our internal policy allows for managing anticipated foreign currency cash flow for up to one year. These foreign currency forward contracts are designated and qualify as foreign currency cash flow hedges under GAAP. The effective portion of the unrealized gain or loss on the forward contract is deferred and reported as a component of "Accumulated other comprehensive loss" (AOCL). When the hedged forecasted transaction (sale or purchase) occurs, the unrealized gain or loss is reclassified into income in the same line item associated with the hedged transaction in the same period or periods during which the hedged transaction affects income. The ineffective portion of the hedge, unrealized gain or loss, if any, is recognized in current income during the period of change. As of December 31, 2009, the amount expected to be reclassified to income over the next year is not material. For the years ended December 31, 2009 and 2008, there were no circumstances that would have resulted in the discontinuance of a cash flow hedge.
To minimize the income volatility resulting from the remeasurement of net monetary assets and payables denominated in a currency other than the functional currency, we enter into foreign currency forward contracts, which are considered economic hedges. The objective is to offset the gain or loss from remeasurement with the gain or loss from the fair market valuation of the forward contract. These derivative instruments are not designated as hedges under GAAP.
The table below summarizes our outstanding foreign currency forward contracts. The currenciesthe activity and balance of accrued restructuring charges, which is included in this table represent 93 percent of the notional amounts of contracts outstanding as of December 31, 2009.
| ||||
| ||||
| ||||
| ||||
| ||||
| ||||
| ||||
CUMMINS INC. AND SUBSIDIARIES
NOTES TO CONSOLIDATED FINANCIAL STATEMENTS (Continued)
NOTE 20. DERIVATIVES (Continued)
"Other accrued expenses" in our Commodity Price Risk
We are exposed to fluctuations in commodity prices due to contractual agreements with component suppliers. In order to protect ourselves against future price volatility and, consequently, fluctuations in gross margins, we periodically enter into commodity swap contracts with designated banks to fix the cost of certain raw material purchases with the objective of minimizing changes in inventory cost due to market price fluctuations. The commodity swap contracts are derivative contracts that are designated as cash flow hedges under GAAP. The effective portion of the unrealized gain or loss is deferred and reported as a component of AOCL. When the hedged forecasted transaction (purchase) occurs, the unrealized gain or loss is reclassified into income in the same line item associated with the hedged transaction in the same period or periods during which the hedged transaction affects income. The ineffective portion of the hedge, if any, is recognized in current income in the period in which the ineffectiveness occurs. As of December 31, 2009, we expect to reclassify an unrealized net gain of $5 million from AOCL to income over the next year. For the year ended December 31, 2009, we discontinued hedge accounting on certain contracts where the forecasted transactions were no longer probable. The amount reclassified to income as a result of this action was a loss of $4 million. For the year ended December 31, 2008, there were no material circumstances that would have resulted in the discontinuance of a cash flow hedge. Our internal policy allows for managing these cash flow hedges for up to three years.
The following table summarizes our outstanding commodity swap contracts that were entered into to hedge the cost of certain raw material purchases:
| | December 31, 2009 | ||||
|---|---|---|---|---|---|
Dollars in millions Commodity | Notional Amount | Quantity | |||
Copper | $ | 77 | 11,372 metric tons(1) | ||
Platinum | 14 | 15,986 troy ounces(2) | |||
Palladium | 1 | 3,161 troy ounces(2) | |||
Consolidated Balance SheetsInterest Rate Risk
We are exposed to market risk from fluctuations in interest rates. We manage our exposure to interest rate fluctuations through the use of interest rate swaps. The objective of the swaps is to more effectively balance our borrowing costs and interest rate risk.
In November 2005, we entered into an interest rate swap to effectively convert our $250 million debt, due in 2028, from a fixed rate of 7.125% to a floating rate based on a LIBOR spread. The terms of the swap mirror those of the debt, with interest paid semi-annually. This swap qualifies as a fair value hedge under GAAP. The gain or loss on this derivative instrument as well as the offsetting gain
CUMMINS INC. AND SUBSIDIARIES
NOTES TO CONSOLIDATED FINANCIAL STATEMENTS (Continued)
NOTE 20. DERIVATIVES (Continued)
or loss on the hedged item attributable to the hedged risk are recognized in current income as "Interest expense." These gains and losses for the year ended December 31, 2009, were as follows:2012.
| In millions | Charges | Payments | Accrued Balance at December 31, 2012 | |||||||
|---|---|---|---|---|---|---|---|---|---|---|
Restructuring charges(1) | $ | 50 | $ | 25 | $ | 25 | ||||
| | December 31, 2009 | ||||||
|---|---|---|---|---|---|---|---|
In millions Income Statement Classification | Gain/(Loss) on Swaps | Gain/(Loss) on Borrowings | |||||
Interest expense | $ | (54 | ) | $ | 54 | ||
The following table below summarizes where the locationrestructuring and amounts of gains and lossesother charges are located in ourConsolidated Statements of Income for derivative instruments classified as cash flow hedges for the year ended December 31, 2009. The tables do not include amounts related to ineffectiveness as it was not material for the periods presented.2012.
| | For the year ended December 31, 2009 | | ||||||
|---|---|---|---|---|---|---|---|---|
In millions Derivatives in Cash Flow Hedging Relationships | Amount of Gain/(Loss) Recognized in AOCL on Derivative (Effective Portion) | Amount of Gain/(Loss) Reclassified from AOCL into Income (Effective Portion) | Location of Gain/(Loss) Reclassified into Income (Effective Portion) | |||||
Foreign currency forward contracts | $ | 7 | $ | (1 | ) | Sales | ||
Commodity swap contracts | 74 | (24 | ) | Cost of sales | ||||
Total | $ | 81 | $ | (25 | ) | |||
| In millions | Year ended December 31, 2012 | |||
|---|---|---|---|---|
Cost of sales | $ | 29 | ||
Selling, general and administrative expenses | 20 | |||
Research, development and engineering expenses | 3 | |||
Restructuring and other charges | $ | 52 | ||
Derivatives Not Designated as Hedging Instruments
The following table summarizes the location and amounts of gains and losses in ourConsolidated Statements of Income for derivative instruments that are not classified as hedges for the year ended December 31, 2009.
In millions Derivatives Not Designated as Hedging Instruments | Location of Gain/(Loss) Recognized in Income on Derivatives | Amount of Gain/(Loss) Recognized in Income on Derivatives | ||||
|---|---|---|---|---|---|---|
Foreign currency forward contracts | Cost of sales | $ | 2 | |||
Foreign currency forward contracts | Other (expense) income, net | 12 | ||||
CUMMINS INC. AND SUBSIDIARIES
NOTES TO CONSOLIDATED FINANCIAL STATEMENTS (Continued)
NOTE 20. DERIVATIVES (Continued)
Fair Value Amount and Location of Derivative Instruments
The following tables summarize the location and fair value of derivative instruments on ourConsolidated Balance Sheets:
| | Derivative assets | |||||
|---|---|---|---|---|---|---|
| | Fair Value | | ||||
| In millions | December 31, 2009 | Balance Sheet Location | ||||
Derivatives Designated as Hedging Instruments | ||||||
Foreign currency forward contracts | $ | — | ||||
Commodity swap contracts | 9 | Prepaid expenses and other current assets | ||||
Commodity swap contracts | 8 | Other assets | ||||
Interest rate contract | 25 | Other assets | ||||
Total Derivatives Designated as Hedging Instruments | $ | 42 | ||||
Total derivative assets | $ | 42 | ||||
| | Derivative liabilities | |||||
|---|---|---|---|---|---|---|
| | Fair Value | | ||||
| In millions | December 31, 2009 | Balance Sheet Location | ||||
Derivatives Designated as Hedging Instruments | ||||||
Foreign currency forward contracts | $ | 1 | Other accrued expenses | |||
Commodity swap contracts | — | |||||
Total Derivatives Designated as Hedging Instruments | $ | 1 | ||||
Derivatives Not Designated as Hedging Instruments | ||||||
Foreign currency forward contracts | $ | — | ||||
Total Derivatives Not Designated as Hedging Instruments | $ | — | ||||
Total derivative liabilities | $ | 1 | ||||
NOTE 21. SALES OF ACCOUNTS RECEIVABLE
In January 2004, we entered into a three-year facility agreement with a financial institution to sell a designated pool of trade receivables to Cummins Trade Receivables, LLC (CTR), a wholly-owned special purpose subsidiary. In July 2007, we amended the agreement to extend the facility until July 2010, and raised the purchase limitation from $200 million to $400 million. The agreement also provides us with an option to increase the purchase limitation up to $500 million upon approval. As
CUMMINS INC. AND SUBSIDIARIES
NOTES TO CONSOLIDATED FINANCIAL STATEMENTS (Continued)
NOTE 21. SALES OF ACCOUNTS RECEIVABLE (Continued)
necessary, CTR may transfer a direct interest in its receivables, without recourse, to the financial institution. To maintain a balance in the designated pools of receivables sold, we sell new receivables to CTR as existing receivables are collected. Receivables sold to CTR in which an interest is not transferred to the financial institution are included in "Receivables, net" on ourConsolidated Balance Sheets. The maximum interest in sold receivables that can be outstanding at any point in time is limited to the lesser of $400 million or the amount of eligible receivables held by CTR. There are no provisions in this agreement that require us to maintain a minimum investment credit rating; however, the terms of the agreement contain the same financial covenants as our revolving credit facility (see Note 10). As of December 31, 2009, the amount available under this program was $154 million. As of December 31, 2009 and 2008, there were no amounts outstanding under this program.
No accounts receivable sold to CTR were written off during 2009, 2008 or 2007. The sold receivables servicing portfolio, which is included in receivables and the proceeds from the sale of receivables and other related cash flows are as follows:
| | As of and for the years ended December 31, | |||||||||
|---|---|---|---|---|---|---|---|---|---|---|
| In millions | 2009 | 2008 | 2007 | |||||||
Sold receivables servicing portfolio | $ | 806 | $ | 652 | $ | 759 | ||||
Receivables sold to special purpose subsidiary | 5,424 | 6,694 | 6,615 | |||||||
Collections reinvested in special purpose subsidiary | 5,270 | 6,801 | 6,575 | |||||||
Servicing fees and interest | 3 | 1 | 1 | |||||||
NOTE 22. ACQUISITIONS AND DIVESTITURES20. EARNINGS PER SHARE
During 2008, we purchased a majority interestWe calculate basic earnings per share (EPS) of common stock by dividing net income attributable to Cummins Inc. by the weighted-average number of common shares outstanding for the period. The calculation of diluted EPS assumes the issuance of common stock for all potentially dilutive share equivalents outstanding. We exclude shares of common stock held in three previously independent North American distributors in order to increase our ownership interests in key portionsthe EBT (see Note 15, "SHAREHOLDERS' EQUITY") from the calculation of the distribution channel. The acquisitions were accounted for under the purchase method of accounting and resulted in an aggregate purchase price of $81 million which we funded with $54 million of borrowings and $27 million of cash. The assets of the acquired businesses were primarily accounts receivable, inventory and fixed assets. There was less than $1 million of goodwill generated from these transactions. During the first three months of 2007, we purchased the remaining interest in a manufacturing joint venture and acquired ownership of an international independent distributor for approximately $20 million. We recorded goodwill of $13 million for these two transactions.
In July 2008, we entered into a transaction with two Fiat group companies to (1) sell our one-third interest in the European Engine Alliance (EEA) joint venture and simultaneously (2) purchase the remaining 50 percent interest in CDC. As a result, we now own 100 percent of CDC and no longer have an ownership interest in EEA. CDC was previously included in our consolidated results as we were considered the primary beneficiary under GAAP. We sold our remaining interest in EEA for $64 million and subsequently purchased the remaining interest in CDC for $61 million, however, because the transactions were entered into simultaneously with the same counterparty, it is considered a non-monetary exchange for accounting purposes. Thus, we accounted for the transactions at fair value in accordance with GAAP accounting for exchanges of nonmonetary assets. Because fair value and book value were reasonably close, there was no material gain or loss recorded on the sale of EEA. In addition, there were no significant adjustments from book value for any assets or liabilities of CDC recorded upon the acquisition of the remaining 50 percent interest.weighted-average common shares
CUMMINS INC. AND SUBSIDIARIES
NOTES TO CONSOLIDATED FINANCIAL STATEMENTS (Continued)
NOTE 23. VARIABLE INTEREST ENTITIES20. EARNINGS PER SHARE (Continued)
outstanding until those shares are distributed from the EBT to the RSP. Following are the computations for basic and diluted earnings per share:
| | Years ended December 31, | |||||||||
|---|---|---|---|---|---|---|---|---|---|---|
| Dollars in millions, except per share amounts | 2012 | 2011 | 2010 | |||||||
Net income attributable to Cummins Inc. | $ | 1,645 | $ | 1,848 | $ | 1,040 | ||||
Weighted-average common shares outstanding | ||||||||||
Basic | 189,286,821 | 192,972,211 | 196,699,155 | |||||||
Dilutive effect of stock compensation awards | 381,883 | 625,667 | 449,252 | |||||||
Diluted | 189,668,704 | 193,597,878 | 197,148,407 | |||||||
Earnings per common share attributable to Cummins Inc. | ||||||||||
Basic | $ | 8.69 | $ | 9.58 | $ | 5.29 | ||||
Diluted | 8.67 | 9.55 | 5.28 | |||||||
�� The weighted-average diluted common shares outstanding for 2012, 2011 and 2010 excludes the effect of 453,893, 177,460 and 7,795 weighted-average shares, respectively, of common stock options, since such options had an exercise price in excess of the monthly average market value of our common stock during that year.
NOTE 21. DERIVATIVES
We consolidate certain VIEs ifare exposed to financial risk resulting from volatility in foreign exchange rates, commodity prices and interest rates. This risk is closely monitored and managed through the use of financial derivative instruments including foreign currency forward contracts, commodity swap contracts, commodity zero-cost collars and interest rate swaps. As stated in our policies and procedures, financial derivatives are used expressly for hedging purposes, and under no circumstances are they used for speculative purposes. When material, we adjust the value of our derivative contracts for counter-party or our credit risk.
As a result of our international business presence, we are deemedexposed to be the primary beneficiary, definedforeign currency exchange risks. We transact business in FASB standardsforeign currencies and, as a result, our income experiences some volatility related to movements in foreign currency exchange rates. To help manage our exposure to exchange rate volatility, we use foreign exchange forward contracts on a regular basis to hedge forecasted intercompany and third-party sales and purchases denominated in non-functional currencies. Our internal policy allows for consolidation of variable interest entities,managing anticipated foreign currency cash flows for up to one year. These foreign currency forward contracts are designated and qualify as the entity that absorbs a majorityforeign currency cash flow hedges under GAAP. The effective portion of the VIEs' expected losses, receivesunrealized gain or loss on the forward contract is deferred and reported as a majoritycomponent of "Accumulated other comprehensive loss" (AOCL). When the hedged forecasted transaction (sale or purchase) occurs, the unrealized gain or loss is reclassified into income in the same line item associated with the hedged transaction in the same period or periods during which the hedged transaction affects income. The ineffective portion of the VIEs' expected residual returns,hedge, unrealized gain or both. Weloss, if any, is recognized in current income during the period of change. As of December 31, 2012, the amount we expect to reclassify from AOCL to income over the next year is an unrealized net gain of $1 million. For the years ended December 31, 2012 and 2011, there were no circumstances that would have variable interests in certain businesses accounted for under the equity method of accounting that are deemed VIEs and are subject to the provisions of GAAP accounting for variable interest entities.
During 2001, we entered into a sale-leaseback transaction with a financial institution with regard to certain heavy-duty engine manufacturing equipment. The accounting for the original sale-leaseback transaction is discussed in Note 14. The financial institution created a grantor trust to act as the lessorresulted in the arrangement.discontinuance of a foreign currency cash flow hedge.
CUMMINS INC. AND SUBSIDIARIES
NOTES TO CONSOLIDATED FINANCIAL STATEMENTS (Continued)
NOTE 21. DERIVATIVES (Continued)
To minimize the income volatility resulting from the remeasurement of net monetary assets and payables denominated in a currency other than the functional currency, we enter into foreign currency forward contracts, which are considered economic hedges. The financial institution owns 100objective is to offset the gain or loss from remeasurement with the gain or loss from the fair market valuation of the forward contract. These derivative instruments are not designated as hedges under GAAP.
The table below summarizes our outstanding foreign currency forward contracts. Only the U.S. dollar forward contracts are designated and qualify for hedge accounting as of each period presented below. The currencies in this table represent 95 percent and 98 percent of the equity in the trust. The grantor trust has no assets other than the equipment and its rights to the lease agreement with us. On the initial sale, we received $125 million from the financial institution which was financed with $99 millionnotional amounts of non-recourse debt and $26 million of equity. Our obligations to the grantor trust consist of the payments due under the lease and a $9 million guarantee of the residual value of the equipment. In addition, we had a fixed price purchase option that was exercisable on January 14, 2009, for approximately $35 million; however, we decided not to exercise this option as discussed in Note 14.
We had previously determined that the grantor trust is a VIE under GAAP and due primarily to the existence of the residual value guarantee, we determined that we were the primary beneficiary of the VIE. As a result, we began consolidating the grantor trustcontracts outstanding as of December 31, 2003, even though2012 and 2011.
| | Notional amount in millions | ||||||
|---|---|---|---|---|---|---|---|
Currency denomination | December 31, 2012 | December 31, 2011 | |||||
United States Dollar (USD) | 110 | 181 | |||||
British Pound Sterling (GBP) | 227 | 347 | |||||
Euro (EUR) | 28 | 47 | |||||
Singapore Dollar (SGD) | 3 | 20 | |||||
Indian Rupee (INR) | 1,943 | 1,701 | |||||
Japanese Yen (JPY) | 384 | 3,348 | |||||
Canadian Dollar (CAD) | 59 | 39 | |||||
South Korea Won (KRW) | 35,266 | 36,833 | |||||
Chinese Renmimbi (CNY) | 45 | 61 | |||||
We are exposed to fluctuations in commodity prices due to contractual agreements with component suppliers. In order to protect ourselves against future price volatility and, consequently, fluctuations in gross margins, we doperiodically enter into commodity swap contracts with designated banks to fix the cost of certain raw material purchases with the objective of minimizing changes in inventory cost due to market price fluctuations. Certain commodity swap contracts are derivative contracts that are designated as cash flow hedges under GAAP. We also have commodity swap contracts that represent an economic hedge but are not own anydesignated for hedge accounting and are marked to market through earnings. For those contracts that qualify for hedge accounting, the effective portion of its equity. In April 2008, we made the final payment on the non-recourse debt. As further discussed in Note 14, we amended our lease agreement in January 2009 to remove the residual value guaranteeunrealized gain or loss is deferred and reported as a result, determined that we were no longercomponent of AOCL. When the primary beneficiaryhedged forecasted transaction (purchase) occurs, the unrealized gain or loss is reclassified into income in the same line item associated with the hedged transaction in the same period or periods during which the hedged transaction affects income. The ineffective portion of the trust.
Cummins Komatsu Engine Corporation (CKEC)hedge, if any, is an engine manufacturing entity jointly owned and operated by us and our equity partner. We were deemedrecognized in current income in the primary beneficiary of this VIE due toperiod in which the pricing arrangements of purchases and the substantial volume of purchases we made from the VIE.ineffectiveness occurs. As of December 31, 2009, CKEC has no unsecured debt. Creditors2012, we expect to reclassify an unrealized net loss of this entity have no recourseless than $1 million from AOCL to our general credit. Conversely, our creditors have no recourseincome over the next year. Our internal policy allows for managing these cash flow hedges for up to the assets of CKEC.
Results of CKEC for the year ended December 31, 2009, are included in ourConsolidated Statements of Income and a significant amount of their sales is eliminated in consolidation. The table below shows the amount of assets and liabilities from CKEC included in our consolidated results, after eliminating intercompany items, as of December 31, 2009:
| In millions | | |||
|---|---|---|---|---|
Current assets (Primarily receivables and inventory) | $ | 9 | ||
Long-term assets | 10 | |||
Current liabilities | 3 | |||
We also have variable interests in two North American distributors that were deemed to be VIEs in accordance with GAAP, but we were not deemed to be the primary beneficiary since we do not absorb a majority of the entity's expected losses. Our ownership percentage in these entities ranges from 30 percent to 36 percent. For both of these entities, our equity ownership represents our only variable interest in the entity and thus we would not be deemed the primary beneficiary.three years.
CUMMINS INC. AND SUBSIDIARIES
NOTES TO CONSOLIDATED FINANCIAL STATEMENTS (Continued)
NOTE 23. VARIABLE INTEREST ENTITIES21. DERIVATIVES (Continued)
The principal businessfollowing table summarizes our outstanding commodity swap contracts that were entered into to hedge the cost of certain raw material purchases:
| | December 31, 2012 | December 31, 2011 | ||||||||
|---|---|---|---|---|---|---|---|---|---|---|
Dollars in millions Commodity | Notional Amount | Quantity | Notional Amount | Quantity | ||||||
Copper | $ | 24 | 3,025 metric tons(1) | $ | 78 | 9,220 metric tons(1) | ||||
Platinum | 71 | 45,126 troy ounces(2) | 84 | 50,750 troy ounces(2) | ||||||
Palladium | 10 | 14,855 troy ounces(2) | 5 | 7,141 troy ounces(2) | ||||||
In the third quarter of 2012 we began to use a combination of call and put option contracts for copper in net-zero-cost collar arrangements (zero-cost collars) that establish ceiling and floor prices for copper. These contracts are used strictly for hedging and not for speculative purposes. For these zero-cost collars, if the average price of the distributorscopper during the calculation period is within the call and put price, the call and put contracts expire at no cost to us. If the price falls below the floor, the counter-party to the collar receives the difference from us, and if the price rises above the ceiling, the counter-party pays the difference to us. We believe that these zero-cost collars will act as economic hedges; however we have chosen not to designate them as hedges for accounting purposes, therefore we present the calls and puts on a gross basis on ourConsolidated Balance Sheets.
The following table summarizes our outstanding commodity zero-cost collar contracts that were entered into to hedge the cost of copper purchases:
| | December 31, 2012 | ||||||
|---|---|---|---|---|---|---|---|
Commodity | Average Floor or Cap | Quantity in metric tons(1) | |||||
Copper call options | $ | 8,196 | 4,100 | ||||
Copper put options | 7,005 | 4,100 | |||||
We are exposed to market risk from fluctuations in interest rates. We manage our exposure to interest rate fluctuations through the use of interest rate swaps. The objective of the swaps is to sell Cummins enginesmore effectively balance our borrowing costs and related service partsinterest rate risk.
In November 2005, we entered into an interest rate swap to effectively convert our $250 million debt issue, due in 2028, from a fixed rate of 7.125 percent to a floating rate based on a LIBOR spread. The terms of the swap mirror those of the debt, with interest paid semi-annually. This swap qualifies as a fair value hedge under GAAP. The gain or loss on this derivative instrument as well as provide repairthe offsetting gain or loss on the hedged item attributable to the hedged risk are recognized in current income as
CUMMINS INC. AND SUBSIDIARIES
NOTES TO CONSOLIDATED FINANCIAL STATEMENTS (Continued)
NOTE 21. DERIVATIVES (Continued)
"Interest expense." The following table summarizes these gains and maintenance services on engines, including warranty repairs. Our maximum potential loss related to these distributors as of December 31, 2009, consisted of our ownership interest totaling $21 million. In addition, under certain circumstances, we could be required to repurchase certain assets of these distributors at amounts approximating fair value as more fully discussed in Note 14. Our involvement with these distributors as equity holders began in 2005 and 2003. Selected financial information for these distributors as of andlosses for the year ended December 31, 2009, is as follows:years presented below:
| In millions | | |||
|---|---|---|---|---|
Total assets | $ | 154 | ||
Total liabilities (including total debt of $34) | 79 | |||
Revenues | 378 | |||
Net income | 43 | |||
| | For the years ended December 31, | ||||||||||||
|---|---|---|---|---|---|---|---|---|---|---|---|---|---|
| | 2012 | 2011 | |||||||||||
In millions Income Statement Classification | Gain/(Loss) on Swaps | Gain/(Loss) on Borrowings | Gain/(Loss) on Swaps | Gain/(Loss) on Borrowings | |||||||||
Interest expense | $ | 6 | $ | (6 | ) | $ | 41 | $ | (41 | ) | |||
In January 2010, we purchased an additional 50 percent ownership interest in Cummins Western Canada, bringing our total ownership interest to 80 percent. Western Canada will cease to be a variable interest entity in 2010.
CDC was an engine manufacturing entity jointly owned 50/50 by us and our equity partners. In 2006, 2007 and the first six months of 2008, we consolidated this entity under GAAP due to the pricing arrangements on purchases from CDC and the substantial volume of purchases we made. In July 2008, we purchased the remaining 50 percent of CDC as discussed in Note 22 and we now own 100 percent of the voting interest. As a result, variable interest entity accounting under GAAP no longer applies to this entity.
Cash Flow Hedging
NOTE 24. OTHER (EXPENSE) INCOME
Other (expense) income included The following table summarizes the following:effect on ourConsolidated Statements of Income for derivative instruments classified as cash flow hedges for the years ended December 31, 2012 and 2011 presented below. The table does not include amounts related to ineffectiveness as it was not material for the periods presented.
| | Years ended December 31, | |||||||||
|---|---|---|---|---|---|---|---|---|---|---|
| In millions | 2009 | 2008 | 2007 | |||||||
Foreign currency (losses) gains | $ | (20 | ) | $ | (46 | ) | $ | 28 | ||
Bank charges | (14 | ) | (12 | ) | (12 | ) | ||||
Change in cash surrender value of corporate owned life insurance(1) | (4 | ) | (36 | ) | — | |||||
Dividend income | 5 | 6 | 5 | |||||||
Other, net | 18 | 18 | 12 | |||||||
Total other (expense) income, net | $ | (15 | ) | $ | (70 | ) | $ | 33 | ||
| | | For the years ended December 31, | |||||||||||||
|---|---|---|---|---|---|---|---|---|---|---|---|---|---|---|---|
| | | Amount of Gain/(Loss) Recognized in AOCL on Derivative (Effective Portion) | | | |||||||||||
| | | Amount of Gain/(Loss) Reclassified from AOCL into Income (Effective Portion) | |||||||||||||
| | Location of Gain/(Loss) Reclassified into Income (Effective Portion) | ||||||||||||||
In millions Derivatives in Cash Flow Hedging Relationships | 2012 | 2011 | 2012 | 2011 | |||||||||||
Foreign currency forward contracts | Net sales | $ | 8 | $ | (4 | ) | $ | (2 | ) | $ | 3 | ||||
Commodity swap contracts | Cost of sales | 8 | (22 | ) | (9 | ) | 19 | ||||||||
Total | $ | 16 | $ | (26 | ) | $ | (11 | ) | $ | 22 | |||||
Derivatives Not Designated as Hedging Instruments
The following table summarizes the effect on ourConsolidated Statements of Income for derivative instruments that are not classified as hedges for the years ended December 31, 2012 and 2011.
| | | For the years ended December 31, | |||||||
|---|---|---|---|---|---|---|---|---|---|
| | | Amount of Gain/(Loss) Recognized in Income on Derivatives | |||||||
In millions Derivatives Not Designated as Hedging Instruments | Location of Gain/(Loss) Recognized in Income on Derivatives | ||||||||
| 2012 | 2011 | ||||||||
Foreign currency forward contracts | Cost of sales | $ | (4 | ) | $ | (2 | ) | ||
Foreign currency forward contracts | Other income (expense), net | 11 | (14 | ) | |||||
Commodity zero-cost collars | Cost of sales | 1 | — | ||||||
Commodity swap contracts | Cost of sales | — | (6 | ) | |||||
CUMMINS INC. AND SUBSIDIARIES
NOTES TO CONSOLIDATED FINANCIAL STATEMENTS (Continued)
NOTE 21. DERIVATIVES (Continued)
Fair Value Amount and Location of Derivative Instruments
The following tables summarize the location and fair value of derivative instruments on ourConsolidated Balance Sheets:
| | Derivative Assets | |||||||
|---|---|---|---|---|---|---|---|---|
| | Fair Value | | ||||||
| In millions | December 31, 2012 | December 31, 2011 | Balance Sheet Location | |||||
Derivatives designated as hedging instruments | ||||||||
Interest rate contract | $ | 88 | $ | 82 | Other assets | |||
Foreign currency forward contracts | 2 | — | Prepaid expenses and other current assets | |||||
Commodity swap contracts | 1 | — | Prepaid expenses and other current assets | |||||
Total derivatives designated as hedging instruments | 91 | 82 | ||||||
Derivatives not designated as hedging instruments | ||||||||
Foreign currency forward contracts | 1 | — | Prepaid expenses and other current assets | |||||
Commodity call option contracts | 1 | — | Other assets | |||||
Total derivatives not designated as hedging instruments | 2 | — | ||||||
Total derivative assets | $ | 93 | $ | 82 | ||||
CUMMINS INC. AND SUBSIDIARIES
NOTES TO CONSOLIDATED FINANCIAL STATEMENTS (Continued)
NOTE 22. OPERATING SEGMENTS (Continued)
| | Derivative Liabilities | |||||||
|---|---|---|---|---|---|---|---|---|
| | Fair Value | | ||||||
| In millions | December 31, 2012 | December 31, 2011 | Balance Sheet Location | |||||
Derivatives designated as hedging instruments | ||||||||
Commodity swap contracts | $ | 2 | $ | 16 | Other accrued expenses | |||
Foreign currency forward contracts | — | 7 | Other accrued expenses | |||||
Total derivatives designated as hedging instruments | 2 | 23 | ||||||
Derivatives not designated as hedging instruments | ||||||||
Commodity put option contracts | 1 | — | Other accrued expenses | |||||
Commodity swap contracts | — | 6 | Other accrued expenses | |||||
Foreign currency forward contracts | — | 1 | Other accrued expenses | |||||
Total derivatives not designated as hedging instruments | 1 | 7 | ||||||
Total derivative liabilities | $ | 3 | $ | 30 | ||||
NOTE 25.22. OPERATING SEGMENTS
Operating segments under GAAP are defined as components of an enterprise about which separate financial information is available that is evaluated regularly by the chief operating decision-maker, or decision-making group, in deciding how to allocate resources and in assessing performance. Cummins chief operating decision-maker (CODM) is the Chief Executive Officer.
Our reportable operating segments consist of the following: Engine, Components, Power Generation Components and Distribution. This reporting structure is organized according to the products and markets each segment serves and allows management to focus its efforts on providing enhanced service to a wide range of customers. The Engine segment produces engines and parts for sale to customers in on-highway and various industrial markets. TheOur engines are used in trucks of all sizes, buses and recreational vehicles, as well as in various industrial applications, including construction, mining, agriculture, marine, oil and gas, rail and military.military equipment. The Components segment sells filtration products, aftertreatment, turbochargers and fuel systems. The Power Generation segment is an integrated provider of power systems which sells engines, generator sets and alternators and rents power equipment for both standby and prime power uses. The Components segment includes sales of filtration products, exhaust and aftertreatment systems, turbochargers and fuel systems.alternators. The Distribution segment includes wholly-owned and partially-owned distributorships engaged in wholesaling engines, generator sets and service parts, as well as performing service and repair activities on our products and maintaining relationships with various original equipment manufacturers.OEMs throughout the world.
We use segment EBIT (defined as earnings before interest expense, taxes and noncontrolling interests) as a primary basis for the CODM to evaluate the performance of each of our operating segments. Segment amounts exclude certain expenses not specifically identifiable to segments.
The accounting policies of our operating segments are the same as those applied in theourConsolidated Financial Statements. We prepared the financial results of our operating segments on a basis that is consistent with the manner in which we internally disaggregate financial information to assist in making internal operating decisions. We have allocated certain common costs and expenses,
CUMMINS INC. AND SUBSIDIARIES
NOTES TO CONSOLIDATED FINANCIAL STATEMENTS (Continued)
NOTE 22. OPERATING SEGMENTS (Continued)
primarily corporate functions, among segments differently than we would for stand-alone financial information prepared in accordance with GAAP.accounting principles generally accepted in the United States of America (GAAP). These include certain costs and expenses of shared services, such as information technology, human resources, legal and finance. We also do not allocate debt-related items, actuarial gains andor losses, prior service costs or credits, restructuring and other charges, investmentchanges in cash surrender value of corporate owned life insurance, flood damage gains or losses, flood damagedivestiture gains or losses or income taxes to individual segments. In 2012, non-segment items included a $20 million reserve ($12 million after-tax) related to legal matters and a $6 million gain related to adjustments from our 2011 divestitures, while 2011 included the gain on disposition of certain assets and liabilities of our exhaust business and our light-duty filtration business and 2010 included a Brazil revenue tax recovery. These gains were not allocated to the businesses as they were not considered in our evaluation of operating results for the year. Segment EBIT may not be consistent with measures used by other companies.
CUMMINS INC. AND SUBSIDIARIES
NOTES TO CONSOLIDATED FINANCIAL STATEMENTS (Continued)
NOTE 25. OPERATING SEGMENTS (Continued)
Summarized financial information regarding our reportable operating segments at December 31, is shown in the table below:
| In millions | In millions | Engine | Power Generation | Components | Distribution | Non-segment items(1) | Total | Engine | Components | Power Generation | Distribution | Non-segment Items(1) | Total | ||||||||||||||||||||||||||
|---|---|---|---|---|---|---|---|---|---|---|---|---|---|---|---|---|---|---|---|---|---|---|---|---|---|---|---|---|---|---|---|---|---|---|---|---|---|---|---|
2009 | |||||||||||||||||||||||||||||||||||||||
2012 | |||||||||||||||||||||||||||||||||||||||
External sales | External sales | $ | 5,582 | $ | 1,879 | $ | 1,562 | $ | 1,777 | $ | — | $ | 10,800 | $ | 9,101 | $ | 2,809 | $ | 2,163 | $ | 3,261 | $ | — | $ | 17,334 | ||||||||||||||
Intersegment sales | Intersegment sales | 823 | 538 | 793 | 7 | (2,161 | ) | — | 1,632 | 1,203 | 1,105 | 16 | (3,956 | ) | — | ||||||||||||||||||||||||
Total sales | 6,405 | 2,417 | 2,355 | 1,784 | (2,161 | ) | 10,800 | ||||||||||||||||||||||||||||||||
Total sales | 10,733 | 4,012 | 3,268 | 3,277 | (3,956 | ) | 17,334 | ||||||||||||||||||||||||||||||||
Depreciation and amortization(2) | Depreciation and amortization(2) | 185 | 49 | 73 | 17 | — | 324 | 192 | 82 | 47 | 34 | — | 355 | ||||||||||||||||||||||||||
Research, development and engineering expenses | Research, development and engineering expenses | 241 | 33 | 88 | — | — | 362 | 433 | 213 | 76 | 6 | — | 728 | ||||||||||||||||||||||||||
Equity, royalty and interest income from investees | Equity, royalty and interest income from investees | 54 | 22 | 13 | 125 | — | 214 | 127 | 29 | 40 | 188 | — | 384 | ||||||||||||||||||||||||||
Restructuring and other charges | — | — | — | — | 99 | 99 | |||||||||||||||||||||||||||||||||
Interest income | Interest income | 3 | 3 | 1 | 1 | — | 8 | 11 | 3 | 9 | 2 | — | 25 | ||||||||||||||||||||||||||
Segment EBIT | 252 | 167 | 95 | 235 | (74 | ) | 675 | ||||||||||||||||||||||||||||||||
Segment EBIT(3) | 1,248 | 426 | 285 | 369 | (25 | ) | 2,303 | ||||||||||||||||||||||||||||||||
Net assets | Net assets | 2,136 | 1,114 | 1,286 | 686 | — | 5,222 | 3,373 | 1,830 | 1,582 | 1,392 | — | 8,177 | ||||||||||||||||||||||||||
Investment in and advances to equity investees | 261 | 50 | 91 | 172 | — | 574 | |||||||||||||||||||||||||||||||||
Investments and advances to equity investees | 401 | 127 | 88 | 281 | — | 897 | |||||||||||||||||||||||||||||||||
Capital expenditures | Capital expenditures | 207 | 34 | 59 | 10 | — | 310 | 399 | 134 | 95 | 62 | — | 690 | ||||||||||||||||||||||||||
2008 | |||||||||||||||||||||||||||||||||||||||
2011 | |||||||||||||||||||||||||||||||||||||||
External sales | External sales | $ | 7,432 | $ | 2,601 | $ | 2,154 | $ | 2,155 | $ | — | $ | 14,342 | $ | 9,649 | $ | 2,886 | $ | 2,492 | $ | 3,021 | $ | — | $ | 18,048 | ||||||||||||||
Intersegment sales | Intersegment sales | 1,378 | 899 | 998 | 9 | (3,284 | ) | — | 1,658 | 1,177 | 1,006 | 23 | (3,864 | ) | — | ||||||||||||||||||||||||
Total sales | 8,810 | 3,500 | 3,152 | 2,164 | (3,284 | ) | 14,342 | ||||||||||||||||||||||||||||||||
Depreciation and amortization(2) | 180 | 41 | 65 | 25 | — | 311 | |||||||||||||||||||||||||||||||||
Research, development and engineering expenses | 286 | 41 | 95 | — | — | 422 | |||||||||||||||||||||||||||||||||
Equity, royalty and interest income from investees | 99 | 23 | 14 | 117 | — | 253 | |||||||||||||||||||||||||||||||||
Restructuring and other charges | — | — | — | — | 37 | 37 | |||||||||||||||||||||||||||||||||
Interest income | 10 | 3 | 3 | 2 | — | 18 | |||||||||||||||||||||||||||||||||
Segment EBIT | 535 | 376 | 169 | 242 | (102 | ) | 1,220 | ||||||||||||||||||||||||||||||||
Net assets | 1,623 | 1,024 | 1,295 | 678 | — | 4,620 | |||||||||||||||||||||||||||||||||
Investment in and advances to equity investees | 287 | 52 | 91 | 158 | — | 588 | |||||||||||||||||||||||||||||||||
Capital expenditures | 331 | 57 | 139 | 16 | — | 543 | |||||||||||||||||||||||||||||||||
2007 | |||||||||||||||||||||||||||||||||||||||
External sales | $ | 7,129 | $ | 2,375 | $ | 2,007 | $ | 1,537 | $ | — | $ | 13,048 | |||||||||||||||||||||||||||
Intersegment sales | 1,053 | 685 | 925 | 3 | (2,666 | ) | — | ||||||||||||||||||||||||||||||||
Total sales | 8,182 | 3,060 | 2,932 | 1,540 | (2,666 | ) | 13,048 | ||||||||||||||||||||||||||||||||
Total sales | 11,307 | 4,063 | 3,498 | 3,044 | (3,864 | ) | 18,048 | ||||||||||||||||||||||||||||||||
Depreciation and amortization(2) | Depreciation and amortization(2) | 176 | 42 | 59 | 11 | — | 288 | 181 | 73 | 42 | 25 | — | 321 | ||||||||||||||||||||||||||
Research, development and engineering expenses | Research, development and engineering expenses | 222 | 34 | 73 | — | — | 329 | 397 | 175 | 54 | 3 | — | 629 | ||||||||||||||||||||||||||
Equity, royalty and interest income from investees | Equity, royalty and interest income from investees | 92 | 17 | 4 | 92 | — | 205 | 166 | 31 | 47 | 172 | — | 416 | ||||||||||||||||||||||||||
Interest income | Interest income | 26 | 6 | 3 | 1 | — | 36 | 18 | 5 | 8 | 3 | — | 34 | ||||||||||||||||||||||||||
Segment EBIT | Segment EBIT | 589 | 334 | 153 | 187 | (36 | ) | 1,227 | 1,384 | 470 | 373 | 386 | 102 | 2,715 | |||||||||||||||||||||||||
Net assets | Net assets | 1,727 | 931 | 1,270 | 506 | — | 4,434 | 3,167 | 1,467 | 1,547 | 1,123 | — | 7,304 | ||||||||||||||||||||||||||
Investment in and advances to equity investees | 327 | 24 | 51 | 112 | — | 514 | |||||||||||||||||||||||||||||||||
Investments and advances to equity investees | 398 | 123 | 79 | 238 | — | 838 | |||||||||||||||||||||||||||||||||
Capital expenditures | Capital expenditures | 189 | 51 | 99 | 14 | — | 353 | 339 | 141 | 87 | 55 | — | 622 | ||||||||||||||||||||||||||
CUMMINS INC. AND SUBSIDIARIES
NOTES TO CONSOLIDATED FINANCIAL STATEMENTS (Continued)
NOTE 22. OPERATING SEGMENTS (Continued)
| In millions | Engine | Components | Power Generation | Distribution | Non-segment Items(1) | Total | |||||||||||||
|---|---|---|---|---|---|---|---|---|---|---|---|---|---|---|---|---|---|---|---|
2010 | |||||||||||||||||||
External sales | $ | 6,594 | $ | 2,171 | $ | 2,150 | $ | 2,311 | $ | — | $ | 13,226 | |||||||
Intersegment sales | 1,294 | 875 | 769 | 13 | (2,951 | ) | — | ||||||||||||
Total sales | 7,888 | 3,046 | 2,919 | 2,324 | (2,951 | ) | 13,226 | ||||||||||||
Depreciation and amortization(2) | 171 | 79 | 41 | 25 | — | 316 | |||||||||||||
Research, development and engineering expenses | 263 | 114 | 36 | 1 | — | 414 | |||||||||||||
Equity, royalty and interest income from investees | 161 | 23 | 35 | 132 | — | 351 | |||||||||||||
Interest income | 12 | 2 | 5 | 2 | — | 21 | |||||||||||||
Segment EBIT | 809 | 278 | 299 | 297 | (26 | ) | 1,657 | ||||||||||||
Net assets | 2,662 | 1,450 | 1,286 | 929 | — | 6,327 | |||||||||||||
Investments and advances to equity investees | 355 | 106 | 73 | 200 | — | 734 | |||||||||||||
Capital expenditures | 197 | 78 | 53 | 36 | — | 364 | |||||||||||||
CUMMINS INC. AND SUBSIDIARIES
NOTES TO CONSOLIDATED FINANCIAL STATEMENTS (Continued)
NOTE 25.22. OPERATING SEGMENTS (Continued)
A reconciliation of our segment information to the corresponding amounts in ourtheConsolidated Financial Statements of Income is shown in the table below:
| | | Years ended December 31, | Years ended December 31, | ||||||||||||||||||
|---|---|---|---|---|---|---|---|---|---|---|---|---|---|---|---|---|---|---|---|---|---|
| In millions | In millions | 2009 | 2008 | 2007 | 2012 | 2011 | 2010 | ||||||||||||||
Segment EBIT | Segment EBIT | $ | 675 | $ | 1,220 | $ | 1,227 | $ | 2,303 | $ | 2,715 | $ | 1,657 | ||||||||
Less: | |||||||||||||||||||||
Interest expense | 35 | 42 | 58 | ||||||||||||||||||
Less: Interest expense | 32 | 44 | 40 | ||||||||||||||||||
Income before income taxes | Income before income taxes | $ | 640 | $ | 1,178 | $ | 1,169 | $ | 2,271 | $ | 2,671 | $ | 1,617 | ||||||||
| | December 31, | December 31, | ||||||||||||||||||
|---|---|---|---|---|---|---|---|---|---|---|---|---|---|---|---|---|---|---|---|---|
| In millions | 2009 | 2008 | 2007 | 2012 | 2011 | 2010 | ||||||||||||||
Net assets for operating segments | $ | 5,222 | $ | 4,620 | $ | 4,434 | $ | 8,177 | $ | 7,304 | $ | 6,327 | ||||||||
Liabilities deducted in arriving at net assets | 4,018 | 4,186 | 3,759 | 4,913 | 4,832 | 4,412 | ||||||||||||||
Pension and other postretirement benefit adjustments excluded from net assets | (1,180 | ) | (1,150 | ) | (570 | ) | (977 | ) | (928 | ) | (879 | ) | ||||||||
Deferred tax assets not allocated to segments | 731 | 838 | 546 | 410 | 435 | 517 | ||||||||||||||
Debt-related costs not allocated to segments | 25 | 25 | 26 | 25 | 25 | 25 | ||||||||||||||
Total assets | $ | 8,816 | $ | 8,519 | $ | 8,195 | $ | 12,548 | $ | 11,668 | $ | 10,402 | ||||||||
CUMMINS INC. AND SUBSIDIARIES
NOTES TO CONSOLIDATED FINANCIAL STATEMENTS (Continued)
NOTE 25. OPERATING SEGMENTS (Continued)
The table below presents certain segment information by geographic area. Net sales attributed to geographic areas are based on the location of the customer.
| | Years ended and as of December 31, | Years ended and as of December 31, | ||||||||||||||||||
|---|---|---|---|---|---|---|---|---|---|---|---|---|---|---|---|---|---|---|---|---|
| In millions | 2009 | 2008 | 2007 | |||||||||||||||||
Net sales | ||||||||||||||||||||
In millions Net Sales | 2012 | 2011 | 2010 | |||||||||||||||||
United States | $ | 5,141 | $ | 5,817 | $ | 6,007 | $ | 8,107 | $ | 7,354 | $ | 4,817 | ||||||||
China | 630 | 783 | 603 | 1,056 | 1,452 | 1,206 | ||||||||||||||
Brazil | 596 | 866 | 649 | 798 | 1,286 | 1,014 | ||||||||||||||
India | 592 | 702 | 619 | 757 | 859 | 808 | ||||||||||||||
Mexico | 692 | 631 | 415 | |||||||||||||||||
United Kingdom | 406 | 692 | 621 | 660 | 727 | 562 | ||||||||||||||
Canada | 327 | 619 | 405 | 642 | 653 | 506 | ||||||||||||||
Mexico | 240 | 377 | 342 | |||||||||||||||||
Other foreign countries | 2,868 | 4,486 | 3,802 | 4,622 | 5,086 | 3,898 | ||||||||||||||
Total net sales | $ | 10,800 | $ | 14,342 | $ | 13,048 | $ | 17,334 | $ | 18,048 | $ | 13,226 | ||||||||
Long-lived assets | ||||||||||||||||||||
United States | $ | 1,811 | $ | 1,764 | $ | 1,677 | ||||||||||||||
China | 322 | 342 | 170 | |||||||||||||||||
United Kingdom | 188 | 177 | 289 | |||||||||||||||||
India | 134 | 114 | 105 | |||||||||||||||||
Brazil | 125 | 124 | 122 | |||||||||||||||||
Mexico | 54 | 55 | 44 | |||||||||||||||||
Canada | 27 | 26 | 31 | |||||||||||||||||
Other foreign countries | 125 | 128 | 132 | |||||||||||||||||
Total long-lived assets | $ | 2,786 | $ | 2,730 | $ | 2,570 | ||||||||||||||
CUMMINS INC. AND SUBSIDIARIES
NOTES TO CONSOLIDATED FINANCIAL STATEMENTS (Continued)
NOTE 22. OPERATING SEGMENTS (Continued)
| | Years ended and as of December 31, | |||||||||
|---|---|---|---|---|---|---|---|---|---|---|
In millions Long-lived assets | 2012 | 2011 | 2010 | |||||||
United States | $ | 2,440 | $ | 2,218 | $ | 1,981 | ||||
China | 589 | 520 | 446 | |||||||
United Kingdom | 339 | 318 | 266 | |||||||
India | 243 | 203 | 173 | |||||||
Brazil | 170 | 151 | 146 | |||||||
Netherlands | 130 | 111 | — | |||||||
Mexico | 77 | 72 | 62 | |||||||
Canada | 69 | 64 | 64 | |||||||
Germany | 49 | 47 | 44 | |||||||
Korea | 37 | 27 | 19 | |||||||
Turkey | 29 | 19 | 1 | |||||||
Australia | 25 | 34 | 48 | |||||||
United Arab Emirates | 16 | 14 | 9 | |||||||
Singapore | 16 | 9 | 7 | |||||||
Romania | 15 | 10 | 10 | |||||||
France | 13 | 13 | 14 | |||||||
Other foreign countries | 33 | 32 | 32 | |||||||
Total long-lived assets | $ | 4,290 | $ | 3,862 | $ | 3,322 | ||||
Our largest customer is PACCAR Inc. Worldwide sales to this customer were $2,232 million in 2012, $2,144 million in 2011 and $986 million in 2010, representing 13 percent, 12 percent and 7 percent, respectively, of our consolidated net sales. No other customer accounted for more than 10 percent of consolidated net sales.
SELECTED QUARTERLY FINANCIAL DATA
UNAUDITED
| | | First Quarter | Second Quarter | Third Quarter | Fourth Quarter | |||||||||||||||||||||||
|---|---|---|---|---|---|---|---|---|---|---|---|---|---|---|---|---|---|---|---|---|---|---|---|---|---|---|---|---|
| In millions, except per share amounts | In millions, except per share amounts | 2009 | First Quarter | Second Quarter | Third Quarter | Fourth Quarter | ||||||||||||||||||||||
| | 2012 | |||||||||||||||||||||||||||
Net sales | Net sales | $ | 2,439 | $ | 2,431 | $ | 2,530 | $ | 3,400 | $ | 4,472 | $ | 4,452 | $ | 4,118 | $ | 4,292 | |||||||||||
Gross margin | Gross margin | 445 | 448 | 503 | 773 | 1,198 | 1,210 | 1,042 | 1,058 | |||||||||||||||||||
Net income attributable to Cummins Inc. | Net income attributable to Cummins Inc. | 7 | 56 | 95 | 270 | Net income attributable to Cummins Inc. | 455 | 469 | 352 | 369 | ||||||||||||||||||
Net earnings per share attributable to Cummins Inc.—basic | Net earnings per share attributable to Cummins Inc.—basic | $ | 0.04 | $ | 0.28 | $ | 0.48 | $ | 1.36 | Net earnings per share attributable to Cummins Inc.—basic | $ | 2.39 | $ | 2.47 | $ | 1.87 | $ | 1.96 | ||||||||||
Net earnings per share attributable to Cummins Inc.—diluted | Net earnings per share attributable to Cummins Inc.—diluted | 0.04 | 0.28 | 0.48 | 1.36 | 2.38 | 2.47 | 1.86 | 1.95 | |||||||||||||||||||
Cash dividends per share | Cash dividends per share | 0.175 | 0.175 | 0.175 | 0.175 | 0.40 | 0.40 | 0.50 | 0.50 | |||||||||||||||||||
Stock price per share | Stock price per share | |||||||||||||||||||||||||||
High | $ | 31.77 | $ | 37.40 | $ | 48.71 | $ | 51.65 | ||||||||||||||||||||
Low | 18.34 | 23.99 | 31.32 | 41.51 | ||||||||||||||||||||||||
High | $ | 129.51 | $ | 123.34 | $ | 105.63 | $ | 109.78 | ||||||||||||||||||||
Low | 90.37 | 88.31 | 82.20 | 85.88 | ||||||||||||||||||||||||
| | 2011 | ||||||||||||
|---|---|---|---|---|---|---|---|---|---|---|---|---|---|
Net sales | $ | 3,860 | $ | 4,641 | $ | 4,626 | $ | 4,921 | |||||
Gross margin | 957 | 1,203 | 1,188 | 1,241 | |||||||||
Net income attributable to Cummins Inc.(1) | 343 | 505 | 452 | 548 | |||||||||
Net earnings per share attributable to Cummins Inc.—basic(2) | $ | 1.75 | $ | 2.61 | $ | 2.35 | $ | 2.87 | |||||
Net earnings per share attributable to Cummins Inc.—diluted | 1.75 | 2.60 | 2.35 | 2.86 | |||||||||
Cash dividends per share | 0.2625 | 0.2625 | 0.40 | 0.40 | |||||||||
Stock price per share | |||||||||||||
High | $ | 114.81 | $ | 121.49 | $ | 114.00 | $ | 103.95 | |||||
Low | 93.50 | 91.13 | 79.62 | 79.53 | |||||||||
| | 2008 | |||||||||||||
|---|---|---|---|---|---|---|---|---|---|---|---|---|---|---|
Net sales | $ | 3,474 | $ | 3,887 | $ | 3,693 | $ | 3,288 | ||||||
Gross margin | 707 | 879 | 820 | 534 | ||||||||||
Net income attributable to Cummins Inc.(1)(2) | 190 | 293 | 229 | 43 | ||||||||||
Net earnings per share attributable to Cummins Inc.—basic(3) | $ | 0.97 | $ | 1.50 | $ | 1.18 | $ | 0.22 | ||||||
Net earnings per share attributable to Cummins Inc.—diluted | 0.97 | 1.49 | 1.17 | 0.22 | ||||||||||
Cash dividends per share | 0.125 | 0.125 | 0.175 | 0.175 | ||||||||||
Stock price per share | ||||||||||||||
High | $ | 64.17 | $ | 75.09 | $ | 75.98 | $ | 45.63 | ||||||
Low | 38.11 | 46.10 | 44.05 | 17.70 | ||||||||||
At December 31, 2009,2012, there were approximately 3,8503,977 holders of record of Cummins Inc.'s $2.50 par value common stock.
ItemITEM 9. Changes in and Disagreements with Accountants on Accounting and Financial Disclosure
ItemITEM 9A. Controls and Procedures
Evaluation of Disclosure Controls and Procedures
As of the end of the period covered by this Annual Report on Form 10-K, our management evaluated, with the participation of our Chief Executive Officer and Chief Financial Officer, the effectiveness of the design and operation of our disclosure controls and procedures as defined in Exchange Act Rules 13a-15(e) and 15d-15(e). Based upon that evaluation, our Chief Executive Officer and our Chief Financial Officer concluded that our Company's disclosure controls and procedures were effective as of the end of the period covered by this Annual Report on Form 10-K.
Changes in Internal Control over Financial Reporting
There has been no change in our internal control over financial reporting during the quarter ended December 31, 2009,2012, that has materially affected, or is reasonably likely to materially affect, our internal control over financial reporting.
Management's Report on Internal Control Over Financial Reporting
The information required by Item 9A relating to Management's Annual Report on Internal Control Over Financial Reporting and Attestation Report of the Registered Public Accounting Firm is incorporated herein by reference to the information set forth under the captions "Management's Report on Internal Control Over Financial Reporting" and "Report of Independent Registered Public Accounting Firm," respectively, under Item 8.
ItemITEM 9B. Other Information
None.
ItemITEM 10. Directors, Executive Officers and Corporate Governance
The information required by Item 10 is incorporated by reference to the relevant information under the captions "Corporate Governance," "Election of Directors" and "Other Information—Section 16(a) Beneficial Ownership Reporting Compliance" in our 20102013 Proxy Statement, which will be filed within 120 days after the end of 2009.2012. Information regarding our executive officers may be found in Part 1 of this annual report under the caption "Executive Officers of the Registrant." Except as otherwise specifically incorporated by reference, our Proxy Statement is not deemed to be filed as part of this annual report.
ItemITEM 11. Executive Compensation
The information required by Item 11 is incorporated by reference to the relevant information under the caption "Executive Compensation" in our 20102013 Proxy Statement, which will be filed within 120 days after the end of 2009.2012.
ItemITEM 12. Security Ownership of Certain Beneficial Owners and Management and Related Stockholder Matters
Information concerning our equity compensation plans as of December 31, 2009,2012, is as follows:
Plan Category | Number of securities to be issued upon exercise of outstanding options, warrants and rights(1) | Weighted-average exercise price of outstanding options, warrants and rights(2) | Number of securities remaining available for future issuance under equity compensation plans (excluding securities reflected in the first column) | |||||||
|---|---|---|---|---|---|---|---|---|---|---|
Equity compensation plans approved by security holders | 2,001,481 | $ | 78.80 | 3,551,212 | ||||||
Equity compensation plans not approved by security holders | — | — | — | |||||||
Total | 2,001,481 | $ | 78.80 | 3,551,212 | ||||||
Plan Category | Number of securities to be issued upon exercise of outstanding options, warrants and rights(1) | Weighted-average exercise price of outstanding options, warrants and rights(2) | Number of securities remaining available for future issuance under equity compensation plans (excluding securities reflected in the first column)(3) | |||||||
|---|---|---|---|---|---|---|---|---|---|---|
Equity compensation plans approved by security holders | 2,180,082 | $ | 22.55 | 5,932,475 | ||||||
Equity compensation plans not approved by security holders | — | $ | — | — | ||||||
Total | 2,180,082 | $ | 22.55 | 5,932,475 | ||||||
The remaining information required by Item 12 is incorporated by reference to the relevant information under the caption "Stock Ownership of Directors, Management and Others" in our 20102013 Proxy Statement, which will be filed within 120 days after the end of 2009.2012.
ItemITEM 13. Certain Relationships, Related Transactions and Director Independence
The information required by Item 13 is incorporated by reference to the relevant information under the captions "Corporate Governance" and "Other Information—Related Party Transactions" in our 20102013 Proxy Statement, which will be filed within 120 days after the end of 2009.2012.
ItemITEM 14. Principal Accountant Fees and Services
The information required by Item 14 is incorporated by reference to the relevant information under the caption "Selection of Independent Public Accountants" in our 20102013 Proxy Statement, which will be filed within 120 days after the end of 2009.2012.
ItemITEM 15. Exhibits and Financial Statement Schedules
#—A management contract or compensatory plan or arrangement.
Pursuant to the requirements of Section 13 or 15(d) of the Securities Exchange Act of 1934, the registrant has duly caused this report to be signed on its behalf by the undersigned, thereunto duly authorized.
| CUMMINS INC. | ||||||
By: | /s/ PATRICK J. WARD Patrick J. Ward Vice President and Chief Financial Officer (Principal Financial Officer) | By: | /s/ MARSHA L. HUNT Marsha L. Hunt Vice President—Corporate Controller (Principal Accounting Officer) | |||
Date: February 20, 2013
Pursuant to the requirements of the Securities Exchange Act of 1934, this report has been signed below by or on behalf of the following persons on behalf of the registrant and in the capacities as of this February 25, 2010.20, 2013.
Signatures | Title | Date | ||||
|---|---|---|---|---|---|---|
| /s/ | Chairman of the Board of Directors and Chief Executive Officer (Principal Executive Officer) | February | ||||
/s/ PATRICK J. WARD Patrick J. Ward | Vice President and Chief Financial Officer (Principal Financial Officer) | February | ||||
/s/ MARSHA L. HUNT Marsha L. Hunt | Vice President—Corporate Controller (Principal Accounting Officer) | February | ||||
* Robert J. Bernhard | Director | February | ||||
* Franklin R. Chang-Diaz | Director | February | ||||
* | Director | February | ||||
* Robert K. Herdman | Director | February | ||||
Signatures | Title | Date | ||||
|---|---|---|---|---|---|---|
| * Alexis M. Herman | Director | February | ||||
* William I. Miller | Director | February | ||||
* Georgia R. Nelson | Director | February | ||||
* Carl Ware | Director | February | ||||
By: | /s/ PATRICK J. WARD Patrick J. Ward Attorney-in-fact | |||||
| Exhibit No. | Description of Exhibit | ||
|---|---|---|---|
| 3(a | ) | Restated Articles of Incorporation, as amended (incorporated by reference to Exhibit 3(a) to Cummins Inc.'s Quarterly Report on Form 10-Q for the quarter ended June 28, 2009). | |
| 3(b | ) | By-laws, as amended and restated effective as of July 14, 2009 (incorporated by reference to Exhibit 3.1 to Cummins Inc.'s Current Report on Form 8-K dated July 17, 2009). | |
| 10(a | )# | 2003 Stock Incentive Plan, as amended (incorporated by reference to Exhibit 10(a) to Cummins Inc.'s Annual Report on Form 10-K for the year ended December 31, 2009). | |
| 10(b | )# | Target Bonus Plan (incorporated by reference to Exhibit 10(b) to Cummins Inc.'s Annual Report on Form 10-K for the year ended December 31, 2009). | |
| 10(c | )# | Deferred Compensation Plan, as amended (filed herewith). | |
| 10(d | )# | Supplemental Life Insurance and Deferred Income Plan, as amended (incorporated by reference to Exhibit 10(d) to Cummins Inc.'s Annual Report on Form 10-K for the year ended December 31, 2011). | |
| 10(e | ) | Credit Agreement, dated as of November 9, 2012, by and among Cummins Inc., Cummins Ltd., Cummins Power Generation Ltd., Cummins Generator Technologies Limited, certain other subsidiaries referred to therein and the Lenders party thereto. (incorporated by reference to Exhibit 10.1 to Cummins Inc.'s Current Report on Form 8-K dated November 9, 2012). | |
| 10(f | )# | Deferred Compensation Plan for Non-Employee Directors, as amended (filed herewith). | |
| 10(g | )# | Excess Benefit Retirement Plan, as amended (incorporated by reference to Exhibit 10(g) to Cummins Inc.'s Annual Report on Form 10-K for the year ended December 31, 2011). | |
| 10(h | )# | Employee Stock Purchase Plan, as amended (incorporated by reference to Annex B to Cummins Inc.'s definitive proxy statement filed with the Securities and Exchange Commission on Schedule 14A on March 27, 2012 (File No. 001-04949)). | |
| 10(i | )# | Longer Term Performance Plan (incorporated by reference to Exhibit 10(i) to Cummins Inc.'s Annual Report on Form 10-K for the year ended December 31, 2009). | |
| 10(j | )# | 2006 Executive Retention Plan, as amended (incorporated by reference to Exhibit 10(j) to Cummins Inc.'s Annual Report on Form 10-K for the year ended December 31, 2011). | |
| 10(k | )# | Senior Executive Target Bonus Plan (incorporated by reference to Exhibit 10(k) to Cummins Inc.'s Annual Report on Form 10-K for the year ended December 31, 2009). | |
| 10(l | )# | Senior Executive Longer Term Performance Plan (incorporated by reference to Exhibit 10(l) to Cummins Inc.'s Annual Report on Form 10-K for the year ended December 31, 2009). | |
| 10(m | )# | Form of Stock Option Agreement under the 2003 Stock Incentive Plan (incorporated by reference to Exhibit 10(m) to Cummins Inc.'s Annual Report on Form 10-K for the year ended December 31, 2009). | |
| 10(n | )# | Form of Performance Share Award Agreement under the 2003 Stock Incentive Plan (incorporated by reference to Exhibit 10(n) to Cummins Inc.'s Annual Report on Form 10-K for the year ended December 31, 2009). | |
| Exhibit No. | Description of Exhibit | ||
|---|---|---|---|
| 10(o | )# | 2012 Omnibus Incentive Plan (incorporated by reference to Annex A to Cummins Inc.'s definitive proxy statement filed with the Securities and Exchange Commission on Schedule 14A on March 27, 2012 (File No. 001-04949)). | |
| 10(p | )# | Form of Stock Option Agreement under the 2012 Omnibus Incentive Plan (filed herewith). | |
| 10(q | )# | Key Employee Stock Investment Plan (incorporated by reference to Exhibit 4.3 to Cummins Inc.'s Registration Statement on Form S-8 on November 6, 2012 (File No. 333-184786)). | |
| 12 | Calculation of Ratio of Earnings to Fixed Charges (filed herewith). | ||
| 21 | Subsidiaries of the Registrant (filed herewith). | ||
| 23 | Consent of PricewaterhouseCoopers LLP (filed herewith). | ||
| 24 | Powers of Attorney (filed herewith). | ||
| 31(a | ) | Certification Pursuant to Section 302 of the Sarbanes-Oxley Act of 2002 (filed herewith). | |
| 31(b | ) | Certification Pursuant to Section 302 of the Sarbanes-Oxley Act of 2002 (filed herewith). | |
| 32 | Certifications Pursuant to Section 906 of the Sarbanes-Oxley Act of 2002 (filed herewith). | ||
| 101.INS | XBRL Instance Document. | ||
| 101.SCH | XBRL Taxonomy Extension Schema Document. | ||
| 101.CAL | XBRL Taxonomy Extension Calculation Linkbase Document. | ||
| 101.DEF | XBRL Taxonomy Extension Definition Linkbase Document. | ||
| 101.LAB | XBRL Taxonomy Extension Label Linkbase Document. | ||
| 101.PRE | XBRL Taxonomy Extension Presentation Linkbase Document. | ||