| (Mark One) | ||
ý | ANNUAL REPORT PURSUANT TO SECTION 13 or 15(d) OF THE SECURITIES EXCHANGE ACT OF 1934 | |
For the fiscal year ended December 31, | ||
OR | ||
o | TRANSITION REPORT PURSUANT TO SECTION 13 or 15(d) OF THE SECURITIES EXCHANGE ACT OF 1934 | |
Indicate by check mark whether the registrant is a well-known seasoned issuer (as defined in Rule 405 of the Securities Act). $48.4 billion. The company's Proxy Statement in connection with the Annual Meeting of Stockholders to be held on April The company has operations in more than 90 countries worldwide and about sales through distributors. The company utilizes numerous suppliers as well as internal sources to supply a wide range of raw materials, energy, supplies, services and equipment. To ensure availability, the company maintains multiple sources for fuels and many raw materials, including hydrocarbon feedstocks. Large volume purchases are generally procured under competitively priced supply contracts. Agriculture segment include: benzene derivatives, other aromatics and carbamic acid related insect control products, natural gas and seed treatments. continued dianhydride. applications. The result is cost and process benefits, better product performance and improved environmental outcomes. Industrial Biosciences also makes DuPont industrial gases, methanol, natural gas, perchloroethylene, petroleum coke, sodium hydroxide, sulfur and titanium ore. applications. personnel to ensure consistency with the business and corporate strategy and to capitalize on the application of emerging science. See discussion under "Intellectual Property". SEC. volatility. When possible, the company purchases raw materials through negotiated long-term contracts to minimize the impact of price fluctuations. Additionally, the company enters into over-the-counter and exchange traded derivative commodity instruments to hedge its exposure to price fluctuations on certain raw material purchases. The company takes actions to offset the effects of higher energy and raw material costs through selling price increases, productivity improvements and cost reduction programs. Success in offsetting higher raw material costs with price increases is largely influenced by competitive and economic conditions and could vary significantly depending on the market served. If the company is not able to fully offset the effects of higher energy and raw material costs, it could have a significant impact on the company's financial results. number of factors including the nature of the matter, the complexity of the site, site geology, the nature and extent of contamination, the type of remedy, the outcome of discussions with regulatory agencies and other Potentially Responsible Parties (PRPs) at multi-party sites and the number and financial viability of other PRPs. ITEM 1B. UNRESOLVED STAFF COMMENTS ýo2010,2013, was approximately $31.3 billion.2011, 921,634,0002014, 927,717,000 shares (excludes 87,041,000 shares of treasury stock) of the company's common stock, $.30$0.30 par value, were outstanding.27, 2011 III 20112014 Annual Meeting Proxy Statement to be filed within 120 days after the end of the year covered by this Annual Report on Form 10-K, pursuant to Regulation 14A (the Proxy).is a world leader inbrings world-class science and innovation across a range of disciplines, including agriculture and industrial biotechnology, chemistry, biology, materials science and manufacturing. The company operates globally and offers a wide rangeengineering to the global marketplace in the form of innovative products, materials and servicesservices. The company believes that by collaborating with customers, governments, non-governmental organizations and thought leaders it can help find solutions to such global challenges as providing healthy food for markets including agriculturepeople everywhere, decreasing dependence on fossil fuels, and food, buildingprotecting life and construction, electronics and communications, general industrial, and transportation.the environment. Total worldwide employment at December 31, 2010,2013, was approximately 60,000about 64,000 people.The company consists of 13 businesses which are aggregated into seven reportable segments based on similar economic characteristics, the nature of the products and production processes, end-use markets, channels of distribution and regulatory environment. The company's reportable segments are Agriculture & Nutrition, Electronics & Communications, Performance Chemicals, Performance Coatings, Performance Materials, Safety & Protection, and Pharmaceuticals. The company includes certain embryonic businesses not included in the reportable segments, such as Applied BioSciences, and nonaligned businesses in Other.Information describing the business of the company can be found on the indicated pages of this report:ItemPageSegment ReviewsIntroduction25Agriculture & Nutrition26Electronics & Communications28Performance Chemicals29Performance Coatings30Performance Materials31Safety & Protection32Pharmaceuticals33Other34Geographic Information – Net Sales and Net PropertyF-47Segment Sales, Net Sales, Pre-tax Operating Income and Segment Net AssetsF-486560 percent of consolidated net sales are made to customers outside the United States of America (U.S.). See Note 21 to the Consolidated Financial Statements for additional details on the location of the company's sales and property.Acquisition As a science and technology based company, DuPont competes on a variety of DaniscoIn January 2011, DuPontfactors such as product quality and its wholly owned subsidiary, DuPont Denmark Holding ApS, entered into a definitive agreement forperformance or specifications, continuity of supply, price, customer service and breadth of product line, depending on the acquisitioncharacteristics of Danisco A/S (Danisco) for $6.3 billion, which includes $5.8 billion in cashthe particular market involved and the assumption of $500 million of Danisco's net debt. The transactionproduct or service provided. Most products are marketed primarily through the company's sales force, although in some regions, more emphasis is subject to customary closing conditions, including certain regulatory approvals and the tender of more than 90 percent of Danisco's shares in the tender offer. DuPont has the right to waive such tender offer conditions and accept a lesser number of shares in certain cases. The transaction is expected to close in the second quarter 2011.Danisco is a leading technology-driven organization, with outstanding research and application development capabilities in biotechnology. Danisco has specialty food ingredients, including enablers, cultures and sweeteners, which generate about 65 percent of its total sales. Genencor, its enzymes division, represents about 35 percent of its total sales. DuPont and Danisco are joint venture partners in the development of cellulosic ethanol technology. (See Applied BioSciences business discussionplaced on page 34 for more information.) Danisco has nearly 7,000 employees globally with operations in 23 countries. Upon completion, the transaction would establish DuPont as a clear leader in industrial biotechnology with science-intensive innovations that address global challenges in food production and reduced fossil fuel consumption.Part IITEM 1. BUSINESS,continuedSources of Supplywholly owned subsidiary, Pioneer Hi-Bred International, Inc. (Pioneer), operatesreportable segments are Agriculture, Electronics & Communications, Industrial Biosciences, Nutrition & Health, Performance Chemicals, Performance Materials, Safety & Protection and Pharmaceuticals. The company includes certain embryonic businesses not included in the reportable segments, such as pre-commercial programs, and nonaligned businesses in Other. Additional information with respect to business segment results is included in Item 7, Management's Discussion and Analysis of Financial Condition and Results of Operations, on page 21 of this report and Note 22 to the Consolidated Financial Statements.industryproducts and well-established brands of insecticides, fungicides and herbicides. Research and development focuses on leveraging technology to increase grower productivity and enhance the value of grains and soy through improved seed traits, superior seed germplasm and effective use of insecticides, herbicides and fungicides. Agriculture accounted for approximately 50 percent of the company's total research and development expense in 2013.companybusiness or contracted with independent growers and conditioners. The company'sPioneer's ability to produce seeds primarily depends upon weather conditions and availability of reliable contract growers.company's reportable segments in 2010 include the following:& Nutrition:intermediates; copper; insect control products; natural gas; soybeans; soy flake; soy lecithin; sulfonamides;intermediates, copper, corn and soybean seeds,Communications:Communicationsco-polymers; copper; hydroxylamine; oxydianiline;co-polymers, copper, difluoroethane, hydroxylamine, oxydianiline, polyester film;film, precious metals;metals and pyromellitic dianhydridePerformance Chemicals:ammonia; benzene; chlorine; chloroform; fluorspar; hydrofluoric acid;Industrial Biosciences is a leader in developing and manufacturing a broad portfolio of bio-based products. The segment's enzymes add value and functionality to processes and products across a broad range of markets such as animal nutrition, detergents, food manufacturing, ethanol production and industrial gases; methanol; natural gas; perchloroethylene; sulfur; titanium orePerformance Coatings:TM isocyanates; pigments; resins; solventsPerformance Materials:Soronaacrylic monomers; adipic acid; butadiene; butanediol; dimethyl terephthalate; ethane; fiberglass; hexamethylenediamine; methanol; natural gas;® PTT renewably sourced polymer for use in carpet and apparel fibers.Protection:Protectionalumina hydroxide; benzene;® high strength material, Nomex® thermal resistant material and Tyvek® protective material, the business continues to hold strong positions in life protection markets and meet the continued demand for body armor and personal protective gear for the military, law enforcement personnel, firefighters and other first responders, as well as for workers in the oil and gas industry around the world.polyethylene;polyethylene, isophthaloyl chloride; metaphenylenediamine;chloride, metaphenylenediamine, methyl methacrylate; paraphenylenediamine;methacrylate, paraphenylenediamine, polyester fiber;fiber, terephthaloyl chloride;chloride and wood pulpNo commodities or raw materials are purchasedpulp.Pharmaceutical segment. This segment receives net proceedssegment's total sales in 2013.royalties from licensing arrangements for Cozaar® and Hyzaar® antihypertensive drugs,Hyzaar® (losartan potassium with hydrochlorothiazide), which are manufacturedused in the treatment of hypertension. DuPont has exclusively licensed worldwide marketing and distributed by Merck Sharp & Dohme Corp., a subsidiary ofmanufacturing rights for Cozaar® and Hyzaar® to Merck & Co., Inc. (Merck).estate providesincluding its trade secrets. When the company discovers that its trade secrets have been unlawfully taken, it with an important competitive advantage. Itreports the matter to governmental authorities for investigation and potential criminal action, as appropriate. In addition, the company takes measures to mitigate any potential impact, which may include civil actions seeking redress, restitution and/or damages based on loss to the company and/or unjust enrichment.an established global network of attorneys, as well as branding, advertising and licensing professionals,access to procure, maintain, protect, enhance and gain value from this estate.Part IITEM 1. BUSINESS,continuedThe company has a large patent portfolio, ofboth owned and is licensed under various patents. These definite-lived patents cover many products, processes and product uses. These patents protect many aspects of the company's significant research programs and the goods and services it sells. The actual protection afforded by these patents varies from country to country and depends upon the scope of coverage of each individual patent as well as the availability of legal remedies in each country. DuPont owns about 17,600 worldwide patents and 17,300 worldwide patent applications. In 2010, the company was granted about 700 U.S. patents and about 1,400 international patents. DuPont'slicensed. DuPont’s rights under itsthese patents and licenses, as well as the products made and sold under them, are important to the company in the aggregate. The protection afforded by these patents varies based on country, scope of individual patent coverage, as a whole,well as the availability of legal remedies in each country. This significant patent estate may bevarying degrees, important to each reportable segment.The environment in which Pioneer competes has been characterized byits owned patents, the use among competitors of new patents,company owns over 20,000 patent positions and patent lawsuits to gain advantage in commercial markets. Ownership of and access to intellectual property rights, particularly those relating to biotechnology and germplasm, will continue to be important to Pioneer and its competitors. Pioneer has a large collection of patents related to biotechnology and germplasm and also licenses technology from others. Pioneer will continue to address the dynamic environment in which it competes through a variety of means that includes protecting and enforcing its own intellectual property rights, challenging claims made by others and, where appropriate, obtaining licenses to important technologies on commercially reasonable terms. During 2007, Pioneer entered into a business agreement on corn herbicide tolerance and insect control trait technologies with Monsanto Company (Monsanto). Among other provisions, modifications were made to the existing corn license agreements; both parties agreed to exchange certain non-assert and other intellectual property rights; and both parties obtained rights to reference and access certain regulatory data and approvals in which the other has certain interests. For additional information, see Pioneer business discussion beginning on page 26 and the Contractual Obligations table on page 39.2,0002,140 unique trademarks for its products and services and approximately 19,00021,130 registrations for these trademarks worldwide. Ownership rights in trademarks do not expire if the trademarks are continued in use and properly protected. The company has many trademarks that have significant recognition at the consumer retail level and/or business to business level. Significant trademarks at the consumer retail level include the DuPont Oval and DuPont™ (the "DuPont Brand Trademarks"); Pioneer® brand seeds; Teflon® fluoropolymers, films, fabric protectors, fibers and dispersions; Corian® surfaces; Kevlar® high strength material; Nomex® thermal resistant material and Tyvek® protective material. The company actively pursues licensing opportunities for selected trademarks at the retail level.SeasonalitySales of the company's products in the Agriculture & Nutrition segment are affected by seasonal cropping and weather patterns. Sales and earnings performance in the Agriculture & Nutrition segment is strongest in the first half of the year. The segment generally operates at a loss during the third and fourth quarters of the year. As a result of the seasonal nature of its business, Agriculture & Nutrition's inventory is at its highest level at the end of the calendar year and is sold down in the first and second quarters. Trade receivables in the Agriculture & Nutrition segment are at a low point at year-end and increase through the selling season to peak at the end of the second quarter.In general, businesses in the remaining segments are not significantly affected by seasonal factors.MarketingWith the exception of certain products in the Agriculture & Nutrition segment, most products are marketed primarily through DuPont's sales force, although in some regions, more emphasis is placed on sales through distributors. Pioneer owns or uses a number of brands for its products and promotes them through multiple marketing channels around the world. In the corn and soybean markets of the U.S. Corn Belt, Pioneer® brand products are sold through a specialized force of independent sales representatives. Products that are co-branded or marketed under other Pioneer owned brands are distributed in this region by select seed companies. (See page 27 for a discussion of Pioneer's PROaccessSM business strategy.) In other North American markets, Pioneer® products are marketed through distributors and crop input retailers. Pioneer® products outside of North America are marketed through a network of subsidiaries, joint ventures and independent producer-distributors. Similarly, Crop Protection products are marketed and sold to growers and other end users through a network of wholesale distributors and crop input retailers. Solae®Part IITEM 1. BUSINESS,continuedisolated and functional soy proteins are marketed using a combination of outside distributors, joint ventures and direct sales.Major CustomersThe company's sales are not materially dependent on a single customer or small group of customers. However, collectively, Performance Coatings and Performance Materials have several large customers, primarily in the motor vehicle original equipment manufacturer (OEM) industry supply chain. The company has long-standing relationships with these customers and they are considered to be important to the segments' operating results.CompetitionAs a science and technology based company, DuPont competes on a variety of factors such as product quality and performance or specifications, continuity of supply, price, customer service and breadth of product line, depending on the characteristics of the particular market involved and the product or service provided.Major competitors include diversified industrial companies principally based in the U.S., Western Europe, Japan, China, Korea and India. In the aggregate, these competitors offer a wide range of products from agricultural, commodity and specialty chemicals to plastics, fibers and advanced materials. The company also competes in certain markets with smaller, more specialized firms who offer a narrow range of products or converted products that functionally compete with the company's offerings.Pioneer sells advanced plant genetics, principally for the global production of corn and soybeans and thus directly competes with other seed and plant biotechnology companies. The Nutrition & Health business also provides food safety equipment and soy-based food ingredients in competition with other major grain and food processors.in the U.S.and development (R&D) at either dedicated research facilities or manufacturing plants. The highest concentration of research is in the Wilmington, Delaware area at several large research centers. Among these, the Experimental Station laboratories engage in investigative and applied research, the Chestnut Run laboratories focus on applied research and the Stine-Haskell Research Center conducts agricultural product research and toxicological research to assure the safe manufacture, handling and use of products and raw materials.OtherThere are eleven major research locations in the U.S. include& Canada, with the highest concentration of facilities dedicated to coatingsat our corporate headquarters in the Wilmington, Delaware area. In addition, DuPont has five major research centers in Mount Clemens, Michigan; Pioneer research facilitiesthe Asia Pacific region, four major locations in Johnston, Iowa; the Europe, Middle East and Africa (EMEA) region and one major location is located in Latin America.Solae Company facilities in St. Louis, Missouri; polymer research facilities in Richmond, Virginia, and Parkersburg, West Virginia; and electronic materials research facilities in Research Triangle Park, North Carolina, and Santa Barbara, California.DuPont, reflecting the company's global interests, also operates additionalcompany’s research and development facilities at locations outsideobjectives are to leverage its unique integrated science capabilities to drive revenue and profit growth. DuPont's R&D organization is fully focused on the U.S., with major facilities located in Sao Paulo, Brazil; Kingston, Canada; Shanghai, China; Wuppertal, Germany; Hyderabad, India; Kanagawa, Japan; Utsunomiya, Japan; Seoul, Korea; and Meyrin, Switzerland.The objectivescompany's strategic priorities: extending its leadership across the high-value, science-driven segments of the company's researchagriculture and development programsfood value chains, strengthening its lead as provider of differentiated, high-value advanced industrial materials, and building transformational new bio-based industrial businesses. The company believes that its unique breadth of science, proven R&D engine, broad global reach and deep market penetration are distinctive, competitive advantages that position it to create new technologies, processesaddress demands for more and healthier food, decreasing our dependence on fossil fuel, and protecting people and the environment. Each business opportunities in relevant fields, as well as to improve existing products and processes. Each segment of the company funds research and development activities that support its business mission. Recently, the company has broadened its sustainability commitments beyond environmental footprint reduction to include market-driven targets formission, and a central research and development investment.organization supports cross-business and cross-functional growth opportunities. The companyR&D portfolio is expanding its offerings addressing safety, environment, energy and climate challenges in the global marketplace by developing and commercializing renewable, bio-based materials; advanced biofuels; energy-efficient technologies; enhanced safety and protection products; and alternative energy products and technologies. The goals are tied directly to business growth, including increasing food production, increasing renewable sources for energy and raw materials, and providing greater safety and protection for people and the environment.The corporate research laboratories are responsible for conducting research programs aligned with corporate strategy. All research and development activities are administeredmanaged by senior research and development managementPart IITEM 1. BUSINESS,continuedThe future of the company is not dependent upon the outcome of any single research program.Facility SecuritySee Item 7, Management's Discussion and Analysis of Financial Condition and Results of Operations, on page 45 for a discussion of facility security.23, 41-4531, 35-37 and (3) Notes 1 and 1916 to the Consolidated Financial Statements.tabsection labeled "Investor Center""Investors", then on "Key Financials & Filings" and then on "SEC filings.Filings." These reports are made available, without charge, as soon as is reasonably practicable after the company files or furnishes them electronically with the Securities and Exchange Commission.5140 of this report.and natural gas and raw materials, affect the company's operating results from period to period. In 2013, price increases for energy and raw materials were about $500 million as compared to 2012. Price increases for energy and raw materials were not significant to earnings in 2012 as compared to 2011. Legislation to address climate change by reducing greenhouse gas emissions and establishing a price on carbon could create increases in energy costs and pricePart IITEM 1A. RISK FACTORS,continueddevelopeffectively prevent, detect and market new productsrecover from security breaches, including attacks on information technology and manage product life cyclesinfrastructureimpactresult in misuse of the company's assets, business disruptions, loss of property including trade secrets and confidential business information, legal claims or proceedings, reporting errors, processing inefficiencies, negative media attention, loss of sales and interference with regulatory compliance. Like most major corporations, DuPont is the target of industrial espionage, including cyber-attacks, from time to time. DuPont has determined that these attacks have resulted, and could result in the future, in unauthorized parties gaining access to at least certain confidential business information. However, to date, the company has not experienced any material financial impact, changes in the competitive position and have an adverse effect onenvironment or business operations that it attributes to these attacks. Although management does not believe that the company's financial results.Operating results are largely dependent on the company's assessment and management of its portfolio of current, new and developing products and services and its abilitycompany has experienced any material losses to bring those products and servicesdate related to market. The company plans to grow earnings by focusing on developing markets and solutions to meet increasing demand for food productivity, decrease dependency on fossil fuels and protect people, assets and the environment. This ability could be adversely affected by difficulties or delays in product development such as the inability to identify viable new products, successfully complete research and development, obtain relevant regulatory approvals, obtain intellectual property protection, or gain market acceptance of new products and services. Because of the lengthy development process, technological challenges and intense competition,security breaches, including cybersecurity incidents, there can be no assurance that it will not suffer such losses in the future. The company actively manages the risks within its control that could lead to business disruptions and security breaches. As these threats continue to evolve, particularly around cybersecurity, the company may be required to expend significant resources to enhance its control environment, processes, practices and other protective measures. Despite these efforts, such events could materially adversely affect the company's business, financial condition or results of operations.is currently developing, oroperates. While the company has procedures and controls to manage process safety risks, issues could begin to develop inbe created by events outside of its control including natural disasters, severe weather events, acts of sabotage and substandard performance by the future, will achieve substantial commercial success. Salescompany's external partners.new productscurrent and past operations, including operations related to divested businesses, the company could replace salesincur significant environmental liabilities.somepollutants and the management and disposal of hazardous substances. As a result of its current products, offsettingoperations, including its past operations and operations of divested businesses, the benefitcompany could incur substantial costs, including remediation and restoration costs. The costs of evencomplying with complex environmental laws and regulations, as well as internal voluntary programs, are significant and will continue to be so for the foreseeable future. The ultimate costs under environmental laws and the timing of these costs are difficult to predict. The company's accruals for such costs and liabilities may not be adequate because the estimates on which the accruals are based depend on a successful product introduction.The company's business, including its results of operations and reputation, could be adversely affected by process safety and product stewardship issues.Failure to appropriately manage safety, human health, product liability and environmental risks associated with the company's products, product life cycles and production processes could adversely impact employees, communities, stakeholders, the company's reputation and its results of operations. Public perception of the risks associated with the company's products and production processes could impact product acceptance and influence the regulatory environment in which the company operates. While the company has procedures and controls to manage process safety risks, issues could be created by events outside of its control including natural disasters, severe weather events and acts of sabotage.ITEM 1A. RISK FACTORS,continuedAs a result of the company's current and past operations, including operations related to divested businesses, the company could incur significant environmental liabilities.The company is subject to various laws and regulations around the world governing the environment, including the discharge of pollutants and the management and disposal of hazardous substances. As a result of its operations, including its past operations and operations of divested businesses, the company could incur substantial costs, including cleanup costs. The costs of complying with complex environmental laws and regulations, as well as internal voluntary programs, are significant and will continue to be so for the foreseeable future. The ultimate costs under environmental laws and the timing of these costs are difficult to predict. The company's accruals for such costs and liabilities may not be adequate because the estimates on which the accruals are based depend on a number of factors including the nature of the matter, the complexity of the site, site geology, the nature and extent of contamination, the type of remedy, the outcome of discussions with regulatory agencies and other Potentially Responsible Parties (PRPs) at multi-party sites and the number and financial viability of other PRPs.The company's ability to generate sales from genetically modified products, particularly seeds and other agricultural products, could be adversely affected by market acceptance, government policies, rules or regulations and competition.The company is using biotechnology to create and improve products, particularly in its Agriculture & Nutrition segment. The use of biotechnology to characterize the genetic and performance characteristics of Pioneer seeds provides Pioneer with competitive advantages in the development of new products, and in the most effective placement of those products on customer acres. In addition, the company uses biotechnology to enhance the performance of its seed products through the addition of specific transgenes. The company's ability to generate sales from such products could be affected by market acceptance of genetically modified products as well as governmental policies, laws and regulations that affect the development, manufacture and distribution of products, including the testing and planting of seeds containing biotechnology traits and the import of commodity grain grown from those seeds.The company competes with major global companies that have strong intellectual property estates supporting the use of biotechnology to enhance products, particularly in the agricultural products and production markets. Speed in discovering and protecting new technologies and bringing products based on them to market is a significant competitive advantage. Failure to predict and respond effectively to this competition could cause the company's existing or candidate products to become less competitive, adversely affecting sales.Changes in government policies and laws could adversely affect the company's financial results.Sales outside the U.S. constitute approximately 65 percent of the company's 2010 revenue. The company anticipates that international sales will continue to represent a substantial portion of its total sales and that continued growth and profitability will require further international expansion, particularly in developing markets. Sales from developing markets represent approximately 30 percent of the company's revenue in 2010 and the company's growth plans include focusing on expanding its presence in developing markets. The company's financial results could be affected by changes in trade, monetary and fiscal policies, laws and regulations, or other activities of U.S. and non-U.S. governments, agencies and similar organizations. These conditions include, but are not limited to, changes in a country's or region's economic or political conditions, trade regulations affecting production, pricing and marketing of products, local labor conditions and regulations, reduced protection of intellectual property rights in some countries, changes in the regulatory or legal environment, restrictions on currency exchange activities, burdensome taxes and tariffs and other trade barriers. International risks and uncertainties, including changing social and economic conditions as well as terrorism, political hostilities and war, could lead to reduced sales and profitability.Economic factors, including inflation, deflation and fluctuations in currency exchange rates, interest rates and commodity prices could affect the company's financial results.The company is exposed to fluctuations in currency exchange rates, interest rates and commodity prices. Because the company has significant international operations, there are a large number of currency transactions that result from international sales, purchases, investments and borrowings. The company actively manages currency exposures that are associated with net monetary asset positions, committed currency purchases and sales, foreign currency-Part IITEM 1A. RISK FACTORS,continueddenominated revenues and other assets and liabilities created in the normal course of business. Failure to successfully manage these risks could have an adverse impact on the company's financial position, results of operations and cash flows.Conditions in the global economy and global capital markets may adversely affect the company's results of operations, financial condition, and cash flows.The company's business and operating results may in the future be adversely affected by global economic conditions, including instability in credit markets, declining consumer and business confidence, fluctuating commodity prices, volatile exchange rates, and other challenges that could affect the global economy. The company's customers may experience deterioration of their businesses, cash flow shortages, and difficulty obtaining financing. As a result, existing or potential customers may delay or cancel plans to purchase products and may not be able to fulfill their obligations in a timely fashion. Further, suppliers could experience similar conditions, which could impact their ability to fulfill their obligations to the company. Adversity within capital markets may impact future return on pension assets, thus resulting in greater future pension costs that impact the company's results. Future weakness in the global economy could adversely affect the company's results of operations, financial condition and cash flows in future periods.The company's results of operations and financial condition could be seriously impacted by business disruptions and security threats.Business disruptions, including supply disruptions, increasing costs for energy, temporary plant and/or power outages and information technology system and network disruptions, could seriously harm the company's operations as well as the operations of its customers and suppliers. Like many other multinational organizations, the company faces security threats to its facilities, data and information technology infrastructure. Although it is impossible to predict the occurrences or consequences of business disruptions or security threats, they could result in reduced demand for the company's products, make it difficult or impossible for the company to deliver products to its customers or to receive raw materials from suppliers, and create delays and inefficiencies in the supply chain. The company actively manages the risks within its control that could lead to business disruptions or security breaches in order to mitigate any potential impact from business disruptions regardless of cause including acts of sabotage, terrorism or war, weather events and natural disasters. Despite these efforts, the impact from business disruptions and security breaches could significantly increase the cost of doing business or otherwise adversely impact the company's financial performance.Inability to protect and enforce the company's intellectual property rights could adversely affect the company's financial results.Intellectual property rights are important to the company's business. The company endeavors to protect its intellectual property rights in jurisdictions in which its products are produced or used and in jurisdictions into which its products are imported. However, the company may be unable to obtain protection for its intellectual property in key jurisdictions. Additionally, the company has designed and implemented internal controls to restrict access to and distribution of its intellectual property, including confidential information and trade secrets. Despite these precautions, it is possible that unauthorized parties may access and use such property. When misappropriation is discovered, the company reports such situations to the appropriate governmental authorities for investigation and takes measures to mitigate any potential impact.
The company's plants and equipment are well maintained and in good operating condition. ® Herbicide Claims Process DuPont is in settlement negotiations with the U.S. Environmental Protection Agency (EPA) and the Department of Justice (DOJ). 2006 and 2010 following separate environmental audits. DuPont is in settlement negotiations with EPA and 2014. Fourth Quarter Third Quarter Second Quarter First Quarter 2009 Fourth Quarter Third Quarter Second Quarter First Quarter November Total DuPont S&P 500 Index Peer Group (Dollars in millions, except per share) Summary of operations Net sales Income before income taxes Provision for income taxes Net income attributable to DuPont Basic earnings per share of common stock Diluted earnings per share of common stock Financial position at year-end Working capital Total assets Borrowings and capital lease obligations Short-term Long-term Total equity General For the year Purchases of property, plant & equipment and investments in affiliates Depreciation Research and development expense Average number of common shares Basic Diluted Dividends per common share At year-end Employees (thousands) Closing stock price Common stockholders of record (thousands) 8. to return excess cash to shareholders unless there is a compelling opportunity to invest for growth. (Dollars in millions) NET SALES The (Dollars in billions) Worldwide United States Europe, Middle East, and Africa (EMEA) Asia Pacific Latin America Canada (Dollars in billions) Worldwide United States EMEA Asia Pacific Latin America Canada (Dollars in millions) OTHER INCOME, NET (Dollars in millions) COST OF GOODS SOLD AND OTHER OPERATING CHARGES As a percent of net sales (Dollars in millions) SELLING, GENERAL AND ADMINISTRATIVE EXPENSES As a percent of net sales (Dollars in millions) RESEARCH AND DEVELOPMENT EXPENSE As a percent of net sales (Dollars in millions) INTEREST EXPENSE (Dollars in millions) EMPLOYEE SEPARATION/ASSET RELATED CHARGES, NET (Dollars in millions) PROVISION FOR INCOME TAXES Effective income tax rate In earnings, in addition to benefits associated with certain U.S. business tax provisions in 2013. provisions in 2011. (Dollars in millions) NET INCOME ATTRIBUTABLE TO DUPONT Principal U.S. Pension Plan Market-related value of assets Fair value of plan assets For plans other than the principal U.S. pension plan, pension expense is typically determined using the fair value of assets. Pre-tax Earnings Benefit (Charge) Discount Rate Expected rate of return on plan assets negotiations, settlements, rulings, advice of counsel and other information and events that may pertain to a particular matter. Predicting the outcome of claims and lawsuits and estimating related costs and exposure involves substantial uncertainties that could cause actual costs to vary materially from estimates. In making determinations of likely outcomes of litigation matters, management considers many factors. These factors include, but are not limited to, the nature of specific claims including unasserted claims, the company's experience with similar types of claims, the jurisdiction in which the matter is filed, input from outside legal counsel, the likelihood of resolving the matter through alternative dispute resolution mechanisms and the matter's current status. Considerable judgment is required in determining whether to establish a litigation accrual when an adverse judgment is rendered against the company in a court proceeding. In such situations, the company will not recognize a loss if, based upon a thorough review of all relevant facts and information, management believes that it is probable that the pending judgment will be successfully overturned on appeal. A detailed discussion of significant litigation matters is contained in Note See Note 6 to the Consolidated Financial Statements for additional details related to the deferred tax asset balance. (Dollars in millions) Agriculture & Nutrition Electronics & Communications Performance Chemicals Performance Coatings Performance Materials Safety & Protection Other Total (Charge) Credit 2010 2009 2008 2010 2009 2008 2010 2009 2008 2010 2009 2008 2010 2009 2008 2010 2009 2008 2010 2009 2008 (Dollars in millions) Cash provided by operating activities (Dollars in millions) Cash used for investing activities (Dollars in millions) Cash (used for) provided by financing activities (Dollars in millions) Cash provided by operating activities Purchases of property, plant and equipment Free cash flow Off-Balance Sheet Arrangements (Dollars in millions) (Dollars in millions) Long-term debt obligations1 Long-term debt obligations1 Expected cumulative cash requirements for interest payments through maturity Expected cumulative cash requirements for interest payments through maturity Capital leases1 Capital leases1 Operating leases Operating leases Purchase obligations2 Purchase obligations2 Information technology infrastructure & services Raw material obligations Utility obligations INVISTA-related obligations3 Human resource services Other4 Total purchase obligations Total purchase obligations Other liabilities1,5 Workers' compensation Asset retirement obligations Environmental remediation Legal settlements License agreement6 Other7 Total other long-term liabilities Total other long-term liabilities Total contractual obligations8 (Dollars in millions) Defined benefit plan charges (benefits) Defined contribution plan charges Other long-term employee benefit plan charges Net amount 2013. (Dollars in millions) Balance at December 31, 2008 Remediation Payments Increase in Accrual Balance at December 31, 2009 Remediation Payments Increase in Accrual Balance at December 31, 2010 (Dollars in millions) Environmental Operating Costs Increase in Remediation Accruals Environmental Capital Expenditures financial position or liquidity of the company. Similarly, demand is expected to grow for products that facilitate adaptation to a changing climate. This type of GHG emissions regulation by EPA, in the absence of or in addition to federal legislation, could result in more costly, less efficient facility-by-facility controls versus a federal perfluoroelastomer parts and fluoroelastomers. In Statements. Consolidated Financial Statements. (Dollars in millions) Pre-tax exchange loss Tax (expense) benefit After-tax loss (Dollars in millions) Interest rate swaps Foreign currency contracts Energy feedstocks “Stockholder Nominations for Election of Directors.” Chair of the Board of Directors and Chief Executive Officer: Chair of the Board of Directors and Chief Executive Officer: Ellen J. Kullman Ellen J. Kullman Other Executive Officers: Other Executive Officers: James C. Borel James C. Borel Executive Vice President Thomas M. Connelly, Jr. Executive Vice President and Chief Innovation Officer Nicholas C. Fanandakis Nicholas C. Fanandakis Executive Vice President and Chief Financial Officer Thomas L. Sager Thomas L. Sager Senior Vice President and General Counsel Mark P. Vergnano Mark P. Vergnano Executive Vice President Equity compensation plans approved by security holders Equity compensation plans not approved by security holders Total Information with respect to this Item is incorporated herein by reference to the Proxy, including information within the section entitled "Ownership of Company Stock." Accounts Receivable—Allowance for Doubtful Receivables Balance at beginning of period Additions charged to cost and expenses Deductions from reserves Balance at end of period Deferred Tax Assets—Valuation Allowance Balance at beginning of period Net (benefits) charges to income tax expense Additions charged to other comprehensive income (loss) Currency translation Balance at end of period Net sales Net sales Other income, net Other income, net Total Cost of goods sold and other operating charges Selling, general and administrative expenses Selling, general and administrative expenses Research and development expense Research and development expense Interest expense Interest expense Employee separation/asset related charges, net Total Income before income taxes Provision for income taxes Net income Net income Less: Net income attributable to noncontrolling interests Less: Net income attributable to noncontrolling interests Net income attributable to DuPont Net income attributable to DuPont Basic earnings per share of common stock Basic earnings per share of common stock Diluted earnings per share of common stock Diluted earnings per share of common stock Assets Current assets Cash and cash equivalents Marketable securities Accounts and notes receivable, net Inventories Prepaid expenses Deferred income taxes Total current assets Property, plant and equipment Less: Accumulated depreciation Net property, plant and equipment Goodwill Other intangible assets Investment in affiliates Other assets Total Liabilities and Stockholders' Equity Current liabilities Accounts payable Short-term borrowings and capital lease obligations Income taxes Other accrued liabilities Total current liabilities Long-term borrowings and capital lease obligations Other liabilities Deferred income taxes Total liabilities Commitments and contingent liabilities Stockholders' Equity Preferred stock, without par value – cumulative; 23,000,000 shares authorized; issued at December 31, 2010 and 2009: $4.50 Series – 1,673,000 shares (callable at $120) $3.50 Series – 700,000 shares (callable at $102) Common stock, $.30 par value; 1,800,000,000 shares authorized; Issued at December 31, 2010 – 1,004,351,000; 2009 – 990,855,000 Additional paid-in capital Reinvested earnings Accumulated other comprehensive loss Common stock held in treasury, at cost (Shares: December 31, 2010 and 2009 – 87,041,000) Total DuPont stockholders' equity Noncontrolling interests Total equity Total 2008 Balance January 1, 2008 Net income Cumulative translation adjustment Net revaluation and clearance of cash flow hedges to earnings Pension benefit plans Other benefit plans Net unrealized loss on securities Total comprehensive loss Common dividends ($1.64 per share) Preferred dividends Common stock Issued – compensation plans Balance December 31, 2008 2009 Acquisition of a majority interest in a consolidated subsidiary Purchase of subsidiary shares from noncontrolling interest Net income Cumulative translation adjustment Net revaluation and clearance of cash flow hedges to earnings Pension benefit plans Other benefit plans Net unrealized gain on securities Total comprehensive income Common dividends ($1.64 per share) Preferred dividends Common stock Issued – compensation plans Balance December 31, 2009 2010 Acquisition of a majority interest in a consolidated subsidiary Net income Cumulative translation adjustment Net revaluation and clearance of cash flow hedges to earnings Pension benefit plans Other benefit plans Net unrealized gain on securities Total comprehensive income Common dividends ($1.64 per share) Preferred dividends Common stock Issued – compensation plans Repurchased Retired Balance December 31, 2010 Operating activities Net income Adjustments to reconcile net income to cash provided by operating activities: Depreciation Amortization of intangible assets Other noncash charges and credits – net Contributions to pension plans (Increase) decrease in operating assets: Accounts and notes receivable Inventories and other operating assets Increase (decrease) in operating liabilities: Accounts payable and other operating liabilities Accrued interest and income taxes Cash provided by operating activities Investing activities Purchases of property, plant and equipment Investments in affiliates Payments for businesses – net of cash acquired Proceeds from sale of assets – net of cash sold Net (increase) decrease in short-term financial instruments Forward exchange contract settlements Other investing activities – net Cash used for investing activities Financing activities Dividends paid to stockholders Net increase (decrease) in short-term (less than 90 days) borrowings Long-term and other borrowings: Receipts Payments Repurchase of common stock Proceeds from exercise of stock options Proceeds from termination of interest rate swap Other financing activities – net Cash (used for) provided by financing activities Effect of exchange rate changes on cash Increase in cash and cash equivalents Cash and cash equivalents at beginning of year Cash and cash equivalents at end of year Supplemental cash flow information: Cash paid during the year for Interest, net of amounts capitalized Taxes For those consolidated subsidiaries in which the company's ownership is less than 100 percent, the outside stockholders' interests are shown as noncontrolling interests. Investments in affiliates over which the company has significant influence but not a controlling interest are carried on the equity above matters. cu the company's cash equivalents approximates its stated value as of December 31, 2013 and 2012. Marketable securities represent investments in fixed and floating rate financial instruments with maturities greater than three months and up to twelve months at time of purchase. They are classified as held-to-maturity and recorded at amortized cost. The carrying value approximates fair value due to the short-term nature of the investments. Elements of cost in inventories include raw materials, direct labor and manufacturing overhead. Stores and supplies are valued at cost or market, whichever is lower; cost is generally determined by the average cost method. Research and development expenses include costs (primarily consisting of employee costs, materials, contract services, research agreements, and other external spend) relating to the discovery and development of new products, enhancement of existing products and regulatory approval of new and existing products. A receivable for an insurance recovery is generally recognized when the loss has occurred and collection is considered probable. Cozaar®/Hyzaar® income Royalty income Interest income Equity in earnings of affiliates, excluding exchange gains/losses1 Net gains on sales of assets Net exchange gains (losses)1 Miscellaneous income and expenses, net2 Interest incurred Interest capitalized GLS/Vinyls primarily consist of inventory and property, plant and equipment. In Net charges to income in 2009 Charges to accounts Payments Net translation adjustment Net credits to income Asset write-offs and adjustments Balance at December 31, 2009 Payments Net translation adjustment Net credits to income Balance at December 31, 2010 activities were shut downs. - Net charges to income in 2008 Charges to accounts Net translation adjustment Asset write-offs Other Balance at December 31, 2008 Payments Net translation adjustment Net credits to income Balance at December 31, 2009 Payments Net translation adjustment Net credits to income Balance at December 31, 2010 December 31, 2013 and 2012, the company had long-lived assets with a remaining net book value of approximately $90 and Current tax expense (benefit): U.S. federal U.S. state and local International Total current tax expense Deferred tax expense (benefit): U.S. federal U.S. state and local International Total deferred tax expense Provision for income taxes Depreciation Accrued employee benefits Other accrued expenses Inventories Unrealized exchange gains Tax loss/tax credit carryforwards/backs Investment in subsidiaries and affiliates Amortization of intangibles Other Valuation allowance Net deferred tax asset Current deferred tax asset Non-current deferred tax asset1 Current deferred tax liability Non-current deferred tax liability Net deferred tax asset An analysis of the company's effective income tax rate (EITR) on continuing operations is as follows: Statutory U.S. federal income tax rate Exchange gains/losses1 Domestic operations Lower effective tax rates on international operations-net Tax settlements United States (including exports) International 2018. non-U.S. income tax examinations by tax authorities for years before Total Unrecognized Tax Benefits as of January 1 Gross amounts of decreases in unrecognized tax benefits as a result of tax positions taken during the prior period Gross amounts of increases in unrecognized tax benefits as a result of tax positions taken during the prior period Gross amounts of increases in unrecognized tax benefits as a result of tax positions taken during the current period Amount of decreases in the unrecognized tax benefits relating to settlements with taxing authorities Reduction to unrecognized tax benefits as a result of a lapse of the applicable statue of limitations Exchange gain (loss) Total Unrecognized Tax Benefits as of December 31 Total unrecognized tax benefits that, if recognized, would impact the effective tax rate Total amount of interest and penalties recognized in the Consolidated Income Statement Total amount of interest and penalties recognized in the Consolidated Balance Sheet Numerator: Net income attributable to DuPont Preferred dividends Net income available to common stockholders Denominator: Weighted-average number of common shares outstanding – Basic Dilutive effect of the company's employee compensation plans and accelerated share repurchase agreement Weighted average number of common shares outstanding – Diluted Average number of stock options Financial assets Derivatives Available-for-sale securities Financial liabilities Derivatives Financial assets Derivatives Available-for-sale securities Financial liabilities Derivatives Accounts receivable – trade1 Notes receivable – trade1,2 Other3 Finished products Semifinished products Raw materials, stores and supplies Adjustment of inventories to a LIFO basis Buildings Equipment Land Construction 11. GOODWILL AND OTHER INTANGIBLE ASSETS The following table summarizes changes in the carrying amount of goodwill for the years ended December 31, Agriculture & Nutrition Electronics & Communications Performance Chemicals Performance Coatings Performance Materials Safety & Protection Total Intangible assets subject to amortization (Definite-lived)1 Purchased and licensed technology Patents Trademarks Other2 Intangible assets not subject to amortization (Indefinite-lived) Trademarks/tradenames Pioneer germplasm3 Net sales1 Earnings before income taxes Net income DuPont's equity in (losses) earnings of affiliates: Partnerships-pre-tax2 Corporate joint ventures-after-tax Current assets Noncurrent assets Total assets Short-term borrowings1 Other current liabilities Long-term borrowings1 Other long-term liabilities Total liabilities DuPont's investment in affiliates (includes advances) Long-term investments in securities Deferred income taxes (Note 5) Miscellaneous Trade payables Payables to banks Miscellaneous Commercial paper Other loans-various currencies Long-term debt payable within one year Capital lease obligations Compensation and other employee-related costs Deferred revenue Employee benefits (Note 21) Discounts and rebates Derivative instruments Miscellaneous U.S. dollar: U.S. dollar: Industrial development bonds due 2026, 20291 Medium-term notes due 2013 – 20412 4.125% notes due 20103,4 4.75% notes due 2012 5.00% notes due 2013 5.00% notes due 2013 5.875% notes due 2014 4.875% notes due 2014 3.25% notes due 20154 4.75% notes due 2015 1.95% notes due 2016 5.25% notes due 2016 6.00% notes due 20185 5.75% notes due 2019 4.625% notes due 2020 3.625% notes due 2021 6.50% debentures due 2028 5.60% notes due 2036 4.90% notes due 2041 Other loans (average interest rate of 2.0 percent)3 Foreign currency denominated loans: Euro loans (average interest rate of 2.3 percent)3 Other loans (various currencies)3 Less short-term portion of long-term debt Less short-term portion of long-term debt Capital lease obligations Capital lease obligations Total Total 2043. Employee benefits: Employee benefits: Accrued other long-term benefit costs (Note 21) Accrued pension benefit costs (Note 21) Accrued environmental remediation costs Accrued environmental remediation costs Miscellaneous Miscellaneous Consolidated Financial Statements (continued) Obligations for customers and suppliers1: Bank borrowings (terms up to 5 years) Obligations for other affiliated companies2: Bank borrowings (terms up to 1 year) Obligations for equity affiliates2: Bank borrowings (terms up to 2 years) Revenue bonds (terms up to 5 years) Total obligations for customers, suppliers, other affiliated companies, and equity affiliates Obligations for divested subsidiaries3: Conoco (terms up to 16 years) Total obligations for divested subsidiaries At December 31, 2013, DuPont In DuPont denies allegations in these lawsuits and is defending itself vigorously. $1,000 in damages to Monsanto on its claims that the company willfully infringed Monsanto's RE 39,247 patent directed to Roundup® Ready® 1 glyphosate herbicide tolerancesoybean seed technology. court approval. In Remediation activities vary substantially in duration and cost from site to site. These activities, and their associated costs, depend on the mix of unique site characteristics, evolving remediation technologies, diverse regulatory agencies and enforcement policies, as well as the presence or absence of potentially responsible parties. At December 31, 2013 December 31, 2013. Balance January 1, 2008 Issued Balance December 31, 2008 Issued Balance December 31, 2009 Issued Repurchased Retired Balance December 31, 2010 28 percent interest in the Solae, LLC joint venture from Bunge Limited for $447. As the purchase of the remaining interest did not result in a change of control, the difference between the carrying value of the noncontrolling interest of $378 and the consideration paid, net of taxes of $78, was recorded as a $9 increase to additional paid-in capital. 2010 Cumulative translation adjustment Net revaluation and clearance of cash flow hedges to earnings Pension benefits (Note 21) Other benefits (Note 21) Net unrealized gains on securities Other comprehensive income attributable to noncontrolling interest Other comprehensive loss attributable to DuPont 2009 Cumulative translation adjustment Net revaluation and clearance of cash flow hedges to earnings Pension benefits (Note 21) Other benefits (Note 21) Net unrealized gains on securities Other comprehensive loss attributable to noncontrolling interest Other comprehensive loss attributable to DuPont 2008 Cumulative translation adjustment Net revaluation and clearance of cash flow hedges to earnings Pension benefits (Note 21) Other benefits (Note 21) Net unrealized losses on securities Other comprehensive loss attributable to noncontrolling interest Other comprehensive loss attributable to DuPont Cumulative translation adjustment Net revaluation and clearance of cash flow hedges to earnings Net unrealized gain (loss) on securities Pension benefits Net losses Net prior service cost Other benefits Net losses Net prior service benefit Pension coverage for employees of the company's non-U.S. consolidated subsidiaries is provided, to the extent deemed appropriate, through separate plans. Obligations under such plans are funded by depositing funds with trustees, covered by insurance contracts, or remain unfunded. Obligations and Funded Status at December 31, Obligations and Funded Status at December 31, Change in benefit obligation Change in benefit obligation Benefit obligation at beginning of year Benefit obligation at beginning of year Service cost Service cost Interest cost Interest cost Plan participants' contributions Plan participants' contributions Actuarial loss Benefits paid Benefits paid Amendments Amendments Net effects of acquisitions/divestitures Net effects of acquisitions/divestitures Benefit obligation at end of year Benefit obligation at end of year Change in plan assets Change in plan assets Fair value of plan assets at beginning of year Fair value of plan assets at beginning of year Actual gain on plan assets Actual gain on plan assets Employer contributions Employer contributions Plan participants' contributions Plan participants' contributions Benefits paid Benefits paid Net effects of acquisitions/divestitures Net effects of acquisitions/divestitures Fair value of plan assets at end of year Fair value of plan assets at end of year Funded status Funded status U.S. plans with plan assets U.S. plans with plan assets Non-U.S. plans with plan assets Non-U.S. plans with plan assets All other plans All other plans Total Amounts recognized in the Consolidated Balance Sheet consist of: Other assets (Note 13) Other accrued liabilities (Note 16) Other liabilities (Note 18) Net amount recognized Net amount recognized December 31, Net loss Prior service (cost) benefit Projected benefit obligation Accumulated benefit obligation Fair value of plan assets Projected benefit obligation Accumulated benefit obligation Fair value of plan assets Components of net periodic benefit cost (credit) and amounts recognized in other comprehensive income Net periodic benefit (credit) cost Service cost Interest cost Expected return on plan assets Amortization of loss Amortization of prior service cost Curtailment/settlement loss Net periodic benefit (credit) cost Changes in plan assets and benefit obligations recognized in other comprehensive income Net loss (gain) Amortization of loss Prior service cost Amortization of prior service cost Curtailment/settlement loss Total recognized in other comprehensive income Total recognized in net periodic benefit cost and other comprehensive income The estimated pre-tax net loss and prior service cost for the defined benefit pension plans that will be amortized from accumulated other comprehensive loss into net periodic benefit cost during Components of net periodic benefit cost and amounts recognized in other comprehensive income Net periodic benefit cost Service cost Interest cost Amortization of loss Amortization of prior service benefit Net periodic benefit cost Changes in plan assets and benefit obligations recognized in other comprehensive income Net (gain) loss Amortization of loss Prior service cost Amortization of prior service benefit Total recognized in other comprehensive income Total recognized in net periodic benefit cost and other comprehensive income Weighted-average assumptions used to determine benefit obligations at December 31, Discount rate Rate of compensation increase Weighted-average assumptions used to determine net periodic benefit cost for the years ended December 31, Discount rate Expected return on plan assets Rate of compensation increase effect of the company's active management of the plans' assets. For non-U.S. plans, assumptions reflect economic assumptions applicable to each country. Health care cost trend rate assumed for next year Rate to which the cost trend rate is assumed to decline (the ultimate trend rate) Year that the rate reaches the ultimate trend rate Increase (decrease) on total of service and interest cost Increase (decrease) on post-retirement benefit obligation U.S. equity securities Non-U.S. equity securities Fixed income securities Private market securities Real estate Total Cash and cash equivalents U.S. equity securities1 Non-U.S. equity securities Debt – government issued Debt – corporate issued Debt – asset-backed Private market securities Real estate Derivatives – asset position Derivatives – liability position Other Pension trust receivables2 Pension trust payables3 Total Cash and cash equivalents U.S. equity securities1 Non-U.S. equity securities Debt – government issued Debt – corporate issued Debt – asset-backed Private market securities Real estate Derivatives – asset position Derivatives – liability position Other Pension trust receivables2 Pension trust payables3 Total The company's pension plans hold Level 3 assets which are primarily ownership interests in investment partnerships and trusts that own private market securities and real estate. Fair value is generally based on the company's units of ownership and net asset value of the investment entity or the company's share of the investment entity's total equity. The table below presents a rollforward of activity for these assets for the years ended December 31, Beginning balance at December 31, 2008 Realized gain (loss) Change in unrealized gain (loss) Purchases, sales and settlements Transfers out of Level 3 Ending balance at December 31, 2009 Realized gain (loss) Change in unrealized gain (loss) Purchases, sales and settlements Transfers out of Level 3 Ending balance at December 31, 2010 Pension plans Other long-term employee benefit plans 2011 2012 2013 2014 2015 Years 2016-2020 Dividend yield Volatility Risk-free interest rate Expected life (years) Outstanding, December 31, 2009 Granted Exercised Forfeited Cancelled Outstanding, December 31, 20101 Exercisable, December 31, 2010 Nonvested, December 31, 2009 Granted Vested Forfeited Nonvested, December 31, 2010 company's derivative instruments were as follows: The company also uses foreign currency exchange contracts to offset a portion of the company's exposure to certain foreign currency-denominated revenues so that gains and losses on these contracts offset changes in the USD value of the related foreign currency-denominated revenues. The objective of the hedge program is to reduce earnings and cash flow volatility related to changes in foreign currency exchange rates. The company enters into over-the-counter and exchange-traded derivative commodity instruments to hedge the commodity price risk associated with energy feedstock and agricultural commodity exposures. next two-year period. Cash flow hedge results are reclassified into earnings during the same period in which the related exposure impacts earnings. Reclassifications are made sooner if it appears that a forecasted transaction will not materialize. The following table summarizes the after-tax effect of cash flow hedges on accumulated other comprehensive income (loss) for the Beginning balance Additions and revaluations of derivatives designated as cash flow hedges Clearance of hedge results to earnings Ending balance Portion of ending balance expected to be reclassified into earnings over the next twelve months $(36). soybean meal. Derivatives designated as hedging instruments Interest rate swaps Interest rate swaps Foreign currency contracts Energy feedstocks Energy feedstocks Total derivatives designated as hedging instruments Derivatives not designated as hedging instruments Foreign currency contracts Total derivatives not designated as hedging instruments Total derivatives Interest rate swaps Total 2010 Treasury rate contracts Foreign currency contracts Agricultural feedstocks Energy feedstocks Total 2009 Treasury rate contracts Foreign currency contracts Agricultural feedstocks Energy feedstocks Total Foreign currency contracts Agricultural feedstocks Total United States EMEA3 Belgium France Germany Italy Luxembourg Russia Spain The Netherlands United Kingdom Other Total EMEA Asia Pacific Australia China/Hong Kong India Japan Korea Singapore Taiwan Thailand Other Total Asia Pacific Latin America Argentina Brazil Mexico Other Total Latin America Canada Total 2010 Segment sales Less transfers Net sales Pre-tax operating income (loss) Depreciation and amortization Equity in earnings of affiliates Segment net assets Affiliate net assets Purchases of property, plant and equipment 2009 Segment sales Less transfers Net sales Pre-tax operating income (loss) Depreciation and amortization Equity in earnings of affiliates Segment net assets Affiliate net assets Purchases of property, plant and equipment 2008 Segment sales Less transfers Net sales Pre-tax operating income (loss) Depreciation and amortization Equity in earnings of affiliates Segment net assets Affiliate net assets Purchases of property, plant and equipment Total segment PTOI Net exchange (losses) gains, including affiliates Corporate expenses and net interest Income before income taxes Total segment net assets Corporate assets1 Liabilities included in net assets Total assets 2010 Depreciation and amortization Equity in earnings of affiliates Affiliate net assets Purchases of property, plant and equipment 2009 Depreciation and amortization Equity in earnings of affiliates Affiliate net assets Purchases of property, plant and equipment 2008 Depreciation and amortization Equity in earnings of affiliates Affiliate net assets Purchases of property, plant and equipment 2010 Agriculture & Nutrition1 Electronics & Communications2 Performance Chemicals2 Performance Coatings2 Performance Materials2 Safety & Protection2 Other2 2009 Agriculture & Nutrition1 Electronics & Communications1,2 Performance Chemicals1,2 Performance Coatings1,2 Performance Materials1,2,3 Safety & Protection1,2 Pharmaceuticals4 Other1,2 2008 Agriculture & Nutrition1,2 Electronics & Communications1 Performance Chemicals1,2 Performance Coatings1 Performance Materials1,2 Safety & Protection1,2 Other1,3 2010 Net sales Cost of goods sold and other expenses1 Income before income taxes Net income Basic earnings per share of common stock2 Diluted earnings per share of common stock2 2009 Net sales Cost of goods sold and other expenses1 Income before income taxes Net income Basic earnings per share of common stock2 Diluted earnings per share of common stock2 E. I. du Pont de Nemours and Company1916 and 2421 to the Consolidated Financial Statements.more significantnumber of sites are listedused by their applicable segment(s) by major geographic area around the world is as set forth below:follows: Number of Sites Agriculture Electronics & Communications Industrial Biosciences Nutrition & Health Performance Chemicals Performance Materials Safety & Protection Asia Pacific 22 10 1 9 6 19 6 73 EMEA 48 3 7 19 4 11 4 96 Latin America 20 — 1 7 1 1 — 30 U.S. & Canada 57 18 7 12 29 19 11 153 147 31 16 47 40 50 21 352 Agriculture & Nutrition1.Asia PacificShanghai, China; Savli, IndiaEuropeIeper, Belgium; Aarhus, Denmark; Cernay, France; Szarvas, Hungary; Asturias, SpainLatin AmericaBarra Mansa, Brazil; Camacari, Brazil; Esteio, Brazil; Lerma, MexicoU.S.Mobile, AL; Valdosta, GA; Johnston, IA; El Paso, IL; Pryor, OK; Manati, Puerto Rico; Memphis, TN; LaPorte, TXElectronics & CommunicationsAsia PacificDongguan, China; Shenzhen, China; Hitachi, Japan; Tokai, Japan; Hsinchu, Taiwan; Taoyuan, TaiwanEuropeNeu Isenburg, Germany; Bristol, UK; Ruabon, UKU.S.Hayward, CA; Santa Barbara, CA; Torrance, CA; Fort Madison, IA; Louisville, KY; Fayetteville, NC; Research Triangle Park, NC; Parlin, NJ; Buffalo, NY; Rochester, NY; Circleville, OH; Dayton, OH; Towanda, PA; Manati, Puerto Rico; Bayport, TX; Logan, UTPerformance ChemicalsAsia PacificChangshu, China; Shenzhen, China; Madurai, India; Chiba, Japan; Shimizu, Japan; Kuan Yin, TaiwanEuropeMechelen, Belgium; Villers-St. Paul, France; Dordrecht, The Netherlands; Sudbury, UKLatin AmericaAltamira, MexicoU.S.El Dorado, AR; Edge Moor, DE; Red Lion, DE; Starke, FL; Louisville, KY; Wurtland, KY; Burnside, LA; La Place, LA; De Lisle, MS; Pascagoula, MS; Fayetteville, NC; Chambers Works, NJ; Deepwater, NJ; Linden, NJ; Parlin, NJ; Buffalo, NY; Niagara Falls, NY; Circleville, OH; Fort Hill, OH; Towanda, PA; North Kingstown, RI; Memphis, TN; New Johnsonville, TN; Baytown, TX; Beaumont, TX; Corpus Christi, TX; El Paso, TX; LaPorte, TX; James River, VA; Belle, WV; Parkersburg, WVPerformance CoatingsAsia PacificChangchun, China; Jiading, ChinaEuropeMechelen, Belgium; Wuppertal, GermanyLatin AmericaSao Paulo, BrazilU.S.Mount Clemens, MI; Houston, TX; Front Royal, VASites that are used by multiple segments are included more than once in the figures above.Part IITEM 2. PROPERTIES,continuedPerformance MaterialsAsia PacificBeijing, China; Shenzhen, China; Wuxi, China; Zhangjigang, China; Madurai, India; Savli, India; Chiba, Japan; Gifu, Japan; Ibaraki, Japan; Otake, Japan; Utsunomiya, Japan; Ulsan, Korea; SingaporeCanadaMaitland, Canada; Sarnia, CanadaEuropeAntwerp, Belgium; Mechelen, Belgium; Uentrop, Germany; Luxembourg; Dordrecht, The Netherlands; Landgraaf, The Netherlands; Dumfries, UKLatin AmericaBerazategui, ArgentinaU.S.Newark, DE; La Place, LA; Fayetteville, NC; Deepwater, NJ; Ashland, OH; Circleville, OH; Cleveland, OH; Upper Sandusky, OH; Copper River, SC; Chattanooga, TN; La Porte, TX; Orange, TX; Victoria, TX; Hopewell, VA; Richmond, VA; Parkersburg, WVSafety & ProtectionAsia PacificGuangzhou, China; Ulsan, KoreaCanadaThetford Mines, CanadaEuropeLuxembourg; Maydown, UK; Asturias, SpainU.S.Martinez, CA; Leawood, KS; Parsippany, NJ; Buffalo, NY; Cooper River, SC; Richmond, VA; Virgina Beach, VASales as a percent ofThe company believes it has sufficient production capacity were 81, 70 and 78 percentto meet demand in 2010, 2009 and 2008, respectively.2014. Properties are primarily owned by the company; however, certain properties are leased. No title examination of the properties has been made for the purpose of this report and certain properties are shared with other tenants under long-term leases.1916 to the Consolidated Financial Statements.LitigationImprelis1916 to the Consolidated Financial Statements under the heading PFOA.U.S. Environmental Protection Agency (EPA) is investigating threealleged non-compliance relates to chemical releases at DuPont's Belle facility in West Virginiabetween 2006 and 2010, including one release which occurred in January 2010. One of the releases involved the death of a DuPont employee after exposure to phosgene.January 2010, EPA and the U.S. Attorney's Office for New Jersey, informed DuPont that the government was initiatinginitiated an enforcement action arising from alleged environmental non-compliance at the Chambers Works facility. The government allegesalleging that the facility violated recordkeeping requirements of certain provisions of the Clean Air ActCAA and the Federal Clean Air Act Regulations (FCAR) governing Leak Detection and Reporting (LDAR) and that it failed to report emissions of a compound from Chambers Works' waste water treatment facility under the Emergency Planning and Community Right-to-Know Act.EPCRA. The alleged non-compliance was identified by EPA in 2007 and 2009 following separate environmental audits. DuPont is in settlement negotiations with EPA and DOJ.DepartmentLaPorte facility in January 2008. DuPont, EPA and DOJ began discussions in the fall 2011 relating to the management of Justice (DOJ).Chambers Works Plant, Deepwater, New JerseyOn September 29, 2010, DuPont received a draft Administrative Consent Order fromcertain materials in the New Jersey Department of Environmental Protection (NJDEP) seeking a penalty for alleged violations of New Jerseyfacility's waste water treatment system, hazardous waste regulations dating backmanagement, flare and air emissions. These negotiations continue.April 2009 based on a facility-widemultimedia inspection that EPA conducted at the Sabine facility in March 2009. The discussions involve the management of materials in the facility's waste water treatment system, hazardous waste audit conductedmanagement, flare and air emissions.May 2010. DuPont is in negotiations with NJDEP.Chambers Works Plant, Deepwater, New JerseyDOJ concerning allegationsDOJ.non-complianceaudit conducted in 2007 and the submission of responses to an information request received in 2009. DuPont is in settlement negotiations with the EPA and DOJ.Chambers Works facility. The allegations arose from an ongoing investigation into DuPont's management of hazardous wastecompany's surface mine in rail cars.TSCA Voluntary AuditDuPont voluntarily undertook a self-audit concerning reporting of inhalation studies pursuantStarke, Florida is included in Exhibit 95 to Toxic Substances Control Act (TSCA) section 8(e). DuPont voluntarily reported the results of that audit to EPA. The EPA has reviewed the information submitted under this self-audit and has indicated potential violations exist with respect to some of the submitted studies. In December 2010, the agreement to settle this matter for a penalty of $3.3 million was approved by EPA's Environmental Appeals Board.81,00070,000 at January 31, 2011.20102013 and 20092012 are shown below. Market Prices Market Prices 2010 High Low Per Share
Dividend
Declared $ 50.17 $ 44.21 $ 0.41 45.87 33.73 0.41 41.45 33.66 0.41 39.04 31.88 0.41 2013 High Low $ 35.62 $ 30.06 $ 0.41 $ 65.00 $ 56.46 $ 0.45 34.59 23.91 0.41 60.86 52.04 0.45 30.23 21.62 0.41 57.25 48.21 0.45 27.98 16.05 0.41 50.20 45.11 0.43 2012 Fourth Quarter $ 50.96 $ 41.67 $ 0.43 Third Quarter 52.33 46.15 0.43 Second Quarter 53.98 46.44 0.43 First Quarter 53.95 45.84 0.41 In June 2001, the Board of Directors authorized up to $2 billion for repurchasesstock. During the fourth quarter 2010, the company paid $250 million to purchase and retire 5.4 million shares at an average price of $46.34 per share under this plan. As of December 31, 2010, cumulative purchases of common stock under this plan are 25.9 million shares at a cost of $1.2 billion. There is no expiration date on the current authorization and no determination has been made by the company to suspend or cancel purchases under the plan.The following table summarizes information with respect to the company's purchases of its common stock during the fourth quarter 2010: Month Total Number
of Shares
Purchased Average Price
Paid per Share Total Number of
Shares Purchased
as Part of Publicly
Announced
Program Approximate Value
of Shares that May
Yet Be Purchased
Under the Program
(Dollars in millions) 5,395,024 $ 46.34 5,395,024 $ 788 5,395,024 5,395,024 a self-constructed peer group of companies. The peer group companies for the year ended December 31, 2010 are 3M Company; Abbott Laboratories; Air Products & Chemicals, Inc.; Baxter International Inc.; The Boeing Company; Caterpillar Inc.; Eastman Kodak Company; Emerson Electric Co.; Hewlett-Packard Company; Honeywell International Inc.; Ingersoll-Rand Company Limited; Johnson & Johnson; Johnson Controls, Inc.; Kimberly-Clark Corporation; Merck & Co. Inc.; Monsanto Company; Motorola Inc.; The Procter & Gamble Company; and United Technologies Corporation.Stock Performance Graph
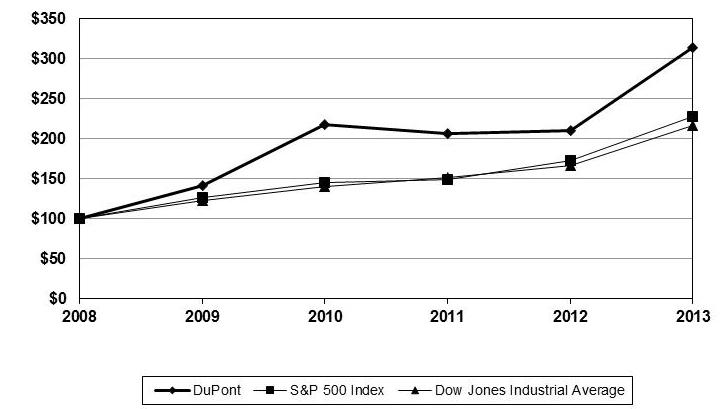
12/31/2005 12/31/2006 12/31/2007 12/31/2008 12/31/2009 12/31/2010 12/31/2008 12/31/2009 12/31/2010 12/31/2011 12/31/2012 12/31/2013 $ 100 $ 119 $ 111 $ 66 $ 94 $ 145 $ 100 $ 141 $ 218 $ 207 $ 211 $ 314 $ 100 $ 116 $ 122 $ 77 $ 97 $ 112 100 126 146 149 172 228 $ 100 $ 119 $ 140 $ 103 $ 124 $ 132 Dow Jones Industrial Average 100 123 140 152 167 217 valuevalues of DuPont Common Stock,common stock, the S&P 500 Stock Index and the peer group of companies wasDow Jones Industrial Average were each $100 on December 31, 20052008 and that all dividends were reinvested. The peer group is weighted by market capitalization. 2010 2009 2008 2007 2006 $ 31,505 $ 26,109 $ 30,529 $ 29,378 $ 27,421 $ 3,711 $ 2,184 $ 2,391 $ 3,743 $ 3,329 $ 659 $ 415 $ 381 $ 748 $ 196 $ 3,031 $ 1,755 $ 2,007 $ 2,988 $ 3,148 $ 3.32 $ 1.93 $ 2.21 $ 3.25 $ 3.41 $ 3.28 $ 1.92 $ 2.20 $ 3.22 $ 3.38 $ 9,670 $ 7,898 $ 5,601 $ 4,619 $ 4,930 $ 40,410 $ 38,185 $ 36,209 $ 34,131 $ 31,777 $ 133 $ 1,506 $ 2,012 $ 1,370 $ 1,517 $ 10,137 $ 9,528 $ 7,638 $ 5,955 $ 6,013 $ 9,743 $ 7,651 $ 7,552 $ 11,578 $ 9,863 $ 1,608 $ 1,432 $ 2,033 $ 1,698 $ 1,563 $ 1,204 $ 1,251 $ 1,169 $ 1,158 $ 1,157 $ 1,651 $ 1,378 $ 1,393 $ 1,338 $ 1,302
outstanding (millions) 909 904 902 917 921 922 909 907 925 929 $ 1.64 $ 1.64 $ 1.64 $ 1.52 $ 1.48 60 58 60 60 59 $ 49.88 $ 33.67 $ 25.30 $ 44.09 $ 48.71 81 85 88 92 84 (Dollars in millions, except per share) 2013 2012 2011 2010 2009 Net sales $ 35,734 $ 34,812 $ 33,681 $ 27,700 $ 22,681 Employee separation / asset related charges, net $ 114 $ 493 $ 53 $ (40 ) $ 195 Income from continuing operations before income taxes $ 3,489 $ 3,088 $ 3,879 $ 3,259 $ 1,870 Provision for income taxes on continuing operations $ 626 $ 616 $ 647 $ 518 $ 298 Net income attributable to DuPont $ 4,848 $ 2,755 $ 3,559 $ 3,022 $ 1,690 Basic earnings per share of common stock from continuing operations $ 3.07 $ 2.61 $ 3.43 $ 2.98 $ 1.71 Diluted earnings per share of common stock from continuing operations $ 3.04 $ 2.59 $ 3.38 $ 2.94 $ 1.70 $ 11,017 $ 7,765 $ 7,030 $ 9,733 $ 7,973 $ 51,499 $ 49,859 $ 48,643 $ 40,470 $ 38,256 Borrowings and capital lease obligations Short-term $ 1,721 $ 1,275 $ 817 $ 133 $ 1,506 Long-term $ 10,741 $ 10,465 $ 11,736 $ 10,137 $ 9,528 Total equity $ 16,286 $ 10,299 $ 9,208 $ 9,800 $ 7,719 For the year $ 1,940 $ 1,890 $ 1,910 $ 1,608 $ 1,432 Depreciation $ 1,280 $ 1,319 $ 1,199 $ 1,118 $ 1,144 Research and development expense $ 2,153 $ 2,123 $ 1,960 $ 1,650 $ 1,370 Average number of common shares outstanding (millions) Basic 926 933 928 909 904 Diluted 933 942 941 922 909 Dividends per common share $ 1.78 $ 1.70 $ 1.64 $ 1.64 $ 1.64 At year-end Employees (thousands) 64 70 70 60 58 Closing stock price $ 64.97 $ 44.98 $ 45.78 $ 49.88 $ 33.67 Common stockholders of record (thousands) 70 74 78 81 85 Information has been restated to reflect the impact of discontinued operations and change in accounting principle, as applicable. See Note 1, Basis of Presentation and Inventories, to the Consolidated Financial Statements for further information. At December 31, 2012, working capital included approximately $2.0 billion of net assets related to the Performance Coatings business, of which approximately $1.3 billion was previously considered to be noncurrent and was classified as held for sale as of December 31, 2012. See Note 2 to the Consolidated Financial Statements for further information. During 2011, the company acquired approximately $8.8 billion of assets in connection with the Danisco acquisition. "plans," "expects," "will," "anticipates," "intends," "projects," "estimates"“plans,” “expects,” “will,” “anticipates,” “believes,” “intends,” “projects,” “estimates” or other words of similar meaning. All statements that address expectations or projections about the future, including statements about the company's strategy for growth, product development, regulatory approval, market position, anticipated benefits of recent acquisitions, outcome of contingencies, such as litigation and environmental matters, expenditures and financial results, are forward-looking statements.events. The company cannot guarantee that these assumptions and expectations areevents which may not be accurate or will be realized. Forward-looking statements also involve risks and uncertainties, many of which are beyond the company's control. Some of the important factors that could cause the company's actual results to differ materially from those projected in any such forward-looking statements are:6.OverviewVisionPurpose DuPont's vision is to beDuPont’s businesses serve markets where the world's most dynamic science company, creating sustainable solutions essentialincreasing demand for a better, safermore and healthier life for people everywhere. food, renewably sourced materials and fuels, and advanced industrial materials is creating substantial growth opportunities. The company’s unique combination of sciences, proven R&D engine, broad global reach, and deep market penetration are distinctive competitive advantages that position the company to continue capitalizing on this enormous potential.growing shareholdermaintain a strong balance sheet and societal value while reducing its environmental footprint over the long term.StrategyResults The company's strategy for growth isIncome from continuing operations after taxes increased 16 percent to use science-based solutions to address four fundamental global trends –Increasing Food Production,Decreasing Dependency on Fossil Fuels,Protecting People and the Environment, andGrowth in Developing Markets. The company believes it best serves its shareholders$2.9 billion. Net sales of $35.7 billion increased 3 percent driven by increasing its global presence in meeting challenges, including increasing food production, increasing renewable sources for energy and raw materials, and providing greater safety and protection for people and the environment. For these strategic areas, the company has set differentiated targets for growth and future funding for capital expenditures, research and development, and marketing programs.Acquisition of Danisco The financial goals discussed below exclude the impact of the intended acquisition of Danisco. The acquisition is aligned with the company's growth strategy and complimentary to the company's existing businesses and research and development pipelines. The transaction is expected to be cash and earnings accretive in 2012, the first full year of the combined entity. Upon completion, the transaction would establish DuPont as a clear leader in industrial biotechnology with science-intensive innovations that address global challenges in food production and reduced fossil fuel consumption.Goals By aggressively pursuing top line growth opportunities in key markets and improving productivity, the company met or surpassed its 2010 financial goals for sales growth, earnings per share, cash flow and working capital reductions. Consistent with its strong 2010 performance, the company announced a new five-year plan which includes compound annual growth targets of 75 percent for sales and 12higher volume. Sales grew 6 percent for earnings per share from 2010 through 2015. Sales in developing markets, which include China, India, and the countries located in Latin America, Eastern and Central Europe, Middle East, Africa, and Southeast Asia, are targetedAsia. Sales of new products introduced in the last four years also contributed to make up 36 percent of the company's sales by 2015, a 4 percentage point increase from 2010. Additionally, the company continues to execute its three-year 2010-2012 plan announced in 2009, which includes $1 billion fixed cost productivity actions and $1 billion working capital productivity programs. The company also reaffirmed its commitment to maintain a strong balance sheet and to return excess cash to shareholders unless there is a compelling opportunity to invest for growth. 2010 2009 2008 2013 2012 2011 $ 31,505 $ 26,109 $ 30,529 $ 35,734 $ 34,812 $ 33,681 20102013 versus 20092012 ConsolidatedThe table below shows a regional breakdown of 2013 consolidated net sales for 2010 were $31.5 billion, up 21 percent. This increase reflects 17based on location of customers and percentage variances from prior year: Percent Change Due to: (Dollars in billions) Volume Portfolio / Other Worldwide $ 35.7 3 (1 ) (1 ) 5 — U.S. & Canada 14.8 4 1 — 3 — EMEA 8.4 4 (2 ) 1 4 1 Asia Pacific 7.7 (3 ) (6 ) (3 ) 6 — Latin America 4.8 6 — (3 ) 9 — higher sales volume,reflecting a 5 percent increase in local sellingworldwide sales volume with growth in all segments. Local prices were 1 percent lower principally due to a 12 percent decline in Performance Chemicals prices and a 1 percent net reduction from portfolio changes. Sales volume was higher across all segments with volume improving 13 percent in the United Statespass through of lower precious metals prices for Electronics & Communications. Negative currency impact reflects a weaker Brazilian Real and 19 percent outside the United States.Indian Rupee, partly offset by a stronger Euro. Sales in developing markets of $10.2$11.9 billion improved 277 percent on 10 percent higher volume, and the percentage of total company sales in these markets increased to 33 percent from 2009,32 percent in 2012. Percent Change Due to: (Dollars in billions) Volume Portfolio / Other Worldwide $ 34.8 3 4 (2 ) (2 ) 3 U.S. & Canada 14.2 8 6 — — 2 EMEA 8.1 (1 ) 3 (6 ) (4 ) 6 Asia Pacific 8.0 (4 ) (1 ) (1 ) (5 ) 3 Latin America 4.5 11 9 (5 ) 5 2 percent.percent in 2011.(Dollars in millions) 2013 2012 2011 OTHER INCOME, NET $ 410 $ 498 $ 742 table below shows$88 million decrease was largely attributable to the absence of a regional breakdown$122 million gain related to the 2012 sale of 2010 consolidatedthe company's interest in an equity method investment, the absence of a $117 million gain related to the 2012 sale of a business within the Agriculture segment, partially offset by $87 million lower net pre-tax exchange losses, $27 million increase in interest income, and a $26 million re-measurement gain on an equity investment.(Dollars in millions) 2013 2012 2011 COST OF GOODS SOLD $ 22,548 $ 21,538 $ 21,264 As a percent of net sales 63 % 62 % 63 % based on location of customers and percentage variances from prior year: Percent Change Due to:
2010
Net Sales
Percent
Change vs.
2009
Local
Price
Currency
Effect Volume Portfolio $ 31.5 21 5 - 17 (1 ) 11.5 17 5 - 13 (1 ) 8.1 14 4 (3 ) 13 - 7.3 40 6 2 33 (1 ) 3.7 17 4 2 13 (2 ) 0.9 20 3 9 9 (1 ) 2009 versus 2008 Consolidated net sales for 2009 were $26.1 billion, down 14 percent. This reflects 12was 63 percent, lower volume, a 1 percent increase from 2012. The increase in localCOGS as a percentage of net sales principally reflects the impact of increased costs for raw materials and agriculture inputs versus lower selling prices, and 3coupled with adverse currency impact.unfavorable currency exchange. The full year worldwideto $21.5 billion. COGS as a percentage of net sales volume decline reflects decreases in every region for the first 9 months of the year, partly offset by year over year volumewas 62 percent, a 1 percent decrease from 2011, principally reflecting selling price increases in certain markets during the fourth quarter. Sales in developing marketsexcess of $8 billion declined 9 percent from 2008, while the percentage of total company sales in these markets increased to 31 percent.raw material cost increases.(Dollars in millions) 2013 2012 2011 OTHER OPERATING CHARGES $ 3,838 $ 4,077 $ 3,510 As a percent of net sales 11 % 12 % 10 % The table below shows a regional breakdown of 2009 consolidated net sales based on location of customers and percentage variances from 2008: Percent Change Due to:
2009
Net Sales
Percent
Change vs.
2008
Local
Price
Currency
Effect Volume Portfolio $ 26.1 (14 ) 1 (3 ) (12 ) - 9.8 (11 ) 2 - (11 ) (2 ) 7.2 (25 ) 1 (8 ) (18 ) - 5.2 (5 ) (1 ) - (4 ) - 3.2 (11 ) 2 (4 ) (9 ) - 0.7 (16 ) 5 (8 ) (13 ) - 2010 2009 2008 $ 1,228 $ 1,219 $ 1,307 20102013 versus 20092012 Other income, net, was essentially flat comparedoperating charges decreased 6 percent to 2009, despite a decrease of $549 million of Cozaar®/Hyzaar® income$3.8 billion, principally due to the expirationlower Imprelis® herbicide claims, net of certain patents. Offsetting the reduction of Cozaar®/Hyzaar® income was a decrease in net pre-tax exchange losses of $192 million combined with higher income from equity affiliates of $93 million, an increase in net gains on sales of assets of $64 million, a benefit of $59 million in 2010insurance recoveries, and other litigation charges. See Note 16 for additional information related to accrued interest associated with settlementsthe Imprelis® matter.income tax contingencies, ancharges related to the acquisition of Danisco . See Note 16 for additional information related to the Imprelis® matter.(Dollars in millions) 2013 2012 2011 SELLING, GENERAL AND ADMINISTRATIVE EXPENSES $ 3,554 $ 3,527 $ 3,310 As a percent of net sales 10 % 10 % 10 % insurance recoveriesthe Agriculture segment, partially offset by cost savings in administrative functions as a result of $41the 2012 restructuring program.$31full year of selling expense of acquired companies.(Dollars in millions) 2013 2012 2011 RESEARCH AND DEVELOPMENT EXPENSE $ 2,153 $ 2,123 $ 1,960 As a percent of net sales 6 % 6 % 6 % combined benefit from an acquisitionincrease was primarily attributable to continued growth investments in the Agriculture segment and an early termination of a supply agreement.increases in pre-commercial investment.20092012 versus 20082011 Other income, net, decreased $88The $163 million versus 2008. The decreaseincrease was primarily attributable to a $47 million reductionfull year of research and development expense from acquired companies and continued growth investments in interest income due to lower interest rates in 2009 partiallythe Agriculture segment offset by higher interest from increased cash and customer deferred receivables, and the absence of a $51$50 million favorable litigation settlementcharge for a payment related to a Pioneer licensing agreement in 2008. 2011.(Dollars in millions) 2013 2012 2011 INTEREST EXPENSE $ 448 $ 464 $ 447 an increase of $23a lower average borrowing rate.(Dollars in millions) 2013 2012 2011 EMPLOYEE SEPARATION/ASSET RELATED CHARGES, NET $ 114 $ 493 $ 53 sales.Additional informationrelated charges, net consisted of a a net $15 million restructuring benefit and a $129 million asset impairment charge discussed below. The net $15 million restructuring benefit consisted of a $24 million benefit associated with prior year restructuring programs offset by a $9 million charge resulting from restructuring actions related to a joint venture within the company's other income, net is included in Note 2Performance Materials segment. The majority of the $24 million benefit was due to the Consolidated Financial Statements. 2010 2009 2008 $ 23,146 $ 19,708 $ 23,548 73 % 75 % 77 % 2010 versus 2009 Costachievement of goods sold and other operating charges (COGS) forwork force reductions through non-severance programs associated with the year 2010 was $23.1 billion, versus $19.7 billion in 2009, an increase of 17 percent. COGS was 73 percent of net sales, a 2 percentage point decrease from prior year. The improvement principally reflects increased manufacturing utilization and higher selling prices that more than offset increases in raw material costs. Higher selling prices increased sales $1.3 billion, while raw material, energy and freight costs, adjusted for volume and currency, were up 6 percent, or $0.7 billion.2009 versus 2008 COGS for the year 2009 was $19.7 billion, versus $23.5 billion in 2008, a decrease of 16 percent. COGS was 75 percent of net sales for 2009 versus 77 percent for the year 2008. 2 percentage point decrease principally reflects a $1.1 billion decrease in the combined costs for raw materials, energy and freight and the absence of a $227 million charge for hurricane-related cleanup and repair in 2008, partially offset by significantly lower capacity utilization and an unfavorable currency impact. 2010 2009 2008 $ 3,669 $ 3,440 $ 3,593 12 % 13 % 12 % 2010 versus 2009 Selling, general and administrative expenses (SG&A) increased $229$493 million in 2010 as compared to 2009. The 2010 increase was due to higher selling expenses, primarilycharges recorded during 2012 in the Agriculture & Nutrition segment as a resultemployee separation / asset related charges, net consisted of increased global commissions and selling and marketing investments$234 million in charges related to the company's seed products,2012 restructuring program, a $16 million net reduction in the estimated costs associated with 2011 and higher non-cash pension expenses.2009 versus 2008 SG&A decreased $153prior years restructuring programs, and $275 million in 2009asset impairment charges, as compareddiscussed below.2008.increase productivity, enhance competitiveness and accelerate growth. The 2009 decrease was principally dueplan is designed to stricteliminate corporate costs previously allocated to the Performance Coatings business as well as utilize additional cost-cutting actions to improve competitiveness. As a result, pre-tax charges of $234 million were recorded in employee separation / asset related charges, net. The 2012 restructuring program charges consist of $157 million of employee separation costs, $8 million of other non-personnel charges, and $69 million of asset related charges, which includes $30 million of asset impairments and $39 million of asset shut downs.controlssavings of more than $300 million in 2013, and was partially offset by higher SG&Ais expected to increase to approximately $450 million per year in subsequent years.Agriculture & Nutrition segment asU.S. and Europe.resultnet reduction of increased global commissions and selling and marketing investments related to the company's seed products. 2010 2009 2008 $ 1,651 $ 1,378 $ 1,393 5 % 5 % 5 % 2010 versus 2009 Research and development expense (R&D) increased $273$15 million in 2010 as compared to 2009 due to continued growth investment alignedthe estimated costs associated with the company's global trends, including resources to support agriculture productivity, alternative fuels and energy efficient materials, and safety and protection. In addition, R&D increased due to higher non-cash pension expenses and a $50 million charge for an upfront payment related to a Pioneer licensing agreement for corn seed trait technology. See Pioneer business discussion beginning on page 26 for additional information.2009 versus 2008 R&D was down in 2009 versus 2008, excluding the Agriculture & Nutrition segment, due to strict cost controls. Higher R&D expense in the Agriculture & Nutrition segment in 2009 related to accelerated biotechnology trait research and development activity. 2010 2009 2008 $ 590 $ 408 $ 376 Interest expense increased $182 million in 2010 compared to 2009. The increase in interest expense2011 restructuring program. This net reduction was primarily due to the $179 pre-tax charge on the early extinguishment of debt in the fourth quarter 2010. The $32 increase in 2009 compared to 2008 was due to higher average borrowings, partially offset by slightlyworkforce reductions through non-severance programs and lower average interest rates. (Dollars in millions) 2013 (Charges) and Credits 2012 (Charges) and Credits 2011 (Charges) and Credits Agriculture $ 1 $ (11 ) $ — Electronics & Communications (131 ) (159 ) — Industrial Biosciences 1 (3 ) (9 ) Nutrition & Health 6 (49 ) (14 ) Performance Chemicals (2 ) (36 ) — Performance Materials (6 ) (104 ) (2 ) Safety & Protection 4 (58 ) — Other 5 11 (28 ) Corporate expenses 8 (84 ) — Total (Charges) Credits $ (114 ) $ (493 ) $ (53 ) 2010 2009 2008 2013 2012 2011 $ (34 )1 $ 210 2 $ 535 PROVISION FOR INCOME TAXES ON CONTINUING OPERATIONS $ 626 $ 616 $ 647 Effective income tax rate 17.9 % 19.9 % 16.7 % 1Represents a $34 million net reduction in the estimated costs for the 2008 and 2009 restructuring programs. See below for further details on these programs.2Represents a charge of $340 million for the 2009 restructuring program and a $130 million net reduction in the estimated costs for the 2008 and 2009 restructuring programs. See below for further details on these programs.2009 Restructuring ProgramIn second quarter 2009, in response to the global economic recession, the company committed to an initiative to address the steep and extended downturn in motor vehicle and construction markets, and the extension of the downturn into industrial markets. The plan was designed to restructure asset and fixed cost bases in order to improve long-term competitiveness, simplify business processes, and maximize pre-tax operating income. The plan included the elimination of about 2,000 positions by severance principally located in the U.S. As a result, a charge of $340 million was recorded in employee separation/asset related charges, net which pertains to the following financial statement line items: COGS – 60 percent, SG&A – 30 percent, and R&D – 10 percent. This charge included $212 million of severance and related benefits costs, $24 million of other non-personnel charges and $104 million of asset-related charges, including $77 million for asset shut downs and write-offs, $11 million for asset impairments and $16 million for accelerated depreciation.In the fourth quarter 2009, the company recorded a $30 million net reduction in the estimated costs associated with the 2009 restructuring program. Additionally, the company recorded a $20 million net reduction in the estimated costs associated with the 2009 restructuring program in the fourth quarter 2010. These reductions primarily related to lower than estimated individual severance costs and work force reductions through non-severance programs.The actions related to the 2009 restructuring program were substantially completed by the end of 2010 with payments continuing into 2011, primarily in Europe.2008 Restructuring ProgramDuring 2008, in response to the challenging economic environment, the company initiated a global restructuring program to reduce costs and improve profitability across its businesses. The 2008 restructuring program included the elimination of approximately 2,500 positions principally located in Western Europe and the U.S. primarily supporting the motor vehicle and construction markets.In 2008, the company recorded a charge of $535 million, which included $287 million related to employee severance costs and $248 million attributable to asset shut-downs, asset impairments and other non-personnel charges.In 2009, the company recorded a $100 million net reduction in the estimated costs associated with the 2008 restructuring program. Additionally, the company recorded a $14 million net reduction in the estimated costs associated with the 2008 restructuring program in the fourth quarter 2010. These reductions primarily related to lower than estimated individual severance costs and workforce reductions through non-severance programs.The program and payments related to the 2008 restructuring program were substantially completed by the end of 2010.Additional details related to these programs are contained in the individual segment reviews and in Note 4 to the Consolidated Financial Statements.Part IIITEM 7. MANAGEMENT'S DISCUSSION AND ANALYSIS OF FINANCIAL CONDITION AND RESULTS OF OPERATIONS,continued 2010 2009 2008 $ 659 $ 415 $ 381 17.8 % 19.0 % 15.9 % 2010,2013, the company recorded a tax provision on continuing operations of $659 million, reflecting an increase from 2009, largely due to an increase in pre-tax earnings and the impact associated with the company's policy of hedging the foreign currency-denominated monetary assets and liabilities of its operations. These are partially offset by net tax benefits of $49 million related to the adjustment of income tax accruals associated with settlements of prior year tax contingencies and $39 million for reversal of tax valuation allowance related to the net deferred tax assets of a foreign subsidiary. The decrease in the 2010 effective tax rate compared to 2009 was primarily due to favorable geographic mix of pre-tax earnings in low tax rate jurisdictions and the net tax benefits noted above.In 2009, the company recorded a tax provision of $415$626 million, reflecting a marginal increase from 2008.2012. The increasedecrease in the 20092013 effective tax rate compared to 20082012 was primarily due to geographic mix of earnings.company's current estimate ofincrease in the 20112012 effective income tax rate is about 20-21 percent, excludingcompared to 2011 was primarily due to geographic mix of earnings, in addition to benefits associated with certain U.S. business tax effects of exchange gains and losses which cannot be reasonably estimated at this time.56 to the Consolidated Financial Statements for additional details related to the provision for income taxes on continuing operations, as well as items that significantly impact the company's effective income tax rate. 2010 2009 2008 2013 2012 2011 $ 3,031 $ 1,755 $ 2,007 INCOME FROM CONTINUING OPERATIONS AFTER INCOME TAXES $ 2,863 $ 2,472 $ 3,232 2010 versus 2009 Netattributabletaxes for 2013 was $2.9 billion compared to DuPont ("earnings") for 2010 increased $1.3$2.5 billion or 73 percent versus 2009.in 2012 and $3.2 billion in 2011. The increase principally reflects higherchanges between periods were due to the reasons noted above.volume and selling prices and the absence of a prior year restructuring charge, partly offset by higher non-cash pensionearnings will reflect continuing improvement in global industrial production, lower agricultural input costs, and lower Pharmaceuticals income. See additional information above relateda slightly stronger average exchange value for the U.S. dollar. In addition, the company’s market position and results will continue to changes in earnings.2009 versus 2008 Earnings for 2009 decreased $252 million, or 13 percent versus 2008. The decrease in earnings was principally attributablebenefit from market driven innovation and productivity.lower sales volume, unfavorable currency impacts,another business segment. Products are transferred between segments on a basis intended to reflect, as nearly as practicable, the market value of the products. Effective January 1, 2013, to better indicate operating performance, the company eliminated the allocation of non-operating pension and higher non-cashother postretirement employee benefit costs from segment pre-tax operating income (loss) (PTOI). Segment PTOI is defined as income (loss) from continuing operations before income taxes excluding non-operating pension costs. Partly offsetting these factors were lowerand other postretirement employee benefit costs, for raw materials, energy,exchange gains (losses), corporate expenses and freight, benefits from cost reductions and productivity actions, lower restructuring charges, and the absenceinterest. Certain reclassifications of prior year hurricane-related charges. See additional information above related to changes in earnings.Corporate OutlookFor the year 2011, the company's earnings outlook is a range of $3.45 to $3.75 per share with expected sales between $33 billion to $34 billion, reflecting the expectation for continued steady global economic growth with increasing industrial production, favorable North American agricultural conditions and the company's further penetration of developing markets. Earnings from Pharmaceuticals are expected to decline about $290 million pre-tax, reflecting the expiration of certain patents for Cozaar®/Hyzaar®. The company expects higher operating costs from an estimated four to five percent increase in raw material, energy and freight costs, and approximately $60 million higher pre-tax non-cash pension costs. The company plans to partly offset these increases by fixed cost productivity programs totaling about $300 million.The company plans to continue a differential level of capital expenditures and funding for research & development for businesses expected to have above-average growth rates and margins. For 2011, targetsdata have been set for capital expenditures totaling about $1.8 billion, and working capital productivity improvements totaling $300 million.The outlook above excludesmade to conform to current year classifications. All references to prices are on a U.S. dollar (USD) basis, including the impact of the planned Danisco acquisition which could reduce 2011 earnings by $0.30 to $0.45 per share.(Dollars in millions) 2013 2012 2011 Segment sales $ 11,739 $ 10,426 $ 9,166 PTOI $ 2,132 $ 1,669 $ 1,566 PTOI margin 18 % 16 % 17 % 2013 2012 Change in segment sales from prior period due to: Price 5 % 6 % Volume 7 % 8 % Portfolio / Other 1 % — % Total change 13 % 14 % (Dollars in millions) 2013 2012 2011 Segment sales $ 2,549 $ 2,701 $ 3,173 PTOI $ 203 $ 222 $ 438 PTOI margin 8 % 8 % 14 % 2013 2012 Change in segment sales from prior period due to: Price (8 )% (4 )% Volume 2 % (11 )% Portfolio / Other — % — % Total change (6 )% (15 )% (Dollars in millions) 2013 2012 2011 Segment sales $ 1,224 $ 1,180 $ 705 PTOI $ 170 $ 159 $ 2 PTOI margin 14 % 13 % — % 2013 2012 Change in segment sales from prior period due to: Price 2 % (4 )% Volume 2 % 8 % Portfolio / Other — % 63 % Total change 4 % 67 % (Dollars in millions) 2013 2012 2011 Segment sales $ 3,473 $ 3,422 $ 2,460 PTOI $ 305 $ 270 $ 76 PTOI margin 9 % 8 % 3 % 2013 2012 Change in segment sales from prior period due to: Price 3 % 1 % Volume — % 3 % Portfolio / Other (2 )% 35 % Total change 1 % 39 % (Dollars in millions) 2013 2012 2011 Segment sales $ 6,703 $ 7,188 $ 7,794 PTOI $ 924 $ 1,778 $ 2,114 PTOI margin 14 % 25 % 27 % 2013 2012 Change in segment sales from prior period due to: Price (12 )% 4 % Volume 5 % (12 )% Portfolio / Other — % — % Total change (7 )% (8 )% (Dollars in millions) 2013 2012 2011 Segment sales $ 6,468 $ 6,447 $ 6,815 PTOI $ 1,281 $ 1,121 $ 1,079 PTOI margin 20 % 17 % 16 % 2013 2012 Change in segment sales from prior period due to: Price (3 )% (2 )% Volume 4 % — % Portfolio / Other (1 )% (3 )% Total change — % (5 )% (Dollars in millions) 2013 2012 2011 Segment sales $ 3,884 $ 3,825 $ 3,934 PTOI $ 694 $ 562 $ 661 PTOI margin 18 % 15 % 17 % 2013 2012 Change in segment sales from prior period due to: Price (1 )% — % Volume 3 % (3 )% Portfolio / Other — % — % Total change 2 % (3 )% (Dollars in millions) 2013 2012 2011 Segment sales $ — $ — $ — PTOI $ 32 $ 62 $ 289 December 31, (Dollars in millions) 2013 2012 Cash, cash equivalents and marketable securities $ 9,086 $ 4,407 Total debt 12,462 11,740 Long-term Short-term Outlook Standard & Poor's A A-1 Stable Moody’s Investors Service A2 P-1 Stable Fitch Ratings A F1 Stable (Dollars in millions) 2013 2012 2011 Cash provided by operating activities $ 3,179 $ 4,849 $ 5,152 (Dollars in millions) 2013 2012 2011 Cash provided by (used for) investing activities $ 2,945 $ (1,346 ) $ (6,238 ) (Dollars in millions) 2013 2012 2011 Cash (used for) provided by financing activities $ (1,474 ) $ (2,697 ) $ 403 (Dollars in millions) 2013 2012 2011 Cash provided by operating activities $ 3,179 $ 4,849 $ 5,152 Purchases of property, plant and equipment (1,882 ) (1,793 ) (1,843 ) Free cash flow $ 1,297 $ 3,056 $ 3,309 generally accepted accounting principles in the United States of America (GAAP)GAAP requires management to make estimates and assumptions that affect the reported amounts, including, but not limited to, receivable and inventory valuations, impairment of tangible and intangible assets, long-term employee benefit obligations, income taxes, restructuring liabilities, environmental matters and litigation. Management's estimates are based on historical experience, facts and circumstances available at the time and various other assumptions that are believed to be reasonable. The company reviews these matters and reflects changes in estimates as appropriate. Management believes that the following represents some of the more critical judgment areas in the application of the company's accounting policies which could have a material effect on the company's financial position, liquidity or results of operations.plan obligationsplan's benefit obligation or the applicable plan assets, the excess is amortized over the average remaining service period of active employees.8077 percent of the company's benefit obligation for pensions and essentially all of the company's other long-term employee benefit obligations are attributable to the benefit plans in the U.S. TheIn the U.S. the discount rate is developed by matching the expected cash flow of the benefit plans to a yield curve constructed from a portfolio of high quality fixed-income instruments provided by the plan's actuary as of the measurement date. For non-U.S. benefit plans, the company utilizes publishedprevailing long-term high quality corporate bond indices to determine the discount rate, applicable to each country, at the measurement date. Where commonly available, the company considers indices of various durations to reflect the timing of future benefit payments.consideration.consideration. The long-term expected return on plan assets in the U.S. is based upon historical real returns (net of inflation) for the asset classes covered by the investment policy, expected performance, and projections of inflation over the long-term periodreturnreturn on plan assets in the U.S. reflects the asset allocation of the plan and the effect of the company's active management of the plans' assets.
(Dollars in billions) 2010 2009 2008 (Dollars in billions) 2013 2012 2011 $ 13.9 $ 14.0 $ 16.2 $ 15.5 $ 14.8 $ 13.9 $ 14.8 $ 13.9 $ 13.5 16.1 15.1 13.9 Part IIITEM 7. MANAGEMENT'S DISCUSSION AND ANALYSIS OF FINANCIAL CONDITION AND RESULTS OF OPERATIONS,continued The fair value of assets in all pension plans was $18.4 billion at December 31, 2010, and the related projected benefit obligations were $23.9 billion. In addition, obligations under the company's unfunded other long-term employee benefit plans were $4.0 billion at December 31, 2010.2010:2013:
(Dollars in millions) 1/2 Percentage
Point
Increase 1/2 Percentage
Point
Decrease $ 81 $ (88 ) Discount rate $ 89 $ 94 84 (84 ) 97 (97 ) "Long-Term"Long-term Employee Benefits" beginning on page 4034 and in Note 2118 to the Consolidated Financial Statements. PRPs Potentially Responsible Parties (PRPs) at multipartymulti-party sites and the number of and financial viability of other PRPs. The company has recorded a liability of $407 million on the Consolidated Balance Sheet as of December 31, 2010; these accrued liabilities exclude claims against third parties and are not discounted.ConsiderableTherefore, considerable uncertainty exists with respect to environmental remediation costs and, under adverse changes in circumstances, the potential liability may range up to two to three times the amount accrued. Much of this liability results from the Comprehensive Environmental Response, Compensation and Liability Act (CERCLA, often referred to as the Superfund), the Resource Conservation and Recovery Act (RCRA) and similar state and global laws. These laws require the company to undertake certain investigative and remedial activities at sites where the company conducts or once conducted operations or at sites where company-generated waste was disposed. The accrual also includes a number of sites identified by the company for which it is probable that environmental remediation will be required, but which are not currently the subject of enforcement activities. Federal and state authorities may seek fines and penalties for violation of the various laws and governmental regulations and could, among other things, impose liability on the company for cleaning up the damage resulting from company-generated waste disposal. Over the next two decades, the company could incur significant costs under both CERCLA and RCRA.Remediation activities vary substantially in duration and cost from site to site. These activities and their associated costs, depend on the mix of unique site characteristics, evolving remediation technologies, diverse regulatory agencies and enforcement policies, as well as the presence or absence of PRPs. Therefore, it is difficult to develop precise estimates of future site remediation costs.Part IIITEM 7. MANAGEMENT'S DISCUSSION AND ANALYSIS OF FINANCIAL CONDITION AND RESULTS OF OPERATIONS,continued1916 to the Consolidated Financial Statements.2010,2013, the company had a deferred tax asset balance of $6.4 billion, net of valuation allowance of $1.7$1.8 billion. Realization of these assets is expected to occur over an extended period of time. As a result, changes in tax laws, assumptions with respect to future taxable income, and tax planning strategies could result in adjustments to these assets.Part IIITEM 7. MANAGEMENT'S DISCUSSION AND ANALYSIS OF FINANCIAL CONDITION AND RESULTS OF OPERATIONS,continued2010,2013, no impairments exist at this time. The company's methodology for estimating the fair value of its businessesreporting units is using the income approach based on the present value of future cash flows. The income approach has been generally supported by additional market transaction analyses. There can be no assurance that the company's estimates and assumptions regarding forecasted cash flow and revenue and operating income growth rates made for purposes of the annual goodwill impairment test will prove to be accurate predictions of the future. The company believes the current assumptions and estimates utilized are both reasonable and appropriate. Information with respect to the company's significant accounting policies on long-lived assets is included in Note 1 to the Consolidated Financial Statements.Segment ReviewsSegment sales include transfers to another business segment. Products are transferred between segments on a basis intended to reflect, as nearly as practicable, the market value of the products. Segment pre-tax operating income (loss) (PTOI) is defined as operating income before income taxes, exchange gains (losses), corporate expenses and interest. A reconciliation of segment sales to consolidated net sales and segment PTOI to income before income taxes for 2010, 2009 and 2008 is included in Note 25 to the Consolidated Financial Statements.As described in Note 4 to the Consolidated Financial Statements, the company initiated global restructuring programs during 2009 and 2008. The 2009 and 2008 program charges reduced total segment PTOI for 2009 and 2008 by $340 million and $535 million, respectively.In 2009, the company recorded a $30 million and $100 million net reduction in the estimated costs associated with the 2009 program and 2008 programs, respectively. In 2010, the company recorded a $20 million and $14 million net reduction in the estimated costs associated with the 2009 program and 2008 programs, respectively.Below is a summary of the net impact to each segment related to the activities described above: 2010 (Charges)
and Credits 2009 (Charges) and Credits 2008
(Charge) 2009 and 2008
Net Program
Reductions 2009
Program 2009 Net
Program
Reductions 2008 Net
Program
Reductions 2009 Net
Impact 2008
Program $ - $ - $ - $ 1 $ 1 $ (18 ) 8 (43 ) 6 - (37 ) (37 ) 10 (66 ) 9 3 (54 ) (50 ) (6 ) (65 ) (11 ) 61 (15 ) (209 ) 16 (110 ) 23 29 (58 ) (94 ) 5 (55 ) 8 2 (45 ) (96 ) 1 (1 ) (5 ) 4 (2 ) (31 ) $ 34 $ (340 ) $ 30 $ 100 $ (210 ) $ (535 ) AGRICULTURE & NUTRITION Segment Sales
(Dollars in billions) PTOI
(Dollars in millions) $ 9.1 $ 1,355 $ 8.3 $ 1,224 $ 8.0 $ 1,087 Agriculture & Nutrition's businesses leverage the company's technology, customer relationships, and industry knowledge to improve the quantity, quality and safety of the global food supply and the global production agriculture industry. Land available for worldwide agricultural production is increasingly limited so production growth will need to be achieved principally through improving crop yields and productivity rather than through increases in planted area. The segment's businesses deliver a broad portfolio of products and services that are specifically targeted to achieve gains in crop yields and productivity, including Pioneer® brand seed products and well-established brands of insecticides, fungicides and herbicides. The segment's businesses operate across the food value chain from inputs for producing agriculture products to global production and distribution of soy-based food ingredients to food quality diagnostic testing equipment. Research and development focuses on leveraging technology to increase grower productivity and enhance the value of grains and soy through improved seed traits, superior seed germplasm and effective use of insecticides, herbicides and fungicides. The following are Agriculture & Nutrition's operating businesses:Pioneer is the world's leading seed brand and a world leader in improving crop yields with hybrid and varietal seeds that improve grower yields and provide effective plant insect protection and herbicide tolerance. The principal products of Pioneer are hybrid seed corn and varietal soybean seed, as well as sunflower, canola, sorghum and rice. Crops grown from Pioneer seed are used to meet the global demand for animal feed, food, biofuels, and fiber. Sales of Pioneer seeds amounted to 17 percent, 18 percent and 13 percent of the company's total consolidated net sales for the years ended December 31, 2010, 2009 and 2008, respectively. Agricultural seed research requires long-term commitment, investment and innovation. Pioneer research is focused on results that deliver higher crop yields and a consistent per acre income advantage for its customers. New product innovation is accomplished through an effective integration of superior germplasm and value added native and biotechnology traits. In 2010, Pioneer benefited from the North America launch of new soybean varieties and new Pioneer® brand corn hybrids. In April 2010, Pioneer received EPA cultivation approval of Optimum® AcreMax™ 1 products, the first product with reduced and integrated corn rootworm refuge with 2011 commercialization in North America. In October 2010, Pioneer received EPA cultivation approval of Optimum® Intrasect™ insect protection products offering that will allow U.S. corn growers to reduce their structured above ground refuge to a level of 5 percent in the Corn Belt. Optimum® Intrasect™ insect protection products will be demonstrated to growers in 2011. Pioneer expects EPA cultivation approval for its next generation integrated refuge insect control products in the second half 2011. These innovative and convenient products would feature single-bag reduced refuge for both corn rootworm and corn borer. Upon EPA cultivation approval, multiple product versions would be available for grower choice including but not limited to: Optimum® AcreMaxTM products for above-ground protection and Optimum® AcreMaxTM Xtra products for above- and below-ground protection.In December 2010, Pioneer and Syngenta AG (Syngenta) entered into an agreement to grant Pioneer a non-exclusive, global license to Syngenta's corn rootworm trait MIR604 (Agrisure™ RW) for corn seed. The trait provides protection from below-ground coleopteran insects, including corn rootworm, a major corn pest in the U.S. and around the world. The license gives Pioneer the right to commercialize corn seed containing MIR604, including the right to stack MIR604 with other traits through the expiration of the relevant patents. As part of the agreement, Pioneer is obligated to make milestone and royalty payments assuming certain contingencies, including regulatory approvals, are met. The contingencies related to the first milestone payment are expected to be met in 2011. Minimum payments under the agreement are expected to total about $400 million over the next several years.In September 2010, as part of the company's strategy to deliver innovations that address the need for increased food production to feed the world's growing population, Pioneer announced that it had entered into an agreement to acquirePart IIITEM 7. MANAGEMENT'S DISCUSSION AND ANALYSIS OF FINANCIAL CONDITION AND RESULTS OF OPERATIONS,continueda majority share of Pannar Seed Limited, a South African-based seed company. This investment would allow each business to access additional crop areas, reach more customers and deliver improved seed products quicker than either can do on its own. In December 2010, the South African Competition Commission rejected the acquisition. The company has appealed this decision and expects to receive a final decision in 2011.As announced in December 2008, Pioneer is expanding its reach in North America through its PROaccessSM business strategy in order to bring its seed genetics to more customers. Under the PROaccessSM business strategy, nine companies distribute products on behalf of Pioneer that are co-branded using Pioneer-owned brands together with one of the nine companies' brands. Since launching PROaccessSM, six of the nine PROaccessSM partners have become wholly owned subsidiaries of the company.In the spring 2009, Monsanto sued the company in U.S. District Court claiming that stacking seed with Pioneer's Optimum® GAT® trait and Monsanto's Roundup Ready®1 herbicide tolerance trait violates its Roundup Ready® license agreements with Monsanto. Monsanto also alleges that sales of Pioneer stacked seeds would infringe a Monsanto patent that expires in 2014. Monsanto seeks declaratory relief, unspecified damages and a permanent injunction to prevent sales of Optimum® GAT®/ Roundup Ready® stacked seeds. DuPont filed an answer and counterclaims, including patent misuse and antitrust claims. In January 2010, the Court ruled that the license agreements between the companies contain an unwritten ("implied") term that prohibits stacking these traits. The Court vacated its ruling regarding the "implied term" in the third quarter 2010, and concluded that the license neither expressly prohibits nor expressly grants the right to stack a second glyphosate tolerance trait with Monsanto's Roundup Ready® trait. The company's separate antitrust and patent fraud claims were not impacted by either ruling and are proceeding. Pioneer continues to develop soybean seed in which these traits are stacked and sales could occur between 2013-2014, subject to regulatory approvals. Neither ruling changes Pioneer's commercialization plans for products with the Optimum® GAT® trait. Furthermore, management believes that the Monsanto lawsuit is unlikely to adversely affect the company's commercial results for soybean and corn seed because Pioneer can continue to sell seed with Roundup Ready® traits that are not stacked with Optimum® GAT® traits.1Registered Trademark of MonsantoDuPont Crop Protection serves the global production agriculture industry with crop protection products for field crops such as wheat, corn, soybean and rice; specialty crops such as fruit, nut, vine and vegetables; and non-crop segments, including forestry and land management. Principal crop protection products are weed control, disease control, and insect control products. The sales growth of the business' insect control portfolio is led by Rynaxypyr®, a product registered for sale in over 60 countries and sold under four key brands for use across a broad range of core agricultural crops. The business continues to expand its product offerings in the professional pest control, lawn care, golf course, animal health and seed treatment markets.Nutrition & Health operates principally within the specialty food ingredients market, including soy proteins and lecithins through the Solae Company, a majority-owned venture with Bunge Limited. Nutrition & Health global production and distribution capabilities serves various areas within the food industries including meat and poultry products, consumer food products, dairy-alternative products and nutritional products. Nutrition & Health anticipates improved volume growth through offerings in its specialty food ingredients.2010 versus 2009 Sales were $9.1 billion, a 10 percent increase versus the prior year, reflecting a 7 percent increase in volume and 4 percent higher United States dollar (USD) selling prices, which were partially offset by portfolio changes of 1 percent. Higher volume was primarily due to higher seed sales in North America with market share gains for corn and soybeans. Higher global sales of Crop Protection products were led by broad-based recovery across most regions and strong demand for Rynaxypyr® in Asia Pacific and Latin America. The higher USD selling prices reflect higher value product mix and pricing actions to offset the increase in raw material costs.PTOI for 2010 was $1.4 billion, an increase of 11 percent versus the prior year, principally due to the higher sales volume, partially offset by higher spending for growth investments and a $50 million charge in R&D expense for an upfront payment related to a Pioneer licensing agreement for corn seed trait technology, as described above.Part IIITEM 7. MANAGEMENT'S DISCUSSION AND ANALYSIS OF FINANCIAL CONDITION AND RESULTS OF OPERATIONS,continued2009 versus 2008 Sales were $8.3 billion, a 4 percent increase when compared to 2008, reflecting 5 percent higher USD selling prices, partially offset by a 1 percent decrease in volume. The higher USD selling prices is related to Pioneer seeds and Crop Protection proprietary insect, weed and disease control products, partially offset by unfavorable currency impacts in Europe, Canada and Latin America, as well as the impact of significantly lower market-driven pricing for glyphosate resale. The decrease in volume was primarily due to lower sales of Crop Protection disease and insect control products, and lower sales of Nutrition & Health products largely offset by higher Pioneer corn and soybean seed sales market share gains in North America.PTOI was $1.2 billion, an increase of 13 percent versus 2008, principally due to the higher sales and higher value product mix, partially offset by unfavorable currency impacts globally.Outlook The segment anticipates sales and earnings growth in 2011. Segment earnings are expected to benefit in particular from continued strong momentum in the Pioneer corn and soybean business. Pioneer anticipates continued growth in volume in key corn and soybean markets including the U.S., Canada and Latin America, as well as value-based pricing gains. The 2011 product line up will include new corn hybrids and soybean varieties as well as Optimum® AcreMax™ 1 products, the industry's first product with reduced and integrated corn rootworm refuge.In the Crop Protection business, volume driven sales growth combined with continued productivity and business improvement actions are expected to contribute to earnings in 2011. Volume growth is underpinned by a favorable industry outlook, continued regional expansion and new market segment penetration of products such as Rynxypyr® as well as new product introductions such as Streamline® herbicide for land management. In the Nutrition & Health business, volume growth reflecting soy protein penetration and expansion of health and wellness products coupled with continued and intensified productivity actions are anticipated to support earnings and margin expansion. ELECTRONICS & COMMUNICATIONS Segment Sales
(Dollars in billions) PTOI
(Dollars in millions) $ 2.8 $ 445 $ 1.9 $ 87 $ 2.2 $ 251 Electronics & Communications is a leading supplier of differentiated materials and systems for photovoltaics, consumer electronics, displays and advanced printing that enable superior performance and lower total cost of ownership for customers. The segment leverages DuPont's strong materials and technology base to target attractive growth opportunities in photovoltaic materials, materials for circuit and semiconductor fabrication and packaging, display materials, packaging graphics, and ink-jet printing. In the fast growing photovoltaics market, the company continues to be a leading supplier of metallization pastes and backsheet materials for use in solar cells and modules. In 2010, DuPont Apollo Ltd., a wholly owned subsidiary of the company, started providing total system solutions and production of high-efficiency tandem thin-film photovoltaic modules to meet the needs of this fast growing segment of the solar energy market. Beyond photovoltaics, the segment is investing in its broad portfolio of materials for semiconductor fabrication and packaging, as well as innovative materials for circuit applications, to address critical needs of electronic component and device manufacturers. In the displays market, the segment continues to be a leading materials supplier for plasma displays. In addition, the segment continues to invest in developing a solution-process technology and material set to enable lower cost organic light-emitting diode (OLED) displays. In packaging graphics, DuPont is a leading supplier of flexographic printing systems, including Cyrel® photopolymer plates. The segment is investing in new products such as Cyrel® FAST Round to strengthen its market leadership position in advanced printing markets. DuPont is also expanding its leadership position in black-pigmented inks and developing new color-pigmented inks for network printing applications.Part IIITEM 7. MANAGEMENT'S DISCUSSION AND ANALYSIS OF FINANCIAL CONDITION AND RESULTS OF OPERATIONS,continuedThe segment is on track to complete a $295 million expansion to support the DuPont Tedlar® polyvinyl fluoride films business. This includes a $120 million investment in capacity expansion to produce the raw materials that make the film, which was completed in 2010. A multi-phase $175 million investment of high-performance Tedlar® PV2001 series oriented film production is scheduled for completion in 2011. Tedlar® films serve as the critical component of photovoltaic module backsheets, providing long-term durability and performance in all weather conditions.2010 versus 2009 Sales of $2.8 billion were up 44 percent, reflecting 37 percent higher volume and 7 percent higher USD selling prices. Higher volume was driven by strong growth in all regions, particularly in Asia Pacific and Europe, and strong demand across most market segments, particularly in photovoltaics. Higher USD selling prices were primarily due to pass-through of higher precious metals prices.PTOI was $445 million compared to $87 million in the prior year. The increase in PTOI was driven by substantially higher volume, improved productivity and the absence of a net $37 million restructuring charge in the prior year.2009 versus 2008 Sales of $1.9 billion were down 13 percent, reflecting 11 percent volume decline and 2 percent lower USD selling prices. The lower volume reflects the impact of the global economic recession which affected sales for products across all key markets. Sales volume improved throughout 2009, most significantly in Asia Pacific, where sales were essentially flat when compared to 2008. The lower USD selling prices were mainly due to contractual pass-through of lower precious metal prices.PTOI was $87 million compared to $251 million in 2008. The decline in PTOI was primarily due to the impact of lower sales, lower income from affiliates, and higher charges associated with low capacity utilization of production lines.Outlook For 2011, sales of products into photovoltaics, consumer electronics, displays, and advanced printing markets are expected to increase moderately. The segment continues to make productivity and supply chain improvements, as well as capacity investments to meet global demand. Segment earnings are expected to increase reflecting the impact of higher volume and productivity initiatives, as well as investments for growth. PERFORMANCE CHEMICALS Segment Sales
(Dollars in billions) PTOI
(Dollars in millions) $ 6.3 $ 1,081 $ 5.0 $ 547 $ 6.0 $ 687 Performance Chemicals businesses deliver customized solutions with a wide range of industrial and specialty chemical products for markets including plastics & coatings, textiles, mining, pulp and paper, water treatment and healthcare. The following are Performance Chemicals' operating businesses:DuPont Titanium Technologies is the world's largest manufacturer of titanium dioxide, and is dedicated to creating greater, more rewarding value for the coatings, paper, plastics, specialties and minerals markets through service, brand, and product. The business' main products include its broad line of DuPont™ Ti-Pure® titanium dioxide products.DuPont Chemicals and Fluoroproducts is a leading global manufacturer of industrial and specialty fluorochemicals, fluoropolymers, and performance chemicals. The business' broad line of products that include refrigerants, lubricants, propellants, solvents, fire extinguishants and electronic gases, cover a wide range of industries and markets. Key brands include DuPontTM Teflon®, Dymel®, Isceon®, Suva®, Vertrel®, Zyron®, Vazo® and Virkon®.2010 versus 2009 Sales of $6.3 billion were 27 percent higher than last year, reflecting 18 percent higher volume and 10 percent higher USD selling prices, which were partially offset by portfolio changes of 1 percent. Broad-based market recovery led to sales increases in all markets and all regions, most significant in Asia Pacific, reflecting strong demand for titanium dioxide, fluoropolymers and refrigerants, with continuing adoption of ISCEON® as a preferred retrofit to R22Part IIITEM 7. MANAGEMENT'S DISCUSSION AND ANALYSIS OF FINANCIAL CONDITION AND RESULTS OF OPERATIONS,continuedrefrigerant. Higher USD selling prices reflect favorable pricing for titanium dioxide and pass-through of higher raw material costs for industrial chemicals and fluoroproducts.PTOI was $1,081 million as compared to $547 million in the prior year. The increase in PTOI was driven by higher volume, higher USD selling prices that more than offset increases in raw material costs, improved productivity and the absence of a net $54 million restructuring charge in the prior year.2009 versus 2008 Sales of $5.0 billion were 18 percent lower than 2008, due to a 12 percent decline in volume and 6 percent lower USD selling prices. The lower volume principally reflects decreased demand for industrial chemicals and fluoroproducts across all regions reflecting the impact of the economic downturn. Sales of titanium dioxide products recovered during the second half 2009, and were higher than the pre-recession levels in the second half 2007. The lower USD selling prices were mainly due to contractual pass-through of lower raw material prices and unfavorable currency impact in Europe and Asia Pacific.PTOI was $547 million as compared to $687 million in 2008. The decrease in earnings was primarily due to the impact of lower volume, partially offset by fixed costs reductions.Outlook Performance Chemicals' sales are expected to increase in 2011 as a result of the continued global economic recovery, higher global demand for titanium dioxide and specialty chemicals, and higher USD selling prices. Total segment earnings are also expected to increase consistent with the higher sales volume, higher USD selling prices and improved fixed cost productivity. This segment manufactures products that could be affected by uncertainties associated with PFOA matters. See the discussion on page 46 under the subheading PFOA for further information. PERFORMANCE COATINGS Segment Sales
(Dollars in billions) PTOI
(Dollars in millions) $ 3.8 $ 249 $ 3.4 $ 69 $ 4.4 $ (8 ) Performance Coatings is one of the world's leading motor vehicle coatings suppliers. Products offered include high performance liquid and powder coatings for motor vehicle original equipment manufacturers (OEMs), the motor vehicle after-market, and general industrial applications, such as coatings for heavy equipment, pipes and appliances and electrical insulation. After-market coatings products are marketed using the DuPont™ Standox®, Spies Hecker® and Nason® brand names. Standox® and Spies Hecker® are focused on the high-end motor vehicle after-markets, while Nason® is primarily focused on economy coating applications.In 2009 and 2008, the segment experienced a significant decline in sales, mainly in the OEMs markets, due to the impact of the global economic recession in the automotive industry. In addition, the North American automotive industry continued to experience structural changes, including the loss of U.S. market share by U.S. automakers. In 2009, the global production of automobiles and light trucks declined by 14 percent reflecting declines of 33 percent in North America, and 10 percent in the rest of the world, which was partially offset by an increase in production of 44 percent in Greater China.In 2010, the segment experienced strong recovery from the economic downturn across most markets and regions. Global automotive markets experienced increased production levels due to improved OEM auto builds as a result of higher demand, most significant in North America and Europe. Automotive builds across the globe increased 22 percent, reflecting an improvement of 37 percent in North America and 20 percent in the rest of the world. The industry production forecast for 2011 projects a global increase of 5 percent, reflecting continued recovery in North America and continued growth in Asia Pacific.Part IIITEM 7. MANAGEMENT'S DISCUSSION AND ANALYSIS OF FINANCIAL CONDITION AND RESULTS OF OPERATIONS,continued2010 versus 2009 Sales of $3.8 billion were up 11 percent when compared to prior year, reflecting 9 percent higher volume and a 2 percent increase in USD selling prices. Higher volume reflects recovery in global automotive OEM markets as a result of higher global motor vehicle builds and strong demand in industrial coatings, particularly in the North American and European heavy duty truck markets. Higher USD selling prices primarily reflect pricing actions taken to offset the increase in raw material costs.PTOI was $249 million as compared to $69 million in 2009. The increase in PTOI primarily reflects the impact of higher volume, improved productivity and higher USD selling prices, which were partially offset by higher raw material costs.2009 versus 2008 Sales of $3.4 billion were down 21 percent when compared to 2008, reflecting a 20 percent decline in volume and 1 percent lower USD selling prices. The decline in volume reflects the impact of fewer motor vehicle and industrial truck builds of motor vehicle OEMs, and lower sales of industrial and after-market products in all regions. Sales to OEMs improved substantially during the second half 2009, mostly due to the impact of government incentives programs and higher sales in Asia Pacific. Sales of after-market and industrial coatings experienced a slower recovery from the inventory destocking experienced in the industry during the fourth quarter 2008 and first quarter 2009. The lower USD selling prices reflect unfavorable currency impacts, partially offset by higher local selling prices.PTOI was $69 million as compared to a loss of $8 million in 2008. The improvement in PTOI was primarily due to lower fixed costs, and the net year-over-year impact of the 2008 and 2009 restructuring activities, partially offset by the effect of lower volume.Outlook For 2011, the segment expects sales to increase modestly with continued recovery in the global automotive and heavy duty truck markets and market growth in the developing regions. PTOI is expected to improve due to continued productivity efforts and higher sales in all regions. PERFORMANCE MATERIALS Segment Sales
(Dollars in billions) PTOI
(Dollars in millions) $ 6.3 $ 994 $ 4.8 $ 287 $ 6.4 $ 128 Performance Materials' businesses provide productive, higher performance polymers, elastomers, films, parts, and systems and solutions which improve the uniqueness, functionality and profitability of its customers' offerings. The key markets served by the segment include the automotive OEM and associated after-market industries, as well as electrical, electronics, packaging, construction, oil, photovoltaics, aerospace, chemical processing and consumer durable goods. The following are Performance Materials' operating businesses:Performance Polymers delivers a broad range of polymer-based high performance materials in its product portfolio, including elastomers and thermoplastic and thermoset engineering polymers which are used by customers to fabricate components for mechanical, chemical and electrical systems. The main products include: DuPont™ Zytel® nylon resins, Delrin® acetal resins, Hytrel® polyester thermoplastic elastomer resins, Tynex® filaments, Vespel® parts and shapes, Vamac® ethylene acrylic elastomer, Kalrez® perfluoroelastomer and Viton® fluoroelastomers. Performance Polymers also includes the DuPont Teijin Films joint venture, whose primary products are Mylar® and Melinex® polyester films.Packaging & Industrial Polymers specializes in resins and films used in packaging and industrial polymer applications, sealants and adhesives, sporting goods, and interlayers for laminated safety glass. Key brands include: DuPont™ Surlyn® ionomer resins, Bynel® coextrudable adhesive resins, Elvax® EVA resins, SentryGlas®, Butacite® laminate interlayers and Elvaloy® copolymer resins.ITEM 7. MANAGEMENT'S DISCUSSION AND ANALYSIS OF FINANCIAL CONDITION AND RESULTS OF OPERATIONS,continued2010 versus 2009 Sales of $6.3 billion were 32 percent higher than prior year, reflecting 27 percent higher volume and a 7 percent increase in USD selling prices, which were partially offset by portfolio changes of 2 percent. The higher volume was led by broad-based demand across all markets, particularly in automotive and electronic markets, with strong volume recovery in all regions, led by Asia Pacific. Higher USD selling prices were a combination of stronger product sales mix and higher USD selling prices in response to higher feedstock costs.2010 PTOI was $994 million compared to $287 million in 2009. The increase in PTOI was primarily driven by higher sales volume, higher USD selling prices and improved productivity.2009 versus 2008 Sales of $4.8 billion were 26 percent lower reflecting 18 percent lower volume, 6 percent decrease in USD selling prices, and a 2 percent reduction related to portfolio changes. The decrease in volume mainly reflects the effect of the global economic recession and the inventory destocking experienced during the first half 2009. However, sales continuously improved during the second half 2009, both sequentially and when compared to 2008, mainly due to overall economic recovery and higher sales to the motor vehicle industry. The lower USD selling prices were a combination of significantly weaker product sales mix, unfavorable currency impacts, and for certain products, lower USD selling prices in response to lower feedstock costs.2009 PTOI was $287 million compared to $128 million in 2008. The improvement in PTOI reflects the impact of lower raw material, energy and freight costs, lower fixed costs, the absence of a $216 million hurricane-related charge in 2008, an $82 million benefit in 2009 from hurricane-related insurance recoveries and a reduction in the hurricane-related accrual, and the net year over year impact of the 2008 and 2009 restructuring activities. As of December 31, 2010, the company is aggressively pursuing additional insurance recoveries in the range of $50 – $100 million.Outlook 2011 sales are expected to grow due to anticipated increases in global motor vehicle OEMs builds and continued strength, particularly in Asia Pacific, for most of the markets served by the segment. PTOI is also expected to improve due to the impact of higher sales, improved fixed cost productivity and market-driven innovations for products and processes. SAFETY & PROTECTION Segment Sales
(Dollars in billions) PTOI
(Dollars in millions) $ 3.4 $ 454 $ 2.8 $ 260 $ 3.7 $ 661 Safety & Protection's businesses satisfy the growing global needs of businesses, governments and consumers for solutions that make life safer, healthier and more secure. By uniting market-driven science with the strength of highly regarded brands, the segment delivers products and services to a large number of markets including, construction, transportation, communications, industrial chemicals, oil and gas, electric utilities, automotive, manufacturing, defense, homeland security and safety consulting. The following are Safety & Protection's operating businesses:Protection Technologies is focused on finding solutions to protect people and the environment. With products like DuPontTM Kevlar®, Nomex® and Tyvek®, the business continues to hold strong positions in life protection markets and meet the continued demand for body armor and personal protective gear for the military, law enforcement personnel, firefighters and other first responders, as well as for workers in the oil and gas industry around the world.Building Innovations is committed to the building science behind increasing the performance of building systems, helping reduce operating costs and creating more sustainable structures. The business is a market leader of solid surfaces through its Corian® and Montelli® lines of products which offer durable and versatile materials for residential and commercial purposes. Other products such as Tyvek® and Typar® offer leading solutions for the protection and energy efficiency of buildings.Part IIITEM 7. MANAGEMENT'S DISCUSSION AND ANALYSIS OF FINANCIAL CONDITION AND RESULTS OF OPERATIONS,continuedSustainable Solutions continues to help organizations worldwide reduce workplace injuries and fatalities while improving operating costs, productivity and quality. Sustainable Solutions is a leader in the safety consulting field, selling training products, as well as consulting services. Additionally, Sustainable Solutions is dedicated to clean air, clean fuel and clean water with offerings that help reduce sulfur and other emissions, formulate cleaner fuels, or dispose of liquid waste. Its goal is to help maintain business continuity and environmental compliance for companies in the refining and petrochemical industries, as well as for government entities. In 2010, the business completed the acquisition of MECS, Inc., which is a leading global provider of process technology, proprietary specialty equipment and technical services to the sulfuric acid industry. The acquisition allows the business to expand its clean technologies portfolio by strengthening the business' clean air and clean fuel offerings and provide the company with further access to high-growth market segments, particularly in developing regions like Asia Pacific.2010 versus 2009 Sales of $3.4 billion were 20 percent higher than last year, due to higher volume. The increase in volume reflects strong recovery and increased demand across all regions, led by Europe and Asia Pacific, and markets, particularly in aramid and nonwoven products. Further penetration in the U.S. commercial construction markets led to higher sales as recovery in global construction markets remained weak. Sales for consulting and training services improved modestly across most regions, led by Asia Pacific.PTOI was $454 million compared to $260 million in the prior year. The increase in earnings was primarily due to higher volume and the absence of a net $45 million restructuring charge in prior year, partially offset by higher spending for growth initiatives and higher raw material costs.2009 versus 2008 Sales of $2.8 billion were 25 percent lower than 2008, due to a 23 percent decline in volume and 3 percent lower USD selling prices, partially offset by a 1 percent increase from portfolio changes. The lower volume reflects decreased demand for products across all markets and regions due to the impact of the economic downturn. The lower USD selling prices were mainly due to unfavorable currency impact in Europe and Asia Pacific.PTOI was $260 million compared to $661 million in 2008. The decrease in earnings was primarily due to the impact of lower volume and charges associated with low capacity utilization of production units, partially offset by fixed costs reductions.Outlook For 2011, sales are expected to benefit from improved global market conditions. Demand for Kevlar®, Nomex® and Tyvek® products is expected to increase across all regions with continued strength in industrial, consumer and automotive markets. Sales related to the Building Innovations business are expected to increase due to forecasted improvements in construction markets across most regions. Sales related to the Sustainable Solutions business are expected to increase modestly due to the completion of the MECS, Inc. acquisition in 2010. PTOI is expected to improve due to higher sales. PHARMACEUTICALS Segment Sales
(Dollars in billions) PTOI
(Dollars in millions) $ - $ 489 $ - $ 1,037 $ - $ 1,025 On October 1, 2001, DuPont Pharmaceuticals was sold to the Bristol-Myers Squibb Company. DuPont retained its interest in Cozaar® (losartan potassium) and Hyzaar® (losartan potassium with hydrochlorothiazide). These drugs were developed in collaboration with Merck and are used in the treatment of hypertension. The U.S. patents covering the compounds, pharmaceutical formulation and use for the treatment of hypertension, including approval for pediatric use, expired in 2010. DuPont has exclusively licensed worldwide marketing and manufacturing rights for Cozaar® and Hyzaar® to Merck. Pharmaceuticals receive net proceeds and royalties as outlined below. Merck is responsible for manufacturing, marketing and selling Cozaar® and Hyzaar®.Part IIITEM 7. MANAGEMENT'S DISCUSSION AND ANALYSIS OF FINANCIAL CONDITION AND RESULTS OF OPERATIONS,continuedPharmaceuticals' Cozaar®/Hyzaar® income is the sum of two parts: income related to a share of the profits from North American sales and certain markets in EMEA, and royalty income derived from worldwide contract net sales linked to the exclusivity term in a particular country. Patents and exclusivity started to expire in prior years and the U.S. exclusivity for Cozaar® ended in April 2010. The worldwide agreement terminates when the following conditions are met: (i) the Canadian exclusivity ends, and (ii) North American sales fall below a certain level. The company experienced its first significant step-down in income from Cozaar®/Hyzaar® in 2010 and expects a continued step-down each subsequent year to zero when the contract ends. In general, management expects a traditional sales, earnings and cash decline for a drug going off patent in the pharmaceutical industry.In the fourth quarter 2009, the company recorded a $63 million charge to other income, net and a reduction to accounts and notes receivable, net in the Pharmaceuticals segment to reflect increased rebates and other sales deductions related to the Cozaar®/Hyzaar® licensing agreement.Outlook Cozaar®/Hyzaar® income is expected to continue to substantially decrease due to the expiration of a majority of the worldwide patents which occurred in 2010. Earnings contributions to the company from the collaboration with Merck are expected to decline in 2011 about $290 million pre-tax from earnings generated in 2010. OTHERThe company includes certain embryonic businesses not included in the reportable segments, such as Applied BioSciences and nonaligned businesses in Other. The potential viability of each embryonic business depends on a number of factors including successful product development, market acceptance and production ramp up capabilities. Using these factors and others, management periodically assesses the potential and fit of these businesses and may make investment adjustments based on such assessments. Applied BioSciences is focused on delivering cost advantaged products with superior performance and a smaller environmental footprint that are based on a unique combination of biological, chemical and material science capabilities. Specific global growth projects across the company are consolidated within Applied BioSciences to capitalize on the market opportunities and technology needs in this high-growth industry, including biomaterials and advanced biofuels products and technologies.Applied BioSciences is developing two biofuels businesses: one to commercialize non-food, cellulosic ethanol and the second to commercialize biobutanol. DuPont is pursuing commercialization through two joint ventures: DuPont Danisco Cellulosic Ethanol LLC (DDCE) and Butamax™ Advanced Biofuels LLC, respectively. DDCE now operates a demonstration scale facility in Vonore, Tennessee and Butamax™ now operates a demonstration scale facility in Hull, United Kingdom. Both joint ventures are aggressively pursuing commercialization capabilities.DuPont continues its joint venture with Tate & Lyle PLC, DuPont Tate and Lyle Bio Products LLC, to produce 1,3-propanediol (Bio-PDO™) using a proprietary fermentation and purification process. Bio-PDO™ is the key building block for DuPont™ Sorona® renewably sourced polymer. The joint venture also markets direct sale of Bio-PDO™ under the Zemea® propanediol and Susterra® propanediol brands as a key renewable ingredient in products ranging from industrial to personal care uses. DuPont Tate & Lyle Bio Products LLC is currently expanding capacity to support the production of Bio-PDO™, which is scheduled for completion in 2011.In 2010, the Applied BioSciences business announced the formation, pending European Union approvals, of Actamax™ Surgical Materials LLC, a joint venture with Royal DSM N.V. Actamax™ will bring to market next-generation biomedical materials.Nonaligned businesses include activities and costs associated with Benlate® fungicide and other discontinued businesses.In the aggregate, sales in Other for 2010, 2009 and 2008 represent less than 1 percent of total segment sales.2010 pre-tax loss of $205 million compared to a loss of $171 million in 2009, primarily reflecting an increase in litigation charges related to discontinued businesses.Part IIITEM 7. MANAGEMENT'S DISCUSSION AND ANALYSIS OF FINANCIAL CONDITION AND RESULTS OF OPERATIONS,continued2009 pre-tax loss of $171 million compared to a loss of $181 million in 2008. The lower pre-tax loss for the year was mainly due to the net year over year impact of the 2008 and 2009 restructuring activities, and lower pre-tax loss for Applied BioSciences.Liquidity & Capital ResourcesManagement believes the company's ability to generate cash from operations and access to capital markets will be adequate to meet anticipated cash requirements to fund working capital, capital spending, dividend payments, debt maturities and other cash needs. The company's liquidity needs can be met through a variety of sources, including: cash provided by operating activities, cash and cash equivalents, marketable securities, commercial paper, syndicated credit lines, bilateral credit lines, equity and long-term debt markets and asset sales. The company's current strong financial position, liquidity and credit ratings provide excellent access to the capital markets. In addition, cash generating actions have been implemented including spending and working capital reductions and restructuring to better align expenditures and costs. The company will continue to monitor the financial markets in order to respond to changing conditions.Pursuant to its cash discipline policy, the company seeks first to maintain a strong balance sheet and second, to return excess cash to shareholders unless the opportunity to invest for growth is compelling. Cash and cash equivalents and marketable securities balances of $6.8 billion as of December 31, 2010, provide primary liquidity to support all short-term obligations. The company has access to approximately $2.6 billion in unused credit lines with several major financial institutions, as additional support to meet short-term liquidity needs.The company continually reviews its debt portfolio and occasionally may rebalance it to ensure adequate liquidity and an optimum debt maturity schedule. In 2010, the company issued $0.5 billion of 1.95% Senior Notes due January 15, 2016, $1.0 billion of 3.625% Senior Notes due January 15, 2021 and $0.5 billion of 4.90% Senior Notes due January 15, 2041. The company elected to use the net proceeds to redeem $0.5 billion of its 5.00% Senior Notes due January 15, 2013 and $0.8 billion of its 5.875% Senior Notes due January 15, 2014 and pay down commercial paper issued to fund the $0.5 billion voluntary contribution to its principal U.S. pension plan.The company expects to finance the acquisition of Danisco with about $3.0 billion in existing cash and the remainder in new debt. The completion of the transaction is expected in the second quarter 2011 and is subject to customary closing conditions, including certain regulatory approvals and the tender of more than 90 percent of Danisco shares in the tender offer. In connection with this transaction, the company entered into a $4 billion bridge loan facility and a $2 billion bridge loan facility. The latter requires the company have cash, cash equivalents and marketable securities at least equal to $2 billion on hand at all times and readily available for use to purchase Danisco's shares. The bridge loan facilities terminate when the company completes the financing for the acquisition.During 2010, Standard & Poor's and Moody's Investors Service revised the company's credit outlook to "Stable" from "Negative". After the announcement of the potential acquisition of Danisco, Moody's Investors Service placed all of the company's credit ratings under review for possible downgrade. Standard & Poor's has responded to the acquisition announcement by placing the company on credit watch with negative implications. Fitch Ratings announced it will take no immediate action with regard to the company's ratings.Part IIITEM 7. MANAGEMENT'S DISCUSSION AND ANALYSIS OF FINANCIAL CONDITION AND RESULTS OF OPERATIONS,continuedThe company remains committed to a strong financial position and strong investment-grade rating. The company's credit ratings impact its access to the debt capital market and cost of capital. The company's long-term and short-term credit ratings are as follows:Long termShort termOutlookStandard & Poor'sAA-1Watch negativeMoody's Investors ServiceA2P-1Under review forpossible downgradeFitch RatingsAF1Negative 2010 2009 2008 $ 4,559 $ 4,741 $ 3,129 The company's cash provided by operating activities was $4.6 billion in 2010, a $0.2 billion decrease compared to 2009. Higher earnings were offset by changes in operating assets and liabilities, mainly due to higher sales and inventory; the stronger dollar, which was hedged with forward exchange contracts reflected in investing activities; and the voluntary contribution to the principal U.S. pension plan.The company's cash provided by operating activities was $4.7 billion in 2009, a $1.6��billion increase from the $3.1 billion generated in 2008. The increase was primarily due to the benefit of the weaker dollar, which was hedged by forward exchange contracts in investing activities. 2010 2009 2008 $ (2,439 ) $ (4,298 ) $ (1,610 ) In 2010, cash used for investing activities totaled $2.4 billion compared to $4.3 billion used in 2009. The $1.9 billion decrease was mainly due to changes in investments in short-term financial instruments and a net increase in proceeds from forward exchange contract settlements, partially offset by an increase in payments for businesses and higher expenditures for the purchases of property, plant and equipment.In 2009, cash used for investing activities totaled $4.3 billion compared to $1.6 billion used in 2008. The $2.7 billion increase was mainly due to the increase in investments in short-term financial instruments and the change in forward exchange contract settlements, partially offset by decreased capital expenditures.Purchases of property, plant and equipment totaled $1.5 billion, $1.3 billion and $2.0 billion in 2010, 2009 and 2008, respectively. Spending in 2010 reflects the company's continued investment in capacity expansion to support areas of growth. The company expects 2011 purchases of plant, property and equipment to be $1.8 billion, an increase of $0.3 billion over 2010, driven by continued growth investments aligned with the company's global trends. 2010 2009 2008 $ (1,829 ) $ (97 ) $ 878 The $1.7 billion increase in cash used for financing activities in 2010 was primarily due to a decrease in borrowings in 2010 as compared to an increase in borrowings in 2009. This was partially offset by an increase in the proceeds from the exercise of stock options net of cash used to repurchase common stock.Part IIITEM 7. MANAGEMENT'S DISCUSSION AND ANALYSIS OF FINANCIAL CONDITION AND RESULTS OF OPERATIONS,continuedThe $1.0 billion decrease in cash provided for financing activities in 2009 compared to 2008 was primarily due to changes in net borrowings. Net borrowings increased $1.4 billion in 2009 as compared to $2.1 billion in 2008. 2010 2009 2008 $ 4,559 $ 4,741 $ 3,129 (1,508 ) (1,308 ) (1,978 ) $ 3,051 $ 3,433 $ 1,151 Free cash flow is a measurement not recognized in accordance with generally accepted accounting principles (GAAP) and should not be viewed as an alternative to GAAP measures of performance. All companies do not calculate non-GAAP financial measures in the same manner and, accordingly, the company's free cash flow definition may not be consistent with the methodologies used by other companies. The company defines free cash flow as cash provided by operating activities less purchases of property, plant and equipment, and therefore indicates operating cash flow available for payment of dividends, other investing activities, and other financing activities. Free cash flow is useful to investors and management to evaluate the company's cash flow and financial performance, and is an integral financial measure used in the company's financial planning process.2010 free cash flow of $3.1 billion exceeded the company's target of greater than $1.7 billion primarily due to higher earnings and working capital productivity.Total debt at December 31, 2010 was $10.3 billion, a $0.7 billion decrease from December 31, 2009. The decrease in debt reflects the company's positive cash flow generated from general business activities.Total debt at December 31, 2009 was $11.0 billion, a $1.4 billion increase from December 31, 2008. The proceeds from the increased borrowings were primarily invested in short-term financial instruments.Dividends paid to common and preferred shareholders were $1.5 billion in 2010, 2009 and 2008. Dividends per share of common stock were $1.64 in 2010, 2009 and 2008. The common dividend declared in the first quarter 2011 was the company's 426th consecutive dividend since the company's first dividend in the fourth quarter 1904.The company's Board of Directors authorized a $2 billion share buyback plan in June 2001. During 2010, the company purchased and retired 5.4 million shares at a total cost of $250 million under this plan. During 2009 and 2008, there were no purchases of stock under this plan. As of December 31, 2010, the company has purchased 25.9 million shares at a total cost of $1.2 billion. Management has not established a timeline for the buyback of the remaining shares of stock under this plan.Cash, Cash Equivalents and Marketable SecuritiesCash and cash equivalents and marketable securities totaled $6.8 billion at December 31, 2010, $6.1 billion at December 31, 2009 and $3.7 billion at December 31, 2008. The $0.7 billion increase from 2009 to 2010 was primarily due to the company's positive cash flow generated from general business activities. The $2.4 increase from 2008 to 2009 was primarily due to cash proceeds from increased borrowings and cash generated from general business activities.IndemnificationsIn connection with acquisitions and divestitures, the company has indemnified respective parties against certain liabilities that may arise in connection with acquisitions and divestitures and related business activities prior to the completion of the transaction. The term of these indemnifications, which typically pertain to environmental, tax and product liabilities, is generally indefinite. In addition, the company indemnifies its duly elected or appointed directors and officers to the fullest extent permitted by Delaware law, against liabilities incurred as a result of their activities for thePart IIITEM 7. MANAGEMENT'S DISCUSSION AND ANALYSIS OF FINANCIAL CONDITION AND RESULTS OF OPERATIONS,continuedcompany, such as adverse judgments relating to litigation matters. If the indemnified party were to incur a liability or have a liability increase as a result of a successful claim, pursuant to the terms of the indemnification, the company would be required to reimburse the indemnified party. The maximum amount of potential future payments is generally unlimited. The carrying amounts recorded for all indemnifications as of December 31, 2010 and 2009 were $100 million. Although it is reasonably possible that future payments may exceed amounts accrued, due to the nature of indemnified items, it is not possible to make a reasonable estimate of the maximum potential loss or range of loss. No assets are held as collateral and no specific recourse provisions exist.In connection with the 2004 sale of the majority of the net assets of Textiles and Interiors, the company indemnified the purchasers, subsidiaries of Koch Industries, Inc. (INVISTA), against certain liabilities primarily related to taxes, legal and environmental matters and other representations and warranties under the Purchase and Sale Agreement. The estimated fair value of the indemnity obligations under the Purchase and Sale Agreement was $70 million and was included in the indemnifications balance of $100 million at December 31, 2010. Under the Purchase and Sale Agreement, the company's total indemnification obligation for the majority of the representations and warranties cannot exceed $1.4 billion. The other indemnities are not subject to this limit. In March 2008, INVISTA filed suit in the Southern District of New York alleging that certain representations and warranties in the Purchase and Sale Agreement were breached and, therefore, that DuPont is obligated to indemnify it. DuPont disagrees with the extent and value of INVISTA's claims. DuPont has not changed its estimate of its total indemnification obligation under the Purchase and Sale Agreement as a result of the lawsuit.Obligations for Equity Affiliates and OthersThe company has directly guaranteed various debt obligations under agreements with third parties related to equity affiliates, customers, suppliers and other affiliated companies. At December 31, 2010, the company had directly guaranteed $544 million of such obligations, and $16 million relating to guarantees of obligations for divested subsidiaries. This represents the maximum potential amount of future (undiscounted) payments that the company could be required to make under the guarantees. The company would be required to perform on these guarantees in the event of default by the guaranteed party. At December 31, 2010 and 2009, a liability of $109 million and $146 million, respectively, was recorded for these obligations, representing the amount of payment/performance risk which the company deems probable. This liability is principally related to obligations of the company's polyester films joint venture which are guaranteed by the company.Existing guarantees for customers and suppliers arose as part of contractual agreements. Existing guarantees for equity affiliates and other affiliated companies arose for liquidity needs in normal operations. In certain cases, the company has recourse to assets held as collateral as well as personal guarantees from customers and suppliers.The company has guaranteed certain obligations and liabilities related to a divested subsidiary, Conoco, which has indemnified the company for any liabilities the company may incur pursuant to these guarantees. No material loss is anticipated by reason of such agreements and guarantees. At December 31, 2010 and 2009, the company had no liabilities recorded for these obligations.Additional informationInformation with respect to the company's guarantees is included in Note 1916 to the Consolidated Financial Statements. Historically, the company has not had to make significant payments to satisfy guarantee obligations; however, the company believes it has the financial resources to satisfy these guarantees.Part IIITEM 7. MANAGEMENT'S DISCUSSION AND ANALYSIS OF FINANCIAL CONDITION AND RESULTS OF OPERATIONS,continued Payments Due In Payments Due In Total at
December 31,
2010
2011
2012 –
2013
2014 –
2015
2016 and
beyond 2014 $ 10,137 $ 4 $ 1,647 $ 2,106 $ 6,380 $ 12,392 $ 1,674 $ 3,026 $ 1,361 $ 6,331 3,858 431 803 623 2,001 4,047 429 776 648 2,194 5 1 - 1 3 26 3 6 3 14 982 227 357 219 179 1,524 288 501 388 347 246 114 116 16 - 282 125 106 40 11 241 99 67 22 53 1,537 124 284 329 800 72 36 36 - - 23 18 5 - - 174 108 62 4 — Raw material obligations 740 512 140 65 23 Utility obligations 295 69 98 39 89 1,533 117 282 328 806 Human resource services 62 31 30 1 — Other 220 153 58 7 2 2,401 516 614 407 864 3,024 990 670 444 920 83 14 36 15 18 59 2 3 19 35 407 90 154 83 80 87 85 2 - - 413 90 174 149 - 147 34 24 25 64 Workers' compensation 96 14 43 18 21 Asset retirement obligations 63 2 10 4 47 Environmental remediation 458 84 168 67 139 Legal settlements 89 76 5 4 4 2,159 326 541 572 720 193 65 29 17 82 1,196 315 393 291 197 3,058 567 796 682 1,013 $ 18,579 $ 1,494 $ 3,814 $ 3,647 $ 9,624 $ 24,071 $ 3,951 $ 5,775 $ 3,526 $ 10,819 1Included in the Consolidated Financial Statements.Included in the Consolidated Financial Statements. Represents enforceable and legally binding agreements in excess of $1 million to purchase goods or services that specify fixed or minimum quantities; fixed, minimum or variable price provisions; and the approximate timing of the agreement. Primarily represents raw material supply obligations. Pension and other long-term employee benefit obligations have been excluded from the table as they are discussed below within Long-term Employee Benefits. Primarily represents remaining minimum payments under Pioneer license agreements. Primarily represents employee-related benefits other than pensions and other long-term employee benefits. Due to uncertainty regarding the completion of tax audits and possible outcomes, the estimate of obligations related to unrecognized tax benefits cannot be made. See Note 6 to the Consolidated Financial Statements for additional detail. 2Represents enforceable and legally binding agreements in excess of $1 million to purchase goods or services that specify fixed or minimum quantities; fixed, minimum or variable price provisions; and the approximate timing of the agreement.3Primarily represents raw material supply obligations.4Primarily represents obligations associated with distribution, health care/benefit administration, research and development and other professional and consulting contracts.5Pension and other long-term employee benefit obligations have been excluded from the table as they are discussed below within Long-Term Employee Benefits.6Represents remaining expected payments under a license agreement between Pioneer and Monsanto.7Primarily represents employee-related benefits other than pensions and other long-term employee benefits.8Due to uncertainty regarding the completion of tax audits and possible outcomes, the estimate of obligations related to unrecognized tax benefits cannot be made. See Note 5 to the Consolidated Financial Statements for additional detail.Long-Termand life insurance protectionbenefits for employees (other long-term employee benefits). Approximately 8077 percent of the company's worldwide benefit obligation for pensions and essentially all of the company's worldwide other long-term employee benefit obligations are attributable to the U.S. benefit plans. Pension coverage for employees of the company's non-U.S. consolidated subsidiaries is provided, to the extent deemed appropriate, through separate plans. The company regularly explores alternative solutions to meet its global pension obligations in the most cost effective manner possible as demographics, life expectancy and country-specific pension funding rules change. Where permitted by applicable law, the company reserves the right to change, modify or discontinue its plans that provide pension, medical, dental, life insurance and disability benefits.In 2006, the company announced major changes to the pension and defined contribution benefits that cover the its U.S. employees. Such employees hired in the U.S. on or after December 31, 2006January 1, 2007 are not eligible to participate in the pension and post-retirement medical, dental and life insurance plans, but receive benefits in the defined contribution plans.TheIn January 2012, the company made a voluntary contribution ofcontributed $500 million in 2010 to its principal U.S. pension plan.plan and no contributionsrequired or currently anticipatedexpected to be made to the principal U.S. pension plan in 2011. Contributions2014. The company expects to make contributions to its principal U.S. pension plan beyond 2011 are not determinable since2014; however, the amount of any contributioncontributions is heavily dependent on the future economic environment and investment returns on pension trust assets. U.S. pension benefits that exceed federal limitations are covered by separate unfunded plans and these benefits are paid to pensioners and survivors from operating cash flows.$782$313 million to its pension plans in 20102013 and anticipates that it will make approximately $305$344 million in contributions in 20112014 to pension plans other than the principal U.S. pension plan.$321$207 million, $323$261 million and $326$312 million for 2010, 20092013, 2012 and 2008,2011, respectively. This amount is expected to be about $320$224 million in 2011.2014. Changes in cash requirements reflect the net impact of higher per capita health care costs, demographic changes, plan amendments and changes in participant premiums, co-pays and deductibles.and credits related to long-term employee benefits.benefits: 2010 2009 2008 $ 557 $ 155 $ (362 ) 254 245 250 1 219 220 181 $ 1,030 $ 620 $ 69 (Dollars in millions) 2013 2012 2011 $ 1,153 $ 1,321 $ 1,134 1Includes an accrual of $16 million for company match and contribution based on compensation paid in 2009 for 2008 service.The long-term employee benefit plan charges relating to discontinued operations was $5, $74 and $72 for 2013, 2012 and 2011, respectively. (benefits) charges for pension and other long-term employee benefits are determined as of the beginning of each year. The increasesdecrease in pensionlong-term employee benefit expense in 2010 and 20092013 is primarily related to decreasesthe retiree medical and dental plan amendment in 2012 and the market-related value of the assets in the principal U.S. pension plan.Performance Coatings sale, partially offset by lower discount rates. See "Long-Term"Long-term Employee Benefits" under the Critical Accounting Estimates section beginning on page 2230 of this report for additional information on determining annual expense for the principal U.S. pension plan.2118 to the Consolidated Financial Statements). For 2011,2014, long-term employee benefits expense from continuing operations is expected to increasedecrease by about $60$440 million primarily due to lowerhigher discount rates.Other Employee-Related BenefitsIn October 2009, the company announced revisions to its vacation benefits policy covering all U.S. employees. Effectiverates at December 31, 2010, entitled vacation for the following year will no longer vest at the end of each preceding year. In addition, vacation will be earned monthly2013 and accrued on the first day of each calendar monthbetter than expected pension asset returns during the year beginning in 2011. These revisions to the company's vacation benefits policy provided a one-time benefit of $148 million in 2010.(Dollars in millions) 2013 2012 2011 Environmental operating costs $ 602 $ 595 $ 562 Increase in remediation accrual 90 110 92 $ 692 $ 705 $ 654 Related to these activities, the company incurred environmental operating costs of $501 million, $483 million and $525 million in 2010, 2009 and 2008, respectively.ExpendituresRCRA, which extensively regulatesAccrualtreatment, storage and disposal of hazardous waste, requires that permitted facilities undertake an assessment of environmental contamination. If conditions warrant, companies may be required to remediate contamination caused by prior operations. In contrast to CERCLA, the costs of the RCRA corrective action programremediation accrual balance are typically borne solely by the company. The company anticipates that significant ongoing expenditures for RCRA remediation activities may be required over the next two decades. summarized below:(Dollars in millions) Balance at December 31, 2011 $ 416 Remediation payments (90 ) Increase in remediation accrual 110 Balance at December 31, 2012 $ 436 Remediation payments (68 ) Increase in remediation accrual 90 Balance at December 31, 2013 $ 458 forare expected to continue to increase in the near term,future; however, they are not expected to vary significantly from the range of such expenditures experienced in the past few years. Longer term, expenditures are subject to considerable uncertainty and may fluctuate significantly. The company's expenditures associated with RCRA and similar remediation activities were $52 million, $49 million and $51 million in 2010, 2009 and 2008, respectively.From time to time, the company receives requests for information or notices of potential liability from EPA and state environmental agencies alleging that the company is a PRP under CERCLA or similar state statutes. CERCLA is often referred to as the Superfund and requires companies to undertake certain investigative and research activities at sites where it conducts or once conducted operations or where company generated waste has been disposed. The company has also, on occasion, been engaged in cost recovery litigation initiated by those agencies or by private parties. These requests, notices and lawsuits assert potential liability for remediation costs at various sites that typically are not company owned, but allegedly contain wastes attributable to the company's past operations.2010,2013, the company has been notified of potential liability under CERCLAthe Comprehensive Environmental Response, Compensation and Liability Act (CERCLA or Superfund) or similar state laws at about 405420 sites around the U.S., with active remediation under way at approximately 160165 of these sites. In addition, the company has resolved its liability at approximately 170175 sites, either by completing remedial actions with other PRPs or by participating in "de minimis buyouts" with other PRPs whose waste, like the company's, represented only a small fraction of the total waste present at a site. The company received notice of potential liability at 10five new sites during 20102013 compared with threefive and fivesix similar notices in 20092012 and 2008,2011, respectively. The company's expenditures associatedCERCLArespect to environmental remediation costs, and, similar stateunder adverse changes in circumstances, potential liability may range up to three times the amount accrued as of December 31, 2013. However, based on existing facts and circumstances, management does not believe that any loss, in excess of amounts accrued, related to remediation activities were approximately $21 million, $18 million and $17 million in 2010, 2009 and 2008, respectively.For nearly all Superfund sites, the company's potential liability will be significantly less than the total site remediation costs because the percentage of waste attributable to the company versus that attributable to all other PRPs at any givenindividual site is typically relatively low. Other PRPs at sites, where the company is a party, typically have the financial strength to meet their obligations and, where they do not, or where PRPs cannot be located or have declared bankruptcy, the company's own share of liability has not materially increased. There are relatively few sites where the company is a major participant and the cost to the company of remediation at those sites and at all CERCLA sites in the aggregate, is not expected towill have a material impact on the financial position, liquidity or results of operations of the company.Total payments for previously accrued remediation activities under RCRA, CERCLA and similar state and global laws were $82 million, $72 million and $81 million in 2010, 2009 and 2008, respectively.Remediation AccrualsAt December 31, 2010, the Consolidated Balance Sheets included an accrued liability of $407 million related to activities under RCRA, CERCLA and similar state and global laws compared to $396 million at December 31, 2009. Considerable uncertainty exists with respect to environmental remediation costs, particularly those related to RCRA, and, under adverse changes in circumstances, potential liability may range up to two to three times the amount accrued as of December 31, 2010. Of the $407 million accrued liability, approximately nine percent was reserved for non-U.S. facilities. Approximately 68 percent of the reserve balance was attributable to RCRA and similar remediation liabilities, while about 23 percent was attributable to CERCLA liabilities. Increases to remediation accruals were $93 million, $89 million and $103 million for 2010, 2009 and 2008, respectively. Based on existing facts and circumstances, management does not believe that a material loss, in excess of amounts accrued, related to remediation activities at any individual site or location is reasonably possible.Part IIITEM 7. MANAGEMENT'S DISCUSSION AND ANALYSIS OF FINANCIAL CONDITION AND RESULTS OF OPERATIONS,continuedChanges in the remediation accruals balance at December 31, 2010, 2009 and 2008 are summarized below: $ 379 (72 ) 89 $ 396 (82 ) 93 $ 407 Pre-Tax Environmental ExpensesPre-tax environmental expenses charged to current operations in 2010, 2009 and 2008 are summarized below: At December 31, 2010 2009 2008 $ 501 $ 483 $ 525 93 89 103 $ 594 $ 572 $ 628 About 75 percent of total pre-tax environmental expenses charged to current operations in 2010 resulted from operations in the U.S. Total pre-tax environmental expenses charged to operations in 2010 increased $22 million versus 2009 due primarily to increased environmental research activities. Based on existing facts and circumstances, management does not believe that year over year changes, if any, in environmental expenses charged to current operations will have a material impact on the company's financial position, liquidity or results of operations.2010,2013, the company spent approximately $75$70 million on environmental capital projects either required by law or necessary to meet the company's internal environmental goals. The company currently estimates expenditures for environmental-related capital projects to be approximately $100$115 million in 2011.2014. In the U.S., significantadditional capital expenditures are expected to be required over the next decade for treatment, storage and disposal facilities for solid and hazardous waste and for compliance with the Clean Air Act (CAA). Until all CAA regulatory requirements are established and known, considerable uncertainty will remain regarding future estimates for future capital expenditures. Total CAA capitalHowever, management does not believe that the costs overto comply with these requirements will have a material impact on the next two years are currently estimated to range from $40 million to $70 million.will presentpresents risks and opportunities to businessopportunities. Expanding upon significant global greenhouse gas (GHG) emissions and society at large. Sinceother environmental footprint reductions made in the early 1990s whenperiod 1990-2004, the company began taking action to reduce greenhouse gasreduced its environmental footprint achieving in 2012 reductions of 25 percent in GHG emissions and 12 percent in water consumption versus our 2004 baselines. In addition, in 2012 the company has achieved major global reductionsa one percent reduction in emissions. Voluntary emissions reductions implemented byenergy intensity from non-renewable resources versus a 2010 baseline. The company continuously evaluates opportunities for existing and new product and service offerings in light of the companyanticipated demands of a low-carbon economy. About $2 billion of the company's 2012 revenue was generated from sales of products that help direct and other companies are valuable but alone will not be sufficient to effectively address a problem of this scale. downstream customers reduce GHG emissions.greenhouse gasGHG emissions and encourage lower carbon forms of energy.The Kyoto Protocol to the United Nations Framework Convention on Climate Change entered into force in February 2005 Such policies may bring higher operating costs as well as greater revenue and while not ratified by the U.S., has spurred policy action by many other countries and regions around the world, including the European Union. Considerable international attention is now focused on development of a post-2012 international policy framework to guide international action to address climate change when the KyotoPart IIITEM 7. MANAGEMENT'S DISCUSSION AND ANALYSIS OF FINANCIAL CONDITION AND RESULTS OF OPERATIONS,continuedProtocol expires in 2012. Proposed and existing legislativeLegislative efforts to control or limit greenhouse gasGHG emissions could affect the company's energy source and supply choices as well as increase the cost of energy and raw materials derived from fossil fuels. Such efforts are also anticipated to provide the business community with greater certainty for the regulatory future, help guide investment decisions, and drive growth in demand for low-carbon and energy-efficient products, technologies, and services.climate change.GHG emissions. Several of the company's facilities in the European Union (EU) are regulated under the EU Emissions Trading Scheme. China has begun pilot programs for trading of GHG emissions in selected areas and South Korea will begin to implement its emission trading scheme in 2015. In other countries, including the EU, U.S., and Japan, policy debate continues. efforts to reduce the GHG emissions associated with gases used in refrigeration and air conditioning create market opportunities for lower GHG solutions. The current unsettled policy environment in the U.S. adds an element of uncertainty to business decisions particularly those relating to long-term capital investments. If in the absence of federal legislation, states were to implement programs mandating greenhouse gas (GHG)GHG emissions reductions, the company, its suppliers and customers could be competitively disadvantaged by the added administrative costs and burden of complying with a variety of state-specific requirements.A 2007 U.S. Supreme Court ruling directed EPA to determine whether carbon dioxide endangers human health and, if so, to take steps to regulate it under the CAA. In December 2009, EPA made a determination that carbon dioxide emissions endanger human health and the environment requiring EPA to pursue regulation of carbon dioxide emissions under the CAA. phased inphased-in scheme to regulate GHG emissions first from large stationary sources under CAA regulations known as the Prevention of Significant Deterioration (PSD) rules. The PSD rules require thatexisting Clean Air Act permitting requirements administered by state and local authorities. As a result, large capital investments may be required to install Best Available Control Technology (BACT) be installed on major new or modified sources of GHG emissions. BACT controls for GHG emissions can require very large capital investments. EPA has not provided final guidance regarding BACT requirements. In addition, EPA in 2010 put in place operating permit requirements for major new or modified sources of GHG emissions. EPA will not require permits for smaller sources until 2016 or later. Both Congressional and litigation efforts are underway to delay or remove EPA's authority to regulate GHG emissions and to enforce GHG reporting and permitting regulations.market-based cap and trade program.program that incorporates policies that provide an economic balance that does not severely distort markets. Differences in regional or national legislation could present challenges in a global marketplace highlighting the need for coordinated global policy action.the fourth quarter 2009,2013 EPA issued the Final Mandatory Reporting of Greenhouse Gases Rule which requires reporting of GHG emissions in the United States beginning in 2010. The rule requires suppliers of fossil fuels or industrial greenhouse gases, manufacturers of vehicles and engines, and facilities that emit 25,000 metric tons orproposed more per year of GHG emissions to submit annual reports to EPA. The company has approximately 25 sites that have a stake in one or more of the covered gases, including several at which emissions monitoring equipment must be installed. Costs incurred in 2010 to comply with the rule were not material to the company. Based on the current state of rulemaking related to this rule, management does not expect future costs to comply with the rule will be material to the company's operations and consolidated financial position.The company assesses the potential risks that climate change could present, and looks for opportunities to make its overall portfolio less energy and emissions intensive. The company weighs energy use when investments or divestitures are considered. The company continuously evaluates opportunities for existing and new product and service offerings in light of the anticipated demands of a low-carbon economy.RegistrationThe goal of the U.S. Toxic Substances Control Act (TSCA) is to prevent unreasonable risks of injury to health or the environment associated with the manufacture, processing, distribution in commerce, use, or disposal of chemical substances. Under TSCA, the EPA has established reporting, record-keeping, testing and control-related requirementsstringent regulations for new Electric Generating Units (EGU's) that may affect the long term price and existing chemicals. In September 2009, EPA announced its comprehensive approach to enhance the Agency's current chemicals management program under TSCA, including developmentsupply of action plans.electricity. The Agency's actions on chemicals may include initiating regulatory action to label, restrict, or ban a chemical, or to require theTable of ContentsPart IIITEM 7. MANAGEMENT'S DISCUSSION AND ANALYSIS OF FINANCIAL CONDITION AND RESULTS OF OPERATIONS,The Performance Chcontinuedsubmission of additional data needed to determine the riskemicals segment used a chemical may pose. Also in 2009, EPA announced its "Essential Principle for Reform of Chemicals Management Legislation." The company is monitoring these developments under TSCA.In December 2006, the European Union adopted a new regulatory framework concerning the Registration, Evaluation and Authorization of Chemicals. This regulatory framework known as REACH entered into force on June 1, 2007. One of its main objectives is the protection of human health and the environment. REACH requires manufacturers and importers to gather information on the properties of their substances that meet certain volume or toxicological criteria and register the information in a central database to be maintained by the European Chemicals Agency. The Regulation also contains a mechanism for the progressive substitution of the most dangerous chemicals when suitable alternatives have been identified. Complete registrations containing extensive data on the characteristics of the chemical will be required in three phases, depending on production usage or tonnage imported per year, and the toxicological criteria of the chemical. The first registrations for substances that were preregistered in 2008 were required in 2010; subsequent registrations are due in 2013 and 2018. New substances that will be manufactured or imported need to be registered prior to being placed on the market (also known as non-phase-in substances). The company successfully completed the 2010 registrations and is working on the non-phase-in registrations. By June 1, 2011, companies must notify the European Chemicals Agency of products containing above 0.1 percent of substances of very high concern on the candidate list for authorization. There are now 46 such substances and the notice process may create pressure for substitution away from these substances. By June 1, 2013, the Commission will review whether substances with endocrine disruptive properties should be authorized if safer alternatives exist. Management does not expect that the costs to comply with REACH will be material to its operations and consolidated financial position.Facility SecurityDuPont recognizes that the security and safety of its operations are critical to its employees, neighbors and, indeed, to the future of the company. As such, the company has merged chemical site security into its safety core value where it serves as an integral part of its long standing safety culture. Physical security measures have been combined with process safety measures (including the use of inherently safer technology), administrative procedures and emergency response preparedness into an integrated security plan. The company has conducted vulnerability assessments at operating facilities in the U.S. and high priority sites worldwide and identified and implemented appropriate measures to protect these facilities from physical and cyber attacks. DuPont is partnering with carriers, including railroad, shipping and trucking companies, to secure chemicals in transit.In April 2007, the Department of Homeland Security (DHS) issued an interim final rule (Rule) that establishes risk-based performance standards for the security of U.S. chemical facilities. Covered chemical facilities are required to prepare Security Vulnerability Assessments that identify facility security vulnerabilities and to develop and implement Site Security Plans that include measures satisfying the identified risk-based performance standards. The Rule contains associated provisions addressing inspections and audits, recordkeeping, and the protection of information that constitutes Chemical-terrorism Vulnerability Information. DHS can seek compliance through the issuance of Orders, including Orders Assessing Civil Penalty and Orders for the Cessation of Operations.In June 2008, DHS notified those facilities that were preliminarily determined to be covered by the Rule's security requirements. DuPont facilities that were preliminarily determined to be covered conducted and submitted security vulnerability assessments to DHS. Based on its review of these assessments, DHS made final determinations as to which facilities were covered and the risk-base tier into which each falls. These facilities are submitting site security plans to DHS. Once DHS has reviewed and provided preliminary approval of the plans, it will meet with facilities before providing final approval. DuPont has already devoted substantial effort and resources in assessing security vulnerabilities and taking steps to reinforce security at its chemical manufacturing facilities. Until each facility develops and receives DHS approval for its site security plan, specific requirements cannot be determined and considerable uncertainty exists regarding estimates for future capital expenditures. However, based on guidance issued by DHS regarding its risk-based performance standards, it is expected that new security measures will need to be implementedPart IIITEM 7. MANAGEMENT'S DISCUSSION AND ANALYSIS OF FINANCIAL CONDITION AND RESULTS OF OPERATIONS,continuedat the regulated facilities and that total capital costs to implement such measures over the next 5 years will be about $50 million.PFOADuPont manufactures fluoropolymer resins and dispersions as well as fluorotelomers, marketing many of them under the Teflon® and Zonyl® brands. All of these products are part of the Performance Chemicals segment.Fluoropolymer resins and dispersions are high-performance materials with many end uses including architectural fabrics, telecommunications and electronic wiring insulation, automotive fuel systems, computer chip processing equipment, weather-resistant/breathable apparel and non-stick cookware. Fluorotelomers are used to make soil, stain and grease repellants for paper, apparel, upholstery and carpets as well as firefighting foams and coatings.A form of PFOA (collectively, perfluorooctanoic acid and its salts, including the ammonium salt) is used as a processing agentaid to manufacture some fluoropolymer resins and dispersions. For over 50 years, DuPont purchased itsresins. The Performance Materials segment used PFOA needs from a third party, but beginning in the manufacture of certain raw materials for perfluoroelastomer parts (and some fluoroelastomers). In the fall of 2002, itDuPont began producing rather than purchasing PFOA to support the manufacture of fluoropolymer resins and dispersions.these manufacturing processes. PFOA is not used in the manufacture of fluorotelomers; however, it is an unintended by-product present at trace levels in some fluorotelomer-based products.DuPont Performance Elastomers, LLC (DPE) uses PFOA in the manufacture of raw materials to manufacture Kalrez® perfluoroelastomer parts. PFOA is also used in the manufacture of some fluoroelastomers marketed by DPE under the Viton® trademark. The wholly owned subsidiary is a part of the Performance Materials segment.As a result, EPA initiated a process to enhance its understanding of the sources of PFOA in the environmentSignificant scientific research has been and the pathways through which human exposure to PFOA is occurring. In 2005, EPA issued a draft risk assessment on PFOA stating that the cancer data for PFOA may be best described as "suggestive evidence of carcinogenicity, but not sufficient to assess human carcinogenic potential" under EPA's Guidelines for Carcinogen Risk Assessment. At EPA's request, the Science Advisory Board (SAB) reviewed and commented on the scientific soundness of this assessment. In its May 2006 report, the SAB set forth the view, based on laboratory studies in rats, that the human carcinogenic potential of PFOA is more consistent with the Guidelines' descriptor of "likelycontinues to be carcinogenic." However,conducted to understand the report stated that additional data should be considered before EPA finalizes its risk assessment of PFOA. EPA has acknowledged that it will consider additional data, including new research and testing, and has indicated that another SAB review will be sought after EPA makes its risk assessment. DuPont disputes the cancer classification recommended in the SAB report. Although EPA has stated that there remains considerable scientific uncertainty regarding potential risks associated with PFOA, it also stated that it does not believe that there is any reason for consumers to stop using any products because of concerns about PFOA.DuPont respects EPA's position raising questions about exposure routes and the potential toxicityhazards of PFOA and DuPont and other companies have outlined plansPFOA. Regulatory agencies continue to continue research, emission reduction and product stewardship activitiesreview these studies to help address EPA's questions. evaluate potential regulation.In October 2010, (forDuPont has exceeded the year 2009), DuPont reported to EPA that it had achieved about a 99 percent reduction of PFOA emissions in U.S. manufacturing facilities. The company achieved about a 98 percent reduction in global manufacturing emissions, exceeding EPA's 2010 objective. In February 2007, DuPont announced its commitment to no longer make, use or buy PFOA by 2015, or sooner if possible. To achieve this goal, DuPont developed PFOA replacement technology and is converting customers to fluoropolymer resins and dispersions manufactured using the replacement technology. In addition since 2008, DuPont has been introducing its next generation fluorotelomers products and converting customers to their use.In2009, EPA announced2013, DuPont had already ceased the startmanufacture of a comprehensive approach to enhancing EPA's current chemicals management program under TSCA. As part of this enhancement, EPA released four Existing ChemicalPart IIITEM 7. MANAGEMENT'S DISCUSSION AND ANALYSIS OF FINANCIAL CONDITION AND RESULTS OF OPERATIONS,continuedAction Plans (the Plans) in December 2009 of which one covers long-chain perfluorinated chemicals (PFCs) including PFOA. The Plans outline the risks thatPFOA and discontinued the use of the specified chemicals may present and the specific steps that EPA will take to address concerns. EPA indicated that it intends to propose regulatory actions in 2012 to address the potential risks from PFCs, but the specific steps notedPFOA for production of fluoropolymer resins as well as for raw materials used in the PFCs Plan are generally consistent with the requirementsproduction of the 2010/2015 PFOA Stewardship Program.January 2009, EPA issued a national Provisional Health Advisory for PFOA of 0.4 parts per billion (ppb) in drinking water. In February 2007, NJDEP identified a preliminary drinking-water guidance level for PFOA of 0.04 ppb as part of the first phase of an ongoing process to establish a state drinking-water standard. During the first quarter 2009, NJDEP began the process to establish a permanent Maximum Contaminant Level (MCL) for PFOA in drinking water. The process is estimated to take 1 to 2 years. While NJDEP will continue sampling and evaluation of data from all sources, it has not recommended a change in consumption patterns.Based on extensive health and toxicological studies, DuPont believes that PFOA exposure does not pose a health risk to the general public. Human studies have evaluated many health endpoints across a wide range of exposed populations. While some associations have been reported, no human health effects are known to be caused by PFOA. A considerable number of human health studies are ongoing and results will be available over the next several years.There have not been any regulatory or government actions that prohibit the production or use of PFOA. However, there can be no assurance that there will not be in the future. Products currently manufactured byaddition, the company representing approximately $1 billion of 2010 revenues could be affected by any such regulation or prohibition. DuPont has established reservescontinues to make progress in connectionreplacing fluorotelomer-based products with certainalternative products.environmental and litigation matters, (seesee Note 1916 to the Consolidated Financial Statements).Financial InstrumentsDerivative instruments utilized include forwards, options, futures and swaps. The counterparties toFor additional information on these contractual arrangements are major financial institutions and major commodity exchanges.The company hedges certain foreign currency-denominated revenues, monetary assets and liabilities, certain business-specific foreign currency exposures and certain energy and agricultural feedstock purchases.Concentration of Credit RiskFinancial instruments that potentially subject the company to significant concentrations of credit risk consist principally of cash, investments, accounts receivable and derivatives.As part of the company's financial risk management processes, it continuously evaluates the relative credit standing of all of the financial institutions that service DuPont and monitors actual exposures versus established limits. The company has not sustained credit losses from instruments held at financial institutions.The company maintains cash and cash equivalents, marketable securities, derivatives and certain other financial instruments with various financial institutions. These financial institutions are generally highly rated and geographically dispersed and the company has a policy to limit the dollar amount of credit exposure with any one institution.The company's sales are not materially dependent on a single customer or small group of customers. As of December 31, 2010, no one individual customer balance represented more than 5 percent of the company's total outstanding receivables balance. Credit risk associated with its receivables balance is representative of the geographic, industry and customer diversity associated with the company's global businesses.Part IIITEM 7A. QUANTITATIVE AND QUALITATIVE DISCLOSURES ABOUT MARKET RISK,continuedThe company also maintains strong credit controls in evaluating and granting customer credit. As a result, it may require that customers provide some type of financial guarantee in certain circumstances. Length of terms for customer credit varies by industry and region.Foreign Currency RiskThe company's objective in managing exposure to foreign currency fluctuations is to reduce earnings and cash flow volatility associated with foreign currency rate changes. Accordingly, the company enters into various contracts that change in value as foreign exchange rates change to protect the U.S. dollar value of its existing foreign currency-denominated assets, liabilities, commitments, and cash flows.The company uses foreign currency exchange contracts to offset its netrelated exposures, by currency, relatedsee Note 20 to the foreign currency-denominated monetary assets and liabilities of its operations. The primary business objective of this hedging program is to maintain an approximately balanced position in foreign currencies so that exchange gains and losses resulting from exchange rate changes, net of related tax effects, are minimized. The company also uses foreign currency exchange contracts to offset a portion of the company's exposure to certain foreign currency-denominated revenues so that gains and losses on these contracts offset changes in the U.S. dollar value of the related foreign currency-denominated revenues. The objective of the hedge program is to reduce earnings and cash flow volatility related to changes in foreign currency exchange rates.thisthe company's foreign currency hedging program on the company's results of operations for the years ended December 31, 2010, 20092013, 2012, and 2008,2011, and includes the company's pro rata share of its equity affiliates' exchange gains and losses and corresponding gains and losses on foreign currency exchange contracts.contracts: 2010 2009 2008 2013 2012 2011 $ (13 ) $ (205 ) $ (255 ) $ (128 ) $ (215 ) $ (146 ) (71 ) 91 83 $ (84 ) $ (114 ) $ (172 ) Tax benefit 42 73 81 After-tax exchange loss $ (86 ) $ (142 ) $ (65 ) FromInterest Rate RiskThe company uses interest rate swaps to manage the interest rate mix of the total debt portfolio and related overall cost of borrowing.Interest rate swaps involve the exchange of fixed or floating rate interest payments to effectively convert fixed rate debt into floating rate debt based on USD LIBOR. Interest rate swaps allow the company to maintain a target range of floating rate debt.Commodity Price RiskThe company enters into over-the-counter and exchange-traded derivative commodity instruments to hedge its exposure to price fluctuations on certain raw material purchases.A portion of certain energy feedstock purchases are hedged to reduce price volatility using fixed price swaps and options.The company contracts with independent growers to produce finished seed inventory. Under these contracts, growers are compensated with bushel equivalents that are marketed to the company for the market price of grain during thePart IIITEM 7A. QUANTITATIVE AND QUALITATIVE DISCLOSURES ABOUT MARKET RISK,continuedcontract period. Derivative instruments having a high correlation to the underlying commodity are used to hedge the commodity price risk involved in compensating growers.The company utilizes derivatives to manage the price volatility of soybean meal. These derivative instruments have a high correlation to the underlying commodity exposure and are deemed effective in offsetting soybean meal feedstock price risk.Additional details on these and other financial instruments are set forth in Note 23 to the Consolidated Financial Statements.20102013 and 2009,2012, and the effect on fair values of a hypothetical adverse change in the market prices or rates that existed at December 31, 20102013 and 2009.2012. The sensitivity for interest rate swaps is based on a one percent change in the market interest rate. Foreign currency and energy derivativecommodity contracts sensitivities are based on a 10 percent change in market rates. Fair Value
Asset/(Liability) Fair Value
Sensitivity 2010 2009 2010 2009 2013 2012 2013 2012 $ 40 $ - $ (51 ) $ (60 ) $ 29 $ 55 $ (18 ) $ (29 ) 53 97 (697 ) (752 ) 18 9 (1,000 ) (659 ) (72 ) (101 ) (79 ) (119 ) Commodity contracts (1 ) (1 ) (2 ) (3 ) Part II2010,2013, the company's Chief Executive Officer (CEO) and Chief Financial Officer (CFO), together with management, conducted an evaluation of the effectiveness of the company's disclosure controls and procedures pursuant to Rules 13a-15(e) and 15d-15(e) of the Exchange Act. Based on that evaluation, the CEO and CFO concluded that these disclosure controls and procedures are effective.20102013 that has materially affected, or is reasonably likely to materially affect, the company's internal control over financial reporting. The company has completed its evaluation of its internal controls and has concluded that the company's system of internal controls over financial reporting was effective as of December 31, 20102013 (see page F-2).The company continues to take appropriate steps to enhance the reliability of its internal control over financial reporting. Management has identified areas for improvement and discussed them with the company's Audit Committee and independent registered public accounting firm.The company owns and operates a surface mine near Starke, Florida. The Mine Safety and Health Administration proposed and DuPont paid total penalties of one thousand six hundred and fifty-eight dollars for all citations issued in 2010, including two violations that could significantly and substantially contribute to the cause and effect of a mine safety or health hazard under the Mine Safety and Health Act of 1977. No citations were received in the fourth quarter 2010.Proxy. Information related to directors is included within the section entitled, "Election of Directors." The company has not made any material changes to the procedures by which security holders may recommend nominees to its Board of Directors since these procedures were communicated in the company's 2010 Proxy, Statement for the Annual Meeting of Stockholders held on April 28, 2010. Information related to the Audit Committee is incorporated herein by reference to the Proxy and is includedincluding information within the sections entitled, "Committees"Election of Directors," "Governance of the Board" and "Committee Membership.Company-Committees of the Board," Information regarding executive officers is contained in"Governance of the Proxy section entitledCompany-Committee Membership," "Section 16(a) Beneficial Ownership Reporting Compliance"Compliance," and as set forth below.Investor Center"Investors" and then Corporate"Corporate Governance." Any amendments to, or waiver from, any provision of the code will be posted on the company's website at the above address.8, 2011,5, 2014, of the company's Executive Officers: Age Executive
Officer
Since Age 55 2006 58 2006 55 2004 58 2004 58 2000 Executive Vice President Benito Cachinero-Sánchez 55 2011 Senior Vice President - Human Resources Thomas M. Connelly, Jr. 61 2000 Executive Vice President and Chief Innovation Officer 54 2009 57 2009 Executive Vice President and Chief Financial Officer 60 2008 63 2008 Senior Vice President and General Counsel 53 2009 56 2009 Executive Vice President TableBenito Cachinero-Sánchez joined DuPont in April 2011 as Senior Vice President - Human Resources. Prior to joining DuPont, he was Corporate Vice President of ContentsHuman Resources at Automatic Data Processing (ADP). Prior to ADP, he was Vice President, Human Resources for the Medical Devices & Diagnostics Group of Johnson & Johnson.In October 2009, he added responsibility for DuPont Performance Polymers, Packaging & Industrial Polymers, Applied BioSciences, Nutrition & Health as well as integrated operations.His current responsibilities include Integrated Operations, Science and Technology and leadership of the regions outside of the United States.President withPresident. Mr. Vergnano has responsibility for businesses in the Performance Chemicals segment: DuPont Protection Technologies, Building Innovations, Sustainable Solutions, Chemicals & Fluoroproducts and Titanium Technologies and Electronics & Communications. HeTechnologies. In January 2014, DuPont announced that Mr. Vergnano would focus on activities related to the company’s announced intention to separate Performance Chemicals; DuPont also leadsannounced that Mr. Vergnano will become the company's sustainability, safety, communications, and sales and marketing functions.chief executive officer of the new Performance Chemicals company after separation, which is expected to occur about mid-2015.and is included inincluding information within the sections entitled, "Compensation Discussion and Analysis," "2010 Summary"Compensation of Executive Officers," "Directors' Compensation, Table," " 2010 Grants of Plan-Based Awards," "Outstanding Equity Awards," "2010 Option Exercises and Stock Vested," "Pension Benefits," "Nonqualified Deferred Compensation," "Potential Payments Upon Termination or Change in Control," and "Directors' Compensation." Information related to the Compensation Committee is included within the sections entitled "Compensation Committee Interlocks and Insider Participation" and "Compensation Committee Report."Information with respect to Beneficial Owners is incorporated herein by reference to the Proxy and is included in the section entitled "Ownership of Company Stock."Securities authorized for issuance under equity compensation plans as of December 31, 2010(Shares in thousands, except per share) Plan Category Number of Securities to
be Issued Upon Exercise
of Outstanding Options,
Warrants and Rights Weighted-Average
Exercise Price of
Outstanding Options,
Warrants and Rights2 Number of Securities
Remaining Available
for Future Issuance
Under Equity
Compensation Plans3 58,797 1 $ 37.71 22,529 10,335 4 $ 44.47 — 5 69,132 $ 38.82 22,529 1Includes stock-settled time-vested and performance-based restricted stock units granted and stock units deferred under the company's Equity and Incentive Plan, Stock Performance Plan, Variable Compensation Plan and the Stock Accumulation and Deferred Compensation Plan for Directors. Performance-based restricted stock units reflect the maximum number of shares to be awarded at the conclusion of the performance cycle (200 percent of the original grant). The actual award payouts can range from zero to 200 percent of the original grant.2Represents the weighted-average exercise price of the outstanding stock options only; the outstanding stock-settled time-vested and performance-based restricted stock units and deferred stock units are not included in this calculation.3Reflects shares available pursuant to the issuance of stock options, restricted stock, restricted stock units or other stock-based awards under the Equity and Incentive Plan approved by the shareholders on April 25, 2007 (see Note 22 to the company's Consolidated Financial Statements). The maximum number of shares of stock reserved for the grant or settlement of awards under the Equity and Incentive Plan (the "Share Limit") shall be 60,000 and shall be subject to adjustment as provided therein; provided that each share in excess of 20,000 issued under the Equity and Incentive Plan pursuant to any award settled in stock, other than a stock option or stock appreciation right, shall be counted against the foregoing Share Limit as four shares for every one share actually issued in connection with such award. (For example, if 22,000 shares of restricted stock are granted under the Equity and Incentive Plan, 28,000 shall be charged against the Share Limit in connection with that award.)4Includes 9 deferred stock units resulting from base salary and short-term incentive ("STIP") deferrals under the Management Deferred Compensation Plan ("MDCP"). Under the MDCP, a select group of management or highly compensated employees can elect to defer the receipt of their base salary, STIP or Long Term Incentive (LTI) award. LTI deferrals are included in footnote 1 to the above chart. The company does not match deferrals under the MDCP. There are seven core investment options under the MDCP for base salary and STIP deferrals, including deferred stock units with dividend equivalents credited as additional stock units. In general, deferred stock units are distributed in the form of DuPont common stock and may be made in the form of lump sum at a specified future date prior to retirement or a lump sum or annual installments after separation from service. Shareholder approval of the MDCP was not required under the rules of the New York Stock Exchange. This column also includes the following: (i) options totaling 9,811 granted under the company's 2002 Corporate Sharing Program (see Note 22 to the Consolidated Financial Statements); and (ii) 515 options from the conversion of DuPont Canada options to DuPont options in connection with the company's acquisition of the minority interest in DuPont Canada.5There is no limit on the number of shares that can be issued under the MDCP and no further shares are available for issuance under the other equity compensation arrangements described in footnote 4 to the above chart.Part IIIITEM 13. CERTAIN RELATIONSHIPS AND RELATED TRANSACTIONS AND DIRECTOR INDEPENDENCEInformation with respect to the company's policy and procedures for the review, approval or ratification of transactions with related persons is incorporated by reference herein to the Proxy and is included in the section entitled "Review and Approval of Transactions with Related Persons." Information with respect to director independence is incorporated by reference herein to the Proxy and is included in the sections entitled "DuPont Board of Directors—Corporate Governance Guidelines," "Guidelines for Determining the Independence of DuPont Directors," "Committees of the Board" and "Committee Membership."ITEM 14. PRINCIPAL ACCOUNTANT FEES AND SERVICESPlan Category 27,171 $ 41.58 51,252 15 — — Total 27,186 $ 41.58 51,252 Includes stock-settled time-vested and performance-based restricted stock units granted and stock units deferred under the company's Equity and Incentive Plan, Stock Performance Plan, Variable Compensation Plan and the Stock Accumulation and Deferred Compensation Plan for Directors. Performance-based restricted stock units reflect the maximum number of shares to be awarded at the conclusion of the performance cycle (200 percent of the original grant). The actual award payouts can range from zero to 200 percent of the original grant. Represents the weighted-average exercise price of the outstanding stock options only; the outstanding stock-settled time-vested and performance-based restricted stock units and deferred stock units are not included in this calculation. Reflects shares available pursuant to the issuance of stock options, restricted stock, restricted stock units or other stock-based awards under the amended Equity and Incentive Plan approved by the shareholders in April 2011 (see Note 19 to the company's Consolidated Financial Statements). The maximum number of shares of stock reserved for the grant or settlement of awards under the Equity and Incentive Plan (Share Limit) shall be 110,000 and shall be subject to adjustment as provided therein; provided that each share in excess of 30,000 issued under the Equity and Incentive Plan pursuant to any award settled in stock, other than a stock option or stock appreciation right, shall be counted against the foregoing Share Limit as four and one-half shares for every one share actually issued in connection with such award. (For example, if 32,000 shares of restricted stock are granted under the Equity and Incentive Plan, 39,000 shall be charged against the Share Limit in connection with that award.) Includes 15 deferred stock units resulting from base salary and short-term incentive (STIP) deferrals under the Management Deferred Compensation Plan (MDCP). Under the MDCP, a select group of management or highly compensated employees can elect to defer the receipt of their base salary, STIP or Long Term Incentive (LTI) award. LTI deferrals are included in footnote 1 to the above chart. The company does not match deferrals under the MDCP. There are seven core investment options under the MDCP for base salary and STIP deferrals, including deferred stock units with dividend equivalents credited as additional stock units. In general, deferred stock units are distributed in the form of DuPont common stock and may be made in the form of lump sum at a specified future date prior to retirement or a lump sum or annual installments after separation from service. Shareholder approval of the MDCP was not required under the rules of the New York Stock Exchange. There is no limit on the number of shares that can be issued under the MDCP and no further shares are available for issuance under the other equity compensation arrangements described in footnote 4 to the above chart. included inincorporated herein by reference to the Proxy, including information within the sections entitled, "Governance of the Company-Review and Approval of Transactions with Related Persons" and "Governance of the Company-Corporate Governance Guidelines," "Governance of the Company-Committees of the Board," "Governance of the Company-Committee Membership" and "Election of Directors".(a)Financial Statements, Financial Statement Schedules and Exhibits:1.Financial Statements (See the Index to the Consolidated Financial Statements on page F-1 of this report).2.Financial Statement Schedules(a) Financial Statements, Financial Statement Schedules and Exhibits: 1. Financial Statements (See the Index to the Consolidated Financial Statements on page F-1 of this report). 2. Financial Statement Schedules Year Ended December 31, 2010 2009 2008 2013 2012 2011 $ 322 $ 238 $ 261 $ 243 $ 292 $ 326 75 112 41 72 33 73 (71 ) (28 ) (64 ) (46 ) (64 ) (107 ) Amounts related to the Performance Coatings business — (18 ) — $ 326 $ 322 $ 238 $ 269 $ 243 $ 292 $ 1,759 $ 1,693 $ 1,424 $ 1,914 $ 1,971 $ 1,666 (19 ) 55 (43 ) Net charges (benefits) to income tax expense 29 (77 ) 73 — — 328 (205 ) 10 236 (74 ) 11 (16 ) 26 10 (4 ) $ 1,666 $ 1,759 $ 1,693 $ 1,764 $ 1,914 $ 1,971 The following should be read in conjunction with the previously referenced Consolidated Financial Statements:Condensed financial information of the parent company is omitted because restricted net assets of consolidated subsidiaries do not exceed 25 percent of consolidated net assets. Footnote disclosure of restrictions on the ability of subsidiaries and affiliates to transfer funds is omitted because the restricted net assets of subsidiaries combined with the company's equity in the undistributed earnings of affiliated companies does not exceed 25 percent of consolidated net assets at December 31, 2010.Separate financial statements of affiliated companies accounted for by the equity method are omitted because no such affiliate individually constitutes a 20 percent significant subsidiary.3.Exhibits3. Exhibits Description 3.1 Company's Restated Certificate of Incorporation (incorporated by reference to Exhibit 3.1 to the company'scompany’s Annual Report on Form 10-K for the year ended December 31, 2007)2012).3.2
Company's3.2 Company’s Bylaws, as last amended effective November 1, 2009August 12, 2013 (incorporated by reference to Exhibit 3.2 to the company's Annualcompany’s Quarterly Report on Form 10-K10-Q for the yearperiod ended December 31, 2009)September 30, 2013).4
4 The company agrees to provide the Commission, on request, copies of instruments defining the rights of holders of long-term debt of the company and its subsidiaries. 10.1*
10.1* The DuPont Stock Accumulation and Deferred Compensation Plan for Directors, as last amended effective January 1, 2009 (incorporated by reference to Exhibit 10.1 to the company's Annual Report on Form 10-K for the year ended December 31, 2008).2009.10.2*
Company's10.2* Company’s Supplemental Retirement Income Plan, as last amended effective June 4, 1996 (incorporated by reference to Exhibit 10.310.2 to the company's Annual Report on Form 10-K for the year ended December 31, 2006)2011).10.3*
Company's10.3* Company’s Pension Restoration Plan, as restated effective July 17, 2006 (incorporated by reference to Exhibit 99.110.3 to the company's Currentcompany’s Quarterly Report on Form 8-K filed on July 20, 2006)10-Q for the period ended June 30, 2011).10.4*
Company's10.4* Company’s Rules for Lump Sum Payments, adopted July 17, 2006as last amended effective December 20, 2007 (incorporated by reference to Exhibit 99.210.4 to the company's Currentcompany’s Quarterly Report on Form 8-K filed on July 20, 2006)10-Q for the period ended June 30, 2011).10.5*
Company's10.5* Company’s Stock Performance Plan, as last amended effective January 25, 2007 (incorporated by reference to Exhibit 10.5 to the company's Annual Report on Form 10-K for the year ended December 31, 2011). 10.6* Company’s Equity and Incentive Plan as amended October 23, 2013. 10.7* Form of Award Terms under the company’s Equity and Incentive Plan (incorporated by reference to Exhibit 10.7 to the company’s Quarterly Report on Form 10-Q for the period ended June 30, 2013). 10.8* Company’s Retirement Savings Restoration Plan, as last amended effective January 1, 2013 (incorporated by reference to Exhibit 10.8 to the company’s Annual Report on Form 10-K for the year ended December 31, 2012). 10.9* Company’s Retirement Income Plan for Directors, as last amended January 2011 (incorporated by reference to Exhibit 10.9 to the company's Quarterly Report on Form 10-Q for the period ended March 31, 2007)2012).10.6*
Company's Equity and Incentive Plan as approved by the company's shareholders on April 25, 2007 (incorporated by reference to pages C1-C13 of the company's Annual Meeting Proxy Statement dated March 19, 2007).10.7*10.10*
Form of Award Terms under the company's Equity and Incentive Plan (incorporated by reference to Exhibit 10.8 to the company's Quarterly Report on Form 10-Q for the period ended March 31, 2009).10.8*Company's Retirement Savings Restoration Plan, as last amended effective January 1, 2009 (incorporated by reference to Exhibit 10.16 to the company's Quarterly Report on Form 10-Q for the period ended June 30, 2008).10.9*Company's Retirement Income Plan for Directors, as last amended August 1995 (incorporated by reference to Exhibit 10.17 to the company's Annual Report on Form 10-K for the year ended December 31, 2007).10.10*Company's Bicentennial Corporate Sharing Plan, adopted by the Board of Directors on December 12, 2001 and effective January 9, 2002 (incorporated by reference to Exhibit 10.19 to the company's Quarterly Report on Form 10-Q for the quarter ended September 30, 2007).10.11*
Company's Management Deferred Compensation Plan, adopted on May 2, 2008, as last amended May 12, 2010 (incorporated by reference to Exhibit 10.11 to the company's Quarterly Report on Form 10-Q for the period ended June 30, 2010).Part IVITEM 15. EXHIBITS AND FINANCIAL STATEMENT SCHEDULES,continued10.11* Company's Senior Executive Severance Plan, adopted on August 12, 2013 (incorporated by reference to Exhibit NumberDescription10.12* Supplemental Deferral Terms for Deferred Long Term Incentive Awards and Deferred Variable Compensation AwardsAwards.12 Computation of Ratio of Earnings to Fixed Charges. 18.1 Preferability Letter of Independent Registered Public Accounting Firm (incorporated by reference to Exhibit 10.1518.1 to the company's Annualcompany’s Quarterly Report on Form 10-K10-Q for the yearperiod ended DecemberMarch 31, 2008)2013).10.13
Announcement Agreement dated January 9, 2011, among Danisco A/S, the company and Denmark Holding ApS. (incorporated by reference to Exhibit 2.1 to the company's Current Report on Form 8-K filed on January 12, 2011.) The company agrees to furnish supplementally a copy of any omitted schedule to the Commission upon request.1221
Computation of the Ratio of Earnings to Fixed Charges.21
Subsidiaries of the Registrant.23
23 Consent of Independent Registered Public Accounting Firm. 31.1
31.1 Rule 13a-14 (a)13a-14(a)/15d-14 (a)15d-14(a) Certification of the company'scompany’s Principal Executive Officer.31.2
31.2 Rule 13a-14 (a)13a-14(a)/15d-14 (a)15d-14(a) Certification of the company'scompany’s Principal Financial Officer.32.1
32.1 Section 1350 Certification of the company'scompany’s Principal Executive Officer. The information contained in this Exhibit shall not be deemed filed with the Securities and Exchange Commission nor incorporated by reference in any registration statement filed by the registrant under the Securities Act of 1933, as amended.32.2
32.2 Section 1350 Certification of the company'scompany’s Principal Financial Officer. The information contained in this Exhibit shall not be deemed filed with the Securities and Exchange Commission nor incorporated by reference in any registration statement filed by the registrant under the Securities Act of 1933, as amended.101.INS
95 Mine Safety Disclosures. 101.INS XBRL Instance Document 101.SCH
101.SCH XBRL Taxonomy Extension Schema Document 101.CAL
101.CAL XBRL Taxonomy Extension Calculation Linkbase Document 101.DEF
101.DEF XBRL Taxonomy Extension Definition Linkbase Document 101.LAB
101.LAB XBRL Taxonomy Extension Label Linkbase Document 101.PRE
101.PRE XBRL Taxonomy Extension Presentation Linkbase Document *Management contract or compensatory plan or arrangement required to be filed as an exhibit to this Form 10-K.* Management contract or compensatory plan or arrangement required to be filed as an exhibit to this Form 10-K. February 8, 20115, 2014 E. I. DU PONT DE NEMOURS AND COMPANY
By:By:
/s/ NICHOLAS C. FANANDAKIS
Nicholas C. FanandakisSignature Title(s)Date/s/ E. J. KULLMANE. J. Kullman Chair of the Board of Directors andChief Executive Officer and Director(Principal Executive Officer)Title(s) February 8, 2011Date/s/ S. W. BODMANS. W. BodmanDirectorFebruary 8, 2011/s/ R. H. BROWNR. H. BrownDirectorFebruary 8, 2011/s/ R. A. BROWNR. A. BrownDirectorFebruary 8, 2011/s/ B. P. COLLOMBB. P. CollombDirectorFebruary 8, 2011/s/ C. J. CRAWFORDC. J. CrawfordDirectorFebruary 8, 2011/s/ A. M. CUTLERA. M. CutlerDirectorFebruary 8, 2011/s/ J. T. DILLONJ. T. DillonDirectorFebruary 8, 2011/s/ E. I. DU PONT, IIE. I. du Pont, IIDirectorFebruary 8, 2011/s/ M. A. HEWSONM. A. HewsonDirectorFebruary 8, 2011/s/ L. D. JULIBERL. D. JuliberDirectorFebruary 8, 2011/s/ W. K. REILLYW. K. ReillyDirectorFebruary 8, 2011E.I. du Pont de Nemours and CompanyIndex to the Consolidated Financial StatementsPage(s) Consolidated Financial Statements: /s/ E.J. Kullman February 5, 2014 E. J. Kullman /s/ L. Andreotti Director February 5, 2014 L. Andreotti /s/ R.H. Brown Director February 5, 2014 R. H. Brown /s/ R.A. Brown Director February 5, 2014 R. A. Brown /s/ B.P. Collomb Director February 5, 2014 B. P. Collomb /s/ C.J. Crawford Director February 5, 2014 C. J. Crawford /s/ A.M. Cutler Director February 5, 2014 A. M. Cutler /s/ E.I. du Pont, II Director February 5, 2014 E. I. du Pont, II /s/ M.A. Hewson Director February 5, 2014 M. A. Hewson /s/ L.D. Juliber Director February 5, 2014 L. D. Juliber /s/ L.M. Thomas Director February 5, 2014 L. M. Thomas /s/ P.J. Ward Director February 5, 2014 P. J. Ward Page(s) Consolidated Financial Statements: i.pertain to the maintenance of records that, in reasonable detail, accurately and fairly reflect the transactions and dispositions of the assets of the company;ii.provide reasonable assurance that transactions are recorded as necessary to permit preparation of financial statements in accordance with generally accepted accounting principles and that receipts and expenditures of the company are being made only in accordance with authorization of management and directors of the company; andiii.provide reasonable assurance regarding prevention or timely detection of unauthorized acquisitions, use or disposition of the company's assets that could have a material effect on the financial statements.i. pertain to the maintenance of records that, in reasonable detail, accurately and fairly reflect the transactions and dispositions of the assets of the company; ii. provide reasonable assurance that transactions are recorded as necessary to permit preparation of financial statements in accordance with generally accepted accounting principles and that receipts and expenditures of the company are being made only in accordance with authorization of management and directors of the company; and iii. provide reasonable assurance regarding prevention or timely detection of unauthorized acquisitions, use or disposition of the company's assets that could have a material effect on the financial statements. 2010,2013, based on criteria set forth by the Committee of Sponsoring Organizations of the Treadway Commission (COSO) inInternal Control-Integrated Framework (1992). Based on its assessment and those criteria, management concluded that the company maintained effective internal control over financial reporting as of December 31, 2010.2013.December 31, 2010, as stated in their report, which is presented on the following page.

8, 20115, 2014stockholders'comprehensive income, equity and cash flows present fairly, in all material respects, the financial position of E. I. du Pont de Nemours and Company and its subsidiaries at December 31, 20102013 and 2009,2012, and the results of their operations and their cash flows for each of the three years in the period ended December 31, 20102013 in conformity with accounting principles generally accepted in the United States of America. In addition, in our opinion, the financial statement schedule listed in the index appearing under Item 15(a) (2) presents fairly, in all material respects, the information set forth therein when read in conjunction with the related consolidated financial statements. Also in our opinion, the Company maintained, in all material respects, effective internal control over financial reporting as of December 31, 2010,2013, based on criteria established inInternal Control –- Integrated Framework (1992) issued by the Committee of Sponsoring Organizations of the Treadway Commission (COSO). The Company's management is responsible for these financial statements and financial statement schedule, for maintaining effective internal control over financial reporting and for its assessment of the effectiveness of internal control over financial reporting, included in "Management's Report on Internal Control over Financial Reporting" appearing on page F-2. Our responsibility is to express opinions on these financial statements, on the financial statement schedule and on the Company's internal control over financial reporting based on our integrated audits. We conducted our audits in accordance with the standards of the Public Company Accounting Oversight Board (United States). Those standards require that we plan and perform the audits to obtain reasonable assurance about whether the financial statements are free of material misstatement and whether effective internal control over financial reporting was maintained in all material respects. Our audits of the financial statements included examining, on a test basis, evidence supporting the amounts and disclosures in the financial statements, assessing the accounting principles used and significant estimates made by management, and evaluating the overall financial statement presentation. Our audit of internal control over financial reporting included obtaining an understanding of internal control over financial reporting, assessing the risk that a material weakness exists, and testing and evaluating the design and operating effectiveness of internal control based on the assessed risk. Our audits also included performing such other procedures as we considered necessary in the circumstances. We believe our audits provide a reasonable basis for our opinions.company'scompany’s internal control over financial reporting is a process designed to provide reasonable assurance regarding the reliability of financial reporting and the preparation of financial statements for external purposes in accordance with generally accepted accounting principles. A company'scompany’s internal control over financial reporting includes those policies and procedures that (i) pertain to the maintenance of records that, in reasonable detail, accurately and fairly reflect the transactions and dispositions of the assets of the company; (ii) provide reasonable assurance that transactions are recorded as necessary to permit preparation of financial statements in accordance with generally accepted accounting principles, and that receipts and expenditures of the company are being made only in accordance with authorizations of management and directors of the company; and (iii) provide reasonable assurance regarding prevention or timely detection of unauthorized acquisition, use, or disposition of the company'scompany’s assets that could have a material effect on the financial statements.
8, 20115, 2014 For the year ended December 31, For the year ended December 31, 2010 2009 2008 2013 2012 2011 $ 31,505 $ 26,109 $ 30,529 $ 35,734 $ 34,812 $ 33,681 1,228 1,219 1,307 410 498 742 32,733 27,328 31,836 23,146 19,708 23,548 Total 36,144 35,310 34,423 Cost of goods sold 22,548 21,538 21,264 Other operating charges 3,838 4,077 3,510 3,669 3,440 3,593 3,554 3,527 3,310 1,651 1,378 1,393 2,153 2,123 1,960 590 408 376 448 464 447 (34 ) 210 535 29,022 25,144 29,445 3,711 2,184 2,391 659 415 381 Employee separation / asset related charges, net 114 493 53 Total 32,655 32,222 30,544 Income from continuing operations before income taxes 3,489 3,088 3,879 Provision for income taxes on continuing operations 626 616 647 Income from continuing operations after income taxes 2,863 2,472 3,232 Income from discontinued operations after income taxes 1,999 308 367 3,052 1,769 2,010 4,862 2,780 3,599 21 14 3 14 25 40 $ 3,031 $ 1,755 $ 2,007 $ 4,848 $ 2,755 $ 3,559 Basic earnings per share of common stock: Basic earnings per share of common stock from continuing operations $ 3.07 $ 2.61 $ 3.43 Basic earnings per share of common stock from discontinued operations 2.16 0.33 0.40 $ 3.32 $ 1.93 $ 2.21 $ 5.22 $ 2.94 $ 3.82 Diluted earnings per share of common stock: Diluted earnings per share of common stock from continuing operations $ 3.04 $ 2.59 $ 3.38 Diluted earnings per share of common stock from discontinued operations 2.14 0.33 0.39 $ 3.28 $ 1.92 $ 2.20 $ 5.18 $ 2.91 $ 3.77 Dividends per share of common stock $ 1.78 $ 1.70 $ 1.64 F-8.F-9.BALANCE SHEETS
STATEMENTS OF COMPREHENSIVE INCOME December 31, 2010 2009 $ 4,263 $ 4,021 2,538 2,116 5,635 5,030 5,967 5,380 122 129 534 612 19,059 17,288 29,967 28,915 18,628 17,821 11,339 11,094 2,617 2,137 2,704 2,552 1,041 1,014 3,650 4,100 $ 40,410 $ 38,185 $ 4,360 $ 3,542 133 1,506 225 154 4,671 4,188 9,389 9,390 10,137 9,528 11,026 11,490 115 126 30,667 30,534 167 167 70 70 301 297 9,227 8,469 12,030 10,710 (5,790 ) (5,771 ) (6,727 ) (6,727 ) 9,278 7,215 465 436 9,743 7,651 $ 40,410 $ 38,185 For the year ended December 31, 2013 2012 2011 Net income $ 4,862 $ 2,780 $ 3,599 Other comprehensive income (loss), before tax: Cumulative translation adjustment 25 77 (457 ) Net revaluation and clearance of cash flow hedges to earnings: Additions and revaluations of derivatives designated as cash flow hedges (58 ) 8 10 Clearance of hedge results to earnings (25 ) (65 ) 96 Net revaluation and clearance of cash flow hedges to earnings (83 ) (57 ) 106 Pension benefit plans: Net gain (loss) 3,293 (1,433 ) (4,069 ) Prior service benefit (cost) 62 22 (2 ) Reclassifications to net income: Amortization of prior service cost 8 13 16 Amortization of loss 957 887 613 Curtailment / settlement loss 153 7 — Pension benefit plans, net 4,473 (504 ) (3,442 ) Other benefit plans: Net gain (loss) 513 (60 ) (437 ) Prior service benefit (cost) 211 857 (11 ) Reclassifications to net income: Amortization of prior service benefit (195 ) (155 ) (121 ) Amortization of loss 76 94 60 Curtailment / settlement (gain) loss (153 ) 3 — Other benefit plans, net 452 739 (509 ) Net unrealized gain (loss) on securities 1 (2 ) 2 Other comprehensive income (loss), before tax 4,868 253 (4,300 ) Income tax (expense) benefit related to items of other comprehensive income (1,665 ) (121 ) 1,322 Other comprehensive income (loss), net of tax 3,203 132 (2,978 ) Comprehensive income 8,065 2,912 621 Less: Comprehensive income attributable to noncontrolling interests 12 53 22 Comprehensive income attributable to DuPont $ 8,053 $ 2,859 $ 599 F-8.F-9.STATEMENTS OF STOCKHOLDERS' EQUITY
BALANCE SHEETS Preferred
Stock Common
Stock Additional
Paid-in
Capital Reinvested
Earnings Accumu-
lated
Other
Compre-
hensive
Loss Treasury
Stock Non-
controlling
Interests Total Stock-
holders'
Equity Compre-
hensive
Income $ 237 $ 296 $ 8,179 $ 9,945 $ (794 ) $ (6,727 ) $ 442 $ 11,578 2,007 3 2,010 $ 2,010 (120 ) (1 ) (121 ) (121 ) (199 ) (2 ) (201 ) (201 ) (4,122 ) (8 ) (4,130 ) (4,130 ) (272 ) (272 ) (272 ) (11 ) (11 ) (11 ) $ (2,725 ) (1,486 ) (7 ) (1,493 ) (10 ) (10 ) 1 201 202 $ 237 $ 297 $ 8,380 $ 10,456 $ (5,518 ) $ (6,727 ) $ 427 $ 7,552 1 1 (1 ) (1 ) 1,755 14 1,769 $ 1,769 89 89 89 93 2 95 95 (333 ) (4 ) (337 ) (337 ) (106 ) (106 ) (106 ) 4 4 4 $ 1,514 (1,491 ) (3 ) (1,494 ) (10 ) (10 ) 89 89 $ 237 $ 297 $ 8,469 $ 10,710 $ (5,771 ) $ (6,727 ) $ 436 $ 7,651 9 9 3,031 21 3,052 $ 3,052 (6 ) (6 ) (6 ) 34 3 37 37 (65 ) (1 ) (66 ) (66 ) 17 17 17 1 1 1 $ 3,035 (1,500 ) (3 ) (1,503 ) (10 ) (10 ) 6 805 811 (250 ) (250 ) (2 ) (47 ) (201 ) 250 — $ 237 $ 301 $ 9,227 $ 12,030 $ (5,790 ) $ (6,727 ) $ 465 $ 9,743 December 31, 2013 2012 Assets Current assets Cash and cash equivalents $ 8,941 $ 4,284 Marketable securities 145 123 Accounts and notes receivable, net 6,047 5,452 Inventories 8,042 7,565 Prepaid expenses 206 204 Deferred income taxes 775 613 Assets held for sale 228 3,076 Total current assets 24,384 21,317 Property, plant and equipment 32,431 31,826 Less: Accumulated depreciation 19,438 19,085 Net property, plant and equipment 12,993 12,741 Goodwill 4,713 4,616 Other intangible assets 5,096 5,126 Investment in affiliates 1,011 1,163 Deferred income taxes 2,353 3,936 Other assets 949 960 Total $ 51,499 $ 49,859 Liabilities and Equity Current liabilities Accounts payable $ 5,180 $ 4,853 Short-term borrowings and capital lease obligations 1,721 1,275 Income taxes 247 343 Other accrued liabilities 6,219 5,997 Liabilities related to assets held for sale — 1,084 Total current liabilities 13,367 13,552 Long-term borrowings and capital lease obligations 10,741 10,465 Other liabilities 10,179 14,687 Deferred income taxes 926 856 Total liabilities 35,213 39,560 Commitments and contingent liabilities Stockholders' Equity $4.50 Series – 1,673,000 shares (callable at $120) 167 167 $3.50 Series – 700,000 shares (callable at $102) 70 70 304 306 Additional paid-in capital 11,072 10,655 Reinvested earnings 16,784 14,383 Accumulated other comprehensive loss (5,441 ) (8,646 ) (6,727 ) (6,727 ) Total DuPont stockholders' equity 16,229 10,208 Noncontrolling interests 57 91 Total equity 16,286 10,299 Total $ 51,499 $ 49,859 F-8.F-9.CASH FLOWS
EQUITYmillions)millions, except per share) For the year ended December 31, 2010 2009 2008 $ 3,052 $ 1,769 $ 2,010 1,204 1,251 1,169 176 252 275 809 976 814 (782 ) (306 ) (252 ) (481 ) 69 488 (512 ) 481 (663 ) 1,010 (115 ) (515 ) 83 364 (197 ) 4,559 4,741 3,129 (1,508 ) (1,308 ) (1,978 ) (100 ) (124 ) (55 ) (637 ) (13 ) (144 ) 195 91 50 (457 ) (2,016 ) 40 176 (927 ) 508 (108 ) (1 ) (31 ) (2,439 ) (4,298 ) (1,610 ) (1,501 ) (1,492 ) (1,496 ) 20 (317 ) (891 ) 2,061 3,685 3,527 (2,859 ) (1,977 ) (547 ) (250 ) — — 708 1 94 — — 226 (8 ) 3 (35 ) (1,829 ) (97 ) 878 (49 ) 30 (57 ) 242 376 2,340 4,021 3,645 1,305 $ 4,263 $ 4,021 $ 3,645 $ 623 $ 403 $ 336 416 63 609 2011 Balance January 1, 2011 $ 237 $ 301 $ 9,227 $ 12,075 $ (5,790 ) $ (6,727 ) $ 477 $ 9,800 Sale of a majority interest in a consolidated subsidiary (3 ) (3 ) Net income 3,559 40 3,599 Other comprehensive income (loss) (2,960 ) (18 ) (2,978 ) Common dividends ($1.64 per share) (1,531 ) (11 ) (1,542 ) Preferred dividends (10 ) (10 ) Common stock issued - compensation plans 7 1,007 1,014 Common stock repurchased (672 ) (672 ) Common stock retired (4 ) (127 ) (541 ) 672 — Balance December 31, 2011 $ 237 $ 304 $ 10,107 $ 13,552 $ (8,750 ) $ (6,727 ) $ 485 $ 9,208 2012 Acquisitions of a noncontrolling interest in consolidated subsidiaries (2 ) (386 ) (388 ) Net income 2,755 25 2,780 Other comprehensive income (loss) 104 28 132 Common dividends ($1.70 per share) (1,593 ) (61 ) (1,654 ) Preferred dividends (10 ) (10 ) Common stock issued - compensation plans 4 627 631 Common stock repurchased (400 ) (400 ) Common stock retired (2 ) (77 ) (321 ) 400 — Balance December 31, 2012 $ 237 $ 306 $ 10,655 $ 14,383 $ (8,646 ) $ (6,727 ) $ 91 $ 10,299 2013 Sale of a majority interest in a consolidated subsidiary (34 ) (34 ) Acquisitions of a noncontrolling interest in consolidated subsidiaries 4 4 Net income 4,848 14 4,862 Other comprehensive income (loss) 3,205 (2 ) 3,203 Common dividends ($1.78 per share) (1,658 ) (12 ) (1,670 ) Preferred dividends (10 ) (10 ) Common stock issued - compensation plans 4 628 632 Common stock repurchased (1,000 ) (1,000 ) Common stock retired (6 ) (215 ) (779 ) 1,000 — Balance December 31, 2013 $ 237 $ 304 $ 11,072 $ 16,784 $ (5,441 ) $ (6,727 ) $ 57 $ 16,286 F-8.F-9.For the year ended December 31, 2013 2012 2011 Operating activities Net income $ 4,862 $ 2,780 $ 3,599 Adjustments to reconcile net income to cash provided by operating activities: Depreciation 1,280 1,376 1,283 Amortization of intangible assets 323 337 277 Other operating charges and credits – net 859 1,185 991 Contributions to pension plans (313 ) (848 ) (341 ) Gain on sale of business (2,687 ) — — (Increase) decrease in operating assets: Accounts and notes receivable (883 ) 114 (360 ) Inventories and other operating assets (526 ) (812 ) (1,018 ) Increase (decrease) in operating liabilities: Accounts payable and other operating liabilities 418 1,037 528 Accrued interest and income taxes (154 ) (320 ) 193 Cash provided by operating activities 3,179 4,849 5,152 Investing activities Purchases of property, plant and equipment (1,882 ) (1,793 ) (1,843 ) Investments in affiliates (58 ) (97 ) (67 ) Payments for businesses – net of cash acquired (133 ) (18 ) (6,459 ) Proceeds from sale of business - net 4,841 — — Proceeds from sale of assets – net 142 302 214 Net (increase) decrease in short-term financial instruments (45 ) 315 2,149 Forward exchange contract settlements 40 (40 ) (227 ) Other investing activities – net 40 (15 ) (5 ) Cash provided by (used for) investing activities 2,945 (1,346 ) (6,238 ) Financing activities Dividends paid to stockholders (1,661 ) (1,594 ) (1,533 ) Net increase (decrease) in short-term (less than 90 days) borrowings 16 (200 ) 185 Long-term and other borrowings: Receipts 2,013 323 2,539 Payments (1,312 ) (916 ) (1,163 ) Repurchase of common stock (1,000 ) (400 ) (672 ) Proceeds from exercise of stock options 536 550 952 Payments for noncontrolling interest (65 ) (470 ) — Other financing activities – net (1 ) 10 95 Cash (used for) provided by financing activities (1,474 ) (2,697 ) 403 Effect of exchange rate changes on cash (88 ) (13 ) 6 Cash classified as held for sale — (95 ) — Increase (decrease) in cash and cash equivalents 4,562 698 (677 ) Cash and cash equivalents at beginning of year 4,379 3,586 4,263 Cash and cash equivalents at end of year $ 8,941 $ 4,284 $ 3,586 Supplemental cash flow information: Cash paid during the year for Interest, net of amounts capitalized $ 489 $ 501 $ 455 Income taxes 1,323 1,054 527 At December 31, 2010, the assets, liabilities and operations of VIEs for which DuPont is the primary beneficiary were not material to the Consolidated Financial Statements of the company. The company is also involved with other entities that are VIEs for which the company is not currently the primary beneficiary. Future events may require these VIEs to be consolidated if the company becomes the primary beneficiary. At December 31, 2010, the assets and liabilities of the other VIEs were not material to the Consolidated Financial Statements of the company. The company's share of the net income (loss) of these VIEs is included in other income, net, in the Consolidated Income Statements and is not material.basis. This includes majority-owned entitiesmethod. At consolidate because a minority investor holds substantive participating rights. Investmentsmeet the criteria for discontinued operations and as such, earnings are included in affiliates over which the company does not have significant influence are accountedcompany’s income from continuing operations.byfurther information relating to the cost method or as available-for-sale securities.non-U.S.non United States of America (U.S.) customers, an equivalent basis. Accruals are made for sales returns and other allowances based on the company's experience. The company accounts for cash sales incentives as a reduction in sales and noncash sales incentives as a charge to cost of goods sold or selling expense, depending on the nature of the incentive. Amounts billed to customers for shipping and handling fees are included in net sales and costs incurred by the company for the delivery of goods are classified as cost of goods sold and other operating charges in the Consolidated Income Statements. Taxes on revenue-producing transactions are excluded from net sales. & Nutrition segment and receives advance payments for product to be delivered in future periods. These advance payments are recorded as deferred revenue and are included in(classified as other accrued liabilitiesliabilities) or debt, depending on the Consolidated Balance Sheets.nature of the program. Revenue associated with advance payments is recognized as shipments are made and title, ownership and risk of loss pass to the customer.E. I. du Pont de Nemours and CompanyNotes to the Consolidated Financial Statements (continued)(Dollars in millions, except per share)interest, which approximatesinterest. The estimated fair value because of the short-termcompany's cash equivalents was determined using level 1 and level 2 inputs within the fair value hierarchy, as described below. The company held $5,116 and $0 of money market funds (level 1 measurements) as of December 31, 2013 and 2012, respectively. The company held $2,256 and $2,026 of other cash equivalents (level 2 measurements) as of December 31, 2013 and 2012, respectively. these instruments.Investments in SecuritiesOther assets include long-term investments in securities, which comprise investments for which market values are not readily available (cost investments) and available-for-sale securities that are reported at fair value (see Note 13).Level 1 – Quoted market prices in active markets for identical assets or liabilities; Level 2
––
Significant other observable inputs (e.g. quoted prices for similar items in active markets, quoted prices for identical or similar items in markets that are not active, inputs other than quoted prices that are observable such as interest rate and yield curves, and market-corroborated inputs);Level 3
––
Unobservable inputs for the asset or liability, which are valued based on management's estimates of assumptions that market participants would use in pricing the asset or liability.majority of the company's inventories are valued at cost, as determined by the last-in, first-out (LIFO) method; in the aggregate, such valuations are not in excess of market. Seed inventories are valued at the lower of cost as determined by the first-in, first-out (FIFO) method, or market. 2013 2012 2011 As reported As reported under LIFO As reported As reported under LIFO As reported As reported under LIFO Change:
(Decrease)/IncreaseCost of goods sold $ 22,548 $ 22,578 $ (30 ) $ 21,538 $ 21,511 $ 27 $ 21,264 $ 21,362 $ (98 ) Income from continuing operations before income taxes 3,489 3,459 30 3,088 3,115 (27 ) 3,879 3,781 98 Provision for income taxes on continuing operations 626 617 9 616 622 (6 ) 647 626 21 Income from continuing operations after income taxes 2,863 2,842 21 2,472 2,493 (21 ) 3,232 3,155 77 Income from discontinued operations after income taxes 1,999 1,999 — 308 320 (12 ) 367 355 12 Net income $ 4,862 $ 4,841 $ 21 $ 2,780 $ 2,813 $ (33 ) $ 3,599 $ 3,510 $ 89 may not be recoverable.exceeds fair value. The company's fair value methodology is based on prices of similar assets or other valuation methodologies including present valuediscounted cash flow techniques. Impairment losses are included in cost of goods sold and other operating charges.51 to 20 years. The company continually evaluates the reasonableness of the useful lives of these assets. Once these assets are fully amortized, they are removed from the Consolidated Balance Sheets.2025 years.E. I. du Pont de Nemours and CompanyNotes to the Consolidated Financial Statements (continued)(Dollars in millions, except per share)(USD) isor local currency as the functional currency, of most of the company's worldwide operations.where applicable. For subsidiaries where the USDU.S. dollar (USD) is the functional currency, all foreign currency asset and liability amounts are remeasured into USD at end-of-period exchange rates, except for inventories, prepaid expenses, property, plant and equipment, goodwill and other intangible assets, which are remeasured at historical rates. Foreign currency income and expenses are remeasured at average exchange rates in effect during the year, except for expenses related to balance sheet amounts remeasured at historical exchange rates. Exchange gains and losses arising from remeasurement of foreign currency-denominated monetary assets and liabilities are included in income in the period in which they occur. stockholders' equity. Assets and liabilities denominated in other than the local currency are remeasured into the local currency prior to translation into USD and the resultant exchange gains or losses are included in income in the period in which they occur. Income and expenses are translated into USD at average exchange rates in effect during the period.onin the Consolidated Balance Sheets at their fair values. For derivative instruments designated as fair value hedges, changes in the fair values of the derivative instruments will generally be offset onin the income statement by changes in the fair value of the hedged items. For derivative instruments designated as cash flow hedges, the effective portion of any hedge is reported in accumulated other comprehensive income (loss) until it is cleared to earnings during the same period in which the hedged item affects earnings. The ineffective portion of all hedges is recognized in current period earnings. Changes in the fair values of derivative instruments that are not designated as hedges are recorded in current period earnings.E. I. du Pont de Nemours and CompanyNotes to the Consolidated Financial Statements (continued)(Dollars in millions, except per share)2320 for additional discussion regarding the company's objectives and strategies for derivative instruments.ReclassificationsCertain reclassifications of prior years' data have been made to conform to 2010 classifications.2. OTHER INCOME, NET 2010 2009 2008 $ 483 $ 1,032 $ 1,019 146 127 111 93 91 138 179 86 117 127 63 40 (13 ) (205 ) (255 ) 213 25 137 $ 1,228 $ 1,219 $ 1,307 1The company routinely uses foreign currency exchange contracts to offset its net exposures, by currency, related to the foreign currency-denominated monetary assets and liabilities. The objective of this program is to maintain an approximately balanced position in foreign currencies in order to minimize, on an after-tax basis, the effects of exchange rate changes on net monetary asset positions. The net pre-tax exchange gains and losses are partially offset by the associated tax impact. Exchange gains (losses) related to earnings of affiliates was $(2), $13 and $(36) for 2010, 2009 and 2008, respectively.2Miscellaneous income and expenses, net, includes interest items, insurance recoveries, litigation settlements, and other items.3. INTEREST EXPENSE 2010 2009 2008 $ 628 $ 455 $ 425 (38 ) (47 ) (49 ) $ 590 $ 408 $ 376 Interest expense increased in 2010 as a result of the $179 pre-tax charge on the early extinguishment of debt in the fourth quarter 2010 (see Note 17).4. EMPLOYEE SEPARATION/ASSET RELATED CHARGES, NET$543At, plus the value of the inventories. The sale is expected to close about mid-2014 pending customary closing conditions, including timing of antitrust clearance.2010, total liabilities relating2013 related to prior restructuring activities were $63.2009 Restructuring Programthe second quarter 2009, in response to the global economic recession,February 2013, the company committedsold its Performance Coatings business to an initiativeFlash Bermuda Co. Ltd., a Bermuda exempted limited liability company formed by affiliates of The Carlyle Group (collectively referred to address the steepas "Carlyle"). The sale resulted in approximately $4,200 in after-tax proceeds and extended downturn in motor vehicle and construction markets, and the extensiona pre-tax gain of the downturn into industrial markets.$2,687 ($1,962 net of tax). The plan was designed to restructure asset and fixed cost bases in order to improve long-term competitiveness, simplify business processes, and maximize pre-tax operating income. The plan included the elimination of about 2,000 positions by severance principally located in the United States of America (U.S.). As a result, a charge of $340gain was recorded in employee separation/asset related charges, net, which pertains to the following financial statement line items; cost of goods sold and other operating charges – 60 percent, selling, general and administrative expenses – 30 percent, and research and development expense – 10 percent. This charge includes $212 of severance and related benefits costs, $24 of other non-personnel charges and $104 of asset related charges, including $77 for asset shut downs and write-offs, $11 for asset impairments and $16 for accelerated depreciation.The 2009 restructuring program charge of $340 reduced segment earnings as follows: Electronics & Communications – $43; Performance Chemicals – $66; Performance Coatings – $65; Performance Materials – $110; Safety & Protection – $55; and Other – $1.In the fourth quarter 2009, the company recorded a net reduction of $30income from discontinued operations after income taxes in the estimated costs associated with the 2009 restructuring program. This net reduction was primarily due to lower than estimated individual severance costs and work force reductions through non-severance programs. The net reduction of $30 impacted segment earningscompany's Consolidated Income Statements for the twelve monthsyear ended December 31, 20092013. The results of discontinued operations are summarized below:For the year ended December 31, 2013 2012 2011 Net sales $ 331 $ 4,218 $ 4,280 Income before income taxes $ 2,717 $ 551 $ 518 718 243 151 Income from discontinued operations after income taxes $ 1,999 $ 308 $ 367 follows: Electronics & Communications – $6; Performance Chemicals – $9;held for sale at December 31, 2012 related to Performance Coatings – $(11); Performance Materials – $23; Safety & Protection – $8; and Other – $(5).Inconsisted of the fourth quarter 2010, the company recorded a net reduction of $20 in the estimated costs associated with the 2009 restructuring program. This net reduction was primarily due to lower than estimated individual severance costs and work force reductions through non-severance programs. The net reduction of $20 impacted segment earnings for the twelve months ended December 31, 2010 as follows: Electronics & Communications – $8; Performance Chemicals – $10; Performance Coatings – $(16); Performance Materials – $13; and Safety & Protection – $5.There were $81 of employee separation cash payments related to the 2009 restructuring program during 2010. The actions related to the 2009 restructuring program were substantially completed by the end of 2010 with payments continuing into 2011, primarily in Europe. December 31,
2012Cash and cash equivalents $ 95 Accounts and notes receivable, net 783 Inventories 488 Prepaid expenses 6 Deferred income taxes - current 32 Property, plant and equipment, net of accumulated depreciation 749 Goodwill 808 Other intangible assets 67 Deferred income taxes - noncurrent 14 Other assets - noncurrent 34 Total assets held for sale $ 3,076 Accounts payable $ 408 Income taxes 17 Other accrued liabilities 237 Other liabilities - noncurrent 388 Deferred income taxes - noncurrent 34 Total liabilities related to assets held for sale $ 1,084 Account balances and activity for the 2009December 31, 2013, total liabilities related to restructuring program are summarized below: Asset
Related Employee
Separation
Costs Other
Non-personnel
Charges1 Total $ 104 $ 212 $ 24 $ 340 - (33 ) - (33 ) - 1 - 1 - (30 ) - (30 ) (104 ) - - (104 ) $ - $ 150 $ 24 $ 174 - (81 ) (20 ) (101 ) - (6 ) - (6 ) - (17 ) (3 ) (20 ) $ - $ 46 $ 1 $ 47 1Other non-personnel charges consist of contractual obligation costs.2008 Restructuring Program$57During 2008, in response, primarily relating to the challenging economic environment,2012 restructuring program. In addition to the company initiated a global restructuring program to reduce costs and improve profitability across its businesses. The program included the elimination of approximately 2,500 positions principally located in Western Europe and the U.S. primarily supporting the motor vehicle and construction markets. As a result,programs discussed below, a charge of $535 was$19, which included $9 recorded in employee separation / asset related charges, net which pertainsand $10 recorded in other income, net, was taken in the fourth quarter 2013. This charge was a result of restructuring actions including employee separation and asset related costs related to a joint venture in the Performance Materials segment.costPerformance Coatings business as well as utilize additional cost-cutting actions to improve competitiveness. As a result, pre-tax charges of goods sold and other operating$234 were recorded in employee separation / asset related charges, financial statement line item. This charge included $287 related tonet. The 2012 charges consisted of $157 of employee severanceseparation costs, $18$8 of other non-personnel charges, and $230$69 of asset related charges, including $111 forwhich included $30 of asset shut-downsimpairments and $119 for$39 of asset impairments.20082012 restructuring program charge of $535 reduced 2008charges impacted segment earnings as follows: Agriculture & Nutrition – $18;- $11, Electronics & Communications – $37;- $9, Industrial Biosciences - $3, Nutrition & Health - $53, Performance Chemicals – $50; Performance Coatings – $209;- $3, Performance Materials – $94;- $13, and Safety & Protection – $96; and Other – $31.2009,the fourth quarter 2013, the company recorded a $100 net reduction of $(17) in the estimated costs associated with the 20082012 restructuring program. This net reduction was primarily due to lower than estimated individual severance costs and workforce reductions through non-severance programs. The $100 net reduction impacted segment earnings for the year ended December 31, 20092013 as follows: Agriculture - $(2), Electronics & Communications - $2, Industrial Biosciences - $(1), Nutrition – $1;& Health - $(3), Performance Chemicals – $3; Performance Coatings – $61;- $1, Performance Materials – $29;- $(1), and Safety & Protection – $2; and- $(2), Other – $4.In the fourth quarter 2010, the company recorded a net reduction of $14 in the estimated costs associated with the 2008 restructuring program. This net reduction was primarily due to lower than estimated individual severance costs and work force reductions through non-severance programs. - (2), as well as Corporate expenses - net reduction of $14 impacted segment earnings for the twelve months ended December 31, 2010 as follows: Performance Coatings – $10; and Performance Materials – $3; and Other – $1.There were $78 of employee separation cash payments related to the 2008 restructuring program during 2010. The programactions and payments related to the 20082012 restructuring program were substantially completedcomplete as of December 31, 2010. Asset Related Employee Separation Costs Total Charges to income in 2012 $ 69 $ 157 $ 8 $ 234 Charges to accounts: Payments — (4 ) (1 ) (5 ) Net translation adjustment — 1 — 1 Asset write-offs and adjustments (69 ) — — (69 ) Balance as of December 31, 2012 $ — $ 154 $ 7 $ 161 Payments — (82 ) (5 ) (87 ) Net translation adjustment — (1 ) — (1 ) Asset write-offs and adjustments — (19 ) 2 (17 ) Balance as of December 31, 2013 $ — $ 52 $ 4 $ 56 Account balancesactivitythat an assessment of the asset group related to this industrial chemical was warranted. This assessment determined that the carrying value of the asset group exceeded its fair value. As a result of the impairment test, a $33 pre-tax impairment charge was recorded within the Performance Chemicals segment.2008 restructuring program are summarized below: Asset
Related Employee
Separation
Costs Other
Non-personnel
Charges1 Total $ 230 $ 287 $ 18 $ 535 - 19 1 20 (230 ) - (2 ) (232 ) - 3 - 3 $ - $ 309 $ 17 $ 326 - (110 ) (9 ) (119 ) - 6 1 7 - (100 ) - (100 ) $ - $ 105 $ 9 $ 114 - (78 ) (5 ) (83 ) - (6 ) - (6 ) - (11 ) (3 ) (14 ) $ - $ 10 $ 1 $ 11 1Other non-personnel charges consistabove were calculated utilizing a discounted cash flow approach which included assumptions concerning future operating performance and economic conditions that may differ from actual cash flows. In connection with the matters discussed above, as of contractual obligation costs.5. PROVISION FOR INCOME TAXES$150 2010 2009 2008 $ (109 ) $ 23 $ 14 - (9 ) (3 ) 454 328 327 345 342 338 245 57 210 3 1 - 66 15 (167 ) 314 73 43 $ 659 $ 415 $ 381 Table4. DANISCO ACQUISITIONContentsDanisco's outstanding shares at a price of 665 Danish Kroner (DKK) in cash per share. On April 29, 2011, DDHA increased the price of its tender offer to acquire all of the outstanding shares of Danisco to DKK 700 in cash per share. 2013 2012 2011 $ 14 $ 54 $ 282 Royalty income 187 177 189 Interest income 136 109 110 37 99 191 Gain on sale of equity method investment 9 122 — Net gains on sales of other assets 25 130 89 (128 ) (215 ) (146 ) 130 22 27 $ 410 $ 498 $ 742 Miscellaneous income and expenses, net, generally includes interest items, certain insurance recoveries and litigation settlements, and other items. 2013 2012 2011 Current tax expense (benefit) on continuing operations: U.S. federal $ 160 $ 121 $ 353 U.S. state and local 23 16 (20 ) International 677 663 482 Total current tax expense on continuing operations 860 800 815 Deferred tax expense (benefit) on continuing operations: U.S. federal (193 ) (105 ) (143 ) U.S. state and local (65 ) (46 ) (4 ) International 24 (33 ) (21 ) Total deferred tax (benefit) expense on continuing operations (234 ) (184 ) (168 ) Provision for income taxes on continuing operations $ 626 $ 616 $ 647 20102013 and 2009,2012, are as follows: 2010 2009 Asset Liability Asset Liability $ - $ 1,614 $ - $ 1,515 3,731 81 3,899 98 928 369 1,029 366 273 154 197 148 34 - 5 - 2,680 - 3,023 - 41 279 45 275 53 636 80 558 314 144 291 152 (1,666 ) - (1,759 ) - $ 6,388 $ 3,277 $ 6,810 $ 3,112 $ 3,111 $ 3,698 Deferred taxes are presented in the Consolidated Balance Sheets as of December 31, 2010 and 2009 as follows: 2013 2012 Asset Liability Asset Liability Depreciation $ — $ 1,707 $ — $ 1,696 Accrued employee benefits 3,754 512 5,198 167 Other accrued expenses 818 87 723 65 Inventories 275 151 231 105 Unrealized exchange gains/losses 65 — — 37 Tax loss/tax credit carryforwards/backs 2,615 — 2,733 — Investment in subsidiaries and affiliates 189 245 78 92 Amortization of intangibles 109 1,372 58 1,335 Other 316 159 244 265 Valuation allowance (1,764 ) — (1,914 ) — $ 6,377 $ 4,233 $ 7,351 $ 3,762 Net deferred tax asset $ 2,144 $ 3,589 Location on the
Balance Sheet 2010 2009 Deferred income taxes $ 534 $ 612 Other assets 2,772 3,240 Income taxes (80 ) (28 ) Deferred income taxes (115 ) (126 ) $ 3,111 $ 3,698 1See Note 13. 2010 2009 2008 35.0 % 35.0 % 35.0 % 0.2 (2.6 ) (0.2 ) (2.0 ) (1.4 ) (2.8 ) (13.6 ) (11.8 ) (14.3 ) (1.8 ) (0.2 ) (1.8 ) 17.8 % 19.0 % 15.9 % 1Principally reflects the impact of non-taxable exchange gains and losses resulting from remeasurement of foreign currency-denominated monetary assets and liabilities. Further information about the company's foreign currency hedging program is included in Note 23 under the heading Foreign Currency Risk. 2013 2012 2011 Statutory U.S. federal income tax rate 35.0 % 35.0 % 35.0 % 0.8 0.1 (0.8 ) Domestic operations (3.2 ) (2.3 ) (2.5 ) (12.3 ) (10.9 ) (11.6 ) Tax settlements (0.2 ) (2.0 ) (0.2 ) Sale of a business — — (2.3 ) (2.2 ) — (0.9 ) 17.9 % 19.9 % 16.7 % Principally reflects the impact of non-taxable exchange gains and losses resulting from remeasurement of foreign currency-denominated monetary assets and liabilities. Further information about the company's foreign currency hedging program is included in Note 20 under the heading Foreign Currency Risk. On January 2, 2013, U.S. tax law was enacted which extended through 2013 (and retroactive to 2012) several expired or expiring temporary business tax provisions. In accordance with GAAP, this extension was taken into account in the quarter in which the legislation was enacted (i.e. first quarter 2013). 2010 2009 2008 2013 2012 2011 $ 949 $ 171 $ 992 U.S. (including exports) $ 962 $ 640 $ 718 2,762 2,013 1,399 2,527 2,448 3,161 $ 3,711 $ 2,184 $ 2,391 $ 3,489 $ 3,088 $ 3,879 U.S. pre-tax earnings from 2009continuing operations from 2013 to 20102012 is primarily driven by two factors, the resultshigher worldwide sales volume, lower Imprelis® herbicide claims, net of the company's hedging program combined with the improvementinsurance recoveries, and lower employee separation/asset related charges in the U.S. economy.2013, partly offset by lower local selling prices and negative currency impact. See Note 16 and Note 3 for additional information relating to Imprelis® claims and employee separation/asset related charges, respectively. In 2009,2013 and 2012, the U.S. recorded $485 of exchange lossesgain (loss) associated with the hedging program. However, in 2010, the program resulted in the company recording $117 of exchange gains. This swing in the exchange gains$35 and losses year over year combined with the underlying recovery in the U.S. economy accounts for the increase in the U.S. earnings per the chart above.$(157), respectively. While the taxation of the amounts reflected on the chart above does not correspond precisely to the jurisdiction of taxation (due to taxation in multiple countries, exchange gains (losses),gains/losses, etc.), it represents a reasonable approximation of the income before income taxes split between U.S. and international jurisdictions. See Note 2320 for additional information regarding the company's hedging program.2010,2013, the tax effect of such carryforwards/backs, net of valuation allowance approximated $1,379.$1,199. Of this amount, $1,205$1,009 has no expiration date, $38$19 expires after 20102013 but before the end of 20152018 and $136$171 expires after 2015.2010,2013, unremitted earnings of subsidiaries outside the U.S. totaling $12,631$15,978 were deemed to be indefinitely reinvested. No deferred tax liability has been recognized with regard to the remittance of such earnings. It is not practical to estimate the income tax liability that might be incurred if such earnings were remitted to the U.S.E. I. du Pont de Nemours and CompanyNotes to the Consolidated Financial Statements (continued)(Dollars in millions, except per share)1999.2004. A reconciliation of the beginning and ending amounts of unrecognized tax benefits is as follows: 2010 2009 2008 $ 739 $ 677 $ 825 (155 ) (60 ) (49 ) 169 68 51 51 42 59 (90 ) (9 ) (157 ) (24 ) (10 ) (14 ) 3 31 (38 ) $ 693 $ 739 $ 677 $ 545 $ 566 $ 467 $ (70 ) $ 12 $ 7 $ 99 $ 125 $ 115 2013 2012 2011 Total unrecognized tax benefits as of January 1 $ 805 $ 800 $ 693 (28 ) (94 ) (82 ) 76 73 170 92 78 79 (19 ) (29 ) (6 ) (6 ) (10 ) (32 ) Exchange gain (loss) (19 ) (13 ) (22 ) Total unrecognized tax benefits as of December 31 $ 901 $ 805 $ 800 Total unrecognized tax benefits that, if recognized, would impact the effective tax rate $ 778 $ 693 $ 683 Total amount of interest and penalties recognized in the Consolidated Income Statements $ 16 $ 4 $ 7 Total amount of interest and penalties recognized in the Consolidated Balance Sheets $ 122 $ 116 $ 113 6. 2010 2009 2008 2013 2012 2011 $ 3,031 $ 1,755 $ 2,007 Income from continuing operations after income taxes attributable to DuPont $ 2,849 $ 2,447 $ 3,192 (10 ) (10 ) (10 ) (10 ) (10 ) (10 ) Income from continuing operations after income taxes available to DuPont common stockholders $ 2,839 $ 2,437 $ 3,182 Income from discontinued operations after income taxes $ 1,999 $ 308 $ 367 $ 3,021 $ 1,745 $ 1,997 $ 4,838 $ 2,745 $ 3,549 908,860,000 904,395,000 902,415,000 925,984,000 933,275,000 928,417,000 12,795,000 4,317,000 4,956,000 Dilutive effect of the company's employee compensation plans 7,163,000 8,922,000 12,612,000 921,655,000 908,712,000 907,371,000 933,147,000 942,197,000 941,029,000 20102013 decreased as a result of the company's repurchase and retirement of its common stock, partially offset by the issuance of new shares from the company's equity compensation plans. The weighted-average number of common shares outstanding in 2012 increased as a result of the issuance of new shares from the company's equity compensation plans, partially offset by the company's repurchase and retirement of its common stock (see Note 20)Notes 19 and 17, respectively). The weighted-average number of common shares outstanding in 2009 increased as a result of the issuance of new shares from the company's equity compensation plans.E. I. du Pont de Nemours and CompanyNotes to the Consolidated Financial Statements (continued)(Dollars in millions, except per share) 2010 2009 2008 45,508,000 72,899,000 40,831,000 2013 2012 2011 Average number of stock options 2,596,000 12,158,000 4,361,000 20102013 and 20092012 was primarily due to changes in the company's average stock price.7. FAIR VALUE MEASUREMENTSThe company has determined that its financial assets and liabilities are level 1 and level 2 in the fair value hierarchy. See Note 21 for a schedule of pension assets measured at fair value on a recurring basis. At December 31, 2010, the following financial assets and financial liabilities were measured at fair value on a recurring basis using the type of inputs shown: Fair Value Measurements at
December 31, 2010 Using December 31,
2010 Level 1 Inputs Level 2 Inputs $ 153 $ - $ 153 17 17 - $ 170 $ 17 $ 153 $ 132 $ - $ 132 At December 31, 2009, the following financial assets and financial liabilities were measured at fair value on a recurring basis using the type of inputs shown: Fair Value Measurements at
December 31, 2009 Using December 31,
2009 Level 1 Inputs Level 2 Inputs $ 128 $ - $ 128 27 27 - $ 155 $ 27 $ 128 $ 132 $ - $ 132 Refer to Note 23 for further discussions regarding the company's derivative instruments.December 31, 2010 2009 2013 2012 $ 4,124 $ 3,795 $ 4,575 $ 4,069 219 137 195 131 1,292 1,098 1,277 1,252 $ 5,635 $ 5,030 $ 6,047 $ 5,452 1Accounts and notes receivable – trade are net of allowances of $326 in 2010 and $322 in 2009. Allowances are equal to the estimated uncollectible amounts. That estimate is based on historical collection experience, current economic and market conditions, and review of the current status of customer's accounts.2Notes receivable – trade primarily consists of receivables within the Agriculture & Nutrition segment for deferred payment loan programs for the sale of seed products to customers. These loans have terms of one year or less and are primarily concentrated in North America. The company maintains a rigid pre-approval process for extending credit to customers in order to manage overall risk and exposure associated with credit losses. As of December 31, 2010 and 2009, there were no significant past due notes receivable, nor were there any significant impairments related to current loan agreements.3Other includes receivables in relation to Cozaar®/Hyzaar® interests, fair value of derivative instruments, value added tax, general sales tax and other taxes.value and include amounts due from equity affiliates of $51 and $35 for 2010 and 2009, respectively.9. INVENTORIESDecember 31, 2010 2009 $ 3,191 $ 2,893 2,564 2,231 855 872 6,610 5,996 (643 ) (616 ) $ 5,967 $ 5,380 Inventory values, before LIFO adjustment, are generally determined by the average cost method, which approximates current cost. Excluding seeds, stores and supplies, inventories valued under the LIFO method comprised 78 percent and 79 percent of consolidated inventories before LIFO adjustment for the periods ended December 31, 2010 and 2009, respectively. Seed inventories of $2,581 and $2,380 at December 31, 2010 and 2009, respectively, were valued under the FIFO method. Stores and supplies inventories of $248 and $239 at December 31, 2010 and 2009, respectively, were valued under the average cost method.December 31, 2013 2012 Finished products $ 4,645 $ 4,449 Semifinished products 2,576 2,407 Raw materials, stores and supplies 1,360 1,313 8,581 8,169 Adjustment of inventories to a LIFO basis (539 ) (604 ) $ 8,042 $ 7,565 Table of ContentsDecember 31, 2013 2012 Buildings $ 5,283 $ 5,490 Equipment 24,714 24,090 Land 671 691 Construction 1,763 1,555 $ 32,431 $ 31,826 10. PROPERTY, PLANT AND EQUIPMENTDecember 31, 2010 2009 $ 4,492 $ 4,460 23,384 22,809 544 520 1,547 1,126 $ 29,967 $ 28,915 Property, plant and equipment includes gross assets acquired under capital leases of $30 and $36 at December 31, 2010 and 2009, respectively. Related amounts included in accumulated depreciation were $21 and $24 at December 31, 2010 and 2009, respectively.Goodwill20102013 and 2009,2012, by reportable segment: Balance
as of
December 31,
2010 Goodwill
Adjustments
and
Acquisitions Balance
as of
December 31,
2009 Goodwill
Adjustments
and
Acquisitions Balance
as of
December 31,
2008 Balance as of December 31, 2013 Balance as of December 31, 2012 Balance as of December 31, 2011 $ 652 $ 176 $ 476 $ 10 $ 466 Agriculture $ 330 $ 99 $ 231 $ (1 ) $ 232 117 (2 ) 119 (1 ) 120 149 — 149 — 149 Industrial Biosciences 898 8 890 24 866 Nutrition & Health 2,315 1 2,314 (8 ) 2,322 185 2 183 (1 ) 184 185 — 185 — 185 809 - 809 - 809 — — — (809 ) 809 410 (3 ) 413 (7 ) 420 388 (13 ) 401 (3 ) 404 444 307 137 1 136 448 2 446 — 446 $ 2,617 $ 480 $ 2,137 $ 2 $ 2,135 $ 4,713 $ 97 $ 4,616 $ (797 ) $ 5,413 20102013 primarily relatedrelate to acquisitionsgoodwill associated with an acquisition in the Agriculture & Nutrition and Safety & Protection segments.segment. Changes in goodwill in 2012 primarily relate to goodwill in 2009 resulted from acquisition accounting refinementsassociated with the Performance Coatings business that was reclassified as held for sale (see Note 2). In 2013 and other acquisitions and divestitures. In 2010 and 2009,2012, the company performed impairment tests for goodwill and determined that no goodwill impairments existed. December 31, 2010 December 31, 2009 Gross Accumulated
Amortization Net Gross Accumulated
Amortization Net $ 1,557 $ (765 ) $ 792 $ 1,622 $ (716 ) $ 906 118 (44 ) 74 169 (57 ) 112 57 (22 ) 35 62 (22 ) 40 918 (323 ) 595 642 (302 ) 340 2,650 (1,154 ) 1,496 2,495 (1,097 ) 1,398 233 - 233 179 - 179 975 - 975 975 - 975 1,208 - 1,208 1,154 - 1,154 $ 3,858 $ (1,154 ) $ 2,704 $ 3,649 $ (1,097 ) $ 2,552 December 31, 2013 December 31, 2012 Gross Net Gross Net Customer lists $ 1,818 $ (393 ) $ 1,425 $ 1,847 $ (330 ) $ 1,517 Patents 519 (160 ) 359 525 (127 ) 398 Purchased and licensed technology 1,999 (1,129 ) 870 1,929 (1,016 ) 913 Trademarks 43 (17 ) 26 57 (29 ) 28 242 (106 ) 136 206 (98 ) 108 4,621 (1,805 ) 2,816 4,564 (1,600 ) 2,964 In-process research and development 43 — 43 62 — 62 306 — 306 306 — 306 1,050 — 1,050 975 — 975 Trademarks/tradenames 881 — 881 819 — 819 2,280 — 2,280 2,162 — 2,162 Total $ 6,901 $ (1,805 ) $ 5,096 $ 6,726 $ (1,600 ) $ 5,126 1Changes in the gross carrying amount of intangible assets subject to amortization in 2010 primarily related to acquisitions in the Agriculture & Nutrition and Safety & Protection segments, which were partially offset by the write-off of fully amortized definite-lived intangible assets in the Agriculture & Nutrition segment.2Primarily consists of sales and grower networks, customer lists, marketing and manufacturing alliances and noncompetition agreements.3Pioneer germplasm is the pool of genetic source material and body of knowledge gained from the development and delivery stage of plant breeding. The company recognized germplasm as an intangible asset upon the acquisition of Pioneer. This intangible asset is expected to contribute to cash flows beyond the foreseeable future and there are no legal, regulatory, contractual, or other factors which limit its useful life.Primarily consists of sales and grower networks, marketing and manufacturing alliances and noncompetition agreements. Microbial cell factories, derived from natural microbes, are used to sustainably produce enzymes, peptides and chemicals using natural metabolic processes. The company recognized the microbial cell factories as an intangible asset upon the acquisition of Danisco. This intangible asset is expected to contribute to cash flows beyond the foreseeable future and there are no legal, regulatory, contractual, or other factors which limit its useful life. Pioneer germplasm is the pool of genetic source material and body of knowledge gained from the development and delivery stage of plant breeding. The company recognized germplasm as an intangible asset upon the acquisition of Pioneer. This intangible asset is expected to contribute to cash flows beyond the foreseeable future and there are no legal, regulatory, contractual, or other factors which limit its useful life. $176, $252$323, $312 and $275$253 for 2010, 20092013, 2012 and 2008,2011, respectively. The estimated aggregate pre-tax amortization expense from continuing operations for 2011, 2012, 2013, 2014, 2015, 2016, 2017 and 20152018 is $215, $213, $213, $202$371, $377, $339, $212 and $170,$209, respectively, which are primarily reported in cost of goods sold and other operating charges.12. SUMMARIZED FINANCIAL INFORMATION FOR AFFILIATED COMPANIESsold.Summarized combined financial information for affiliated companies for which the equity method of accounting is used (see Note 1) is shown on a 100 percent basis. The most significant of these affiliates at December 31, 2010, are DuPont Teijin Films, DuPont-Toray Company Ltd. and DuPont-Mitsui, all of which are owned 50 percent by the company. Dividends received from equity affiliates were $103, $49 and $87 in 2010, 2009 and 2008, respectively. Year Ended December 31, Results of operations 2010 2009 2008 $ 4,073 $ 2,924 $ 3,064 543 235 281 393 210 190 (12 ) (22 ) (4 ) 189 121 85 $ 177 $ 99 $ 81 1Includes sales to DuPont of $652, $412 and $390 in 2010, 2009 and 2008, respectively.2Income taxes are reflected in the company's provision for income tax.E. I. du Pont de Nemours and CompanyNotes to the Consolidated Financial Statements (continued)(Dollars in millions, except per share)Financial position at December 31, 2010 2009 $ 1,972 $ 1,710 1,397 1,416 3,369 3,126 381 375 841 768 144 178 119 111 1,485 1,432 $ 1,041 $ 1,014 1The company's pro rata interest in total borrowings was $236 in 2010 and $253 in 2009, of which $45 in 2010 and $32 in 2009 were guaranteed by the company. These amounts are included in the guarantees disclosed in Note 19.13. OTHER ASSETSDecember 31, 2010 2009 $ 104 $ 112 2,772 3,240 774 748 $ 3,650 $ 4,100 Included within long-term investments in securities are securities for which market values are not readily available (cost investments) and securities classified as available-for-sale. The company's cost investments totaled $87 and $85 at December 31, 2010 and 2009, respectively. The company's available for sale securities totaled $17 and $27 at December 31, 2010 and 2009, respectively.14. ACCOUNTS PAYABLEDecember 31, 2010 2009 $ 3,795 $ 3,020 61 54 504 468 $ 4,360 $ 3,542 Trade payables includes $119 in 2010 and $71 for 2009 due to equity affiliates. Payables to banks represent checks issued on certain disbursement accounts but not presented to the banks for payment. The reported amounts shown above approximate fair value because of the short-term maturity of these obligations.E. I. du Pont de Nemours and CompanyNotes to the Consolidated Financial Statements (continued)(Dollars in millions, except per share)15.12. SHORT-TERM BORROWINGS AND CAPITAL LEASE OBLIGATIONSDecember 31, 2010 2009 2013 2012 $ - $ 444 128 80 44 20 4 981 1,674 1,252 1 1 3 3 $ 133 $ 1,506 $ 1,721 $ 1,275 basedwas determined using level 2 inputs within the fair value hierarchy, as described in Note 1 to the Consolidated Financial Statements. Based on quoted market prices for the same or similar issues, or on current rates offered to the company for debt of the same remaining maturities, the fair value of the company's short-term borrowings was $130$1,730 and $1,500$1,300 at December 31, 20102013 and 2009,2012, respectively.$2,600$4,400 and $4,300 at December 31, 20102013 and 2009.2012, respectively. These lines are available to support short-term liquidity needs and general corporate purposes including letters of credit. Outstanding letters of credit were approximately $424$352 and $350$503 at December 31, 20102013 and 2009,2012, respectively. These letters of credit support commitments made in the ordinary course of business.20102013 and 20092012 was 5.43.0% and 0.6 percent,4.8%, respectively. The increasedecrease in the interest rate reflects the reduction in commercial paper and the maturity offor 2013 was primarily due to long-term debt in 2010, which both had low interest rates in 2009.16.maturing within one year.December 31, 2010 2009 2013 2012 $ 978 $ 885 $ 1,045 $ 1,092 1,700 1,174 2,839 2,706 443 456 Employee benefits (Note 18) 335 367 332 302 328 318 132 71 105 131 1,086 1,300 1,567 1,383 $ 4,671 $ 4,188 $ 6,219 $ 5,997 related to businesses within the Agriculture & Nutrition segment. Miscellaneous other accrued liabilities principally includes accrued plant and operating expenses, accrued litigation costs, employee separation costs in connection with the company's restructuring programs, the estimated fair value of certain guarantees and accrued environmental remediation costs.17.December 31, December 31, 2010 2009 2013 2012 $ - $ 50 420 426 - 911 400 400 250 749 746 744 170 996 498 498 1,038 986 399 399 495 - 599 598 1,425 1,445 498 498 996 996 999 - 299 299 395 395 493 - 9 37 2 3 6 72 $ 121 $ 374 — 250 — 749 170 170 400 400 600 600 500 499 1,028 1,054 4.75% notes due 2015 400 400 1.95% notes due 2016 498 497 2.75% notes due 2016 500 499 5.25% notes due 2016 599 599 1,361 1,383 5.75% notes due 2019 499 499 4.625% notes due 2020 997 997 3.625% notes due 2021 999 999 4.25% notes due 2021 499 499 2.80% notes due 2023 1,250 — 6.50% debentures due 2028 299 299 5.60% notes due 2036 395 395 4.90% notes due 2041 494 493 4.15% notes due 2043 749 — 33 36 1 2 10,137 10,502 12,392 11,693 4 981 1,674 1,252 10,133 9,521 10,718 10,441 4 7 23 24 $ 10,137 $ 9,528 $ 10,741 $ 10,465 1Average interest rates on fixed rate industrial development bonds at December 31, 2009 were 6.0 percent.Includes long-term debt due within one year. 2Average interest rates on medium-term notes at December 31, 2010 and 2009, were 3.4 percent and 3.3 percent, respectively.3Includes long-term debt due within one year.4At December 31, 2010 and 2009, the company had outstanding interest rate swap agreements with gross notional amounts of $1,000 and $1,900, respectively. Over the remaining terms of the notes, the company will receive fixed payments equivalent to the underlying debt and pay floating payments based on USD LIBOR. The fair value of outstanding swaps was an asset of $40 and $0 at December 31, 2010 and 2009, respectively.5During 2008, the interest rate swap agreement associated with these notes was terminated. The gain will be amortized over the remaining life of the bond, resulting in an effective yield of 3.85 percent.2010,2013, the company issued $500$1,250 of 1.95% Senior2.80% Notes due JanuaryFebruary 15, 2016, $1,0002023 and $750 of 3.625% Senior4.15% Notes due JanuaryFebruary 15, 2021 and $500 of 4.90% Senior Notes due January 15, 2041. The company elected to use a portion of the net proceeds to redeem $500 of its 5.00% Senior Notes due January 15, 2013 and $830 of its 5.875% Senior Notes due January 15, 2014. The partial redemption of the outstanding 5.00% and 5.875% Senior Notes resulted in a $179 pre-tax charge on the early extinguishment of debt. In addition, $900 of 4.125% Senior Notes matured in April 2010.$408, $1,239, $668$1,429, $1,597, $0 and $1,438$1,361 for the years 2012, 2013, 20142015, 2016, 2017 and 2015,2018, respectively, and $6,380$6,331 thereafter.basedwas determined using level 2 inputs within the fair value hierarchy, as described in Note 1 to the Consolidated Financial Statements. Based on quoted market prices for the same or similar issues, or on current rates offered to the company for debt of the same remaining maturities, the fair value of the company's long-term borrowings was $10,800$11,130 and $10,100$11,715 at December 31, 20102013 and 2009,2012, respectively.18.December 31, December 31, 2010 2009 2013 2012 $ 3,670 $ 3,791 5,401 5,514 Accrued other long-term benefit costs (Note 18) $ 2,530 $ 3,271 Accrued pension benefit costs (Note 18) 5,575 9,303 317 326 374 353 1,638 1,859 1,700 1,760 $ 11,026 $ 11,490 $ 10,179 $ 14,687 19.Product Warranty LiabilityThe company warrants that its products meet standard specifications. The company's product warranty liability as of December 31, 2010 and 2009 was $20 and $17, respectively. Estimates for warranty costs are based on historical claims experience. The carrying amounts recorded for all indemnifications as of December 31, 2010 and 2009 were $100. Although it is reasonably possible that future payments may exceed amounts accrued, due to the nature of indemnified items, it is not possible to make a reasonable estimate of the maximum potential loss or range of loss. No assets are held as collateral and no specific recourse provisions exist.In connection with the 2004 sale of the majority of the net assets of Textiles and Interiors, the company indemnified the purchasers, subsidiaries of Koch Industries, Inc. (INVISTA), against certain liabilities primarily related to taxes, legal and environmental matters and other representations and warranties under the Purchase and Sale Agreement. The estimated fair value of the indemnity obligations under the Purchase and Sale Agreement was $70 and was included in the indemnifications balance of $100 at December 31, 2010. Under the Purchase and Sale Agreement, the company's total indemnification obligation for the majority of the representations and warranties cannot exceed $1,400. The other indemnities are not subject to this limit. In March 2008, INVISTA filed suit in the Southern District of New York alleging that certain representations and warranties in the Purchase and Sale Agreement were breached and, therefore, that DuPont is obligated to indemnify it. DuPont disagrees with the extent and value of INVISTA's claims. DuPont has not changed its estimate of its total indemnification obligation under the Purchase and Sale Agreement as a result of the lawsuit.E. I. du Pont de Nemours and CompanyNotes to the Consolidated Financial Statements (continued)(Dollars in millions, except per share)suppliers and other affiliated companies.suppliers. At December 31, 2010,2013, the company had directly guaranteed $544$561 of such obligations, and $16 relating to guarantees of historical obligations for divested subsidiaries.obligations. This amount represents the maximum potential amount of future (undiscounted) payments that the company could be required to make under the guarantees. The company would be required to perform on these guarantees in the event of default by the guaranteed party.At December 31, 20102009, a liability of $109 and $146, respectively, was recorded for these obligations, representingCompanyamount of payment/performance risk for which the company deems probable. This liability is principally related to obligations of the company's polyester films joint venture, which are guaranteed by the company.45 percent54% of the $288$376 of guaranteed obligations of customers and suppliers. Set forth below are the company's guaranteed obligations at December 31, 2010:2013: Short-Term Long-Term Total $ 189 $ 99 $ 288 211 — 211 6 16 22 — 23 23 406 138 544 — 16 16 — 16 16 $ 406 $ 154 $ 560 Short-Term Long-Term Total Bank borrowings (terms up to 7 years) $ 309 $ 66 $ 375 Leases on equipment and facilities (terms up to 5 years) — 1 1 Bank borrowings (terms up to 1 year) 185 — 185 Total $ 494 $ 67 $ 561 1Existing guarantees for customers and suppliers arose as part of contractual agreements.Existing guarantees for customers and suppliers, as part of contractual agreements. Existing guarantees for equity affiliates' liquidity needs in normal operations. 2Existing guarantees for equity affiliates and other affiliated companies arose for liquidity needs in normal operations.3The company has guaranteed certain obligations and liabilities related to a divested subsidiary, Conoco, which has indemnified the company for any liabilities the company may incur pursuant to these guarantees.$227, $197, $160, $123$288, $262, $239, $208 and $96$180 for the years 2011, 2012, 2013, 2014, 2015, 2016, 2017 and 2015,2018, respectively, and $179$347 for subsequent years and are not reduced by non-cancelable minimum sublease rentals due in the future in the amount of $6.$1. Net rental expense under operating leases was $268, $302$303, $316 and $320$268 in 2010, 20092013, 2012 and 2008,2011, respectively.E. I. du Pont de Nemours and CompanyNotes to the Consolidated Financial Statements (continued)(Dollars in millions, except per share)$59$63 and $56$64 at December 31, 20102013 and 2009,2012.LitigationPFOAuseshad accruals of $489 related to these claims. The company has an applicable insurance program with a deductible equal to the first $100 of costs and expenses. The insurance program limits are $725 for costs and expenses in excess of the $100. DuPont has submitted and will continue to submit requests for payment to its insurance carriers for costs associated with this matter. The company has begun to receive payment from its insurance carriers and continues to seek recovery although the timing and outcome remain uncertain. and dispersions at various sites around the world including its Washington Works plant in West Virginia. At December 31, 2010,2013, DuPont has accruals of $18$15 related to the PFOA matters discussed below.Leach v DuPontagainst DuPont and the Lubeck Public Service District. The complaint allegedalleging that residents living near the Washington Works facility had suffered, or may suffer, deleterious health effects from exposure to PFOA in drinking water. The relief sought included damages for medical monitoring, diminution of property values and punitive damages plus injunctive relief to stop releases of PFOA. agreement in 2004 and as a result, the company established accruals of $108 in 2004. The settlementthat binds a class of approximately about 80,000 residents. As defined by the court, the class includes those individuals who have consumed, for at least one year, water containing 0.05 parts per billion (ppb) or greater of PFOA from any of six designated public water sources or from sole source private wells.July 2005, the companyDuPont paid the plaintiffs' attorneys'plaintiffs’ attorneys’ fees and expenses of $23$70,$70, which class counsel has designated to fund a community health project. The company is also fundingfunded a series of health studies which were completed in October 2012 by an independent science panel of experts (the “C8 Science Panel”). The studies were conducted in the communities exposed to PFOA to evaluate available scientific evidence on whether any probable link exists, as defined in the settlement agreement, between exposure to PFOA and human disease.expectsis obligated to fund up to $235 for a medical monitoring program for eligible class members. In January 2012, the independent science panelcompany put $1 in an escrow account to complete these health studies between 2009fund medical monitoring as required by the settlement agreement. The court has appointed a Medical Monitoring Director to implement the medical panel's recommendations who is in the process of setting up a program. Testing has not yet begun and year-end 2011 at a totalno money has been disbursed from the fund. While it is probable that the company will incur losses related to funding the medical monitoring program, such losses cannot be reasonably estimated cost of $32. due to uncertainties surrounding implementation.is providing state-of-the artmust continue to provide water treatment systems designed to reduce the level of PFOA in water to six area water districts, including the Little Hocking Water Association (LHWA), untiland private well users.science panel determines that PFOA does not cause disease or until applicable water standards can be met without such treatment. All of the water treatment systems are operating.The settlement resultedConsolidated Financial Statements (continued)the dismissal of all claims asserted in the lawsuitmillions, except for personal injury claims. If the independent science panel concludes that no probable link exists between exposure to PFOA and any diseases, then the settlement would also resolve personal injury claims. If it concludes that a probable link does exist between exposure to PFOA and any diseases, then DuPont would also fund up to $235 for a medical monitoring program to pay for such medical testing. In this event, plaintiffs would retain their right to pursue personal injury claims. All other claims in the lawsuit would remain dismissed by the settlement. DuPont believes that it is remote that the panel will find a probable link. Therefore, at December 31, 2010, the company has not established any accruals related to medical monitoring or personal injury claims. However, there can be no assurance as to what the independent science panel will conclude.Civil Actions: Drinking WaterAt December 31, 2010, there were four additional actions pending brought by or on behalf of water district customers in New Jersey, Ohio and West Virginia. The cases generally claim PFOA contamination of drinking water and seek a variety of relief including compensatory and punitive damages, testing, treatment, remediation and monitoring. In addition, the two New Jersey class actions and theper share)claim "imminentis ongoing. In addition to general claims of PFOA contamination of drinking water, the action claims “imminent and substantial endangerment to health and or the environment"environment” under the Resource Conservation and Recovery Act (RCRA). In December 2010, the company reached an agreement in principle to settle the two New Jersey class actions subject to court approval. Approval was denied and the parties are considering revised settlement terms for potential resubmission to the court. If a revised settlement is not reached and approved, litigation will resume. Discovery has justE. I. du Pont de Nemours and CompanyNotes to the Consolidated Financial Statements (continued)(Dollars in millions, except per share)begun in the Ohio class action. In the West Virginia class action, the court entered judgment for DuPont in the first quarter 2010. Plaintiffs' appeal of the matter was heard by the Fourth Circuit Court of Appeals in late January 2011.thethese claims alleged in these civil drinking water actions and is defending itself vigorously.Environmental ActionsOfClass members may pursue personal injury claims against DuPont only for those human diseases for which the total accrual, $4 isC8 Science Panel determined a probable link exists. At December 31, 2013, eighty-three lawsuits alleging personal injury including five lawsuits alleging wrongful death from exposure to fund DuPont's obligations under agreements with the U. S. Environmental Protection Agency (EPA) and the New Jersey Department of Environmental Protection. In 2005, the company and EPA entered an agreement settling allegations that DuPont failed to comply with technical reporting requirements under the Toxic Substances Control Act and RCRA. Under the settlement, DuPont paid a fine of $10.25 and is undertaking two Supplemental Environmental Projects. In 2009, EPA and DuPont entered a Consent Order under the Safe Drinking Water Act which obligates DuPont to survey, sample and test drinking water in and around the company's Washington Works site. If tests indicate the presence of PFOA in drinking water atare pending in federal court in Ohio and West Virginia. This is an increase in pending cases of fifty-seven over year end 2012. These cases have been consolidated for discovery purposes in multi-district litigation in Ohio federal court. DuPont denies the national Provisional Health Advisory for PFOA of 0.40 ppb or greater, the company will offer treatment or an alternative supply of drinking water.PFOA matters in addition to those matters discussed above for which it has established accruals,these additional actions, a range of such losses, if any, cannot be reasonably estimated at this time.Benlate®On August 1, 2012, a St. Louis, Missouri jury awarded 1991, DuPont began receiving claims by growers that useMarch 2013, Pioneer and Monsanto entered into technology license agreements. As part of Benlate® 50 DF fungicide had caused crop damage. DuPont has since been served with thousands of lawsuits, most of which have been disposed of through trial, dismissal or settlement.At December 31, 2010, there were nine cases in Florida courts alleging that Benlate® caused crop damage. Atthose agreements, the 2006 trial of two cases involving twenty-seven Costa Rican fern growers, the plaintiffs sought damagescompany received, among other things, a non-exclusive royalty bearing license in the rangeUnited States and Canada for Monsanto's Genuity$270up-front and variable payments subject to $400. A $56 judgmentMonsanto delivering enabling soybean genetic material.Total annual fixed royalty payments of $802 contemplated under the arrangement for trait technology, associated data and soybean lines to support commercial introduction are expected to come due in years 2014 - 2017. Additionally, beginning in 2018, DuPont will pay royalties on a per unit basis related to the Genuity® Roundup Ready 2 Yield® and dicamba tolerance traits for the life of the license, subject to annual minimum payments through 2023 totaling $950.renderedresolved, but for the court-ordered sanctions against the company but was reducedfor “fraud against the court.” The court unsealed the order in November 2012. The parties agreed to $24present the sanctions and related rulings for immediate appeal and those matters are presently on DuPont's motion. appeal.fourth quarter 2009, on DuPont's motion, the judgment was reversed, vacatedUnited States between March 2002 and the present. The cases were remanded to be tried separately orsubsequently consolidated and in small related groups. Plaintiffs sought appellate review of the decision. In December 2010, the appellate court upheld the decision to try the cases separately. The appellate court also affirmed dismissal of the verdicts for seven of the twenty-seven fern growers on grounds that their claims were barred by the statute of limitations. Plaintiffs are seeking review by the Florida Supreme Court. One other crop case is scheduled for trial in June 2011. On January 19, 2011,August 2012, the court entered an order in fivecertified a class consisting of U.S. customers that have directly purchased titanium dioxide since February 1, 2003.remaining crop cases striking DuPont's pleadings. The order essentially enters judgment againstthird quarter 2013, DuPont asand plaintiffs agreed to liability. DuPont will appeal, but cannot do so until a damages trial results in a monetary judgment against it.Two cases alleging damagesettle this matter, subject to shrimping operations were resolved in a single binding arbitration during the fourth quarter 2010. The arbiter awarded plaintiffs a total of $19 in compensatory damages plus attorneys' fees and expenses. DuPont paid the compensatory damages in December 2010 and will pay $8.5 in attorneys' fees and expenses.January 2009, a case was filed in Florida state court claiming that plaintiff's exposure to Benlate® allegedly contaminated with other fungicides and herbicides, caused plaintiff's kidney cancer and pancreatic and brain tumors. The case was tried to a verdict in September 2010 in federal court, to which it had been removed on DuPont's motion, and the jury unanimously rejected allegations that exposure to Benlate® caused plaintiff's diseases. In December 2010, the court denied plaintiff's post trial motions. Plaintiff has appealed.The company does not believe that Benlate® caused the damages alleged in each of these cases and denies the allegations of fraud and misconduct. The company continues to defend itself in ongoing matters. As of December 31, 2010,connection therewith, the company has incurred costsrecorded charges of $72, within other operating charges, at December 31, 2013. The settlement explicitly acknowledges that DuPont denies all allegations and expenses of approximately $2,000 associated with these matters, but does not expect additional significant costs or expenses associated withadmit liability. The court entered the remaining twelve cases. Atorder granting final approval to the settlement on December 31, 2010, the company has accruals of about $9 related to Benlate®.13, 2013. The company does not expect lossessettlement was paid in excess of the accruals, if any, to be material.Spelter, West VirginiaIn September 2006, a West Virginia state court certified a class action captioned Perrine v DuPont, against DuPont that seeks relief including the provision of remediation services and property value diminution damages for 7,000 residential properties in the vicinity of a closed zinc smelter in Spelter, West Virginia. The action also seeks medical monitoring for an undetermined number of residents in the class area. The smelter was owned and operated by at least three companies between 1910 and 2001, including DuPont between 1928 and 1950. DuPont performed remedial measures at the request of EPA in the late 1990s and in 2001 repurchased the site to facilitate and complete the remediation. The fall 2007 trial was conducted in four phases: liability, medical monitoring, property and punitive damages. The jury found against DuPont in all four phases awarding $55.5 for property remediation and $196.2 in punitive damages. In post trial motions, the court adopted the plaintiffs' forty-year medical monitoring plan estimated by plaintiffs to cost $130 and granted plaintiffs' attorneys legal fees of $127 plus $8 in expenses based on and included in the total jury award. DuPont appealed to the West Virginia Supreme Court (the Court) seeking review of a number of issues. The Court issued its decision on March 26, 2010, affirming in part and reversing in part the trial court's decision.The Court conditionally affirmed the verdict, but reduced punitive damages to $97.7. The Court reversed the trial court's order granting summary judgment to the adult plaintiffs on the issue of statute of limitations and ordered a new jury trial on the sole issue of when the plaintiffs possessed requisite knowledge to trigger the running of the statute.In November 2010, plaintiffs and DuPont reached an agreement to settle this matter for $70. In addition, the agreement requires DuPont to fund a medical monitoring program. The initial set-up costs associated with the program are included in the $70. The company will reassess its liability related to funding the medical monitoring program as eligible members of the class elect to participate and enroll in the program. Enrollment in the program is expected to be complete in the third quarter 2011. As of December 31, 2010, the company has recorded accruals of $70 related this matter.GeneralThe company is subject to various lawsuits and claims arising out of the normal course of its business. These lawsuits and claims include actions based on alleged exposures to products, intellectual property and environmental matters and contract and antitrust claims. Management has noted a nationwide trend in purported class actions against chemical manufacturers generally seeking relief such as medical monitoring, property damages, off-site remediation and punitive damages arising from alleged environmental torts without claiming present personal injuries. Such cases may allege contamination from unregulated substances or remediated sites. The company also has noted a trend in public and private nuisance suits being filed on behalf of states, counties, cities and utilities alleging harm to the general public. Although it is not possible to predict the outcome of these various lawsuits and claims, management does not anticipate they will have a materially adverse effect on the company's consolidated financial position or liquidity. However, the ultimate liabilities may be significant to results of operations in the period recognized. The company accrues for contingencies when the information available indicates that it is probable that a liability has been incurred and the amount of the liability can be reasonably estimated.Environmentalremedialrestoration activities at sites where the company conducts or once conducted operations or at sites where company-generated waste was disposed. The accrual also includes estimated costs related to a number of sites identified by the company for which it is probable that environmental remediation will be required, but which are not currently the subject of enforcement activities.E. I. du Pont de Nemours and CompanyNotes to the Consolidated Financial Statements (continued)(Dollars in millions, except per share)2010,2013, the Condensed Consolidated Balance SheetsSheet included a liability of $407,$458, relating to these matters and, in management's opinion, is appropriate based on existing facts and circumstances. The average time frame, over which the accrued or presently unrecognized amounts may be paid, based on past history, is estimated to be 15-2015-20 years. Considerable uncertainty exists with respect to these costs and, under adverse changes in circumstances, potential liability may range up to two to three times the amount accrued as of December 31, 2010.Other.The company has various purchase commitments incident toordinary conductcompany’s Board of business. Directors authorized a $5,000 share buyback plan that will replace the company’s 2011 plan. There is no required completion date for purchases under the 2014 plan. aggregate, such commitments are not at prices in excess of current market.20. STOCKHOLDERS' EQUITYThe company's Board of Directors authorized a $2,000$1,000 share buyback plan. In February 2013, the company entered into an accelerated share repurchase (ASR) agreement with a financial institution under which the company used $1,000 of the proceeds from the sale of Performance Coatings for the purchase of shares of common stock. The 2012 $1,000 share buyback plan was completed in June 2001. During 2010,the second quarter 2013 through the ASR agreement, under which the company purchased and retired 5.420.4 million shares.$250$400. These purchases completed the 2001 $2,000 share buyback plan and began purchases under this plan. During 2009 and 2008, there were no purchasesa $2,000 share buyback plan authorized by the company's Board of stock under this plan. AsDirectors in April 2011. Under the completed 2001 plan, the company purchased a total of December 31, 2010,42.0 million shares. Under the 2011 plan, the company has purchased 25.95.5 million shares at a total cost of $1,212. Management has not established a timeline for the buyback$284 as of the remaining stock under this plan.2010, 20092013, 2012 and 2008:2011:Shares of common stock Issued Held In Treasury Issued Held In Treasury 986,330,000 (87,041,000 ) 3,085,000 - 989,415,000 (87,041,000 ) 1,440,000 - 990,855,000 (87,041,000 ) Balance January 1, 2011 1,004,351,000 (87,041,000 ) 18,891,000 - 22,650,000 — - (5,395,000 ) — (13,837,000 ) (5,395,000 ) 5,395,000 (13,837,000 ) 13,837,000 1,004,351,000 (87,041,000 ) Balance December 31, 2011 1,013,164,000 (87,041,000 ) Issued 14,671,000 — Repurchased — (7,778,000 ) Retired (7,778,000 ) 7,778,000 Balance December 31, 2012 1,020,057,000 (87,041,000 ) Issued 14,370,000 — Repurchased — (20,400,000 ) Retired (20,400,000 ) 20,400,000 Balance December 31, 2013 1,014,027,000 (87,041,000 ) TableIn May 2012, the company completed the acquisition of Contentsthe remaining The(loss) are shown below:for the years ended December 31, 2013, 2012, and 2011 is provided as follows: Pre-tax Tax After-tax $ (6 ) $ - $ (6 ) 54 (20 ) 34 (111 ) 46 (65 ) 47 (30 ) 17 2 (1 ) 1 2 - 2 $ (12 ) $ (5 ) $ (17 ) $ 89 $ - $ 89 145 (52 ) 93 (485 ) 152 (333 ) (162 ) 56 (106 ) 6 (2 ) 4 (2 ) - (2 ) $ (409 ) $ 154 $ (255 ) $ (120 ) $ - $ (120 ) (312 ) 113 (199 ) (6,326 ) 2,204 (4,122 ) (423 ) 151 (272 ) (16 ) 5 (11 ) (11 ) - (11 ) $ (7,208 ) $ 2,473 $ (4,735 ) For the year ended December 31, 2013 2012 2011 Pre-Tax Tax After-Tax Pre-Tax Tax After-Tax Pre-Tax Tax After-Tax Cumulative translation adjustment $ 25 $ — $ 25 $ 77 $ — $ 77 $ (457 ) $ — $ (457 ) Net revaluation and clearance of cash flow hedges to earnings: Additions and revaluations of derivatives designated as cash flow hedges (58 ) 22 (36 ) 8 (6 ) 2 10 (5 ) 5 See (2) below Clearance of hedge results to earnings: Foreign currency contracts (1 ) — (1 ) (21 ) 8 (13 ) 15 (5 ) 10 Net sales Commodity contracts (24 ) 10 (14 ) (44 ) 20 (24 ) 81 (31 ) 50 Cost of goods sold Net revaluation and clearance of cash flow hedges to earnings (83 ) 32 (51 ) (57 ) 22 (35 ) 106 (41 ) 65 Pension benefit plans: Net gain (loss) 3,293 (1,136 ) 2,157 (1,433 ) 437 (996 ) (4,069 ) 1,402 (2,667 ) See (2) below Prior service benefit (cost) 62 (22 ) 40 22 (8 ) 14 (2 ) — (2 ) See (2) below Reclassifications to net income: Amortization of prior service cost 8 (2 ) 6 13 (4 ) 9 16 (5 ) 11 See (3) below Amortization of loss 957 (331 ) 626 887 (305 ) 582 613 (210 ) 403 See (3) below Curtailment loss 1 — 1 2 — 2 — — — See (3) below Settlement loss 152 (45 ) 107 5 (2 ) 3 — — — See (3) below Pension benefit plans, net 4,473 (1,536 ) 2,937 (504 ) 118 (386 ) (3,442 ) 1,187 (2,255 ) Other benefit plans: Net gain (loss) 513 (184 ) 329 (60 ) 17 (43 ) (437 ) 151 (286 ) See (2) below Prior service benefit (cost) 211 (72 ) 139 857 (299 ) 558 (11 ) 4 (7 ) See (2) below Reclassifications to net income: Amortization of prior service benefit (195 ) 69 (126 ) (155 ) 54 (101 ) (121 ) 43 (78 ) See (3) below Amortization of loss 76 (27 ) 49 94 (33 ) 61 60 (21 ) 39 See (3) below Curtailment (gain) loss (154 ) 54 (100 ) 3 (1 ) 2 — — — See (3) below Settlement loss 1 — 1 — — — — — — See (3) below Other benefit plans, net 452 (160 ) 292 739 (262 ) 477 (509 ) 177 (332 ) Net unrealized (loss) gain on securities 1 (1 ) — (2 ) 1 (1 ) 2 (1 ) 1 Other comprehensive income (loss) $ 4,868 $ (1,665 ) $ 3,203 $ 253 $ (121 ) $ 132 $ (4,300 ) $ 1,322 $ (2,978 ) Represents the income statement line item within the Consolidated Income Statement affected by the pre-tax reclassification out of other comprehensive income (loss). These amounts represent changes in accumulated other comprehensive income excluding changes due to reclassifying amounts to the Consolidated Income Statements. These accumulated other comprehensive income components are included in the computation of net periodic benefit cost of the company's pension and other long-term employee benefit plans. See Note 18 for additional information. (expense) recorded in Stockholders' Equity was $12, $144$(1,617), $(70) and $2,476$1,365 for the years 2010, 20092013, 2012 and 2008,2011, respectively. Included in these amounts were tax (expense) benefits of $17, $(10)$48, $51 and $3$43 for the years 2010, 20092013, 2012 and 2008,2011, respectively, associated with stock compensation programs. The remainder consists of amounts recorded within other comprehensive income (loss) as shown in the table above.Balances of related after-tax components comprising accumulated other comprehensive loss are summarized below:December 31, 2010 2009 2008 $ 213 $ 219 $ 130 (31 ) (65 ) (158 ) 2 1 (3 ) (5,950 ) (5,873 ) (5,527 ) (82 ) (94 ) (107 ) (577 ) (551 ) (511 ) 635 592 658 $ (5,790 ) $ (5,771 ) $ (5,518 ) 21. Cumulative Translation Adjustment Net Revaluation and Clearance of Cash Flow Hedges to Earnings Pension Benefit Plans Other Benefit Plans Unrealized Gain (Loss) on Securities Total 2011 Balance January 1, 2011 $ 213 $ (31 ) $ (6,032 ) $ 58 $ 2 $ (5,790 ) Other comprehensive income (loss) before reclassifications (457 ) 12 (2,658 ) (293 ) 1 (3,395 ) Amounts reclassified from accumulated other comprehensive income (loss) — 60 414 (39 ) — 435 Balance December 31, 2011 $ (244 ) $ 41 $ (8,276 ) $ (274 ) $ 3 $ (8,750 ) 2012 Other comprehensive income (loss) before reclassifications 77 (1 ) (1,006 ) 514 (1 ) (417 ) Amounts reclassified from accumulated other comprehensive income (loss) — (37 ) 596 (38 ) — 521 Balance December 31, 2012 $ (167 ) $ 3 $ (8,686 ) $ 202 $ 2 $ (8,646 ) 2013 Other comprehensive income (loss) before reclassifications 27 (36 ) 2,197 468 — 2,656 Amounts reclassified from accumulated other comprehensive income (loss) — (15 ) 740 (176 ) — 549 Balance December 31, 2013 $ (140 ) $ (48 ) $ (5,749 ) $ 494 $ 2 $ (5,441 ) In 2006, the company announced major changes to the pension and defined contribution benefits that cover the majority of its U.S. employees. Such employees hired in the U.S. after December 31, 2006 are not eligible to participate in the pension and post-retirement medical, dental and life insurance plans but receive benefits in the defined contribution plans.employees.employees hired prior to January 1, 2007. The benefits under these plans are based primarily on years of service and employees' pay near retirement. The company's funding policy is consistent with the funding requirements of federal laws and regulations.survivors, and disability and life insurance protection to employees.survivors. The associated plans for retiree benefits are unfunded and the cost of the approved claims is paid from company funds. Essentially all of the cost and liabilities for these retiree benefit plans are attributable to the U.S. parent company plans. The non-Medicare eligible retiree medical plan is contributory with pensioners and survivors' contributions adjusted annually to achieve a 50/50 target sharing of cost increases between the company and pensioners and survivors. In addition, limits are applied to the company's portion of the retiree medical cost coverage.Employee For Medicare eligible pensioners and survivors the company provides a company-funded Health Reimbursement Arrangement (HRA). Beginning January 1, 2015, eligible employees who retire on and after that date will receive the same one-time life insurance benefit payment, regardless of age. The majority of U.S. employees hired on or after January 1, 2007 are not eligible to participate in the post retirement medical, dental and life insurance plans.self-insured or are fully experience-rated.self-insured. Obligations and expenses for self-insured and fully experience-rated plans are reflected in the figures below. Pension Benefits Other Benefits Pension Benefits Other Benefits 2010 2009 2010 2009 2013 2012 2013 2012 $ 22,770 $ 21,506 $ 4,132 $ 4,072 $ 29,179 $ 27,083 $ 3,532 $ 4,379 207 192 29 31 271 277 29 37 1,262 1,270 238 245 1,088 1,165 130 174 18 17 114 138 23 24 33 110 1,218 1,392 96 111 Actuarial (gain) loss (2,104 ) 2,245 (515 ) 60 (1,584 ) (1,608 ) (435 ) (461 ) (1,626 ) (1,593 ) (240 ) (371 ) — — (189 )1 (4 ) (62 ) (22 ) (211 ) (857 ) 33 1 4 — (480 ) — (4 ) — $ 23,924 $ 22,770 $ 3,989 $ 4,132 $ 26,289 $ 29,179 $ 2,754 $ 3,532 $ 17,143 $ 16,209 $ — $ — $ 19,399 $ 17,794 $ — $ — 2,015 2,219 — — 2,714 2,326 — — 782 306 321 323 313 848 207 261 18 17 114 138 23 24 33 110 (1,584 ) (1,608 ) (435 ) (461 ) (1,626 ) (1,593 ) (240 ) (371 ) 29 — — — (209 ) — — — $ 18,403 $ 17,143 $ — $ — $ 20,614 $ 19,399 $ — $ — $ (3,408 ) $ (3,594 ) $ — $ — $ (3,546 ) $ (6,625 ) $ — $ — (652 ) (543 ) — — (686 ) (1,443 ) — — (1,461 )2 (1,490 )2 (3,989 ) (4,132 ) (1,443 ) (1,712 ) (2,754 ) (3,532 ) $ (5,521 ) $ (5,627 ) $ (3,989 ) $ (4,132 ) 4 2 — — (124 ) (115 ) (319 ) (341 ) (5,401 ) (5,514 ) (3,670 ) (3,791 ) Total $ (5,675 ) $ (9,780 ) $ (2,754 ) $ (3,532 ) Other assets $ 11 $ 5 $ — $ — Other accrued liabilities (Note 13) (111 ) (110 ) (224 ) (257 ) Other liabilities (Note 15) (5,575 ) (9,303 ) (2,530 ) (3,271 ) Liabilities related to assets held for sale — (372 ) — (4 ) $ (5,521 ) $ (5,627 ) $ (3,989 ) $ (4,132 ) $ (5,675 ) $ (9,780 ) $ (2,754 ) $ (3,532 ) 1Change is primarily due to an amendment in 2010Primarily due to amendments in 2013 to the company's U.S. parent company retiree life insurance plan for employees retiring on and after January 1, 2015 and subsidiaries retiree health care plans. Primarily due to an amendment in 2012 to the company's U.S. parent company retiree medical and dental plans for Medicare eligible pensioners and survivors from the company sponsored group plans to a company-funded Health Reimbursement Arrangement (HRA). Includes pension plans maintained around the world where funding is not customary. company's U.S. parent company retiree medical plan to take advantage of a 50 percent discount from brand name drug manufacturersConsolidated Financial Statements (continued)the "coverage gap" portion of the Medicare Part D plan. The plan amendment has no effect on current or future retirees' coverage.millions, except per share)2Includes pension plans maintained around the world where funding is not customary. Pension Benefits Other Benefits Pension Benefits Other Benefits 2010 2009 2010 2009 2013 2012 2013 2012 $ (9,032 ) $ (8,904 ) $ (889 ) $ (853 ) $ (8,640 ) $ (13,042 ) $ (647 ) $ (1,233 ) (114 ) (130 ) 994 911 Prior service benefit (cost) 9 (62 ) 1,433 1,567 $ (9,146 ) $ (9,034 ) $ 105 $ 58 $ (8,631 ) $ (13,104 ) $ 786 $ 334 $22,165$24,685 and $21,042$27,243 at December 31, 20102013 and 2009,2012, respectively.Information for pension plans with projected benefit obligation in excess of plan assets 2013 2012 Projected benefit obligation $ 26,158 $ 29,043 Accumulated benefit obligation 24,574 27,130 Fair value of plan assets 20,472 19,258 Information for pension plans with accumulated benefit obligations in excess of plan assets 2013 2012 Projected benefit obligation $ 25,350 $ 28,925 Accumulated benefit obligation 23,906 27,064 Fair value of plan assets 19,744 19,179 Pension Benefits 2013 2012 2011 Net periodic benefit cost Service cost $ 271 $ 277 $ 249 Interest cost 1,088 1,165 1,253 Expected return on plan assets (1,524 ) (1,517 ) (1,475 ) Amortization of loss 957 887 613 Amortization of prior service cost 8 13 16 Curtailment loss 1 2 — Settlement loss 152 5 — $ 953 $ 832 $ 656 Net (gain) loss $ (3,293 ) $ 1,433 $ 4,069 Amortization of loss (957 ) (887 ) (613 ) Prior service (benefit) cost (62 ) (22 ) 2 Amortization of prior service cost (8 ) (13 ) (16 ) Curtailment loss (1 ) (2 ) — Settlement loss (152 ) (5 ) — Total (benefit) loss recognized in other comprehensive income $ (4,473 ) $ 504 $ 3,442 Noncontrolling interest — (1 ) (11 ) Accumulated other comprehensive income assumed from purchase of noncontrolling interest — 25 — Total (benefit) loss recognized in other comprehensive income, attributable to DuPont $ (4,473 ) $ 528 $ 3,431 Total recognized in net periodic benefit cost and other comprehensive income $ (3,520 ) $ 1,360 $ 4,087 Information for pension plans with projected benefit obligation in excess of plan assets 2010 2009 $ 23,707 $ 22,688 21,962 20,971 18,183 17,059 Information for pension plans with accumulated benefit obligations in excess of plan assets 2010 2009 $ 23,481 $ 21,276 21,807 19,709 18,017 15,763 Pension Benefits 2010 2009 2008 $ 207 $ 192 $ 209 1,262 1,270 1,286 (1,435 ) (1,603 ) (1,932 ) 507 278 56 16 18 18 — — 1 $ 557 $ 155 $ (362 ) 634 781 6,397 (507 ) (278 ) (56 ) — — 4 (16 ) (18 ) (18 ) — — (1 ) $ 111 $ 485 $ 6,326 $ 668 $ 640 $ 5,964 20112014 are $612$597 and $16,$3, respectively.E. I. du Pont de Nemours and CompanyNotes to the Consolidated Financial Statements (continued)(Dollars in millions, except per share) Other Benefits 2010 2009 2008 Other Benefits 2013 2012 2011 $ 29 $ 31 $ 29 $ 29 $ 37 $ 33 238 245 226 130 174 212 58 50 32 76 94 60 (106 ) (106 ) (106 ) (195 ) (155 ) (121 ) $ 219 $ 220 $ 181 Curtailment (gain) loss (154 ) 3 — Settlement loss 1 — — $ (113 ) $ 153 $ 184 $ 94 $ 110 $ 349 $ (513 ) $ 60 $ 437 (58 ) (50 ) (32 ) (76 ) (94 ) (60 ) (189 ) (4 ) - Prior service (benefit) cost (211 ) (857 ) 11 106 106 106 195 155 121 $ (47 ) $ 162 $ 423 Curtailment gain (loss) 154 (3 ) — Settlement loss (1 ) — — Total (benefit) loss recognized in other comprehensive income $ (452 ) $ (739 ) $ 509 Accumulated other comprehensive income assumed from purchase of noncontrolling interest — 1 — Total (benefit) loss recognized in other comprehensive income, attributable to DuPont $ (452 ) $ (738 ) $ 509 $ 172 $ 382 $ 604 $ (565 ) $ (585 ) $ 693 creditbenefit for the other long-term employee benefit plans that will be amortized from accumulated other comprehensive loss into net periodic benefit cost during 20112014 are $60$55 and $(122)$(212), respectively. Pension Benefits Other Benefits Pension Benefits Other Benefits 2010 2009 2010 2009 2013 2012 2013 2012 5.32% 5.80% 5.50% 6.00% 4.58 % 3.89 % 4.60 % 3.85 % 4.24% 4.24% 4.50% 4.50% 4.22 % 4.13 % — % 4.40 % The rate of compensation increase represents the single annual effective salary increase that an average plan participant would receive during the participant's entire career at the company. Pension Benefits Other Benefits Pension Benefits Other Benefits 2010 2009 2008 2010 2009 2008 2013 2012 2011 2013 2012 2011 5.80% 6.14% 6.01% 6.00% 6.25% 6.25% 3.90 % 4.32 % 5.32 % 3.85 % 4.49 % 5.50 % 8.64% 8.75% 8.74% - - - 8.39 % 8.61 % 8.73 % — % — % — % 4.24% 4.30% 4.28% 4.50% 4.50% 4.50% 4.14 % 4.18 % 4.24 % 4.40 % 4.40 % 4.50 % 6.004.10 percent, 8.75 percent and 4.40 percent for 2013.2010, 6.25 percent, 9.00 percent and 4.50 percent for 2009 and 6.25 percent, 9.00 percent and 4.50 percent for 2008.Thepublishedprevailing long-term high quality corporate bond indices to determine the discount rate applicable to each country at the measurement date. Where commonly available, the company considers indices of various durations to reflect the timing of future benefit payments.E. I. du Pont de Nemours and CompanyNotes to the Consolidated Financial Statements (continued)(Dollars in millions, except per share) Assumed health care cost trend rates at December 31, 2010 2009 2013 2012 8 % 8 % 7 % 8 % 5 % 5 % 5 % 5 % 2014 2013 2022 2016 1-Percentage
Point Increase 1-Percentage
Point Decrease $ 6 $ (5 ) $ 7 $ (6 ) 72 (76 ) 87 (75 ) Target allocation for plan assets at December 31, 2010 2009 2013 2012 30 % 30 % 27 % 28 % 22 % 22 % 21 21 29 % 31 % 32 29 Hedge funds 2 2 12 % 10 % 11 13 7 % 7 % 7 7 100 % 100 % 100 % 100 % E. I. du Pont de Nemours and CompanyNotes to the Consolidated Financial Statements (continued)(Dollars in millions, except per share)tabletables below presents the fair values of the company's pension assets by level within the fair value hierarchy, as described in Note 1, as of December 31, 20102013 and 2009,2012, respectively. Fair Value Measurements at December 31, 2010 Fair Value Measurements at December 31, 2013 Asset Category Total Level 1 Level 2 Level 3 Total Level 1 Level 2 Level 3 $ 2,603 $ 2,535 $ 68 $ - $ 3,076 $ 3,073 $ 3 $ — 4,016 3,964 32 20 4,432 4,383 22 27 3,663 3,602 61 - 4,005 3,965 37 3 1,514 195 1,319 - 1,813 151 1,628 34 Debt – government-issued 1,970 396 1,574 — Debt – corporate-issued 1,961 376 1,566 19 970 43 923 4 925 51 870 4 Hedge funds 435 — 1 434 2,931 - - 2,931 2,882 — 5 2,877 1,049 118 - 931 1,179 73 — 1,106 95 6 89 - 97 18 79 — (75 ) (1 ) (74 ) - (78 ) (7 ) (71 ) — 1 1 - - $ 18,580 $ 10,614 $ 4,046 $ 3,920 $ 20,884 $ 12,328 $ 4,086 $ 4,470 471 200 (648 ) (470 ) $ 18,403 $ 20,614 Fair Value Measurements at December 31, 2009 Asset Category Total Level 1 Level 2 Level 3 $ 2,789 $ 2,734 $ 55 $ - 3,735 3,720 11 4 3,672 3,661 11 - 1,487 112 1,375 - 1,985 284 1,650 51 919 - 911 8 1,998 18 - 1,980 970 84 1 885 46 1 45 - (38 ) - (38 ) - 30 11 19 - $ 17,593 $ 10,625 $ 4,040 $ 2,928 752 (1,202 ) $ 17,143 1The company's pension plans directly held $498 (3 percent of total plan assets) and $336 (2 percent of total plan assets) of DuPont common stock at December 31, 2010 and 2009, respectively.2Primarily receivables for investment securities sold.3Primarily payables for investment securities purchased. Fair Value Measurements at December 31, 2012 Asset Category Total Level 1 Level 2 Level 3 Cash and cash equivalents $ 2,613 $ 2,584 $ 29 $ — 3,647 3,604 25 18 Non-U.S. equity securities 3,928 3,842 86 — Debt – government-issued 1,714 443 1,271 — Debt – corporate-issued 2,236 378 1,831 27 Debt – asset-backed 1,059 40 1,017 2 Hedge funds 389 — 2 387 Private market securities 2,926 — 4 2,922 Real estate 1,236 82 — 1,154 Derivatives – asset position 129 6 123 — Derivatives – liability position (80 ) (1 ) (79 ) — $ 19,797 $ 10,978 $ 4,309 $ 4,510 312 (710 ) Total $ 19,399 Primarily receivables for investment securities sold. Primarily payables for investment securities purchased. 20102013 and 2009: Level 3 Assets Total U.S. Equity
Securities Debt-
Corporate
Issued Debt-
Asset-
Backed Private
Market
Securities Real
Estate $ 3,431 $ 12 $ 127 $ 13 $ 3,166 $ 113 24 - (1 ) 1 24 - (606 ) (8 ) (32 ) - (428 ) (138 ) 92 - (34 ) (2 ) (782 ) 910 (13 ) - (9 ) (4 ) - - $ 2,928 $ 4 $ 51 $ 8 $ 1,980 $ 885 (9 ) - (53 ) 5 39 - 206 3 48 (5 ) 229 (69 ) 884 13 (11 ) (4 ) 683 203 (89 ) - (1 ) - - (88 ) $ 3,920 $ 20 $ 34 $ 4 $ 2,931 $ 931 Level 3 Assets Total Non-U.S. Equity
SecuritiesHedge Funds Beginning balance at December 31, 2011 $ 4,500 $ 28 $ — $ 30 $ 4 $ 392 $ 2,959 $ 1,087 Realized gain (loss) 14 (3 ) — — — (6 ) 23 — Change in unrealized gain (loss) 253 (8 ) — (10 ) — 17 179 75 Purchases, sales and settlements, net (134 ) (1 ) — 7 (2 ) (16 ) (114 ) (8 ) Transfers (out) in of Level 3 (123 ) 2 — — — — (125 ) — Ending balance at December 31, 2012 $ 4,510 $ 18 $ — $ 27 $ 2 $ 387 $ 2,922 $ 1,154 Realized gain (loss) 42 — — — — 3 39 — Change in unrealized gain (loss) 192 5 1 (8 ) — 22 95 77 Purchases, sales and settlements, net (278 ) 6 1 (1 ) — 22 (181 ) (125 ) Transfers in (out) of Level 3 4 (2 ) 1 1 2 — 2 — Ending balance at December 31, 2013 $ 4,470 $ 27 $ 3 $ 19 $ 4 $ 434 $ 2,877 $ 1,106 ContributionsThe following table shows the company's pre-tax cash contributions to its pension plans and other long-term employee benefit plans: 2010 2009 2008 $ 782 $ 306 $ 252 321 323 326 voluntary contribution of $500 to its principal U.S. pension plan in the third quarter 2010. No2012 and no contributions were requiredmade in2011 or 2013. No contributions are expected to be made to the principal U.S. pension plan trust fund in 2009 and 2008 and no contributions are required or expected to be made to this plan in 2011.2014. The company expects to contribute approximately $305 in 2011contributed $313 and $207 to its pension plans other than the principal U.S. pension plan and also expects to make cash payments of approximately $320 in 2011 under its other long-term employee benefit plans.plans, respectively, in 2013. The company expects to contribute approximately $344 and $224 to its pension plans other than the principal U.S. pension plan and its other long-term employee benefit plans, respectively, in 2014.E. I. du Pont de Nemours and CompanyNotes to the Consolidated Financial Statements (continued)(Dollars in millions, except per share) Pension
Benefits Other Benefits $ 1,593 $ 319 1,528 315 1,521 315 1,527 313 1,544 312 8,002 1,548 Other Benefits 2014 $ 1,620 $ 224 2015 1,611 219 2016 1,618 214 2017 1,639 209 2018 1,648 205 Years 2019-2023 8,482 937 $195, $191$208, $212 and $189$210 for the years ended December 31, 2010, 20092013, 2012 and 2008,2011, respectively. The company's matching contributions vest immediately upon contribution. The 3 percent nonmatching company contribution vests for employees with at least three years of service. In addition, the company made contributions to other defined contribution plans of $59, $54$105, $124 and $45$84 for the years ended December 31, 2010, 20092013, 2012 and 2008,2011, respectively. Included in the company's contributions are amounts related to discontinued operations of $2, $30 and $29 for the years ended December 31, 2013, 2012 and 2011, respectively. The company expects to contribute about $265$320 to its defined contribution plans in 2011.22.2014.$108, $115$129, $105 and $112$113 for 2010, 20092013, 2012 and 2008,2011, respectively. The income tax benefits related to stock-based compensation arrangements were $36, $38$43, $35 and $37$37 for 2010, 20092013, 2012 and 2008,2011, respectively.2007,2011, the shareholders approved amendments to the DuPont Equity and Incentive Plan (EIP). The EIP consolidated several of the company's existing compensation plans (the Stock Performance Plan, Variable Compensation Plan, and equity awards of the Stock Accumulation and Deferred Compensation Plan for Directors) into one plan providingprovides for equity-based and cash incentive awards to certain employees, directors, and consultants. Currently, equity-based compensation awards consist of stock options, time-vested restricted stock units (RSUs), performance-based restricted stock units (PSUs) and stock appreciation rights.The company satisfies stock option exercises and vesting of RSUs and PSUs with newly issued shares of DuPont common stock. Under the amended EIP, the maximum number of shares reserved for the grant or settlement of awards is 602030 million that is issued with respect to any award that is not an option or stock appreciation right will be counted against the 60110 million share limit as four and one-half shares. At December 31, 2010,2013, approximately 2351 million shares were authorized for future grants under the company's EIP. Awards or grants made in 2007, prior to shareholder approvalThe company satisfies stock option exercises and vesting of the EIP, weretime-vested restricted stock units (RSUs) and performance-based restricted stock units (PSUs) with newly issued under the company's previously existing compensation plans. Awards outstanding under eachshares of these plans have not been terminated. These awards remain outstanding and are administered under the terms of the applicable existing plan. No further awards will be made under the company's previously existing compensation plans.DuPont common stock.E. I. du Pont de Nemours and CompanyNotes to the Consolidated Financial Statements (continued)(Dollars in millions, except per share)purchaseexercise price of shares subject to option is equal to the market price of the company's stock on the date of grant. Options granted prior to 2004 expire 10 years from date of grant; options granted between 2004 and 2008 serially vested over a three-year period and carry a six-yearsix-year option term. Stock option awards granted inbetween 2009 and 20102013 expire seven years after the grant date. The plan allows retirement eligible employees to retain any granted awards upon retirement provided the employee has rendered at least six months of service following grant date.2010, 20092013, 2012 and 20082011 was $6.44, $2.68$10.40, $11.81 and $5.30,$12.32, respectively. 2010 2009 2008 2013 2012 2011 4.9 % 7.0 % 3.7 % 3.6 % 3.2 % 3.2 % 32.44 % 27.61 % 18.86 % 34.86 % 34.87 % 33.26 % 2.6 % 2.5 % 2.6 % 1.0 % 0.9 % 2.3 % 5.3 5.3 4.5 5.3 5.3 5.3 2010,2013, and changes during the year then ended were as follows: Number of
Shares
(in thousands) Weighted
Average
Exercise Price
(per share) Weighted
Average
Remaining
Contractual
Term (years) Aggregate
Intrinsic
Value
(in thousands) 85,416 $ 41.06 Outstanding, December 31, 2012 33,359 $ 39.70 6,378 $ 33.51 5,758 $ 47.68 (18,101 ) $ 39.95 (13,012 ) $ 36.31 (225 ) $ 30.78 (253 ) $ 50.10 (10,581 ) $ 51.89 (4,281 ) $ 50.64 62,887 $ 38.83 2.74 $ 702,445 43,252 $ 42.90 1.68 $ 308,494 Outstanding, December 31, 2013 21,571 $ 41.58 4.14 $ 505,136 Exercisable, December 31, 2013 11,765 $ 35.02 2.95 $ 352,427 1Includes 9.8 million options outstanding from the 2002 Corporate Sharing Program grants of 200 shares to all eligible employees at an option price of $44.50. These options are currently exercisable and expire 10 years from date of grant.20102013 and the exercise price, multiplied by the number of in-the-money options) that would have been received by the option holders had all option holders exercised their in-the-money options at year end. The amount changes based on the fair market value of the company's stock. Total intrinsic value of options exercised for 2010, 20092013, 2012 and 20082011 were $109, $0$230, $147 and $18,$216, respectively. In 2010,2013, the company realized a tax benefit of $35$74 from options exercised.2010, $142013, $34 of total unrecognized compensation cost related to stock options is expected to be recognized over a weighted-average period of 1.711.73 years.E. I. du Pont de Nemours and CompanyNotes to the Consolidated Financial Statements (continued)(Dollars in millions, except per share)2010,2013, there were 310,917313,324 PSUs granted. Vesting for PSUs granted in 2008, 20092011, 2012 and 20102013 is equally based upon corporate revenue growth relative to peer companies and total shareholder return (TSR) relative to peer companies. Performance and payouts are determined independently for each metric. The actual award, delivered as DuPont common stock, can range from zero percent to 200 percent of the original grant. The grant-date fair value of the PSUs granted in 2010,2013, subject to the TSR metric, was $44.86,$59.05, estimated using a Monte Carlo simulation. The grant-date fair value of the PSUs, subject to the revenue metric, was based upon the market price of the underlying common stock as of the grant date.For PSUs granted prior to 2008, vesting occurs upon attainment of (i) corporate revenue growth relative to peer companies and (ii) return on invested capital objectives (relative to peer companies for periods prior to 2008 and relative to internal targets for periods beginning in 2008). The actual award, delivered as DuPont common stock, can range from zero percent to 200 percent of the original grant. The fair value of PSUs granted prior to 2008 is based upon the market price of the underlying common stock as of the grant date.20102013 and 20092012 are shown below. The weighted-average grant-date fair value of RSUs and PSUs granted during 2010, 20092013, 2012 and 20082011 was $34.60, $23.72$48.06, $47.17 and $45.70,$53.19, respectively. The table also includes Board of Directors' cash-settled RSUs granted prior to 2008. Number of
Shares
(in thousands) Weighted
Average
Grant Date
Fair Value
(per share) 4,502 $ 34.56 Nonvested, December 31, 2012 3,120 $ 49.42 1,628 $ 34.60 2,439 $ 48.06 (1,742 ) $ 36.93 (1,744 ) $ 43.22 (270 ) $ 47.86 (50 ) $ 43.69 4,118 $ 32.27 Nonvested, December 31, 2013 3,765 $ 52.41 2010,2013, there was $25$73 of unrecognized stock-based compensation expense related to nonvested awards. That cost is expected to be recognized over a weighted-average period of 1.672.14 years. The total fair value of stock units vested during 2010, 20092013, 2012 and 20082011 was $64, $74$75, $68 and $60,$74, respectively.$233, $141$60, $60 and $140$85 for 2010, 20092013, 2012 and 2008,2011, respectively. The amounts of the awards are dependent on company earnings and are subject to maximum limits as defined under the governing plans.Pioneer's Annual Reward Program and the company's regional and local variable compensation plans.plans and Pioneer's Annual Reward Program. Such awards were $301, $213$317, $379 and $196$386 for 2010, 20092013, 2012 and 2008,2011, respectively.E. I. du Pont de Nemours and CompanyNotes to the Consolidated Financial Statements (continued)(Dollars in millions, except per share)23.risks under established procedures and controls.risks. The company has established a variety of approved derivative instrumentsprograms to be utilized in eachfor financial risk management program, as well asmanagement. These programs reflect varying levels of exposure coverage and time horizons based on an assessment of risk.factors related to each hedging program.management policies and guidelines. Derivative instruments utilized during the period includeused are forwards, options, futures and swaps. The company has not designated any nonderivatives as hedging instruments.company established acompany's financial risk management framework that incorporated the Corporate Financial Risk Management Committee and established financial risk management policies and guidelines that authorize the use of specific derivative instruments and further establishes procedures for control and valuation,also address counterparty credit approval, limits and routine exposure monitoring and reporting. The counterparties to these contractual arrangements are major financial institutions and major commodity exchanges. The company is exposed to credit loss in the event of nonperformance by these counterparties. The company manages thisutilizes collateral support annex agreements with certain counterparties to limit its exposure to credit loss throughlosses. The company's derivative assets and liabilities are reported on a gross basis in the aforementioned credit approvals, limits and monitoring procedures and, to the extent possible, by restricting the period over which unpaid balances are allowed to accumulate.Consolidated Balance Sheets. The company anticipates performance by counterparties to these contracts and therefore no material loss is expected. Market and counterparty credit risks associated with these instruments are regularly reported to management.company hedges foreign currency-denominated revenue and monetary assets and liabilities, certain business specific foreign currency exposures and certain energy feedstock purchases. In addition,notional amounts of the company enters into agricultural commodity derivatives to hedge exposures relevant to agricultural feedstocks.December 31, 2013 2012 Derivatives designated as hedging instruments: Interest rate swaps $ 1,000 $ 1,000 Foreign currency contracts 1,107 1,083 Commodity contracts 606 753 Derivatives not designated as hedging instruments: Foreign currency contracts 9,553 6,733 Commodity contracts 281 242 natural gas, copper, corn, soybeans and soybean meal.2010,2013, the company maintained a number of interest rate swaps, which were implemented at the time the debt instruments were issued, that involve the exchange of fixed for floating rate interest payments. These swaps allow theE. I. du Pont de Nemours and CompanyNotes to the Consolidated Financial Statements (continued)(Dollars in millions, except per share)company to achieve a target range of floating rate debt.issued. All interest rate swaps qualify for the shortcut method of hedge accounting, thus there is no ineffectiveness related to these hedges. The company maintains no other significant fair value hedges. At December 31, 2010 and 2009, the company had interest rate swap agreements with gross notional amounts of approximately $1,000 and $1,900, respectively.The company maintains a number of cash flow hedging programs to reduce risks related to foreign currency and commodity price risk. While each risk management program has a different time maturity period, most programs currently do not extend beyond the next two-year period.contractsinstruments such as forwards and options to offset a portion of the company's exposure to certain foreign currency-denominated revenues so that gains and losses on these contracts offset changes in the USD value of the related foreign currency-denominated revenues. At December 31, 2010 and 2009, the company had foreign currency exchange contracts with gross notional amounts of approximately $1,220 and $293, respectively.A portion of natural gas purchases are hedged to reduce price volatility using fixed price swaps and options. At December 31, 2010 and 2009, the company had energy feedstock and other contracts with gross notional amounts of approximately $151 and $277, respectively.contracts with independent growers to produce seed inventory. Under these contracts, growers are compensated with bushel equivalents that are sold to the company for the market price of grain for a period of time. Derivativeenters into over-the-counter and exchange-traded derivative commodity instruments, such as commodityincluding options, futures and options that have a high correlation to the underlying commodity, are usedswaps, to hedge the commodity price risk involved in compensating growers.The company utilizes agriculturalassociated with energy feedstock and agriculture commodity futures to manageexposures.price volatility of soybean meal. These derivative instruments have a high correlation to the underlying commodity exposure and are deemed effective in offsetting soybean meal feedstock price risk.At December 31, 2010 and 2009, the company had agricultural commodity contracts with gross notional amounts of approximately $297 and $332, respectively.During 2010 and 2009, the company entered into treasury rate contracts to hedge the company's exposure to treasury rates on a portion of planned bond issuances. The contracts were terminated at the time the bonds were issued prior to year end.20102013 and 2009:2012: 2010 2009 Pre-tax Tax After-tax Pre-tax Tax After-tax December 31, 2013 2012 $ (101 ) $ 36 $ (65 ) $ (246 ) $ 88 $ (158 ) $ 3 $ 41 (36 ) 14 (22 ) (48 ) 17 (31 ) (36 ) (1 ) 90 (34 ) 56 193 (69 ) 124 (15 ) (37 ) $ (47 ) $ 16 $ (31 ) $ (101 ) $ 36 $ (65 ) $ (48 ) $ 3 $ (69 ) $ 24 $ (45 ) $ (54 ) $ 19 $ (35 ) Table of ContentsDuring the next 12 months, the after-tax amount expected to be reclassified from accumulated other comprehensive income (loss) into earnings is Hedges of Net Investment in a Foreign OperationAt December 31, 2010 and 2009, the company did not maintain any hedges of net investment in a foreign operation.liabilities.liabilities of its operations so that exchange gains and losses resulting from exchange rate changes are minimized. The netting of such exposures precludes the use of hedge accounting. However,accounting; however, the required revaluation of the forward contracts and the associated foreign currency-denominated monetary assets and liabilities results inintends to achieve a minimal earnings impact, after taxes. At December 31, 2010 and 2009,Additionally, the company hadutilized cross-currency swaps to hedge foreign currency fluctuations on long-term intercompany loans. These swaps matured during 2013.with gross notional amountsto reduce the net exposure related to foreign currency-denominated monetary assets and liabilities of approximately $7,449its discontinued operations.$7,634, respectively.In addition, the company has risk management programs for agricultural commoditiesswaps that doare not qualify for hedge accounting treatment. At December 31, 2010designated as hedging instruments to reduce exposure to commodity price fluctuations on purchases of inventory such as corn, soybeans and 2009, the company had agricultural commodities contracts with gross notional amounts of approximately $310 and $206, respectively.Contingent FeaturesAt December 31, 2010 and 2009, the company did not maintain any derivative contracts with credit-risk-related contingent features.The following tables provide information on the location and amounts of derivative fair values in the Consolidated Balance Sheets and derivative gains and losses in the Consolidated Income Statements: Asset Derivatives Liability Derivatives December 31, 2010 2009 2010 2009 $ — $ 12 1 $ — $ 12 4 40 2 — — — 20 1 3 1 3 3 — 3 1 2 1 75 3 54 3 — — — 49 4 $ 63 $ 17 $ 78 $ 115 90 1 111 1 54 3 17 3 $ 90 $ 111 $ 54 $ 17 $ 153 $ 128 $ 132 $ 132 1Current portion recorded in accounts and notes receivable, net.2Long-term portion recorded in other assets.3Current portion recorded in other accrued liabilities.4Long-term portion recorded in other liabilities. Balance Sheet Location 2013 2012 Asset derivatives: Derivatives designated as hedging instruments: Other assets $ 29 $ 55 Foreign currency contracts Accounts and notes receivable, net 6 7 35 62 Derivatives not designated as hedging instruments: Accounts and notes receivable, net 86 88 $ 121 $ 150 Other accrued liabilities $ 30 $ 44 Liability derivatives: Derivatives designated as hedging instruments: Foreign currency contracts Other accrued liabilities $ 4 $ 10 Derivatives not designated as hedging instruments: Foreign currency contracts Other accrued liabilities 70 76 Commodity contracts Other accrued liabilities 1 1 71 77 $ 75 $ 87 Cash collateral held as of December 31, 2013 and 2012 represents $17 and $13, respectively, related to interest rate swap derivatives designated as hedging instruments. Cash collateral held as of December 31, 2013 and 2012 represents $13 and $31, respectively, related to foreign currency derivatives not designated as hedging instruments. The company's derivative assets and liabilities subject to enforceable master netting arrangements totaled $54 at December 31, 2013 and $40 at December 31, 2012. The on the Consolidated Income StatementFair Value Hedging Amount of Gain or
(Loss) Recognized
in Income of
Derivative Amount of Gain or
(Loss) Recognized
in Income on
Hedged Item Amount of Gain or
(Loss) Recognized
in Income of
Derivative Amount of Gain or
(Loss) Recognized
in Income on
Hedged Item Derivatives in Fair Value Hedging
Relationships 2010 2010 2009 2009 $ 401 $ (40)1 $ (43)1 $ 431 $ 40 $ (40) $ (43) $ 43 1Gain (loss) was recognized in interest expense, which offset to $0.Cash Flow Hedging Derivatives in Cash Flow Hedging
Relationships Amount of Gain or
(Loss) Recognized in
OCI1 on Derivative
(Effective Portion) Amount of Gain or (Loss)
Reclassified from
Accumulated OCI1 into
Income (Effective Portion) Amount of Gain or
(Loss) Recognized in
Income on Derivative
(Ineffective Portion and
Amount Excluded from
Effectiveness Testing) $ (3 ) $ - $ - 2 (1 )2 - 6 (18 )3 3 3 (41 ) (71 )3 - $ (36 ) $ (90 ) $ 3 $ 4 $ - $ - (7 ) (32 )2 - 13 (44 )3 (2 )3 (58 ) (117 )3 - $ (48 ) $ (193 ) $ (2 ) 1OCI is defined as other comprehensive income (loss).2Loss was reclassified from accumulated other comprehensive income into net sales.3Loss was recognized in cost of goods sold and other operating charges.Derivatives not Designated in Hedging Instruments Amount of Gain or (Loss)
Recognized in Income on Derivative Derivatives Not Designated in Hedging Instruments 2010 2009 $ 117 1 $ (485 )1 (18 )2 (6 )2 $ 99 $ (491 ) 1Gain (loss) recognized in other income, net, was partially offset by the related gain (loss) on the foreign currency-denominated monetary assets and liabilities of the company's operations, which were $(130) and $280 for 2010 and 2009, respectively.2Loss was recognized in cost of goods sold and other operating charges. 2013 2012 2011 2013 2012 2011 Income Statement Classification Derivatives designated as hedging instruments: Fair value hedges: Interest rate swaps $ — $ — $ — $ (26 ) $ (11 ) $ 26 Cash flow hedges: Foreign currency contracts 9 (2 ) (6 ) 1 21 (15 ) Net sales Commodity contracts (67 ) 7 23 24 44 (81 ) Cost of goods sold (58 ) 5 17 (1 ) 54 (70 ) Derivatives not designated as hedging instruments: Foreign currency contracts — — — 35 (157 ) (133 ) Commodity contracts — — — (10 ) (22 ) 3 Cost of goods sold Interest rate swaps — — — — — (1 ) Interest expense — — — 25 (179 ) (131 ) Total derivatives $ (58 ) $ 5 $ 17 $ 24 $ (125 ) $ (201 ) OCI is defined as other comprehensive income (loss). 24.21. GEOGRAPHIC INFORMATION 2010 2009 2008 Net Sales1 Net Property2 Net Sales1 Net Property2 Net Sales1 Net Property2 $ 11,451 $ 7,835 $ 9,814 $ 7,641 $ 11,091 $ 7,784 $ 298 $ 139 $ 240 $ 146 $ 350 $ 157 777 102 837 100 1,072 115 1,939 289 1,645 294 2,220 309 767 36 684 39 912 28 67 244 50 243 88 247 306 7 253 7 359 7 427 259 389 291 521 297 264 216 215 220 240 229 503 116 452 126 605 138 2,769 327 2,400 329 3,119 325 $ 8,117 $ 1,735 $ 7,165 $ 1,795 $ 9,486 $ 1,852 $ 236 $ 9 $ 178 $ 8 $ 255 $ 9 2,759 494 1,827 427 1,656 309 695 81 492 65 485 60 1,464 102 1,096 97 1,302 102 614 65 482 74 534 78 179 31 135 32 153 42 534 129 362 129 420 132 266 3 190 3 236 4 562 69 427 47 442 26 $ 7,309 $ 983 $ 5,189 $ 882 $ 5,483 $ 762 $ 321 $ 26 $ 282 $ 27 $ 335 $ 28 1,892 317 1,584 316 1,775 300 915 215 757 215 843 225 592 58 559 53 609 46 $ 3,720 $ 616 $ 3,182 $ 611 $ 3,562 $ 599 $ 908 $ 170 $ 759 $ 165 $ 907 $ 157 $ 31,505 $ 11,339 $ 26,109 $ 11,094 $ 30,529 $ 11,154 1Net sales are attributed to countries based on the location of the customer.2Includes property, plant and equipment less accumulated depreciation.3Europe, Middle East, and Africa (EMEA). 2013 2012 2011 2013 2012 2011 United States $ 13,763 $ 13,284 $ 12,234 $ 8,598 $ 8,512 $ 8,668 Canada $ 1,025 $ 921 $ 880 $ 142 $ 149 $ 173 Belgium $ 257 $ 257 $ 304 $ 136 $ 133 $ 190 Denmark 88 83 83 280 320 323 Finland 72 69 65 166 170 176 France 749 765 774 269 243 252 Germany 1,502 1,557 1,736 152 161 337 Italy 728 764 824 38 33 35 Luxembourg 86 75 74 250 252 250 Russia 365 355 357 7 7 8 Spain 369 331 390 270 269 266 Switzerland 105 111 116 129 79 69 The Netherlands 278 290 277 308 289 237 United Kingdom 506 516 493 87 96 110 Other 3,274 2,867 2,624 290 251 349 Total EMEA $ 8,379 $ 8,040 $ 8,117 $ 2,382 $ 2,303 $ 2,602 Asia Pacific Australia $ 251 $ 269 $ 247 $ 16 $ 20 $ 19 China/Hong Kong 2,987 2,944 2,996 356 423 628 India 740 745 815 131 111 97 Japan 1,292 1,577 1,749 85 101 106 Korea 623 662 694 49 61 64 Malaysia 143 108 99 52 53 52 Singapore 184 154 186 74 55 42 Taiwan 579 594 654 135 135 133 Thailand 299 324 309 30 26 24 Other 677 650 599 66 62 63 Total Asia Pacific $ 7,775 $ 8,027 $ 8,348 $ 994 $ 1,047 $ 1,228 Latin America Argentina $ 435 $ 406 $ 403 $ 45 $ 43 $ 40 Brazil 2,565 2,363 2,072 394 348 394 Mexico 1,070 1,044 972 421 307 276 Other 722 727 655 17 32 31 Total Latin America $ 4,792 $ 4,540 $ 4,102 $ 877 $ 730 $ 741 Total $ 35,734 $ 34,812 $ 33,681 $ 12,993 $ 12,741 $ 13,412 Net sales are attributed to countries based on the location of the customer. Includes property, plant and equipment less accumulated depreciation. Europe, Middle East, and Africa (EMEA). 25.seveneight reportable segments based on similar economic characteristics, the nature of the products and production processes, end-use markets, channels of distribution and regulatory environment. The company's reportable segments are Agriculture, & Nutrition, Electronics & Communications, Industrial Biosciences, Nutrition & Health, Performance Chemicals, Performance Coatings, Performance Materials, Safety & Protection and Pharmaceuticals. The company includes certain embryonic businesses not included in the reportable segments, such as Applied BioSciences,pre-commercial programs, and nonaligned businesses in Other.& Nutrition (hybrid seed corn(corn hybrids and soybean seed,varieties, herbicides, fungicides insecticides, value enhanced grains and soy protein)insecticides); Electronics & Communications (photopolymers and electronic materials); Industrial Biosciences (enzymes and bio-based materials); Nutrition & Health (cultures, emulsifiers, texturants, natural sweeteners and soy-based food ingredients); Performance Chemicals (fluorochemicals, fluoropolymers, specialty and industrial chemicals, and white pigments); Performance Coatings (automotive finishes, and industrial coatings); Performance Materials (engineering polymers, packaging and industrial polymers, films and elastomers); Safety & Protection (nonwovens, aramids and solid surfaces); and Pharmaceuticals (representing the company's interest in the collaboration relating to Cozaar®Cozaar®/Hyzaar®Hyzaar® antihypertensive drugs, which is reported as other income). The company operates globally in substantially all of its product lines.the Summary of Significant Accounting Policies.Note 1. Exceptions are noted as follows and are shown in the reconciliations below. Segment sales include transfers to another business segment. Products are transferred between segments on a basis intended to reflect, as nearly as practicable, the market value of the products. Segment pre-tax operating income (loss) (PTOI) is defined as operating income (loss) before income taxes, exchange gains (losses), corporate expenses and interest. Segment net assets includes net working capital, net property, plant and equipment, and other noncurrent operating assets and liabilities of the segment. Affiliate net assets (pro rata share) excludes borrowing and other long-term liabilities. Depreciation and amortization includes depreciation on research and development facilities and amortization of other intangible assets, excluding write-down of assets whichassets. Prior years' data have been reclassified to reflect the current organizational structure.discussed in Note 4.defined as income (loss) from continuing operations before income taxes excluding non-operating pension and other postretirement employee benefit costs, exchange gains (losses), corporate expenses and interest. Certain reclassifications of prior year data have been made to conform to current year classifications. Agriculture &
Nutrition Electronics &
Communications Performance
Chemicals Performance
Coatings Performance
Materials Safety &
Protection Pharma-
ceuticals Other Total $ 9,085 $ 2,764 $ 6,322 $ 3,806 $ 6,287 $ 3,364 $ - $ 194 $ 31,822 (1 ) (17 ) (216 ) (1 ) (69 ) (12 ) - (1 ) (317 ) 9,084 2,747 6,106 3,805 6,218 3,352 - 193 31,505 1,355 445 1,081 249 994 454 489 (205 ) 4,862 374 94 266 105 205 151 - 4 1,199 59 26 24 2 77 37 - (45 ) 180 5,877 1,656 3,317 2,047 3,545 2,967 40 235 19,684 291 195 184 16 485 103 - 90 1,364 399 260 225 74 190 215 - 11 1,374 $ 8,287 $ 1,918 $ 4,964 $ 3,429 $ 4,768 $ 2,811 $ - $ 158 $ 26,335 - (20 ) (145 ) (1 ) (40 ) (11 ) - (9 ) (226 ) 8,287 1,898 4,819 3,428 4,728 2,800 - 149 26,109 1,224 87 547 69 287 260 1,037 (171 ) 3,340 439 88 267 123 249 147 - 4 1,317 47 1 9 1 37 26 - (32 ) 89 6,212 1,439 3,297 2,018 3,286 2,217 105 172 18,746 312 190 152 15 430 84 39 71 1,293 340 237 192 55 122 228 - 5 1,179 $ 7,952 $ 2,194 $ 6,035 $ 4,361 $ 6,425 $ 3,733 $ - $ 160 $ 30,860 - (30 ) (229 ) (1 ) (39 ) (14 ) - (18 ) (331 ) 7,952 2,164 5,806 4,360 6,386 3,719 - 142 30,529 1,087 251 687 (8 ) 128 661 1,025 (181 ) 3,650 460 86 261 111 219 130 - 4 1,271 25 20 16 1 44 29 - (18 ) 117 6,016 1,389 3,673 2,226 3,595 2,335 201 134 19,569 184 210 137 15 437 96 41 50 1,170 376 157 349 91 271 468 - 27 1,739 Agriculture Industrial Biosciences Nutrition & Health Other Total 2013 Segment sales $ 11,739 $ 2,549 $ 1,224 $ 3,473 $ 6,703 $ 6,468 $ 3,884 $ — $ 6 $ 36,046 Less: Transfers 11 15 13 — 196 73 4 — — 312 Net sales 11,728 2,534 1,211 3,473 6,507 6,395 3,880 — 6 35,734 PTOI 2,132 203 170 305 924 1,281 694 32 (372 ) 5,369 358 105 81 271 242 173 198 — 1 1,429 36 22 2 — 19 (16 ) 23 — (49 ) 37 Segment net assets 5,883 1,435 2,640 6,455 3,933 3,724 3,138 (3 ) 156 27,361 Affiliate net assets 281 145 48 7 169 492 106 — 21 1,269 485 73 77 138 424 184 109 — 112 1,602 2012 Segment sales $ 10,426 $ 2,701 $ 1,180 $ 3,422 $ 7,188 $ 6,447 $ 3,825 $ — $ 5 $ 35,194 Less: Transfers 5 17 11 — 247 91 11 — — 382 Net sales 10,421 2,684 1,169 3,422 6,941 6,356 3,814 — 5 34,812 PTOI 1,669 222 159 270 1,778 1,121 562 62 (474 ) 5,369 337 113 79 288 245 182 197 — 1 1,442 30 19 1 — 28 42 32 — (53 ) 99 Segment net assets 4,756 1,622 2,602 6,641 3,910 3,770 3,153 (18 ) 77 26,513 Affiliate net assets 389 151 53 8 180 567 106 — 14 1,468 432 71 80 148 389 186 118 — 7 1,431 2011 Segment sales $ 9,166 $ 3,173 $ 705 $ 2,460 $ 7,794 $ 6,815 $ 3,934 $ — $ 40 $ 34,087 Less: Transfers 1 19 7 — 257 109 13 — — 406 Net sales 9,165 3,154 698 2,460 7,537 6,706 3,921 — 40 33,681 PTOI 1,566 438 2 76 2,114 1,079 661 289 (344 ) 5,881 295 99 47 207 252 199 172 — 2 1,273 58 19 (3 ) — 43 74 47 — (47 ) 191 Segment net assets 4,975 1,954 2,542 6,279 3,812 3,757 3,239 35 75 26,668 Affiliate net assets 330 197 52 1 201 445 111 — 34 1,371 420 198 61 115 326 197 208 — 5 1,530 Includes assets held for sale related to GLS/Vinyls of $228 as of December 31, 2013. See Note 2 for additional information. PTOI to income before income taxes 2010 2009 2008 $ 4,862 $ 3,340 $ 3,650 (13 ) (205 ) (255 ) (1,138 ) (951 ) (1,004 ) $ 3,711 $ 2,184 $ 2,391 PTOI to income from continuing operations before income taxes 2013 2012 2011 Total segment PTOI $ 5,369 $ 5,369 $ 5,881 Non-operating pension and other postretirement employee benefit costs (539 ) (654 ) (540 ) Net exchange losses, including affiliates (128 ) (215 ) (146 ) Corporate expenses (765 ) (948 ) (869 ) Interest expense (448 ) (464 ) (447 ) Income from continuing operations before income taxes $ 3,489 $ 3,088 $ 3,879 Segment net assets to total assets 2010 2009 2008 Segment net assets to total assets at December 31, 2013 2012 2011 $ 19,684 $ 18,746 $ 19,569 $ 27,361 $ 26,513 $ 26,668 11,312 10,975 8,836 13,498 10,261 9,637 9,414 8,464 7,804 Liabilities included in segment net assets 10,640 10,009 9,250 — 3,076 3,088 $ 40,410 $ 38,185 $ 36,209 $ 51,499 $ 49,859 $ 48,643 1Pension assets are included in corporate assets.Pension assets are included in corporate assets. See Note 1 for additional information on the presentation of the Performance Coatings which met the criteria for discontinued operations during 2012. Other items Segment
Totals Adjustments Consolidated
Totals Adjustments 2013 $ 1,199 $ 181 $ 1,380 $ 1,429 $ 174 $ 1,603 180 (3 ) 177 37 4 41 1,364 (323 ) 1,041 1,269 (258 ) 1,011 1,374 134 1,508 1,602 280 1,882 2012 $ 1,317 $ 186 $ 1,503 $ 1,442 $ 271 $ 1,713 89 10 99 99 3 102 1,293 (279 ) 1,014 1,468 (305 ) 1,163 1,179 129 1,308 1,431 362 1,793 2011 $ 1,271 $ 173 $ 1,444 $ 1,273 $ 287 $ 1,560 117 (36 ) 81 191 1 192 1,170 (326 ) 844 1,371 (254 ) 1,117 1,739 239 1,978 1,530 313 1,843 See Note 1 for additional information on the presentation of the Performance Coatings business which met the criteria for discontinued operations during 2012. 2010 included the following pre-tax benefits (charges): $ (50 ) 8 10 (6 ) 16 5 1 $ (16 ) $ (351 ) (131 ) 1 6 (74 ) (16 ) 4 5 $ (556 ) 1Included a $(72) charge recorded in Other operating charges related to the titanium dioxide antitrust litigation. See Note 16 for additional information. Includes a $(50) charge in research and development expense for an upfront payment related to a Pioneer licensing agreement with Syngenta AG for MIR604 (Agrisure2012TM RW) for corn seed trait technology. Since this payment is being made before regulatory approval is secured by Pioneer, it was charged to research and development expense.2Includes a $34 net reduction (increase) in estimated restructuring costs related to the 2008 and 2009 programs impacting the segments as follows: Electronics & Communications – $8; Performance Chemicals – $10; Performance Coatings – $(6); Performance Materials – $16; Safety & Protection – $5; and Other – $1.2009 included the following pre-tax benefits (charges): $ 1 (37 ) (54 ) (15 ) 24 (45 ) (63 ) (2 ) $ (191 ) 1Includes a $130 net reduction (increase) in estimated restructuring costs related to the 2008 and 2009 programs impacting the segments as follows: Agriculture & Nutrition – $1; Electronics & Communications – $6; Performance Chemicals – $12; Performance Coatings – $50; Performance Materials – $52; Safety & Protection – $10; and Other – $(1).2Includes a $(340) restructuring charge impacting the segments as follows: Electronics & Communications – $(43); Performance Chemicals – $(66); Performance Coatings – $(65); Performance Materials – $(110); Safety & Protection – $(55); and Other – $(1).3Includes an $82 benefit from proceeds and adjustments related to hurricanes impacting the Performance Materials segment.4Includes $(63) charge to other income, net and reduction to accounts and notes receivable, net in the Pharmaceuticals segment to reflect increased rebates and other sales deductions related to the Cozaar®/Hyzaar® licensing agreement with Merck Sharp & Dohme Corp. This adjustment in 2009 is the result of overstatements to other income, net in prior periods which accumulated over the life of the contract. The company determined the impact of this adjustment was not material to the results of operations in 2009 or for prior periods.$ (469 ) (37 ) (3 ) (49 ) (36 ) (104 ) (58 ) (126 ) $ (882 ) Included a $117 gain recorded in Other income, net associated with the sale of a business. Included a $(134) restructuring charge recorded in Employee separation/asset related charges, net primarily as a result of the company's plan to eliminate corporate costs previously allocated to Performance Coatings and cost-cutting actions to improve competitiveness, partially offset by a reversal of prior year restructuring accruals. Charges by segment were: Agriculture - $(11); Electronics & Communications - $(9); Industrial Biosciences - $(3); Nutrition & Health - $(49); Performance Chemicals - $(3); Performance Materials - $(12); Safety & Protection - $(58); and Other - $11. See Note 3 for additional information. Included a $122 gain recorded in Other income, net associated with the sale of an equity method investment. Included a $(275) impairment charge recorded in Employee separation/asset related charges, net related to asset groupings, which impacted the segments as follows: Electronics & Communications - $(150); Performance Chemicals - $(33); and Performance Materials - $(92). See Note 3 for additional information. Included a $(137) charge in Other operating charges primarily related to the company's settlement of litigation with INVISTA. 2008 included the following pre-tax benefits (charges): $ (22 ) (37 ) (56 ) (209 ) (310 ) (97 ) 20 $ (711 ) 1Includes a $(535) restructuring charge impacting the segments as follows: Agriculture & Nutrition – $(18); Electronics & Communications – $(37); Performance Chemicals – $(50); Performance Coatings – $(209); Performance Materials – $(94); Safety & Protection – $(96); and Other – $(31).2Includes a $(227) charge for damaged facilities, inventory write-offs, clean-up costs, and other costs related to the hurricanes, in the following segments: Agriculture & Nutrition��– $(4); Performance Chemicals – $(6); Performance Materials – $(216); and Safety & Protection – $(1).3Includes a $51 benefit from a litigation settlement.$ (225 ) (79 ) (126 ) 47 (28 ) $ (411 ) Included a $(50) charge recorded in Research and development expense in connection with a milestone payment associated with a Pioneer licensing agreement. Since this milestone was reached before regulatory approval was secured by Pioneer, it was charged to Research and development expense. Included a $(182) charge for transaction related costs and the fair value step-up of inventories that were acquired as part of the Danisco transaction, which impacted the segments as follows: Industrial Biosciences - $(70) and Nutrition & Health - $(112). Included a $(53) restructuring charge primarily related to severance and related benefit costs associated with the Danisco acquisition impacting the segments as follows: Industrial Biosciences - $(9); Nutrition & Health - $(14); Performance Materials - $(2); and Other - $(28). Included a $49 benefit recorded in Other income, net associated with the sale of a business. 26. Unaudited For the quarter ended March 31, June 30, September 30, December 31, $ 8,484 $ 8,616 $ 7,001 $ 7,404 7,154 7,409 6,634 7,235 4,5 1,587 1,568 3 330 226 6 1,137 1,168 3 369 378 7 1.24 1.27 0.40 0.41 1.24 1.26 0.40 0.40 $ 6,871 $ 6,858 $ 5,961 $ 6,419 6,415 6,510 8,9,10 5,665 6,146 11 749 472 391 572 12 489 421 414 445 0.54 0.46 0.45 0.48 0.54 0.46 0.45 0.48 Unaudited For the quarter ended March 31, June 30, September 30, December 31, 2013 Net sales $ 10,408 $ 9,844 $ 7,735 $ 7,747 Cost of goods sold 6,193 6,057 5,165 5,133 1,774 1,365 228 122 Net income 3,355 1,034 288 185 1.48 1.11 0.28 0.19 1.47 1.10 0.28 0.19 2012 Net sales $ 10,180 $ 9,917 $ 7,390 $ 7,325 Cost of goods sold 5,935 5,844 4,779 4,980 Income (loss) from continuing operations before income taxes 1,801 1,496 (175 ) (34 ) Net income 1,504 1,175 8 93 1.49 1.16 (0.05 ) — 1.48 1.15 (0.05 ) — 1Excludes interest expense and non-operating items.2Earnings per share for the year may not equal the sum of quarterly earnings per share due to changes in average share calculations.3Includes benefits for the adjustment of accrued interest of $59 ($38 after-tax) in other income, net and the adjustment of income tax accruals of $49 associated with settlements of prior year tax contingencies.4Includes a $50 charge in research and development expense for an upfront payment related to a Pioneer licensing agreement with Syngenta AG for MIR604 (AgrisureTM RW) for corn seed trait technology. See description in Note 25 for further details.5Includes a $34 net reduction in estimated costs recorded in employee separation / asset related charges, net related to the 2008 and 2009 restructuring program primarily due to overall workforce reductions through lower than estimated individual severance costs and workforce reductions through non-severance programs.6Includes a $179 charge in interest expense associated with the early extinguishment of debt.7Includes a $39 benefit for the reversal of a tax valuation allowance related to the net deferred tax assets of a foreign subsidiary.8Includes a $340 charge for employee separation payments and asset related charges associated with the 2009 restructuring program.9Includes a $75 net reduction in estimated costs recorded in employee separation / asset related charges, net related to the 2008 restructuring program primarily due to overall workforce reductions through lower than estimated individual severance costs and workforce reductions through non-severance programs.10Includes a $50 benefit resulting from a reduction of $26 from lower than estimated inventory and permanent investment write-offs, and $24 in insurance recoveries relating to the damage from Hurricane Ike in 2008.11Includes a $55 net reduction in estimated costs recorded in employee separation / asset related charges, net related to the 2008 and 2009 restructuring program primarily due to overall workforce reductions through lower than estimated individual severance costs and workforce reductions through non-severance programs.12Includes a $63 charge for increased rebates and other sales deductions related to the Cozaar®/Hyzaar® licensing agreement. See description in Note 25 for further details.27. SUBSEQUENT EVENTIn January 2011, DuPont and its wholly owned subsidiary, DuPont Denmark Holding ApS, entered into a definitive agreement for the acquisition of Danisco A/S (Danisco), a global enzyme and specialty food ingredients company, for $6,300 which includes $5,800 in cash and the assumption of $500 of Danisco's net debt. The transaction is subject to customary closing conditions, including certain regulatory approvals and the tender of more than 90 percent of Danisco's shares in the tender offer. DuPont has the right to waive such tender offer conditions and accept a lesser number of shares in certain cases.The acquisition is expected to be financed with about $3,000 in existing cash and the remainder in new debt. In connection with this transaction, the company entered into a $4,000 bridge loan facility and a $2,000 bridge loan facility. The latter requires the company have cash, cash equivalents and marketable securities at least equal to $2,000 on hand at all times and readily available for use to purchase Danisco's shares. The bridge loan facilities terminate when the company completes the financing for the acquisition. The transaction is expected to close early in the second quarter 2011.Earnings per share for the year may not equal the sum of quarterly earnings per share due to changes in average share calculations. Third quarter 2013 included a $(72) charge recorded in Other operating charges related to the titanium dioxide antitrust litigation. See description in Note 16 for further details. Fourth quarter 2013 included a net $5 restructuring adjustment consisting of a $24 benefit associated with prior year restructuring programs and a $(19) charge associated with restructuring actions related to a joint venture. The majority of the $24 net reduction recorded in Employee separation/asset related charges, net was due to the achievement of work force reductions through non-severance programs associated with the 2012 restructuring program. The charge of $(19) included $(9) recorded in Employee separation/asset related charges, net and $(10) recorded in Other income, net and was the result of restructuring actions related to a joint venture within the Performance Materials segment. See Note 3 for additional information. Fourth quarter 2013 included a $(129) impairment charge recorded in Employee separation/asset related charges, net related to an asset grouping within the Electronics & Communications segment. See Note 3 for additional information. Second quarter 2012 included a $(137) charge recorded in Other operating charges primarily related to the company's settlement of litigation with INVISTA. Second quarter 2012 included a pre-tax gain of $122 recorded in Other income, net associated with the sale of an equity method investment in the Electronics & Communications segment. Third quarter 2012 included a $(152) restructuring charge recorded in Employee separation/asset related charges, net related to the 2012 restructuring program. Fourth quarter 2012 included a net $(66) charge recorded in Employee separation/asset related charges, net related to costs associated with the 2012 restructuring program partially offset by a reversal of prior years restructuring accruals. See description in Note 3 for further details. Third and fourth quarter 2012 included asset impairment charges of $(242) and $(33), respectively, recorded in Employee separation/asset related charges, net related to certain asset groupings. See descriptions in Note 3 for further details. Information for InvestorsCorporate Headquarters1007 Market StreetWilmington, DE 19898Telephone: 302 774-1000E-mail:find.info@usa.dupont.com2011 Annual MeetingThe annual meeting ofshareholders will be held at 10:30 a.m., Wednesday, April 27,Consolidated Financial Statements (continued)The DuPont Theatre inmillions, except per share)DuPont Building, 1007 Market Street, Wilmington, Delaware.Stock Exchange ListingsDuPont common stock (Symbol DD) is listed on the New York Stock Exchange, Inc. (NYSE) and on certain foreign exchanges. Quarterly high and low market prices are shown in Item 5 of the Form 10-K.DuPont preferred stock is listed on the New York Stock Exchange, Inc. (Symbol DDPrA for $3.50 series and Symbol DDPrB for $4.50 series).DividendsHolders of the company's common stock are entitled to receive dividends when they are declared by thecompany’s Board of Directors. While it is notDirectors authorized a guarantee of future conduct, the company has continuously paid a quarterly dividend since the fourth quarter 1904. Dividends on common stock and preferred stock are usually declared in January, April, July and October. When dividends on common stock are declared, they are usually paid mid March, June, September and December. Preferred dividends are paid on or about the 25th$5,000 of January, April, July and October.Shareholder ServicesInquiries from shareholders about stock accounts, transfers, certificates, dividends (including direct deposit and reinvestment), name or address changes and electronic receipt of proxy materials may be directed to DuPont's stock transfer agent:Computershare Trust Company, N.A.P.O. Box 43078Providence, RI 02940-3078or call: in the United States and Canada888 983-8766 (toll-free)other locations-781 575-2724
share buyback plan. See Note 17 for the hearing impaired-TDD: 800 952-9245 (toll-free)or visit Computershare's home page atadditional details.http://www.computershare.comIndependent Registered Public Accounting FirmPricewaterhouseCoopers LLPTwo Commerce Square, Suite 17002001 Market StreetPhiladelphia, PA 19103Investor RelationsInstitutional investors and other representatives of financial institutions should contact:E. I. du Pont de Nemours and CompanyDuPont Investor Relations1007 Market Street-D-11020Wilmington, DE 19898or call 302 774-4994Bondholder RelationsE. I. du Pont de Nemours and CompanyDuPont Finance1007 Market Street-D-8028Wilmington, DE 19898or call 302 774-0564or 302 774-8802DuPont on the InternetFinancial results, news and other information about DuPont can be accessed from the company's website athttp://www.dupont.com. This site includes important information on products and services, financial reports, news releases, environmental information and career opportunities. The company's periodic and current reports filed with the SEC are available on its website, free of charge, as soon as reasonably practicable after being filed.Product Information/ReferralFrom the United States and Canada:800 441-7515 (toll-free)From other locations: 302 774-1000E-mail: find.info@usa.dupont.comOn the Internet: http://www.dupont.comPrinted Reports Available to ShareholdersThe following company reports may be obtained, without charge:1.2010 Annual Report to the Securities and Exchange Commission, filed on Form 10-K;2.Proxy Statement for 2011 Annual Meeting of Stockholders; and3.Quarterly reports to the Securities and Exchange Commission, filed on Form 10-QRequests should be addressed to:DuPont Corporate Information CenterCRP705-GS38P.O. Box 80705Wilmington, DE 19880-0705or call 302 774-5991E-mail: find.info@usa.dupont.comInformation for Investors Services for Shareholders Online Account AccessRegistered shareholders may access their accounts and obtain online answers to stock transfer questions by signing up for Internet account access. Call toll-free 888 983-8766 (outside the United States and Canada, call 781 575-2724) to obtain by mail a temporary personal identification number and information on viewing your account over the Internet.Dividend Reinvestment PlanAn automatic dividend reinvestment plan is available to all registered shareholders. Common or preferred dividends can be automatically reinvested in DuPont common stock. Participants also may add cash for the purchase of additionalshares. A detailed account statement is mailed after each investment. Your account can also be viewed over the Internet if you have Online Account Access (see above). To enroll in the plan, please contact Computershare (listed above).Online Delivery of Proxy MaterialsStockholders may request their proxy materials electronically in 2011 by visitinghttp://enroll.icsdelivery.com/dd.Direct Deposit of DividendsRegistered shareholders who would like their dividends directly deposited in a U.S. bank account should contact Computershare (listed above).