
Use these links to rapidly review the document
Table of Contents
Index to Consolidated Financial Statements
UNITED STATES
SECURITIES AND EXCHANGE COMMISSION
Washington, D.C. 20549
FORM 10-K
| (Mark One) | ||
ý | ||
For the fiscal year ended December 31, | ||
or | ||
o | ||
For the | ||
Commission File No. 001-34728
DOUGLAS DYNAMICS, INC.
![]()
(Exact name of registrant as specified in its charter)
| Delaware (State or other jurisdiction of incorporation or organization) | 134275891 (I.R.S. Employer Identification No.) | |
7777 N 73rd Street | ||
| Milwaukee, Wisconsin (Address of principal executive offices) | 53223 (Zip Code) |
Registrant's telephone number, including area code
(414) 354-2310
Securities registered pursuant to Section 12(b) of the Act:
| Title of each class | ||
|---|---|---|
| Name of each exchange on which registered | ||
| Common Stock, $.01 Par Value | New York Stock Exchange |
Securities registered pursuant to Section 12(g) of the Act:NONE
Indicate by check mark if the registrant is a well-known seasoned issuer, as defined in Rule 405 of the Securities Act. Yes o No ý.
Indicate by check mark if the registrant is not required to file reports pursuant to Section 13 or Section 15(d) of the Act. Yes o No ý.
Indicate by check mark whether the registrant (1) has filed all reports required to be filed by Section 13 or 15(d) of the Securities Exchange Act of 1934 during the preceding 12 months (or for such shorter period that the registrant was required to file such reports), and (2) has been subject to such filing requirements for the past 90 days. Yes ý No o.
Indicate by check mark whether the registrant has submitted electronically and posted on its corporate Website, if any, every Interactive Data File required to be submitted and posted pursuant to Rule 405 of RegulationsRegulation S-T (232.405 of this chapter) during the preceding 12 months (or for such shorter period that the registrant was required to submit and post such files). Yes oý No o.
Indicate by check mark if disclosure of delinquent filers pursuant to Item 405 of Regulation S-K is not contained herein, and will not be contained, to the best of registrant's knowledge, in definitive proxy or information statements incorporated by reference in Part III of this Form 10-K or any amendment to this Form 10-K. ýo
Indicate by check mark whether the registrant is a large accelerated filer, an accelerated filer, a non-accelerated filer or a smaller reporting company. See definitions of "large accelerated filer," "accelerated filer" and "smaller reporting company" in Rule 12b-2 of the Exchange Act. (Check one):
| Large accelerated filer o | Accelerated filer | Non-accelerated filer (Do not check if a smaller reporting company) | Smaller reporting company o |
Indicate by check mark whether the registrant is a shell company (as defined in Rule 12b-2 of the Exchange Act). Yes o No ý.
At June 30, 2010,28, 2013, the aggregate market value of the voting stock of the Registrant held by stockholders who were not affiliates of the Registrant was approximately $130$288 million (based upon the closing price of Registrant's Common Stock on the New York Stock Exchange on such date). At March 4, 2011,11, 2014, the Registrant had outstanding an aggregate of 21,662,24222,260,082 shares of its Common Stock.
Documents Incorporated by Reference:
Portions of the Proxy Statement for the Registrant's Annual Meeting of Shareholders to be held on May 4, 2011April 30, 2014, which Proxy Statement will be filed with the Securities and Exchange Commission no later than 120 days after the close of the fiscal year ended December 31, 2013, are incorporated into Parts II and III.
PART I | 3 | ||||||
Item 1. | Business | ||||||
Item 1A. | Risk Factors | ||||||
Item 1B. | Unresolved Staff Comments | ||||||
Item 2. | Properties | ||||||
Item 3. | Legal Proceedings | ||||||
Item 4. |
| ||||||
| 20
| |||||||
PART II | |||||||
Item 5. | Market for Registrant's Common Equity, Related Stockholder Matters and Issuer Purchases of Equity Securities | ||||||
Item 6. | Selected Consolidated Financial Data | ||||||
Item 7. |
| ||||||
Item 7A. | Quantitative and Qualitative Disclosures About Market Risk | ||||||
Item 8. | Financial Statements and Supplementary Data | ||||||
Item 9. | Changes In and Disagreements with Accountants on Accounting and Financial Disclosures | ||||||
Item 9A. | Controls and Procedures | ||||||
Item 9B. | Other Information | ||||||
PART III | |||||||
Item 10. | Directors, Executive Officers and Corporate Governance | ||||||
Item 11. | Executive Compensation | ||||||
Item 12. | Security Ownership of Certain Beneficial Owners and Management and Related | ||||||
Item 13. | Certain Relationships and Related Transactions, and Director Independence | ||||||
Item 14. | Principal | ||||||
PART IV | |||||||
Item 15. | Exhibits and Financial Statement Schedules | ||||||
Signatures | |||||||
Exhibit Index | |||||||
Index to Consolidated Financial Statements | F-1 | ||||||
Forward Looking Statements
This Annual Report on Form 10-K contains "forward-looking statements" made within the meaning of the Private Securities Litigation Reform Act of 1995. Words such as "anticipate," "believe," "intend," "estimate," "expect," "continue," "should," "could," "may," "plan," "project," "predict," "will" and similar expressions are intended to identify forward-lookingforward- looking statements. In addition, statements covering our future sales or financial performance and our plans, performance and other objectives, expectations or intentions are forward-looking statements, such as statements regarding our liquidity, debt, planned capital expenditures, and adequacy of capital resources and reserves. Factors that could cause our actual results to differ materially from those expressed or implied in such forward-looking statements include, but are not limited to:
We undertake no obligation to revise the forward-looking statements included in this Annual Report on Form 10-K to reflect any future events or circumstances. Our actual results, performance or achievements could differ materially from the results expressed in, or implied by, these forward-looking statements. Factors in addition to those listed above that could cause or contribute to such differences are discussed in Item 1A, "Risk Factors" of the Annual Report on Form 10-K.
Overview
Douglas Dynamics, Inc. (the "Company," "we," "us," "our") is the North American leader in the design, manufacture and sale of snow and ice control equipment for light trucks, which consists of snowplows, sand and salt spreaders, and related parts and accessories. We sell our products under the WESTERN®, FISHER® and BLIZZARD® brands which are among the most established and recognized in the industry. We believe that in 2010 our shareOn May 6, 2013, the Company acquired substantially all of the light truck snowassets of TrynEx. The acquired assets include TrynEx's full line of product offerings, including its SnowEx, TurfEx and ice control equipment market was greater than 50%.SweepEx brands, and access to TrynEx's network of authorized dealers. We operate as a single segment.
We offer the broadest and most complete product line of snowplows and sand and salt spreaders for light trucks in the U.S. and Canadian markets. We also provide a full range of related parts and accessories, which generates an ancillary revenue stream throughout the lifecycle of our snow and ice control equipment. For the yearyears ended December 31, 2010, 86%2013, December 31, 2012 and December 31, 2011 85%, 88% and 85% of our net sales were generated from
sales of snow and ice control equipment, respectively and 14%15%, 12% and 15% of our net sales were generated from sales of parts and accessories.accessories, respectively.
We sell our products through a distributor network primarily to professional snowplowers who are contracted to remove snow and ice from commercial, municipal and residential areas. Over the last 50 years, we have engendered exceptional customer loyalty for our products because of our ability to satisfy the stringent demands of our customers for a high degree of quality, reliability and service. As a result, we believe our installed base is the largest in the industry with over 500,000 snowplows and sand and salt spreaders in service. Because sales of snowplows and sand and salt spreaders are primarily driven by the need of our core end-user base to replace worn existing equipment, we believe our substantial installed base provides us with a high degree of predictable sales over any extended period of time.
We believe we have the industry's most extensive North American distributordistribution network worldwide, which primarily consists of over 7202,100 points of sale. Direct points of shipment are predominantly through North American truck equipment and lawn care equipment distributors. Most of our distributors who purchase directly from us and are located throughout the snowbeltsnow belt regions in North America (primarily the Midwest, East and Northeast regions of the United States as well as all provinces of Canada). We have longstanding relationships with many of our distributors, with an average tenure of approximately 15 years.distributors. We continually seek to grow and optimize our network by opportunistically adding high-quality, well-capitalized distributors in select geographic areas and by cross-selling our industry-leading brands within our distribution network. Beginning in 2005, we began to extend our reach to international markets, establishing distribution relationships in Northern Europe and Asia, where we believe meaningful growth opportunities exist.
We believe we are the industry's most operationally efficient manufacturer due to our vertical integration, highly variable cost structure and intense focus on lean manufacturing. We continually seek to use lean principles to reduce costs and increase the efficiency of our manufacturing operations. We currently manufacture our products in twothree facilities that we own in Milwaukee, Wisconsin, Rockland, Maine and Rockland, Maine. We closed our Johnson City, Tennessee facility in August 2010.Madison Heights, Michigan. Furthermore, our manufacturing efficiency allows us to deliver desired products quickly to our customers during times of sudden and unpredictable snowfall events when our customers need our products immediately.
On May 10, 2010, we completed our initial public offering ("IPO"). In connection with our IPO, we listed our common stock on the New York Stock Exchange ("NYSE") under the stock symbol "PLOW."Table of Contents
Our Industry
The light truck snow and ice control equipment industry in North America consists predominantly of domestic participants that manufacture their products in North America. The annual demand for snow and ice control equipment is driven primarily by the replacement cycle of the existing installed base, which is predominantly a function of the average life of a snowplow or spreader and is driven by usage and maintenance practices of the end-user. We believe actively-used snowplows are typically replaced, on average, every 79 to 812 years.
The primary factor influencing the replacement cycle for snow and ice control equipment is the level, timing and location of snowfall. Sales of snow and ice control equipment in any given year and region are most heavily influenced by local snowfall levels in the prior snow season. Heavy snowfall during a given winter causes equipment usage to increase, resulting in greater wear and tear and shortened life cycles, thereby creating a need for replacement equipment and additional parts and accessories.
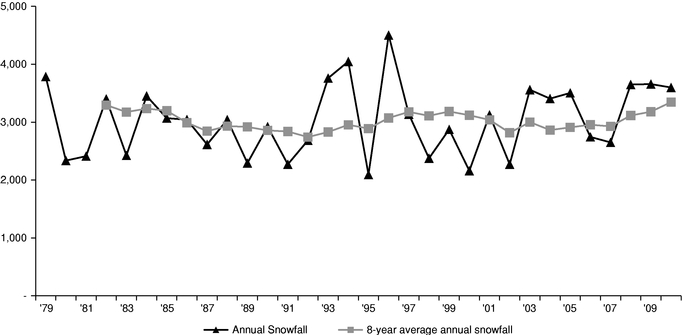
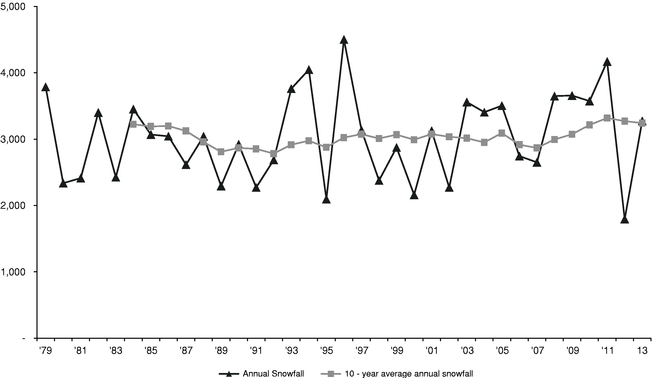
While snowfall levels vary within a given year and from year-to-year, snowfall, and the corresponding replacement cycle of snow and ice control equipment, is relatively consistent over multi-year periods. The following chart depicts aggregate annual and eight-yearten-year (based on the typical
life of our snowplows) rolling average of the aggregate snowfall levels in 66 cities in 26 snowbeltsnow belt states across the Northeast, East, Midwest and Western United States where we monitor snowfall levels from 1980 to 2010.2013. As the chart indicates, since 19821984 aggregate snowfall levels in any given rolling eight-yearten-year period have been fairly consistent, ranging from 2,742 to 3,3463,318 inches.
Snowfall in Snowbelt States (inches)
(for October 1 through March 31)
The demand for snow and ice control equipment can also be influenced by general economic conditions in the United States, as well as local economic conditions in the snowbeltsnow-belt regions in North America. In stronger economic conditions, our end-users may choose to replace or upgrade existing equipment before its useful life has ended, while in weak economic conditions, our end-users may seek to extend the useful life of equipment, thereby increasing the sales of parts and accessories. However, since snow and ice control management is a non-discretionary service necessary to ensure public safety and continued personal and commercial mobility in populated areas that receive snowfall, end-users cannot extend the useful life of snow and ice control equipment indefinitely and must replace equipment that has become too worn, unsafe or unreliable, regardless of economic conditions. While our parts and accessories yield slightly higher gross margins than our snow and ice control equipment, they yield significantly lower revenue than equipment sales, which adversely affects our results of operations.
Sales of parts and accessories for 2009 and 2010, respectively,2013 were approximately 44.5% and 34.4%31% higher than average annual parts and accessories sales over the preceding ten years, which management believes is largely a resultyears. The higher than average parts and accessories sales was partially due to acquisition of the deferralTrynEx business. TrynEx parts and accessories sales contributed approximately 9% of new equipment purchases dueincreased parts and accessory sales. The remaining 22% increase can be attributed to the recent economic downturn. Although salestiming of the snowfall for the six-month snow and ice control units increased in 2010season ended March 31, 2013. From October 2012 through January 2013, there was very little snowfall across our key markets, while the snow season as compared to 2009, management believes that absenta whole was slightly above historical average snowfall levels. Consequently, the recent economic downturn, equipment sales in 2009 and 2010 would have been considerably higher due to the high levelsmajority of snowfall during these years, ascame in February and March of 2013. When snowfall occurs late in the snow season, end users will typically choose to repair rather than replace existing equipment unit sales in 2009thus driving up parts and 2010 remained below the ten-year average, while snowfall levels in 2009 and 2010 were considerably above the ten-year average. Management believes this deferral of new equipment purchases could result in an elevated multi-year replacement cycle as the economy recovers.accessory sales.
Long-term growth in the overall snow and ice control equipment market also results from geographic expansion of developed areas in the snowbeltsnow belt regions of North America, as well as
consumer demand for technological enhancements in snow and ice control equipment and related parts and accessories that improves efficiency and reliability. Continued construction in the snowbeltsnow belt regions in North America increases the aggregate area requiring snow and ice removal, thereby growing the market for snow and ice control equipment. In addition, the development and sale of more reliable, more efficient and more sophisticated products have contributed to an approximate 2% to 4% average unit price increase in each of the past five years.
Our Competitive Strengths
We compete solely with other North American manufacturers who do not benefit from our extensive distributor network, manufacturing efficiencies and depth and breadth of products. As the market leader in snow and ice control equipment for light trucks, we enjoy a set of competitive advantages versus smaller equipment providers, which allows us to generate robust cash flows in all snowfall environments and to support continued investment in our products, distribution capabilities and brand regardless of annual volume fluctuations. We believe these advantages are rooted in the following competitive strengths and reinforces our industry leadership over time.
Exceptional Customer Loyalty and Brand Equity. Our brands enjoy exceptional customer loyalty and brand equity in the snow and ice control equipment industry with both end-users and distributors, which have been developed through over 50 years of superior innovation, productivity, reliability and support, consistently delivered season after season. We believe past brand experience, rather than price, is the key factor impacting snowplow purchasing decisions.
Broadest and Most Innovative Product Offering. We provide the industry's broadest product offering with a full range of snowplows, sand and salt spreaders and related parts and accessories. We believe we maintain the industry's largest and most advanced in-house new product development program, historically introducing several new and redesigned products each year. Our broad product offering and
commitment to new product development is essential to maintaining and growing our leading market share position as well as continuing to increase the profitability of our business.
Extensive North American Distributor Network. With over 720 direct distributors,2,100 points of sale, we benefit from having the most extensive North American direct distributor network in the industry, providing a significant competitive advantage over our peers. Our distributors function not only as sales and support agents (providing access to parts and service), but also as industry partners providing real-time end-user information, such as retail inventory levels, changing consumer preferences or desired functionality enhancements, which we use as the basis for our product development efforts.
Leader in Operational Efficiency. We believe we are a leader in operational efficiency in our industry, resulting from our application of lean manufacturing principles and a highly variable cost structure. By utilizing lean principles, we are able to adjust production levels easily to meet fluctuating demand, while controlling costs in slower periods. This operational efficiency is supplemented by our highly variable cost structure, driven in part by our access to a sizable temporary workforce (comprising approximately 10-15% of our total workforce)workforce during average snowfall years), which we can quickly adjust, as needed. These manufacturing efficiencies enable us to respond rapidly to urgent customer demand during times of sudden and unpredictable snowfalls, allowing us to provide exceptional service to our existing customer base and capture new customers from competitors that we believe cannot service their customers' needs with the same speed and reliability.
Strong Cash Flow Generation. We are able to generate significant cash flow as a result of relatively consistent high profitability, low capital spending requirements and predictable timing of our working capital requirements. Our cash flow results will also benefit substantially from approximately $18$19.5 million of annual tax-deductible intangible and goodwill expense over the next ninefive years, which has the impact of reducing our corporate taxes owed by approximately $6.7$7.4 million on an annual basis
during this period, in the event we have sufficient taxable income to utilize such benefit. Our significant cash flow has allowed us to reinvest in our business, pay down long term debt, and pay substantial dividends on a pro rata basis to our stockholders.
Experienced Management Team. We believe our business benefits from an exceptional management team that is responsible for establishing our leadership in the snow and ice control equipment industry for light trucks. Our senior management team, consisting of four officers, has an average of approximately 2023 years of weather-related industry experience and an average of over ninethirteen years with our company. James Janik, our President and Chief Executive Officer, has been with us for over 1821 years and in his current role since 2000, and through his strategic vision, we have been able to expand our distributor network and grow our market leading position.
Our Business Strategy
Our business strategy is to capitalize on our competitive strengths to maximize cash flow to pay dividends, reduce indebtedness and reinvest in our business to create stockholder value. The building blocks of our strategy are:
Continuous Product Innovation. We believe new product innovation is critical to maintaining and growing our market-leading position in the snow and ice control equipment industry. We will continue to focus on developing innovative solutions to increase productivity, ease of use, reliability, durability and serviceability of our products and on incorporating lean manufacturing concepts into our product development process, which has allowed us to reduce the overall cost of development and, more importantly, to reduce our time-to-market by nearly one-half.
Distributor Network Optimization. We will continually seek opportunities to continue to expand our extensive distribution network by adding high-quality, well-capitalized distributors in select geographic
areas and by cross-selling our industry-leading brands within our distribution network to ensure we maximize our ability to generate revenue while protecting our industry leading reputation, customer loyalty and brands. We will also focus on optimizing this network by providing in-depth training, valuable distributor support and attractive promotional and incentive opportunities. As a result of these efforts, we believe a majority of our distributors choose to sell our products exclusively. We believe this sizable high quality network is unique in the industry, providing us with valuable insight into purchasing trends and customer preferences, and would be very difficult to replicate.
Aggressive Asset Management and Profit Focus. We will continue to aggressively manage our assets in order to maximize our cash flow generation despite seasonal and annual variability in snowfall levels. We believe our ability is unique in our industry and enables us to achieve attractive margins in all snowfall environments. Key elements of our asset management and profit focus strategies include:
Additionally, although modest, our capital expenditure requirements and operating expenses can be temporarily reduced in response to anticipated or actual lower sales in a particular year to maximize cash flow.
Flexible, Lean Enterprise Platform. We will continue to utilize lean principles to maximize the flexibility, efficiency and productivity of our manufacturing operations while reducing the associated costs, enabling us to increase distributor and end-user satisfaction. For example, in an environment where shorter lead times and near-perfect order fulfillment are important to our distributors, we believe our lean processes have helped us to improve our shipping performance and build a reputation for providing industry leading shipping performance. In 2010, we fulfilled 96.1% of our orders on or before the requested ship date, without error in content, packaging or delivery, as compared to 98.2% in 2009 and 81.5% in 2008. In January 2009, we opened a sourcing office in China, which we expect to become our central focus for specific component purchases and provide a majority of our procurement cost savings in the future.
Our Growth Opportunities
Opportunistically Seek New Products and New Markets. On May 6, 2013, the Company acquired substantially all of the assets of Trynex, including its full line of product offerings and access to its network of authorized dealers. We expect to continue to consider external growth opportunities within the snow and ice control industry and other equipment or component markets. We plan to continue to evaluate other acquisition opportunities within our industry that can help us expand our distribution reach, enhance our technology and as a consequence improve the breadth and depth of our product lines. We also consider diversification opportunities in adjacent markets that complement our business model and could offer us the ability to leverage our core competencies to create stockholder value.
Increase Our Industry Leading Market Share. We plan to leverage our industry leading position, distribution network and new product innovation capabilities to capture market share in the North American snow and ice control equipment market, focusing our primary efforts on increasing penetration in those North American markets where we believe our overall market share is less than 50%. We also plan to continue growing our presence in the snow and ice control equipment market outside of North America, particularly in Asia and Europe, which we believe could provide significant growth opportunities in the future.
Opportunistically Seek New Products and New Markets. We will consider external growth opportunities within the snow and ice control industry and other equipment or component markets. We plan to continue to evaluate acquisition opportunities within our industry that can help us expand our distribution reach, enhance our technology and as a consequence improve the breadth and depthTable of our product lines. We also consider diversification opportunities in adjacent markets that complement our business model and could offer us the ability to leverage our core competencies to create stockholder value.Contents
Employees
As of December 31, 2010,2013, we employed approximately 450520 employees on a full-time basis. None of our employees are represented by a union and we are not party to any collective bargaining agreements.
Financing program
We are party to a financing program in which certain distributors may elect to finance their purchases from us through a third party financing company. We provide the third party financing company recourse against us regarding the collectability of the receivable under the program due to the fact that if the third party financing company is unable to collect from the distributor the amounts due in respect of the product financed, we would be obligated to repurchase any remaining inventory related to the product financed and reimburse any legal fees incurred by the financing company. During the years ended December 31, 2013, 2012 and 2011, distributors financed purchases of $2.9 million, $1.6 million and $2.8 million through this financing program, respectively. At both December 31, 2013 and December 31, 2012, there were $0.0 million, of uncollectible outstanding receivables related to sales financed under the financing program. The amount owed by our distributors to the third party financing company under this program at December 31, 2013 and 2012 was $1.3 million and $0.9 million, respectively. We were required to repurchase repossessed inventory of $0.0 million, $0.2 million and $0.1 million for the years ended December 31, 2013, December 31, 2012 and December 31, 2011, respectively.
In the past, minimal losses have been incurred under this agreement. However, an adverse change in distributor retail sales could cause this situation to change and thereby require us to repurchase repossessed units. Any repossessed units are inspected to ensure they are current, unused product and are restocked and resold.
Intellectual Property
We maintain patents relating to snowplow mounts, assemblies, hydraulics, electronics and lighting systems, brooms as well as sand, salt and fertilizer spreader assemblies and our patent applications relate to each of the foregoing except for hydraulics. Patents are valid for the longer period of 17 years from issue date or 20 years from filing date. The duration of the patents we currently possess range between three years and 13 years of remaining life. Our patent applications date from 1999 through 2013.
We rely on a combination of patents, trade secrets and trademarks to protect certain of the proprietary aspects of our business and technology. We hold approximately 29 U.S. registered trademarks (including the trademarks WESTERN®, FISHER® BLIZZARD®, SNOWEX®, TURFEX® and SWEEPEX®), 10 Canadian registered trademarks, 5 European trademarks, 43 U.S. issued patents, 11 Canadian patents and two Chinese trademarks.
Raw Materials
During 2013, we experienced slightly favorable commodity costs compared to the average prices paid for commodities in 2012. Historically, we have mitigated, and we currently expect to continue to mitigate, commodity cost increases in part by engaging in proactive vendor negotiations, reviewing alternative sourcing options, substituting materials, engaging in internal cost reduction efforts, and increasing prices on some of our products, all as appropriate.
Most of the components of our products are also affected by commodity cost pressures and are commercially available from a number of sources. In 2013, we experienced no significant work stoppages because of shortages of raw materials or commodities. The highest raw material and component costs are generally for steel, which we purchase from several suppliers.
Other Information
We were formed as a Delaware corporation in 2004. We maintain a website with the address www.douglasdynamics.com. We are not including the information contained on our website as part of, or incorporating it by reference into, this report. We make available free of charge (other than an investor's own Internet access charges) through our website our Annual Report on Form 10-K, quarterly reports on Form 10-Q and current reports on Form 8-K, and amendments to these reports, as soon as reasonably practicable after we electronically file such material with, or furnish such material to, the Securities and Exchange Commission ("SEC").
The Company operates in an environment that involves numerous known and unknown risks and uncertainties. Our business, prospects, financial condition and operating results could be materially adversely affected by any of these risks, as well as other risks not currently known to us or that we currently consider immaterial. The risk described below highlight some of the factors that have affected, and in the future could affect our operations.
Our results of operations depend primarily on the level, timing and location of snowfall. As a result, a decline in snowfall levels in multiple regions for an extended time could cause our results of operations to decline and adversely affect our ability to pay dividends.
As a manufacturer of snow and ice control equipment for light trucks, and related parts and accessories, our sales depend primarily on the level, timing and location of snowfall in the regions in which we offer our products. A low level or lack of snowfall in any given year in any of the snowbeltsnow-belt regions in North America (primarily the Midwest, East and Northeast regions of the United States as well as all provinces of Canada) will likely cause sales of our products to decline in such year as well as the subsequent year, which in turn may adversely affect our results of operations and ability to pay dividends. See "Management's Discussion and Analysis of Financial Condition and Results of Operations—Seasonality and Year-to-Year Variability." A sustained period of reduced snowfall events in one or more of the geographic regions in which we offer our products could cause our results of operations to decline and adversely affect our ability to pay dividends.
The year-to-year variability of our business can cause our results of operations and financial condition to be materially different from year-to-year; whereas the seasonality of our business can cause our results of operations and financial condition to be materially different from quarter-to-quarter.
Because our business depends on the level, timing and location of snowfall, our results of operations vary from year-to-year. Additionally, because the annual snow season typically only runs from October 1 through March 31, our distributors typically purchase our products during the second and third quarters. As a result, we operate in a seasonal business. We not only experience seasonality in our sales, but also experience seasonality in our working capital needs. Consequently, our results of operations and financial condition can vary from year-to-year, as well as from quarter-to-quarter, which could affect our ability to pay dividends. If we are unable to effectively manage the seasonality and year-to-year variability of our business, our results of operations, financial condition and ability to pay dividends may suffer.
If economic conditions in the United States continue to remain weak or deteriorate further, our results of operations, financial condition and ability to pay dividends may be adversely affected.
Historically, demand for snow and ice control equipment for light trucks has been influenced by general economic conditions in the United States, as well as local economic conditions in the snowbeltsnow-belt regions in North America. During the last few years, economic conditions throughout the United States
have been extremely weak, andweak. Although conditions improved from 2011 through 2013, they may not improvebecome strong in the foreseeable future. Weakened economic conditions may cause our end-users to delay purchases of replacement snow and ice control equipment and instead repair their existing equipment, leading to a decrease in our sales of new equipment. Weakened economic conditions may also cause our end-users to delay their purchases of new light trucks. Because our end-users tend to purchase new snow and ice control equipment concurrent with their purchase of new light trucks, their delay in purchasing new light trucks can also result in the deferral of their purchases of new snow and ice control equipment. The deferral of new equipment purchases during periods of weak economic conditions may negatively affect our results of operations, financial condition and ability to pay dividends.
Weakened economic conditions may also cause our end-users to consider price more carefully in selecting new snow and ice control equipment. Historically, considerations of quality and service have outweighed considerations of price, but in a weak economy, price may become a more important factor. Any refocus away from quality in favor of cheaper equipment could cause end-users to shift away from our products to less expensive competitor products, or to shift away from our more
profitable products to our less profitable products, which in turn would adversely affect our results of operations and our ability to pay dividends.
Our failure to maintain good relationships with our distributors, the loss or consolidation of our distributor base or the actions or inactions of our distributors could have an adverse effect on our results of operations and our ability to pay dividends.
We depend on a network of truck equipment distributors to sell, install and service our products. Nearly all of these sales and service relationships are at will, and less than 1% of our distributors have agreed not to offer products that compete with our products. As a result,so almost all of our distributors could discontinue the sale and service of our products at any time, and those distributors that primarily sell our products may choose to sell competing products at any time. Further, difficult economic or other circumstances could cause any of our distributors to discontinue their businesses. Moreover, if our distributor base were to consolidate or if any of our distributors were to discontinue their business, competition for the business of fewer distributors would intensify. If we do not maintain good relationships with our distributors, or if we do not provide product offerings and pricing that meet the needs of our distributors, we could lose a substantial amount of our distributor base. A loss of a substantial portion of our distributor base could cause our sales to decline significantly, which would have an adverse effect on our results of operations and ability to pay dividends.
In addition, our distributors may not provide timely or adequate service to our end-users. If this occurs, our brand identity and reputation may be damaged, which would have an adverse effect on our results of operations and ability to pay dividends.
Lack of available financing options for our end-users or distributors may adversely affect our sales volumes.
Our end-user base is highly concentrated among professional snowplowers, who comprise over 50% of our end-users, many of whom are individual landscapers who remove snow during the winter and landscape during the rest of the year, rather than large, well-capitalized corporations. These end-users often depend upon credit to purchase our products. If credit is unavailable on favorable terms or at all, our end-users may not be able to purchase our products from our distributors, which would in turn reduce sales and adversely affect our results of operations and ability to pay dividends.
In addition, because our distributors, like our end-users, rely on credit to purchase our products, if our distributors are not able to obtain credit, or access credit on favorable terms, we may experience delays in payment or nonpayment for delivered products. Further, if our distributors are unable to obtain credit or access credit on favorable terms, they could experience financial difficulties or bankruptcy and cease purchases of our products altogether. Thus, if financing is unavailable on
favorable terms or at all, our results of operations and ability to pay dividends would be adversely affected.
The price of steel, a commodity necessary to manufacture our products, is highly variable. If the price of steel increases, our gross margins could decline.
Steel is a significant raw material used to manufacture our products. During 2008, 20092013, 2012 and 2010,2011, our steel purchases were approximately 15%13%, 18% and 13%15% of our revenue, respectively. The steel industry is highly cyclical in nature, and steel prices have been volatile in recent years and may remain volatile in the future. Steel prices are influenced by numerous factors beyond our control, including general economic conditions domestically and internationally, the availability of raw materials, competition, labor costs, freight and transportation costs, production costs, import duties and other trade restrictions. Steel prices are volatile and may increase as a result of increased demand from the automobile and consumer durable sectors. If the price of steel increases, our variable costs may increase. We may not be able to mitigate these increased costs through the implementation of
permanent price increases or temporary invoice surcharges, especially if economic conditions remain weak and our distributors and end-users become more price sensitive. If we are unable to successfully mitigate such cost increases in the future, our gross margins could decline.
If petroleum prices increase, our results of operations could be adversely affected.
Petroleum prices have fluctuated significantly in recent years. Prices and availability of petroleum products are subject to political, economic and market factors that are outside of our control. Political events in petroleum-producing regions as well as hurricanes and other weather-related events may cause the price of fuel to increase. If the price of fuel increases, the demand for our products may decline, which would adversely affect our financial condition and results of operations.
We depend on outside suppliers who may be unable to meet our volume and quality requirements, and we may be unable to obtain alternative sources.
We purchase certain components essential to our snowplows and sand and salt spreaders from outside suppliers, including off-shore sources. Most of our key supply arrangements can be discontinued at any time. A supplier may encounter delays in the production and delivery of such products and components or may supply us with products and components that do not meet our quality, quantity or cost requirements. Additionally, a supplier may be forced to discontinue operations. Any discontinuation or interruption in the availability of quality products and components from one or more of our suppliers may result in increased production costs, delays in the delivery of our products and lost end-user sales, which could have an adverse effect on our business and financial condition.
In addition, weWe have beguncontinued to increase the number of our off-shore suppliers. Our increased reliance on off-shore sourcing may cause our business to be more susceptible to the impact of natural disasters, war and other factors that may disrupt the transportation systems or shipping lines used by our suppliers, a weakening of the dollar over an extended period of time and other uncontrollable factors such as changes in foreign regulation or economic conditions. In addition, reliance on off-shore suppliers may make it more difficult for us to respond to sudden changes in demand because of the longer lead time to obtain components from off-shore sources. We may be unable to mitigate this risk by stocking sufficient materials to satisfy any sudden or prolonged surges in demand for our products. If we cannot satisfy demand for our products in a timely manner, our sales could suffer as distributors can cancel purchase orders without penalty until shipment.
We do not sell our products under long-term purchase contracts, and sales of our products are significantly impacted by factors outside of our control; therefore, our ability to estimate demand is limited.
We do not enter into long-term purchase contracts with our distributors and the purchase orders we receive may be cancelled without penalty until shipment. Therefore, our ability to accurately predict future demand for our products is limited. Nonetheless, we attempt to estimate demand for our products for purposes of planning our annual production levels and our long-term product development and new product introductions. We base our estimates of demand on our own market assessment, snowfall figures, quarterly field inventory surveys and regular communications with our distributors. Because wide fluctuations in the level, timing and location of snowfall, economic conditions and other factors may occur, each of which is out of our control, our estimates of demand may not be accurate. Underestimating demand could result in procuring an insufficient amount of materials necessary for the production of our products, which may result in increased production costs, delays in product delivery, missed sale opportunities and a decrease in customer satisfaction. Overestimating demand could result in the procurement of excessive supplies, which could result in increased inventory and associated carrying costs.
If we are unable to enforce, maintain or continue to build our intellectual property portfolio, or if others invalidate our intellectual property rights, our competitive position may be harmed.
Our patents relate to snowplow mounts, assemblies, hydraulics, electronics and lighting systems, brooms as well as sand, salt and fertilizer spreader assemblies and our patent applications relate to each of the foregoing except for hydraulics. Patents are valid for the longer period of 17 years from issue date or 20 years from filing date. The duration of the patents we currently possess range between three years and 13 years of remaining life. Our patent applications date from 1999 through 2013.
We rely on a combination of patents, trade secrets and trademarks to protect certain of the proprietary aspects of our business and technology. We hold approximately 2029 U.S. registered trademarks (including the trademarks WESTERN®, FISHER®, BLIZZARD® SNOWEX®, TURFEX® and BLIZZARD®SWEEPEX®), 510 Canadian registered trademarks, 285 European trademarks, 43 U.S. issued patents, 11 Canadian patents and 15 Canadian patents.two Chinese trademarks. Although we work diligently to protect our intellectual property rights, monitoring the unauthorized use of our intellectual property is difficult, and the steps we have taken may not prevent unauthorized use by others. In addition, in the
event a third party challenges the validity of our intellectual property rights, a court may determine that our intellectual property rights may not be valid or enforceable. An adverse determination with respect to our intellectual property rights may harm our business prospects and reputation. Third parties may design around our patents or may independently develop technology similar to our trade secrets. The failure to adequately build, maintain and enforce our intellectual property portfolio could impair the strength of our technology and our brands, and harm our competitive position. Although the Company haswe have no reason to believe that itsour intellectual property rights are vulnerable, previously undiscovered intellectual property could be used to invalidate our rights.
If we are unable to develop new products or improve upon our existing products on a timely basis, it could have an adverse effect on our business and financial condition.
We believe that our future success depends, in part, on our ability to develop on a timely basis new technologically advanced products or improve upon our existing products in innovative ways that meet or exceed our competitors' product offerings. Continuous product innovation ensures that our consumers have access to the latest products and features when they consider buying snow and ice control equipment. Maintaining our market position will require us to continue to invest in research and development and sales and marketing. Product development requires significant financial, technological and other resources. We may be unsuccessful in making the technological advances necessary to develop new products or improve our existing products to maintain our market position.
Industry standards, end-user expectations or other products may emerge that could render one or more of our products less desirable or obsolete. If any of these events occur, it could cause decreases in sales, a failure to realize premium pricing and an adverse effect on our business and financial condition.
We face competition from other companies in our industry, and if we are unable to compete effectively with these companies, it could have an adverse effect on our sales and profitability. Price competition among our distributors could negatively affect our market share.
We primarily compete with regional manufacturers of snow and ice control equipment for light trucks. While we are the most geographically diverse company in our industry, we may face increasing competition in the markets in which we operate. In saturated markets, price competition may lead to a decrease in our market share or a compression of our margins, both of which would affect our profitability. Moreover, current or future competitors may grow their market share and develop superior service and may have or may develop greater financial resources, lower costs, superior technology or more favorable operating conditions than we maintain. As a result, competitive pressures we face may cause price reductions for our products, which would affect our profitability or result in decreased sales and operating income. Additionally, saturation of the markets in which we compete or channel conflicts among our brands and shifts in consumer preferences may increase these competitive pressures or may result in increased competition among our distributors and affect our sales and profitability. In addition, price competition among the distributors that sell our products could lead to significant margin erosion among our distributors, which could in turn result in compressed margins or loss of market share for us. Management believes that, after us,ourselves, the next largest competitors in the market for snow and ice control equipment for light trucks are BOSSNorthern Star Industries, Inc. (the manufacturer of the Boss brand of snow and ice control equipment) and Meyer respectively,Products LLC, and accordingly represent our primary competitors for market share.
We are subject to complex laws and regulations, including environmental and safety regulations that can adversely affect the cost, manner or feasibility of doing business.
Our operations are subject to certain federal, state and local laws and regulations relating to, among other things, the generation, storage, handling, emission, transportation, disposal and discharge of hazardous and non-hazardous substances and materials into the environment, the manufacturing of
motor vehicle accessories and employee health and safety. We cannot be certain that existing and future laws and regulations and their interpretations will not harm our business or financial condition. We currently make and may be required to make large and unanticipated capital expenditures to comply with environmental and other regulations, such as:
While we monitor our compliance with applicable laws and regulations and attempt to budget for anticipated costs associated with compliance, we cannot predict the future cost of such compliance. While in the current periodIn 2013, the amount expended for such compliance was insignificant, but we could incur material expenses in the future in the event of future legislation changes or unforeseen events, such as a workplace accident or environmental discharge, or if we otherwise discover we are in non-compliance with an applicable regulation. In addition, under these laws and regulations, we could be liable for:
Our operations could be significantly delayed or curtailed and our costs of operations could significantly increase as a result of regulatory requirements, restrictions or claims. We are unable to predict the ultimate cost of compliance with these requirements or their effect on our operations.
Financial market conditions have had a negative impact on the return on plan assets for our pension plans, which may require additional funding and negatively impact our cash flows.
Our pension expense and required contributions to our pension plan are directly affected by the value of plan assets, the projected rate of return on plan assets, the actual rate of return on plan assets and the actuarial assumptions we use to measure the defined benefit pension plan obligations. Due toDespite modest recent market recoveries, the recent significantfunding status of our pension plans, remain impacted by the financial market downturn over the last several years, which had severely impacted the funded status of our pension plans has declined.plans. As of December 31, 2010,2013, our pension plans were underfunded by approximately $10.8$7.1 million. In 2010,2013, contributions to our defined benefit pension plans were approximately $0.9$0.8 million. If plan assets continue to perform below expectations, future pension expense and funding obligations will increase, which would have a negative impact on our cash flows. Moreover, under the Pension Protection Act of 2006, it is possible that continued losses of asset values may necessitate accelerated funding of our pension plans in the future to meet minimum federal government requirements.
The statements regarding our industry, market positions and market share in this filing are based on our management's estimates and assumptions. While we believe such statements are reasonable, such statements have not been independently verified.
Information contained in this Annual Report on Form 10-K concerning the snow and ice control equipment industry for light trucks, our general expectations concerning this industry and our market positions and other market share data regarding the industry are based on estimates our management prepared using end-user surveys, anecdotal data from our distributors and distributors that carry our competitors' products, our results of operations and management's past experience, and on assumptions
made, based on our management's knowledge of this industry, all of which we believe to be reasonable. These estimates and assumptions are inherently subject to uncertainties, especially given the year-to-year variability of snowfall and the difficulty of obtaining precise information about our competitors, and may prove to be inaccurate. In addition, we have not independently verified the information from any third-party source and thus cannot guarantee its accuracy or completeness, although management also believes such information to be reasonable. Our actual operating results may vary significantly if our estimates and outlook concerning the industry, snowfall patterns, our market positions or our market shares turn out to be incorrect.
We are subject to product liability claims, product quality issues, and other litigation from time to time that could adversely affect our operating results or financial condition.
The manufacture, sale and usage of our products expose us to a risk of product liability claims. If our products are defective or used incorrectly by our end-users, injury may result, giving rise to product liability claims against us. If a product liability claim or series of claims is brought against us for uninsured liabilities or in excess of our insurance coverage, and it is ultimately determined that we are liable, our business and financial condition could suffer. Any losses that we may suffer from any liability claims, and the effect that any product liability litigation may have upon the reputation and marketability of our products, may divert management's attention from other matters and may have a
negative impact on our business and operating results. Additionally, we could experience a material design or manufacturing failure in our products, a quality system failure or other safety issues, or heightened regulatory scrutiny that could warrant a recall of some of our products. A recall of some of our products could also result in increased product liability claims. Any of these issues could also result in loss of market share, reduced sales, and higher warranty expense.
We are heavily dependent on our Chief Executive Officer and management team.
Our continued success depends on the retention, recruitment and continued contributions of key management, finance, sale and marketing personnel, some of whom could be difficult to replace. Our success is largely dependent upon our senior management team, led by our Chief Executive Officer and other key managers. The loss of any one or more of such persons could have an adverse effect on our business and financial condition.
Our indebtedness could adversely affect our operations, including our ability to perform our obligations and pay dividends.
As of December 31, 2010,2013, we had approximately $121$110 million of senior secured indebtedness, $13.0 million in outstanding borrowings under our revolving credit facility and $60$48 million of remaining borrowing availability under ourthe revolving credit facility. We may also be able to incur substantial indebtedness in the future, including senior indebtedness, which may or may not be secured.
Our indebtedness could have important consequences, including the following:
If any of these consequences occur, our financial condition, results of operations and ability to pay dividends could be adversely affected. This, in turn, could negatively affect the market price of our common stock, and we may need to undertake alternative financing plans, such as refinancing or restructuring our debt, selling assets, reducing or delaying capital investments or seeking to raise additional capital. We cannot assure you that any refinancing would be possible, that any assets could be sold, or, if sold, of the timing of the sales and the amount of proceeds that may be realized from those sales, or that additional financing could be obtained on acceptable terms, if at all.
Our variable rate indebtedness subjects us to interest rate risk, which could cause our debt service obligations to increase significantly and could impose adverse consequences.
OurCertain of our borrowings, including our term loan and any revolving borrowings under our senior credit facilities, are at variable rates of interest and expose us to interest rate risk. In addition, the interest rate on any revolving borrowings is subject to an increase in the interest rate if the average daily availability under our revolving credit facility falls below a certain threshold. If interest rates increase, our debt service obligations on the variable rate indebtedness would increase even though the amount borrowed remained the same, and our net income and cash flows would correspondingly decrease.
Our senior credit facilities impose restrictions on us, which may also prevent us from capitalizing on business opportunities and taking certain corporate actions. One of these facilities also includes minimum availability requirements, which if unsatisfied, could result in liquidity events that may jeopardize our business.
Our senior credit facilities contain, and future debt instruments to which we may become subject may contain, covenants that limit our ability to engage in activities that could otherwise benefit our company, includingcompany. Under the credit facilities as modified in April 2011 and amended again in November 2012, these covenants include restrictions on our ability to:
Our amended revolving credit facility also includes limitations on capital expenditures and requires usthat if we fail to maintain at least $6 millionthe greater of $8,750,000 and 12.5% of the revolving commitments in borrowing availability. Failure to maintain such availability, would constitute a "liquidity event" under our revolving credit facility, and as a result we would be required tomust comply with a fixed charge coverage ratio test. In addition, if such a liquidity event occurs because our borrowing availability is less than the greater of $10,500,000 and 15% of the aggregate revolving commitments (or an event of default)default occurs and is continuing,continuing), subject to certain limited cure rights, all proceeds of our accounts receivable and other collateral will be applied to reduce obligations under our revolving credit facility,
reduce obligations under our amended revolving credit facility, jeopardizing our ability to meet other obligations. Our ability to comply with the covenants contained in our senior credit facilities or in the agreements governing our future indebtedness, and our ability to avoid liquidity events, may be affected by events, or our future performance, which are subject to factors beyond our control, including prevailing economic, financial, industry and weather conditions, such as the level, timing and location of snowfall and general economic conditions in the snowbelt regions of North America. A failure to comply with these covenants could result in a default under our senior credit facilities, which could prevent us from paying dividends, borrowing additional amounts and using proceeds of our inventory and accounts receivable, and also permit the lenders to accelerate the payment of such debt. If any of our debt is accelerated or if a liquidity event (or event of default) occurs that results in collateral proceeds being applied to reduce such debt, we may not have sufficient funds available to repay such debt and our other obligations, in which case, our business could be halted and such lenders could proceed against any collateral securing that debt. Further, if the lenders accelerate the payment of the indebtedness under our senior credit facilities, our assets may not be sufficient to repay in full the indebtedness under our senior credit facilities and our other indebtedness, if any. We cannot assure you that these covenants will not adversely affect our ability to finance our future operations or capital needs to pursue available business opportunities or react to changes in our business and the industry in which we operate.
The closure of our Johnson City, Tennessee manufacturing facility may entail risks to our business.
As part of our lean manufacturing strategy to lower our fixed costs, we closed our Johnson City, Tennessee manufacturing facility in the third quarter ending September 30, 2010 and thereby reduced our manufacturing facilities from three to two. In connection with this closure, we relocated our Johnson City operations and equipment into our remaining two facilities. We cannot assure you that we will realize contemplated cost savings from the closure of this facility. In addition, there may be risks associated with this closure for which we are unprepared, such as labor and employment litigation, difficulties implementing a smooth transition and the possibility that this closure leaves us with insufficient manufacturing capacity. It is therefore possible that our business could be negatively affected by the closure of this facility.
Our principal stockholders hold a significant portion of our common stock and may have different interests than us or you in the future.
As of December 31, 2010, our principal stockholders had the right to vote or direct the vote of approximately 46% of our voting power. In light of their voting power, our principal stockholders will for the foreseeable future be able to influence the election and removal of our directors and influence our corporate and management policies, including virtually all matters requiring stockholder approval, such as potential mergers or acquisitions, asset sales and other significant corporate transactions. This concentration of ownership may delay or deter possible changes in control of our company. We cannot assure you that the interests of our principal stockholders will coincide with the interests of our other holders of common stock.
Provisions of Delaware law and our charter documents could delay or prevent an acquisition of us, even if the acquisition would be beneficial to you.
Provisions in our certificate of incorporation and bylaws may have the effect of delaying or preventing a change of control or changes in our management. These provisions include:
We are also subject to Section 203 of the Delaware General Corporation Law, which, subject to certain exceptions, prohibits us from engaging in any business combination with any interested stockholder, as defined in that section, for a period of three years following the date on which that stockholder became an interested stockholder. This provision, together with the provisions discussed above, could also make it more difficult for you and our other stockholders to elect directors and take other corporate actions, and could limit the price that investors might be willing to pay in the future for shares of our common stock.
If we are unable to assess favorably the effectivenessTable of our internal control over financial reporting, or if our independent registered public accounting firm is unable to provide an unqualified attestation report on our internal controls, our stock price could be adversely affected.Contents
Pursuant to Section 404 of the Sarbanes-Oxley Act of 2002 and the related rules adopted by the SEC and the Public Company Accounting Oversight Board, beginning with our Annual Report on Form 10-K for the year ending December 31, 2011, our management will be required to report on, and our independent registered public accounting firm to attest to, the effectiveness of our internal control over financial reporting. We may encounter problems or delays in completing the implementation of any changes necessary to make a favorable assessment of our internal control over financial reporting. In addition, in connection with the attestation process by our independent registered public accounting firm, we may encounter problems or delays in completing the implementation of any requested improvements and receiving a favorable attestation. If we cannot timely and favorably assess the effectiveness of our internal control over financial reporting, or if our independent registered public accounting firm is unable to provide an unqualified attestation report on our internal control over financial reporting, investor confidence and our stock price could decline.
Our dividend policy may limit our ability to pursue growth opportunities.
If we continue to pay dividends at the current level undercontemplated by our dividend policy, as in effect on the date of this filing, or if we increase the level of our dividend payments in the future, we may not retain a sufficient amount of cash to finance growth opportunities, meet any large unanticipated liquidity requirements or fund our operations in the event of a significant business downturn. In addition, because a significant portion of cash available will be distributed to holders of our common stock under our dividend policy, our ability to pursue any material expansion of our business, including through acquisitions, increased capital spending or other increases of our expenditures, will depend more than it otherwise would on our ability to obtain third party financing. We cannot assure you that such financing will be available to us at all, or at an acceptable cost. If we are unable to take timely
advantage of growth opportunities, our future financial condition and competitive position may be harmed, which in turn may adversely affect the market price of our common stock.
Security breaches and other disruptions could compromise our information and expose us to liability, which would cause our business and reputation to suffer.
In the ordinary course of our business, we collect and store sensitive data, including our proprietary business information and that of our customers, suppliers and business partners, as well as personally identifiable information of our customers and employees, in our data centers and on our networks. The secure processing, maintenance and transmission of this information is critical to our operations and business strategy. Despite our security measures, our information technology and infrastructure may be vulnerable to malicious attacks or breached due to employee error, malfeasance or other disruptions, including as a result of rollouts of new systems. Any such breach could compromise our networks and the information stored there could be accessed, publicly disclosed, lost or stolen. Any such access, disclosure or other loss of information could result in legal claims or proceedings and/or regulatory penalties, disrupt our operations, damage our reputation, and/or cause a loss of confidence in our products and services, which could adversely affect our business.
We may be unable to identify, complete or benefit from strategic transactions.
Our long-term growth strategy includes building value for our company through a variety of methods. These methods may include acquisition of, investment in, or joint ventures involving, complementary businesses. We cannot assure that we will be able to identify suitable parties for these transactions. If we are unable to identify suitable parties for strategic transactions we may not be able to capitalize on market opportunities with existing and new customers, which could inhibit our ability to gain market share. Even if we identify suitable parties to participate in these transactions, we cannot assure that we will be able to make them on commercially acceptable terms, if at all.
In May 2013, we acquired substantially all of the assets of TrynEx. We may not be able to achieve the projected financial performance with the acquired assets, and may incur unexpected costs or liabilities related to the acquisition of the TrynEx assets. In addition, if in the future we acquire another company or its assets, it may be difficult to assimilate the acquired businesses, products, services, technologies and personnel into our operations. These difficulties could disrupt our ongoing business, distract our management and workforce, increase our expenses and adversely affect our operating results and ability to compete and gain market share. Mergers and acquisitions are inherently risky and are subject to many factors outside our control. No assurance can be given that any future acquisitions will be successful and will not materially adversely affect our business, operating results, or financial condition. In addition, we may incur debt or be required to issue equity securities to pay for future acquisitions or investments. The issuance of any equity securities could be dilutive to our stockholders. We also may need to make further investments to support any acquired company and may have difficulty identifying and acquiring appropriate resources. If we divest or otherwise exit certain portions of our business in connection with a strategic transaction, we may be required to record additional
expenses, and our estimates with respect to the useful life and ultimate recoverability of our carrying basis of assets, including goodwill and purchased intangible assets, could change.
Item 1B. Unresolved Staff Comments
Not applicable.
We are headquartered in Milwaukee, WI and currently have manufacturing facilities in Milwaukee, WI, Rockland, ME and Rockland, ME. We closed our Johnson City, TN facility in August 2010, and are currently holding it for sale. In January 2009,Madison Heights, MI. Additionally, we openedoperate a sourcing office in China. We operate as a single segment.
In the ordinary course of business, we are engaged in various litigation primarily including product liability and intellectual property disputes. However, management does not believe that any current litigation is material to our operations or financial position. In addition, we are not currently party to any environmental-related claims or legal matters.
Item 4. (Removed and Reserved)Mine Safety Disclosures
Not applicable.
Executive Officers of the Registrant
Our executive officers as of December 31, 20102013 were as follows:
Name | Age | Position | |||
|---|---|---|---|---|---|
James Janik | 57 | President and Chief Executive Officer; Director | |||
Robert McCormick | 53 | Executive Vice President, Chief Financial Officer | |||
Mark Adamson | 55 | Senior Vice President, Sales and Marketing | |||
Keith Hagelin | 53 | Senior Vice President, Operations | |||
James Janik has been serving as our President and Chief Executive Officer since 2000 and as a director since 2004. Mr. Janik was General Manager of our Western Products division from 1994 to 2000 and Vice President of Marketing and Sales from 1998 to 2000. Prior to joining us, Mr. Janik was the Vice President of Marketing and Sales of Sunlite Plastics Inc., a custom extruder of thermoplastic materials, for two years. During the 11 prior years, Mr. Janik held a number of key marketing, sales and production management positions for John Deere Company.
Robert McCormick has been serving as our Executive Vice President, Chief Financial Officer and Treasurer since September 2004 and as our Secretary since May 2005. Mr. McCormick served as our Assistant Secretary from September 2004 to May 2005.2005 and as our Treasurer from September 2004 through December 2010. Prior to joining us, Mr. McCormick served as President and Chief Executive Officer of Xymox Technology Inc. from 2001 to 2004. Prior to that, Mr. McCormick served in various capacities in the Newell Rubbermaid Corporation, including President from 2000 to 2001 and Vice President Group Controller from 1997 to 2000. While Mr. McCormick served as President, he was responsible for Newell's Mirro / Wearever Cookware, and as Vice President Group Controller, he was responsible for worldwide strategic and financial responsibilities for 12 company divisions with sales of over two billion dollars.
Mark Adamson has been serving as our Senior Vice President, Sales and Marketing since 2013. Prior to becoming our Senior Vice President, Sales and Marketing he had served as our Vice President, Sales and Marketing since 2007. Prior to joining us, Mr. Adamson held numerous senior level management positions with industry leaders in the grounds care industry, including John Deere Company from 1980 to 2002 and Gehl Corporation from 2002 to 2007. From 2003 to 2005, he was the Manager, Regional Sales & Distribution of Gehl Company, directing the sales and marketing activities of certain sales field managers in the
northeastern United States responsible for Gehl product sales and rental., and from 2005 to 2007, he was the Director, Training and Customer Support, where he directed the aftermarket and training activities of five departments and thirty-two individuals responsible for Gehl and Mustang products worldwide. From 1980 to 2002, Mr. Adamson held several senior level management positions with John Deere Company.
Keith Hagelin has been serving as our Senior Vice President, Operations since September 2013. Prior to becoming our Senior Vice President, Operations, he had served as our Vice President, Operations since 2009, having previously spent twelve years in progressive roles with us, including Plant Manager and General Manager—Rockland and most recently Vice President of Manufacturing from 2007 to 2009. Prior to joining Douglas, Mr. Hagelin spent 13 years at Raytheon Corporation in various manufacturing, production and new product development roles.
Executive officers are elected by, and serve at the discretion of, the Board of Directors. There are no family relationships between any of our directors or executive officers.
Item 5. Market for Registrant's Common Equity, Related Stockholder Matters and Issuer Purchases of Equity Securities
The Company's common stock is listed, and principallyOur Common Stock has been traded on the NYSE. The Company'sNew York Stock Exchange since the second quarter of 2010 under the symbol for its common stock is "PLOW." The followingprices in the table setsset forth below indicate the range of high and low per share sales prices of our Common Stock per the Company's common stockNew York Stock Exchange Composite Price History for each quarter in 2013 and per share dividends for the periods indicated. As the company was not listed until it listed its common stock in the second quarter 2010 in connection with the IPO, no market price data is available for the first quarter of 2010 or any periods of 2009.2012.
| | 2010 | 2013 | 2012 | ||||||||||||||||||||||||||
|---|---|---|---|---|---|---|---|---|---|---|---|---|---|---|---|---|---|---|---|---|---|---|---|---|---|---|---|---|---|
| | Price Range | Price Range | Price Range | ||||||||||||||||||||||||||
| | High | Low | Dividends | High | Low | Dividends | High | Low | Dividends | ||||||||||||||||||||
Fourth Quarter | $ | 16.84 | $ | 11.97 | $ | 0.20 | $ | 17.45 | $ | 14.41 | $ | 0.21 | $ | 15.67 | $ | 12.87 | $ | 0.21 | |||||||||||
Third Quarter | 13.00 | 10.20 | 0.18 | 15.30 | 13.14 | 0.21 | 15.70 | 12.69 | 0.21 | ||||||||||||||||||||
Second Quarter | 12.54 | 10.93 | — | 14.55 | 12.72 | 0.21 | 14.27 | 12.52 | 0.21 | ||||||||||||||||||||
First Quarter | — | — | — | 14.86 | 12.65 | 0.21 | 14.93 | 12.37 | 0.21 | ||||||||||||||||||||
At March 8, 2011,11, 2014, there were 3320 record holders of our Common Stock.
In accordance with the Company's dividend policy, dividends are declared and paid quarterly at the discretion of the board of directors. Additionally, special dividends may be declared and paid at the discretion of the board of directors. TheIn the first, quarterlysecond and third quarters of 2012, the Company both declared and paid a dividend to common shareholders subsequent to IPO was made inof $0.205 per share. In the thirdfourth quarter of 2010 for $0.1825 per share paid on September 30, 2010. Additionally,2012, the Company increased its annual implied dividend from $0.82 to $0.83 and both declared and paid a $0.20dividend of $0.2075 per share quarterlyshare. In the first, second and third quarters of 2013, the Company both declared and paid a dividend on December 31, 2010.of $0.2075 per share. In the fourth quarter of 2013, the Company increased its annual implied dividend from $0.83 to $0.85 and both declared and paid a dividend of $0.2125 per share.
The Company's senior credit agreement includes a number offacilities include certain negative and operating covenants, that require the Company to meet several distribution conditions in order for the Company to be ableincluding restrictions on its ability to pay a dividend. Additionally, the Company'sdividends, and other customary covenants, representations and warranties and events of default. The senior credit agreement provides distribution limitations which could limit the amount the Company can distribute. Distribution conditions include the Company maintaining positive net assets, maintaining a "leverage ratio", as definedfacilities entered into and recorded by the credit agreement, less than 6.0:1.0 and maintain borrowing availability over $12.0 million. Distribution limitations apply if the Company's adjusted EBITDA, as defined by the credit agreement were to fall below $40.0 million.
Company's subsidiaries significantly restrict its subsidiaries from paying dividends and otherwise transferring assets to Douglas Dynamics, Inc. The terms of the Company's revolving credit facility specifically restrict the Company from paying dividends if a minimum availability under the revolving credit facility, the greater of $10.5 million and 15% of the aggregate revolving commitments at the time of determination, is not maintained. Additionally, both senior credit facilities restrict the Company from paying dividends above certain levels not to exceed $5.25 million in any fiscal quarter of 2011 calculated without regard to a one-time special dividend not to exceed $8.0 million, $5.5 million in any fiscal quarter of 2012, $5.75 million in any fiscal quarter of 2013, $6.0 million in any fiscal quarter of 2014, $6.25 million in any fiscal quarter of 2015 and $6.5 million in any fiscal quarter of 2016 and thereafter or at all if an event of default has occurred. These restrictions would affect the Company indirectly since the Company relies principally on distributions from its subsidiaries to have funds available for the payment of dividends.
Securities Authorized for Issuance under Equity Compensation Plans
The following table sets forth information with respect to compensation plans under which equity securities of the Company are authorized for issuance as of December 31, 2010.2013.
Equity Compensation Plan Information
Plan Category | Number of securities to be issued upon exercise of outstanding options, warrants and rights (a) | Weighted-average exercise price of outstanding options, warrants and rights (b) | Number of securities remaining available for future issuance under equity compensation plans (excluding securities reflected in column(a)) | |||||||
|---|---|---|---|---|---|---|---|---|---|---|
Equity Compensation plans approved by security holders(1): | ||||||||||
2010 Stock Incentive Plan(2): | 74,518 | — | 1,415,636 | |||||||
2004 Stock Incentive Plan | 37,240 | $ | 4.21 | — | ||||||
Equity compensation plans not approved by security holders | — | — | — | |||||||
| | | | | | | | | | | |
Total(3) | 111,758 | $ | 4.21 | 1,415,636 | ||||||
| | | | | | | | | | | |
| | | | | | | | | | | |
PLAN CATEGORY | Number of securities to be issued upon the exercise of outstanding options, warrants and rights | Weighted-average exercise price of outstanding options, warrants and rights | Number of securities remaining available for future issuance under equity compensation plans (excluding securities reflected in the first column) | ||||||||
|---|---|---|---|---|---|---|---|---|---|---|---|
Equity compensation plans approved by security holders:(1) | |||||||||||
2010 Stock Incentive Plan | — | — | 1,843,566 | ||||||||
2004 Stock Incentive Plan | 356,613 | $ | 4.21 | — | |||||||
Equity compensation plans not approved by security holders | — | — | — | ||||||||
Total | 356,613 | $ | 4.21 | 1,843,566 | |||||||
The following information in this Item 5 of this Annual Report on Form 10-K is not deemed to be "soliciting material" or to be "filed" with the SEC or subject to Regulation 14A or 14C under the Securities Exchange Act of 1934 or to the liabilities of Section 18 of the Securities Exchange Act of 1934, and will not be deemed to be incorporated by reference into any filing under the Securities Act of 1933 or the Securities Exchange Act of 1934, except to the extent we specifically incorporate it by reference into such a filing.
The graph set forth below compares the cumulative total stockholder return on our common stock between May 11,5, 2010 (the date of our initial public offering, or IPO) and December 31, 2010,2013, with the cumulative total return of The Dow Jones Industrial Average and Russell 2000 Index. This graph assumes the investment of $100 on May 11,5, 2010 in our common stock at our IPO offering price of
$11.25 $11.25 per share, the Dow Jones Industrial Average and Russell 2000 Index, and assumes the reinvestment of dividends.
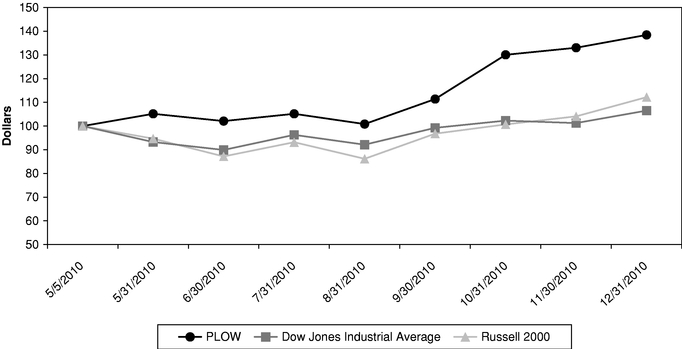
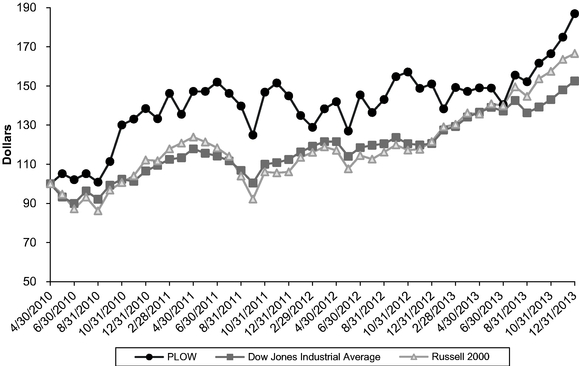
We did not sell any equity securities during 2010,201, in offerings that were not registered under the Securities Act of 1933.
We did not make any purchases of equity securities registered pursuant to Section 12 of the Securities Exchange Act of 1934 during the fourth quarter of 2010.
Item 6. Selected Consolidated Financial Data
The following table sets forth our selected historical consolidated financial data for the periods and at the dates indicated. The selected historical consolidated financial data as of December 31, 2008, 20092012 and 20102013 and for the three years in the period ended December 31, 20102013, 2012 and 2011 are derived from our audited consolidated financial statements included at Item 8.statements.
The selected historical consolidated financial data as of December 2009, 2010 and 2011 and for the years ended December 31, 20062009 and 2007 are2010 is derived from our historical financial statements not included in this Annual Report on Form 10-K.
The selected consolidated financial data presented below should be read in conjunction with our consolidated financial statements and related notes included elsewhere in this document.
| | As of December 31, | ||||||||||||||||
|---|---|---|---|---|---|---|---|---|---|---|---|---|---|---|---|---|---|
| | 2006 | 2007 | 2008 | 2009 | 2010 | ||||||||||||
| | (in thousands) | ||||||||||||||||
Selected Balance Sheet Data | |||||||||||||||||
Cash and cash equivalents | $ | 12,441 | $ | 35,519 | $ | 53,552 | $ | 69,073 | $ | 20,149 | |||||||
Total current assets | 70,367 | 91,491 | 115,414 | 133,534 | 88,972 | ||||||||||||
Total assets | 365,168 | 375,649 | 391,264 | 404,619 | 348,043 | ||||||||||||
Total current liabilities | 18,089 | 19,013 | 23,858 | 25,187 | 15,976 | ||||||||||||
Total debt | 227,608 | 234,363 | 233,513 | 232,663 | 121,154 | ||||||||||||
Total liabilities | 271,447 | 283,705 | 293,203 | 296,395 | 178,550 | ||||||||||||
Total redeemable stock and stockholders' equity | 93,721 | 91,944 | 98,061 | 108,224 | 169,493 | ||||||||||||
| | As of December 31, | |||||||||||||||
|---|---|---|---|---|---|---|---|---|---|---|---|---|---|---|---|---|
| | 2009 | 2010 | 2011 | 2012 | 2013 | |||||||||||
| | (in thousands) | |||||||||||||||
Selected Balance Sheet Data | ||||||||||||||||
Cash and cash equivalents | $ | 69,073 | $ | 20,149 | $ | 39,432 | $ | 24,136 | $ | 19,864 | ||||||
Total current assets | 133,534 | 88,972 | 103,462 | 89,582 | 98,372 | |||||||||||
Total assets | 404,619 | 348,043 | 359,017 | 338,371 | 364,339 | |||||||||||
Total current liabilities | 25,187 | 15,976 | 32,611 | 16,670 | 36,098 | |||||||||||
Total debt | 232,663 | 121,154 | 122,937 | 111,966 | 123,994 | |||||||||||
Total liabilities | 296,395 | 178,550 | 195,628 | 184,639 | 209,018 | |||||||||||
Total redeemable stock and shareholders' equity | 108,224 | 169,493 | 163,389 | 153,732 | 155,321 | |||||||||||
| | For the year ended December 31, | ||||||||||||||||
|---|---|---|---|---|---|---|---|---|---|---|---|---|---|---|---|---|---|
| | 2006 | 2007 | 2008 | 2009 | 2010 | ||||||||||||
| | (in thousands, except per share data) | ||||||||||||||||
Consolidated Statement of Operations Data | |||||||||||||||||
Total sales | $ | 145,779 | $ | 140,065 | $ | 180,108 | $ | 174,342 | $ | 176,795 | |||||||
Gross profit | 45,232 | 42,816 | 62,197 | 57,078 | 60,301 | ||||||||||||
Income from operations | 20,459 | 20,636 | 35,636 | 29,439 | 21,408 | ||||||||||||
Income tax expense (benefit) | 443 | (749 | ) | 6,793 | 3,986 | 872 | |||||||||||
Net income (loss) | 197 | (1,057 | ) | 11,471 | 9,843 | 1,662 | |||||||||||
Net income (loss) per basic share, as adjusted(1) | $ | 0.02 | $ | (0.07 | ) | $ | 0.79 | $ | 0.68 | $ | 0.09 | ||||||
Net income (loss) per diluted share, as adjusted(1) | $ | 0.02 | $ | (0.07 | ) | $ | 0.77 | $ | 0.67 | $ | 0.09 | ||||||
| | For the year ended December 31, | |||||||||||||||
|---|---|---|---|---|---|---|---|---|---|---|---|---|---|---|---|---|
| | 2009 | 2010 | 2011 | 2012 | 2013 | |||||||||||
| | (in thousands, except per share data) | |||||||||||||||
Consolidated Statement of Operations Data | ||||||||||||||||
Total sales | $ | 174,342 | $ | 176,795 | $ | 208,798 | $ | 140,033 | $ | 194,320 | ||||||
Gross profit | 57,078 | 60,301 | 71,817 | 43,963 | 65,650 | |||||||||||
Income from operations | 29,439 | 21,408 | 40,181 | 18,869 | 27,506 | |||||||||||
Income tax expense | 3,986 | 872 | 11,332 | 4,144 | 7,378 | |||||||||||
Net income | 9,843 | 1,662 | 19,040 | 6,012 | 11,639 | |||||||||||
Net income per basic share, as adjusted(1) | $ | 0.68 | $ | 0.09 | $ | 0.87 | $ | 0.27 | $ | 0.52 | ||||||
Net income per diluted share, as adjusted(1) | $ | 0.67 | $ | 0.09 | $ | 0.85 | $ | 0.26 | $ | 0.51 | ||||||
Cash dividends paid per commmon share | $ | — | $ | 0.38 | $ | 1.18 | $ | 0.82 | $ | 0.84 | ||||||
| | For the year ended December 31, | |||||||||||||||
|---|---|---|---|---|---|---|---|---|---|---|---|---|---|---|---|---|
| | 2009 | 2010 | 2011 | 2012 | 2013 | |||||||||||
| | (in thousands) | |||||||||||||||
Other Data | ||||||||||||||||
Adjusted EBITDA | $ | 45,180 | $ | 47,345 | $ | 52,461 | $ | 29,732 | $ | 44,569 | ||||||
Capital expenditures(2) | $ | 8,200 | $ | 3,009 | $ | 2,373 | $ | 1,446 | $ | 2,775 | ||||||
| | For the year ended December 31, | ||||||||||||||||
|---|---|---|---|---|---|---|---|---|---|---|---|---|---|---|---|---|---|
| | 2006 | 2007 | 2008 | 2009 | 2010 | ||||||||||||
| | (in thousands) | ||||||||||||||||
Other Data | |||||||||||||||||
Adjusted EBITDA | $ | 32,564 | $ | 32,745 | $ | 47,742 | $ | 45,180 | $ | 47,345 | |||||||
Capital expenditures(2) | $ | 3,449 | $ | 1,049 | $ | 3,160 | $ | 8,200 | $ | 3,009 | |||||||
Item 7. Management's Discussion and Analysis of Financial Condition and Results of Operations
The following discussion and analysis of our financial condition and results of operations for the years ended December 31, 2008, 20092011, 2012 and 20102013 should be read together with our audited consolidated financial statements and related notes included elsewhere in this Annual Report on Form 10-K. Some of the information contained in this discussion and analysis or set forth elsewhere in this Annual Report on Form 10-K, including information with respect to our plans and strategies for our business, includes forward-looking statements that involve risks and uncertainties. You should review the "Risk Factors" section of this Annual Report on Form 10-K for a discussion of important factors that could cause actual results to differ materially from the results described in, or implied by, the forward-looking statements contained in this Annual Report on Form 10-K.
Results of Operations
Overview
In assessing our results of operations in a given period, one of the primary factors we consider is the level of snowfall experienced within the prior snow season. We typically compare the snowfall level in a given period both to the snowfall level in the prior season and to those snowfall levels we consider to be average. References to "average snowfall" levels below refer to the aggregate average inches of snowfall recorded in 66 cities in 26 snowbeltsnow-belt states in the United States during the annual snow season, from October 1 through March 31, from 1980 to 2010.2013. During this period, snowfall averaged 3,0023,008 inches, with the low in such period being 2,0941,794 inches and the high being 4,502 inches.
During the six monthsix-month snow season ended March 31, 2013 snowfall was 3,274 inches which was 9.0% higher than average. Meanwhile, during the six-month snow seasons endingended March 31, 2008, 2009 and 2010,2012, we experienced historically below average snowfall (approximately 40% below average). During the six-month snow season ended March 31, 2011, we experienced above average snowfall (approximately 22%, 22% and 20%39% above average). In addition to the severity of the low snowfall of snow season ended March 31, 2012, management believes that the timing of the snowfall in the snow season ended March 31, 2013, despite being slightly above average during six months endingin amount, negatively impacted our pre-season business in 2013. As the timing of the snowfall was predominantly in the second half of the snow season ended March 31, 2008, 20092013, management believes end users were more likely to repair existing equipment rather than replacing equipment. Consequently we believe our distributors entered the 2013 pre-season period with higher inventory levels than desired. As a result, we believe distributors ordered less equipment in the pre-season period in 2013. While we believe the historically low snowfall levels for the six-month snow season ended March 31, 2012, and 2010slow start to the March 31, 2013 snow seasons, respectively). Despite above average snowfalls during these periods,season and continued macro-economic uncertainty negatively impacted our business in 2013, we believe that other factors had a positive impact. These additional factors included the economic downturn resultedtiming, amount, and location of snowfall in lowerthe fourth quarter of 2013, positively trending light truck sales in 2013 and a large number of snowplows and sand and salt spreaders, but increased sales of our parts and accessories as a percentage of total net sales during the years ended December 31, 2008, 2009 and 2010 as compared to prior periods. We experienced lower equipment and higher parts and accessories sales as weakened economic conditions tend to cause our end-users to delay purchase of replacement snow and ice control equipment and instead repair their existing equipment.new products launched in 2013.
Sales of parts and accessories for 20102013 and 20092012 were $25.0$29.9 million and $26.9$16.7 million, respectively, or approximately 34.4%31% higher than and 44.5% higher than27% below average annual parts and accessories sales over the preceding ten years, (from 2001respectively. Sales of equipment unit sales for 2013 and 2012 were $164.5 million and $123.3 million, respectively. In 2013, equipment unit sales increased 32.2% as we sold 45,560 equipment units in 2013 as compared to 2007, sales34,457 equipment units in 2012. We believe that the increase of both parts and accessories ranged from approximately $9 millionsales and equipment unit sales in 2013 as compared to $19 million perthe prior calendar year with an average of approximately $15 million). Management believes the increased sales of parts and accessories are largelyis a direct result of the deferralhistorically low snowfall of 2012. Meanwhile, we believe that pent up demand due to deferred new equipment purchases due tostill exists in the severe economic downturn from 2008 to 2010, as many end-users chose to extend the lifemarketplace and could be released in or following a year of their existing equipment beyond the typical replacement cycle. As sales of snow and ice control units decreasedaverage or better snowfall that is accompanied by 6.0% and 7.2% in 2010 and 2009, respectively, as compared to 2008, management believes that absent the recent economic downturn, equipment sales in 2010 and 2009 would have been considerably higher due to the high levels of snowfall during the year. Equipment unit sales in 2010 remained 12% below the immediately preceding ten-year average, despite the fact that snowfall levels were approximately 13% above the immediately preceding ten-year average (excluding units sold by Blizzard Corporation prior to its acquisition by us in November 2005). Equipment unit sales in 2009 remained 14% below the immediately preceding ten-year average, despite the fact that snowfall levels in 2008 were approximately 19% above the immediately preceding ten-year average (excluding units sold by Blizzard Corporation prior to its acquisition by us in November 2005). Management believesstronger macro-economic conditions. We believe this deferral of new equipment purchases could result in an elevated multi-year replacement cycle as the economy recovers.
The following table shows our sales of snow and ice control equipment and related parts and accessories as a percentage of net sales for the periods indicated. During the years ended December 31, 2008, 20092011, 2012 and 2010,2013, we sold 47,911, 44,44450,801, 34,457 and 45,05445,560 units of snow and ice control equipment, respectively.
| | Year Ended December 31, | Year Ended December 31, | ||||||||||||||||||
|---|---|---|---|---|---|---|---|---|---|---|---|---|---|---|---|---|---|---|---|---|
| | 2008 | 2009 | 2010 | 2011 | 2012 | 2013 | ||||||||||||||
Equipment | 84 | % | 85 | % | 86 | % | 85 | % | 88 | % | 85 | % | ||||||||
Parts and accessories | 16 | % | 15 | % | 14 | % | 15 | % | 12 | % | 15 | % | ||||||||
The following table sets forth, for the periods presented, the consolidated statements of operationsincome of the Company and its subsidiaries. All intercompany balances and transactions have been eliminated in consolidation. In the table below and throughout this "Management's Discussion and Analysis of Financial Condition and Results of Operations," consolidated statements of operationsincome data for the years ended December 31, 2008, 20092011, 2012 and 20102013 have been derived from our audited consolidated financial statements. The information contained in the table below should be read in conjunction with our consolidated financial statements and the related notes included elsewhere in this Annual Report on Form 10-K.
| | For the year ended December 31, | For the year ended December 31, | ||||||||||||||||||
|---|---|---|---|---|---|---|---|---|---|---|---|---|---|---|---|---|---|---|---|---|
| | 2008 | 2009 | 2010 | 2011 | 2012 | 2013 | ||||||||||||||
| | (in thousands) | (in thousands) | ||||||||||||||||||
Net sales | $ | 180,108 | $ | 174,342 | $ | 176,795 | $ | 208,798 | $ | 140,033 | $ | 194,320 | ||||||||
Cost of sales | 117,911 | 117,264 | 116,494 | 136,981 | 96,070 | 128,670 | ||||||||||||||
| | | | | | | | | |||||||||||||
Gross profit | 62,197 | 57,078 | 60,301 | 71,817 | 43,963 | 65,650 | ||||||||||||||
Selling, general, and administrative expense | 19,032 | 20,085 | 26,509 | 26,435 | 19,895 | 31,872 | ||||||||||||||
Intangibles amortization | 6,160 | 6,161 | 6,001 | 5,201 | 5,199 | 5,625 | ||||||||||||||
Management fees-related party | 1,369 | 1,393 | 6,383 | |||||||||||||||||
Impairment of assets held for sale | — | — | 647 | |||||||||||||||||
| | | | | | | | | |||||||||||||
Income from operations | 35,636 | 29,439 | 21,408 | 40,181 | 18,869 | 27,506 | ||||||||||||||
Interest expense, net | (17,299 | ) | (15,520 | ) | (10,943 | ) | (8,918 | ) | (8,393 | ) | (8,328 | ) | ||||||||
Loss on extinguishment of debt | — | — | (7,967 | ) | (673 | ) | — | — | ||||||||||||
Other income (expense), net | (73 | ) | (90 | ) | 36 | |||||||||||||||
Other expense, net | (218 | ) | (320 | ) | (161 | ) | ||||||||||||||
| | | | | | | | | |||||||||||||
Income before taxes | 18,264 | 13,829 | 2,534 | 30,372 | 10,156 | 19,017 | ||||||||||||||
Income tax expense | 6,793 | 3,986 | 872 | 11,332 | 4,144 | 7,378 | ||||||||||||||
| | | | | | | | | |||||||||||||
Net income | $ | 11,471 | $ | 9,843 | $ | 1,662 | $ | 19,040 | $ | 6,012 | $ | 11,639 | ||||||||
| | | | | | | | | |||||||||||||
| | | | | | | | | |||||||||||||
The following table sets forth, for the periods indicated, the percentage of certain items in our consolidated statement of operationsincome data, relative to net sales:
| | For the year ended December 31, | For the year ended December 31, | ||||||||||||||||||
|---|---|---|---|---|---|---|---|---|---|---|---|---|---|---|---|---|---|---|---|---|
| | 2008 | 2009 | 2010 | 2011 | 2012 | 2013 | ||||||||||||||
| | (in thousands) | (in thousands) | ||||||||||||||||||
Net sales | 100.0 | % | 100.0 | % | 100.0 | % | 100.0 | % | 100.0 | % | 100.0 | % | ||||||||
Cost of sales | 65.5 | % | 67.3 | % | 65.9 | % | 65.6 | % | 68.6 | % | 66.2 | % | ||||||||
| | | | | | | | | |||||||||||||
Gross profit | 34.5 | % | 32.7 | % | 34.1 | % | 34.4 | % | 31.4 | % | 33.8 | % | ||||||||
Selling, general, and administrative expense | 10.6 | % | 11.5 | % | 15.0 | % | 12.7 | % | 14.2 | % | 16.4 | % | ||||||||
Intangibles amortization | 3.4 | % | 3.5 | % | 3.4 | % | 2.5 | % | 3.7 | % | 2.9 | % | ||||||||
Management fees-related party | 0.8 | % | 0.8 | % | 3.6 | % | ||||||||||||||
Impairment of assets held for sale | 0.0 | % | 0.0 | % | 0.3 | % | ||||||||||||||
| | | | | | | | | |||||||||||||
Income from operations | 19.8 | % | 16.9 | % | 12.1 | % | 19.2 | % | 13.5 | % | 14.2 | % | ||||||||
Interest expense, net | (9.7 | )% | (8.9 | )% | (6.2 | )% | (4.3 | )% | (6.0 | )% | (4.3 | )% | ||||||||
Loss on extinguishment of debt | 0.0 | % | 0.0 | % | (4.5 | )% | (0.3 | )% | 0.0 | % | 0.0 | % | ||||||||
Other income (expense), net | 0.0 | % | (0.1 | )% | 0.0 | % | ||||||||||||||
Other expense, net | (0.1 | )% | (0.2 | )% | (0.1 | )% | ||||||||||||||
| | | | | | | | | |||||||||||||
Income before taxes | 10.1 | % | 7.9 | % | 1.4 | % | 14.5 | % | 7.3 | % | 9.8 | % | ||||||||
Income tax expense | 3.7 | % | 2.3 | % | 0.5 | % | 5.4 | % | 3.0 | % | 3.8 | % | ||||||||
| | | | | | | | | |||||||||||||
Net income | 6.4 | % | 5.6 | % | 0.9 | % | 9.1 | % | 4.3 | % | 6.0 | % | ||||||||
| | | | | | | | | |||||||||||||
| | | | | | | | | |||||||||||||
Year Ended December 31, 20102013 Compared to Year Ended December 31, 20092012
Net Sales. Net sales were $176.8$194.3 million for the year ended December 31, 20102013 compared to $174.3$140.0 million in 2009,2012, an increase of $2.5$54.3 million, or 1.4%38.8%. This increase was primarily driven by a $4.3increases of $41.2 million increase in sales of snow and ice control equipment slightly offset by a $1.9and $13.1 million decrease in parts and accessories sales. The increase in sales of snow and ice control equipment for the year ended December 31, 20102013 was attributable to (1) an increase in sales volume of snow and ice control equipment of $2.1$39.7 million, or 1.4%32.2%, as compared to the prior year, and (2)by price increases that we implemented beginning in the second quarterthird and fourth quarters of 20102012 and an additional price increase that extended throughout 2010.was effective in the third and fourth quarters of 2013. The 1.4% increase in sales volume was largely a result of strengthening economic conditions towards the endtiming of 2010 whichlate snowfall for the snow season ending March 31, 2013 causing the snow season to be slightly above average in most of the markets we believe led to lower parts and accessories sales compared to 2009. However, compared to a ten year historical average, parts and accessories sales are still higher than average, while equipment sales are lower than average, as many end-users continue to repair their existing snow and ice control equipment instead of purchasing new equipment.serve. Net sales of parts and accessories declinedincreased in the year ended December 31, 20102013 from the year ended December 31, 20092012 by 7.0%78.5%, from $26.9$16.7 million to $25.0$29.9 million. Notwithstanding this decline, netNet sales of parts and accessories remained comparatively high in 2010, exceeding2013, above the preceding ten-year average by approximately 34.4%31.1%. As discussed above, the comparatively stronghigher sales of parts and accessories waswere due in large part to the continued downturn in general economic conditions and local economic conditionstiming of snowfall in the snowbelt regions,markets in which we believe led manyour products are sold. Additionally, equipment sales were lower (5% below the immediately preceding ten-year average), mainly due to the timing of our end-userssnowfall. Sales related to repair their existing snow and ice control equipment insteadTrynEx products of purchasing new equipment.$12.9 million for the year ended December 31, 2013 also contributed to the increase in net sales for the period.
Cost of Sales. Cost of sales was $116.5$128.7 million for the year ended December 31, 20102013 compared to $117.3$96.1 million in 2009, a decrease2012, an increase of $0.8$32.6 million, or 0.7%33.9%. This decreaseincrease was driven primarily by reduced costs due to material cost savings as steel costs were lower in 2010 as compared to 2009. Steel purchases were approximately 15% and 18% of our sales revenue for the years ending December 31, 2010 and 2009, respectively. Lower steel costs were slightly offset by increases in snow and ice control equipment unit volume as discussed above. Costsincreased volume. Cost of sales as a percentage of net sales decreased from 67.3%68.6% for the year ended December 31, 20092012 to 65.9%66.2% for the year ended December 31, 20102013 as a result of higher volumes to absorb fixed spending in the material cost savingsyear ending December 31, 2013 as discussed above.compared to the year ending December 31, 2012. Additionally, in 2013, inflationary commodity experience was slightly positive. As a percentage of cost of sales, fixed and
percentage of cost of sales, fixed and variable costs were approximately 19%18% and 81%82%, respectively, for both of the yearyears ended December 31, 2010 versus approximately 17%2013 and 83%, respectively for the year ended December 31, 2009.2012.
Gross Profit. Gross profit was $60.3$65.7 million for the year ended December 31, 20102013 compared to $57.1$44.0 million in 2009,2012, an increase of $3.2$21.7 million, or 5.6%49.3%, due to the increase in net sales volume described above under "—Net Sales" And the reduction in material costs as described underand "—Cost of Sales." As a percentage of net sales, gross profit increased from 32.7%31.4% for the year ended December 31, 20092012 to 34.1%33.8% for the corresponding period in 2010,2013, as a result of the factors discussed above under "—Net Sales" and "—Cost of Sales."
Selling, General and Administrative Expense. Selling, general and administrative expenses, including intangiblesintangible asset amortization, and management fees, were $38.9$37.5 million for the year ended December 31, 20102013 compared to $27.6$25.1 million for the year ended December 31, 2009,2012, an increase of $11.3$12.4 million, or 40.9%49.4%, driven by non-recurring expenses incurred at the timehigher incentive based compensation of the IPO. The non-recurring charges associated with the IPO totaled $8.5$3.2 million and were compriseddue to better operating results. Additionally in 2013 we recorded $4.0 million of the buyout of the management services agreement at $5.8 million,earnout compensation expense associated with net exercises of stock options totaling $1.7 million and the expense and payment of cash bonuses under our liquidity bonus plan of $1.0 million. Additionally, there was non-recurring compensation expense associated with net exercises of stock options subsequentrelated to the IPO totaling $1.2 million. We also spent $1.3TrynEx acquisition and $2.2 million more in 2010 defending our patents comparedselling, general and administrative expenses related to 2009. Finally,TrynEx after the closure costs associated with the Johnson City facility increased $0.4 million compareddate of acquisition. The remaining increase in 2013 is a result of management returning to the priornormal discretionary spending which was significantly cut back in 2012 in order to preserve profitability in a low sales volume year. As a percentage of net sales, selling, general and administrative expenses, including intangibles amortization, and management fees, increased from 15.8%17.9% for the year ended December 31, 20092012 to 22.0%19.3% for the corresponding period in 20102013 due to the non-recurring chargesitems discussed above.
Impairment of Assets Held for Sale. We recorded assets held for sale on our balance sheet in conjunction with the closure of the Johnson City, Tennessee location in 2010. The land and building have been held for sale since the closure. In an effort to stimulate sales activity, we lowered the listed sale price which caused us to reassess the fair value of the assets held for sale. Consequently, we recorded an impairment charge of $0.6 million in the year ended December 31, 2013. On February 26, 2014, the Company entered into an agreement for the sale of the land and building, which the Company anticipates closing within seventy-five days of the sale agreement, subject to closing conditions.
Interest Expense. Interest expense was $10.9$8.3 million for the year ended December 31, 20102013 compared to $15.5$8.4 million in the corresponding period in 2009, a decrease of $4.6 million. This decrease was due to less interest expense as a result of the redemption of our 73/4% Senior Notes due 2012 ("Senior Notes") with proceeds from the IPO, additional borrowings under our senior credit facilities and cash on hand
Loss on Extinguishment of Debt. Loss on extinguishment of debt totaling $8.0 million for the year ended December 31, 2010 was entirely driven by costs associated with the amendment of our senior credit facilities and the redemption of the Senior Notes, including both the call premium on the redemption of our Senior Notes, and the write-off of unamortized deferred financing costs relating to the redemption of our Senior Notes and the amendment of our senior credit facilities.2012.
Income Taxes. Deferred income taxes reflect the net tax effects of temporary differences between the carrying amounts of assets and liabilities for financial reporting purposes and the amounts used for income tax purposes. The largest item affecting deferred taxes is the difference between book and tax amortization of goodwill and other intangibles amortization. Our effective combined federal and state tax rate for 20102013 was 34.4%38.8% compared to 28.8%40.8% for 2009.2012. The effective tax rate for the year ended December 31, 20102013 is higherlower than 2009 due to an increase in the valuation allowance for state net operating losses ("NOLs") related to the closure of the Johnson City, Tennessee facility. Additionally, the 2009 effective rate was lower2012 due to the release of a valuation allowance for Wisconsin NOLs2012 and 2013 Federal research and development credit recognition in the first quarter of 20092013 due to a tax law changeretroactive legislation passed in the state of Wisconsin resulting in the ability to utilize the NOLs in future periods.January 2013.
Net Income. Net income for the year ended December 31, 20102013 was $1.7$11.6 million compared to net income of $9.8$6.0 million for the corresponding period in 2009, a decrease2012, an increase of $8.1 million, or 82.7%.$5.6 million. This decreaseincrease was driven by the factors described above, and primarily by the non-recurring charges associated with the IPO.above.
Year Ended December 31, 20092012 Compared to Year Ended December 31, 20082011
Net Sales. Net sales were $174.3$140.0 million for the year ended December 31, 20092012 compared to $180.1$208.8 million in 2008,2011, a decrease of $5.8$68.8 million, or 3.2%33.0%. This declinedecrease was primarily driven by a
$4$54.5 million decrease in sales of snow and ice control equipment.equipment and $14.3 million in parts and accessories sales. The declinedecrease in sales of snow and ice control equipment for the year ended December 31, 20092012 was attributable to a decrease in sales volume of $24.4snow and ice control equipment of $57.2 million, or 13.5%32.2%, as compared to the prior year, slightly offset by (1) price increases that we implemented beginning in the
fourth quarter of 20082011 and that extended throughout 2009 to cover steel cost inflation, which resulted inthe remainder of 2011 and 2012 and an $11.8 millionadditional price increase to net sales as compared to the prior year and (2) the successful introduction of a new half-ton plow in June 2009, which together with other new product introductionsthat was effective in the last five years resulted in an $8.6 million increase to net sales as compared to the prior year.third and fourth quarters of 2012. The 13.5% decrease in sales volume was largely a result of weak economic conditions that persisted throughout 2009 and which we believe led many end-users to repair their existingthe below average snow and ice control equipment instead of purchasing new equipment. Further, our net sales for the year ended Decemberseason ending March 31, 2008 were higher than in 2009 as a heavy snowfall in December 2007 caused our order flow to be unusually high toward the end of December 2007, resulting in a backlog at the start of 2008 and the shipment of an above-average number of units in the first quarter of 2008.2012. Net sales of parts and accessories also declineddecreased in the year ended December 31, 20092012 from the year ended December 31, 20082011 by 6.3%46.0%, from $28.7$31.0 million to $26.9$16.7 million. Notwithstanding this decline, netNet sales of parts and accessories remained comparatively highlow in 2009, exceeding2012, below the preceding ten-year average by approximately 58.3%21.2%. As discussed above, the comparatively stronglower sales of parts and accessories was due in large part to below average snowfall resulting in decreased equipment usage. Additionally, equipment sales were lower (30% below the downturn in general economic conditions and local economic conditions in the snowbelt regions, which we believe led manyimmediately preceding ten-year average), mainly attributable to lack of our end-users to repair their existing snow and ice control equipment instead of purchasing new equipment.snowfall.
Cost of Sales. Cost of sales were $117.3was $96.1 million for the year ended December 31, 20092012 compared to $117.9$137.0 million in 2008,2011, a decrease of $0.6$40.9 million, or 0.5%29.9%. This decrease was driven primarily by reduced costs caused by the decrease in unit sales of snow and ice control equipment, as discussed above. Costsdecreased volume. Cost of sales as a percentage of net sales however, increased from 65.5%65.6% for the year ended December 31, 20082011 to 67.3%68.6% for the year ended December 31, 20092012 as a result of the declinelower volumes to absorb fixed spending. In 2012, inflationary commodity experience was cost neutral as compared to negative inflationary commodity experience throughout 2011. The favorability of inflation experienced in net sales for the year ended December 31, 2009, the increased2012 was more than offset by negative fixed cost absorption resulting from decreases in volume of steelequipment units and the implementation of price increases to cover the increased cost of steel (because these price increases increased both our net salesparts and our cost of sales).accessories. As a percentage of cost of sales, fixed and variable costs were approximately 17%18% and 83%82%, respectively, for the year ended December 31, 20092012 versus approximately 16%15% and 84%85%, respectively for the year ended December 31, 2008.2011.
Gross Profit. Gross profit was $57.1$44.0 million for the year ended December 31, 20092012 compared to $62.2$71.8 million in 2008,2011, a decrease of $5.1$27.8 million, or 8.2%38.7%, due primarily to the declinedecrease in net sales volume described above under "—Net Sales" and "—Cost of Sales." As a percentage of net sales, gross profit decreased from 34.5%34.4% for the year ended December 31, 20082011 to 32.7%31.4% for the corresponding period in 2009,2012, as a result of the factors discussed above under "—Net Sales" and "—Cost of Sales."
Selling, General and Administrative Expense. Selling, general and administrative expenses, including intangible asset amortization and management fees, were $27.6$25.1 million for the year ended December 31, 20092012 compared to $26.6$31.6 million for the year ended December 31, 2008, an increase2011, a decrease of $1.1$6.5 million, or 4%20.6%, driven by the restructuring chargeslower incentive based compensation of $1.1$3.4 million relateddue to the Johnson City closure.lower operating results. We spent $1.3 million in 2011 on offering costs to allow our former principal stockholders to dispose of their remaining holdings in our common stock while we did not incur any offering costs in 2012. The remaining decrease in 2012 is a result of management pulling back on discretionary spending in order to preserve profitability in a low sales volume year. As a percentage of net sales, selling, general and administrative expenses, including intangibles amortization and management fees, increased from 14.7%15.2% for the year ended December 31, 20082011 to 15.9%17.9% for the corresponding period in 20092012 due to the decline in net salesitems discussed above.
Interest Expense. Interest expense was $15.5$8.4 million for the year ended December 31, 20092012 compared to $17.3$8.9 million in the corresponding period in 2008, a2011. The decrease of $1.8 million. This decreasein interest expense for the year ended December 31, 2012 as compared to the prior year was due to reduced interest expense of $2.3a voluntary $10 million due to lower interest ratespayment made on ourthe term loan partially offsetin January 2012.
Loss on Extinguishment of Debt. Loss on extinguishment of debt was zero for the year ended December 31, 2012 compared to a total of $0.7 million for the year ended December 31, 2011. The loss on extinguishment of debt in 2011 was entirely driven by $0.5our entry into a new term loan facility resulting in a significant modification of our debt which resulted in the write off of unamortized capitalized deferred financing costs of $0.3 million and write off of reduced interest income due to lower interest rates on short term cash investments.unamortized debt discount of $0.3 million.
Income Taxes. Deferred income taxes reflect the net tax effects of temporary differences between the carrying amounts of assets and liabilities for financial reporting purposes and the amounts used for income tax purposes. The largest item affecting deferred taxes is the difference between book and tax amortization of goodwill and other intangibles amortization. Our effective combined federal and state tax rate for 20092012 was 28.8%40.8% compared to 37.2%37.3% for 2008.2011. The effective tax rate for the year ended December 31, 2009 was lower2012 is higher than 2008 due
to the release of2011 as we were in a valuation allowance for Wisconsin NOLstaxable loss position in the first quarter of 2009 due to a tax law change in the state of Wisconsin resulting in the ability2012 and thus unable to utilize the NOLsdomestic production activities deduction while we were in future periods.a taxable income position in 2011 and able to utilize the domestic production activities deduction.
Net Income. Net income for the year ended December 31, 20092012 was $9.8$6.0 million compared to net income of $11.5$19.0 million for the corresponding period in 2008,2011, a decrease of $1.6 million, or 14.2%.$13.0 million. This decrease was driven by the factors described above, and primarily by the lower level of unit sales of snow and ice control equipment for the year ended December 31, 2009 compared to the corresponding period in 2008. As a percentage of net sales, net income was 5.6% for the year ended December 31, 2009 compared to 6.4% for the year ended December 31, 2008.above.
Non-GAAP Financial Measures
This Annual Report on Form 10-K contains financial information calculated other than in accordance with U.S. generally accepted accounting principles ("GAAP").
These non-GAAP measures include:
These non-GAAP disclosures should not be construed as an alternative to the reported results determined in accordance with GAAP.
Free cash flow (as defined below) for the year ended December 31, 2013 was $29.5 million compared to $14.2 million in 2012, an increase in free cash flow of $15.3 million, or 107.7%. The increase in free cash flow is primarily a result of $16.6 million more cash provided by operating activities, as discussed below under Liquidity and Capital Resources. In addition to the changes in cash provided by operating activities, capital expenditures increased by $1.3 million. In 2013, there were higher capital expenditures due to reduced spending in 2012 to preserve cash flow following a low snowfall season ending March 2012.
Free cash flow is a non-GAAP financial measure, which we define as net cash provided by operating activities less capital expenditures. Free cash flow should be evaluated in addition to, and not considered a substitute for, other financial measures such as net income and cash flow provided by operations. We believe that free cash flow represents our ability to generate additional cash flow from our business operations.
The following table reconciles net cash provided by operating activities, a GAAP measure, to free cash flow, a non-GAAP measure.
| | For the year ended December 31, | |||||||||
|---|---|---|---|---|---|---|---|---|---|---|
| | 2011 | 2012 | 2013 | |||||||
| | (in thousands) | |||||||||
Net cash provided by operating activities | $ | 47,728 | $ | 15,619 | $ | 32,248 | ||||
Acquisition of property and equipment | (2,373 | ) | (1,446 | ) | (2,775 | ) | ||||
| | | | | | | | | | | |
Free cash flow | $ | 45,355 | $ | 14,173 | $ | 29,473 | ||||
| | | | | | | | | | | |
| | | | | | | | | | | |
Adjusted net income represents net income as determined under GAAP, excluding non-recurringloss on extinguishment of debt incurred in 2011, costs incurred to pursue potential acquisitions in 2011, certain expenses incurred at the time of our IPO, namely the buyoutsecondary offerings in 2011 and a loss recognized on impairment
Table of our management services agreement, the loss on extinguishment Contents
of debt, stock based compensation expense associated with the net exercise of stock options and the payment of cash bonuses under our liquidity bonus plan.assets held for sale in 2013. We believe that the presentation of Adjustedadjusted net income for the yearyears ended December 31, 2010 provides useful information2011, December 31, 2012 and December 31, 2013 allows investors to investors by facilitatingmake meaningful comparisons to our historical performance due to the non-recurring expenses incurred at the time of our IPO in May 2010.operating performance between periods and to view our business from the same perspective as our management. Because the excluded items are not predictable or consistent, management does not consider them when evaluating our performance or when making decisions regarding allocation of resources.
The following table presents a reconciliation of net income, the most comparable GAAP financial measure, to adjusted net income for the yearyears ending December 31, 2010. There were no such adjustments during the year ended2011, December 31, 2009.2012 and December 31, 2013.
| | Year Ended | ||||
|---|---|---|---|---|---|
| (in millions) | December 31, 2010 | ||||
Net Income—(GAAP) | $ | 1.7 | |||
Addback non-recurring expenses, net of tax at 38.0%, incurred at the time of the IPO: | |||||
—Buyout of the Management Services Agreement | 3.6 | ||||
—Loss on extinguishment of debt | 4.9 | ||||
—Liquidity bonus payment | 0.6 | ||||
—Non-recurring stock based compensation expense | 1.9 | ||||
Adjusted Net Income—(non-GAAP) | $ | 12.7 | |||
| | Years Ended | |||||||||
|---|---|---|---|---|---|---|---|---|---|---|
| (in millions) | December 31, 2011 | December 31, 2012 | December 31, 2013 | |||||||
Net income—(GAAP) | $ | 19.0 | $ | 6.0 | $ | 11.6 | ||||
Addback non-recurring expenses, net of tax at 37.0% and 38.8% for 2011 and 2013, respectively: | ||||||||||
— Loss on extinguishment of debt | 0.4 | — | — | |||||||
— Loss recognized on impairment of assets held for sale | — | — | 0.4 | |||||||
— Acquisition costs | 0.6 | — | — | |||||||
— Offering costs | 0.8 | — | — | |||||||
| | | | | | | | | | | |
Adjusted net income—(non-GAAP) | $ | 20.8 | $ | 6.0 | $ | 12.0 | ||||
| | | | | | | | | | | |
| | | | | | | | | | | |
Adjusted EBITDA is presentedrepresents net income before interest, taxes, depreciation and amortization, as further adjusted for certain charges consisting of unrelated legal and consulting fees, as well as management fees paid by us to affiliates of our former principal stockholders, stock based compensation, payment of cash bonuses under our liquidity bonus plan, loss on extinguishment of debt, impairment on assets held for sale, certain purchase accounting expenses and offering costs. We use, and we believe our investors benefit from the presentation of Adjusted EBITDA in evaluating theour operating performance of the Company because it provides managementus and our investors with additional tools to compare our operating performance on a consistent basis by removing the impact of certain items that management believes do not directly reflect our core operations .operations. In addition, we believe that Adjusted EBITDA is useful to investors and other external users of our consolidated financial statements in evaluating our operating performance as compared to that of other companies, because it allows them to measure a company's operating performance without regard to items such as interest expense, taxes, depreciation and depletion, and
amortization, and accretion, which can vary substantially from company to company depending upon accounting methods and book value of assets and liabilities, capital structure and the method by which assets were acquired. Our management also uses Adjusted EBITDA for planning purposes, including the preparation of our annual operating budget and financial projections. Management also uses Adjusted EBITDA to evaluate our ability to make certain payments, including dividends, in compliance with our senior credit facilities, which is determined based on a calculation of "Consolidated Adjusted EBITDA" that is substantially similar to Adjusted EBITDA.
Adjusted EBITDA has limitations as an analytical tool. As a result, you should not consider it in isolation, or as a substitute for net income, operating income, cash flow from operating activities or any other measure of financial performance or liquidity presented in accordance with GAAP. Some of these limitations are:
Adjusted EBITDA for the year ended December 31, 20102013 was $47.3$44.6 million compared to $45.2$29.7 million in the corresponding period in 2009,2012, an increase of $2.1$14.9 million, or 4.6%49.9%. As a percentage of net sales, Adjusted EBITDA increased from 25.9%21.2% for the year ended December 31, 20092012 to 26.8%22.9% for the year ended December 31, 2010.2013. Adjusted EBITDA for the year ended December 31, 20092012 was $45.2$29.7 million compared to Adjusted EBITDA of $47.7$52.5 million for the year ended December 31, 2008,2011, a decrease of $2.5$22.8 million, or 5.2%43.4%. As a percentage of net sales, Adjusted EBITDA decreased from 26.5% in 200825.1% for the year ended December 31, 2011 to 25.9% in 2009.21.2% for the year ended December 31, 2012. In addition to the specific changes resulting from the exceptions, the changes to Adjusted EBITDA for the periods discussed resulted from factors discussed above under "—Results of Operations."
The following table presents a reconciliation of net income, the most comparable GAAP financial measure, to Adjusted EBITDA, for each of the periods indicated.
| | For the year ended December 31, | |||||||||||||||
|---|---|---|---|---|---|---|---|---|---|---|---|---|---|---|---|---|
| | 2009 | 2010 | 2011 | 2012 | 2013 | |||||||||||
| | (in thousands) | |||||||||||||||
Net income | $ | 9,843 | $ | 1,662 | $ | 19,040 | $ | 6,012 | $ | 11,639 | ||||||
Interest expense—net | 15,520 | 10,943 | 8,918 | 8,393 | 8,328 | |||||||||||
Income taxes | 3,986 | 872 | 11,332 | 4,144 | 7,378 | |||||||||||
Depreciation expense | 5,797 | 5,704 | 2,975 | 2,819 | 3,068 | |||||||||||
Amortization | 6,161 | 6,001 | 5,201 | 5,199 | 5,625 | |||||||||||
| | | | | | | | | | | | | | | | | |
EBITDA | 41,307 | 25,182 | 47,466 | 26,567 | 36,038 | |||||||||||
Management fees | 1,393 | 6,383 | 46 | — | — | |||||||||||
Stock based compensation | 732 | 4,029 | 1,873 | 2,166 | 2,587 | |||||||||||
Loss on extinguishment of debt | — | 7,967 | 673 | — | — | |||||||||||
Management liquidity bonus | — | 1,003 | — | — | — | |||||||||||
Offering costs | — | — | 1,342 | — | — | |||||||||||
Trynex purchase accounting(1) | — | — | — | — | 4,506 | |||||||||||
Other charges(2) | 1,748 | 2,781 | 1,061 | 999 | 1,438 | |||||||||||
| | | | | | | | | | | | | | | | | |
Adjusted EBITDA | $ | 45,180 | $ | 47,345 | $ | 52,461 | $ | 29,732 | $ | 44,569 | ||||||
| | | | | | | | | | | | | | | | | |
| | | | | | | | | | | | | | | | | |
| | For the year ended December 31, | ||||||||||||||||
|---|---|---|---|---|---|---|---|---|---|---|---|---|---|---|---|---|---|
| | 2006 | 2007 | 2008 | 2009 | 2010 | ||||||||||||
| | (in thousands) | ||||||||||||||||
Net income (loss) | $ | 197 | $ | (1,057 | ) | $ | 11,471 | $ | 9,843 | $ | 1,662 | ||||||
Interest expense—net | 20,095 | 19,622 | 17,299 | 15,520 | 10,943 | ||||||||||||
Income taxes | 443 | (749 | ) | 6,793 | 3,986 | 872 | |||||||||||
Depreciation expense | 4,284 | 4,632 | 4,650 | 5,797 | 5,704 | ||||||||||||
Amortization | 6,166 | 6,164 | 6,160 | 6,161 | 6,001 | ||||||||||||
EBITDA | 31,185 | 28,612 | 46,373 | 41,307 | 25,182 | ||||||||||||
Management fees | 1,379 | 1,400 | 1,369 | 1,393 | 6,383 | ||||||||||||
Stock based compensation | — | — | — | 732 | 4,029 | ||||||||||||
Loss on extinguishment of debt | — | 2,733 | — | — | 7,967 | ||||||||||||
Management Liquidity Bonus | — | — | — | — | 1,003 | ||||||||||||
Other non-recurring charges(1) | — | — | — | 1,748 | 2,781 | ||||||||||||
Adjusted EBITDA | $ | 32,564 | $ | 32,745 | $ | 47,742 | $ | 45,180 | $ | 47,345 | |||||||
curtailment related to the Johnson City plant closure for the year ended December 31, 2010.2010 and a write down of asset held for sale of $647 for the year ended 2013.
Discussion of Critical Accounting Policies
Our consolidated financial statements are prepared in accordance with GAAP. The preparation of these consolidated financial statements requires us to make estimates and assumptions that affect the reported amounts of assets, liabilities, revenues, costs and expenses, and related disclosures. These estimates and assumptions are often based on judgments that we believe to be reasonable under the circumstances at the time made, but all such estimates and assumptions are inherently uncertain and unpredictable. Actual results may differ from those estimates and assumptions, and it is possible that
other professionals, applying their own judgment to the same facts and circumstances, could develop and support alternative estimates and assumptions that would result in material changes to our operating results and financial condition. We evaluate our estimates and assumptions on an ongoing basis. Our estimates are based on historical experience and various other assumptions that we believe to be reasonable under the circumstances.
The most significant accounting estimates inherent in the preparation of our financial statements include estimates used in the determination of liabilities related to pension obligations, recovery of accounts receivable, impairment assessment of goodwill and other indefinite-lived intangible assets, as well as estimates used in the determination of the lower of cost or market value of inventory and liabilities related to taxation and product warranty.
We believe the following are the critical accounting policies that affect our financial condition and results of operations.
Defined Benefit Pension Obligation
As discussed in Note 12 to our audited consolidated financial statements included elsewhere in this Annual Report on Form 10-K, the pension benefit obligation and related pension expense or income of our pension plans are calculated in accordance with Accounting Standards Codification ("ASC") 715-30, Defined Benefit Plans-Pension, and are impacted by certain actuarial assumptions, including the discount rate and the expected rate of return on plan assets. Rates are evaluated on an annual basis considering such factors as market interest rates and historical asset performance. Actuarial valuations for 20102013 used a discount rate of 6.0%4.1% and an expected long-term rate of return on plan assets of 8.0%7.25%. Meanwhile, actuarial valuations for 2012 used a discount rate of 4.6% and an expected long-term rate of return on plan assets of 7.25%. Our discount rate reflects the expected future cash flow based upon our funding valuation assumptions and participant data at the beginning of the plan year. The expected future cash flow was discounted by the Principal Financial Group's yield curve for the month preceding the 20102013 year end.
In estimating the expected return on plan assets, we analyze historical and expected returns for multiple asset classes. The overall rate for each asset class was developed by combining a long-term inflation component, the risk-free real rate of return, and the associated risk premium. A weighted average rate was then developed based upon those overall rates and the target asset allocation of the plan. Changes in the discount rate and return on assets can have a significant effect on the funded status of our pension plans, stockholders'shareholders' equity and related expense. We cannot predict these changes in discount rates or investment returns and, therefore, cannot reasonably estimate whether the impact in subsequent years will be significant. The funded status of our pension plans is the difference between the projected benefit obligation and the fair value of its plan assets. The projected benefit obligation is the actuarial present value of all benefits expected to be earned by our employeesemployees' service adjusted for future wage increases. At December 31, 2010,2013, our pension obligation funded status was $10.8$7.1 million underfunded.
Our funding policy for our pension plans is to contribute amounts at least equal to the minimum annual amount required by applicable regulations. We contributed approximately $0.9$0.8 million to our pension plans in 2010.2013 and expect to make approximately $1.4 million in contributions to our pension plans in 2014. See Note 12 to our audited consolidated financial statements included elsewhere in this Annual Report on Form 10-K for a more detailed description of our pension plans.
Revenue Recognition and Allowance for Doubtful Accounts
We recognize revenues upon shipment to the customer, which is when titlerisk of loss passes and all of the following conditions are satisfied: (1) persuasive evidence of an arrangement exists; (2) the price is fixed or determinable; (3) collectability is reasonably assured; and (4) the product has been shipped and we have no further obligations. Customers have no right of return privileges. Historically, product returns have not been material and are permitted on an exception basis only.
We offer a variety of discounts and sales incentives to our distributors. The estimated liability for sales discounts and allowances is recorded at the time of sale as a reduction of net sales. The liability is estimated based on the costs of the program, the planned duration of the program and historical experience.
We carry our accounts receivable at their face amount less an allowance for doubtful accounts. On a periodic basis, we evaluate our accounts receivable and establish an allowance for doubtful accounts based on a combination of specific distributor circumstances and credit conditions taking into account the history of write-offs and collections. A receivable is considered past due if payment has not been received within the period agreed upon in the invoice. Accounts receivable are written off after all collection efforts have been exhausted. We take a security interest in the inventory as collateral for the receivable but often do not have a priority security interest. See Note 2 to our audited consolidated financial statements included elsewhere in this Annual Report on Form 10-K for further information regarding our allowance for doubtful accounts.
Impairment of Long-Lived Assets
Long-lived assets are reviewed for potential impairment when events or changes in circumstances indicate that the carrying amount of the asset may not be recoverable. Recoverability of assets to be held and used is measured by comparison of the carrying value of such assets to the undiscounted future cash flows expected to be generated by the assets. If the carrying value of an asset exceeds its estimated undiscounted future cash flows, an impairment provision is recognized to the extent that the carrying amount of the asset exceeds its fair value. Assets to be disposed of are reported at the lower of the carrying amount or the fair value of the asset, less costs of disposition. Our management considers such factors as current results, trends and future prospects, current market value, and other economic and regulatory factors in performing these analyses. We determined that no long-lived assets were impaired as of December 31, 2010, 20092013, 2012 and 2008.2011.
Goodwill and Other Intangible Assets
We perform an annual impairment test for goodwill and indefinite lived trade names and more frequently if an event or circumstances indicate that an impairment loss has been incurred. Conditions that would trigger an impairment assessment include, but are not limited to, a significant adverse change in legal factors or business climate that could affect the value of an asset. The analysis of potential impairment of goodwill requires a two-step process. The first step is the estimation of fair value of the applicable reporting unit. We have determined we have one reporting unit, and all significant decisions are made on a companywide basis by our chief operating decision maker. The fair value of the reporting unit is estimated by using a market approach. The estimated fair value is compared with our aggregate carrying value. If our fair value is greater than the carrying amount, there
is no impairment. If our carrying amount is greater than the fair value, then the second step must be completed to measure the amount of impairment, if any.
The second step calculates the implied fair value of the goodwill, which is compared to its carrying value. The implied fair value of goodwill is calculated by valuing all of the tangible and intangible assets of the reporting unit at the hypothetical fair value, assuming the reporting unit had been acquired in a business combination. The excess of the fair value of the entire reporting unit over the fair value of its identifiable assets and liabilities is the implied fair value of goodwill. If the implied fair value of goodwill is less than the carrying value of goodwill, an impairment loss is recognized equal to the difference. Annual impairment tests conducted by us on December 31, 2010, 20092013, 2012 and 20082011 resulted in no adjustment to the carrying value of our indefinite-lived intangibles.
Table of Contentsintangibles and goodwill.
Our goodwill and trade name balances could be impaired in future periods. A number of factors, many of which we have no ability to control, could affect our financial condition, operating results and business prospects and could cause actual results to differ from the estimates and assumptions we employed. These factors include:
Inventory Valuation
Inventories are stated at the lower of cost or market. Market is determined on the basis of estimated realizable values. Cost is determined using the first-in, first-out basis. We periodically review our inventory for slow-moving, damaged and discontinued items and provide reserves to reduce such items identified to their recoverable amounts.
Income Taxes
Our estimate of income taxes payable, deferred income taxes and the effective tax rate is based on an analysis of many factors including interpretations of federal and state income tax laws, the difference between tax and financial reporting bases and liabilities, estimates of amounts currently due or owed in various jurisdictions, and current accounting standards. We review and update our estimates on a quarterly basis as facts and circumstances change and actual results are known.
We have generated significant deferred tax assets as a result of goodwill and intangible asset book versus tax differences as well as state net operating loss carryforwards. In assessing the ability to realize these deferred tax assets, we consider whether it is more likely than not that some portion or all of the deferred tax assets will not be realized. The ultimate realization of deferred tax assets is dependent upon the generation of future taxable income during the years in which those temporary differences become deductible. We consider the scheduled reversal of deferred tax liabilities, excluding those relating to indefinite lived intangible assets, projected future taxable income and tax planning strategies in making this assessment. As a result of this analysis, we have recorded a valuation allowance against certain of these deferred tax assets.
Accruals for uncertain tax contingencies,positions, if any, are provided for in accordance with the requirements of ASC 740—Income Taxes. See Note 10 to our audited consolidated financial statements included
elsewhere in this Annual Report on Form 10-K for further information regarding our accounting for income taxes.
Warranty Cost Recognition
We accrue for estimated warranty costs as sales are recognized and periodically assess the adequacy of the recorded warranty liability and adjust the amount as necessary. Our warranties generally provide, with respect to our snow and ice control equipment, that all material and workmanship will be free from defect for a period of two years after the date of purchase by the end-user, and with respect to our parts and accessories purchased separately, that such parts and accessories will be free from defect for a period of one year after the date of purchase by the end-user. Certain snowplows only provide for a one year warranty. We determine the amount of the estimated warranty costs (and our corresponding warranty reserve) based on our prior five years of warranty
history utilizing a formula driven by historical warranty expense and applying management's judgment. We adjust our historical warranty costs to take into account unique factors such as the introduction of new products into the marketplace that do not provide a historical warranty record to assess.
Liquidity and Capital Resources
Our principal sources of cash have been and we expect will continue to be cash from operations and borrowings under our senior credit facilities.
Our primary uses of cash are to provide working capital, meet debt service requirements, finance capital expenditures, pay dividends under our dividend policy and support our growth, including through potential acquisitions, and for other general corporate purposes. For a description of the seasonality of our working capital rates see "—Seasonality and Year-To-Year Variability."
Our Board of Directors has adopted a dividend policy that reflects an intention to distribute to our stockholders a regular quarterly cash dividend. The declaration and payment of these dividends to holders of our common stock is at the discretion of our Board of Directors and depends upon many factors, including our financial condition and earnings, legal requirements, taxes and other factors our Board of Directors may deem to be relevant. The terms of our indebtedness may also restrict us from paying cash dividends on our common stock under certain circumstances. As a result of this dividend policy, we may not have significant cash available to meet any large unanticipated liquidity requirements. As a result, we may not retain a sufficient amount of cash to fund our operations or to finance unanticipated capital expenditures or growth opportunities, including acquisitions. Our Board of Directors may, however, amend, revoke or suspend our dividend policy at any time and for any reason.
As of December 31, 2010,2013, we had liquidity comprised of $20approximately $19.9 million in cash and cash equivalents and borrowing availability of $60approximately $48.3 million under our revolving credit facility. Borrowing availability under our revolving credit facility is governed by a borrowing base, the calculation of which includes cash on hand. Accordingly, use of cash on hand may also result in a reduction in the amount available for borrowing under our revolving credit facility. Furthermore, our revolving credit facility requires us to maintain at least $6$10.5 million of borrowing availability. We expect that cash on hand, cash generated from operations, as well as available credit under our senior credit facilities will provide adequate funds for the purposes described above for at least the next 12 months.
Cash Flow Analysis
Set forth below is summary cash flow information for each of the years ended December 31, 2008, 20092011, 2012 and 2010.2013.
| | Year ended December 31, | Year ended December 31, | ||||||||||||||||||
|---|---|---|---|---|---|---|---|---|---|---|---|---|---|---|---|---|---|---|---|---|
Cash Flows (in thousands) | 2008 | 2009 | 2010 | 2011 | 2012 | 2013 | ||||||||||||||
Net cash provided by operating activities | $ | 23,411 | $ | 25,571 | $ | 15,777 | $ | 47,728 | $ | 15,619 | $ | 32,248 | ||||||||
Net cash used in investing activities | (3,113 | ) | (8,200 | ) | (2,783 | ) | (2,306 | ) | (1,366 | ) | (29,509 | ) | ||||||||
Net cash used in financing activities | (2,265 | ) | (1,850 | ) | (61,918 | ) | (26,139 | ) | (29,549 | ) | (7,011 | ) | ||||||||
| | | | | | | | | |||||||||||||
Increase (Decrease) in cash | $ | 18,033 | $ | 15,521 | $ | (48,924 | ) | $ | 19,283 | $ | (15,296 | ) | $ | (4,272 | ) | |||||
| | | | | | | | | |||||||||||||
| | | | | | | | | |||||||||||||
Sources and Uses of Cash
During the three-year periods described above, net cash provided by operating activities was used for funding capital investment, retiring preferred stock and paying related dividends, paying interest on both our senior notes and senior credit facilities, and funding working capital requirements during our pre-season shipping period.
The following table shows our cash and cash equivalents and inventories at December 31, 2008, 20092011, 2012 and 2010.2013.
| | December 31, | December 31, | ||||||||||||||||||
|---|---|---|---|---|---|---|---|---|---|---|---|---|---|---|---|---|---|---|---|---|
| | 2008 | 2009 | 2010 | 2011 | 2012 | 2013 | ||||||||||||||
| | (in thousands) | (in thousands) | ||||||||||||||||||
Cash and cash equivalents | $ | 53,552 | $ | 69,073 | $ | 20,149 | $ | 39,432 | $ | 24,136 | $ | 19,864 | ||||||||
Inventories | 28,802 | 26,697 | 23,481 | 24,005 | 30,292 | 27,977 | ||||||||||||||
Year Ended December 31, 20102013 Compared to Year Ended December 31, 20092012
We had cash and cash equivalents of $20.1$19.9 million at December 31, 20102013 compared to cash and cash equivalents of $69.1$24.1 million at December 31, 2009.2012. The table below sets forth a summary of the significant sources and uses of cash for the periods presented.
| | Year ended December 31, | Year ended December 31, | ||||||||||||||||||||||||
|---|---|---|---|---|---|---|---|---|---|---|---|---|---|---|---|---|---|---|---|---|---|---|---|---|---|---|
Cash Flows (in thousands) | 2009 | 2010 | Change | 2012 | 2013 | Change | | |||||||||||||||||||
Net cash provided by operating activities | $ | 25,571 | $ | 15,777 | $ | (9,794 | ) | (38.3 | )% | $ | 15,619 | $ | 32,248 | $ | 16,629 | 106.5 | % | |||||||||
Net cash used in investing activities | (8,200 | ) | (2,783 | ) | 5,417 | (66.1 | )% | (1,366 | ) | (29,509 | ) | (28,143 | ) | 2,060.2 | % | |||||||||||
Net cash used in financing activities | (1,850 | ) | (61,918 | ) | (60,068 | ) | 3246.9 | % | (29,549 | ) | (7,011 | ) | 22,538 | (76.3 | )% | |||||||||||
| | | | | | | | | | | |||||||||||||||||
Increase (Decrease) in cash | $ | 15,521 | $ | (48,924 | ) | $ | (64,445 | ) | (415.2 | )% | $ | (15,296 | ) | $ | (4,272 | ) | $ | 11,024 | (72.1 | )% | ||||||
| | | | | | | | | | | |||||||||||||||||
| | | | | | | | | | | |||||||||||||||||
Net cash provided by operating activities decreased $9.8increased $16.6 million from the year ended December 31, 20092012 to the year ended December 31, 2010.2013. The decreaseincrease in cash provided by operating activities was due to an $8.1 decreasea $13.8 million increase in net income causedadjusted for reconciling items. The remaining increase in partcash provided by lower income from operationsoperating activities of $5.0 million is attributable to working capital changes. Negatively impacting cash flow was a $16.9 million increase in accounts receivable driven by higher selling, general, and administrative costs related to the IPO. As we paid off these notes, accrued interest declined $5.3 million, which increased cash usedbetter results in operating activities. Additionally, accounts receivable growth of $4.9 million and accounts payable decline of $2.3 million both negatively impacted operating cash flows. Slightly offsetting these uses of cash were an increase in stock based compensation of $3.3 million and lower inventories of $3.2 million. Lower inventory levels have resulted from the closure of our Johnson City, TN location in August 2010.
Net cash used in investing activities decreased $5.4 million for the year endedending December 31, 2010,2013 as compared to the corresponding periodDecember 31, 2012. Offsetting this increase was a decrease to income tax receivable balance of $2.2 million. Also, positively impacting cash flow were increases in 2009, mainlyaccrued liability balances by $3.8 million driven by increased accrued incentives. Inventory balances decreased $2.3 million as a result of higher than normal capital investmentssales volumes in 2009 of approximately $52013 positively impacting cash flows. Accounts payable increased $2.3 million in our manufacturing plants in Milwaukee, WI and Rockland, ME to support the closure of our Johnson City, TN manufacturing facility in August 2010.
Netalso positively impacting cash used in financing activities increased $60.1 million for the year ended December 31, 2010 compared to the corresponding period in 2009. The increase was a result of our repayment of our senior notes in the amount of $150 million. Offsetting cash used were net proceeds from the IPO of $63.9 million and borrowings under the credit facility of $40 million.flows.
Net cash used in investing activities increased $28.1 million for the year ended December 31, 2013, compared to the corresponding period in 2012. This increase was due to the $26.7 million acquisition of the TrynEx business in 2013 and increased capital expenditures in 2013 as compared to 2012 due to preserving cash flow in a historically low snowfall year in 2012.
Net cash used in financing activities decreased $22.5 million for the year ended December 31, 2013 compared to the corresponding period in 2012. In 2012, we made $11.2 million in repayments of long term debt, including a $10 million voluntary prepayment, refinanced our revolving line of credit and capitalized $0.2 million in deferred financing costs. Meanwhile, in 2013 we made $1.2 million in repayments of long term debt. We also paid dividends of $18.7 million in the year ended December 31, 2013, compared to dividends paid of $18.2 million in the year ended December 31, 2012. Lastly, we had $13.0 million of outstanding borrowings on the revolver at December 31, 2013 while we had no outstanding revolver borrowings at December 31, 2012.
Year Ended December 31, 20092012 Compared to Year Ended December 31, 20082011
We had cash and cash equivalents of $69.1$24.1 million at December 31, 20092012 compared to cash and cash equivalents of $53.6$39.4 million at December 31, 2008.2011. The table below sets forth a summary of the significant sources and uses of cash for the periods presented.
| | Year ended December 31, | Year ended December 31, | ||||||||||||||||||||||||
|---|---|---|---|---|---|---|---|---|---|---|---|---|---|---|---|---|---|---|---|---|---|---|---|---|---|---|
Cash Flows (in thousands) | 2008 | 2009 | Change | 2011 | 2012 | Change | | |||||||||||||||||||
Net cash provided by operating activities | $ | 23,411 | $ | 25,571 | $ | 2,160 | 9.2 | % | $ | 47,728 | $ | 15,619 | $ | (32,109 | ) | (67.3 | )% | |||||||||
Net cash used in investing activities | (3,113 | ) | (8,200 | ) | (5,087 | ) | 163.4 | % | (2,306 | ) | (1,366 | ) | 940 | (40.8 | )% | |||||||||||
Net cash used in financing activities | (2,265 | ) | (1,850 | ) | 415 | (18.3 | )% | (26,139 | ) | (29,549 | ) | (3,410 | ) | 13.0 | % | |||||||||||
Increase in cash | $ | 18,033 | $ | 15,521 | $ | (2,512 | ) | (13.9 | )% | |||||||||||||||||
| | | | | | | | | | | |||||||||||||||||
Increase (Decrease) in cash | $ | 19,283 | $ | (15,296 | ) | $ | (34,579 | ) | (179.3 | )% | ||||||||||||||||
| | | | | | | | | | | |||||||||||||||||
| | | | | | | | | | | |||||||||||||||||
Net cash provided by operating activities increased $2.2decreased $32.1 million from the year ended December 31, 20082011 to the year ended December 31, 2009.2012. The increasedecrease in cash provided by operating activities was due to an aggregate $13.8 million change$11.6 decrease in inventory (from an $11.7 million increase in inventory for the year ended December 31, 2008 to support increased sales volume to a $2.1 million inventory reduction for the year ended December 31, 2009). This positive impact was partially offset by increased accounts receivable growth, reduced net income a loweradjusted for reconciling items. Negatively impacting cash flow were an income tax receivable balance at December 31, 2012 of $4.9 million as compared to a $0.4 million payable position at December 31 2011 combining for a net impact of $5.3 million. Also, negatively impacting cash flow were decreases in accrued liability balances by $5.8 million driven by decreased accrued incentive of $3.2 million and a reductiondecrease in accruals with respect to the Company's Annual Incentive Plan and non-executive employee profit sharing plan.accrued sales incentives of $1.8 million Inventory balances increased $6.3 million as a result of lower sales volumes in 2012 negatively impacting cash flows. Slightly offsetting these adverse cash flow items were accounts receivable, which declined $8.6 million, positively influencing operating cash flows.
Net cash used in investing activities increased $5.1decreased $0.9 million for the year ended December 31, 2009,2012, compared to the corresponding period in 2008, mainly as2011. This decrease was due to lower capital expenditures in 2012 to preserve cash flow in a result of increases in capital investments of approximately $5 million in our manufacturing plants in Milwaukee, WI and Rockland, ME to support the closure of our Johnson City, TN manufacturing plant in August 2010.historically low snowfall year.
Net cash used in financing activities decreased $0.4increased $3.4 million for the year ended December 31, 20092012 compared to the corresponding period in 2008, primarily2011. In 2012, we made $11.2 million in repayments of long term debt, including a $10 million voluntary prepayment, refinanced our revolving line of credit and capitalized $0.2 million in deferred financing costs. In 2011, we refinanced our term loan, resulting in a net impact of $2.2 million in cash used as we borrowed $125.0 million less a result of a payment$1.3 million discount and paid and capitalized $3.5 million of deferred financing costs, offset by debt repayments of $0.3$122.5 million. We also paid dividends of $25.8 million forin the year ended December 31, 2008 which did not occur2011, compared to dividends paid of $18.2 million in the corresponding periodyear ended December 31, 2012, and received $1.3 million in 2009.2011 for the exercise of stock options, whereas no options were exercised in 2012.
Future Obligations and Commitments
Contractual Obligations
We are subject to certain contractual obligations, including long-term debt and related interest. We have net unrecognized tax benefits of $0.6$0.3 million as of December 31, 2010.2013. However, we cannot make a reasonably reliable estimate of the period of potential cash settlement of the underlying liabilities, therefore, we have not included unrecognized tax benefits in calculating the obligations set forth in the following table of significant contractual obligations as of December 31, 2010.2013.
(Dollars in thousands) | Total | Less than 1 year | 1 - 3 years | 3 - 5 years | |||||||||
|---|---|---|---|---|---|---|---|---|---|---|---|---|---|
Long-term debt(1) | $ | 110,994 | $ | 971 | $ | 1,942 | $ | 108,081 | |||||
Interest on long-term debt(2) | 27,349 | 6,697 | 12,605 | 8,047 | |||||||||
| | | | | | | | | | | | | | |
Total contracted cash obligations(3) | $ | 138,343 | $ | 7,668 | $ | 14,547 | $ | 116,128 | |||||
| | | | | | | | | | | | | | |
| | | | | | | | | | | | | | |
(Dollars in thousands) | Total | Less than 1 year | 1–3 years | 3–5 years | More than 5 years | |||||||||||
|---|---|---|---|---|---|---|---|---|---|---|---|---|---|---|---|---|
Long-term debt(1) | $ | 121,154 | $ | 1,183 | $ | 81,629 | $ | 666 | $ | 37,676 | ||||||
Interest on long-term debt(2) | 27,172 | 8,066 | 12,732 | 5,341 | 1,033 | |||||||||||
Total contracted cash obligations(3) | $ | 148,326 | $ | 9,249 | $ | 94,361 | $ | 6,007 | $ | 38,709 | ||||||
Senior Credit Facilities
As of December 31, 2009, ourOur senior credit facilities consisted of an $85.0 million term loan facility and a $60.0 million revolving credit facility with a group of banks as well as our outstanding $150,000 of 7.75% senior notes due January 15, 2012. Concurrent with the consummation of the IPO, we amended our senior credit facilities to, among other things, (i) allow us to redeem the Senior Notes, (ii) increase the size of our term loan facility by $40.0 million and (iii) amend certain of the provisions in our senior credit facilities which govern our ability to pay dividends. Consequently, at December 31, 2010, our senior credit facilities consistedconsist of a $125.0 million term loan facility and a $60.0an $80.0 million revolving credit facility with a group of banks. In connection with the amendments to our senior credit facilities, the interest on the existing portion ofThe agreement for the term loan facility was revised. The change consisted of an increase from an interest rate equal to (at our option) either the base rate plus 1.25% or the eurodollar rate plus 2.25% to (at our option) either the base rate (which shall be no less than 3%(the "Term Loan Credit Agreement") plus 3.5% or the eurodollar rate (which shall be no less than 2%) plus 4.5%. The interestprovides for the additional $40.0 million increase in our'sa senior secured term loan facility is anin the aggregate principal amount of $125.0 million and generally bears interest rate equal toat (at the our option)election) either (i) 3.25% per annum plus the base rate (which shall be no less than 3%)greatest of (a) the Prime Rate (as defined in the Term Loan Credit Agreement) in effect on such day, (b) the weighted average of the rates on overnight Federal funds transactions with members of the Federal Reserve System arranged by Federal funds brokers plus 4%0.50% and (c) 1.00% plus the greater of (1) the London Interbank Offered Rate for a one month interest period multiplied by the Statutory Reserve Rate (as defined in the Term Loan Credit Agreement) and (2) 1.50% or (ii) 4.25% per annum plus the eurodollar rate (which shall be no less than 2%) plus 5%greater of (a) the London Interbank Offered Rate for the applicable interest period multiplied by the Statutory Reserve Rate and (b) 1.50%. Under the
The revolving credit facility as amended and restated (the "Revolving Credit and Guaranty Agreement") provides that the marginwe have the option to select whether borrowings will bear interest at either (i) 1.75% per annum plus the London Interbank Offered Rate for base rate loans is either 0.25%the applicable interest period multiplied by the Statutory Reserve Rate or (ii) 1.25% per annum plus the greatest of (a) the Prime Rate in effect on such day, (b) the weighted average of the rates on overnight Federal funds transactions with members of the Federal Reserve System arranged by Federal funds brokers plus 0.50% and (c) the margin for eurodollar rate loans is either 1.25% or 1.50%, in each case determined based on our leverage ratio from time to time. The amendment of the term loan facility resulted in a significant modification of the debt which resulted in the write off of unamortized capitalized deferred financing costs of $1.0 million and expenditures of $2.0 million related to financing costs paid to existing lenders which was recorded as a loss on extinguishment of debt in the consolidated statements of operations for the year ended December 31, 2010.
On June 9, 2010, we completed the redemption of the senior notes. We redeemed the senior notes with the proceeds from the additional term loan, together with the net IPO proceeds and cash on handLondon Interbank Offered Rate for a total of $157.6 million, which includes $3.7 million ofone month interest that accrued throughperiod multiplied by the date of deposit with the trustee, $1.0 million of interest that accrued from the date of deposit with the trustee to the date of redemption and a $2.9 million redemption call premium of 1.938%Statutory Reserve Rate plus 1%. In addition, we wrote off $1.1 million of unamortized deferred financing costs related to the senior notes.
After effecting the discharge of the senior notes, theThe maturity date for our amended and restated revolving credit facility is May 21, 2012,April 17, 2017, and our term loan amortizes in nominal amounts quarterly with the balance payable on May 21, 2013 with respect toApril 18, 2018.
The term loan was issued at a $1.25 million discount which is being amortized over the existing term loans and May 21, 2016 with respect toof the additional term loans.loan.
As ofAt December 31, 2010,2013, we had nooutstanding borrowings under our term loan of $111.0 million and had $13.0 million in outstanding borrowings on the revolving credit facility and remaining borrowing availability of $60.0$48.3 million.
Our senior credit facilities include certain negative and operating covenants, including restrictions on itsour ability to pay dividends, and other customary covenants, representations and warranties and events of default. The senior credit facilities entered into and recorded by our subsidiaries significantly restrict itsour subsidiaries from paying dividends and otherwise transferring assets to Douglas Dynamics, Inc.us. The terms of our revolving credit facility specifically restrict subsidiaries from paying dividends if a minimum availability under the revolving credit facility is not maintained, (such event, a "liquidity event"), and both senior credit facilities restrict subsidiaries from paying dividends above certain levels or at all if an event of default has occurred. These restrictions would affect us indirectly since we rely principally on distributions from our subsidiaries to have funds available for the payment of dividends. In addition, our revolving credit facility includes a requirement that, subject to certain exceptions, capital expenditures may not exceed $10.0$10 million in any calendar year and, during the occurrence of a liquidity event,if certain minimum availability under our revolving credit facility is not maintained, that we comply with
a monthly minimum fixed charge coverage ratio test of 1.0:1.0. Compliance with the fixed charge coverage ratio test is subject to certain cure rights under our revolving credit facility. At December 31, 2010,2013, we were in compliance with the respective covenants.covenants in our senior credit facilities. The credit facilities are collateralized by substantially all of our assets.
In accordance with the senior credit facilities, we are required to make additional principal prepayments over the above scheduled payments under certain conditions. This includes, in the case of the term loan facility, 100% of the net cash proceeds of certain asset sales, certain insurance or condemnation events, certain debt issuances, and, within 150 days of the end of the fiscal year, 50% of excess cash flow, as defined, including a deduction for allowedcertain distributions (which percentage is reduced to 25% or 0% upon the achievement of certain leverage ratio thresholds), for any fiscal year. Excess cash flow is defined in the senior credit facilities as consolidated Adjustedadjusted EBITDA (earnings before interest, taxes, depreciation and amortization) plus a working capital adjustment less the sum of repayments of debt and capital expenditures subject to certain adjustments, interest and taxes paid in cash, management fees and certain restricted payments (including dividends or distributions). Working capital adjustment is defined in the senior credit facilities as the change in working capital, defined as current assets excluding cash and cash equivalents less current liabilities excluding current portion of long-termlong term debt. As of December 31, 2010 and December 31, 2009,2013, we were not required to make an excess cash flow payment.
Each of the senior secured facilities include a hedge provision, which required us to enter into an interest rate hedge commencing 90 days after the closing date. The hedging provision requires the Company to hedge the interest rate on at least 25% of the aggregate outstanding principal amount of the term loans. The purpose of the interest rate swap is to reduce our exposure to interest rate volatility. Effective June 20, 2011, we entered into an interest rate swap agreement with a notional amount of $50 million. The interest rate swap negative fair value at December 31, 2013 of $0.3 million is included in other long-term liabilities on the Consolidated Balance Sheet. We have counterparty credit risk resulting from the interest rate swap, which we monitors on an on-going basis. This risk lies with one global financial institution. Under the interest rate swap agreement, effective as of July 18, 2011, we either receive or makes payments on a monthly basis based on the differential between 6.335% and LIBOR plus 4.25% (with a LIBOR floor of 1.5%). The interest rate swap contract on the term loan expires in December 2014.
Deductibility of Intangible and Goodwill Expense
We possess a favorable tax structure with approximately $18$19.5 million of annual tax-deductible intangible and goodwill amortization expense over the next tenfive years which may be utilized in the event we have sufficient taxable income to utilize such benefit.
Impact of Inflation
We do not believe that inflation risk is material to our business or our financial condition, results of operations or cash flows at this time. Historically, we have experienced normal raw material, labor and fringe benefit inflation. To date we have been able to fully offset this inflation by providing higher value products, which command higher prices. In previous years, we have experienced significant increases in steel costs, but have been able to mitigate the effects of these increases through both temporary and permanent steel surcharges. See "Risk Factors—The price of steel, a commodity necessary to manufacture our products, is highly variable. If the price of steel increases, our gross margins could decline."
Off-Balance Sheet Arrangements
We are not party to any off-balance sheet arrangements that have or are reasonably likely to have a material current or future effect on our financial condition, changes in financial condition, revenues, expenses, results of operations, liquidity, capital expenditures or capital resources.
Seasonality and Year-To-Year Variability
Our business is seasonal and also varies from year-to-year. Consequently, our results of operations and financial condition vary from quarter-to-quarter and from year-to-year as well. In addition, because of this seasonality and variability, our results of operations for any quarter may not be indicative of results of operations that may be achieved for a subsequent quarter or the full year, and may not be similar to results of operations experienced in prior years.
Sales of our products are significantly impacted by the level, timing and location of snowfall, with sales in any given year and region most heavily influenced by snowfall levels in the prior snow season (which we consider to begin in October and end in March) in that region. This is due to the fact that end-user demand for our products is driven primarily by the condition of their snow and ice control equipment, and in the case of professional snowplowers, by their financial ability to purchase new or replacement snow and ice control equipment, both of which are significantly affected by snowfall levels. Heavy snowfall during a given winter causes usage of our products to increase, resulting in greater wear and tear to our products and a shortening of their life cycles, thereby creating a need for replacement snow and ice control equipment and related parts and accessories. In addition, when there is a heavy snowfall in a given winter, the increased income our professional snowplowers generate from their professional snowplow activities provides them with increased purchasing power to purchase replacement snow and ice control equipment prior to the following winter. To a lesser extent, sales of our products are influenced by the timing of snowfall in a given winter. Because an early snowfall can be viewed as a sign of a heavy upcoming snow season, our end-users may respond to an early snowfall by purchasing replacement snow and ice control equipment during the current season rather that delaying purchases until after the season is over when most purchases are typically made by end-users.
The following chart illustrates the effects of snowfall levels in the snowbelt states in a given winter on the number of units of snow and ice control equipment we shipped in the following year. Snowfall levels represent the aggregate number of inches of snowfall recorded in each of 66 cities in 26 snowbelt states across the Northeast, East, Midwest and Western United States where we have historically monitored snowfall levels. We have historically monitored snowfall levels in these cities because they represent the key metropolitan areas in the states where snowfall is a regular occurrence and coincide with our historical U.S. market. With respect to the calculation of units shipped, each year in the following chart represents the calendar year period from January 1 to December 31. With respect to the calculation of snowfall, each year in the following chart represents the period beginning on October 1 of the prior year and extending through the following March 31. Thus, for example, the number of units shipped in 20012004 represents the total units of snow and ice control equipment we
shipped from January 1, 20012004 to December 31, 2001,2004, whereas the 20012004 snowfall level reflects snowfall in the snowbelt states in the period from October 1, 20002003 through March 31, 2001.2004. As the chart indicates, heavy snowfall levels in a given winter tend to lead to increased unit shipments of our snow and ice control equipment in the following year, whereas low snowfall levels in a given winter tend to lead to decreased units shipped of our snow and ice control equipment in the following year. Over the past 10 years, our sales of snow and ice control equipment ranged from a low of 40,53834,457 units to a high of 66,043 units, averaging 51,19948,081 units per year (including units sold by Blizzard Corporation prior to its acquisition by us in November 2005).
Equipment Sales Versus Snowfall

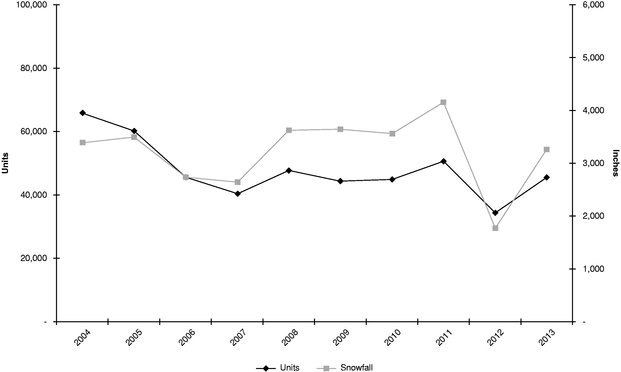
Note:
Source of snowfall data: National Oceanic and Atmospheric Administration's National Weather Service
Snowfall levels in any given rolling eight-yearten-year period have been relatively constant. See "Business—Our Industry."
We attempt to manage the seasonal impact of snowfall on our revenues in part through our pre-season sales program, which involves actively soliciting and encouraging pre-season distributor orders in the second and third quarters by offering our distributors a combination of pricing, payment and freight incentives during this period. These pre-season sales incentives encourage our distributors to re-stock their inventory during the second and third quarters in anticipation of the peak fourth quarter retail sales period by offering favorable pre-season pricing and payment deferral until the fourth quarter. As a result, we tend to generate our greatest volume of sales (an average of over two-thirds over the last ten years) during the second and third quarters, providing us with manufacturing visibility for the remainder of the year. By contrast, our revenue and operating results
tend to be lowest during the first quarter as management believes our end-users prefer to wait until the beginning of a snow season to purchase new equipment and as our distributors sell off inventory and wait for our pre-season sales incentive period to re-stock inventory. Fourth quarter sales vary from year-to-year as they are primarily driven by the level, timing and location of snowfall during the quarter. This is because most of our fourth quarter sales and shipments consist of re-orders by distributors seeking to restock inventory to meet immediate customer needs caused by snowfall during the winter months.
Our revenue and operating results tend to be lowest during the first quarter, during which period we typically experience negative earnings as the snow season draws to a close. Our first quarter revenue has varied from approximately $7.9$8.5 million to approximately $22.4$23.5 million between 20062009 and 2010.2013. During the last five-year period, net loss during the first quarter has varied from a net loss of approximately $2.9$0.8 million to a net loss of approximately $6.5$5.7 million, with an average net loss of $5.1$3.7 million.
While our monthly working capital has averaged approximately $90$60 million from 20082011 to 2010,2013, because of the seasonality of our sales, we experience seasonality in our working capital needs as well.
In the first quarter we require capital as we are generally required to build our inventory in anticipation of our second and third quarter sales seasons. During the second and third quarters, our working capital requirements rise as our accounts receivables increase as a result of the sale and shipment of products ordered through our pre-season sales program and we continue to build inventory. Working capital requirements peak towards the end of the third quarter (reaching an average peak of $89.0approximately $70.0 million over the prior three years) and then begin to decline through the fourth quarter through a reduction in accounts receivables (as it is in the fourth quarter that we receive a majority of the payments for previously shipped products).
We also attempt to manage the impact of seasonality and year-to-year variability on our business costs through the effective management of our assets. See "Business—Our Business Strategy—Aggressive Asset Management and Profit Focus." Our asset management and profit focus strategies include:
These asset management and profit focus strategies, among other management tools, allow us to adjust fixed overhead and sales, general and administrative expenditures to account for the year-to-year variability of our sales volumes. Management currently estimates that annual fixed overhead expenses generally range from approximately $14.0$22.0 million in low sales volume years to approximately $16.0$26.0 million in high sales volume years. Further, management currently estimates that annual sales, general and administrative expenses other than amortization generally approximate $20.0$33.0 million, but can be reduced to approximately $17.0$24.0 million to maximize cash flow in low sales volume years, and can increase to approximately $24.0$36.0 million to maintain customer service and responsiveness in high sales volume years.
Additionally, although modest, our annual capital expenditure requirements, which are normally budgeted at $3.5$3.0 million, can be temporarily reduced by up to approximately 40% in response to actual
or anticipated decreases in sales volumes. If we are unsuccessful in our asset management initiatives, the seasonality and year-to-year variability effects on our business may be compounded and in turn our results of operations and financial condition may suffer.
Item 7A. Quantitative and Qualitative Disclosures About Market Risk
Quantitative and Qualitative Disclosures About Market Risk
We do not use financial instruments for speculative trading purposes, and do not hold any derivative financial instruments that could expose us to significant market risk. Our primary market risk exposures are changes in interest rates and steel price fluctuations.
Interest Rate Risk
We are exposed to market risk primarily from changes in interest rates. Our borrowings, underincluding our term loan and any revolving borrowings under our senior credit facilities, are at variable rates of interest and expose us to interest rate risk. A portion of our interest rate risk associated with our term loan is mitigated through an interest rate swap as discussed in Note 7 to the Consolidated Financial Statements. In addition, the interest rate on any revolving borrowings is subject to an increase in the interest rate based on our average daily availability under our revolving credit facility. When the average daily excess availability on our revolving credit facility falls below $25 million, our interest rate on the revolving credit facility will increase by 0.25%. The maximum impact this would have on our interest expense would be $150,000 per year. If interest rates increase, our debt service obligations on our variable rate indebtedness would increase even though the amount borrowed remained the same, and our net income and cash flows would correspondingly decrease.
As of December 31, 2010,2013, we had outstanding borrowings under our term loan of $121.2$111.0 million. A hypothetical interest rate change of 1%, 1.5% and 2% on our term loan would have changed interest incurred for 2010the year ended December 31, 2013 by $0.4$0.0 million, $0.7$0.2 million and $1.3$0.5 million, respectively. We have entered into an interest rate swap, which became effective beginning July 2011 and matures December 2014, to hedge the variability in future cash flows associated with our variable-rate term loans. The swap converts $50.0 million of our term loan to a fixed interest rate of 2.085%. As of December 31, 2013, we had no outstanding borrowings under our revolving credit facility as of $13.0 million. A hypothetical interest rate change of 1%, 1.5% and 2% on our revolving credit facility would have changed interest incurred for the year ended December 31, 2010.2013 by $0.2 million, $0.3 million and $0.4 million, respectively.
Commodity Price Risk
In the normal course of business, we are exposed to market risk related to our purchase of steel, the primary commodity upon which our manufacturing depends. While steel is typically available from numerous suppliers, the price of steel is a commodity subject to fluctuations that apply across broad spectrums of the steel market. We do not use any derivative or hedging instruments to manage the price risk. If the price of steel increases, our variable costs could also increase. While historically we have successfully mitigated these increased costs through the implementation of either permanent price increases and/or temporary invoice surcharges, in the future we may not be able to successfully mitigate these costs, which could cause our gross margins to decline. If our costs for steel were to increase by $1.00 in a period in which we were not able to pass any of this increase onto our distributors, our gross margins would decline by $1.00 in that period.
Item 8. Financial Statements and Supplementary Data
The financial statements are included in this report beginning on page F-3.
Item 9. Changes In and Disagreements with Accountants on Accounting and Financial Disclosures
None
Item 9A. Controls and Procedures
Disclosure Controls and Procedures
We maintain "disclosureOur management, with the participation of our Chief Executive Officer and Chief Financial Officer, carried out an evaluation of the effectiveness of the design and operation of our disclosure controls and procedures" (the "Evaluation") as such term isof the last day of the period covered by this report.
Based upon the Evaluation, our Chief Executive Officer and Chief Financial Officer concluded that our disclosure controls and procedures were effective as of December 31, 2013. Disclosure controls and procedures are defined inby Rules 13a-15(e) and 15d-15(e) under the Securities Exchange Act of 1934 (the "Exchange Act"), as controls and other procedures that are designed to ensure that information required to be disclosed by us in the reports that we file or submit under the Exchange Act is recorded, processed, summarized and reported within the time periods specified in Securities and Exchange Commissionby the SEC's rules and forms,forms. Disclosure controls and procedures include, without limitation, controls and procedures designed to ensure that such information required to be disclosed by us in the reports that we file or submit under the Exchange Act is accumulated and communicated to
our management, including our Chief Executive Officer and Chief Financial Officer, as appropriate to allow timely decisions regarding required disclosure. In designing disclosure controls and procedures, our management necessarily was required to apply its judgment in evaluatingdisclosures.
It should be noted that the cost-benefit relationship of possible disclosure controls and procedures. The design of any disclosuresystem of controls and procedures also is based in part upon certain assumptions about the likelihood of future events, and there can be no assurance that any design will succeed in achieving its stated goals under all potential future conditions.conditions, regardless of how remote.
Management's Report on Internal Control Over Financial Reporting
Our management includingis responsible for establishing and maintaining adequate internal control over financial reporting. Our internal control system was designed to provide reasonable assurance to our management and Board of Directors regarding the preparation and fair presentation of our published financial statements.
All internal control systems, no matter how well designed, have inherent limitations. Therefore, even those systems determined to be effective can provide only reasonable assurance with respect to financial statement preparation and presentation.
Our management, with the participation of our Chief Executive Officer and Chief Financial Officer, evaluated the effectiveness of our disclosure controls and procedures pursuant to Rule 13a-15 under the Exchange Actinternal control over financial reporting as of December 31, 2013. As allowed by the endSecurities and Exchange Commission guidance, management excluded from its assessment Trynex International LLC, which was acquired in 2013 and constituted 8.6% and 15.1% of total and net assets, respectively as of December 31, 2013, and 6.6% and (19.0%) of net sales and net income, respectively, for the year then ended. In making this assessment, it used the criteria set forth by the Committee of Sponsoring Organizations of the period covered by this report.Treadway Commission ("COSO") inInternal Control—Integrated Framework (1992 framework). Based on that evaluation, our Chief Executive Officer and Chief Financial Officer have concludedits assessment, management believes that, as of December 31, 2013, our internal control over financial reporting was effective based on those criteria.
Ernst & Young LLP, an independent registered public accounting firm, has audited the endConsolidated Financial Statements included in this Annual Report on Form 10-K and, as part of its audit, has issued an attestation report, included herein, on the period covered by this annual report,effectiveness of our disclosure controls and procedures (as defined in Rule 13a-15(e) under the Exchange Act) were effective.internal control over financial reporting at December 31, 2013.
Management's Report on Internal Control Over Financial Reporting
This Annual Report on Form 10-K does not include aDuring the last fiscal quarter of the period covered by this report, of management's assessment regardingthere were no changes in our internal controlcontrols over financial reporting or an attestation report of our independent registered public accounting firm due to a transition period established by the rules of the SEC for newly public companies. No change in our internal control over financial reporting (as defined in Rule 13a-15(f) under the Exchange Act) occurred during the fourth quarter of our fiscal year ended December 31, 2010 that hashave materially affected, or isare reasonably likely to materially affect our internal control over financial reporting.such controls.
None
Item 10. Directors, Executive Officers and Corporate Governance
The information included under the captions "Election of Directors," "Board of Directors and Corporate Governance" and "Section 16(a) Beneficial Ownership Reporting Compliance" in the Company's definitive proxy statement, which is expected to be filed pursuant to Regulation 14A within 120 days following the end of the fiscal year covered by this report (the "Proxy Statement"), is hereby incorporated by reference. The information required by Item 10 with respect to our Executive Officers is included in Part I of this Annual Report on Form 10-K.
We have adopted a Code of Business Conduct and Ethics that applies to our principal executive officer, principal financial officer and principal accounting officer, as well as all of our employees. We have posted a copy of the Code of Business Conduct and Ethics on our website at www.douglasdynamics.com. The Code of Business Conduct and Ethics is also available in print to any stockholder who requests it in writing from the Corporate Secretary at 7777 North 73rd Street, Milwaukee, Wisconsin 53223. We intend to post on our website any amendments to, or waivers (with respect to our principal executive officer, principal financial officer and controller) from, the Code of Business Conduct and Ethics within four business days of any such amendment or waiver. We are not including the information contained on our website as part of, or incorporating it by reference into, this report.
Item 11. Executive Compensation
The information required in Item 11 is incorporated by reference to the information in the Proxy Statement under the captions "Corporate Governance—Compensation Committee Interlocks and Insider Participation," "Compensation Discussion and Analysis", "Executive Compensation," "Director Compensation" and "Compensation Committee Report."
Item 12. Security Ownership of Certain Beneficial Owners and Management and Related Shareholder Matters
The information required in Item 12 is incorporated by reference to the information in the Proxy Statement under the captions "Corporate Governance—Significant Stockholders" and "—Executive Officers and Directors."
Item 13. Certain Relationships and Related Transactions, and Director Independence
The information required in Item 13 is incorporated by reference to the information in the Proxy Statement under the caption "Corporate Governance."
Item 14. Principal Accounting Fees and Services
The information required in Item 14 is incorporated by reference to the information in the Proxy Statement under the caption "Ratification of Appointment of Independent Registered Public Accounting Firm."
Item 15. Exhibits and Financial Statement Schedules
See "Index to Consolidated Financial Statements" on page F-1, the ReportReports of Independent Registered Public Accounting Firm on page F-2 and F-3 and the Consolidated Financial Statements beginning on page F-3,F-4, all of which are incorporated herein by reference.
All schedules have been omitted because the information required in these schedules is included in the Notes to the Consolidated Financial Statements.
See "Exhibit Index" of this Form 10-K, which is incorporated herein by reference.
Pursuant to the requirements of Section 13 or 15(d) of the Securities Exchange Act of 1934, the Registrant has duly caused this report to be signed on its behalf by the undersigned, thereunto duly authorized, on this 811th day of March, 2011.2014.
| DOUGLAS DYNAMICS, INC. | ||||
By: | /s/ JAMES JANIK James L. Janik President and Chief Executive Officer | |||
Pursuant to the requirements of the Securities Exchange Act of 1934, this report has been signed below by the following persons on behalf of the Registrant and in the capacities andindicated on the dates indicated.March 11, 2014.
| /s/ JAMES L. JANIK James L. Janik | President and Chief Executive Officer (Principal Executive Officer) and Director | |
/s/ ROBERT L. MCCORMICK Robert L. McCormick | Executive Vice President and Chief Financial Officer (Principal Financial Officer) | |
/s/ ROBERT J. YOUNG Robert J. Young | Corporate Controller and Treasurer (Controller) | |
/s/ | Director | |
/s/ KENNETH W. KRUEGER Kenneth W. Krueger | Director | |
/s/ JAMES L. PACKARD James L. Packard | Director | |
/s/ JACK O. PEIFFER Jack O. Peiffer | Director | |
/s/ | ||
James D. Staley | Director | |
/s/ DONALD W. STURDIVANT Donald W. Sturdivant | Director | |
/s/ MICHAEL W. WICKHAM Michael W. Wickham | Director |
Dated: March 8, 2011
| Exhibit Number | Title | ||
|---|---|---|---|
| Asset Purchase Agreement, dated May 6, 2013 by and between Acquisition Tango LLC, TrynEx, Inc. and shareholders of Trynex, Inc. named therein [Incorporated by reference to Exhibit 2.1 to Douglas Dynamics, Inc.'s Current Report on Form 8-K filed May 6, 2013 (File No. 001-34728)]. | |||
2.2 | First Amendment, dated August 6, 2013, to the Asset Purchase Agreement dated May 6, 2013 by and between TrynEx International LLC, Apex International, Inc. and shareholders of Apex International, Inc. named therein [Incorporated by reference to Exhibit 2.1 to Douglas Dynamics, Inc.'s Current Report on Form 8-K filed August 5, 2013 (File No. 001-34728)]. | ||
3.1 | Fourth Amended and Restated Certificate of Incorporation of Douglas Dynamics, Inc. | ||
3.2 | Second Amended and Restated Bylaws of Douglas Dynamics, Inc. | ||
10.2 | |||
10.3 | |||
| First Amendment, | |||
# | Employment Agreement between Robert McCormick and Douglas Dynamics, Inc., dated September 7, 2004, as amended by that certain amendment, dated as of October 1, 2008 [Incorporated by reference to Exhibit 10.5 to Douglas Dynamics, Inc.'s Registration Statement on Form S-1 (Registration No. 333-164590)]. | ||
| Exhibit Number | Title | ||
|---|---|---|---|
| 10.5 | # | Form of Amendment No. 2 to Employment Agreement between Robert McCormick and Douglas Dynamics, Inc. [Incorporated by reference to Exhibit 10.6 to Douglas Dynamics, Inc.'s Registration Statement on Form S-1 (Registration No. 333-164590)]. | |
# | Employment Agreement between James L. Janik and Douglas Dynamics, Inc., dated March 30, 2004 [Incorporated by reference to Exhibit 10.7 to Douglas Dynamics, Inc.'s Registration Statement on Form S-1 (Registration No. 333-164590)]. | ||
# | Form of Amendment No. 1 to Employment Agreement between James L. Janik and Douglas Dynamics, Inc. [Incorporated by reference to Exhibit 10.8 to Douglas Dynamics, Inc.'s Registration Statement on Form S-1 (Registration No. 333-164590)]. | ||
10.9 | # | Employment Agreement between Mark Adamson and Douglas Dynamics, Inc., dated August 27, 2007 [Incorporated by reference to Exhibit 10.9 to Douglas Dynamics, Inc.'s Registration Statement on Form S-1 (Registration No. 333-164590)]. | |
10.10 | # | Form of Amendment No. 1 to Employment Agreement between Mark Adamson and Douglas Dynamics, Inc. [Incorporated by reference to Exhibit 10.10 to Douglas Dynamics, Inc.'s Registration Statement on Form S-1 (Registration No. 333-164590)]. | |
10.11 | # | ||
Douglas Dynamics, Inc. Amended and Restated 2004 Stock Incentive Plan [Incorporated by reference to Exhibit 10.16 to Douglas Dynamics, Inc.'s Registration Statement on Form S-1 (Registration No. 333-164590)]. | |||
# | Form of Amended and Restated Management Incentive Option Agreement under Douglas Dynamics, Inc. Amended and Restated 2004 Stock Incentive Plan [Incorporated by reference to Exhibit 10.18 to Douglas Dynamics, Inc.'s Registration Statement on Form S-1 (Registration No. 333-164590)]. | ||
# | Form of Management Non-Qualified Stock Option Agreement under Douglas Dynamics, Inc. 2004 Stock Incentive Plan [Incorporated by reference to Exhibit 10.19 to Douglas Dynamics, Inc.'s Registration Statement on Form S-1 (Registration No. 333-164590)]. | ||
# | Form of Amended and Restated Management Non-Qualified Option Agreement under Douglas Dynamics, Inc. Amended and Restated 2004 Stock Incentive Plan [Incorporated by reference to Exhibit 10.20 to Douglas Dynamics, Inc.'s Registration Statement on Form S-1 (Registration No. 333-164590)]. | ||
# | Form of Non-Employee Director Non-Qualified Option Agreement under Douglas Dynamics, Inc. 2004 Stock Incentive Plan [Incorporated by reference to Exhibit 10.21 to Douglas Dynamics, Inc.'s Registration Statement on Form S-1 (Registration No. 333-164590)]. | ||
# | Form of Amended and Restated Non-Employee Director Non-Qualified Option Agreement under Douglas Dynamics, Inc. Amended and Restated 2004 Stock Incentive Plan [Incorporated by reference to Exhibit 10.22 to Douglas Dynamics, Inc.'s Registration Statement on Form S-1 (Registration No. 333-164590)]. | ||
# | Amended and Restated Management Incentive Option Agreement under Douglas Dynamics, Inc. 2004 Stock Incentive Plan between Douglas Dynamics, Inc. and James L. Janik, dated March 31, 2004 [Incorporated by reference to Exhibit 10.23 to Douglas Dynamics, Inc.'s Registration Statement on Form S-1 (Registration No. 333-164590)]. | ||
| Exhibit Number | Title | ||
|---|---|---|---|
| 10.18 | # | Form of Second Amended and Restated Management Incentive Option Agreement under Douglas Dynamics, Inc. Amended and Restated 2004 Stock Incentive Plan between Douglas Dynamics, Inc. and James L. Janik [Incorporated by reference to Exhibit 10.24 to Douglas Dynamics, Inc.'s Registration Statement on Form S-1 (Registration No. 333-164590)]. | |
# | Amended and Restated Non-Qualified Option Agreement under Douglas Dynamics, Inc. 2004 Stock Incentive Plan between Douglas Dynamics, Inc. and James L. Janik, dated March 31, 2004 [Incorporated by reference to Exhibit 10.25 to Douglas Dynamics, Inc.'s Registration Statement on Form S-1 (Registration No. 333-164590)]. | ||
10.20 | |||
| # | Form of Second Amended and Restated Non-Qualified Option Agreement under Douglas Dynamics, Inc. Amended and Restated 2004 Stock Incentive Plan between Douglas Dynamics, Inc. and James L. Janik [Incorporated by reference to Exhibit 10.26 to Douglas Dynamics, Inc.'s Registration Statement on Form S-1 (Registration No. 333-164590)]. | ||
# | Form of Amended and Restated Deferred Stock Unit Agreement [Incorporated by reference to Exhibit 10.27 to Douglas Dynamics, Inc.'s Registration Statement on Form S-1 (Registration No. 333-164590) ]. | ||
# | Douglas Dynamics | ||
# | Douglas Dynamics, L.L.C. Long Term Incentive Plan 2009 [Incorporated by reference to Exhibit 10.30 to Douglas Dynamics, Inc.'s Registration Statement on Form S-1 (Registration No. 333-164590) ]. | ||
# | Douglas Dynamics, Inc. 2010 Stock Incentive Plan [Incorporated by reference to Exhibit 10.32 to Douglas Dynamics, Inc.'s Registration Statement on Form S-1 (Registration No. 333-164590) ]. | ||
# | Form of Restricted Stock Agreement under Douglas Dynamics, Inc. 2010 Stock Incentive Plan [Incorporated by reference to Exhibit 10.33 to Douglas Dynamics, Inc.'s Registration Statement on Form S-1 (Registration No. 333-164590)]. | ||
# | Alternative Form of Restricted Stock Agreement under Douglas Dynamics, Inc. 2010 Stock Incentive Plan [Incorporated by reference to Exhibit 10.34 to Douglas Dynamics, Inc.'s Registration Statement on Form S-1 (Registration No. 333-164590)]. | ||
# | Form of Restricted Stock Units Agreement under Douglas Dynamics, Inc. 2010 Stock Incentive Plan [Incorporated by reference to Exhibit 10.35 to Douglas Dynamics, Inc.'s Registration Statement on Form S-1 (Registration No. 333-164590)]. | ||
# | Form of Nonqualified Stock Option Agreement under Douglas Dynamics, Inc. 2010 Stock Incentive Plan [Incorporated by reference to Exhibit 10.36 to Douglas Dynamics, Inc.'s Registration Statement on Form S-1 (Registration No. 333-164590)]. | ||
# | Form of Incentive Stock Option Agreement under 2010 Stock Incentive Plan [Incorporated by reference to Exhibit 10.37 to Douglas Dynamics, Inc.'s Registration Statement on Form S-1 (Registration No. 333-164590)]. | ||
| Exhibit Number | Title | ||
|---|---|---|---|
| 10.30 | # | Form of Restricted Stock Grant Notice and Standard Terms and Conditions under the Douglas Dynamics, Inc. 2010 Stock Incentive Plan [Incorporated by reference to Exhibit 10.1 to Douglas Dynamics, Inc.'s Current Report on Form 8-K filed December 30, 2010 (File No. 001-34728)]. | |
# | Form of Restricted Stock Unit Grant Notice and Standard Terms and Conditions under the Douglas Dynamics, Inc. 2010 Stock Incentive Plan [Incorporated by reference to Exhibit 10.1 to Douglas Dynamics, Inc.'s Current Report on Form 8-K filed December 30, 2010 (File No. 001-34728)]. | ||
10.32 | |||
| # | Form of Nonemployee Director Restricted Stock Unit Grant Notice and Standard Terms and Conditions under the Douglas Dynamics, Inc. 2010 Stock Incentive Plan [Incorporated by reference to Exhibit 10.1 to Douglas Dynamics, Inc.'s Current Report on Form 8-K filed December 30, 2010 (File No. 001-34728)]. | ||
# | Form of Second Amended and Restated Joint Management Services Agreement among Douglas Dynamics, Inc., Douglas Dynamics, L.L.C., Aurora Management Partners LLC, and ACOF Management, L.P. [Incorporated by reference to Exhibit 10.42 to Douglas Dynamics, Inc.'s Registration Statement on Form S-1 (Registration No. 333-164590)]. | ||
# | Form of Director and Officer Indemnification Agreement [Incorporated by reference to Exhibit 10.43 to Douglas Dynamics, Inc.'s Registration Statement on Form S-1 (Registration No. 333-164590) ]. | ||
10.35 | # | Douglas Dynamics Nonqualified Deferred Compensation Plan [Incorporated by reference to Exhibit 10.34 to Douglas Dynamics, Inc.'s Annual Report on Form 10-K for the period ending December 31, 2011.] | |
10.36 | # | Form of Restricted Stock Unit Agreement under Douglas Dynamics, Inc. 2010 Stock Incentive Plan. [Incorporated by reference to Exhibit 10.36 to Douglas Dynamics, Inc.'s Annual Report on Form 10-K for the period ending December 31, 2012.] | |
10.37 | # | Form of Performance Share Unit Agreement under Douglas Dynamics, Inc. 2010 Stock Incentive Plan. [Incorporated by reference to Exhibit 10.37 to Douglas Dynamics, Inc.'s Annual Report on Form 10-K for the period ending December 31, 2012.] | |
10.38 | #* | Douglas Dynamics 2014 Annual Incentive Plan. | |
10.39 | Real Estate Purchase and Sale Agreement, dated May 6, 2013, by and between Dynamex Properties LLC and Acquisition Tango LLC [Incorporated by reference to Exhibit 10.1 to Douglas Dynamics, Inc.'s Current Report on Form 8-K filed May 6, 2013 (File No. 001-34728)]. | ||
10.40 | # | Form of Nonemployee Director Restricted Stock Unit Grant Notice and Standard Terms and Conditions under Douglas Dynamics, Inc. 2010 Stock Incentive Plan. [Incorporated by reference to Exhibit 10.4 to Douglas Dynamics, Inc.'s Quarterly Report on Form 10-Q for the Quarterly Period Ended March 31, 2013 (File No. 001-34728)]. | |
21.1 | * | Subsidiaries of Douglas Dynamics, Inc. | |
23.1 | * | Consent of Ernst & Young LLP. | |
31.1 | * | Certification of the Company's Chief Executive Officer pursuant to Section 302 of the Sarbanes-Oxley Act of | |
| Exhibit Number | Title | ||
|---|---|---|---|
| 31.2 | * | Certification of the Company's Chief Financial Officer pursuant to Section 302 of the Sarbanes-Oxley Act of | |
32.1 | * | Certification of | |
99.1 | Proxy Statement for the | ||
101.INS | XBRL Instance Document | ||
101.SCH | XBRL Taxonomy Extension Schema | ||
101.CAL | XBRL Taxonomy Extension Calculation Linkbase | ||
101.DEF | XBRL Taxonomy Extension Definition Linkbase | ||
101.LAB | XBRL Taxonomy Extension Label Linkbase | ||
101.PRE | XBRL Taxonomy Extension Presentation Linkbase | ||
Index to Consolidated Financial Statements
| | Page | |||
|---|---|---|---|---|
Consolidated Financial Statements | ||||
| F-2 | |||
| ||||
| ||||
Consolidated Statements of Comprehensive Income | F-7 | |||
Consolidated Statements of Changes in Shareholders' Equity | ||||
| ||||
| ||||
REPORT OF INDEPENDENT REGISTERED PUBLIC ACCOUNTING FIRMReport of Independent Registered Public Accounting Firm
The Board of Directors and Shareholders of Douglas Dynamics, Inc.
We have audited the accompanying consolidated balance sheets of Douglas Dynamics, Inc. (the Company) as of December 31, 20102013 and 2009,2012, and the related consolidated statements of income, comprehensive income, changes in shareholders' equity, and cash flows for each of the three years in the period ended December 31, 2010.2013. These financial statements are the responsibility of the Company's management. Our responsibility is to express an opinion on these financial statements based on our audits.
We conducted our audits in accordance with the standards of the Public Company Accounting Oversight Board (United States). Those standards require that we plan and perform the audit to obtain reasonable assurance about whether the financial statements are free of material misstatement. We were not engaged to perform an audit of the Company's internal control over financial reporting. Our audit included consideration of internal control over financial reporting as a basis for designing audit procedures that are appropriate in the circumstances, but not for the purpose of expressing an opinion on the effectiveness of the company's internal control over financial reporting. Accordingly, we express no such opinion. An audit also includes examining, on a test basis, evidence supporting the amounts and disclosures in the financial statements,statements. An audit also includes assessing the accounting principles used and significant estimates made by management, andas well as evaluating the overall financial statement presentation. We believe that our audits provide a reasonable basis for our opinion.
In our opinion, the financial statements referred to above present fairly, in all material respects, the consolidated financial position of Douglas Dynamics, Inc. at December 31, 20102013 and 2009,2012, and the consolidated results of its operations and its cash flows for each of the three years in the period ended December 31, 2010,2013, in conformity with U.S. generally accepted accounting principles.
/s/ ERNST & YOUNG LLP We also have audited, in accordance with the standards of the Public Company Accounting Oversight Board (United States), Douglas Dynamics, Inc.'s internal control over financial reporting as of December 31, 2013, based on criteria established inInternal Control—Integrated Framework issued by the Committee of Sponsoring Organizations of the Treadway Commission (1992 framework) and our report dated March 11, 2014 expressed an unqualified opinion thereon.
| /s/ Ernst & Young LLP |
Milwaukee, Wisconsin
March 8, 201111, 2014
Report of Independent Registered Public Accounting Firm
The Board of Directors and Shareholders of Douglas Dynamics, Inc.
We have audited Douglas Dynamics, Inc.'s internal control over financial reporting as of December 31, 2013, based on criteria established inInternal Control—Integrated Framework issued by the Committee of Sponsoring Organizations of the Treadway Commission (1992 framework) (the COSO criteria). Douglas Dynamics, Inc.'s management is responsible for maintaining effective internal control over financial reporting, and for its assessment of the effectiveness of internal control over financial reporting included in the accompanying Management's Report on Internal Control over Financial Reporting. Our responsibility is to express an opinion on the company's internal control over financial reporting based on our audit.
We conducted our audit in accordance with the standards of the Public Company Accounting Oversight Board (United States). Those standards require that we plan and perform the audit to obtain reasonable assurance about whether effective internal control over financial reporting was maintained in all material respects. Our audit included obtaining an understanding of internal control over financial reporting, assessing the risk that a material weakness exists, testing and evaluating the design and operating effectiveness of internal control based on the assessed risk, and performing such other procedures as we considered necessary in the circumstances. We believe that our audit provides a reasonable basis for our opinion.
A company's internal control over financial reporting is a process designed to provide reasonable assurance regarding the reliability of financial reporting and the preparation of financial statements for external purposes in accordance with generally accepted accounting principles. A company's internal control over financial reporting includes those policies and procedures that (1) pertain to the maintenance of records that, in reasonable detail, accurately and fairly reflect the transactions and dispositions of the assets of the company; (2) provide reasonable assurance that transactions are recorded as necessary to permit preparation of financial statements in accordance with generally accepted accounting principles, and that receipts and expenditures of the company are being made only in accordance with authorizations of management and directors of the company; and (3) provide reasonable assurance regarding prevention or timely detection of unauthorized acquisition, use or disposition of the company's assets that could have a material effect on the financial statements.
Because of its inherent limitations, internal control over financial reporting may not prevent or detect misstatements. Also, projections of any evaluation of effectiveness to future periods are subject to the risk that controls may become inadequate because of changes in conditions, or that the degree of compliance with the policies or procedures may deteriorate.
As indicated in the accompanying Management's Report on Internal Control over Financial Reporting, management's assessment of and conclusion on the effectiveness of internal control over financial reporting did not include the internal controls of TrynEx, Inc., which is included in the 2013 consolidated financial statements of Douglas Dynamics, Inc. and constituted 8.6% and 15.1% of total and net assets, respectively, as of December 31, 2013 and 6.6% and (19.0)% of net sales and net income, respectively, for the year then ended. Our audit of internal control over financial reporting of Douglas Dynamics, Inc. also did not include an evaluation of the internal control over financial reporting of TrynEx, Inc.
In our opinion, Douglas Dynamics, Inc. maintained, in all material respects, effective internal control over financial reporting as of December 31, 2013, based on the COSO criteria.
We also have audited, in accordance with the standards of the Public Company Accounting Oversight Board (United States), the consolidated balance sheets of Douglas Dynamics, Inc. as of December 31, 2013 and 2012, and the related consolidated statements of income, comprehensive income, changes in shareholders' equity and cash flows for each of the three years in the period ended December 31, 2013 and our report dated March 11, 2014, expressed an unqualified opinion thereon.
| /s/ Ernst & Young LLP |
Milwaukee, Wisconsin
March 11, 2014
DOUGLAS DYNAMICS, INC.
CONSOLIDATED BALANCE SHEETS
(Dollars In Thousands, Except Per Share Data)
| | | December 31, 2010 | December 31, 2009 | December 31, 2013 | December 31, 2012 | ||||||||||
|---|---|---|---|---|---|---|---|---|---|---|---|---|---|---|---|
Assets | Assets | ||||||||||||||
Current assets: | Current assets: | ||||||||||||||
Cash and cash equivalents | $ | 19,864 | $ | 24,136 | |||||||||||
Accounts receivable, net | 42,343 | 25,425 | |||||||||||||
Inventories | 27,977 | 30,292 | |||||||||||||
Refundable income taxes paid | 2,648 | 4,870 | |||||||||||||
Deferred income taxes | 4,223 | 3,710 | |||||||||||||
Prepaid and other current assets | 1,317 | 1,149 | |||||||||||||
Cash and cash equivalents | $ | 20,149 | $ | 69,073 | |||||||||||
Accounts receivable, net | 37,040 | 32,172 | |||||||||||||
Inventories | 23,481 | 26,697 | |||||||||||||
Deferred income taxes | 7,142 | 3,729 | |||||||||||||
Prepaid income taxes | 29 | — | |||||||||||||
Prepaid management fees-related party | — | 417 | |||||||||||||
Prepaid and other current assets | 1,131 | 1,446 | |||||||||||||
| | | | | | | ||||||||||
Total current assets | Total current assets | 88,972 | 133,534 | 98,372 | 89,582 | ||||||||||
Property, plant, and equipment, net | 21,962 | 26,661 | |||||||||||||
Property, plant and equipment, net | 24,866 | 19,887 | |||||||||||||
Assets held for sale | Assets held for sale | 1,779 | — | 1,085 | 1,732 | ||||||||||
Goodwill | Goodwill | 107,222 | 107,222 | 113,132 | 107,222 | ||||||||||
Other intangible assets, net | Other intangible assets, net | 126,948 | 132,950 | 123,422 | 116,548 | ||||||||||
Deferred financing costs, net | Deferred financing costs, net | 953 | 3,311 | 2,216 | 2,794 | ||||||||||
Other long-term assets | Other long-term assets | 207 | 941 | 1,246 | 606 | ||||||||||
| | | | | | | ||||||||||
Total assets | Total assets | $ | 348,043 | $ | 404,619 | $ | 364,339 | $ | 338,371 | ||||||
Liabilities, redeemable stock and stockholders' equity | |||||||||||||||
| | | | | | | ||||||||||
| | | | | | | ||||||||||
Liabilities and shareholders' equity | |||||||||||||||
Current liabilities: | Current liabilities: | ||||||||||||||
Accounts payable | $ | 7,709 | $ | 5,370 | |||||||||||
Accrued expenses and other current liabilities | 14,418 | 10,329 | |||||||||||||
Short-term borrowings | 13,000 | — | |||||||||||||
Current portion of long-term debt | 971 | 971 | |||||||||||||
Accounts payable | $ | 2,847 | $ | 5,170 | |||||||||||
Accrued expenses and other current liabilities | 11,923 | 12,598 | |||||||||||||
Accrued interest | 23 | 5,367 | |||||||||||||
Income taxes payable | — | 1,202 | |||||||||||||
Current portion of long-term debt | 1,183 | 850 | |||||||||||||
| | | | | | | ||||||||||
Total current liabilities | Total current liabilities | 15,976 | 25,187 | 36,098 | 16,670 | ||||||||||
Retiree health benefit obligation | Retiree health benefit obligation | 7,235 | 7,848 | 4,654 | 6,541 | ||||||||||
Pension obligation | Pension obligation | 10,753 | 8,957 | 7,077 | 14,401 | ||||||||||
Deferred income taxes | Deferred income taxes | 22,650 | 18,913 | 45,046 | 33,805 | ||||||||||
Deferred compensation | Deferred compensation | 1,067 | 1,482 | 658 | 756 | ||||||||||
Long-term debt, less current portion | Long-term debt, less current portion | 119,971 | 231,813 | 110,023 | 110,995 | ||||||||||
Other long-term liabilities | Other long-term liabilities | 898 | 2,195 | 5,462 | 1,471 | ||||||||||
Redeemable preferred stock—Series A, par value $0.01, 65,000 shares authorized, no shares outstanding at December 31, 2010 and December 31, 2009 | — | — | |||||||||||||
Redeemable preferred stock—Series B, par value $0.01, no shares outstanding at December 31, 2010 and one share outstanding at December 31, 2009 | — | 1 | |||||||||||||
Redeemable preferred stock—Series C, par value $0.01, no shares outstanding at December 31, 2010 and one share outstanding at December 31, 2009 | — | 1 | |||||||||||||
Stockholders' equity: | |||||||||||||||
Shareholders' equity: | |||||||||||||||
Common Stock, par value $0.01, 200,000,000 shares authorized, 22,223,454 and 22,130,996 shares issued and outstanding at December 31, 2013 and December 31, 2012, respectively | 222 | 221 | |||||||||||||
Additional paid-in capital | 135,498 | 133,072 | |||||||||||||
Retained earnings | 20,463 | 27,523 | |||||||||||||
Accumulated other comprehensive loss, net of tax | (862 | ) | (7,084 | ) | |||||||||||
Common Stock, par value $0.01, 200,000,000 and 23,750,000 shares authorized at December 31, 2010 and December 31, 2009, respectively, 21,579,655 and 14,421,736 shares issued and outstanding at December 31, 2010 and December 31, 2009, respectively | 216 | 144 | |||||||||||||
| | | | | | | ||||||||||
Total shareholders' equity | 155,321 | 153,732 | |||||||||||||
Additional paid-in capital | 127,695 | 59,973 | |||||||||||||
| | | | | | | ||||||||||
Total liabilities and shareholders' equity | $ | 364,339 | $ | 338,371 | |||||||||||
Stockholders' notes receivable | (482 | ) | (1,013 | ) | |||||||||||
| | | | | | | ||||||||||
| | | | | | | ||||||||||
Retained earnings | 46,495 | 53,055 | |||||||||||||
Accumulated other comprehensive loss, net of tax | (4,431 | ) | (3,937 | ) | |||||||||||
Total stockholders' equity | 169,493 | 108,222 | |||||||||||||
Total liabilities, redeemable stock and stockholders' equity | $ | 348,043 | $ | 404,619 | |||||||||||
See accompanying Notes to Consolidated Financial Statements
DOUGLAS DYNAMICS, INC.
CONSOLIDATED STATEMENTS OF INCOME
(In Thousands, Except Per Share Data)
| Years ended December 31, | |||||||||||||||||||||
|---|---|---|---|---|---|---|---|---|---|---|---|---|---|---|---|---|---|---|---|---|---|
| | | 2010 | 2009 | 2008 | 2013 | 2012 | 2011 | ||||||||||||||
Net sales | Net sales | $ | 176,795 | $ | 174,342 | $ | 180,108 | $ | 194,320 | $ | 140,033 | $ | 208,798 | ||||||||
Cost of sales | Cost of sales | 116,494 | 117,264 | 117,911 | 128,670 | 96,070 | 136,981 | ||||||||||||||
| | | | | | | | | ||||||||||||||
Gross profit | Gross profit | 60,301 | 57,078 | 62,197 | 65,650 | 43,963 | 71,817 | ||||||||||||||
Selling, general, and administrative expense | Selling, general, and administrative expense | 26,509 | 20,085 | 19,032 | 31,872 | 19,895 | 26,435 | ||||||||||||||
Intangibles amortization | Intangibles amortization | 6,001 | 6,161 | 6,160 | 5,625 | 5,199 | 5,201 | ||||||||||||||
Management fees-related party | 6,383 | 1,393 | 1,369 | ||||||||||||||||||
Impairment of assets held for sale | 647 | — | — | ||||||||||||||||||
| | | | | | | | | ||||||||||||||
Income from operations | Income from operations | 21,408 | 29,439 | 35,636 | 27,506 | 18,869 | 40,181 | ||||||||||||||
Interest expense, net | Interest expense, net | (10,943 | ) | (15,520 | ) | (17,299 | ) | (8,328 | ) | (8,393 | ) | (8,918 | ) | ||||||||
Loss on extinguishment of debt | Loss on extinguishment of debt | (7,967 | ) | — | — | — | — | (673 | ) | ||||||||||||
Other income (expense), net | 36 | (90 | ) | (73 | ) | ||||||||||||||||
Other expense, net | (161 | ) | (320 | ) | (218 | ) | |||||||||||||||
| | | | | | | | | ||||||||||||||
Income before taxes | Income before taxes | 2,534 | 13,829 | 18,264 | 19,017 | 10,156 | 30,372 | ||||||||||||||
Income tax expense | Income tax expense | 872 | 3,986 | 6,793 | 7,378 | 4,144 | 11,332 | ||||||||||||||
| | | | | | | | | ||||||||||||||
Net income | Net income | $ | 1,662 | $ | 9,843 | $ | 11,471 | $ | 11,639 | $ | 6,012 | $ | 19,040 | ||||||||
| | | | | | | | | ||||||||||||||
Less: Net income attributable to participating securities | Less: Net income attributable to participating securities | 12 | — | — | 179 | 69 | 233 | ||||||||||||||
| �� | |||||||||||||||||||||
| | | | | | | | | ||||||||||||||
Net income attributable to common shareholders | Net income attributable to common shareholders | $ | 1,650 | $ | 9,843 | $ | 11,471 | $ | 11,460 | $ | 5,943 | $ | 18,807 | ||||||||
| | | | | | | | | ||||||||||||||
| | | | | | | | | ||||||||||||||
Earnings per share: | Earnings per share: | ||||||||||||||||||||
Basic earnings per common share attributable to common shareholders | $ | 0.09 | $ | 0.68 | $ | 0.79 | |||||||||||||||
Earnings per common share assuming dilution attributable to common shareholders | $ | 0.09 | $ | 0.67 | $ | 0.77 | |||||||||||||||
Basic earnings per common share attributable to common shareholders | $ | 0.52 | $ | 0.27 | $ | 0.87 | |||||||||||||||
Earnings per common share assuming dilution attributable to common shareholders | $ | 0.51 | $ | 0.26 | $ | 0.85 | |||||||||||||||
Cash dividends declared and paid per share | Cash dividends declared and paid per share | $ | 0.38 | $ | 0.00 | $ | 0.00 | $ | 0.84 | $ | 0.82 | $ | 1.18 | ||||||||
See accompanying Notes to Consolidated Financial Statements
CONSOLIDATED STATEMENTS OF CHANGES IN SHAREHOLDERS' EQUITY
(Dollars In Thousands)
| | Redeemable Securities | | | | | | | | | |||||||||||||||||||||||||||||||||||
|---|---|---|---|---|---|---|---|---|---|---|---|---|---|---|---|---|---|---|---|---|---|---|---|---|---|---|---|---|---|---|---|---|---|---|---|---|---|---|---|---|---|---|---|---|
| | Series A Redeemable Preferred Stock | Series B Redeemable Preferred | Series C Redeemable Preferred | | | | | | | | | |||||||||||||||||||||||||||||||||
| | Common Stock | | | | Accumulated Other Comprehensive Loss | | | |||||||||||||||||||||||||||||||||||||
| | Additional Paid-in Capital | Stockholders' Notes Receivable | Retained Earnings | | Comprehensive Income (Loss) | |||||||||||||||||||||||||||||||||||||||
| | Shares | Dollars | Shares | Dollars | Shares | Dollars | Shares | Dollars | Total | |||||||||||||||||||||||||||||||||||
Balance at January 1, 2008 | — | $ | — | 1 | $ | 1 | 1 | $ | 1 | 14,618,861 | $ | 146 | $ | 62,153 | $ | (1,742 | ) | $ | 31,855 | $ | (468 | ) | $ | 91,944 | ||||||||||||||||||||
Net income | — | — | — | — | — | — | — | — | — | — | 11,471 | — | 11,471 | $ | 11,471 | |||||||||||||||||||||||||||||
Adjustment for pension and postretirement benefit liability, net of tax of $1,913 | — | — | — | — | — | — | — | — | — | — | — | (2,449 | ) | (2,449 | ) | (2,449 | ) | |||||||||||||||||||||||||||
Change in pension measurement date, net of tax of $964 | — | — | — | — | — | — | — | — | — | — | (114 | ) | (1,642 | ) | (1,756 | ) | — | |||||||||||||||||||||||||||
Interest on stockholders' notes receivable | — | — | — | — | — | — | — | — | — | (77 | ) | — | — | (77 | ) | — | ||||||||||||||||||||||||||||
Stock repurchases and retirement | — | — | — | — | — | — | (164,493 | ) | (2 | ) | (1,775 | ) | 703 | — | — | (1,074 | ) | — | ||||||||||||||||||||||||||
Balance at December 31, 2008 | — | — | 1 | 1 | 1 | 1 | 14,454,369 | 144 | 60,378 | (1,116 | ) | 43,212 | (4,559 | ) | 98,059 | $ | 9,022 | |||||||||||||||||||||||||||
Net income | — | — | — | — | — | — | — | — | — | — | 9,843 | — | 9,843 | $ | 9,843 | |||||||||||||||||||||||||||||
Adjustment for pension and postretirement benefit liability, net of tax of $365 | — | — | — | — | — | — | — | — | — | — | — | 622 | 622 | 622 | ||||||||||||||||||||||||||||||
Interest on stockholders' notes receivable | — | — | — | — | — | — | — | — | — | (34 | ) | — | — | (34 | ) | — | ||||||||||||||||||||||||||||
Stock repurchases and retirement | — | — | — | — | — | — | (32,633 | ) | — | (405 | ) | 137 | — | — | (268 | ) | — | |||||||||||||||||||||||||||
Balance at December 31, 2009 | — | $ | — | 1 | $ | 1 | 1 | $ | 1 | 14,421,736 | $ | 144 | $ | 59,973 | $ | (1,013 | ) | $ | 53,055 | $ | (3,937 | ) | $ | 108,222 | $ | 10,465 | ||||||||||||||||||
Net income | — | — | — | — | — | — | — | — | — | — | 1,662 | — | 1,662 | $ | 1,662 | |||||||||||||||||||||||||||||
Dividends paid | — | — | — | — | — | — | — | — | — | — | (8,222 | ) | — | (8,222 | ) | — | ||||||||||||||||||||||||||||
Adjustment for pension and postretirement benefit liability, net of tax of $327 | — | — | — | — | — | — | — | — | — | — | — | (494 | ) | (494 | ) | (494 | ) | |||||||||||||||||||||||||||
Interest on stockholders' notes receivable | — | — | — | — | — | — | — | — | — | (28 | ) | — | — | (28 | ) | — | ||||||||||||||||||||||||||||
Issuance and sales of common stock by Company through IPO | — | — | — | — | — | — | 6,500,000 | 65 | 63,864 | — | — | — | 63,929 | — | ||||||||||||||||||||||||||||||
Issuance of non-vested common stock in connection with IPO | — | — | — | — | — | — | 208,130 | 2 | (2 | ) | — | — | — | 0 | — | |||||||||||||||||||||||||||||
Shares issued for options exercised in connection with IPO | — | — | — | — | — | — | 180,567 | 2 | 1,659 | — | — | — | 1,661 | — | ||||||||||||||||||||||||||||||
Fractional shares repurchased and retired in connection with IPO | — | — | — | — | — | — | (7 | ) | — | — | — | — | — | — | — | |||||||||||||||||||||||||||||
Stock repurchases and retirement | — | — | (1 | ) | (1 | ) | (1 | ) | (1 | ) | 559 | — | 559 | — | ||||||||||||||||||||||||||||||
Deferred stock units converted | — | — | — | — | — | — | 174,229 | 2 | (2 | ) | — | — | — | (0 | ) | — | ||||||||||||||||||||||||||||
Stock option exercises | — | — | — | — | — | — | 95,000 | 1 | 1,067 | |||||||||||||||||||||||||||||||||||
Stock based compensation | — | — | — | — | — | — | — | — | 1,136 | — | — | — | 1,136 | — | ||||||||||||||||||||||||||||||
Balance at December 31, 2010 | — | $ | — | — | $ | — | — | $ | — | 21,579,655 | $ | 216 | $ | 127,695 | $ | (482 | ) | $ | 46,495 | $ | (4,431 | ) | $ | 169,493 | $ | 1,168 | ||||||||||||||||||
See accompanying Notes to Consolidated Financial Statements
DOUGLAS DYNAMICS, INC.
CONSOLIDATED STATEMENTS OF COMPREHENSIVE INCOME
(In Thousands)
| | Years ended December 31, | |||||||||
|---|---|---|---|---|---|---|---|---|---|---|
| | 2013 | 2012 | 2011 | |||||||
Net income | $ | 11,639 | $ | 6,012 | $ | 19,040 | ||||
Adjustment for pension and postretirement benefit liability, net of tax of ($3,838) in 2013, ($219) in 2012 and $1,560 in 2011 | 6,062 | 349 | (2,658 | ) | ||||||
Adjustment for interest rate swap, net of tax of ($102) in 2013, ($30) in 2012, and $230 in 2011 | 160 | 47 | (391 | ) | ||||||
| | | | | | | | | | | |
Comprehensive income | $ | 17,861 | $ | 6,408 | $ | 15,991 | ||||
| | | | | | | | | | | |
| | | | | | | | | | | |
See accompanying Notes to Consolidated Financial Statements
DOUGLAS DYNAMICS, INC.
CONSOLIDATED STATEMENTS OF CHANGES IN SHAREHOLDERS' EQUITY
(Dollars In Thousands)
| | Common Stock | | | | Accumulated Other Comprehensive Loss | | ||||||||||||||||
|---|---|---|---|---|---|---|---|---|---|---|---|---|---|---|---|---|---|---|---|---|---|---|
| | Additional Paid-in Capital | Shareholders' Notes Receivable | Retained Earnings | | ||||||||||||||||||
| | Shares | Dollars | Total | |||||||||||||||||||
Balance at December 31, 2010 | 21,579,655 | $ | 216 | $ | 127,695 | $ | (482 | ) | $ | 46,495 | $ | (4,431 | ) | $ | 169,493 | |||||||
| | | | | | | | | | | | | | | | | | | | | | | |
Net income | — | — | — | — | 19,040 | — | 19,040 | |||||||||||||||
Dividends paid | — | — | — | — | (25,793 | ) | — | (25,793 | ) | |||||||||||||
Adjustment for pension and postretirement benefit liability, net of tax of $1,560 | — | — | — | — | — | (2,658 | ) | (2,658 | ) | |||||||||||||
Adjustment for interest rate swap, net of tax of $230 | — | — | — | — | — | (391 | ) | (391 | ) | |||||||||||||
Interest on shareholders' notes receivable | — | — | — | (7 | ) | — | — | (7 | ) | |||||||||||||
Repayment of shareholders' note receivable | — | — | — | 489 | — | — | 489 | |||||||||||||||
Shares issued for options exercised | 319,383 | 3 | 1,340 | — | — | — | 1,343 | |||||||||||||||
Stock based compensation | 121,656 | 1 | 1,872 | — | — | — | 1,873 | |||||||||||||||
| | | | | | | | | | | | | | | | | | | | | | | |
Balance at December 31, 2011 | 22,020,694 | $ | 220 | $ | 130,907 | $ | — | $ | 39,742 | $ | (7,480 | ) | $ | 163,389 | ||||||||
| | | | | | | | | | | | | | | | | | | | | | | |
Net income | — | — | — | — | 6,012 | — | 6,012 | |||||||||||||||
Dividends paid | — | — | — | — | (18,231 | ) | — | (18,231 | ) | |||||||||||||
Adjustment for pension and postretirement benefit liability, net of tax of ($219) | — | — | — | — | — | 349 | 349 | |||||||||||||||
Adjustment for interest rate swap, net of tax of ($30) | — | — | — | — | — | 47 | 47 | |||||||||||||||
Stock based compensation | 110,302 | 1 | 2,165 | — | — | — | 2,166 | |||||||||||||||
| | | | | | | | | | | | | | | | | | | | | | | |
Balance at December 31, 2012 | 22,130,996 | $ | 221 | $ | 133,072 | $ | — | $ | 27,523 | $ | (7,084 | ) | $ | 153,732 | ||||||||
| | | | | | | | | | | | | | | | | | | | | | | |
Net income | — | — | — | — | 11,639 | — | 11,639 | |||||||||||||||
Dividends paid | — | — | — | — | (18,699 | ) | — | (18,699 | ) | |||||||||||||
Adjustment for pension and postretirement benefit liability, net of tax of ($3,838) | — | — | — | — | — | 6,062 | 6,062 | |||||||||||||||
Adjustment for interest rate swap, net of tax of ($102) | — | — | — | — | — | 160 | 160 | |||||||||||||||
Shares withheld on restricted stock vesting | — | — | (160 | ) | — | — | — | (160 | ) | |||||||||||||
Stock based compensation | 92,458 | 1 | 2,586 | — | — | — | 2,587 | |||||||||||||||
| | | | | | | | | | | | | | | | | | | | | | | |
Balance at December 31, 2013 | 22,223,454 | $ | 222 | $ | 135,498 | $ | — | $ | 20,463 | $ | (862 | ) | $ | 155,321 | ||||||||
| | | | | | | | | | | | | | | | | | | | | | | |
| | | | | | | | | | | | | | | | | | | | | | | |
See accompanying Notes to Consolidated Financial Statements
DOUGLAS DYNAMICS, INC.
CONSOLIDATED STATEMENTS OF CASH FLOWS
(In Thousands)
| Years ended December 31, | |||||||||||||||||||||
|---|---|---|---|---|---|---|---|---|---|---|---|---|---|---|---|---|---|---|---|---|---|
| | | 2010 | 2009 | 2008 | 2013 | 2012 | 2011 | ||||||||||||||
Operating activities | Operating activities | ||||||||||||||||||||
Net income | Net income | $ | 1,662 | $ | 9,843 | $ | 11,471 | $ | 11,639 | $ | 6,012 | $ | 19,040 | ||||||||
Adjustments to reconcile net income to net cash provided by operating activities: | Adjustments to reconcile net income to net cash provided by operating activities: | ||||||||||||||||||||
Depreciation and amortization | 8,693 | 8,018 | 8,176 | ||||||||||||||||||
Amortization of deferred financing costs and debt discount | 758 | 955 | 832 | ||||||||||||||||||
Loss on extinguishment of debt | — | — | 673 | ||||||||||||||||||
Loss recognized on impairment of assets held for sale | 647 | — | — | ||||||||||||||||||
Stock-based compensation | 2,587 | 2,166 | 1,873 | ||||||||||||||||||
Provision for losses on accounts receivable | 329 | 259 | 47 | ||||||||||||||||||
Deferred income taxes | 10,728 | 8,090 | 6,497 | ||||||||||||||||||
Earnout liability | 3,951 | — | — | ||||||||||||||||||
Changes in operating assets and liabilities: | |||||||||||||||||||||
Accounts receivable | (16,643 | ) | 8,335 | 2,974 | |||||||||||||||||
Inventories | 6,445 | (6,287 | ) | (524 | ) | ||||||||||||||||
Prepaid and other assets and refundable income taxes | 1,717 | (5,459 | ) | 201 | |||||||||||||||||
Accounts payable | 1,559 | 330 | 2,193 | ||||||||||||||||||
Accrued expenses and other current liabilities | 2,885 | (6,171 | ) | 4,554 | |||||||||||||||||
Deferred compensation | (98 | ) | (156 | ) | (155 | ) | |||||||||||||||
Benefit obligations and other long-term liabilities | (2,949 | ) | (473 | ) | 1,347 | ||||||||||||||||
Depreciation and amortization | 11,705 | 11,958 | 10,810 | ||||||||||||||||||
Amortization of deferred financing costs and debt discount | 872 | 1,209 | 1,138 | ||||||||||||||||||
Loss on extinguishment of debt | 7,967 | — | — | ||||||||||||||||||
Stock-based compensation | 4,029 | 732 | — | ||||||||||||||||||
Provision for losses on accounts receivable | 445 | 133 | 81 | ||||||||||||||||||
Deferred income taxes | 641 | 1,810 | 3,946 | ||||||||||||||||||
Changes in operating assets and liabilities: | |||||||||||||||||||||
Accounts receivable | (5,313 | ) | (3,717 | ) | (1,182 | ) | |||||||||||||||
Inventories | 3,216 | 2,105 | (11,716 | ) | |||||||||||||||||
Prepaid and other assets and prepaid income taxes | 1,437 | (776 | ) | 4,105 | |||||||||||||||||
Accounts payable | (2,323 | ) | 218 | 335 | |||||||||||||||||
Accrued expenses and other current liabilities | (7,201 | ) | 1,127 | 4,476 | |||||||||||||||||
Deferred compensation | (415 | ) | (162 | ) | (45 | ) | |||||||||||||||
Benefit obligations and other long-term liabilities | (945 | ) | 1,091 | (8 | ) | ||||||||||||||||
| | | | | | | | | ||||||||||||||
Net cash provided by operating activities | Net cash provided by operating activities | 15,777 | 25,571 | 23,411 | 32,248 | 15,619 | 47,728 | ||||||||||||||
Investing activities | Investing activities | ||||||||||||||||||||
Capital expenditures | Capital expenditures | (3,009 | ) | (8,200 | ) | (3,160 | ) | (2,775 | ) | (1,446 | ) | (2,373 | ) | ||||||||
Proceeds from sale of equipment | Proceeds from sale of equipment | 226 | — | 47 | — | 80 | 67 | ||||||||||||||
Acquisition of Trynex | (26,734 | ) | — | — | |||||||||||||||||
| | | | | | | | | ||||||||||||||
Net cash used in investing activities | Net cash used in investing activities | (2,783 | ) | (8,200 | ) | (3,113 | ) | (29,509 | ) | (1,366 | ) | (2,306 | ) | ||||||||
Financing activities | Financing activities | ||||||||||||||||||||
Stock repurchases | (166 | ) | (1,000 | ) | (1,101 | ) | |||||||||||||||
Payment of call premium and post payoff interest on senior notes redemption | (3,876 | ) | — | — | |||||||||||||||||
Collection of stockholders' notes receivable | 531 | — | — | ||||||||||||||||||
Shares withheld on restricted stock vesting paid for employees' taxes | (160 | ) | — | — | |||||||||||||||||
Proceeds from exercise of stock options | — | — | 1,343 | ||||||||||||||||||
Collection of shareholders' notes receivable | — | — | 482 | ||||||||||||||||||
Payments of financing costs | Payments of financing costs | (2,605 | ) | — | (314 | ) | — | (168 | ) | (3,471 | ) | ||||||||||
Proceeds from initial public offering, net | 63,929 | — | — | ||||||||||||||||||
Borrowings on long-term debt | Borrowings on long-term debt | 40,000 | — | — | — | — | 123,750 | ||||||||||||||
Dividends paid | Dividends paid | (8,222 | ) | — | — | (18,699 | ) | (18,231 | ) | (25,793 | ) | ||||||||||
Revolver borrowings | 13,000 | — | — | ||||||||||||||||||
Repayment of long-term debt | Repayment of long-term debt | (151,509 | ) | (850 | ) | (850 | ) | (1,152 | ) | (11,150 | ) | (122,450 | ) | ||||||||
| | | | | | | | | ||||||||||||||
Net cash used in financing activities | Net cash used in financing activities | (61,918 | ) | (1,850 | ) | (2,265 | ) | (7,011 | ) | (29,549 | ) | (26,139 | ) | ||||||||
| | | | | | | | | ||||||||||||||
Change in cash and cash equivalents | Change in cash and cash equivalents | (48,924 | ) | 15,521 | 18,033 | (4,272 | ) | (15,296 | ) | 19,283 | |||||||||||
Cash and cash equivalents at beginning of year | Cash and cash equivalents at beginning of year | 69,073 | 53,552 | 35,519 | 24,136 | 39,432 | 20,149 | ||||||||||||||
| | | | | | | | | ||||||||||||||
Cash and cash equivalents at end of year | Cash and cash equivalents at end of year | $ | 20,149 | $ | 69,073 | $ | 53,552 | $ | 19,864 | $ | 24,136 | $ | 39,432 | ||||||||
| | | | | | | | | ||||||||||||||
| | | | | | | | | ||||||||||||||
Supplemental disclosure of cash flow information | Supplemental disclosure of cash flow information | ||||||||||||||||||||
Income Taxes Paid | $ | 1,663 | $ | 1,895 | $ | 2,832 | |||||||||||||||
Interest Paid | $ | 16,886 | $ | 14,410 | $ | 16,730 | |||||||||||||||
Income taxes paid | $ | 2,355 | $ | 1,558 | $ | 2,479 | |||||||||||||||
Interest paid | $ | 7,597 | $ | 7,435 | $ | 7,767 | |||||||||||||||
See accompanying Notes to Consolidated Financial Statements
Douglas Dynamics, Inc.
Notes to Consolidated Financial Statements
Years ended December 31, 2010, 20092013, 2012 and 20082011
(Dollars in Thousands Except Share and Per Share Data)
1. Description of business and basis of presentation
Douglas Dynamics, Inc., (the "Company") is the North American leader in the design, manufacture and sale of snow and ice control equipment for light trucks, which is comprised of snowplows and sand and salt spreaders, and related parts and accessories. The Company's snow and ice control products are sold through a network of over 7202,100 points of sale. Direct points of shipment are predominantly through North American truck equipment and lawn care equipment distributors. Most of our distributors that purchase directly from the Company and are located throughout the snowbeltsnow belt regions in North America (primarily the Midwest, East and Northeast regions of the United States as well as all provinces of Canada). The Company sells its products under the WESTERN®, FISHER®, BLIZZARD®, SNOWEX®, TURFEX® and BLIZZARD® brands.SWEEPEX® brands which are among the most established and recognized in the industry. The Company is headquartered in Milwaukee, WI and currently has manufacturing facilities in Milwaukee, WI, Rockland, ME, and Rockland, ME.Madison Heights, MI. The Company closed its Johnson City, TN facility in August 2010.2010 which it currently is holding for sale. The Company operates as a single segment.
All share and per share data reported herein have been retrospectively restated to reflect the 23.75-for-one stock split of the Company's common stock that occurred on May 7, 2010, immediately prior to the consummation of the Company's initial public offering ("IPO").
On May 10, 2010, the Company completed its IPO of 10,000,000 shares of common stock at a public offering price of $11.25 per share, less underwriting discounts. The 10,000,000 shares sold included 6,500,000 shares sold by the Company and 3,500,000 shares sold by certain selling stockholders. In addition, on May 14, 2010, the selling stockholders in the IPO closed the sale of an additional 1,500,000 shares to the underwriters at the public offering price of $11.25 per share, less underwriting discounts, pursuant to the underwriters' exercise in full of their overallotment option. The Company received $73,125 in gross proceeds from the issuance and sale of its common stock in the IPO and $63,929 in net proceeds after deducting underwriting discounts and total expenses related to the offering. The Company did not receive any proceeds from the sale of its stock by the selling stockholders in the IPO.
Capitalization summary upon closing of IPO:
| ||||
| ||||
| ||||
| ||||
| ||||
| ||||
Concurrent with the closing of the IPO, the Company repurchased its one issued and outstanding share of Series B preferred stock and one issued and outstanding share of Series C preferred stock, each at a price of $1,000 per share. Subsequent to the repurchase of the preferred stock, the Company has no preferred stock outstanding.
Douglas Dynamics, Inc.
Notes to Consolidated Financial Statements (Continued)
Years ended December 31, 2010, 2009 and 2008
(in Thousands Except Share and Per Share Data)
2. Summary of Significant Accounting Policies
Principles of consolidation
The accompanying consolidated financial statements include the accounts of Douglas Dynamics, Inc. and its direct wholly-owned subsidiary, Douglas Dynamics, L.L.C., and its indirect wholly-owned subsidiaries, Douglas Dynamics Finance Company (an inactive subsidiary) and Fisher, LLC (hereinafter collectively referred to as the "Company"). All intercompany balances and transactions have been eliminated in consolidation.
Use of estimates
The preparation of the financial statements in conformity with U.S. generally accepted accounting principles requires management to make estimates and assumptions that affect the reported amounts of assets and liabilities and disclosure of contingent assets and liabilities at the date of the financial statements and the reported amounts of revenues and expenses during the reporting periods. Accordingly, actual results could differ from those estimates.
Cash and Cash Equivalents
The Company considers all highly liquid investments purchased with an original maturity of three months or less to be cash equivalents. Cash equivalents are carried at cost, which approximates fair value.
Accounts receivable and allowance for doubtful accounts
The Company carries its accounts receivable at their face amount less an allowance for doubtful accounts. The majority of the Company's accounts receivable are due from distributors of truck equipment. Credit is extended based on an evaluation of a customer's financial condition. On a periodic basis, the Company evaluates its accounts receivable and establishes the allowance for doubtful accounts based on a combination of specific customer circumstances and credit conditions based on a history of write-offs and collections. A receivable is considered past due if payments have not been
Douglas Dynamics, Inc.
Notes to Consolidated Financial Statements (Continued)
Years ended December 31, 2013, 2012 and 2011
(Dollars in Thousands Except Per Share Data)
2. Summary of Significant Accounting Policies (Continued)
received within agreed upon invoice terms. Accounts receivable are written off after all collection efforts have been exhausted. The Company takes a security interest in the inventory as collateral for the receivable but often does not have a priority security interest.
Financing program
The Company is party to a financing program in which certain distributors may elect to finance their purchases from the Company through a third party financing company. The Company provides the third party financing company recourse against the Company regarding the collectability of the receivable under the program due to the fact that if the third party financing company is unable to collect from the distributor the amounts due in respect of the product financed, the Company would be obligated to repurchase any remaining inventory related to the product financed and reimburse any legal fees incurred by the financing company. During the years ended December 31, 2010, 20092013, 2012 and 2008,2011, distributors financed purchases of $1,696, $3,269$2,926, $1,579 and $3,462$2,752 through this financing program, respectively. ThereAt both December 31, 2013 and December 31, 2012, there were no$0 of uncollectible outstanding or uncollectible amountsreceivables related to sales financed under the
Douglas Dynamics, Inc.
Notes to Consolidated Financial Statements (Continued)
Years ended December 31, 2010, 2009 and 2008
(in Thousands Except Share and Per Share Data)
2. Summary of Significant Accounting Policies (Continued)
financing program for the years ended December 31, 2010 and 2009.program. The amount owed by our distributors to the third party financing company under this program at December 31, 20102013 and 20092012 was $1,267$1,300 and $3,202,$943, respectively. The Company was required to repurchase repossessed inventory of $91$0, $233, and $19$41 for the years ended December 31, 20102013, December 31, 2012 and December 31, 2009,2011, respectively. There were no required repurchases of repossessed inventory during the year ended December 31, 2008.
In the past, minimal losses have been incurred under this agreement. However, an adverse change in distributor retail sales could cause this situation to change and thereby require the Company to repurchase repossessed units. Any repossessed units are inspected to ensure they are current, unused product and are restocked and resold.
Interest Rate Swap
As required by the debt agreement the Company entered into in the second quarter of 2011, the Company entered into an interest-rate swap agreement to hedge against the potential impact on earnings from increases in market interest rates. Under the interest rate swap agreement, effective as of July 18, 2011 the Company either receives or makes payments on a monthly basis based on the differential between 6.335% and LIBOR plus 4.25% (with a LIBOR floor of 1.5%). See Consolidated Statement of Comprehensive income (loss) for treatment of gains and losses on the interest rate swap agreement.
Inventories
Inventories are stated at the lower of cost or market. Market is determined based on estimated realizable values. Inventory costs are primarily determined by the first-in, first-out (FIFO) method. The Company periodically reviews ourits inventory for slow moving, damaged and discontinued items and provides reserves to reduce such items identified to their recoverable amounts.
Douglas Dynamics, Inc.
Notes to Consolidated Financial Statements (Continued)
Years ended December 31, 2013, 2012 and 2011
(Dollars in Thousands Except Per Share Data)
2. Summary of Significant Accounting Policies (Continued)
Property, plant and equipment
Property, plant and equipment are recorded at cost, less accumulated depreciation. Depreciation is computed using straight-line methods over the estimated useful lives for financial statement purposes and an accelerated method for income tax reporting purposes. The estimated useful lives of the assets are as follows:
| | Years | |||
|---|---|---|---|---|
Land improvements and buildings | ||||
Machinery and equipment | ||||
Furniture and fixtures | ||||
Mobile equipment and other | ||||
Depreciation expense was $5,704, $5,797,$3,068, $2,819, and $4,650$2,975 for the years ended December 31, 2010, 20092013, 2012 and 2008,2011, respectively.
Expenditures for renewals and improvements that significantly add to the productive capacity or extend the useful life of an asset are capitalized. Expenditures for maintenance and repairs are charged to operations when incurred. Repairs and maintenance expenses amounted to $2,909, $3,079$3,509, $2,855 and $2,610$4,025 for the years ended December 31, 2010, 20092013, 2012 and 2008,2011, respectively. When assets are sold or retired, the cost of the asset and the related accumulated depreciation are eliminated from the accounts and any gain or loss is recognized in the results of operations.
Impairment of long-lived assets
Long-lived assets are reviewed for potential impairment when events or changes in circumstances indicate that the carrying amount of the asset may not be recoverable. Recoverability of assets to be
Douglas Dynamics, Inc.
Notes to Consolidated Financial Statements (Continued)
Years ended December 31, 2010, 2009 and 2008
(in Thousands Except Share and Per Share Data)
2. Summary of Significant Accounting Policies (Continued)
held and used is measured by comparison of the carrying value of such assets to the undiscounted future cash flows expected to be generated by the assets. If the carrying value of an asset exceeds its estimated undiscounted future cash flows, an impairment provision is recognized to the extent that the carrying amount of the asset exceeds its fair value. Assets to be disposed of are reported at the lower of the carrying amount or the fair value of the asset, less costs of disposition. Management of the Company considers such factors as current results, trends and future prospects, current market value, and other economic and regulatory factors in performing these analyses. The Company determined that no long-lived assets were impaired as of December 31, 20102013 and 2009.2012.
Goodwill and other intangible assets
Goodwill and indefinite-lived intangible assets are tested for impairment annually in the fourth quarter,as of December 31, or sooner if impairment indicators arise. The fair value of indefinite-lived intangible assets is estimated based upon a market approach. In reviewing goodwill for impairment, potential impairment is identified by comparing the estimated fair value of the reporting unit to its carrying value. The Company has determined it has one reporting unit. When the fair value is less than the carrying value of the net assets of the reporting unit, including goodwill, an impairment loss may be
Douglas Dynamics, Inc.
Notes to Consolidated Financial Statements (Continued)
Years ended December 31, 2013, 2012 and 2011
(Dollars in Thousands Except Per Share Data)
2. Summary of Significant Accounting Policies (Continued)
recognized. The Company has determined that goodwill and indefinite lived assets were not impaired as of December 31, 20102013 and 2009.2012.
Intangible assets with estimable useful lives are amortized over their respective estimated useful lives and alsoare reviewed at least annually for potential impairment or aswhen events or circumstances arise.indicate that the carrying amount of the asset may not be recoverable. The Company amortizes its distribution network intangible over periods ranging from 15 to 20 years, trademarks over 7 to 1025 years, patents over 7 to 20 years, customer relationships over 19.5 years and noncompete agreements over 5 years. The Company has determined that finite lived intangible assets were not impaired as of December 31, 20102013 and 2009.2012.
Income taxes
Deferred income taxes are accounted for under the asset and liability method whereby deferred tax assets and liabilities are recognized for the future tax consequences attributable to differences between the financial statement carrying amounts of existing assets and liabilities and their respective tax bases. Deferred tax assets and liabilities are measured using enacted tax rates. Deferred income tax provisions or benefits are based on the change in the deferred tax assets and liabilities from period to period. Deferred income tax assets are reduced by a valuation allowance if it is more likely than not that some portion of the deferred income tax asset will not be realized. Additionally, when applicable, the Company would classify interest and penalties related to uncertain tax positions in income tax expense.
Douglas Dynamics, Inc.
Notes to Consolidated Financial Statements (Continued)
Years ended December 31, 2010, 2009 and 2008
(in Thousands Except Share and Per Share Data)
2. Summary of Significant Accounting Policies (Continued)
Deferred financing costs
The costs of obtaining financing are capitalized and amortized over the term of the related financing on a basis that approximates the effective interest method. The changes in deferred financing costs are as follows:
Balance at January 1, 2008 | $ | 5,344 | ||||||
Amortization of deferred financing costs | (1,138 | ) | ||||||
Debt amendment | 314 | |||||||
Balance at December 31, 2008 | 4,520 | |||||||
Amortization of deferred financing costs | (1,209 | ) | ||||||
Balance at December 31, 2009 | 3,311 | |||||||
Balance at January 1, 2011 | $ | 953 | ||||||
Write-off of unamortized deferred financing costs | (2,045 | ) | (335 | ) | ||||
Deferred financing costs capitalized on new debt | 559 | 3,471 | ||||||
Amortization of deferred financing costs | (872 | ) | (687 | ) | ||||
Balance at December 31, 2010 | $ | 953 | ||||||
| | | | | |||||
Balance at December 31, 2011 | 3,402 | |||||||
Deferred financing costs capitalized on new debt | 168 | |||||||
Amortization of deferred financing costs | (776 | ) | ||||||
| | | | | |||||
Balance at December 31, 2012 | 2,794 | |||||||
Amortization of deferred financing costs | (578 | ) | ||||||
| | | | | |||||
Balance at December 31, 2013 | $ | 2,216 | ||||||
| | | | | |||||
| | | | | |||||
For the year ended December 31, 2010,2012, the Company extended the term on its revolving line of credit and capitalized $168 of deferred financing costs associated with the refinancing. For the year ended December 31, 2011, the Company recorded the write-off of deferred financing costs as a loss on
Douglas Dynamics, Inc.
Notes to Consolidated Financial Statements (Continued)
Years ended December 31, 2013, 2012 and 2011
(Dollars in Thousands Except Per Share Data)
2. Summary of Significant Accounting Policies (Continued)
extinguishment of debt, in the consolidated statements of operationsincome as a result of an amendment to the Company's term loan facility and the repayment of the senior notes.facility. The amendment of the term loan facility resulted in a significant modification of the debt which resulted in the write off of unamortized capitalized deferred financing costs of $995. The Company wrote off $1,050 of unamortized deferred financing costs related to the senior notes. These amounts are included as a loss on extinguishment of debt in the consolidated statements of operations. See further details in Note 7.$335.
Fair valuesValue
Fair value is the price at which an asset could be exchanged in a current transaction between knowledgeable, willing parties. A liability's fair value is defined as the amount that would be paid to transfer the liability to a new obligor, not the amount that would be paid to settle the liability with the creditor. Fair value measurements are categorized into one of financial instrumentsthree levels based on the lowest level of significant input used: Level 1 (unadjusted quoted prices in active markets); Level 2 (observable market inputs available at the measurement date, other than quoted prices included in Level 1); and Level 3 (unobservable inputs that cannot be corroborated by observable market data).
The Company'sfollowing table presents financial instruments consist of cash, trade receivables, trade accounts payable,assets and long-term debt. The Company's estimate ofliabilities measured at fair value on a recurring basis and discloses the fair value of alllong-term debt:
| | Fair Value at 12/31/2013 | Fair Value at 12/31/2012 | |||||
|---|---|---|---|---|---|---|---|
Assets: | |||||||
Other assets(a) | $ | 1,127 | $ | 491 | |||
| | | | | | | | |
Total Assets | $ | 1,127 | $ | 491 | |||
| | | | | | | | |
Liabilities: | |||||||
Long term debt(b) | 110,439 | 110,566 | |||||
Other long-term liabilities— | |||||||
Earnout—Trynex(c) | 3,587 | — | |||||
Interest rate swap(d) | 282 | 544 | |||||
| | | | | | | | |
Total Liabilities | $ | 114,308 | $ | 111,110 | |||
| | | | | | | | |
the acquisition of substantially all of TrynEx's assets. The carrying amount of the earn out approximates its fair value. Fair value measurements
The Company applies the guidance in Accounting Standards Codification (ASC) 820-10Fair Value Measurements and Disclosures ("ASC 820-10"). ASC 820-10, among other things, defines fair value, establishes a consistent framework for measuring fair value, and expands disclosure for each major asset and liability category measured at fair value on either a recurring basis or nonrecurring basis. ASC 820-10 clarifies that fair value is an exit price, representing the amount that would be received to sell an asset or paid to transfer a liability in an orderly transaction between market participants. As
Douglas Dynamics, Inc.
Notes to Consolidated Financial Statements (Continued)
Years ended December 31, 2010, 20092013, 2012 and 20082011
(Dollars in Thousands Except Share and Per Share Data)
2. Summary of Significant Accounting Policies (Continued)
such, fair value isLevel 3 inputs of a market-based measurement that should be determined based on assumptions thatmonte carlo simulation analysis using key inputs of forecasted future sales and financial performance as well as a growth rate reduced by the market participants would use in pricing an asset or liability. As a basis for considering such assumptions, the pronouncement establishes a three-tier fair value hierarchy, which prioritizes the inputs used in measuring fair value as follows: (Level 1) observable inputs such as quoted prices in active markets; (Level 2) inputs, other than the quoted prices in active markets, thatrequired rate of return. See reconciliation of liability included below:
| | 2013 | |||
|---|---|---|---|---|
Balance at January 1 | $ | — | ||
Additions | 3,587 | |||
Adjustments to fair value | — | |||
| | | | | |
Balance at December 31 | $ | 3,587 | ||
| | | | | |
| | | | | |
Assets and liabilities measured at fair valueinitial trade price. Subsequent valuations are based on observable inputs to the market approach, which is pricesvaluation model (e.g. interest rates and other relevant information generatedcredit spreads). Model inputs are changed only when corroborated by market transactions involving identical or comparable assets or liabilities. At December 31, 2010 and 2009,data. A credit risk adjustment is made using observable market credit spreads. Thus, inputs used to determine fair value of the Company did not have any financial instruments accounted for at fair value.
Concentration of credit risk
The Company's cash is deposited with multiple financial institutions. At times, deposits in these institutions exceed the amount of insurance provided on such deposits. The Company has not experienced any losses in such accounts and believes that it is not exposed to any significant risk on these balances.
No distributor represented more than 10% of the Company's net sales or accounts receivable during the years ended December 31, 2010, 20092013, 2012 and 2008.2011.
Revenue recognition
The Company recognizes revenues upon shipment to the customer, which is when titlerisk of loss passes and all of the following conditions are satisfied: (i) persuasive evidence of an arrangement exists; (ii) the price is fixed or determinable; (iii) collectability is reasonably assured; and (iv) the product has been shipped and the Company has no further obligations. Customers have no right of return privileges. Historically, product returns have not been material and are permitted on an exception basis only.
The Company offers a variety of discounts and sales incentives to ourits distributors. The estimated liability for sales discounts and allowances is recorded at the time of sale as a reduction of net sales. The liability is estimated based on the costs of the program, the planned duration of the program and historical experience.
Cost of sales
Cost of sales includes all costs associated with the manufacture of the Company's products, including raw materials, purchased parts, freight, plant operating expenses, property insurance and taxes, and plant depreciation. All payroll costs and employee benefits for the hourly workforce, manufacturing management, and engineering costs are included in cost of sales.
Douglas Dynamics, Inc.
Notes to Consolidated Financial Statements (Continued)
Years ended December 31, 2010, 20092013, 2012 and 20082011
(Dollars in Thousands Except Share and Per Share Data)
2. Summary of Significant Accounting Policies (Continued)
taxes, and plant depreciation. All payroll costs and employee benefits for the hourly workforce, manufacturing management, and engineering costs are included in cost of sales.
Warranty cost recognition
The Company accrues for estimated warranty costs as revenue is recognized. See note 9 for further details.
Advertising expenses
Advertising expenses include costs for the production of marketing media, literature, CD-ROM, and displays. The Company participates in trade shows and advertises in the yellow pages and billboards. Advertising expenses amounted to $2,805, $2,528$3,037, $1,815 and $3,028$2,718 for the years ended December 31, 2010, 20092013, 2012 and 2008,2011, respectively. The Company also provides its distributors with pre-approved, cooperative advertising programs, which are recorded as advertising expense in selling, general and administrative expense. All costs associated with the Company's advertising programs are expensed as incurred.
Shipping and handling costs
Generally, shipping and handling costs are paid directly by the customer to the shipping agent. Those shipping and handling costs billed by the Company are recorded as a component of sales with the corresponding costs included in cost of sales.
Reclassifications
Certain prior year amounts in the financial statements have been reclassified to conform to the current year presentation.
Share-based payments
The Company applies the guidance codified in ASC 718—Compensation-StockCompensation—Stock Compensation. This standard requires the measurement of the cost of employee services received in exchange for an award of equity instruments based on the fair value of the award at the grant date and recognition of the compensation expense over the period during which an employee is required to provide service in exchange for the award (generally the vesting period). Because the Company used the minimum-value method to measure compensation cost for employee stock options prior to January 1, 2006, the date on which ASC 718 was adopted, under this previous guidance, it was required to use the prospective method of adoption for this standard. Under the prospective method, the Company continues to account for non-vested awards outstanding at the date of adoption using the same method as prior to adoption for financial statement recognition purposes. All awards granted, modified, or settled after the date of adoption are accounted for using the measurement, recognition, and attribution provisions of ASC 718.
Comprehensive income (loss)
Comprehensive income (loss) is defined as the change in equity (net assets) of a business enterprise during a period from transactions and other events and circumstances from non-owner resources and is comprised of net income or loss and "other comprehensive income (loss)". The Company's other comprehensive income (loss) is comprised of the adjustments for pension and
Douglas Dynamics, Inc.
Notes to Consolidated Financial Statements (Continued)
Years ended December 31, 2010, 20092013, 2012 and 20082011
(Dollars in Thousands Except Share and Per Share Data)
2. Summary of Significant Accounting Policies (Continued)
resources and is comprisedpostretirement benefit liabilities as well as the impact of net income orits interest rate swap. The interest rate swap contract on $50,000 notional amount of the term loan expires in December 2014. The Company does not expect to record any unrecognized loss and "other comprehensive income (loss)". The Company'sinto earnings in the next twelve months. Additionally, other comprehensive income (loss) is comprised exclusivelyincludes the net income (loss) of the Company plus/minus the Company's adjustments for pension and postretirementits defined benefit liabilities.retirement plans based on the measurement date as of the Company's year-end. See Note 19 for the components of accumulated other comprehensive loss.
Segment Reporting
The Company operates in and reports as a single operating segment, which is the manufacture and sale of snow and ice control products. Net sales are generated through the sale of snow and ice control products and accessories to distributors. The chief operating decision maker (the Company's CEO)Chief Executive Officer) manages and evaluates its operations as one segment primarily due to similarities in the nature of the products, production processes and methods of distribution. All of the Company's identifiable assets are located in the United States. The Company's sales outside North America are not material, representing less than 1%3% of net sales.
The Company's product offerings primarily consist of snow and ice control products and accessories. Equipment and parts and accessories are each a similar class of products based on similar customer usage.
| | Year ended December 31, | Year ended December 31, | ||||||||||||||||||
|---|---|---|---|---|---|---|---|---|---|---|---|---|---|---|---|---|---|---|---|---|
| | 2010 | 2009 | 2008 | 2013 | 2012 | 2011 | ||||||||||||||
Equipment | $ | 151,808 | $ | 147,478 | $ | 151,450 | $ | 164,460 | $ | 123,308 | $ | 177,806 | ||||||||
Parts and accessories | 24,987 | 26,864 | 28,658 | 29,860 | 16,725 | 30,992 | ||||||||||||||
| | | | | | | | | |||||||||||||
Net Sales | $ | 176,795 | $ | 174,342 | $ | 180,108 | $ | 194,320 | $ | 140,033 | $ | 208,798 | ||||||||
| | | | | | | | | |||||||||||||
| | | | | | | | | |||||||||||||
3. Related-Party TransactionsAcquisition
On May 6, 2013, the Company acquired substantially all of the assets of TrynEx for the purpose of expanding its current market presence in the snow and ice segment. Total consideration paid was $26,734 including an estimated working capital adjustment. The working capital adjustment was further adjusted to reduce the purchase price at December 31, 2013 by $262 which the Company received after the date of these financial statements. The acquisition was financed with $28,000 of revolver borrowings under the Company's credit facility discussed in Note 7. The Company incurred $1,239 of transaction expenses related to this acquisition that are included in selling, general and administrative expense in the Consolidated Statements of Income.
The Company is partyTrynEx purchase agreement includes contingent consideration in the form of an earnout capped at $7,000. Under the earnout the former owners of TrynEx are entitled to a Joint Management Services Agreement with Aurora Management Partners, LLC ("AMP")receive payments contingent upon the revenue growth and ACOF Management, LP ("ACOF"), affiliates of its principal stockholders. Prior to the IPO, this agreement obligated the Company to pay an annual management fee of $1,250 per annum, to AMP and ACOF, pro rata in accordance with their respective holdings, plus reimbursement of reasonable out-of-pocket expenses, in exchange for consultation and advice in fields such as financial services, accounting, general business management, acquisitions, dispositions and banking.
In connection with the Company's IPO, the Company amended and restated the terms of its Joint Management Services Agreement to, among other things, (i) extend the term of service until the earlier of (A) the fifth anniversaryperformance of the consummationacquired business for the years 2014, 2015 and 2016. On August 5, 2013, the purchase agreement was amended to remove the requirement that the former owners of the Company's IPO, (B) such time as AMP and ACOF, together with their affiliates, collectively hold less than 5% of the Company's outstanding common stock and (C) such time as all parties mutually agree in writing, while eliminating all other termination events (other than termination for cause); (ii) eliminate the annual management fee, as well as the provision obligating the Company to pay AMP and ACOF a transaction feeTrynEx remain employed in the event of an acquisition or any sale or disposition of the Company or any of its divisions or any sale of substantially all Company assets or similar transactions in exchange for a one-time fee of $5,800 upon2014 and 2015 performance
Douglas Dynamics, Inc.
Notes to Consolidated Financial Statements (Continued)
Years ended December 31, 2010, 20092013, 2012 and 20082011
(Dollars in Thousands Except Share and Per Share Data)
3. Related-Party TransactionsAcquisition (Continued)
the consummationperiods, resulting in recognition of the IPO, pro ratafair value of the contingent consideration for 2014 and 2015 of $3,587 at that date. The requirement of continued employment remains in accordance with their respective holdings; and (iii) modify the expense reimbursement provisions to include reimbursement for out-of-pocket expenses incurred in connection with SEC and other legally required filings made by each of AMP and ACOF with respect to the Company's securities and certain other expenses. The one-time management fee was paid on May 10, 2010, and is included in management fees—related party expenseplace for the year ended December 31, 2010.2016 performance period.
The Company recognized management feesfollowing table summarizes the allocation of the purchase price paid and related expensethe subsequent working capital adjustment to the fair value of $6,383, $1,393 and $1,369the net assets acquired as of the acquisition date:
Accounts receivable | 604 | |||
Inventories | 4,130 | |||
Other current assets | 29 | |||
Property and equipment | 5,272 | |||
Goodwill | 5,910 | |||
Intangible assets | 12,499 | |||
Accounts payable and other liabilities | (1,972 | ) | ||
| | | | | |
Total | $ | 26,472 | ||
| | | | | |
| | | | | |
The goodwill for the acquisition is a result of acquiring and retaining the existing workforces and expected synergies from integrating the operations into the Company. The Company is amortizing its goodwill for income tax purposes over a fifteen-year period starting at the date of acquisition. The acquired intangible assets include customer relationships of $8,820 being amortized over 19.5 years, endedpatents of $1,320 being amortized over 17 years and trademarks of $2,359 being amortized over 25 years.
The acquisition was accounted for under the purchase method, and accordingly, the results of operations are included in the Company's financial statements from the date of acquisition. From the date of acquisition through December 31, 2010, 20092013, the TrynEx assets contributed $12,879 of revenues and 2008, respectively. In addition, because fees under this agreement are payable in semi-annual installments on May 1 and November 1($3,334) of each year, at December 31, 2009,pre-tax operating losses, including $4,506 of certain purchase accounting expenses, related to the Company's balance sheet included a prepayment of management fees of $417. Meanwhile, at December 31, 2010, the Company's balance sheet did not include a prepayment of management fee as the fee was eliminated upon the consummation of the IPO.Company.
4. Inventories
Inventories consist of the following:
| | December 31, | ||||||
|---|---|---|---|---|---|---|---|
| | 2010 | 2009 | |||||
Finished goods and work-in-process | $ | 21,896 | $ | 24,639 | |||
Raw material and supplies | 1,585 | 2,058 | |||||
| $ | 23,481 | $ | 26,697 | ||||
5. Property, plant and equipment
Property, plant and equipment are summarized as follows:
| | December 31, | ||||||
|---|---|---|---|---|---|---|---|
| | 2010 | 2009 | |||||
Land | $ | 960 | $ | 1,000 | |||
Land improvements | 1,768 | 2,218 | |||||
Buildings | 12,554 | 13,766 | |||||
Machinery and equipment | 22,343 | 23,092 | |||||
Furniture and fixtures | 6,482 | 6,934 | |||||
Mobile equipment and other | 1,019 | 969 | |||||
Construction-in-process | 422 | 4,252 | |||||
Total property, plant and equipment | 45,548 | 52,231 | |||||
Less accumulated depreciation | (23,586 | ) | (25,570 | ) | |||
Net property, plant and equipment | $ | 21,962 | $ | 26,661 | |||
| | December 31, | ||||||
|---|---|---|---|---|---|---|---|
| | 2013 | 2012 | |||||
Finished goods and work-in-process | $ | 26,175 | $ | 29,119 | |||
Raw material and supplies | 1,802 | 1,173 | |||||
| | | | | | | | |
| $ | 27,977 | $ | 30,292 | ||||
| | | | | | | | |
| | | | | | | | |
Douglas Dynamics, Inc.
Notes to Consolidated Financial Statements (Continued)
Years ended December 31, 2010, 20092013, 2012 and 20082011
(Dollars in Thousands Except Share and Per Share Data)
5. Property, plant and equipment
Property, plant and equipment are summarized as follows:
| | December 31, | ||||||
|---|---|---|---|---|---|---|---|
| | 2013 | 2012 | |||||
Land | $ | 1,160 | $ | 960 | |||
Land improvements | 1,849 | 1,768 | |||||
Buildings | 16,743 | 12,852 | |||||
Machinery and equipment | 25,756 | 24,286 | |||||
Furniture and fixtures | 8,772 | 7,465 | |||||
Mobile equipment and other | 1,267 | 1,138 | |||||
Construction-in-process | 1,113 | 351 | |||||
| | | | | | | | |
Total property, plant and equipment | 56,660 | 48,820 | |||||
Less accumulated depreciation | (31,794 | ) | (28,933 | ) | |||
| | | | | | | | |
Net property, plant and equipment | $ | 24,866 | $ | 19,887 | |||
| | | | | | | | |
| | | | | | | | |
6. Other Intangible Assets
The following is a summary of the Company's other intangible assets:
| | Gross Carrying Amount | Less Accumulated Amortization | Net Carrying Amount | |||||||||
|---|---|---|---|---|---|---|---|---|---|---|---|---|
December 31, 2010: | ||||||||||||
Indefinite-lived intangibles: | ||||||||||||
Trademark and tradenames | $ | 60,000 | $ | — | $ | 60,000 | ||||||
Amortizable intangibles: | ||||||||||||
Dealer network | 80,000 | 27,000 | 53,000 | |||||||||
Customer relations | 2,000 | 689 | 1,311 | |||||||||
Patents | 15,116 | 3,977 | 11,139 | |||||||||
Noncompete agreements | 5,050 | 5,050 | — | |||||||||
Trademark—Blizzard | 3,100 | 1,602 | 1,498 | |||||||||
License | 20 | 20 | — | |||||||||
Amortizable intangibles, net | 105,286 | 38,338 | 66,948 | |||||||||
Total | $ | 165,286 | $ | 38,338 | $ | 126,948 | ||||||
| | | Gross Carrying Amount | Less Accumulated Amortization | Net Carrying Amount | Gross Carrying Amount | Less Accumulated Amortization | Net Carrying Amount | |||||||||||||||
|---|---|---|---|---|---|---|---|---|---|---|---|---|---|---|---|---|---|---|---|---|---|---|
December 31, 2009: | ||||||||||||||||||||||
December 31, 2013: | ||||||||||||||||||||||
Indefinite-lived intangibles: | ||||||||||||||||||||||
Trademark and tradenames | $ | 60,000 | $ | — | $ | 60,000 | ||||||||||||||||
Amortizable intangibles: | ||||||||||||||||||||||
Dealer network | 80,000 | 39,000 | 41,000 | |||||||||||||||||||
Customer relationships | 10,820 | 1,404 | 9,416 | |||||||||||||||||||
Patents | 16,436 | 6,293 | 10,143 | |||||||||||||||||||
Noncompete agreements | 5,050 | 5,050 | — | |||||||||||||||||||
Trademarks | 5,459 | 2,596 | 2,863 | |||||||||||||||||||
License | 20 | 20 | — | |||||||||||||||||||
Indefinite-lived intangibles: | ||||||||||||||||||||||
Trademark and tradenames | $ | 60,000 | $ | — | $ | 60,000 | ||||||||||||||||
Amortizable intangibles: | ||||||||||||||||||||||
Dealer network | 80,000 | 23,000 | 57,000 | |||||||||||||||||||
Customer relations | 2,000 | 555 | 1,445 | |||||||||||||||||||
Patents | 15,077 | 3,180 | 11,897 | |||||||||||||||||||
Noncompete agreements | 4,820 | 4,020 | 800 | |||||||||||||||||||
Trademark—Blizzard | 3,100 | 1,292 | 1,808 | |||||||||||||||||||
License | 17 | 17 | — | |||||||||||||||||||
| | | | | | | | | |||||||||||||||
Amortizable intangibles, net | Amortizable intangibles, net | 105,014 | 32,064 | 72,950 | 117,785 | 54,363 | 63,422 | |||||||||||||||
| | | | | | | | | |||||||||||||||
Total | Total | $ | 165,014 | $ | 32,064 | $ | 132,950 | $ | 177,785 | $ | 54,363 | $ | 123,422 | |||||||||
| | | | | | | | | |||||||||||||||
| | | | | | | | | |||||||||||||||
Douglas Dynamics, Inc.
Notes to Consolidated Financial Statements (Continued)
Years ended December 31, 2010, 20092013, 2012 and 20082011
(Dollars in Thousands Except Share and Per Share Data)
6. Other Intangible Assets (Continued)
| | Gross Carrying Amount | Less Accumulated Amortization | Net Carrying Amount | |||||||
|---|---|---|---|---|---|---|---|---|---|---|
December 31, 2012: | ||||||||||
Indefinite-lived intangibles: | ||||||||||
Trademark and tradenames | $ | 60,000 | $ | — | $ | 60,000 | ||||
Amortizable intangibles: | ||||||||||
Dealer network | 80,000 | 35,000 | 45,000 | |||||||
Customer relationships | 2,000 | 956 | 1,044 | |||||||
Patents | 15,116 | 5,491 | 9,625 | |||||||
Noncompete agreements | 5,050 | 5,050 | — | |||||||
Trademark—Blizzard | 3,100 | 2,221 | 879 | |||||||
License | 20 | 20 | — | |||||||
| | | | | | | | | | | |
Amortizable intangibles, net | 105,286 | 48,738 | 56,548 | |||||||
| | | | | | | | | | | |
Total | $ | 165,286 | $ | 48,738 | $ | 116,548 | ||||
| | | | | | | | | | | |
| | | | | | | | | | | |
Amortization expense for intangible assets was $6,001, $6,161$5,625, $5,199 and $6,160$5,201 for the years ended December 31, 2010, 20092013, 2012 and 2008,2011, respectively. Estimated amortization expense for the next five years is as follows:
2011 | $ | 5,201 | ||
2012 | 5,199 | |||
2013 | 5,193 | |||
2014 | 5,193 | |||
2015 | 5,142 |
2014 | $ | 5,818 | ||
2015 | 5,767 | |||
2016 | 5,508 | |||
2017 | 5,508 | |||
2018 | 5,508 |
The weighted average remaining life for intangible assets is 13.312.1 years.
7. Long-Term Debt
Long-term debt is summarized below:
| | December 31, | ||||||
|---|---|---|---|---|---|---|---|
| | 2010 | 2009 | |||||
Term Loan, net of debt discount of $358 at December 31, 2010 | $ | 121,154 | $ | 82,663 | |||
Senior notes | — | 150,000 | |||||
Total long-term debt | 121,154 | 232,663 | |||||
Less current maturities | 1,183 | 850 | |||||
| $ | 119,971 | $ | 231,813 | ||||
| | December 31, | ||||||
|---|---|---|---|---|---|---|---|
| | 2013 | 2012 | |||||
Term Loan, net of debt discount of $766 and $946 at December 31, 2013 and December 31, 2012, respectively | $ | 110,994 | $ | 111,966 | |||
Less current maturities | 971 | 971 | |||||
| | | | | | | | |
| $ | 110,023 | $ | 110,995 | ||||
| | | | | | | | |
| | | | | | | | |
The scheduled maturities on long-term debt at December 31, 2010, are as follows:
2011 | $ | 1,183 | ||
2012 | 1,183 | |||
2013 | 80,446 | |||
2014 | 333 | |||
2015 | 333 | |||
Thereafter | 37,676 | |||
| $ | 121,154 | |||
As of December 31, 2009, the Company's senior credit facilities consisted of an $85,000 term loan facility and a $60,000 revolving credit facility with a group of banks and the Company also had outstanding $150,000 of 7.75% senior notes (the "Senior Notes") due January 15, 2012. Concurrent with the consummation of the IPO in 2010, the Company amended its senior credit facilities to, among other things, (i) allow it to redeem the Senior Notes, (ii) increase the size of its term loan facility by $40,000 and (iii) amend certain of the provisions in its senior credit facilities which govern the Company's ability to pay dividends. Consequently, at December 31, 2010, the Company's senior credit
Douglas Dynamics, Inc.
Notes to Consolidated Financial Statements (Continued)
Years ended December 31, 2010, 20092013, 2012 and 20082011
(Dollars in Thousands Except Share and Per Share Data)
7. Long-Term Debt (Continued)
The scheduled maturities on long-term debt at December 31, 2013, are as follows:
2014 | 971 | |||
2015 | 971 | |||
2016 | 971 | |||
2017 | 971 | |||
2018 | 107,110 | |||
| | | | | |
| $ | 110,994 | |||
| | | | | |
| | | | | |
The Company's senior credit facilities consist of a $125,000 term loan facility and a $60,000an $80,000 revolving credit facility with a group of banks. In connection with the amendments to the Company's senior credit facilities, the interest on the existing portion ofThe agreement for the term loan (the "Term Loan Credit Agreement") provides for a senior secured term loan facility was revised. The change consistedin the aggregate principal amount of an increase from an$125,000 and generally bears interest rate equal toat (at the Company's option)election) either (i) 3.25% per annum plus the base rategreatest of (a) the Prime Rate (as defined in the Term Loan Credit Agreement) in effect on such day, (b) the weighted average of the rates on overnight Federal funds transactions with members of the Federal Reserve System arranged by Federal funds brokers plus 1.25%0.50% and (c) 1.00% plus the greater of (1) the London Interbank Offered Rate for a one month interest period multiplied by the Statutory Reserve Rate (as defined in the Term Loan Credit Agreement) and (2) 1.50% or (ii) 4.25% per annum plus the eurodollar rate plus 2.25% to (atgreater of (a) the Company's option) either the base rate (which shall be no less than 3%) plus 3.5% or the eurodollar rate (which shall be no less than 2%) plus 4.5%. The interestLondon Interbank Offered Rate for the additional $40,000 increase inapplicable interest period multiplied by the Company's term loan facility is an interest rate equal to (at the Company's option) either the base rate (which shall be no less than 3%) plus 4% or the eurodollar rate (which shall be no less than 2%) plus 5%Statutory Reserve Rate and (b) 1.50%. Under the
The revolving credit facility as amended and restated (the "Revolving Credit and Guaranty Agreement") provides that the marginCompany has the option to select whether borrowings will bear interest at either (i) 1.75% per annum plus the London Interbank Offered Rate for base rate loans is either 0.25%the applicable interest period multiplied by the Statutory Reserve Rate or (ii) 1.25% per annum plus the greatest of (a) the Prime Rate in effect on such day, (b) the weighted average of the rates on overnight Federal funds transactions with members of the Federal Reserve System arranged by Federal funds brokers plus 0.50% and (c) the margin for eurodollar rate loans is either 1.25% or 1.50%, in each case determined based on the Company's leverage ratio from time to time. The amendment of the term loan facility resulted in a significant modification of the debt which resulted in the write off of unamortized capitalized deferred financing costs of $995 and expenditures of $2,045 related to financing costs paid to existing lenders which was recorded as a loss on extinguishment of debt in the consolidated statements of operations in the year ended December 31, 2010.
On June 9, 2010, the Company completed the redemption of its Senior Notes. The Company redeemed its Senior Notes with the proceeds from the additional term loan, together with the net IPO proceeds and cash on handLondon Interbank Offered Rate for a total of $157,557, which includes $3,681 ofone month interest that accrued throughperiod multiplied by the date of deposit with the trustee, $969 of interest that accrued from the date of deposit with the trustee to the date of redemption and a $2,907 redemption call premium of 1.938%Statutory Reserve Rate plus 1%. In addition, the Company wrote off $1,050 of unamortized deferred financing costs related to the Senior Notes.
After effecting the discharge of the Senior Notes, theThe maturity date for the Company's amended and restated revolving credit facility is May 21, 2012,April 17, 2017, and the Company's term loan amortizes in nominal amounts quarterly with the balance payable on May 21,April 18, 2018. The Company incurred and paid interest expense of $446 related to its revolving credit facility borrowings in the year ended December 31, 2013 with respect toat an average rate of 2.0%.
The term loan was issued at a $1,250 discount which is being amortized over the existing term loans and May 21, 2016 with respect toof the additional term loans.loan.
At December 31, 20102013, the Company had nooutstanding borrowings under the term loan of $110,994 and $13,000 of outstanding borrowings on the revolving credit facility and remaining borrowing availability of $60 million.$48,324.
The Company's senior credit facilities include certain negative and operating covenants, including restrictions on its ability to pay dividends, and other customary covenants, representations and warranties and events of default. The senior credit facilities entered into and recorded by the
Douglas Dynamics, Inc.
Notes to Consolidated Financial Statements (Continued)
Years ended December 31, 2013, 2012 and 2011
(Dollars in Thousands Except Per Share Data)
7. Long-Term Debt (Continued)
Company's subsidiaries significantly restrict its subsidiaries from paying dividends and otherwise transferring assets to Douglas Dynamics, Inc. The terms of the Company's revolving credit facility specifically restrict subsidiaries from paying dividends if a minimum availability under the revolving credit facility is not maintained, (such event, a "liquidity event"), and both senior credit facilities restrict subsidiaries from paying dividends above certain levels or at all if an event of default has occurred. These restrictions would affect the Company indirectly since the Company relies principally on distributions from its subsidiaries to have funds available for the payment of dividends. In addition, the Company's revolving credit facility includes a requirement that, subject to certain exceptions, capital expenditures may not exceed $10,000 in any calendar year and, duringif certain minimum availability under the occurrence of a liquidity event,revolving credit facility is not maintained, that the Company comply with a monthly minimum fixed charge coverage ratio test of 1.0:1.0. Compliance with the fixed charge coverage ratio test is subject to certain cure rights under the Company's revolving credit facility. At December 31, 2010,2013, the Company was in compliance with the respective covenants. The credit facilities are collateralized by substantially all assets of the Company.
Douglas Dynamics, Inc.
Notes to Consolidated Financial Statements (Continued)
Years ended December 31, 2010, 2009 and 2008
(in Thousands Except Share and Per Share Data)
7. Long-Term Debt (Continued)
In accordance with the senior credit facilities, the Company is required to make additional principal prepayments over the above scheduled payments under certain conditions. This includes, in the case of the term loan facility, 100% of the net cash proceeds of certain asset sales, certain insurance or condemnation events, certain debt issuances, and, within 150 days of the end of the fiscal year, 50% of excess cash flow, as defined, including a deduction for allowedcertain distributions (which percentage is reduced to 25% or 0% upon the achievement of certain leverage ratio thresholds), for any fiscal year. Excess cash flow is defined in the senior credit facilities as consolidated adjusted EBITDA (earnings before interest, taxes, depreciation and amortization) plus a working capital adjustment less the sum of repayments of debt and capital expenditures subject to certain adjustments, interest and taxes paid in cash, management fees and certain restricted payments (including dividends or distributions). Working capital adjustment is defined in the senior credit facilities as the change in working capital, defined as current assets excluding cash and cash equivalents less current liabilities excluding current portion of long term debt. As of December 31, 2010 and 2009,2013, the Company was not required to make an excess cash flow payment.
AsEach of the senior secured facilities include a hedge provision, which required the Company to enter into an interest rate hedge commencing 90 days after the closing date. The hedging provision required the Company to hedge the interest rate on at least 25% of the aggregate outstanding principal amount of the term loans. The purpose of the interest rate swap is to reduce the Company's exposure to interest rate volatility. Effective June 20, 2011, the Company entered into an interest rate swap agreement with a notional amount of $50,000. The interest rate swap negative fair value at December 31, 20102013 and 2009,2012 of $282 and $544, respectively, is included in Accrued expenses and other current liabilities on the Consolidated Balance Sheets. The Company has counterparty credit risk resulting from the interest rate swap, which it monitors on an on-going basis. This risk lies with one global financial institution. Under the interest rate swap agreement, effective as of July 18, 2011, the Company had no letterseither receives or makes payments on a monthly basis based on the differential between 6.335% and LIBOR plus 4.25% (with a LIBOR floor of credit outstanding.1.5%). The interest rate swap contract on the term loan expires in December 2014.
Douglas Dynamics, Inc.
Notes to Consolidated Financial Statements (Continued)
Years ended December 31, 2013, 2012 and 2011
(Dollars in Thousands Except Per Share Data)
8. Accrued Expenses and Other Current Liabilities
Accrued expenses and other current liabilities are summarized as follows:
| | December 31, | December 31, | ||||||||||||
|---|---|---|---|---|---|---|---|---|---|---|---|---|---|---|
| | 2010 | 2009 | 2013 | 2012 | ||||||||||
Payroll and related costs | $ | 2,993 | $ | 3,659 | $ | 2,857 | $ | 1,429 | ||||||
Employee benefits | 2,334 | 2,534 | 4,522 | 2,731 | ||||||||||
Accrued warranty | 3,399 | 3,040 | 3,808 | 3,628 | ||||||||||
Other | 3,197 | 3,365 | 3,231 | 2,541 | ||||||||||
| | | | | | | |||||||||
| $ | 11,923 | $ | 12,598 | $ | 14,418 | $ | 10,329 | |||||||
| | | | | | | |||||||||
| | | | | | | |||||||||
9. Warranty Liability
The Company accrues for estimated warranty costs as sales are recognized and periodically assesses the adequacy of its recorded warranty liability and adjusts the amount as necessary. The Company's warranties generally provide, with respect to its snow and ice control equipment, that all material and workmanship will be free from defect for a period of two years after the date of purchase by the end-user, and with respect to its parts and accessories purchased separately, that such parts and accessories will be free from defect for a period of one year after the date of purchase by the end-user. Certain snowplows only provide for a one year warranty. The Company determines the amount of the estimated warranty costs (and its corresponding warranty reserve) based on the Company's prior five years of warranty history utilizing a formula driven by historical warranty expense and applying management's judgment. The companyCompany adjusts its historical warranty costs to take into account unique factors such as the introduction of new products into the marketplace that do not provide a historical
Douglas Dynamics, Inc.
Notes to Consolidated Financial Statements (Continued)
Years ended December 31, 2010, 2009 and 2008
(in Thousands Except Share and Per Share Data)
9. Warranty Liability (Continued)
warranty record to assess. The warranty reserve is included with Accrued Expenses and Other Current Liabilities in the accompanying consolidated balance sheets.
The following is a rollforward of the Company's warranty liability:
| | December 31, | |||||||||
|---|---|---|---|---|---|---|---|---|---|---|
| | 2010 | 2009 | 2008 | |||||||
Balance at the beginning of the period | $ | 3,040 | $ | 2,272 | $ | 1,593 | ||||
Warranty provision | 2,604 | 2,913 | 2,523 | |||||||
Claims paid/settlements | (2,245 | ) | (2,145 | ) | (1,844 | ) | ||||
Balance at the end of the period | $ | 3,399 | $ | 3,040 | $ | 2,272 | ||||
10. Income Taxes
The provision for income tax expense (benefit) consists of the following:
| | Year ended December 31 | ||||||||||
|---|---|---|---|---|---|---|---|---|---|---|---|
| | 2010 | 2009 | 2008 | ||||||||
Current: | |||||||||||
Federal | $ | — | $ | 1,284 | $ | 2,642 | |||||
State | 231 | 892 | 205 | ||||||||
| 231 | 2,176 | 2,847 | |||||||||
Deferred: | |||||||||||
Federal | 363 | 3,165 | 3,449 | ||||||||
State | 278 | (1,355 | ) | 497 | |||||||
| �� | 641 | 1,810 | 3,946 | ||||||||
| $ | 872 | $ | 3,986 | $ | 6,793 | ||||||
A reconciliation of income tax expense (benefit) computed at the federal statutory rate to the provision for income taxes for the years ended December 31, 2010, 2009 and 2008 is as follows:
| | 2010 | 2009 | 2008 | |||||||
|---|---|---|---|---|---|---|---|---|---|---|
Federal income tax expense at statutory rate | $ | 862 | $ | 4,840 | $ | 6,392 | ||||
State taxes (benefit), net of federal benefit | 7 | 302 | (135 | ) | ||||||
Valuation allowance changes | 311 | (1,129 | ) | 599 | ||||||
Change in uncertain tax positions, net | (349 | ) | 276 | 149 | ||||||
Research and development credit | (117 | ) | (194 | ) | (40 | ) | ||||
Rate change | 95 | — | — | |||||||
Other | 63 | (109 | ) | (172 | ) | |||||
| $ | 872 | $ | 3,986 | $ | 6,793 | |||||
| | December 31, | |||||||||
|---|---|---|---|---|---|---|---|---|---|---|
| | 2013 | 2012 | 2011 | |||||||
Balance at the beginning of the period | $ | 3,628 | $ | 4,188 | $ | 3,399 | ||||
Establish warranty liability for Trynex | 600 | — | — | |||||||
Warranty provision | 1,452 | 846 | 3,386 | |||||||
Claims paid/settlements | (1,872 | ) | (1,406 | ) | (2,597 | ) | ||||
| | | | | | | | | | | |
Balance at the end of the period | $ | 3,808 | $ | 3,628 | $ | 4,188 | ||||
| | | | | | | | | | | |
| | | | | | | | | | | |
Douglas Dynamics, Inc.
Notes to Consolidated Financial Statements (Continued)
Years ended December 31, 2010, 20092013, 2012 and 20082011
(Dollars in Thousands Except Per Share Data)
10. Income Taxes
The provision for income tax expense (benefit) consists of the following:
| | Year ended December 31 | |||||||||
|---|---|---|---|---|---|---|---|---|---|---|
| | 2013 | 2012 | 2011 | |||||||
Current: | ||||||||||
Federal | $ | 712 | $ | (3,994 | ) | $ | 2,697 | |||
State | (190 | ) | 289 | 326 | ||||||
| | | | | | | | | | | |
| 522 | (3,705 | ) | 3,023 | |||||||
Deferred: | ||||||||||
Federal | 5,582 | 7,375 | 7,855 | |||||||
State | 1,274 | 474 | 454 | |||||||
| | | | | | | | | | | |
| 6,856 | 7,849 | 8,309 | ||||||||
| | | | | | | | | | | |
| $ | 7,378 | $ | 4,144 | $ | 11,332 | |||||
| | | | | | | | | | | |
| | | | | | | | | | | |
A reconciliation of income tax expense computed at the federal statutory rate to the provision for income taxes for the years ended December 31, 2013, 2012 and 2011 is as follows:
| | 2013 | 2012 | 2011 | |||||||
|---|---|---|---|---|---|---|---|---|---|---|
Federal income tax expense at statutory rate | $ | 6,656 | $ | 3,555 | $ | 10,630 | ||||
State taxes, net of federal benefit | 236 | 218 | 1,522 | |||||||
Valuation allowance changes | — | 451 | (47 | ) | ||||||
Change in uncertain tax positions, net | 8 | 8 | (150 | ) | ||||||
Research and development credit | (305 | ) | (26 | ) | (111 | ) | ||||
Rate change | 758 | 67 | (162 | ) | ||||||
Manufacturing tax benefits | (44 | ) | — | (552 | ) | |||||
Other | 69 | (129 | ) | 202 | ||||||
| | | | | | | | | | | |
| $ | 7,378 | $ | 4,144 | $ | 11,332 | |||||
| | | | | | | | | | | |
| | | | | | | | | | | |
Douglas Dynamics, Inc.
Notes to Consolidated Financial Statements (Continued)
Years ended December 31, 2013, 2012 and 2011
(Dollars in Thousands Except Per Share Data)
10. Income Taxes (Continued)
Significant components of the Company's deferred tax liabilities and assets are as follows:
| | | December 31, | December 31, | ||||||||||||
|---|---|---|---|---|---|---|---|---|---|---|---|---|---|---|---|
| | | 2010 | 2009 | 2013 | 2012 | ||||||||||
Deferred tax assets: | Deferred tax assets: | ||||||||||||||
Allowance for doubtful accounts | $ | 401 | $ | 223 | |||||||||||
Inventory reserves | 638 | 445 | |||||||||||||
Warranty liability | 1,455 | 1,346 | |||||||||||||
Deferred compensation | 570 | 383 | |||||||||||||
Earnout liability | 1,531 | — | |||||||||||||
Pension and retiree health benefit obligations | (869 | ) | 7,072 | ||||||||||||
Accrued vacation | 587 | 631 | |||||||||||||
Medical claims reserve | 263 | 261 | |||||||||||||
State net operating losses | 3,294 | 2,633 | |||||||||||||
Other accrued liabilities | 865 | 746 | |||||||||||||
Valuation allowance for state net operating losses | (1,395 | ) | (1,374 | ) | |||||||||||
Allowance for doubtful accounts | $ | 456 | $ | 284 | |||||||||||
Inventory reserves | 533 | 726 | |||||||||||||
Warranty liability | 1,291 | 1,143 | |||||||||||||
Deferred compensation | 666 | 264 | |||||||||||||
Pension and retiree health benefit obligations | 6,145 | 6,103 | |||||||||||||
Accrued vacation | 428 | 523 | |||||||||||||
Medical claims reserve | 214 | 214 | |||||||||||||
State net operating losses | 3,160 | 2,490 | |||||||||||||
Federal net operating losses | 3,310 | — | |||||||||||||
Valuation allowance for state net operating losses | (877 | ) | (566 | ) | |||||||||||
Other accrued liabilities | 886 | 784 | |||||||||||||
| | | | | | | ||||||||||
Total deferred tax assets | Total deferred tax assets | 16,212 | 11,965 | 7,340 | 12,366 | ||||||||||
Deferred tax liabilities: | Deferred tax liabilities: | ||||||||||||||
Tax deductible goodwill and other intangibles | (45,872 | ) | (39,664 | ) | |||||||||||
Accelerated depreciation | (2,040 | ) | (2,205 | ) | |||||||||||
Other | (251 | ) | (592 | ) | |||||||||||
Tax deductible goodwill | (17,474 | ) | (14,789 | ) | |||||||||||
Other intangibles | (12,960 | ) | (10,758 | ) | |||||||||||
Accelerated depreciation | (865 | ) | (1,280 | ) | |||||||||||
Prepaid insurance | (241 | ) | (209 | ) | |||||||||||
Deferred stock units | (180 | ) | (113 | ) | |||||||||||
| | | | | | | ||||||||||
Total deferred tax liabilities | Total deferred tax liabilities | (31,720 | ) | (27,149 | ) | (48,163 | ) | (42,461 | ) | ||||||
| | | | | | | ||||||||||
Net deferred tax liabilities | Net deferred tax liabilities | $ | (15,508 | ) | $ | (15,184 | ) | $ | (40,823 | ) | $ | (30,095 | ) | ||
| | | | | | | ||||||||||
| | | | | | | ||||||||||
Deferred income tax balances reflect the effects of temporary differences between the carrying amount of assets and liabilities and their tax basis and are stated at enacted tax rates expected to be in effect when taxes are actually paid or recovered.
State operating loss carry forwards for tax purposes were $61,112are $64,378 at December 31, 20102013, and will result in future tax benefits of approximately $3,160.$3,294. These loss carry-forwards will begin to expire beginning in 2019. The Company evaluated the need to maintain a valuation allowance against certain deferred tax assets. Based on this evaluation, which included a review of recent profitability and future projections of profitability, the Company concluded that a valuation allowance of approximately $877$1,395 is necessary at December 31, 20102013 for the state net operating loss carry-forwards which are likely to expire prior to the Company's ability to use the tax benefit.
InA reconciliation of the first quarter of 2009 the Company reversed $1,213 of its valuation allowancebeginning and ending liability for state net operating losses in Wisconsin due to auncertain tax law change, which was effective January 1, 2009.positions is as follows:
| | 2013 | 2012 | |||||
|---|---|---|---|---|---|---|---|
Balance at beginning of year | $ | 328 | $ | 320 | |||
Increases for tax position taken in prior years | 8 | 8 | |||||
| | | | | | | | |
Balance at the end of year | $ | 336 | $ | 328 | |||
| | | | | | | | |
| | | | | | | | |
Douglas Dynamics, Inc.
Notes to Consolidated Financial Statements (Continued)
Years ended December 31, 2010, 20092013, 2012 and 20082011
(Dollars in Thousands Except Share and Per Share Data)
10. Income Taxes (Continued)
A reconciliation of the beginning and ending liability for uncertain tax positions is as follows:
| | 2010 | 2009 | |||||
|---|---|---|---|---|---|---|---|
Balance at beginning of year | $ | 2,095 | $ | 1,613 | |||
Increases for tax positions taken in the current year | — | 356 | |||||
Increases for tax positions taken in prior years | — | 126 | |||||
Decreases due to settlements with taxing authorities | (1,297 | ) | — | ||||
Balance at the end of year | $ | 798 | $ | 2,095 | |||
The amount of the unrecognized tax benefits that would affect the effective tax rate, if recognized, was approximately $591 and $1,154$219 at December 31, 2010 and 2009 respectively.2013. The Company recognizes interest and penalties related to the unrecognized tax benefits in income tax expense. Approximately $174$70 and $653$62 of accrued interest and penalties is reported as an income tax liability at December 31, 20102013 and 2009,2012, respectively. The liability for unrecognized tax benefits is reported in Other Long-term Liabilities on the consolidated balance sheets at December 31, 20102013 and 2009. The Company recognized ($478) and $153 of (benefits) expenses related to interest and penalties in income tax expense for the years ended December 31, 2010 and 2009, respectively.2012.
The Company files income tax returns in the United States (Federal), Wisconsin (state), Maine (state) and various other states. Tax years open to examination by tax authorities under the statute of limitations include 2008, 20092011, 2012 and 20102013 for Federal and 20062009 through 20102013 for most states. Tax returns for the 20102013 tax year have not yet been filed.
11. Deferred Compensation
The Company has a long-term incentive compensation plan covering certain management employees. Under the terms of the plan, theprior to December 31, 2010 participants earn (lose)earned (lost) additional compensation based upon a percentage of the Company's cash flow from operations reduced by capital expenditures under a predetermined formula. In addition, participants' account balances under the plan increaseincreased or decreasedecreased on an annual basis based upon the Company's cash flow from operations reduced by capital expenditures under a predetermined formula. Amounts credited to participant accounts under the plan arewere, and continue to be as of December 31, 2013, non-forfeitable unless a participant is terminated for cause or voluntarily terminates his or her employment with the Company. In either of these events, the terminated participant will forfeit any positive amounts allocated to his or her account for the two years preceding the year of termination.
Compensation earned under the plan is deferred until such time as the participant has an account balance of more than two times his or her base compensation, at which point 20% of the balance is
Douglas Dynamics, Inc.
Notes to Consolidated Financial Statements (Continued)
Years ended December 31, 2010, 2009 and 2008
(in Thousands Except Share and Per Share Data)
11. Deferred Compensation (Continued)
paid to the participant in cash in a lump sum. Participants are paid their vested account balances under the plan upon separation from the Company as follows:
| | Payment Method | |
|---|---|---|
| ||
Balance of less than $75,000 | Lump sum | |
Balance greater than $75,000 | 5 equal annual installments |
With respect to account balances paid in installments, participants earn interest each year on the unpaid balance at the one-year U.S. Treasury rate in effect at the beginning of the year.
Activity for the plan is as follows:
| | December 31 | ||||||
|---|---|---|---|---|---|---|---|
| | 2010 | 2009 | |||||
Balance at beginning of year | $ | 1,705 | $ | 1,791 | |||
Participant earnings according to the terms of the plan | 128 | 120 | |||||
Payments to current and former participants | (258 | ) | (206 | ) | |||
Adjustments to Plan | (283 | ) | — | ||||
Balance at end of year | 1,292 | 1,705 | |||||
Less current portion | (225 | ) | (223 | ) | |||
Long Term balance at end of year | $ | 1,067 | $ | 1,482 | |||
Effective December 31, 2010, the Company modifiedfroze the deferred compensationlong-term incentive plan. The Company will continue to pay its obligations to previously designated recipients in accordance with the deferred compensation plan. However,plan, but no new compensation will be earned under the deferred compensation plan. As there were modifications
Douglas Dynamics, Inc.
Notes to Consolidated Financial Statements (Continued)
Years ended December 31, 2013, 2012 and 2011
(Dollars in Thousands Except Per Share Data)
11. Deferred Compensation (Continued)
Activity for the deferred compensation plan the Company reduced its obligation for expected forfeitures which was based on historical turnoveris as included above as "Adjustments to Plan."follows:
| | December 31 | ||||||
|---|---|---|---|---|---|---|---|
| | 2013 | 2012 | |||||
Balance at beginning of year | $ | 911 | $ | 1,067 | |||
Payments to current and former participants | (155 | ) | (156 | ) | |||
| | | | | | | | |
Balance at end of year | 756 | 911 | |||||
Less current portion | (98 | ) | (155 | ) | |||
| | | | | | | | |
Long term balance at end of year | $ | 658 | $ | 756 | |||
| | | | | | | | |
| | | | | | | | |
12. Employee Retirement Plans
Pension benefits
The Company provides noncontributory defined benefit pension plans for most employees. Plans covering salaried employees generally provide pension benefits that are based on the employee's average earnings and credited service. Plans covering hourly employees generally provide benefits of stated amounts for each year of service. The Company's funding policy for the plans is to contribute amounts sufficient to meet the minimum funding requirement of the Employee Retirement Income Security Act of 1974, plus any additional amounts that the Company may determine to be appropriate.
Douglas Dynamics, Inc.
Notes to Consolidated Financial Statements (Continued)
Years ended December 31, 2010, 2009 and 2008
(in Thousands Except Share and Per Share Data)
12. Employee Retirement Plans (Continued)
The reconciliation of the beginning and ending balances of the fair value of plan assets, funded status of plans, and amounts recognized in the consolidated balance sheets consisted of the following:
| | December 31 | |||||||
|---|---|---|---|---|---|---|---|---|
| | 2010 | 2009 | ||||||
Change in projected benefit obligation: | ||||||||
Benefit obligation at beginning of year | $ | 24,723 | $ | 23,010 | ||||
Service cost | 800 | 820 | ||||||
Interest cost | 1,432 | 1,355 | ||||||
Actuarial loss | 2,884 | 403 | ||||||
Benefits paid | (956 | ) | (865 | ) | ||||
Effect of curtailment | (326 | ) | — | |||||
Benefit obligation at end of year | 28,557 | 24,723 | ||||||
Change in plan assets: | ||||||||
Fair value of plan assets at beginning of year | 15,766 | 12,648 | ||||||
Actual return on plan assets | 2,085 | 2,630 | ||||||
Employer contributions through December 31 | 909 | 1,353 | ||||||
Benefits paid | (956 | ) | (865 | ) | ||||
Fair value of plan assets at end of year | 17,804 | 15,766 | ||||||
Funded Status: accrued pension liability | $ | (10,753 | ) | $ | (8,957 | ) | ||
In May 2010, in connection with the upcoming closure of the Company's manufacturing facility in Johnson City, TN substantially all the employees at this facility were terminated. This resulted in a cessation of all future benefit accruals for these employees under the Company's pension and other post employment benefit ("OPEB") plans. A curtailment gain of $326 was recognized as a reduction to the net actuarial loss, as the curtailment liability gain was less than the unrecognized net actuarial loss prior to the curtailment for the pension plan in the year ending December 31, 2010. Therefore, this did not impact the consolidated statement of operations for the year ending December 31, 2010.
The components of net periodic pension cost consisted of the following for the years ended December 31,
| | 2010 | 2009 | 2008 | ||||||||
|---|---|---|---|---|---|---|---|---|---|---|---|
Component of net periodic pension cost: | |||||||||||
Service cost | $ | 800 | $ | 820 | $ | 1,159 | |||||
Interest cost | 1,432 | 1355 | 1,667 | ||||||||
Expected return on plan assets | (1,162 | ) | (984 | ) | (1,914 | ) | |||||
Amortization of net loss | 324 | 519 | 0 | ||||||||
Net periodic pension cost | $ | 1,394 | 1,710 | $ | 912 | ||||||
| | December 31 | ||||||
|---|---|---|---|---|---|---|---|
| | 2013 | 2012 | |||||
Change in projected benefit obligation: | |||||||
Benefit obligation at beginning of year | $ | 36,209 | $ | 32,800 | |||
Service cost | 246 | 268 | |||||
Interest cost | 1,449 | 1,482 | |||||
Actuarial (gain) loss | (5,031 | ) | 2,944 | ||||
Benefits paid | (1,158 | ) | (1,285 | ) | |||
| | | | | | | | |
Benefit obligation at end of year | 31,715 | 36,209 | |||||
Change in plan assets: | |||||||
Fair value of plan assets at beginning of year | 21,808 | 18,637 | |||||
Actual return on plan assets | 3,160 | 2,442 | |||||
Employer contributions through December 31 | 828 | 2,014 | |||||
Benefits paid | (1,158 | ) | (1,285 | ) | |||
| | | | | | | | |
Fair value of plan assets at end of year | 24,638 | 21,808 | |||||
| | | | | | | | |
Funded Status: accrued pension liability | $ | (7,077 | ) | $ | (14,401 | ) | |
| | | | | | | | |
| | | | | | | | |
Douglas Dynamics, Inc.
Notes to Consolidated Financial Statements (Continued)
Years ended December 31, 2010, 20092013, 2012 and 20082011
(Dollars in Thousands Except Share and Per Share Data)
12. Employee Retirement Plans (Continued)
In November 2011, the Company took the following actions with respect to its pension plans effective as of December 31, 2011: It froze benefits as of January 1, 2012 for all employees under the Company's Pension Plan for Hourly Employees, froze benefits as of January 1, 2012 for all employees under the Company's Salaried Pension Plan for employees with less than five years of service and grandfathered employees (other than certain highly compensated employees) under the Company's Salaried Pension Plan with five or more years of service, but reduced the benefit accrual from 1.67% of pay to 1.00% of pay. In order to offset the loss of these benefit to employees, the Company has enhanced its defined contribution plan. The Company also established a nonqualified deferred compensation plan effective as of January 1, 2012, for certain highly compensated employees whose participation in the qualified plan is restricted. A liability gain of $1,408 from this curtailment was recognized as a reduction to the net actuarial loss, as the liability gain was less than the unrecognized net actuarial loss prior to the curtailment for the pension plan in the year ended December 31, 2011. Therefore, this did not impact the consolidated statement of income for the year ended December 31, 2011.
The components of net periodic pension cost consisted of the following for the years ended December 31,
| | 2013 | 2012 | 2011 | |||||||
|---|---|---|---|---|---|---|---|---|---|---|
Component of net periodic pension cost: | ||||||||||
Service cost | $ | 246 | $ | 268 | $ | 961 | ||||
Interest cost | 1,449 | 1,482 | 1,539 | |||||||
Expected return on plan assets | (1,409 | ) | (1,274 | ) | (1,357 | ) | ||||
Amortization of net loss | 1,205 | 770 | 454 | |||||||
| | | | | | | | | | | |
Net periodic pension cost | $ | 1,491 | 1,246 | $ | 1,597 | |||||
| | | | | | | | | | | |
| | | | | | | | | | | |
The accumulated benefit obligation for all pension plans as of December 31, 20102013 and 2009,2012, was $26,078$31,623 and $22,957,$34,949, respectively.
In accordance with its adoption of ASC 715-20, the Company useduses December 31 as its measurement date for all periods presented. Assumptions used in determining net periodic pension cost for the plans consisted of the following:
| | Year ended December 31 | Year ended December 31 | ||||||||||||||||||
|---|---|---|---|---|---|---|---|---|---|---|---|---|---|---|---|---|---|---|---|---|
| | 2010 | 2009 | 2008 | 2013 | 2012 | 2011 | ||||||||||||||
Discount rates | 6.0 | % | 6.0 | % | 6.0 | % | 4.1 | % | 4.6 | % | 5.5 | % | ||||||||
Rates of increase in compensation levels: | ||||||||||||||||||||
Salaried | 3.5 | 3.5 | 3.5 | 3.5 | 3.5 | 3.5 | ||||||||||||||
Hourly | N/A | N/A | N/A | N/A | N/A | N/A | ||||||||||||||
Expected long-term rate of return on assets | 8.0 | 8.0 | 8.0 | 7.25 | 7.25 | 8.0 | ||||||||||||||
Douglas Dynamics, Inc.
Notes to Consolidated Financial Statements (Continued)
Years ended December 31, 2013, 2012 and 2011
(Dollars in Thousands Except Per Share Data)
12. Employee Retirement Plans (Continued)
The discount rate used to determine the benefit obligation at December 31, 20102012 was 4.1% for both hourly and 2009 is 5.5%salaried pension plans. Meanwhile the discount rate used to determine the benefit obligation at December 31, 2013 was 4.9% and 6.0%,4.8% for the hourly and salaried pension plans, respectively.
For 2011,2014, the expected long-term rate of return on plan assets is 8.0%7.25%. To determine the long-term rate of return assumption for plan assets, the Company studies historical markets and preserves the long-term historical relationships between equities and fixed-income securities consistent with the widely accepted capital market principle that assets with higher volatility generate a greater return over the long run. The Company evaluates current market factors such as inflation and interest rates before it determines long-term capital market assumptions and reviews peer data and historical returns to check for reasonableness and appropriateness.
The expected benefit payments under the pension plans are as follows:
2011 | $ | 1,160 | ||
2012 | 1,240 | |||
2013 | 1,280 | |||
2014 | 1,310 | |||
2015 | 1,330 | |||
2016-2019 | 7,600 |
2014 | $ | 1,330 | ||
2015 | 1,340 | |||
2016 | 1,360 | |||
2017 | 1,400 | |||
2018 | 1,440 | |||
2019 - 2023 | 8,250 |
The Company made required minimum pension funding contributions of $909$828 to the pension plans in 20102013 and currently expects to make $1,917$1,410 of required minimum pension funding contributions in 2011.2014.
The Company maintains target allocation percentages among various asset classes based on an investment policy established for the pension plans, which is designed to achieve long-term objectives of return, while mitigating downside risk and considering expected cash flows. The current weighted-average target asset allocations are reflective of actual investments at December 31, 20102013 and 2009.2012. The investment policy is reviewed periodically in order to achieve overall objectives in light of current circumstances.
The Company's weighted-average asset allocation and actual allocation for the qualified pension plans by asset category at December 31 is as follows:
| | Target | 2013 | 2012 | |||||||||||||
|---|---|---|---|---|---|---|---|---|---|---|---|---|---|---|---|---|
Large Cap Equity | 37 | % | $ | 7,373 | 30 | % | $ | 6,766 | 31 | % | ||||||
Mid Cap Equity | 4 | % | 938 | 4 | % | 859 | 4 | % | ||||||||
Small Cap Equity | 3 | % | 935 | 4 | % | 876 | 4 | % | ||||||||
International Equity | 12 | % | 2,485 | 10 | % | 2,448 | 11 | % | ||||||||
Emerging markets Equity | 2 | % | 617 | 2 | % | 598 | 3 | % | ||||||||
Fixed Income and Cash Equivalents | 34 | % | 9,830 | 40 | % | 8,019 | 37 | % | ||||||||
Real Estate | 8 | % | 2,460 | 10 | % | 2,242 | 10 | % | ||||||||
| | | | | | | | | | | | | | | | | |
Total | 100 | % | $ | 24,638 | 100 | % | $ | 21,808 | 100 | % | ||||||
| | | | | | | | | | | | | | | | | |
| | | | | | | | | | | | | | | | | |
Douglas Dynamics, Inc.
Notes to Consolidated Financial Statements (Continued)
Years ended December 31, 2010, 20092013, 2012 and 20082011
(Dollars in Thousands Except Share and Per Share Data)
12. Employee Retirement Plans (Continued)
The Company's weighted-average asset allocation for the qualified pension plans by asset category at December 31 is as follows:
| | Target | 2010 | 2009 | |||||||||||||
|---|---|---|---|---|---|---|---|---|---|---|---|---|---|---|---|---|
Large Cap Equity | 37 | % | $ | 6,297 | 35 | % | $ | 6,106 | 39 | % | ||||||
Mid Cap Equity | 4 | % | 799 | 5 | % | 601 | 4 | % | ||||||||
Small Cap Equity | 3 | % | 772 | 4 | % | 586 | 4 | % | ||||||||
International Equity | 12 | % | 2,379 | 13 | % | 2,015 | 13 | % | ||||||||
Emerging markets Equity | 2 | % | 284 | 2 | % | 240 | 2 | % | ||||||||
Fixed Income and Cash Equivalents | 34 | % | 6,148 | 35 | % | 5,241 | 33 | % | ||||||||
Real Estate | 8 | % | 1,125 | 6 | % | 977 | 6 | % | ||||||||
Total | 100 | % | $ | 17,804 | 100 | % | $ | 15,766 | 100 | % | ||||||
The investment strategy is to build an efficient, well-diversified portfolio based on a long-term, strategic outlook of the investment markets. The investment market outlook utilizes both historical-based and forward-looking return forecasts to establish future return expectations for various asset classes. These return expectations are used to develop a core asset allocation based on the needs of the plan. The core asset allocation utilizes investment portfolios of various asset classes and multiple investment managers in order to help maximize the plan's return while providing multiple layers of diversification to help minimize risk.
The following table presents the fair values of the plan assets related to the Company's pension plans within the fair value hierarchy as defined in Note 2.
The fair values of the Company's pension plan assets as of December 31, 20102013 are as follows (in thousands):follows:
| | Balance as of December 31, 2010 | Quoted Prices in Active Markets for Identical Assets (Level 1) | Significant Other Observable Inputs (Level 2) | Significant Unobservable Inputs (Level 3) | Balance as of December 31, 2013 | Quoted Prices in Active Markets for Identical Assets (Level 1) | Significant Other Observable Inputs (Level 2) | Significant Unobservable Inputs (Level 3) | ||||||||||||||||||
|---|---|---|---|---|---|---|---|---|---|---|---|---|---|---|---|---|---|---|---|---|---|---|---|---|---|---|
Assets: | ||||||||||||||||||||||||||
Equity holdings | $ | 10,938 | $ | — | $ | 10,938 | $ | — | $ | 13,582 | $ | — | $ | 13,582 | $ | — | ||||||||||
Fixed-income holdings | 6,148 | — | 6,148 | — | 9,830 | — | 9,830 | — | ||||||||||||||||||
Alternative investments | 718 | — | — | 718 | 1,226 | — | — | 1,226 | ||||||||||||||||||
| | | | | | | | | | | |||||||||||||||||
Total pension plan assets | $ | 17,804 | $ | — | $ | 17,086 | $ | 718 | $ | 24,638 | $ | — | $ | 23,412 | $ | 1,226 | ||||||||||
| | | | | | | | | | | |||||||||||||||||
| | | | | | | | | | | |||||||||||||||||
The fair values of the Company's pension plan assets as of December 31, 2012 are as follows:
| | Balance as of December 31, 2012 | Quoted Prices in Active Markets for Identical Assets (Level 1) | Significant Other Observable Inputs (Level 2) | Significant Unobservable Inputs (Level 3) | |||||||||
|---|---|---|---|---|---|---|---|---|---|---|---|---|---|
Assets: | |||||||||||||
Equity holdings | $ | 12,672 | $ | — | $ | 12,672 | $ | — | |||||
Fixed-income holdings | 8,019 | — | 8,019 | — | |||||||||
Alternative investments | 1,117 | — | — | 1,117 | |||||||||
| | | | | | | | | | | | | | |
Total pension plan assets | $ | 21,808 | $ | — | $ | 20,691 | $ | 1,117 | |||||
| | | | | | | | | | | | | | |
| | | | | | | | | | | | | | |
Level 2 investments are based on quoted prices for similar assets in markets that are not active while Level 3 investments are comprised of a real estate fund for which the fair value is determined by taking the appraised values of the properties on hand plus other assets and subtracting mortgage loans and other liabilities.
Douglas Dynamics, Inc.
Notes to Consolidated Financial Statements (Continued)
Years ended December 31, 2010, 20092013, 2012 and 20082011
(Dollars in Thousands Except Share and Per Share Data)
12. Employee Retirement Plans (Continued)
The fair values of the Company's pension plan assets as of December 31, 2009 are as follows (in thousands):
| | Balance as of December 31, 2009 | Quoted Prices in Active Markets for Identical Assets (Level 1) | Significant Other Observable Inputs (Level 2) | Significant Unobservable Inputs (Level 3) | |||||||||
|---|---|---|---|---|---|---|---|---|---|---|---|---|---|
Assets: | |||||||||||||
Equity holdings | $ | 9,906 | $ | — | $ | 9,906 | $ | — | |||||
Fixed-income holdings | 5,241 | — | 5,241 | — | |||||||||
Alternative investments | 619 | — | — | 619 | |||||||||
Total pension plan assets | $ | 15,766 | $ | — | $ | 15,147 | $ | 619 | |||||
The following table presents a reconciliation of the fair value measurements using significant unobservable inputs (Level 3) (in thousands):
| | December 31, | December 31, | ||||||||||||
|---|---|---|---|---|---|---|---|---|---|---|---|---|---|---|
| | 2010 | 2009 | 2013 | 2012 | ||||||||||
Balance, beginning of year | $ | 619 | $ | 905 | $ | 1,117 | $ | 1,096 | ||||||
Deposits | 41 | 187 | ||||||||||||
Actual return on plan assets held at reporting date | 99 | (286 | ) | 149 | 125 | |||||||||
Withdrawals | (81 | ) | (291 | ) | ||||||||||
| | | | | | | |||||||||
Balance, end of year | $ | 718 | $ | 619 | $ | 1,226 | $ | 1,117 | ||||||
| | | | | | | |||||||||
| | | | | | | |||||||||
The fair value of the real estate fund is determined by taking the appraised values of the properties on hand plus other assets and subtracting mortgage loans and other liabilities.
Postretirement benefits
The Company provides postretirement healthcare benefits for certain employee groups. The postretirement healthcare plans are contributory and contain certain other cost-sharing features such as deductibles and coinsurance. The plans are unfunded. Employees do not vest until they retire from active employment with the Company and have at least twelve years of service. These benefits can be amended or terminated at anytime and are subject to the same ongoing changes as ourthe Company's healthcare benefits for employees with respect to deductible, co-insurance and participant contributions.
Effective January 1, 2004, the postretirement healthcare benefits were extended to all active employees of the Company as of December 31, 2003. The period of coverage was reduced and the retiree contribution percentage was increased in order to keep the cost of the plan equivalent to the previous plan design.
Maximum coverage under the plan is limited to ten years. All benefits terminate upon the death of the retiree. Employees who began working for the Company after December 31, 2003, are not eligible for postretirement healthcare benefits.
Douglas Dynamics, Inc.
Notes to Consolidated Financial Statements (Continued)
Years ended December 31, 2010, 20092013, 2012 and 20082011
(Dollars in Thousands Except Share and Per Share Data)
12. Employee Retirement Plans (Continued)
The reconciliation of the beginning and ending balances of the projected benefit obligation for the Company consisted of the following:
| | | December 31 | December 31 | ||||||||||||
|---|---|---|---|---|---|---|---|---|---|---|---|---|---|---|---|
| | | 2010 | 2009 | 2013 | 2012 | ||||||||||
Change in projected benefit obligation: | Change in projected benefit obligation: | ||||||||||||||
Benefit obligation at beginning of year | $ | 6,812 | $ | 8,402 | |||||||||||
Service cost | 250 | 281 | |||||||||||||
Interest cost | 245 | 360 | |||||||||||||
Participant contributions | 100 | 103 | |||||||||||||
Changes in actuarial assumptions | (2,085 | ) | (1,590 | ) | |||||||||||
Benefits paid | (448 | ) | (744 | ) | |||||||||||
| | | | | | | ||||||||||
Projected benefit obligation at end of year | $ | 4,874 | $ | 6,812 | |||||||||||
| | | | | | | ||||||||||
| | | | | | | ||||||||||
Amounts recognized in the consolidated balance sheets consisted of: | |||||||||||||||
Accrued expenses and other current liabilities | $ | 220 | $ | 271 | |||||||||||
Retiree health benefit obligation | 4,654 | 6,541 | |||||||||||||
| | | | | | | ||||||||||
Benefit obligation at beginning of year | $ | 8,198 | $ | 7,155 | $ | 4,874 | $ | 6,812 | |||||||
Service cost | 308 | 305 | |||||||||||||
| | | | | | | ||||||||||
| | | | | | | ||||||||||
Interest cost | 455 | 420 | |||||||||||||
Participant contributions | 94 | 86 | |||||||||||||
Changes in actuarial assumptions | (154 | ) | 701 | ||||||||||||
Benefits paid | (294 | ) | (469 | ) | |||||||||||
Plan Curtailment | (1,031 | ) | — | ||||||||||||
Projected benefit obligation at end of year | $ | 7,576 | $ | 8,198 | |||||||||||
Amounts recognized in the consolidated balance sheets consisted of: | |||||||||||||||
Accrued expenses and other current liabilities | $ | 341 | $ | 350 | |||||||||||
Retiree health benefit obligation | 7,235 | 7,848 | |||||||||||||
| $ | 7,576 | $ | 8,198 | ||||||||||||
In May 2010, in connection with the upcoming closureThe components of postretirement healthcare benefit cost consisted of the Company's manufacturing facility in Johnson City, TN substantially all the employees at this facility were terminated. This resulted in a cessation of all future benefit accruals for these employees under the Company's pension and other post employment benefit ("OPEB") plans. The curtailment gainfollowing for the OPEB plan, exceeded the unrecognized net actuarial loss prioryears ended December 31,
| | 2013 | 2012 | 2011 | |||||||
|---|---|---|---|---|---|---|---|---|---|---|
Component of net postretirement health benefit cost: | ||||||||||
Service cost | $ | 250 | $ | 281 | $ | 263 | ||||
Interest cost | 245 | 360 | 407 | |||||||
Amortization of net gain | (172 | ) | (17 | ) | (61 | ) | ||||
| | | | | | | | | | | |
Net postretirement healthcare benefit cost | $ | 323 | $ | 624 | $ | 609 | ||||
| | | | | | | | | | | |
| | | | | | | | | | | |
Douglas Dynamics, Inc.
Notes to the curtailment and resulted in a gain of $1,031 of which $667 was recorded in selling, general and administrative expense in the consolidated statement of operations for yearConsolidated Financial Statements (Continued)
Years ended December 31, 20102013, 2012 and $364 (before taxes) was recognized as a reduction to the net actuarial loss2011
(Dollars in accumulated other comprehensive loss at December 31, 2010.Thousands Except Per Share Data)
12. Employee Retirement Plans (Continued)
The assumed discount and healthcare cost trend rates are summarized as follows:
| | Year Ended December 31 | |||||||||
|---|---|---|---|---|---|---|---|---|---|---|
| | 2013 | 2012 | 2011 | |||||||
Discount rate | 3.7 | % | 4.4 | % | 5.5 | % | ||||
Immediate healthcare cost trend rate | 7.0 | 8.0 | 9.0 | |||||||
Ultimate healthcare cost trend rate | 4.5 | 4.5 | 5.0 | |||||||
Assumed annual reduction in trend rate | * | ** | *** | |||||||
Participation | 80 | 80 | 80 | |||||||
| | December 31 | |||||||||
|---|---|---|---|---|---|---|---|---|---|---|
| | 2010 | 2009 | 2008 | |||||||
Discount rate | 5.5 | % | 6.0 | % | 6.0 | % | ||||
Immediate healthcare cost trend rate | 9.0 | 9.0 | 8.5 | |||||||
Ultimate healthcare cost trend rate | 5.0 | 5.0 | 5.0 | |||||||
Assumed annual reduction in trend rate | ** | 0.5 | 0.5 | |||||||
Participation | 80 | 80 | 80 | |||||||
Douglas Dynamics, Inc.
Notes to Consolidated Financial Statements (Continued)
Years ended December 31, 2010, 2009 and 2008
(in Thousands Except Share and Per Share Data)
12. Employee Retirement Plans (Continued)
The discount rate used to determine the benefit obligation at December 31, 2010, 20092013 and 20082012 is 5.5%, 6.0%,4.5% and 6.0%3.7%, respectively. In all years presented the combination of pension cash flows were used to develop a single equivalent discount rate. For December 31, 2010,2013, the health care cost trend rate is assumed to be 9.0%7.0% for participants under 65 and 5.0% for those over 65 beginning in 20112014 gradually reducing to an ultimate rate of 5.0%4.5% in 2017. In 20092020 for both participants under 65 and 2008 a flat rate of 0.5% was used forover 65. For December 31, 2012, the health care cost trend.trend rate is assumed to be 8.0% for participants under 65 and 6.0% for those over 65 beginning in 2013 gradually reducing to an ultimate rate of 4.5% in 2021 for both participants under 65 and over 65. For December 31, 2011, the health care cost trend rate is assumed to be 8.0% beginning in 2012 gradually reducing to an ultimate rate of 4.5% in 2019.
A one percentage point change in the healthcare cost trend rate would have the following effect at December 31, 2010:2013:
| | 1% Increase | 1% Decrease | 1% Increase | 1% Decrease | ||||||||||
|---|---|---|---|---|---|---|---|---|---|---|---|---|---|---|
Effect on total service and interest cost | $ | 98 | $ | (83 | ) | $ | 51 | $ | (44 | ) | ||||
Effect on postretirement benefit obligation | 904 | (774 | ) | 555 | (482 | ) | ||||||||
Amounts included in other comprehensive loss, net of tax, at December 31, 2010,2013, which have not yet been recognized in net periodic pension or OPEB cost, were net actuarial gain (loss) of $(4,835)($2,912) and $404$2,234 for the pension plans and postretirement healthcare benefits,benefit plans, respectively. The estimated actuarial gain (loss) for the defined benefit plans that will be amortized from accumulated other comprehensive loss into net periodic pension or OPEB cost during 20112014 are ($454)202) and $61$398 for the pension plans and postretirement healthcare benefits,benefit plans, respectively.
During the yearTable of Contents
Douglas Dynamics, Inc.
Notes to Consolidated Financial Statements (Continued)
Years ended December 31, 2008 the Company adopted the guidance originally issued under FAS No. 158 (codified under ASC 715-20) to measure the funded status of the plan as of its year end, December 31 versus the previous measurement date of October 1. Upon adoption of this requirement, the Company recorded a reduction to retained earnings of $114 net of tax of $682013, 2012 and an increase to accumulated other comprehensive loss of $1,642, net of tax of $896.2011
(Dollars in Thousands Except Per Share Data)
12. Employee Retirement Plans (Continued)
Defined contribution plan
The Company has a defined contribution plan, which qualifies under Section 401(k) of the Internal Revenue Code thatand provides substantially all employees an opportunity to accumulate personal funds for their retirement. Contributions are made on a before-tax basis to these plans.the plan and are invested, at the employees' direction, among a variety of investment alternatives including, commencing January 1, 2013, a Company common stock fund designated as an employee stock ownership plan.
As determined by the provisions of the plan, the Company matches a portion of the employees' basic voluntary contributions. The Company matching contributions to the plan were approximately $123, $137$213, $198 and $140 for the years ended December 31, 2010, 20092013, 2012 and 2008,2011, respectively. Beginning January 1, 2012, the Company amended its defined contribution plan to permit non-discretionary employer contributions. The Company made non-discretionary employer contributions of $807 and $871 in the years ended December 31, 2013 and December 31, 2012, respectively.
Non-qualified plan
The Company also maintains a supplemental non-qualified plan for certain officers and other key employees. Expense for this plan was $450 and $471 for the years ended December 31, 2013 and December 31, 2012, respectively. The amount accrued was $1,105 and $497 as of December 31, 2013 and December 31, 2012, respectively. Amounts were determined based on the fair value of the liability at December 31, 2013 and December, 31, 2012, respectively.
13. Stock-Based Compensation
Amended and Restated 2004 Stock Incentive Plan
In connection with the IPO, in May 2010, the Company's Board of Directors and stockholders amended and restated the Company's 2004 Stock Incentive Plan (as amended and restated, the "A&R 2004 Plan") and certain outstanding award agreements thereunder, to among other things, eliminate the ability of the holders thereunder to use a promissory note to pay any portion of the exercise price of the options, to provide that the use of "net exercises" to pay any portion of the exercise price of the options shall be at the sole discretion of the committee administering the A&R 2004 Plan, and to effect
Douglas Dynamics, Inc.
Notes to Consolidated Financial Statements (Continued)
Years ended December 31, 2010, 2009 and 2008
(in Thousands Except Share and Per Share Data)
13. Stock-Based Compensation (Continued)
certain ministerial changes under the A&R 2004 Plan. In addition, in connection with the IPO, the Board of Directors also resolved not to issue any further awards under the A&R 2004 Plan. As of December 31, 2010, 356,6132013, 37,240 shares of common stock are reserved for issuance upon the exercise of outstanding options under the A&R 2004 Plan. All outstanding options are fully vested, excluding 47,500 options, of which 23,750 will vest on August 27, 2011 and the remaining options will vest on August 27, 2012.vested. All options expire 10 years from the date of grant.
2010 Stock Incentive Plan
In connection with the IPO, in May 2010, the Company's Board of Directors and stockholders adopted the 2010 Stock Incentive Plan (the "2010 Plan"). The 2010 Plan provides for the issuance of nonqualified stock options, incentive stock options, stock appreciation rights, restricted stock awards and restricted stock units, any of which may be performance-based, and for incentive bonuses, which
Douglas Dynamics, Inc.
Notes to Consolidated Financial Statements (Continued)
Years ended December 31, 2013, 2012 and 2011
(Dollars in Thousands Except Per Share Data)
13. Stock-Based Compensation (Continued)
may be paid in cash or stock or a combination of both, to eligible employees, officers, non-employee directors and other service providers to the Company and its subsidiaries. A maximum of 2,130,000 shares of common stock may be issued pursuant to all awards under the 2010 Plan.
In May 2010, in connection with the IPO, an aggregate of 208,130 shares of restricted stock were granted to certain officers and employees under the 2010 Plan. The restricted stock awards were time-based and vest over a five-year period in equal annual installments of 20% per year, commencing on the first anniversary of the grant date. In the fourth quarter of 2010, the compensation committee retroactively modified the participation of the restricted stock to the IPO. Previously, the restricted stock did not carry voting or dividend rights until the stock vested. Subsequent to the amendment, the restricted stock carried both voting and dividend rights retroactively to the IPO date.
In the final quarter of 2010, the compensation committee approved a long-term incentive program (the "LTIP") under the 2010 Plan. Under the LTIP, executive officers, including its named executive officers, will be issued shares of the Company's common stock. The initial awards under the LTIP consist of (i) a performance-based incentive award that will result in an issuance to the executive officers of 44,350 unrestricted shares of common stock in March 2011 based upon performance metrics both performed and earned through December 31, 2010 and (ii) an issuance of 33,954 shares of restricted stock, subject to vesting contingent on the executive officer's continuous employment with the Company through the applicable vesting date. The first tranche will be immediately vested upon issuance. The remaining two tranches will vest in January 2012 and 2013, contingent on the executive officer's continuous employment through the applicable vesting date. The restricted shares granted in October of 2010 carry dividend rights once the shares are issued, but no voting rights until vesting.
Stock Options
The following table summarizes information with respect to the Company's stock option activity under the A&R 2004 Plan for the years ended December 31, 2010, 2009 and 2008. In connection with the IPO, certain of the Company's selling stockholders exercised 288,001 stock options and sold the underlying shares. Such stockholders paid the exercise price of such options through a net exercise. Subsequent to the IPO, certain of the Company's option holders exercised 174,571 stock options and
Douglas Dynamics, Inc.
Notes to Consolidated Financial Statements (Continued)
Years ended December 31, 2010, 2009 and 2008
(in Thousands Except Share and Per Share Data)
13. Stock-Based Compensation (Continued)
paid the exercise price of such options through a net exercise, resulting in an additional 95,000 outstanding shares. The options exercised in conjunction with the IPO as well as those exercised subsequently in the year ended December 31, 2010 were granted under APB 25 with an exercise price equal to fair value at date of grant, and accordingly no compensation expense was recorded at the time of grant. Because of the net exercise mechanism, the option holders did not bear the risk and rewards of the options. As such, the Company recorded $2,975 of stock based compensation expense for the year ended December 31, 2010 related to stock options.
| | December 31, 2010 | December 31, 2009 | December 31, 2008 | ||||||||||||||||
|---|---|---|---|---|---|---|---|---|---|---|---|---|---|---|---|---|---|---|---|
| | Options | Weighted average exercise price | Options | Weighted average exercise price | Options | Weighted average exercise price | |||||||||||||
Outstanding—beginning of year | 819,185 | $ | 4.21 | 908,556 | $ | 4.21 | 1,058,894 | $ | 4.21 | ||||||||||
Granted | — | — | — | — | — | — | |||||||||||||
Canceled | — | — | (89,371 | ) | 4.21 | (150,338 | ) | 4.21 | |||||||||||
Exercised | (462,572 | ) | 4.21 | — | — | — | — | ||||||||||||
Outstanding—end of year | 356,613 | $ | 4.21 | 819,185 | $ | 4.21 | 908,556 | $ | 4.21 | ||||||||||
Exercisable—end of year | 309,113 | $ | 4.21 | 747,935 | $ | 4.21 | 659,656 | $ | 4.21 | ||||||||||
As of December 31, 2010, 2009 and 2008, the weighted-average remaining contractual life of all outstanding options was 4.0, 4.8 and 5.8 years, respectively. As of December 31, 2010, 2009 and 2008, the weighted-average remaining contractual life of all exercisable options was 3.6, 4.6 and 5.5 years, respectively.
The aggregate intrinsic value of the options at December 31, 2010 was $3,901 and $3,382 for options outstanding and exercisable, respectively. The aggregate intrinsic value of the options at December 31, 2009 was $6,752 and $6,165 for options outstanding and exercisable, respectively. There were no options exercised for the years ended December 31, 2009 and 2008. The aggregate intrinsic value of stock options exercised during 2010 was $2,885.
On January 23, 2009, the Company entered into securities repurchase agreements with certain members of management. Pursuant to these agreements, the Company repurchased at fair value and subsequently retired 32,633 shares of common stock and 89,371 stock options in exchange for aggregate consideration of $1,137, comprised of a cash payment of $1,000 and the satisfaction of the remaining principal amount of $137 on promissory notes held by the members of management. As a result of the repurchase of stock options, the Company recorded $732 of compensation expense in the first quarter of 2009, which represented the fair value of the repurchased options. See footnote 16, "Redeemable stock and stockholders' equity." Stock-based compensation for the years ended December 31, 2008 was not material.
As of December 31, 2010 and 2009, the Company has stockholders' notes receivable with recourse of $482 and $1,013 including accrued interest, respectively, related to the exercise of options, which are included as a component of stockholders' equity. The stockholders' notes receivable are payable in 2014 and bear interest of 5%.
Douglas Dynamics, Inc.
Notes to Consolidated Financial Statements (Continued)
Years ended December 31, 2010, 2009 and 2008
(in Thousands Except Share and Per Share Data)
13. Stock-Based Compensation (Continued)
Restricted Stock
A summary of restricted stock activity for the year ended December 31, 2010 is as follows:
| | Shares (In thousands) | Weighted Average Grant Date Fair value | Weighted Average Remaining Contractual Term | |||||||
|---|---|---|---|---|---|---|---|---|---|---|
Unvested at December 31, 2009 | — | — | — | |||||||
Granted | 242,084 | $ | 11.68 | — | ||||||
Vested | — | — | — | |||||||
Cancelled and forfeited | — | — | — | |||||||
Unvested at December 31, 2010 | 242,084 | $ | 11.68 | 4.01 years | ||||||
Expected to vest in the future at December 31, 2010 | 233,369 | $ | 11.68 | 4.01 years | ||||||
The fair value of the Company's restricted stock awards is the closing stock price on the date of grant. The closing price the date the restricted shares were granted at the time of the IPO was $11.25 per share, while the closing price of the restricted shares granted in the fourth quarter was $14.32 per share. The Company recognized $419 of compensation expense related to restricted stock awards for the year ended December 31, 2010. The unrecognized compensation expense for shares expected to vest as of December 31, 2010 was approximately $2,311 and is expected to be recognized over a weighted average period of 4.01 years.
Unrestricted Stock
The Company granted 44,350 shares of unrestricted stock as performance based awards under the 2010 plan. The fair value of the Company's unrestricted stock awards is the closing stock price on the date of grant, or $14.32 per share. The Company recognized $635 of compensation expense related to unrestricted stock awards granted for the year ended December 31, 2010. The unrestricted awards will be issued in March 2011. There is no required vesting period for the unrestricted stock units as recipients are entitled to shares upon grant and performance satisfaction, which both occurred by the year ended December 31, 2010.
As of December 31, 2010,2013, the Company had 1,843,5661,595,858 shares of common stock available for future issuance of awards under the 2010 Plan. The shares of common stock to be issued under the 2010 Plan will be made available from authorized and unissued Company common stock.
Stock Options
The following table summarizes information with respect to the Company's stock option activity under the A&R 2004 Plan for the years ended December 31, 2013, 2012 and 2011.
| | December 31, 2013 | December 31, 2012 | December 31, 2011 | ||||||||||||||||
|---|---|---|---|---|---|---|---|---|---|---|---|---|---|---|---|---|---|---|---|
| | Options | Weighted average exercise price | Options | Weighted average exercise price | Options | Weighted average exercise price | |||||||||||||
Outstanding—beginning of year | 37,240 | $ | 4.21 | 37,240 | $ | 4.21 | 356,623 | $ | 4.21 | ||||||||||
Granted | — | — | — | — | — | — | |||||||||||||
Canceled | — | — | — | — | — | — | |||||||||||||
Exercised | — | — | — | — | (319,383 | ) | 4.21 | ||||||||||||
| | | | | | | | | | | | | | | | | | | | |
Outstanding—end of year | 37,240 | $ | 4.21 | 37,240 | $ | 4.21 | 37,240 | $ | 4.21 | ||||||||||
| | | | | | | | | | | | | | | | | | | | |
Exercisable—end of year | 37,240 | $ | 4.21 | 37,240 | $ | 4.21 | 37,240 | $ | 4.21 | ||||||||||
| | | | | | | | | | | | | | | | | | | | |
| | | | | | | | | | | | | | | | | | | | |
No stock options were exercised in either of the years ended December 31, 2013 or December 31, 2012. Certain of the Company's option holders exercised 319,383 stock options during the year ended December 31, 2011, of which 184,236 options were exercised utilizing a broker assisted cashless exercise. The options exercised were granted under APB 25 with an exercise price equal to fair value at date of grant, and accordingly so, no compensation expense was recorded at the time of grant. The Company did not bear the risk and rewards of the options and thus, did not record stock based compensation expense. The option holders paid the Company the required exercise price for the remaining options at the time of exercise and therefore the Company did not record any stock based compensation expense.
As of December 31, 2013, 2012 and 2011, the weighted-average remaining contractual life of all outstanding options was 2.7, 3.7 and 4.7 years, respectively. As of December 31, 2013, 2012 and 2011, the weighted-average remaining contractual life of all exercisable options was 2.7, 3.7 and 4.7 years, respectively.
The aggregate intrinsic value of the options at December 31, 2013 was $470 for both options outstanding and exercisable. The aggregate intrinsic value of the options at December 31, 2012 was $379 for both options outstanding and exercisable. There were no options exercised for the years ended December 31, 2013 and December 31, 2012. The aggregate intrinsic value of stock options exercised during 2011 was $3,200.
Douglas Dynamics, Inc.
Notes to Consolidated Financial Statements (Continued)
Years ended December 31, 2013, 2012 and 2011
(Dollars in Thousands Except Per Share Data)
13. Stock-Based Compensation (Continued)
Restricted Stock
Restricted stock carries both voting and dividend rights. A summary of restricted stock activity for the years ended December 31, 2013, 2012 and 2011 is as follows:
| | Shares | Weighted Average Grant Date Fair value | Weighted Average Remaining Contractual Term | |||||
|---|---|---|---|---|---|---|---|---|
Unvested at December 31, 2010 | 242,088 | $ | 11.68 | 4.01 years | ||||
Granted | 43,690 | 14.99 | 2.00 years | |||||
Vested | (50,111 | ) | 11.77 | — | ||||
Cancelled and forfeited | — | — | — | |||||
| | | | | | | | | |
Unvested at December 31, 2011 | 235,667 | 12.27 | 2.83 years | |||||
Granted | 42,077 | 14.57 | 2.00 years | |||||
Vested | (68,921 | ) | 12.61 | — | ||||
Cancelled and forfeited | — | — | — | |||||
| | | | | | | | | |
Unvested at December 31, 2012 | 208,823 | 12.63 | 1.94 years | |||||
Granted | 44,022 | 14.78 | 2.00 years | |||||
Vested | (82,942 | ) | 12.97 | — | ||||
Cancelled and forfeited | — | — | — | |||||
| | | | | | | | | |
Unvested at December 31, 2013 | 169,903 | $ | 13.03 | 1.34 years | ||||
| | | | | | | | | |
| | | | | | | | | |
Expected to vest in the future at December 31, 2013 | 163,786 | $ | 13.03 | 1.34 years | ||||
| | | | | | | | | |
| | | | | | | | | |
The fair value of the Company's restricted stock awards is the closing stock price on the date of grant. The Company recognized $1,126 , $1,092, and $848 of compensation expense related to restricted stock awards for the years ended December 31, 2013, December 31, 2012, and December 31, 2011, respectively. The unrecognized compensation expense for shares expected to vest as of December 31, 2013 and December 31, 2012 was approximately $1,218 and $1,685, respectively.
Unrestricted Stock
The Company did not grant any shares of unrestricted stock in the year ended December 31, 2013. The Company granted 58,441, and 68,224 shares of unrestricted stock as performance based awards under the 2010 plan in the years ended December 31, 2012 and December 31, 2011, respectively. The fair value of the Company's unrestricted stock awards is the closing stock price on the date of grant, or $12.94, and $15.01 per share, for grants in years ended December 31, 2012 and December 31, 2011, respectively. The Company recognized $756 and $1,024 of compensation expense related to unrestricted stock awards granted for the years ended December 31, 2012 and December 31, 2011, respectively. The shares of unrestricted stock subject to awards granted in 2011 were issued in March 2012, while the shares of unrestricted stock subject to awards granted in 2012 were issued in March 2013. There is no
Douglas Dynamics, Inc.
Notes to Consolidated Financial Statements (Continued)
Years ended December 31, 2013, 2012 and 2011
(Dollars in Thousands Except Per Share Data)
13. Stock-Based Compensation (Continued)
required vesting period for the unrestricted shares of stock as recipients are entitled to the shares following grant and satisfaction of performance requirements of the award, both of which occurred by the years ended December 31, 2011 and December 31, 2012.
Restricted Stock Units
Restricted stock units ("RSUs") are granted to both non-employee directors and management. Prior to 2013, RSUs were only issued to directors. However, in 2013, the Company changed the timing and form of management's annual stock grants and began to grant RSUs to management. For both non-employee directors and maangement, RSUs carry dividend equivalent rights but do not carry voting rights. Each RSU represents the right to receive one share of the Company's common stock and is subject to time based vesting restrictions. Participants are not required to pay any consideration to the Company at either the time of grant of a RSU or upon vesting.
In 2013, the Company's compensation committee approved a retirement provision for RSUs issued to management. The retirement provision provides that members of management who either (1) are age 65 or older or (2) have at least ten years of service and are at least age 55 will continue to vest in unvested RSUs upon retirement. As the retirement provision does not qualify as a substantive service condition, the Company incurred $261 in additional expense in the year ended December 31, 2013 as a result of accelerated stock based compensation expense for employees who meet the thresholds of the retirement provision. The Company's nominating and governance committee also approved a retirement provision for the RSUs issued to non-employee directors that accelerates the vesting of such RSUs upon retirement. Such awards are fully expensed immediately upon grant in accordance with ASC 718, as the retirement provision eliminates substantive service conditions associated with the awards.
Douglas Dynamics, Inc.
Notes to Consolidated Financial Statements (Continued)
Years ended December 31, 2013, 2012 and 2011
(Dollars in Thousands Except Per Share Data)
13. Stock-Based Compensation (Continued)
A summary of RSU activity for the years ended December 31, 2013 and 2012 is as follows:
| | Shares | Weighted Average Grant Date Fair value | Weighted Average Remaining Contractual Term | |||||||
|---|---|---|---|---|---|---|---|---|---|---|
Unvested at December 31, 2010 | — | — | — | |||||||
Granted | 20,612 | $ | 15.21 | — | ||||||
Vested | (1,719 | ) | 15.25 | — | ||||||
Cancelled and forfeited | — | — | — | |||||||
| | | | | | | | | | | |
Unvested at December 31, 2011 | 18,893 | 15.20 | 2.00 years | |||||||
Granted | 14,367 | 14.35 | 1.02 years | |||||||
Vested | (7,214 | ) | 15.21 | — | ||||||
Cancelled and forfeited | — | — | — | |||||||
| | | | | | | | | | | |
Unvested at December 31, 2012 | 26,046 | 14.73 | 0.72 years | |||||||
Granted | 70,324 | 14.52 | 0.82 years | |||||||
Vested | (53,022 | ) | 14.68 | |||||||
Cancelled and forfeited | — | — | — | |||||||
| | | | | | | | | | | |
Unvested at December 31, 2013 | 43,348 | $ | 14.46 | 1.55 years | ||||||
| | | | | | | | | | | |
| | | | | | | | | | | |
Expected to vest in the future at December 31, 2013 | 41,787 | $ | 14.46 | 1.55 years | ||||||
| | | | | | | | | | | |
| | | | | | | | | | | |
The Company recognized $852 of compensation expense related to the RSU awards in the year ended December 31, 2013. The unrecognized compensation expense, net of expected forfeitures, calculated under the fair value method for shares that were, as of December 31, 2013, expected to be earned through the requisite service period was approximately $357 and is expected to be recognized through 2016.
Vested RSUs are "settled" by the delivery to the participant or a designated brokerage firm of one share of common stock per vested RSU as soon as reasonably practicable following a termination of service of the participant that constitutes a separation from service, and in all events no later than the end of the calendar year in which such termination of service occurs or, if later, two and one-half months after such termination of service.
Douglas Dynamics, Inc.
Notes to Consolidated Financial Statements (Continued)
Years ended December 31, 2013, 2012 and 2011
(Dollars in Thousands Except Per Share Data)
13. Stock-Based Compensation (Continued)
Performance Share Unit Awards
The Company granted performance share units as performance based awards under the 2010 Plan in the first quarter of 2013 that are subject to performance conditions. Upon meeting the prescribed performance conditions, in the first quarter of the year subsequent to grant, employees will be issued RSUs of which one third will vest immediately upon issuance. The remaining RSU's issued will be subject to vesting over the two years following the end of the performance period. In accordance with ASC 718, such awards are being expensed over the vesting period from the date of grant through the requisite service period, based upon the most probable outcome. As of December 31, 2013, the performance conditions for share units granted in the year ended December 31, 2013 have been met. Thus, in the first quarter of 2014, management estimates that 74,516 performance shares units will be converted into RSU's. Upon conversion the first third of the RSU's issued will immediately vest and converted into common shares. The remaining two thirds of the RSU's issued will vest ratably over the remaining two-year vesting period. The fair value per share of the awards is the closing stock price on the date of grant, which was $14.40. The Company recognized $609 of compensation expense related to the awards in the year ended December 31, 2013. The unrecognized compensation expense calculated under the fair value method for shares that were, as of December 31, 2013, expected to be recognized through the requisite service period was $453 and is expected to be recognized through 2016.
14. Earnings Per Share
Basic earnings per share of common stock is computed by dividing net income by the weighted average number of common shares outstanding during the period. Diluted earnings per share of common stock is computed by dividing net income by the weighted average number of common shares and common stock equivalents related to the assumed exercise of stock options, using the two-class
Douglas Dynamics, Inc.
Notes to Consolidated Financial Statements (Continued)
Years ended December 31, 2010, 2009 and 2008
(in Thousands Except Share and Per Share Data)
14. Earnings Per Share (Continued)
method. Stock options for which the exercise price exceeds the average fair value have an anti-dilutive effect on earnings per share and are excluded from the calculation. There were no shares excluded from diluted earnings per share for the years presented.
Subsequent to the payment of the third quarter 2010 dividend, which was the first dividend payment made subsequent to the IPO, management retroactively approved allAll restricted stockholders for shares issued and outstanding toRSU holders participate in dividends. As such,Thus, the Company has calculated earnings per share pursuant to the two-class method, which is an earnings allocation formula that determines earnings per share for common stock and participating securities according to dividends declared and participation rights in undistributed earnings. Under this method, all earnings (distributed
Douglas Dynamics, Inc.
Notes to Consolidated Financial Statements (Continued)
Years ended December 31, 2013, 2012 and 2011
(Dollars in Thousands Except Per Share Data)
14. Earnings Per Share (Continued)
(distributed and undistributed) are allocated to common shares and participating securities based on their respective rights to receive dividends.
| | 2010 | 2009 | 2008 | 2013 | 2012 | 2011 | ||||||||||||||
|---|---|---|---|---|---|---|---|---|---|---|---|---|---|---|---|---|---|---|---|---|
Basic earnings per common share | ||||||||||||||||||||
Net income | $ | 1,662 | $ | 9,843 | $ | 11,471 | $ | 11,639 | $ | 6,012 | $ | 19,040 | ||||||||
Less income allocated to participating securities | 12 | — | — | 179 | 69 | 233 | ||||||||||||||
| | | | | | | | | |||||||||||||
Net income allocated to common shareholders | $ | 1,650 | $ | 9,843 | $ | 11,471 | $ | 11,460 | $ | 5,943 | $ | 18,807 | ||||||||
| | | | | | | | | |||||||||||||
| | | | | | | | | |||||||||||||
Weighted average common shares outstanding | 18,799,761 | 14,423,470 | 14,611,855 | 22,029,374 | 21,894,569 | 21,650,736 | ||||||||||||||
| | | | | | | | | |||||||||||||
| $ | 0.09 | $ | 0.68 | $ | 0.79 | $ | 0.52 | $ | 0.27 | $ | 0.87 | |||||||||
| | | | | | | | | |||||||||||||
| | | | | | | | | |||||||||||||
Earnings per common share assuming dilution | ||||||||||||||||||||
Net income a | $ | 1,662 | $ | 9,843 | $ | 11,471 | ||||||||||||||
Net income | $ | 11,639 | $ | 6,012 | $ | 19,040 | ||||||||||||||
Less income allocated to participating securities | 12 | — | — | 179 | 69 | 233 | ||||||||||||||
| | | | | | | | | |||||||||||||
Net income allocated to common shareholders | $ | 1,650 | $ | 9,843 | $ | 11,471 | $ | 11,460 | $ | 5,943 | $ | 18,807 | ||||||||
| | | | | | | | | |||||||||||||
| | | | | | | | | |||||||||||||
Weighted average common shares outstanding | 18,799,761 | 14,423,470 | 14,611,855 | 22,029,374 | 21,894,569 | 21,650,736 | ||||||||||||||
Incremental shares applicable to stock based compensation | 487,685 | 325,328 | 360,834 | 37,800 | 69,742 | 163,881 | ||||||||||||||
| | | | | | | | | |||||||||||||
Weighted average common shares assuming dilution | 19,287,446 | 14,748,798 | 14,972,689 | 22,067,174 | 21,964,311 | 21,814,617 | ||||||||||||||
| | | | | | | | | |||||||||||||
| $ | 0.09 | $ | 0.67 | $ | 0.77 | $ | 0.51 | $ | 0.26 | $ | 0.85 | |||||||||
| | | | | | | | | |||||||||||||
| | | | | | | | | |||||||||||||
15. Commitments and Contingencies
In the ordinary course of business, the Company is engaged in various litigation including product liability and intellectual property disputes. However, the Company does not believe that any pending litigation will have a material adverse effect on its consolidated financial position, consolidated results of operations or liquidity. In addition, the Company is not currently a party to any environmental-related claims or legal matters.
Douglas Dynamics, Inc.
Notes to Consolidated Financial Statements (Continued)
Years ended December 31, 2010, 2009 and 2008
(in Thousands Except Share and Per Share Data)
16. Redeemable stock and stockholders' equity
Series A Redeemable Convertible Preferred StockImpairment of Assets Held For Sale
The authorized capital stockDuring the first quarter of 2013, the Company includes 100,000 shares of preferred stock, of which 65,000 shares have been designated as Series A preferred stock ("Series A"). All shares of Series A have been redeemed and therefore no shares of Series A were issued and outstanding as of December 31, 2010 and 2009. The par value of Series A is $0.01 per share.
The Series A is non-voting except as required by Delaware law, and Series A stockholders do not havelowered the right to elect any members of the Company's Board of Directors. The Series A ranks senior to the Series B and C preferred stock and common stock related to dividend rights and distributions upon liquidation, dissolution or winding up of the Company. Dividends accrue on the Series A at a rate of 10% per annum on the stated value of the Series A plus 10% of the aggregate of all annual dividends that a holder of Series A will have become entitled to receive but which has not been declared and paid by the Company.asking price for its assets held for sale. The Company accretes dividends basedrecorded assets held for sale on the terms of the Series A set forth in the Company's certificate of incorporation.
The Series A is subject to redemption at anytime, in whole or in part, at the option of the Board of Directors, which is controlled by the preferred stockholders and thus outside the control of the Company, at a redemption price per share equal to Series A stated value of $1,000 per share plus all accrued but unpaid cumulative dividends.
Series B Redeemable Preferred Stock
One share of preferred stock has been designated as Series B preferred stock ("Series B") and no shares and one share was issued and outstanding as of December 31, 2010 and December 31, 2009, respectively. The par value of Series B is $0.01 per share.
In addition to any voting rights to which the holders of the Series B may be entitled by law, so long as the Series B remains outstanding, the holder of the share, voting as a single series, are entitled to elect four directors to the Company's Board of Directors. The Series B ranks junior to the Series A, on parity with the Series C preferred stock and senior to the common stock as to dividend rights and distributions upon liquidation, dissolution or winding up of the Company. The holder of Series B is not entitled to receive dividends. However, subject to certain exceptions, so long as any shares of Series B or Series C preferred stock are outstanding, the Company may not pay dividends or make other distributions with respect to its junior securities (including common stock). This dividend restriction may be waived by the affirmative vote of a majority of the outstanding shares of Series B and Series C preferred stock, voting as a single class.
The Series B is subject to mandatory redemption at any time the holder's ownership of both preferred stock and common stock falls below certain percentages. The fixed redemption price per share is $1,000 per share, which equals the initial amount paid for the share. At the time of any such redemption, any members of the Company's Board of Directors elected by the Series B shall cease to be members of the Board without further action of any kind by the Company or its stockholders. The Series B share was redeemedbalance sheet in conjunction with the IPOclosure of the Johnson City, Tennessee location in May2010. The land and building have been held for sale since the closure. In an effort to stimulate sales activity, the Company lowered the listed sale price which caused the Company to reassess the fair value of 2010.the assets held for sale. The Company valued the fair value of the assets held for sale based upon Level 2 market price inputs for similar assets. The Company used comparable properties sold and held for sale in the Johnson City, TN industrial real estate market to determine an appropriate fair value. Consequently, the Company incurred a $647 loss recognized on the impairment of assets held for sale and is included in "Impairment of assets held for sale" on the Consolidated Statements of Income (Loss).
Douglas Dynamics, Inc.
Notes to Consolidated Financial Statements (Continued)
Years ended December 31, 2010, 20092013, 2012 and 20082011
(Dollars in Thousands Except Share and Per Share Data)
16. Redeemable stock and stockholders'17. Stockholders' equity (Continued)
Series C Redeemable Preferred Stock
One shareThe Company is authorized to issue 5,000,000 shares of preferred stock, has been designated as Series Bpar value $0.01 per share. Subject to any limitations under law or the Company's certificate of incorporation, the Company's board of directors is authorized to provide for the issuance of the shares of preferred stock ("Series C")in one or more series; to establish the number of shares to be included in each series; and noto fix the designation, powers, privileges, preferences, relative participating, optional or other rights (if any), and the qualifications, limitations or restrictions of the shares and one share was issued and outstanding asof each series. As of December 31, 20102013 and December 31, 2009, respectively. The par value2012, no shares of Series C is $0.01 per share.
In addition to any voting rights to which the holders of the Series C may be entitled by law, so long as the Series C remains outstanding, the holder of the share, voting as a single series, is entitled to elect two directors to the Company's Board of Directors. The Series C ranks junior to the Series A, on a parity with the Series B preferred stock were issued and senior to the common stock as to dividend rights and distributions upon liquidation, dissolution or winding up of the Company. The holder of Series C is not entitled to receive dividends. However, subject to certain exceptions, so long as any shares of Series B or Series C preferred stock are outstanding, the Company may not pay dividends or make other distributions with respect to its junior securities (including common stock). This dividend restriction may be waived by the affirmative vote of a majority of the outstanding shares of Series B and Series C preferred stock, voting as a single class.
The Series C is subject to mandatory redemption at any time the holder's beneficial ownership of both preferred stock and common stock falls below certain percentages. The fixed redemption price per share is $1,000 per share, which equals the initial amount paid for the share. At the time of any such redemption, any members of the Company's Board of Directors elected by the Series C shall cease to be members of the Board without further action of any kind by the Company or its stockholders. The Series C share was redeemed in conjunction with the IPO in May of 2010.outstanding.
Common Stock
The Company has 200,000,000 shares of common stock authorized, of which 21,579,65522,223,454 and 14,421,73622,130,996 shares were issued and outstanding as of December 31, 20102013 and 2009,2012, respectively. The par value of the common stock is $0.01 per share.
The holders of common stock are entitled to one vote per share on all matters submitted to a vote of stockholders. In the event of any voluntary or involuntary liquidation, dissolution or winding up of the Company, common stockholders would be entitled to share ratably in the Company's assets and funds remaining after payment of liabilities and after provision is made for each class of stock having preference over the Company's common stock, including Series A, B and C preferred stock.
Deferred Stock Plan
The Company has previously issued to certain members of management deferred common stock units and deferred preferred stock units, in each case representing the right to receive less than 1% of its fully-diluted equity capitalization. These deferred units were issued in consideration for the cancellation of accrued award balances in the Douglas Dynamics, LLC Long Term Incentive Plan. Deferred units were issued at a price equal to the fair value of the common stock at the date of issuance. Deferred units have all rights of common and preferred shareholders, excluding voting rights, and convert to common and preferred stock upon a change in control, or initial public offering of theliabilities.
Douglas Dynamics, Inc.
Notes to Consolidated Financial Statements (Continued)
Years ended December 31, 2010, 20092013, 2012 and 20082011
(Dollars in Thousands Except Share and Per Share Data)
16. Redeemable stock and stockholders' equity (Continued)
Company's stock. As of December 31, 2010 and 2009 there were no deferred preferred stock units outstanding.
As of December 31, 2010 and 2009, the Company had no deferred common stock units and 174,229 deferred common stock units outstanding, respectively. In the fourth quarter of 2010, the 174,229 deferred stock units converted into common stock, subsequent to the IPO of the Company's stock, upon expiration of the lock-up agreement.
Common Stock Repurchase
During 2008, the Company entered into securities repurchase agreements with certain members of management. Pursuant to these agreements, the Company repurchased at fair value and subsequently retired 164,493 shares of common stock for aggregate consideration of $1,775, comprised of a cash payment of $1,101 and the satisfaction of $703 of promissory notes held by members of management.
On January 23, 2009, the Company entered into securities repurchase agreements with certain members of management. Pursuant to these agreements, the Company repurchased at fair value and subsequently retired 32,633 shares of common stock and 89,371 stock options in exchange for aggregate consideration of $1,137, comprised of a cash payment of $1,000 and the satisfaction of the remaining principal amount of $137 on promissory notes held by the members of management. As a result of the repurchase of stock options, the Company recorded $732 of compensation expense in the first quarter of 2009, which represented the fair value of the repurchased options.
Douglas Dynamics, Inc.
Notes to Consolidated Financial Statements (Continued)
Years ended December 31, 2010, 2009 and 2008
(in Thousands Except Share and Per Share Data)
17.18. Valuation and qualifying accounts
The Company's valuation and qualifying accounts for the years ended December 31, 2010, 20092013, 2012 and 20082011 are as follows: (dollars in thousands):
| | Balance at beginning of year | Additions charged to earnings | Changes to reserve, net(1) | Balance at end of year | |||||||||
|---|---|---|---|---|---|---|---|---|---|---|---|---|---|
Year ended December 31, 2013 | |||||||||||||
Allowance for doubtful accounts | $ | 600 | $ | 329 | $ | 122 | $ | 1,051 | |||||
Reserves for inventory | 1,199 | 757 | (357 | ) | 1,599 | ||||||||
Valuation of deferred tax assets | 1,374 | — | 21 | 1,395 | |||||||||
Year ended December 31, 2012 | |||||||||||||
Allowance for doubtful accounts | $ | 1,247 | $ | 259 | $ | (906 | ) | $ | 600 | ||||
Reserves for inventory | 1,288 | 715 | (804 | ) | 1,199 | ||||||||
Valuation of deferred tax assets | 830 | — | 544 | 1,374 | |||||||||
Year ended December 31, 2011 | |||||||||||||
Allowance for doubtful accounts | $ | 1,200 | $ | 1,106 | $ | (1,059 | ) | $ | 1,247 | ||||
Reserves for inventory | 1,404 | 1,080 | (1,196 | ) | 1,288 | ||||||||
Valuation of deferred tax assets | 877 | — | (47 | ) | 830 | ||||||||
| | Balance at beginning of year | Additions charged to earnings | Changes to reserve, net(1) | Balance at end of year | ||||||||||
|---|---|---|---|---|---|---|---|---|---|---|---|---|---|---|
Year ended December 31, 2010 | ||||||||||||||
Allowance for doubtful accounts | $ | 755 | $ | 966 | $ | (521 | ) | $ | 1,200 | |||||
Reserves for inventory | 1,931 | 930 | (1,457 | ) | 1,404 | |||||||||
Valuation of deferred tax assets | 566 | 343 | (32 | ) | 877 | |||||||||
Year ended December 31, 2009 | ||||||||||||||
Allowance for doubtful accounts | $ | 622 | $ | 281 | $ | (148 | ) | $ | 755 | |||||
Reserves for inventory | 1,736 | 1,347 | (1,153 | ) | 1,931 | |||||||||
Valuation of deferred tax assets | 1,695 | 84 | (1,213 | ) | 566 | |||||||||
Year ended December 31, 2008 | ||||||||||||||
Allowance for doubtful accounts | $ | 541 | $ | 271 | $ | (190 | ) | $ | 622 | |||||
Reserves for inventory | 1,741 | 1296 | (1,301 | ) | 1,736 | |||||||||
Valuation of deferred tax assets | 1,096 | 599 | — | 1,695 | ||||||||||
18. Restructuring
On April 27, 2009, the Company announced a plan to close its Johnson City, TN manufacturing facility and move production from this facility to its Milwaukee, WI and Rockland, ME facilities. The company completed the closure of this facility as of August 31, 2010. The Company expects to realize significant annual cost savings and improved customer delivery performance as a result. The closure has resulted in the elimination of approximately 100 positions in Johnson City and the addition of approximately 50 positions in Rockland and approximately 35 positions in Milwaukee.
Related to the facility closure, the Company recorded $50 of employee termination costs and $1,385 for other closure costs for the year ended December 31, 2010, respectively. Restructuring expenses of $1,054 were recorded for the year ended December 31, 2009. The Company does not expect to incur any additional costs related to the closure. These costs are included in the selling, general and administrative expense line in the Company's consolidated statements of operations.
Douglas Dynamics, Inc.
Notes to Consolidated Financial Statements (Continued)
Years ended December 31, 2010, 2009 and 2008
(in Thousands Except Share and Per Share Data)
18. Restructuring (Continued)
The following represents a reconciliation of changes in the restructuring reserves related to this project through December 31, 2010.
| | Employee Termination Costs | Other Exit Costs | Total | ||||||||
|---|---|---|---|---|---|---|---|---|---|---|---|
Accrued restructuring reserves as of December 31, 2008 | $ | — | $ | — | $ | — | |||||
Activity during year ended December 31, 2009: | |||||||||||
Charges to earnings | 690 | 364 | 1,054 | ||||||||
Payments | — | (364 | ) | (364 | ) | ||||||
Accrued restructuring reserves as of December 31, 2009 | $ | 690 | $ | — | $ | 690 | |||||
Activity during year ended December 31, 2010: | |||||||||||
Charges to earnings | 50 | 1,385 | 1,435 | ||||||||
Payments | (710 | ) | (1,385 | ) | (2,095 | ) | |||||
Accrued restructuring reserves as of December 31, 2010 | $ | 30 | — | $ | 30 | ||||||
In connection with the restructuring, the Company reassessed the useful lives of its manufacturing facility and certain equipment. As a result of this assessment, the Company assigned shorter useful lives to these assets and recorded accelerated depreciation of $2,071 for the year ended December 31, 2010. This change in estimate reduced basic and diluted earnings per share by $0.07 and $0.07 for the year ended December 31, 2010. The Company recorded accelerated depreciation of $900 for the year ended December 31, 2009. This change in estimate reduced basic and diluted earnings per share by $0.04 and $0.04 for the year ended December 31, 2009.
Because of actions taken in the restructuring, the Johnson City property is being actively marketed for sale and is classified as held for sale in the consolidated balance sheet.
19. Quarterly Financial Information (Unaudited)
| | 2010 | ||||||||||||
|---|---|---|---|---|---|---|---|---|---|---|---|---|---|
| | First | Second | Third | Fourth | |||||||||
Net sales | $ | 14,647 | $ | 66,243 | $ | 47,448 | $ | 48,457 | |||||
Gross profit | $ | 1,980 | $ | 25,061 | $ | 15,227 | $ | 18,033 | |||||
Income (loss) before taxes | $ | (9,424 | ) | $ | (1,302 | ) | $ | 4,464 | $ | 8,796 | |||
Net income (loss) attributable to common shareholders | $ | (5,719 | ) | $ | 75 | $ | 2,185 | $ | 5,121 | ||||
Basic net earnings (loss) per common share attributable to common shareholders | $ | (0.40 | ) | $ | — | $ | 0.10 | $ | 0.24 | ||||
Earnings (loss) per common share assuming dilution attributable to common shareholders | $ | (0.40 | ) | $ | — | $ | 0.10 | $ | 0.23 | ||||
Dividends per share | $ | — | $ | — | $ | 0.18 | $ | 0.20 | |||||
Douglas Dynamics, Inc.
Notes to Consolidated Financial Statements (Continued)
Years ended December 31, 2010, 20092013, 2012 and 20082011
(Dollars in Thousands Except Share and Per Share Data)
19. Changes in Accumulated Other Comprehensive Loss by Component
Changes to accumulated other comprehensive loss by component for the year ended December 31, 2013 is as follows:
| | Unrealized Net Loss on Interest Rate Swap | Retiree Health Benefit Obligation | Pension Obligation | Total | |||||||||
|---|---|---|---|---|---|---|---|---|---|---|---|---|---|
Balance at December 31, 2012 | $ | (344 | ) | $ | 1,063 | $ | (7,803 | ) | $ | (7,084 | ) | ||
Other comprehensive gain (loss) before reclassifications | (22 | ) | 1,066 | 4,154 | 5,197 | ||||||||
Amounts reclassified from accumulated other comprehensive loss(1) | 182 | 105 | 737 | 1,025 | |||||||||
| | | | | | | | | | | | | | |
Balance at December 31, 2013 | $ | (184 | ) | $ | 2,234 | $ | (2,912 | ) | $ | (862 | ) | ||
| | | | | | | | | | | | | | |
| | | | | | | | | | | | | | |
| | December 31, 2013 | |||
|---|---|---|---|---|
Amortization of Other Postretirement Benefit items: | ||||
Actuarial loss(a) | 172 | |||
Tax benefit | (67 | ) | ||
| | | | | |
Reclassification net of tax | $ | 105 | ||
| | | | | |
| | | | | |
Amortization of pension items: | ||||
Actuarial loss(a) | $ | 1,205 | ||
Tax benefit | (468 | ) | ||
| | | | | |
Reclassification net of tax | $ | 737 | ||
| | | | | |
| | | | | |
Realized losses on interest rate swap reclassified to interest expense | 297 | |||
Tax benefit | (115 | ) | ||
| | | | | |
Reclassification net of tax | $ | 182 | ||
| | | | | |
| | | | | |
Douglas Dynamics, Inc.
Notes to Consolidated Financial Statements (Continued)
Years ended December 31, 2013, 2012 and 2011
(Dollars in Thousands Except Per Share Data)
20. Quarterly Financial Information (Unaudited) (Continued)
| | 2013 | ||||||||||||
|---|---|---|---|---|---|---|---|---|---|---|---|---|---|
| | First | Second | Third | Fourth | |||||||||
Net sales | $ | 14,141 | $ | 55,156 | $ | 52,026 | $ | 72,997 | |||||
Gross profit | $ | 4,326 | $ | 18,878 | $ | 15,044 | $ | 27,402 | |||||
Income (loss) before taxes | $ | (5,543 | ) | $ | 9,261 | $ | 694 | $ | 14,605 | ||||
Net income (loss) | $ | (3,404 | ) | $ | 5,909 | $ | 603 | $ | 8,531 | ||||
Basic net earnings (loss) per common share attributable to common shareholders | $ | (0.15 | ) | $ | 0.26 | $ | 0.03 | $ | 0.38 | ||||
Earnings (loss) per common share assuming dilution attributable to common shareholders | $ | (0.15 | ) | $ | 0.26 | $ | 0.02 | $ | 0.38 | ||||
Dividends per share | $ | 0.21 | $ | 0.21 | $ | 0.21 | $ | 0.21 | |||||
| | 2009 | 2012 | ||||||||||||||||||||||||
|---|---|---|---|---|---|---|---|---|---|---|---|---|---|---|---|---|---|---|---|---|---|---|---|---|---|---|
| | First | Second | Third | Fourth | First | Second | Third | Fourth | ||||||||||||||||||
Net sales | $ | 15,173 | $ | 59,637 | $ | 50,396 | $ | 49,136 | $ | 8,560 | $ | 65,499 | $ | 37,774 | $ | 28,200 | ||||||||||
Gross profit | $ | 3,013 | $ | 19,515 | $ | 15,155 | $ | 19,395 | $ | 1,820 | $ | 23,060 | $ | 11,566 | $ | 7,517 | ||||||||||
Income (loss) before taxes | $ | (8,455 | ) | $ | 8,684 | $ | 4,463 | $ | 9,137 | $ | (6,235 | ) | $ | 13,719 | $ | 3,091 | $ | (419 | ) | |||||||
Net income (loss) attributable to common shareholders | $ | (4,462 | ) | $ | 5,665 | $ | 2,738 | $ | 5,902 | |||||||||||||||||
Net income (loss) | $ | (4,268 | ) | $ | 8,972 | $ | 2,346 | $ | (1,038 | ) | ||||||||||||||||
Basic net earnings (loss) per common share attributable to common shareholders | $ | (0.31 | ) | $ | 0.39 | $ | 0.19 | $ | 0.41 | $ | (0.19 | ) | $ | 0.41 | $ | 0.11 | $ | (0.05 | ) | |||||||
Earnings (loss) per common share assuming dilution attributable to common shareholders | $ | (0.31 | ) | $ | 0.38 | $ | 0.19 | $ | 0.40 | $ | (0.19 | ) | $ | 0.40 | $ | 0.10 | $ | (0.05 | ) | |||||||
Dividends per share | $ | — | $ | — | $ | — | $ | — | $ | 0.21 | $ | 0.21 | $ | 0.21 | $ | 0.21 | ||||||||||
Due to changes in stock prices during the year and timing of issuance of shares, the sum of quarterly earnings per share may not equal the annual earnings per share.