•aour history of operating losses and negative cash flow;•our reliance on our independent sales agencies and distributors to sell our products and the effect on our business and operating results of agency and distributor changes, transitions to direct selling models in certain geographies, including most recently in the United States, Canada, Australia, Japan, Belgium and Luxembourg, and the recent transition of our U.S. sales channel towards focusing separately on upper and lower extremity products, and the adverse impact of such changes and transitions on our revenue and other operating results;continuing weakness in the global economy, which has been and may continue to be exacerbated by austerity measures taken by several countries, and automatic and discretionary governmental spending cuts, which could reduce the availability or affordability of private insurance or Medicare or other governmental reimbursement or may affect patient decision to undergo elective procedures, and could otherwise adversely affect our business and operating results;our reliance on sales of our upper extremity joints and trauma products, including in particular our shoulder products, which generate a significant portion of our revenue, and the third quarter of 2013 launch of our Aequalis Ascend Flex;deriving a significant portion of our revenues from operations in certain geographic markets that are subject to political, economic and social instability, including in particular France, and risks and uncertainties involved in launching our products in certain new geographic markets, including in particular Japan, China and Brazil;fluctuations in foreign currency exchange rates;disruption and turmoil in global credit and financial markets, which may be exacerbated by the inability of certain countries to continue to service their sovereign debt obligations;not successfully developing and marketing new products and technologies and implementing our business strategy;•successful competitionnot successfully competing against our existing or potential competitors;•deriving a significant portionour October 2012 acquisition of OrthoHelix Surgical Designs, Inc., and risks related thereto, including our inability to integrate successfully our commercial organizations, including in particular our distribution and sales representative arrangements, and our failure to realize the anticipated benefits and synergies to our business and operating results;the reliance of oursales from operations in international markets that are subject to political, economic and social instability;•- business plan on certain market assumptions;
our private label manufacturers failing to provide us with sufficient supply of their products, or failing to meet appropriate quality requirements;•our plans to bring the manufacturing of certain of our products in-house and possible disruptions we may experience in connection with such transition;our plans to increase our gross margins by taking certain actions designed to do so;the loss ofone of ourkey suppliers,and thewhich may result in our inability to meet customer orders for our products in a timely manner or within ourbudget that may result;•- budget;
our patents and other intellectual property rights not adequately protecting our productsand theor alleged claims of patent infringement by us, which may result in our loss of market share to our competitorsthat may result;•- and increased expenses;
the incurrence of significant expenditures of resources to maintain relatively high levels of inventory, whichcancould reduce our cashflows;•recent turmoil inflows and increase the risk of inventory obsolescence, which could harm our operating results;our creditmarketsagreement, senior secured term loan andthe financial services industry may negatively affectrevolving credit facility and risks related thereto;ourbusiness;•theinability to access our revolving credit facility or raise capital when needed, whichwouldcould force us to delay, reduce, eliminate or abandon our commercialization efforts or product developmentprograms.•- programs;
restrictive affirmative financial and other covenants in ouroutstanding debt agreementscredit agreement that may limit our operating flexibility;•consolidation in the healthcare industry that could lead to demands for price concessions ortothe exclusion of some suppliers from certain of our markets, which could have an adverse effect on our business, financial condition or operating results;our clinical trials and their resultsof operations;and our reliance on third parties to conduct them;•- regulatory clearances or approvals and the extensive regulatory requirements
thatto which we aresubject to; •- subject;the compliance of our
medical devicesproducts with the laws and regulations of theforeigncountries in which they are marketed, which compliance may be costly and time-consuming;and•the use, misuse or off-label use of our products that may harm our image in the marketplace or result in injuries that may lead to product liability suits, which could be costly to our business or result inFDA sanctions.governmental sanctions;
healthcare reform legislation, including the excise tax on U.S. sales of certain medical devices, and its implementation, possible additional legislation, regulation and other governmental pressure in the United States and globally, which may affect utilization, pricing, reimbursement, taxation and rebate policies of governmental agencies and private payors, which could have an adverse effect on our business, financial condition or operating results; andpending and future litigation, which could have an adverse effect on our business, financial condition or operating results.For more information regarding these and other uncertainties and factors that could cause our actual results to differ materially from what we have anticipated in our forward-looking statements or otherwise could materially adversely affect our business, financial condition or operating results, see “Part I — Item 1A. Risk Factors.” The risks and uncertainties described above and in the “Part I — Item 1A. Risk Factors” section of this report are not exclusive and further information concerning us and our business, including factors that potentially could materially affect our financial results or condition, may emerge from time to time. We assume no obligation to update, amend or clarify forward-looking statements to reflect actual results or changes in factors or assumptions affecting such forward-looking statements. We advise you, however, to consult any further disclosures we make on related subjects in our future annual reports on Form 10-K, quarterly reports on Form 10-Q and current reports on Form 8-K we file with or furnish to the Securities and Exchange Commission.
Overview
We are a global medical device company focused on providing solutions to surgeons that treat musculoskeletal injuries and disorders of the shoulder, elbow, wrist, hand, ankle and
foot. Wefoot, which we refer tothese surgeonsasextremity specialists.“extremity joints.” We sell tothis extremity specialist customer basethese surgeons a broad line of joint replacement, trauma, sports medicine and biologic products to treat extremity joints.Our motto of "specialists serving specialists" encompasses this focus.In certain international markets, we also offer joint replacement products for the hip and knee.We currently sell over 80 product lines in approximately 35 countries.We have had a tradition of innovation, intense focus on
surgeonscience and education and a commitment to the advancement oforthopaedic technologyorthopaedics in the pursuit of improved clinical outcomes for patients since our foundingapproximatelyover 70 years ago in France by René Tornier. Our history includes the introduction of the porous orthopaedic hip implant, the application of the Morse taper, which is a reliable means of joining modular orthopaedic implants, and more recently, the introduction of thereversedstemless shoulderimplantboth inthe United States.Europe and in a U.S. clinical trial. This track record of innovationover the decadesbased on science and education stems from our close collaboration with leading orthopaedic surgeons and thought leaders throughout the world.We were acquired in 2006 by an investor group led by Warburg Pincus (Bermuda) Private Equity IX, L.P., or WP Bermuda, and medical device investors, including The Vertical Group, L.P., or The Vertical Group, Split Rock Partners, L.P., or Split Rock, and Douglas W. Kohrs, our Chief Executive Officer, collectively, the Investor Group. They recognized the potential to leverage our reputation for innovation and our strong extremity joint portfolio as a platform upon which they could build a global company focused on the rapidly evolving upper and lower extremity specialties. The Investor Group has contributed capital resources and a management team with a track record of success in the orthopaedic industry in an effort to expand our product offerings in extremities and accelerate our growth. Since the acquisition in 2006, we have:•created a single, extremity specialist sales channel in the United States primarily focused on our products;•enhanced and broadened our portfolio of shoulder joint implants and foot and ankle products;•entered the sports medicine and biologics markets through acquisitions and licensing agreements;•improved our hip and knee product offerings, helping us gain market share internationally; and•significantly increased investment in research and development and expanded business development activities to build a pipeline of innovative new technologies.
We believe we are differentiated in the marketplace by our strategic focus on extremities, our full portfolio of upper and lower extremity products, and our
dedicatedextremity-focused salesorganizationorganization. We offer a broad product portfolio of over 95 extremities products that are designed to provide solutions to our surgeon customers with the goal of improving clinical outcomes for their patients. We believe a more active andour strategic focusaging patient population with higher expectations regarding “quality of life,” an increasing global awareness of extremities solutions, improved clinical outcomes as a result of the use of extremities products and technological advances resulting in specific designs for extremities products that simplify procedures and address unmet needs for early interventions and the growing need for revisions and revision related solutions will drive the market for extremities products.Our global corporate headquarters are located in Amsterdam, the Netherlands. We also have significant operations located in Bloomington, Minnesota (U.S. headquarters, sales, marketing and distribution and administration), Grenoble, France (OUS headquarters, manufacturing and research and development), Macroom, Ireland (manufacturing), Warsaw, Indiana (research and development) and Medina, Ohio (marketing, research and development). In addition, we conduct local sales and distribution activities across 13 sales offices throughout Europe, Asia, Australia and Canada.
Customers, Sales and Distribution
Our target customers are surgeon specialists focused on
extremities.extremity injuries and disorders, along with general surgeons and podiatrists that perform extremities-related surgical procedures. Wefurther believeprovide these surgeons extensive “hands on” orthopaedic training and education, including fellowships and masters courses thatwearewell-positioned to benefit from the opportunities in the extremity products marketplace as we are already among the global leaders in the shoulder and ankle joint replacement markets.not easily accessible through traditional medical training programs. Wemore recently have expanded our technology base and product offering to include: new joint replacement products based on new materials; improved trauma products based on innovative designs; and proprietary biologic materials for soft tissue repair. In the United States, which is the largest orthopaedic market, webelieve that oursingle, "specialists serving specialists" distribution channelhistory of innovation and focus on quality and improving clinical outcomes, along with our training programs, allow us to reach surgeons early in their careers and provide on-going value, which includes experiencing the clinical benefits of our products.While we market our broad portfolio of products to these surgeons, our revenue is
strategically aligned with whatgenerated from sales of our products to healthcare institutions and stocking distributors. We have built and developed local sales organizations to serve these customer groups across the markets in which webelieve is an ongoing trend in orthopaedics for surgeons to specialize in certain partsoperate. Our sales organizations are structured based on the requirements of theanatomylocal markets in which they serve and consist of sales associates, sales management and support personnel that are either employed by us orcertain types of procedures.provided under contract by an independent distributor or sales agency. Our
principal products are organized in four major categories: upper extremity jointsdirect sales employees andtrauma, lower extremity joints and trauma, sports medicine and biologics, and large joints and other. Our upper extremity products include joint replacement and bone fixation devices for the shoulder, hand, wrist and elbow. Our lower extremity products include joint replacement and bone fixation devices for the foot and ankle. Our sports medicine and biologics product category includes products used across several anatomic sites to mechanically repair tissue-to-tissue or tissue-to-bone injuries, in the case of sports medicine, or to support or induce remodeling and regeneration of tendons, ligaments, bone and cartilage, in the case of biologics. Our large joints and other products include hip and knee joint replacement implants and ancillary products.This annual report contains references to among others, our trademarks Aequalis®, Affiniti™, Ascend™, Biofiber™, CoverLoc™, Futura™, Insite®, InSpyre™, Intrafocal™, HLS Kneetec®, Latitude®, Linea™, Meije Duo®, NexFix™, Noetos®, Oceane™, Osteocure®, Piton®, Pleos®, RFS™, Salto®, Salto Talaris®, Simpliciti™, Stayfuse™ and Tornier™. All other trademarks or trade names referred to in this annual report on Form 10-K are the property of their respective owners.Innovations in the orthopaedic industry have typically consisted of evolutions of product design in implant fixation, joint mechanics, and instruments and modifications of existing metal or plastic-based device designs rather than new productsindependent sales agencies earn commissions based oncombinations of new designs and new materials. In contrast,thegrowthrevenue they generate from sales of ourtarget markets has been driven by the development of products that respond to the particular mechanics of small joints and the importance of soft tissue to small joint stability and function. We are committed to the development of new designs utilizing both conventional materials and new tissue-friendly biomaterials that we expect will create new markets. We believe that we are a leader in researching and incorporating some of these new technologies across multiple product platforms.products.United States
In the United States, we market and sell a broad offering of products,
from ourincluding products for upper extremity joints and trauma, lower extremity joints and trauma, and sports medicine andbiologics product categories; webiologics. We do not actively marketlargeproducts for the hip or knee, which we refer to as “large joints,” in the United States,nor doalthough we have clearance from the U.S. Food and Drug Administration, or FDA, to sell certain large joint products. Our distribution system in the United States currentlyhave plansconsists of approximately 145 direct sales representatives and approximately 40 independent sales agencies that sell our products.We are in the process of completing our strategic initiative to
do so. While we markettransition ourproducts to extremity specialists, our revenue is generatedU.S. sales organization fromsales to healthcare institutions and distributors. We sell through a single sales channel consisting ofa network of independentcommission-basedsalesagencies. Internationally, whereagencies that sold our full product portfolio to a combination of direct sales teams and independent sales agencies that are individually focused on selling either upper extremity products or lower extremity products across thetrend among surgeons toward specialization is notterritories that they serve. To create these separate upper and lower extremity sales channels, in 2013, we terminated relationships with certain independent sales agencies and transitioned these territories to new agencies or established directsales representation; acquired sales agencies and established direct sales representation; or transitioned an upper or lower extremity product portfolio between agencies or from an agency to a new direct sales team. These transitions caused disruption in our U.S. business and revenue in 2013. As we move into 2014, we expect to continue and complete the transition of our sales representatives to focus on either upper or lower extremities products, optimize our territory structures, hire additional sales representatives to fill territories and educate and train our sales teams and, as
advanced asa result, we expect to continue to experience disruption in our U.S. business and revenue in 2014. Currently, approximately 60% of our direct sales representatives and 80% of our distributors are identified and transitioned, or in theUnited States,process of transitioning, to either dedicated upper or lower extremities products. Our goal for 2014 is to become 85% dedicated to either upper extremities or lower extremities products by the end of 2014. The goal is 85% since not all of our territories warrant two separate sales representatives. In terms of training, our goal is to train an average of 50 sales representatives per quarter during 2014 for a total of 200 representatives by the end of 2014. We believe this will be an important milestone because we believe it will be an indication that our sales representatives have the requisite pathology, procedural and product knowledge and skills to communicate the key aspects of their product lines and to support and guide surgeons during cases. While this transition has caused and is expected to continue to cause disruption in our U.S. business, we ultimately believe that this strategy will position us to leverage our sales force and broad product portfolio toward our goal of achieving above market extremities revenue growth and margin expansion over the long term by allowing us to increase the product proficiency of our sales representatives to better serve our surgeon customers and to increase and optimize our selling opportunities by improving our overall procedure coverage and providing access to new specialists, general surgeons and accounts.International
Internationally, we sell our full product portfolio, including upper
extremity jointsandtrauma,lower extremityjoints and trauma,products, sports medicine and biologics products and largejoints.joints products. We utilize several distribution approachesdepending onthat are tailored to the needs and requirements of each individualmarket requirements, includingmarket. Our international sales and distribution system currently consists of 13 direct sales offices and approximately 25 distributors that sell our products in approximately 45 countries. We utilize direct sales organizations inthe largestcertain mature European markets, Australia, Japan and Canada. In France, our largest international market, we have an upper extremity direct sales force and a separate direct sales force that sells a combination of hip, knee and lower extremity products. In addition, we may also utilize independent stocking distributorsfor mostin these direct sales areas to further broaden our distribution channel. In certain other geographies, including emerging markets, we utilize independent stocking distributors to market and sell our full product portfolio or select portions of our product portfolio.As part of our efforts to grow internationally, over the last few years we have expanded our distribution and sales efforts into Mexico, Israel, Argentina, Singapore and Vietnam through partnerships with local stocking distributors. In addition, we have selectively transitioned from distributor representation to direct sales representation in certain countries, including Australia, the United Kingdom, Denmark, Belgium, Luxembourg, Japan and Canada during the past few years. We plan to continue this strategy of international
markets. In 2010, weexpansion, in combination with the tailoring of our international distribution approach to the needs and requirements of each individual market. This strategy may result in additional sales coverage transitions in the future.We generated
revenue$182.1 million, or 59% of$227.4 million, 56% of which wasour total revenue, in the United States during the year ended December 29, 2013, compared to $156.8 million and44% of which was international.Our Business StrategiesOur goal is to strengthen our leadership position serving extremity specialists. The key elements$141.5 million during the years ended December 30, 2012 and January 1, 2012, respectively. We generated $128.9 million, or 41% of ourstrategy include:Leveraging our "specialists serving specialists" strategy:We believe our focus on and dedication to extremity specialists enables us to better understand and address the clinical needs of these surgeons. We believe that extremity specialists, who have emerged as a significant constituencytotal revenue, inorthopaedics only in the last 10 to 15 years, have been underserved in terms of new technology and also inefficiently served by the current marketplace. We offer a comprehensive portfolio of extremity products, and also serve our customers through a sales channel that is dedicated to extremities, which we believe provides us with a significant competitive advantage, because our sales agencies and their representatives have both the knowledge and desire to comprehensively meet the needs of extremity specialists and their patients, without competing priorities.Advancing scientific and clinical education:We believe our specialty focus, commitment to product innovation and culture of scientific advancement attract both thought leaders and up-and-coming surgeon specialists who share these values. We actively involve these specialists in the development of world-class training and education programs and encourage ongoing scientific study of our products. Specific initiatives include the Tornier Master's Courses in shoulder and ankle joint replacement, The Fellows and Chief Residents Courses, and a number of clinical concepts courses. We also maintain a registry that many of our customers utilize to study and report on the outcomes of procedures in which our extremity products have been used. We believe our commitment to science and education also enables us to reach surgeons early in their careers and provide them access to a level of training in extremities that we believe is not easily accessible through traditional orthopaedic training.Introducing new products and technologies to address more of our extremity specialists' clinical needs:Our goal is to continue to introduce new technologies for extremity joints that improve patient outcomes and thereby continue to expand our market opportunity and share. Our efforts have been focused on joint replacement, as well as sports medicine and biologics, given the importance of these product categories to extremity surgeons. Since our acquisition by the Investor Group, we have significantly increased our investment in research and development to accelerate the pace of new product introduction. We have also been active in gaining access to new technologies through external partnerships, licensing agreements and acquisitions. We believe that our reputation for effective collaboration with industry thought leaders as well as our track record of effective new product development and introductions will allow us to continue to gain access to new ideas and technologies early in their development.Expanding our international business:We face a wide range of market dynamics that require our distribution channels to address both our local market positions and local market requirements. For example, in France, which is a more developed extremities market and where we have a diversified extremities, hip and knee business, we have two direct sales organizations. One is focused on products for upper extremities, and the other focused on hip and knee replacements and products for lower extremities. In other European markets, we utilize a combination of direct and distributor strategies that have evolved to support our expanding extremity business and also to support our knee and hip market positions. In largeinternational marketswhere the extremity market segment is relatively underdeveloped, such as Japan and China, the same sales channel sells our hip and knee product portfolios and extremity joint products, which provides these sales channels sufficient product breadth and economic scale. We plan on expanding our international business by continuing to adapt our distribution channels to the unique characteristicsoutside ofindividual markets.Achieving and improving our profitability through operating leverage:With the additional capital resources brought by the Investor Group, we have made significant investments over the last several years in our research and development, sales and marketing, and manufacturing operations to build what we believe is a world-class organization capable of driving sustainable global growth. For example, we grew our research and development organization from approximately 20 employees as of December 31, 2006 to 83 employees as of January 2, 2011. We created a new global sales and marketing leadership team by integrating key personnel from acquired organizations and recruiting additional experienced medical device sales and marketing professionals. We also expanded our manufacturing capacity with two new plants in Ireland and France. With these organizational and infrastructure investments in place, we believe we have the infrastructure to support our growth for the foreseeable future. As a result, we believe we can increase revenue and ultimately achieve and improve profitability.Our Surgeon CustomersWe estimate that there are over 80,000 orthopaedic and over 9,000 podiatric surgeons worldwide who specialize in surgical treatment of the musculoskeletal system, including bones, joints and soft tissues such as tendons and ligaments. Inthe United States during the year ended December 29, 2013, compared to $120.8 million andcertain other developed markets, there has been a trend over$119.7 million during thepast two decades for these surgeons to specializeyears ended December 30, 2012 and January 1, 2012, respectively. Our total revenue incertain parts of the anatomy or certain types of procedures. We believe that the trend toward specialization has been supported by the expansion of specialist professional societiesFrance was $58.2 million in 2013, $52.7 million in 2012 andan increase$55.4 million in 2011. Our total revenue in thenumber of fellowship programs.Netherlands was $5.8 million in 2013, $5.3 million in 2012 and $5.0 million in 2011.Product Portfolio
We
focus onmanage our business in one reportable segment that includes thefollowing orthopaedic specialist groups:Upper Extremity Specialists:Upper extremity specialists perform joint replacementdesign, manufacture, marketing andtrauma and soft tissue repair procedures for the shoulder, elbow, wrist and hand. We believe the evolution of this specialty has been driven by the unique requirements of these joints due to the relative importance of soft tissue to joint function and the increased complexity and breadth of technology available for use in these procedures. For this reason, in addition to joint replacement and trauma products, upper extremity specialists utilize a broad range of sports and orthobiologic products. We believe upper extremity specialists now perform the majority of shoulder joint replacements that were previously performed by reconstructive and general orthopaedic surgeons.Lower Extremity Specialists:Lower extremity specialists perform a wide range of joint replacement, trauma, reconstruction and soft tissue repair procedures for the foot and ankle. This specialist group principally consistssales of orthopaedicsurgeons who have received fellowship or other specialized training. Additionally, Doctors of Podiatric Medicine with special surgical training may perform certain foot and ankle surgical procedures in the United States, Canada and United Kingdom.Sports Medicine Specialists:Sports medicine specialists are surgeons who use minimally invasive surgical techniques, including arthroscopy, for the repair of soft tissues. Arthroscopy is a minimally invasive surgical technique in which a surgeon creates several small incisions at the surgery site; inserts a fiber optic scope with a miniature video camera as well as surgical instruments through the incisions to visualize, access and conduct the procedure; and uses a video monitor to view the surgery itself. The sports medicine specialty is not just limited to treatment of athletes, but rather to all patients with orthopaedic soft tissue injuries or disease. The most common sports medicine procedures are ligament repairs in the knee and rotator cuff tendon repairs in the shoulder.Reconstructive and General Orthopaedic Surgeons:Reconstructive and general orthopaedic surgeons are important customers for us in selected European countries and other international markets. In these markets, orthopaedic surgeons may treat multiple areas of bone and joint disease and trauma, and commonly perform procedures involving extremity joints as well as hip and knee joint replacement. For these target customers, we are able to provide not only our broad product category for extremity joint procedures, but also our hip and knee joint replacementproducts.Our Target MarketsWe compete on a worldwide basis providing upper and lower extremity specialist surgeons a wide range of products from several major segments of the orthopaedic market, including extremity joints, sports medicine, biologics and trauma. In addition, we compete in the hip and knee segments of certain international markets where we have a strong legacy presence such as in France, where participation in the local hip and knee market is important to our distributor partners, and in China, where the market for our extremity focused products is still small.We believe our addressable portion of the market will grow at a faster rate than the overall orthopaedic market due to the introduction of new technologies with improved clinical outcomes, a growing number of extremity specialists, the aging of the general population and the desire for peopleto remain physically active as they grow older. Overviews of the major orthopaedic markets in which we compete, as well as our targeted participation in those markets, are as follows:Extremity Joints:The extremity joint market includes implantable devices used for the replacement of shoulder, elbow, hand, and foot and ankle joints. We believe this market has been under-served and underdeveloped by major orthopaedic companies, which have generally focused on the much larger hip, knee and spine markets. As a result, the growth of the extremity joint market is still benefiting from market-expanding design and materials technologies and from growth in the number of upper and lower extremity specialists. We believe that we are a leader in both the shoulder and ankle joint replacement portions of this market based upon revenue.Sports Medicine:Sports medicine refers to the repair of soft tissue injuries that often occur when people are engaged in physical activity, but that also result from age-related wear and tear. We believe market growth has been driven by both new technology and the continued acceptance of minimally invasive surgical techniques. The most common sports medicine procedures are anterior cruciate ligament repairs in the knee and rotator cuff repairs in the shoulder. The primary sports medicine products include capital equipment and related disposables as well as bone anchors, which are implantable devices used to attach soft tissue to bone, sutures, or thread for soft tissue, and handheld instruments. We estimate that our products currently address only a portion of the sports medicine market, primarily bone anchors and other products utilized for rotator cuff repairs. The total sports medicine market also includes capital or powered equipment and related disposables, but we do not have any product offerings in these areas.Biologics:Biologics refer to products, both biologic and synthetic, that are utilized to stimulate hard and soft tissue healing following surgery for a wide range of orthopaedic injuries or disorders. We believe market growth is being driven by the application of an expanding biotechnology knowledge base to the development of products that can improve clinical outcomes by inducing tissue healing and regeneration. The primary product categories in the total biologics market are bone grafting materials, cell therapy systems, including growth factors, and tendon and ligament grafts. We currently only offer tendon and ligament graft products for extremities.Trauma:The trauma market includes devices that are used to treat fractures, joint dislocations, severe arthritis and deformities that result from either acute injuries or chronic wear and tear. The major products in the trauma market include metal plates, screws, pins, wires and external fixation devices used to hold fractured bone fragments together until they heal properly. These devices are also utilized in the treatment of a wide range of non-traumatic surgical procedures, especially in the foot and ankle. As the market has transitioned from external casting performed in the emergency room, to internal fixation performed on a scheduled basis in the operating room, our extremity specialist customers have expanded their role in treating trauma injuries. Our products currently address only a portion of the trauma market, consisting primarily of plating systems, screws and pins for the repair of extremity joint injuries and disorders.Knee Joints:Knee joint replacements are performed for patients who have developed an arthritic condition that compromises the joints' articulating surfaces (articulating surfaces are bone segments connected by a joint). The knee joint replacement system has multiple components including a femoral component, a tibial component and a patella component (knee cap). We currently provide a broad line of knee joint replacement products in selected international geographies. We do not currently address the knee joint market in the United States.Hip Joints:Hip joint replacements are performed for patients who have suffered a femoral fracture or suffer from severe arthritis or other conditions that have led to the degradation of the articular cartilage or bone structure residing between the femoral head and the acetabulum (hip socket). The hip joint replacement system generally includes both femoral and acetabular components.We currently provide a broad line of hip joint replacement products in selected international geographies. We do not currently address the hip joint market in the United States.Our Product PortfolioWe offer a broad product
lineportfolio of over 95 extremities products that are designed tomeetprovide solutions to our surgeon customers with theneedsgoal ofour extremity specialists andimproving clinical outcomes for their patients. Our product portfolio consists of the following product categories:Product category
Target addressable geography
Upper extremity joints and trauma United States and International Lower extremity joints and trauma United States and International Sports medicine and biologics United States and International Large joints and other Selected International Markets Although the industry traditionally organizes the orthopaedic market based on the mechanical features of the products, we organize our product categories in a way that aligns with the types of surgeons who most frequently use them. Therefore, we distinguish upper extremity joints and trauma from lower extremity joints and trauma, as opposed to viewing joint implants and trauma products as distinct product categories.
Along these lines,Descriptions of our productoffering is as follows:categories are detailed below.Product categoryTarget addressable geographyUpper extremity joints and traumaUnited States and InternationalLower extremity joints and traumaUnited States and InternationalSports medicine and biologicsUnited States and InternationalLarge joints and otherSelected International MarketsSee the Fiscal Year Comparisons contained in
the Management's“Part II – Item 7. Management’s Discussion and Analysis of Financial Condition and Results ofOperationOperations” section of thisfilingreport for a three-year revenue history by product category.Upper Extremity Joints and Trauma
The upper extremity joints and trauma product category includes joint implants and bone fixation devices for the shoulder, hand, wrist and elbow. Our global revenue from this category for the year ended
January 2, 2011December 29, 2013 was$139.2$184.5 million, or61%59% of total revenue, which represents growth of11%5% over the priorfiscalyear.Shoulder Joint Replacement and Trauma Implants—We expect the shoulder to continue to be the largest and most important product category for us for the foreseeable future. Our shoulder joint implants are used to treat painful shoulder conditions due to arthritis, irreparable rotator cuff tendon tears, bone disease, fractured humeral heads or failed previous shoulder replacement surgery. Our shoulder productsare designed forinclude the following:•- Our total joint replacement products have two components—a humeral implant consisting of a metal stem or base attached to a metal
ball,head, and a plastic implant for the glenoid (shoulder socket). Together, these two components mimic the function of a natural shoulder joint.•- Our products in this area include the Aequalis Ascend, Aequalis Primary, Aequalis PerFORM and Simpliciti shoulder systems. The Simpliciti stemless shoulder is currently available in certain international markets and is in a clinical trial in the United States.
Our hemi joint replacement products replace only the humeral head and allow it to articulate against the native glenoid.•- These products include our PYC Humeral Head and Inspyre. PYC stands for pyrocarbon, which is a biocompatible material and is currently available in certain international markets.
Our reversed implants, which include the Aequalis Reversed II shoulder, are used in arthritic patients lacking rotator cuff function. The components are different from a traditional"total"“total” shoulder in that the humeral implant has the plastic socket and the glenoid has the metalball.head. This design has the biomechanical impact of shifting the pivot point of the joint away from the body centerline andgivingrecruiting the deltoid musclesa mechanical advantageto enable the patient to elevate the arm.•Our convertible implants are modular implants that can be converted from a total or hemi joint replacement to a reversed implant at a later date if the patient requires it. In the third quarter of 2013, we launched our Aequalis Ascend Flex convertible shoulder system, which provides anatomic and reversed options within a single system and offers precise intra-operative implant-to-patient fit and easy conversion to reversed if necessary.Our resurfacing implants, which include the Aequalis Resurfacing Head, are designedto minimize bone resectionto preserve bone, which may benefit more active or younger patients with shoulder arthritis.•Trauma devices, such as plates, screws and nails, are non-articulating implants used to help stabilize fractures of the humerus.Hand, WristOur upper extremity trauma products include the Aequalis IM Nail, Aequalis Proximal Humeral Plate, Aequalis Fracture shoulder andElbow Joint Replacement and Trauma Implants—Aequalis Reversed Fracture shoulder.We also offer joint replacement and trauma products including implants, pins, plates and screws that are used to treat
In 2013, we also launched our Latitude EV total elbow prosthesis. The Latitude EV gives surgeons the ability to reproduce the natural flexion/extension axis and restore natural kinematics of the elbow with its anatomic design.arthritis in the hand, wrist and elbow. In addition, we offer trauma products including plates, screws and pins, to treat fractures ofthe hand, wrist and elbow. One of our distinctive product offerings for these smaller, non-load bearing joints are implants made froma biocompatible material calledpyrocarbon, which has low joint surface friction and a high resistance to wear. We offer a wide range of pyrocarbon implants internationally and have begun to introduce some of these products into the United States.Lower Extremity Joints and Trauma
The lower extremity joints and trauma category includes joint implants and bone fixation devices for the foot and ankle. Our global revenue from lower extremity joints and trauma for the year ended
January 2, 2011December 29, 2013 was$23.6$58.7 million,10%or 19% of total revenue, which represents growth of16%72% over the priorfiscalyear. This growth was primarily related to our acquisition of OrthoHelix Surgical Designs, Inc. (OrthoHelix) in the fourth quarter of 2012. In 2013, we received the required regulatory approvals to introduce the OrthoHelix product portfolio into certain international markets, including France and Germany, which resulted in the first international sales of these products in the second quarter of 2013. We have since received required regulatory approvals to introduce our OrthoHelix products in the United Kingdom.Ankle Joint Implants—Ankle arthritis is a painful condition that can be treated by fusingOur lower extremity products include the following:Our joint implants include replacement products for the anklejoint with plates or screws or bythat involve replacing the joint with an articulating multi-component implant. These joint implants may be mobile bearing, in which the plastic component is free to slide relative to the metal bearing surfaces, or fixed bearing, in which this component is constrained.PrecisionWe offer mobile bearing implants outside the United States, including the Salto Total Ankle prosthesis, and precision bearing implants globally, including the Salto Talaris Total Ankle mobile version.Our bone fixation products, including the OrthoHelix product portfolio, include a broad range of anatomically designed plates, screws and nails. These products arehighly anatomic fixed bearing implants.
MaxLock, MiniMaxLock, and MaxLock Extreme plate and screw systems and the Cannulink Intraosseous Fixation System (IFS) for hammertoe correction.Other Footused to stabilize andAnkle Jointheal fractured bones, joint dislocation, correct deformities andTrauma Implants—Our products include joint replacement implants to treat arthritisfuse arthritic joints ofthe toes and other small bone joints, trauma and bone fusion implants forthe foot and ankle that result from either acute injuries or chronic wear andother implants to address certain other deformitiestear. These devices are also utilized in the treatment of a wide range of non-traumatic surgical procedures. These products include thefoot.Sports Medicine and Biologics
Our revenue from sports medicine and biologics for the year ended January 2, 2011 was $13.2 million, or 6% of overall revenue, which represents growth of 100% in that segment over the prior fiscal year. Nearly all of our products in this product category were launched during the first half of 2009 and only in the United States. We have introduced some of these products internationally in 2010.Sports Medicine—The sports medicine product category includes products used across several anatomic sites to mechanically repair tissue-to-tissue or tissue-to-bone injuries.Because of its close relationship to shoulder joint replacement, the sports medicine market is of critical strategic importance to us.Rotator cuff repair is the largest sub-segment in the sports medicine market. Other procedures relevant toextremetiesextremities include shoulder instability treatment, Achilles tendon repair and soft tissue reconstruction of the foot and ankle and several other soft tissue repair procedures. Our sports medicine products include the Insite FT and Piton anchor products, ArthroTunneler arthroscopic tunneling device and Force Fiber suture products.Biologics—The field of biologics employs tissue engineering and regenerative medicine technologies focused on remodeling and regeneration of tendons, ligaments, bone and cartilage. Biologically or synthetically derived soft tissue grafts and scaffolds are used to treat soft tissue injures and are complementary to many sports medicine applications, including rotator cuff tendon repair and Achilles tendon repair. Hard tissue biologics products are used in many bone fusion or trauma cases where healing potential may be compromised and additional biologic factors are desired to enhance healing, where the surgeon needs additional bonestock and does not want to harvest a bone graft from another surgical siteor in cases where the surgeon wishes to use materials that are naturally incorporated by the body overtime in contrasttime. Our biologics products include the BioFiber biologic absorbable scaffold products and Phantom Fiber high strength, resorbable suture products.Because of its close relationship to
traditional metallic-basedextremity joint replacement and bone fixation, our sports medicine and biologics portfolio is comprised of products used to complement our upper and lower extremity product portfolios, providing surgeons a variety of products that mayrequire later removal.
We haveOur revenue from sports medicine and biologics for the year ended December 29, 2013 was $14.8 million, or 5% of total revenue, which represents arobust pipelinedecline in revenue ofbiologics products under development and are actively pursuing new product additions. We have in-licensed biologic materials such as Biofiber, an advanced high-strength resorbable polymer fiber produced using recombinant DNA technology as well as our F2A peptide, a synthetic version of5% over thenatural human FGF-2 growth factor.Table of Contentsprior year.Large Joints and Other
The large joints and other product category includes hip and knee joint replacement implants and other ancillary
products.products, including instrumentation. Hip and knee joint replacements are used to treat patients with painful arthritis in these largerjoints. Our global revenue from largejoints andotherto treat femoral fracture patients. We offer these productsfor the year ended January 2, 2011 was $51.4 million, or 23% of overall revenue, which represents growth of 5% over the prior fiscal year.We generated nearly all of our revenue from this category outside of the United States. We have continued to innovateinthis area so that we can maintain or grow market share in severalFrance and select internationalmarkets where the extremity markets have not yet reached a size to permit the type of channel focus that we have in the United States or where extremities specialization is not as prevalent as in the United States.geographies. We currently have no plans to actively market our large joint implants in the United States.Our
TechnologiesThe orthopaedic industry has produced many innovations in product designglobal revenue from large joints and other products for the year ended December 29, 2013 was $53.0 million, or 17% of total revenue, which represents growth of 1% over theyears. These innovations have typically consisted of evolutions of product design in implant fixation, joint mechanics,prior year.Manufacturing and
instruments and modifications of existing metal or plastic-based device designs rather than new products based on combinations of new designs and new materials. In contrast, the growth of our target markets has been driven by the development of products that respond to the particular mechanics of small joints and the importance of soft tissue to small joint stability and function.SupplyWe
are committed to the development of new designs utilizing both conventional materials and new tissue-friendly biomaterials that we expect will create new product categories. We believe that we are a leader in researching and incorporating some of these new technologies across multiple product platforms. A few selected examples are listed below:•Bone sparing implants: Several of our newer implants, such as our Ascend shoulder, Simpliciti shoulder and InSpyre shoulder, as well as our current implants, such as our Salto Talaris ankle implant, follow a philosophy of bone sparing site preparation to minimize the amount of native tissue that must be removed for the implant. We believe this philosophy results in a more anatomic implant that is less traumatic to the patient. By preserving native tissue, we believe surgeons retain more options compared to traditional implants should a revision procedure be required in the future.•Adjustable locking plates: We have incorporated CoverLoc technology into some of our plating systems, including wrist and ankle plates. CoverLoc technology is based upon high precision machining that places screw holes through metal plates at anatomic angles. Each hole is angled to achieve optimal screw or peg placement aimed at reducing the risk of screw loosening. Furthermore, the technology provides the surgeon the ability to pull bone fragments to the plate and then lock the screws in the desired angle with the cover plate, while providing protection for the surrounding soft tissues from the screw heads.•Knotless suture locking: Cinch technology is a patented mechanism that is the basis for our knotless suture anchor platform. The Piton suture anchor is the first product to incorporate Cinch technology. Cinch technology eliminates the need for knots while allowing surgeons to independently and sequentially tension each suture, even after inserters are removed. We believe this innovative design makes it easier for surgeons to perform arthroscopic surgery, eliminates knot slippage, and enables a uniform soft tissue repair across the repaired surface.
Advanced Design Technologies•Pyrocarbon: This material is gaining acceptance for use in orthopaedics due to its biocompatibility, low joint surface friction and high resistance to wear. Pyrocarbon also has a stiffness similar to bone, making it an ideal material for orthopaedic implants. We offer several joint replacement or joint spacer devices made from pyrocarbon in the hand, wrist and elbow, and have recently announced what we believe to be the first human implant of a pyrocarbon shoulder implant.•Resorbable polymers: Some of our productsutilizeresorbable polymers, the benefit of which is that once a soft tissue injury has healed and the implant is no longer necessary, there is no longer a foreign substance residing in the body. Our Biofiber material is a high-strength resorbable polymer that can be processed in many physical configurations including fiber, mesh and film. These materials are biocompatible and non-inflammatory. They degrade by cell-friendly processes into metabolites that already exist in humans, unlike other acidic bioresorbable materials. We also offer high strength next-generation resorbable materials in our Resorbable Fixation System product line of trauma pins and screws. These products benefit froma combination ofmaterials having a long history of surgical useinternal manufacturing andour supplier's ability to produce a high-strength, reliable, biodegradable implant.
Advanced Materials•Biologic tissue grafts: Our Conexa reconstructive tissue matrix product line was introduced through a partnership with LifeCell, a division of KCI. The Conexa material provides a complex three-dimensional biologic architecture to support cellular repopulation and vascular channels that allow for rapid capillary in-growth. Surgeons use this product in procedures to support regeneration of soft tissue, such as rotator cuff and Achilles tendon repairs.•Synthetic Growth Factors: F2A is an engineered peptide that is a synthetic version of the natural human FGF-2 growth factor. FGF-2 and other naturally occurring growth factors may play key roles in the body's healing and repair processes. Synthetic growth factors may address many of the manufacturing, handling and shelf life challenges that have limited the clinical role of natural growth factors. We have recently conducted pre-clinical testing of a scaffold incorporating F2A that demonstrates tissue regeneration in both small and large animal models. F2A has not yet been approved by the FDA.
Biologic TechnologiesDistributionWe have developed our distribution channels to serve the needs of our customers, primarily extremity specialist surgeons in the United States and a mix of extremity specialist and general orthopaedic surgeons in international markets. In the United States, we have a broad offering of joint replacement and repair, sports and biologic products targeting extremity specialists through a single distribution channel. Internationally, we utilize several distribution approaches depending on individual market requirements. We utilize direct sales organizations in several mature European markets and independent sales agencies for most other international markets. In France, we have two direct sales forces, one handling our upper extremity focused products and one handling our lower extremity portfolio. In emerging international markets such as China and Japan, where extremity markets are still undeveloped, we utilize independent sales agencies that carry both our extremity-focused and our hip and knee portfolios.United StatesIn the United States, we sell upper extremity joints and trauma, lower extremity joints and trauma, sports medicine and biologics products. We do not actively market hip or knee replacement joints inthe United States, although we have FDA clearance for selected large joint products. We sell our products through a single sales channel. Our U.S. sales force consists ofa network ofapproximately 24 independent commission-based sales agencies, which in aggregate utilized over 300 sales representatives as of January 2, 2011, many of whom exclusively sell our products. We believe a significant portion of these sales agencies' commission revenue is generated by sales of our products. Our success depends largely upon our abilityqualified outsourced manufacturing partners tomotivate these sales agencies and their representatives to sell our products. Additionally, we depend on their sales and service expertise and relationships with the surgeons in the marketplace. Our independent sales agencies are not obligated to renew their contracts with us, may devote insufficient sales efforts toproduce our productsor may focus their sales efforts on other products that produce greater commissions for them. A failure to maintainand surgical instrumentation. We manufacture ourexisting relationships with our independent sales agencies and their representatives could have an adverse effect on our operations. We do not control our independent sales agencies and they may not be successful in implementing our marketing plans. We employ four area business directors to support these independent sales agencies and have dedicated marketing support, to help drive adoption of our newly introduced extremities, sports and biologics products. During the course of the year, we host numerous opportunities for product training throughout the United States.InternationalWe sell our full product portfolio, including upper and lower extremities, sports medicine and biologics and large joints, in select international markets. We believe our full range of hip and knee products enable us to more effectively and efficiently service these markets where procedure or anatomic specialization is not as prevalent as in the United States and where extremities, sports medicine and biologics markets have not yet reached a size to permit the degree of channel focus we have in the United States. Our international distribution system consists of nine direct sales offices and approximately 32 distributors that sell ourinternally-sourced products inapproximately 35 countries. Our largest international market is France, where we have a direct sales force of 26 direct sales representatives. We also have direct sales offices and corporate subsidiaries in Germany, Italy, Spain, Switzerland, the Netherlands, the United Kingdom, Denmark and Australia that employ direct sales employees. Additional European countries, as well as countries in Latin America and Asia, are served by distributors who purchase products directly from us for resale to their local customers, with product ownership generally passing to the distributor upon shipment. As part of our strategy to grow internationally, we have selectively converted from distributors to direct sales representation in certain countries, as we did in the United Kingdom and Denmark in 2009. We intend to focus on expanding our presence in underserved countries, such as China, where we signed an agreement in 2009 with Weigao for the exclusive distribution of our shoulder, hip and knee products for a four-year term. Purchase quotas and prices are set at the end of each year and the agreement may be terminated prior to its expiration in 2014 upon breach by either party, including Weigao's failure to meet the purchase quota.Our total revenue in France was $47.3 million in 2010, $46.3 million in 2009 and $43.2 million in 2008. Our total revenue in the Netherlands was $4.1 million in 2010, $3.6 million in 2009 and $3.4 million in 2008.Research and DevelopmentWe are committed to a strong research and development program and have significantly increased our investment in this area since the acquisition by the Investor Group in 2006. Our research and development expenses were $17.9 million, $18.1 million and $20.6 million in 2010, 2009 and 2008, respectively. As of January 2, 2011, we had a research and development staff of 83 people, or 10% of total employees, principally located inthree locations: Montbonnot, France,and Warsaw, Indiana, with additional staff in Grenoble, France, San Diego, California and Boston, Massachusetts.We have dedicated internal product development teams focused on continuous innovation and introduction of new products for extremity joint replacements, extremity joint trauma, soft tissue repair and large joint replacement. We also have an active business development team that seeks to in-license development-stage products, which our internal team assists in bringing to market. In collaboration with our internal teams, we work closely with external research and development consultants and a global network of leading surgeon inventors to ensure we have broad access to best-in-class ideas and technology to drive our product development pipeline.Manufacturing and SupplyWe manufacture substantially all of our products at five sites including Montbonnot, Saint-Ismier andGrenoble, France andDunmanwayMacroom, Ireland. Our internal manufacturing operations are focused on product quality, continuous improvement andMacroom, Ireland.efficiency. Our operations in France have a long history and deep experience with orthopaedic manufacturing andinnovationinnovation. Additionally, we believe we are the only company to have vertically integrated operations for the manufacturing of pyrocarbon orthopaedic products. We believe that this capability gives us a competitive advantage in design for manufacturing andwe have invested in facilities upgrades to both expand capabilities and establish incremental lean cellular manufacturing practices there as well.prototyping of this innovative material. Our Irelandlocations havelocation has been practicingleanLean cellular manufacturing concepts for many years with a philosophy focused oncontinuous operational improvementhigh productivity, flexibility and capacity optimization.We continually manage our internal capacity and in-source manufacturing where we can; however, we are willing to outsource to our manufacturing partners when it provides us with cost efficiency, expertise, flexibility, and in instances where we need additional capacity. We also evaluate the potential to in-source products currently purchased from outside
vendors to on-site production. We are continuously working on product and process improvement projects to optimize our manufacturing processes and product costs to improve our profitability and cash flow. We believe that our manufacturing facilities and relationships will support our potential capacity needs for the foreseeable future.vendors.We use a diverse and broad range of raw materials in the manufacturing of our products. We purchase all of our raw materials and select components used in the manufacturing of our products from external suppliers. In addition, we purchase some supplies from single sources for reasons of proprietary know-how, quality assurance, sole source availability, cost-effectiveness or constraints resulting from regulatory requirements.
For example, we rely on one supplier for raw materials and select components in several of our products, including Poco Graphite, Inc., which supplies graphite for pyrocarbon on a purchase order basis, Heymark Metals Ltd., which supplies CoCr used in certain of our hip, shoulder and elbow products on a purchase order basis, and CeramTec Group, which supplies ceramic for ceramic heads for hips on a purchase order basis.We believe we are the only vertically integrated manufacturer of pyrocarbon orthopaedic products with production equipment to enable production of larger-sized implants. While we rely on an external supplier to supply us with surgical grade substrate material, we control the remaining pyrocarbon manufacturing process, which we believe gives us a competitive advantage in design for manufacturing and prototyping of this innovative material.We work closely with our suppliers to ensure continuity of supply while maintaining high quality and reliability.
To date,Although we have no long-term supply contracts with any of these suppliers, we have not experienced, to date, any significant difficulty in locating and obtaining the materials necessary to fulfill our production requirements.Some of our products are provided by suppliers underprivate-label distribution agreements. Under these agreements, the supplier generally retains the intellectual property and exclusive manufacturing rights. The supplier private labels the products under the Tornier brand for sale in certain fields of use and geographic territories. These agreements may be subject to minimum purchase or sales obligations.
Ourprivate-label distribution agreements expire between
2011this year and 2015 and are renewable under certain conditions or by mutual agreement. These agreements are terminable by either party upon notice and such agreements include some or all of the following provisions allowing for termination under certain circumstances: (i) eitherparty'sparty’s uncured material breach of the terms and conditions of theagreement,agreement; (ii) either party filing for bankruptcy, being bankrupt or becoming insolvent, suspending payments, dissolving or ceasing commercialactivity,activity; (iii) our inability to meet market development milestones and ongoing salestargets,targets; (iv) termination without cause, provided that payments are madeto the
distributor,distributor; (v) a merger or acquisition of one of the parties by a thirdparty,party; (vi) the enactment of a government law or regulation that restricts eitherparty'sparty’s right to terminate or renew the contract or invalidates any provision of the agreement or (vii) the occurrence of a"force“force majeure,"” including natural disaster, explosion or war.Ourprivate-label distribution agreements do not, individually or in the aggregate, represent a material portion of our business and we are not substantially dependent on them.
CompetitionOur business, and the orthopaedic industry in general, is capital intensive, particularly as it relates to inventory and surgical instrumentation. Our business requires a significant level of inventory driven by our global footprint, the requirement to provide products within a short period of time, and the number of different sizes of many of our products. In addition, we must maintain a significant investment in surgical instrumentation as we provide these instruments to healthcare facilities and surgeons for their use to facilitate the implantation of our products.Research and Development
We are committed to a strong research and development program focused on innovation. Our research and development teams are organized and aligned with our product marketing teams and are focused on improving clinical outcomes by designing new product features and by developing enhanced surgical techniques. Our internal research and development teams work closely with external research and development consultants and a global network of leading surgeon inventors to ensure we have broad access to best-in-class ideas and technologies to drive our product development pipeline. We also have an active business development team that actively evaluates novel technologies and development stage products, which our internal team can assist in bringing to market.
Our research and development expenses were $22.4 million, $22.5 million and $19.8 million in 2013, 2012 and 2011, respectively. As of December 29, 2013, we had a research and development staff of approximately 76 people, or 7% of our total employees, principally located in Montbonnot, France and Warsaw, Indiana, with additional staff in Grenoble, France, Bloomington, Minnesota and Medina, Ohio.
Competition
The market for orthopaedic devices is highly competitive and subject to rapid and profound technological change. Our currently marketed products are, and any future products we commercialize likely will be, subject to intense competition. We believe that the principal competitive factors
in our marketsinclude innovative product features and design, brand reputation, strong customer service, andservice. One ofthekey factors to our future success will be ourability tocontinue to introduce new products and improve existing products and technologies. In addition, we are committed to following the AdvaMed and Eucomed guidelines and codesprovide a full line ofethics in our interactions with customers and other healthcare professionals globally.orthopaedic products.We face competition from large diversified orthopaedic manufacturers, such as DePuy Orthopaedics, Inc., a Johnson & Johnson subsidiary, Biomet, Inc., Zimmer Corporation and Stryker Corporation, and established mid-sized orthopaedic manufacturers, such as Arthrex, Inc., Wright Medical Group, Inc., Exactech, Inc., Integra LifeSciences Corporation and
ArthroCare.ArthroCare Corporation. Many of the companies developing or marketing competitive orthopaedic productsare publicly traded or are divisions of publicly traded companies and mayenjoy several competitive advantages over us, including:•- greater financial and human resources for product development and sales and marketing;
•significantlygreater name recognition;•established relationships with surgeons, hospitals andthird-partythird party payors;•broader product lines and the ability to offer rebates or bundle products to offer greater discounts or incentives to gain a competitive advantage;•- and
established sales and marketing and distributionnetworks; and•more experience in conducting research and development, manufacturing, preparing regulatory submissions and obtaining regulatory approval for products.We also compete against smaller, entrepreneurial companies with niche product lines. Our competitors may increase their focus on the extremities market, which is our primary strategic focus. Our competitors may develop and patent processes or products earlier than
us,we can, obtain regulatoryclearanceclearances or approvals for competing products more rapidly thanus andwe can or develop more effective or less expensive products or technologies that render our technology or products obsolete or non-competitive. We also compete withour competitorsother organizations in recruiting and retaining qualified scientific, management andmanagementsales personnel, as well as in acquiring technologiesand technology licensescomplementary to our products or advantageous to our business. If our competitors are more successful than us in these matters,our businesswe may beharmed.unable to compete successfully against our existing and future competitors.Intellectual Property
Patents, trade secrets, know-how and other proprietary rights are important to the continued success of our business. We believe our patents are valuable and our trade secrets, especially with respect to manufacturing processes, materials and product design, are also important in maintaining the proprietary nature of our product lines. We also rely upon
trade secrets, know-how,continuing technological innovation,andlicensing opportunities, our creative product development and marketing staff, knowledge and experience to develop and maintain our competitive position.We protect our proprietary rights through a variety of
methods, including confidentiality agreements and proprietary information agreements with vendors, employees, consultants and others who may have access to proprietary information.Although we believe our patents are valuable, our knowledge and experience, our creative product development and marketing staff, and our trade secret information with respect to manufacturingprocesses, materials and product design, have been equally important in maintaining our proprietary product lines.methods. As a condition of employment, we generally require employees to executea confidentialityan employment agreement relating to the confidential nature of and company ownership of proprietary information and assigningpatentintellectual property rights to us. We generally require confidentiality agreements with vendors, consultants and others who may have access to proprietary information. We generally limit access to our facilities and review the release of company information in advance of public disclosure.We cannot be assured that our patents will provide competitive advantages for our products, or that our competitors will not challenge or circumvent these rights. In addition, we cannot be assured that the
United StatesU.S. Patent and Trademark Office, or USPTO, or foreign patent offices will issue any of our pending patent applications. The USPTO and foreign patent offices also mayalso denyreject or require significant narrowing of claims in our pending patent applicationsandaffecting patents issuing from the pending patent applications. Any patents issuing from our pending patent applications may not provide us with significant commercial protection. We could incur substantial costs in proceedings before the USPTO or foreign patent offices, includinginterference oropposition and other post-grant proceedings. These proceedings could result in adverse decisions as to thepriorityvalidity of our inventions. Additionally, the laws of some of the countries in which our products are or may be sold may not protect our products and intellectual property to the same extent as the laws in the United States, or at all.While we do not believe that any of our products infringe any valid claims of patents or other proprietary rights held by third parties, we cannot be assured that we do not infringe any patents or other proprietary rights held by third parties. If our products were found to infringe any proprietary right of a third party, we could be required to pay significant damages or license fees to the third party or cease production, marketing and distribution of those products.Litigation also mayalsobe necessary to enforce patent rights weholdown.The Leahy-Smith America Invents Act, or the Leahy-Smith Act, which was adopted in September 2011, includes a number of significant changes to
protect trade secretsU.S. patent law, including provisions that affect the way patent applications will be prosecuted and may also affect patent litigation. Under the Leahy-Smith Act, the United States will transition from a “first-to-invent” system to a “first-to-file” system for patent applications filed on ortechniques we own.after March 16, 2013. The USPTO is currently developing regulations and procedures to govern administration of the Leahy-Smith Act, and many of the substantive changes to patent law associated with the Leahy-Smith Act have recently become effective. Accordingly, it is not clear what, if any, impact the Leahy-Smith Act will have on the operation of our business.We
alsorely on trade secrets and other unpatented proprietary technology. We cannot be assured that we can meaningfully protect our rights in our unpatented proprietary technology or that others will not independently develop substantially equivalent proprietary products or processes or otherwise gain access to our proprietary technology. We seek to protect our trade secrets and proprietary know-how, in part, with confidentiality agreements with employees and consultants. We cannot be assured, however, that the agreements will not be breached, that we will have adequate remedies for any breach or that our competitors will not discover or independently develop our trade secrets. Litigation also may be necessary to protect trade secrets or techniques we own.Corporate HistoryWhile we do not believe that any of our products infringe any valid claims of patents or other proprietary rights held by third parties, we cannot be assured that we do not infringe upon any patents or other proprietary rights held by third parties. If our products were found to infringe upon any proprietary right of a third party, we could be required to pay significant damages or license fees to the third party or cease production, marketing and distribution of those products. Litigation also may be necessary to enforce patent rights we hold or to protect trade secrets or techniques we own.Government Regulation
We
were foundedare subject to varying degrees of government regulation in the1940s by René Torniercountries inSaint-Ismier, Francewhich we conduct business. In some countries, such as the United States, Europe, Canada andare oneJapan, government regulation is significant and, we believe there is a general trend toward increased and more stringent regulation throughout the world. As a manufacturer and marketer ofthe early pioneers of the orthopaedic implant market. We originally manufactured dental surgical products, and diversified into screws and plates for orthopaedic surgery in the 1950s, and entered the joint replacement market with a hip implant in the 1960s. Alain Tornier, René Tornier's son, began to work for us in 1970 and assumed a leadership role in 1976 when René Tornier died. Alain Tornier modernized our manufacturing; organized and expanded commercial operations with a direct sales force in France; introduced a knee implant product line; and established our first international subsidiary in Spain. During the 1990s and early 2000s, Alain Tornier continued to improve upon our growth by introducing new products and expanding into new international markets. In 2006, Alain Tornier sold a majority stake in us to the Investor Group, but retained a minority equity position and became a non-executive director.Since the acquisition by the Investor Group,medical devices, wehave significantly increased our investment in research and development, from $3.0 million in 2006 to $17.9 million in 2010. In addition, we have expanded our product portfolio and ability to serve our target customers through a series of strategic acquisitions, licensing and distribution agreements. Each of these transactions was specifically targeted for its potential to either improve our ability to compete in an existing market or expand our addressable market by broadening our product portfolio into a related area. The entry into the sports medicine market in particular expanded our addressable market to include the core products used by our shoulder surgeon customers, who typically perform both shoulder joint replacement and shoulder sports medicine procedures. In addition, we have been active in licensing new material technologies with longer-term potential to differentiate our product offering. Finally, we expanded geographically in selected international markets.Regulatory MattersFDA RegulationBoth before and after approval or clearance our products and product candidatesare subject to extensiveregulation. Inregulation by the U.S. Food and Drug Administration, other federal governmental agencies and state agencies in the United Stateswe are regulated byand similar foreign governmental authorities in countries located outside theFDA underUnited States. These regulations generally govern theFederal Food, Drug,introduction of new medical devices, the observance of certain standards with respect to the design, manufacture, testing, labeling, promotion andCosmetic Act,sales of the devices, the maintenance of certain records, the ability to track devices, the reporting of potential product defects, the import and export of devices, as well as otherregulatory bodies. These regulations govern, amongmatters. In addition, as a participant in the healthcare industry, we are also subject tovarious other
things, the following activities in which weU.S. federal, state andour contract manufacturers, contract testing laboratories and suppliers are involved:•product development;•product testing;•product manufacturing;•product labeling;•product safety;•product storage;•product market clearance or approval;•product advertising and promotion;•product import and export; and•product sales and distribution.
Failureforeign laws. We strive to comply with regulatory requirements governing our products and operations and to conduct our affairs in an ethical manner. This practice is reflected in our Code of Business Conduct and Ethics, various other compliance policies and through theFederal Food, Drug,responsibility of the nominating, corporate governance andCosmetic Actcompliance committee of our board of directors, which oversees our compliance with legal and regulatory requirements as well as our ethical standards and policies. We devote significant time, effort and expense to addressing the extensive government and regulatory requirements applicable to our business. Governmental regulatory actions against us could result inamong other things,warning letters,civil penalties,delays in approving or refusal to approve a product,candidate, productthe recallproductor seizureinterruptionof our products, suspension or revocation of the authority necessary for the productionoperating restrictions, suspension on withdrawalor sale ofproduct approval, injunctions orour products, and other civil and criminalprosecution.sanctions.FDA Approval or Clearance of Medical DevicesUnited StatesIn the United States, numerous laws and regulations govern all the processes by which medical devices are brought to market and marketed. These include the U.S. Federal Food, Drug and Cosmetic Act and regulations issued or promulgated thereunder, among others. The FDA has enacted regulations that control all aspects of the development, manufacture, advertising, promotion and post-market surveillance of medical devices. In addition, the FDA controls the access of products to market through processes designed to ensure that only products that are safe and effective are made available to the public. All of our products currently marketed in the United States have been listed, cleared or approved by the FDA, in most cases by 510(k) clearance, except for certain low-risk devices that do not require FDA review and approval or clearance prior to commercial distribution, but are still subject to FDA regulations and must be listed with the FDA.
Medical devices are subject to varying degrees of regulatory control in the United States and are classified in one of three classes depending on risk and the extent of controls the FDA determines are necessary to reasonably ensure their safety and
efficacy. These classifications generally require the following:•Class I: general controls, such as labeling and adherence to quality system regulations;•Class II: general controls, premarket notification (510(k)) and special controls such as performance standards, patient registries and postmarket surveillance; and•Class III: general controls and approval of a PMA.
effectiveness. Most of our
newproducts fall into an FDAclassificationsclassification thatrequirerequires the submission of aPremarket Notificationpremarket notification (510(k)) to the FDA.InThis process requires us to demonstrate that the510(k) process, the FDA reviews a premarket notification and determines whether a proposeddevice to be marketed is"substantially equivalent"“substantially equivalent” to a previously cleared 510(k) device or a device that was in commercial distribution before May 28, 1976,for which the FDA has not yet called for the submission of PMA applications,referred to as apredicate“predicate” device. In making this determination, the FDA compares the proposed new device to the predicate device.If the two devices are comparable in intended use and safety and effectiveness, the device may be cleared for marketing. 510(k) submissions generally include, among other things, a description of the device and its manufacturing, device labeling, medical devices to which the device is substantially equivalent, safety and biocompatibility information and the results of performance testing. In some cases, a 510(k) submission must include data from human clinical studies. Marketing may commence only when the FDA issues a clearance letter finding the proposed device to be substantially equivalent to the predicate.After a device receives 510(k) clearance, any product modification that could significantly affect the safety or effectiveness of the product, or any product modification that would constitute a significant change in intended use, requires a new 510(k)clearance or, ifclearance. If the modified devicewouldis no longerbesubstantially equivalent, it would require either de novo or aPMA.pre-market, or PMA, approval. The FDA is increasingly moving devices with slightly different proposed indication statement or different technological features off the 510(k) path and on to the de novo path resulting in more time and expense for us.If the FDA determines that
theour product does not qualify for 510(k) clearance, thenthe company must submit and the FDA must approvewe would be required to make a submission for a de novo approval or a PMA before marketing can begin.Other devices we may develop and market may be classified as Class III for which the FDA has implemented stringent clinical investigation and PMA requirements.The PMA processwould requirerequires us to provide clinical and laboratory data that establishes that the newmedical device is safe and effective. Information about the device and its components, device design, manufacturing and labeling, among other information, must also be included in the PMA. As part of the PMA review, the FDA will typically inspect the manufacturer's facilities for compliance with QSR requirements, which govern testing, control, documentation and other aspects of quality assurance with respect to manufacturing. The FDA will approve the new device for commercial distribution if it determines that the data and information in the PMA constitute valid scientific evidence and that there is reasonable assurance that thedevice is safe and effectivefor its intended use(s)in an absolute sense as opposed to in a comparative sense as with a 510(k). The PMA can include post-approval conditions including, among other things, restrictions on labeling, promotion, sale and distribution, data reporting (surveillance), or requirements to do additional clinical studies post-approval. Even after approval of a PMA, a new PMA or PMA supplement is required to authorize certain modifications to the device, its labeling or its manufacturing process.All of our devices marketed in the United States have been listed, cleared or approved by the FDA. Some low-risk medical devices (including most instruments) do not require FDA review and approval or clearance prior to commercial distribution, but are subject to FDA regulations and must be listed with the FDA. The FDA has the authority to: halt the distribution of certain medical devices; detain or seize adulterated or misbranded medical devices; or order the repair, replacement of or refund the costs of such devices. There are also requirements of state, local and foreign governments that we must comply with in the manufacture and marketing of our products. For example, some jurisdictions require compliance with the Pharmaceutical Research and Manufacturers of America's Code on Interactions with Healthcare Professionals or its equivalent. Laws and regulations and the interpretation of those laws and regulations may change in the future. We cannot foresee what effect, if any, such changes may have on us.Clinical TrialsOne or more clinical trials
aremay be required to support a 510(k) application or a de novo submission and almost always are required to support a PMAapplication and are sometimes required to support a 510(k) submission.application. Clinical trials of unapproved or uncleared medical devices or devices being studied for uses for which they are not approved or cleared (investigational devices) must be conducted in compliance with FDA requirements. Ifan investigationalhuman clinical trials of a devicecouldposeare required and the device presents a significant risk,to patients,the sponsorcompanyof the trial mustsubmit an application forfile an investigational device exemptionor IDE, to the FDA(IDE) application prior toinitiation of thecommencing human clinicalstudy. Antrials. The IDE application must be supported byappropriatedata,such astypically including the results of animalandand/or laboratorytest results, showing that ittesting. If the IDE application issafe to test the device in humans and that the testing protocol is scientifically sound. The IDE will automatically become effective 30 days after receiptapproved by the FDAunless the FDA notifies the company that the investigation may not begin. Clinical trials of investigational devices may not begin until anand one or more institutional reviewboard,boards (IRBs), human clinical trials may begin at a specific number of institutional investigational sites with the specific number of patients approved by the FDA. If the device presents a non-significant risk to the patient, a sponsor may begin the clinical trial after obtaining approval for the trial by one orIRB, has approvedmore IRBs without separate approval from thestudy.FDA. During the trial, the sponsor must comply with the
FDA'sFDA’s IDE requirements including, for example,forinvestigator selection, trial monitoring, adverse event reporting and recordkeeping. The investigators must obtain patient informed consent, rigorously follow the investigational plan and trial protocol, control the disposition of investigational devices and comply with reporting and recordkeeping requirements. We, the FDA and the IRB at each institution at which a clinical trial is being conducted may suspend a clinical trial at any time for various reasons, including a belief that the subjects are being exposed to an unacceptable risk.DuringWe are currently conducting a few clinical trials, including one in theapproval or clearance process, the FDA typically inspects the records relating to the conduct of one or more trials supporting the application.United States involving our Simpliciti stemless shoulder.Post-market RegulationAfter a device is cleared or approved for marketing, numerous and pervasive regulatory requirements continue to
apply.apply and we continue to be subject to inspection by the FDA to determine our compliance with these requirements, as do our suppliers, contract manufacturers and contract testing laboratories. Theseinclude:•- requirements include, among others, the
QSR regulation,following:Quality System regulations, whichgoverns,govern, among other things, how manufacturers design, test, manufacture, modify, label, exercise quality control over and document manufacturing of their products;•labeling and claims regulations, which require that promotion is truthful, not misleading, fairly balanced and provide adequate directions for use and that all claims are substantiated, and also prohibit the promotion of products for unapproved or"off-label"“off-label” uses and impose other restrictions on labeling;FDA guidance of off-label dissemination of information and•theresponding to unsolicited requests for information;Medical Device Reporting regulation, which requires reporting to the FDA certain adverse experiences associated with use of theproduct.product;We continuecomplaint handling regulations designed tobetrack, monitor and resolve complaints related to our products; andin some cases, ongoing monitoring of our products’ performance and periodic reporting to the FDA of such performance results.Some of our biologics tissue-based products are subject not only to
inspection bythe FDA’s medical device regulations, but also specific regulations governing human cells, tissues and cellular and tissue-based products, or HCT/Ps. Section 361 of the Public Health Service Act, or PHSA, authorizes the FDA todetermine our complianceissue regulations to prevent the introduction, transmission or spread of communicable disease. HCT/Ps regulated as “361” HCT/Ps are subject to requirements relating to registering facilities and listing products withregulatorythe FDA, screening and testing for tissue donor eligibility, Good Tissue Practice when processing, storing, labeling, and distributing HCT/Ps, including required labeling information, stringent record keeping, and adverse event reporting, among other applicable requirementsas do our suppliers, contract manufacturersandcontract testing laboratories.laws.International RegulationWe are subject to
regulationsvarious U.S. federal andproduct registrationstate laws concerning healthcare fraud and abuse, including anti-kickback and false claims laws, and other matters. The federal Anti-Kickback Statute (and similar state laws) prohibits certain illegal remuneration to physicians and other health care providers that may financially bias prescription decisions and result in an over-utilization of goods and services reimbursed by the federal government. The False Claims Act (and similar state laws) prohibits conduct on the part of a manufacturer which may cause or induce an inappropriate reimbursement for devices reimbursed by the federal government. These laws are administered by, among others, the U.S. Department of Justice, the Office of Inspector General of the Department of Health and Human Services and state attorneys general. Many of these agencies have increased their enforcement activities with respect to medical device manufacturers in recent years. Violations of these laws are punishable by criminal and/or civil sanctions, including, in some instances, fines, imprisonment and exclusion from participation in federal government healthcare programs, including Medicare, Medicaid and Veterans Administration (VA) health programs. We are also subject to the U.S. federal Physician Sunshine Payment Act and various state laws on reporting remunerative relationships with healthcare customers. We are also subject to various federal and state laws that protect the confidentiality of certain patient health information, including patient medical records, and restrict the use and disclosure of patient health information by healthcare providers, such as the Health Insurance Portability and Accountability Act of 1996, or HIPAA.The FDA, in cooperation with U.S. Customs and Border Protection, administers controls over the import of medical devices into the United States. The U.S. Customs and Border Protection imposes its own regulatory requirements on the import of our products, including inspection and possible sanctions for noncompliance. We are also subject to foreign trade controls administered by certain U.S. government agencies, including the Bureau of Industry and Security within the Commerce Department and the Office of Foreign Assets Control within the Treasury Department.
International
Outside the United States, we are subject to government regulation in
many foreignthe countries in which wemay sell our products, including in the areas of:•design, development, manufacturing and testing;•product standards;•product safety;•marketing, sales and distribution;•packaging and storage requirements;•labeling requirements;•content and language of instructions for use;•clinical trials;•record keeping procedures;•advertising and promotion;•recalls and field corrective actions;
•post-market surveillance, including reporting of deaths or serious injuries and malfunctions that, if they were to recur, could lead to death or serious injury;•import and export restrictions; and•tariff regulations, duties and tax requirements.
The time required to obtain clearance required by foreign countries may be longer or shorter than that required for FDA clearance, and requirements for licensing a product in a foreign country may differ significantly from FDA requirements.Inoperate. Although manyof the foreign countries in which we market our products, we are subject to local regulations affecting, among other things, design and product standards, packaging requirements and labeling requirements. Manyof the regulations applicable to ourdevices andproducts in these countries are similar to those of theFDA.FDA, these regulations vary significantly from country to country and with respect to the nature of the particular medical device. The time required to obtain foreign approvals to market our products may be longer or shorter than the time required in the United States, and requirements for such approvals may differ from FDA requirements.InTo market our product devices in theEEA, our devicesmember countries of the European Union, we are required to comply with theessential requirementsEuropean Medical Device Directives and to obtain CE mark certification. CE mark certification is the European symbol of adherence to quality assurance standards and compliance with applicable European Medical Device Directives. Under theEUEuropean MedicalDevicesDevice Directives,(Council Directive 93/42/EEC of 14 June 1993 concerningall medical devicesas amended, and Council Directive 90/385/EEC of 20 June 2009 relating to active implantable medical devices, as amended). Compliance with these requirements entitles us to affix themust qualify for CEconformity mark to our medical devices, without which they cannot be commercialized in the EEA. In order to demonstrate compliance with the essential requirements andmarking. To obtainthe right to affix the CE conformity mark we must undergo a conformity assessment procedure, which varies according to the type of medical device and its classification. Except for low-risk medical devices (Class I), where the manufacturer can issue an EC Declaration of Conformity based on a self-assessment of the conformity of its products with the essential requirements of the Medical Devices Directives, a conformity assessment procedure requires the intervention of a Notified Body, which is an organization accredited by a Member State of the EEA to conduct conformity assessments. The Notified Body would typically audit and examine the quality system for the manufacture, design and final inspection of our devices before issuing a certification demonstrating compliance with the essential requirements. Based on this certification we can draw up an EC Declaration of Conformity, which allows usauthorization to affix the CE mark to one of ourproducts.U.S. Anti-kickbackproducts, a recognized European Notified Body must assess our quality systems andFalse Claims LawsIntheUnited States, there are federal and state anti-kickback laws that prohibit the payment or receipt of kickbacks, bribes or other remuneration intendedproduct’s conformity toinduce the purchase or recommendation of healthcare products and services. Violations of these laws can lead to civil and criminal penalties, including exclusion from participation in federal healthcare programs. These laws are potentially applicable to manufacturers of products regulated by the FDA, such as us, and hospitals, physicians and other potential purchasers of such products.In particular, the federal Anti-Kickback Law prohibits persons from knowingly and willfully soliciting, receiving, offering or providing remuneration, directly or indirectly, to induce either the referral of an individual, or the furnishing, recommending, or arranging for a good or service, for which payment may be made under a federal healthcare program such as the Medicare and Medicaid programs. The definition of "remuneration" has been broadly interpreted to include anything of value, including for example, gifts, discounts, the furnishing of supplies or equipment, credit arrangements, payments of cash, waivers of payments, ownership interests and providing anything at less than its fair market value. In addition, the recently enacted Patient Protection and Affordable Care Act, as amended by the Health Care and Education Affordability Reconciliation Act, collectively, the PPACA, among other things, amends the intent requirement of the federal anti-kickback and criminal healthcare fraud statutes. A person or entity no longer needs to have actual knowledge of this statute or specific intent to violate it. In addition, the PPACA provides that the government may assert that a claimincluding items or services resulting from a violation of the federal anti-kickback statute constitutes a false or fraudulent claim for purposes of the false claim statutes. The lack of uniform interpretation of the Anti-Kickback Law makes compliance with the law difficult. The penalties for violating the Anti-Kickback Law can be severe. These sanctions include criminal penalties and civil sanctions, including fines, imprisonment and possible exclusion from participation in federal healthcare programs.Recognizing that the Anti-Kickback Law is broad and may technically prohibit many innocuous or beneficial arrangements within the healthcare industry, the U.S. Department of Health and Human Services issued regulations in July of 1991, which the Department has referred to as "safe harbors." These safe harbor regulations set forth certain provisions which, if met in form and substance, will assure medical device manufacturers, healthcare providers and other parties that they will not be prosecuted under the federal Anti-Kickback law. Additional safe harbor provisions providing similar protections have been published intermittently since 1991. Our arrangements with physicians, hospitals and other persons or entities who are in a position to refer may not fully meet the stringent criteria specified in the various safe harbors. Although full compliance with these provisions ensures against prosecution under the federal Anti-Kickback Law, the failure of a transaction or arrangement to fit within a specific safe harbor does not necessarily mean that the transaction or arrangement is illegal or that prosecution under the federal Anti-Kickback law will be pursued. Even though we continuously strive to comply withthe requirements of theAnti-Kickback Law, liability underEuropean Medical Device Directives. We are subject to inspection by theAnti-Kickback Law may still arise because of the intentions or actions of the partiesNotified Bodies for compliance withwhom we do business, including our independent distributors. While wethese requirements. We also arenot aware of any such intentions or actions, we have only limited knowledge regarding the intentions or actions underlying those arrangements. Conduct and business arrangements that do not fully satisfy one of these safe harbor provisions may result in increased scrutiny by government enforcement authorities.Other provisions of state and federal law provide civil and criminal penalties for presenting, or causing to be presented, to third-party payors for reimbursement, claims that are false or fraudulent, or that are for items or services that were not provided as claimed. Although our business is structuredrequired to comply withtheseregulations of other countries in which are products are sold, such as obtaining Ministry of Health Labor andother applicableWelfare approval in Japan, Health Protection Branch approval in Canada and Therapeutic Goods Administration approval in Australia.Our manufacturing facilities in France and Ireland are subject to environmental health and safety laws
it is possible that someand regulations, including those relating to the use, registration, handling, storage, disposal, recycling and human exposure to hazardous materials and discharges ofour business practicessubstances in thefuture could beair, water and land. For example, in France, requirements known as the Installations Classées pour la Protection de l’Environnement regime provide for specific environmental standards related to industrial operations such as noise, water treatment, air quality and energy consumption. In Ireland, our manufacturing facilities are likewise subject toscrutinylocal environmental regulations, such as related to water pollution andchallengewater quality, which are administered byfederalthe Environmental Protection Agency.Our operations in countries outside the United States are subject to various other laws such as those regarding recordkeeping and privacy, laws regarding sanctioned countries, entities and persons, customs, import-export, laws regarding transactions in foreign countries and the U.S. Foreign Corrupt Practices Act, which generally prohibits covered entities and their intermediaries from engaging in bribery or
state enforcementmaking other prohibited payments to foreign officialsunder these laws. This typefor the purpose ofchallenge could have a material adverse effect on ourobtaining or retaining businessfinancial condition and resultsor other benefits, as well as similar anti-corruption laws ofoperations.other countries, such as the UK Bribery Act.Third-Party Coverage and Reimbursement
We anticipate that salesSales volumes and prices of our productswilldepend in large part on the availability of coverage and reimbursement fromthird-party payors.Third-party payors include governmental programs such as Medicare and Medicaid, private insurance plans andworkers'workers’ compensation plans. Thesethird-party payors may deny coverage or reimbursement for a product ortherapyprocedure if they determine that the product ortherapyprocedure was not medically appropriate or necessary. Thethird-party payors also may place limitations on the types of physicians that can perform specific types of procedures. Also,third-party payors are increasingly challenging the prices charged for medical products and services. Somethird-party payors mustalsoapprove coverage for new or innovative devices ortherapiesprocedures before they will reimburse healthcare providers who use the products or therapies. Even though a new product may have been cleared for commercial distribution, we may find limited demand for thedeviceproduct until reimbursement approval has been obtained from governmental and privatethird-party payors.The Centers for Medicare & Medicaid Services, or CMS, the agency responsible for administering the Medicare program, sets coverage and reimbursement policies for the Medicare program in the United States. CMS policies may alter coverage and payment related to our product portfolio in the future. These changes may occur as the result of national coverage determinations issued by CMS or as the result of local coverage determinations by contractors under contract with CMS to review and make
coverage and payment decisions. Medicaid programs are funded by both federal and state governments, may vary from state to state and from year to year and will likely play an even larger role in healthcare funding pursuant to the recently enacted Patient Protection and Affordable Care Act, as amended by the Health Care and Education Affordability Reconciliation Act, collectively, the PPACA.
A key component in ensuring whether the appropriate payment amount is received for physician and other services, including those procedures using our products, is the existence of a Current Procedural Terminology, or CPT, code. To receive payment, health care practitioners must submit claims to insurers using these codes for payment for medical services. CPT codes are assigned, maintained and annually updated by the American Medical Association and its CPT Editorial Board. If the CPT codes that apply to the procedures performed using our products are changed, reimbursement for performances of these procedures may be adversely affected.
In the United States, some insured individuals enroll in managed care programs, which monitor and often require pre-approval of the services that a member will receive. Some managed care programs pay their providers on a per capita (patient) basis, which puts the providers at financial risk for the services provided to their patients by paying these providers a predetermined payment per member per month and, consequently, may limit the willingness of these providers to use our products.
We believe that the overall escalating cost of medical products and services being paid for by the government and private health insurance has led to, and will continue to lead to, increased pressures on the healthcare and medical device industry to reduce the costs of products and services. Allthird-party reimbursement programs are developing increasingly sophisticated methods of controlling healthcare costs through prospective reimbursement and capitation programs, group purchasing, redesign of benefits, requiring second opinions prior to major surgery, careful review of bills, encouragement of healthier lifestyles and other preventative services and exploration of more
cost- effectivecost-effective methods of delivering healthcare. There can be no assurance thatthird-party reimbursement and coverage will be available or adequate, or that future legislation, regulation or reimbursement policies ofthird-party payors will not adversely affect the demand for our products or our ability to sell these products on a profitable basis. The unavailability or inadequacy ofthird- partythird-party payor coverage or reimbursement could have a material adverse effect on our business, operating results and financial condition.In international markets,Outside the United States, reimbursement and healthcare payment systems vary significantly by country, and many countries have instituted price ceilings on specific product lines and procedures. There can be no assurance that procedures using our products will be considered medically reasonable and necessary for a specific indication, that our products will be considered cost-effective bythird-party payors, that an adequate level of reimbursement will be available or that thethird-party
payors'payors’ reimbursement policies will not adversely affect our ability to sell our products profitably. We believe we have received increased requests for clinical data for the support of registration and reimbursement outside the United States and Europe. More and more, local, product specific reimbursement law is applied as an overlay to medical device regulation, which has provided an additional layer of clearance requirement. Specifically, Australia now requires clinical data for clearance and reimbursement be in the form of prospective, multi-center studies, a high bar not previously applied. In addition, in France, certain innovative devices (such as some of our products made from pyrolytic carbon), have been identified as needing to provide clinical evidence to support a “mark-specific” reimbursement.EmployeesSeasonality and BacklogOur business is somewhat seasonal in nature, as many of our products are used in elective procedures, which typically decline during June, July and August and can increase at the end of the year once annual deductibles have been met on health insurance plans. Additionally, elective procedures typically decline in certain parts of Europe during the third quarter of the year due to holiday and vacation schedules.
The time period between the placement of an order for our products and shipment is generally short. As such, we do not consider our backlog of firm orders to be material to an understanding of our business.
Employees
As of
January 2, 2011,December 29, 2013, we hadapproximately 7921,076 employees, including331405 in manufacturing and operations,8376 in research and development and the remaining in sales, marketing, quality, regulatory and related administrative support. Of our7921,076 worldwide employees,178391 employees were located in the United States and614685 employees were located outside of the United States, primarilythroughout Europe.in France and Ireland.TableFinancial Information about Geographical AreasSee Note 13 to our consolidated financial statements for information regarding our revenues and long-lived assets by geographic area.
Available Information
Our principal executive offices are located at Prins Bernhardplein 200, 1097 JB Amsterdam, The Netherlands. Our telephone number at this address is (+ 31) 20 675-4002. Our agent for service of
process in the United States is CT Corporation, 1209 Orange St., Wilmington, Delaware 19801. Our website is located at www.tornier.com. The information contained on our website or connected to our website is not incorporated by reference into and should not be considered part of this report.ContentsWe make available, free of charge and through our Internet web site, our annual reports on Form 10-K, quarterly reports on Form 10-Q, current reports on Form 8-K, and any amendments to any such reports filed or furnished pursuant to Section 13(a) or 15(d) of the Securities Exchange Act of 1934, as amended, as soon as reasonably practicable after we electronically file such material with, or furnish it to, the Securities and Exchange Commission.
ItemITEM 1A.Risk Factors.
RISK FACTORSWe are affected by risks specific to us as well as factors that affect all businesses operating in a global market. The following
information containsis a discussion of the specific risks that couldpotentially impactmaterially adversely affect our business, financial condition or operatingresults. We may be subject to additional risks that are not currently known to us or those which we deem immaterial that may also impact our business operations.results:Risks Related to Our Business and Our Industry
We have a history of operating losses and negative cash
flow.flow and may never achieve profitability.We have
experienceda history of operating lossessince our acquisition by the Investor Group in July 2006and atJanuary 2, 2011,December 29, 2013, we had an accumulated deficit of$183.5$272.2 million. Our ability to achievecash flow positive operationsprofitability will be influenced by many factors, including the extent and duration of our future operating losses, the level and timing of futuresalesrevenue and expenditures, development, commercialization and market acceptance of new products, the results and scope of ongoing research and development projects, the success of our direct sales force and independent distributor and sales agency organization and transitions related thereto, competing technologies and market developments and regulatorydevelopments. Additionally, we expect generalrequirements andadministrative expenses to increase due to the additional operational and reporting costs associated with being a public company.delays. As a result, we may continue to incur operating losses for the foreseeable future. These losses will continue to have an adverse impact onshareholders'our shareholders’ equity, and we may never achieve or sustain profitability.We have transitioned in our U.S. sales channel from a network of independent sales agencies that sold our full product portfolio to a combination of direct sales teams and independent sales agencies that are individually focused on selling either upper extremity products or lower extremity products across the territories that they serve. This transition has had, and likely will continue to have, an adverse effect on our operations and operating results and, ultimately, may not prove to be successful.
In the United States, we historically had a single sales channel that consisted of a network of independent commission-based sales agencies, along with direct sales representation in certain territories. As a result of our acquisition of OrthoHelix in October 2012, we decided to transition to a combination of direct sales teams and independent sales agencies that are individually focused on selling either upper extremity products or lower extremity products across the territories that they serve. We believe this strategy provides increased focus to our sales teams and allows us to increase the product proficiency of our sales representatives and increase our selling opportunities by improving our overall procedure coverage, leveraging our entire product portfolio, and accessing new specialists, general surgeons and accounts. However, we may be incorrect and it is possible that our separate sales strategy may be unsuccessful.
To create these separate upper and lower extremity sales channels, we terminated relationships with certain independent sales agencies and transitioned these territories to new agencies or established direct sales representation; acquired sales agencies and established direct sales representation; or transitioned an upper or lower extremity product portfolio between agencies or from an agency to a new direct sales team. This transition caused disruption in our U.S. sales channel during 2013 and we expect that this disruption will continue throughout 2014 as we continue to separate territories, hire additional sales representatives and educate and train our sales teams. It is also possible that we may become subject to litigation and incur future charges and cash expenditures in connection with this transition, which charges and cash expenditures would adversely affect our operating results.
We rely on distributors, independent sales agencies and their representatives to market and sell our products in certain territories. A failure to retain our existing relationships with these distributors, independent sales agencies and their representatives or changes and transitions with respect to our sales organization have had and could continue to have an adverse effect on our operations and operating results.
Our success is partially dependent upon our ability to retain and motivate our distributors, independent sales agencies and their representatives to sell our products in certain territories. We depend on their sales and service expertise and their relationships with surgeons in the marketplace. Our distribution system in the United States currently consists of approximately 145 direct sales representatives and approximately 40 independent sales agencies that sell our products. Internationally, we currently utilize several distribution approaches depending on individual market requirements and, as a result, our international distribution system consists of 13 direct sales offices and approximately 25 distributors that sell our products in approximately 45 countries. As part of our strategy to grow internationally, we have selectively converted from distributor representation to direct sales representation in certain countries, including the United Kingdom, Denmark, Belgium, Luxembourg, Japan, Australia and Canada, and we have selectively converted from direct sales representation to distributor representation in certain countries, including Spain, during the past few years.
We do not control our distributors or independent sales agencies and they may not be successful in implementing our marketing plans. Some of our distributors and independent sales agencies do not sell our products exclusively and may offer similar products from other orthopaedic companies. Our distributors and independent sales agencies may terminate their contracts with us, may devote insufficient sales efforts to our products or may focus their sales efforts on other products that produce greater commissions for them. A failure to maintain our existing relationships with or changes and transitions with respect to our distributors and independent sales agencies and their representatives have had and could continue to have an adverse effect on our operations and operating results.
If we do not successfully develop and market new products and technologies and implement our business strategy, our business and operating results
of operations willmay be adversely affected.
We may not be able to successfully implement our business strategy. To implement our business strategy we need to, among other things, develop and introduce new extremity joint products, find new applications for and improve our existing products, properly identify and anticipate our
surgeons'surgeons’ and theirpatients'patients’ needs, obtain regulatoryclearanceclearances orapprovalapprovals for new products and applications and educate surgeons about the clinical and cost benefits of our products.We are continually engaged in product development and improvement programs, and we expect new products to account for a significant portion of our future growth. If we do not continue to introduce new products and technologies, or if those products and technologies are not accepted, we may not be successful. Moreover, research and development efforts may require a substantial investment of time and resources before we are adequately able to determine the commercial viability of a new product, technology, material or innovation. Demand for our products also could
alsochange in ways we may not anticipate due to evolving customer needs, changing demographics, slow industry growth rates, evolving surgical philosophies and evolving industry standards, among others. Additionally, ourcompetitors'competitors’ new products and technologies may precede our products to market, may be more effective or less expensive than our products or may render our products obsolete.Our new products and technologies also could render our existing products obsolete and thus adversely affect sales of our existing products and lead to increased expense for excess and obsolete inventory. For example, we believe that sales of our Aequalis Ascend Flex convertible shoulder system may adversely affect demand for and sales of our other mature shoulder products. Our targeted surgeons
arepractice in areas such as shoulder, upper extremities, lower extremities, sports medicine and reconstructive and general orthopaedics, and our strategy of focusingexclusivelyprimarily on these surgeons may not be successful.In addition, we are seeking to increase our international sales and will need to increase our worldwide direct sales force and enter into distribution agreements with third parties in order to do so. All of this may result in additional or different foreign regulatory requirements, with which we may not be able to comply. Moreover, evenEven if we successfully implement our business strategy, our operating results may not improve. We may decide to alter or discontinue aspects of our business strategy and may adopt different strategies due to business or competitivefactors.We rely onfactors, which could negatively impact ourindependent sales agencies and their representatives to market and sell our products.operating results.In the United States, we sell our products through a single sales channel primarily focused on our products and consisting of approximately 24 independent commission-based sales agencies, which in the aggregate utilized over 300 sales representatives as of January 2, 2011. Our sales agencies do not sell our products exclusively and may offer similar products from other orthopaedic companies. In fiscal 2010, no individual sales agency accounted for more than 3% of our global revenue. Our success depends largely upon our ability to motivate these sales agencies to sell our products. Additionally, we depend on their sales and service expertise and relationships with the surgeons in the marketplace. Our independent sales agencies may terminate their contracts with us at the end of each yearly term, may devote insufficient sales efforts to our products or may focus their sales efforts on other products that produce greater commissions for them. If our relationship with any of our sales agencies terminated, we could enter into agreements with existing sales agencies to take on the related sales, contract with new sales agencies or a combination of these options. A failure to maintain our existing relationships with our independent sales agencies and their representatives could have an adverse effect on our operations. We do not control our independent sales agencies and they may not be successful in implementing our marketing plans.We may be unable to compete successfully against our existing or potential competitors, in which case our
salesrevenue and operating results may be negatively affected and we may not grow.The market for orthopaedic devices is highly competitive and subject to rapid and profound technological change. Our success depends, in part, on our ability to maintain a competitive position in the development of technologies and products for use by our customers. We face competition from large diversified orthopaedic manufacturers, such as DePuy Orthopaedics, Inc.,
or DePuy,a Johnson & Johnson subsidiary, Zimmer Corporation,or Zimmer,Biomet, Inc. and Stryker Corporation,or Stryker,and established mid-sized orthopaedic manufacturers, such as Arthrex, Inc.,or Arthrex,Wright Medical Group, Inc.,or Wright Medical,Exactech, Inc., Integra LifeSciences Corporation and ArthroCareCorporation, or ArthroCare.Corporation. Many of the companies developing or marketing competitive orthopaedic productsare publicly traded or are divisions of publicly traded companies and mayenjoy several competitive advantages over us, including:•- greater financial and human resources for product development and sales and marketing;
•greater name recognition;•established relationships with surgeons, hospitals and third-party payors;•broader product lines and the ability to offer rebates or bundle products to offer greater discounts or incentives to gain a competitive advantage;•- and
established sales and marketing and distributionnetworks; and•more experience in conducting research and development, manufacturing, preparing regulatory submissions and obtaining regulatory clearance or approval for products.We also compete against smaller, entrepreneurial companies with niche product lines. Some of our competitors have indicated an increased focus on the extremities market, which is our primary strategic focus. Our competitors may develop and patent processes or products earlier than
we can,us, obtain regulatoryclearanceclearances or approvals for competing products more rapidly thanwe can andus, develop more effective or less expensive products or technologies that render our technology or products obsolete ornon-competitive.non-competitive or acquire technologies and technology licenses complementary to our products or advantageous to our business. Not all of our sales and other personnel have non-compete agreements. We also compete with other organizations in recruiting and retaining qualified scientific, sales and managementpersonnel, as well as in acquiring technologies and technology licenses complementary to our products or advantageous to our business.personnel. If our competitors are more successful than us in these matters, we may be unable to compete successfully against our existing or future competitors.We derive a significant portion of our
salesrevenue from operations ininternationalmarketsthat are subjectoutside the United States, which exposes us topolitical, economic and social instability.additional risks.We derive a significant portion of our
salesrevenue from operations ininternational markets.markets outside the United States. Ourinternationaldistribution system outside the United States consists ofnine13 direct sales offices and approximately3225 distribution partners, who together sell in approximately3545 countries. Most of these countries are, to some degree, subject to political, economic and social instability. Foreach of the years ended January 2, 20112013 andDecember 27, 2009,2012, approximately 41% and 44% of our revenue, respectively, was derived from our operations outside the United States, including 19% of our revenue from France for both 2013 and 2012. Any material decrease in our internationaloperations.revenue may negatively affect our profitability. In the future, we intend to further expand our international operations into key markets, such as Brazil and China, as we have done, for example, in 2013, when we acquired certainassets of our distributors in Australia, Canada and the United Kingdom and established direct sales forces in such countries, and in 2012, when we opened a direct sales office in Japan and acquired our exclusive distributor in Belgium and Luxembourg. Our international sales operations expose us and our representatives, agents and distributors to risks inherent in operating in foreign jurisdictions. These risks include:
•- the imposition of additional U.S. and foreign governmental controls or regulations on orthopaedic implants and biologics products;
•the imposition of costly and lengthy new export and import license requirements;•the imposition of U.S. or international sanctions against a country, company, person or entity with whom we do business that would restrict or prohibit continued business with that country, company, person or entity;•economic instability, including the European sovereign debt crisis and the austerity measures taken and to be taken by certain countries in response to such crisis, and the currency risk between the U.S. dollar and foreign currencies in our target markets;•the imposition of restrictions on the activities of foreign agents, representatives and distributors;•scrutiny of foreign tax authorities, which could result in significant fines, penalties and additional taxes being imposed upon us;•a shortage of high-quality international salespeople and distributors;•loss of any key personnel who possess proprietary knowledge or are otherwise important to our success in international markets;•significant and financially debilitating product liability exposure of which we are currently unaware;changes in third-party reimbursement policies that may require some of the patients who receive our products to directly absorb medical costs or that may require us to sell our products at lower prices;•unexpected changes in foreign regulatory requirements;differing local product preferences and product requirements;changes in tariffs and other trade restrictions;•work stoppages or strikes in the healthcare industry;•difficulties in enforcing and defending intellectual property rights;foreign exchange controls that might prevent us from repatriating cash earned in countries outside the Netherlands;complex data privacy requirements and•- labor relations laws; and
exposure to different legal and political standards.Not only are we subject to the laws of
otherjurisdictions located outside the United States in which we do business, but we also arealsosubject to U.S. laws governing our activities in foreign countries, including various import-export laws, customs and import laws, anti-boycott laws and embargoes. For example, the FDA Export Reform and Enhancement Act of 1996 requires that, when exporting medical devices from the United States for sale in a foreign country, depending on the type of product being exported, the regulatory status of the product and the country to which the device is exported, we must ensure, among other things, that the device is produced in accordance with the specifications of the foreign purchaser; not in conflict with the laws of the country to which it is intended for export; labeled for export; and not offered for sale domestically. In addition, we must maintain records relevant to product export and, if requested by the foreign government, obtain a certificate of exportability. In some instances, prior notification to or approval from the FDA is required prior to export. The FDA can delay or deny export authorization if all applicable requirements are not satisfied. Imports of approved medical devices into the United States also arealsosubject to requirements including registration of establishment, listing of devices, manufacturing inaccordance with the quality system regulation, medical device reporting of adverse events, and
Premarket Notificationpremarket notification 510(k) clearance or premarket approval, or PMA, among others and if applicable. If our business activities were determined to violate these laws, regulations or rules, we could suffer serious consequences.In addition, a portion of our international
salesrevenue is made through distributors. As a result, we are dependent upon the financial health of our distributors. We also are dependent upon the compliance of our distributors with foreign laws and the U.S. Foreign Corrupt Practices Act, or the FCPA, as it relates to certain “facilitating” payments made to those employed by or acting on behalf of a foreign government in the procurement, sale and prescription of medical devices. If a distributor were to go out of business, it would take substantial time, cost and resources to find a suitable replacement and the products held by such distributor may not be returned to us or to a subsequent distributor in a timely manner or at all.Any material decreaseDisruption and turmoil inour foreign salesglobal credit and financial markets, which may be exacerbated by the inability of certain countries to continue to service their sovereign debt obligations and certain austerity measures countries have implemented, and the possible negative implications of such events to the global economy, may negativelyaffectimpact ourprofitability. We generatebusiness, operating results and financial condition.A substantial portion of our revenue outside the United States is generated in the European Union, or EU, including in particular France. The credit and economic conditions within certain European Union countries, including France, Greece, Ireland, Italy, Portugal and Spain in particular, and the possibility that they may default on their debt obligations, have contributed to instability in global credit and financial markets during the past couple of years. The continued possibility that such EU member states may default on their debt obligations, the continued uncertainty regarding international
sales primarilyand the European Union’s financial support programs and the continued possibility that other EU member states may experience similar financial troubles could further disrupt global credit and financial markets. While the ultimate outcome of these events cannot be predicted, it is possible that such events could continue to have a negative effect on the global economy as a whole, and our business, operating results and financial condition, inEurope, where healthcare regulationparticular. For example, if the European sovereign debt crisis continues or worsens, the negative implications to the global economy andreimbursementus could be significant. Since a significant amount of our trade receivables are with hospitals that are dependent upon governmental health care systems in many countries, repayment of such receivables is dependent upon the financial stability of the economies of those countries. A deterioration of economic conditions in such countries may increase the average length of time it takes fororthopaedic medical devices vary significantlyus to collect on our outstanding accounts receivable in these countries or even our ability to collect such receivables.In addition, if the European sovereign debt crisis continues or worsens, the value of the Euro could deteriorate or lead to the re-introduction of individual currencies in one or more Eurozone countries, or, in more extreme circumstances, the possible dissolution of the Euro currency entirely, all of which could negatively impact our business, operating results and financial condition in light of our substantial operations in and revenues derived from
country to country. This changing environmentcustomers in the European Union. Should the Euro dissolve entirely, the legal and contractual consequences for holders of Euro denominated obligations would be determined by laws in effect at such time. These potential developments, or market perceptions concerning these and related issues, could adversely affect the value of our Euro denominated assets and obligations. In addition, concerns over the effect of this financial crisis on financial institutions in Europe and globally could lead to tightening of the credit and financial markets, which could negatively impact the ability of companies to borrow money from their existing lenders, obtain credit from other sources or raise financing to fund their operations. This could negatively impact our customers’ ability to purchase our products, our suppliers’ ability to provide us with materials and components and our ability, if needed, tosellfinance our operations on commercially reasonable terms, or at all. We believe that European governmental austerity policies have reduced and may continue to reduce the amount of money available to purchase medical products, including our products. These austerity measures could negatively impact overall procedure volumes and result in increased pricing pressure for our products and the products of our competitors. Any or all of these events, as well as any additional austerity measures that may be taken which, among other things, could result in decreased utilization, pricing and reimbursement, could negatively impact our business, operating results and financial condition.Weakness in the global economy is likely to adversely affect our business until an economic recovery is underway.
Many of our products are used in procedures covered by private insurance, and some
European countries.of these procedures may be considered elective. We believe that weakness in the global economy may reduce the availability or affordability of private insurance or may affect patient decisions to undergo elective procedures. If current economic conditions do not continue to recover or worsen, we expect that increasing levels of unemployment and pressures to contain healthcare costs could adversely affect the global growth rate of procedure volume, which could have a material adverse effect on our revenue and operating results.Fluctuations in foreign currency rates could result in declines in our reported revenue and earnings.
A substantial portion of our revenue outside the United States is generated in Europe and other countries in Latin America and Asia where the amounts are denominated in currencies other than the U.S. dollar. For purposes of preparing our consolidated financial statements, these amounts are converted into U.S. dollars, the value of which varies with currency exchange rate fluctuations. For revenue not denominated in U.S. dollars, if there is an increase in the value of the U.S. dollar relative to the specified foreign currency, we will receive less in U.S. dollars than before the increase in the exchange rate, which could negatively impact our operating results. Although we address currency risk management through regular operating and financing activities, and more recently through hedging activities, those actions may not prove to be fully effective, and hedging activities involve additional risks.
Our business plan relies on assumptions about the market for our products, which, if incorrect, may adversely affect our
sales.revenue.We believe that the aging of the general population and increasingly active lifestyles and expectations regarding “quality of life” will continue and that these trends will increase the need for our products. We also believe that if clinical outcomes are improved as a result of extremity procedures over alternative treatments or no treatment, awareness regarding such extremity procedures will increase, more surgeons will recommend extremity procedures and more patients will elect to undergo them as opposed to alternative treatments or no treatment. Since most of our products are designed specifically for extremities and
early intervention, we believe the market for our extremities products in particular will continue to grow. The
projectedactual demand for our products, however, could differ materiallydifferfromactualour projected demand if our assumptions regarding these trends and acceptance of our products by the medical community prove to be incorrect or do not materialize, or if non-surgical treatments gain more widespread acceptance as a viable alternative to our orthopaedic implants. If this occurs, our revenue and other operating results could be adversely affected.Our upper extremity joints and trauma products, including in particular our shoulder products, generate a significant portion of our revenue. Accordingly, if revenue of these products were to decline, our operating results would be adversely affected.
Our upper extremity joints and trauma products, which includes joint implants and bone fixation devices for the shoulder, hand, wrist and elbow, generate a significant portion of our revenue. During 2013 and 2012, our upper extremity joints and trauma products generated approximately 59% and 63% of our revenue, respectively. We expect the shoulder to continue to be the largest and most important product category for us for the foreseeable future. In particular, we anticipate that our upper extremity joints and trauma product revenue will be favorably impacted in future periods as a result of the third quarter of 2013 launch of our Aequalis Ascend Flex. However, our expectations may prove to be incorrect and it is possible that the market acceptance of the Aequalis Ascend Flex will not meet our expectations or may have the effect of negatively impacting sales of our other shoulder products. A decline in our upper extremity joints and trauma product revenue as a result of lack of market acceptance of new products, the effect of new products on sales of existing products, increased competition, regulatory matters, intellectual property matters or any other reason would negatively impact our operating results.
We obtain some of our products through private-label distribution agreements that subject us to minimum performance and other criteria. Our failure to satisfy those criteria could cause us to lose those rights of distribution.
We have entered into private-label distribution agreements with manufacturers of some of our products. These manufacturers brand their products according to our specifications, and we may have exclusive rights in certain fields of use and territories to sell these products subject to minimum purchase, sales or other performance criteria. Though these agreements do not individually or in the aggregate represent a material portion of our business, if we do not meet these performance criteria, or fail to renew these agreements, we may lose exclusivity in a field of use or territory or cease to have any rights to these products, which could have an adverse effect on our
sales.revenue. Furthermore, some of these manufacturers may be smaller, undercapitalized companies that may not have sufficient resources to continue operations or to continue to supply us sufficient product without additional access to capital.If our private-label manufacturers fail to provide us with sufficient supply of their products, or if their supply fails to meet appropriate quality requirements, our business could suffer.
Our private-label manufacturers are sole source suppliers of the products we purchase from them. Given the specialized nature of the products they provide, we may not be able to locate or establish additional or replacement manufacturers of these products. Moreover, these private-label manufacturers typically own the intellectual property associated with their products, and even if we could find a replacement manufacturer for the product, we may not have sufficient rights to enable the replacement party to manufacture the product. While we have entered into agreements with our private-label manufacturers
tothat we believe will provide us sufficient quantities of products, we cannot assure you that they will do so, or that any products they do provide us will not contain defects in quality. Our private-label manufacturing agreements have terms expiring between2011this year and 2015 and are renewable under certain conditions or by mutual agreement. The agreements also include some or all of the following provisions allowing for termination under certain circumstances: (i) eitherparty'sparty’s uncured materialbreach of the terms and conditions of the
agreement,agreement; (ii) either party filing for bankruptcy, being bankrupt or becoming insolvent, suspending payments, dissolving or ceasing commercialactivity,activity; (iii) our inability to meet market development milestones and ongoing salestargets,targets; (iv) termination without cause, provided that payments are made to thedistributor,distributor; (v) a merger or acquisition of one of the parties by a thirdparty,party; (vi) the enactment of a government law or regulation that restricts eitherparty'sparty’s right to terminate or renew the contract or invalidates any provision of the agreement or (vii) the occurrence of a"force“force majeure,"” including natural disaster, explosion or war.We also rely on these private-label manufacturers to comply with the regulations of the
U.S. Food and Drug Administration, orFDA, the competent authorities of the Member States of the European Economic Area, or EEA, or foreign regulatory authorities and their failure to comply with strictly enforced regulatory requirements could expose us to regulatory action including warning letters, product recalls, termination of distribution, product seizures or civil penalties. Any quality control problems that we experience with respect to products manufactured by our private-label manufacturers, any inability by us to provide our customers with sufficient supply of products or any investigations or enforcement actions by the FDA, the competent authorities of the Member States of the EEA or other foreign regulatory authorities could adversely affect our reputation or commercialization of our products and adversely and materially affect our business and operating results.We intend to continue to bring in-house the manufacturing of certain of our products that are currently manufactured by third parties. Should we encounter difficulties in manufacturing these or other products, it could adversely affect our business.
We intend to continue our initiative to bring in-house the manufacturing of certain of our products, including in particular our Aequalis Ascend and Simpliciti shoulder products. The technology and the manufacturing process for our shoulder products is highly complex, involving a large number of unique parts, and we may encounter difficulties in manufacturing these products in-house. There is no assurance that we will be able to meet the volume and quality requirements associated with our shoulder products. In addition, other products that we choose to bring in-house could encounter similar difficulties. Manufacturing and product quality issues may also arise as we increase the scale of our production. If our products do not consistently meet our customers’ performance expectations, our reputation may be harmed, and we may be unable to generate sufficient revenue to become profitable. Any delay or inability in bringing in-house the manufacturing of our products could diminish our ability to sell our products, which could result in lost revenue and seriously harm our business, financial condition and operating results.
Failure to comply with the U.S. Foreign Corrupt Practices Act could subject us to, among other things, penalties and legal expenses that could harm our reputation and have a material adverse effect on our business, financial condition and
results of operations.operating results.Our U.S. operations, including those of our
subsidiary,U.S. operating subsidiaries, Tornier, Inc. and OrthoHelix Surgical Designs, Inc., arecurrentlysubject to the U.S. Foreign Corrupt PracticesAct, or the FCPA.Act. We are required to comply with the FCPA, which generally prohibits covered entities and their intermediaries from engaging in bribery or making other prohibited payments to foreign officials for the purpose of obtaining or retaining business or other benefits. In addition, the FCPA imposes accounting standards and requirements on publicly traded U.S. corporations and their foreign affiliates, which are intended to prevent the diversion of corporate funds to the payment of bribes and other improper payments, and to prevent the establishment of"off books"“off books” slush funds from which such improper payments can be made. Wearealsocurrentlyare subject to similar anticorruption legislation implemented in Europe under the Organization for Economic Co-operation andDevelopment'sDevelopment’s Convention on Combating Bribery of Foreign Public Officials in International Business Transactions. We either operate or plan to operate in a number of jurisdictions that pose a high risk of potential violations of the FCPA and other anticorruption laws, such asAlgeria,China andOman, based on measurements such as Transparency International's Corruption Perception IndexBrazil, and we utilize a number of third-party sales representatives for whose actions we could be held liable under the FCPA. We inform our personnel and third-party sales representatives of the requirements of the FCPA and other anticorruption laws, including, but not limited to their reporting requirements. We also havealsodeveloped and will continue to develop and implement systems for formalizing contracting processes, performing due diligence on agents and improving our recordkeeping and auditing practices regarding these regulations. However, there is no guarantee that our employees, third-party sales representatives or other agents have not or will not engage in conduct undetected by our processes and for which we might be held responsible under the FCPA or other anticorruption laws.If our employees, third-party sales representatives or other agents are found to have engaged in such practices, we could suffer severe penalties, including criminal and civil penalties, disgorgement and other remedial measures, including further changes or enhancements to our procedures, policies and controls, as well as potential personnel changes and disciplinary actions.
The Securities and Exchange Commission, orDuring the past few years, the SECis currently in the midsthas increased its enforcement ofconducting an informal investigation of numerous medical device companies over potentialviolations of theFCPA.FCPA against companies, including several medical device companies. Although we do not believe we are currently a target, any investigation of any potential violations of the FCPA or other anticorruption lawsby U.S. or foreign authorities also could have an adverse impact on our business, financial condition and
results of operations.operating results.Certain foreign companies, including some of our competitors, are not subject to prohibitions as strict as those under the FCPA or, even if subjected to strict prohibitions, such prohibitions may be laxly enforced in practice. If our competitors engage in corruption, extortion, bribery, pay-offs, theft or other fraudulent practices, they may receive preferential treatment from personnel of some companies, giving our competitors an advantage in securing business, or from government officials, who might give them priority in obtaining new licenses, which would put us at a disadvantage.
Fluctuations in foreign currency rates could result in declines in our reported sales and earnings.A substantial portion of our foreign revenue is generated in Europe and other foreign countries in Latin America and Asia where the amounts are denominated in currencies other than the U.S. dollar. For purposes of preparing our financial statements, these amounts are converted into U.S. dollars, the value of which varies with currency exchange rate fluctuations. For sales not denominated in U.S. dollars, if there is an increase in the value of the U.S. dollar relative to the specified foreign currency, we will receive less in U.S. dollars than before the increase in the exchange rate, which could negatively impact our results of operations. Although we address currency risk management through regular operating and financing activities, those actions may not prove to be fully effective.If we lose one of our key suppliers, we may be unable to meet customer orders for our products in a timely manner or within our budget.
We use a number of suppliers for raw materials and select components that we need to manufacture our products. These suppliers must provide the materials and components to our standards for us to meet our quality and regulatory requirements. We obtain some key raw materials and select components from a single source or a limited number of sources. For example, we rely on one supplier for raw materials and select components in several of our products, including Poco Graphite, Inc., which supplies graphite for our pyrocarbon
products,products; CeramTec AG, or CeramTec, which supplies ceramic for ceramic heads forhips,hips; and Heymark Metals Ltd., which suppliesCoCrcobalt chrome used in certain of our hip, shoulder and elbow products. Establishing additional or replacement suppliers for these components, and obtaining regulatoryclearanceclearancesor approvals that may result from adding or replacing suppliers, could take a substantial amount of time, result in increased costs and impair our ability to produce our products, which would adversely impact our business and operating results. We do not have long-term or other supply contracts with our sole source suppliers
(other than a Quality Assurance Agreement and Secrecy Agreement with CeramTec, which only relate to quality and confidentiality obligations of the parties and do not govern the purchase and receipt of CeramTec products)and instead rely on purchase orders. As a result, those suppliers may elect not to supply us with product or to supply us with less product than we need, and we will have limited rights to cause them to do otherwise. In addition, some of our products, which we acquire from third parties, are highly technical and are required to meet exacting specifications, and any quality control problems that we experience with respect to the products supplied by third parties could adversely and materially affect our reputation or commercialization of our products and adversely and materially affect our business, operating results and prospects. Furthermore, some of these suppliers are smaller companies. To the extent that any of these suppliers are, or become, undercapitalized and do not otherwise have sufficient resources to continue operations or to supply us sufficient product without additional access to capital,we do not believe that anysuch a failurewould result in a material adverse effect on our business, particularly because these suppliers do not, individually or in the aggregate, represent a material portion ofcould adversely affect our business. We also mayalsohave difficulty obtaining similar components from other suppliers that are acceptable to the FDA, the competent authorities or notified bodies of the Member States of the EEA, or foreign regulatory authorities and the failure of our suppliers to comply with strictly enforcedregulatory requirements could expose us to regulatory action including warning letters, product recalls, termination of distribution, product seizures or civil penalties. Furthermore, since many of these suppliers are located outside of the United States, we are subject to foreign export laws and U.S. import and customs regulations, which complicate and could delay shipments of components to us. For example, all foreign importers of medical devices are required to meet applicable FDA requirements, including registration of establishment, listing of devices, manufacturing in accordance with the quality system regulation, medical device reporting of adverse events, and
Premarket Notificationpremarket notification 510(k) clearance or PMA, if applicable. In addition, all imported medical devices also mustalsomeetBureau ofU.S. Customs and Border Protection requirements. While it is our policy to maintain sufficient inventory of materials and components so that our production will not be significantly disrupted even if a particular component or material is not available for a period of time, we remain at risk that we will not be able to qualify new components or materials quickly enough to prevent a disruption if one or more of our suppliers ceases production of important components or materials.Sales volumes may fluctuate depending on the season and our operating results may fluctuate over the course of the year.
Our business is somewhat seasonal in
nature. Historically, demand fornature, as many of our productshas been the lowestare used inour third quarter as a result of the European holiday scheduleelective procedures, which typically decline during the summermonths.months and can increase at the end of the year once annual deductibles have been met on health insurance plans. Additionally, elective procedures typically decline in certain parts of Europe during the third quarter of the year due to holiday and vacation schedules. We have experienced and expect to continue to experience meaningful variability in our revenue and gross profit among quarters, as well as within each quarter, as a result of a number of factors, including, among other things:•- transitions to direct selling models in certain geographies and the transition of our U.S. sales channel towards focusing separately on upper and lower extremity products;the number and mix of products sold in the
quarter;•- quarter and the geographies in which they are sold;
the demand for, and pricing of, our products and the products of our competitors;•the timing of or failure to obtain regulatory clearances or approvals forproducts;•- products
costs, benefits and timing of new product introductions;•increasedthe level of competition;•the timing and extent of promotional pricing or volume discounts;•changes in average selling prices;the availability and cost of components and materials;•the number of selling days;•fluctuations in foreign currency exchange rates;the timing of patients’ use of their calendar year medical insurance deductibles; and•impairment and other special charges.We may not achieve our financial guidance or projected goals and objectives in the time periods that we anticipate or announce publicly, which could have an adverse effect on our business and could cause the market price of our ordinary shares to decline.
On a quarterly basis, we typically provide projected financial information, such as our anticipated quarterly and annual revenues, adjusted earnings before interest, taxes and depreciation and net loss. These financial projections are based on management’s then current expectations and typically do not contain any significant margin of error or cushion for any specific uncertainties or for the uncertainties inherent in all financial forecasting. The failure to achieve our financial projections or the projections of analysts and investors could have an adverse effect on our business, disappoint analysts and investors and cause the market price of our ordinary shares to decline. Since our initial public offering, our revenue performance has been outside of our guidance range in certain quarters, including the third quarter of 2013, which negatively impacted the market price of our ordinary shares, and could do so in the future should our results fall below our guidance range and the expectations of analysts and investors.
We also set goals and objectives for, and make public statements regarding, the timing of certain accomplishments and milestones regarding our business, such as the timing of new products, regulatory actions and anticipated distributor and sales representative transitions. The actual timing of these events can vary dramatically due to a number of factors including the risk factors described in this report. As a result, there can be no assurance that we will succeed in achieving our projected goals and objectives in the time periods that we anticipate or announce publicly. The failure to achieve such projected goals and objectives in the time periods that we anticipate or announce publicly could have an adverse effect on our business, disappoint investors and analysts and cause the market price of our ordinary shares to decline.
If product liability lawsuits are brought against us, our business may be harmed.
The manufacture and sale of orthopaedic medical devices exposes us to significant risk of product liability claims. In the past, we have had a small number of product liability claims relating to our products, none of which either individually, or in the aggregate, have resulted in a material negative impact on our business. In the future, we may be subject to additional product liability claims, some of which may have a negative impact on our business. Such claims could divert our management from pursuing our business strategy and may be costly to defend. Regardless of the merit or eventual outcome, product liability claims may result in:
•- decreased demand for our products;
•injury to our reputation;•significant litigation and other costs;•- substantial monetary awards to or costly settlements with patients;
•- product recalls;
•loss of revenue; and•the inability to commercialize new products or product candidates.Our existing product liability insurance coverage may be inadequate to protect us from any liabilities we might incur. If a product liability claim or series of claims is brought against us for uninsured liabilities or in excess of our insurance coverage, our business and operating results could suffer.
In addition, a recall of some of our products, whether or not the result of a product liability claim, could result in significant costs and loss of customers.In addition, we may not be able to maintain insurance coverage at a reasonable cost or in sufficient amounts or scope to protect us against losses. Any claims against us, regardless of their merit, could severely harm our financial condition, strain our management and other resources and adversely affect or eliminate the prospects for commercialization or sales of a product or product candidate which is the subject of any such claim.
If our patents and other intellectual property rights do not adequately protectIn addition, a recall of our products,we may lose market share to our competitors.We rely on patents, trade secrets, copyrights, know-how, trademarks, license agreements and contractual provisions to establish our intellectual property rights and protect our products. These legal means, however, afford only limited protection and maywhether or notadequately protect our rights. The patents we own may not be of sufficient scope or strength to provide us with any meaningful protection or commercial advantage, and competitors may be able to design around our patents or develop products that provide outcomes that are similar to ours. In addition, we cannot be certain that any of our pending patent applications will be issued. The USPTO may deny or require a significant narrowing of the claims in our pending patent applications and the patents issuing from such applications. Any patents issuing from the pending patent applications may not provide us with significant commercial protection. We could incur substantial costs in proceedings before the USPTO and the proceedings can be time-consuming, which may cause significant diversion of effort by our technical and management personnel. These proceedings could result in adverse decisions as to the priority of our inventions and the narrowing or invalidation of claims in issued patents. In addition, the laws of some of the countries in which our products are or may be sold may not protect our intellectual property to the same extent as U.S. laws or at all. We also may be unable to protect our rights in trade secrets and unpatented proprietary technology in these countries.In the event a competitor infringes upon our patent or other intellectual property rights, enforcing those rights may be costly, difficult and time-consuming. Even if successful, litigation to enforce our intellectual property rights or to defend our patents against challenge could be expensive and time-consuming and could divert our management's attention. We may not have sufficient resources to enforce our intellectual property rights or to defend our patents or other intellectual property rights against a challenge. If we are unsuccessful in enforcing and protecting our intellectual property rights and protecting our products, it could harm our business and results of operations.We rely on our trademarks, trade names and brand names to distinguish our products from the products of our competitors, and have registered or applied to register many of these trademarks. However, our trademark applications may not be approved. Third parties may also oppose our trademark applications or otherwise challenge our use of the trademarks. In the event that our trademarks are successfully challenged, we could be forced to rebrand our products, which could result in loss of brand recognition and could require us to devote resources to advertising and marketingthese new brands. Further, our competitors may infringe our trademarks, or we may not have adequate resources to enforce our trademarks.In addition, we hold licenses from third parties that are necessary to the design and manufacturing of some of our products. The loss of such licenses would prevent us from manufacturing, marketing and selling these products, which could harm our business.In addition to patents, we seek to protect our trade secrets, know-how and other unpatented technology, in part, with confidentiality agreements with our vendors, employees, consultants and others who may have access to proprietary information. We cannot be certain, however, that these agreements will not be breached, adequate remedies for any breach would be available or our trade secrets, know-how and other unpatented proprietary technology will not otherwise become known to or be independently developed by our competitors.If we are subject to any future intellectual property lawsuits, a court could require us to pay significant damages or prevent us from selling our products.The orthopaedic medical device industry is litigious with respect to patents and other intellectual property rights. Companies in the orthopaedic medical device industry have used intellectual property litigation to gain a competitive advantage. In the future, we may become a party to lawsuits involving patents or other intellectual property. A legal proceeding, regardless of outcome, could drain our financial resources and divert the time and effort of our management. A patent infringement suit or other infringement or misappropriation claim brought against us or any of our licensees may force us or any of our licensees to stop or delay developing, manufacturing or selling potential products that are claimed to infringe a third party's intellectual property, unless that party grants us or any licensees rights to use its intellectual property. In such cases, we may be required to obtain licenses to patents or proprietary rights of others in order to continue to commercialize our products. However, we may not be able to obtain any licenses required under any patents or proprietary rights of third parties on acceptable terms, or at all. Even if we or our licensees were able to obtain rights to the third party's intellectual property, these rights may be nonexclusive, thereby giving our competitors access to the same intellectual property. Ultimately, we may be unable to commercialize some of our potential products or may have to cease some of our business operationsas a result ofpatent infringement claims, which could severely harm our business.In any infringement lawsuit,athird party could seek to enjoin, or prevent, us from commercializing our existing or future products, or may seek damages from us, and any such lawsuit would likely be expensive for us to defend against. If we lose one of these proceedings, a court or a similar foreign governing body could require us to pay significant damages to third parties, seek licenses from third parties, pay ongoing royalties, redesign our products so that they do not infringe or prevent us from manufacturing, using or selling our products. In addition to being costly, protracted litigation to defend or prosecute our intellectual property rightsproduct liability claim, could result in decreased demand for ourcustomers or potential customers deferring or limiting their purchase or use of the affectedproducts,until resolution of the litigation.We have received, and we may receive in the future, notifications of potential conflicts of existing patents, pending patent applications and challenges to the validity of existing patents. For example, we corresponded with DePuy in 2006 regarding a possible license granted by DePuy to us under a French patent in connection with one of our shoulder products. We did not come to any agreement with DePuy and last corresponded on this matter in early 2007. We were contacted by an individual in June 2010 regarding his French patent and his request that we explain our position regarding this patent with respectinjury to ourhip product Meije Duo. We analyzed the patentreputation, significant litigation and other costs, substantial monetary awards to or costly settlements with patients, loss of revenue and ourproduct and respondedinability tothe individual stating our belief the product falls outside the scope of his patent. The individual has not responded. We have searched and found that the individual has no corresponding patent outside ofFrance. We do not believe that either notification will have a material adverse effect on our future business. In addition, we may, in the future, become aware of patent applications and issued patents that relate to ourcommercialize new products orthe surgical applications using our products and, in some cases, we may discuss with outside counsel the relevance of such issued patents to our products.product candidates.Our inability to maintain adequate working relationships with external research and development consultants and surgeons could have a negative impact on our ability to
marketdevelop and sell new products.We maintain professional working relationships with external research and development consultants and leading surgeons and medical personnel in hospitals and universities who assist in product research and
development.development and training. We continue to emphasize the development of proprietary products and product improvements to complement and expand our existing product lines. It is possible that U.S. federal and state and international laws requiring us to disclose payments or other transfers of value, such as free gifts or meals, to physicians and other healthcare providers could have a chilling effect on these relationships with individuals or entities that may, among other things, want to avoid public scrutiny of their financial relationships with us. If we are unable to maintain these relationships, our ability tomarketdevelop and sell new and improved products could decrease, and our future operating results could be unfavorably affected.We incur significant expenditures of resources to maintain relatively high levels of inventory and instruments, which can reduce our cash flows.
As a result of the need to maintain substantial levels of inventory and instruments, we are subject to the risk of
inventoryobsolescence. The nature of our business requires us to maintain a substantial level ofinventory.inventory and instruments. For example, our total consolidated inventorybalances were $77.5balance was $87.0 million and$68.6$86.7 million atJanuary 2, 2011December 29, 2013 and December27, 2009,30, 2012, respectively, and our total consolidated instrument balance was $63.1 million and $51.4 million at December 29, 2013 and December 30, 2012, respectively. In order to market effectively we often must maintain and bring our customers instrument kits, back-up products and products of different sizes. In the event that a substantial portion of our inventory becomes obsolete, it could have a material adverse effect on our earnings and cash flows due to the resulting costs associatedwith
theinventory impairment charges and costs required to replace such inventory. The third quarter of 2013 launch of our Aequalis Ascend Flex convertible shoulder system could adversely affect demand for and sales of our other mature shoulder products, which could result in a higher level of excess and obsolete inventory charges or otherwise negatively impact our operating results and cash flows.RecentOur acquisition of OrthoHelix in October 2012 and any additional acquisitions and efforts to acquire and integrate other companies or product lines could adversely affect our operations and financial results.WeDuring 2013, we acquired certain assets of our distributors in Australia, Canada and the United Kingdom and established direct sales forces in such countries and acquired certain assets of some of our independent sales agencies in the United States and established direct sales forces in certain territories. During fourth quarter of 2012, we acquired OrthoHelix, a company focused on developing and marketing specialty implantable screw and plate systems for the repair of small bone fractures and deformities predominantly in the foot and ankle. In addition, we may pursue additional acquisitions of other distributors, companies or product lines. A successful acquisition depends on our ability to identify, negotiate, complete and integrate such acquisition and to obtain any necessary financing. With respect to these recent acquisitions and any future acquisitions, we may experience:•- difficulties in integrating
anythe acquiredcompanies,businesses and their respective personnel and products into our existing business;•difficulties in integrating commercial organizations, including in particular distribution and sales representative arrangements;difficulties or delays in realizing the anticipated benefits oftheour recent acquisitions or any additional acquiredcompany orcompanies and their products;•diversion of ourmanagement'smanagement’s time and attention from other business concerns;•challenges due to limited or no direct prior experience in new markets or countries we may enter;•higher coststhe potential loss ofintegration than we anticipated; or•- key employees, including in particular sales and research and development personnel;
the potential loss of key customers, distributors, representatives, vendors and other business partners who choose not to do business with our company post-acquisition;inability to effectively coordinate sales and marketing efforts to communicate our capabilities post-acquisition and coordinate sales organizations to sell our combined products;inability to successfully develop new products and services on a timely basis that address our new market opportunities post-acquisition;inability to compete effectively against companies already serving the broader market opportunities expected to be available to us post-acquisition;difficulties inretaining key employeesthe assimilation of different corporate cultures, practices and sales and distribution methodologies, as well as in the assimilation and retention of geographically dispersed, decentralized operations and personnel;unanticipated costs, litigation and other contingent liabilities;incurrence of acquisition and integration related costs, accounting charges, or amortization costs for acquiredbusiness whointangible assets;potential write-down of goodwill, acquired intangible assets and/or deferred tax assets;additional legal, financial and accounting challenges and complexities in areas such as intellectual property, tax planning, cash management and financial reporting andany unforeseen compliance risks and accompanying financial and reputational exposure or loss not uncovered in the due diligence process and which arenecessaryimputed tomanage these acquisitions.Tornier, such as compliance with federal laws and regulations, the advertising and promotion regulations under the federal Food, Drug and Cosmetic Act, the Anti-kickback Statute, the False Claims Act, the Physician Sunshine Payments Act and other applicable laws.In addition,
any future acquisitionswe may have to incur debt or issue equity securities to pay for an acquisition, the issuance of which could involve restrictive covenants or be dilutive to our existing shareholders. Acquisitions also could materially impair our operating results bycausing us to incur debt orrequiring us to amortize acquired assets. For example, as a result of our acquisition of OrthoHelix, we incurred additional indebtedness under two senior secured term loans, the proceeds of which were used to fund our acquisition of OrthoHelix and retire certain then existing indebtedness.In addition, effective internal controls are necessary for us to provide reliable and accurate financial reports and to effectively prevent fraud. The integration of acquired businesses is likely to result in our systems and controls becoming increasingly complex and more difficult to manage. We devote significant resources and time to comply with the internal control over financial reporting requirements of the Sarbanes-Oxley Act of 2002. However, we cannot be certain that these measures will ensure that we design, implement and maintain adequate control over our financial processes and reporting in the future, especially in the context of acquisitions of other businesses. Any difficulties in the assimilation of acquired
businesses into our control system could harm our operating results or cause us to fail to meet our financial reporting obligations. Inferior internal controls could also cause investors to lose confidence in our reported financial information, which could have a negative effect on the trading price of our stock and our access to capital.
All of the risks described above may be exacerbated if we effect multiple acquisitions during a short period of time.
If we do not achieve the contemplated benefits of our acquisition of OrthoHelix, our business and financial condition may be materially impaired.
We may not achieve the desired benefits from our acquisition of OrthoHelix. For any of the reasons described above and elsewhere in this report and even if we are able to successfully operate OrthoHelix within our company, we may not be able to realize the revenue and other synergies and growth that we anticipate from the acquisition in the time frame that we currently expect, and the costs of achieving these benefits may be higher than what we currently expect, because of a number of risks, including, but not limited to:
the possibility that the acquisition may not further our business strategy as we expected;the possibility that we may not be able to expand the reach and customer base for OrthoHelix’s products as expected;the possibility that we may not be able to expand the reach and customer base for our products as expected; andthe fact that the acquisition will substantially expand our lower extremity joints and trauma business, and we may not experience anticipated growth in that market.As a result of
these risks, the OrthoHelix acquisition may not contribute to our earnings as expected, we may not achieve expected revenue synergies or our return on invested capital targets when expected, or at all, and we may not achieve the other anticipated strategic and financial benefits of the transaction. For example, some of these risks materialized during 2013. As part of our OrthoHelix integration initiative to establish separate U.S. sales channels that are individually focused on upper extremity products and lower extremity products, we terminated some of our existing sales relationships with certain distributors and independent sales agencies. Upon these terminations, we entered into agreements with existing distributors and sales agencies to take on the impacted products or territories, contracted with new distributors and sales agencies, hired direct sales representatives, or used a combination of these options. These terminations, changes and transitions have resulted and may continue to result in disruption in our U.S. sales channel, thereby adversely affecting our operations and operating results.ContentsIf we cannot attract and retain our key personnel, we
willmay not be able to manage and operate successfully, and we may not be able to meet our strategic objectives.Our future success depends, in large part, upon our ability to attract and retain and motivate our management team and key managerial, scientific, sales and technical personnel. Key personnel
as well asmay depart because of difficulties with change or a desire not to remain with our company. Any unanticipated loss or interruption of services of our management team and our key personnel could significantly reduce our ability to meet our strategic objectives because it may not be possible for us to find appropriate replacement personnel should the need arise. In addition, we have hired and expect to continue toattract and retainhire additionalhighly qualified personnel.sales personnel, especially in territories where we have recently commenced direct sales operations. We compete forsuchpersonnel with other companies, academic institutions, governmental entities and other organizations. There is no guarantee that we will be successful in retaining our current personnel or in hiring or retaining qualified personnel in the future. Loss of key personnel or the inability to hire or retain qualified personnel in the future could have a material adverse effect on our ability to operate successfully. Further, any inability on our part to enforce non-compete arrangements related to key personnel who have left thebusinesscompany could have a material adverse effect on our business.Fluctuations in insurance cost and availability could adversely affect our profitability or our risk management profile.
We hold a number of insurance policies, including product liability insurance,
directors'directors’ andofficers'officers’ liability insurance, property insurance andworkers'workers’ compensation insurance. If the costs of maintaining adequate insurance coverage should increase significantly in the future, our operating results could be materially adversely affected. Likewise, if any of our current insurance coverage should become unavailable to us or become economically impractical, we would be required to operate our business without indemnity from commercial insurance providers.If a natural or man-made disaster, including as a result of climate change or weather,
strikesadversely affects our manufacturing facilities or distribution channels, we could be unable to manufacture or distribute our products for a substantial amount of time and oursalesrevenue could decline.We principally rely on
fivethree manufacturing facilities,threetwo of which are in France andtwoone of whichareis in Ireland. The facilities and the manufacturing equipment we use to produce our products would be difficult to replace and could require substantial lead-time to repair or replace. For example, the machinery associated with our manufacturing of pyrocarbon in one of our French facilities is highly specialized and would take substantial lead-time and resources to replace. We also maintainwarehousesa facility inStafford, TexasBloomington, Minnesota, and a warehouse in Montbonnot, France,containingboth of which contain large amounts of our inventory. Our facilities, warehouses or distribution channels may be affected by natural or man-made disasters. Further, such may be exacerbated by climate change, as some scientists have concluded that climate change could result in the increased severity of and perhaps more frequent occurrence of extreme weather patterns. For example, in the event of ahurricane in Stafford, Texas,tornado at one of our warehouses, we may lose substantial amounts of inventory that would be difficult to replace. In the event our facilities, warehouses or distribution channels are affected by a disaster, we would be forced to rely on, among others, third-party manufacturers and alternative warehouse space and distribution channels, which may or may not be available, and oursalesrevenue could decline. Although we believe we possess adequate insurance for damage to our property and the disruption of our business from casualties, such insurance may not be sufficient to cover all of our potential losses and may not continue to be available to us on acceptable terms or at all.Recent turmoil in the credit markets and the financial services industry may negatively affect our business.Recently, the credit markets and the financial services industry have been experiencing a period of unprecedented turmoil and upheaval characterized by the bankruptcy, failure, collapse or sale of various financial institutions and an unprecedented level of intervention from U.S. and foreign governments. While the ultimate outcome of these events cannot be predicted, they may have an adverse effect on our customers' ability to borrow money from their existing lenders or to obtain credit from other sources to purchase our products. In addition, the recent economic crises could alsoadversely affect our suppliers' ability to provide us with materials and components, either of which may negatively impact our business.We may be unable to raise capital when needed, which would force us to delay, reduce, eliminate or abandon our commercialization efforts or product development programs.
There is no guarantee that our anticipated cash flow from operations will be sufficient to meet all of our cash requirements. We intend to continue to make investments to support our business growth and may require additional funds to:
•expand the commercialization of our products;•fund our operations and clinical trials;•- continue our research and development;
•develop, obtain required regulatory approvals or clearances and commercialize new products;make changes in our distribution channels;defend, in litigation or otherwise, any claims that we infringe third-party patents or other intellectual propertyrights;•commercializerights and enforce ournew products, if any such products receive regulatory clearance or approval for commercial sale;patent and•- other intellectual property rights; and
acquire companies and in-license products or intellectual property.We believe that our
existingcash and cashequivalent balances andequivalents balance of $56.8 million as of December 29, 2013, anticipated cash receipts generated fromsalesrevenue of our products and available credit under our $30.0 million senior secured revolving credit facility, will be sufficient to meet our anticipated cash requirements for at least theforeseeable future.next 12 months. However, our future funding requirements will depend on many factors, including:•- our future revenues and expenses;required regulatory approval, commercial introduction and market acceptance of our products;
•the scope, rate of progress and cost of our clinical trials;•the cost of our research and development activities;•the cost and timing of additional regulatory clearances or approvals;the cost and timing of expanding our sales, marketing and distribution capabilities;the cost and timing of our product offering inventories;the cost of filing and prosecuting patent applications and defending and enforcing our patent and other intellectual property rights;•the cost of defending, in litigation or otherwise, any claims that we infringe third-party patent or other intellectual property rights;•the costand timingofadditional regulatory clearancesdefending any claims of product liability, orapprovals;•the cost and timing of expandingother claims against us, such as contract liabilities;oursales, marketing and distribution capabilities;•- ability to collect amounts receivable from customers;
the effect of competing technological and market developments; and•the extent to which we acquire or invest in additional businesses, products andtechnologies, althoughtechnologies.In the event that we
currently have no commitmentswould require additional working capital to fund future operations, we could seek to acquire that through additional equity oragreements relating to any of these types of transactions.
debt financing arrangements which may or may not be available on favorable terms at such time. If we raise additional funds by issuing equity securities, our shareholders may experience dilution. Debt financing, if available, may involve covenants restricting our operations or our ability to incur additional
debt.debt, in addition to those under our existing credit facilities. Any debt financing or additional equity that we raise may contain terms that are not favorable to us or our shareholders. If we do not have, or are not able to obtain, sufficient funds, we may have to delay development or commercialization of our products or license to third parties the rights to commercialize products or technologies that we would otherwise seek to commercialize. We also may have to reduce marketing, customer support or other resources devoted to our products or cease operations.Any lack of borrowing availability under our credit facility and our potential inability to obtain replacement sources of credit could materially affect our operations and financial condition.
Although we currently have available credit under our $30.0 million senior secured revolving credit facility, our ability to draw on our credit facility may be limited by outstanding letters of credit or by operating and financial covenants under our the credit agreement. There can be no assurances that we will continue to have access to credit if our operating and financial performance do not satisfy these covenants. If we do not satisfy these criteria, and if we are unable to secure necessary waivers or other amendments from the lenders of our credit facility, we will not have access to this credit.
Both the $30.0 million revolving credit facility and the $60.9 million term loan under our credit agreement as of December 29, 2013 are secured by all of our assets (subject to certain exceptions) and except to the extent otherwise permitted under the terms of our credit agreement, our assets cannot be pledged as security for other indebtedness. These limits on our ability to offer collateral to other sources of financing could limit our ability to obtain other financing which could materially affect our operations and financial condition.
Although we believe that our anticipated operating cash flows, on-hand cash levels and access to credit will give us the ability to meet our financing needs for at least the next 12 months, there can be no assurance that they will do so. Any lack of borrowing availability under our revolving credit facility and our potential inability to obtain replacement sources of credit could materially affect our operations and financial condition.
We are leveraged financially, which could adversely affect our ability to adjust our business to respond to competitive pressures and to obtain sufficient funds to satisfy our future research and development needs, to protect and enforce our intellectual property and other needs.
We have significant indebtedness. As of December 29, 2013, we had a senior secured term loan outstanding in the amount of $60.9 million, net of unamortized discount of $3.2 million. In addition, as of December 29, 2013, we have $30.0 million of credit availability under our senior secured revolving line of credit. The degree to which we are leveraged could have important consequences, including, but not limited to, the following:
our ability to utilize our existing available credit under our senior secured revolving line of credit or our ability to obtain additional financing in the future for working capital, capital expenditures, acquisitions, litigation, general corporate or other purposes may be limited;a substantial portion ofContentsour cash flows from operations in the future will be dedicated to the payment of principal and interest on our indebtedness, including the requirement that certain excess cash flows and certain net proceeds of asset dispositions (including from condemnation or casualty) and certain new indebtedness be applied to prepayment of our senior secured terms loans; andwe may be more vulnerable to economic downturns, less able to withstand competitive pressures and less flexible in responding to changing business and economic conditions.A failure to comply with the covenants and other provisions of our credit agreement could result in events of default under such agreement, which could require the immediate repayment of our outstanding indebtedness. If we are at any time unable to generate sufficient cash flows from operations to service our indebtedness when payment is due, we may be required to attempt to renegotiate the terms of the agreements relating to the indebtedness, seek to refinance all or a portion of the indebtedness or obtain additional financing. There can be no assurance that we will be able to successfully renegotiate such terms, that any such refinancing would be possible or that any additional financing could be obtained on terms that are favorable or acceptable to us.
Our credit agreement contains restrictive covenants that may limit our operating flexibility.
The agreement relating to our senior secured term loan and senior secured revolving credit facility contains operating covenants limiting our ability to transfer or dispose of assets, merge with or acquire other companies, make investments, pay dividends, incur additional indebtedness and liens, make capital expenditures and conduct transactions with affiliates, and financial covenants requiring us to meet certain financial ratios. We, therefore, may not be able to engage in any of the foregoing transactions or in any that would cause us to breach these financial covenants until our current debt obligations are paid in full or we obtain the consent of the lenders. There is no guarantee that we will be able to generate sufficient cash flow or revenue to meet these operating and financial covenants or pay the principal and interest on our debt. Furthermore, there is no guarantee that future working capital, borrowings or equity financing will be available to repay or refinance any such debt.
As a result of our acquisition of OrthoHelix, we may be required to make future earn-out payments of up to an aggregate of $20.0 million based upon our sales of lower extremity joints and trauma products during fiscal years 2013 and 2014, which payments may affect our liquidity and our operating results.
In connection with our acquisition of OrthoHelix, we agreed to made additional earn-out payments of up to an aggregate of $20.0 million in cash based upon our sales of lower extremity joints and trauma products during 2013 and 2014. A portion of the earn-out payments are subject to certain rights of set-off for post-closing indemnification obligations of OrthoHelix’s equity holders. Based upon sales of lower extremity joints and trauma products during 2013, we may be required to make an earn-out payment in the amount of approximately $4.6 million. If we are required to make another payment based upon 2014 sales during 2015 and if at this time we are experiencing financial difficulty, our liquidity, operating results and financial condition may be adversely affected.
Our operating results could be negatively impacted by future changes in the allocation of income to each of the entities through which we operate and to each of the income tax jurisdictions in which we operate.
We operate through multiple entities and in multiple income tax jurisdictions with different income tax rates both inside and outside the United
States.States and the Netherlands. Accordingly, our management must determine the appropriate allocation of income to each such entity and each of these jurisdictions. Income tax audits associated with the allocation of this income and other complex issues, including inventory transfer pricing and cost sharing and product royalty arrangements, may require an extended period of time to resolve and may result in income tax adjustments if changes to the income allocation are required. Since income tax adjustments in certain jurisdictions can be significant, our future operating results could be negatively impacted by settlement of these matters.Future changes in technology or market conditions could result in adjustments to our recorded asset balance for intangible assets, including goodwill, resulting in additional charges that could significantly impact our operating results.
Our consolidated balance sheet includes significant intangible assets, including $251.5 million in goodwill and $117.6 million in other acquired intangible
assets.assets, together representing 52% of our total assets as of December 29, 2013. The determination of related estimated useful lives and whether these assets are impaired involves significant judgments. Our ability to accurately predict future cash flows related to these intangible assets may be adversely affected by unforeseen and uncontrollable events. In the highly competitive medical device industry, new technologies could impair the value of our intangible assets if they create market conditions that adversely affect the competitiveness of our products. We test our goodwill for impairment in the fourth quarter of each year, but we also test goodwill and other intangible assets for impairment at any time when there is a change in circumstances that indicates that the carrying value of these assets may be impaired. Any future determination that these assets are carried at greater than their fair value could result in substantial non-cash impairment charges, which could significantly impact our reported operating results.Our outstanding debt agreements contain restrictive covenants that may limit our operating flexibility.The agreements relating to our outstanding debt contain some financial covenants limiting our ability to transfer or dispose of assets, merge with or acquire other companies, make investments, pay dividends, incur additional indebtedness and liens and conduct transactions with affiliates. We therefore may not be able to engage in any of the foregoing transactions until our current debt obligations are paid in full or we obtain the consent of the lenders. There is no guarantee that we will be able to generate sufficient cash flow or revenue to meet the financial covenants or pay the principal and interest on our debt. Furthermore, there is no guarantee that future working capital, borrowings or equity financing will be available to repay or refinance any such debt.If reimbursement from third-party payors for our products becomes inadequate, surgeons and patients may be reluctant to use our products and our
salesrevenue may decline.In the United States, healthcare providers who purchase our products generally rely on third-party payors, principally federal Medicare, state Medicaid and private health insurance plans, to pay for all or a portion of the cost of joint reconstructive procedures and products utilized in those procedures. We may be unable to sell our products on a profitable basis if third-party payors deny coverage or reduce their current levels of reimbursement. Our
sales dependrevenue depends largely on governmental healthcare programs and private health insurers reimbursingpatients'patients’ medical expenses. As part of the Budget Control Act to extend the federal debt limit and reduce government spending, $1.2 trillion in automatic spending cuts (known as sequestration) are scheduled to occur over the next decade. Half of the automatic reductions are to come from lowering the caps imposed on non-defense discretionary spending and cutting domestic entitlement programs, including aggregate reductions in payments to Medicare providers of up to 2% per fiscal year. Subsequent legislation reduced Medicare payments to several providers, including hospitals, imaging centers and cancer treatment centers, and increased the statute of limitations period for the government to recover overpayments to providers from three to five years. We expect that additional state and federal healthcare reform measures will be adopted in the future, any of which could limit the amounts that federal and state governments will pay for healthcare products and services, which could result in reduced demand for our products or additional pricing pressure.To contain costs of new technologies, third-party payors are increasingly scrutinizing new treatment modalities by requiring extensive evidence of clinical outcomes and cost-effectiveness. Currently, we are aware of several private insurers who have issued policies that classify procedures using our Salto Talaris Prosthesis and Conical Subtalar Implants
implantsas experimental or investigational and denied coverage and reimbursement for such procedures. Surgeons, hospitals and other healthcare providers may notpurchase our products if they do not receive satisfactory reimbursement from these third-party payors for the cost of the procedures using our products. Payors continue to review their coverage policies carefully for existing and new therapies and can, without notice, deny coverage for treatments that include the use of our products. If we are not successful in reversing existing non-coverage policies or other private insurers issue similar policies, this could have a material adverse effect on our business and operations.
In addition, some healthcare providers in the United States have adopted or are considering a managed care system in which the providers contract to provide comprehensive healthcare for a fixed cost per person. Healthcare providers may attempt to control costs by authorizing fewer elective surgical procedures, including joint reconstructive surgeries, or by requiring the use of the least expensive implant available.
Additionally, there is a significant likelihood of reform of the U.S. healthcare system, and changesChanges in reimbursement policies or healthcare cost containment initiatives that limit or restrict reimbursement for our products may cause our revenue to decline.If adequate levels of reimbursement from third-party payors outside of the United States are not obtained, international
salesrevenue of our products may decline. Outside of the United States, reimbursement systems vary significantly by country. Many foreign markets have government-managed healthcare systems that govern reimbursement for orthopaedic medical devices and procedures. Additionally, some foreign reimbursement systems provide for limited payments in a given period and therefore result in extended payment periods.Weakness in the global economy is likely to adversely affect our business until an economic recovery is underway.Many of our products are used in procedures covered by private insurance, and some of these procedures may be considered elective. We believe the global economic downturn may reduce the availability or affordability of private insurance or may affect patient decisions to undergo elective procedures. If current economic conditions do not continue to recover or worsen, we expect that increasing levels of unemployment and pressures to contain healthcare costs could adversely affect the global growth rate of procedure volume, which could have a material adverse effect on our sales and results of operations.Consolidation in the healthcare industry could lead to demands for price concessions or to the exclusion of some suppliers from certain of our markets, which could have an adverse effect on our business, financial condition or
results of operations.operating results.Because healthcare costs have risen significantly over the past decade, numerous initiatives and reforms initiated by legislators, regulators and third-party payors to curb these costs have resulted in a consolidation trend in the healthcare industry to create new companies with greater market power, including hospitals. As the healthcare industry consolidates, competition to provide products and services to industry participants has become and will continue to become more intense. This in turn has resulted and likely will
likelycontinue to result in greater pricing pressures and the exclusion of certain suppliers from important market segments as group purchasing organizations, independent delivery networks and large single accounts continue to use their market power to consolidate purchasing decisions for some of our customers. We expect that market demand, government regulation, third-party reimbursement policies and societal pressures will continue to change the worldwide healthcare industry, resulting in further business consolidations and alliances among our customers, which may reduce competition, exert further downward pressure on the prices of our products and may adversely impact our business, financial condition orresults of operations.operating results.If we experience significant disruptions in our information technology systems, our business may be adversely affected.
We depend on our information technology systems for the efficient functioning of our business, including accounting, data storage, purchasing and inventory management. Currently, we have a non-interconnected information technology system; however, in 2013, we
have undertakenbegan implementing a new enterprise resource planningfor the implementation of an upgrade ofsystem (ERP) across oursystems.significant operating locations. We expect thatthis upgradethe ERP will take two to three years to implement; however, when complete it should enable management to better and more efficiently conduct our operations and gather, analyze, and assessinformation across allbusiness information. The ERP will require the investment ofour businesssignificant human andgeographic locations. Wefinancial resources. As a result of the implementation, we may experience difficultiesin implementing this upgradein our business operations, or difficulties in operating our business underthis upgrade,the ERP, either of which could disrupt our operations, including our ability to timely ship and track product orders, project inventory requirements, manage our supply chain, and otherwise adequately service ourcustomers.customers, and lead to increased costs and other difficulties. In the event we experience significant disruptions as a result of thecurrentERP implementation,in our information technology system,we may not be able to fix our systems in an efficient and timely manner. Accordingly, such events may disrupt or reduce the efficiency of our entire operation and have a material adverse effect on our operating resultsof operationsand cash flows.Risks Related to Regulatory Environment
The sale of our products is subject to regulatory clearances or approvals and our business is subject to extensive regulatory requirements. If we fail to maintain regulatory
approvalsclearances andclearances,approvals, or are unable to obtain, or experience significant delays in obtaining, FDA clearances or approvals for our future products or product enhancements, our ability to commercially distribute and market these products could suffer.Our medical device products and operations are subject to extensive regulation by the FDA and various other federal, state and foreign governmental
authorities, such as those of the European Union and the competent authorities of the Member States of the EEA.authorities. Government regulation of medical devices is meant to assure their safety and effectiveness, and includes regulation of, among other things:•- design, development and manufacturing;
•testing, labeling, packaging, content and language of instructions for use, and storage;•clinical trials;•product safety;•marketing, sales and distribution;•premarket clearance and approval;•recordkeeping procedures;•marketing, sales and distribution (including making product claims);advertising and promotion;•product modifications;recordkeeping procedures;recalls and field corrective actions;•post-market surveillance, including reporting of deaths or serious injuries and malfunctions that, if they were to recur, could lead to death or serious injury; and•product import and export.Before a new medical device, or a new use of, or claim for, an existing product can be marketed in the United States, it must first receive either premarket clearance under Section 510(k) of the U.S. Federal Food, Drug and Cosmetic Act, or FDCA, a de novo approval or a PMA, from the FDA, unless an exemption applies. In the 510(k) clearance process, the FDA must determine that the proposed device is
"substantiallyequivalent"“substantially equivalent” to a device legally on the market, known as a"predicate"“predicate” device. To establish substantial equivalence which allows the devicewith respectto be marketed, the applicant must demonstrate the device has the: (i) the same intendeduse, technologyuse; (ii) the same technological characteristics; and (iii) to the extent the technological characteristic are different, that they do not raise different questions of safety andeffectiveness to clear the proposed device for marketing.effectiveness. Clinical data is sometimes required to support substantialequivalence.equivalence, but FDA’s expectations for data are often unclear and do change. Another procedure for obtaining marketing authorization for a medical device is the “de novo classification” procedure, pursuant to which FDA may authorize the marketing of a moderate to low risk device that has no predicate. These submissions typically require more information (i.e. non-clinical and/or clinical performance data) and take longer than a 510(k), but require less data and a shorter time period than a PMA approval. If the FDA grants the de novo request, the device is permitted to enter commercial distribution in the same manner as if 510(k) clearance had been granted, and the device becomes a 510(k) predicate for future devices seeking to call it a “predicate.” The PMA pathway requires an applicant to demonstratethereasonable assurance of safety and effectiveness of the device for its intended use based, in part, on extensive data including, but not limited to, technical, preclinical, clinical trial, manufacturing and labeling data. The PMA process is typically required for devices that are deemed to pose the greatest risk, such as life-sustaining, life-supporting or implantable devices. Products that are approved through a PMA application generally need FDA approval before they can be modified. Similarly, some modifications made to products cleared through a 510(k) may require a new 510(k). Both theor a PMA. The 510(k), de novo and PMA processes can be expensive,andlengthy and sometimes unpredictable. The processes also entail significant user fees, unless exempt. TheFDA'sFDA’s 510(k) clearance process usually takes fromthreesix to1218 months, but may takelonger.longer if more data are needed. The de novo process can take one to two years or longer if additional data are needed. The PMA pathway is much more costly and uncertain than the 510(k) clearance process and it generally takes from one to five years, or even longer, from the time the application is filed with the FDA until an approval is obtained. The process of obtaining regulatory clearances or approvals to market a medical device can be costly and time-consuming, and we may not be able to obtain these clearances or approvals on a timely basis, if at all.Most of our currently commercialized products have received premarket
clearanceclearances under Section 510(k) of the FDCA. If the FDA requires us to go through a lengthier, more rigorous examination for future products or modifications to existing products than we had expected, our product introductions or modifications could be delayed or canceled, which could cause oursalesrevenue to decline. In addition, the FDA may determine that future products will require the more costly, lengthy and uncertain de novo or PMAprocess.processes. Although we do not currently market any devices under PMA and have not gone through the de novo classification for marketing clearance, we cannot assure you that the FDA will not demand that we obtain a PMA prior to marketing or that we will be able to obtainthe510(k) clearances with respect to future products.The FDA can delay, limit or deny clearance or approval of a device for many reasons, including:
•- we may not be able to demonstrate to the
FDA'sFDA’s satisfaction that our products meet the definition of “substantial equivalence” or meet the standard for the FDA to grant a petition for de novo classification;we may not be able to demonstrate to the FDA’s satisfaction that our products are safe and effective for their intendedusers;•- uses;
the data from our pre-clinical studies (bench and/or animal) and clinical trials may be insufficient to support clearance or approval, where required;•the manufacturing process or facilities we use may not meet applicable requirements; and•changes in FDA clearance or approval policies or the adoption of new regulations may require additional data.Any delay in, or failure to receive or maintain,
clearanceclearances orapprovalapprovals for our products under development could prevent us from generating revenue from these products or achieving profitability. Additionally, the FDA and other governmental authorities have broad enforcement powers. Our failure to comply with applicable regulatory requirements could lead governmental authorities or a court to take action against us,including:including but not limited to:•- issuing untitled (notice of violation) letters or public warning letters to us;
•imposing fines and penalties on us;•obtaining an injunction or administrative detention preventing us from manufacturing or selling our products;•seizing products to prevent sale or transport or export;bringing civil or criminal charges against us;•recalling our products or engaging in a product correction;detaining our products at U.S. Customs;delaying the introduction of our products into the market;•delaying pending requests for clearance or approval of new uses or modifications to our existing products; and/or•recalling, detaining or seizing our products; or•- withdrawing or denying approvals or clearances for our products.
If we fail to obtain and maintain regulatory
approvalsclearances orclearances,approvals, our ability to sell our products and generaterevenuesrevenue will be materially harmed.Outside of the United States, our medical devices must comply with the laws and regulations of the foreign countries in which they are marketed, and compliance may be costly and time-consuming. Failure to obtain and maintain regulatory approvals in jurisdictions outside the United States will prevent us from marketing our products in such jurisdictions.
We currently market, and intend to continue to market, our products outside the United States. To market and sell our
productsproduct inothercountries outside the United States, we must seek and obtain regulatory approvals, certifications or registrations and comply with the laws and regulations of those countries. These laws and regulations, including the requirements for approvals, certifications or registrations and the time required for regulatory review, vary from country to country. Obtaining and maintaining foreign regulatory approvals, certifications or registrations are expensive, and we cannot be certain that we will receive regulatory approvals, certifications or registrations in any foreign country in which we plan to market our products.If we failThe regulatory approval process outside the United States may include all of the risks associated with obtaining FDA clearance or approval in addition toobtain or maintain regulatory approvals, certifications or registrations in any foreign country in which we planother risks.In order to market our products
our ability to generate revenue will be harmed.In particular,in theEEA, which is composed of the 27Member States of theEU plus Liechtenstein, Norway and Iceland,EEA, ourmedicaldevicesmustare required to comply with the essential requirements of the EU Medical Devices Directives (Council Directive 93/42/EEC of 14 June 1993 concerning medical devices, as amended, and Council Directive 90/385/EEC of 20 June 2009 relating to active implantable medical devices, as amended). Compliance with these requirements entitles us to affix the CE conformity mark to our medical devices, without which they cannot bemarketedcommercialized in the EEA.Further,In order to demonstrate compliance with theadvertisingessential requirements andpromotionobtain the right to affix the CE conformity mark we must undergo a conformity assessment procedure, which varies according to the type of medical device and its classification. Except for low risk medical devices (Class I), where the manufacturer can issue an EC Declaration of Conformity based on a self-assessment of the conformity of its products with the essential requirements of the Medical Devices Directives, a conformity assessment procedure requires the intervention of a Notified Body, which is an organization accredited by a Member State of the EEA to conduct conformity assessments. The Notified Body would typically audit and examine the quality system for the manufacture, design and final inspection of ourproducts is subjectdevices before issuing a certification demonstrating compliance with the essential requirements. Based on this certification we can draw up an EC Declaration of Conformity, which allows us toEEA Memberaffix the CE mark to our products.We may not obtain regulatory approvals or certifications outside the United States
laws implementing Directive 93/42/EEC concerning Medical Devices,on a timely basis, if at all. Clearance or approval by the FDA does not ensure approval or certification by regulatory authorities or Notified Bodies in other countries, and approval or certification by one foreign regulatory authority or Notified Body does not ensure approval by regulatory authorities in other countries or by the FDA. We may be required to perform additional pre-clinical or clinical studies even if FDA clearance or approval, or theEU Medical Devices Directive, Directive 2006/114/EC concerning misleading and comparative advertising, and Directive 2005/29/EC on unfair commercial practices, as well as other EEA Member State legislation governingright to bear theadvertising and promotion of medical devices. These laws may limitCE mark, has been obtained. If we fail to obtain orrestrict the advertising and promotion ofmaintain regulatory approvals, certifications or registrations in any foreign country in which we plan to market our products,to the general publicour business, financial condition andmay impose limitations on our promotional activities with healthcare professionals.operating results could be adversely affected.Modifications to our marketed products may require new 510(k) clearances or PMAs, or may require us to cease marketing or recall the modified products until clearances are obtained.
Any modification to a 510(k)-cleared device that could significantly affect its safety or efficacy, or that would constitute a major change in its intended use, technology, materials, packaging and certain manufacturing processes, may require a new 510(k) clearance or, possibly, a PMA. The FDA requires every manufacturer to make the determination regarding the need for a new 510(k) clearance or PMA in the first instance, but the FDA may (and often does) review the
manufacturer'smanufacturer’sdecision. The FDA may not agree with a
manufacturer'smanufacturer’s decision regarding whether a new clearance or approval is necessary for a modification, and may retroactively require the manufacturer to submit a premarket notification requesting 510(k) clearance or an application for PMA. We have made modifications to our products in the past and may make additional modifications in the future that we believe do not or will not require additional clearances or approvals. No assurance can be given that the FDA would agree with any of our decisions not to seek 510(k) clearance or PMA. The issue of whether a product modification is significant enough to require a 510(k), as opposed to a simple “letter-to-file” documenting the change, is in a state of flux. In 1997, FDA issued a guidance to address this issue and it is a guidance with which FDA and industry is very familiar. In 2011, FDA proposed a new modifications guidance that was very controversial with industry because industry interpreted the guidance to reflect FDA’s view that it would require more 510(k)s than under the 1997 modifications guidance. On July 9, 2012, the Food and Drug Administration Safety and Innovation Act, FDASIA, was signed into law. Among other things, FDASIA requires the FDA to withdraw this proposed new modifications guidance and does not allow the FDA to use this draft guidance as part of, or for the basis of, any premarket review or any compliance or enforcement decisions or actions. FDASIA also obligates the FDA to prepare a report for Congress on the FDA’s approach for determining when a new 510(k) will be required for modifications or changes to a previously cleared device. After submitting this report, the FDA is expected to issue revised guidance to assist device manufacturers in making this determination. Until then, manufacturers may continue to adhere to the FDA’s 1997 guidance on this topic when making a determination as to whether or not a new 510(k) is required for a change or modification to a device, but the practical impact of the FDA’s continuing scrutiny of these issues remains unclear.If the FDA requires us to cease marketing and recall
thea modified device until we obtain a new 510(k) clearance or PMA, our business, financial condition, operating resultsof operationsand future growth prospects could be materially adversely affected. Further, our products could be subject to recall if the FDA determines, for any reason, that our products are not safe or effective. Any recall or FDA requirement that we seek additional approvals orclearances could result in significant delays, fines, increased costs associated with modification of a product, loss of revenue and potential operating restrictions imposed by the FDA.
Healthcare policy changes, including
the recently enactedlegislation to reform the U.S. healthcare system, may have a material adverse effect onus.our business and operating results.In March 2010, President Obama signed into law theThe Patient Protection and Affordable Care Act, as amended by the Health Care and Education Affordability Reconciliation Act, collectively, the PPACA,whichsubstantially changes the way health care is financed by both governmental and private insurers, encourages improvements in the quality of healthcare items and services, and significantly impacts the medical device industry. The PPACA includes, among other things, the following measures:•- an excise tax on any entity that manufactures or imports medical devices offered for sale in the United States;
•a new Patient-Centered Outcomes Research Institute to oversee, identify priorities in and conduct comparative clinical effectiveness research;•new reporting and disclosure requirements on device manufacturers for any"transfer“transfer ofvalue"value” made or distributed to prescribers and other healthcare providerseffective(referred to as the Physician Payment Sunshine Act), which reporting requirements will be difficult to define, track and report, and which reports are due to CMS by March30, 2013;•- 31, 2014 and by the 90th day of each calendar year thereafter;
payment system reforms including a national pilot program on payment bundling to encourage hospitals, physicians and other providers to improve the coordination, quality and efficiency of certain healthcare services through bundled payment models, beginning on or before January 1, 2013;•an independent payment advisory board that will submit recommendations to reduce Medicare spending if projected Medicare spending exceeds a specified growth rate; and•a new licensure framework for follow-on biologic products.TheseWe cannot predict what healthcare programs and regulations will be ultimately implemented at the federal or state level, or the effect of any future legislation or regulation. However, these provisions as adopted could meaningfully change the way healthcare is delivered and financed, and may materially impact numerous aspects of our business. In particular, any changes that lower reimbursements for our products or reduce medical procedure volumes could adversely affect our business and operating results.In addition, in the future there may continue to be additional proposals relating to the reform of the U.S. healthcare system. Certain of these proposals could limit the prices we are able to charge for our products, or the amounts of reimbursement available for our products, and could limit the acceptance and availability of our products. The adoption of some or all of these proposals could have a material adverse effect on our financial position and
results of operations.operating results.Additionally,Furthermore, initiatives sponsored by government agencies, legislative bodies and the private sector to limit the growth of healthcare costs, including price regulation and competitive pricing, are ongoing in markets where we do business. We could experience a negative impact on our operating results due to increased pricing pressure in the United States and certain other markets. Governments, hospitals and other third-party payors could reduce the amount of approved reimbursements for our products. Reductions in reimbursement levels or coverage or other cost-containment measures could unfavorably affect our future operating results.
Our financial performance may continue to be adversely affected by medical device tax provisions in the health care reform laws.
The PPACA imposes a deductible excise tax equal to 2.3% of the price of a medical device on any entity that manufactures or imports medical devices offered for sale in the United States, with limited
exceptions, beginning in 2013.exceptions. Under these provisions, the total cost to the medical device industryiswas estimated to be approximately $20 billion over 10 years. These taxeswould resultresulted in a significantincrease in the tax burden on our industry and on us, which
could have a material, negative impact onnegatively impacted our operating resultsof operationsand our cashflows.flows during 2013. Should this tax continue to exist or change, our operating results could continue to be negatively impacted.The use, misuse or off-label use of our products may harm our image in the marketplace or result in injuries that lead to product liability suits, which could be costly to our business or result in FDA sanctions if we are deemed to have engaged in
such promotion.improper promotion of our products.Our products currently marketed
productsin the United States have been cleared by theFDA'sFDA’s 510(k) clearance process for use under specific circumstances. Our promotional materials and training methods must comply with FDA and other applicable laws and regulations, including the prohibition on the promotion of a medical device for a use that has not been cleared or approved by the FDA. Use of a device outside of its cleared or approved indication is known as"off-label"“off-label” use. We cannothowever,prevent a surgeon from using our products or procedure for off-label use, as the FDA does not restrict or regulate aphysician'sphysician’s choice of treatment within the practice of medicine. However, if the FDA determines that our promotional materials, reimbursement advice or training of sales representatives or physicians constitute promotion of an off-label use,itthe FDA could request that we modify our training or promotional or reimbursement materials or subject us to regulatory or enforcement actions, including the issuance of an untitled letter, a warning letter, injunction, seizure, disgorgement of profits, a civil fine and criminal penalties. Other federal, state or foreign governmental authorities also mightalsotake action if they consider our promotion or training materials to constitute promotion of an uncleared or unapproved use, which could result in significant fines or penalties under other statutory authorities, such as laws prohibiting false claims for reimbursement. In that event, our reputation could be damaged and adoption of the products would be impaired. Although we train our sales force not to promote our products for off-label uses, and our instructions for use in all markets specify that our products are not intended for use outside of those indications cleared for use, the FDA or another regulatory agency could conclude that we have engaged in off-label promotion.Further, the advertising and promotion of our products is subject to EEA Member States laws implementing Directive 93/42/EEC concerning Medical Devices, or the EU Medical Devices Directive, Directive 2006/114/EC concerning misleading and comparative advertising, and Directive 2005/29/EC on unfair commercial practices, as well as other EEA Member State legislation governing the advertising and promotion of medical devices. These laws may limit or restrict the advertising and promotion of our products to the general public and may impose limitations on our promotional activities with healthcare professionals. Our failure to comply with all these laws and requirements may harm our business and operating results.
In addition, there may be increased risk of injury if surgeons attempt to use our products off-label. Furthermore, the use of our products for indications other than those indications for which our products have been cleared by the FDA may not effectively treat such conditions, which could harm our reputation in the marketplace among surgeons and patients. Surgeons also may
alsomisuse our products or use improper techniques if they are not adequately trained, potentially leading to injury and an increased risk of product liability. Product liability claims are expensive to defend and could divert ourmanagement'smanagement’s attention and result in substantial damage awards against us. Any of these events could harm our business andresults of operations.operating results.If our marketed medical devices are defective or otherwise pose safety risks, the FDA and similar foreign governmental authorities could require their recall, or we may initiate a recall of our products voluntarily.
The FDA and similar foreign governmental authorities may require the recall of commercialized products in the event of material deficiencies or defects in design or manufacture or in the event that a product poses an unacceptable risk to health. Manufacturers,
may,on their own initiative, may recall a product if any material deficiency in a device is found. In the past we have initiated voluntary product recalls. For example, in2008,August 2013, werecalledinitiated asmall number of medical devices duevoluntary Class II recall for instrumentation contained within the Aequalis Reversed II and the Aequalis Reversed Fracture instrument sets. We notified our distributors, sales representatives and all direct consignees and directed them toa mislabeled product. We requested FDA closure ofreturn therecallaffected instrumentation to us inJanuary 2010.exchange for redesigned instruments.A government-mandated or voluntary recall by us or one of our sales agencies could occur as a result of an unacceptable risk to health, component failures, manufacturing errors, design or labeling defects or other deficiencies and issues. Recalls of any of our products would divert managerial and financial resources and have an adverse effect on our financial condition and
results of operations.operating results. Any recall could impair our ability to produce our products in a cost-effective and timely manner in order to meet ourcustomers'customers’ demands. We also mayalsobe required to bear other costs or take other actions that may have a negative impact on our futuresalesrevenue and our ability to generate profits. We may initiate voluntary recalls involving our products in the future that we determine do not require notification of the FDA. If theFDA disagrees with our determinations, they could require us to report those actions as recalls. A future recall announcement could harm our reputation with customers and negatively affect our
sales.revenue. In addition, the FDA could take enforcement action for failing to report the recalls when they were conducted.In the EEA we must comply with the EU Medical Device Vigilance System, the purpose of which is to improve the protection of health and safety of patients, users and others by reducing the likelihood of reoccurrence of incidents related to the use of a medical device. Under this system, incidents must be reported to the competent authorities of the Member States of the EEA. An incident is defined as any malfunction or deterioration in the characteristics and/or performance of a device, as well as any inadequacy in the labeling or the instructions for use which, directly or indirectly, might lead to or might have led to the death of a patient or user or of other persons or to a serious deterioration in their state of health. Incidents are evaluated by the EEA competent authorities to whom they have been reported, and where appropriate, information is disseminated between them in the form of National Competent Authority Reports, or NCARs. The Medical Device Vigilance System is further intended to facilitate a direct, early and harmonized implementation of Field Safety Corrective Actions, or FSCAs across the Member States of the EEA where the device is in use. An FSCA is an action taken by a manufacturer to reduce a risk of death or serious deterioration in the state of health associated with the use of a medical device that is already placed on the market. An FSCA may include the recall, modification, exchange, destruction or retrofitting of the device. FSCAs must be communicated by the manufacturer or its legal representative to its customers and/or to the end users of the device through Field Safety Notices.
If our products cause or contribute to a death or a serious injury, or malfunction in certain ways, we will be subject to medical device reporting regulations, which can result in voluntary corrective actions or agency enforcement actions.
Under the FDA medical device reporting regulations, or MDR, we are required to report to the FDA any incident in which our product has or may have caused or contributed to a death or serious injury or in which our product malfunctioned and, if the malfunction were to recur, would likely cause or contribute to death or serious injury. If we fail to report these events to the FDA within the required timeframes, or at all, the FDA could take enforcement action against us. Any adverse event involving our products could result in future voluntary corrective actions, such as recalls or customer notifications, or agency action, such as inspection, mandatory recall or other enforcement action. Any corrective action, whether voluntary or involuntary, as well as defending ourselves in a lawsuit, will require the dedication of our time and capital, distract management from operating our business, and may harm our reputation and financial results.
Our manufacturing operations require us to comply with the
FDA'sFDA’s and other governmentalauthorities'authorities’ laws and regulations regarding the manufacture and production of medical devices, which is costly and could subject us to enforcement action.We and certain of our third-party manufacturers are required to comply with the
FDA'sFDA’s current Good Manufacturing Program (cGMP) and Quality SystemRegulation,Regulations, or QSR, whichcoverscover the methods of documentation of the design, testing, production, control, quality assurance, labeling, packaging, sterilization, storage and shipping of our products. We and certain of our suppliers also arealsosubject to the regulations of foreign jurisdictions regarding the manufacturing process for our products marketed outside of the United States. The FDA enforces the QSR through periodic announced and unannounced inspections of manufacturing facilities. In January 2013, our OrthoHelix facility located in Medina, Ohio was subject to a routine FDA inspection. The inspection resulted in the issuance of a Form FDA-483 listing four inspectional observations. The FDA’s observations related to our documentation of corrective and preventative actions, procedures for receiving, reviewing and evaluating complaints, procedures to control product that does not conform to specified requirements and procedures to ensure that all purchased or otherwise received product and services conform to specified requirements. Although we believe we have corrected all four of these observations, the FDA could disagree with our conclusion and take corrective and remedial measures. In April 2013, our manufacturing facility located in Montbonnot, France was subject to a routine FDA inspection. The inspection resulted in the issuance of a Form FDA-483 listing one inspectional observation. The FDA’s observation related to our establishment of records of acceptable suppliers, contractors and consultants. Although we believe we have corrected the observation, the FDA could disagree with our conclusion and corrective and remedial measures. The failure by us or one of our suppliers to comply with applicable statutes and regulations administered by theFDA and other regulatory bodies, or the failure to timely and adequately respond
to any adverse inspectional observations or product safety issues, could result in, among other things, any of the following enforcement actions:
•- untitled letters, warning letters, fines, injunctions, consent decrees, disgorgement of profits, criminal and civil penalties;
•customer notifications or repair, replacement, refunds, recall, detention or seizure of our products;•operating restrictions or partial suspension or total shutdown of production;•refusing or delaying our requests for 510(k) clearance or PMA approval of new products or modified products;•withdrawing 510(k) clearances or PMAs that have already been granted;•refusal to grant export approval for our products; or•criminal prosecution.Any of these actions could impair our ability to produce our products in a cost-effective and timely manner in order to meet our
customers'customers’ demands. We also mayalsobe required to bear other costs or take other actions that may have a negative impact on our futuresalesrevenue and our ability to generate profits. Furthermore, our key component suppliers may not currently be or may not continue to be in compliance with all applicable regulatory requirements, which could result in our failure to produce our products on a timely basis and in the required quantities, if at all.We are subject to substantial post-market government regulation that could have a material adverse effect on our business.
The productionMany states such as Massachusetts, Connecticut, Nevada andmarketingVermont require different types ofour products are subjectcompliance such as having a code of conduct, as well as reporting remuneration paid toextensive regulationhealth care professionals or entities in a position to influence prescribing behavior. Many of these industry standards inevitably influence company standards of conduct. Other laws tie into these standards as well, such as compliance with the advertising andreview bypromotion regulations under theFDAU.S. federal Food, Drug andnumerousCosmetic Act, the Anti-Kickback Statute, the False Claims Act, the Physician Payment Sunshine Act and othergovernmental authorities bothlaws. We use many distributors and independent sales representatives in certain territories and thus rely upon their compliance with applicable laws and regulations, such as with the advertising and promotion regulations under the U.S. federal Food, Drug and Cosmetic Act, the Anti-kickback Statute, the False Claims Act, the Physician Payment Sunshine Act, similar laws under countries located outside the United States andabroad. For example, in addition toother applicable federal, stateregulatory requirements, Massachusetts, California and Arizona require compliance with the standards in industry codes such as the Code of Ethics on Interactions with Health Care Professionals issued by the Advanced Medical Technology Association (commonly known as AdvaMed), the Code on Interactions with Healthcare Professionals issued by MEDEC, the national association of Canada's medical technology companies, andor internationalequivalents.laws. The failure by us or one of our distributors, representatives or suppliers to comply with applicable legal and regulatory requirements could result in, among other things, the FDA or other governmental authorities:•- imposing fines and penalties on us;
•preventing us from manufacturing or selling our products;•delaying the introduction of our new products into the market;•recalling, seizing, detaining orseizingenjoining the sale of our products;•withdrawing, delaying or denying approvals or clearances for our products;•issuing warning letters or untitled letters;•imposing operating restrictions;•imposing injunctions; and•commencing criminal prosecutions.Failure to comply with applicable regulatory requirements also could
alsoresult in civil actions against us and other unanticipated expenditures. If any of these actions were to occur it would harm our reputation and cause our productsalesrevenue to suffer and may prevent us from generating revenue.The results of our clinical trials may not support our product
candidateclaims or may result in the discovery of adverse side effects.Our ongoing research and development, pre-clinical testing and clinical trial activities are subject to extensive regulation and review by numerous governmental authorities both in the United States and abroad. We are currently conducting post-market clinical studies of some or our products to gather additional information about these
products'products’ safety, efficacy or optimal use. We are also conducting a clinical trial of our Simpliciti product in the United States. In the future we may conduct additional clinical trials to support approval of new products. Clinical studies must be conducted in compliance with FDA regulations or the FDA may take enforcement action. The data collected from these clinical trials may ultimately be used to support market clearance for these products. Even if our clinical trials are completed as planned, we cannot be certain that their results will support our productcandidateclaims or that the FDA or foreign authorities will agree with our conclusions regarding them. Success in pre-clinical testing and early clinical trials does not always ensure that later clinical trials will be successful, and we cannot be sure that the later trials will replicate the results of prior trials and studies. The clinical trial process may fail to demonstrate that ourproduct candidatesproducts are safe and effective for the proposed indicated uses, which could cause us to abandon a productcandidateand may delay development of others. Any delay or termination of our clinical trials will delay the filing of our product submissions and, ultimately, our ability to commercialize ourproduct candidatesproducts and generaterevenues.revenue. It is also possible that patients enrolled in clinical trials will experience adverse side effects that are not currently part of theproduct candidate'sproduct’s profile.If the third parties on which we rely to conduct our clinical trials and to assist us with pre-clinical development do not perform as contractually required or expected, we may not be able to obtain regulatory clearance or approval for or commercialize our products.
We often must rely on third parties, such as contract research organizations, medical institutions, clinical investigators and contract laboratories to conduct our clinical trials. If these third parties do not successfully carry out their contractual duties or regulatory obligations or meet expected deadlines, if these third parties need to be replaced, or if the quality or accuracy of the data they obtain is compromised due to
thetheir failure to adhere to our clinical protocols or regulatory requirements or for other reasons, our pre-clinical development activities or clinical trials may be extended, delayed, suspended or terminated, and we may not be able to obtain regulatory approval for, or successfully commercialize, our products on a timely basis, if at all, and our business, operating results and prospects may be adversely affected. Furthermore, our third-party clinical trial investigators may be delayed in conducting our clinical trials for reasons outside of their control.FederalFuture regulatoryreformsactions may adversely affect our ability to sell our products profitably.From time to time, legislation is drafted and introduced
in Congressthat could significantly change the statutory provisions governing the clearance or approval, manufacture and marketing of a medical device. In addition, FDA and other regulations and guidance are often revised or reinterpretedby the agencyin ways that may significantly affect our business and our products. It is impossible to predict whether legislative changes will be enacted orFDAregulations, guidance or interpretations changed, and what the impact of such changes, if any, may be.We may be subject to or otherwise affected by federal, state, and
stateinternational healthcare laws, including fraud and abuse, false claims and health information privacy and security laws, and could face substantial penalties if we are unable to fully comply with such laws.Although we do not provide healthcare services, submit claims for third-party reimbursement, or receive payments directly from Medicare, Medicaid or other third-party payors for our products or the procedures in which our products are used, healthcare regulation by federal, state and
stateforeign governmentscould significantly impact our business. Healthcare fraud and abuse and health information privacy and security laws potentially applicable to our operations include:
•- the federal Anti-Kickback Law, which constrains our marketing practices and those of our independent sales agencies, educational programs, pricing, bundling and rebate policies, grants for physician-initiated trials and continuing medical education, and other remunerative relationships with healthcare providers, by prohibiting, among other things, soliciting, receiving, offering or providing remuneration, intended to induce the purchase or recommendation of an item or service reimbursable under a federal healthcare program, such as the Medicare or Medicaid programs;
•federal false claims laws (such as the federal False Claims Act) which prohibit, among other things, knowingly presenting, or causing to be presented, claims for payment from Medicare, Medicaid, or other third-party payors that are false orfraudulent;•- fraudulent, which impacts and regulates the reimbursement advice we give to our customers as it cannot be inaccurate and must relate to on-label uses of our products;
the federal Health Insurance Portability and Accountability Act of 1996, or HIPAA, and its implementing regulations, which created federal criminal laws that prohibit executing a scheme to defraud any healthcare benefit program or making false statements relating to healthcare matters and which also imposes certain regulatory and contractual requirements regarding the privacy, security and transmission of individually identifiable health information;and•state laws analogous to each of the above federal laws, such as anti-kickback and false claims laws that may apply to items or services reimbursed by any third-party payor, including commercial insurers, and state laws governing the privacy and security of certain health information, many of which differ from each other in significant ways and often are not preempted by HIPAA, thus complicating complianceefforts.efforts; andfederal, state and international laws that impose reporting and disclosure requirements on device and drug manufacturers for any “transfer of value” made or distributed to prescribers and other healthcare providers.If our past or present operations, or those of our independent sales agencies, are found to be in violation of any of such laws or any other governmental regulations that may apply to us, we may be subject to penalties, including civil and criminal penalties, damages, fines, exclusion from federal healthcare programs and the curtailment or restructuring of our operations. Similarly, if the healthcare providers or entities with whom we do business are found to be non-compliant with
applicable laws, they may be subject to sanctions, which could also have a negative impact on us. Any penalties, damages, fines, curtailment or restructuring of our operations could adversely affect our ability to operate our business and our financial results. The risk of our company being found in violation of these laws is increased by the fact that many of them have not been fully interpreted by the regulatory authorities or the courts, and their provisions are open to a variety of interpretations. Further, the
recently enactedPPACA, among other things, amends the intent requirement of the federal anti-kickback and criminal health care fraud statutes. A person or entity no longer needs to have actual knowledge of this statute or specific intent to violate it. In addition, the PPACA provides that the government may assert that a claim including items or services resulting from a violation of the federalanti-kickback statuteAnti-Kickback Statute constitutes a false or fraudulent claim for purposes of the false claims statutes. Any action against us for violation of these laws, even if we successfully defend against them, could cause us to incur significant legal expenses and divert ourmanagement'smanagement’s attention from the operation of our business.The PPACA also includes a number of provisions that impact medical device manufacturers, including
new reporting and disclosure requirements on device and drug manufacturers for any "transfer of value" made or distributed to prescribers and other healthcare providers, effective March 30, 2013. Such information will be made publicly available in a searchable format beginning September 30, 2013. In addition, device and drug manufacturers will also be required to report and disclose any investment interests held by physicians and their immediate family members duringthepreceding calendar year.Physician Payment Sunshine Act. Failure to submit required information under the Physician Payment Sunshine Act may result in civil monetary penalties of up to an aggregate of $150,000 per year (and up to an aggregate of $1 million per year for"knowing failures"“knowing failures”), for all payments, transfers of value or ownership or investment interests not reported in an annual submission.In addition, there has been a recent trend of increased state and international regulation of payments made to physicians for marketing. Some states, such as Massachusetts and Vermont, mandate implementation of compliance programs, along with the tracking and reporting of gifts, compensation, and other remuneration to physicians. Several countries, such as France, also regulate payments made to physicians. The
PPACA also imposes excise taxes on medical device manufacturers, permitsshifting compliance environment and theuseone or more ofcomparative effectiveness researchthe requirements. Our efforts tomake Medicare coverage determinationscomply with these regulations have resulted in,certain circumstances, creates an Independent Medicare Advisory Board chargedand are likely to continue to result in, significant general and administrative expenses and a diversion of management time and attention from revenue-generating activities to compliance activities. Our failure to comply withrecommending ways to reduce the rate of Medicare spendingall these laws andchanges payment methodologies under the Medicare and Medicaid programs. All of these changes could adversely affectrequirements may harm our business andfinancialoperating results.Governments and regulatory authorities
have increased their enforcement of thesevigorously enforce healthcare fraud and abuse laws,in recent years. For example, in 2007 five competitors in the orthopaedics industry settled a Department of Justice investigation into the financial relationships and consulting agreements between the companies and surgeons. The companies agreed to new corporate compliance procedures and federal monitoring. At issue were financial inducements designed to encourage physicians to use the payor company's products exclusively and the failure of physicians to disclose these relationships to hospitals and patients. Individual states may also be investigating the relationship between healthcare providers andespecially against companies inthe orthopaedicsour industry.Many states have their own regulations governing the relationship between companies and healthcare providers.While we have not been the target of any investigations, we cannot guarantee that we will not be investigated in the future. If investigated we cannot assure that the costs of defending or resolving those investigations or proceedings would not have a material adverse effect on our financial condition, operating resultsof operationsand cash flows.Failure to obtain and maintain regulatory approval in foreign jurisdictions will prevent us from marketing our products abroad.We currently market, and intend to continue to market, our products internationally. Outside the United States, we can market a product only if we receive a marketing authorization and, in some cases, pricing approval, from the appropriate regulatory authorities. The approval procedure varies among countries and can involve additional testing, and the time required to obtain approval may differ from that required to obtain FDA clearance or approval. The foreign regulatory approval process may include all of the risks associated with obtaining FDA clearance or approval in addition to other risks. For example, in order to market our products in the Member States of the EEA, our devices are required to comply with the essential requirements of the EU Medical Devices Directives (Council Directive 93/42/EEC of 14 June 1993 concerning medical devices, as amended, and Council Directive 90/385/EEC of 20 June 2009 relating to active implantable medical devices, as amended). Compliance with these requirements entitles us to affix the CE conformity mark to our medical devices, without which they cannot be commercialized in the EEA. In order to demonstrate compliance with the essential requirements and obtain the right to affix the CE conformity mark we must undergo a conformity assessment procedure, which varies according to the type of medical device and its classification. Except for low risk medical devices (Class I), where the manufacturer can issue an EC Declaration of Conformity based on a self-assessment of the conformity of its products with the essential requirements of the Medical Devices Directives, a conformity assessment procedure requires the intervention of a Notified Body, which is an organization accredited by a Member State of the EEA to conduct conformity assessments. The Notified Body would typically audit and examine the quality system for the manufacture, design and final inspection of our devices before issuing a certification demonstrating compliance with the essential requirements. Based on this certification we can draw up an EC Declaration of Conformity, which allows us to affix the CE mark to our products.We may not obtain foreign regulatory approvals or certifications on a timely basis, if at all. Clearance or approval by the FDA does not ensure approval or certification by regulatory authorities or Notified Bodies in other countries, and approval or certification by one foreign regulatory authority or Notified Body does not ensure approval by regulatory authorities in other foreign countries or by the FDA. We may be required to perform additional pre-clinical or clinical studies even if FDA clearance or approval, or the right to bear the CE mark, has been obtained. If we fail to receivenecessary approvals to commercialize our products in foreign jurisdictions on a timely basis, or at all, our business, financial condition and results of operations could be adversely affected.Our existing xenograft-based biologics business is and any future biologics products we pursue would be subject to emerging governmental regulations that could materially affect our business.
Some of our products are xenograft, or animal-based, tissue products. Our principal xenograft-based biologics offering is Conexa reconstructive tissue matrix. All of our current xenograft tissue-based products are regulated as medical devices and are subject to the
FDA'sFDA’s medical device regulations.While we do notWe currently are planning to offerany products based on human tissue, in the future we may offer biologicsproducts based on human tissue. The FDA has statutory authority to regulate human cells, tissues and cellular and tissue-based products, or HCT/Ps. An HCT/P is a product containing or consisting of human cells or tissue intended for transplantation into a human patient, including allograft-based products. The FDA, EU and Health Canada have been working to establish more comprehensive regulatory frameworks for allograft-based, tissue-containing products, which are principally derived from cadaveric tissue.Section 361 of the Public Health Service Act, or PHSA, authorizes the FDA to issue regulations to prevent the introduction, transmission or spread of communicable disease. HCT/Ps regulated as 361 HCT/Ps are subject to requirements relating to: registering facilities and listing products with the FDA; screening and testing for tissue donor eligibility; Good Tissue Practice, or GTP, when processing, storing, labeling and distributing HCT/Ps, including required labeling information; stringent recordkeeping; and adverse event reporting. The FDA has also proposed extensive additional requirements that address sub-contracted tissue services, tracking to the recipient/patient, and donor records review. If a tissue-based product is considered human tissue, the FDA requirements focus on preventing the introduction, transmission and spread of communicable diseases to recipients. A product regulated solely as a 361 HCT/P is not required to undergo premarket clearance (510(k)) or
approval.approval (de novo or PMA).The FDA may inspect facilities engaged in manufacturing 361 HCT/Ps and may issue untitled letters, warning letters, or otherwise authorize orders of retention, recall, destruction and cessation of manufacturing if the FDA has reasonable grounds to believe that an HCT/P or the facilities where it is manufactured are in violation of applicable regulations. There also are
alsorequirements relating to the import of HCT/Ps that allow the FDA to make a decision as to the HCT/Ps'Ps’ admissibility into the United States.An HCT/P is eligible for regulation solely as a 361 HCT/P if it is: (i) minimally manipulated; (ii) intended for homologous use as determined by labeling, advertising or other indications of the
manufacturer'smanufacturer’s objective intent for a homologous use; (iii) the manufacture does not involve combination with another article, except for water, crystalloids or a sterilizing, preserving, or storage agent (not raising new clinical safety concerns for the HCT/P); and (iv) it does not have a systemic effect and is not dependent upon the metabolic activity of living cells for its primary function or, if it has such an effect, it is intended for autologous use or allogenetic use in close relatives or for reproductive use. If any of these requirements are not met, then the HCT/P is also subject to applicable biologic, device, or drug regulation under the FDCA or the PHSA. These biologic, device or drug HCT/Ps must comply both with the requirements exclusively applicable to 361 HCT/Ps and, in addition, with requirements applicable to biologics under the PHSA, or devices or drugs under the FDCA, including premarket licensure, clearance or approval.Title VII of the PPACA, the Biologics Price Competition and Innovation Act of 2009, or BPCIA, creates a new licensure framework for follow-on biologic products, which could ultimately subject our biologics business to competition to so-called
"biosimilars."“biosimilars.” Under the BPCIA, a manufacturer may submit an application for licensure of a biologic product that is"biosimilar to"“biosimilar to” or"interchangeable with"“interchangeable with” a referenced, branded biologic product. Previously, there had been no licensure pathway for sucha follow-on product. While we do not anticipate that the FDA will license a follow-on biologic for several years, given the need to generate data sufficient to demonstrate
"biosimilarity"“biosimilarity” to or"interchangeability"“interchangeability” with the branded biologic according to criteria set forth in the BPCIA, as well as the need for the FDA to implement theBPCIA'sBPCIA’s provisions with respect to particular classes of biologic products, we cannot guarantee that our biologics will not eventually become subject to direct competition by a licensed"biosimilar."“biosimilar.”Procurement of certain human organs and tissue for transplantation, including allograft tissue we may use in future products, is subject to federal regulation under the National Organ Transplant Act, or NOTA. NOTA prohibits the acquisition, receipt, or other transfer of certain human organs, including bone and other human tissue, for valuable consideration within the meaning of NOTA. NOTA permits the payment of reasonable expenses associated with the removal, transportation, implantation, processing, preservation, quality control and storage of human organs. For any future products implicating
NOTA'sNOTA’s requirements, we would reimburse tissue banks for their expenses associated with the recovery, storage and transportation of donated human tissue that they would provide tous for processing.us. NOTA payment allowances may be interpreted to limit the amount of costs and expenses that we may recover in our pricing for ourproducts,services, thereby negatively impacting our future revenue and profitability. If we were to be found to have violatedNOTA'sNOTA’s prohibition on the sale or transfer of human tissue for valuable consideration, we would potentially be subject to criminal enforcement sanctions, which could materially and adversely affect ourresults of operations.operating results. Further, in the future, if NOTA is amended or reinterpreted, we may not be able to pass these expenses on to our customers and, as a result, our business could be adversely affected.Our operations involve the use of hazardous materials, and we must comply with environmental health and safety laws and regulations, which can be expensive and may affect our business and operating results.
We are subject to a variety of laws and regulations of the countries in which we operate and distribute products, such as the
European Union, or EU,United States, France, Ireland, otherEuropeanEU nations andthe United States,other countries, relating to the use, registration, handling, storage, disposal, recycling and human exposure to hazardous materials. Liability under environmental laws can be joint and several and without regard to comparative fault, and environmental, health and safety laws could become more stringent over time, imposing greater compliance costs and increasing risks and penalties associated with violations, which could harm our business. In the EU, where our manufacturing facilities are located, we and our suppliers are subject to EU environmental requirements such as the Registration, Evaluation,AuthorisationAuthorization and Restriction of Chemicals, or REACH, regulation. In addition, we are subject to the environmental, health and safety requirements of individual European countries in which we operate such as France and Ireland. For example, in France, requirements known as the Installations Classées pour la Protection del'Environnementl’Environnement regime provide for specific environmental standards related to industrial operations such as noise, water treatment, air quality and energy consumption. In Ireland, our manufacturing facilities are likewise subject to local environmental regulations, such as related to water pollution and water quality, that are administered by the Environmental Protection Agency. We believe that we are in material compliance with all applicable environmental, health and safety requirements in the countries in which we operate and do not have reason to believe that we are responsible for any cleanup liabilities. In addition, certain hazardous materials are present at some of our facilities, such as asbestos, that we believe are managed in compliance with all applicable laws. We also arealsosubject to greenhouse gas regulations in the EU and elsewhere and we believe that we are in compliance based on present emissions levels at our facilities. Although we believe that our activities conform in all material respects with applicable environmental, health and safety laws, we cannot assure you that violations of such laws will not arise as a result of human error, accident, equipment failure, presently unknown conditions or other causes. The failure to comply with past, present or future laws, including potential laws relating to climate control initiatives, could result in the imposition of fines, third-party property damage and personal injury claims,investigation and remediation costs, the suspension of production or a cessation of operations.
In particular, in relation to our manufacturing facility located in Saint-Ismier, France, we require a formal agreement and/or authorization to discharge wastewater to the local community wastewater treatment system, or could be subject to fines, civil liability, and/or reduced throughput. As has been standard practice for business operations in the area, we believe that we obtained authorization from local authorities to connect to the wastewater discharge network at the time we first made our connection in 2003. When authority over such matters was assumed by an inter-community agency, theSyndicat Intercommunal de la Zone Verte(SIZOV), we applied for and received formal authorization as of October 28, 2010.We also expect that our operations will be affected by other new environmental and health and safety laws, including laws relating to climate control initiatives, on an ongoing basis. Although we cannot predict the ultimate impact of any such new laws, they could result in additional costs and may require us to change how we design, manufacture or distribute our products, which could have a material adverse effect on our business.Our business is subject to evolving corporate governance and public disclosure regulations that result in significant compliance costs. Our noncompliance with these regulations could have an adverse effect on our stock price.
We are subject to changing rules and regulations promulgated by a number of U.S. and Dutch governmental and self-regulated organizations, including the SEC, the NASDAQ Stock Market, the Dutch Authority for the Financial Markets and the Financial Accounting Standards Board. These rules and regulations continue to evolve in scope and complexity and many new requirements have been created, making compliance more difficult and uncertain. Our efforts to comply with these regulations have resulted in, and are likely to continue to result in, significant general and administrative expenses and a diversion of management time and attention from revenue-generating activities to compliance activities.
Risks Related to Our Intellectual Property
If our patents and other intellectual property rights do not adequately protect our products, we may lose market share to our competitors and may be unable to prevent competitors from competing against us.
We rely on patents, trade secrets, copyrights, know-how, trademarks, license agreements and contractual provisions to establish our intellectual property rights and protect our products. These legal means, however, afford only limited protection and may not adequately protect our rights. The patents we own may not be of sufficient scope or strength to provide us with any meaningful protection or commercial advantage, and competitors may be able to design around our patents or develop products that duplicate our own products or provide outcomes that are similar to ours.
U.S. patents and patent applications may be subject to interference proceedings, and U.S. patents may be subject to reexamination, inter partes review, post-grant review, derivation proceedings or other proceedings in the U.S. Patent and Trademark Office (USPTO). Foreign patents may be subject to opposition, nullity actions, or comparable proceedings in the corresponding foreign patent offices. Any of these proceedings could result in loss of the patent or denial of the patent application, or loss or reduction in the scope of one or more of the claims of the patent or patent application. Changes in either patent laws or in interpretations of patent laws may also diminish the value of our intellectual property or narrow the scope of our protection. Interference, reexamination, opposition proceedings, and invalidation actions such as nullity proceedings may be costly and time-consuming, and we, or the other parties from whom we might potentially license intellectual property, may be unsuccessful in defending against such proceedings. Thus, any patents that we own or might license may provide limited or no protection against competitors.
We cannot be certain that any of our pending patent applications will be issued. The USPTO or foreign patent offices may reject or require a significant narrowing of the claims in our pending patent applications and those we may file in the future affecting the patents issuing from such applications. We could incur substantial costs in proceedings before the USPTO and the proceedings may be time-consuming, which may cause significant diversion of effort by our technical and management personnel. These proceedings could result in adverse decisions as to the patentability or validity of claims directed to our inventions and may result in the narrowing or cancellation of claims in issued patents. Even if any of our pending or future applications are issued, they may not provide us with significant commercial protection or any competitive advantages. Our patents and patent applications cover particular aspects of our products. Other parties may develop and obtain patent protection for more effective technologies, designs or methods. If these developments were to occur, they would likely have an adverse effect on our sales. There may be prior public disclosures that could invalidate our inventions or parts of our inventions of which we are not aware. Our ability to develop additional patentable technology is also uncertain. In addition, the laws of some of the countries in which our products are or may be sold may not protect our intellectual property to the same extent as U.S. laws or at all, particularly in the field of medical products and procedures. We also may be unable to protect our rights in trade secrets and unpatented proprietary technology in these countries.
Non-payment or delay in payment of patent fees or annuities, whether intentional or unintentional, may also result in the loss of patents or patent rights important to our business. Many countries, including certain countries in Europe, have compulsory licensing laws under which a patent owner may be compelled to grant licenses to other parties. In addition, many countries limit the enforceability of patents against other parties, including government agencies or government contractors. In these countries, the patent owner may have limited remedies, which could materially diminish the value of the patent.
In the event a competitor infringes our patent or other intellectual property rights, enforcing those rights may be costly, difficult and time-consuming. Even if successful, litigation to enforce our intellectual property rights or to defend our patents against challenge could be expensive and time-consuming and could divert our management’s attention. An adverse decision in any legal action could limit our ability to assert our intellectual property rights, limit the value of our technology or otherwise negatively impact our business, financial condition and results of operations.
Monitoring unauthorized use of our intellectual property is difficult and costly. Unauthorized use of our intellectual property may have occurred or may occur in the future. Although we have taken steps to reduce the risk of this occurring, any such failure to identify unauthorized use and otherwise adequately protect our intellectual property would adversely affect our business. We may not have sufficient resources to enforce our intellectual property rights or to defend our patents or other intellectual property rights against a challenge. If we are unsuccessful in enforcing and protecting our intellectual property rights and protecting our products, it could harm our business and operating results.
Patent law can be highly uncertain and involve complex legal and factual questions for which important principles remain unresolved. In the United States and in many foreign jurisdictions, policy regarding the breadth of claims allowed in patents can be inconsistent. The U.S. Supreme Court and the Court of Appeals for the Federal Circuit have made, and will likely continue to make, changes in how the patent laws of the United States are interpreted. Patent law has recently been modified by the U.S. Congress, and future potential legislation could further change provisions of patent law. We cannot predict future changes in the interpretation of patent laws or changes to patent laws. Those changes may materially affect our patents, our ability to obtain patents or the patents and applications of our licensors. Future protection for our proprietary rights is uncertain because legal means afford only limited protection and may not adequately protect our rights or permit us to gain or keep our competitive advantage, which could adversely affect our financial condition and results of operations.
In particular, there are numerous recent changes to the U.S. patent laws and proposed changes to the rules of the USPTO that may have a significant impact on our ability to obtain and enforce intellectual property rights. For example, the Leahy-Smith America Invents Act, or the Leahy-Smith Act, was adopted in September 2011. The Leahy-Smith Act includes a number of significant changes to U.S. patent law, including provisions that affect the way patent applications will be prosecuted and may also affect patent litigation. Under the Leahy-Smith Act, the United States transitioned from a “first-to-invent” system to a “first-inventor-to-file” system for patent applications filed on or after March 16, 2013. With respect to patent applications filed on or after March 16, 2013, if we are the first to invent but not the first to file a patent application, we may not be able to fully protect our intellectual property rights and may be found to have violated the intellectual property rights of others if we continue to operate in the absence of a patent issued to us. Many of the substantive changes to patent law associated with the Leahy-Smith Act have recently become effective. Accordingly, it is not clear what, if any, impact the Leahy-Smith Act will have on the operation of our business. However, the Leahy-Smith Act and its implementation could increase the uncertainties and costs surrounding the prosecution of our patent applications and the enforcement or defense of our issued patents, all of which could have a material adverse effect on our business and financial condition.
We rely on our trademarks, trade names and brand names to distinguish our products from the products of our competitors, and have registered or applied to register many of these trademarks. However, our trademark applications may not be approved. Third parties may also oppose our trademark applications or otherwise challenge our use of the trademarks. In the event that our trademarks are successfully challenged, we could be forced to rebrand our products, which could result in loss of brand recognition and could require us to devote resources to advertising and marketing these new brands. Further, our competitors may infringe our trademarks, or we may not have adequate resources to enforce our trademarks.
In addition, we hold licenses from third parties that relate to the design and manufacture of some of our products. The loss of such licenses could prevent us from manufacturing, marketing and selling these products, which could harm our business. If we, or the other parties from whom we would license intellectual property, fail to obtain and maintain adequate patent or other intellectual property protection for intellectual property used in our products, or if any protection is reduced or eliminated, others could use the intellectual property used in our products, resulting in harm to our competitive business position.
If we are unable to protect the confidentiality of our proprietary information and know-how, the value of our technology and products could be adversely affected.
In addition to patents, we seek to protect our trade secrets, know-how and other unpatented technology, in part, with confidentiality agreements with our vendors, employees, consultants and others who may have access to proprietary information. We cannot be certain, however, that these agreements will not be breached, adequate remedies for any breach would be available or our trade secrets, know-how and other unpatented proprietary technology will not otherwise become known to or be independently developed by our competitors. We also have taken precautions to initiate safeguards to protect our information technology systems. However, these measures may not be adequate to safeguard our proprietary intellectual property and conflicts may, nonetheless, arise regarding ownership of inventions. Such conflicts may lead to the loss or impairment of our intellectual property or to expensive litigation to defend our rights against competitors who may be better funded and have superior resources. Our employees, consultants, contractors, outside clinical collaborators and other advisors may unintentionally or willfully disclose our confidential information to competitors. In addition, confidentiality agreements may not be enforced or may not provide an adequate remedy in the event of unauthorized disclosure. Enforcing a claim that a third party illegally obtained and is using our trade secrets is expensive and time-consuming, and the outcome is unpredictable. Moreover, our competitors may independently develop equivalent knowledge, methods and know-how.
Unauthorized parties also may attempt to copy or reverse engineer certain aspects of our products that we consider proprietary, and in such cases we could not assert any trade secret rights against such party. As a result, other parties may be able to use our proprietary technology or information, and our ability to compete in the marketplace would be harmed.
Some of our employees were previously employed at other medical device companies focused on the development of orthopaedic devices. We may be subject to claims that these employees or we have inadvertently or otherwise used or disclosed trade secrets or other proprietary information of their former employers. Litigation may be necessary to defend against these claims. If we fail in defending such claims, in addition to paying monetary damages, we may lose valuable intellectual property rights. Even if we are successful in defending against these claims, litigation could result in substantial costs, damage to our reputation and be a distraction to management.
Our commercial technology and any future products and services that we develop could be alleged to infringe patent rights of third parties, which may require costly litigation and, if we are not successful, could cause us to pay significant damages or limit our ability to commercialize our products.
The orthopaedic medical device industry is litigious with respect to patents and other intellectual property rights. Companies in the orthopaedic medical device industry have used intellectual property litigation to gain a competitive advantage. Non-practicing entities also have used intellectual property litigation to seek revenue from orthopaedic companies. We cannot provide assurance that our products or methods do not infringe the patents or other intellectual property rights of third parties, and as our business grows, the possibility may increase that others will assert infringement claims against us. Determining whether a product infringes a patent involves complex legal and factual issues, and the outcome of a patent litigation action is often uncertain. No assurance can be given that patents containing claims covering our products, parts of our products, technology or methods do not exist, have not been filed or could not be filed or issued. Because of the number of patents issued and patent applications filed in our technical areas, our competitors or other parties may assert that our products and the methods we employ in the use of our products are covered by U.S. or foreign patents held by them. In addition, because patent applications can take many years to issue and because publication schedules for pending applications vary by jurisdiction, there may be applications now pending of which we are unaware and which may result in issued patents that our current or future products infringe. Also, because the claims of published patent applications can change between publication and patent grant, there may be published patent applications that may ultimately issue with claims that we infringe. There could also be existing patents that one or more of our products or parts may infringe and of which we are unaware. In certain situations, we may determine that it is in our best interests to voluntarily challenge a party’s products or patents in litigation or other proceedings, including patent interferences or reexaminations.
Any legal proceeding involving patents or other intellectual property, regardless of outcome, could drain our financial resources and divert the time and effort of our management. A patent infringement suit or other infringement or misappropriation claim brought against us or any of our licensees may force us or any of our licensees to stop or delay developing, manufacturing or selling potential products that are claimed to infringe a third party’s intellectual property, unless that party grants us or any of our licensees rights to use its intellectual property. In such cases, we may be required to obtain licenses to patents or proprietary rights of others in order to continue to commercialize our products. However, we may not be able to obtain any licenses required under any patents or proprietary rights of third parties on acceptable terms, or at all. Even if we or our licensees were able to obtain rights to the third party’s intellectual property, these rights may be nonexclusive, thereby giving our competitors access to the same intellectual property. Ultimately, we may be unable to commercialize some of our potential products or may have to cease some of our business operations as a result of patent infringement claims, which could severely harm our business.
In any infringement lawsuit, a third party could seek to enjoin, or prevent, us from commercializing our existing or future products, or may seek damages from us, and any such lawsuit would likely be expensive for us to defend against. If we lose one of these proceedings, a court or a similar foreign governing body could require us to pay significant damages to third parties, seek licenses from third parties, pay ongoing royalties, redesign or rename, in the case of trademark claims, our products so that they do not infringe or prevent us from manufacturing, using or selling our products. In addition to being costly, protracted litigation to defend or prosecute our intellectual property rights could result in our customers or potential customers deferring or limiting their purchase or use of the affected products until resolution of the litigation.
From time to time, in the ordinary course of business, we receive notices from third parties alleging infringement or misappropriation of the patent, trademark or other intellectual property rights of third parties by us or our customers in connection with the use of our products. We also may otherwise become aware of possible infringement claims against us. We routinely analyze such claims and determine how best to respond in light of the circumstances existing at the time, including the importance of the intellectual property right to us and the third party, the relative strength of our position of non-infringement or non-misappropriation and the product or products incorporating the intellectual property right at issue.
If we choose to acquire new businesses, products or technologies, we may experience difficulty in the identification or integration of any such acquisition, and our business may suffer.
Our success depends on our ability to continually enhance and broaden our product and service offerings in response to changing customer demands, competitive pressures and technologies. Accordingly, we may pursue the acquisition of complementary businesses, products or technologies instead of developing them ourselves. We do not know if we will be able to identify or complete any acquisitions, or whether we will be able to successfully integrate any acquired business, product or technology or retain key employees. Integrating any business, product or technology we acquire could be expensive and time consuming, and could disrupt our ongoing business and distract our management. If we are unable to integrate any acquired businesses, products or technologies effectively, our business will suffer. In addition, any amortization or charges resulting from acquisitions could negatively impact our operating results.
Risks Relating to Our Ordinary Shares
The trading volume and prices of our ordinary shares
are likelyhave been and may continue to be volatile, which could result in substantial losses toinvestors.our shareholders.The trading volume and prices of our ordinary shares
are likelyhave been and may continue to be volatile and could fluctuate widely due to factors beyond our control. During 2013, the sale price of our ordinary shares ranged from $15.17 per share to $21.87 per share, as reported by the NASDAQ Global Select Market. This may happen because of broad market and industry factors, like the performance and fluctuation of the market prices of other companies with business operations located mainly in Europe that have listed their securities in the United States.A number of European companies have listed or are in the process of listing their securities on U.S. stock markets. The securities of some of these companies have experienced significant volatility, including price declines in connection with their initial public offerings. The trading performances of these European companies' securities after their offerings may affect the attitudes of investors toward European companies listed in the United States in general and consequently may impact the trading performance of our ordinary shares, regardless of our actual operating performance.In addition to market and industry factors, the price and trading volume for our ordinary shares may be highly volatile for factors specific to our own operations, including the following:
•- variations in our revenue, earnings and cash
flow;•- flow, and in particular variations that deviate from our projected financial information;
announcements of new investments, acquisitions, strategic partnerships or joint ventures;•announcements of newservices and expansionsproducts by us or our competitors;•announcements of divestitures or discontinuance of products or assets;changes in financial estimates by securities analysts;•additions or departures of key personnel;•releasesales oflock-upour equity securities by our significant shareholders orother transfer restrictions on our outstanding equity securitiesmanagement or sales of additional equitysecurities;•- securities by our company;
potential litigation or regulatory investigations; and•fluctuations in market prices for our products.Any of these factors may result in large and sudden changes in the volume and price at which our ordinary shares
willtrade. In the past, shareholders of a public company often brought securities class action suits against the company following periods of instability in the market price of thatcompany'scompany’s securities. If we were involved in a class action suit, it could divert a significant amount of ourmanagement'smanagement’s attention and other resources from our business and operations, which could harm our operating resultsof operationsand require us to incur significant expenses to defend the suit. Any such class action suit, whether or not successful, could harm our reputation and restrict our ability to raise capitalin the future. In addition, if a claim is successfully made against us, we may be required to pay significant damages, which could have a material adverse effect on our financial condition and
resultsoperating results.If securities or industry analysts do not publish research or reports about our business, or if they adversely change their recommendations regarding our ordinary shares, the market price for our ordinary shares and trading volume could decline.
The trading market for our ordinary shares is influenced by research or reports that industry or securities analysts publish about us or our business. If one or more analysts who cover us downgrade our ordinary shares, the market price for our ordinary shares likely would decline. If one or more of
operations.these analysts cease coverage of us or fail to regularly publish reports on us, we could lose visibility in the financial markets, which, in turn, could cause the market price or trading volume for our ordinary shares to decline.The sale or availability for sale of substantial amounts of our ordinary shares could adversely affect their market price.
Sales of substantial amounts of our ordinary shares in the public market, or the perception that these sales could occur, could adversely affect the market price of our ordinary shares and could materially impair our ability to raise capital through equity offerings in the future. We cannot predict what effect, if any, market sales of securities held by our significant shareholders or any other shareholder or the availability of these securities for future sale will have on the market price of our ordinary shares.
We are party to a registration rights agreement with certain of our shareholders and entities affiliated with our directors, including TMG Holdings Coöperatief U.A., or TMG, Vertical Fund I, L.P., Vertical Fund II, L.P. and KCH Oslo AS, which requires us to register ordinary shares held by these persons under the Securities Act, subject to certain limitations, restrictions and conditions. The market price of our ordinary shares could decline as a result of the registration and sale of or the perception that registration and sales may occur of a large number of our ordinary shares.
We are a Netherlands company, and it may be difficult for you to obtain or enforce judgments against us or our directors or executive officers in the United States.
We were formed under the laws of the Netherlands and, as such, the rights of holders of our ordinary shares and the civil liability of our directors are governed by Dutch laws and our articles of association. The rights of shareholders under the laws of the Netherlands may differ from the rights of shareholders of companies incorporated in other jurisdictions. Certain of our directors and executive officers and many of our assets and some of the assets of our directors are located outside the United States. As a result, you may not be able to serve process on us or on such persons in the United States or obtain or enforce judgments from U.S. courts against us or them based on the civil liability provisions of the securities laws of the United States. There is doubt as to whether Dutch courts would enforce certain civil liabilities under U.S. securities laws in original actions or enforce claims for punitive damages.
Under our articles of association, we indemnify and hold our directors harmless against all claims and suits brought against them, subject to limited exceptions. There is doubt, however, as to whether U.S. courts would enforce such an indemnity provision in an action brought against one of our directors in the United States under U.S. securities laws.
Rights of a holder of ordinary shares are governed by Dutch law and differ from the rights of shareholders under U.S. law.
We are a public limited liability company incorporated under Dutch law. The rights of holders of ordinary shares are governed by Dutch law and our articles of association. These rights differ from the typical rights of shareholders in U.S. corporations. For example, Dutch law does not provide for a shareholder derivative action.
We do not anticipate paying dividends on our ordinary shares.
Our articles of association prescribe that profits or reserves appearing from our annual accounts adopted by the general meeting shall be at the disposal of the general meeting. We will have power to make distributions to shareholders and other persons entitled to distributable profits only to the extent that our equity exceeds the sum of the paid and called-up portion of the ordinary share capital and the reserves that must be maintained in accordance with provisions of Dutch law or our articles of association. The profits must first be used to set up and maintain reserves required by law and must then be set off against certain financial losses. We may not make any distribution of profits on ordinary shares that we hold. The general meeting, whether or not upon the proposal of our board of directors, determines whether and how much of the remaining profit they will reserve and the manner and date of such distribution. All calculations to determine the amounts available for dividends will be based on our annual accounts, which may be different from our consolidated financial statements, Our statutory accounts to date have been prepared and will continue to be prepared under Dutch generally accepted accounting principles and are deposited with the Trade Register in Amsterdam, the Netherlands. We have not previously declared or paid cash dividends and we have no plan to declare or pay any dividends in the
pastnear future on our ordinary shares. We currently intend to retain most, if not all, of our available funds and any future earnings to operate and expand our business. In addition, our credit agreement contains covenants limiting our ability to pay cash dividends.Warburg Pincus (Bermuda) Private Equity IX, L.P. and its affiliates control 32.7% of our ordinary shares, and this concentration of ownership may have an effect on transactions that are otherwise favorable to our shareholders.
Warburg Pincus (Bermuda) Private Equity IX, L.P. and its affiliates, or Warburg Pincus, beneficially own, in the aggregate, 32.7% of our outstanding ordinary shares. These shareholders could have an effect on matters requiring our shareholders’ approval, including the election of directors. This concentration of ownership also may delay, deter or prevent a change in control, and may
inmake some transactions more difficult or impossible to complete without thefuturesupport of these shareholders, regardless of the impact of this transaction on our other shareholders. In addition, our securityholders’ agreement gives TMG Holdings Coöperatief U.A., or TMG, an affiliate of Warburg Pincus, the right to designate three directors to be nominated to our board of directors for so long as TMG beneficially owns at least 25% of our outstanding ordinary shares, two directors for so long as TMG beneficially owns at least 10% but less than 25% of our outstanding ordinary shares and one director for so long as TMG beneficially owns at least 5% but less than 10% of our outstanding ordinary shares, and we have agreed to use our reasonable best efforts to cause the TMG designees to be elected.We may experience deficiencies, including material weaknesses, in our internal control over financial reporting. Our business and our share price may be adversely affected if we do not remediate
these material weaknesses or if we have other weaknessesany deficiencies in our internal controls.Our management is responsible for establishing and maintaining adequate internal control over financial reporting. Internal control over financial reporting is a process designed to provide reasonable assurance regarding the reliability of financial reporting and the preparation of financial statements in accordance with U.S. GAAP. A material weakness, as defined in the standards established by the Public Company Accounting Oversight Board, is a deficiency, or a combination of deficiencies, in internal control over financial reporting, such that there is a reasonable possibility that a material misstatement of our annual or interim financial statements will not be prevented or detected on a timely basis.
In connection with the audit of our financial statements for 2009, we identified a material weakness in our internal control over financial reporting relating to our audited financial statements for fiscal years 2007 and 2008. Specifically, in our case, management and our independent registered accounting firm have determined that internal controls over identifying, evaluating and documenting accounting analysis and conclusions over complex non-routine transactions, including related-party transactions, required strengthening. Although we implemented initiatives aimed at addressing this material weakness, these initiatives may not remediate the identified material weakness. Our management and independent registered public accounting firm has not performed an evaluation of our internal control over financial reporting in accordance with the provisions of the Sarbanes-Oxley Act of 2002, or Sarbanes-Oxley Act. As a public company, absent an available exemption, we will be required to comply with Section 404 of the Sarbanes-Oxley Act by no later than December 31, 2011. Had we and our independent registered public accounting firm performed an evaluation of our internal control over financial reporting in accordance with the provisions of the Sarbanes-Oxley Act, additional control deficiencies may have been identified by management or our independent registered public accounting firm, and those control deficiencies could have also represented one or more material weaknesses. We cannot be certain as to when we will be able to implement the requirements of Section 404 of the Sarbanes-Oxley Act. If we fail to implement the requirements of Section 404 in a timely manner, we might be subject to sanctions or investigation by regulatory agencies such as the SEC. In addition, failure to comply with Section 404 or theA report by us of a material weakness may cause investors to lose confidence in our financial statements, and the trading price of our ordinary shares may decline. If we fail to remedy any material weakness, our financial statements may be inaccurate, our access to the capital markets may be restricted and the trading price of our ordinary shares may decline.If securities or industry analysts do not publish research or reports about our business, or if they adversely change their recommendations regarding our ordinary shares, the market price for our ordinary shares and trading volume could decline.The trading market for our ordinary shares will be influenced by research or reports that industry or securities analysts publish about us or our business. If one or more analysts who cover us downgrade our ordinary shares, the market price for our ordinary shares would likely decline. If one or more of these analysts cease coverage of us or fail to regularly publish reports on us, we could lose visibility in the financial markets, which, in turn, could cause the market price or trading volume for our ordinary shares to decline.The sale or availability for sale of substantial amounts of our ordinary shares could adversely affect their market price.Sales of substantial amounts of our ordinary shares in the public market, or the perception that these sales could occur, could adversely affect the market price of our ordinary shares and could materially impair our ability to raise capital through equity offerings in the future. We cannot predict what effect, if any, market sales of securities held by our significant shareholders or any other shareholder or the availability of these securities for future sale will have on the market price of our ordinary shares.We are party to a registration rights agreement with certain of our shareholders and officers, including TMG Holdings Coöperatief U.A., or TMG, Vertical Fund I, L.P., or VFI, Vertical Fund II, L.P., or VFII, KCH Stockholm AB, or KCH, Phil Invest ApS and Douglas W. Kohrs, which requires us to register up to 27,590,201 of our ordinary shares held by these persons under the Securities Act, subject to certain restrictions and conditions described in "Description of Ordinary Shares—Registration Rights". The market price of our ordinary shares could decline as a result of the registration of or the perception that registration may occur of a large number of our ordinary shares.We are a Netherlands company, and it may be difficult for you to obtain or enforce judgments against us or our executive officers, some of our directors and some of our named experts in the United States.We were formed under the laws of the Netherlands and, as such, the rights of holders of our ordinary shares and the civil liability of our directors will be governed by Dutch laws and our amended articles of association. The rights of shareholders under the laws of the Netherlands may differ from the rights of shareholders of companies incorporated in other jurisdictions. Some of the named experts referred to in this annual report are not residents of the United States, and certain of our directors and our executive officers and most of our assets and some of the assets of our directors are located outside the United States. As a result, you may not be able to serve process on us or on such persons in the United States or obtain or enforce judgments from U.S. courts against them or us based on the civil liability provisions of the securities laws of the United States. There is doubt as to whether Dutch courts would enforce certain civil liabilities under U.S. securities laws in original actions or enforce claims for punitive damages.Under our amended articles of association, we indemnify and hold our directors harmless against all claims and suits brought against them, subject to limited exceptions. Although there is doubt as to whether U.S. courts would enforce such provision in an action brought in the United States under U.S. securities laws, such provision could make enforcing judgments obtained outside of the Netherlands more difficult to enforce against our assets in the Netherlands or jurisdictions that would apply Dutch law.Your rights as a holder of ordinary shares will be governed by Dutch law and will differ from the rights of shareholders under U.S. law.We are a public limited liability company incorporated under Dutch law. The rights of holders of ordinary shares are governed by Dutch law and our amended articles of association. These rights differ from the typical rights of shareholders in U.S. corporations. For example, Dutch law significantly limits the circumstances under which shareholders of Dutch companies may bring an action on behalf of a company.We do not anticipate paying dividends on our ordinary shares.We have not previously declared or paid cash dividends and we have no plan to declare or pay any dividends in the near future on our ordinary shares. We currently intend to retain most, if not all, of our available funds and any future earnings to operate and expand our business. Our board of directorshas complete discretion as to whether to distribute dividends. Even if our board of directors decides to pay dividends, the form, frequency and amount will depend upon our future operations and earnings, capital requirements and surplus, general financial condition, contractual restrictions and other factors that the board of directors may deem relevant.WP Bermuda and its affiliates, a significant shareholder, control approximately 47% of our ordinary shares, and this concentration of ownership may have an effect on transactions that are otherwise favorable to our shareholders.WP Bermuda and its affiliates, or Warburg Pincus, beneficially own, in the aggregate, approximately 47% of our outstanding ordinary shares. These shareholders could have an effect on matters requiring our shareholders' approval, including the election of directors. This concentration of ownership may also delay, deter or prevent a change in control, and may make some transactions more difficult or impossible to complete without the support of these shareholders, regardless of the impact of this transaction on our other shareholders. In addition, our Securityholders' Agreement, as amended on August 27, 2010, gives TMG, an affiliate of Warburg Pincus, the right to designate three of the eight directors to be nominated to our board of directors for so long as TMG beneficially owns at least 25% of the outstanding shares, two of the eight directors for so long as TMG beneficially owns at least 10% but less than 25% of the outstanding shares and one of the eight directors for so long as TMG beneficially owns at least 5% but less than 10% of the outstanding shares, and we have agreed to use our reasonable best efforts to cause the TMG designees to be elected.ItemITEM 1B.Unresolved Staff Comments.
UNRESOLVED STAFF COMMENTSNone.
ItemITEM 2.Properties.
PROPERTIESOur global corporate headquarters are located in Amsterdam, the Netherlands.
Our U.S. headquarters are located in a
19,10056,000 square foot facility inEdina,Bloomington, Minnesota, where we conduct our principal executive, sales and marketing, and administrativeactivities.activities, along with our U.S. distribution and customer service operations. This facility is leased through2015.2022. OurU.S.OrthoHelix operations, which include research and development, marketing and distribution,andcustomer serviceoperationsand administrative functions, arebasedlocated inan owned 20,000 square foot facility in Stafford, Texas and ourMedina, Ohio. Our primary U.S. research and development operations are based in a 12,200 square foot leased facility in Warsaw,Indiana, with small satellite quality, marketing and research and development offices in Beverly, Massachusetts and San Diego, California.Indiana.Our global corporate headquarters are located in Amsterdam, the Netherlands.Outside the United States, our primary manufacturing facilities are located in MontbonnotSaint-Ismierand Grenoble, France;and Dunmanwayand Macroom, Ireland. In the 112,000 square foot Montbonnot campus, we conduct manufacturing and manufacturing support activities, sales and marketing, research and development, quality and regulatory assurance, distribution and administrative functions. In our54,900 square foot Saint-Ismier facility and 15,200 square foot Dunmanway and84,700 square foot Macroomfacilities,facility, we conduct manufacturing operations and manufacturing support such as purchasing, engineering and quality assurance functions. Our pyrocarbon manufacturing is performed at our 9,900 square foot facility in Grenoble, France. In addition, we maintain subsidiary sales offices and distribution warehouses in various countries, including France, Germany, Italy, the Netherlands, Denmark,Spain,Switzerland, United Kingdom, Belgium, Japan, Canada and Australia. We believe that our facilities are adequate and suitable for their use.Below is a summary of our material facilities:
Entity
City State/
CountryOwned or
LeasedOccupancy Square
FootageLeaseExpirationDateTornier, Inc.StaffordTexas, United StatesOwnedOffices/Warehouse/Distribution20,000Lease
Expiration
DateN/ATornier, Inc.
Bloomington Minnesota, WarsawUnited States
LeasedIndiana, United StatesOffices/Warehouse/ LeasedOffices/R&DDistribution56,000 01/01/2022 Tornier, Inc.
Warsaw Indiana,
United StatesLeased Offices/R&D 12,200 2/02/28/2015 Tornier, Inc.OrthoHelix Surgical Designs, IncMedina Ohio, United
StatesLeased Offices/Warehouse/R&D 19,500 05/31/2014 EdinaTornier SASMontbonnot France Leased Offices 15,100 05/31/2022 Minnesota, United StatesTornier SAS
MontbonnotLeasedFrance Leased Warehouse/Distribution/ Offices
19,10012/31/2015Tornier SASSt IsmierFranceLeased
19,500Offices/Manufacturing/Warehouse/Distribution54,90005/31/2022 5/29/2012Tornier SAS
Montbonnot
France
Leased
Offices/R&DOffices15,1005/29/2012Tornier SASMontbonnotFranceLeased
25,500Warehouse/Distribution/Offices19,50005/31/2022 5/29/2012Tornier SAS
Montbonnot
France
Owned 51%Leased
Manufacturing/OfficesOffices/R&D25,5005/29/2012Tornier SASMontbonnotFranceOwned 51%
51,700Manufacturing/Offices51,70009/03/2018 9/3/2018Tornier SAS
Grenoble
France
Leased
Manufacturing/Offices/
R&D
9,9007/22/2012Tornier Deutschland GmbHBurscheidGermanyOwnedSales Office1,90012/31/2021 N/ATornier Orthopedics Ireland Limited
MacroomDunmanwayIreland
LeasedOwnedManufacturing/Offices
15,200N/ATornier Orthopedics Ireland LimitedMacroomIrelandLeased
84,700Manufacturing/Offices84,70012/01/2028 12/1/2028Tornier N.V.SchiedamThe NetherlandsLeasedOffices72010/31/2012ItemITEM 3.Legal Proceedings.
LEGAL PROCEEDINGSOn October 25, 2007, twoA description of ourformer sales agents filed a complaint in the U.S. District Court for the Southern District of Illinois, alleging that we had breached their agency agreements and committed fraudulent and negligent misrepresentations. The plaintiffs, Garry Boyd of Boyd Medical, Inc. and Charles Wetherill of Addison Medical, Inc., claimed that we had intentionally set their 2007 quotas too high, in hopes that Messrs. Boyd and Wetherill would not meet the quotas so that we could terminate them for cause and install another distributor in their territories. The complaint also included allegations that we had falsely suggested to the plaintiffs that if they dropped all other product lines, we would fill the void with new product lines. The jury rendered a verdict on July 31, 2009, awarding the plaintiffs a total of $2.6 million in actual damages and $4 million in punitive damages. While the court struck the award of punitive damages on March 31, 2010, it denied our motion to set aside the verdict or order a new trial. We have filed a notice of appeal with the U.S. Court of Appeals for the Seventh Circuit in respect of the remaining actual damages.On July 7, 2010, the Company submitted its opening brief to the United States Court of Appeals for the Seventh Circuit. The Plaintiffs filed their opening briefs during August 2010. The consolidated appeal has been argued before the U.S. Court of Appeals for the Seventh Circuit. We expect a decision in the first half of 2011.We have considered the facts of the case and related case law and, based on this information, we believe that the verdict rendered on July 31, 2009 was inappropriate given the related facts and supporting legal arguments. We have been successful in striking the jury awarded punitive damages through a motion filed with the original court. We have filed a notice of appeal with the U.S. Court of Appeals for the Seventh Circuit in respect of the remaining actual damages. We have considered the progress of the case, the views of legal counsel and the facts and arguments presented at the original jury trial and the fact that we intend to vigorously defend our position through the appellate courts in assessing the probability of a loss occurring for this matter. We believe we must assess the probability of the incurrence of a loss, and the ability to reasonably estimate such loss, based on the possible outcomes of the entire legal process including the appeals process. We believe our legal appeal is strong and that the range of possible outcomes is between zero and $6.6 million. After assessing all relevant information, we do not believe there to be a reasonably estimable loss within the range of possible outcomes that is probable of occurring. As a result, we have not recorded an accrual for any loss related to this issue. We have determined that a loss is reasonably possible, and management estimates the range of loss to be between zero and $6.6 million, the amount of the initial jury verdict. We believe we have a strong defense against these claims and are vigorously contesting these allegations. As of January 2, 2011, no accrual was recorded relating to this case.In addition to the item noted above, we are subject to various otherlegal proceedingsproduct liability claims and other matters which ariseinthe ordinary courseNote 19 ofbusiness. In the opinion of management, the amount of liability, if any, with respect to these matters will not materially affectour consolidatedresults of operations orfinancialposition.statements included in this report is incorporated herein by reference.ITEM 4. MINE SAFETY DISCLOSURES
Not applicable.
Item 4. (Removed and Reserved).ItemITEM 5.Market for Registrant's Common Equity, Related Stockholder Matters and Issuer Purchases of Equity Securities.
MARKET FOR REGISTRANTS COMMON EQUITY, RELATED STOCKHOLDER MATTERS AND ISSUER PURCHASES OF EQUTIY SECURITIESOur ordinary shares
began trading on February 3, 2011are traded on the NASDAQ Global Select Market under the symbol"TRNX" in connection with our initial public offering. Prior to that, there was no public market“TRNX.” The following table sets forth, for the fiscal quarters indicated, the high and low daily per share sales prices for our ordinaryshares.Holdersshares as reported by the NASDAQ Global Select Market.High Low Fiscal year 2013
First Quarter
$ 19.58 $ 15.95 Second Quarter
$ 19.00 $ 15.28 Third Quarter
$ 19.97 $ 15.63 Fourth Quarter
$ 21.87 $ 15.17 Fiscal year 2012
First Quarter
$ 25.84 $ 17.25 Second Quarter
$ 25.91 $ 19.21 Third Quarter
$ 23.02 $ 17.15 Fourth Quarter
$ 20.49 $ 14.53 Holders
As of
January 2, 2011February 18, 2014 there were13 shareholders57 holders ofrecord.record of our ordinary shares.Dividends
We have never declared or paid any cash dividends on our ordinary shares. We currently intend to retain all future earnings for the operation and expansion of our business. We do not anticipate declaring or paying cash dividends on our ordinary shares in the foreseeable future. Any payment of cash dividends on our ordinary shares will be at the discretion of our board of directors and will depend upon our results of operations,
earnings,capital requirements, contractual restrictions and other factors deemed relevant by our board of directors. The credit agreement relating to our senior secured term loan and senior secured revolving credit facility contains covenants limiting our ability to pay cash dividends.Purchases of Equity Securities by the Company
None.
Recent Sales of Unregistered Securities
None.During the fourth fiscal quarter ended December 29, 2013, we did not issue any ordinary shares or other equity securities of our company that were not registered under the Securities Act of 1933, as amended.UseComparison of
ProceedsTotal Shareholder ReturnsThe graph below compares the cumulative total shareholder returns for the period from
Registered SecuritiesOurFebruary 3, 2011, the date of our initial public offering,or the Offering, was effected through a Registration Statement on Form S-1 (File No. 333-167370) that was declared effective by the SEC on February 2, 2011. An aggregate of 10,062,500to December 29, 2013 (our fiscal year-end), for our ordinary shares,were registered (includingan index composed of U.S. companies whose stock is listed on theunderwriters' over-allotmentNASDAQ Global Select Market (the NASDAQ U.S. Composite Index), and an index consisting of1,312,500 ordinary shares), of whichNASDAQ-listed companies in the surgical, medical and dental instruments and supplies industry (the NASDAQ Medical Equipment Subsector). For the year ended December 29, 2013, wesold 8,750,000 shares, at an initial price to the public of $19.00 per share (before underwriters' discounts and commissions). The Offering closed on February 8, 2011, and, as a result, we received net proceeds of approximately $155.4 million (after underwriters' discounts and commissions of approximately $10.8 million, but before additional offering related costs). Merrill Lynch, Pierce, Fenner & Smith Incorporated and J.P. Morgan Securities LLC were the managing underwriters of the Offering. Subsequently, on March 7, 2011, we issued an additional 721,274 ordinary shares at an offering price of $19.00 per share (before underwriters' discounts and commissions) due to the exercise of the underwriters' overallotment option. We received proceeds of approximately $12.8 million (after underwriters' discounts and commissions of approximately $0.9 million).No offering expenses were paid directly or indirectly to any of our directors or officers (or their associates) or persons owning ten percent or more of any class of our equity securities or to any other affiliates.In February 2011, we used approximately $116.1 million of the net proceeds from the offering to repay all of the outstanding indebtedness under our notes payable, including accrued interest thereon, payable of approximately €86.4 million. We expectelected to use theremaining net proceedsNASDAQ OMX Global Indices (XCMP), which was a change from prior years when we used the indexes of the Center forgeneral corporate purposes. Pending the uses described above,Research in Security Prices (CRSP). These indices were chosen because weintendbelieve they are a more appropriate benchmark against which toinvest the net proceeds in a varietymeasure our stock performance. In compliance with Item 201(e)(4) ofshort-term, interest-bearing, investment grade securities. There has been no material change in theplanned use of proceeds from the Offering from that describedSEC Regulation S-K, we are required to show graphs under both indexes in thefinal prospectus datedperiod of change. The graphs assume that $100.00 was invested on February2,3, 2011,filed by usin our ordinary shares, the NASDAQ U.S. Composite Indices and the NASDAQ Medical Equipment Subsector Indices, and that all dividends were reinvested. Total returns for the NASDAQ indices are weighted based on the market capitalization of the companies included therein. Historic stock price performance is not indicative of future stock price performance. We do not make or endorse any prediction as to future share price performance.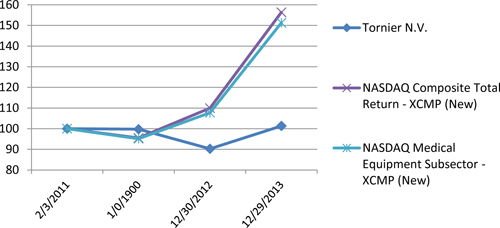
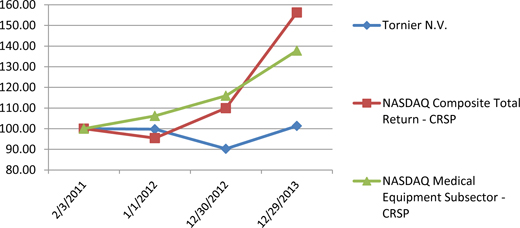
February 3,
2011January 1,
2012December 30,
2012December 29,
2013Tornier N.V.
100.00 99.72 90.25 101.33 NASDAQ U.S. Composite Index XCMP (New)
100.00 95.47 109.94 156.35 NASDAQ Medical Equipment Subsector XCMP (New)
100.00 95.14 107.74 151.26 NASDAQ U.S. Composite Index CRSP
100.00 95.44 109.95 156.26 NASDAQ Medical Equipment Subsector CRSP
100.00 106.18 115.96 137.80 The above stock performance graph shall not be deemed to be “filed” with the
SEC pursuantSecurities and Exchange Commission or subject toRule 424(b)(1).Equity Compensation Plan InformationAsthe liabilities ofJanuary 2, 2011, our equity compensation plan information wasSection 18 of the Securities Exchange Act of 1934, asfollows:amended. Notwithstanding anything to the contrary set forth in any of Tornier’s previous filings under the Securities Act of 1933, as amended, or the Securities Exchange Act of 1934, as amended, that might incorporate future filings, including this annual report on Form 10-K, in whole or in part, the above stock performance graph shall not be incorporated by reference into any such filings.Equity Compensation Plan InformationPlan categoryNumber of securities
to be issued upon
exercise of outstanding
options, warrants and
rights (in thousands)
(a)Weighted-average
exercise price of
outstanding options,
warrants and rights
(b)Number of securities
remaining available for
future issuance under
equity compensation
plans (in thousands,
excluding securities
reflected in column (a))
(c)Equity compensation plans approved by security holders
3,532 $ 17.02 1,200 Equity compensation plans not approved by security holders
0 0 0 Total
3,532 $ 17.02 1,200 ItemITEM 6.Selected Financial Data.
SELECTED FINANCIAL DATAThe following tables set forth certain of our selected consolidated financial data as of the dates and for the years indicated. The selected consolidated financial data was derived from our consolidated financial statements. The audited consolidated financial statements
audited by Ernst & Young LLP.as of December 29, 2013 and December 30, 2012, and for the three year period ended December 29, 2013 are included elsewhere in this report. The audited consolidated financial statements as of January 1, 2012, January 2, 2011 and December 27, 2009 andDecember 28, 2008, andfor the yearsthenendedare included elsewhere in this annual report. The audited consolidated financial statements as of December 31, 2007January 2, 2011 and December31, 2006 and for the periods then ended,27, 2009 are not included in thisfiling.report. Historical results are not necessarily indicative of the results to be expected for any future period.These tablesU.S. dollars are presented in thousands, except per share data.Year ended Period from
July 18, 2006
to
December 31,
2006January 2,
2011December 27,
2009December 28,
2008December 31,
2007(in thousands, except per share data) Statement of Operations Data:
Revenue
$ 227,378 $ 201,462 $ 177,370 $ 145,369 $ 46,158 Cost of goods sold
63,437 54,859 45,500 46,573 19,912 Gross profit
163,941 146,603 131,870 98,796 26,246 Sales and marketing
126,809 115,630 106,870 82,014 21,544 General and administrative
22,366 20,790 21,742 17,976 9,118 Research and development
17,896 18,120 20,635 13,305 1,730 Amortization of intangible assets
11,492 15,173 11,186 7,946 2,272 Special charges
306 1,864 — — — In-process research and development
— — — 15,107 9,649 Operating loss
(14,928 ) (24,974 ) (28,563 ) (37,552 ) (18,067 ) Interest expense
(21,582 ) (19,667 ) (11,171 ) (2,394 ) (828 ) Foreign currency transaction gain (loss)
(8,163 ) 3,003 1,701 (5,859 ) 115 Other non-operating (expense) income
43 (28,461 ) (1,371 ) (1,966 ) — Loss before income taxes
(44,630 ) (70,099 ) (39,404 ) (47,771 ) (18,780 ) Income tax benefit
5,121 14,413 5,227 6,580 2,279 Consolidated net loss
(39,509 ) (55,686 ) (34,177 ) (41,191 ) (16,501 ) Net loss attributable to noncontrolling interest
(695 ) (1,067 ) (1,173 ) — — Net loss attributable to Tornier
(38,814 ) (54,619 ) (33,004 ) (41,191 ) (16,501 ) Accretion of noncontrolling interest
(679 ) (1,127 ) (3,761 ) — — Net loss attributable to ordinary shareholders
$ (39,493 ) $ (55,746 ) $ (36,765 ) $ (41,191 ) $ (16,501 ) Weighted-average ordinary shares outstanding: basic and diluted
27,770 24,408 23,930 22,222 14,667 Net loss per share: basic and diluted
$ (1.42 ) $ (2.28 ) $ (1.54 ) $ (1.85 ) $ (1.13 ) Balance Sheet Data:
Cash and cash equivalents
24,838 $ 37,969 $ 21,348 $ 17,347 $ 8,734 Other current assets
148,376 133,179 122,167 107,968 88,911 Total assets
491,178 520,187 475,967 431,614 291,124 Total liabilities
220,939 277,140 212,442 181,738 141,426 Noncontrolling interest
— 23,259 23,200 — — Total shareholders' equity
270,239 219,788 240,325 249,876 149,698 Other Financial Data:
Net cash provided by (used in) operating activities
$ 2,889 $ 2,291 $ (19,482 ) $ (8,165 ) $ 6,116 Net cash provided by (used in) investing activities
(22,853 ) (31,104 ) (43,314 ) (106,188 ) (14,508 ) Net cash provided by (used in) financing activities
7,427 44,857 66,487 121,886 (1,829 ) Depreciation and amortization
27,038 29,732 22,331 15,582 4,919 Capital expenditures
20,525 (23,448 ) (31,622 ) (17,729 ) (4,671 ) Effect of exchange rate changes on cash and cash equivalents
(594 ) 577 310 1,080 699 TableOur fiscal year-end is generally determined on a 52-week basis and always falls on the Sunday nearest to December 31. Every few years, it is necessary to add an extra week to the year making it a 53-week period in order to have our year end fall on the Sunday nearest to December 31. For example, the year ended January 2, 2011 includes an extra week ofContentsoperations relative to the years ended December 29, 2013, December 30, 2012 and January 1, 2012. The extra week was added in the first quarter of the year ended January 2, 2011, making the first quarter 14 weeks in length, as opposed to 13 weeks in length.Year ended December 29,
2013December 30,
2012January 1,
2012January 2,
2011December 27,
2009Statement of Operations Data:
Revenue
$ 310,959 $ 277,520 $ 261,191 $ 227,378 $ 201,462 Cost of goods sold
86,172 81,918 74,882 63,437 54,859 Gross profit
224,787 195,602 186,309 163,941 146,603 Selling, general and administrative
206,851 170,447 161,448 149,175 136,420 Research and development
22,387 22,524 19,839 17,896 18,120 Amortization of intangible assets
15,885 11,721 11,282 11,492 15,173 Special charges
3,738 19,244 892 306 1,864 Operating loss
(24,074 ) (28,334 ) (7,152 ) (14,928 ) (24,974 ) Interest income
245 338 550 223 250 Interest expense
(7,256 ) (3,733 ) (4,326 ) (21,805 ) (19,917 ) Foreign currency transaction (loss) gain
(1,820 ) (473 ) 193 (8,163 ) 3,003 Loss on extinguishment of debt
(1,127 ) (593 ) (29,475 ) — — Other non-operating (expense) income, net
(45 ) 116 1,330 43 (28,461 ) Loss before income taxes
(34,077 ) (32,679 ) (38,880 ) (44,630 ) (70,099 ) Income tax (expense) benefit
(2,349 ) 10,935 8,424 5,121 14,413 Consolidated net loss
(36,426 ) (21,744 ) (30,456 ) (39,509 ) (55,686 ) Net loss attributable to noncontrolling interest
— — — (695 ) (1,067 ) Net loss attributable to Tornier
(36,426 ) (21,744 ) (30,456 ) (38,814 ) (54,619 ) Accretion of noncontrolling interest
— — — (679 ) (1,127 ) Net loss attributable to ordinary shareholders
$ (36,426 ) $ (21,744 ) $ (30,456 ) $ (39,493 ) $ (55,746 ) Weighted-average ordinary shares outstanding:
basic and diluted
45,826 40,064 38,227 27,770 24,408 Net loss per share: basic and diluted
$ (0.79 ) $ (0.54 ) $ (0.80 ) $ (1.42 ) $ (2.28 ) Balance Sheet Data:
Cash and cash equivalents
$ 56,784 $ 31,108 $ 54,706 $ 24,838 $ 37,969 Other current assets
169,741 166,210 144,166 148,376 133,179 Total assets
705,426 654,227 511,700 491,178 520,187 Total long-term debt, less current portion
67,643 115,457 21,900 109,728 92,424 Total liabilities
179,618 218,148 110,240 220,939 277,140 Noncontrolling interest
— — — — 23,259 Total shareholders’ equity
525,808 436,079 401,460 270,239 219,788 Other Financial Data:
Net cash provided by operating activities
$ 24,982 $ 14,431 $ 23,166 $ 2,889 $ 2,291 Net cash used in investing activities
(47,713 ) (125,795 ) (29,475 ) (22,853 ) (31,104 ) Net cash provided by financing activities
47,023 86,666 39,110 7,427 44,857 Depreciation and amortization
36,566 30,232 28,107 27,038 29,732 Capital expenditures
(34,630 ) (23,290 ) (26,333 ) (20,525 ) (23,448 ) Effect of exchange rate changes on cash and cash equivalents
1,384 1,100 (2,933 ) (594 ) 577 Note: The results included above as of December 30, 2012 and for the year ended December 30, 2012 include the results of OrthoHelix Surgical Designs, Inc. from October 4, 2012 (date of acquisition) to December 30, 2012.
ItemITEM 7.Management's Discussion and Analysis of Financial Condition and Results of Operations.
MANAGEMENT’S DISCUSSION AND ANALYSIS OF FINANCIAL CONDITION AND RESULTS OF OPERATIONSYou should read the following discussion of our financial condition and results of operations together with the
selected consolidated financial data,consolidated financial statements and the notes thereto included elsewhere in thisannualreport and other financial information included in thisannualreport. The following discussion may contain predictions, estimates and otherforward-looking statements that involve a number of risks and uncertainties, including those discussed under"Risk Factors"“Special Note Regarding Forward Looking Statements,” “Part 1- Item 1A. Risk Factors” and elsewhere in thisannualreport. These risks could cause our actual results to differ materially from any future performance suggested below.Overview
We are a global medical device company focused on providing solutions to surgeons that treat musculoskeletal injuries and disorders of the shoulder, elbow, wrist, hand, ankle and
foot. Wefoot, which we refer tothese surgeonsasextremity specialists.“extremity joints.” We sell to thisextremity specialist customersurgeon base a broad line of joint replacement, trauma, sports medicine and biologic products to treat extremity joints.Our motto of "specialists serving specialists" encompasses this focus.In certain international markets, we also offer joint replacement products for the hip and knee.We currently sell over 80 product lines in approximately 35 countries.We have had a tradition of innovation, intense focus on
surgeonscience and education and a commitment to the advancement oforthopaedic technologyorthopaedics in the pursuit of improved clinical outcomes for patients since our foundingapproximatelyover 70 years ago in France by René Tornier. Our history includes the introduction of the porous orthopaedic hip implant, the application of the Morse taper, which is a reliable means of joining modular orthopaedic implants, and, more recently, the introduction of thereversedstemless shoulderimplantboth inthe United States.Europe and in a U.S. clinical trial. This track record of innovationover the decadesbased on science and education stems from our close collaboration with leading orthopaedic surgeons and thought leaders throughout the world.We were acquired in 2006 by the Investor Group, who recognized the potential to leverage our reputation for innovation and our strong extremity joint portfolio as a platform upon which they could build a global company focused on the rapidly evolving upper and lower extremity specialties. The Investor Group has contributed capital resources and a management team with a track record of success in the orthopaedic industry in an effort to expand our offering in extremities and accelerate our growth. Since the acquisition in 2006, we have:•created a single, extremity specialist sales channel in the United States primarily focused on our products;•enhanced and broadened our portfolio of shoulder joint implants and foot and ankle products;•entered the sports medicine and biologics markets through acquisitions and licensing agreements;•improved our hip and knee product offerings, helping us gain market share internationally; and•significantly increased investment in research and development and expanded business development activities to build a pipeline of innovative new technologies.
We believe we are differentiated in the marketplace by our strategic focus on extremities, our full portfolio of upper and lower extremity products, and our
dedicatedextremity-focused salesorganizationorganization. We offer a broad product portfolio of over 95 extremities products that are designed to provide solutions to our surgeon customers with the goal of improving clinical outcomes for their patients. We believe a more active andour strategic focus on extremities. We further believe that we are well positioned to benefit from the opportunities in the extremity products marketplaceaging patient population with higher expectations regarding “quality of life,” an increasing global awareness of extremities solutions, improved clinical outcomes aswe are already among the global leaders in the shoulder and ankle joint replacement markets. We more recently have expanded our technology base and product offering to include: new joint replacement products based on new materials; improved trauma products based on innovative designs; and proprietary orthobiologic materials for soft tissue repair. In the United States, which is the largest orthopaedic market, we believe that our single, "specialists serving specialists" distributionchannel is strategically aligned with what we believe is an ongoing trend in orthopaedics for surgeons to specialize in certain partsa result of theanatomy or certain typesuse ofprocedures.extremities products and technological advances resulting in specific designs for extremities products that simplify procedures and address unmet needs for early interventions and the growing need for revisions and revision related solutions will drive the market for extremities products.We manage our business in one reportable segment that includes the design, manufacture, marketing and sales of orthopaedic products. Our principal products are organized in four major categories: upper extremity joints and trauma, lower extremity joints and trauma, sports medicine and biologics, and large joints and other. Our upper extremity joints and trauma products include joint replacement and bone fixation devices for the shoulder, hand, wrist and elbow. Our lower extremity joints and trauma products, which include our OrthoHelix portfolio, include joint replacement and bone fixation devices for the foot and ankle. Our sports medicine and biologics product category includes products used across several anatomic sites to mechanically repair tissue-to-tissue or tissue-to-bone injuries, in the case of sports medicine, or to support or induce remodeling and regeneration of tendons
ligaments, boneandcartilage,ligaments, in the case of biologics. Our large joints and other products include hip and knee joint replacement implants and ancillary products.Innovations in the orthopaedic industry have typically consisted of evolutions of product design in implant fixation, joint mechanics, and instruments and modifications of existing metal or plastic-based device designs rather than new products based on combinations of new designs and new materials. In contrast, the growth of our target markets has been driven by the development of products that respond to the particular mechanics of small joints and the importance of soft tissue to small joint stability and function. We are committed to the development of new designs utilizing both conventional materials and new tissue-friendly biomaterials that we expect will create new markets. We believe that we are a leader in researching and incorporating some of these new technologies across multiple product platforms.In the United States, we market and sell a broad offering of products,
from ourincluding products for upper extremity joints and trauma, lower extremity joints and trauma, and sports medicine andbiologics product categories; webiologics. We do not actively marketlargeproducts for the hip or knee, which we refer to as “large joints,” in the United States,nor doalthough wecurrentlyhaveplansclearance from the FDA todo so. While we marketsell certain large joint products. We are in the process of completing ourproductsstrategic initiative toextremity specialists,transition ourrevenue is generatedU.S. sales organization fromsales to healthcare institutions and distributors. We sell through a single sales channel consisting ofa network of independentcommission-basedsalesagencies. Internationally, whereagencies that sold our full product portfolio to a combination of direct sales teams and independent sales agencies that are individually focused on selling either upper extremity products or lower extremity products across thetrend amongterritories that they serve. This transition caused disruption in our U.S. business in 2013 and this disruption is expected to continue throughout 2014 as we continue to transition our sales representatives to focus on either upper or lower extremities products, optimize our territory structures, hire additional sales representatives to fill territories and educate and train our sales teams. We ultimately believe that this strategy will position us to leverage our sales force and broad product portfolio toward our goal of achieving above market extremities revenue growth and margin expansion over the long term by allowing us to increase the product proficiency of our sales representatives to better serve our surgeon customers and to increase and optimize our selling opportunities by improving our overall procedure coverage and providing access to new specialists, general surgeonstoward specialization is not as advanced as in the United States,and accounts.In international markets, we sell our full product portfolio, including large joints, and we utilize several distribution approaches that are tailored to the needs and requirements of each individual market. Our international sales and distribution system currently consists of 13 direct sales offices and approximately 25 distributors that sell our products in approximately 45 countries.
2013 Executive Summary
During 2013, we believe we made significant progress toward our three main strategic initiatives:
The transition of our U.S. sales organization. We spent most of 2013 transitioning our U.S. sales organization from a network of independent sales agencies that sold our full product portfolio to a combination of direct sales teams and independent sales agencies that are individually focused on selling either upper extremity products or lower extremity products across the territories that they serve. Over 85% of our U.S. revenues is now under a new agreement or transitioned to a direct sales model and over 55% of our U.S. revenues are served by direct sales teams. As we move into 2014, we expect to continue and complete the transition of our sales representatives to focus on either upper or lower extremities products, optimize our territory structures, hire additional sales representatives to fill territories and educate and train our sales teams. We believe that the transition of our U.S. sales organization will position us to leverage our sales force and broad product portfolio toward our goal of achieving above market extremities revenue growth and margin expansion over the long term.The integration of OrthoHelix. We acquired OrthoHelix in the fourth quarter of 2012 to strengthen our product portfolio of lower extremity products and gain access to a dedicated lower extremities sales force that would allow a move to dedicated upper and lower extremities sales representation. The 2013 transition of our U.S. sales organization was closely connected to the integration of many of the historical OrthoHelix distributors into our overall U.S. lower extremities sales organization. During 2013, we received CE Mark approval to sell the majority of our OrthoHelix products internationally and have since begun to selectively launch these products in certain markets, including France, Germany and the United Kingdom. In addition, we completed the integration of the OrthoHelix sales, marketing, and research and development activities into our global teams.The launch of our Aequalis Ascend Flex. We completed the limited user release and commercial launch of the Aequalis Ascend Flex convertible shoulder system during 2013. We believe that the Aequalis Ascend Flex has further strengthened our market-leading shoulder product portfolio by providing surgeons with a convertible pressed-fit reversed solution, while also expanding our addressable market for shoulder products by filling what we believe was a previous gap in this portfolio. We completed the training and education of over 150 surgeons on the Aequalis Ascend Flex during 2013 and plan to increase the number of instrument sets available to the field during 2014, both in the United States and internationally, and continue to train surgeons to further increase market acceptance.Although we believe we made great strides in our business and strategic initiatives during 2013, our financial performance was below our expectations set at the beginning of 2013, primarily as a result of the disruption experienced in our U.S. business driven by the transition of our U.S. sales organization. The following are a few highlights of our 2013 financial and operating performance:
Our revenue grew by $33.4 million, or 12.0%, to $311.0 million in 2013 from $277.5 million in 2012 primarily as a result of our acquisition of OrthoHelix, and to a lesser extent, an increase in upper extremity joints and trauma revenue primarily as a result of the continued increase in sales of our Aequalis Ascend shoulder products, including the Aequalis Ascend Flex that was launched in the third quarter of 2013. Our 2013 revenue, however, was negatively impacted by disruption in our U.S. sales channel due to our strategic initiative to establish separate sales channels that are individually focused on selling either upper extremity products or lower extremity products across the territories that they serve.Our gross margins improved to 72.3% in 2013 compared to 70.5% in 2012. Our 2013 gross margin results improved due to product cost improvements, production efficiencies and the insourcing of certain products. Additionally, our gross margin included $5.9 million of inventory fair value adjustments as a result of our acquisition of OrthoHelix and other smaller acquisitions, while our 2012 gross margin results included $2.0 million of fair value adjustments related to acquired inventory and $3.0 million product rationalization charges primarily due to product overlap with the products acquired from OrthoHelix.Although we incurred a net loss of $36.4 million for 2013 compared to a net loss of $21.7 million for 2012, our operating loss decreased to $24.1 million for 2013 from $28.3 million for 2012 driven by higher revenues and improved gross margins, partially offset by higher selling, general and administrative expenses primarily due to our U.S. sales organization transition, higher intangible amortization related to our recent acquisitions and the negative impact of the medical device excise tax.We completed the acquisitions of certain stocking distributors in Canada, Australia and the United Kingdom and certain U.S. distributors and independent sales agencies during 2013 for an aggregate purchase price of $9.9 million, plus an additional $2.5 million in contingent consideration to be paid over the next two years.We completed an underwritten public offering in May 2013 pursuant to which we sold 5.2 million ordinary shares and certain shareholders sold 2.9 million ordinary shares at a public offering price of $16.15 per share, resulting in net proceeds to us of $78.7 million, after the underwriters’ discount and commissions and offering expenses.We used $50.5 million of the net proceeds from our May 2013 public offering to pay off our $40.0 million Euro denominated term loan and a portion of our U.S. dollar denominated term loan.We recorded $3.7 million in special charges in 2013, which were primarily comprised of $7.1 million of integration and distributor transition costs and $1.2 million of legal settlements in the United States, partially offset by a $5.1 million reversal of a contingent consideration liability related to our OrthoHelix acquisition due to the under-performance of our legacy lower extremity products versus established revenue targets. We expect to record special charges in 2014 between $3.9 and $5.6 million primarily related to our ongoing integration of OrthoHelix, expected completion of our U.S. sales transitions and OrthoHelix restructuring efforts.We began and made significant progress on the implementation of an enterprise resource planning (ERP) system and our efforts will continue through 2014 and into 2015.Results of Operations
Fiscal Year Comparisons
The following table sets forth, for the periods indicated, certain items from our consolidated statements of operations and the percentage of revenue that such items represent for the periods shown.
Year ended December 29,
2013December 30,
2012January 1,
2012($ in thousands) Statements of Operations Data:
Revenue
$ 310,959 100 % $ 277,520 100 % $ 261,191 100 % Cost of goods sold
86,172 28 81,918 30 74,882 29 Gross profit
224,787 72 195,602 70 186,309 71 Selling, general and administrative
206,851 67 170,447 61 161,448 62 Research and development
22,387 7 22,524 8 19,839 8 Amortization of intangible assets
15,885 5 11,721 4 11,282 4 Special charges
3,738 1 19,244 7 892 0 Operating loss
(24,074 ) (8 ) (28,334 ) (10 ) (7,152 ) (3 ) Interest income
245 0 338 0 550 0 Interest expense
(7,256 ) (2 ) (3,733 ) (1 ) (4,326 ) (2 ) Foreign currency transaction (loss) gain
(1,820 ) (1 ) (473 ) (0 ) 193 0 Loss on extinguishment of debt
(1,127 ) (0 ) (593 ) (0 ) (29,475 ) (11 ) Other non-operating (expense) income, net
(45 ) (0 ) 116 0 1,330 1 Loss before income taxes
(34,077 ) (11 ) (32,679 ) (12 ) (38,880 ) (15 ) Income tax (expense) benefit
(2,349 ) (1 ) 10,935 4 8,424 3 Consolidated net loss
$ (36,426 ) (12 )% $ (21,744 ) (8 )% $ (30,456 ) (12 )% The following tables set forth, for the periods indicated, our revenue by product category and geography expressed as dollar amounts and the changes in revenue between the specified periods expressed as percentages:
Revenue by Product Category
Year ended Percent change December 29,
2013December 30,
2012January 1,
20122013/
20122012/
20112013/
20122012/
2011($ in thousands) (as stated) (constant
currency)*
Upper extremity joints and trauma
$ 184,457 $ 175,242 $ 164,064 5 % 7 % 5 % 9 % Lower extremity joints and trauma
58,747 34,109 26,033 72 31 72 33 Sports medicine and biologics
14,752 15,526 14,779 (5 ) 5 (5 ) 7 Total extremities
257,956 224,877 204,876 15 10 14 12 Large joints and other
53,003 52,643 56,315 1 (7 ) (2 ) 1 Total
$ 310,959 $ 277,520 $ 261,191 12 % 6 % 11 % 9 % Revenue by Geography
Year ended Percent change December 29,
2013December 30,
2012January 1,
20122013/
20122012/
20112013/
20122012/
2011($ in thousands) (as stated) (constant
currency) *United States
$ 182,104 $ 156,750 $ 141,496 16 % 11 % 16 % 11 % International
128,855 120,770 119,695 7 1 5 8 Total
$ 310,959 $ 277,520 $ 261,191 12 % 6 % 11 % 9 % * -Constant currency is a non-GAAP financial measure. We calculate constant currency percentages by converting our current-period local currency financial results using the prior-period foreign currency exchange rates and comparing these adjusted amounts to our prior-period reported results. Year Ended December 29, 2013 (2013) Compared to Year Ended December 30, 2012 (2012)
Revenue. Revenue increased by 12% to $311.0 million in 2013 from $277.5 million in 2012, primarily as a result of our acquisition and integration of OrthoHelix and growth in upper extremity joints and trauma. Foreign currency exchange rate fluctuations had a positive impact of $2.1 million in 2013. Excluding the positive impact of foreign currency exchange rate fluctuations, our revenue grew by 11% on a constant currency basis. We believe revenue in 2013 was negatively impacted by disruption in our U.S. sales channel due to our strategic initiative to establish separate sales channels that are individually focused on upper extremity products and lower extremity products.
Revenue by product category. Revenue in upper extremity joints and trauma increased by 5% to $184.5 million in 2013 from $175.2 million in 2012, primarily as a result of the continued increase in sales of our Aequalis Ascend shoulder products, including the Aequalis Ascend Flex convertible shoulder that was launched in the third quarter of 2013, and Aequalis reversed shoulder products and the Latitude EV elbow. We believe the increase in sales of our Aequalis Ascend shoulder products was due to continued market share gains and the launch of the Aequalis Ascend Flex, while the increased sales of our Aequalis reversed shoulder products resulted from continued market movement toward reversed shoulder replacement procedures. This increase was partially offset by decreased revenue from our mature shoulder products and disruption in our U.S. sales channel. Foreign currency exchange rate fluctuations had a positive impact of $0.5 million on the upper extremity joints and trauma revenue growth during 2013. Excluding the positive impact of foreign currency exchange rate fluctuations, our upper extremity joints and trauma revenue grew by 5% on a constant currency basis. We anticipate that revenue from upper extremity joints and trauma will be favorably impacted in future periods as a result of the launch of our Aequalis Ascend Flex, although we expect a certain level of cannibalization of our other mature shoulder products as a result of the launch.
Revenue in lower extremity joints and trauma increased by 72% to $58.7 million in 2013 from $34.1 million in 2012, primarily as a result of our acquisition and integration of OrthoHelix. This growth was partially offset by decreased revenue of legacy Tornier foot and ankle fixation products driven by disruption in our U.S. sales channel due to our strategic initiative to establish separate sales channels that are individually focused on upper extremity products and lower extremity products.
Revenue in sports medicine and biologics decreased 5% to $14.8 million in 2013 from $15.5 million in 2012 as growth in our suture and BioFiber products was more than offset by decreases in certain anchor products and our Conexa product. Our sports medicine and biologics products are sold by both our upper and lower extremities sales forces and were also partially impacted by the disruption in our U.S. sales channel.
Revenue from large
joints. We utilize several distribution approaches dependingjoints and other increased by 1% to $53.0 million in 2013 from $52.6 million in 2012 related primarily to growth in sales of our hip products and the positive impact of foreign currency exchange rate fluctuations, partially offset by declines in sales of our mature knee products as we transition to next generation technologies. Revenue from our large joints and other category is primarily generated in certain western European geographies which continued to experience economic pressures, negatively impacting our revenue in this category. Foreign currency exchange rate fluctuations had a positive impact of $1.5 million on our large joints and other revenue during 2013. Excluding theindividual market requirements, includingpositive impact of foreign currency exchange rate fluctuations, our large joints and other revenue decreased by 2% on a constant currency basis.Revenue by geography. Revenue in the United States increased by 16% to $182.1 million in 2013 from $156.8 million in 2012, primarily due to our acquisition and integration of OrthoHelix. Excluding the impact from OrthoHelix, our revenues in the United States decreased as a result of disruption in our U.S. sales channel due to our strategic initiative to establish separate sales channels that are individually focused on upper extremity products and lower extremity products. While we believe this transition will increase our ability to meet our customers’ needs in the future, it had a negative impact on our U.S. revenue growth and likely will continue to negatively impact U.S. revenue growth during 2014 until the initiative is complete.
International revenue increased by 7% to $128.9 million in 2013 from $120.8 million in 2012. International revenue increased due to revenue growth in France from increased demand and certain geographic expansion activities in which we increased the number of products sold through direct sales
organizationschannels in countries where we historically utilized local independent distributor representation. Our international revenue growth was partially offset by decreases in revenue in certain western European countries due to continued austerity measures and lower procedure volumes and lower sales volumes to certain stocking distributors. Foreign currency exchange rate fluctuations had a positive impact of $2.1 million on international revenue during 2013. Excluding thelargest European marketspositive impact of foreign currency exchange rate fluctuations, our international revenue increased by 5% on a constant currency basis.Cost of goods sold. Cost of goods sold increased to $86.2 million in 2013 from $81.9 million in 2012. As a percentage of revenue, cost of goods sold decreased to 28% in 2013 from 30% in 2012, primarily due to product cost improvements, production efficiencies and
independent distributorsthe insourcing of certain products. This decrease was partially offset by a higher level of excess and obsolete inventory charges and the negative impact of our geographical revenue mix. Also included in cost of goods sold in 2013 is approximately $5.9 million in fair value adjustments related to inventory acquired in our acquisition of OrthoHelix compared to $2.0 million in fair value adjustments related to acquired inventory and $3.0 million related to product rationalization charges in 2012 as a result of our acquisition of OrthoHelix. We intend to continue to focus on improving our cost of goods sold as a percentage of revenue through a combination of manufacturing efficiencies, additional in-sourcing activities and improved product mix. However, our cost of goods sold and corresponding gross profit as a percentage of revenue can be expected to fluctuate in future periods depending upon certain factors, including, among others, changes in our product sales mix and prices, distribution channels and geographies, manufacturing yields, plans formost other international markets. In 2010, we generatedinsourcing some previously outsourced production activities, inventory reserves required, levels of production volume and fluctuating inventory costs due to changes in foreign currency exchange rates since the period they were manufactured. The fair value adjustment charges recorded as cost of goods sold from the sell through of inventory acquired from business acquisitions is expected to decline in future periods from the levels experienced in 2013 as all fair value adjustment charges related to the OrthoHelix acquired inventory have been fully recognized.Selling, general and administrative. Our selling, general and administrative expenses increased by 21% to $206.9 million in 2013 from $170.4 million in 2012 primarily as a result of our acquisition of OrthoHelix. As a percentage of revenue, selling, general and administrative expenses were 67% and 61% in 2013 and 2012, respectively. The increase in selling, general and administrative expense as a percentage of
$227.4 million, 56%revenue was primarily a result ofwhich washigher variable sales expenses and non-variable sales expenses related to the establishment of direct sales channels in the United States and44%several countries internationally, higher investments in sales training and education, an increase in expense related to information technology infrastructure and $3.2 million of expense related to the medical device excise tax which became effective in 2013. We expect selling, general and administrative expenses as a percentage of revenue to be higher than historical levels in the near term until we experience the anticipated revenue benefits of our U.S. sales channel transitions, integration initiatives, investments in sales resources, training and education, and new product launches, including the Aequalis Ascend Flex.Research and development. Research and development expenses decreased slightly to $22.4 million in 2013 from $22.5 million in 2012. As a percentage of revenue, research and development expenses decreased 1% to 7% in 2013 from 8% in 2012. The decrease in total research and development expense of $0.1 million was primarily due to lower spending due to the timing of certain development projects, partially offset by our acquisition of OrthoHelix.
Amortization of intangible assets. Amortization of intangible assets increased $4.2 million to $15.9 million in 2013 from $11.7 million in 2012. The increase in amortization expense was primarily attributable to an increase in intangible assets due to our acquisition of OrthoHelix.
Special charges. We recorded $3.7 million in special charges in 2013 compared to $19.2 million in 2012. The $3.7 million in special charges for 2013 were primarily comprised of $7.1 million of integration and distributor transition costs and $1.2 million of legal settlements in the United States, partially offset by a $5.1 million reversal of a contingent consideration liability related to our OrthoHelix acquisition due to the under-performance of legacy Tornier lower extremity products versus established revenue targets. Special charges in 2012 included approximately $6.4 million of expense related to our facilities consolidation initiative, $4.7 million of intangible impairment charges, $3.5 million of integration costs related to our acquisitions of OrthoHelix and our exclusive stocking distributor in Belgium and Luxembourg, $2.0 million of bad debt expense related to the termination of a distributor and worsening general economic conditions in Italy, $1.4 million of expense related to distributor transition costs in the United States and internationally, and $1.2 million of expense related to management exit costs including the departures of our former Chief Executive Officer and Global Chief Financial Officer. We expect to record special charges in 2014 between $3.9 and $5.6 million primarily related to our ongoing integration of OrthoHelix, expected completion of our U.S. sales transitions and OrthoHelix restructuring efforts. See Note 18 to our consolidated financial statements for further detail on special charges.
Interest income. Our interest income was immaterial for both 2013 and 2012.
Interest expense. Our interest expense increased to $7.3 million in 2013 from $3.7 million in 2012 due primarily to the establishment of our credit facility which was
international.We have significantly grown our business sinceused to fund our acquisition of OrthoHelix in the fourth quarter of 2012. In addition, interest expense was higher due to the accretion of interest expense related to OrthoHelix earn-out liabilities. We expect to continue to experience interest expense related to our credit agreement; however, in the second quarter of 2013, we repaid our $40.0 million Euro denominated term loan in full and repaid approximately $10.5 million of principal on our U.S. dollar denominated term loan, which we expect will reduce our future interest expense during 2014 from levels incurred in the first half of 2013.Foreign currency transaction loss. We recognized $1.8 million of foreign currency transaction loss in 2013 compared to a $0.5 million foreign currency transaction loss in 2012. Foreign currency gains and losses are recognized when a transaction is denominated in a currency other than the subsidiary’s functional currency. The increase in foreign currency transaction loss was primarily attributable to foreign currency exchange rate fluctuations on foreign currency denominated intercompany payables and receivables.
Loss on extinguishment of debt.We recorded $1.1 million in loss on extinguishment of debt for 2013 related to the write-off of a debt discount on the repayment of our Euro denominated term loan. This compared to $0.6 million in loss on extinguishment of debt in 2012 as a result of penalties incurred upon repayment of certain portions of our previously existing European debt. We were required to repay all existing debt in 2012 prior to entering into the senior secured term loans that were used to finance our acquisition of OrthoHelix.
Other non-operating (expense) income. Our other non-operating income was immaterial for both 2013 and 2012.
Income tax (expense) benefit. We recorded income tax expense of $2.3 million during 2013 compared to an income tax benefit of $10.9 million for 2012. Our effective tax rate for 2013 and 2012 was (6.9)% and 33.5%, respectively. The change in our effective tax rate from 2012 to 2013 primarily relates to the impact of a $10.4 million tax benefit from the reversal of valuation allowance related to the OrthoHelix acquisition and the relative percentage of our pre-tax income generated from operations in countries with related income tax expense compared to operations in countries in which we have pre-tax losses but for which we record a valuation allowance against our deferred tax assets, and thus, cannot recognize income tax benefits. In addition, we recorded $1.0 million of income tax expense to establish a valuation allowance for deferred tax assets related to foreign stock-based compensation during 2013. We determined the tax planning strategies necessary to realize these deferred tax assets were no longer prudent, and as a result, we no longer believed these deferred tax assets were realizable. Given our history of operating losses, we do not generally record a provision for income taxes in the United States and certain of our European geographies.
Year Ended December 30, 2012 (2012) Compared to Year Ended January 1, 2012 (2011)
Revenue. Revenue increased by 6% to $277.5 million in 2012 from $261.2 million in 2011 as a result of increased sales in all of our extremities categories, partially offset by a decrease in sales of large joints and other due primarily to the negative impact of foreign currency exchange rates. The growth experienced in the extremities categories was driven primarily by increased demand, product expansion and our acquisition of OrthoHelix. Excluding the negative impact of foreign currency exchange rate fluctuations of approximately $8.1 million, principally due to the performance of the U.S. dollar against the Euro, our revenue grew by 9% on a constant currency basis.
Revenue by product category. Revenue in upper extremity joints and trauma increased by 7% to $175.2 million in 2012 from $164.1 million in 2011 primarily as a result of an increase in sales of our Aequalis reversed and Aequalis Ascend shoulder products, and to a lesser degree, our Simpliciti shoulder products. We believe that increased sales of our Aequalis reversed shoulder products resulted from market growth in shoulder replacement procedures and market movement towards reversed shoulder replacement procedures. We also saw an increase in sales of our Aequalis Ascend shoulder products which gained share in the shoulder replacement market. Included in the upper extremity joints and trauma revenue for 2012 was $0.2 million of incremental revenue from our acquisition of OrthoHelix. Offsetting these increases was the negative impact of foreign currency exchange rate fluctuations of $3.4 million. Excluding the impact of foreign currency exchange rate fluctuations, revenue in upper extremity joints and trauma increased by 9% on a constant currency basis.
Revenue in our lower extremity joints and trauma increased by 31% to $34.1 million in 2012 from $26.0 million in 2011 primarily due to $7.8 million in incremental revenue from our acquisition of OrthoHelix.
Revenue in sports medicine and biologics increased by 5% to $15.5 million in 2012 from $14.8 million in 2011, which was primarily attributable to increased sales of our anchor and suture products internationally, partially offset by a decrease in revenue of our biologics products, primarily our Conexa product.
Revenue from large joints and other decreased by 7% to $52.6 million in 2012 from $56.3 million in 2011 primarily related to negative foreign currency exchange rate fluctuations of $4.0 million. Excluding the impact of foreign currency exchange rate fluctuations, our large joints and other product revenue increased 1% on a constant currency basis.
Revenue by geography. Revenue in the United States increased by 11% to $156.8 million in 2012 from $141.5 million in 2011. While U.S. revenue was negatively impacted by certain U.S. sales channel changes during 2012, overall U.S. revenue increased as a result of incremental revenue from our OrthoHelix acquisition and increases in sales in upper extremity joints and trauma products. Included in the U.S. revenue was $8.0 million in incremental revenue from our OrthoHelix acquisition.
International revenue increased slightly to $120.8 million in 2012 from $119.7 million in 2011. International revenue was negatively impacted by foreign currency exchange rate fluctuations of approximately $8.1 million, principally due to the performance of the U.S. dollar against the Euro. Excluding the impact of foreign currency exchange rate fluctuations, our international revenue grew by 8% on a constant currency basis. This increase was primarily due to increased revenue in Australia, the United Kingdom and the Netherlands as a result of increased demand.
Cost of goods sold. Our cost of goods sold increased by 9% to $81.9 million in 2012 from $74.9 million in 2011. As a percentage of revenue, cost of goods sold increased to 30% in 2012 from 29% in 2011, primarily as a result of approximately $2.0 million in fair value adjustments related to inventory acquired in our acquisitions of OrthoHelix and our acquisition of our exclusive stocking distributor in Belgium and Luxembourg.
Selling, general and administrative. Our selling, general and administrative expenses increased by 6% to $170.4 million in 2012 from $161.4 million in 2011. As a percentage of revenue, selling, general and administrative expenses remained consistent at 62% in 2012 and 2011. The increase in total selling, general and administrative expenses was primarily a result of $3.4 million of additional variable selling expenses including commissions, royalties and freight expenses due to increased revenue. Selling, general and administrative expenses also increased as a result of increased instrument depreciation, sales management costs and costs related to information technology, partially offset by a decrease in expenses related to certain management incentives. These items were partially offset by the
Investor Groupfavorable impact of foreign currency exchange rate fluctuations of $6.1 million.Research and development. Research and development expenses increased by 14% to $22.5 million in
July 2006. Since2012 from $19.8 million in 2011. As a percentage of revenue, research and development expenses remained consistent during 2012 and 2011 at 8%. The increase in research and development expense of $2.7 million was primarily due to increased clinical study related expenses, an increased level of expenses on certain shoulder related development projects, including the Aequalis Ascend Flex convertible shoulder system, certain biologics related development projects and increased personnel related expenses. These items were partially offset by the favorable impact of foreign currency exchange rate fluctuations of $0.8 million and a decrease in expenses related to certain management incentives.Amortization of intangible assets. Amortization of intangible assets increased by 4% to $11.7 million in 2012 from $11.3 million in 2011, primarily as a result of the amortization of intangible assets recorded through our acquisition of OrthoHelix and our acquisition of our exclusive stocking distributor in Belgium and Luxembourg in 2012, partially offset by the complete amortization of certain license related intangible assets that were fully amortized in 2011.
Special charges. Special charges were $19.2 million in 2012 compared to $0.9 million in 2011. Special charges in 2012 included approximately $6.4 million of expense related to our facilities consolidation initiative, $2.0 million of bad debt expense related to the termination of a distributor and worsening general economic conditions in Italy, $1.4 million of expense related to certain distribution changes in the United States and internationally, $3.5 million of integration costs related to our acquisitions of OrthoHelix and our exclusive stocking distributor in Belgium and Luxembourg, $1.2 million of expense related to management exit costs including the departures of our former Chief Executive Officer and Global Chief Financial Officer and $4.7 million of intangible impairment charges. For 2011, the $0.9 million of special charges were primarily related to severance costs from certain management organizational changes.
Interest income.Our interest income decreased by 38% to $0.3 million in 2012 from $0.6 million in 2011, primarily as a result of lower average levels of cash held and decreased average interest rates in 2012 compared to 2011.
Interest expense. Our interest expense decreased by 14% to $3.7 million in 2012 from $4.3 million in 2011 due primarily to the repayment of our notes payable in February 2011. Our interest expense for 2012 related primarily to the interest paid on our term loans, mortgages, and prior lines of credit and overdraft arrangements.
Foreign currency transaction (loss) gain. We recognized $0.5 million of foreign currency transaction losses in 2012 compared to $0.2 million of foreign currency transaction gains in 2011. Foreign currency gains and losses are recognized when a transaction is denominated in a currency other than the subsidiary’s functional currency and are primarily attributable to foreign currency exchange rate fluctuations on foreign currency denominated intercompany payables and receivables.
Loss on extinguishment of debt.We recognized a $0.6 million loss on the extinguishment of debt in 2012 as a result of penalties incurred upon repayment of certain portions of our European debt. We were required to pay-off all existing debt in 2012 prior to entering into the senior secured term loans that were used to finance our acquisition of OrthoHelix. See Note 8 to our consolidated financial statements for further details. In 2011, we recognized a $29.5 million loss on extinguishment of debt due to the repayment of our notes payable. Our notes payable were issued in 2008 and 2009 together with warrants to purchase ordinary shares of our company. At the time of issuance, we recognized the estimated fair value of the warrants as a warrant liability with an offsetting debt discount to reduce the carrying value of the notes payable to the estimated fair value at the time of issuance. This debt discount was then amortized as additional interest expense over the term of the notes. At the time of repayment in the first quarter of 2011, we recognized the remaining unamortized portion of the discount as a loss on the extinguishment of debt.
Other non-operating income. Our other non-operating income decreased to $0.1 million in 2012 from $1.3 million in 2011. The $1.3 million in 2011 was primarily due to the recognition of a gain related to the resolution of our contingent liability recorded as a part of our acquisition of C2M Medical Inc.
Income tax (expense) benefit.Our effective tax rate was 33.5% in 2012 and 21.6% in 2011. The change in our effective tax rate from 2011 to 2012 primarily related to the relative percentage of our pre-tax income from operations in countries with related income tax expense compared to operations in countries in which we have
built an extremities focused businesspre-tax losses but for which we record a valuation allowance against deferred tax assets, and thus, cannot recognize income tax benefits. In connection with our acquisition of OrthoHelix in 2012, we recorded deferred tax liabilities of $11.9 million, which included $10.7 million related to amortizable intangible assets and $1.2 million related to indefinite-lived acquired in-process research and development. The deferred tax liabilities of $10.7 million related to the amortizable intangibles reduced our net deferred tax assets by a like amount and in a manner thatoffersprovides predictable future taxable income over the asset amortization period. As abroad range of products to a focused group of specialty surgeons. We believe this strategyresult, we reduced our pre-acquisition deferred tax asset valuation allowance in 2012 by $10.7 million, which has been reflected as an income tax benefit in our consolidated statements of operations. Although theprimary factordeferred tax liability of $1.2 million related to acquired in-process research and development also reduced our net deferred tax assets by a like amount, it did so inenablinga manner that did not provide predictable future taxable income because the related asset was indefinite-lived. Therefore, the deferred tax asset valuation allowance was not reduced as a result of this item. As a result, ourrevenue growth from 2006income tax benefit increased to2010. During that time we also increased our operating expenses significantly. We have strategically invested with particular emphasis on product development, acquisition$10.9 million in 2012 compared to an income tax benefit ofstrategic products and technologies and sales commissions to support both current and future growth. While we experienced operating losses during 2010, we also believe the investments made will allow us to grow our revenue at rates exceeding our expected growth$8.4 million inoperating expenses in the future.2011.Foreign Currency Exchange Rates
A substantial portion of our business is located outside the United States, and as a result, we generate revenue and incur expenses denominated in currencies other than the U.S. dollar. As a result, fluctuations in the value of foreign currencies relative to the U.S. dollar can impact our operating results. The majority of our operations denominated in currencies other than the U.S. dollar are denominated in Euros. In
2010, 20092013 and2008,2012, approximately44%, 44%41% and49%44%, respectively, of oursales wererevenue was denominated in foreign currencies. As a result, our revenue can be significantly impacted byfluctuations in foreign currency exchange rates. We expect that foreign currencies will continue to represent a similarly significant percentage of our
salesrevenue in the future. Selling, marketing and administrative costs related to these sales are largely denominated in the same foreign currencies, thereby limiting our foreign currency transaction risk exposure. In addition, we also have significant levels of other selling, general and administrative expenses and research and development expenses denominated in foreign currencies. We, therefore, believe that the risk of a significant impact on our earnings from foreign currency fluctuations ismitigated. However, amitigated to some extent.A substantial portion of the products we sell in the United States are manufactured in countries where costs are incurred in Euros. Fluctuations in the Euro to U.S. dollar exchange rate will have an impact on the cost of the products we manufacture in those countries, but we would not likely be able to change our U.S. dollar selling prices of those same products in the United States in response to those cost fluctuations. As a result, fluctuations in the Euro to U.S. dollar exchange rates could have a significant impact on our gross profit in
the future.Basis of PresentationOur fiscal year-endfuture periods in which that inventory isgenerally determined on a 52-week basis and always falls on the Sunday nearest to December 31. Every few years, it is necessary to add an extra week to the year making it a 53-week periodsold. Impacts associated with fluctuations inorder to have our year end fall on the Sunday nearest to December 31. For example, the year ended January 2, 2011 includes an extra week of operations relative to the years ended December 27, 2009 and December 28, 2008. For purposes of this management's discussion and analysis of financial condition and results of operations, references to:•2010 and our 2010 fiscal year refer to the fiscal year ended January 2, 2011;•2009 and our 2009 fiscal year refer to the fiscal year ended December 27, 2009;•2008 and our 2008 fiscal year refer to the fiscal year ended December 28, 2008;
Recent AcquisitionsC2M Medical, Inc., or C2M Medical.On March 26, 2010, we exercised our option to acquire 100% of the stock of C2M Medical, a medical device development company based in San Antonio, Texas, focused on the sports medicine market. C2M Medical developed the Piton Knotless Anchor, an advanced arthroscopic technology for rotator cuff repair. In 2008, we signed a license agreement with C2M Medical for exclusive worldwide rights to the Piton, along with an option to acquire the company. C2M Medical was determined to be a variable interest entity and was consolidated by us beginning in 2008 upon signing the initial license agreement. Refer to Note 14 of our consolidated financial statements for further information regarding the accounting for C2M Medical.RevenueWe derive our revenue from the sale of medical devices that are used by surgeons who treat diseases and disorders of extremity joints including the shoulder, elbow, wrist, hand, ankle and foot. We report our sales in four primary product categories: upper extremity joints and trauma, lower extremity joints and trauma, sports medicine and biologics, and large joints and other. Our revenue is generated from sales to two types of customers: healthcare institutions and distributors, with healthcare institutions representing a majority of our revenue. We utilize a network of independent sales agencies for sales in the United States and a combination of employee sales representatives, independent sales agencies and distributors for sales outside the United States. Revenue from sales to healthcare institutions is recognized at the time of surgical implantation. We generally record revenue from sales to our distributors at the time the product is shipped to the distributor. Distributors, who sell the products to their customers, take title to the products and assume all risks of ownership at the time of shipment. Our distributors are obligated to pay within specified terms regardless of when, if ever, they sell the products. We charge our customers for shipping and record shipping revenue as part of revenue.Cost of Goods SoldWe manufacture a majority of the products that we sell. Our cost of goods sold consists primarily of direct labor, allocated manufacturing overhead, raw materials and components, and excludes amortization of intangible assets, which is presented as a separate component of operating expenses. A portion of the products we sell are manufactured by third parties, and our cost of goods sold for those products consists primarily of the price invoiced by our third-party vendors. Cost of goods sold also includes share-based compensation expenses related to individuals whose salaries are also included within this category. A majority of our current manufacturing facilities are located in Europe and the related manufacturing costs are incurred in Euro. As a result, the cost of goods sold for our products sold in the United States that were manufactured in Europe is subject toforeign currency exchangerate fluctuations.rates are discussed in more detail under “Item 7A. Quantitative and Qualitative Disclosures about Market Risk.”Sales and MarketingOur variable selling costs consist primarily of commissions paid to our independent sales agencies used in the United States and some other countries to generate sales, royalties based on certain product sales and freight expense we pay to ship our products to customers. Our non-variable sales and marketing costs consist primarily of salaries, personnel costs, including share-based compensation and other support costs related to the selling, marketing and support of our products as well as trade shows, promotions and physician training. Sales and marketing expenses also include the cost of distributing our products, which includes the operating costs and certain administrative costs related to our various worldwide sales and distribution operations.Weprovide surgical instrumentation to our customers for use during procedures involving our products. There are no contractual arrangements related to our customers' use of our surgical instrumentation and we do not charge a fee for providing access to the related instrumentation. We record surgical instrumentation on our balance sheet as a long-lived asset. The depreciation expense related to our surgical instrumentation is included in sales and marketing expenses.General and AdministrativeGeneral and administrative expenses consist of expenses for our executive, finance, legal, compliance, administrative, information technology and human resource departments. General and administrative expenses also include share-based compensation expense related to individuals within these departments.Research and DevelopmentResearch and development expenses include costs associated with the design, development, testing, deployment and enhancement of products and certain regulatory costs. This category also includes costs associated with the design and execution of our clinical trials and regulatory submissions. Research and development expenses also include share-based compensation related to individuals within our research and development groups.Amortization of Intangible AssetsAmortization expense for intangible assets includes purchased developed technology, customer relationships and intellectual property, including patents and license rights.Special ChargesSpecial charges consist of certain severance, lease termination and moving costs related to the consolidation of our U.S. facilities during 2009 and 2010. Special charges also include legal andconsulting costs related to establishing new sales and distribution subsidiaries in the United Kingdom and Denmark.Interest ExpenseInterest expense reflects interest associated with both our notes payable and other long-term and short-term debt. Our notes payable accrue paid-in-kind interest at a rate of 8% annually. Our notes payable were also issued together with warrants to purchase our ordinary shares. The estimated fair value of the warrants at the date of issuance was recorded as a discount to the related notes payable. The debt discount is accreted as additional interest expense to the par value of the notes payable over the related term. We also incur interest expense at varying rates of interest on various revolving lines of credit, secured and unsecured term loans and other mortgage-related debt.Foreign Currency Transaction Gain (Loss)Foreign currency transaction gain (loss) consists primarily of foreign currency gains and losses on transactions denominated in a currency other than the functional currency of the related entity. Our foreign currency transactions primarily consist of foreign currency denominated cash, liabilities and intercompany receivables and payables.Other Non-operating (Expense) IncomeOther non-operating (expense) income primarily relates to losses incurred in the revaluation of our warrant liabilities to fair value as well as other expenses not related to the operations of the business.Income Tax BenefitIncome tax benefit includes federal income taxes, income taxes in foreign jurisdictions, state income taxes and changes to our deferred taxes and deferred tax valuation allowance.Results of OperationsFiscal Year ComparisonsThe following table sets forth, for the periods indicated,evaluate our results of operationsexpressedon both an as reported and apercentage of revenue.Year ended January 2,
2011December 27,
2009December 28,
2008Revenue
100 % 100 % 100 % Cost of goods sold
28 27 26 Gross profit
72 73 74 Operating expenses:
Selling and marketing
56 57 60 General and administrative
10 10 12 Research and development
8 9 12 Amortization of intangible assets
5 8 6 Special charges
— 1 — Operating loss
(7 )% (12 )% (16 )% constant currency basis. The
following tables set forth, for the periods indicated, our revenue by product category and geography expressed as dollar amounts and the changes in revenue between the specified periods expressed as percentages:Revenue by Product CategoryYear ended Percent change January 2,
2011December 27,
2009December 28,
20082010/
20092009/
20082010/
20092009/
2008($ in thousands) (as stated) (constant
currency)Upper extremity joints and trauma
$ 139,175 $ 125,454 $ 108,829 11 % 15 % 11 % 17 % Lower extremity joints and trauma
23,629 20,417 18,167 16 % 12 % 16 % 13 % Sports medicine and biologics
13,210 6,593 2,513 100 % 162 % 101 % 162 % Total extremities
176,014 152,464 129,509 15 % 18 % 16 % 18 % Large joints and other
51,364 48,998 47,861 5 % 2 % 9 % 7 % Total
$ 227,378 $ 201,462 $ 177,370 13 % 14 % 14 % 16 % Revenue by GeographyYear ended Percent change January 2,
2011December 27,
2009December 28,
20082010/
20092009/
20082010/
20092009/
2008($ in thousands) (as stated) (constant
currency)United States
$ 127,762 $ 112,588 $ 91,106 13 % 24 % 13 % 24 % International
99,616 88,874 86,264 12 % 3 % 15 % 8 % Total
$ 227,378 $ 201,462 $ 177,370 13 % 14 % 14 % 16 % Fiscal Year Ended January 2, 2011 Compared to Fiscal Year Ended December 27, 2009Revenue.Revenue increased by 13% to $227.4 million in 2010 from $201.5 million in 2009 asconstant currency presentation is aresult of increased sales in each of our product categories, with the most significant dollar increase occurring in our upper extremity joints and trauma category. Fiscal year 2009 included a revenue reversal of approximately $1.3 million related to the repurchase of inventory from a stocking distributor in 2009 that was terminated as part of our launch of a direct sales subsidiary in the United Kingdom. We have also experienced an increase in sales in our sports medicine and biologics categories as we continue to focus on our distribution efforts in this market. Our overall revenue growth of 13% consisted of 13% growth in the United States and 12% growth in our international geographies. Our revenue was negatively impacted by foreign currency fluctuations of approximately $2.8 million during 2010. Revenue also increased over 2009 due to five extra selling days of operations included in 2010. Our global revenue growth, excludingnon-GAAP financial measure, which excludes the impact offoreign currencyfluctuationsfor 2010, was 14%.Revenue by product category.Revenue in upper extremity joints and trauma product category increased by 11% to $139.2 million in 2010 from $125.5 million in 2009 primarily as a result of the continued increase in sales of our Aequalis, Affiniti and Ascend shoulder products. We believe that increased sales of our Aequalis shoulder resulted from continued market growth in shoulder replacement procedures and further market acceptance of our reversed shoulder joint replacement products. We have also seen an increase in sales in our Affiniti shoulder products, which were launched at the end of 2008. Revenue in our lower extremity joints and trauma increased by 16% to $23.6 million for 2010 from $20.4 million for 2009, primarily due to increased sales in our foot andankle fixation products in both the United States and internationally. We continue to focus our U.S. distribution network on selling our full range of products and have increased the number of products available internationally. Revenue in sports medicine and biologics increased by 100% to $13.2 million for 2010 from $6.6 million for 2009. This increase was attributable to an increase in sales of our Piton products, as well as an increase in sales of our Conexa product, which was in initial launch during the first quarter of 2009. Fiscal year 2010 also included revenue from our ArthroTunneler, which was launched during the second half of 2009. Revenue from large joints and other increased by 5% to $51.4 million for 2010 from $49.0 million for 2009. Our large joint and other revenue increase was primarily due to an increased level of sales to international stocking distributors as we continue to expand our geographic footprint, continued growth of our core hip products internationally and the existence of an extra week in 2010, offset by approximately $2.2 million of unfavorable impacts from changes in foreign currency exchange rates.Revenue by geography.Revenue in the United States increased by 13% to $127.8 million in 2010 from $112.6 million in 2009, primarily driven by continued increase in sales in upper extremities joints and trauma products, together with a significant increase in sales in sports medicine and biologics products with the launch of Conexa and the ArthroTunneler and as our distribution focus on this category increased. Revenue from 2010 was also favorably impacted by the extra week during the year compared to 2009. International revenue increased by 12% to $99.6 million in 2010 from $88.9 million in 2009. Our international revenue was negatively impacted by approximately $2.8 million in 2010 as a result of foreign currency fluctuations, principally due to the performance of the Euro against the U.S. dollar. Excluding the impact of the change in currency exchange rates, our international revenue increased by 15% in 2010, primarily due to the launch of our United Kingdom sales office in the first quarter of 2010, increased revenue in France, Spain, and Australia, and the existence of an extra fiscal week in 2010. Fiscal year 2009 was also negatively impacted by approximately $1.3 million from the repurchase of inventory previously discussed.Cost of goods sold.Our cost of goods sold increased by 16% to $63.4 million in 2010 from $54.9 million in 2009. As a percentage of revenue, cost of goods sold increased to 28% in 2010 from 27% in 2009. We have intentionally increased our manufacturing overhead costs in an effort to establish a sufficient level of capacity and manufacturing infrastructure to support our current and future growth plans. Our manufacturing overhead costs have grown at a rate faster than our factory output in recent years, causing an increase in the fully absorbed cost of our products. However, we believe this has allowed us to establish an infrastructure that will be able to sustain our sales growth and has increased our ability to leverage our costs in the future. Our gross profit as a percentage of revenue was impacted by a change in relative mix of our fourth quarter revenue between our European distributor business and our U.S. business, resulting in less high-margin sales in the United States, as a percentage of total sales, and more low-margin sales from certain stocking distributors. This impact was partially offset by a lower level of inventory obsolescence. Our cost of goods sold and corresponding gross profit as a percentage of revenue can be expected to fluctuate in future periods depending upon changes in our product sales mix and prices, distribution channels and geographies, manufacturing yields, period expenses, levels of production volume and currency exchange rates.Selling and marketing.Our selling and marketing expenses increased by 10% to $126.8 million in 2010 from $115.6 million in 2009, primarily as a result of $5.3 million of additional variable commissions and royalty expenses on higher revenue, and approximately $1.4 million of increased non-variable selling and marketing expenses related to the additional week of operations included in the first quarter of 2010, offset by approximately $1.1 million of decreased expense due to changesin foreign currency exchange rates.The remaining increase in selling and marketing expenses relates to general increases in our selling, marketing, training and distribution costs to support continued growth and product expansion, including our direct expansion into the United Kingdom and Scandinavia. Selling and marketing expense as a percentage of revenue decreased from 57% for 2009 to 56% for2010. The decrease in our selling and marketing expenses as a percentage of revenue is due primarily to revenue growing at a faster rate than our non-variable selling expenses.General and administrative.Our general and administrative expenses increased by 8% to $22.4 million in 2010 from $20.8 million in 2009. As a percentage of revenue, general and administrative expenses remained at 10% for 2010 and 2009. The increase in expenses in 2010 is primarily due to severance-related expenses of approximately $0.4 million recognized in the first quarter of 2010 from the departure of our former CFO, as well as increased stock option expense of approximately $0.6 million. The remaining increase in general and administrative expenses relates to increased information technology, legal, tax and accounting expenses as we continued to prepare ourselves to be a publicly traded company.Research and development.Research and development expenses decreased by 1% to $17.9 million in 2010 from $18.1 million in 2009, primarily due to a $0.2 million favorable impact from foreign currency exchange rate fluctuations. Research and development expenses were also impacted by a reduction in the required outside spending for the particular product development projects underway during 2010 as compared to 2009, as well as a $0.3 million research grant given to the Orthopedic Research and Education Foundation during 2009 that did not recur in 2010. This decrease in product development expenses was offset by consolidated operating expenses from C2M Medical, including certain operating expenses related to the launch of our Piton product. C2M Medical was a variable interest entity which we consolidated in 2008 and which holds the intellectual property related to our Piton products. Fiscal year 2010 included $0.6 million of operating expenses related to C2M Medical compared to an immaterial amount for 2009. During the first quarter of 2010, we acquired C2M Medical and merged the entity into our existing U.S. operations. The acquisition of C2M was completed in order to purchase the intellectual property related to our Piton products, which we had previously been licensing from C2M, and therefore the C2M entity was no longer needed. As a percentage of revenue, research and development decreased from 9% for 2009 to 8% for 2010. We expect our level of research and development to fluctuate depending on the timing of new product development projects and clinical study costs.Amortization of intangible assets.Amortization of intangible assets decreased by 24% to $11.5 million in 2010 from $15.2 million in 2009, primarily due to a $3.4 million impairment loss recognized in the fourth quarter of 2009 when developed technology from certain acquired entities was abandoned. There were no intangible asset impairments recognized during 2010.Special charges.Special charges decreased by 84% to $0.3 million for 2010 compared to $1.9 million for 2009. These special charges were primarily related to the relocation of our U.S. headquarters and the establishment of our sales office in the United Kingdom. Both of these activities began in the second quarter of 2009. The majority of the expenses related to these activities were recognized in 2009 and completed in the first quarter of 2010. These consolidation and restructuring activities were intended to result in a more efficient use of space and resources within our U.S. operations. The net impact on future periods is expected to be immaterial because the reduction in lease expense and headcount will be offset by additional lease costs in our remaining U.S. facilities to accommodate relocated employees as well as by increased headcount to perform activities within the remaining U.S. locations, including certain activities previously performed by terminated individuals.Interest expense.Our interest expense increased by 10% to $21.6 million in 2010 from $19.7 million in 2009 due to the issuance of €37 million of 8% notes payable together with warrants to purchase 8.8 million ordinary shares in April of 2009. Interest expense for 2010 includes a full year of interest expense related to the 8% stated interest on the notes, together with additional interest expense related to the notes being issued at a discount as they were issued in conjunction with warrants. In February 2011, we repaid all of the outstanding indebtedness under our notes payable and at the time of repayment, we recognized a loss on debt extinguishment of approximately $29.5 millionand related deferred tax benefit of $7.5 million to recognize the remaining balance of unamortized discount on the notes, and to reverse the related deferred tax liability.Foreign currency transaction gain (loss).We recorded a foreign currency transaction loss of $8.2 million in 2010 and a foreign currency transaction gain of $3.0 million in 2009. The primary driver of our foreign currency transaction loss in 2010 and gain in 2009 is related to the revaluation of our warrant liability, which was denominated in a currency other than that of our parent legal entity. We recorded a foreign currency loss of $11.6 million and gain of $3.9 million in 2010 and 2009, respectively, to revalue the warrant liability. The offsetting foreign currency gains and losses in each period relate to the impact of revaluing certain of our intercompany debt and payables between our U.S. and European subsidiaries as a result of changes in the Euro to U.S. dollar exchange rate.Other non-operating (expense) income.We recorded other non-operating income of less than $0.1 million in 2010 and other non-operating loss of $28.5 million in 2009. Our non-operating income and expense primarily relates to the adjustment of our warrant liability to fair value at the end of each reporting period. We settled our warrant liability in May of 2010 by exchanging all the outstanding warrants for our ordinary shares.Income tax benefit.Our income tax benefit decreased $9.3 million to $5.1 million in 2010 compared to $14.4 million in 2009. Our effective tax rate for 2010 and 2009 was 11% and 21%, respectively. Given our history of operating losses, we do not generally record a provision for income taxes in the United States and certain of our European sales offices. Our income tax benefit in both 2010 and 2009 primarily relate to tax benefit recorded related to our French subsidiaries and the reversal of deferred tax liabilities recognized in the Netherlands related to the debt discount on the notes payable issued in 2008 and 2009. Income tax benefit recognized in 2009 also included $2.8 million related to a change in applicable law allowing for a one-time ability to carry back losses for five years in the United States.Fiscal Year Ended December 27, 2009 Compared to Fiscal Year Ended December 28, 2008Revenue.Revenue increased by 14% to $201.5 million in 2009 from $177.4 million in 2008, primarily as a result of growth in our target markets, new product launches and market share gains by our shoulder and ankle joint replacement products. During 2009, we launched 18 new products; six of these new products were introduced primarily in the United States. Our revenue was negatively impacted by approximately $4.5 million during 2009 as a result of foreign currency fluctuations, principally due to the performance of the Euro against the U.S. dollar. Excluding the impact of the change in foreign currency exchange rates, our revenue increased by 16%.Revenue by product category.Revenue in upper extremity joints and trauma product category increased by 15% to $125.5 million in 2009 from $108.8 million in 2008, primarily as a result of the continued increase in sales of our shoulder products, including our reversed shoulder and our Affiniti shoulder products, which launched at the end of 2008.We believethat increased sales ofproviding constant currency information provides valuable supplemental information regarding ourreversed shoulder products resulted from continued market growth in shoulder replacement procedures and further market acceptance of our reversed and standard Aequalis shoulder joint replacement products. Our Affiniti shoulder products continued to grow in sales volume since their 2008 launch. Our upper extremity joints and trauma product category continues to represent the most significant group of products in our revenue, representing approximately 61% and 62% of revenue in 2008 and 2009, respectively. We expect our upper extremity joints and trauma product category will remain a significant portion of revenue in the immediate future and will be a primary driver of our anticipated 2010 revenue growth. Revenue in our lower extremity joints and trauma product category increased by 12% to $20.4 million in 2009 from $18.2 million in 2008, primarily due to high volume growth in our U.S. ankle products, which we believe was driven by our surgeon training and education efforts. Revenue in our sports medicine and biologics product category increased by 162% to $6.6 million in2009 from $2.5 million in 2008. This increase was attributable to the launch of our biologics product, Conexa, as well as increasing market acceptance of our Piton anchors. We expect revenue in this product category to increase as we focus on further developing and broadening these products. Revenue in the large joint and other product category increased by 2% to $49.0 million in 2009 from $47.9 million in 2008. Our large joint products are primarily sold internationally and were negatively impacted by the strengthening of the U.S. dollar. Excluding the impact of currency fluctuations, our large joint sales increased by 7%, driven primarily by an increase in sales volumes of certain of our hip products during 2009. We also launched the HLS Kneetec, a new knee joint implant, during 2009 to continue to strengthen our knee product revenue. We have made the strategic decision to focus the sale of our large joint products only in select international markets.Revenue by geography.Revenue in the United States increased by 24% to $112.6 million in 2009 from $91.1 million in 2008. Revenue internationally increased by 3% to $88.9 million in 2009 from $86.3 million in 2008. Our international revenue was negatively impacted by approximately $4.5 million during 2009 as a result of foreign currency fluctuations, principally due to the performance of the Euro against the U.S. dollar. Excluding the impact of the change in currency exchange rates, our international revenues increased by 8%, driven primarily by increased sales in our French market as well as in Germany and Australia.Cost of goods sold.Our cost of goods sold increased by 21% to $54.9 million in 2009 from $45.5 million in 2008, primarily attributable to increased manufacturing overhead costs to support increased production capacity, which grew at a rate higher than production during 2008, the period in which the majority of our 2009 product sales were manufactured. As a percentage of revenue, cost of goods sold increased to 27% in 2009 from 26% in 2008, as we increased our manufacturing overhead costs in an effort to establish a sufficient level of capacity and manufacturing infrastructure to support our current and future growth plans. During 2009, we leased and moved into a new manufacturing facility in Macroom, Ireland, which should enable us to expand our Irish manufacturing capacity. We also purchased a new facility in Grenoble, France in 2009, which expanded our manufacturing facilities in France. Our increases in manufacturing overhead costs have grown at a rate faster than our factory output in recent years, causing an increase in the fully absorbed cost of our products. However, this has allowed us to establish an infrastructure that we believe will be able to sustain our sales growth plans and has increased our ability to leverage our costs in the future. In addition, we experienced charges for excess and obsolete inventory of $6.8 million during 2009 compared to $3.6 million during 2008 as a result of higher levels of obsolete inventory from a higher level of new product launches during 2009 and an increase in estimated shrinkage of U.S. consigned inventory. We also incurred certain one-time charges for relocating our Ireland manufacturing facility during 2009. Our cost of goods sold and corresponding gross profit as a percentage of revenue can be expected to fluctuate in future periods depending on changes in our product sales mix and prices, distribution channels and geographies, manufacturing yields, period expenses, levels of production volume and foreign currency exchange rates.Selling and marketing.Our selling and marketing expenses increased by 8% to $115.6 million in 2009 from $106.9 million in 2008, primarily as a result of $5.2 million of higher variable commissions and royalty expenses related to higher revenue, $3.0 million of increased instrumentation depreciation and $3.1 million of increased selling expenses related to new product promotions and training offset by a positive impact of $2.6 million due to changes in foreign currency exchange rates. Selling and marketing expense as a percentage of revenue decreased from 60% in 2008 to 57% in 2009, primarily as a result of our ability to increase revenue at a higher rate than the increases in our existing sales and distribution expenses. We believe this reflects theresults of operations, consistent with how we evaluate ourhaving increased sales and marketing expenses in prior years to build a sales and distribution infrastructure capable of supportingperformance. We calculate constant currency percentages by converting our current-period local currency financial results using therevenue growth we experienced in 2009. While we believe our existing infrastructure is sufficient tosupport our 2010 growth plans, we do not anticipate that our selling and marketing expenses will decrease as a percentage of revenue during 2010.General and administrative.Our general and administrative expenses decreased by 4% to $20.8 million in 2009 from $21.7 million in 2008, primarily as a result of the consolidation of certain administrative functions in France related to a subsidiary acquired in the Nexa acquisition, combined with a reduction of certain French property taxes. As a percentage of revenue, general and administrative expenses decreased two percentage points from 12% in 2008 to 10% in 2009. We were able to decrease our general and administrative expenses as a percentage of revenue during 2009 through controlled expenditures on certain legal and administrative costs; however, given our preparation for an initial public offering of our ordinary shares, we expect that general and administrative expense could increase and we may not be able to continue to decrease our general and administrative costs as a percentage of revenue in 2010.Research and development.Research and development expenses decreased by 12% to $18.1 million in 2009 from $20.6 million in 2008, primarily due to favorableprior-period foreign currency exchange rates andconsolidation of certain researchcomparing these adjusted amounts to our prior-period reported results. This calculation may differ from similarly-titled measures used by others; and,development activities into our Warsaw, Indiana facility. Research and development expenses represented 9% and 12% of revenue in 2009 and 2008, respectively. We believe that continued investment in research and developmentaccordingly, the constant currency presentation isan important part of sustaining our growth strategy through new product development and anticipate that research and development expenses as a percentage of revenue in 2010 will remain at a level similar to 2009.Amortization of intangible assets.Amortization of intangible assets increased by 36% to $15.2 million in 2009 from $11.2 million in 2008 primarily as a result of $3.4 million of impairment charges recorded in 2009 from the abandonment of certain previously acquired developed technology and a full year of amortization related to the intangible asset recorded upon the consolidation of C2M Medical in 2008.Special charges.In 2009, we recorded special charges totaling $1.9 million related to the consolidation and restructuring of certain activities in our Boston, New Jersey and San Diego facilities, as well as the relocation of our U.S. headquarters. These consolidation and restructuring activities were intended to result in a more efficient use of space and resources within our U.S. operations. The net impact on future periods is expectednot meant to beimmaterial because the reductiona substitution for recorded amounts presented inlease expense and headcount willconformity with GAAP nor should such amounts beoffset by additional lease costsconsidered inour remaining U.S. facilities to accommodate relocated employees as well as by increased headcount to perform activities within the remaining U.S. locations, including certain activities previously performed by terminated individuals.isolation.Interest expense.Our interest expense increased by 76% to $19.7 million in 2009 from $11.2 million in 2008 due to the full year impact of interest related to €34.5 million of notes payable issued in February 2008 and €37.0 million of notes payable issued in April 2009. Of the $19.7 million of interest expense in 2009, $10.0 million relates to non-cash amortization of debt discount recorded on the notes payable issued in both 2008 and 2009 and $7.3 million relates to paid-in-kind interest accrued as additional principal value of the notes payable issued in 2008 and 2009.Foreign currency transaction gain (loss).Our foreign currency transaction gain increased by 77% to $3.0 million in 2009 from $1.7 million in 2008. During 2009, we recorded a $3.9 million foreign currency gain related to the revaluation of our warrant liability, which is denominated in a currency other than our functional currency. The remaining foreign currency gains in 2009 and 2008 relate primarily to the impact of revaluing certain of our intercompany debt and payables between our U.S. and European subsidiaries as a result of changes in the Euro to U.S. dollar exchange rate.Other non-operating (expense) income.Other non-operating expenses increased to $28.5 million in 2009 from $1.4 million in 2008 due to the charge recorded as a result of the change in the fair value of the warrant liability issued with the 2008 and 2009 notes payable. This increase in fair value primarily relates to our change in the estimated fair value of our ordinary shares from $16.98 per share at the end of 2008 to $22.50 per share at the end of 2009.Income tax benefit.Our income tax benefit increased $9.2 million to $14.4 million in 2009 compared to $5.2 million in 2008. Our effective tax rate for 2009 and 2008 was 21% and 13%, respectively. Given our history of operating losses, we do not generally record a provision for income taxes in the United States and certain of our European sales offices. During 2009, we recorded a $3.2 million tax benefit related to losses incurred in France that we believe will be realizable in the future because of the existence of sufficient deferred tax liabilities that will reverse over time, creating future taxable income. We also recorded a $2.8 million income tax benefit in the United States as a result of a law change allowing for a one-time ability to carry back our current year losses for five years. Finally, we recorded a $9.2 million income tax benefit related to the reversal of deferred tax liabilities on the debt discount recorded on the notes payable issued in 2008 and 2009.Seasonality and Quarterly Fluctuations
Our business is seasonal in nature. Historically, demand for our products has been the lowest in our third quarter as a result of the European holiday schedule during the summer months.
We have experienced and expect to continue to experience meaningful variability in our revenue and gross profit among quarters, as well as within each quarter, as a result of a number of factors including, among other things, the transitions to direct selling models in certain geographies and the transition of our U.S. sales channel towards focusing separately on upper and lower extremity products; the number and mix of products sold in the
quarter;quarter and the geographies in which they are sold; the demand for, and pricing of our products and the products of our competitors; the timing of or failure to obtain regulatory clearances or approvals for products; costs, benefits and timing of new product introductions;increasedthe level of competition; the timing and extent of promotional pricing or volume discounts; changes in average selling prices; the availability and cost of components and materials; number of selling days; fluctuations in foreign currency exchange rates; the timing of patients’ use of their calendar year medical insurance deductibles; and impairment and other special charges.In addition, we issued notes payable and warrants in both 2008 and 2009 in order to raise working capital. During 2009, we adopted new accounting guidance that requires we record the fair value of the warrants as a liability on our balance sheet and adjust that liability to fair value at each reporting period, changes in which are recognized as either an expense or gain in our statement of operations.Liquidity and Capital Resources
Working Capital
Since inception, we have generated significant operating
losses. These, combined with significant charges not related to cash from operations, amortization of acquired intangible assets, fair value adjustments to our warrant liability and accretion of noncontrolling interests, have resultedlosses resulting in an accumulated deficit of$183.5$272.2 million as ofJanuary 2, 2011.December 29, 2013. Historically, our liquidity needs have been met through a combination of sales of our equitysecurities together with issuances of notes payableandwarrants to both current shareholders and new investors and other bank related debt. Our notes payable have financial and operational covenants that could limit our ability to transfer or dispose of assets, merge with or acquire other companies, make investments, pay dividends, incur additional indebtedness and liens and conduct transactions with affiliates. As of January 2, 2011, we have $53.9 million in short-term and long-termcommercial debtexcluding our notes payable. Certain of these other debt agreements also include financial covenants that (i) require us to have a minimum level of tangible net worth in our U.S. operating subsidiary, (ii) have various levels of performance tests of debt to equity and debt to modified income specifically related to our French operating subsidiary and (iii) restrict our ability to borrow in our U.S. operating subsidiary if there is a default under the agreement, all of which may have an impact on our liquidity.The following table sets forth, for the periods indicated, certain liquidity measures:As of January 2,
2011December 27,
2009December 28,
2008($ in thousands) Cash and cash equivalents
$ 24,838 $ 37,969 $ 21,348 Working capital
96,965 98,993 66,779 Line of credit availability
11,252 13,530 7,927 Operating activities.Net cash provided by operating activities was $2.9 million in 2010 compared to net cash provided by operating activities of $2.3 million in 2009. The increase was primarily driven by an improvement in our consolidated net loss adjusted for non-cash items and a decrease in accounts payable offset by increases in inventory and receivables. Net cash provided by operating activities was $2.3 million in 2009 compared to net cash used in operating activities of $19.5 million in 2008. This improvement in our cash flows from operations was primarily driven by an improvement in our consolidated net loss adjusted for non-cash items by approximately $17.1 million, due to our increased leverage on operating expenses versus our increase in revenue. In addition, we decreased inventory by $4.3 million due to improved inventory management and lower levels of inventory to support product launches.financing. Wealso experienced $5.4 million in favorable cash flows from lower receivable balances as a result of improved collection efforts in 2009. These cash flow improvements were partially offset by other changes in current assets and liabilities.Investing activities.Net cash used in investing activities totaled $22.9 million, $31.1 million and $43.3 million in 2010, 2009 and 2008, respectively. Amounts related to the addition of surgical instrumentation equipment were $13.8 million, $12.3 million and $18.2 million in 2010, 2009 and 2008, respectively. The investments in surgical instrumentation in 2010 and 2009 relate primarily to supporting continued revenue growth as well as certain new product launches. Investment in surgical instrumentation was higher in 2008 than 2009 due to increased building of instrument sets in 2008 to support product launches in subsequent years. Amounts related to property, plant and equipment were $6.7 million, $11.1 million and $13.5 million in 2010, 2009 and 2008, respectively. Property, plant and equipment additions in 2010 primarily related to preparing our new France manufacturing facility to begin production. In 2009 we used approximately $2.4 million on leasehold improvements in conjunction with moving our Irish manufacturing operations into a newly leased facility. In 2008, we used approximately $6.1 million to purchase a new manufacturing facility in Grenoble, France. Acquisition-and licensing-related payments totaled $2.3 million, $7.7 million and $12.7 million in 2010, 2009 and 2008, respectively. Acquisition and licensing related payments in 2010 were related to contingent purchase price from a previous acquisition, as certain milestones were achieved in the first two quarters of 2010 and continued payments of contingent purchase price related to our consolidated subsidiary's acquisition of our Piton technology. The purchase agreement related to our acquisition of our Piton technology requires that we make payments equal to 25% of the sales of Piton for a three-year period ending in the fourth quarter of 2011. Acquisition and licensing related payments in 2009 were related to earn-out payments made to the shareholders of DVO as a part of the asset purchase agreement we entered into in 2007. These were the final earn-out payments to be made under this agreement.Our industry is capital intensive, particularly as it relates to surgical instrumentation. Historically, our capital expenditures have consisted principally of purchased manufacturing equipment, research and testing equipment, computer systems, office furniture and equipment and surgical instruments.Financing activities.Net cash provided by financing activities totaled $7.4 million, $44.9 million and $66.5 million in 2010, 2009 and 2008. During 2010, we used $3.5 million for deferred financing costs related to our initial public offering completed in 2011. During 2010, we also generated$6.5 million from the increase in short-term debt and $3.7 million from new long-term borrowing arrangements net of payments on long-term debt. This compares to payments of $3.5 million on short-term debt and payments made of $3.9 million on long-term borrowing arrangements, net of cash generated from new long-term borrowing arrangements during 2009. The increase in proceeds generated by the issuance of long-term debt was due to our ability to raise a higher level of term loans in France secured by certain working capital balances during 2010. During 2009 and 2008, proceeds of $49.3 million and $52.4 million, respectively, were generated from the issuance of notes payable and warrants to be used as working capital. Proceeds of $2.9 million and $8.9 million were generated in 2009 and 2008, respectively, through the sale of our ordinary shares to various investors.Other liquidity information.We have funded our cash needs since our acquisition in 2006 through the issuance of equity, notes payable and warrants to a group of investors. In February of 2011, we completed an initial public offering and raised net proceeds of $155.4 million. Although it is difficult for us to predict our future liquidity requirements, webelieve that ourcurrentcash and cash equivalents balance of approximately$24.8$56.8 millionthe additional cash raised in our 2011 initial public offering and our existingas of December 29, 2013, along with $30.0 million of available creditlines of $11.3 millionunder our revolving credit facility, will be sufficient to fund our working capital requirements and operations, including recent and potential acquisitions to continue our U.S. sales channel transition and international expansion, and permit anticipated capital expendituresin 2011. Our European subsidiaries have established a combination of secured and unsecured available lines of credit totaling $21.9 million as of January 2, 2011. The secured lines of credit generally have between one and two year terms and are renewed atduring theend of the related term. The unsecured lines of credit do not include specific terms and can be terminated by the banks upon 60 days notice. These lines of credit have variable interest rates based on the Euro Overnight Index Average plus 1.3% or a three-month Euro rate plus 0.5%-3.0%. We also have a $10.0 million credit line secured by our U.S. operating subsidiary which was renewed in August 2010. This line is secured by working capital and equipment and bears interest at a 30-day LIBOR plus 2.25% interest rate.next twelve months. In the event that we would require additional working capital to fund future operations or for other needs, we could seek to acquire that through additional issuances of equity or additional debt financingarrangements. If we raise additional funds by issuing equity securities, our shareholdersarrangements, which mayexperience dilution. Debt financing, if available,or mayinvolve covenants restricting our operations or our ability to incur additional debt. There is no assurance that any financing transaction willnot be available on favorable termsacceptableat such time.The following table sets forth, for the periods indicated, certain liquidity measures:
As of December 29, 2013 December 30, 2012 ($ in thousands) Cash and cash equivalents
$ 56,784 $ 31,108 Working capital
150,209 136,692 Available lines of credit
30,000 29,000 Total short and long term debt
69,081 120,052 Total working capital was positively impacted during 2013 as a result of the completion of our underwritten public offering in May 2013, partially offset by the subsequent repayment of certain long-term debt. The offering consisted of 8.1 million ordinary shares at a public offering price of $16.15 per share. Pursuant to the offering, we sold 5.2 million shares and certain shareholders sold 2.9 million shares, both of which were inclusive of the exercise of the underwriters’ over-allotment option. We received $78.7 million in net proceeds from the offering, net of the underwriters’ discount and commissions and offering expenses, and used approximately $50.5 million of the net proceeds to repay our $40.0 million Euro denominated term loan and a portion of our U.S. dollar denominated term loan. We intend to use the remaining net proceeds from this offering for working capital and general corporate purposes.
Credit Facility
The term loans that were repaid in 2013 related to our credit facility that was entered into in October 2012 to fund our acquisition of OrthoHelix. Under the credit facility, we obtained credit of $145 million, consisting of: (1) a senior secured term loan facility denominated in U.S. dollars in an aggregate principal amount of up to $75 million (referred to as the USD term loan facility); (2) a senior secured term loan facility denominated in Euros in an aggregate principal amount of up to the U.S. dollar equivalent of $40 million (referred to as the EUR term loan facility); and (3) a senior secured revolving credit facility denominated at our election, in U.S. dollars, Euros, pounds, sterling and yen in an aggregate principal amount of up to the U.S. dollar equivalent of $30 million. The borrowings under the term loan facilities were used to pay a portion of the OrthoHelix acquisition consideration, and fees, costs and expenses incurred in connection with the acquisition and the credit agreement and to repay prior existing indebtedness. As of December 29, 2013, we had $60.9 million of term debt outstanding under this credit facility. The term loan matures in October 2017. Funds available under the revolving credit facility may be used for general corporate purposes.
At our option, borrowings under our revolving credit facility and our U.S. dollar denominated term loan facility bear interest at (a) the alternate base rate (if denominated in U.S. dollars), equal to the greatest of (i) the prime rate in effect on such day, (ii) the federal funds rate in effect on such day plus 1/2 of 1%, and (iii) the adjusted LIBO rate plus 1%, plus in the case of each of (i)-(iii) above, an applicable rate of 2.00% or 2.25% (depending on our total net leverage ratio as defined in our credit agreement), or (b) the applicable adjusted LIBO rate for the relevant interest period plus an applicable rate of 3.00% or 3.25% (depending on our total net leverage ratio), plus the mandatory cost (as defined in our credit agreement) if such loan is made in a currency other than U.S. dollars or from a lending office in the United Kingdom or a participating member state (as defined in our credit agreement). In addition, we are subject to a 0.5% interest rate on the unfunded balance related to the line of credit.
The credit agreement contains customary covenants, including financial covenants which require us
or at all.
Other Liquidity Information
In connection with our acquisition of OrthoHelix, we agreed to pay in cash additional earn-out payments of up to an aggregate of $20 million based upon our sales of lower extremity joints and trauma products during fiscal years 2013 and 2014. As a result of the earn-out, we expect to pay $4.6 million based on growth in revenue of our lower extremity joints and trauma products during 2013 over 2012.
In addition, in connection with the acquisitions of certain stocking distributors in Canada, Australia and the United Kingdom and certain U.S. distributors and independent sales agencies during 2013, we agreed to pay in cash additional contingent consideration of $2.5 million over the next two years.
Cash Flows
The following summarizes the components of our consolidated statements of cash flows for the years ended December 29, 2013, December 30, 2012 and January 1, 2012:
Operating activities. Net cash provided by operating activities was $25.0 million in 2013 compared to $14.4 million in 2012. This increase of $10.6 million in operating cash flow was attributable to a decrease in our consolidated net loss that was cash related in 2013 and an increase in cash from working capital of $6.3 million.
Net cash provided by operating activities decreased by $8.8 million to $14.4 million in 2012 compared to $23.2 million in 2011. The primary driver of this decrease was the increase in the portion of our consolidated net loss that was cash related. Our 2011 consolidated net loss of $30.5 million included a $29.5 million non-cash loss on the extinguishment of debt, while our 2012 consolidated net loss of $21.7 million included significant cash charges for our facilities consolidation initiative, the acquisition and integration of OrthoHelix, and certain senior management exit costs, among other items.
Investing activities. Net cash used in investing activities totaled $47.7 million, $125.8 million and $29.5 million in 2013, 2012 and 2011, respectively. The decrease in net cash used in investing activities in 2013 compared to 2012 was primarily driven by our 2012 acquisition of OrthoHelix, which had included cash consideration of $100.4 million. In 2013, we used approximately $10.1 million for acquisition related payments related to the acquisition of stocking distributors in Canada, the United Kingdom and Australia and the acquisition of certain U.S. independent sales agencies.
Our industry is capital intensive, particularly as it relates to surgical instrumentation. Our instrument additions were $23.8 million, $12.0 million and $19.7 million in 2013, 2012 and 2011, respectively. Instrument additions in 2013 were higher than both 2012 and 2011 due to the global launch of products acquired in 2012 from OrthoHelix and the 2013 launches of the Aequalis Ascend Flex and Latitude EV. 2011 instrument additions were higher than 2012 instrument additions as we used a portion of our 2011 initial public offering proceeds to make additional investments in instrumentation to support anticipated future revenue growth. Our expenditures related to property, plant and equipment were $10.8 million, $11.3 million and $6.6 million in 2013, 2012 and 2011, respectively. The increase in property, plant and equipment expenditures in 2013 and 2012 as compared to 2011 was driven by our investments in a global Enterprise Resource Planning (ERP) system in 2013 and the move of our U.S. sales and distribution activities from Stafford, Texas to Bloomington, Minnesota in 2012. We anticipate that capital expenditures in 2014 will approximate recent historical levels.
Financing activities.Net cash provided by financing activities decreased to $47.0 million in 2013 from $86.7 million in 2012. The $47.0 million in net cash provided by financing activities in 2013 included $78.7 million in net proceeds raised from our May 2013 underwritten public offering and $21.5 million received from stock option exercises, partially offset by $54.1 million in payments made on our senior secured term loans. The $86.7 million in net cash provided by financing activities in 2012 included $121.0 million in proceeds from the issuance of debt incurred to fund our acquisition of OrthoHelix, partially offset by the repayment of our previously existing long term debt. The increase in net cash provided by financing activities in 2012 compared to 2011 was due to the debt issued to fund our acquisition of OrthoHelix in 2012, partially offset by the repayment of a majority of our previously existing debt, which was a requirement under the new credit agreement.
Contractual Obligations and Commitments
The following table summarizes our outstanding contractual obligations as of
January 2, 2011December 29, 2013 for the categories set forth below, assuming only scheduled amortizations and repayment at maturity:Total Less than
1 Year1 - 3 Years 3 - 5 Years More than
5 Years($ in thousands) Amounts reflected in consolidated balance sheet:
Bank debt
$ 50,356 $ 28,076 $ 11,915 $ 6,115 $ 4,250 Notes payable
95,538 — 95,538 — — Shareholder loan
2,356 — — — 2,356 Capital leases
1,148 316 665 167 — Amounts not reflected in consolidated balance sheet:
Interest on bank debt
3,782 1,886 1,290 606 — Accrued paid-in-kind interest on notes payable
45,962 — 45,962 — — Interest on capital leases
161 81 74 6 — Operating leases
17,523 4,691 5,138 3,572 4,122 Total
$ 216,826 $ 35,050 $ 160,582 $ 10,466 $ 10,728 Payment Due By Period Contractual Obligations Total Less than
1 Year1 - 3 Years 3 - 5 Years More than
5 Years($ in thousands) Amounts reflected in consolidated balance sheet:
Bank debt
$ 65,848 $ 977 $ 2,339 $ 61,985 $ 547 Shareholder loan
2,319 — — — 2,319 Contingent consideration
12,956 6,428 6,528 — — Capital leases
914 461 383 70 — Amounts not reflected in consolidated balance sheet:
Interest on bank debt
9,603 2,776 5,436 1,376 15 Interest on contingent consideration
807 721 86 — — Interest on capital leases
67 40 25 2 — Operating leases
28,143 5,410 8,035 6,336 8,362 Total
$ 120,657 $ 16,813 $ 22,832 $ 69,769 $ 11,243 Off-Balance Sheet Arrangements
We do not have any off-balance sheet arrangements, as defined by the rules and regulations of the SEC, that have or are reasonably likely to have a material effect on our financial condition, changes in financial condition, revenue or expenses, results of operations, liquidity, capital expenditures or capital resources. As a result, we are not materially exposed to any financing, liquidity, market or credit risk that could arise if we had engaged in these arrangements.
Critical Accounting Policies
Our consolidated financial statements and related financial information are based on the application of U.S. GAAP. The preparation of our consolidated financial statements in conformity with U.S. GAAP requires us to make estimates and assumptions that affect the amounts reported in our consolidated financial statements and accompanying notes.
Certain of our
morecritical accounting policies require the application of significant judgment by management in selecting the appropriate assumptions for calculating financial estimates. By their nature, these judgments are subject to an inherent degree of uncertainty. These judgments are based on our historical experience, terms of existing contracts, our observance of trends in the industry, information provided by our physician customers and information available from other outside sources, as appropriate. Changes in accounting estimates are reasonably likely to occur from period to period. Changes in these estimates and changes in our business could have a material impact on our consolidated financial statements.We believe that the following accounting policies are both important to the portrayal of our financial condition and results of operations and require subjective or complex judgments. Further, we believe that the items discussed below are properly recognized in our consolidated financial statements for all periods presented. Management has discussed the development, selection and disclosure of our critical financial estimates with the audit committee and our board of directors. The judgments about those financial estimates are based on information available as of the date of our consolidated financial statements. Our critical
financialaccounting policies and estimates are described below:Revenue Recognition
We derive our revenue from the sale of medical devices that are used by orthopaedic and general surgeons who treat diseases and disorders of extremity joints, including the shoulder, elbow, wrist, hand, ankle and
foot.foot, and large joints, including the hip and knee. Our revenue is generated from sales to two types of customers: healthcare institutions and stocking distributors. Sales to healthcare institutions represent the majority of our revenue.We utilize a network of independent commission-based sales agencies for sales in the United States and a combination of direct sales organizations, independent sales representatives and distributors for sales outside the United States. Generally, revenueRevenue from sales to healthcare institutions is recognized at the time of surgical implantation. We generally record revenue from sales to our stocking distributors at the time the product is shipped to the distributor.Distributors,Stocking distributors, who sell the products to their customers, take title to the products and assume all risks of ownership at time of shipment. We do not have any arrangements with stocking distributors that allow for retroactive pricing adjustments. Our stocking distributors are obligated to pay within specified terms regardless of when, if ever, they sell the products. In certain circumstances, we may accept sales returns from distributors and in certain situations in which the right of return exists, we estimate a reserve for sales returns and recognize the reserve as a reduction of revenue. We base our estimate for sales returns on historical sales and product return information including historical experience and trend information. Our reserve for sales returns has historically been immaterial. We charge our customers for shipping and handling and recognize these amounts as part of revenue.Allowance for Doubtful Accounts
We maintain an allowance for doubtful accounts for estimated losses in the collection of accounts receivable. We make estimates regarding the future ability of our customers to make required payments based on historical credit experience, delinquency and current and expected future trends. The majority of our receivables are due from healthcare institutions, many of which are government funded. Accordingly, our collection history with this class of customer has been favorable and has resulted in a low level of historical write-offs. We write off accounts receivable when we determine that the accounts receivable are uncollectible, typically upon customer bankruptcy or the
customer'scustomer’s non-response to continued collection efforts.We believe that the amount included in our allowance for doubtful accounts historically has been
a historicallyan appropriate estimate of the amount of accounts receivable that is ultimately not collected. While we believe that our allowance for doubtful accounts is adequate, the financial condition of our customers and the geopolitical factors that impact reimbursement under individualcountries'countries’ healthcare systems can change rapidly, which may necessitate additional allowances in future periods. For example, in 2012, we recorded reserves $2.0 million for certain specific customer accounts in Italy, primarily due to the impact of the ongoing economic challenges and the termination of agreements with certain distributors. Our allowance for doubtful accounts was$2.5$5.1 million and$2.7$4.8 million atJanuary 2, 2011December 29, 2013 and December27, 2009,30, 2012, respectively.Excess and Obsolete Inventory
We value our inventory at the lower of the actual cost to purchase or manufacture the inventory on a first-in, first-out, or FIFO, basis or its net realizable value. We regularly review inventory quantities on hand for excess and obsolete inventory (which can include charges for product expirations) and, when circumstances indicate, we incur charges to write down inventories to their net realizable value. Our review of inventory for excess and obsolete quantities is based on an analysis of historical product sales together with our forecast of future product demand and production requirements. A significant decrease in demand could result in an increase in the amount of excess inventory quantities on hand. Additionally, our industry is characterized by regular new product
developmentdevelopments that could result in an increase in the amount of obsolete inventory quantities on hand due to cannibalization of existing products. Also, our estimates of future product demand may prove to be inaccurate, in which case we may be required to incur charges for excess and obsolete inventory. In the future, ifadditional inventorywrite-downs are required, we would recognize additional cost of goods sold at the time of such determination. Regardless of changes in our estimates of future product demand, we do not increase the value of our inventory above its adjusted cost basis. Therefore, although we make every effort to ensure the accuracy of our forecasts of future product demand, significant unanticipated decreases in demand or technological developments could have a significant impact on the value of our inventory and our reported operating results. Charges incurred for excess and obsolete inventory were
$5.2$8.4 million,$6.8$8.2 million and$3.6$5.0 million forthe fiscal years ended 2010, 20092013, 2012 and2008,2011, respectively.Instruments
Instruments are surgical tools used by orthopaedic and general surgeons during joint replacement and other surgical procedures to facilitate the implantation of our products. There are no contractual terms with respect to the usage of our instruments by our
customers. Surgeons are under no contractual commitment to use our instruments. Wecustomers and we maintain ownership of these instruments,and, when requested,except in situations where weallow the surgeons to use thesell instruments tofacilitate implantation of our related products.certain stocking distributors. We generally do notcurrentlycharge for the use of our instruments and there are no minimum purchase commitments relating to our products. As our surgical instrumentation is used numerous times over several years, often by many different customers, instruments are recognized as long-livedassets once they have been placed in service.assets. Instruments and instrument parts that have not been placed in service are carried at costnet of allowances for excess and obsolete instruments,and are included as instruments in progress within instruments, net of allowances for excess and obsolete instruments, ontheour consolidated balance sheets. Once placed in service, instruments arecarried at cost, less accumulated depreciation. Instrument parts used to maintain the functionality of instrument sets but that do not extend the life of the instrument sets are expensed as they are consumed and recorded as part of selling, general and administrative expense. Depreciation is computed using the straight-line method based on average estimated useful lives. Estimated useful lives are determined principally in reference to associated product life cycles, and average five years. As instruments are used as tools to assist surgeons, depreciation of instruments is recognized as a
salesselling, general andmarketingadministrative expense. Instrument depreciation expense was$9.4$13.9 million,$9.4$12.4 million and$6.3$11.0 million during2010, 20092013, 2012 and2008,2011, respectively.We review instruments for impairment whenever events or changes in circumstances indicate that the carrying value of the assets may not be recoverable. An impairment loss would be recognized when estimated future undiscounted cash flows relating to
the assetsan asset are less than theasset'sasset’s carrying amount. An impairment loss is measured as the amount by which the carrying amount of an asset exceeds its fair value.Business Combinations, Goodwill and Long-Lived Assets
We account for acquired businesses using the purchase method of accounting. Under the purchase method, our consolidated financial statements include the financial results of an acquired business starting from the date the acquisition is completed. In addition, the assets acquired, liabilities assumed and any contingent consideration must be recorded at the date of acquisition at their respective estimated fair values, with any excess of the purchase price over the estimated fair values of the net assets acquired recorded as goodwill. Significant judgment is required in estimating the fair value of contingent consideration, intangible assets and in assigning their respective useful lives. Accordingly, we typically obtain the assistance of third-party valuation specialists for significant acquisitions. The fair value estimates are based on available historical information and on future expectations and assumptions deemed reasonable by management, but are inherently uncertain.
We typically have used a discounted cash flow analysis to determine the fair value of contingent consideration on the date of acquisition. Significant changes in the discount rate used could affect the accuracy of the fair value calculation. Contingent consideration is adjusted based on experience in subsequent periods and the impact of changes related to assumptions are recorded in operating expenses as incurred.
We typically use an income method to estimate the fair value of intangible assets, which is based on forecasts of the expected future cash flows attributable to the respective assets. Significant estimates and assumptions inherent in the valuations reflect a consideration of other marketplace participants and include the amount and timing of future cash flows (including expected growth rates and profitability), the underlying product or technology life cycles, the economic barriers to entry and the discount rate applied to the cash flows. Unanticipated market or macroeconomic events and circumstances may occur that could affect the accuracy or validity of the estimates and assumptions.
Determining the useful life of an intangible asset also requires judgment. Certain intangibles are expected to have indefinite lives based on their history and our plans to continue to support and build the acquired brands. Other acquired intangible assets (e.g., certain trademarks or brands, customer relationships, patents and technologies) are expected to have finite useful lives. Our assessment as to trademarks and brands that have an indefinite life and those that have a finite life is based on a number of factors including competitive environment, market share, trademark and/or brand history, underlying product life cycles, operating plans and the macroeconomic environment of the countries in which the trademarks or brands are sold. Our estimates of the useful lives of finite-lived intangibles are primarily based on these same factors. All of our acquired technology and customer-related intangibles are expected to have finite useful lives.
We have approximately
$131.8$251.5 million of goodwill recorded as a result of the acquisition of businesses. Goodwill is tested for impairment annually or more frequently if changes in circumstances or the occurrence of events suggest that impairment exists. Based on our single business approach todecision-making, planning and resource allocation, we have determined that we have one reporting unit for purposes of evaluating goodwill for impairment. We use widely accepted valuation techniques to determine the fair value of our reporting unit used in our annual goodwill impairment analysis. Our valuation is primarily based on a qualitative assessment and, if necessary, a quantitative assessments regarding theincome approach that is supported byfair value of the reporting unit relative to the carrying value. We also use adiscounted cash flow analysis. Themarket approachused consists of comparisons to the valuations of a group of guideline public companies. We do not currently generate earnings from operations and therefore do not use the results of the market approach in our valuation. Rather, the results of our market approach are usedto evaluate the reasonableness of the income approach. We performed our annual impairment test on the first day of the fourth quarter of20102013 and determined that the fair value of our reporting unit significantly exceeded its carrying value and, therefore, no impairment charge was necessary.The impairment evaluation related to goodwill requires the use of considerable management judgment to determine discounted future cash flows, including estimates and assumptions regarding the amount and timing of cash flows, cost of capital and growth rates. Cash flow assumptions used in the assessment are estimated using assumptions in our annual operating plan as well as our five-year strategic plan. Our annual operating plan and strategic plan contain revenue assumptions that are derived from existing technology as well as future revenues attributed to in-process technologies and the associated launch, growth and decline assumptions normal for the life cycle of those technologies. In addition, management considers relevant market information, peer company data and historical financial information. We also considered our historical operating losses in assessing the risk related to our future cash flow estimates and attempted to reflect that risk in the development of our weighted average cost of capital.We depreciate our property, plant and equipment and instruments and amortize our intangible assets based upon our estimate of the respective
asset'sasset’s useful life. Our estimate of the useful life of an asset requires us to make judgments about future events, such as product life cycles, new product development, product cannibalization and technological obsolescence, as well as other competitive factors beyond our control. We account for the impairment of long-lived assets in accordance withFASB ASCFinancial Accounting Standards Board (FASB) Accounting Standard Codification (ASC) Section 360, Property, Plant and Equipment (FASB ASC 360).and ASC 350, General Intangibles Other than Goodwill. Accordingly, when indicators of impairment exist, we evaluate impairments of our property, plant and equipment, instruments, and intangibles based upon an analysis of estimated undiscounted future cash flows. If we determine that a change is required in the useful life of an asset, future depreciation and amortization is adjusted accordingly. Alternatively, if we determine that an asset has been impaired, an adjustment would be charged to earnings based on theasset'sasset’s fair market value, or discounted cash flows if the fair market value is not readilydeterminable, reducing revenue in that period.Warrant LiabilityDuring 2009 and 2008 we raised additional working capital funds through the sale of notes payable and warrants to purchase our ordinary shares. In accordance with U.S. GAAP, these warrants were classified as a liability and carried at fair value because the warrants were denominated in a currency other than the functional currency of the issuing entity. We estimated the fair value of the warrant liability using a Black-Scholes option pricing model. The determination of the fair value of our warrant liability utilizing the Black-Scholes model is affected by our share price and a number of assumptions, including expected volatility, expected life, risk-free interest rate and expected dividends. The expected life of our warrants was determined to be equal to the remaining contractual term as the warrants were fully detachable from the notes payable with which they were issued. As a non-public entity, historic volatility was not previously available for our ordinary shares. As a result, we estimated volatility based on a peer group of companies, which collectively provides a reasonable basis for estimating volatility. The risk-free interest rate is based on the implied yield available on U.S. Treasury zero-coupon issues with a remaining term approximately equal to the remaining term of the warrants. The final input, which has a significant impact on the estimated fair value of our warrant liability, is our estimated fair value of our underlying ordinary shares. Refer to "Significant Factors Used in Determining Fair Value of Our Ordinary Shares" below for a detailed discussion of how we estimate the fair value of our underlying shares.Accounting for Income Taxes
Our effective tax rate is based on income by tax jurisdiction, statutory rates and tax-saving initiatives available to us in the various jurisdictions in which we operate. Significant judgment is required in determining our effective tax rate and evaluating our tax positions. This process includes assessing temporary differences resulting from differing recognition of items for income tax and financial reporting purposes. These differences result in deferred tax assets and liabilities, which are included within our consolidated balance sheet. Realization of deferred tax assets in each taxable jurisdiction is dependent on our ability to generate future taxable income sufficient to realize the benefits. Management evaluates deferred tax assets on an ongoing basis and provides valuation allowances to reduce net deferred tax assets to the amount that is more likely than not to be realized.
Our valuation allowance balances totaled
$27.0$40.4 million and$22.8$30.0 million as ofJanuary 2, 2011December 29, 2013 and December27, 2009,30, 2012, respectively, due to uncertainties related to our ability to realize, before expiration, some of our deferred tax assets for both U.S. and foreign income tax purposes. These deferred tax assets primarily consist of the carryforward of certain tax basis net operating losses and general business tax credits.In July 2006, the Financial Accounting Standards Board, or FASB, issued FASB Interpretation No. 48, Accounting for Uncertainty in Income Taxes (FIN 48), effective January 1, 2007, which requires theWe recognize taxeffects of an income tax positionbenefits when they are more likely than not to berecognized only if they are more-likely-than-not to be sustained based solely on the technical merits as of the reporting date. On December 30, 2008, the FASB further delayed the effective date of this guidance for certain non-public enterprises until annual financial statements for fiscal years beginning after December 15, 2008. Effective July 1, 2009, this standard was incorporated into FASB ASC Section 740, Income Taxes. We adopted these provisions of ASC Section 740 in 2009.realized. As a multinational corporation, we are subject to taxation in many jurisdictions and the calculation of our tax liabilities for uncertain tax positions involves dealing withuncertainties inthe application of complex tax laws and regulations in various taxing jurisdictions. If we ultimately determine that the payment of these liabilities will be unnecessary, we will reverse the liability and recognize a tax benefit in the period in which we determine the liability no longer applies. Conversely, we record additional tax charges in a period in which we determine that a recorded tax liability is less than we expect the ultimate assessment to be. Our liability for unrecognized tax benefits totaled$2.1$3.1 million and $2.6 million as ofJanuary 2, 2011.December 29, 2013 and December 30, 2012, respectively.TableShare-Based CompensationFor purposes of
Contentscalculatingshare-basedcompensation, we estimate the fair value of stock options using a
Share-Based CompensationBlack-Scholesoption pricing model. The determination of the fair value ofshare-based payment awards utilizing thisBlack-Scholes model is affected by our ordinary share price and a number of assumptions, including expected volatility, expected life, risk-free interest rate and expected dividends. The estimated fair value ofshare-based awards exchanged for employee and non-employee director services are expensed over the requisite service period. Option awards issued to non-employees (excluding non-employee directors) are recorded at their fair value as determined in accordance with authoritative guidance, are periodically revalued as the options vest and are recognized as expense over the related service period.
For purposes of calculating share-based compensation, we estimate the fair value of stock options using a Black-Scholes option pricing model. The determination of the fair value of share-based payment awards utilizing this Black-Scholes model is affected by our share price and a number of assumptions, including expected volatility, expected life, risk-free interest rate and expected dividends.We currently do not have information available which is indicative of future exercise and post-vesting behavior to estimate the expected term. As a result, we adopted the simplified method of estimating the expected term of a stock option, as permitted by
the Staff Accounting Bulletin No. 107.ASC 718. Under this method, the expected term is presumed to be the mid-point between the vesting date and the contractual end of theterm.term of our share-based awards. As a non-public entity prior to February 2011, historicvolatility was not available for our ordinary shares. As a result, we estimated volatility based on a peer group of companies that we believe collectively provides a reasonable basis for estimating volatility. We intend to continue to consistently use the same group of publicly traded peer companies to determine volatility in the future until sufficient information regarding volatility of our ordinary share price becomes available or the selected companies are no longer suitable for this purpose. The risk-free interest rate is based on the implied yield available on U.S. Treasury zero-coupon issues with a remaining term approximately equal to the expected life of our stock options. The estimated pre-vesting forfeiture rate is based on our historical experience together with estimates of future employee turnover. We do not expect to declare cash dividends in the foreseeable future.
The following table summarizes the amountFor a summary ofshare-basedcompensation expenserecognized inrelated to share-based awards, see Note 16 of ourstatements of operations by expense category:consolidated financial statements.Year ended January 2,
2011December 27,
2009December 28,
2008($ in thousands) Cost of goods sold
$ 536 $ 77 $ 341 Selling and marketing
1,800 1,306 1,034 General and administrative
2,861 2,250 2,051 Research and development
433 280 246 Total share-based compensation
$ 5,630 $ 3,913 $ 3,672 If factors change and we employ different assumptions,share-based compensation expense may differ significantly from what we have recorded in the past. If there is a difference between the assumptions used in determiningshare-based compensation expense and the actual factors which become known over time, specifically with respect to anticipated forfeitures, we may change the input factors used in determiningshare-based compensation costs for future grants. These changes, if any, may materially impact our results of operations in the period such changes are made. We expect to continue to grant stock options and other share-based awards in the future, and to the extent that we do, our actualshare-based compensation expense recognized in future periods will likely increase.
Significant Factors Used in Determining Fair Value of Our Ordinary SharesThe fair value of our ordinary shares that underlie the stock options we have granted has historically been determined by our board of directors based upon information available to it at thetime of grant. Because, prior to our initial public offering, there has been no public market for our ordinary shares, our board of directors has determined the fair value of our ordinary shares by utilizing, among other things, transactions involving sales of our ordinary shares, other financing events involving our ordinary shares and contemporaneous valuation studies conducted as of January 31, 2008, and December 27, 2009. The findings of these valuation studies were based on our business and general economic, market and other conditions that could be reasonably evaluated at that time. The analyses of the valuation studies incorporated extensive due diligence that included a review of our company, including its financial results, business agreements, intellectual property and capital structure. The valuation studies also included a thorough review of the conditions of the industry in which we operate and the markets that we serve. The methodologies of the valuation studies included an analysis of the fair market value of our company using three widely accepted valuation methodologies: (1) market multiple, (2) comparable transactions and (3) discounted cash flow. These valuation methodologies were based on a number of assumptions, including our forecasted future revenue and industry, general economic, market and other conditions that could reasonably be evaluated at the time of the valuation.The market multiple methodology involved the multiplication of revenue by risk-adjusted multiples. Multiples were determined through an analysis of certain publicly traded companies, which were selected on the basis of operational and economic similarity with our principal business operations. Revenue multiples, when applicable, were calculated for the comparable companies based upon daily trading prices. A comparative risk analysis between us and the public companies formed the basis for the selection of appropriate risk-adjusted multiples for our company. The risk analysis incorporated factors that relate to, among other things, the nature of the industry in which we and other comparable companies are engaged. The comparable transaction methodology also involved multiples of earnings and cash flow. Multiples used in this approach were determined through an analysis of transactions involving controlling interests in companies with operations similar to our principal business operations. The discounted cash flow methodology involved estimating the present value of the projected cash flows to be generated from the business and theoretically available to the capital providers of our company. A discount rate was applied to the projected future cash flows to reflect all risks of ownership and the associated risks of realizing the stream of projected cash flows. Since the cash flows were projected over a limited number of years, a terminal value was computed as of the end of the last period of projected cash flows. The terminal value was an estimate of the value of the enterprise on a going concern basis as of that future point in time. Discounting each of the projected future cash flows and the terminal value back to the present and summing the results yielded an indication of value for the enterprise. Our board of directors took these three approaches into consideration when establishing the fair value of our ordinary shares.The fair value of our ordinary shares was initially established on July 18, 2006, based on the price per share paid in the Investor Group's initial acquisition. During the first quarter of 2007, we sold approximately $92.6 million of additional ordinary shares to our existing shareholders at a price of $13.89 per share to fund certain acquisitions. This price was then used as the fair value of our ordinary shares until December 31, 2007. During 2007, we began to integrate three acquired companies, all of which expanded our product portfolio and helped to increase our sales by 22%. On January 1, 2008, we increased the value of our ordinary shares to $16.98 per share based on the conclusions of our board of directors in analyzing several factors including an independent valuation. We believe this increase in fair value was warranted based on several factors including our continued revenue growth and broadening product portfolio, offset by our increased operating expenses from the acquired business. From January 1, 2008 to December 27, 2009, we granted 1,105,416 stock options at an exercise price of $16.98 per share. During this period, we continued to experience revenue growth through continued product launches, new product licensing transactions and increased volumes and market share. However, during the same period we increased manufacturing costs and operating expenses to build an operational foundation on which we could sustain continued double digit revenue growth. As a result, we experienced a decrease in our operating profitability and higher levels of cash used to sustain ouroperations compared to 2007. As a result of our continued high growth offset by increased spending levels, we determined that a change in the fair value of our ordinary shares was not necessary. This determination was supported by the fact that, during this time, we sold additional shares of our ordinary shares to various investors, including former shareholders of one of our 2007 acquisitions and certain other business partners, all at a price of $16.98 per share. During this time, we also raised additional working capital through the sale of $52.4 million of notes payable and warrants in February 2008 and $49.3 million of notes payable and warrants in April 2009. These sales of notes payable and warrants were to a combination of then current investors, certain new investors and members of management. In both instances, the exercise price of the warrants sold was set at $16.98 per share as we continued to estimate the value of our ordinary shares to be $16.98 per share. On December 27, 2009, we decided to increase our estimate of the fair value of our ordinary shares to $22.50 per share. Our estimated fair value of $22.50 per share was determined by our board of directors based on several factors including an independent valuation discussed previously. We believed the increase in the estimated fair value of our ordinary shares was appropriate during 2009 as our sales continued to grow at a high rate while our operating profit, excluding depreciation, amortization and share-based compensation, began to increase and our cash flow from operations also improved substantially. Stock options granted during these periods had exercise prices equal to the then estimated fair value of our ordinary shares.We also granted 765,464 options in June of 2010 as part of our annual option grants as well as for certain new employees and a new director. These options were granted within an exercise price of $22.50 per share which we estimated to be the fair value of our underlying shares at the dates of grant. Our board of directors estimated the fair value of our underlying ordinary shares during 2010 by reviewing various factors including our first quarter results, current market conditions, the impact of various 2010 corporate transactions and by reviewing an updated independent valuation report. We believed that certain factors were increasing the fair value of our ordinary shares such as a shortened time period between the estimated valuation date and the estimated date of our pending initial public offering which would reduce the discount to our ordinary shares for the current lack of liquidity and marketability. However, this increase in fair value was offset by two dilutive transactions occurring in 2010 in which we issued additional ordinary shares in our acquisition of C2M and in the exchange of all previously outstanding warrants for ordinary shares (refer to Note 14 of the consolidated financial statements). Both of these transactions included the issuance of additional ordinary shares without corresponding increases in our overall estimated enterprise value. As a result, these transactions reduced the fair value of our ordinary shares on a per share basis. As a result of our analyses, we determined that the fair value of our ordinary shares was $22.50 per ordinary share. The weighted average fair value of the option grants was $11.07 per share aggregating total future compensation of $8.5 million, reduced by our ongoing estimates of expected forfeitures, to be recognized over the four year period subsequent to the respective dates of grant.In October 2010 and December 2010 we granted 135,333 and 95,833 options, respectively, to certain employees. The options were granted with an exercise price of $22.50 per share, which we estimated to be the fair value of our underlying ordinary shares at each grant date.Recent Accounting Pronouncements
In
December 2009,June 2013, the FASB issued Accounting Standards Update (ASU)2009-17,2013-11,ConsolidationsIncome Taxes (ASC Topic810): Improvements740), Presentation of an Unrecognized Tax Benefit When a Net Operating Loss Carryforward, a Similar Tax Loss, or a Tax Credit Carryforward Exists. The ASU requires entities toFinancial Reporting by Enterprises Involved with Variable Interest Entities.present unrecognized tax benefits as a decrease in a net operating loss, similar to tax loss or tax credit carryforward if certain criteria are met. The standard clarifies presentation requirements for unrecognized tax benefits but will not alter the way in which entities assess deferred tax assets for realizability. The guidance is effective for the fiscal year, and interim periods within that fiscal year, beginning after December 15, 2013. We will adopt this guidance beginning in the first quarter of 2014. The impact of adoption is not expected to be material.In March 2013, the FASB issued ASU
2009-172013-05,Foreign Currency Matters (ASC Topic 830), Parent’s Accounting for the Cumulative Adjustment upon Derecognition of Certain Subsidiaries or Groups of Assets within a Foreign Entity or of an Investment in a Foreign Entity. The ASU requiresa qualitative approachentities toidentifyingrelease cumulative translation adjustments to earnings when an entity ceases to have a controlling financial interest in avariable interestsubsidiary or group of assets within a consolidated foreign entity(VIE),andrequires ongoing assessment of whether an entity is a VIE and whether an interestthe sale or transfer results ina VIE makestheholder the primary beneficiarycomplete or substantially complete liquidation of theVIE.foreign entity. Theadoption ofASU2009-17 in January 2010 did not have a material impact on the Company's consolidated financial statements.
In January 2010, the FASB issued ASU 2010-6,Fair Value Measurements and Disclosures (ASC Topic 820):Improving Disclosures about Fair Value Measurements, which requires reporting entities to make new disclosures about recurring or nonrecurring fair value measurements including (i) significant transfers into and out of Level 1 and Level 2 fair value measurements and (ii) information on purchases, sales, issuances and settlements on a gross basis in the reconciliation of Level 3 fair value measurements. ASU2010-6 wasis effective for the fiscal year, and interimand annual reportingperiods within that fiscal year, beginning after December 15,2009, except for Level 3 reconciliation disclosures which are effective for interim2013 andannual periods beginning after December 15, 2010. The Company adopted the additional disclosures required for Level 1 and Level 2 fair value measurementsis to be applied prospectively. We will adopt this guidance in the first quarter of2010.2014 and will affect the accounting for any future liquidation of foreign subsidiaries.In February 2013, the FASB issued ASU 2013-04,Liabilities (ASC Topic 405), Obligations Resulting from Joint and Several Liability Arrangements for Which the Total Amount of the Obligation is Fixed at the Reporting Date.The
CompanyASU requires an entity that is jointly and severally liable to measure the obligation as the sum of the amount the entity has agreed with co-obligors to pay and any additional amount it expects to pay on behalf of one or more co-obligors. The amendment is effective for the fiscal year, and interim periods with that fiscal year, beginning after December 15, 2013 and should be applied retrospectively. We will adoptLevel 3 disclosures beginningthis guidance in the first quarter of2011.
ItemITEM 7A.Quantitative and Qualitative Disclosures About Market Risk.
QUANTITATIVE AND QUALITATIVE DISCLOSURES ABOUT MARKET RISKWe are exposed to various market risks, which may result in potential losses arising from adverse changes in market rates and prices, such as interest rates and foreign currency exchange rate fluctuations. We do not enter into derivatives or other financial instruments for trading or speculative purposes. We believe we are not exposed to a material market risk with respect to our invested cash and cash equivalents.
Interest Rate Risk
Borrowings under our
variousrevolvinglines ofcreditin the United Statesfacility andin Europe generallyU.S. dollar denominated term loan bear interest at variableannual rates. Borrowings under our various term loans in the United States and Europe are mixed between variable and fixed interestrates. As ofJanuary 2, 2011,December 29, 2013, we had$20.6no borrowings under our revolving credit facility and $60.9 million in borrowings under ourrevolving lines of creditU.S. dollar denominated term loan and$33.2 million in borrowings under various term loans.other debt. Based upon this debt level, and the LIBOR floor on our interest rate, a10%100 basis point increase in the annual interest rate on such borrowings wouldnothavea materialan immaterial impact on our interestexpense.expense on an annual basis.At
Januaryour option, borrowings under our revolving credit facility and our U.S. dollar denominated term loan facility bear interest at (a) the alternate base rate (if denominated in U.S. dollars), equal to the greatest of (i) the prime rate in effect on such day, (ii) the federal funds rate in effect on such day plus 1/22011,of 1%, and (iii) the adjusted LIBO rate plus 1%, plus in the case of each of (i)-(iii) above, an applicable rate of 2.00% or 2.25% (depending on our total net leverage ratio as defined in our credit agreement), or (b) the applicable adjusted LIBO rate for the relevant interest period plus an applicable rate of 3.00% or 3.25% (depending on our total net leverage ratio), plus the mandatory cost (as defined in our credit agreement) if such loan is made in a currency other than U.S. dollars or from a lending office in the United Kingdom or a participating member state (as defined in our credit agreement).At December 29, 2013 our cash and cash equivalents were
$24.8$56.8 million. Based on our annualized average interest rate, a 10% decrease in the annual interest rate on such balances wouldnot have a materialresult in an immaterial impact on our interestexpense.income on an annual basis.Foreign Currency Exchange Rate Risk
Fluctuations in the exchange rate
of exchangebetween the U.S. dollar and foreign currencies could adversely affect our financial results. Infiscal years 2010, 20092013 and2008,2012, approximately44%, 44%41% and49%44%, respectively, of oursalesrevenues were denominated in foreigncurrencies.currencies, respectively. We expect that foreign currencies will continue to represent a similarly significant percentage of oursalesrevenues in the future. Operating expenses related to thesesalesrevenues are largely denominated in the same respective currency, thereby limiting our transaction riskexposure. We therefore believe that the risk of a significant impact on our operating income from foreign currency fluctuations is not significant.exposure, to some extent. However, forsalesrevenues not denominated in U.S. dollars, if there is an increase in the rate at which a foreign currency is exchanged for U.S. dollars, it will require more of the foreign currency to equal a specified amount of U.S. dollars than before the rate increase. In such cases and if we price our products in the foreign currency, we will receive less in U.S. dollars than we did before the rate increase went into effect. If we price our products in U.S. dollars and competitors price their products in local currency, an increase in the relative strength of the U.S. dollar could result in our prices not being competitive in a market where business is transacted in the local currency.In
2010,2013, approximately83%76% of our revenues denominated in foreigncurrency denominated salescurrencies were derived fromEUEuropean Union countries and were denominated in Euros. Additionally, we have significant intercompany payables and debt with certain European subsidiaries, which are denominated in foreign currencies, principally the Euro. Our principal exchange rate risk therefore exists between the U.S. dollar and the Euro.Fluctuations from the beginning to the end of any given reporting period result in the
remeasurementre-measurement of our foreign currency-denominated cash, receivables, payables anddebt-generatingdebt, generating currency transaction gains or losses that impact our non-operatingrevenue/income/expense levels in the respective period and are reported in foreign currency transaction gain (loss) in our consolidated financial statements.We recorded a foreign currency transaction loss of approximately $8.2 million in 2010 related to the translation of our foreign-denominated receivables, payablesIn 2013 anddebt into U.S. dollars. We do not currently hedge2012, we economically hedged our exposure toforeign currency exchange rate fluctuations. We may, however, hedge such exposure to foreign currency exchange ratesfluctuations in thefuture.Euro and other currencies by entering into foreign exchange forward contracts.ItemITEM 8.Financial Statements and Supplementary Data.
FINANCIAL STATEMENTS AND SUPPLEMENTARY DATAIndex to Consolidated Financial Statements
ReportReports of Independent Registered Public Accounting Firm8364Consolidated Balance Sheets
8466Consolidated Statements of Operations
856767 8668Consolidated Statements of
Shareholders'Shareholders’ Equityand Comprehensive Loss8769Notes to Consolidated Financial Statements
8870
Report of Independent Registered Public Accounting FirmThe Board of Directors
and Shareholdersof Tornier
B.V.N.V. and subsidiariesWe have audited the accompanying consolidated balance sheets of Tornier
B.V.N.V. and subsidiaries(the Company)as ofJanuary 2, 2011December 29, 2013, and December27, 2009,30, 2012, and the related consolidated statements of operations,shareholders'comprehensive loss, shareholders’ equity, and cash flows for each of the three fiscal years in the period endedJanuary 2, 2011.December 29, 2013. Our audits also included the financial statement schedule listed in the Index at Item 15(a). These financial statements and schedule are the responsibility of theCompany'sCompany’s management. Our responsibility is to express an opinion on these financial statements and schedule based on our audits.We conducted our audits in accordance with the standards of the Public Company Accounting Oversight Board (United States). Those standards require that we plan and perform the audit to obtain reasonable assurance about whether the financial statements are free of material misstatement.
We were not engaged to perform an audit of the Company's internal control over financial reporting. Our audits included consideration of internal control over financial reporting as a basis for designing audit procedures that are appropriate in the circumstances, but not for the purpose of expressing an opinion on the effectiveness of the Company's internal control over financial reporting. Accordingly, we express no such opinion.An auditalsoincludes examining, on a test basis, evidence supporting the amounts and disclosures in the financialstatements,statements. An audit also includes assessing the accounting principles used and significant estimates made by management,andas well as evaluating the overall financial statement presentation. We believe that our audits provide a reasonable basis for our opinion.In our opinion, the
consolidatedfinancial statements referred to above present fairly, in all material respects, the consolidated financial position of TornierB.V.N.V. and subsidiaries atJanuary 2, 2011December 29, 2013 and December27, 2009,30, 2012, and the consolidated results of their operations and their cash flows for each of the three fiscal years in the period endedJanuary 2, 2011,December 29, 2013, in conformity with U.S. generally accepted accounting principles. Also, in our opinion, the related financial statement schedule, when considered in relation to the basic financial statements taken as a whole, presents fairly in all material respects the information set forth therein.As discussedWe also have audited, inNote 2accordance with the standards of theconsolidatedPublic Company Accounting Oversight Board (United States), Tornier N.V.’s internal control over financialstatements, the Company adopted the provisions of ASC Topic 740,Income Taxes, related to accounting for uncertainty in income taxes,reporting as of December 29,2008. Additionally, as discussed2013, based on criteria established inNote 7Internal Control-Integrated Framework issued by the Committee of Sponsoring Organizations of theconsolidatedTreadway Commission (1992 framework) and our report dated February 21, 2014, expressed an unqualified opinion thereon./s/ Ernst & Young LLP
Minneapolis, MN
February 21, 2014
Report of Independent Registered Public Accounting Firm
The Board of Directors and Shareholders
of Tornier N.V. and Subsidiaries
We have audited Tornier N.V. and subsidiaries’ internal control over financial reporting as of December 29, 2013, based on criteria established in Internal Control—Integrated Framework issued by the Committee of Sponsoring Organizations of the Treadway Commission (1992 framework) (the COSO criteria). Tornier N.V. and subsidiaries’ management is responsible for maintaining effective internal control over financial reporting, and for its assessment of the effectiveness of internal control over financial reporting included in the accompanying Management’s Annual Report on Internal Control Over Financial Reporting. Our responsibility is to express an opinion on the company’s internal control over financial reporting based on our audit.
We conducted our audit in accordance with the standards of the Public Company Accounting Oversight Board (United States). Those standards require that we plan and perform the audit to obtain reasonable assurance about whether effective internal control over financial reporting was maintained in all material respects. Our audit included obtaining an understanding of internal control over financial reporting, assessing the risk that a material weakness exists, testing and evaluating the design and operating effectiveness of internal control based on the assessed risk, and performing such other procedures as we considered necessary in the circumstances. We believe that our audit provides a reasonable basis for our opinion.
A company’s internal control over financial reporting is a process designed to provide reasonable assurance regarding the reliability of financial reporting and the preparation of financial statements
the Company adopted the provisions of ASC Topic 815-40,
Derivativesfor external purposes in accordance with generally accepted accounting principles. A company’s internal control over financial reporting includes those policies andHedging, and changed its method of accounting for certain instruments indexedprocedures that (1) pertain to theCompany's own stock.maintenance of records that, in reasonable detail, accurately and fairly reflect the transactions and dispositions of the assets of the company; (2) provide reasonable assurance that transactions are recorded as necessary to permit preparation of financial statements in accordance with generally accepted accounting principles, and that receipts and expenditures of the company are being made only in accordance with authorizations of management and directors of the company; and (3) provide reasonable assurance regarding prevention or timely detection of unauthorized acquisition, use, or disposition of the company’s assets that could have a material effect on the financial statements.Because of its inherent limitations, internal control over financial reporting may not prevent or detect misstatements. Also, projections of any evaluation of effectiveness to future periods are subject to the risk that controls may become inadequate because of changes in conditions, or that the degree of compliance with the policies or procedures may deteriorate.
In our opinion, Tornier N.V. and subsidiaries maintained, in all material respects, effective internal control over financial reporting as of December 29, 2013, based on the COSO criteria.
We also have audited, in accordance with the standards of the Public Company Accounting Oversight Board (United States), the consolidated balance sheets of Tornier N.V. and subsidiaries as of December 29, 2013 and December 30, 2012, and the related consolidated statement of operations, comprehensive loss, shareholders’ equity, and cash flows for each of the three fiscal years in the period ended December 29, 2013 and our report dated February 21, 2014 expressed an unqualified opinion thereon.
/s/ Ernst & Young LLP
Minneapolis, Minnesota
March 11, 2011February 21, 2014
TORNIER N.V. AND SUBSIDIARIES
Tornier B.V.
Consolidated Balance Sheets(U.S. dollars in thousands, except share and per share
data)
January 2,
2011December 27,
2009December 29,
2013December 30,
2012Assets
Assets
Current assets:
Cash and cash equivalents
$ 24,838 $ 37,969 Accounts receivable (net of allowance of $2,519 and $2,667, respectively)
42,758 40,447 Inventories
77,525 68,621 Income taxes receivable
2,835 2,835 Deferred income taxes
2,587 2,860 Prepaid taxes
11,179 10,356 Prepaid expenses
7,444 3,353 Other current assets
4,048 4,707 Current assets:
Cash and cash equivalents
$ 56,784 $ 31,108 Accounts receivable (net of allowance of $5,080 and $4,846, respectively)
55,555 54,192 Inventories
87,011 86,697 Income taxes receivable
— 382 Deferred income taxes
5,601 2,734 Prepaid taxes
14,667 14,752 Prepaid expenses
3,151 2,998 Other current assets
3,756 4,455 Total current assets
Total current assets
173,214 171,148 226,525 197,318 Instruments, net
Instruments, net
42,378
40,45063,055 51,394 Property, plant, and equipment, net
33,680 35,076 Property, plant and equipment, net
43,494 37,151 Goodwill
Goodwill
131,830 136,949 251,540 239,804 Intangible assets, net
Intangible assets, net
109,024 125,221 117,608 126,594 Deferred income taxes
Deferred income taxes
440 10,530 660 159 Other assets
Other assets
612 813 2,544 1,807 Total assets
Total assets
$ 491,178 $ 520,187 $ 705,426 $ 654,227 Liabilities and shareholders' equity
Current liabilities:
Short-term borrowing and current portion of long-term debt
$ 28,392 $ 23,299 Accounts payable
12,890 12,925 Accrued liabilities
34,620 35,580 Income taxes payable
327 351 Deferred income taxes
20 — Liabilities and shareholders’ equity
Current liabilities:
Short-term borrowing and current portion of long-term debt
$ 1,438 $ 4,595 Accounts payable
17,326 11,526 Accrued liabilities
50,714 44,410 Income taxes payable
397 83 Contingent consideration, current
6,428 — Deferred income taxes
13 12 Total current liabilities
Total current liabilities
76,249 72,155 76,316 60,626 Notes payable
84,261
69,535Other long-term debt
25,467 22,889 Long-term debt
67,643 115,457 Deferred income taxes
Deferred income taxes
28,706 21,557 21,489 20,284 Warrant liabilities
— 85,215 Contingent liabilities
1,860 3,167 Contingent consideration, long-term
6,528 15,265 Other non-current liabilities
Other non-current liabilities
4,396 2,622 7,642 6,516 Total liabilities
Total liabilities
220,939 277,140 179,618 218,148 Redeemable non-controlling interest
—
23,259Shareholders' equity:
Shareholders’ equity:
Ordinary shares, €0.03 par value; authorized 175,000,000; issued and outstanding 48,508,612 and 41,728,257 at December 29, 2013 and December 30, 2012, respectively
1,921 1,655 Additional paid-in capital
769,466 660,968 Accumulated deficit
(272,158 ) (235,732 ) Accumulated other comprehensive income
26,579 9,188 Ordinary shares, $0.03 par value; authorized 100,000,000; issued and outstanding 29,568,731 and 24,666,970 at January 2, 2011 and December 27, 2009, respectively
1,156 968 Total shareholders’ equity
525,808 436,079 Additional paid-in capital
437,307 344,049 Total liabilities and shareholders’ equity
$ 705,426 $ 654,227 Accumulated deficit
(183,532 ) (144,718 ) Accumulated other comprehensive income
15,308 19,489 Total shareholders' equity
270,239 219,788 Total liabilities and shareholders' equity
$ 491,178 $ 520,187 The accompanying notes are an integral part of the consolidated financial statements.
Tornier B.V.
Consolidated Statements of Operations(U.S. dollars in thousands, except share and per share
data)
amounts)Fiscal year ended December 29,
2013December 30,
2012January 1,
2012Revenue
$ 310,959 $ 277,520 $ 261,191 Cost of goods sold
86,172 81,918 74,882 Gross profit
224,787 195,602 186,309 Operating expenses:
Selling, general and administrative
206,851 170,447 161,448 Research and development
22,387 22,524 19,839 Amortization of intangible assets
15,885 11,721 11,282 Special charges
3,738 19,244 892 Total operating expenses
248,861 223,936 193,461 Operating loss
(24,074 ) (28,334 ) (7,152 ) Other income (expense):
Interest income
245 338 550 Interest expense
(7,256 ) (3,733 ) (4,326 ) Foreign currency transaction (loss) gain
(1,820 ) (473 ) 193 Loss on extinguishment of debt
(1,127 ) (593 ) (29,475 ) Other non-operating (expense) income, net
(45 ) 116 1,330 Loss before income taxes
(34,077 ) (32,679 ) (38,880 ) Income tax (expense) benefit
(2,349 ) 10,935 8,424 Consolidated net loss
$ (36,426 ) $ (21,744 ) $ (30,456 ) Net loss per share:
Basic and diluted
$ (0.79 ) $ (0.54 ) $ (0.80 ) Weighted average shares outstanding:
Basic and diluted
45,826 40,064 38,227 TORNIER N.V. AND SUBSIDIARIES
(U.S. dollars in thousands)
Fiscal Year Ended January 2,
2011December 27,
2009December 28,
2008Revenue
$ 227,378 $ 201,462 $ 177,370 Cost of goods sold
63,437 54,859 45,500 Gross profit
163,941 146,603 131,870 Operating expenses:
Sales and marketing
126,809 115,630 106,870 General and administrative
22,366 20,790 21,742 Research and development
17,896 18,120 20,635 Amortization of intangible assets
11,492 15,173 11,186 Special charges
306 1,864 — Total operating expenses
178,869 171,577 160,433 Operating loss
(14,928 ) (24,974 ) (28,563 ) Other income (expense):
Interest (expense)
(21,582 ) (19,667 ) (11,171 ) Foreign currency transaction gain (loss)
(8,163 ) 3,003 1,701 Other non-operating income (expense), net
43 (28,461 ) (1,371 ) Loss before income taxes
(44,630 ) (70,099 ) (39,404 ) Income tax benefit
5,121
14,413
5,227Consolidated net loss
(39,509 ) (55,686 ) (34,177 ) Net loss attributable to non-controlling interest
(695 ) (1,067 ) (1,173 ) Net loss attributable to Tornier
(38,814 ) (54,619 ) (33,004 ) Accretion of non-controlling interest
(679 ) (1,127 ) (3,761 ) Net loss attributable to ordinary shareholders
$ (39,493 ) $ (55,746 ) $ (36,765 ) Net loss per share:
Basic and diluted
$ (1.42 ) $ (2.28 ) $ (1.54 ) Weighted-average shares outstanding:
Basic and diluted
27,770 24,408 23,930 Fiscal year ended December 29,
2013December 30,
2012January 1,
2012Consolidated net loss
$ (36,426 ) $ (21,744 ) $ (30,456 ) Unrealized gain (loss) on retirement plans, net of tax
95 (866 ) (32 ) Foreign currency translation adjustments
17,296 4,938 (10,160 ) Comprehensive loss
$ (19,036 ) $ (17,672 ) $ (40,648 ) The accompanying notes are an integral part of the consolidated financial statements.
Tornier B.V.
Consolidated Statements of Cash Flows(U.S. dollars in thousands)
Fiscal Year Ended Fiscal year ended January 2,
2011December 27,
2009December 28,
2008December 29,
2013December 30,
2012January 1,
2012Cash flows from operating activities:
Cash flows from operating activities:
Consolidated net loss
$ (36,426 ) $ (21,744 ) $ (30,456 ) Adjustments to reconcile consolidated net loss to cash provided by operating activities:
Depreciation and amortization
36,566 30,232 28,107 Impairment of fixed assets
140 2,041 — Lease termination costs
— 731 — Intangible impairment
— 4,737 210 Non-cash foreign currency loss (gain)
1,829 (495 ) 298 Deferred income taxes
3,566 (4,506 ) (11,619 ) Tax benefit from reversal of valuation allowance
(1,120 ) (10,700 ) — Share-based compensation
8,300 6,830 6,547 Non-cash interest expense and discount amortization
969 524 2,040 Inventory obsolescence
8,447 8,171 4,996 Loss on extinguishment of debt
1,127 — 29,475 Incentive related to new facility lease
— 1,400 — Acquired inventory step-up
5,908 1,993 — Gain on reversal of OrthoHelix contingent consideration liability
(5,140 ) — — Other non-cash items affecting earnings
1,095 1,836 (186 ) Changes in operating assets and liabilities, net of acquisitions:
Accounts receivable
(1,084 ) (2,188 ) (4,673 ) Inventories
(9,186 ) (3,057 ) (7,939 ) Accounts payable and accruals
7,421 87 2,573 Other current assets and liabilities
4,704 (1,526 ) 3,987 Other non-current assets and liabilities
(2,134 ) 65 (194 ) Consolidated net loss
$ (39,509 ) $ (55,686 ) $ (34,177 ) Adjustments to reconcile consolidated net loss to cash provided by (used in) operating activities:
Depreciation and amortization
27,038 29,732 22,331 Non-cash foreign currency (gain) loss
7,143 (3,898 ) (317 ) Deferred income taxes
(6,548 ) (11,807 ) (5,732 ) Share-based compensation
5,630 3,913 3,672 Non-cash interest expense and discount amortization
19,612 17,202 9,320 Inventory obsolescence
5,212 6,781 3,587 Change in fair value of warrant liability
(172 ) 28,027 — Other non-cash items affecting earnings
1,871 2,062 861 Changes in operating assets and liabilities, net of acquisitions:
Accounts receivable
(3,790 ) 425 (5,007 ) Inventories
(17,349 ) (13,927 ) (18,222 ) Accounts payable and accruals
2,348 497 794 Other current assets and liabilities
(307 ) (870 ) 3,372 Other non-current assets and liabilities
1,710 (160 ) 36 Net cash provided by (used in) operating activities
2,889 2,291 (19,482 ) Net cash provided by operating activities
24,982 14,431 23,166 Cash flows from investing activities:
Cash flows from investing activities:
Acquisition-related cash payments
(2,328 ) (7,656 ) (12,730 ) Consolidation of non-controlling interest
— — 1,038 Additions of instruments
(13,838 ) (12,339 ) (18,155 ) Purchases of property, plant, and equipment
(6,687 ) (11,109 ) (13,467 ) Acquisition-related cash payments
(10,148 ) (102,612 ) — Purchases of intangible assets
(2,935 ) (1,410 ) (3,142 ) Additions of instruments
(23,805 ) (11,999 ) (19,734 ) Property, plant and equipment lease incentive
— (1,400 ) — Purchases of property, plant and equipment
(10,825 ) (9,891 ) (6,599 ) Proceeds from sale of property, plant and equipment
— 1,517 — Net cash used in investing activities
Net cash used in investing activities
(22,853 ) (31,104 ) (43,314 ) (47,713 ) (125,795 ) (29,475 ) Cash flows from financing activities:
Cash flows from financing activities:
Change in short-term debt
6,468 (3,506 ) (2,122 ) Repayments of long-term debt
(7,687 ) (9,881 ) (2,869 ) Proceeds from issuance of long-term debt
11,361 6,030 10,198 Proceeds from the issuance of notes payable and warrants
— 49,332 52,406 Deferred financing costs
(3,534 ) — — Issuance of ordinary shares
819 2,882 8,874 Change in short-term debt
(1,000 ) (8,009 ) (10,513 ) Repayments of long-term debt
(54,095 ) (28,684 ) (8,147 ) Repayment of notes payable
— — (116,108 ) Proceeds from issuance of long-term debt
1,796 121,045 5,032 Deferred financing costs
(111 ) (5,396 ) (2,731 ) Issuance of ordinary shares from stock option exercises
21,481 7,710 — Proceeds from other issuance of ordinary shares
78,952 — 171,577 Net cash provided by financing activities
Net cash provided by financing activities
7,427 44,857 66,487 47,023 86,666 39,110 Effect of exchange rate changes on cash and cash equivalents
Effect of exchange rate changes on cash and cash equivalents
(594
)
577
3101,384 1,100 (2,933 ) (Decrease)/Increase in cash and cash equivalents
(13,131 ) 16,621 4,001 Increase (decrease) in cash and cash equivalents
25,676 (23,598 ) 29,868 Cash and cash equivalents:
Cash and cash equivalents:
Beginning of period
31,108 54,706 24,838 Beginning of period
37,969 21,348 17,347 End of period
$ 24,838 $ 37,969 $ 21,348 End of period
$ 56,784 $ 31,108 $ 54,706 Non cash investing and financing transactions:
Non cash investing and financing transactions:
Fixed assets acquired pursuant to capital lease
$ 42 $ 560 $ 640 Fixed assets acquired pursuant to capital lease
$ 614 $ — $ — Capitalized software development costs
$ 1,180 $ — $ — Supplemental disclosure:
Supplemental disclosure:
Income taxes paid
$ 1,700 $ 2,937 $ 1,119 Income taxes (refunded) paid
$ 999 $ (2,163 ) $ 1,317 Interest paid
$ 6,043 $ 2,084 $ 2,235 Interest paid
$ 2,193 $ 1,854 $ 1,865 The accompanying notes are an integral part of the consolidated financial statements.
Tornier B.V.
Consolidated Statements ofShareholders'Shareholders’ Equity(U.S. dollars in thousands, except share and
Comprehensive Loss(in thousands)
per share amounts)Ordinary shares Accumulated
Other
Comprehensive
Income (Loss)Additional
Paid-In
CapitalAccumulated
DeficitShares Amount Total Balance at December 31, 2007
20,375 $ 782 $ 278,975 $ 27,811 $ (57,692 ) $ 249,876 Net loss
— — — — (33,004 ) (33,004 ) Foreign currency translation adjustments
— — — (7,211 ) — (7,211 ) Other
— — — 67 — 67 Total comprehensive loss
— — — — — (40,148 ) Accretion of non-controlling interest
— — (3,761 ) — — (3,761 ) Issuance of warrants related to debt financing, net of $7,466 tax
— — 21,812 — — 21,812 Issuance of common stock related to acquisitions
303 14 5,138 — — 5,152 Issuance of common stock related to stock option exercise
8 — 117 — — 117 Other issuances of common stock
214 8 3,597 — — 3,605 Share-based compensation
— — 3,672 — — 3,672 Balance at December 28, 2008
20,900 $ 804 $ 309,550 $ 20,667 $ (90,696 ) $ 240,325 Net loss
— — — — (54,619 ) (54,619 ) Foreign currency translation adjustments
— — — (1,032 ) — (1,032 ) Other
— — — (146 ) — (146 ) Total comprehensive loss
— — — — — (55,797 ) Accretion of non-controlling interest
— — (1,127 ) — — (1,127 ) Adoption of ASC Topic 740
— — — — (266 ) (266 ) Adoption of ASC Topic 815
— — (21,812 ) — 863 (20,949 ) Issuance of common stock related to stock option exercise
10 — 135 — — 135 Conversion of mandatorily convertible debt
3,409 149 50,288 — — 50,437 Other issuances of common stock
348 15 2,731 — — 2,746 Share-based compensation
— — 4,284 — — 4,284 Balance at December 27, 2009
24,667 $ 968 $ 344,049 $ 19,489 $ (144,718 ) $ 219,788 Net loss
— — — — (38,814 ) (38,814 ) Foreign currency translation adjustments
— — — (4,181 ) — (4,181 ) Total comprehensive loss
— — — — — (42,995 ) Accretion of non-controlling interest
— — (679 ) — — (679 ) Conversion of warrants to ordinary shares, net of $21, 686 tax
3,780 143 63,156 — — 63,299 Acquisition of C2M Medical, Inc.
1,031 41 23,159 — — 23,200 Issuances of ordinary shares to related parties
44 2 980 — — 982 Other issuances of ordinary shares
47 2 817 — — 819 Share-based compensation
— — 5,825 — — 5,825 Balance at January 2, 2011
29,569 $ 1,156 $ 437,307 $ 15,308 $ (183,532 ) $ 270,239 Ordinary Shares Additional
Paid-InAccumulated
Other
ComprehensiveAccumulated Total Shares Amount Capital Income (Loss) Deficit Balance at January 2, 2011
29,569 $ 1,156 $ 437,307 $ 15,308 $ (183,532 ) $ 270,239 Net loss attributable to Tornier
— — — — (30,456 ) (30,456 ) Unrealized loss on retirement plans
— — — (32 ) — (32 ) Foreign currency translation adjustments
— — — (10,160 ) — (10,160 ) Initial public offering financing costs
— — (17,962 ) — — (17,962 ) Issuances of ordinary shares related to initial public offering
9,471 394 179,560 — — 179,954 Issuance of ordinary shares related to stock option exercises
230 10 3,310 — — 3,320 Share-based compensation
— — 6,557 — — 6,557 Balance at January 1, 2012
39,270 $ 1,560 $ 608,772 $ 5,116 $ (213,988 ) $ 401,460 Net loss
— — — — (21,744 ) (21,744 ) Unrealized loss on retirement plans
— — — (866 ) — (866 ) Foreign currency translation adjustments
— — — 4,938 — 4,938 Issuances of ordinary shares related to acquisition of OrthoHelix Surgical Designs, Inc.
1,941 75 37,954 — — 38,029 Issuances of ordinary shares related to employee stock purchase plan
8 1 169 — — 170 Issuances of ordinary shares for restricted stock units
50 2 (2 ) — — — Issuance of ordinary shares related to stock option exercises
459 17 7,523 — — 7,540 Share-based compensation
— — 6,552 — — 6,552 Balance at December 30, 2012
41,728 $ 1,655 $ 660,968 $ 9,188 $ (235,732 ) $ 436,079 Net loss
— — — — (36,426 ) (36,426 ) Unrealized loss on retirement plans
— — — 95 — 95 Foreign currency translation adjustments
— — — 17,296 — 17,296 Secondary offering financing costs
— — (4,878 ) — — (4,878 ) Issuance of ordinary shares related to public offering
5,175 202 83,375 — — 83,577 Issuances of ordinary shares related to employee stock purchase plan
15 1 253 — — 254 Issuances of ordinary shares for restricted stock units
98 4 (4 ) — — — Issuance of ordinary shares related to stock option exercises
1,493 59 21,422 — — 21,481 Share-based compensation
— — 8,330 — — 8,330 �� Balance at December 29, 2013
48,509 $ 1,921 $ 769,466 $ 26,579 $ (272,158 ) $ 525,808 The accompanying notes are an integral part of the consolidated financial statements.
TORNIER N.V. AND SUBSIDIARIES
Table of ContentsNotes to the Consolidated Financial Statements1. Business Description
Tornier
B.V.,N.V. (Tornier or theCompany,Company) is a global medical device company focused on providing solutions to surgeons that treat musculoskeletal injuries and disorders of the shoulder, elbow, wrist, hand, ankle andfoot. Tornier refersfoot, referred tothese surgeonsasextremity specialists. Tornier“extremity joints.” The Company sells to thisextremity specialist customersurgeon base a broad line of joint replacement, trauma, sports medicine and biologic products to treat extremity joints.The Company's motto of "specialists serving specialists" encompasses this focus.In certain international markets,Tornierthe Company also offers joint replacement products for the hip and knee.Tornier currently sells over 80 product linesTornier’s global corporate headquarters are located in
approximately 35 countries.Tornier has a tradition of innovation, intense focus on surgeon education, and commitment to advancement of orthopaedic technology since its founding approximately 70 years ago in France by René Tornier. Tornier's history includesAmsterdam, theintroduction of the world's first porous orthopaedic hip implant, the application of the Morse taper, which is a reliable means of joining modular orthopaedic implants and, more recently, the introduction of the reversed shoulder implant in the United States. This track record of innovation over the decades stems from our close collaboration with leading orthopaedic surgeons and thought leaders throughout the world.Netherlands. The Company
was acquiredalso has significant operations located in2006 by an investor group led by Warburg Pincus (Bermuda) Private Equity IX, L.P.Bloomington, Minnesota (U.S. headquarters, sales, marketing and distribution and administration),or WP Bermuda,Grenoble, France (OUS headquarters, manufacturing andmedical device investors, including The Vertical Group, L.P.research and development),or The Vertical Group,Macroom, Ireland (manufacturing), Warsaw, Indiana (research andSplit Rock Partners, L.P.,development) andDouglas W. Kohrs, Tornier's PresidentMedina, Ohio (marketing, research andChief Executive Officer.During 2007,development). In addition, the Companymade several acquisitions that expanded its product offerings withinconducts local sales and distribution activities across 13 sales offices throughout Europe, Asia, Australia and Canada.Basis of Presentation
The Company’s fiscal year-end is generally determined on a 52-week basis consisting of four 13 week quarters and always falls on the
orthopaedic industry.Sunday nearest to December 31.The consolidated financial statements and accompanying notes present the consolidated results of the Company for each of the fiscal years in the three-year period ended December 29, 2013, December 30, 2012 and January
2,1, 2012.On January 28, 2011,
December 27, 2009the Company executed a 3-to-1 reverse stock split of the Company’s ordinary shares.On January 28, 2011, the Company made a change to its legal form by converting from Tornier B.V., a private company with limited liability (besloten vennootschap met beperkte aansprakelijkheid) to Tornier N.V., a public company with limited liability (naamloze vennootschap).
In February 2011, the Company completed an initial public offering of 8,750,000 ordinary shares at an offering price of $19.00 per share (before underwriters’ discounts and
December 28, 2008.The Company's global headquarters are located in Amsterdam, the Netherlands. The Company's U.S. headquarters are in Edina, Minnesota, and its U.S. sales and distribution operations are in Stafford, Texas.commissions). The Companyhas manufacturing, researchreceived proceeds of approximately $149.2 million (after underwriters’ discounts anddevelopment, salescommissions of approximately $10.8 million anddistributionadditional offering related costs of $6.2 million). Net proceeds were used for the retirement of debt, working capital andadministrative activities in Grenoble, France.other general corporate purposes. Additionally, on March 7, 2011, the Company issued an additional 721,274 ordinary shares at an offering price of $19.00 per share (before underwriters’ discounts and commissions) due to the exercise of the underwriters’ overallotment option. The Companyalso has manufacturing operationsreceived additional net proceeds of approximately $12.8 million (after underwriters’ discounts and commissions of approximately $0.9 million).All amounts are presented in
Ireland. The Company hasU.S. Dollar (“$”), except where expressly stated as being in othersales and distribution operations in Australia, Germany, Italy, The Netherlands, Spain, the United Kingdom, Scandinavia and Switzerland. The Company also has other research and development and quality and regulatory functions located in Warsaw, Indiana, San Diego, California and Beverly, Massachusetts.currencies, e.g. Euros (“€”).In 2009, the Company consolidated its U.S. operations and closed quality and regulatory and sales and marketing functions in San Diego, California and manufacturing operations in Beverly, Massachusetts. See Note 18 for further details.In 2008, the Company changed its fiscal reporting periods to 13-week quarters and a 52-week annual period, which ends on the Sunday nearest to and preceding December 31. The 2008 fiscal year began on January 1, 2008 and ended on December 28, 2008. This change did not have a material effect on the consolidated financial statements as compared to the prior years. During the first quarter of 2010 the Company added a 14thweek to the quarterly reporting period in order to make up for past annual periods that included only 364 days under the 52-week annual period rather than a full 365 day annual period. As a result, the first quarter of 2010 includes an extra week of operations as compared to the first quarter of 2009.2. Significant Accounting Policies
Consolidation
The consolidated financial statements include the accounts of the Company and all of its wholly and majority owned subsidiaries.
Additionally, the Company has consolidated the assets and liabilities of a variable interest entity (VIE), C2M Medical Inc. (C2M), for which the Company is deemed to be the primary beneficiary in 2009 and 2008. During 2010, the Company exercised its option to acquire the outstanding shares of C2M in exchange for Tornier ordinary shares. Upon exercise of the purchase option, a non-controlling interest in C2M no longer existed. The balance of the non-controlling interest was eliminated and the fair value of the shares issued in the acquisition, $23.2 million, was recorded as a component of shareholders' equity.In consolidation, all material intercompany accounts and transactions are eliminated.Use of Estimates
The consolidated financial statements are prepared in conformity with United States generally accepted accounting principles
(GAAP)(U.S. GAAP) and include amounts that are based onmanagement'smanagement’s best estimates and judgments. Actual results could differ from those estimates.Foreign Currency Translation
The functional currencies for the Company and all of the
Company'sCompany’s wholly owned subsidiaries are their local currencies. The reporting currency of the Company is theUnited StatesU.S. dollar. Accordingly, the consolidated financial statements of the Company and its international subsidiaries are translated intoUnited StatesU.S. dollars using current exchange rates for the consolidated balance sheets and average exchange rates for the consolidated statements of operations and cash flows. Unrealized translation gains and losses are included in accumulated other comprehensive income (loss) inshareholders'shareholders’ equity. When a transaction is denominated in a currency other than thesubsidiary'ssubsidiary’s functional currency, the Company recognizes a transaction gain or loss in net earnings. Foreign currency transaction (losses) gains(losses)included in net earnings were$(8.2)$(1.8) million,$3.0$(0.5) million and$1.7$0.2 million during thefiscalyears ended December 29, 2013, December 30, 2012 and January2, 2011, December 27, 2009, and December 28, 2008,1, 2012, respectively.Included in the $3.0 million of foreign currency transaction gain recognized in 2009 is $3.9 million related to the revaluation of warrants carried as a liability on the consolidated balance sheets, which are denominated in a currency other than Tornier NV's functional currency.Revenue Recognition
The Company derives
itsrevenue from the sale of medical devices that are used by orthopaedic and general surgeons who treat diseases and disorders of extremity joints, including the shoulder, elbow, wrist, hand, ankle andfoot. The Company's revenuefoot, and large joints, including the hip and knee. Revenue is generated from sales to two types of customers: healthcare institutions anddistributors. Salesstocking distributors, with sales to healthcare institutionsrepresent therepresenting a majority of theCompany'sCompany’s revenue.The Company utilizes a network of independent commission based sales agencies for sales in the United States and a combination of direct sales organizations, independent sales representatives and distributors for sales outside the United States. Generally, revenueRevenue from sales to healthcare institutions is recognized at the time of surgical implantation.The Company generally records revenueRevenue from sales toitsstocking distributors is recorded at the time the product is shipped to the distributor.Distributors,These stocking distributors, who sell the products to their customers, take title to the products and assume all risks of ownership at the time of shipment.The Company does not have any arrangements with distributors that allow for retroactive pricing adjustments. The Company'sStocking distributors are obligated to pay within specified terms regardless of when, if ever, they sell the products. In certain circumstances, the Company may accept sales returns from distributors and in certain situations in which the right of return exists, the Company estimates a2. Significant Accounting Policies (Continued)reserve for sales returns and recognizes the reserve as a reduction of revenue. The Company bases its estimate for sales returns on historical sales and product return information including historical experience and trend information. The
Company'sCompany’s reserve for sales returns has historically been immaterial.The Company charges its customers for shipping and handling and recognizes these amounts as part of revenue.Shipping and Handling
Amounts billed to customers for shipping and handling of products are reflected in
net salesrevenue and are not considered significant. Costs related to shipping and handling of products are expensed as incurred, are included insalesselling, general andmarketingadministrative expense, and were$4.3$5.7 million,$3.4$5.1 million and$3.7$5.2 million for thefiscalyears ended December 29, 2013, December 30, 2012 and January2, 2011, December 27, 2009, and December 28, 2008,1, 2012, respectively.Cash and Cash Equivalents
Cash equivalents are highly liquid investments with an original maturity of three months or less. The carrying amount reported in the consolidated balance sheets for cash and cash equivalents is cost, which approximates fair value.
Accounts Receivable
Accounts receivable consist of customer trade
customerreceivables. The Company maintains an allowance for doubtful accounts for estimated losses in the collection of accounts receivable. The Company makes estimates regarding the future ability of its customers to make required payments based on historical credit experience, delinquency and expected future trends. The majority of theCompany'sCompany’s receivables are fromhealth carehealthcare institutions, many of which aregovernment-funded. TheCompany'sCompany’s allowance for doubtful accounts was$2.5 million, $2.7$5.1 million and$2.2$4.8 million atJanuary 2, 2011,December27, 200929, 2013 and December28, 2008,30, 2012, respectively. Accounts receivable are written off when it is determined that the accounts are uncollectible, typically upon customer bankruptcy or the customer’s non-response to continued collection efforts.Financial instruments that potentially subject the Company to concentrations of credit risk consist principally of accounts receivable. Management attempts to minimize credit risk by reviewing
customers'customers’ credit history before extending credit and by monitoring credit exposure on a regular basis. The allowance for doubtful accounts is established based upon factors surrounding the credit risk of specific customers, historical trends and other information. Collateral or other security is generally not required for accounts receivable. As ofJanuary 2, 2011,December 29, 2013, there were no customers that accounted for more than 10% of accounts receivable.AdvertisingRoyaltiesThe Company records advertising expenses as a component of sales and marketing expenses in the period in which they are incurred. The Company incurred $2.4 million, $1.9 million, and $2.6 million in advertising costs during the fiscal years ended January 2, 2011, December 27, 2009 and December 28, 2008, respectively.RoyaltiesThe Company pays royalties to certain individuals and companies that have developed and retain the legal rights to the technology or have assisted the Company in the development of technology or new products. These royalties are based on sales and are reflected as
a salesselling, general andmarketing expenseadministrative expenses in the consolidated statements of operations.2. Significant Accounting Policies (Continued)Inventories
InventoriesInventories, net of reserves for obsolete and slow-moving goods, are stated at the lower of cost or market value. Cost is determined on a first-in, first-out (FIFO) basis.
Inventory is held both withinCosts included in theCompanyvalue of inventory that Tornier manufactures include the material costs, direct labor costs andby third-party distributors on a consignment basis.manufacturing and distribution overhead costs. Inventories consist of raw materials, work-in-process and finished goods. Finished goods inventories are held primarily in the United States, several countries in Europe, Canada, Japan and Australia and consist primarily ofimplants. Manufacturedjoint implants andassembled instruments that have not been completed and placed in service are also included in the inventoryrelated orthopaedic products. Inventory balances,and are reclassified as instruments,netin the consolidated balance sheets upon being made available for service.Inventory balancesof reserves, consist of the following (in thousands):January 2,
2011December 27,
2009Raw materials
$ 7,913 $ 7,384 Work in process
5,356 7,773 Finished goods
64,256 53,464 Total
$ 77,525 $ 68,621 December 29,
2013December 30,
2012Raw materials
$ 6,840 $ 5,696 Work in process
9,171 4,933 Finished goods
71,000 76,068 Total
$ 87,011 $ 86,697 The Company regularly reviews inventory quantities on-hand for excess and obsolete inventory and, when circumstances indicate, incurs charges to write down inventories to their net realizable value. The
Company'sCompany’s review of inventory for excess and obsolete quantities is based primarily on the estimated forecast of future product demand, production requirements, and introduction of new products. The Company recognized$5.2$8.4 million,$6.8$8.2 million and$3.6$5.0 million of expense for excessorand obsolete inventory inearningscost of goods sold during thefiscalyears ended December 29, 2013, December 30, 2012 and January2, 2011, December 27, 20091, 2012, respectively. The increase in excess andDecember 28, 2008, respectively.obsolete charges in 2012 included a $3.0 million charge related to rationalization of products associated with the integration of OrthoHelix into Tornier. Additionally, the Company had$14.7$47.8 million and$13.3$44.5 million in inventory held on consignment with third-party distributors and healthcare facilities, among others, atJanuary 2, 2011December 29, 2013 and December27, 2009,30, 2012, respectively.Property, Plant and Equipment
Property, plant and equipment are carried at cost less accumulated depreciation. Depreciation is computed using the straight-line method based on estimated useful lives of
tenfive to39thirty-nine years for buildings and improvements and two to eight years for machinery and equipment. The cost of maintenance and repairs is expensed as incurred. The Company reviews property, plant and equipment for impairment whenever events or changes in circumstances indicate that the carrying value of an asset may not be recoverable. An impairment loss would be recognized when estimated future undiscounted cash flows relating to the asset are less than theasset'sasset’s carrying amount. An impairment loss is measured as the amount by which the carrying amount of an asset exceeds its fair value.NoFor the year ended December 29, 2013, the Company recorded $0.1 million in impairment
losses were recognized duringrelated to thefiscal yearsfixed assets located in Medina, Ohio that the Company is abandoning as part of its OrthoHelix restructuring plan. As a result of the Company’s facilities consolidation initiative in 2012, the Company recorded several fixed asset impairments related to the Company’s facilities in St. Ismier, France, Dunmanway, Ireland, and Stafford, Texas in the aggregate amount of $0.9 million for the year endedJanuary 2, 2011,December27, 200930, 2012.Software Development Costs
The Company capitalizes certain computer software and
December 28, 2008.software development costs incurred in connection with developing or obtaining computer software for internal use when both the preliminary project stage is completed and it is probable that the software will be used as intended. Capitalized software costs generally include external direct costs of materials and services utilized in developing or obtaining computer software and compensation and related benefits for employees who are directly associated with the software project. Capitalized software costs are included in property, plant and equipment on the Company’s consolidated balance sheet and amortized on a straight-line basis when the software is ready for its intended use over the estimated useful lives of the software, which approximate three to ten years.Instruments
Instruments are surgical tools used by orthopaedic and general surgeons during joint replacement and other surgical procedures to facilitate the implantation of the
Company'sCompany’s products. Instruments are recognized as long-lived assets. Instruments and instrument parts that have not been placed in service are carried at cost, and are included as instruments in progress within instruments, net on the consolidated balance sheets. Once placed in service, instruments are carried at cost, less accumulated depreciation. Depreciation is computed using the straight-line method based on average estimated useful lives. Estimated useful lives are determined principally in reference to associated product life cycles, and average five years.Instrument parts used to maintain the functionality of instruments but do not extend the life of the instruments are expensed as they are consumed and recorded as part of selling, general and administrative expense. The Company reviews instruments for impairment whenever events or changes in
2. Significant Accounting Policies (Continued)circumstances indicate that the carrying value of the assets may not be recoverable. An impairment loss would be recognized when estimated future undiscounted cash flows relating to the
assetassets are less than theasset'sassets’ carrying amount. An impairment loss is measured as the amount by which the carrying amount of an asset exceeds its fair value. No impairment losses were recognized duringfiscalthe years ended December 29, 2013 and January2, 2011 or1, 2012. The Company recorded impairment charges of $1.0 million during the year ended December27, 2009.30, 2012 related to instrument sets and components that were impaired as a result of revisions to existing product lines. Instruments included in long-term assets on the consolidated balance sheets are as follows (in thousands):January 2,
2011December 27,
2009Instruments
$ 58,356 $ 47,376 Instruments in Progress
15,007 14,095 Accumulated depreciation
(30,985 ) (21,021 ) Instruments, net
$ 42,378 $ 40,450 December 29,
2013December 30,
2012Instruments
$ 99,754 $ 85,869 Instruments in progress
23,990 18,171 Accumulated depreciation
(60,689 ) (52,646 ) Instruments, net
$ 63,055 $ 51,394 The Company provides instruments to surgeons for use in surgeries and retains title to the
instruments throughout the implantation process.instruments. As instruments are used as tools to assist surgeons, depreciation of instruments is recognized as asalesselling, general andmarketingadministrative expense. Instrument depreciation expense was$9.4$13.9 million,$9.4$12.4 million and$6.3$11.0 million during thefiscalyears ended December 29, 2013, December 30, 2012 and January2, 2011, December 27, 2009 and December 28, 2008,1, 2012, respectively.GoodwillBusiness CombinationsFor all business combinations, the Company records all assets and liabilities of the acquired business, including goodwill and other identified intangible assets, generally at their fair values starting in the period when the acquisition is completed. Contingent consideration, if any, is recognized at its fair value on the acquisition date and changes in fair value are recognized in earnings until settlement. Acquisition-related transaction costs are expensed as incurred.
Goodwill
Goodwill is recognized as the excess of the purchase price over the fair value of net assets of businesses acquired. Goodwill is not amortized, but is subject to impairment tests.
The Company performs impairment tests annually unless circumstances otherwise dictate.Based on theCompany'sCompany’s single business approach todecision-making, planning and resource allocation, management has determined that the Company has one reporting unit for the purpose of evaluating goodwill for impairment. The Company performs its annual goodwill impairment test as of the first day of the fourth quarter of its fiscalyear.year or more frequently if changes in circumstances or the occurrence of events suggest that an impairment exists. Impairment tests are done by qualitatively assessing the likeliness for impairment and then, if necessary, comparing the reportingunit'sunit’s fair value to its carrying amount to determine if there is potential impairment. If the fair value of the reporting unit is less than its carrying value, an impairment loss is recorded to the extent that the implied fair value of the reportingunit'sunit’s goodwill is less than the carrying value of the reportingunit'sunit’s goodwill. The fair value of the reporting unit and the implied fair value of goodwill are determined based on widely accepted valuationtechniques, primarily the income approach, as appropriate. The calculation of the fair value of the reporting unit involves significant management judgment, including the valuation of the Company's shares. At the time of the impairment test, the Company's shares were not traded in an active market, and therefore, this assumption was unobservable.techniques. No goodwill impairment losses were recorded during thefiscalyears ended December 29, 2013, December 30, 2012 and January2, 2011, December 27, 2009 and December 28, 20081, 2012 as the fair value of the reporting unit significantly exceeded its carrying value.Intangible Assets
Intangible assets with an indefinite life, including certain trademarks and trade names, are not
amortized. The useful lives of indefinite-life intangible assets are assessed annually to determine whether events and circumstances continue to support an indefinite life. Intangible assets with an indefinite lifeamortized, but are tested for impairment annually or whenever events or circumstances indicate that the carrying amount may not be recoverable.An impairment loss is recognized if the carryingAny amountexceeds the estimated fair valueofthe asset. The amount of theimpairment loss to be recorded would be determined based upon the excess of theasset'sasset’s carrying value over its fair value. No impairment2. Significant Accounting Policies (Continued)losses on indefinite life intangibles were recorded during the
fiscalyears ended December 29, 2013, December 30, 2012 and January2, 2011, December 27, 2009 or December 28, 2008, respectively.1, 2012. The useful lives of these assets are also assessed annually to determine whether events and circumstances continue to support an indefinite life.Intangible assets with a finite life, including developed technology, customer relationships, and patents and licenses, are amortized on a straight-line basis over their estimated useful lives, ranging from
10one to20twenty years. Costs incurred to extend or renew license arrangements are capitalized as incurred and amortized over the shorter of the life of the extension or renewal, or the remaining useful life of the underlying product being licensed. Intangible assets with a finite life are tested for impairment whenever events or circumstances indicate that the carrying amount may not be recoverable. An impairment loss would be recognized when estimated future undiscounted cash flows relating to the asset are less than theasset'sasset’s carryingamount. An impairment loss isamount and would be measured as the amount by which the carrying amount of an asset exceeds its fair value.No impairment charges were recognized during the years ended January 2, 2011 or December 28, 2008. DuringFor the year ended December27, 2009,29, 2013, the Company recognized an impairment charge of$3.4$0.1 million related to licenseintangibles that are no longer being used. For the year ended December 30, 2012, the Company recognized an impairment charge of $4.7 million related to developed technology and customer relationship intangibles whose fair values were negatively impacted by the acquisition of OrthoHelix. The fair value of the intangibles was determined using a discounted cash flow analysis. For the year ended January 1, 2012, the Company recognized
whenan impairment charge of $0.2 million related to developed technology from acquired entities that wasabandonedno longer being used. For the years ended December 29, 2013 andisJanuary 1, 2012, intangible asset impairments are included in amortization of intangible assets in the consolidated statements of operations. For the year ended December 30, 2012, intangible asset impairments are included in special charges on the consolidated statement of operations as they related directly to the acquisition and integration of OrthoHelix.Derivative Financial Instruments
All of the
Company'sCompany’s derivative instruments are economic hedges and are recorded in the accompanying consolidated balance sheets as either an asset or liability and are measured at fair value. The changes in thederivative'sderivative’s fair value are recognizedcurrentlyincurrent period earnings.Changes to the fair valueearnings as a component offoreign currency derivative instrument economic hedges resulted in no impact on loss before income taxes for the fiscal year ended December 27, 2009, and $0.7 million for the fiscal year ended December 28, 2008. These charges were classified asforeign currency transaction gain (loss)on the consolidated statements of operations. Any related derivative assets or liabilities are recorded as other current assets or other current liabilities, respectively,in theconsolidated balance sheets. There were no outstanding foreign currency derivative instruments at January 2, 2011.period in which the change occurred.The Company also issued warrants in 2008 and 2009 for ordinary shares that are recognized as warrant liabilities on the consolidated balance sheets. Changes in the fair value of these warrants resulted in other non-operating gain of $0.4 million for the year ended January 2, 2011. See footnote 7 for additional information on these warrants.Research and Development
All research and development costs are expensed as incurred.
Income Taxes
Deferred tax assets and liabilities are determined based on differences between the financial reporting and tax bases of assets and liabilities and are measured using the enacted tax rates in effect for the years in which the differences are expected to reverse. Valuation allowances for deferred tax assets are recognized if it is more likely than not that some component or all of the benefits of deferred tax assets will not be realized.
The Company adopted the provisions of FASB Accounting Standards Codification (ASC) Topic 740 related to accounting for uncertainty in income taxes on December 29, 2008. As a result of the implementation of these provisions, the Company recognized a $0.3 million increase in the liability for unrecognized tax benefits, which was accounted for as an increase to the December 29, 2008 balance of accumulated deficit.The Company accrues interest and penalties related to unrecognized tax benefits in theCompany'sCompany’s provision for income taxes.At January 2, 2011In the fiscal years ended December 29, 2013 and December27, 2009,30, 2012, accrued interest and penalties wereimmaterial.Table of Contents$0.3 million and $0.2 million, respectively.2. Significant Accounting Policies (Continued)Other Comprehensive Income (Loss)
Other comprehensive income (loss) refers to revenues, expenses, gains, and losses that under U.S. GAAP are included in comprehensive income (loss) but are excluded from net earnings, as these amounts are recorded directly as an adjustment to
shareholders'shareholders’ equity. Other comprehensive income (loss) is comprised mainly of foreign currency translationadjustments.adjustments and unrealized gains (losses) on retirement plans. These amounts are presented in the consolidated statements ofshareholders' equity andcomprehensive loss.Share-Based Compensation
The Company accounts forshare-based compensation in accordance with
ASCAccounting Standards Codification (ASC) Topic 718,formerly Statement of Financial Accounting Standards (SFAS) No. 123(R),Share-Based Payments—RevisedCompensation – Stock Compensation, which requiresshare-based compensation cost to be measured at the grant date based on the fair value of the award and recognized as expense on a straight-line basis over the requisite service period, which is the vesting period. The determination of the fair value ofshare-based payment awards, such as options, is made on the date of grant using anoption-pricing model is affected by theCompany'sCompany’s share price, as well as assumptions regarding a number of complex and subjective variables, which include the expected life of the award, the expected share price volatility over the expected life of the award, expected dividend yield and risk-free interest rate.New Accounting Pronouncements
In June 2013, the FASB issued Accounting Standards Update (ASU) 2013-11,Income Taxes (ASC Topic 740), Presentation of an Unrecognized Tax Benefit When a Net Operating Loss Carryforward, a Similar Tax Loss, or a Tax Credit Carryforward Exists. The ASU requires entities to present unrecognized tax benefits as a decrease in a net operating loss, similar to tax loss or tax credit carryforward if certain criteria are met. The standard clarifies presentation requirements for unrecognized tax benefits but will not alter the way in which entities assess deferred tax assets for realizability. The guidance is effective for the fiscal year, and interim periods within that fiscal year, beginning after December 15, 2013. The Company will adopt this guidance beginning in the first quarter of 2014. The impact of adoption is not expected to be material.
In March 2013, the FASB issued ASU 2013-05,Foreign Currency Matters (ASC Topic 830), Parent’s Accounting for the Cumulative Adjustment upon Derecognition of Certain Subsidiaries or Groups of Assets within a Foreign Entity or of an Investment in a Foreign Entity. The ASU requires entities to release cumulative translation adjustments to earnings when an entity ceases to have a controlling financial interest in a subsidiary or group of assets within a consolidated foreign entity and the sale or transfer results in the complete or substantially complete liquidation of the foreign entity. The ASU is effective for the fiscal year, and interim periods within that fiscal year, beginning after December 15, 2013 and is to be applied prospectively. The Company will adopt this guidance in the first quarter of 2014 and will affect the accounting for any future liquidation of foreign subsidiaries.
In February 2013, the FASB issued ASU 2013-04,Liabilities (ASC Topic 405), Obligations Resulting from Joint and Several Liability Arrangements for Which the Total Amount of the Obligation is Fixed at the Reporting Date.The ASU requires an entity that is jointly and severally liable to measure the obligation as the sum of the amount the entity has agreed with co-obligors to pay and any additional amount it expects to pay on behalf of one or more co-obligors. The amendment is effective for the fiscal year, and interim periods with that fiscal year, beginning after December 15, 2013 and should be applied retrospectively. The Company will adopt this guidance in the first quarter of 2014. The impact of adoption is expected to be immaterial.
3. Fair Value of Financial Instruments
The Company
appliesmeasures certain assets and liabilities at fair value on a recurring or non-recurring basis based on the application of ASC Topic 820, which establishes a framework for measuring fair value and clarifies the definition of fair value within that framework.ASC Topic 820 defines fair value as an exit price, which is the price that would be received for an asset or paid to transfer a liability in the Company's principal or most advantageous market in an orderly transaction between market participants on the measurement date. The fair value hierarchy established in ASC Topic 820 generally requires an entity to maximize the use of observable inputs and minimize the use of unobservable inputs when measuring fair value. Observable inputs reflect the assumptions that market participants would use in pricing the asset or liability and are developed based on market data obtained from sources independent of the reporting entity. Unobservable inputs reflect the entity's own assumptions based on market data and the entity's judgments about the assumptions that that market participants would use in pricing the asset or liability, and are to be developed based on the best information available in the circumstances.When an active market for certain financial instruments does not exist, it may be appropriate to use unobservable inputs to determine fair value. The carrying value of the Company's cash and cash equivalents, accounts receivable, and accounts payable approximates the fair value of these financial instruments at January 2, 2011 and December 27, 2009. Assets and liabilities measured at fair value are done so on a recurring basis. U.S. GAAPThis requires fair value measurements to be classified and disclosed in one of the following three categories:Level 1—Assets and liabilities with unadjusted, quoted prices listed on active market exchanges.
Level 2—Assets and liabilities determined using prices for recently traded assets and liabilities with similar underlying terms, as well as directly or indirectly observable inputs, such as interest rates and yield curves that are observable at commonly quoted intervals.
Level 3—Assets and liabilities that are not actively traded on a market exchange. This category includes situations where there is little, if any, market activity for the asset or liability. The prices are determined using significant unobservable inputs or valuation techniques.
2. Significant Accounting Policies (Continued)the financial assets and liabilities that are measured at fair value on a recurring basis at December 29, 2013 and December 30, 2012 are as follows:December 29, 2013 Quoted Prices in
Active Markets
(Level 1)Significant Other
Observable Inputs
(Level 2)Significant
Unobservable
Inputs (Level 3)Cash and cash equivalents
$ 56,784 $ 56,784 $ — $ — Contingent consideration
(12,956 ) — — (12,956 ) Derivative asset
238 — 238 — Total, net
$ 44,066 $ 56,784 $ 238 $ (12,956 ) December 30, 2012 Quoted Prices in
Active Markets
(Level 1)Significant Other
Observable Inputs
(Level 2)Significant
Unobservable
Inputs (Level 3)Cash and cash equivalents
$ 31,108 $ 31,108 $ — $ — Contingent consideration
(15,265 ) — — (15,265 ) Derivative asset
274 — 274 — Total, net
$ 16,117 $ 31,108 $ 274 $ (15,265 ) As of December
27, 2009,29, 2013 and December 30, 2012 the Company hadwarrants that were classified as warrant liabilities and hada derivative asset with a fair value of$85.2$0.2 million and $0.3 million, respectively, with recurring Level 2 fair value measurements. The derivatives are foreign exchange forward contracts and their fair values are based on pricing for similar recently executed transactions. The amount of gain (loss) recognized in foreign exchange loss for the year ended December 29, 2013 and December 30, 2012 related to this derivative is approximately $0.4 million and $0.3 million, respectively. Included in Level 3 fair value measurements as of December 29, 2013 is a $10.4 million contingent consideration liability related to potential earnout payments for the acquisition of OrthoHelix that was completed in October 2012, a $1.9 million contingent consideration liability related to earn-out payments for distributor acquisitions in the United States that occurred throughout 2013, a $0.5 million contingent consideration liability related to potential earnout payments for the acquisition of the Company’s exclusive distributor in Belgium and Luxembourg that was completed in May 2012 and a $0.2 million contingent consideration liability related topotential earnout payments related to the acquisition of a distributor in Australia. Contingent consideration liabilities are carried at fair value and included in contingent consideration (short term and long term) on the consolidated balance sheet. The contingent consideration liabilities were determined based on discounted cash flow analyses that included revenue estimates and a discount rate, which are considered significant unobservable inputs as of December 29, 2013. The revenue estimates were based on current management expectations for these businesses and the discount rate used was between 8-11% and was based on the Company’s estimated weighted average cost of capital for each transaction. To the extent that these assumptions were to change, the fair value of the contingent consideration liabilities could change significantly. Included in interest expense on the consolidated statement of operations for the year ended December 29, 2013 is $1.1 million related to the accretion of the contingent consideration. There were no transfers between levels during the year ended December 29, 2013.
Included in Level 3 fair value measurements as of December 30, 2012 is a $14.5 million contingent consideration liability related to potential earn-out payments for the acquisition of OrthoHelix and a $0.7 million contingent consideration liability related to potential earn-out payments for the acquisition of the Company’s exclusive distributor in Belgium and Luxembourg. The contingent consideration liabilities are carried at fair value, which is determined based on a discounted cash flow analysis that included revenue estimates and a discount rate, which are considered significant unobservable inputs as of December 30, 2012. The revenue estimates were based on then current management expectations for these businesses and the discount rate used as of December 30, 2012 was 8% and was based on the Company’s estimated weighted average cost of capital. Included in interest expense on the consolidated statement of operations for the year ended December 30, 2012 is $0.3 million related to the accretion of the contingent consideration. There were no transfers between levels during the year ended December 30, 2012.
A rollforward of the level 3 contingent liability for the year ended December 29, 2013 is as follows (in thousands):
Contingent consideration liability at December 30, 2012
$ 15,265 Additions
3,329 Fair value adjustments
(5,140 ) Settlements
(1,640 ) Interest accretion
1,132 Foreign currency translation
10 Contingent consideration at December 29, 2013
12,956 The Company also has assets and liabilities that are measured at fair value on a non-recurring basis. The Company reviews the carrying amount of its long-lived assets other than goodwill for potential impairment whenever events or changes in circumstances indicate that their carrying values may not be recoverable. During the year ended December 30, 2012, the Company recognized an intangible impairment of $4.7 million. The impairment was determined using a discounted cash flow analysis. Key inputs into the analysis included estimated future revenues and expenses and a discount rate. The discount rate of 8% was based on the Company’s weighted average cost of capital. These inputs are considered to be significant unobservable inputs and are considered Level 3 fair value measurements. No intangible impairments were recorded for the year ended December 29, 2013.
During the year ended December 30, 2012, the Company initiated and completed a facilities consolidation initiative that included the closure and consolidation of certain facilities in France, Ireland and the United States, which resulted in the recognition of a $0.9 million impairment charge to write down certain fixed assets to their estimated fair values. The fair value calculations were performed using a cost-to-sell analysis and are considered Level 2 fair value measurements as the key inputs into the calculations included estimated market values of the facilities, which are considered indirect observable inputs. In addition, the Company recorded $0.7 million of lease termination costs for the year ended December 30, 2012 related to the facilities consolidation initiative. The termination costs were determined using a discounted cash flow analysis that included a discount rate assumption, which is based on the credit adjusted risk free interest rate input, and an assumption related to the timing and amount of sublease income. The timing of the sublease income is a significant unobservable input and thus is considered a Level 3 fair value measurement. As of December 29, 2013, the value of this liability was approximately $0.4 million.
As of December 29, 2013 and December 30, 2012, the Company had short-term and long-term debt of $69.1 million and $120.1 million, respectively, the vast majority of which was variable rate debt. The fair value of the
Company'sCompany’s debt obligations approximates carrying value as a result of its variable rate term and would be considered a Level 2 measurement.4. Business Combinations
On October 4, 2012, the Company completed the acquisition of 100% of the outstanding common stock of OrthoHelix Surgical Designs, Inc which further expanded the Company’s lower extremity joints and trauma product portfolio. Under the terms of the agreement, the Company acquired the assets and assumed certain liabilities of OrthoHelix for an aggregate purchase price of $152.6 million, including $100.4 million in cash, the equivalent of $38.0 million in Tornier ordinary shares based on the closing share price
is a significant input into this valuation, which was unobservable in the market. Therefore, these warrants are considered Level 3 instruments. The warrants were converted into ordinary shares during 2010. See Note 7 for further information.Recent Accounting PronouncementsIn December 2009, the FASB issued Accounting Standards Update (ASU) 2009-17,Consolidations (ASC Topic 810): Improvements to Financial Reporting by Enterprises Involved with Variable Interest Entities. ASU 2009-17 requires a qualitative approach to identifying a controlling financial interest in a variable interest entity (VIE), and requires ongoing assessment of whether an entity is a VIE and whether an interest in a VIE makes the holder the primary beneficiary of the VIE. The adoption of ASU 2009-17 in January 2010 did not have a material impacton theCompany's consolidated financial statements.In January 2010, the FASB issued ASU 2010-6,Fair Value Measurementsdate of acquisition, andDisclosures (ASC Topic 820):Improving Disclosures about Fair Value Measurements, which requires reporting entities to make new disclosures about recurring or nonrecurring fair value measurements including (i) significant transfers into and out of Level 1 and Level 2 fair value measurements and (ii) information on purchases, sales, issuances and settlements on a gross basis in the reconciliation of Level 3 fair value measurements. ASU2010-6 was effective for interim and annual reporting periods beginning after December 15, 2009, except for Level 3 reconciliation disclosures which are effective for interim and annual periods beginning after December 15, 2010. The Company adopted the additional disclosures required for Level 1 and Level 2 fair value measurements in the first quarter of 2010. The Company will adopt Level 3 disclosures beginning in the first quarter of 2011.3. Share-Based CompensationShare-based awards are granted under the Company's stock option plan. Under this plan, options to purchase ordinary shares are the only type of share-based compensation awards granted. These options generally have graded vesting periods of four years and expire ten years after the grant date. The options are granted with exercise prices equal$14.2 million related to the fair value of additional contingent consideration of up to $20.0 million. The contingent consideration is payable in future periods based on growth of theCompany's ordinary shares onlower extremity joints and trauma revenue category.The OrthoHelix acquisition was accounted for as an acquisition of a business; and, accordingly, the financial results have been included in the Company’s consolidated results of operations from the date of
grant.acquisition. TheCompany recognizes compensation expense for these optionsallocation of the total purchase price to the net tangible and identifiable intangible assets was based ona straight-line basistheir estimated fair values as of the acquisition date. The excess of the purchase price over thevesting period. Share-based compensation expenseidentifiable intangible and net tangible assets in the amount of $105.9 million was allocated to goodwill, which isincluded in costnot deductible for tax purposes. Qualitatively, the three largest components ofgoods sold,goodwill include: (1) expansion into international markets; (2) the relationships between the Company’s sales representatives andmarketing, researchphysicians; and (3) the development of new product lines andgeneral and administrative expenses on the consolidated statements of operations. Below is a summary oftechnology.The following represents the allocation of
share-based compensation (in thousands):Fiscal Year Ended January 2,
2011December 27,
2009December 28,
2008Cost of goods sold
$ 536 $ 77 $ 341 Sales and marketing
1,800 1,306 1,034 General and administrative
2,861 2,250 2,051 Research and development
433 280 246 Total
$ 5,630 $ 3,913 $ 3,672 The Company recognizesthefair value of an award of equity instruments granted in exchange for employee services as a cost of those services.3. Share-Based Compensation (Continued)purchase price:The Company estimates the fair value of stock options using the Black-Scholes option pricing model. The Black-Scholes option pricing model requires the input of estimates, including the expected life of stock options, expected stock price volatility, the risk-free interest rate, and the expected dividend yield. The Company calculates the expected life of stock options using the SEC's allowed short-cut method. The expected stock price volatility assumption was estimated based upon historical volatility of the common stock of a group of the Company's peers thatPurchase Price
Allocation
(In Thousands)Goodwill
$ 105,904 Other intangible assets
40,600 Tangible assets acquired and liabilities assumed:
Accounts receivable
4,330 Inventory
12,033 Other assets
776 Instruments, net
4,475 Accounts payable and accrued liabilities
(3,606 ) Deferred income taxes
(11,900 ) Other long-term debt
(16 ) Total purchase price
$ 152,596 Acquired identifiable intangible assets are
publicly traded. The risk-free interest rate was determined using U.S. Treasury rates with terms consistent with the expected life of the stock options. Expected dividend yield is not considered, as the Company has never paid dividends and has no plans of doing so during the term of the options. The Company estimates forfeitures at the time of grant and revises those estimates in subsequent periods if actual forfeitures differ from those estimates. The Company uses historical data when available to estimate pre-vesting option forfeitures, and records stock-based compensation expense only for those awards that are expected to vest. All stock options areamortizedand recognized as compensation expenseon a straight-line basis over theirrespective requisite service periods, whichestimated useful lives. The following table represents components of these identifiable intangible assets and their estimated useful lives at the acquisition date:Fair Value
(In Thousands)Estimated Useful
Life
(In Years)Developed technology
$ 35,500 10 In-process research and development
3,500 N/A Trademarks and trade names
1,500 3 Non-compete agreements
100 3 Total identifiable intangible assets
$ 40,600 Of the $3.5 million in in-process research and development, three of the four projects have been completed and are
generally the vesting periods. Total compensation costincluded inthe consolidated statements of operations for employee share-based payment arrangements was $5.1 million, $3.4 million and $3.3 million during the fiscal years ended January 2, 2011, December 27, 2009 and December 28, 2008, respectively. Additionally, $0.6 million and $0.4 million was included in inventory as a capitalized costdeveloped technology as ofJanuary 2, 2011 andDecember27, 2009, respectively.29, 2013.The
weighted-averageestimated fair value of theCompany's options granted to employeesintangible assets acquired was$11.03, $7.23 and $6.51 per share, in 2010, 2009 and 2008, respectively. During 2010,determined by the Companygranted 975,630 optionswith the assistance of a third-party valuation expert. The Company used an income approach toemployees to purchase ordinary shares with an exercise price of $22.50 per share and a weighted averagemeasure the fair value of$11.03 per share.the developed technology and in-process research and development based on the multi-period excess earnings method, whereby the fair value is estimated based upon the present value of cash flows that the applicable asset is expected to generate. The Company used an income approach to measure the fair value ofeach option grantthe trademarks based upon the relief from royalty method, whereby the fair value is estimated based upon discounting the royalty savings as well as any tax benefits related to ownership to a present value. The Company used an income approach to measure the fair value of non-compete agreements, based on thedateincremental income method, whereby value is estimated by discounting the cash flow differential as well as any tax benefits related to ownership to a present value. These fair value measurements were based on significant inputs not observable in the market and thus represent Level 3 measurements under the fair value hierarchy. The significant unobservable inputs include the discount rate ofgrant using8% which was based on theBlack-Scholes option pricing model using the following weighted-average assumptions:2010 2009 2008 Risk-free interest rate
2.3 % 1.8 % 2.5 % Expected life in years
5.8 6.0 6.0 Expected volatility
49.8 % 41.8 % 35.1 % Expected dividend yield
0.0 % 0.0 % 0.0 % AsCompany’s estimate ofJanuary 2, 2011,its weighted cost of capital.Pro forma results of operations (unaudited) of the Company
had $11.4 million of total unrecognized compensation cost related to unvested share-based compensation arrangements granted to employees under the stock option plan. That cost is expected to be recognized over a weighted-average service period of 2.7 years. Shares reservedforfuture compensation grants were 1.2 million and 0.1 million at January 2, 2011 and December 27, 2009, respectively. Exercise prices for options outstanding at January 2, 2011, ranged from $13.39 to $22.50.3. Share-Based Compensation (Continued)A summary of the Company's employee stock option activity is as follows:Shares
(In Thousands)Weighted-Average
Exercise PriceWeighted-Average
Remaining
Contractual Life
(In Years)Outstanding at December 31, 2007
1,805 13.89 8.9 Granted
544 16.98 Exercised
(9 ) 13.44 Forfeited or expired
(62 ) 13.62 Outstanding at December 28, 2008
2,278 14.61 8.2 Granted
507 16.95 Exercised
(10 ) 13.50 Forfeited or expired
(124 ) 14.40 Outstanding at December 27, 2009
2,651 15.06 7.6 Granted
992 22.50 Exercised
(32 ) 15.32 Forfeited or expired
(79 ) 15.81 Outstanding at January 2, 2011
3,532 17.02 7.4 Duringthe years ended December 30, 2012 and January2,1, 2012, as if the acquisition had occurred on January 3, 2011,and December 27, 2009,are as follows:Year Ended
December 30,
2012Year Ended
January 1,
2012Revenue
$ 298,051 $ 283,370 Net loss
(31,390 ) (43,155 ) Basic and diluted net loss per share
$ (0.75 ) $ (1.07 ) The pro forma results of operations are not necessarily indicative of future operating results. Included in the
Company issued 21,000 and 58,833 options, respectively, to non-employees in exchangeconsolidated statement of operations forconsulting services. No options were issued to non-employees duringthe year ended December28, 2008. The options issued in 201030, 2012 are approximately $8.0 million of revenue and2009 had weighted-average exercise prices$1.8 million of$22.50 and $16.89, respectively. Approximately 154,770 of these non-employee options were exercisable at January 2, 2011. 2,419 of these options were exercised in 2010. These options have vesting periods of either 2 or 4 years and expire 10 years after the grant date. The measurement date for options granted to non-employees is often after the grant date, which often requires updatesnet loss related to theestimateoperations offair value untilOrthoHelix subsequent to theservices are performed. The weighted-average fair value of each non-employee option granted was $10.44 and $7.59 in 2010 and 2009, respectively. The amount of expense related to non-employee options was $0.6 million, $0.5 million and $0.4 million for the fiscal years ended January 2, 2011, December 27, 2009 and December 28, 2008, respectively.Table of Contentstransaction closing.4.5. Property, Plant and EquipmentProperty, plant and equipment balances are as follows (in thousands):
January 2,
2011December 27,
2009Land
$ 2,195 $ 2,337 Building and improvements
10,087 10,630 Machinery and equipment
20,420 19,604 Furniture, fixtures, and office equipment
22,066 16,092 Software
4,134 4,035 Construction in progress
129 3,079 59,031 55,777 Accumulated depreciation
(25,351 ) (20,701 ) Property, plant, and equipment, net
$ 33,680 $ 35,076 In 2009, the Company leased a new manufacturing facility in Ireland. In conjunction with moving into the leased building, the Company made approximately $2.4 million in leasehold improvements that are included in fixed assets as of December 27, 2009.December 29,
2013December 30,
2012Land
$ 1,886 $ 1,830 Building and improvements
14,255 12,908 Machinery and equipment
31,192 25,767 Furniture, fixtures and office equipment
29,371 26,541 Software
5,511 4,729 Construction in progress
5,628 2,148 87,843 73,923 Accumulated depreciation
(44,349 ) (36,772 ) Property, plant and equipment, net
$ 43,494 $ 37,151 Depreciation expense recorded on property, plant and equipment was $6.8 million, $6.1 million
$5.7 millionand$5.3$6.0 million during thefiscalyears ended December 29, 2013, December 30, 2012 and January2, 2011, December 27, 2009 and December 28, 2008,1, 2012, respectively.DuringFor thefiscalyear ended December27, 2009,29, 2013, theCompany's majority-owned subsidiary, SCI Calyx, acquiredCompany recognized $0.1 million of fixed asset impairments related to the OrthoHelix integration. As acombined manufacturingresult of the facilities consolidation initiative, the Company recorded several fixed asset impairments during 2012 related to the Company’s facilities in St. Ismier, France, Dunmanway, Ireland, andoffice facilityStafford, Texas inGrenoble, France,the aggregate amount of $0.9 million forapproximately $6.1 million.year ended December 30, 2012. Additionally, the Company recorded $0.1 million in impairments related to certain distribution channel changes in Europe in 2012. These changes are reflected in related fixed asset categories above. These impairments were recorded in special charges, a component of operating expenses, in the consolidated statements of operations for the years ended December 29, 2013 and December 30, 2012. See Note 18 for further description of the facilities consolidation initiative.5.Included in construction in progress is $5.6 million of software development costs, primarily related to the Company’s development of an enterprise resource planning system.6. Goodwill and Other Intangible Assets
The following table summarizes the changes in the carrying amount of goodwill for the
fiscalyears endedJanuary 2, 2011December 29, 2013 and December27, 200930, 2012 (in thousands):Balance at December 28, 2008
$ 130,632 Contingent payment on acquisition
3,836 Goodwill from acquisition
171 Other
76 Foreign currency translation
2,234 Balance at December 27, 2009
136,949 Contingent payment on acquisition
723 Foreign currency translation
(5,842 ) Balance at January 2, 2011
$ 131,830 Balance at January 1, 2012
$ 130,544 Contingent payment on acquisition
1,193 Goodwill acquired in acquisitions
106,654 Foreign currency translation
1,413 Balance at December 30, 2012
$ 239,804 Goodwill acquired in acquisitions
8,239 Foreign currency translation
3,497 Balance at December 29, 2013
$ 251,540 The goodwill balance at
January 2, 2011December 29, 2013 contains$13.9$16.8 million of goodwill that qualifies for future tax deductions.5. Goodwill and Other Intangible Assets (Continued)The components of identifiable intangible assets are as follows (in thousands):
Gross Value Accumulated
AmortizationNet Value Balances at January 2, 2011
Intangible assets subject to amortization:
Developed technology
$ 76,561 $ (24,164 ) $ 52,397 Customer relationships
61,838 (18,275 ) 43,563 Licenses
3,965 (1,492 ) 2,473 Other
1,645 (967 ) 678 Intangible assets not subject to amortization:
Tradename
9,913 — 9,913 Total
$ 153,922 $ (44,898 ) $ 109,024 Gross Value Accumulated
AmortizationNet Value Gross
ValueAccumulated
AmortizationNet Value Balances at December 27, 2009
Balances at December 29, 2013
Intangible assets subject to amortization:
Intangible assets subject to amortization:
Developed technology
$ 79,252 $ (19,134 ) $ 60,118 Customer relationships
65,360 (15,017 ) 50,343 Licenses
3,780 (470 ) 3,310 Other
2,172 (1,404 ) 768 Developed technology
$ 112,782 $ (44,161 ) $ 68,621 Customer relationships
61,783 (30,155 ) 31,628 Licenses
6,810 (4,004 ) 2,806 In-process research and development
400 — 400 Other
6,624 (2,431 ) 4,193 Intangible assets not subject to amortization:
Intangible assets not subject to amortization:
Tradename
10,682 — 10,682 Tradename
9,960 — 9,960 Total
Total
$ 161,246 $ (36,025 ) $ 125,221 $ 198,359 $ (80,751 ) $ 117,608 Gross
ValueAccumulated
AmortizationNet Value Balances at December 30, 2012
Intangible assets subject to amortization:
Developed technology
$ 108,274 $ (34,114 ) $ 74,160 Customer relationships
59,212 (24,634 ) 34,578 Licenses
5,525 (2,927 ) 2,598 In-process research and development
3,200 — 3,200 Other
3,923 (1,357 ) 2,566 Intangible assets not subject to amortization:
Tradename
9,492 — 9,492 Total
$ 189,626 $ (63,032 ) $ 126,594 During the year ended December 29, 2013, the Company acquired certain assets of its distributor in Canada for $3.3 million, which included $0.5 million in potential earn-out payments, which were subsequently paid. The purchase accounting for this transaction resulted in an increase in intangible assets of $0.5 million, in the form of customer relationships and non-compete agreements, and an increase in goodwill of $0.3 million. Additionally, during the year ended December 29, 2013, the Company acquired certain assets of a distributor in the United Kingdom for $1.0 million, which included $0.1 million in potential earn-out payments, which were subsequently paid. The purchase accounting for this transaction resulted in an increase in intangible assets of $0.1 million in the form of customer relationships. In addition, during the year ended December 29, 2013, the Company acquired certain assets of a distributor in Australia for $2.6 million, which included $0.2 million in potential earn-out payments. The purchase accounting for this transaction resulted in an increase in intangible assets of $0.1 million in the form of non-compete agreements and an increase in goodwill of $1.4 million. Also during the year ended December 29, 2013, the Company acquired certain U.S. distributors and independent sales agencies. The purchase accounting for these U.S. distributor transactions resulted in $2.2 million of intangible assets, primarily non-compete agreements and an increase in goodwill of $6.7 million.
During the year ended December 30, 2012, the Company acquired its exclusive distributor in Belgium and Luxembourg for $3.5 million, which included a $1.0 million earn-out. The purchase accounting for this transaction resulted in an increase in intangible assets of $3.0 million and an increase in goodwill of $0.8 million for the year ended December 30, 2012. Additionally, the Company acquired OrthoHelix on October 4, 2012 which resulted in the recording of additional goodwill of $105.9 million and additional intangible assets of $40.6 million for the year ended December 30, 2012. See Note 4 for further details on the acquisition of OrthoHelix.
For the year ended December 29, 2013, the Company recognized an impairment charge of $0.1 million related to license intangibles that are no longer being used. For the year ended December 30, 2012, the Company recognized an impairment charge of $4.7 million related to intangibles where the carrying value was greater than the fair value of the intangibles due to a reduction in forecasted revenue from the products that related to the intangible as a result of acquiring similar products as part of the OrthoHelix acquisition. For the year ended January 1, 2012, the Company recognized an impairment charge of $0.2 million related to developed technology from acquired entities that is no longer being used.
Allfinite-lived intangible assets have been assigned an estimated useful life and are amortized on a straight-line basis over the number of years that approximates the
assets'assets’ respective useful lives (ranging from10one to20twenty years). Included in other intangibles are non-compete agreements and patents. Theweighted-average amortization periods, by major intangible asset class, are as follows:Weighted-Average
Amortization Period
(In Years)Developed technology
12 Customer relationships
13 Customer relationshipsLicenses155LicensesIn-process research and development6—Other
3 Total amortization expense forfinite-lived intangible assets was
$11.5$15.9 million, $11.6 million and$15.2$11.3 million during thefiscalyears ended December 29, 2013, December 30, 2012 and January2, 2011 and December 27, 2009,1, 2012, respectively. Amortization expense is recorded as amortization of intangible assets in the consolidated statements of operations.5. Goodwill and Other Intangible Assets (Continued)Estimated annual amortization expense for fiscal years ending
20112014 through20152018 is as follows (in thousands):Amortization Expense 2011
$ 10,268 2012
10,117 2013
10,073 2014
10,030 2015
10,023 Amortization Expense 2014
$ 16,866 2015
16,420 2016
14,213 2017
13,299 2018
12,475 6.7. Accrued LiabilitiesAccrued liabilities consist of the following (in thousands):
January 2, 2011 December 27, 2009 December 29, 2013 December 30, 2012 Accrued payroll & related expenses
$ 14,887 $ 15,578 Income, VAT, and other taxes
3,972 2,997 Accrued payroll and related expenses
$ 21,499 $ 16,521 Accrued royalties
6,435 5,620 9,169 9,001 Accrued sales and use tax
4,727 2,022 Accrued agent commissions
4,554 5,266 Other accrued liabilities
9,326 11,385 10,765 11,599 $ 34,620 $ 35,580 $ 50,714 $ 44,410 7. Notes Payable and Warrants to Issue Ordinary Shares8. Long-Term Debt
A summary of long-term debt is as follows (in thousands):
In April 2009,December 29,
2013December 30,
2012Lines of credit and overdraft arrangements
$ — $ 1,000 Mortgages
4,993 3,719 Bank term debt
61,769 113,135 Shareholder debt
2,319 2,198 Total debt
69,081 120,052 Less current portion
(1,438 ) (4,595 ) Long-term debt
$ 67,643 $ 115,457 Aggregate maturities of debt for the next five years are as follows (in thousands):
2014
$ 1,438 2015
1,275 2016
1,447 2017
61,406 2018
649 Thereafter
2,866 Lines of Credit
On October 4, 2012, the Company,
issued notes payableand one of its U.S. operating subsidiaries, Tornier, Inc. (Tornier USA), entered into a credit agreement with Bank of America, N.A., as Administrative Agent, SG Americas Securities, LLC, as Syndication Agent, BMO Capital Markets and JPMorgan Chase Bank, N.A., as Co-Documentation Agents, Merrill Lynch, Pierce, Fenner & Smith Incorporated and SG Americas Securities, LLC, as Joint Lead Arrangers and Joint Bookrunners, and the other lenders party thereto. The credit facility included a senior secured revolving credit facility to Tornier USA denominated at the election of Tornier USA, in U.S. dollars, Euros, pounds, sterling and yen in an aggregate principal amount of up to the U.S. dollar equivalent of $30.0 million. Funds available under the revolving credit facility may be used for general corporate purposes. Loans under the revolving credit facility bear interest at (a) the alternate base rate (if denominated in U.S. dollars), equal to the greatest of (i) the prime rate in effect on such day, (ii) the federal funds rate in effect on such day plus 1/2 of 1%, and (iii) the adjusted LIBO rate plus 1%, plus in theamountcase of€37 million (approximately $49.3 million)each of (i)-(iii) above, an applicable rate of 2.00% or 2.25% (depending on the Company’s total net leverage ratio as defined in its credit agreement), or (b) in the case of a eurocurrency loan (as defined in the credit agreement), at the applicable adjusted LIBO rate for the relevant interest period plus an applicable rate of 3.00% or 3.25% (depending on the Company’s total net leverage ratio), plus the mandatory cost (as defined in the credit agreement) if such loan is made in a currency other than U.S. dollars or from a lending office in the United Kingdom or a participating member state (as defined in the credit agreement). Additionally, the Company is subject to agroup of investors that included existing shareholders, new investors and management of the Company. The notes carry a fixed0.5% interest rate related to the unfunded balance on the line of8.0% with interest payments accrued in kind semi-annually. The notes mature in March 2014.These notes payable have a cross default clause in which any event of defaultcredit. There was no outstanding amount under thetermsline of credit as of December 29, 2013. As of December 30, 2012, theCompany's other debt arrangements also are defined as an event of default under the terms of these notes payable. In 2009, there were no events of default. Additionally, $0.2 million of debt issuance costsoutstanding balance related to thisissuance have been capitalized and are included in other non-current assets on the consolidated balance sheet and are being recognized as additional interest expense over theline of credit was $1.0 million. The term of thenotes.line of credit ends in October 2017.The Company’s European subsidiaries had established unsecured bank overdraft arrangements prior to 2012. This debt was paid off in 2012 and the Company recorded a loss on extinguishment of debt of $0.6 million related to prepayment fees and penalties.
Mortgages
The Company has mortgages secured by an office building in Montbonnot, France. These mortgages had an outstanding balance of $5.0 million and $3.7 million at December 29, 2013 and December 30, 2012, respectively, and bear fixed annual interest rates of 2.55%-4.9%.
Bank Term Debt
In addition to the senior secured revolving credit facility discussed above, the credit agreement entered into on October 4, 2012 also provided for an aggregate credit commitment to Tornier USA of $115.0 million, consisting of: (1) a senior secured term loan facility to Tornier USA denominated in dollars in an aggregate principal amount of up to $75.0
million; (2) a senior secured term loan facility to Tornier USA denominated in Euros in an aggregate principal amount of up to the U.S. dollar equivalent of $40.0 million. The borrowings under the term loan facilities were used to pay the cash consideration for the OrthoHelix acquisition, and fees, costs and expenses incurred in connection with the
noteacquisition and the credit agreement and to repay prior existing indebtedness of the Companyalso issued a totaland its subsidiaries. The term loans mature in October 2017. In the second quarter of2.92013, the $40.0 millionwarrants to purchase ordinary shares at an exercise price of $16.98 per share. These warrants have a strike pricesenior secured term loan facility denominated inU.S. dollars; however, the functional currencyEuros was repaid in full. As part of theparent company issuingrepayment, thenotes is the Euro. As a result, GAAP requires that these warrants be classified as liabilities on the balance sheet and recorded at fair value. The fair value of the warrants at the date of issuance was $9.87 per warrant, or $29.1 million, and was determined using a Black-Scholes option pricing model, which takes into account various assumptions such as share price volatility, risk free interest rate and expected term. Share price volatility is determined based on the volatility of various peers of the Company. The fair value of the warrants as of December 27, 2009 was approximately $14.49 per warrant. TheCompany recordeda $13.5$1.1 million lossin other non-operating expense, neton extinguishment of debt related to thechange in the fair valuewrite-off of thewarrantscorresponding deferred financing costs. Additionally, in2009. TheJune 2013, the Companyrecorded a $2.7repaid $10.5 millionforeign currency transaction gain in 2009. This gain is related to the change in exchange rates, and is recorded in foreign currency transaction gain7. Notes Payable and Warrants to Issue Ordinary Shares (Continued)(loss) in the consolidated statements of operations. A summaryof theassumptions used to determine the fair value on the date of issuance and December 27, 2009 is as follows:Date of Issuance December 27,
2009Fair value of underlying stock
$ 16.98 $ 22.50 Volatility
44.34 % 44.43 % Risk-free interest rate
2.78 % 3.55 % Expected term (in years)
10 9 Dividend yield
0 % 0 % The Companysenior secured U.S. dollar denominated loan. Amounts recordedthe warrants as liabilities with an offsetting debt discount recorded as a reduction of the carrying value of the notes. The debt discount will be amortized as additional interest expense over the life of the notes. GAAP requires that the allocation of proceeds be allocated first to the fair value of the warrant liability with the residual allocated to the outstanding debt. The debt discount was $21.7 million (net of tax of $7.4 million) on the issuance date. The Company recorded $5.8 million and $4.6 million of additionalin interest expense related to the amortization of the debt discountduringwere approximately $1.0 million for theyearsyear endedJanuary 2, 2011December 29, 2013.Borrowings under these facilities within the credit agreement as of December 29, 2013 and December
27, 2009, respectively.30, 2012 were as follows:December 29,
2013December 30,
2012Senior secured U.S. dollar term loan
$ 64,031 $ 75,925 Senior secured Euro term loan
— 40,772 Debt discount
(3,157 ) (5,138 ) Total
$ 60,874 $ 111,559 The
Company also recognized $4.3 million and $3.1 million of non-cashUSD term facility bears interestexpense relatedat (a) the alternate base rate (if denominated in U.S. dollars), equal to thestated 8% interestgreatest of (i) the prime rate in effect on such day, (ii) the federal funds rate in effect on such day plus 1/2 of 1%, and (iii) the adjusted LIBO rate, with a floor of 1% (as defined in the new credit agreement) plus 1%, plus in the case of each of (i)-(iii) above, an applicable rate of 2.00% or 2.25% (depending on thenotes during the years ended January 2, 2011 and December 27, 2009, respectively. Together with the stated interest and amortization of debt discount, the effective interest rate recognized related to the notes payable was approximately 20.6% and 19.7% at January 2, 2011 and December 27, 2009, respectively.In February 2008, the Company issued notes payableCompany’s total net leverage ratio as defined in theamountCompany’s credit agreement), or (b) in the case of€ 34.5 million (approximately $52.4 million) toagroup of investors that included existing shareholders and management ofeurocurrency loan (as defined in theCompany. The notes carry a fixedCompany’s credit agreement), at the applicable adjusted LIBO rate for the relevant interest period plus an applicable rate of8.0% with interest payments accrued in-kind. The notes mature3.00% or 3.25% (depending onFebruary 28, 2013. These notes payable also have a cross default clausethe Company’s total net leverage ratio), plus the mandatory cost (as defined inwhich any event of default undertheterms of the Company's other debt arrangements also are defined as an event of default under the terms of these notes payable.Also, in connection with the 2008 note agreement, the Company issued a total of 3.1 million warrants to purchase ordinary shares at a price of $16.98 per share. At issuance, the Company accounted for the warrants separately from the debt and allocated the proceeds received to the debt and the warrants based on their relative fair values. As a result, the warrants were valued at $21.8 million (net of tax of $7.5 million) as an increase to equity with an offsetting discount of $29.3 million recorded as a reduction of the carrying value of the notes.Upon the Company's adoption of ASC Topic 815 on December 29, 2008, the Company determined that the warrants no longer qualified to be recognized as equity under ASC Topic 815 as they were determined to not be indexed to the Company's stock as prescribed by ASC Topic 815 due to the fact that the warrants are denominatedcredit agreement) if such loan is made in a currency other thantheir functional currency. On December 29, 2008, the warrants, upon adoption of ASC Topic 815, were reclassifiedU.S. dollars or fromequity to warrant liability at the then fair value of $28.1 million and marked to market through the consolidated statement of operations subsequent to that date. The value of the warrants decreased by $1.2 million ($0.9 million net of tax) from the warrants' issuance date to the adoption date of ASC Topic 815 on December 29, 2008. As of December 29, 2008, the cumulative effect of adopting ASC Topic 815 was recognized asareduction to additional paid-in capital of $21.8 million ($29.3 million net of tax) to reclassify the warrants from equity to warrant liability and a decrease in accumulated deficit of $0.9 million recognized as a cumulative effect of a change in accounting principle to reflect the changelending office in thevalueUnited Kingdom or a participating member state (as defined in the credit agreement).The credit agreement, including the term loan and the revolving line of
the warrants between their issuance date and December 29, 2008.7. Notes Payable and Warrants to Issue Ordinary Shares (Continued)For the year ended December 27, 2009credit, contains covenants, including financial covenants which require the Companyrecognized a loss onto maintain minimum interest coverage, annual capital expenditure limits and maximum total net leverage ratios, and customary events of default. The obligations under thechange in fair value of the warrant liability of $14.5 million, in non-operating expense, net related to the warrants issued in 2008. Additionally,credit agreement are guaranteed by the Company,recognized $1.2 million of foreign currency transaction gains on the warrant liability for the year ended December 27, 2009. Under ASC Topic 815, the warrants will be carried at fair valueTornier USA andadjusted at each reporting period to fair value through current period earnings. As of December 27, 2009, the warrant liability had a fair value of $42.6 million. The impact of adoption of ASC Topic 815 was as follows:Balance Prior to
AdoptionImpact of
AdoptionBalance After
AdoptionWarrant liabilities
$ — $ (28,119 ) $ (28,119 ) Non-current deferred tax assets
— 7,170 7,170 Additional paid-in capital
(313,311 ) 21,812 (291,499 ) Accumulated deficit
94,473 (863 ) 93,610 The fair value was determined using the Black-Scholes Option Pricing Model. The following table summarizes the assumptions used to determine fair value on the date of issuance, the date of adoption of ASC Topic 815, and as of December 27, 2009:Date of Issuance December 29,
2008December 27,
2009Fair value of underlying stock
$ 16.98 $ 16.98 $ 22.50 Volatility
39.38 % 42.35 % 43.46 % Risk-free interest rate
3.53 % 2.46 % 3.55 % Expected term (in years)
10 9 8 Dividend yield
0 % 0 % 0 % The Company is amortizing the value of the debt discount as additional interest expense over the term of the notes. The Company recorded $5.1 million, $5.4 million and $4.7 million of additional interest expense related to the amortization of discount during 2010, 2009 and 2008, respectively. The Company also recognized $4.4 million, $4.2 million and $3.4 million in 2010, 2009 and 2008, respectively, related to the stated 8% interest rate on the notes. Together with the stated interest and amortization of debt discount, the effective interest rate recognized related to the notes payable was approximately 20.8% and 19.9% at January 2, 2011 and December 27, 2009, respectively.In May 2010 the Company executed agreements with 100% of the warrant holders that acquired warrants under the February 2008 and April 2009 note payable and warrant issuances to exchange their outstanding warrants for the Company's ordinary shares. Each warrant holder agreed to exchange their warrants under the February 2008 and April 2009 agreements for ordinary sharescertain other specified subsidiaries of the Company,at an exchange ratioand subject to certain exceptions, are secured by a first priority security interest in substantially all of0.6133 and 0.6410 respectively. In order to settlethewarrant liabilities related to the February 2008 and April 2009 warrant issuances,assets of the Companyissued 1,894,076and1,885,624 ordinary shares, respectively. The Company determined the fair value of its ordinary shares to be $22.50 per share at the datecertain specified existing and future subsidiaries of theexchange which resulted inCompany. Additionally, theissuance of shares withcredit agreement includes atotal value of $85.0 million. This amount, net of $21.7 million of tax was recognized as an increase to equity at the time of the exchange. The Company recognized a gainrestriction on thechange in fair value of the warrant liability of $0.2 million in non-operating expense, net during the year ended January 2, 2011Company’s ability toadjust the carrying value of the warrant liability to the final settlement amount. The Company also recognized $11.6 million of foreign currency transaction loss on the warrant liability for the year ended January 2, 2011. This transaction settled the warrant liability of $85.2 million included in the consolidated balance sheet at December 27, 2009.7. Notes Payable and Warrants to Issue Ordinary Shares (Continued)Changes in the carrying value of warrants are as follows:Warrant value at December 28, 2008
$ 29,277 Impact of adoption of ASC Topic 815—fair value adjustment
(1,159 ) Issuance of 2009 warrants at fair value
29,070 Change in fair value during the year
28,027 Warrant value at December 27, 2009
$ 85,215 Change in fair value during the period
(172 ) Fair value of shares issued to settle liability and recognized in equity on May 27, 2010
$ 85,043 Warrant value at January 2, 2011
$ — Notes payable as outstanding are as follows:January 2,
2011December 27,
2009Gross notes payable
$ 114,357 $ 113,793 Discount to notes payable
(30,096 ) (44,258 ) Net notes payable
$ 84,261 $ 69,535 The fair value of the Company's Notes Payable as of January 2, 2011 and December 27, 2009 was approximately $79.8 million and $63.7 million, respectively. The fair value was determined using a discounted cash flow analysis, calculated using management's best estimates of the key assumptions, primarily the discount rate. As a result of various factors, including the Company's financial position, the assumptions used are unobservable in the market place.8. Other Long-Term DebtThe Company's European subsidiaries have established unsecured lines of credit totaling $21.9 million and $15.3 million at January 2, 2011 and December 27, 2009, respectively. Borrowings under these lines were $15.4 and $8.1 million at January 2, 2011 and December 27, 2009, respectively. Borrowings under these lines have variable interest rates based on the Euro Overnight Index Average plus 1.3% or a three-month Euro plus 0.5%-3.0%.The Company's U.S.-based subsidiary has established a $10 million and $6.0 million secured line of credit at January 2, 2011 and December 27, 2009. This line of credit expires in July 2012 and is callable by the bank at any time. Also, the line is secured by working capital and equipment. Borrowings under the line were $5.2 million and zero at January 2, 2011 and December 27, 2009, respectively. Borrowings under the line of credit bear interest at a 30-day LIBOR plus 2.25%, with a floor interest rate of 5%. This line contains customary affirmative and negative covenants and events of default. As of January 2, 2011, the Company's U.S. subsidiary was subject to a covenant to maintain no less than $39.0 million of tangible net worth. As of January 2, 2011, the Company was also subject to a covenant to maintain a maximum debt to tangible net worth ratio of 1.50. The covenants relate to the U.S. subsidiary's ratios only.pay dividends. The Company was in compliance with all covenants as ofJanuary 2, 2011.December 29, 2013.The Company has a mortgage secured by the Company's U.S. subsidiary's office buildingAlso included inStafford, Texas. This mortgage had an outstanding amount of $1.3bank term debt is $0.9 million and$1.4$1.6 million related to capital leases atJanuary 2, 2011December 29, 2013 and December27, 2009,30, 2012, respectively.This mortgage bears a fixed interest rate of 6.7%.Table of ContentsSee Note 14 for further details.8. Other Long-TermShareholder Debt(Continued)The Company also has a mortgage secured by an office building in Grenoble, France. This mortgage had an outstanding balance of $5.0 million and $6.0 million at January 2, 2011 and December 27, 2009, respectively. This mortgage bears a fixed interest rate of 4.9%.The Company's U.S. subsidiary has long-term debt secured by its working capital, and equipment. This debt had an outstanding amount of $0.3 million and $1.2 million at January 2, 2011 and December 27, 2009, respectively. This debt accrues interest based on a variable rate of LIBOR plus 2.25%.The Company's international subsidiaries have other long-term secured and unsecured notes totaling $24.2 million and $21.3 million at January 2, 2011 and December 27, 2009, respectively, with initial maturities ranging from 3 to 10 years. A portion of these notes have fixed interest rates that range from 2.9% to 7.5%. The remaining notes carry a variable interest rate based on LIBOR, plus 1.2%, or a three-month Euro, plus 0.3% to 1.5%.OneIn 2008, one of theCompany'sCompany’s51%-owned and consolidated subsidiaries borrowed$2.4$2.2 million from a member of theBoardCompany’s board ofDirectorsdirectors who is also a 49% owner of the consolidated subsidiary. This loan was used to partially fund the purchase of real estate in Grenoble, France, to be used as afuturemanufacturing facility. Interest on the debt is variable based onthree-month Euro Libor rate plus 0.5%.and has no stated term. The outstanding balance on this debt was $2.3 and $2.2 million as of December 29, 2013 and December 30, 2012, respectively. The non-controlling interest in this subsidiary is deemed immaterial to the consolidated financial statements.A summary of debt is as follows (in thousands):January 2,
2011December 27,
2009Lines of credit
$ 20,639 $ 15,271 Mortgages
6,342 7,438 Other term debt
24,522 22,464 Shareholder debt
2,356 1,015 Total debt
53,859 46,188 Less current portion
(28,392 ) (23,299 ) Long-term debt
$ 25,467 $ 22,889 Aggregate maturities of debt for the next five years are as follows (in thousands):2011
$ 7,754 2012
7,194 2013
5,385 2014
3,893 2015
2,389 Thereafter
6,606 The Company was also party to certain mandatorily convertible debt agreements allowing for conversion into 3.4 million common shares at a conversion price of $14.70 as of July 18, 2009. These instruments were in their legal form debt, and therefore, we recognized a $47.8 million liability within the consolidated balance sheet in 2008. In 2009, we satisfied the debt through the share conversion. The agreements contained a beneficial conversion feature as the fixed conversion price of the bonds was less than the fair value of the common stock on the issuance date. The beneficial conversion feature is accreted through interest expense and resulted in additional interest expense of $0.6 million and $1.2 million for the years ended December 27, 2009 and December 28, 2008, respectively. The8. Other Long-Term Debt (Continued)agreement had no payment terms, did not accrue interest, and, in no circumstances other than liquidation, required the Company to cash settle in part or in full.Additionally, in 2007, the Company purchased Axya. At the time of the acquisition, the Company's majority shareholder entered into an agreement with another shareholder of the Company to either issue additional mandatorily convertible zero coupon bonds or decrease the conversion price of the zero coupon bonds, in which additional shares would be obtained upon conversion, if the performance of Axya did not meet certain thresholds. The arrangement represented a modification to the conversion terms of the mandatorily convertible bonds, as under either settlement scenario, the result is that the holder could receive more shares than originally entitled upon mandatory conversion. The Company estimated the fair value of the modification and recorded as an increase to equity with an offsetting amount recorded as a discount to the carrying value of the mandatorily convertible bonds. This discount is accreted to the bonds' par value over the remaining term of the bonds as interest expense. The fair value of the modification was determined to be $0.6 million at the date of modification. The Company recognized $0.1 million and $0.3 million in additional interest expense in 2009 and 2008, respectively as a result of this modification.All of the outstanding mandatorily convertible debt agreements were converted in accordance with the terms of the agreements during 2009.9. Retirement and Postretirement Benefit Plans
The
Company'sCompany’s French subsidiary is required by French government regulations toprovideoffer a plan to its employees that provides certain lump-sum retirementbenefits that qualifybenefits. This plan qualifies as a defined benefit retirement plan. The French regulations do not require funding of this liability in advance and as a result there are no plan assets associated with thisdefined-benefit plan. The Company hasaan unfunded liability of$1.7$2.8 million and$1.5$2.5 million recorded atJanuary 2, 2011December 29, 2013 and December27, 2009, respectively.30, 2012, respectively, for future obligations under the plan that is included in other noncurrent liabilities on the consolidated balance sheet. The government mandated discount rate increased from 2.8% as of December 30, 2012 to 3.0% at December 29, 2013, which resulted in a $0.1 million unrealized gain recorded as a component of other comprehensive loss for the year ended December 29, 2013. For the year ended December 30, 2012, the discount rate decreased from 4.7% to 2.8%, which resulted in a $0.9 million unrealized loss which was recorded as a component of other comprehensive loss. The related periodic benefit expense was immaterial in all periods presented.10. Derivative Instruments
The Company’s operations outside the United States are significant. As a result, the Company has foreign exchange exposure on transactions denominated in currencies that are different than the functional currency in certain legal entities. Starting in 2012, the Company began entering into forward contracts to manage its exposure to foreign currency transaction gains (losses). As it relates to one of the Company’s U.S. operating entities, Tornier Inc., the Company has entered into forward contracts to manage the foreign currency exposures to the Euro. As it relates to the Company’s French operating entity, Tornier SAS, the Company has entered into forward contracts to manage the foreign currency exposure to the Australian Dollar, British Pound, Canadian Dollar, Japanese Yen, Swiss Franc and U.S. Dollar. Forward contracts are recorded on the consolidated balance sheet at fair value. At December 29, 2013, the Company had foreign currency forward contracts outstanding with a fair value of $0.2 million recorded within other current assets on the consolidated balance sheet. These contracts are accounted for as economic hedges and accordingly, changes in fair value are recognized in earnings. The net gain (loss) on foreign exchange forward contracts is recognized in foreign currency transaction gain (loss). For the years ended December 29, 2013 and December 30, 2012, the Company recognized gains of $0.4 million and $0.3 million, respectively related to these forward currency contracts.
11. Income Taxes
The components of earnings (loss) before taxes for the
fiscalyears ended December 29, 2013, December 30, 2012 and January2, 2011, December 27, 2009 and December 28, 2008,1, 2012, consist of the following (in thousands):2010 2009 2008 United States loss
$ (6,526 ) $ (18,444 ) $ (24,174 ) Rest of the world loss
(38,104 ) (51,655 ) (15,230 ) Loss before taxes
$ (44,630 ) $ (70,099 ) $ (39,404 ) December 29,
2013December 30,
2012January 1,
2012United States loss
$ (33,204 ) $ (19,858 ) $ (2,631 ) Rest of the world loss
(873 ) (12,821 ) (36,249 ) Loss before taxes
$ (34,077 ) $ (32,679 ) $ (38,880 ) The income tax benefit (provision) for the
fiscalyears ended December 29, 2013, December 30, 2012 and January2, 2011, December 27, 2009 and December 28, 2008,1, 2012, consists of the following (in thousands):2010 2009 2008 Current benefit (provision):
United States
$ (433 ) $ 2,884 $ — Rest of the world
539 553 (196 ) Deferred benefit
5,015 10,976 5,423 Total benefit for income taxes
$ 5,121 $ 14,413 $ 5,227 10. Income Taxes (Continued)December 29,
2013December 30,
2012January 1,
2012Current (provision) benefit:
United States
$ (94 ) $ (150 ) $ (327 ) Rest of the world
(3,513 ) (2,523 ) (3,140 ) Deferred (provision) benefit
1,258 13,608 11,891 Total income tax (provision) benefit
$ (2,349 ) $ 10,935 $ 8,424 A reconciliation of the
United StatesU.S. statutory income tax rate to theCompany'sCompany’s effective tax rate for thefiscalyears ended December 29, 2013, December 30, 2012 and January2, 2011, December 27, 2009 and December 28, 2008,1, 2012, is as follows:2010 2009 2008 Income tax provision at U.S. statutory rate
34.0 % 34.0 % 34.0 % Change in valuation allowance
(11.9 ) (6.8 ) (22.9 ) Non-taxed interest income on participating loan
0.3 0.2 1.0 State and local taxes
(0.1 ) 0.1 2.2 R&D credits
0.6 1.0 1.3 Unrecognized interest deduction
(2.5 ) (1.4 ) (1.6 ) Impact of foreign income tax rates
(5.8 ) (5.1 ) (0.2 ) Non-deductible expenses
(0.4 ) (0.3 ) — Other
(2.7 ) (1.1 ) (0.5 ) Total
11.5 % 20.6 % 13.3 % December 29,
2013December 30,
2012January 1,
2012Income tax provision at U.S. statutory rate
34.0 % 34.0 % 34.0 % Release of valuation allowance
3.3 32.8 — Change in valuation allowance
(38.6 ) (33.4 ) (10.1 ) Tax benefit from disregarded entity
1.8 1.7 6.4 State and local taxes
(4.7 ) 2.6 (0.4 ) Tax deductible IPO costs
2.0 1.7 — Other foreign taxes
(3.5 ) (3.5 ) (2.0 ) Unrecognized interest deduction
— — (0.5 ) Contingent consideration adjustment to market value
4.1 — — Stock option cancellation
(8.1 ) Impact of foreign income tax rates
2.1 (2.5 ) (6.9 ) Non-deductible expenses
(1.1 ) (1.8 ) (0.6 ) Other
1.8 1.9 1.7 Total
(6.9 )% 33.5 % 21.6 % Deferred income taxes reflect the net tax effects of temporary differences between the carrying amounts of assets and liabilities for financial reporting purposes and the amounts used for income tax purposes. The Company has established valuation allowances for deferred tax assets when the amount of expected future taxable income is not likely to support the use of the deduction or credit.
During 2008,The components of deferred taxes for the years ended December 29, 2013 and December 30, 2012, consist of the following (in thousands):December 29,
2013December 30,
2012Deferred tax assets:
Net operating loss and tax credit carryforwards
$ 41,456 $ 27,924 Inventory
7,294 4,960 Exchange rate changes
102 223 Stock options
7,082 9,715 Accruals and other provisions
6,161 5,067 Total deferred tax assets
62,095 47,889 Less: valuation allowance
(40,441 ) (30,011 ) Total deferred tax assets after valuation allowance
21,654 17,878 Deferred tax liabilities:
Intangible assets
(33,553 ) (33,248 ) Depreciation
(3,342 ) (2,033 ) Total deferred tax liabilities
(36,895 ) (35,281 ) Total net deferred tax liabilities
$ (15,241 ) $ (17,403 ) In 2012, in connection with the acquisition of OrthoHelix, the Company
reversed $2.9recorded deferred tax liabilities of $11.9 million, which included $10.7 million related to amortizable intangible assets and $1.2 million related to indefinite-lived acquired in-process research and development. The deferred tax liabilities ofpreviously recognized$10.7 million related to the amortizable intangibles reduces the Company’s net deferred tax assets by a like amount and in a manner that provides predictable future taxable income over the asset amortization period. As a result, the Company reduced its pre-acquisition deferred tax asset valuation allowance in 2012 by $10.7 million, which has been reflected as an income tax benefit in the consolidated statements of operations. Although the deferred tax liability of $1.2 million related toaccumulatedacquired in-process research and development also reduces the netoperating losses of one of its French subsidiaries. Ofdeferred tax assets by a like amount, it does so in a manner that does not provide predictable future taxable income because the$2.9 million, $2.4 millionrelated asset is indefinite-lived. Therefore, the deferred tax asset valuation allowance wasrecordednot reduced as areductionresult ofgoodwill as it related to valuation allowances recorded as a part of one of the Company's 2007 acquisitions.this item.The Company
has $26.9had $40.4 million,$22.8$30.0 million and$17.4$29.8 million of valuation allowance recorded at December 29, 2013, December 30, 2012 and January2, 2011, December 27, 2009 and December 28, 2008,1, 2012, respectively. If any amounts of valuation allowance reverse, the reversals would be recognized in the income tax provision in the period of reversal. The Company recognized$5.2income tax expense from valuation allowance increases of $10.4 million$4.8 million, and $9.1 million of(an increase in the valuation allowanceasof $11.5 million netted against atax expense$1.1 million reversal of valuation allowance from the OrthoHelix acquisition), $0.2 million (an increase in the valuation allowance of $10.9 million netted against a $10.7 million reversal of valuation allowance from the OrthoHelix acquisition) and $2.9 million during thefiscalyears ended December 29, 2013, December 30, 2012 and January2, 2011, December 27, 2009 and December 28, 2008,1, 2012, respectively.10. Income Taxes (Continued)The components of deferred taxes for the fiscal years ended January 2, 2011 and December 27, 2009, consist of the following (in thousands):2010 2009 Deferred tax assets:
Net operating loss carryforwards
$ 18,631 $ 19,937 Warrant liabilities
— 21,730 Intangible assets
225 6,303 Transaction costs
250 955 Exchange rate changes
— 1,235 Stock options
6,449 4,072 Accruals and other provisions
9,711 7,914 Total deferred tax assets
35,266 62,146 Less: valuation allowance
(26,974 ) (22,816 ) Total deferred tax assets after valuation allowance
8,292 39,330 Deferred tax liabilities:
Intangible assets
(24,325 ) (34,040 ) Foreign currency exchange rate changes
(248 ) — Debt discount
(7,636 ) (11,286 ) Depreciation
(1,782 ) (2,022 ) Other
— (149 ) Total deferred tax liabilities
(33,991 ) (47,497 ) Total net deferred tax liabilities
$ (25,699 ) $ (8,167 ) The majority of the Company's income tax benefit recognized in 2010 relates to the reversal of the deferred tax liabilities related to the debt discount on the notes payable issued in 2008 and 2009.Net operating loss carryforwards totaling approximately
$37 million and $31$128.8 million atJanuary 2, 2011December 29, 2013, of which $82.0 million relates to the United States and $50.0 million relates to jurisdictions outside the United States, are available to reduce future taxable earnings of theCompany'sCompany’s consolidated U.S. subsidiaries and certain European subsidiaries, respectively. These net operating loss carryforwards include$29$6.0 million with no expiration date; the remaining carryforwards have expiration dates between20102015 and2029.2033.The Company has recorded a long-term income tax liability of approximately
$1.3$3.1 million and$0.3$2.6 million atJanuary 2, 2011December 29, 2013 and December27, 2009,30, 2012, respectively,which representsrelated to uncertain tax positions from unclosed tax years in certain of its subsidiaries. These amounts represent theCompany'sCompany’s best estimate of the potential additional tax liability related tocertain tax positions from unclosed tax years in certain of its subsidiaries.these uncertain positions. To the extent that the results of any future tax audits differ from theCompany'sCompany’s estimate,changes to tax uncertainties outsidethemeasurement periodimpact of these differences will be reported as adjustments to income tax expense.The total amount of net unrecognized tax benefits that, if recognized, would affect the tax rate was
$4.7$6.4 million atJanuary 2, 2011. Management believes that it is reasonably possible the total amounts of unrecognized tax benefits will decrease between zero and $0.5 million due to the resolution of certain issues resulting from the expiration of the statute of limitations in the U.S. within the 12 months subsequent to January 2, 2011.December 29, 2013. The Company files income tax returns in the U.S. federal jurisdiction and in various U.S. state and foreign jurisdictions.With few exceptions, theThe Company isno longer subject tonot currently under examination by any U.S. federal, state,and local,or non-U.S.incometax authorities. If any examinationsby tax authorities for years before 2007. There are currently tax examinations in progress in Germany andwere initiated, theUnited States. The10. Income Taxes (Continued)Company
doeswould not expect the results of these examinations to have a material impactto theon its consolidated financial statements in future years.A reconciliation of the beginning and ending balances of the total amounts of unrecognized tax benefits is as follows (in thousands):
A reconciliation of the beginning and ending balances of the total amounts of unrecognized tax benefits is as follows (in thousands):Gross unrecognized tax benefits at January 1, 2012
$ 5,232 Increase for tax positions in prior years
2,282 Decrease for tax positions in prior years
— Increase for tax positions in current year
306 Foreign currency translation
89 Gross unrecognized tax benefits at December 30, 2012
$ 7,909 Increase for tax positions in prior years
58 Decrease for tax positions in prior years
— Settlements
(2,094 ) Increase for tax positions in current year
307 Foreign currency translation
236 Gross unrecognized tax benefits at December 29, 2013
$ 6,416 Gross unrecognized tax benefits at December 27, 2009
$ 2,988 Increase for tax positions in prior years
2,032 Decrease for tax positions in prior years
(1,305 ) Settlements
— Increase for tax positions in current years
1,110 Foreign currency translation
(118 ) Gross unrecognized tax benefits at January 2, 2011
$ 4,707 11.12. Capital Stock and Earnings Per ShareThe Company had
29.648.5 million and24.741.7 million ordinary shares issued and outstanding as ofJanuary 2, 2011December 29, 2013 and December27, 2009,30, 2012, respectively.The dividend rights ofIn 2013, themandatorily convertible debt and ordinary shares are identical. In addition, the shares issuable under the convertible debt agreement have been included as outstanding common sharesCompany completed a secondary offering for thepurposeissuance ofcomputing basic earnings per share5,175,000 shares of common stock that resulted inaccordance with GAAP in all years presented for which these notes were outstanding.net proceeds to the Company of $78.7 million.The Company had
3.7outstanding options to purchase 2.6 million,2.83.8 million and2.44.2 millionemployeeordinary shares at December 29, 2013, December 30, 2012 and January 1, 2012, respectively. The Company also had 0.6 million, 0.4 million and 0.2 million restricted stockoptionsunits outstanding at December 29, 2013, December 30, 2012 and January2, 2011, December 27, 2009 and December 28, 2008,1, 2012, respectively.Also outstanding are zero and 6.0 million warrants as of January 2, 2011 and December 27, 2009, respectively. All warrants were issued in 2008 and 2009 in relation to long-term debt financing agreements (see Note 7).Outstanding options to purchase ordinary shares andwarrantsrestricted stock units representing3.7an aggregate of 3.2 million,8.84.2 million and5.54.4 million shares are not included in diluted earnings per share for thefiscalyears ended December 29, 2013, December 30, 2012 and January2, 2011, December 27, 2009 and December 28, 2008,1, 2012, respectively, because the Company recorded a net loss in all periods and, therefore, including these instruments would be anti-dilutive.12.13. Segment and Geographic DataThe Company has one reportable segment,
orthopedicorthopaedic products, which includes the design, manufacture, marketing andmarketingsales ofreconstructivejointdevicesimplants and other related products. TheCompany'sCompany’s geographic regions consist of the United States,Europe,France and other international areas. Long-lived assets are those assets located in each region. Revenues attributed to each region are based on the location in which the products were sold.12. Segment and Geographic Data (Continued)Net salesRevenue by geographic regionareis as follows (in thousands):Year Ended January 2, 2011 December 27, 2009 December 28, 2008 Net sales by geographic region:
United States
$ 127,762 $ 112,588 $ 91,106 France
47,324 46,331 43,206 Other International
52,292 42,453 43,058 Total
$ 227,378 $ 201,462 $ 177,370 Net salesYear Ended December 29, 2013 December 30, 2012 January 1, 2012 Revenue by geographic region:
United States
$ 182,104 $ 156,750 $ 141,496 France
58,173 52,737 55,438 Other international
70,682 68,033 64,257 Total
$ 310,959 $ 277,520 $ 261,191 Revenue by product category
areis as follows (in thousands):Year Ended January 2, 2011 December 27, 2009 December 28, 2008 Net sales by product type:
Upper extremities
$ 139,175 $ 125,454 $ 108,829 Lower extremities
23,629 20,417 18,167 Sports medicine and biologics
13,210 6,593 2,513 Total extremities
176,014 152,464 129,509 Large joints and other
51,364 48,998 47,861 Total
$ 227,378 $ 201,462 $ 177,370 Year Ended December 29,
2013December 30,
2012January 1,
2012Revenue by product type:
Upper extremity joints and trauma
$ 184,457 $ 175,242 $ 164,064 Lower extremity joints and trauma
58,747 34,109 26,033 Sports medicine and biologics
14,752 15,526 14,779 Total extremities
257,956 224,877 204,876 Large joints and other
53,003 52,643 56,315 Total
$ 310,959 $ 277,520 $ 261,191 Long-lived tangible assets, including instruments and property, plant and equipment are as follows (in thousands):
January 2
2011December 27
2009December 29,
2013December 30,
2012January 1,
2012Long-lived assets:
Long-lived assets:
United States
$ 21,381 $ 20,189 France
40,761 42,383 Other International
13,916 12,954 United States
$ 40,032 $ 31,342 $ 25,221 France
45,909 39,764 40,564 Other international
20,608 17,439 16,915 Total
Total
$ 76,058 $ 75,526 $ 106,549 $ 88,545 $ 82,700 13.14. LeasesFuture minimum rental commitments under non-cancelable operating leases in effect as of
January 2, 2011,December 29, 2013 are as follows (in thousands):2011
$ 4,691 2012
3,189 2013
1,950 2014
1,846 2015
1,725 Thereafter
4,122 Total
$ 17,523 2014
$ 5,410 2015
4,500 2016
3,535 2017
3,286 2018
3,050 Thereafter
8,362 Total
$ 28,143 13. Leases (Continued)Operating leases include copiers, automobiles and property leases and have maturity dates between 2014 and 2022. Total rent expense for the years ended December 29, 2013, December 30, 2012 and January
2, 2011, December 27, 2009 and December 28, 20081, 2012 was$3.3$5.8 million,$3.7$4.8 million and3.4$4.0 million, respectively.Future lease payments under capital leases are as follows (in thousands):
2011
$ 441 2012
429 2013
227 2014
24 2015
— Thereafter
— Total minimum lease payments
1,121 Less amount representing interest
(86 ) Present value of minimum lease payments
1,035 Current portion
(394 ) Long-term portion
$ 641 2014
$ 461 2015
269 2016
114 2017
70 Total minimum lease payments
914 Less amount representing interest
(67 ) Present value of minimum lease payments
847 Current portion
(448 ) Long-term portion
$ 399 Fixed assets that are recorded as capital lease assets consist of machinery and equipment, and have a carrying value of
$1.4$1.7 million ($2.02.5 million gross value, less$0.6$0.8 million accumulated depreciation)at January 2, 2011and$1.8$2.6 million ($2.23.4 million gross value, less$0.4$0.8 million accumulated depreciation) at December27, 2009.29, 2013 and December 30, 2012, respectively. Amortization of capital lease assets is included in depreciation expense in the consolidated financial statements.14. Non-Controlling InterestsTornier currently markets the Piton Knotless Anchor (Piton), an arthroscopic technology for rotator cuff repair. The Piton was based on technology developed by Sapphire Medical, Inc. (Sapphire). In April 2007, C2M acquired all the assets related to the Piton technology from Sapphire. C2M is a company founded and owned by certain current shareholders of Tornier. Tornier had no equity ownership interest in C2M.Under the terms of the purchase agreement between C2M and Sapphire, C2M paid Sapphire $7.5 million upon execution of the transaction. C2M also agreed to pay Sapphire a $5 million milestone payment upon completion of 75 surgeries using the Piton and a separate $7.5 million milestone payment once the Piton was commercially launched to the sales force. These milestones were paid by C2M during 2008. Additionally, C2M agreed to pay Sapphire an earnout equal to 25% of Piton sales for the first three years after launch.In January of 2008, Tornier began negotiating a licensing agreement with C2M for use of its Piton technology to launch as an anchor product in Tornier's newly developed sports medicine product portfolio. In June of 2008, Tornier executed an exclusive worldwide license agreement with C2M for use of the Piton technology. The terms of the agreement called for Tornier to assume the remaining obligation of C2M under their purchase agreement with Sapphire related to future earnout payments equal to 25% of Piton sales for the three-year period after product launch. C2M had the right to terminate the license agreement at any time after 18 months from the execution of the license. The terms of the license also included an option purchase agreement (the Option Agreement) that allowed the Company to purchase 100% of the common stock of C2M once cumulative Piton sales reach $5 million or C2M terminates the license (the Call Option). Additionally, the license included a clause, whereby C2M could require the Company to purchase 100% of C2M's common stock if sales of the14. Non-Controlling Interests (Continued)Piton anchor products exceed $5 million (the Put Option). Under both the Call Option and the Put Option, the purchase price of C2M would be equal to the paid-in capital of C2M and is required to be paid in Tornier B.V. ordinary shares. The paid-in capital of C2M as of December 2008 and 2009 was approximately $23.2 million, which consisted of the purchase price paid to Sapphire for the Piton technology, including milestones paid, and an additional amount of capital to fund development activities.The Company determined that C2M was a VIE as of June 2008. The Option Agreement allowed for Tornier to purchase C2M at a fixed price regardless of the actual performance of the Piton products. As a result, C2M did not have the right to receive expected residual returns that would instead be enjoyed by Tornier. Tornier was considered the primary beneficiary of C2M because it had the obligation to absorb the majority of the expected losses and the right to absorb the majority of the expected returns. As a result, Tornier was required to consolidate C2M. This conclusion was reached due to the existence of the Put Option and Call Option to acquire C2M at a price that was fixed upon entry into the license agreement. Accordingly, the financial position and results of operations of C2M have been included in the consolidated financial statements from the date of execution of the license agreement. The liabilities recognized as a result of consolidating C2M consist primarily of the fair value of the obligations C2M had under its purchase agreement with Sapphire. As of January 2, 2011 and December 27, 2009, the only material liability recognized relates to the estimated remaining earnout payments due under the original Sapphire purchase agreement. Tornier is required to make these earnout payments on behalf of C2M in accordance with the license agreement. The assets of C2M consist of only cash used to fund ongoing operations and the Piton technology intangible asset.Pursuant to authoritative guidance, the equity interests in C2M not owned by the Company are reported as non-controlling interests on the consolidated balance sheet of the Company. Losses incurred by C2M are charged to the Company and to the non-controlling interest holders based on their ownership percentage. Prior to the acquisition of the noncontrolling interest by the Company, the non-controlling interest holders held 100% of the equity interests in C2M, and therefore, none of the results of operations are allocated to Tornier B.V. Therefore the noncontrolling interest was accounted for in the consolidated financial statements as a contingently redeemable non-controlling interest that is initially recorded at fair value and classified as mezzanine equity.However, pursuant to authoritative guidance, if the fair value of the contingently redeemable non-controlling interest is less than the current redemption value, and it is probable that the contingency related to the put option will be met, then the carrying value of the contingently redeemable non-controlling interest must be adjusted to its redemption value through a charge directly to equity. The Company has recognized $0.7 million, $1.1 million and $3.8 million in accretion charges in 2010, 2009 and 2008 respectively, to reflect the contingently redeemable non-controlling interest at its current redemption value as it is probable the $5 million sales contingency included in the put option will be met.In accordance with authoritative guidance, the Company recorded the identifiable assets, liabilities and non-controlling interests in the VIE at their fair value upon initial consolidation. The C2M entity did not constitute a business at the time of consolidation and as a result the consolidation of C2M's related assets and liabilities were accounted for as the acquisition of an asset in accordance with applicable authoritative guidance. The primary asset consolidated consisted of the developed technology intangible asset underlying our Piton products. The fair value of this intangible asset was determined as of the date of consolidation based on the Company's consideration of a valuation performed using a discounted cash flow assessment together with consideration of historical transactions. The Company recognized $0.7 million, $1.1 million and $1.2 million in net losses in 2010, 2009 and 2008, respectively,14. Non-Controlling Interests (Continued)as a result of the consolidation of C2M. These net losses consist primarily of intangible asset amortization and, as such, the results of consolidation of C2M did not have a significant impact on the consolidated cash flows of the Company. Total assets and liabilities of C2M are as follows (in thousands):January 2,
2011December 27,
2009Current assets
$ — $ 697 Intangible asset, net
18,392 20,236 Deferred tax asset
— 621 Current liabilities
— 16 Contingent liabilities
1,860 3,167 Non-controlling interests
— 23,259 The intangible asset, net consists of developed technology. During 2010, the Company exercised its option to acquire the outstanding shares of C2M in exchange for Tornier ordinary shares. The transaction represents the acquisition of a non-controlling interest and as a result was accounted for as an equity transaction in accordance with ASC 810-10. Upon exercise of the purchase option, a non-controlling interest in C2M no longer existed. The balance of the non-controlling interest was eliminated and the fair value of the shares issued in the acquisition, $23.2 million, was recorded as a component of shareholders' equity.15. Certain Relationships andRelated-Party Transactions
During 2009, the Company issued 185,697 shares pursuant to an agreement with a current shareholder based on the performance of an entity acquired in 2007.The Company leases all of its approximately 55,000 square feet of manufacturing facilities and approximately 52,000 square feet of office space located in
Grenoble,Montbonnot, France, fromthe former Predecessor CompanyAlain Tornier (Mr. Tornier), who is a current shareholder andcurrentmember of the Company’s board of directors. Annual lease payments tothe member of the board of directorsMr. Tornier amounted to$1.7$1.1 million,$1.3$1.6 million and$1.6$1.9 million during the years ended December 29, 2013, December 30, 2012 and January2, 2011, December 27, 2009 and December 28, 2008,1, 2012, respectively.On July 29, 2008, the Company formed a real estate holding company (SCI Calyx) together with Mr. Tornier. SCI Calyx is owned 51% by the Company and 49% by Mr. Tornier. SCI Calyx was initially capitalized by a contribution of capital of €10,000 funded 51% by the Company and 49% by Mr. Tornier. SCI Calyx then acquired a combined manufacturing and office facility in Montbonnot, France, for approximately $6.1 million. The manufacturing and office facility acquired
willwas to be used to support the manufacture of certain of theCompany'sCompany’s current products and house certain operations already located in Montbonnot, France. This real estate purchase was funded through mortgage borrowings of $4.1 million and $2.0 million cash borrowed from the two current shareholders of SCI Calyx. The $2.0 million cash borrowed from the SCI Calyx shareholders originally consisted of a $1.0 million note due to Mr. Tornier and a $1.0 million note due to Tornier SAS, which is theCompany'sCompany’s wholly owned French operating subsidiary. Both of the notes issued by SCI Calyx bear annual interest at thethree month Euriborthree-month Euro Libor rate plus 0.5% and have no stated term. During 2010, SCI Calyx borrowed approximately $1.4 million from Mr. Tornier in order to fund on-going leasehold improvements necessary to prepare the Montbonnot facility for its intended use. This cash was borrowed under the same terms as the original notes.As of January 2, 2011, SCI Calyx had related-party debt outstanding to Mr. Tornier of $2.4 million. The SCI Calyx entity is consolidated by the Company, and the related real estate and liabilities are included in the consolidated balance sheets.On15. Certain Relationships and Related-Party Transactions (Continued)September 3, 2008, Tornier SAS, the
Company'sCompany’s French operating subsidiary, entered into a lease agreement with SCI Calyx relating to these facilities. The agreement, which terminates in 2018, provides for an annual rent payment of €440,000, which has subsequently been increased and is currently€748,074€904,908 annually. As ofJanuary 2, 2011,December 29, 2013, future minimum payments under this lease were€5.7€4.3 million in the aggregate. As of December 29, 2013, SCI Calyx hadrelated-party debt outstanding to Mr. Tornier of $2.3 million. The SCI Calyx entity is consolidated by the Company, and the related real estate and liabilities are included in the consolidated balance sheets.Since 2006, Tornier SAS has entered into various lease agreements with entities affiliated with Mr. Tornier or members of his family. On
May 30, 2006,December 29, 2007, Tornier SAS entered intotwoa leaseagreementsagreement with Mr. Tornier and hissister, Colette Tornier,spouse, relating toour facilitiesthe Company’s museum inSaint-Ismier,Saint Villa, France. Theagreements provideagreement provides for a term through May 30, 2015 and an initial annual rentpaymentspayment of€104,393 and€28,500,respectively,whichhavewas subsequentlybeenincreasedand are currently €119,362 and €32,587 annually, respectively.to €36,095. On December 29, 2007, Tornier SAS entered into a lease agreement with Animus SCI, relating toourthe Company’s facilities in Montbonnot Saint Martin, France. On August 18, 2012, the parties amended the lease agreement to extend the term until May 31, 2022 and reduce the annual rent. The amended agreement provides for an initial annual rent payment of€252,545,€279,506, whichhaswas subsequentlybeenincreasedand is currently €288,756 annually.to €288,564. Animus SCI is wholly owned by Mr.Tornier. On December 29, 2007, Tornier SAS entered into a lease agreement with Cymaise SCI, relating to our facilities in Saint-Ismier, France. The agreement provides for an annual rent payment of €315,865, which has subsequently been increased and is currently €361,158 annually. Cymaise SCI is wholly owned by Mr. Tornier and his sister, ColetteTornier. On February 6, 2008, Tornier SAS entered into a lease agreement with Balux SCI, effective as of May 22, 2006, relating toourthe Company’s facilities in Montbonnot Saint Martin, France. On August 18, 2012, the parties amended the lease agreement to extend the term until May 31, 2022 and reduce the annual rent. The amended agreement provides for an initial annual rent payment of€480,000,€252,254, whichhaswas subsequentlybeenincreasedand is currently €548,828 annually.to €548,465. Balux SCI is wholly owned by Mr. Tornier and his sister, Colette Tornier.Each of the agreements will terminate in 2012.As ofJanuary 2, 2011,December 29, 2013, future minimum payments under all of these agreements were€1.9€8.1 million in the aggregate.16.
16. Other Non-Operating ExpenseShare-Based CompensationShare-based awards are granted under the Tornier N.V. 2010 Incentive Plan, as amended and restated (2010 Plan). This plan allows for the issuance of up to 7.7 million new ordinary shares in connection with the grant of a combination of potential share-based awards, including stock options, restricted stock units, stock appreciation rights and other types of awards as deemed appropriate. To date, only options to purchase ordinary shares (options) and restricted stock units (RSUs) have been awarded. Both types of awards generally have graded vesting periods of four years and the options expire ten years after the grant date. Options are granted with exercise prices equal to the fair value of the Company’s ordinary shares on the date of grant.
The Company recognizes compensation expense for these awards on a straight-line basis over the vesting period.Share-based compensation expense is included in cost of goods sold, selling, general and administrative, and research and development expenses on the consolidated statements of operations.
Below is a summary of the allocation ofshare-based compensation (in thousands):
DuringYear ended December 29,
2013December 30,
2012January 1,
2012Cost of goods sold
$ 658 $ 864 $ 841 Selling, general and administrative
6,955 5,477 5,263 Research and development
687 489 443 Total
$ 8,300 $ 6,830 $ 6,547 The Company recognizes the fair value of share-based awards granted in exchange for employee services as a cost of those services. Total compensation cost included in the consolidated statements of operations for employeeshare-based payment arrangements was $8.0 million, $6.5 million and $6.2 million during the years ended December 29, 2013, December 30, 2012 and January
2, 20111, 2012, respectively. The increase in share-based compensation in 2013 was due to a change in the estimated forfeiture rate applied to unvested awards that resulted in $1.6 million of additional expense. The amount of expense related to non-employee options was $0.3 million, $0.3 million and $0.3 million for the years ended December 29, 2013, December 30, 2012 and January 1, 2012, respectively. Additionally, $0.4 million and $0.3 million of these share-based compensation costs were included in inventory as a capitalized cost as of December 29, 2013 and December27, 2009,30, 2012, respectively.Stock Option Awards
The Company estimates the fair value of stock options using theBlack-Scholes option pricing model. TheBlack-Scholes option pricing model requires the input of estimates, including the expected life of stock options, expected stock price volatility, the risk-free interest rate and the expected dividend yield. The Company calculates the expected life of stock options using the SEC’s allowed short-cut method due to the relatively recent initial public offering and a lack of historical data. The expected stock price volatility assumption was estimated based upon historical volatility of the common stock of a group of the Company’s peers that are publicly traded. The risk-free interest rate was determined using U.S. Treasury rates with terms consistent with the expected life of the stock options. Expected dividend yield is not considered, as the Company
recognized $0.4has never paid dividends and currently has no plans of doing so during the term of the options. The Company estimates forfeitures at the time of grant and revises those estimates in subsequent periods if actual forfeitures differ from those estimates. The Company uses historical data when available to estimate pre-vesting option forfeitures, and recordsshare-based compensation expense only for those awards that are expected to vest. Theweighted-average fair value of the Company’s options granted to employees was $8.95, $8.55 and $12.06 per share, in 2013, 2012 and 2011, respectively. The fair value of each option grant is estimated on the date of grant using theBlack-Scholes option pricing model using the followingweighted-average assumptions:Years ended December 29,
2013January 1,
2012January 2,
2011Risk-free interest rate
1.7 % 0.9 % 2.1 % Expected life in years
6.1 6.1 6.1 Expected volatility
46.6 % 48.1 % 48.6 % Expected dividend yield
0.0 % 0.0 % 0.0 % As of December 29, 2013, the Company had $8.2 million of
non-operating gain and $28.0 million of non-operating expense primarilytotal unrecognized compensation cost related to unvestedshare-based compensation arrangements granted to employees under themark-to-market2010 Plan and the Company’s prior stock option plan. That cost is expected to be recognized over aweighted-average service period of 1.5 years. Shares reserved for future compensation grants were 2.1 million and 2.5 million at December 29, 2013 and December 30, 2012, respectively. Per share exercise prices for options outstanding at December 29, 2013 and December 30, 2012, ranged from $13.39 to $27.31.A summary of the
warrant liability.Company’s employee stock option activity is as follows:Ordinary
Shares
(In Thousands)Weighted-Average
Per Share
Exercise PriceWeighted-Average
Remaining
Contractual Life
(In Years)Aggregate
Intrinsic
Value (in
Millions)Outstanding at January 2, 2011
3,532 17.02 7.4 19.4 Granted
647 24.76 Exercised
(210 ) 15.02 Forfeited or expired
(73 ) 20.96 Outstanding at January 1, 2012
3,896 18.32 6.9 (3.8 ) Granted
626 18.45 Exercised
(426 ) 16.56 Forfeited or expired
(314 ) 22.33 Outstanding at December 30, 2012
3,782 18.23 6.4 (7.3 ) Granted
643 19.32 Exercised
(1,454 ) 14.38 Forfeited or expired
(543 ) 22.51 Outstanding at December 29, 2013
2,428 19.89 7.5 (3.9 ) Exercisable at period end
1,236 20.03 6.2 (2.1 ) The Company did not grant options to purchase ordinary shares to non-employees in the years ended December 29, 2013 and December 30, 2012. During the year ended January 1, 2012, the Company granted options to purchase 74,667 ordinary shares to non-employees in exchange for consulting services. The options granted during the year ended January 1, 2012 had aweighted-average exercise price of $19.39 per share and a weighted average grant date fair value of $9.74 per share. Related to the non-employee options, 177,013 of these options were exercisable at December 29, 2013, while 26,007 of these options were exercised in 2013 and 6,180 were forfeited. These options have vesting periods of either two or four years and expire 10 years after the grant date. The measurement date for options granted to non-employees is often after the grant date, which often requires updates to the estimate of fair value until the services are performed.
Total stock option-related compensation expense recognized in the consolidated statements of operations, including employees and non-employees, was approximately $5.3 million, $5.0 million and $5.8 million for the years ended December 29, 2013, December 30, 2012 and January 1, 2012, respectively.
Restricted Stock Units Awards
The Company began to grant RSUs in 2011 under the 2010 Plan. Vesting of these awards typically occurs over a four-year period and the grant date fair value of the awards is recognized as expense over the vesting period. Total compensation expense recognized in the consolidated statements of operations related to RSUs was $3.0 million, $1.8 million and $0.7 million for the years ended December 29, 2013, December 30, 2012 and January 1, 2012, respectively.
A summary of the Company’s activity related to RSUs is as follows:
Shares
(In Thousands)Weighted-Average
Grant Date Fair
Value Per ShareOutstanding at January 2, 2011
— — Granted
221 25.06 Vested
(7 ) 23.61 Cancelled
(7 ) 25.52 Outstanding at January 1, 2012
207 25.10 Granted
305 18.51 Vested
(55 ) 20.21 Cancelled
(35 ) 24.01 Outstanding at December 30, 2012
422 20.57 Granted
323 19.25 Vested
(97 ) 16.40 Cancelled
(75 ) 22.03 Outstanding at December 29, 2013
573 19.54 17. Other Non-Operating Income
During the year ended December
28, 2008,29, 2013, the Company recognized$1.4 million ofan immaterial amount in other non-operatingexpense related to the disposal of certain non-operating assets acquired in its Axya operations.17. Special Chargesincome. During the year ended December
27, 2009,30, 2012, the Company recognized $0.1 million in other non-operating income. During the year ended January 1, 2012, the Company recognized $1.3 million in non-operating income, which included a $1.0 million gain on settlement of a contingent liability and a $0.3 million gain related to the sale of certain non-operating real estate in France.18. Special Charges
Special charges are recorded as a separate line item within operating expenses on the consolidated statement of operations and primarily include operating expenses directly related to business combinations and related integration activities, restructuring initiatives (including the facilities consolidation initiative), management exit costs and certain other items that are typically infrequent in nature and that affect the comparability and trend of operating results. The table below summarizes amounts included in special charges for the related periods:
Year ended December 29,
2013December 30,
2012January 1,
2012Facilities consolidation charges
$ — $ 6,357 $ — Acquisition, integration and distributor transition costs
7,143 4,920 — OrthoHelix restructuring charges
521 — — Reduction in contingent consideration liability
(5,140 ) — — Legal settlements
1,214 — — Italy bad debt expense
— 2,001 — Management exit costs
— 1,229 632 Intangible asset impairments
— 4,737 — Other
— — 260 Total
$ 3,738 $ 19,244 $ 892 Included in special charges for the year ended December 29, 2013 were $7.1 million of expenses related to acquisition and integration activities of OrthoHelix, U.S. distributor transitions, and the Company’s acquisitions of certain assets of its distributors in Canada, the United Kingdom and Australia; $5.1 million of gain recognized on the reversal of a contingent consideration liability for OrthoHelix due to updated revenue estimates; $1.2 million of expenses related to a certain legal settlement; and $0.5 million of OrthoHelix restructuring costs.
Included in special charges for the year ended December 30, 2012 were $6.4 million of restructuring costs related to the Company’s facilities consolidation initiative. See below for further details on this initiative. Also included in special charges were intangible impairments of $4.7 million as the Company made certain strategic decisions related to previously acquired intangibles which was determined to be impaired as a result of the acquisition of OrthoHelix; acquisition and integration costs of $3.5 million which included costs related to the Company’s acquisition of OrthoHelix and the Company’s exclusive distributor in Belgium and Luxembourg; $2.0 million of bad debt expense related to certain uncollectible accounts and worsening economic conditions in Italy; distribution channel change costs of $1.4 million which included termination costs related to certain strategic business decisions made related to the Company’s U.S. and international distribution channels; and management exit costs of $1.2 million which included severance related to the Company’s former Chief Executive Officer and Global Chief Financial Officer.
Included in special charges on the consolidated statement of operations for the year ended January 1, 2012 are $0.6 million in management termination costs and $0.3 million of charges related to the closure of the Company’s Beverly, Massachusetts facility.
OrthoHelix Restructuring Initiative
In December 2013, as part of the on-going integration of OrthoHelix, the Company announced the move and consolidation of various business operations from Medina, Ohio to Bloomington, Minnesota including customer service, quality, supply chain and finance functions. Charges incurred in connection with the initiative during the year ended December 29, 2013 were $0.4 million and related to termination benefits including severance and retention and $0.1 million of impairment charges for fixed assets, all of which were recorded in special charges in the consolidated statement of operations. The Company estimated it will incur $2.0 to $2.5 million in total charges related to the initiative, substantially all of which will be recorded and paid in 2014.
Included in accrued liabilities on the consolidated balance sheet as of December 29, 2013 is an accrual related to the OrthoHelix restructuring initiative. Activity in the restructuring accrual is presented in the following table (in thousands):
OrthoHelix restructuring accrual balance as of December 30, 2012
$ — Charges:
Employee termination benefits
381 Moving, professional fees and other initiative-related expenses
— Total charges
381 Payments:
Employee termination benefits
— Moving, professional fees and other initiative-related expenses
— Total payments
— OrthoHelix restructuring initiative accrual balance as of December 29, 2013
$ 381 Facilities Consolidation Initiative
On April 13, 2012, the Company announced a facilities consolidation initiative, stating that it planned to consolidate several of its facilities to drive operational productivity. Under the initiative, the Company consolidated its
U.S. operationsDunmanway, Ireland manufacturing facility into its Macroom, Ireland manufacturing facility in the second quarter of 2012 and,closed quality and regulatory sales and marketing functionsinSan Diego, California. Additionally, manufacturing operations in Beverly, Massachusetts, were also closed. Additionally,the third quarter of 2012, the Companyopened sales officesconsolidated its St. Ismier, France manufacturing facility into its Montbonnot, France manufacturing facility. In addition, the Company leased a new facility inScandinaviaBloomington, Minnesota to use as its U.S. business headquarters and consolidated its Minneapolis-based marketing, training, regulatory, supply chain, and corporate functions with its Stafford, Texas-based distribution operations. This initiative was completed in the fourth quarter of 2012.Charges incurred in connection with the facilities consolidation initiatives were recorded in the year ended December 30, 2012 and are presented in the following table (in thousands). All of the following amounts were recognized within special charges in the Company’s consolidated statements of operations.
Fiscal Year Ended
December 30, 2012Employee termination benefits
$ 1,180 Impairment charges related to fixed assets
872 Moving, professional fees and other initiative-related expenses
4,305 Total facilities consolidation expenses
$ 6,357 The $1.2 million of employee termination benefits includes severance and retention related to approximately 65 employees impacted by the facilities consolidation initiative in the United
KingdomStates. The $0.9 million of impairment charges related to fixed assets are a result of closing the impacted facilities in2009.the United States, France and Ireland. TheCompany$4.3 million of moving, professional fees and other initiative-related expenses include moving and transportation expenses, lease termination costs, professional fees and other expenses that were incurred$1.9 millionto execute the facilities consolidation initiative.Included in
costsaccrued liabilities on the consolidated balance sheet as of December 29, 2013 and December 30, 2012 is an accrual related to the facilities consolidationand launching of the sales sites. The operating costs for Scandinavia and the United Kingdom are included in sales and marketing expense. Includedinitiative. Activity in the$1.9 million of special charges are expenses incurred relatedfacilities consolidation accrual is presented in the following table (in thousands):Facility consolidation accrual balance as of January 2, 2012
$ — Charges:
Employee termination benefits
1,180 Moving, professional fees and other initiative-related expenses
4,305 Total charges
5,485 Payments:
Employee termination benefits
(620 ) Moving, professional fees and other initiative-related expenses
(4,191 ) Total payments
(4,811 ) Facilities consolidation accrual balance as of December 30, 2012
$ 674 Payments:
Employee termination benefits
(475 ) Moving, professional fees and other initiative-related expenses
(107 ) Total payments
(582 ) Facilities consolidation accrual balance as of December 29, 2013
$ 92 19. Litigation
From time to
severance, lease termination, and moving costs related to consolidation of the Company's U.S. operations, as well as expenses for travel, consulting, and legal costs incurred to launch the sales sites. All expenses were paid in 2009.During 2010,time, the Companyrecorded $0.3 million in special charges related to commissions paid in the United Kingdom related to the termination of the relationship with a former distributor and expenses related to the Company's consolidation of its U.S. operations.18. LitigationOn October 25, 2007, two of our former sales agents filed a complaint in the U.S. District Court for the Southern District of Illinois, alleging that we had breached their agency agreements and committed fraudulent and negligent misrepresentations. The plaintiffs, Garry Boyd of Boyd Medical, Inc. and Charles Wetherill of Addison Medical, Inc., claimed that we had intentionally set their 2007 quotas too high, in hopes that Messrs. Boyd and Wetherill would not meet the quotas so that we could terminate them for cause and install another distributor in their territories. The complaint also included allegations that we had falsely suggested to the plaintiffs that if they dropped all other product lines, we would fill the void with new product lines. The jury rendered a verdict on July 31, 2009, awarding the plaintiffs a total of $2.6 million in actual damages and $4 million in punitive damages. While the court struck the award of punitive damages on March 31, 2010, it denied our motion to set aside the verdict or order a new trial. We have filed a notice of appeal with the U.S. Court of Appeals for the Seventh Circuit in respect of the remaining actual damages.On July 7, 2010, the Company submitted its opening brief to the United States Court of Appeals for the Seventh Circuit. The Plaintiffs filed their opening briefs during August 2010. The consolidated appeal has been argued before the U.S. Court of Appeals for the Seventh Circuit. We expect a decision in the first half of 2011.The Company has considered the facts of the case and related case law and, based on this information, we believe that the verdict rendered on July 31, 2009 was inappropriate given the related facts and supporting legal arguments. We have been successful in striking the jury awarded punitive damages through a motion filed with the original court. We have filed a notice of appeal with the U.S. Court of Appeals for the Seventh Circuit in respect of the remaining actual damages. We have considered the progress of the case, the views of legal counsel and the facts and arguments presented at the original jury trial and the fact that we intend to vigorously defend our position through the appellate courts in assessing the probability of a loss occurring for this matter. We believe we must assess the probability of the incurrence of a loss, and the ability to reasonably estimate such loss, based on the possible outcomes of the entire legal process including the appeals process. We believe our legal appealisstrong and that the range of possible outcomes is between zero and $6.6 million. After assessing all relevant information, we do not believe there to be a reasonably estimable loss within the range of possible outcomes that is probable of occurring. As a result, we have not recorded an accrual for any loss related to this issue. We have determined that a loss is reasonably possible, and management estimates the range of loss to be between zero and $6.6 million, the amount of the initial jury verdict. We believe we have a strong defense against these claims and are vigorously contesting these allegations. As of January 2, 2011, no accrual was recorded relating to this case.In addition to the item noted above, we aresubject to variousotherpending or threatened legal actions and proceedings,product liability claims and other matters whichincluding those that arise in the ordinary course of its business. These actions and proceedings may relate to, among other things, product liability, intellectual property, distributor, commercial and other matters. Such matters are subject to many uncertainties and to outcomes that are not predictable with assurance and that may not be known for extended periods of time. The Company records a liability in its consolidated financial statements for costs related to claims, including future legal costs, settlements and judgments, where the Company has assessed that a loss is probable and an amount can be reasonably estimated. If the reasonable estimate of a probable loss is a range, the Company records the most probable estimate of the loss or the minimum amount when no amount within the range is a better estimate than any other amount. The Company discloses a contingent liability even if the liability is not probable or the amount is not estimable, or both, if there is a reasonable possibility that material loss may be have been incurred. In the opinion of management, as of December 29, 2013, the amount of liability, if any, with respect to these matters, individually or in the aggregate, will not materially affectourthe Company’s consolidated results of operations, financial position orfinancial position.cash flows.19.20. Selected Quarterly Information (unaudited):
The following table presents a summary of
ourthe Company’s unaudited quarterly operating results for each of the four quarters in20102013 and2009,2012, respectively (in thousands). This information was derived from unaudited interim financial statements that, in the opinion of management, have been prepared on a basis consistent with the financial statements contained elsewhere in thisfilingreport and include all adjustments, consisting only of normal recurring adjustments, necessary for a fair presentation of such19. Selected Quarterly Information (unaudited): (Continued)information when read in conjunction with
ourthe Company’s audited financial statements and related notes. The operating results for any quarter are not necessarily indicative of results for any future period.Year-ended January 2, 2011 Fourth
QuarterThird
QuarterSecond
QuarterFirst
Quarter(in thousands, except per share data) Revenue
$ 61,265 $ 49,707 $ 54,563 $ 61,843 Gross profit
43,382 36,154 39,838 44,567 Consolidated net loss
(8,096 ) (12,759 ) (8,603 ) (10,051 ) Net loss attributable to ordinary shareholders
(8,096 ) (12,759 ) (8,603 ) (10,035 ) Net loss per share:
basic and diluted
$ (0.27 ) $ (0.43 ) $ (0.31 ) $ (0.41 ) Year ended December 29, 2013 Fourth
QuarterThird
QuarterSecond
QuarterFirst
Quarter(in thousands, except per share data) Revenue
$ 83,392 $ 66,747 $ 78,135 $ 82,685 Cost of goods sold
21,267 18,972 22,309 23,624 Gross profit
62,125 47,775 55,826 59,061 Operating expenses:
Selling, general and administrative
56,451 46,797 51,467 52,136 Research and development
5,997 4,665 5,543 6,182 Amortization of intangible assets
4,288 3,976 3,784 3,837 Special charges
2,729 (3,918 ) 3,408 1,519 Total operating expenses
69,465 51,520 64,202 63,674 Operating loss
(7,340 ) (3,745 ) (8,376 ) (4,613 ) Consolidated net loss
(10,699 ) (6,292 ) (12,537 ) (6,898 ) Net loss per share:
basic and diluted
$ (0.22 ) $ (0.13 ) $ (0.28 ) $ (0.17 ) Year-ended December 27, 2009 Year ended December 30, 2012 Fourth
QuarterThird
QuarterSecond
QuarterFirst
QuarterFourth
QuarterThird
QuarterSecond
QuarterFirst
Quarter(in thousands, except per share data) (in thousands, except per share data) Revenue
$ 57,321 $ 44,082 $ 49,204 $ 50,855 $ 79,033 $ 58,015 $ 66,014 $ 74,458 Cost of goods sold
26,974 15,730 18,098 21,116 Gross profit
41,493 32,628 35,849 36,633 52,059 42,285 47,916 53,342 Operating expenses:
Selling, general and administrative
46,290 38,524 41,795 43,838 Research and development
6,195 5,260 5,446 5,623 Amortization of intangible assets
3,708 2,730 2,636 2,647 Special charges
9,831 6,503 2,910 — Total operating expenses
66,024 53,017 52,787 52,108 Operating loss
(13,965 ) (10,732 ) (4,871 ) 1,234 Consolidated net loss
(30,691 ) (11,254 ) (10,224 ) (3,517 ) (4,803 ) (11,681 ) (5,084 ) (176 ) Net loss attributable to ordinary shareholders
(30,750 ) (11,255 ) (10,224 ) (3,517 ) Net loss per share:
Basic and diluted
$ (1.25 ) $ (0.46 ) $ (0.42 ) $ (0.15 ) basic and diluted
$ (0.12 ) $ (0.29 ) $ (0.13 ) $ (0.00 ) For the year ended December 29, 2013, the first, second, third and fourth quarters included net charges of $1.5 million, $3.4 million, $(3.9) million and $2.7 million, respectively, related to acquisition, integration and distribution channel transition charges, certain legal settlements, the partial reversal of a contingent consideration liability incurred in the acquisition of OrthoHelix and certain other items, all of which were recorded in special charges within operating expenses. The first, second, third and fourth quarters also included acquired inventory fair value adjustments of $1.8 million, $1.9 million, $1.8 million and $0.5 million, respectively, which were included in cost of goods sold.
For the year ended December 30, 2012, the second, third and fourth quarter included charges of
the year-ended January 2, 2011 includes an additional week of operations relative$1.1 million, $2.9 million and $2.5 million, respectively, related to thefirstCompany’s facilities consolidation initiative, acquisition and integration costs, intangible impairments, and certain other items, all of which were recorded in special charges within operating expenses. In addition, the fourth quarter included $2.9 million in inventory product rationalization charges and $1.6 million in acquired inventory fair value adjustments, both ofthe year-ended December 27, 2009.20. Subsequent Events (unaudited)On January 28, 2011, the Company executedwhich were recorded in cost of goods sold. The fourth quarter also included a3-to-1 reverse stock split of the Company's ordinary shares. The consolidated financial statements as of January 2, 2011, December 27, 2009 and December 28, 2008 and for the years ended January 2, 2011, December 27, 2009 and December 28, 2008 give retroactive effect to the reverse stock split.On January 28, 2011, the Company made a change to its legal form by converting from Tornier B.V., a private company with limited liability (besloten vennootschap met beperkte aansprakelijkheid) to Tornier N.V., a public company with limited liability (naamloze vennootschap).In February 2011 the Company completed an initial public offering of 8,750,000 ordinary shares at an offering price of $19.00 per share (before underwriters' discounts and commissions). The Company received proceeds of approximately $155.4$10.7 million(after underwriters' discounts and commissions of approximately $10.8 million, but before additional offering related costs). Net proceeds will be used for the retirement of debt, working capital, and other general corporate purposes. Additionally, on March 7, 2011, the Company issued an additional 721,274 ordinary shares at an offering price of $19.00 per share (before underwriters' discounts and commissions)tax benefit due to theexercisereversal of valuation allowance from theunderwriters' overallotment option. The Company received proceedsacquisition ofapproximately $12.8 million (after underwriters' discounts and commissions of approximately $0.9 million.)OrthoHelix.In February 2011, we used approximately $116.1 million of the net proceeds from our initial public offering to repay all of the outstanding indebtedness under our notes payable, including accrued interest thereon, payable of approximately €86.4 million. At the time of repayment, we recognized a loss on debt extinguishment of approximately $29.5 million and related deferred tax benefit of $7.5 million to recognize the remaining balance of unamortized discount on the notes, and to reverse the related deferred tax liability.ItemITEM 9.Changes in and Disagreements With Accountants on Accounting and Financial Disclosure.
CHANGES IN AND DISAGREEMENTS WITH ACCOUNTANTS ON ACCOUNTING AND FINANCIAL DISCLOSURENot applicable.
ItemITEM 9A.Controls and Procedures.
CONTROLS AND PROCEDURESDisclosure Controls
Our President and Chief Executive Officer and Chief Financial Officer, referred to collectively herein as the Certifying Officers, are responsible for establishing and maintaining our disclosure controls and procedures. The Certifying Officers have reviewed and evaluated the effectiveness of
the Company'sour disclosure controls and procedures (as defined in Rules 240.13a-15(e) and 240.15d-15(e) promulgated under the Securities Exchange Act of1934)1934, as amended) as ofJanuary 2, 2011.December 29, 2013. Based on that review and evaluation, which included inquiries made to certain of our other employees,of the Company,the Certifying Officers have concluded that, as of the end of the period covered by thisannualreport,the Company'sour disclosure controls and procedures, as designed and implemented, are effective in ensuring that information relating tothe CompanyTornier required to be disclosed in the reports thatthe Company fileswe file orsubmitssubmit under the Securities Exchange Act of 1934, as amended, is recorded, processed, summarized and reported within the time periods specified in the Securities and ExchangeCommission'sCommission’s rules and forms, including ensuring that such information is accumulated and communicated tothe Company'sour management, including the Certifying Officers, as appropriate to allow timely decisions regarding required disclosure.This annual report does not include a reportManagement’s Annual Report on Internal Control Over Financial ReportingOur management is responsible for establishing and maintaining adequate internal control over financial reporting. Under the supervision and with the participation of
management's assessment regardingour management, including our President and Chief Executive Officer and Chief Financial Officer, we conducted an evaluation of the effectiveness of our internal control over financial reportingor an attestationas of December 29, 2013, based on the criteria established in Internal Control — Integrated Framework issued by the Committee of Sponsoring Organizations of the Treadway Commission (1992 framework) (COSO). Based on this evaluation, our management concluded that our internal control over financial reporting was effective as of December 29, 2013. The report ofthe company'sErnst &Young LLP, our independent registered public accounting firm,due to a transition period established by rulesregarding the effectiveness ofthe Securitiesour internal control over financial reporting is included in this report in “Part II. Item 8, Financial Statements andExchange Commission for newly public companies.Supplementary Data” under “Report of Independent Registered Public Accounting Firm.”Changes in Internal Control Over Financial Reporting
Except as discussed below,During the fourth quarter ended December 29, 2013, there were no changes in our internal control over financial reportingoccurred during the quarter ended January 2, 2011,thathavematerially affected, or that are reasonably likely to materially affect, our internal control over financial reporting.In connection with the audit of the Company's financial statements for 2009, we identified a material weakness in our internal control over financial reporting relating to our audited financial statements for fiscal years 2007 and 2008. Management and our independent registered accounting firm had determined that internal controls over identifying, evaluating and documenting accounting analysis and conclusions over complex non-routine transactions, including related-party transactions, require strengthening. During the year ended January 2, 2011, the Company implemented the following measures which it believes have addressed the material weakness identified above:•introduced formal policies and procedures regarding related party transactions which are subject to oversight by both senior management and the audit committee;•strengthened the communication and collaboration among the various departments within the Company;•reconfigured roles and responsibilities within the finance and accounting team to ensure sufficient resources are available to address such matters; and•further enhanced procedures to help ensure that proper accounting for all material complex, non-routine and related party transactions were researched and reviewed in conjunction with recording the transactions.
2014 Corporate Performance Incentive Plan
On February 13, 2014, our board of directors, upon recommendation of our compensation committee, approved the material terms of the Tornier N.V. Corporate Performance Incentive Plan for 2014. Under the terms of the plan, each participant, including our executive officers, is eligible to earn an annual cash incentive payment based primarily on the achievement of corporate, and in some cases, divisional performance goals, and in the case of most participants, individual performance goals. The plan is designed to reward all eligible employees for achieving annual goals and to closely align their accomplishments with the interests of our shareholders.
Each plan participant has an annual incentive target bonus under the plan, expressed as a percentage of his or her annual base salary. Each plan participant’s target bonus percentage is based on the individual’s position and level of responsibility within the company. The target bonus percentages, expressed as a percentage of annual base salary, for our executive officers named in the Summary Compensation Table contained elsewhere in this report are as follows for 2014: David H. Mowry, President and Chief Executive Officer (80%); Shawn T McCormick, Chief Financial Officer (50%); Gordon W. Van Ummersen, Senior Vice President, Product Delivery (50%); Terry M. Rich, Senior Vice President, U.S. Commercial Operations (75%); and Stéphan Epinette, Senior Vice President, International Commercial Operations (40%).
Each plan participant’s annual cash incentive bonus under the plan is determined by multiplying the participant’s target bonus amount (the participant’s target bonus percentage times his or her earned annual base salary) by a payout percentage equal to between 0% and 150% and determined based primarily on the achievement of corporate, and in some cases,
divisional performance goals, and in the case of most participants, individual performance goals. Consistent with the design for the 2013 plan, the payout under our 2014 corporate performance incentive plan for our President and Chief Executive Officer will be based 100% upon achievement of corporate performance goals, with no divisional performance or individual performance components. Otherwise, the percentage payout splits among corporate performance goals, divisional performance goals and individual performance goals will be the same for our other named executive officers for 2014, except that payouts for Mr. Rich and Mr. Epinette will be based 40% upon achievement of corporate performance goals and 60% upon achievement of their respective divisional goals. The corporate performance measures under the plan for 2014 will be based on Tornier’s adjusted revenue (both total revenue and total extremities revenue), adjusted EBITDA and adjusted free cash flow. The divisional performance measures for 2014 will be based on U.S. adjusted revenue for Mr. Rich and non-U.S. adjusted revenue (both total non-U.S. revenue and non-U.S. extremities revenue) for Mr. Epinette. If the minimum or threshold free cash flow corporate performance goal is not achieved, then our named executive officers will not receive any payout under the plan for individual performance. The material terms of the plan for 2014 are otherwise the same as the plan for 2013.
Discretionary Bonus
On February 13, 2014, our board of directors, upon recommendation of our compensation committee, approved a discretionary bonus of €31,944 to Stéphan Epinette, our Senior Vice President, International Commercial Operations. The bonus is intended to reward Mr. Epinette for the strong performance of our international business and his extraordinary individual performance and to retain and motivate him to achieve our corporate and international business’s performance objectives going forward.
Retention Stock Grants
Effective as of February 25, 2014, stock grants, in the form of restricted stock units, will be granted to certain officers, including three of the executive officers named in the Summary Compensation Table contained elsewhere in this report. The purpose of the grants is to retain and motivate our officers in light of: (1) the continuity of the executive team is important for executing our current strategic plan; (2) such officers received minimal corporate bonus payouts for 2013 under the Tornier N.V. Corporate Performance Incentive Plan and received little to no corporate bonus payouts for 2012; (3) such officers received no bonus payouts for 2013 attributable to their individual performance since under the terms of the Tornier N.V. Corporate Performance Incentive Plan, if the threshold adjusted EBITDA corporate performance goal was not achieved, then executive officer participants did not receive any payout under the plan for individual performance; (4) the vast majority of previously granted stock options held by such officers are currently “underwater” and thus offer minimal retention value; and (5) the outstanding long-term incentive value for our executive officers is below the median for all positions compared to our peer group and below the 25th percentile for three of seven positions.
The restricted stock units will vest based on the passage of time, with 50% of the underlying shares vesting and becoming issuable on the two-year anniversary of the grant date, 25% on the three-year anniversary of the grant date and the remaining 25% on the four-year anniversary of the grant date, or, if earlier, upon the achievement of certain minimum share price triggers. The share price triggers will be measured based on a 30-day average closing price of our ordinary shares.
The following executive officers named in the Summary Compensation Table will receive the following number of restricted stock units: Shawn T McCormick, Chief Financial Officer (12,500); Gordon W. Van Ummersen, Senior Vice President, Product Delivery (12,500); and Terry M. Rich, Senior Vice President, U.S. Commercial Operations (12,500). The other two executive officers named in the Summary Compensation Table will not receive any retention stock grants.
Not applicable.ItemITEM 10. DIRECTORS, EXECUTIVE OFFICERS AND CORPORATE GOVERNANCEDirectors and Executive Officers
and Corporate Governance.We have a one-tier board structure. Our board of directors consists of eight members.Thefollowingtable below sets forth, as ofJanuary 2, 2011,February 10, 2014, certain information concerning our directors and executiveand otherofficers. No family relationships exist among any of our directors or executive officers.NameAgePositionDouglas W. KohrsNameAge Position
David H. Mowry
5351President and Chief Executive Officer and Executive Director Carmen L. Diersen50Global Chief Financial OfficerRobert J. Ball38Vice President, Global Research and DevelopmentRalph E. Barisano, Jr.50Vice President, Global Quality Assurance and Regulatory AffairsStéphan Epinette40Vice President, International Commercial OperationsJames C. Harber41Vice President, Distal Extremities Global Business StrategyAndrew E. JoinerShawn T McCormick49 Chief Financial Officer Stéphan Epinette
42 Senior Vice President, and General Manager, U.S.International Commercial OperationsKevin M. Klemz
4952Senior Vice President, Chief Legal Officer and Secretary James E. KwanGregory Morrison50 Senior Vice President, Global Human Resources and HPMS Terry M. Rich
46 Senior Vice President, U.S. Commercial Operations Gordon W. Van Ummersen
52 Senior Vice President, Global Supply ChainProduct DeliveryGregory MorrisonSean D. Carney(1)(2)(3)4744Global Vice President, Human ResourcesChairman and Non-Executive Director Jamal D. RushdyKevin C. O’Boyle(2)(3)(4)3957Vice President, Global Business and Corporate DevelopmentNon-Executive Director Sean D. Carney(1)(2)Richard B. Emmitt(3)(4)4269Chairman, Non-executiveNon-Executive Director Richard B. Emmitt(3)Alain Tornier6667Non-executiveNon-Executive Director Pascal E.R. GirinRichard F. Wallman(1)(4)5062Non-executiveNon-Executive Director Kevin C. O'Boyle(3)Elizabeth H. Weatherman(1)54Non-executive Director
53Alain Tornier64Non-executiveNon-Executive Director
(1)Richard F. Wallman(3)(2)59Non-executive DirectorElizabeth H. Weatherman(1)51Non-executive DirectorMember of the compensation committee.(1)Member of the compensation committee.(2)Member of the nominating and corporate governance committee.(3)Member of the audit committee.
(2) Member of the nominating, corporate governance and compliance committee. (3) Member of the strategic transactions committee. (4) Member of the audit committee. The following is a biographical summary of the experience of our directors
executiveandotherexecutive officers:Douglas W. KohrsDavid H. Mowrywas appointedserves as our President and Chief Executive Officer, a position he has held since February 2013, and as our Executive Director, adirectorposition he has held since June 2013. Mr. Mowry joined us in July2006. Mr. Kohrs2011 as Chief Operating Officer, and in November 2012 was appointedasInterim President and Chief Executive Officer. In February 2013, he was appointed President and Chief Executive Officer on adirector in connection with the Securityholders' Agreement that we entered into with certain holders of our securities. For more information regarding the Securityholders' Agreement, please refer to the discussion below under "Related Party Transactions." Mr. Kohrsnon-interim basis. He has29over 24 years of experience in the medical device industry. Prior to joining us,heMr. Mowry served from July 2010 to July 2011 as President of the Global Neurovascular Division of Covidien plc, a global provider of healthcare products. From January 2010 to July 2010, Mr. Mowry served as Senior Vice President andChief Executive Officer of American Medical Systems Holdings, Inc., a publicly held medical device company, from April 1999 until January 2005 and served as Chairman of the American Medical Systems Holdings, Inc. board of directors until May 2006. During the past ten years, Mr. Kohrs has also served on the board of directors of nine different medical device companies. Mr. Kohrs previously served on the boardsPresident, Worldwide Neurovascular of ev3 Inc., apublicly held medicalglobal endovascular device companythatacquired Covidien in July 2010. From August 2007 to January 2010, Mr. Mowry served as Senior Vice President of Worldwide Operations of ev3. Prior to this position, Mr. Mowry wasrecently acquired by a wholly owned subsidiaryVice President ofCovidien Group S.a.r.l.,Operations for ev3 Neurovascular from November 2006 to October 2007. Before joining ev3, Mr. Mowry served as Vice President of Operations andKyphon,Logistics at the Zimmer Spine division of Zimmer Holdings Inc., apublicly heldreconstructive and spinal implants, trauma and related orthopaedic surgical products company, from February 2002 to November 2006. Prior to Zimmer, Mr. Mowry was President and Chief Operating Officer of HeartStent Corp., a medical device company.Prior to joining American Medical Systems Holdings, Inc.,Mr.Kohrs was General ManagerMowry is a graduate ofSulzer Spine-Tech Inc., an orthopaedic implant manufacturer of which he wasthe United States Military Academy in West Point, New York with afounding member beginning in August 1991. Mr. Kohrs holds a Master of Business Administration from Northeastern University, a Bachelor of Science in Bioengineering from Texas A&M University and a Bachelor of Artsdegree in EngineeringSciences from Austin College. Mr. Kohrs' prior experience, including as ChiefExecutive Officer of American Medical Systems Holdings, Inc. at the time of its initial public offering,andhis understanding of our business and industry have led our board of directors to the conclusion that he should serve as a director at this time in light of our business and structure.Mathematics.Carmen L. DiersenShawn T McCormick joined usin June 2010asGlobalour Chief FinancialOfficer. She has 18 years of experienceOfficer inthe medical device industry, including nine years in spinal orthopaedics.September 2012. Prior to joining us,sheMr. McCormick servedfrom September 2006 to June 2010astheChief Operatingand FinancialOfficer ofSpine Wave,Lutonix, Inc., aprivately held developer of advanced materials, techniques, and implant systems for spinal surgery.medical device company acquired by C. R. Bard, Inc. in December 2011, from April 2011 to February 2012. FromMarch 2004January 2009 toSeptember 2006, Ms. DiersenJuly 2010, Mr. McCormick served asExecutiveSenior Vice President and Chief Financial Officer ofAmerican Medical Systems Holdings,ev3 Inc., apublicly held medicalglobal endovascular devicecompany.company acquired Covidien plc in July 2010. Prior toAmerican Medical Systems Holdings, Inc., Ms. Diersen spent 12 years in financial leadership positionsjoining ev3, Mr. McCormick served as Vice President, Corporate Development at Medtronic, Inc., a global medical device company, where he was responsible for leading Medtronic’s worldwide business development activities. Mr. McCormick joined Medtronic inthe cardiac surgery, cardiac rhythm managementJuly 1992 andspinal surgery businesses, concluding her career thereheld various finance and leadership positions during his tenure. From July 2007 to May 2008, he served astheVice President, Corporate Technology andGeneral ManagerNew Ventures ofMusculoskeletal Tissue ServicesMedtronic. From July 2002 to July 2007, he was Vice President, Finance forMedtronic Sofamor Danek.Medtronic’s Spinal, Biologics and Navigation business. Prior to that, Mr. McCormick held various other positions with Medtronic,Inc., sheincluding Corporate Development Director, Principal Corporate Development Associate, Manager, Financial Analysis, Senior Financial Analyst and Senior Auditor. Prior to joining Medtronic, he spent10four yearsat Honeywell, Inc. Ms. Diersenwith the public accounting firm KPMG Peat Marwick. Mr. McCormick earnedahis Master of Business Administration from the University of Minnesota’s Carlson School of Managementat the University of Minnesotaandahis Bachelor of Science in Accounting fromthe University of North Dakota. She becameArizona State University. He is a Certified PublicAccountant in 1983. Ms. Diersen has served on the board of directors of SonoSite, Inc., a publicly held leader in point of care ultrasound systems, since October 2005 and previously served on the board of directors of Memry Corporation, a publicly held medical specialty materials company, from December 2004 through September 2008 when the company was sold and Wright Medical Group, Inc., a publicly held medical device company from December 2009 until June 2010 when she joined us.Accountant.Robert J. Balljoined us in September 2006 as Vice President, Global Research and Development. He has over 11 years of experience in the orthopaedic medical device industry. Prior to joining us he served as Vice President of Research Development of Kinetikos Medical Incorporated, or KMI, a medical device company, beginning in December 2002, and also assumed responsibility for Marketing and Product Development in May 2005, continuing in each capacity until August 2006, when KMI was acquired by Integra LifeSciences Holdings Corporation. Prior to joining KMI, Mr. Ball held positions at DePuy, where he oversaw the development and launch of orthopaedic products in the upper extremity. Prior to joining DePuy, he served in the automotive manufacturing industry with SPX Corporation as Program and Engineering Manager, overseeing construction and tooling of a large scale casting and machining facility. Mr. Ball has Bachelor of Science and Master of Science degrees in mechanical engineering from Kettering University (formerly GMI Engineering and Management Institute) and has over 30 issued and pending patents.Ralph E. Barisano, Jr.joined us in April 2007 and leads our quality assurance and regulatory affairs programs as our Vice President, Global Quality Assurance and Regulatory Affairs. He has over 25 years of experience in the medical device industry. Prior to joining us he consulted for Axya, a medical device company, from November 2006 to April 2007, where he directed Quality Assurance and Regulatory Affairs including during its acquisition by us. Prior to joining Axya, he served as Director of Quality Assurance for Smith & Nephew Endoscopy, a manufacturer of surgical equipment and tools, from January 2002 to November 2006. Mr. Barisano has also held other Quality and Regulatory roles at a number of other medical device companies, including Hologic Systems Inc., C.R. Bard, Inc. and Allergan, Inc. Mr. Barisano earned a Master of Business Administration from the Isenberg School of Management, University of Massachusetts Amherst and a Bachelor of Science in Mechanical Engineering Technology from the University of Massachusetts, North Dartmouth.Stéphan Epinette
joined us in December 2008 andleads our international commercial operations(Europe, Asia Pacific, Latin America)and large joints business as Senior Vice President,ofInternational Commercial Operations.HeMr. Epinette served as Vice President, International Commercial Operations from December 2008 to January 2014 and in January 2014 was appointed to his current position. Mr. Epinette has over1719 years of experience in the orthopaedic medical device industry. Prior to joining us, he served in various leadership roles with Stryker Corporation, a medicaldevice and equipmenttechnology company, in its MedSurg and Orthopaedic divisions in France, the United States and Switzerland from 1993 to December 2008, including as Business Unit Director France from 2005 to2008. His past functions at Stryker
Corporationalso included Marketing Director MedSurg EMEA, Assistant to the EMEA President and Director of Business Development & Market Intelligence EMEA. Mr. Epinette earned aMastersMaster’s Degree in Health Economics from Sciences Politiques, Paris, aMastersMaster’s Degree in International Business from Paris University XII and a Bachelor of Arts from EBMS Barcelona. He also attended the INSEAD executive course in Finance and in Marketing.James C. Harberjoined us in February 2007 following our acquisition of Nexa and leads our distal extremities organization as our Vice President, Distal Extremities Global Business Strategy, which consists of our foot, ankle, hand, wrist, and elbow joints and trauma products. He has over 20 years of experience in the orthopaedic medical device industry. At Nexa, he served as the Vice President of Marketing and Sales from March 2006 until June 2007. Prior to joining Nexa, Mr. Harber held the position of Vice President, Marketing at Hand Innovations LLC, an orthopaedic manufacturer from August 2003 to February 2006. He has also held marketing positions at Wright Medical Group, Inc. and Smith & Nephew plc, which are both medical device companies, and was Vice President of Sales and Marketing at a development stage computer assisted surgery venture. Mr. Harber earned a Bachelor of Science in Marketing from Christian Brothers University.Andrew E. Joinerjoined us in April 2008 and leads our U.S. sales and marketing activities and the global shoulder business as our Vice President and General Manager, U.S. Commercial Operations. He has over 19 years of experience in the medical device industry. Prior to joining us, he served as the Vice President and General Manager of Women's Health at American Medical Systems Holdings, Inc. from January 2007 to April 2008, and as the Vice President of Global Marketing at American Medical Systems Holdings, Inc., from 2005 to December 2006. Prior to American Medical Systems Holdings, Inc., Mr. Joiner worked for ten years for United States Surgical Corporation, a surgical tools company, in a variety of sales functions, concluding his career there as Director of Sales for the Southwest Region of the U.S. Mr. Joiner holds a Bachelor of Science in Telecommunications from the University of Georgia.Kevin M. Klemz
joined us in September 2010serves as our Senior Vice President, Chief Legal Officer and Secretary. Mr. Klemz served as Vice President, Chief Legal Officer andSecretary.Secretary from September 2010 to January 2014 and in January 2014 was appointed to his current position. Prior to joining us, Mr. Klemz served as Senior Vice President, Secretary and Chief Legal Officer at ev3 Inc., a global endovascular device company acquired Covidien plc in July 2010, from August 2007 to August 2010, and as Vice President, Secretary and Chief Legal Officer at ev3Inc.from January 2007 to August 2007. Prior to joining ev3,Inc.,Mr. Klemz was a partner in the law firm Oppenheimer Wolff & Donnelly LLP, where he was a corporate lawyer for approximately 20 years. Mr. Klemz has a Bachelor of Arts in Business Administration from Hamline University and a Juris Doctor from William Mitchell College of Law.James E. KwanGregory Morrisonjoined us in September 2006 and leads our global supply chain organizationserves as our Senior Vice President, GlobalSupply Chain.Human Resources and HPMS (High Performance Management System). Mr.Kwan has alsoMorrison servedas Director of Tornier Orthopaedics Ireland Ltd., one of our subsidiaries, since March 2010. He has over 20 years of experience in the medical device industry. Prior to joining us, he served as the Vice President of Operations for the Cardiac Surgery Division for St. Jude Medical, Inc., a medical technology company, from 2004 to 2006. At St. Jude Medical, Inc., Mr. Kwan also served as the Director of Hybrid Microelectronics operations for the Cardiac Rhythm Management Division and managed the Pyrolytic Carbon Technology operations for the Heart Valve Division. Prior to joining St. Jude Medical, Inc., Mr. Kwan served as a Director of Manufacturing at SciMed Life Systems, an interventional cardiology company, and before that held various technical positions within the Defense Systems Division of Honeywell International, Inc., a diversified technology company. Mr. Kwan received a Bachelor of Science in Mechanical Engineering from South Dakota School of Mines & Technology and a Master of Business Administration from the University of St. Thomas.Gregory Morrisonjoined us in December 2010as Global Vice President, HumanResources.Resources from December 2010 to January 2014 and in January 2014 was appointed to this current position. Prior to joining us, Mr. Morrison served as Senior Vice President, Human Resources at ev3 Inc., Inc., a global endovascular device company acquired Covidien plc in July 2010, from August 2007 to December 2010, and as Vice President, Human Resources of ev3 from May 2002 to August 2007. Prior to joining ev3,Inc.,Mr. Morrison served as Vice President of Organizational Effectiveness forThomson Legal & Regulatory from March 1999 to February 2002 and Vice President of Global Human Resources for Schneider Worldwide,
(Boston Scientific)which was acquired by Boston Scientific Corporation, from 1988 to March 1999. Mr. Morrison has a Bachelor of Arts in English and Communications from North Adams State College and a Master of Arts in Corporate Communications from FairfieldUniversityUniversity.Jamal D. RushdyTerry M. Richjoinedserves as our Senior Vice President, U.S. Commercial Operations, a position he has held since March 2012. Prior to joining us,in February 2007 when we acquired Nexa,Mr. Rich served as Senior Vice President of Sales – West of NuVasive, Inc., a medical device company focused on developing minimally disruptive surgical products andleads our corporate strategic planningprocedures for the spine. Prior to such position, Mr. Rich served as Area Vice President, Sales Director andacquisition, licensingArea Business Manager of NuVasive from December 2005. Prior to joining NuVasive, Mr. Rich served as Partner/Area Sales Manager of Bay Area Spine of DePuy Spine, Inc., a spine company andpartnership programs and our sports medicine and biologics businesses, servingsubsidiary of Johnson & Johnson, from July 2004 to December 2005. Mr. Rich has a Bachelor of Labor Relations from Rutgers College, Rutgers University.Gordon W. Van Ummersen serves as our Senior Vice President, Global
Business and Corporate Development since June 2007. He has over 15 years of experience in the orthopaedic medical device industry. At Nexa, heProduct Delivery. Mr. Ummersen servedfrom January 2006 to May 2007astheSenior Vice President,of OperationsProduct Delivery from June 2013 to January 2014 andBusiness Development until its acquisition by us.in January 2014 was appointed to his current position. Prior toNexa, hejoining us, Mr. Van Ummersen spent a year in multiple leadership roles for Biomet, Inc., an orthopedic company, following the divestiture of the worldwide trauma business of DePuy Orthopaedics, Inc. to Biomet in June 2012. Prior to that, Mr. Van Ummersen served as WW President, Trauma & Extremities for DePuy from 2007 to June 2012, General Manager, Trauma & Extremities from 2005 to 2007 and Vice President, Marketing from 2003 to 2005. Prior to joining DePuy, Mr. Van Ummersen held numerous senior commercial roles at Stryker Corporation, a medical technology company, including Vice President & General Manager for US Trauma from 1999 to 2003 and Director ofMarketing and Business Development for dj Orthopedics LLC,Corporate Accounts from 1995 to 1999. Mr. Van Ummersen holds amedical device company, where he also served in various leadership roles in finance and operations from June 2001 to January 2006. Mr. Rushdy earned a MasterMasters of Business Administration from the University ofCalifornia, IrvineMassachusetts, Boston and a Bachelor of Science degree inMechanical EngineeringHealth Services Administration fromthe University of California, San Diego.Providence College.Sean D. Carney is one of our directors and has served as a director since July 2006. Mr. Carney serves as our Chairman, a position he has held since May 2010. Mr. Carney was appointed as a director in connection with the
Securityholders' Agreementsecurityholders’ agreement that we entered into with certain holders of our securities.Mr. Carney became the Chairman of the Company's board of directors in May 2010.For more information regarding theSecurityholders' Agreement,securityholders’ agreement, please refer to the discussion below under"Related Party Transactions."“—Board Structure and Composition.” Since 1996, Mr. Carney has been employed by Warburg Pincus LLC and has served as a Member and Managing Director of Warburg Pincus LLC and General Partner of Warburg Pincus & Co. since January 2001. Warburg Pincus LLC and Warburg Pincus & Co. are part of the Warburg Pincus entities collectively referred to elsewhere in thisprospectusreport as Warburg Pincus,our stockholdera principal shareholder that owns approximately47%32.7% of our outstanding ordinary shares as ofJanuary 2, 2011. Mr. Carney formerly served on the board of directors of Arch Capital Group Ltd., a publicly held company.February 10, 2014. He is also a member of the board of directors ofBausch & LombMBIA Inc. and severalotherprivate companies. During the past five years, Mr. Carney previously served on the board of directors of DexCom, Inc. and Arch Capital Group Ltd.,aboth publicly heldmedical devicecompanies, and Bausch & Lomb Incorporated, a privately held company. Mr. Carney received a Master of Business Administration fromHarvard Business School and a Bachelor of Arts from Harvard College. Mr.
Carney'sCarney’s substantial experience as an investor and director in medical device companies and his experience evaluating financial results have led our board of directors to the conclusion that he should serve as a director,at this time in lightour Chairman and Chair and member of several of ourbusiness and structure.Richard B. Emmittis one of our directors and has served as a director since July 2006. Mr. Emmitt was appointed as a director in connection with the Securityholders' Agreement that we entered into with certain holders of our securities. For more information regarding the Securityholders' Agreement, please refer to the discussion below under "Related Party Transactions." Mr. Emmitt served as a General Partner of The Vertical Group LP, an investment management and venture capital firm focused on the medical device and biotechnology industries, from its inception in 1989 through December 2007. Commencing in January 2008, he has been a Member and Manager of The Vertical Group GP, LLC, which controls The Vertical Group LP. Mr. Emmitt currently serves on theboardof directors of American Medical Systems Holdings, Inc., a publicly held company, as well as several privately held companies. During the past five years, Mr. Emmitt previously served on the board of directors of Wright Medical Group, Inc. and Micro Therapeutics, Inc., all publicly held medical device companies and ev3 Inc. Mr. Emmitt holds a Master of Business Administration from the Rutgers School of Business and a Bachelor of Arts from Bucknell University. Mr. Emmitt's substantial experience as an advisor to numerous venture-backed growth companies and as an advisor to high-growth companies has led our board of directors to the conclusion that he should serve as a director at this time in light of our business and structure.Pascal E.R. Girinis one of our directors and has served as a director since November 2010. Mr. Girin was appointed as a director in connection with the Securityholders' Agreement that we entered into with certain holders of our securities. For more information regarding the Securityholders'Agreement, please refer to the discussion below under "Related Party Transactions." Since February of 2011, Mr. Girin has served as President and Chief Executive Officer of Keystone Dental Inc. Prior to that, from October 2010 to February 2011, Mr. Girin served as Executive Vice President and Chief Operating Officer of Keystone Dental Inc. From July 2010 to September 2010, Mr. Girin served as Chief Operating Officer of ev3 Inc. following its acquisition by a wholly owned subsidiary of Covidien Group S.a.r.l. Prior to that time, Mr. Girin served as Executive Vice President and Chief Operating Officer of ev3 Inc. from January 2010 to July 2010, as Executive Vice President and President, Worldwide Neurovascular and International of ev3 Neurovascular Inc. from July 2008 to January 2010, as Senior Vice President and President, International of ev3 International from July 2005 to July 2008, and as General Manager, Europe of ev3 Inc. from September 2003 to July 2005. From September 1998 to August 2003, Mr. Girin served in various capacities at BioScience Europe Baxter Healthcare Corporation, most recently as Vice President. Mr. Girin received an Engineering Education at the French Ecole des Mines. Mr. Girin's substantial experience as an executive at other global medical device companies has led our board of directors to the conclusion that he should serve as a directorcommittees at this time in light of our business and structure.Kevin C.
O'BoyleO’Boyle is one of our directors and has served as a director since June 2010.SinceIn November 2012, Mr. O’Boyle served as Interim Vice Chairman of Tornier, a position he held for about a year. From Decemberof2010 to October 2011, Mr.O'Boyle hasO’Boyle served as Senior Vice President and Chief Financial Officer of Advanced BioHealing Inc., a medical devicecompany.company which was acquired by Shire PLC in May 2011. From January 2003 until December 2009, Mr.O'BoyleO’Boyle served as the Chief Financial Officer of NuVasive, Inc., a medical device company that completed its initial public offering in May 2004. Prior to that time, Mr.O'BoyleO’Boyle served in various positions during his six years with ChromaVision Medical Systems, Inc., a publicly held medical device company specializing in the oncology market, including as its Chief Financial Officer and Chief Operating Officer. Mr.O'BoyleO’Boyle also held various positions during his seven years with Albert Fisher North America, Inc., a publicly held international food company, including Chief Financial Officer and Senior Vice President of Operations.HeMr. O’Boyle currently serves on the board of directors of GenMark Diagnostics, Inc.,aZELTIQ Aesthetics, Inc. and Durata Therapeutics, Inc., all publicly tradedmolecular diagnostics company.companies. Mr.O'Boyle is a Certified Public Accountant andO’Boyle received a Bachelor of Science in Accounting from the Rochester Institute of Technology and successfully completed the Executive Management Program at the University of California Los Angeles, John E. Anderson Graduate Business School. Mr.O'Boyle'sO’Boyle’s executive experience in the healthcare industry, his experience with companies during their transition fromabeing privately held toa public companypublicly held and his financial and accounting expertise have led our board of directors to the conclusion that Mr.O'BoyleO’Boyle should serve as a director, Chair of our strategic transactions committee andona member of our audit committee at this time in light of our business and structure.Richard B. Emmitt is one of our directors and has served as a director since July 2006. Mr. Emmitt was appointed as a director in connection with the securityholders’ agreement that we entered into with certain holders of our securities. For more information regarding the securityholders’ agreement, please refer to the discussion below under “—Board Structure and Composition.” Mr. Emmitt served as a General Partner of The Vertical Group L.P., an investment management and venture capital firm focused on the medical device and biotechnology industries, from its inception in 1989 through December 2007. Commencing in January 2008, Mr. Emmitt has been a Member and Manager of The Vertical Group G.P., LLC, which controls The Vertical Group L.P. Mr. Emmitt currently serves on the board of directors of several privately held companies. During the past five years, Mr. Emmitt previously served on the board of directors of ev3 Inc. and American Medical Systems Holdings, Inc., both publicly held companies, and several privately held companies. Mr. Emmitt holds a Master of Business Administration from the Rutgers School of Business and a Bachelor of Arts from Bucknell University. Mr. Emmitt’s substantial experience as an investor and board member of numerous medical device companies ranging from development stage private companies to public companies with substantial revenues has led our board of directors to the conclusion that he should serve as a director and a member of our audit committee and strategic transactions committee at this time in light of our business and structure.
Alain Tornier is one of our directors and has served as a director since May 1976. Mr. Tornier assumed a leadership role in our predecessor entity in 1976, following the death of his father, René Tornier, our founder.
HeMr. Tornier later served as our President and Chief Executive Officer until the acquisition of ouracquisitioncompany bythe Investor Groupan investor group in September 2006, when heretired.retired as an executive officer of our company. Mr. Tornier holds a Master of Sciences degree from Grenoble University. Mr.Tornier'sTornier’s significant experience in the global orthopaedics industry and deep understanding of ourcompany'scompany’s history and operations have led our board of directors to the conclusion that he should serve as a director at this time in light of our business and structure.Richard F. Wallman is one of our directors and has served as a director since December 2008. From 1995 through his retirement in 2003, Mr. Wallman served as
theSenior Vice President and Chief Financial Officer of Honeywell International, Inc., a diversified technology company, and AlliedSignal, Inc., a diversified technology company (prior to its merger with Honeywell International, Inc.). Prior to joining AlliedSignal, Inc. as Chief Financial Officer, Mr. Wallman served as Controller of International Business Machines Corporation. In addition to serving as one of our directors,heMr. Wallman is also a member of the board of directors ofAriba, Inc.,Charles River Laboratories International, Inc., Convergys Corporation,Dana Holding Corporation,Extended Stay America, Inc. and its wholly subsidiary ESH Hospitality, Inc., and Roper Industries, Inc., all publicly held companies.He is also a member of the board of directors of Bausch & Lomb Inc.Duringthe past five years, Mr. Wallman previously served on the board of directors of
ExpressJet HoldingsAriba, Inc.and Avaya Inc.,as well as auto suppliers Dana Holding Corporation, Lear Corporation and Hayes Lemmerz International, Inc., all publicly held companies. Mr. Wallman holds a Master of Business Administration from the University of Chicago Booth School of Business with concentrations in finance and accounting and a Bachelor of Science in Electrical Engineering from Vanderbilt University. Mr.Wallman'sWallman’s prior public company experience, including as Chief Financial Officer of Honeywell and his public company director experience, and his financial experience and expertise, have led our board of directors to the conclusion that he should serve as a director, Chair of our audit committee and a member of our compensation committee at this time in light of our business and structure.Elizabeth H. Weatherman
is one of our directors and has served as a director since July 2006. Ms. Weatherman was appointed as a director in connection with theSecurityholders' Agreementsecurityholders’ agreement that we entered into with certain holders of our securities. For more information regarding theSecurityholders' Agreement,securityholders’ agreement, please refer to the discussion below under"Related Party Transactions."“—Board Structure and Composition.” Ms. Weatherman is a General Partner of Warburg Pincus & Co., a Managing Director of Warburg Pincus LLC and a member of thefirm'sfirm’s Executive Management Group. Ms. Weatherman joined Warburg Pincus in 1988 and is currently responsible for thefirm'sfirm’s U.S. healthcare investment activities. Warburg Pincus LLC and Warburg Pincus & Co. are part of the Warburg Pincus entities collectively referred to elsewhere in thisprospectusreport as Warburg Pincus,our stockholdera principal shareholder that owns approximately47%32.7% of our outstanding ordinary shares as ofJanuary 2, 2011.February 10, 2014. Ms. Weatherman currently serves on the board of directors ofBausch & Lomb Inc. andseveralotherprivately held companies. During the past five years, Ms. Weatherman previously served on the board of directors ofAmerican Medical Systems Holdings,ev3 Inc.,Kyphon, Inc., Micro Therapeutics, Inc., and Wright Medical Group, Inc., alla publicly heldcompanies,company, andev3 Inc.Bausch & Lomb Incorporated, a privately held company. Ms. Weatherman earned a Master of Business Administration from the Stanford Graduate School of Business and a Bachelor of Arts from Mount Holyoke College. Ms.Weatherman'sWeatherman’s extensive experience as a director of public companies in the medical device industry has led our board of directors to the conclusion that she should serve as a director and a member of our compensation committee at this time in light of our business and structure.Board Structure and Composition
We have a one-tier board structure. Our articles of
Directorsassociation provide that the number of members of our board of directors will be determined by our board of directors, provided that our board of directors shall be comprised of at least one executive director and two non-executive directors. Our board of directors currently consists of
eightseven directors,sevenone of whom is our executive director and six of whom are non-executive directors.The Chief Executive Officer is the executive director.All of our non-executive directors, except Mr. Tornier, are
independent“independent directors” under theindependence criteria of NASDAQ. Therefore, sixListing Rules of theeightNASDAQ Stock Market. Therefore, five of our current seven directors areindependent.“independent directors” under the Listing Rules of the NASDAQ Stock Market. Independence requirements for service ontheour audit committeeisare discussed below under"—Committees of the“—Boardof Directors—Committees—Audit Committee” and independence requirements for service on our compensation committee are discussed below under “—Board Committees—Compensation Committee."” Mr. Wallman and Mr.O'BoyleO’Boyle are independent under the independence definition in the Dutch Corporate Governance Code. Because we currently comply with the NASDAQ corporate governance requirements, we can deviate from the Dutch Corporate Governance Code requirement that a majority of our directors be independentdoes not applywithin the meaning of the Dutch Corporate Governance Code provided we explain such deviation in our statutory annual report.Our amended articles of association provide that the number of members of the board of directors will be determined by the board of directors, provided that at all times the board of directors shall be comprised of at least one executive director and two non-executive directors.Our board of directors and our shareholders each haveeachapproved that our board of directors be divided into three classes, as nearly equal in number as possible, with each director serving a three-year term and one class being elected at eachyear'syear’s annual general meeting of shareholders.AlainMr. TornierPascal E.R. GirinandElizabeth H.Ms. Weatherman are in the class of directors whose term expires at the20112014 annual general meeting of our shareholders.Sean D.Messrs. CarneyDouglas W. KohrsandRichard B.Emmitt are in the class of directors whose term expires at the20122015 annual general meeting of our shareholders.Richard F.Messrs. Mowry, O’Boyle and Wallmanand Kevin C. O'Boyleare in the class of directors whose term expires at the20132016 annual general meeting of our shareholders. At each annual general meeting of our shareholders, successors to the class of directors whose term expires at such meeting will be elected to serve for three-year terms or until their respective successors are elected and qualified.The general meeting of shareholders appoints the members of
theour board of directors, subject to a binding nomination of the board of directors in accordance with the relevant provisions of the Dutch Civil Code.TheOur board of directors will make the binding nomination based on a recommendation ofthe Nominatingour nominating, corporate governance andCorporate Governance Committee.compliance committee. A nominee is deemed appointed unless the general meeting of shareholders opposes the use of the binding nomination procedure by a resolution passed with the affirmative vote of at least two-thirds majority of the votes cast, which votes also represent more than 50% of our issued share capital. In such case, a new meeting is called to fill the vacancies for which the binding nominations were initially made. Nominees for appointment are presented by the board of directors. These nominations are not binding. The resolution for appointment in such meeting shall require the affirmative vote of at least two-thirds majority of the votes cast representing more than 50% of our issued share capital.If
theour board of directors fails to use its right to submit a binding nomination, the general meeting of shareholders may appoint members oftheour board of directors with a resolution passed with the affirmative vote of at least a two-thirds majority of the votes cast, representing more than 50% of our issued share capital. A resolution of the general meeting of shareholders to suspend a member oftheour board of directors requires the affirmative vote of an absolute majority of the votes cast. A resolution of the general meeting of shareholders to suspend or dismiss members oftheour board of directors, other than pursuant to a proposal bytheour board of directors, requires a majority of at least two-thirds of the votes cast, representing more than 50% of our issued share capital.Pursuant to
the Securityholders' Agreement, dated July 18, 2006, by anda securityholders’ agreement among Tornier,N.V.TMG Holdings Coöperatief U.A. (TMG),formerly known as TMG B.V.Vertical Fund I, L.P.,TMG, TMG Partners U.S. LLC, Mr. Kohrs, VFI, VFII,Vertical Fund II, L.P., KCH Stockholm AB, Mr. Tornier,WP BermudaWarburg Pincus (Bermuda) Private Equity IX, L.P. and(by subsequent joinder agreements) TMG Partners II LLC, TMG Partners III LLC, Split Rock Partners, L.P., or Split Rock, Stichting Administratiekantoor Tornier, or STAK, Medtronic Bakken Research Center B.V., or Medtronic, and DVO TH, L.L.C., or DVO TH, as amended on August 27, 2010,certain other shareholders, TMG has the right to designate threeof the eightdirectors to be nominated to our board of directors for so long as TMG beneficially owns at least 25% oftheour outstanding ordinary shares, twoof the eightdirectors for so long as TMG beneficially owns at least 10% but less than 25% oftheour outstanding ordinary shares and oneof the eight directorsdirector for so long as TMG beneficially owns at least 5% but less than 10% oftheour outstandingshares, and the Company hasordinary shares. We agreed to useitsour reasonable best efforts to cause the TMG designees to be elected.In addition, Mr. Kohrs will continue to be entitled to be nominated for election to the boardAs ofdirectors until termination of his employment.No family relationships exist among anyFebruary 10, 2014, TMG beneficially owned 32.7% of our outstanding ordinary shares. Messrs. Carney and Emmitt and Ms. Weatherman are the current directorsexecutive officers or key employees.who are designees of TMG.Under our
amendedarticles of association,theour internal rules for the board of directors andthe board committees andDutch law, the members oftheour board of directors are collectively responsible for the management, general and financial affairs and policy and strategy of our company.TheOur executive directorishistorically has been our Chief Executive Officer, who is primarily responsible for managing our day-to-day affairs as well as other responsibilities that have been delegated to the executive director in accordance with ouramendedarticles of association and our internal rules for the board of directors.TheOur non-executive directors supervisetheour Chief Executive Officer and our general affairs and provide general advice to our Chief Executive Officer. In performing their duties,the non-executiveour directors are guided by the interests ofthe Companyour company and shall, within the boundaries set by relevant Dutch law, take into account the relevant interests of our stakeholders. The internal affairs of the board of directors are governed by our internal rules for the board ofdirectors.directors, a copy of which is available on the Investor Relations—Corporate Governance section of our corporate website atwww.tornier.com.
TableMr. Carney serves as our Chairman. The duties and responsibilities ofContentsIt is expected that allour Chairman include, among others: determining the agenda and chairing the meetings oftheour board of directors,willmanaging our board of directors to ensure that it operates effectively, ensuring that the members of our board of directors receive accurate, timely and clear information, encouraging active engagement by all the members of our board of directors, promoting effective relationships and open communication between non-executive directors and the executive director and monitoring effective implementation of board of directors decisions.All regular meetings of our board of directors are scheduled to be held in the Netherlands. Each director has the right to cast one vote and may be represented at a meeting of
theour board of directors by a fellow director.TheOur board of directors may pass resolutions only if a majority of the directors is present at the meeting and all resolutions must be passed by a majority of the directors that have no conflict of interest present or represented. However, as required by Dutch law, ouramendedarticles of associationprovidesprovide that when one or more members oftheour board of directors is absent or prevented from acting, the remaining members oftheour board of directors will be entrusted with the management of our company. The intent of this provision is to satisfy certain requirements under Dutch law and provide that, in rare circumstances, when a director is incapacitated, severely ill or similarly absent or prevented from acting, the remaining members oftheour board of directors (or, in the event there are no such remaining members, a person appointed by our shareholders at a general meeting) will be entitled to act on behalf oftheour board of directors in the management of our company, notwithstanding the general requirement that otherwise requires a majority of our board of directors be present. In these limited circumstances, ouramendedarticles of association permit our board of directors to pass resolutions even if a majority of the directors is not present at the meeting.Subject to Dutch law and any
director'sdirector’s objection, resolutions may be passed in writing by a majority of the directors in office. Pursuant to the internal rules for our board of directors, a director may not participate in discussions or thedecision-making process on a transaction or subject in relation to which he or she has a conflict of interest with us. Resolutions to enter into such transactions must be approved by a majority of our board of directors, excluding such interested director or directors.Committees of theBoardof DirectorsCommitteesOur board of directors has four standing board committees: an audit committee, a compensation committee, a nominating, corporate governance and compliance committee and a
nominating and corporate governance committee, eachstrategic transactions committee. Each ofwhichthese committees has thecompositionresponsibilities andresponsibilitiescomposition described below. Our board of directors has adopted a written charter for each committee of our board of directors, which charters are available on the Investor Relations—Corporate Governance section of our corporate website atwww.tornier.com. Our board of directors from time to time may establish other committees.Audit
Committee.CommitteeOur audit committee oversees a broad range of issues surrounding our accounting and financial reporting processes and audits of our financial statements.
OurThe primary responsibilities of our audit committee(i) assistsinclude:assisting our board of directors in monitoring the integrity of our financial statements, our compliance with legal and regulatory requirements insofar as they relate to our financial statements and financial reporting obligations and any accounting, internal accounting controls or auditing matters, our independentauditor'sauditor’s qualifications and independence and the performance of our internal audit function and independent auditors;(ii) assumes direct responsibility for the appointment, compensation, retentionappointing, compensating, retaining andoversight ofoverseeing the work of any independent registered public accounting firm engaged for the purpose of performing any audit, review or attest services and for dealing directly with any such accounting firm;and (iii) providesproviding a medium for consideration of matters relating to any auditissues.issues;establishing procedures for the receipt, retention and treatment of complaints received by our company regarding accounting, internal accounting controls or auditing matters, and for the confidential, anonymous submission by our employees of concerns regarding questionable accounting or auditing matters; andreviewing and approving all related party transactions required to be disclosed under the federal securities laws.Our audit committee reviews and evaluates, at least annually, the performance of the committee and its members, including compliance of the committee with its charter.
Our audit committee consists of Mr. Wallman (Chair), Mr. Emmitt and Mr.
O'Boyle.O’Boyle. We believe that the composition of our audit committee complies with the applicable rules of the SEC and the NASDAQGlobal SelectStock Market.TheOur board of directors has determined that each of Mr. Wallman, Mr. Emmitt and Mr.O'Boyle are eachO’Boyle is an"audit“audit committee financial expert,"” as defined in the SEC rules, andsatisfysatisfies the financial sophistication requirements of the NASDAQGlobal SelectStock Market. The board of directors also has determined that each of Messrs. Wallman, Emmitt andO'Boyle are independent as such term is defined inO’Boyle meets the more stringent independence requirements for audit committee members of Rule 10A-3(b)(1) under the Exchange Act and therulesListing Rules of the NASDAQGlobal Select Market.Stock Market, and each of Messrs. Wallman andO'Boyle areO’Boyle is independentas such term is definedunder the Dutch Corporate Governance Code.Our boardCompensation CommitteeThe primary responsibilities of
directors has adopted a written charter for the auditour compensation committee, whichis available on our website.Compensation Committee.Withinare within the scope of the compensation policy adopted by the general meetingour compensation committee reviews and recommends policy relating to compensation for and benefitsof ourofficers and employees, includingshareholders, include:reviewing and approving corporate goals and objectives relevant to the compensation of our Chief Executive Officer and otherseniorexecutive officers,evaluating the performance of these officers in light of those goals and objectives and setting compensation of these officers based on such
evaluations. Theevaluations;making recommendations to our board of directors with respect to incentive compensation and equity-based plans that are subject to board and shareholder approval, administering or overseeing all of our incentive compensation and equity-based plans, and discharging any responsibilities imposed on the committee by any of these plans;reviewing and discussing with management the “Compensation Discussion and Analysis” section of this report and based on such discussions, recommending to our board of directors whether the “Compensation Discussion and Analysis” section should be included in this report;approving, or recommending to our board of directors for approval, the compensation programs, and the payouts for all programs, applying to our non-executive directors, including reviewing the competitiveness of our non-executive director compensation programs and reviewing the terms to make sure they are consistent with our board of directors compensation policy adopted by the general meeting of our shareholders; andreviewing and discussing with our Chief Executive Officer and reporting periodically to our board of directors plans for development and corporate succession plans for our executive officers and other key employees.Our compensation committee reviews and evaluates, at least annually, the performance of the
compensationcommittee and its members, including compliance of thecompensationcommittee with its charter.Our compensation committee
has sole discretion concerningconsists of Mr. Carney (Chair), Mr. Wallman and Ms. Weatherman. We believe that theadministrationcomposition of ouroption plans, includingcompensation committee complies with theselectionapplicable rules ofindividuals to receive awardsthe SEC and thetime at which awards will be granted.NASDAQ Stock Market. The board of directors has determined that each of Messrs. Carney and Wallman and Ms. Weatherman meets the more stringent independence requirements for compensation committee members of Rule 10C-1 under the Exchange Act and the Listing Rules of the NASDAQ Stock Market. None of our executive officers
havehas served as a member of the board of directors or compensation committee of any entity that has an executive officer serving as a member of our board of directors.Our compensation committee and board of directors has reviewed and discussed the Compensation Discussion and Analysis with the Company's management. Based on this review and these discussions, the board of directors recommended that the Compensation Discussion and Analysis be included in the Company's annual report on Form 10-K.Sean D. CarneyElizabeth H. WeathermanOur compensation committee consists of Mr. Carney (Chair) and Ms. Weatherman. Our board of directors has adopted a written charter for the compensation committee that is available on our website.Nominating,
andCorporate GovernanceCommittee.and Compliance CommitteeThe primary responsibilities of our nominating,
andcorporate governance and compliance committeeoverseesinclude:reviewing andassistsmaking recommendations to our board of directorsinregarding the size and composition of our board of directors;identifying, reviewing and recommending nominees for election as directors;evaluatemaking recommendations to our board of directorsand our management; develops, reviews and recommendsregarding corporate governanceguidelinesmatters anda corporatepractices, including any revisions to our internal rules for our board of directors; andoverseeing our compliance efforts with respect to our legal, regulatory and quality systems requirements and ethical programs, including our code of business conduct andethics;ethics, other than with respect to matters relating to our financial statements andgenerally advises our boardfinancial reporting obligations and any accounting, internal accounting controls or auditing matters, which are within the purview ofdirectors onthe audit committee.Our nominating, corporate governance and
related matters.compliance committee reviews and evaluates, at least annually, the performance of the committee and its members, including compliance of the committee with its charter.Our nominating,
andcorporate governance and compliance committee consists of Mr. Carney (Chair) and Mr.Wallman.O’Boyle.Our
board of directors has adopted a written charter for thenominating,andcorporate governancecommittee, a copy of which is available on our website.The nominatingandcorporate governancecompliance committee considers all candidates recommended by our shareholders pursuant to those specific minimum qualifications that the nominating,andcorporate governance and compliance committee believes must be met by a recommended nominee for a position on our board of directors, which qualifications are described in theCompany'snominating, corporate governance and compliance committee’s charter, a copy of which is available on the Investor Relations—Corporate Governance section of our corporate websitewww.tornier.com. We have made no material changes to the procedures by which shareholders may recommend nominees to our board of directors as described inthe above referenced written charterour most recent proxy statement.Strategic Transactions Committee
The primary responsibilities of
the nominating corporate governance committee.our strategic transactions committee include:Ourreviewing and evaluating potential opportunities for strategic business combinations, acquisitions, mergers, dispositions, divestitures, investments and similar strategic transactions involving Tornier or any one or more of our subsidiaries outside the ordinary course of our business that may arise from time to time;approving on behalf of our board of directors any strategic transaction that may arise from time to timeestablishand is deemed appropriate by the strategic transactions committee and involves total cash consideration of less than $5.0 million; provided, however, that the strategic transactions committee is not authorized to approve any strategic transaction involving the issuance of capital stock or in which any director, officer or affiliate of Tornier has a material interest;making recommendations to our board of directors concerning approval of any strategic transactions that may arise from time to time and are deemed appropriate by the strategic transactions committee and are beyond the authority of the strategic transactions committee to approve;reviewing integration efforts with respect to completed strategic transactions from time to time and making recommendations to management and our board of directors, as appropriate;assisting management in developing, implementing and adhering to a strategic plan and direction for our activities with respect to strategic transactions and making recommendations to management and our board of directors, as appropriate; andreviewing and evaluating potential opportunities for restructuring our business in response to completed strategic transactions or otherwise in an effort to realize anticipated cost and expense savings for, and othercommittees.benefits, to our company and making recommendations to management and our board of directors, as appropriate.Our strategic transactions committee reviews and evaluates periodically the performance of the committee and its members, including compliance of the committee with its charter.
Our strategic transactions committee consists of Mr. O’Boyle (Chair), Mr. Carney and Mr. Emmitt.
Code of Business Conduct and Ethics
We have adopted a
Codecode ofBusiness Conductbusiness conduct andEthics,ethics, which applies to all of our directors, officers and employees. OurCodecode ofBusiness Conductbusiness conduct andEthicsethics is available on the Investor Relations—Corporate Governance section of our corporate websitefree of chargeatwww.tornier.comunder Corporate Governance.. Any person may request a copy free of charge by writing to us at Tornier, Inc.,7701 France Avenue10801 Nesbitt Ave South,Suite 600, Edina,Bloomington, Minnesota55435.55437. We intend to disclose on our website any amendment to, or waiver from, a provision of ourCodecode ofBusiness Conductbusiness conduct andEthicsethics that applies to directors and executive officers and that is required to be disclosed pursuant to the rules of theSEC.SEC and the NASDAQ Stock Market.Section 16(a) Beneficial Ownership Reporting Compliance
We did not become subject toSection 16(a) of the Exchange Actduring the fiscal year ending January 2, 2011,requires our directors andtherefore noexecutive officersdirectors or shareholdersand all persons whohold greaterbeneficially own more than 10% of our outstanding ordinary shareswere requiredto fileSection 16(a)with the SEC initial reports of ownership and reports of changes in ownership of our ordinarysharesshares. Directors, executive officers andothergreater than 10% beneficial owners also are required to furnish us with copies of all Section 16(a) forms they file. To our knowledge, based on review of the copies of such reports and amendments to such reports furnished to us with respect to the year ended December 29, 2013, and based on written representations by our directors and executive officers, all required Section 16 reports under the Exchange Act for our directors, executive officers and beneficial owners of greater than 10% of ourequity securities in relation toordinary shares were filed on a timely basis during theCompany.year ended December 29, 2013.ItemITEM 11.Executive Compensation.
EXECUTIVE COMPENSATIONOur "named executive officers" for 2010 consistedCompensation Discussion and AnalysisIn this Compensation Discussion and Analysis, or CD&A, we describe the key principles and approaches we use to determine elements of compensation paid to, awarded to and earned by the following
individuals:named executive officers, whose compensation is set forth in the Summary Compensation Table found later in this report:•Douglas W. Kohrs,David H. Mowry, whocurrentlyserves as our President, Chief Executive Officer andDirector;•Michael J. Doty, who servedExecutive Director and is referred to as ourGlobal“CEO” in this CD&A;Shawn T McCormick, who serves as our Chief Financial Officer;Gordon W. Van Ummersen, who serves as our Senior Vice President, Global Product Delivery;��� Stéphan Epinette, who serves as our Senior Vice President, International Commercial Operations; and Terry M. Rich, who serves as our Senior Vice President, U.S. Commercial Operations.This CD&A should be read in conjunction with the accompanying compensation tables, corresponding notes and narrative discussion, as they provide additional information and context to our compensation disclosures.
Executive Summary
One of our key executive compensation objectives is to link pay to performance by aligning the financial interests of our executives with those of our shareholders and by emphasizing pay for performance in our compensation programs. We believe we accomplish this objective primarily through the operation of our annual cash incentive plan, which compensates our executive officers for achieving annual corporate financial performance goals and, in the case of some of our executive officers, divisional financial performance goals and individual performance goals.
During 2013, we made significant progress toward our three main strategic initiatives:
The transition of our U.S. sales organization. We spent most of 2013 transitioning our U.S. sales organization from a network of independent sales agencies that sold our full product portfolio to a combination of direct sales teams and independent sales agencies that are individually focused on selling either upper extremity products or lower extremity products across the territories that they serve. Over 85% of our U.S. revenues is now under a new agreement or transitioned to a direct sales model. During 2014, we will turn our focus to completing the split of our sales force into either dedicated upper or lower extremities representatives and on building new sales teams and completing the training and optimization of our sales representatives. We believe the transition will position us to leverage our sales force and broad product portfolio toward our goal of achieving above market extremities revenue growth and margin expansion over the long term.The integration of OrthoHelix. The 2013 transition of our U.S. sales organization was closely connected to the integration of many of the historical OrthoHelix distributors into our overall U.S. lower extremities sales organization. During 2013, we received CE Mark approval to sell the majority of our OrthoHelix products internationally and have since begun to selectively launch these products in certain markets, including France, Germany and the United Kingdom. In addition, we completed the integration of the OrthoHelix sales, marketing, and research and development activities into our global teams.The launch of our Aequalis Ascend Flex. We completed the limited user release and commercial launch of the Aequalis Ascend Flex convertible shoulder system during 2013. We believe that the Aequalis Ascend Flex has further strengthened our market-leading shoulder product portfolio by providing surgeons with a convertible pressed-fit reversed solution, while also expanding our addressable market for shoulder products. We completed the training and education of over 150 surgeons on the Aequalis Ascend Flex during 2013 and plan to increase the number of instrument sets available to the field during 2014, both in the United States and internationally, and continue to train surgeons to further increase market acceptance.Although we believe we made great strides in our business and strategic initiatives during 2013, our financial performance, as measured by certain key performance indicators, including in particular revenue and EBITDA, was below our internal expectations set at the beginning of 2013. Although we experienced increased revenues in 2013 compared to 2012, this increase was primarily a result of our acquisition of OrthoHelix, and to a lesser extent, an increase in upper extremity joints and trauma revenue primarily as a result of the continued increase in sales of our Aequalis Ascend shoulder system, including the Aequalis Ascend Flex that was launched in the third quarter of 2013. Our 2013 revenue, however, was negatively impacted by disruption in our U.S. sales channel due to our strategic initiative to establish separate sales channels that are individually focused on selling either upper extremity products or lower extremity products. During 2013, we incurred a net loss of $36.4 million compared to a net loss of $21.7 million for 2012.
Our financial performance during 2013 had the following impact on our pay programs:
Payouts for corporate and divisional financial performance goals under our cash incentive plan were substantially below target levels.Because our threshold EBITDA performance goal was not met, there were no payouts for achievement of individual performance goals by our executive officers.Overall 2013 plan payouts for our named executive officers were low, ranging between 6% and 30% of target.• Since most of our executives’ pay is variable compensation tied to financial results or share price, and not fixed compensation, these low cash incentive plan payouts resulted in actual total compensation for our executives substantially below our targeted range of 50th to 75th percentile of a group of similarly sized peer companies for 2013. Key 2013 Compensation-Related Actions
During 2013, we took a number of actions that supported our executive compensation philosophy of ensuring that our executive pay program reinforces our corporate mission, vision and values, is reflective of our performance, is market competitive to attract and retain key employees and is aligned with the interests of our shareholders, including the following:
Compensation review. Our compensation committee reviewed our formal compensation objectives and principles to guide executive pay decisions, which are described in more detail below.Independent consultant. Our compensation committee engaged an independent compensation consultant, Mercer (US) Inc., to provide executive pay advice to our compensation committee. During 2013, at the request of the compensation committee, Mercer recommended a peer group of companies, collected relevant market data from these companies to allow the compensation committee to compare elements of our pay program to those of our peers, provided information on executive pay trends and implications for our company and made other recommendations to our compensation committee regarding our executive compensation program.LTI grant guidelines. Our board of directors, upon recommendation of our compensation committee, adopted long-term incentive grant guidelines for the grant of equity awards to our employees under the Tornier N.V. 2010 Incentive Plan.Executive officer changes. In February 2013, we appointed David H. Mowry as President and Chief Executive Officeruntil February 19, 2010;•Carmen L. Diersen,on a non-interim basis and in June 2013, Mr. Mowry was elected as our executive director by our shareholders. In June 2013, we hired Gordon W. Van Ummersen as an executive officer and who currently serves as ourGlobal Chief Financial Officer;•Andrew E. Joiner, who currently serves as ourSenior Vice President, Global Product Delivery. During 2013, we realigned andGeneral Manager, U.S. Commercial Operations;•Kevin M. Klemz,streamlined our executive management structure by reducing the number of direct reports to our CEO.Hedging and pledging. During 2013, we amended our code of conduct on insider trading and confidentiality to prohibit our executive officers from engaging in hedging transactions, such as short sales, transactions in publicly traded options, such as puts, calls and other derivatives, and pledging our shares in any significant respect.Say-on-pay. We honored the desire of a significant portion of our shareholders, whocurrently servesat our 2011 annual general meeting of shareholders supported a “say-on-pay” vote every three years, and accordingly, did not submit a “say-on-pay” proposal to our shareholders during 2013. At our 2011 annual general meeting of shareholders, over 99% of the votes cast by our shareholders were in favor of our “say-on-pay” proposal. Accordingly, our compensation committee generally believes that such results affirmed shareholder support of our approach to executive compensation and did not believe it was necessary to make; and therefore, we have not made, any significant changes to our executive pay program solely in response to that vote. We intend to submit a “say-on-pay” proposal to our shareholders again at our 2014 annual general meeting of shareholders.Compensation Best Practices
We maintain certain best pay practices, which support our executive compensation objectives and principles, and benefit our shareholders. These practices include the following:
Pay for performance. We tie compensation directly to financial performance. Our annual cash incentive plan pays out only if certain minimum threshold levels of financial performance are met. For our annual cash incentive awards, we establish threshold levels of performance for each performance measure that must be met for there to be a payout for that performance measure. Additionally, the threshold level of adjusted EBITDA performance must be met for there to be any payout for individual performance under our annual cash incentive plan.Bonus caps. Our annual cash incentive awards have maximum levels of financial performance. At maximum or greater than maximum levels of performance, our annual cash incentive plan payouts are capped at 150% of target.Performance measure mix. We utilize a mix of performance measures within our annual cash incentive plan.At-risk pay. A significant portion of our executives’ compensation is “performance-based” or “at risk.” For 2013, 79% of target total direct compensation was performance-based for our CEO, and between 64% and 84% of target total direct compensation for our other named executive officers was performance-based, assuming grant date fair values for equity awards.Equity-based pay. A significant portion of our executives’ compensation is “equity-based” and in the form of stock-based incentive awards. For 2013, 63% of target total direct compensation for our CEO and between 44% and 76% of target total direct compensation for our other named executive officers was equity-based, assuming grant date fair values for equity awards.Four-year vesting. Value received under our long-term equity-based incentive awards is tied to four-year vesting and any value received by executives from stock option grants is contingent upon long-term stock price performance in that stock options have value only if the market value of our ordinary shares exceeds the exercise price of the options.No repricing. Under the terms of our stock incentive plan, the repricing or exchange of any equity awards is prohibited without shareholder approval.Clawback policy. Our stock incentive plan and related award agreements include a “clawback” mechanism if it is determined that our executives engaged in certain conduct adverse to our company’s interests.No tax gross-ups. We do not provide tax “gross up” payments in connection with any compensation, benefits or perquisites provided to our executives.Limited perquisites. We provide only limited modest perquisites to our executives.Stock ownership guidelines. We maintain stock ownership guidelines for all of our executive officers.No hedging or pledging. We prohibit our executive officers from engaging in hedging transactions, such as short sales, transactions in publicly traded options, such as puts, calls and other derivatives, and pledging our shares in any significant respect.Compensation Objectives and Principles
Our executive compensation policies, plans and programs seek to enhance our profitability, and thus shareholder value, by aligning the financial interests of our executives with those of our shareholders and by emphasizing pay for performance. Specifically, our executive compensation programs are designed to:
Attract and retain executives important to the success of our company and the creation of value for our shareholders.Reinforce our corporate mission, vision and values.Align the interests of our executives with the interests of our shareholders.Reward our executives for progress toward our corporate mission and vision, the achievement of company performance objectives, the creation of shareholder value in the short and long term and their general contributions to the success of our company.To achieve these objectives, our compensation committee makes compensation decisions based on the following principles:
• Base salary and total compensation levels will generally be targeted within the range of the 50th to 75th percentile of a group of similarly sized peer companies. However, the competitiveness of any individual executive’s salary will be determined considering factors like the executive’s skills and capabilities, contributions as a member of the executive management team and contributions to our overall performance. Pay levels will also reflect the sufficiency of total compensation potential and structure to ensure the retention of an executive when considering the executive’s compensation potential that may be available elsewhere. At least two-thirds of the CEO’s compensation and half of other executives’ compensation opportunity should be in the form of variable compensation that is tied to financial results or share price.The portion of total compensation that is performance-based or at-risk should increase with an executive’s overall responsibilities, job level and compensation. However, compensation programs should not encourage excessive risk-taking by executives.A primary emphasis should be placed on company performance as measured against goals approved by our compensation committee rather than on individual performance.At least half of the CEO’s compensation and one-third of other executives’ compensation opportunity should be in the form of stock-based incentive awards.Determination of Compensation
Role of Compensation Committee and Board. The responsibilities of our compensation committee include reviewing and approving corporate goals and objectives relevant to the compensation of our executive officers, evaluating each executive’s performance in light of those goals and objectives and, either as a committee or together with the other directors, determining and approving each executive’s compensation, including performance-based compensation based on these evaluations (and, in the case of the executives, other than the CEO, the CEO’s evaluation of such executive’s individual performance). Consistent with our shareholder-approved compensation policy for our board of directors, the compensation package for our CEO is determined by the non-executive directors, based upon recommendations from the compensation committee.
In setting or recommending executive compensation for our named executive officers, the compensation committee considers the following primary factors:
each executive’s position within the company and the level of responsibility;the ability of the executive to impact key business initiatives;the executive’s individual experience and qualifications;compensation paid to executives of comparable positions by companies similar to our company;company performance, as compared to specific pre-established objectives;individual performance, generally and as compared to specific pre-established objectives;the executive’s current and historical compensation levels;advancement potential and succession planning considerations;an assessment of the risk that the executive would leave our company and the harm to our company’s business initiatives if the executive left;the retention value of executive equity holdings, including outstanding stock options and stock awards;the dilutive effect on the value of our shareholders’ interests of long-term equity-based incentive awards; andanticipated share-based compensation expense as determined under applicable accounting rules.The compensation committee also considers the recommendations of our CEO with respect to executive compensation to be paid to other executives. The significance of any individual factor described above in setting executive compensation will vary from year to year and may vary among our executives. In making its final decision regarding the form and amount of compensation to be paid to our named executive officers (other than our CEO), our compensation committee considers and gives great weight to the recommendations of our CEO recognizing that due to his reporting and otherwise close relationship with each executive, the CEO often is in a better position than the compensation committee to evaluate the performance of each executive (other than himself). In making its final decision regarding the form and amount of compensation to be paid to our CEO, the compensation committee considers the results of the CEO’s self-review and his individual annual performance review by the compensation committee, benchmarking data gathered by Mercer and the recommendations of our non-executive directors.
Role of Management. Three members of our executive team play a role in our executive compensation process and regularly attend meetings of our compensation committee – our CEO, Senior Vice President, Global Human Resources and HPMS and Senior Vice President, Chief Legal Officer and
Secretary;Secretary. Our CEO assists our compensation committee primarily by making formal recommendations regarding the amount and•Stéphan Epinette, who currently serves astype of compensation to be paid to our executives (other than himself). In making such recommendations, our CEO considers many of the same factors listed above that the compensation committee considers in setting executive compensation, including in particular the results of each executive’s annual performance review and the executive’s achievement of his or her individual management performance objectives established in connection with our annual cash incentive plan described below. Our Senior Vice President,International Commercial Operations.
Compensation OverviewGlobal Human Resources andObjectivesBecause we were a private company prior to February 2011, compensation decisions with respect to our named executive officers have generally been based on the goal of achieving performance at levels necessary to provide meaningful returns to our shareholders upon an ultimate liquidity event. To that end, in addition to the typical need to attract, motivate and retain talented executives,HPMS assists our compensationprograms in 2010 were specifically designed to incentivizecommittee primarily by gathering compensation related data regarding ournamedexecutives and coordinating the exchange of such information and other executiveofficers to achieve short- and long-term performance goals that would enable us to substantially increase our equity value and make us an attractive candidate for either a public offeringcompensation information among the members of ourordinary shares orcompensation committee, our compensation committee’s compensation consultant and management in anticipation of compensation committee meetings. Our Senior Vice President, Chief Legal Officer and Secretary assists our compensation committee primarily by ensuring compliance with legal and regulatory requirements and educating the committee on executive compensation trends and best practices from asale,corporate governance perspective. Final deliberations andto provide our named executive officers with meaningfuldecisions regarding the compensationupon the occurrence of such an event. Our compensation programs in 2010 were weighted toward performance-based compensation, including equity-based compensation, such that our named executive officers will see returns primarily based upon the returns achieved by our shareholders. In 2010, we modified our annual bonus program for our named executive officersto beweighted 80% on the achievementpaid to each ofcorporate performance goals and 20% on the achievement of individual goals.Determination of CompensationFor services performed for us andoursubsidiaries during 2010,executives, however, are made by ournamed executive officers were generally compensated by the operating subsidiary to which such named executive officer primarily provided services. Ourboard of directorswas ultimately responsibleor compensation committee without the presence of such executive.Role of Consultant. Our compensation committee has retained the services of Mercer to provide executive compensation advice. Mercer’s engagement by the compensation committee includes reviewing and advising on all significant aspects of executive compensation. This includes base salaries, short-term cash incentives and long-term equity incentives for
determiningourcompensationexecutive officers, andbenefit plans generally, and established and reviewed all compensatory plans and arrangements with respect to our named executive officers. The board of directors meets not less than annually to specifically review and determine adjustments, if any, to all elements of compensation, including base salary, annual bonuscash compensation and long-term equityawards, includingincentives for our non-executive directors. At the request of the compensation committee, each year, Mercer recommends a peer group of companies, collects relevant market data from these companies toevaluateallow theachievementcompensation committee to compare elements ofperformance goalsour compensation program to those of our peers, provides information on executive compensation trends and implications forthe prior fiscal yearour company andto set new performance goals for the current fiscal year. The board of directors also met periodically to discuss compensation-related matters as they arose during the year. In addition, with respectmakes other recommendations to the compensation committee regarding certain aspects of our executive compensation program. Our management, principally our Senior Vice President, Global Human Resources and HPMS and the chair of our compensation committee, regularly consult with representatives of Mercer before compensation committee meetings. A representative of Mercer is invited on a regular basis to attend, and sometimes attends, meetings of our compensation committee. In making its final decision regarding the form and amount of compensation to be paid to our executives, our compensation committee considers the information gathered by and recommendations of Mercer. The compensation committee values especially Mercer’s benchmarking information and input regarding best practices and trends in executive compensation matters.Use of Peer Group and Other Market Data. To help determine appropriate levels of compensation for certain elements of our executive compensation program, our compensation committee reviews annually the compensation levels of our named executive officers and other
thanexecutives against the compensation levels of comparable positions with companiessimilar to our
Chief Executive Officer, the boardcompany in terms ofdirectors sought the inputproducts, operations andrecommendationrevenues. The elements of ourChief Executive Officer.executive compensation program to which the compensation committee “benchmarks” or uses to base or justify a compensation decision or to structure a framework for compensating executives include base salary, short-term cash incentive opportunity and long-term equity incentives. With respect to other elements of our executive compensation program, such as perquisites, severance and change in control arrangements, our compensation committee benchmarks these elements on a periodic or as needed basis and in some cases uses peer group or market data more as a “market check” after determining the compensation on some other basis.The compensation committee believes that compensation paid by peer group companies is more representative of the compensation required to attract, retain and motivate our executive talent than broader survey data. The compensation committee believes that the compensation paid by the peer companies which are in the same business, with similar products and operations, and with revenues in a range similar to ours generally provides more relevant comparisons.
In February 2012, Mercer worked with our compensation committee to identify a peer group and recommended and the committee approved a peer group of 15 companies. Companies in the peer group are public companies in the health care equipment and supplies business with products and operations similar to those of our company, and which had annual revenues generally within the range of one-half to two times our annual revenues. The February 2012 peer group included the following companies:
American Medical Systems Holdings, Inc. Thoratec Corporation Exactech, Inc. Wright Medical Group, Inc. Arthrocare Corporation Cyberonics, Inc. Volcano Corporation Merit Medical Systems, Inc. Alphatec Holdings, Inc. Nuvasive, Inc. ICU Medical, Inc. Conceptus, Inc. Zoll Medical Corporation NxStage Medical, Inc. RTI Biologics, Inc. The table below sets forth revenue and market capitalization information regarding the February 2012 peer group and Tornier’s position within the peer group as of September 2012, which was the date that Mercer used to compile an executive compensation analysis which our compensation committee used in connection with its recommendations and decisions regarding certain aspects of executive compensation for 2013:
Annual revenue
(in millions)Market capitalization
(in millions)25th percentile
$ 217 $ 629 Median
333 863 75th percentile
437 996 Tornier
267 752 Percentile rank
31 % 43 % Our
Chief Executive Officer reviewed each other named executive officer's overall performancecompensation committee used the February 2012 peer group to assist the compensation committee in making recommendations andcontributiondecisions regarding base salaries, annual incentive plan target opportunities and long- term equity incentives for 2013.In February 2013, Mercer worked with our compensation committee to identify a revised peer group since some of the companies in the February 2012 peer group were no longer public reporting companies due to acquisitions or otherwise. Mercer recommended and the compensation committee approved a revised peer group of 16 companies. Similar to the
Company atFebruary 2012 peer group, companies in theend of each fiscal yearFebruary 2013 peer group are public companies in the health care equipment andmade recommendations regarding each element of their compensationsupplies business with products and operations similar toMr. Carney, onethose of ourdirectors, who then consulted informallycompany, and which had annual revenues generally within the range of one-half to two times our annual revenues. The February 2013 peer group included the following companies:Angiodynamics Inc.* Thoratec Corporation Exactech, Inc. Wright Medical Group, Inc. Arthrocare Corporation Cyberonics, Inc. Volcano Corporation Merit Medical Systems, Inc. Alphatec Holdings, Inc. Nuvasive, Inc. ICU Medical, Inc. Conceptus, Inc. Orthofix International N.V.*
Masimo Corporation*
NxStage Medical, Inc. RTI Biologics, Inc. * New additions since the February 2012 peer group. The table below sets forth revenue and market capitalization information regarding the February 2013 peer group and Tornier’s position within the peer group as of October 2013, which was the date that Mercer used to compile an executive compensation analysis that our compensation committee used in connection with
our Chief Executive Officer regarding hisits recommendations and decisions regarding executive compensation for 2014:Annual revenue
(in millions)Market capitalization
(in millions)25th percentile
$ 248 $ 434 Median
346 995 75th percentile
421 1,267 Tornier
298 924 Percentile rank
38 % 47 % Our compensation committee used the February 2013 peer group to assist the compensation committee in
turn presented hismaking recommendations and decisions regarding base salaries and annual incentive plan target opportunities for 2014 and will use this same peer group later in 2014 to assist the compensation committee in determining long-term equity incentives for 2014.In reviewing benchmarking data, our compensation committee recognizes that benchmarking may not always be appropriate as a stand-alone tool for setting compensation due to aspects of our business and objectives that may be unique to our
full boardcompany. Nevertheless, our compensation committee believes that gathering this information is an important part ofdirectorsits compensation-related decision-making process. However, where a sufficient basis forfinal determinations. Our Chief Executive Officer'scomparison does not exist between the peer group or survey data and an executive, the compensationwas determined based on recommendations made by Mr. Carneycommittee gives less weight to thefull board of directors. Our Chief Executive Officer didpeer group and survey data. For example, relative compensation benchmarking analysis does notparticipateconsider individual specific performance or experience or other case-by-case factors that may be relevant inany formal discussionhiring or retaining a particular executive.with the board of directors regarding hisMarket Positioning. In general, we target base salary and total compensationdecisions and he recused himself from meetings when his compensation was discussed.The board of directors did not generally rely on formulaic guidelines for determining the mix orlevelsof cash and equity-based compensation, but rather maintained a flexible compensation program that allowed it to adapt components and levels of compensation to motivate and reward individual executiveswithin thecontextrange of the 50th to 75th percentile of ourdesire to attain certain strategic and financial goals. Subjectivepeer group. However, the specific competitiveness of any individual executive’s pay will be determined considering factorsconsidered in compensation determinations include an executive'slike the executive’s skills and capabilities, contributions as a member of the executive management team and contributions to our overallperformance andperformance. The compensation committee will also consider the sufficiency of total compensation potential and the structure of pay plans to ensure the hiring or retention of an executive when considering the compensation potential that may be available elsewhere.Executive Compensation Components
The principal elements of our executive compensation program for 2013 were:
base salary;short-term cash incentive compensation;long-term equity-based incentive compensation, in the form of stock options and stock awards; andother compensation arrangements, such as benefits made generally available to our other employees, limited and modest executive benefits and perquisites, and severance and change in control arrangements.In
making its determination,determining theboard of directors did not undertake any formal benchmarking or reviewed any surveys commissioned by usform of compensation for ourcompetitors,named executive officers, our compensation committee views these elements of our executive pay program as related butinstead relied primarilydistinct. Our compensation committee does not believe that significant compensation derived by an executive from one element of our compensation program should necessarily result in a reduction in the amount of compensation the executive receives from other elements. At the same time, our compensation committee does not believe that minimal compensation derived from one element of compensation should necessarily result in an increase in the amount the executive should receive from one or more other elements of compensation.Except as otherwise described in this CD&A, our compensation committee has not adopted any formal or informal policies or guidelines for allocating compensation between long-term and currently paid out compensation, between cash and non-cash compensation, or among different forms of non-cash compensation. However, our compensation committee’s philosophy is to make a greater percentage of an executive’s compensation performance-based, and therefore at risk, as the executive’s position changes and responsibility increases given the influence more senior level executives generally have on
its members' general knowledgecompany performance. Thus, individuals with greater roles and responsibilities associated with achieving our company’s objectives should bear a greater proportion of thecompetitive market.risk that those goals are not achieved and should receive a greater proportion of the reward if objectives are met or surpassed. For example, this philosophy is illustrated by the higher annual cash incentive targets and long-term equity incentives of our CEO compared to our other executives. In addition, our objective is that at least two-thirds of the CEO’s compensation and half of other executives’ compensation opportunity be in the form of variable compensation that is tied to financial results or share price and that at least half of the CEO’s compensation and one-third of other executives’ compensation opportunity be in the form of stock-based incentive awards.ComponentsThe overall mix of
our CEO and other named executive officers as a group for 2013 is provided below. The value of the long-term incentives represented is based on the grant date fair value of stock options and stock awards granted during 2013. Actual long-term incentive value will be based on long-term stock price performance. Other compensation, including discretionary and contingent sign-on bonuses and perquisites, are excluded from the table below.Compensationannual base salaries, target annual cash incentive awards and grant date fair value long-term incentive awards as a percent of target total direct compensation for2010For 2010, the compensation provided to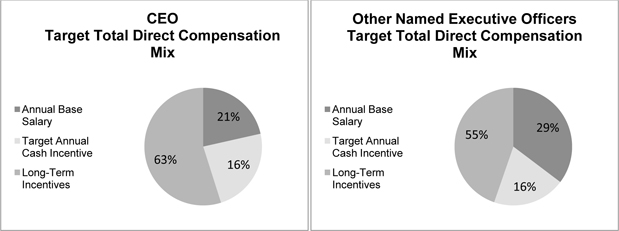
Base Salary
Overview. We provide a base salary for our named executive officers,
consistedwhich, unlike some of the other elements of our executive compensation program, is not subject to company or individual performance risk. We recognize the need for most executives to receive at least a portion of their total compensation in the form of a guaranteed base salaryannual bonus, long-term equity-based compensation, retirement benefits and other perquisites and benefits, each of whichthat isdescribedpaid inmore detail below. We believe thatcash regularly throughout themix of cash- and equity-based compensation, as well as the relationship of fixed to performance-based compensation, is properly balanced and provides us with an effective means to attract, motivate and retain our named executives, as well as reward them for creation of shareholder value.Base SalaryThe base salary payable to each named executive officer is intended to provide a fixed component of compensation reflecting the executive's skill set, experience, role and responsibilities.year. Base salary amounts are established under eachnamed executive officer'sexecutive’s employment agreement,butand are subject to subsequent upwardadjustmentadjustments bythe board of directors based on its consideration of, among other factors, the scope of the executive's responsibilities, individual performance for the prior year, the mix of fixedour compensationto overall compensation and consistency with what the board of directors and our Chief Executive Officer consider to be the market standard for compensation paid to similarly-situated executives at other companies. Initially, base salary was determined at the time of a named executive officer's hire, based on the above elements at such time, and such initial amount forms the basis for base salary throughout a named executive officer's tenure with the Company, with adjustments being made by the board of directors as and when appropriate, based on changescommittee, or in theabove elements over time and consistent with our compensation objectives. Base salary amounts for Ms. Diersen and Mr. Klemz were determined at their timecase ofhire byany executive who is also a director, our board of directors, upon recommendation of our compensation committee.Setting Initial Salaries for New Executives. We initially fix base salaries for our executives at a level we believe enables us to hire and retain them in a competitive environment and to reward satisfactory individual performance and a satisfactory level of contribution to our overall business objectives. During 2013, one of our named executive officers, Mr. Van Ummersen, was hired. In establishing Mr. Van Ummersen’s initial base salary at $350,000, our compensation committee considered the executive’s prior experience, his success in serving in those positions, his most recent base salary and other compensation at his prior employer, as well as the base salaries of our other executives and our
Chief Executive Officer, based on their consideration of factors such as the scope of Ms. Diersen's and Mr. Klemz's roles and responsibilities, our overallcompensationprogram, and market standards for compensation paid to similarly-situated executives at other companies based on theircommittee’s general knowledge of the competitive market. Market pay levels are based in part on the most recent Mercer executive compensation analysis performed for our compensation committee. Although Mr. Van Ummersen’s base salary is slightly below the 75th percentile of our peer group for similarly titled executives, the compensation committee believed it was necessary to set his base salary at such a level to attract him to our company. In2010,addition, the compensation committee believed Mr. Van Ummersen’s base salary should be around the same level as Mr. Rich’s.Annual Salary Increases. We typically increase the base salaries of our
boardnamed executive officers in the beginning ofdirectors established a Company-wide guideline that provided for an average salary increase for all employees, other than employeeseach year following the completion of our prior year individual performance reviews to recognize annual increases inperformance review, of an approximatethe cost of livingadjustmentand superior individual performance and to ensure that our base salaries remain market competitive. Annual base salary increases as a result of3%cost of2009living adjustments and individual performance are referred to as “merit increases.” In addition, we may make additional upward adjustments to an executive’s base salarywithto compensate theactual amountexecutive for assuming increased roles and responsibilities, to retain an executive at risk ofany employee's raise determinedrecruitment by other companies, and/or to bring an executive’s base salary closer to the 50th to 75th percentile of companies in our peer group. We refer to these base salary increases as “market adjustments.”The table below sets forth base salaries effective as of February 1, 2013, the percentage increases compared to 2012 base salaries, and the 2013 base salaries compared to the 50th percentile of our February 2012 peer group for each of our named executive officers who were executives at the time of the merit increase:
Name
2013
base salary
($)2013
base salary %
increase
compared to
20122013 base
salary
compared topeer group
50th
percentileDavid H. Mowry(1)
$ 450,000 16.9 % 18% below Shawn T McCormick
354,812 1.4 % 11% above Stéphan Epinette(2)
312,371 6.2 % 10% below Terry M. Rich
359,624 2.8 % 10% above (1) Mr. Mowry’s base salary percentage increase is compared to his prior base salary of $385,000, which represented his base salary as a result of his promotion to Interim President and Chief Executive Officer in November 2012. (2) Mr. Epinette’s base salary is paid in Euros and was €234,286 for 2013. For purposes of the table and the peer group comparison, a rate of one Euro to $1.33329 was used to convert Mr. Epinette’s base salary into U.S. dollars. The merit increases for our named executive officers who were executives at the time of the increase in February 2013 ranged from 1.4% to 3.0% over 2012 base salaries. The percentage merit increase for a particular executive largely depends upon the results of the executive’s performance review for the previous year. Mr. McCormick and Mr. Rich received smaller merit increases than other executive officers since their merit increases were pro-rated based on
2009 performance.their respective hire dates.In
2010,addition to merit increases, Mr.Kohrs received a 3% raiseMowry and Mr. Epinette receiveda 4% raise pursuantmarket adjustments tothese guidelinestheir base salaries. In evaluating the performance of Mr. Mowry andbased ontheboard's subjective evaluationamount oftheir performance.his 2013 base salary increase, the compensation committee reviewed Mr.Joiner'sMowry’s self-review, discussed his performance, considered the benchmarking data gathered by Mercer and sought the input from the non-executive directors. In assessing the performance of Mr. Mowry, the compensation committee evaluated primarily his ability to achieve his goals and objectives and lead the company. Mr. Mowry’s percentage increase in base salary wasincreased by 8.3% in 2010toreward him for his service based on the board's subjective evaluation of his performance as to the performance factors described above and to keepbring his base salaryin line with whatcloser to theboard of directors and our Chief Executive Officer determined50th percentile. Even after such upward market adjustment, Mr. Mowry’s base salary was below the 25th percentile. The compensation committee believed the marketstandardpositioning of Mr. Mowry’s base salary was appropriate in light of his prior base salary and that 2013 would be his first full year serving as CEO. In addition, the compensation committee believes such market positioning is consistent with typical market practice with respect to executives new to a particular position. The compensation committee expects Mr. Mowry’s base salary to move closer to the 50th percentile as his tenure increases. The percentage increase in Mr. Epinette’s base salary was due to a merit increase of 3.0% and an upward market adjustment of €7,000 to bring his base salary closer to the 50th percentile. Even after such upward market adjustment, Mr. Epinette’s base salary was slightly below the 50th percentile.2014 Base Salaries. In February 2014, we set the following base salaries for 2014 for our named executive officers: Mr. Mowry ($550,000), Mr. McCormick ($365,456), Mr. Van Ummersen ($356,122), Mr. Epinette (€240,846) and Mr. Rich ($369,694), representing merit increases between 2.8% and 3.0% and an upward market adjustment for Mr. Mowry to bring his base salary closer to the 50th percentile. Even after such upward market adjustment, Mr. Mowry’s base salary is at the 25th percentile of our February 2013 peer group.
Short-Term Cash Incentive Compensation
Our short-term cash incentive compensation is paid
to similarly-situated executives at other companies based on their general knowledgeas an annual cash payout under our corporate performance incentive plan and, in the case ofthe competitive market.Table of ContentsMr. Epinette, also under our French incentive compensation scheme.Corporate Performance Incentive Plan. Annual
BonusesAnnual bonusescash payouts under our corporate performance incentive plan are intended to compensate executives, as well as other employees, for achieving annualCompany-widecorporate financial performance goals and, in some cases, divisional financial performance goals, and, in most cases, individual performance goals.Target
bonus amounts (60% of base salary for Mr. Kohrs, 50% of base salary for Mr. Joiner, 50% of base salary for Ms. Diersen, 40% of base salary for Mr. Klemz and 30% of base salary for Mr. Epinette)payouts were established under each named executiveofficer'sofficer’s employment agreement at the time such agreements were entered intowith actual bonusesand are currently as follows fora given fiscal year being based upon the achievement of the applicable performance objectives. Target bonus amounts for Ms. Diersen and Mr. Klemz were determined by our board of directors and our Chief Executive Officer based on their consideration of our overall compensation program and market standards for compensation paid to similarly-situated executives at other companies based on their general knowledge of the competitive market.each named executive officer:Name
Percentage of
base salaryDavid H. Mowry
80 % Shawn T McCormick
50 % Gordon W. Van Ummersen
50 % Stéphan Epinette
40 % Terry M. Rich
75 % The
20102013 target bonus percentages forthe otherour named executive officers did not change from their2009 levels.2012 levels, except in the case of Mr. Mowry as a result of his promotion in February 2013 to President and Chief Executive Officer on a non-interim basis. Based on an executive compensation analysis by Mercer in October 2013, the target bonus percentages for our named executive officers were either at or below the 50th percentile for executives with similar positions in our February 2013 peer group, except in the case of Mr. Mowry, whose target bonus percentage of 80% is slightly above the 25th percentile and below the 50th percentile, and Mr. Rich, whose target bonus percentage of 75% is above the 75th percentile. The compensation committee set Mr. Rich’s target bonus percentage at 75% to provide Mr. Rich a competitive compensation package to hire him from his then prior employer.For
2010, the payment of annual bonuses2013, payouts under our corporate performance incentive plan to our named executive officerswaswere based80%upon achievement of corporate performance goalsrelating to our revenue, Modified EBITDA, revenue over net inventories plus gross instruments, cash flows,for all executives, divisional performance goals for two executives andyear-end days sales outstanding, and 20% upon the named executive officer's achievement ofindividual performance goalsdescribedfor all executives, except our President and Chief Executive Officer whose payout was to be based solely upon achievement of corporate performance goals.Named executive officer
Percentage based upon
corporate performance goalsPercentage based upon
divisional performance goalsPercentage based upon
individual performance goalsDavid H. Mowry
100 % 0 % 0 % Shawn T McCormick
90 % 0 % 10 % Gordon W. Van Ummersen
90 % 0 % 10 % Stéphan Epinette
20 % 70 % 10 % Terry Rich
20 % 70 % 10 % For 2013, the corporate performance metrics and their weightings are set forth in the table below.
For 2010, Ms. Diersen and Mr. Klemz received pro-rated annual bonuses based on the number of daysThese three corporate performance goals were selected for 2013 because they wereemployed bydetermined to be theCompanythree most important key indicators of our financial performance for 2013. Revenue was weighted more heavily since that was intended to be our greatest focus in2010.2013.Corporate performance metric
Weighting Adjusted revenue
60 % Adjusted EBITDA
20 % Adjusted free cash flow
20 % The
followingtable below sets forth thefinancialcorporate performancecriteriagoals forthe 2010 bonus program which were established by the board of directors on March 3, 2010,2013, the range of possible payouts, and the actual payout percentage for our named executive officers based on the actual performance achieved.At their respective timesIn each case, the goals were adjusted for certain items, including changes to foreign currency exchange rates and items that are unusual and not reflective ofhire, our board of directors and our Chief Executive Officer determined thatnormal operations. If performance achieved falls below theportion of Ms. Diersen's and Mr. Klemz's 2010 pro-rated annual bonuses tied to corporatethreshold level, there is no payout for such performancegoals should be based upon achievement of the same financial performance criteria applicable to our other named executive officers' 2010 annual bonuses, in order to encourage consistent behavior among our named executive officers and to promote the achievement of overall corporate performance goals.metric. If performance achieved falls between the threshold, target and maximum levels, actual payout percentages are determined on a sliding scale basis, with payouts for each performance metric starting at 50% of target for
minimumthreshold performance achievement and capped at 150% of target for maximum achievement. For2010,2013, the totalweighted-average payout percentage applicable to the portion of the20102013 annual cash incentive bonus tied toobjectivecorporate performance goals was78.7%, as detailed30% of target since the only performance goal met was the adjusted free cash flow goal above the target level, resulting in a 30% of target payout since the weighting for the adjusted free cash flow metric was 20%.Performance goals(1) Performance metric
Threshold
(50% payout)Target
(100% payout)Maximum
(150% payout)2013
performance(2)2013
payoutAdjusted revenue(3)
$ 318.0 mil. $ 328.2 mil. $ 334.1 mil. $ 308.8 mil. 0 % Adjusted EBITDA(4)
$ 36.7 mil. $ 39.7 mil. $ 42.7 mil. $ 31.1 mil. 0 % Adjusted free cash flow(5)
$ (11.6) mil. $ (10.1) mil. $ (8.6) mil. $ (8.7) mil. 30 % (1) The performance goals were established based on an assumed foreign currency exchange rate. For revenue, we assumed a foreign currency exchange rate of 1.2847, which represented the actual reported average rate of foreign exchange in 2012. For all other performance goals, we assumed a foreign currency exchange rate of 1.29 U.S. dollars for 1 Euro, which represented an anticipated average rate of foreign exchange for 2013 and which was the foreign currency exchange rate used by our company for 2013 budgeting purposes. (2) The compensation committee determined 2013 payouts after reviewing our unaudited financial statements, which were adjusted for changes to foreign currency exchange rates and which were subject to additional discretionary adjustment by the compensation committee for items that are unusual and not reflective of normal operations. For purposes of determining 2013 payouts, in addition to foreign currency exchange rate adjustments, the compensation committee made additional adjustments discussed in the notes below. Accordingly, the figures included in the “2013 performance” column reflect foreign currency exchange rate and discretionary adjustments and differ from the figures reported in our 2013 audited financial statements. (3) “Adjusted revenue” means our revenue for 2013, as adjusted for changes to foreign currency exchange rates. (4) “Adjusted EBITDA” means our net loss for 2013, as adjusted for changes to foreign currency exchange rates, before interest income and expense, income tax expense and benefit, depreciation and amortization, as adjusted further to give effect to non-operating income and expense, foreign currency transaction gains and losses, loss on extinguishment of debt, share-based compensation, amortization of the inventory step-up from acquisitions and special charges including acquisition, integration and distribution channel transition costs, restructuring charges, reversal of acquisition contingent consideration liability, legal settlements and certain other items that affect the comparability and trend of Tornier’s operating results. (5) “Adjusted free cash flow” means cash flow generated from operations less instrument investments and plant, property and equipment investments, as adjusted for changes to foreign currency exchange rates. For 2013, payouts under our corporate performance incentive plan for two of our named executive officers, Mr. Rich and Mr. Epinette, were based upon achievement of divisional performance goals. Since Mr. Rich is in charge of our U.S. commercial operations, 70% of his 2013 payout was based upon adjusted U.S. revenue, and since Mr. Epinette is in charge of our international commercial operations, 70% of his 2013 payout was based upon adjusted non-U.S. revenue. The table
below. The compensation committee approvedbelow sets forth the divisional performance goals for 2013, the range of possible payoutsat thisand the actual payout percentageforapplicable to the portion of thenamed executive officers' bonuses2013 annual cash incentive bonus tied to divisional performance goals based on actual performance achieved.Performance goals Performance metric
Threshold
(50% payout)Target
(100% payout)Maximum
(150% payout)2013
performance2013
payoutU.S. adjusted revenue
$ 190.9 mil. $ 197.1 mil. $ 200.6 mil. $ 182.1 mil. 0 % Non-U.S. adjusted revenue
$ 127.1 mil. $ 131.1 mil. $ 133.5 mil. $ 126.7 mil. 0 % As with the corporate performance
goals.Weight
(% of 2010
bonus tied to
performance
of this metric)Performance targets(1) Payout percentage 2010
Performance
($)Level of
2010
payoutModified metrics(2)Threshold Target Maximum Threshold Target Maximum Modified Revenue
32 % $215.1 million $239.0 million $282.0 million 50 % 100 % 150 % 234.9 million 91 % Modified EBITDA(3)
28 % $17.7 million $19.7 million $25.4 million 50 % 100 % 150 % 18.6 million 74 % Modified Revenue/(Net Inventories + Gross Instruments)(4)
8 % 1.38 1.53 1.80 50 % 100 % 150 % 1.55 101 % Modified Cash From Operations(5)
8 % $(18.9) million $(17.2) million $(11.8) million 50 % 100 % 150 % (21.2) million 77 % Modified Days Sales Outstanding (Year-End)(6)
4 % 78.0 70.9 60.3 50 % 100 % 150 % 67.1 105 % (1)The performance targets were established based on an assumed foreign currency exchange rate of 1.45 U.S. dollars for 1 Euro, which represented an anticipated average rate of foreign exchange for 2010 and which wasgoals, therate of foreign exchange used by the Company for 2010 budgeting purposes.(2)Thecompensation committee determined2010 bonus amounts2013 payouts after reviewing our U.S. and non-U.S. revenue in our unaudited financial statements forthe 2010 fiscal year,2013, and whicharerevenues were adjusted for changes totheforeign currency exchangerates and which are subject to discretionary adjustment by the board for items that
are unusual and not reflective of normal operations. For purposes of determining 2010 bonus amounts, in addition to foreign exchange adjustments, the board made additional adjustments discussed in the footnotes below.those operations during 2013. Accordingly, thefigures included in the "2010 Performance" column reflect foreign exchange rateactual U.S. anddiscretionary board adjustmentsnon-U.S. adjusted revenue used to determine Mr. Rich’s and Mr. Epinette’s 2013 payouts differ from the figures reported in our20102013 audited financial statements.(3)"Modified EBITDA" meansAlthough the payouts based on the divisional performance goals were zero for both Mr. Epinette and Mr. Rich, the board of directors, upon recommendation of ourearnings before interest, taxes, depreciationcompensation committee, approved a discretionary bonus of €31,944 to Mr. Epinette to reward him for the strong performance of our international business andamortization.(4)"Modified Revenue/(Net Inventories + Gross Instruments)" meanshis extraordinary individual performance and to retain and motivate him to achieve our corporate and international business’s performance objectives going forward.To foster cooperation and communication among our executives, our compensation committee places primary emphasis on overall corporate and divisional performance goals rather than on individual performance goals. For our named executive officers, at least 90% of their 2013 annual
revenue divided bycash incentive plan payouts were determined based on theannual averageachievement of corporate and divisional performance goals and only 10% or less were based on achievement of individual performance goals. In addition, under the terms of thesum of net inventories and gross instruments before accumulated depreciation. Gross instruments refersplan, no bonus payouts attributable to individual performance would occur if theacquisition cost ofthreshold adjusted EBITDA corporate performance goal was not achieved. Since thefixed assets.(5)"Modified Cash from Operations" means our cash generated by (used in) operations, reduced by capital expenditures and instrument expenditures,threshold adjustedas described in footnote (2) to be further reduced by deferred financial costs in the amount of $3.5 million.(6)"Modified Days Sales Outstanding (Year-End)" is a measure of the average number of days of revenue included in the net accounts receivable reported on the balance sheet at year end.
IndividualEBITDA corporate performancegoals for 2010 were communicated to eachgoal was not achieved, none of our named executive officersother than Mr. Klemzreceived any payout under the plan for individual performance.The individual performance goals that were to be used to determine the payout under our corporate performance incentive plan are management by objectives, known internally as MBOs. MBOs are generally three to five written, specific and
Ms. Diersen,measurable objectives agreed to and approved byour Chief Executive Officer (or,the executive, CEO and compensation committee inthe case of our Chief Executive Officer, our board of directors) atthe beginning of2010. Individual performance goals for 2010 for Mr. Klemz and Ms. Diersenthe year. All MBOs werecommunicated to them byweighted, with areas of critical importance or critical focus weighted most heavily. Each of ourChief Executive Officer at their respective times of hire. These individual performance goals were primarily based on thenamed executiveofficer's abilityofficers participated in a review process during the beginning of 2014 and in connection with such review was rated (on a scale from one tointeractfour withpeers, performancea rating of three representing target or “on plan” performance) depending upon whether, and at times, when, their MBOs for 2013 were achieved. Although these ratings are then used to determine the portion of the final bonus payout attributable to MBOs, none of the named executiveofficer's direct reports (includingofficers received a payout under thesuccessplan for individual performance since the threshold adjusted EBITDA corporate performance goal was not achieved.The MBOs for each named executive officer who had MBOs for 2013 are described in
recruiting top level talent), development and strengtheningthe table below. Most of thenamed executive officer's relationships with our vendors, distributors and customers, and overall contributionMBOs related primarily to theCompany. Thecontinued implementation of our high performance management system, or HPMS, which focuses executives’ efforts on our vital programs, action items and objectives to work toward fulfilling our corporate mission, vision and values.Name
2013 MBOs
Shawn T McCormick • Implementation of certain financial performance management software
• Enterprise risk management readiness
• Development of key performance indicators and monthly reporting dashboard
• U.S. sales transition objectives
• Expense maintenance within finance and information technology budget
• Cash management objectives
Stéphan Epinette • Product sales in new countries
• International revenues attributable to OrthoHelix products
• Transition to direct operations in certain counties
• Maintenance of certain international expenses
Terry M. Rich • Sales training of U.S. sales representatives and physicians
• Expense maintenance within budgeted amounts
• U.S. sales transition objectives
Our compensation committee determined that each of Messrs. McCormick, Epinette and Rich achieved 100% or higher of their respective MBOs. Mr. Van Ummersen did not have any formal MBOs for 2013 since he became an executive in June 2013. Accordingly, the individual performance portion of
the 2010 annual bonus tied to individual performance goals is capped at 100% of target for maximum achievement. For 2010,his 2013 payout was determined by the compensation committeeconsidered Mr. Kohrs'based upon, among other things, his self-assessment of his 2013 individual performancerelative toand the assessment by the CEO and compensation committee. The compensation committee determined that Mr. Van Ummersen achieved an individual performancegoals, andpayout at 100%. However, as mentioned above, our named executive officers received no bonus payouts for fiscal 2013 attributable to their individual performance since the threshold adjusted EBITDA corporate performance goal was not achieved.The table below sets forth, with respect to
theeach named executiveofficers other than Mr. Kohrs, considered Mr. Kohrs' recommendations, which were based on his considerationofficer, the maximum potential bonus opportunity as a percentage of base salary and thenamed executive officers' individualactual bonus paid under the employee performancerelative to individual performance goals,incentive compensation plan for 2013, both in amount andqualitatively determined that Ms. Diersen achieved 95%, and that Messrs. Kohrs, Joiner, Epinette and Klemz achieved 88%, 85%, 85%, and 95%as a percentage oftheir respective individual performance goals and approved payouts at these percentages for the portion of the named executive officers' bonuses tied to individual performance goals. As a result of his termination of employment, Mr. Doty was not eligible to receive an annual incentive bonus based on 2010 performance.2013 base earnings:For 2010, the payout percentages attributable to corporate performance represented 80% and individual performance represented 20% of the named executive officers' overall annual bonus, which resulted in payouts at approximately the following aggregate percentages: (i) Mr. Kohrs – 80.55%, (ii) Ms. Diersen – 81.96%, (iii) Mr. Joiner – 79.96%, (iv) Mr. Epinett – 79.96%, and (v) Mr. Klemz, 81.96%. Actual 2010 bonus amounts are set forth below in the Summary Compensation Table and were paid in February 2011.Name
Maximum potential bonus
as percentage of base salaryActual
bonus paid
($)Actual bonus paid as a
percentage of
2013 base earningsDavid H. Mowry
120% (150% of 80%) $ 106,285 24 % Shawn T McCormick
75% (150% of 50%) 47,686 13 % Gordon W. Van Ummersen
75% (150% of 50%) 26,414 13 % Stéphan Epinette(1)
60% (150% of 40%) 7,220 2 % Terry M. Rich
113% (150% of 75%) 16,093 4 % (1) A rate of one Euro to $1.368 was used to convert Mr. Epinette’s €5,278 bonus paid into U.S. dollars. French Incentive Compensation
SchemeScheme.In addition to participating in our
annual bonus program,corporate performance incentive plan, Mr. Epinette participates in an incentive compensation scheme on the same basis as other employees of our French operating subsidiary. Thisincentive compensationscheme enables our French operating subsidiary to provide its employees with a form of compensation that is efficient with respect to income tax and mandated social contributions inFrance, insofar as theFrance. The payments made under the French incentive compensation scheme, which receives preferential tax treatment, are exempted from social security contributions.Pursuant toUnder the French incentive compensation scheme, employees of our French operating subsidiary may receive an annual incentive cash payment equal to a specified percentage of their base salary, up to certain statutory limits. In2010,2013, employees were eligible to receive up to 16% of base salary, up to a statutory limit of$22,984.€18,516. For2010,2013, annual incentive payments were dependent on the achievement of performance goals relating to adjusted non-U.S. revenue,Modifiedadjusted revenue, adjusted EBITDA,revenue over net value of implants and instruments andadjusted free cash flow, on-time delivery of new products to marketofand satisfactory service level reviews. In each case these amounts are adjusted for certainnew products.items similar to the adjustments that apply to the corporate performance goals established under our employee performance incentive compensation plan.The
followingtable below sets forth the20102013 financial performance metrics for the French incentive compensation scheme,andthe range of possible payouts for Mr. Epinette, and the estimated actual payout percentage for Mr. Epinette based on the performance achieved. If performance achieved falls between the threshold and target/maximum levels, actual payout percentages are determined on a sliding scale basis, with payouts starting at 0.25% of base salary for minimum performance achievement and capped at 4% of base salary for target/maximumachievement.achievement for each individual metric. The actual payout percentages and Mr.Epinette'sEpinette’s actual20102013 incentive payment amountwhichunder the French incentive compensation scheme will be determined, on a final basis, and paidby July 2011, are not currently calculable, but are expected to be determined byduring mid-2014 after theboard duringFrench employee committee meets and approves thethird quarter of 2011.Weight
(% of payment
tied to
performance
of this metric)Payout Performance targets(1) Threshold
(% of base
salary)Target/max.
(% of base
salary)Modified metrics(2)Threshold Target/max.(3) Modified Revenue
25 % $203.2 million $239.0 million 0.25 % 4 % Modified EBITDA(4)
25 % $16.7 million $19.7 million 0.25 % 4 % Modified Revenue/(Net Value of Implants and Instruments)(5)
25 % .91 1.97 0.25 % 4 % On-time Delivery to Market of New Products(6)
25 % n/a n/a 0.25 % 4 % (1)The performance targets were established based on an assumed foreign currency exchange rate of 1.45 U.S. dollars for 1 Euro, which represented an anticipated average rate of foreign exchange for 2010 and which was the rate of foreign exchange used by the Company for 2010 budgeting purposes.(2)The board of directors has historically determined incentive payment amounts after reviewing our unaudited financial statements for the applicable fiscal year, which are adjusted for changes to the foreign exchange rates and which are subject to discretionary adjustment by our board for items that are unusual and not reflective of normal operations.final payouts. It is anticipated that themetrics usedactual payout percentages fordetermining the 2010 incentiveMr. Epinette’s actual 2013 paymentamountsamount will besubject to foreign exchange adjustments and discretionary board adjustments and will differ fromas set forth in thefigures reportedtable below, resulting inour 2010 audited financial statements.(3)Underan anticipated payment of theFrench incentive compensation scheme, themaximumpossible payout is 16% of base salary, up to astatutory limit of$22,984,€18,516.Performance metric
Weighting Performance goals(1) Payout 2013
performance(3)Level for
2013
paymentThreshold Target/max. Threshold Target/max.(2) (% of base
salary)(% of base
salary)Adjusted non-U.S. revenue(4)
25 % $ 111.4 million $ 131.1 million 0.25 % 4 % $ 126.7 million 3.3 % On-time delivery of new products to market(5)
25 % N/A N/A 0.25 % 4 % 75 % 3.0 % Satisfactory service level reviews(6)
25 % N/A N/A 0.25 % 4 % 75 % 3.0 % Adjusted revenue(7)
15 % $ 279.0 million $ 328.2 million 0.15 % 2 % $ 308.8 million 1.5 % Adjusted EBITDA(8)
5 % $ 33.7 million $ 39.7 million 0.05 % 1 % $ 31.1 million 0.0 % Adjusted free cash flow(9)
5 % $ (11.9) million $ (10.1) million 0.05 % 1 % $ (8.7) million 1.0 % (1) The performance goals were established based on an assumed foreign currency exchange rate of 1.29 U.S. dollars for 1 Euro, which represented an anticipated average rate of foreign exchange for 2013 and which was the rate of foreign exchange used by our company for 2013 budgeting purposes. (2) Under the French incentive compensation scheme, the maximum possible payout is 16% of base salary, up to a statutory limit of €18,516, which is based on 100% achievement of target levels. Therefore, target and maximum performance and payout amounts are the same for the purposes of the French incentive compensation scheme. (3) The compensation committee determined incentive payment amounts after reviewing our unaudited financial statements for the applicable year, which were adjusted for changes to the foreign currency exchange rates and which were subject to further discretionary adjustment by our compensation committee for items that are unusual and not reflective of normal operations. For purposes of determining 2013 bonus amounts, in addition to foreign currency exchange adjustments, the compensation committee made additional adjustments discussed in the notes below. Accordingly, the figures included in the “2013 performance” column reflect foreign currency exchange rate and discretionary adjustments and differ from the figures reported in our 2013 audited financial statements. (4) “Adjusted non-U.S. revenue” means our U.S. revenue for 2013, as adjusted for changes to the foreign currency exchange rates. (5) “On-time delivery to market of new products” means the timely release of certain new, strategic products by specific dates. The target/maximum payout amount with respect to this metric assumes the timely release of all new products scheduled to be delivered for a given year, whereas the threshold payout amount is determined by dividing 4% (the target/maximum payout for this metric) by the number of new products scheduled to be delivered for a given year. (6) “Satisfactory service level reviews” means the timely processing and shipment of orders. (7) “Adjusted revenue” means our revenue for 2013, as adjusted for changes to the foreign currency exchange rates. (8) “Adjusted EBITDA” means our net loss for 2013, as adjusted for changes to foreign currency exchange rates, before interest income and expense, income tax expense and benefit, depreciation and amortization, as adjusted further to give effect to non-operating income and expense, foreign currency transaction gains and losses, loss on extinguishment of debt, share-based compensation, amortization of the inventory step-up from acquisitions and special charges including acquisition, integration and distribution channel transition costs, facilities consolidation charges, reversal of acquisition contingent consideration liability, bad debt expense charges in Italy, legal settlements, management exit costs and certain other items that affect the comparability and trend of Tornier’s operating results. (9) “Adjusted free cash flow” means cash flow generated from operations less instrument investments, plant, property and equipment investments, and cash payments related to our facilities consolidation, as adjusted for changes to foreign currency exchange rates. Corporate Performance Incentive Plan for 2014. In February 2014, our board of directors, upon recommendation of our compensation committee, approved the material terms of the Tornier N.V. Corporate Performance Incentive Plan for 2014. The 2014 target bonus percentages for our named executive officers did not change from their 2013 levels. Consistent
with the design for the 2013 plan, the payout under our 2014 corporate performance incentive plan for our President and Chief Executive Officer will be based 100% upon achievement of corporate performance goals, with no divisional performance or individual performance components. Otherwise, the percentage payout splits among corporate performance goals, divisional performance goals and individual performance goals will be the same for our other named executive officers for 2014, except that payouts for Mr. Rich and Mr. Epinette will be based 40% upon achievement of corporate performance goals and 60% upon achievement of their respective divisional goals. The corporate performance measures under the
purposesplan for 2014 will be based on Tornier’s adjusted revenue (both total revenue and total extremities revenue), adjusted EBITDA and adjusted free cash flow. The divisional performance measures for 2014 will be based on U.S. adjusted revenue for Mr. Rich and non-U.S. adjusted revenue (both total non-U.S. revenue and non-U.S. extremities revenue) for Mr. Epinette. If the minimum or threshold free cash flow corporate performance goal is not achieved, then our named executive officers will not receive any payout under the plan for individual performance. The material terms of theFrench incentiveplan for 2014 are otherwise the same as the plan for 2013.Long-Term Equity-Based Incentive Compensation
Generally. Our compensation
scheme.(4)"Modified EBITDA" means our earnings before interest, taxes, depreciation and amortization, subject to adjustment as described in footnote(2).
(5)"Modified Revenue/(Net Value of Implants and Instruments)" means revenue, divided by the net value of our inventory of raw materials, semi-finished products, and finished goods inventory in warehouses and with customers, plus the net value of implants and instruments, subject to adjustment as described in footnote(2).(6)"On-Time Delivery to Market of New Products" means the timely release of certain new, strategic products by specific dates. The target/maximum payout amountcommittee’s primary objectives with respect tothis metric assumes the timely release of all new products scheduled to be delivered for a given year, whereas the threshold payout amount is determined by dividing 4% (the target/maximum payout for this metric) by the number of new products scheduled to be delivered for a given year.
Long-Term Equity CompensationStock Option PlanWe have historically maintained a stock option plan, in an effortlong-term equity-based incentives are to align theequity ownershipinterests of ouremployeesexecutives with the long-term interests of our shareholders, promote stock ownership and create significant incentives for executive retention. Long-term equity-based incentives typically comprise a significant portion of each named executive officer’s compensation package, consistent with our executive compensation philosophy that at least half of the CEO’s compensation and one-third of other executives’ compensation opportunity should be in the form of stock-based incentive awards. For 2013, equity-based compensation comprised 63% of total compensation for our CEO during the year and ranged from 44% to 76% of total compensation for our other named executive officers, assuming grant date fair value for equity awards. One of our named executive officers had a higher percentage of equity-based compensation than our CEO since such named executive officer joined our company in 2013 and thus received a higher talent acquisition grant during 2013.Before our initial public offering in February 2011, we granted stock options under our prior stock option plan, which is now the Tornier N.V. Amended and Restated Stock Option Plan and referred to in this report as our prior stock option plan. Since our initial public offering, we ceased making grants under our prior stock option plan and subsequently have granted stock options and other equity-based awards under the Tornier N.V. 2010 Incentive Plan, which is referred to in this report as our stock incentive plan. Both our board of directors and shareholders have approved our stock incentive plan, under which our named executive officers (as well as other executives and
other employees have beenkey employees) are eligible to receive equity-based incentive awards. For more information on the terms of our stock incentive plan, see “Executive Compensation—Grants of Plan-Based Awards— Tornier N.V. 2010 Incentive Plan.” All equity-based incentive awards granted to our named executive officers during 2013 were made under our stock incentive plan.To assist our board of directors in granting, and our compensation committee and management in recommending the grant of, equity-based incentive awards, our compensation committee, on recommendation of Mercer, in April 2013, adopted long-term incentive grant guidelines. In addition to our long-term incentive grant guidelines, our board of directors has adopted a stock grant policy document, which includes policies that our board of directors and compensation committee follow in connection with granting equity-based incentive awards, including the long-term incentive grant guidelines.
Types of Equity Grants. Under our long-term incentive grant guidelines and our policy document, our board of directors, on recommendation of the compensation committee, generally grants three types of equity-based incentive awards to our named executive officers: performance recognition grants, talent acquisition grants and special recognition grants. On limited occasion, our board of directors, on recommendation of the compensation committee, may grant purely discretionary awards. During 2013, only performance recognition grants and talent acquisition grants were made to our named executive officers.
Performance recognition grants are discretionary annual grants that are made during mid-year to give the compensation committee another formal opportunity during the year to review executive compensation and recognize executive and other key employee performance. In July 2013, the performance recognition grants were approved by the board of directors, on recommendation of the compensation committee, but the grant date of the awards was effective as of the third full trading day after the release of our second quarter earnings in August 2013. The recipients and size of the performance recognition grants were determined, on a preliminary basis, by each executive with input from their management team and based on our long-term incentive grant guidelines and the 10-trading day average closing sale price of our ordinary shares as reported by the NASDAQ Global Select Market. Grants were determined one week before the corporate approval of the awards, and then ultimately approved by our board of directors, on recommendation by the compensation committee. Under our long-term incentive grant guidelines for annual performance recognition grants, our named executive officers received a certain percentage of their respective base salaries in stock options and stock grant awards (in the form of restricted stock units and referred to as stock awards or RSUs in this CD&A and elsewhere in this report), as set forth in more detail in the table below.
Once the target total long-term equity value was determined for each executive based on the executive’s relevant percentage of base salary, half of the value was provided in stock options and the other half was provided in stock awards. The reasons we use stock options and stock awards are described below under the headings “—Stock Options” and “—Stock Awards.” The target dollar value to be delivered in stock options (50% of the target total long-term equity value) was divided by the Black-Scholes value of one ordinary share to determine the number of stock options, which then was rounded to the nearest whole number or in some cases multiple of 100. The number of stock awards was calculated using the intended dollar value (50% of the target total long-term equity value) divided by the 10-trading day average closing sale price of our ordinary shares as reported by the NASDAQ Global Select Market and was determined one week before the date of anticipated corporate approval of the award, which number was then rounded to the nearest whole number or in some cases multiple of 100. Typically, the number of ordinary shares subject to stock awards is fewer than the number of ordinary shares that would have been covered by a stock option of equivalent target value. The actual number of stock options and stock awards granted may then be pared back so that the estimated run rate dilution under our stock incentive plan is acceptable to our compensation committee (i.e., approximately 2.7% for 2013). The CEO next reviewed the preliminary individual awards and may make recommended discretionary adjustments. Such proposed individual awards were then presented to the compensation committee, which also may make discretionary adjustments before recommending awards to our board of directors for approval. After board approval, awards were issued, with the exercise price of the stock options equal to the closing price of our ordinary shares on the grant date. In determining the number of stock options or stock awards to make to an executive as part of a performance recognition grant, previous awards, whether vested or unvested, granted to such individual had no impact.
The table below describes our long-term incentive grant guidelines for annual performance recognition grants that applied to our named executive officers for 2013. Mr. Van Ummersen is not listed in the table because he did not receive an annual performance recognition grant for 2013.
Named executive officer
Grade level Incentive grant guideline
expressed as % of base salary for
grade levelIncentive grant guideline
dollar value of
long-term incentives ($)David H. Mowry
11 225 % $ 1,012,500 Shawn T McCormick
9 125 % 443,515 Stéphan Epinette(1)
8 125 % 389,501 Terry M. Rich
8 125 % 449,530 (1) A rate of one Euro to $1.33 was used to convert Mr. Epinette’s base salary into U.S. dollars for purposes of determining his long-term incentive grant guideline. We seek to align the interests of our executives with those of our shareholders by providing a significant portion of compensation in equity-based awards. Consistent with this principle, the portion of an executive’s total compensation that varies with performance and is at risk should increase with the executive’s level of responsibility. Thus, incentive grants, expressed as a percentage of base salary and dollar values, increase as an executive’s level of responsibility increases. The incentive grant guidelines were benchmarked by Mercer against our February 2013 peer group.
Performance recognition grants also may be made in connection with the promotion of an individual. When a performance recognition grant is made in connection with the promotion of an individual, the amount of the grant is usually made based on the pro rata difference between the long-term incentive grant guideline for the new position compared to the long-term incentive grant guideline for the prior position.
Talent acquisition grants are made in stock options and stock awards, and are used for new hires. These grants are considered and approved by our board of directors, upon recommendation of our compensation committee, as part of the executive’s compensation package at the time of hire (with the grant date and exercise price delayed until the hire date or the first open window period after board approval of the grant). As with our performance recognition grants, the size of our talent acquisition grants is determined by dollar amount (as opposed to number of underlying shares), and under our long-term incentive grant guidelines, is generally two times the long-term incentive grant guidelines for annual performance recognition grants. We have set talent acquisition grants at two times the long-term incentive grant guidelines for annual performance recognition grants, upon recommendation by Mercer. We recognize that higher initial grants often are necessary to attract a new executive, especially one who may have accumulated a substantial amount of equity-based long-term incentive awards at a previous employer that would typically be forfeited upon acceptance of employment with us. In some cases, we need to further increase a talent acquisition grant to attract an executive.
Our compensation committee made a promotional performance recognition grant, annual performance recognition grants and a talent acquisition grant to one or more of our named executive officers during 2013, as described in more detail below under “—2013 Equity Awards.”
In addition to our annual and promotional performance recognition grants and talent acquisition grants, from time to time, we may make special recognition grants or discretionary grants to our executive officers for retention or other purposes. Such grants may vest based on the passage of time and/or the achievement of certain performance goals, such as those based on our revenue, expenses, profitability, productivity, cash flows, asset utilization, shareholder return, share price and other similar performance measures. For example, as described in more detail below under “—2014 Retention Equity Awards,” effective as of February 25, 2014, stock awards in the form of restricted stock units will be granted to certain of our executive officers, the vesting of which is based on the passage of time or, if earlier, the achievement of certain minimum share price triggers.
Stock Options. Historically, we have granted stock options to our named executive officers, as well as other key employees. We believe that options effectively incentivize
ouremployees to maximizeCompanycompany performance, as the value of awards is directly tied to an appreciation in the value of ourshares, andordinary shares. They also provide an effective retention mechanism because of vesting provisions. An important objective of our long-term incentive program is to strengthen the relationship between the long-term value of our ordinary shares and the potential financial gain for employees. Stock options provide recipients with the opportunity to purchase ordinary shares at a price fixed on the grant date regardless of future market price. The vesting of our stock options is generally time-based. Consistent with our historical practice, 25% of the shares underlying the stock option typically vest on the one-year anniversary of the grant date (or if later, on the hire date) and the remaining 75% of the underlying shares vest over a three-year period thereafter in 12 nearly equal quarterly installments. Our policy is to grant options only with an exercise price equal to or more than the fair market value of our ordinary shares on the grant date.Because stock options become valuable only if the share price increases above the exercise price and the option holder remains employed during the period required for the option to vest, they provide an incentive for an executive to remain employed. In addition, stock options link a portion of an employee’s compensation to the interests of our shareholders by providing an incentive to achieve corporate goals and increase the market price of our ordinary shares over the four-year vesting period.
To comply with Dutch insider trading laws, we time our option grants to occur on the third trading day after the public release of our financial results for our most recently ended quarter.
Stock Awards. Stock awards are intended to retain key employees, including our named executive officers, through vesting periods. Stock awards provide the opportunity for capital accumulation and more predictable long-term incentive value than stock options. All of our stock awards are stock grants in the form of restricted stock units, which is a commitment by us to issue ordinary shares at the time the stock award vests.
The specific terms of vesting of a stock award depend on whether the award is a performance recognition grant or talent acquisition grant. Performance recognition grants of stock awards are made mid-year and vest in four annual installments on June 1stof each year. Talent acquisition grants of stock awards to new hires vest in a similar manner, except that the first installment is often pro-rated, depending on the grant date.
2013 Equity Awards. Our board of directors, on recommendation of the compensation committee, made a promotional performance recognition grant, a talent acquisition grant and annual performance recognition grants to one or more of our named executive officers during 2013.
In connection with the promotion of Mr. Mowry to President and Chief Executive Officer on a non-interim basis, he received a promotional performance recognition grant in February 2013. The number of stock options and stock awards granted to Mr. Mowry as part of the promotional performance recognition grant was determined based on the pro rata difference between the long-term incentive grant guideline for Mr. Mowry, as President and Chief Executive Officer and his then most recent long-term incentive grant as Chief Operating Officer, which was Mr. Mowry’s position prior to becoming President and Chief Executive Officer. Accordingly, on February 26, 2013, Mr. Mowry was granted a stock option to purchase 17,466 ordinary shares and a stock award in the form of a restricted stock unit for 7,982 ordinary shares.
Since Mr. Van Ummersen joined Tornier as a
resultnew executive in 2013, he received a talent acquisition grant in 2013. The number of stock options and stock awards granted to Mr. Van Ummersen as part of the talent acquisition grant was determined based on two times his long-term incentive grant guideline of $437,500, which represents 125% of his base salary. Accordingly, on August 9, 2013, Mr. Van Ummersen was granted a stock option to purchase 52,765 ordinary shares and a stock award in the form of a restricted stock unit for 24,430 ordinary shares.The table below describes the annual performance recognition grants made to our named executive officers in 2013 and the applicable
vesting mechanicslong-term incentive grant guideline for such performance recognition grants for these executives. Since Mr. Van Ummersen received a talent acquisition grant at the time of theoptions. Asperformance recognition grants, he did not receive a performance recognition grant for 2013 and thus is not listed in the table below.Named executive officer
Stock
optionsStock
awardsValue of long-term incentive
grant guideline(1)
($)David H. Mowry
61,057 28,269 $ 1,012,500 Shawn T McCormick
26,745 12,383 443,515 Stéphan Epinette(2)
23,192 10,738 389,501 Terry M. Rich
27,108 12,551 449,530 (1) The value per long-term incentive grant guideline of the annual performance recognition grants is based on the value calculated under our long-term incentive grant guidelines and does not necessarily match the grant date fair value of the equity awards under applicable accounting rules and as set forth in the Grants of Plan Based Awards Table later in this report. (2) A rate of one Euro to $1.33 was used to convert Mr. Epinette’s base salary into U.S. dollars for purposes of determining his long-term incentive grant guideline. Additional information concerning the long-term incentive compensation information for our named executive officers for 2013 is included in the Summary Compensation Table and Grants of Plan-Based Awards Table later in this report.
2014 Retention Equity Awards. Effective as of February
2, 2011, we25, 2014, stock grants, in the form of restricted stock units, willnot make furtherbe granted to certain of our officers, including three of our named executive officers. The purpose of the grants is to retain and motivate our officers in light of: (1) the continuity of our executive team is important for executing our current strategic plan; (2) such officers received minimal corporate bonus payouts for 2013 under ourstock optioncorporate performance incentive plan andequity-based awards will instead be grantedreceived little to no corporate bonus payouts for 2012; (3) such officers received no bonus payouts for 2013 attributable to their individual performance since under the terms of ournew stockcorporate performance incentive plan,as described below.if the threshold adjusted EBITDA corporate performance goal was not achieved, then executive officer participants did not receive any payout under the plan for individual performance; (4) the vast majority of previously granted stock options held by such officers are currently “underwater” and thus offer minimal retention value; and (5) the outstanding long-term equity incentive value for our executive officers is below the median for all positions compared to our February 2013 peer group and below the 25th percentile for three of seven positions.The retention restricted stock units will vest based on the passage of time, with 50% of the underlying shares vesting and becoming issuable on the two-year anniversary of the grant date, 25% on the three-year anniversary of the grant date and the remaining 25% on the four-year anniversary of the grant date, or, if earlier, upon the achievement of certain minimum share price triggers. The share price triggers will be measured based on a 30-day average closing price of our ordinary shares.
The following named executive officers will receive the following number of retention restricted stock units: Mr. McCormick (12,500); Mr. Van Ummersen (12,500); and Mr. Rich (12,500). Neither Mr. Mowry nor Mr. Epinette will receive any retention restricted stock unit grants. The number of retention restricted stock units granted to each named executive officer was determined based on a comparison of the value of their current long-term equity incentives and their respective long term incentive grant guideline.
All Other Compensation
Retirement Benefits.In
2010,2013, each of our named executive officers(other thanhad the opportunity to participate in retirement plans maintained by our operating subsidiaries, including our U.S. operating subsidiary’s 401(k) plan and, with respect to Mr.Doty) receivedEpinette, our French operating subsidiary’sgovernment-mandated pension plan and agrantgovernment-mandated pension plan for managerial staff, or the Retraite Complémentaire, on the same basis as our other employees. We believe that these plans provide an enhanced opportunity for our executives to plan for and meet their retirement savings needs. Mr. Epinette also participated in our French operating subsidiary’s defined contribution pension plan for key employees, or the Retraite Supplémentaire, on the same basis as other key employees. The Retraite Supplémentaire is intended to supplement the state pension plans mandated by French labor laws and to provide participants with a form ofoptions. The number of options grantedcompensation that is efficient with respect toeachincome tax and mandated social contributions. Except for these plans, we do not provide pension arrangements or post-retirement health coverage for our employees, including our named executiveofficer (other thanofficers. We also do not provide any nonqualified defined contribution or other deferred compensation plans.Relocation Benefits. We provide new hires and employees who we request to relocate with standard, market competitive reimbursements of and payments for certain relocation benefits. In June 2013, Mr.
KlemzVan Ummersen, who lived in Massachusetts, commenced employment as our then new Senior Vice President, Product Delivery. To ease his employment transition to the Minneapolis/St. Paul area, we agreed to provide Mr. Van Ummersen a monthly temporary living stipend of $2,500 for 12 months. During 2013, we also continued to provide Mr. Mowry a monthly housing stipend of $3,000 through mid-year. The amounts of Mr. Van Ummersen’s monthly temporary living stipend andMs. Diersen) wasMr. Mowry’s monthly housing stipend were determinedbybased on average monthly rentals for an apartment in downtown Minneapolis. All of these amounts are included in the “All other compensation” column of the Summary Compensation Table and amounts paid during 2013 are quantified in the related note to that column.Contingent Sign-On Bonus. Under Mr. Van Ummersen’s employment agreement, we agreed to pay him an $80,000 sign-on bonus, contingent on his employment for at least one year. We believe this payment assisted in our ability to hire Mr. Van Ummersen.
Discretionary Bonuses. On February 13, 2014, our board of directors,
baseduponrecommendations from Mr. Carney and, other than with respect to his grants, the Chief Executive Officer, based on each executive's position, role and responsibilities, and individual and overall Company performance as determined by the boardrecommendation ofdirectors. In determining the actual numberour compensation committee, approved a discretionary bonus ofoptions awarded€31,944 to Mr.Kohrs during 2010, theEpinette, and on April 30, 2013, our board of directors,consideredupon recommendation of ourpast grant practices and targeted an ownership rate appropriate for Mr. Kohrs' current equity held and the relative percentagecompensation committee, approved a discretionary bonus oftotal equity that his current equity holdings and proposed option grant would represent, and determined that an award€21,000 to Mr.KohrsEpinette. The purpose of83,333 optionsthese bonuses wasconsistent withto reward Mr. Epinette for the strong performance of ouroverall compensation objectives. Thoseinternational business and his extraordinary individual performance and to retain and motivate him to achieve our corporate and international business’s performance objectivesinclude providing a substantial portion ofgoing forward.Perquisites and Other Benefits.Our named executive
officer compensation inofficers receive other benefits, which also are received by our other employees, including theform of equity-based compensationopportunity to purchase our ordinary shares at a discount with payroll deductions under our tax-qualified employee stock purchase plan, andaligning our named executive officers' interests with those of our shareholders. Historically (and in 2010) the board of directors has determined the actual number of options awardedhealth, dental and life insurance benefits. We provide limited additional modest perquisites to our named executive officers,duringonly on agiven fiscal year by assessing targeted long-term ownership levelscase-by-case basis. For 2013, these perquisites included the housing stipend for Mowry, the temporary living stipend for Mr. Van Ummersen and an automobile allowance for Mr. Epinette. We provide Mr. Epinette with an automobile allowance on the same basis as other key employees of our French operating subsidiary pursuant to our company policy, which we believe is necessary in light of the competitive market for talent in our industry.Change in Control and Post-Termination Severance Arrangements
Change in Control Arrangements. To encourage continuity, stability and retention when considering the potential disruptive impact of an actual or potential corporate transaction, we have established change in control arrangements, including provisions in our prior stock option plan, current stock incentive plan and written employment agreements with our executives and other key employees. These arrangements are designed to incentivize our executives to remain with the company in the event of a change in control or potential change in control. Under the terms of our current stock incentive plan and the
relative percentageindividual award documents provided to recipients oftotalawards under that plan, all stock options and stock awards become immediately vested (and, in the case of options, exercisable) upon the completion of a change in control of the company. For more information, see “Executive Compensation—Potential Payments Upon Termination or Change in Control—Change in Control Arrangements—Generally.” Thus, the immediate vesting of stock options and stock awards is triggered by the change in control, itself, and thus is known as a “single trigger” change in control arrangement. We believe our “single trigger” equityoutstandingacceleration change in control arrangements provide important retention incentives during what can often be an uncertain time for employees. They also provide executives with additional monetary motivation to focus on and complete a transaction thateach option grant represents. Consistentour board of directors believes is in the best interests of our shareholders rather than seeking new employment opportunities. If an executive were to leave before the completion of the change in control, non-vested awards held by the executive would terminate.In addition, we have entered into employment agreements with
past practices, Mr. Klemz was granted 83,333 optionsour named executive officers and other officers to provide certain payments and benefits in2010, and Ms. Diersen, 150,000 options,the event of a change in control, most of which are payable only in the event their employment is terminated in connection with thecommencementchange in control (“double-trigger” provisions). These change in control protections were initially offered to induce the executives to accept or continue employment with our company, provide consideration to an executive for certain restrictive covenants that apply following a termination oftheir employment. The boardemployment and provide continuity ofdirectorsmanagement in connection with a threatened or actual change in control transaction. If the executive’s employment is terminated without cause or by the executive for “good reason” (as defined in the employment agreements) within 12 months following a change in control, the executive will be entitled to receive a lump sum payment equal to his or her base salary plus target bonus for the year of termination, health and welfare benefit continuation for 12 months following termination and accelerated vesting of all unvested options and stock awards. These arrangements, and a quantification of the payment and benefits provided under these arrangements, are described in more detail under “Executive Compensation—Potential Payments Upon Termination or Change in Control—Change in Control Arrangements.” Other than the immediate acceleration of equity-based awards which we believe aligns ourChief Executive Officer determined the number of options awarded to Mr. Klemz and Ms. Diersen based upon their respective roles and responsibilities and based on a desire to align theirexecutives’ interests with those of our shareholdersatbyallowing executives to participate fully in the
outsetbenefits of a change in control as to all of their equity, in order for our named executive officers to receive any other payments or benefits as a result of a change in control of our company, there must be a termination of the executive’s employment, either by us without cause or by the executive for good reason. The termination of the executive’s employment byproviding themthe executive without good reason will not give rise to additional payments or benefits either in a change in control situation or otherwise. Thus, these additional payments and benefits will not just be triggered by a change in control, but also will require a termination event not within the control of the executive, and thus are known as “double trigger” change in control arrangements. As opposed to the immediate acceleration of equity-based awards, we believe that other change in control payments and benefits should properly be tied to termination following a change in control, given the intent that these amounts provide economic security to ease in the executive’s transition to new employment.We believe our change in control arrangements are an important part of our executive compensation program in part because they mitigate some of the risk for executives working in a smaller company where there is a meaningful likelihood that the company may be acquired. Change in control benefits are intended to attract and retain qualified executives who, absent these arrangements and in anticipation of a possible change in control of our company, might view employment alternatives to be less risky than remaining with our company through the transaction. We believe that relative to the company’s overall value, our potential change in control benefits are relatively small. We confirm this belief on an annual basis by reviewing a tally sheet for each executive that summarizes the change in control and severance benefits potentially payable to each executive. We also believe that the form and amount of such benefits are reasonable in light of those provided to executives by companies in our peer group and other companies with which we compete for executive talent and the amount of time typically required to find executive employment opportunities. We, thus, believe we must continue to offer such protections in order to remain competitive in attracting and retaining executive talent.
Other Severance Arrangements. Each of our named executive officers is entitled to receive severance benefits upon certain other qualifying terminations of employment, other than a change in control, pursuant to the provisions of such executive’s employment agreement. These severance arrangements were initially offered to induce the executives to accept or continue employment with our company and are primarily intended to retain our executives and provide consideration to an executive for certain restrictive covenants that apply following a termination of employment. Additionally, we entered into the employment agreements because they provide us valuable protection by subjecting the executives to restrictive covenants that prohibit the disclosure of confidential information during and following their employment and limit their ability to engage in competition with us or otherwise interfere with our business relationships following their termination of employment. For more information on our employment agreements and severance arrangements with our named executive officers, see the discussions below under the headings “Executive Compensation—Summary Compensation—Employment Agreements” and “Potential Payments Upon a Termination or Change in Control.”
Stock Ownership Guidelines
In February 2014, we established stock ownership guidelines that are intended to further align the interests of our executive officers with those of our shareholders. Stock ownership targets for our executive officers are set at that number of ordinary shares with a
grantvalue equal to a multiple oflong-term equity-basedthe executive’s annual base salary, with the multiple equal to three times for our CEO and one and one-half times for our other executive officers. Executive officers have five years from the date of hire or, if the ownership multiple has increased during his or her tenure, five years from the date established in connection with such increase to reach their stock ownership target. Until the applicable stock ownership target is achieved, each executive subject to the guidelines is required to retain an amount equal to 75% of the net shares received as a result of the exercise of stock options or the vesting of restricted stock units. If there is a significant decline in our stock price that causes executives to be out of compliance, such executives will be subject to the 75% retention ratio, but will not be required to purchase additional shares to meet the applicable target.Our compensation
As new hires, Mr. Klemz and Ms. Diersen received option grants that were larger thancommittee will report on compliance with thegrants madeguidelines at least annually to our board of directors. Stock ownership targets are evaluated and adjusted as necessary on January 1st each year and also whenever an executive’s annual base salary changes. As of February 13, 2014, the date the stock ownership guidelines were established, all of our executives met their respective individual stock ownership guideline, except for Mr. Mowry, whose stock ownership target is the highest amongst our executive team in light of his CEO position.Anti-Hedging and Pledging
Our code of conduct on insider trading and confidentiality prohibits our executive officers from engaging in hedging transactions, such as short sales, transactions in publicly traded options, such as puts, calls and other derivatives, and pledging our shares in any significant respect.
Compensation Committee Report
Our compensation committee has reviewed and discussed the foregoing “Compensation Discussion and Analysis” section of this report with our management. Based on this review and these discussions, our compensation committee has recommended to our board of directors that the foregoing “Compensation Discussion and Analysis” be included in this annual report on Form 10-K.
This report is dated February 10, 2014.
Compensation Committee
Sean D. Carney
Richard W. Wallman
Elizabeth H. Weatherman
Executive Compensation
Summary Compensation
The table below provides summary information concerning all compensation awarded to, earned by or paid to the individuals that served as our principal executive officer and principal financial officer and other named executive officers for the years ended December 29, 2013, December 30, 2012 and January 1, 2012.
SUMMARY COMPENSATION TABLE – 2013
Name and principal position
Year
Salary(1)
($)
Bonus(2)
($)Stock
awards(3)
($)Option
awards(4)
($)Non-equity
incentive plan
compensation(5)
($)All other
compensation(6)
($)Total
($)David H. Mowry(7)
President and Chief Executive
Officer and Executive Director
2013 2012
2011
444,334 341,591
143,844
0 0
0
687,758 192,630
436,313
689,921 195,481
539,650
106,285 17,666
46,627
27,673 42,251
35,706
1,955,971 789,619
1,202,140
Shawn T McCormick(8)
Chief Financial Officer
2013 2012
354,411 114,198
0 75,000
240,848 354,488
241,636 357,207
47,686 5,710
3,707 0
888,288 906,603
Gordon W. Van Ummersen(9)
Senior Vice President, Global
Product Delivery
2013 196,314 80,000 475,161 476,721 26,414 21,510 1,276,120 Stéphan Epinette(10)
Senior Vice President,
International Commercial Operations
2013 2012
2011
322,567 297,688
299,620
43,699 0
28,636
208,853 143,323
186,186
209,535 145,192
236,519
7,220 48,962
81,960
97,608 87,988
99,002
889,482 723,153
931,923
Terry M. Rich(11)
Senior Vice President, U.S. Commercial
Operations
2013 2012
358,823 282,468
0 0
244,116 614,993
244,915 735,654
16,093 21,185
0 0
863,947 1,654,300
(1) From June 27, 2013 and through December 29, 2013, 5% of Mr. Mowry’s annual base salary was allocated to his service as a member of our board of directors. (2) We generally do not pay any discretionary bonuses or bonuses that are subjectively determined and did not pay any such bonuses to any named executive officers in 2013, 2012 or 2011, except as described below under “—Contingent Sign-On and Other Discretionary Bonuses.” Annual cash incentive bonus payouts based on performance against pre-established performance goals under our corporate performance incentive plan, and in the case of Mr. Epinette, our French incentive compensation scheme, are reported in the “Non-equity incentive plan compensation” column. (3) Amount reported represents the aggregate grant date fair value for stock awards granted to each named executive officer computed in accordance with FASB ASC Topic 718. The grant date fair value is determined based on the per share closing sale price of our ordinary shares on the grant date. (4) Amount reported represents the aggregate grant date fair value for option awards granted to each named executive officer computed in accordance with FASB ASC Topic 718. The grant date fair value is determined based on our Black-Scholes option pricing model. The table below sets forth the specific assumptions used in the valuation of each such option award: Grant
date
Grant date
fair value
per share ($)Risk free
interest rateExpected
LifeExpected
volatilityExpected
dividend
yield08/09/2013
9.03 1.70 % 6.11 years 46.58 % 0 02/26/2013
7.92 1.00 % 6.11 years 47.21 % 0 09/04/2012
8.38 0.85 % 6.11 years 48.03 % 0 08/28/2012
8.30 0.95 % 6.25 years 47.94 % 0 08/10/2012
8.37 0.93 % 6.11 years 48.14 % 0 03/12/2012
11.04 1.20 % 6.11 years 48.65 % 0 08/12/2011
11.13 1.29 % 6.11 years 48.33 % 0 05/12/2011
12.34 2.26 % 6.11 years 48.60 % 0 (5) Represents amounts paid under our corporate performance incentive plan, and for Mr. Epinette, also under our French incentive compensation scheme. The amount reflected for each year reflects the amounts earned for that year but paid during the following year. (6) The amounts shown in this column for 2013 include the following with respect to each named executive officer: Name
Retirement
benefits(a)
($)Perquisites and other
personal benefits(b)
($)Total
($)Mr. Mowry
7,350 20,323 27,673 Mr. McCormick
3,707 — 3,707 Mr. Van Ummersen
4,010 17,500 21,510 Mr. Epinette
70,841 26,767 97,608 Mr. Rich
— — — (a) Represents 401(k) matching contributions under the Tornier, Inc. 401(k) plan for Messrs. Mowry, McCormick and Ummersen, and for Mr. Epinette the following retirement contributions on his behalf: (i) $5,366 in contributions to the French government mandated pension plan; (ii) $46,710 in contributions to our French operating subsidiary’s Retraite Complémentaire; and (iii) $18,765 in contributions to our French operating subsidiary’s Retraite Supplémentaire. (b) Represents $20,323 in a housing stipend for Mr. Mowry, $17,500 in temporary living stipend for Mr. Van Ummersen and $26,767 in automobile expenses for Mr. Epinette. (7) Mr. Mowry was appointed as President and Chief Executive Officer effective February 12, 2013, Interim President and Chief Executive Officer effective November 12, 2012 and prior to such position served as Chief Operating Officer effective July 20, 2011. (8) Mr. McCormick was appointed as Chief Financial Officer effective September 4, 2012. (9) Mr. Van Ummersen was appointed as Senior Vice President, Product Delivery effective June 3, 2013 and Senior Vice President, Global Product Delivery effective January 14, 2014. (10) Mr. Epinette’s cash compensation was paid in Euro. The foreign currency exchange rate of 1.3277 U.S. dollars for 1 Euro, which reflects an average conversion rate for 2013, was used to calculate Mr. Epinette’s base salary and all other compensation amounts for 2013, except for his April 2013 discretionary bonus where a foreign currency exchange rate of 1.307 U.S. dollars for 1 Euro was used and his non-equity incentive plan compensation and February 2014 discretionary bonus where a foreign currency exchange rate of 1.368 U.S. dollars for 1 Euro was used, which represent the respective foreign exchange rates on the dates of corporate approval of such amounts. (11) Mr. Rich was appointed as Senior Vice President, U.S. Commercial Operations effective March 12, 2012. Employment Agreements. We, through one of our operating subsidiaries, typically execute employment agreements in
2010, which is consistentconjunction withour historical practicethe hiring or promotion ofproviding new hires with larger grants than the annual grants provided to our otheran executive officer. Our named executive officers are generally compensated by the operating subsidiary to which such named executive officer primarily provided services. Tornier, Inc., our primary U.S. operating subsidiary, is a party to employment agreements with Messrs. Mowry, McCormick, Van Ummersen and Rich, which agreements are substantially the same, other than differences inorderbase salary, target annual bonus percentages and severance. The employment agreements have a specified term of three years and are subject to automatic renewal for one-year terms unless either we or the executive provides 60 days’ advance notice of a desire not to renew the agreement. Under the agreements, each executive is entitled to a specified base salary, subject to increase but not decrease, is eligible to receive an annual cash bonus with a target bonus equal to a specified percentage of base salary, and is entitled to participate in the employee benefit plans and arrangements that we generally maintain for our senior executives. The employment agreements also contain severance provisions which are described under the heading “—Potential Payments Upon a Termination or Change in Control” and covenants intended to protect against the disclosure of confidential information during and followingemployment, as well as restrictions on engaging in competition with our company or otherwise interfering with our business relationships, which extend through the one-year anniversary of an executive’s termination of employment for any reason. With respect to certain executives, the employment agreements provide for certain limited additional benefits, which are described in more detail under the heading “—Perquisites and Personal Benefits.”
Tornier SAS, our French operating subsidiary, is a party to an employment agreement with Mr. Epinette, which does not have a specified term, but which may be terminated by either party in accordance with local law, and which is substantially similar to the employment agreements described above with respect to base salary, annual target bonus, benefit participation and non-compete obligations. Pursuant to the agreement and French labor laws, Mr. Epinette is entitled to receive certain payments and benefits following a voluntary or involuntary termination of employment, which are described under the heading “—Potential Payments Upon a Termination or Change in Control.”
Equity and Non-Equity Incentive Compensation. During 2013, our named executive officers received grants of stock options and stock awards under our stock incentive plan. These grants and our stock incentive plan are described in more detail under the headings “Compensation Discussion and Analysis” and “—Grants of Plan-Based Awards.” Our named executive officers also received annual cash incentive bonuses under our corporate performance incentive plan for their 2013 performance. In addition, Mr. Epinette will receive an annual cash incentive bonus in mid-2014 under our French incentive compensation scheme for 2013 performance. The bonus amounts and these plans are described in more detail under the headings “Compensation Discussion and Analysis” and “—Grants of Plan-Based Awards.”
Contingent Sign-On and Other Discretionary Bonuses.During 2013, we paid an $80,000 sign-on bonus to Mr. Van Ummersen that is contingent upon his employment for at least one year. The only other discretionary bonuses that we paid during 2013 were a €31,944 discretionary bonus to Mr. Epinette to recognize the performance of our international business during 2013 and a €21,000 discretionary bonus to Mr. Epinette to recognize the performance of our international business during the first quarter of 2013.
Retirement Benefits. Under the Tornier, Inc. 401(k) Plan, participants, including our named executive officers, other than Mr. Epinette, may voluntarily request that we reduce his or her pre-tax compensation and contribute such amounts to the 401(k) plan’s trust up to certain statutory maximums. We contribute matching contributions in an amount equal to 3% of the participant’s eligible earnings for a pay period, or if less, 50% of the participant’s pre-tax 401(k) contributions (other than catch-up contributions) for that pay period. Mr. Epinette participates in our French operating subsidiary’sgovernment-mandated pension plan,government-mandated pension plan for managerial staff, the Retraite Complémentaire, and defined contribution pension plan for key employees, the Retraite Supplémentaire, in each case on the same basis as other key employees of our French operating subsidiary. In 2013, pursuant to the Retraite Supplémentaire, our French operating subsidiary made contributions equal to approximately 6.5% of Mr. Epinette’s base salary on Mr. Epinette’s behalf. The Retraite Supplémentaire is intended to supplement the state pension plans mandated by French labor laws and to provide
such individualsparticipants with astake inform of compensation that is efficient with respect to income tax and mandated social contributions. Except for ourfuture which correspondsFrench operating subsidiary’s government-mandated pension plan and a government-mandated pension plan for managerial staff, we do not provide pension arrangements or post-retirement health coverage for our employees, including our named executive officers. We also do not provide any nonqualified defined contribution or other deferred compensation plans.Perquisites and Personal Benefits. With respect to perquisites and personal benefits, during 2013, we provided a $3,000 monthly housing stipend for Mowry through July 2013, a $2,500 temporary living stipend for Mr. Van Ummersen and an automobile allowance for Mr. Epinette. The only other benefits that our named executive officers receive are benefits that are also received by our other employees, including the retirement benefits described above, an ability to purchase our ordinary shares at a discount with payroll deductions under our employee stock purchase plan and medical, dental, vision and life insurance benefits.
Indemnification Agreements. We have entered into indemnification agreements with all of our named executive officers. The indemnification agreements are governed by the laws of the State of Delaware (USA) and provide, among other things, for indemnification to the
stakefullest extent permitted by law and our articles ofeachassociation against any and all expenses (including attorneys’ fees) and liabilities, judgments, fines and amounts paid in settlement actually and reasonably incurred by the executive or on his or her behalf in connection with such action, suit or proceeding and any appeal therefrom. We will be obligated to pay these amounts only if the executive acted in good faith and in a manner he or she reasonably believed to be in or not opposed to the best interests of ourshareholders atcompany, and, with respect to any criminal action, suit or proceeding, had no reasonable cause to believe his or her conduct was unlawful. The indemnification agreements provide that theoutset of their employment. Our stock option plan provides that, except as may otherwiseexecutive will not bedeterminedindemnified and advanced expenses (i) with respect to an action, suit or proceeding initiated by theboard of directors, options vest over a four-year period, with 25% vesting on the first anniversary of the applicable vesting commencement date and the remaining 75% vesting on a pro-rata basis on each quarterly anniversary of the applicable vesting commencement date over the three-year period thereafter. Option holders willforfeit their outstanding options to the extent they, as determinedexecutive unless so authorized by our board of directorsengageor (ii) with respect to any action, suit or proceeding instituted by the executive to enforce or interpret the indemnification agreement unless the executive is successful incompetitive activities (as definedestablishing a right to indemnification in such action, suit or proceeding, in whole or in part, or unless and to thestock option plan) duringextent that thecourse of their employmentcourt in such action, suit orduringproceeding determines that, despite thesix-month period following their termination. Additionally, on February 2, 2011,executive’s failure to establish thestock option plan was amendedright toprovideindemnification, he or she is entitled to indemnity for such expenses. The indemnification agreement also set forth procedures that apply in the event of achange in control occurs, unless otherwise provided by our compensation committee, any outstandingclaim for indemnification.Grants of Plan-Based Awards
The table below provides information concerning grants of plan-based awards
whether vested or unvested, will be accelerated asto each ofthe consummation of the change in control. We believe that granting options subject to the vesting schedule described above provides us with an effective mechanism to incentivize and to retainour named executive officers during the year ended December 29, 2013. Non-equity incentive plan-based awards were granted to our named executive officers under our corporate performance incentive plan, and in the case of Mr. Epinette, our French incentive compensation scheme. Stock awards and option awards were granted under our stock incentive plan. The material terms of these awards and the material plan provisions relevant toalign their interest withthese awards are described in thelong-term interestsnotes to the table below or in the narrative following the table below. We did not grant any “equity incentive plan” awards within the meaning of the SEC rules during the year ended December 29, 2013.GRANTS OF PLAN-BASED AWARDS – 2013
Board Estimated future payouts under
non-equity incentive plan awards(2)All other
stock
awards:number of
shares ofAll other
option
awards:number of
securities
Exercise
or baseprice of
option
Grant date
fair valuestock and
Name
Grant
dateapproval
date(1)Threshold(3)
($)Target
($)Maximum(4)
($)stock or
units(5) (#)underlying
options(6) (#)awards
($/Sh)Option
awards(7) ($)David H. Mowry
Cash incentive award
N/A 02/12/13 35,547 355,467 497,654 Stock option
02/26/13 02/12/13 17,466 17.28 138,284 Stock grant
02/26/13 02/12/13 7,982 137,929 Stock option
08/09/13 08/01/13 61,057 19.45 551,638 Stock grant
08/09/13 08/01/13 28,269 549,829 Shawn T McCormick
Cash incentive award
N/A 02/12/13 17,721 177,206 248,088 Stock option
08/09/13 08/01/13 26,745 19.45 241,636 Stock grant
08/09/13 08/01/13 12,383 240,848 Gordon W. Van Ummersen
Cash incentive award
N/A 06/10/13 9,816 98,157 137,420 Stock option
08/09/13 08/01/13 52,765 19.45 476,721 Stock grant
08/09/13 08/01/13 24,430 475,161 Stéphan Epinette
Cash incentive award
N/A 02/12/13 12,903 129,027 180,637 French incentive comp. scheme award
N/A 06/29/13 806 24,584 24,584 Stock option
08/09/13 08/01/13 23,192 19.45 209,535 Stock grant
08/09/13 08/01/13 10,738 208,853 Terry M. Rich
Cash incentive award
N/A 02/12/13 26,912 269,117 376,764 Stock option
08/09/13 08/01/13 27,108 19.45 244,915 Stock grant
08/09/13 08/01/13 12,551 244,116 (1) With respect to stock awards and option awards, the grant date was not necessarily the board approval date since the grant date was the third full trading day after the public release of our then most recent financial results. With respect to newly hired officers, the grant date may be the first day of their employment. (2) Represents amounts payable under our corporate performance incentive plan for 2013, which was approved by our board of directors on February 12, 2013. The threshold, target and maximum estimated future payouts for Mr. Van Ummersen have been prorated to reflect his June 10, 2013 start date. In addition, for Mr. Epinette, also represents amounts payable under our French operating subsidiary’s incentive compensation scheme governed by an agreement entered into by our French operating subsidiary on June 29, 2013. The foreign currency exchange rate of 1.3277 U.S. dollars for 1 Euro, which reflects an average conversion rate for 2013, was used to calculate Mr. Epinette’s threshold, target and maximum awards. The actual amounts paid under the corporate performance incentive plan and French incentive compensation scheme are reflected in the “Non-equity incentive compensation” column of the Summary Compensation Table. (3) The threshold amount for awards payable under our corporate performance incentive plan and our French operating subsidiary’s incentive compensation scheme assumes the satisfaction of the threshold level of the lowest weighted financial performance goal. (4) Maximum amounts reflect payout of the portion of our annual cash incentive bonus tied to corporate financial performance goals at a maximum rate of 150% of target and the portion of our annual cash incentive bonus tied to individual performance goals at a rate of 100% of target under our corporate performance incentive plan. Target and maximum payout amounts are the same for purposes of our French incentive compensation scheme. (5) Represents stock grants in the form of restricted stock units granted under our stock incentive plan. The restricted stock units vest and become issuable over time, with the last tranche becoming issuable on June 1, 2017, in each case, so long as the individual remains an employee or consultant of our company. (6) Represents options granted under our stock incentive plan. All options have a ten-year term and vest over a four-year period, with 25% of the underlying shares vesting on the one-year anniversary of the grant date and the remaining 75% of the underlying shares vesting over a three-year period thereafter in 12 as nearly equal as possible quarterly installments. (7) We refer you to notes (3) and (4) to the Summary Compensation Table for a discussion of the assumptions made in calculating the grant date fair value of stock awards and option awards. Tornier N.V. Corporate Performance Incentive Plan. Under the terms of the Tornier N.V. Corporate Performance Incentive Plan, our named executive officers, as well as other employees of our
shareholders.company, earn annual cash incentive bonuses based on our financial performance and individual objectives. The material terms of the plan are described in detail under the heading “Compensation Discussion and Analysis—Short-Term Cash Incentive Compensation.”For more informationFrench Performance Incentive Compensation Scheme. Under the terms of the Tornier SAS Performance Incentive Compensation Scheme, Mr. Epinette, as well as other executives of our company who are employed by our French operating subsidiary, earn annual cash incentive bonuses based on our financial performance and thestock optionfinancial performance of our French operating subsidiary. The material terms of the planseeare described in detail under thediscussion below under "Narrative Disclosure to Summary Compensation Tableheading “Compensation Discussion andGrant of Plan-Based Awards Table—Stock OptionAnalysis—Short-Term Cash Incentive Compensation.”Tornier N.V. 2010 Incentive Plan.
"Stock Incentive PlanAt our general meeting of shareholders on August 26, 2010, our shareholders approved
a newthe Tornier N.V. 2010 Incentive Plan, which we refer to as our stock incentive plan,that will afford more flexibility to our compensation committee in 2011 by allowing grantswhich permits the grant of a wide variety of equity awards to our employees, including ournamed executive officers,employees, directors and consultants, including incentive and non-qualified options, stock appreciation rights, stock grants, stock unit grants, cash-based awards and otherstock basedstock-based awards.TheOur stock incentive plan is designed to assist us in attracting and retaining our employees, directors and consultants,toprovide an additional incentive to such individuals to work to increase the value of our ordinary shares, andtoprovide such individuals with a stake in our future which corresponds to the stake of each of our shareholders.AsOur shareholders approved an amendment to the stock incentive plan on June 27, 2012 to increase the number ofFebruary 2, 2011, we ceased making grantsordinary shares available for issuance underour stock optionthe plan. The stock incentive plan, as amended, reserves for issuance a number of ordinary shares equal to the sum of (i) the number of ordinary shares available for grant undertheour prior stock option plan as of February 2, 2011 (not including issued or outstanding shares granted pursuant to options undertheour prior stock option plan as of such date)and; (ii) the number of ordinary shares forfeited upon the expiration, cancellation, forfeiture, cash settlement or other termination following February 2, 2011 of an option outstanding as of February 2, 2011 undertheour prior stock optionplan.plan; and (iii) 2.7 million. As ofFebruary 2, 2011, 1,199,296December 29, 2013, 2.1 million ordinary shares remained available for grant under the stockoptionincentive plan, and there were3,747,8883.2 million ordinary shares covering outstanding awards under such plan as of such date. For purposes of determining the remaining ordinary shares available for grant under the stock incentive plan, to the extent that an award expires or is cancelled, forfeited, settled in cash, or otherwise terminated without a delivery to the participant of the full number of ordinary shares to which the award related, the undelivered ordinary shares will again be available for grant. Similarly, ordinary shares withheld or surrendered in payment of an exercise price or taxes relating to an award under the stock incentive planshallwill be deemed to constitute shares not delivered to the participant andshallwill be deemed to again be available for awards under the stock incentive plan. The total number of ordinary shares available for issuance under the stock incentive planwill beand the number of ordinary shares subject to outstanding awards are subject to adjustment in the event of any reorganization, merger, consolidation, recapitalization, liquidation, reclassification, stock dividend, stock split, combination of shares, rights offering, divestiture or extraordinary dividend (including a spin off) or any other similar change in our corporate structure or ordinary shares.TheOur board of directors has the ability to amend the stock incentive planprovidesor any awards granted thereunder at any time, provided that, certain amendments are subject to approval by our shareholders and subject to certain exceptions, no amendment may adversely affect any outstanding award without the consent of the affected participant. Our board of directors also may suspend or terminate the stock incentive plan at any time, and, unless sooner terminated, the stock incentive plan will terminate on August 25, 2020.Under the terms of the stock incentive plan, stock options must be granted with a per share exercise price equal to at least 100% of the fair market value of an ordinary share on the grant date. For purposes of the plan, the fair market value of our ordinary shares is the closing sale price of our ordinary shares, as reported by the NASDAQ Global Select Market. We set the per share exercise price of all stock options granted under the plan at an amount at least equal to 100% of the fair market value of our ordinary shares on the grant date. Options become exercisable at such times and in such installments as may be determined by our board of directors or compensation committee, provided that most options may not be exercisable after 10 years from their grant date. The vesting of our stock options is generally time-based and is as follows: 25% of the shares underlying the stock option vest on the one-year anniversary of the grant date and the remaining 75% of the underlying shares vest over a three-year period thereafter in 12 as nearly equal as possible quarterly installments, in each case so long as the individual remains an employee or consultant of our company.
Currently, optionees must pay the exercise price of stock options in cash, except that our compensation committee may allow payment to be made (in whole or in part) by a “cashless exercise” effected through an unrelated broker through a sale on the open market, by a “net exercise” of the option, or by a combination of such methods. In the case of a “net exercise” of an option, we will not require a payment of the exercise price of the option from the grantee but will reduce the number of ordinary shares issued upon the exercise by the largest number of whole shares that has a fair market value that does not exceed the aggregate exercise price for the shares exercised under this method.
Under the terms of the grant
of both incentivecertificates under which stock options have been granted to the named executive officers, if an executive’s employment or service with our company terminates for any reason, the unvested portion of the option will immediately terminate and the executive’s right to exercise the then vested portion of the option will: (i) immediately terminate if the executive’s employment or service relationship with our company terminated for cause; (ii) continue for a period of one year if the executive’s employment or service relationship with our company terminated as a result of his or her death or disability; or (iii) continue for a period of 90 days if the executive’s employment or service relationship with our company terminated for any reason, other than for cause or upon death or disability.Stock grants under the plan are made in the form of restricted stock units and assuming the recipient continuously provides services to our company (whether as an employee or as a consultant) typically vest and the ordinary shares underlying such grants are issued over time. The specific terms of vesting of a stock grant depends upon whether the award is a performance recognition grant, talent acquisition grant, special recognition grant or discretionary grant. Performance recognition grants are typically made in mid-year and vest, or become issuable, in four as nearly equal as possible annual installments on June 1st of each year. Promotional performance recognition grants and talent acquisition grants granted to promoted employees and new employees and special recognition grants vest in a similar manner, except that the first installment is pro-rated, depending upon the grant date. Grants also may vest upon the achievement of certain financial performance goals, such as those based on revenue, expenses, profitability, productivity, cash flows, asset utilization, shareholder return, share price and other similar financial performance measures, or individual performance goals.
As a condition of receiving stock options or stock grants, recipients, including our named executive officers, must agree to pay all applicable tax withholding obligations in connection with the awards. With respect to stock grants, our executives must agree to pay in cash all applicable tax withholding obligations, or alternatively, may give instructions to and authorization any brokerage firm determined acceptable to us for such purpose to sell on the executive’s behalf that number of ordinary shares issuable upon vesting of the stock grant as we determine to be appropriate to generate cash proceeds sufficient to satisfy any applicable tax withholding obligation.
As described in more detail under the heading “—Potential Payments Upon Termination or Change in Control,” if a change in control of our company occurs, then, under the terms of our stock incentive plan, all outstanding options become immediately exercisable in full and remain exercisable for the remainder of their terms and all issuance conditions on all outstanding stock grants will be deemed satisfied; provided, however, that if any such issuance condition relates to satisfying any performance goal and there is a target for the goal, the issuance condition will be deemed satisfied generally only to the extent of the stated target.
Outstanding Equity Awards at Fiscal Year-End
The table below provides information regarding unexercised stock options and stock awards that have not vested for each of our named executive officers that remained outstanding at our fiscal year-end, December 29, 2013. We did not have any “equity incentive plan” awards within the meaning of
Section 422(b)the SEC rules outstanding at December 29, 2013.OUTSTANDING EQUITY AWARDS AT FISCAL YEAR-END – 2013
Option awards Stock awards Name
Number of securities
underlying
unexercised options
(#)
exercisableNumber of securities
underlying
unexercised options (#)
unexercisable(1)Option
exercise
price ($)Option
expiration
date(2)Number of
shares or units
of stock that
have not
vested(3) (#)Market value of
shares or units
that have not
vested(4) ($)David H. Mowry
27,275 7,301
21,215 16,064
23.61 18.04
08/12/2021 08/10/2022
— 17,466 17.28 02/26/2023 — 61,057 19.45 08/09/2023 54,014 987,916 Shawn T McCormick
13,326 29,319 18.15 09/04/2022 — 26,745 19.45 08/09/2023 28,252 516,729 Gordon W. Van Ummersen
— 52,765 19.45 08/09/2023 24,430 446,825 Stéphan Epinette
66,666 — 16.98 05/01/2019 31,246 2,087 22.50 02/01/2020 11,191 6,719 27.31 12/01/2020 5,469 12,032 18.22 02/28/2022 — 23,192 19.45 08/09/2023 22,146 405,050 Terry M. Rich
24,364 31,326 23.36 03/12/2022 4,513 9,930 18.04 08/10/2022 — 27,108 19.45 08/09/2023 30,765 562,692 (1) All stock options vest over a four-year period, with 25% of the underlying shares vesting on the one-year anniversary of the grant date and the remaining 75% of the underlying shares vesting over a three-year period thereafter in 12 as nearly equal as possible quarterly installments, in each case so long as the individual remains an employee or consultant of our company. If a change in control our company occurs, all outstanding options become immediately exercisable in full and remain exercisable for the remainder of their terms. For more information, we refer you to the discussion under the heading “—Potential Payments Upon Termination or Change in Control.” (2) All option awards have a 10-year term, but may terminate earlier if the recipient’s employment or service relationship with our company terminates. (3) The release dates and release amounts for the unvested stock awards are as follows: Name
June 1, 2014 August 28, 2014 June 1, 2015 June 1, 2016 June 1, 2017 Mr. Mowry
17,273 — 17,275 12,398 7,068 Mr. McCormick
8,384 — 8,385 8,387 3,096 Mr. Van Ummersen
5,089 — 6,447 6,447 6,447 Mr. Epinette
4,389 3,999 6,389 4,684 2,685 Mr. Rich
11,418 — 11,420 4,789 3,138 �� If a change in control of our company occurs, all issuance conditions on all outstanding stock grants will be deemed satisfied; provided, however, that if any such issuance condition relates to satisfying any performance goal and there is a target for the goal, the issuance or condition will be deemed satisfied generally only to the extent of the
Internal Revenue Codestated target.(4) The market value of stock grants that had not vested as of December 29, 2013 is based on the per share closing sale price of our ordinary shares, as reported by the NASDAQ Global Select Market, on the last trading day of our fiscal year end, December 27, 2013 ($18.29). Options Exercised and Stock Vested During Fiscal Year
The table below provides information regarding stock options that were exercised by our named executive officers and stock awards that vested for each of
1986, as amended,our named executive officers during the fiscal year ended December 29, 2013.Option awards(1) Stock awards(2) Name
Number of shares
acquired
on exercise
(#)Value
realized
on exercise
($)Number of shares
acquired
on vesting
(#)Value
realized on
vesting
($)David H. Mowry
Stock options
— — Restricted stock units
7,546 119,151 Shawn T McCormick
Stock options
— — Restricted stock units
3,662 57,823 Gordon W. Van Ummersen
Stock options
— — Restricted stock units
— — Stéphan Epinette
Stock options
— — Restricted stock units
3,410 53,844 Terry M. Rich
Stock options
— — Restricted stock units
8,281 130,757 (1) The number of shares acquired upon exercise reflects the gross number of shares acquired absent netting for shares surrendered to pay the option exercise price and/or satisfy tax withholding requirements. The value realized on exercise represents the gross number of shares acquired on exercise multiplied by the market price of our ordinary shares on the exercise date, as reported by The NASDAQ Global Select Market, less the per share exercise price. (2) The number of shares acquired upon vesting reflects the gross number of shares acquired absent netting of shares surrendered or sold to satisfy tax withholding requirements. The value realized on vesting of the restricted stock unit awards held by each of the named executive represents the gross number of ordinary shares acquired, multiplied by $15.79 per share, the closing sale price of our ordinary shares, as reported by The NASDAQ Global Select Market, on May 31, 2013, the last trading day prior to the vesting date. Potential Payments Upon a Termination or Change in Control
Severance Arrangements – Generally. Tornier Inc., our primary U.S. operating subsidiary, is a party to employment agreements with each of our named executive officers, except Mr. Epinette, which agreements provide for certain severance protections. Under such agreements, if the executive’s employment is terminated by Tornier, Inc. without “cause” (as such term is defined in the employment agreements), in addition to any accrued but unpaid salary and
non-qualified stock options. The stock incentive planbenefits through the date of termination, the executive will be entitled to base salary and health and welfare benefit continuation for 12 months following termination, and, in the event the executive’s employment is terminated without cause due to non-renewal of the employment agreements by Tornier, Inc., the executive alsopermitswill be entitled to a payment equal to his or her pro rata annual bonus for thegrantyear ofordinary shares subjecttermination.Tornier SAS, our French operating subsidiary, is a party to
vesting restrictions, stock unit grants,an employment agreement with Mr. Epinette, whichrepresentagreement provides for certain protections. Pursuant to therightagreement and French labor laws, Mr. Epinette is entitled to receivecash based on the valuecertain payments and benefits following a voluntary or involuntary termination ofordinary shares in the future, stock appreciation rights grants, which are rights to receiveemployment, including an amount equal to 12 months’ gross monthly salary, which is payable as consideration for thevaluerestrictive covenants contained in the agreement, a payment equal to Mr. Epinette’s French incentive compensation scheme payment for the year of his termination and, in the case of an involuntary termination of employment, a severance payment payable pursuant to French law, the amount of which is determined based on Mr. Epinette’s gross monthly salary and years of service with Tornier SAS. Pursuant to French law, gross monthly salary represents the average salary Mr. Epinette received during the 12-month period preceding his termination and includes the amount of any annual cashorincentive bonus payable to Mr. Epinette during such period pursuant to our annual cash incentive bonus program.Change in
ordinary sharesControl Arrangements – Generally. Under the terms of theappreciationemployment agreements Tornier Inc. has entered into with Mr. Mowry, Mr. McCormick, Mr. Van Ummersen and Mr. Rich, in theordinary shares overevent the executive’s employment is terminated without cause or by the executive for “good reason” (as such term is defined in the employment agreements) within 12 months following aspecified period,change in control, the executive will be entitled to receive accrued but unpaid salary andgrantsTablebenefits through the date ofContentstermination, a lump sum payment equal to his base salary plus target bonus for the year of termination, health and welfare benefit continuation for 12 months following termination and accelerated vesting of all unvested options and stock grants.
Under the terms of the employment agreement between Tornier SAS and Mr. Epinette, if Mr. Epinette is terminated for reasons other
awards that may be denominated in, payable in, valued in wholethan negligence orin part by reference to or otherwise based on or related to our ordinary shares.In the event ofserious misconduct following a change in control (as such term is defined in thestockemployment agreement), he is entitled to gross monthly salary continuation and health and welfare benefit continuation for 12 months following termination of employment, accelerated vesting of all unvested options, as well as a payment equal to Mr. Epinette’s annual target bonus and French incentiveplan), unless otherwise provided bycompensation scheme payment for thecompensation committee,year of his termination. Pursuant to French law, gross monthly salary represents the average salary Mr. Epinette received during the 12-month period preceding his termination and includes the amount of anyoutstanding awards, whether vested or unvested, will be accelerated as of the consummation ofannual cash incentive bonus payable to Mr. Epinette during such period pursuant to our annual cash incentive bonus program.In addition to the change in
control.control severance protections provided in the employment agreements with our executives, our prior stock option plan and our current stock incentive plan under which stock options and stock grants have been granted to our named executive officers contain “change in control” provisions. Under our prior stock option plan and current stock incentive plan, if there is a change in control of our company, then, all outstanding options become immediately exercisable in full and remain exercisable for the remainder of their terms and all issuance conditions on all outstanding stock grants will be deemed satisfied; provided, however, that if any such issuance condition relates to satisfying any performance goal and there is a target for the goal, the issuance condition will be deemed satisfied generally only to the extent of the stated target. Alternatively, the compensation committee may determine that outstanding awards will be cancelled as of the consummation of the change in control and that holders of cancelled awards will receive a payment in respect of such cancellation based on the amount ofper-shareper share consideration being paid in connection with the change in control less, in the case of options and other awards subject to exercise, the applicable exercise price.Our board of directors has the ability to amend theA “change in control” under our current stock incentive planor any awards granted thereunder at any time, provided that no amendment will be made that impairs the rights of the holder of any award. Our board of directors may also suspend or terminate the stock incentive plan at any time, and, unless sooner terminated, the stock incentive plan shall terminate on the day before the tenth (10th) anniversary of the date the stock incentive plan was adopted by our shareholders.Employee Stock Purchase Planmeans:Atthe acquisition (other than from Tornier) by any person, entity or group, subject to certain exceptions, of 50% or more of either ourgeneral meeting of shareholders on October 28, 2010, our shareholders approved a new employee stock purchase plan that will provide our employees, including our named executive officers, and employees of certain designated subsidiaries with an opportunity to purchase ourthen-outstanding ordinary sharesat a discount on a tax-qualified basis through payroll deductions in 2011. The employee stock purchase plan has been designed to qualify as an "employee stock purchase plan" under Section 423or the combined voting power ofthe U.S. Internal Revenue Code.A total of 333,333our then-outstanding ordinary shareshave been reserved for issuance underor theemployeecombined voting power of our then-outstanding capital stockpurchase plan, subjectentitled toadjustmentvote generally in theeventelection ofcertain changes in our corporate structure or ordinary shares. The employee stock purchase plan providesdirectors;the “continuity directors” cease forconsecutive offering periods, during which participating employees may electany reason tohave between 1% and 10% of their compensation withheld and applied to the purchase of ordinary sharesconstitute atthe end of the period. Unless otherwise determined by our compensation committee before an offering period, the purchase price will be 85% of the fair market value of the ordinary shares at the end of the offering period.The stock purchase plan is administered by our compensation committee. Our board of directors has the ability to suspend, terminate, or amend the employee stock purchase plan at any time, although the board of directors generally may not amend the employee stock purchase plan in suchleast away that would adversely affect the rights of any participating employee without that employee's consent or shareholder approval. Unless sooner terminated, the employee stock purchase plan will terminate on the day before the tenth (10th) anniversary of the date the employee stock purchase plan is approved by the board.Retirement BenefitsIn 2010, each of our named executive officers had the opportunity to participate in retirement plans maintained by our operating subsidiaries, including our U.S. operating subsidiary's 401(k) plan and, with respect to Mr. Epinette, our French operating subsidiary's government-mandated pension plan and a government-mandated pension plan for managerial staff, or the Retraite Complémentaire, on the same basis as our other employees. We believe that these plans provide an enhanced opportunity for our named executive officers to plan for and meet their retirement savings needs. Mr. Epinette also participated in our French operating subsidiary's defined contribution pension plan for key employees, or the Retraite Supplémentaire on the same basis as other key employees. In 2010, pursuant to the Retraite Supplémentaire, our French operating subsidiary made contributions equal to approximately 6.5% of Mr. Epinette's base salary on Mr. Epinette's behalf. The RetraiteSupplémentaire is intended to supplement the state pension plans mandated by French labor laws and to provide participants with a form of compensation that is efficient with respect to income tax and mandated social contributions.Perquisites and Other BenefitsIn 2010, our named executive officers were eligible to receive the same benefits, including life and health benefits, that were available to all employees. We also provided certain additional perquisites to our named executive officers, on a case-by-case basis, including relocation and automobile allowances. We paid for Ms. Diersen's moving and temporary housing expenses associated with her relocation upon joining the Company, which we believed were a necessary inducement for her to join the Company. We also provide Mr. Epinette with an automobile allowance on the same basis as other key employees of our French operating subsidiary pursuant to a Company policy, which we believe is necessary in light of the competitive market for talent in our industry.Employment/Severance, Non-Competition and Non-Solicitation AgreementsEach of our named executive officers is entitled to receive severance benefits upon certain qualifying terminations of employment, pursuant to the provision of such executive's employment agreement. Additionally, pursuant to their agreements, each of our named executive officers is entitled to receive certain enhanced severance benefits upon certain qualifying terminations of employment occurring within twelve months of a Change in Control (as such term is defined in the employment agreements). These severance arrangements were initially offered to induce the named executive officers to accept or continue employment with the Company and are primarily intended to retain our named executives, provide consideration to an executive for certain restrictive covenants that apply following a termination of employment and to provide continuity of management in connection with a threatened or actual Change in Control transaction. Additionally, we entered into the employment agreements because they provide us valuable protection by subjecting the named executive officers to restrictive covenants that prohibit the disclosure of confidential information during and following their employment and limit their ability to engage in competition with us or otherwise interfere with our business relationships following their termination of employment. For more information on our employment agreements and severance arrangements with our named executive officers, see the discussions below under "Narrative Disclosure to Summary Compensation Table and Grant of Plan-Based Awards Table—Employment Agreements" and "Potential Payments Upon a Termination or Change in Control."In connection with his termination of employment, which became effective on February 19, 2010, Mr. Doty and our U.S. operating subsidiary entered into a separation agreement pursuant to which, in exchange for his execution of a general release, Mr. Doty became entitled to the severance payments and benefits described below under "Narrative Disclosure to Summary Compensation Table and Grant of Plan-Based Awards Table—Separation Agreement with Michael Doty."Compensation Risk ManagementRisk ManagementOur board of directors has reviewed our overall compensation policies and practices to determine whether those policies and practices are reasonably likely to have a material adverse effect on us andhas concluded that they are not reasonably likely to have a material adverse effect on us based on the following analysis:Base CompensationBase compensation is a fixed portion of overall compensation that is set based on factors such as the scope of an employee's responsibilities and market practices, and which provides income regardless of our short-term performance. Our board of directors does not believe that base compensation creates an incentive for our employees to take undue risks.Bonus ProgramsBonuses are intended to compensate our employees for achieving corporate performance goals and individual performance goals. We maintain several incentive compensation programs, including our annual bonus program and an incentive compensation scheme for the benefit of employees of our French operating subsidiary, which is maintained in accordance with French labor laws. Our bonus programs are designed to focus employees on achieving annual goals that are important to our success. The fact that bonuses are awarded based on the achievement of corporate performance goals may encourage some risk-taking behavior, but this risk is mitigated by the fact that awards are based on the achievement of a balanced mix of several broad-based criteria. Additionally, in the case of our annual bonus program, a portion of the annual bonus is awarded based on the achievement of qualitative individual performance goals, and in the case of our French incentive compensation scheme, payments are limited by local law and generally do not represent a significant portion of our employees' total compensation. For these reasons, our board of directors believes that our bonus programs appropriately balance risk and reward, and do not encourage employees to take unnecessary or excessive risks which could have a material adverse effect on us.Long-Term Equity CompensationWe award certain employees equity compensation in the form of options in an effort to align the equity ownership of employees with the long-term interests of our shareholders. Our board of directors believes that long-term equity compensation discourages our employees from engaging in unnecessary or excessive risk taking, because the ultimate value of the equity awards, which are subject to four-year vesting schedules, is determined based on the long-term appreciation in value of our shares.Retirement, Health, and Other Welfare BenefitsOur employees are eligible to participate in retirement plans maintained by us and by our operating subsidiaries abroad. Our board of directors does not believe that such programs encourage our employees to take unnecessary or excessive risks which could have a material adverse effect on us, because they represent a small portion of overall compensation, are unrelated to our short-term performance, and are generally limited by local laws. Our board of directors does not believe that the health and welfare benefits we provide to our employees create an incentive for our employees to take undue risks, because the value of these benefits is unrelated to our short-term performance.Severance BenefitsOur executive officers and our employees are eligible to receive severance payments and benefits upon certain terminations of employment pursuant to their employment agreements, our severance policy, or severance policies maintained by our operating subsidiaries abroad in accordance with local laws, which payments and benefits are limited by the terms of such applicable agreements, policies, and laws. Our board of directors does not believe that our severance policies and practices create an incentive for our employees to take undue risks.PerquisitesWe provide our executive officers and certain other employees with perquisites, including, in the case of Mr. Epinette, an automobile allowance. Our board of directors does not believe that the perquisites we provide are excessive, or that they encourage employees to take unnecessary or excessive risks.After considering the risk implications of each element of our overall compensation program, our board of directors determined that the only components of employee compensation that could pose risks are the annual bonus program and the incentive programs. These programs encourage some level of risk taking by our employees; however, we believe that the risk is well managed and the level of risk acceptable, particularly in light of the balanced mix of fixed and variable elements, and of short- and long-term elements, in our overall compensation program. For these reasons, our board of directors concluded that our overall compensation policies and practices are not likely to have a material adverse effect on us.Executive CompensationThe following table shows compensation of our principal executive officer, our principal financial officers and other named executive officers for the fiscal years ending December 27, 2009 and January 2, 2011.Name and principal positionYear Salary
($)Option
awards(2)($)Non-equity
incentive plan
compensation
($)All other
compensation
($)Total
($)Douglas W. Kohrs
2010 490,333 (1) 913,625 236,994 (3) 0 1,640,952 President, Chief Executive
2009 477,210 478,661 289,189 0 1,245,060 Officer and Director(4)
Michael J. Doty(4)
2010 44,315 191,960 (6) 0 (3) 283,795 (5) 520,070 Former Global Chief Financial Officer
2009 315,667 119,665 131,317 0 566,649 Carmen L. Diersen(4)
2010 172,500 1,711,935 70,691 (3) 184,866 (9) 2,139,992 Global Chief Financial Officer
Andrew E. Joiner
2010 327,417 456,825 130,901 (3) 6,701 921,844 Vice President and General
2009 304,500 239,330 156,818 0 700,648 Manager, U.S. Commercial
Operations
Stéphan Epinette(7)
2010 278,171 365,450 67,974 (3) 95,847 (8) 807,442 Vice President, International
2009 278,866 478,661 109,667 78,418 945,612 Commercial Operations
Kevin M. Klemz(4)
2010 81,865 899,925 26,839 (3) 0 1,008,629 Vice President, Chief Legal Officer and Secretary
(1)Effective as of August 26, 2010, five percent of Mr. Kohrs's annual base salary was allocated to his service as a membermajority of our board ofdirectors.(2)The amounts showndirectors;
consummation of a reorganization, merger or consolidation, inthe "Option Awards" column represent the aggregate grant date fair value of equity awards granted in 2009 and 2010, respectively, computed in accordance with FASB ASC Topic 718. The fair value ofeachoption grant is estimated on the date of grant using theBlack-Scholes option pricing model using the following weighted-average assumptions for options granted to all employees:2009 2010 Risk-free interest rate
1.8 % 2.26 % Expected life in years
6.0 5.8 Expected volatility
41.8 % 49.8 % Expected dividend yield
0.0 % 0.0 % (3)Reflects the amount of annual incentive bonuses paid to our named executive officers in respect of 2010 performance, but paid in February 2011. Mr Epinette's annual incentive bonus was calculated using a base salary of $275,303, instead of the $278,171 reported in the Summary Compensation Table, as the amount of base salary reported in the Summary Compensation Table includes approximately $2,868 relating to Mr. Epinette' company car and vacation allowances that are otherwise includible in Mr. Epinette's gross taxable income pursuant to French tax law. For Mr. Epinette, the bonus payable pursuant to the French incentive compensation scheme based on 2010 performance is not currently calculable, but is expected to be determined during the third quarter of 2011, at which time such amounts will be disclosed under Item 5.02(f) on Form 8-K. As a result of his termination of employment, Mr. Doty was not eligible to receive an annual incentive bonus based on 2010 performance.(4)Mr. Doty's tenure as Chief Financial Officer of Tornier, Inc. terminated as of February 19, 2010. Ms. Diersen joined the Company on June 21, 2010. Mr. Kohrs served as the Company's principal financial officer during the period between Mr. Doty's departure and Ms. Diersen joining the Company. Mr. Klemz joined the Company on September 13, 2010.(5)Reflects severance payments of $271,352, which represents the cost of base salary continuation through January 2, 2011, and benefits of $12,443, which represents the cost of continued coverage on our health plans though January 2, 2011, payable to Mr. Doty in connection with his termination of employment.(6)Reflects the incremental fair value, computed as of February 19, 2010, in accordance with FASB ASC Topic 718,case, with respect tothe extensionwhich persons who were our shareholders immediately prior to such reorganization, merger or consolidation do not, immediately thereafter, own more than 50% of theexercise period applicablecombined voting power entitled toMr. Doty's vested, unexercised equity awards. The incremental fair valuevote generally in the election of directors of the then-outstanding voting securities of the reorganized, merged, consolidated, or other surviving corporation (or its direct or indirect parent corporation);
approval by our shareholders of a liquidation or dissolution of our company; orthe consummation of the sale of all or substantially all of our assets with respect tothe modified options was estimated on the modification date using the Black-Scholes option pricing model using the following weighted-average assumptions:Risk-free interest rate0.4%Expected life in years1.5Expected volatility55%Expected dividend yield0.0%(7)Mr. Epinette's cash compensation was paid in Euro. The foreign currency exchange rate of 1.3278 U.S. dollars for 1 Euro,whichreflects an average conversion rate for 2010, was usedpersons who were our shareholders immediately prior tocalculate Mr. Epinette's base salary and all other compensation amounts for 2010. The foreign currency exchange rate of 1.3667 U.S. dollars for 1 Euro, the spot conversion rate on February 22, 2011, was used to calculate his annual incentive bonus, which was paid in February 2010.(8)Consists of $4,732 in contributions to the French government-mandated pension plan, $44,920 in contributions to our French operating subsidiary's Retraite Complémentaire on Mr. Epinette's behalf, $18,031 in contributions to our French operating subsidiary's Retraite Supplémentaire on Mr. Epinette's behalf and $28,164 related to automobile expenses. The foreign currency exchange rate of 1.3278 U.S. dollars for 1 Euro, which reflects an average conversion rate for 2010, was used to calculate Mr. Epinette's all other compensation amounts for 2010.
(9)Consists of relocation perquisites including moving costs of $29,253, payment of real estate taxes associated with thesuch saleof Ms. Diersen's prior residence of $14,313, payment of legal fees associated with the sale of Ms. Diersen's prior residence of $2,475, payment of real estate fees associated with the sale of Ms. Diersen's prior residence of $66,075, payment of closing costs associated with the sale of Ms. Diersen's prior residence of $4,699, family travel costs of $4,245, temporary housing costs of $17,250, gross-up of compensation for taxes payable on the above items of $44,118, and $2,438 in contributions to our U.S. operating subsidiary's 401(k) Plan on Ms. Diersen's behalf.
The following table sets forth summary information regarding all grants of plan-based awards made to our named executive officers for the year ended January 2, 2011.All other
option
awards:
number of
securities
underlying
options
(#)Estimated future payouts under
non-equity incentive plan
awards ($)Exercise or
base price
of option
awards
($/share)(4)Grant date
fair value
of option
awards(5)Grant
dateName(1)Threshold(2) Target Maximum(3) Douglas W. Kohrs
3/3/2010 5,884 294,200 411,880 — — — 6/3/2010 — — — 83,333 22.50 913,625 Michael J. Doty
2/19/2010 — — — — — 191,960 (6) Carmen L. Diersen
6/21/2010 1,725 86,250 120,750 — — — 6/21/2010 — — — 150,000 22.50 1,711,935 Andrew E. Joiner
3/3/2010 3,274 163,708 229,192 — — — 6/3/2010 — — — 41,666 22.50 456,825 Stéphan Epinette(7)
3/3/2010 1,669 (9) 83,451 116,832 — — — 6/25/2010 (8) 695 22,984 22,984 — — — 6/3/2010 — — — 33,333 22.50 365,450 Kevin M. Klemz
9/13/2010 655 32,746 45,844 — — — 10/28/2010 — — — 83,333 22.50 899,925 (1)All of our named executive officers (otherdo not, immediately thereafter, own more thanMr. Doty) were granted non-equity incentive plan awards pursuant to our 2010 annual bonus scheme, and were granted stock options pursuant to our stock option plan. Mr. Epinette was also granted a non-equity incentive plan award pursuant to our French operating subsidiary's incentive compensation scheme.(2)The threshold amount for awards payable under our annual bonus program and our French operating subsidiary's incentive compensation scheme assumes that the threshold level50% of thelowest weighted financial performance objective has been satisfied.(3)Maximum amounts reflect payoutcombined voting power entitled to vote generally in the election of directors of theportion of annual bonus tied to corporate financial performance objectives at a rate of 150% of target and the portionthen-outstanding voting securities of theannual bonus tied to individual performance objectives at a rateacquiring corporation (or its direct or indirect parent corporation).
The definition of
100% of target under our annual bonus program. Target and maximum payout amounts are the same for the purposes of the French incentive compensation scheme.(4)The exercise price of the options was set at the fair market value of one share of our ordinary shares at the time of the grant, with fair market value being determined by our board of directors in good faith.(5)The amounts shown in the "Option Awards" column represent the aggregate grant date fair value of equity awards granted in 2010, computed in accordance with FASB ASC Topic 718. Seefootnote(2) to the Summary Compensation Table for a discussion of valuation assumptions for the aggregate grant date fair values.(6)Reflects the incremental fair value, computed as of February 19, 2010, in accordance with FASB ASC Topic 718, with respect to the extension of the exercise period applicable to Mr. Doty's vested, unexercised equity awards. See footnote (6) to the Summary Compensation Table for a discussion of valuation assumptions for the incremental modification date fair value.(7)The foreign currency exchange rate of 1.3278 U.S. dollars for 1 Euro, which reflects an average conversion rate for 2010, was used to calculate Mr. Epinette's target and maximum awards in respect of annual bonus and payments under the French incentive compensation scheme.(8)The terms of the 2010 French incentive compensation scheme were governed by an agreement entered into by our French operating subsidiary on June 25, 2010. Awards set forth on this line represent awards granted to Mr. Epinette pursuant to our French operating subsidiary's incentive compensation scheme.(9)Awards set forth on this line represent awards granted to Mr. Epinette pursuant to our annual bonus program.
Narrative Disclosure Relating to Summary Compensation Table and Grants of Plan-Based Awards TableEmployment AgreementsTornier, Inc., our U.S. operating subsidiary, is a party to employment agreements with Messrs. Kohrs, Joiner, and Klemz, and Ms. Diersen, which agreements are substantially the same other than differences in base salary, target annual bonus percentages and severance. The agreements have specified terms of three years, subject to automatic renewal for one-year terms unless either party provides 60 days' advance notice of their desire not to renew. Under the agreements, each executive is entitled to an enumerated base salary, subject to increase but not decrease, is eligible to receive an annual bonus with a target bonus equal to an enumerated percentage of base salary (60% for Mr. Kohrs, 50% for Mr. Joiner, 50% for Ms. Diersen, and 40% for Mr. Klemz), and is entitled to participate in the employee benefit plans and arrangements that we generally maintain for our senior executives. If an executive's employment is terminated by Tornier, Inc. without "cause" (as such term is defined in the employment agreements), in addition to any accrued but unpaid salary and benefits through the date of termination, the executive will be entitled to base salary and health and welfare benefit continuation for twelve months following termination, and, in the event their employment is terminated without cause due to non-renewal of their employment agreements by Tornier, Inc., the executives will also be entitled to a payment equal to their pro-rata annual bonus for the year of termination. In the event any of Messrs. Kohrs, Joiner, Klemz's, or Ms. Diersen's, employment is terminated without cause or by the executive for "good reason" (as such term is defined in the employment agreements) within twelve months following achange in controlthe executives will be entitled to receive accruedin our prior stock option plan and executive employment agreements is not identical butunpaid salary and benefits through the date of termination, a lump-sum payment equal to their base salary plus target bonus for the year of termination, health and welfare benefit continuation for twelve months following termination and accelerated vesting of all unvested options. In addition, Mr. Kohrs' agreement provides that in the event the payments and benefits to which he is entitled pursuant to the agreement become subject to the excise tax under Section 4999 of the Internal Revenue Code of 1986, as amended, he will be entitled to a "gross-up" payment in order to cover such tax liability. The agreements also contain covenants intended to protect against the disclosure of confidential information during and following an executive's employment, as well as restrictions on engaging in competition with Tornier, Inc. or otherwise interfering with our business relationships, which extend through the first anniversary of an executive's termination of employment for any reason.Tornier SAS, our French operating subsidiary, is also a party to an employment agreement with Mr. Epinette, which does not have a specified term, but which may be terminated by either party in accordance with local law, and which issubstantially similar to theemployment agreements described above with respect to base salary, annual target bonus (30% of base salary), benefit participation and non-compete obligations. Pursuant to the agreement and French labor laws, Mr. Epinette is entitled to receive certain payments and benefits following a voluntary or involuntary termination of employment, including an amount equal to twelve months' gross monthly salary, which is payable as consideration for the restrictive covenants containeddefinition inthe agreement, a payment equal to Mr. Epinette's French incentive compensation scheme payment for the year of his termination and, in the case of an involuntary termination of employment, a severance payment payable pursuant to French law, the amount of which is determined based on Mr. Epinette's gross monthly salary and years of service with Tornier SAS. If Mr. Epinette is terminated for reasons other than negligence or serious misconduct following a change in control (as such term is defined in the employment agreement), he is entitled to gross monthly salary continuation and health and welfare benefit continuation for twelve months following termination of employment, accelerated vesting of all unvested options, as well as a payment equal to Mr. Epinette's annual target bonus and French incentive compensation scheme payment for the year of his termination. Pursuant to French law, gross monthly salary represents the average salary Mr. Epinette received during the twelve-month period preceding his termination and includes the amount of any annual incentive bonus payable to Mr. Epinette during such period pursuant toourannual bonus program.Separation Agreement with Michael DotyOur U.S. operating subsidiary entered into a separation agreement with Mr. Doty in connection with his termination of employment, which became effective on February 19, 2010, pursuant to which, in exchange for his execution of a general release, Mr. Doty became entitled to the severance payments and benefits payable to him in the event of an involuntary termination of employment without cause pursuant to the employment agreement to which he was a party with the Company prior to his termination of employment, which was substantially the same as the agreements with Messrs. Joiner and Klemz, and Ms. Diersen, other than differences in base salary, target annual bonus percentages and severance. The cost of the separation agreement includes $315,667 of base salary and continued coverage on our health plans through February 19, 2011, with the full cost of such coverage, $13,575, being borne by the Company. The exercise period applicable to Mr. Doty's vested, unexercised options was extended to August 19, 2011 pursuant to the agreement. Mr. Doty's severance payments totaling $315,667, less applicable withholding and related taxes, will be made semi-monthly over a period of one year from the date of termination. Mr. Doty is restricted from engaging in competition with us or otherwise interfering with our business until the first anniversary of his termination.Stock Option PlanEffective as of July 18, 2006, we adopted the stock option plan, which is designed to assist in attracting, retaining, motivating and rewarding eligible employees, directors and consultants, and promoting the creation of long-term value for our stockholders by closely aligning the interests of participants with those of such stockholders, by allowing grants of options to purchase shares of our common stock to such participants. Effective as of February 2, 2011, equity awards will be granted under our newcurrent stock incentiveplan, which is discussed above under "Components of Compensation for 2010—Long-Term Equity Compensation—Stock Incentive Plan," and no further grants will be made under the stock option plan.Our board of directors administers the stock option plan and is authorized to, among other things, designate participants, grant options, determine the terms and conditions relating to options, including vesting, prescribe option agreements, interpret the stock option plan, establish, amend and rescind any rules and regulations relating to the stock option plan, and to make any other determinations that it deems necessary or advisable for the administration of the stock option plan. Our board of directors may also delegate to our officers or employees, or other committees, subject to applicable law, the authority, subject to such terms as our board of directors determines appropriate, to perform such functions, including but not limited to administrative functions, including the appointment of agents to assist in the administration of the stock option plan. Any action of our board of directors (or its authorized delegates) will be final, conclusive and binding on all persons, including participants and their beneficiaries.Our stock option plan reserves 5,000,000 shares of our ordinary shares for issuance, subject to adjustment in the event of any stock dividend or split, reorganization, recapitalization, merger, share exchange or any other similar corporate transaction or event. For purposes of determining the remaining ordinary shares available for grant under the stock option plan, to the extent that an option expires or is canceled, forfeited, settled in cash or otherwise terminated without a delivery to the participant of the full number of ordinary shares to which the option related, the undelivered ordinary shares will again be available for grant. Similarly, ordinary shares withheld in payment of the exercise price or taxes relating to an option and shares equal to the number surrendered in payment of any exercise price or taxes relating to an option shall be deemed to constitute shares not delivered to the participant and shall be deemed to again be available for options under the stock optionplan.The board of directors may, in the event of a Corporate Event (as defined in the stock option plan and which, for example includes a change in control or a reorganization of the Company), in its sole discretion, provide for adjustments or substitutions as to the number, price or kind of shares or other consideration subject to outstanding options, or provide for the termination of an option and the payment of a cash amount in exchange for the cancellation of an option. Additionally, our stock option plan was amended as of February 2, 2011, to provide that in the event a Change in Control (as defined in the stock option plan) occurs, unless otherwise provided by our compensation committee, any outstanding options, whether vested or unvested, will be accelerated as of the consummation of such Change in Control. The board of directors has the ability to amend or terminate the stock option plan at any time, provided that no amendment or termination will be made (i) that impairs the rights of the holder of any option outstanding on the date of such amendment or termination or (ii) without satisfying any applicable shareholder approval requirements. The board of directors may also suspend or terminate the stock option plan at any time, and, unless sooner terminated, the stock option plan will terminate on July 18, 2016.The terms of the stock option plan restrict a participant's ability to transfer shares acquired pursuant to the exercise of options granted thereunder until the expiration of the 180-day period following the occurrence of an initial public offering of our ordinary shares. The stock option plan contains provisions which provide our institutional investors with drag along rights and us with repurchase rights, which rights will terminate upon the occurrence of an initial public offering of our ordinary shares.Outstanding Equity Awards at Fiscal Year EndThe following table sets forth summary information regarding the outstanding equity awards held by our named executive officers at January 2, 2011.NameNumber of securities
underlying unexercised
options(1) (#)
exercisableNumber of securities
underlying unexercised
options(1) (#)
unexercisableOption
exercise
price ($)Option
expiration
dateDouglas W. Kohrs
583,333 — 13.38 7/18/2016 355,808 23,720 13.89 2/26/2017 98,958 59,375 16.98 4/24/2018 29,166 37,500 16.98 2/1/2019 — 83,333 22.50 2/1/2020 Michael Doty(4)
87,500 — 13.89 8/19/2011 21,875 — 16.98 8/19/2011 4,166 — 16.98 8/19/2011 Carmen L. Diersen
— 150,000 22.50 6/21/2020 Andrew Joiner
52,083 31,250 16.98 4/25/2018 14,583 18,750 16.98 2/1/2019 — 41,666 22.50 2/1/2020 Stéphan Epinette
29,166 37,500 16.98 3/26/2019 — 33,333 22.50 2/1/2020 Kevin M. Klemz
— 83,333 22.50 9/13/2020 (1)All options were granted under the stock option plan. Our named executive officers did not exercise any outstanding options during 2010.(2)25% of the options vest on the first anniversary of the applicable vesting commencement date, and the remaining 75% of the options vest on a pro-rata basis on each quarterly anniversary of the applicable vesting commencement date over the three-year period following the first anniversary of the vesting commencement date. The vesting commencement date for each option is generally the date which is ten years earlier than the option expiration date listed on the table. Our named executive officers' unvested options will become fully vested as follows: (i)Mr. Kohrs—for options expiring on February 26, 2017, 23,720 options vest on February 26, 2011, for options expiring on April 24, 2018, 9,896 options vest on each April 25, July 23, October 23 and January 23 through April 24, 2012 (9,894 options will vest on April 24, 2012), for options expiring on February 1, 2019, 4,166.625 options vest on each May 1, August 1, November 1 and February 1 through February 1, 2013, and for options expiring on February 1, 2020, 20,833.25 options vest on February 1, 2011, and 5,208.3125 options vest on each May 1, August 1, November 1 and February 1 occurring thereafter through February 1, 2014; (ii)Mr. Doty—all vesting with respect to Mr. Doty's unvested options ceased as of February 19, 2010, in connection with his separation; (iii)Ms. Diersen—for options expiring on June 21, 2020, 37,500 options vest on June 21, 2011, and 9,375 options vest on each September 21, December 21, March 21 and June 21 occurring thereafter through June 21, 2014, (iv)Mr. Joiner—for options expiring on April 25, 2018, 5,208.3125 options vest on each April 25, July 23, October 23 and January 23 through April 24, 2012, for options expiring on February 1, 2019, 2,083.3125 options vest on each May 1, August 1, November 1 and February 1 through February 1, 2013, and for options expiring on February 1, 2020, 10,416.5 options vest on February 1, 2011, and 2,604.125 options vest on each May 1, August 1, November 1 and February 1 occurring thereafter through February 1, 2014; (v)Mr. Epinette—for options expiring on March 26, 2019, 4,166.625 options vest on each June 26, September 26, December 26 and March 26 through March 26, 2013, and for options expiring on February 1, 2020, 8,333.25 options vest on February 1, 2011, and 2,083.3125 options vest on each May 1, August 1, November 1 and
February 1 occurring thereafter through February 1, 2014; and (vi)Mr. Klemz—for options expiring on September 13, 2020, 20,833.25 options vest on September 13, 2011, and 5,208.3125 options vest on each December 13, March 13, June 13 and September 13 occurring thereafter through September 13, 2014.(3)The exercise price of the options were set at the fair market value of a share of our ordinary shares at the time of the grant, with fair market values being determined by our board of directors in good faith.(4)All unvested options held by Mr. Doty as of February 19, 2010 were forfeited in connection with the separation agreement.
Potential Payments
Upon a Termination or Change in ControlPursuanttothe employment agreements with our named executive officers, upon certain terminations of employment, our named executive officers are entitled to payments of compensation and benefits as described above under "Narrative Disclosure to Summary Compensation Table and Grant of Plan-Based Awards Table—Employment Agreements."Named Executive Officers.The table below reflects the amount of compensation and benefits payable to each named executive officer in the event of (i) any termination (including for cause) or resignation, or a voluntary/for causetermination,termination; (ii) an involuntary termination withoutcause,cause; (iii) an involuntary termination without cause or a resignation for good reason withintwelve12 months following a change in control, or a qualifying change in controltermination,termination; (iv) termination by reason of anexecutive'sexecutive’s death and (v) termination by reason of anexecutive'sexecutive’s disability. The amounts shown assume that the applicable triggering event occurred onJanuary 2, 2011,December 29, 2013, and, therefore, are estimates of the amounts that would be paid to the named executive officers upon the occurrence of such triggering event.Mr. DotyTriggering Events Name
Type of payment
Voluntary/
for cause
termination
($)Involuntary
termination
without
cause
($)Qualifying
change in
control
termination
($)Death
($)Disability
($)David H. Mowry
Cash severance(1) — 450,000 450,000 — — Benefit continuation(2) — 13,827 13,827 — — Target bonus(3) — — 355,467 — — Option award acceleration(4) — — 4,016 — — Stock award acceleration(5) — — 987,916 — — Total
— 463,827 1,811,226 — — Shawn T McCormick
Cash severance(1) — 354,812 354,812 — — Benefit continuation(2) — 13,827 13,827 — — Target bonus(3) — — 177,206 — — Option award acceleration(4) — — 4,105 — — Stock award acceleration(5) — — 516,729 — — Total
— 368,639 1,066,679 — — Gordon W. Van Ummersen
Cash severance(1) — 350,000 350,000 — — Benefit continuation(2) — 13,827 13,827 — — Target bonus(3) — — 175,000 — — Option award acceleration(4) — — — — — Stock award acceleration(5) — — 446,825 — — Total
— 363,827 985,652 — — Stéphan Epinette(6)
Cash severance 375,307 342,598 750,614 — 375,307 Benefit continuation — 13,827 13,827 — — Target bonus(7) 22,708 22,708 153,610 22,708 22,708 Option award acceleration(4) — — 842 — — Stock award acceleration(5) — — 405,050 — — Total
398,015 379,133 1,323,943 22,708 398,015 Terry M. Rich
Cash severance(1) — 359,624 359,624 — — Benefit continuation(2) — 13,827 13,827 — — Target bonus(3) — — 269,117 — — Option award acceleration(4) — — 2,483 — — Stock award acceleration(5) — — 562,692 — — Total
— 373,451 1,207,743 — — (1) Represents the value of salary continuation for 12 months or payment of a lump sum equal to 12-months’ base salary following the executive’s termination, as applicable. (2) Includes the value of medical, dental and vision benefit continuation for each executive and their family for 12 months following the executive’s termination. With respect to a qualifying change in control termination, we will bear the entire cost of coverage. (3) Includes value of full target bonus for the year of the change in control. In the case of all of the named executive officers, other than Mr. Epinette, if the termination is an involuntary termination without cause and the date of termination is such that the termination is structured as a non-renewal of the executive’s employment agreement, then under such circumstances a pro rata portion of the executive’s annual bonus would be required to be paid under the terms of the executive’s employment agreement. (4) The value of the automatic acceleration of the vesting of unvested stock options held by a named executive officer is based on the difference between: (i) the per share market price of our ordinary shares underlying the unvested stock options held by such executive as of December 27, 2013, the last trading day of 2013, based upon the per share closing sale price of our ordinary shares, as reported by the NASDAQ Global Select Market, on December 27, 2013 ($18.29), and (ii) the per share exercise price of the options held by such executive. The range of per share exercise prices of unvested stock options held by our named executive officers included in the table as of December 29, 2013 was $16.98 to $27.31. (5) The value of the automatic acceleration of the vesting of stock awards held by a named executive officer is based on: (i) the number of unvested stock awards held by such officer as of December 29, 2013, multiplied by (ii) the per share market price of our ordinary shares as of last trading day of 2013, December 27, 2013 based upon the per share closing sale price of our ordinary shares, as reported by the NASDAQ Global Select Market, on December 27, 2013 ($18.29). (6) The foreign currency exchange rate of 1.3277 U.S. dollars for 1 Euro, which reflects an average conversion rate for 2013, was used to calculate Mr. Epinette’s payments and benefits upon termination of employment. (7) Includes amounts payable pursuant to the French incentive compensation scheme maintained by Tornier SAS assuming 100% achievement of applicable performance metrics. Pursuant to French law, participants receive their annual incentive payment for the year of their termination of employment for any reason. Upon a qualifying termination following a change in control, Mr. Epinette also will receive his full target annual bonus for the year of the change in control under our corporate performance incentive plan. (8) Reflects an amount equal to 12 months’ gross monthly salary, which is payable as consideration for the restrictive covenants contained in Mr. Epinette’s employment agreement (the “restrictive covenant consideration”). Pursuant to French law, gross monthly salary represents the average salary Mr. Epinette received during the12-month period preceding his termination and includes the amount of annual incentive bonus payable to Mr. Epinette in 2012 in respect of 2011 performance pursuant to our annual bonus program. (9) Reflects, in addition to the restrictive covenant consideration described in note (8), an amount equal to one-fifth of Mr. Epinette’s gross monthly salary, multiplied by his number of years of service with Tornier SAS, which is intended to reflect an amount payable pursuant to French law in the event of Mr. Epinette’s involuntary termination of employment. Mr. Epinette will receive these benefits following any involuntary termination of employment, except for a termination involving serious or gross misconduct. (10) Reflects, in addition to the restrictive covenant consideration described in note (8), an amount equal to 12 months’ gross monthly salary, which is intended to reflect an amount payable pursuant to Mr. Epinette’s employment agreement in the event of an involuntary termination of employment within 12 months following a change in control. Risk Assessment of Compensation Policies, Practices and Programs
As a result of our annual assessment on risk in our compensation programs, we concluded that our compensation policies, practices and programs and related compensation governance structure work together in a manner so as to encourage our employees, including our named executive officers, to pursue growth strategies that emphasize shareholder value creation, but not to take unnecessary or excessive risks that could threaten the value of our company. As part of our assessment, we noted in particular the following:
annual base salaries for employees are not subject to performance risk and, for most non-executive employees, constitute the largest part of their total compensation;while performance-based, or at risk, compensation constitutes a significant percentage of the overall total compensation of many of our employees, including in particular our named executive officers, and thereby we believe motivates our employees to help fulfill our corporate mission, vision and values, including specific and focused company performance goals, the non-performance based compensation for most employees for most years is also a sufficiently high percentage of their overall total compensation that we do notincludedbelieve that unnecessary or excessive risk taking is encouraged by the performance-based compensation;for most employees, our performance-based compensation has appropriate maximums;a significant portion of performance-based compensation of our employees is in thetable belowform of long-term equity incentives which do not encourage unnecessary or excessive risk becausehethey generally vest over a four-year period of time thereby focusing our employees on our company’s long-term interests; andperformance-based or variable compensation awarded to our employees, which for our higher-level employees, including our named executive officers, constitutes the largest part of their total compensation, is appropriately balanced between annual and long-term performance and cash and equity compensation, and utilizes several different performance measures and goals that are drivers of long-term success for our company and our shareholders.As a matter of best practice, we will continue to monitor our compensation policies, practices and programs to ensure that they continue to align the interest of our employees, including in particular our executive officers, with those of our long-term shareholders while avoiding unnecessary or excessive risk.
Director Compensation
Overview
Under the terms of our board of directors compensation policy, which was approved by the general meeting of our shareholders on August 26, 2010 and was amended on October 28, 2010, the compensation packages for our non-executive directors are determined by our board of directors, based upon recommendations by the compensation committee. In determining director compensation, we target such compensation in the market median range of our peer companies; although, we may deviate from the median if we determine necessary or appropriate on a case by case basis.
Under the terms of the non-executive director compensation policy, compensation for our non-executive directors is comprised of both cash compensation and equity-based compensation. Our cash compensation is in the form of annual or other retainers for our non-executive directors, chairman of the board, committee chairs and committee members. Our equity-based compensation is in the form of initial and annual stock option and stock grants (in the form of restricted stock units). Each of these components is described in more detail below. We do not
employedgenerally provide perquisites and other personal benefits to our non-executive directors.During 2013, our compensation committee engaged Mercer to review our non-executive director compensation program. In so doing, Mercer analyzed the outside director compensation levels and practices of our peer companies. Mercer used the same peer group of 16 peer companies as
of January 2, 2011.was approved by our compensation committee in February 2013 and used to gather compensation information for our executive officers. For more information regarding theamounts payable to Mr. Doty in connection with this termination, pleasepeer companies, we refer you to thediscussion aboveinformation underTablethe heading “Compensation Discussion and Analysis—Determination ofContents"Narrative DisclosureExecutive Compensation—Use of Peer Group and Other Market Data” of this report. Based on Mercer’s recommendations, our compensation committee recommended and our board of directors approved certain changes toSummary Compensation Tableour non-executive director compensation policy during 2013. In April 2013, our board of directors approved the following changes to our non-executive director compensation policy effective as of July 1, 2013: (1) an increase in the cash premium paid to the chair of our audit committee from $10,000 to $15,000 per year; (2) an increase in the cash premium paid to the chair of our compensation committee from $5,000 to $10,000 per year; (3) a reduction in the vesting of initial andGrantannual stock option and stock grants from three years to two years; and (4) a cash travel stipend ofPlan-Based Awards Table—Separation Agreement with Michael Doty."Triggering Events NameType of payment Voluntary/
for cause
termination
($)Involuntary
termination
without
cause
($)Qualifying
change in
control
termination
($)Death
($)Disability
($)Douglas W. Kohrs
Cash Severance(1) — 490,333 490,333 — — Benefit Continuation(2) — 13,575 13,575 — — Target Bonus(3) — — 294,200 — — Equity Acceleration(4) — — 738,984 — — Gross-Up — — 0 — — Total — 503,908 1,537,092 — — Carmen L. Diersen
Cash Severance(1) — 325,000 325,000 — — Benefit Continuation(2) — 13,575 13,575 — — Target Bonus(3) — — 162,500 — — Equity Acceleration(4) — — 0 (5) — — Total — 338,575 501,075 — — Andrew E. Joiner
Cash Severance(1) — 327,417 327,417 — — Benefit Continuation(2) — 13,575 13,575 — — Target Bonus(3) — — 163,708 — — Equity Acceleration(4) — — 276,000 — — Total — 340,991 780,700 — — Stéphan Epinette(6)
Cash Severance 360,628 (8) 372,649 (9) 721,256 (10) — 360,628 (8) Benefit Continuation — — 6,975 — — Target Bonus(7) 22,984 22,984 105,840 22,984 22,984 Equity Acceleration(4) — — 207,000 — — Total 383,612 395,633 1,041,071 22,984 383,612 Kevin J. Klemz
Cash Severance(1) — 270,000 270,000 — — Benefit Continuation(2) — 13,575 13,575 — — Target Bonus(3) — — 108,000 — — Equity Acceleration(4) — — 0 (5) — — Total — 283,575 391,575 — — (1)Includes the value of salary continuation for twelve months or payment of a lump sum equal to twelve months' salary following the executive's termination, as applicable.(2)Includes the value of medical, dental and vision benefit continuation$2,000 for eachexecutiveboard meeting attended in person that takes place in the Netherlands or other location outside the United States. In addition, in October 2013, our board of directors approved certain compensation to be paid to the chair andtheir family for twelve months followingmembers of our then newly formed strategic transactions committee effective as of November 1, 2013. Our non-executive director compensation policy, including as revised, is consistent with our shareholder-approved board of directors compensation policy.Cash Compensation
The cash compensation component of our non-executive director compensation consists of gross annual fees, commonly referred to as annual cash retainers, paid to each non-executive director and additional annual cash retainers paid to the
executive's termination. With respectchairman and each board committee chair and member. The table below sets forth the annual cash retainers paid to each non-executive director and the additional annual cash retainers paid to the chairman and each board committee chair and member:Annual cash retainer ($) Description
Prior to
July 1, 2013Effective
July 1, 2013Non-executive director
40,000 40,000 Chairman of the board premium
50,000 50,000 Audit committee chair premium
10,000 15,000 Compensation committee chair premium
5,000 10,000 Nominating, corporate governance and compliance committee chair premium(1)
5,000 5,000 Strategic transactions committee chair premium
— 10,000 Audit committee member (including chair)
10,000 10,000 Compensation committee member (including chair)
5,000 5,000 Nominating, corporate governance and compliance committee member (including chair)
5,000 5,000 Strategic transactions committee member (including chair)(1)
— 5,000 (1) The annual cash retainers for the strategic transactions committee members commenced on November 1, 2013. The annual cash retainers are paid on a
qualifying changequarterly basis incontrol termination, Tornier will beararrears within 30 days of theentire costend ofcoverage.(3)Includes value of full target bonuseach calendar quarter. For example, the retainers for theyearfirst calendar quarter covering the period from January 1 through March 31 are paid within 30 days of March 31.Our former interim vice chairman, Kevin C. O’Boyle, received a cash retainer of $100,000 in consideration for his services as former interim vice chairman.
Equity-Based Compensation
The equity-based compensation component of our non-executive director compensation consists of initial stock option and stock grants (in the form of restricted stock units) to new non-executive directors upon their first appointment or election to our board of directors and annual stock option and stock grants (in the form of restricted stock units) to all non-executive directors on the same date that annual performance recognition grants of equity awards are made to our employees (or such other date if otherwise in accordance with all applicable, laws, rules and regulations).
Non-executive directors, upon their initial election to our board of directors and on an annual basis thereafter effective as of the
changesame date that annual performance recognition grants of equity awards are made to our employees (or such other date if otherwise incontrol.(4)Includesaccordance with all applicable, laws, rules and regulations), receive $125,000, one-half of which is paid in stock options and thevalueremaining one-half ofaccelerationwhich is paid in stock grants (in the form ofall unvestedrestricted stock units). The number of ordinary sharesthat are subjectunderlying the stock options and stock grants is determined based on the10-trading day average closing sale price of an ordinary share, as reported by the NASDAQ Global Select Market, and as determined one week prior to the date of anticipated corporate approval of the award. The stock optionsbased onhave a term of 10 years and a per share exercise price equal to 100% of$22.50, which isthevalue obtained in our most recent valuation.(5)Thefair market value ofaccelerationan ordinary share on the grant date. The stock options and stock grants (in the form ofall unvestedrestricted stock units) vest over a two-year period, with one-half of the underlying sharesthat are subjectvesting on each of the one-year and two-year anniversaries of the grant date, in each case so long as the director is still a director as of such date.Accordingly, on August 9, 2013, each of our non-executive directors received a stock option to
options held by Ms. Diersen and Mr. Klemz, all of which havepurchase 7,538 ordinary shares at an exercise price of$22.50, is $0, based on a$19.45 per share and a stock grant in the form of a restricted stock unit representing 3,490 shares.Election to Receive Equity-Based Compensation in Lieu of Cash Compensation
Our non-executive director compensation policy allows our non-executive directors to elect to receive a stock grant in lieu of 100% of their annual cash retainers payable for services to be rendered as a non-executive director, chairman and chair or member of any board committee. Each non-executive director who elects to receive a stock grant in lieu of such director’s annual cash retainers is granted a stock grant (in the form of a restricted stock unit) under our stock incentive plan for that number of ordinary shares as determined by dividing the aggregate dollar amount of all annual cash retainers anticipated to payable to such director for the period commencing on July 1 of each year to June 30 of the following year by the 10-trading day average closing sale price of
$22.50,our ordinary shares as reported by the NASDAQ Global Select Market and as determined one week prior to the date of anticipated corporate approval of the award. Four of our non-executive directors elected to receive such a stock grant in lieu of their cash retainers for the period covering July 1, 2012 through June 30, 2013, and the same four non-executive directors elected to receive such a stock grant in lieu of their cash retainers for the period covering July 1, 2013 through June 30, 2014. Accordingly, effective as of August 10, 2012 and August 9, 2013, these four non-executive directors received stock grants. These stock grants are described in more detail in note (1) to the Director Compensation Table below.If a non-executive director who elected to receive a stock grant in lieu of such director’s annual cash retainers is no longer a director before such director’s interest in all of the shares underlying the stock grant have vested and become issuable, then such director will forfeit his or her rights to receive all of the shares underling such stock grant that have not vested and been issued as of the date such director’s status as a director so terminates. In such case, the non-executive director will receive in cash a pro rata portion of his or her annual cash retainers for the quarter in which
isthevalue obtaineddirector’s status as a director terminates.If a non-executive director who elected to receive a stock grant in
our most recent valuation.(6)The foreign currency exchange ratelieu of1.3278 U.S. dollarssuch director’s annual cash retainers becomes entitled to receive an increased or additional annual cash retainer during the period from July 1 to June 30 of the next year, such director will receive such increased or additional annual cash retainer in cash until July 1 of the next year when the director may elect (on or prior to June 15 of the next year) to receive a stock grant in lieu of such director’s annual cash retainers.If a non-executive director who elected to receive a stock grant in lieu of such director’s annual cash retainers experiences a change in the director’s membership on one or more board committees or chair positions prior to June 30 of the next year such that the director becomes entitled to receive annual cash retainers for the period from July 1
Euro, which reflectsto June 30 of the next year aggregating anaverage conversion rate for 2010, wasamount less than the aggregate amount used to calculateMr. Epinette's paymentsthe director’s most recent stock grant received, the director will forfeit as of the effective date of such board committee or chair change his or her rights to receive a pro rata portion of the shares underlying such stock grant reflecting the decrease in the director’s aggregate annual cash retainers andbenefits upon terminationthe date on which such decrease occurred. In addition, the vesting ofemployment.
(7)Includes amounts payable pursuant toshares underlying theFrench incentivestock grant and the date on which such change occurred.Summary of Cash and Other Compensation
The table below summarizes the compensation
scheme maintainedreceived byTornier SAS assuming 100% achievement of applicable performance metrics. Pursuant to French law, participants receive their annual incentive paymentour non-executive directors for the yearof their termination of employment for any reason. Upon a qualifying termination following a change in control, Mr. Epinette will also receive his full target annual bonus for the year of the change in control.(8)Reflects an amount equal to twelve months' gross monthly salary, which is payable as consideration for the restrictive covenants contained in Mr. Epinette's employment agreement (the "Restrictive Covenant Consideration"). Pursuant to French law, gross monthly salary represents the average salary Mr. Epinette received during the twelve-month period preceding his termination and includes the amount of annual incentive bonus payable to Mr. Epinette in 2010 in respect of 2009 performance pursuant to our annual bonus program.(9)Reflects, in addition to the Restrictive Covenant Consideration, an amount equal to one-fifth of Mr. Epinette's gross monthly salary, multiplied by his number of years of service with Tornier SAS, which is intended to reflect an amount payable pursuant to French law in the event of Mr. Epinette's involuntary termination of employment. Mr. Epinette will receive these benefits following any involuntary termination of employment, except for a termination involving serious or gross misconduct.(10)Reflects, in addition to the Restrictive Covenant Consideration, an amount equal to twelve months' gross monthly salary, which is intended to reflect an amount payable pursuant to Mr. Epinette's employment agreement in the event of an involuntary termination of employment within twelve months following a change in control.
DIRECTOR COMPENSATIONWith the exception of Messrs. Tornier and O'Boyle, we did not pay our current directors any compensation for serving on our board of directors during 2010.ended December 29, 2013. While Mr.KohrsMowry did not receive additional compensation for his service as a director, a portion of his compensation was allocated to his service as a member oftheour boardeffective asofAugust 26, 2010.directors. For more information regarding the allocation of Mr.Kohrs'sMowry’s compensation, please refer tofootnotenote (1) to the Summary Compensation Table.DIRECTOR COMPENSATION– 2013
Name
Fees earned
or paid
in cash(1)
($)Stock
awards(2)(3)
($)Option
awards(4)(5)
($)All other
compensation(6)
($)Total
($)Sean D. Carney
113,333 192,787 65,594 4,000 375,714 Richard B. Emmitt
50,833 122,184 65,594 4,000 242,611 Kevin C. O’Boyle
157,499 67,880 65,594 4,000 294,973 Alain Tornier
40,000 111,331 65,594 0 216,925 Richard F. Wallman
67,500 67,880 65,594 4,000 204,974 Elizabeth H. Weatherman
45,000 116,758 65,594 4,000 231,352 (1) Unless a director otherwise elects to convert all of his or her annual retainers into stock awards (in the form of restricted stock units), annual retainers are paid in cash on a quarterly basis in arrears within 30 days of the end of each calendar quarter. Four of our non-executive directors elected to convert all of their annual retainers covering the period of service from July 1, 2012 to June 30, 2013 and the same four non-executive directors elected to convert their annual retainers covering the period of service from July 1, 2013 to June 30, 2014 into stock awards under our stock incentive plan. Accordingly, these four non-executive directors were granted stock awards on August 10, 2012 and August 9, 2013 for that number of ordinary shares as determined based on the following formula: (a) the aggregate dollar amount of all annual cash retainers that otherwise would have been payable to the non-executive director for services to be rendered as a non-executive director, chairman and chair or member of any board committee (based on such director’s board committee memberships and chair positions as of the grant date), divided by (b) the 10-trading day average closing sale price of an ordinary share, as reported by the NASDAQ Global Select Market, and as determined one week prior to the date of anticipated corporate approval of the award. Such stock awards vest and the underlying shares become issuable in four as nearly equal as possible quarterly installments, on September 30, December 31, March 31 and June 30, in each case so long as the non-executive director is a director of our company as of such date. The table below
summarizessets forth: (a) thecompensation receivednumber of stock awards granted to each non-executive director on August 9, 2013; (b) the total amount of annual retainers converted byour non-employee directors forsuch director into stock awards; (c) of such total amount of annual retainers converted into stock awards, theyear ended January 2, 2011.Director Compensation TableNameFees earned
or paid
in cash
($)Stock
Awards
($)(2)Option
Awards
($)(4)Total
($)Sean D. Carney
— — — — Richard B. Emmitt
— — — — Pascal E.R. Girin
— — — — Kevin C. O'Boyle
— — 565,935 565,935 Alain Tornier
19,917 (1) 981,750 (3) — 1,001,667 Simon Turton
— — — — Richard F. Wallman
— — — — Elizabeth H. Weatherman
— — — — (1)The foreign currency exchange rate of 1.3278 U.S. dollars for 1 Euro,amount attributed to the director’s service during 2013, whichreflects an average conversion rate for 2010, was used to calculate Mr. Tornier's cash compensation. Theamountshown reflects meeting fees earned by Mr. Tornier in 2010, as described below.(2)The amount shownis included in the"Stock Awards"“Fees earned or paid in cash” columnrepresentsfor each director; (d) theaggregategrant date fair value of the stock awardsgrantedcomputed in2010,accordance with FASB ASC Topic 718; and (e) the incremental grant date fair value for the stock awards above and beyond the amount of annual retainers for 2013 service converted into stock awards computed in accordance with FASB ASC Topic 718 .Name
Total amount
of retainers
converted
into stock
awards
($)Number of
stock awards
(#)Amount of
retainer
converted into
stock awards
attributable to
2013 service
($)Grant date fair
value of stock
awards
($)Incremental grant
date fair value of
stock awards
received during
2013
($)Mr. Carney
115,000 6,422 57,500 124,908 67,408 Mr. Emmitt
50,000 2,792 25,000 54,304 29,304 Mr. Tornier
40,000 2,234 20,000 43,451 23,451 Ms. Weatherman
45,000 2,513 22,500 48,878 26,378 The table below sets forth: (a) the number of stock awards granted to each non-executive director on August 10, 2012; (b) the total amount of annual retainers converted by such director into stock awards; (c) of such total amount of annual retainers converted into stock awards, the amount attributed to the director’s service during 2012, which
was estimated on the date of grant based on a per-share price of $22.50 (which was equal to our estimate of the fair value of our ordinary shares at that time). As of January 2, 2011, our non-employee directors did not hold any shares of common stock subject to unvested stock awards.(3)Theamountshownis included in the"Stock Awards"“Fees earned or paid in cash” column forMr. Tornier representseach director; (d) theaggregategrant date fair value of the stock awardsissued to Mr. Tornier on June 4, 2010, in respect of amounts owed to Mr. Tornier for past services performed under the terms of his consulting agreement. See footnote (2) above for a discussion of valuation assumptions for the aggregate grant date fair value.(4)The amount shown in the "Option Awards" column represents the aggregate grant date fair value of equity awards granted in 2010,computed in accordance with FASB ASC Topic718. See footnote (2) to718; and (e) theSummary Compensation Table for a discussion of valuation assumptions for the aggregateincremental grant date fairvalues. Asvalue for the stock awards above and beyond the amount ofJanuary 2, 2011, the aggregate number of shares of our commonannual retainers for 2012 service converted into stocksubject to outstanding options held by our non-employee directors was as follows: Mr. O'Boyle, 50,000 shares and Mr. Wallman, 34,375 shares.
Narrative Disclosure Relating to Director Compensation Tableawards computed in accordance with FASB ASC Topic 718.Director CompensationWith the exception of Messrs. Tornier and O'Boyle, we did not pay our current non-employee directors any compensation for serving on our board of directors during 2010. We did, however, reimburse all directors for expenses incurred in connection with their service on the board of directors,including reimbursement of expenses incurred in connection with attending board of directors' meetings. In 2010, in addition to receiving reimbursement for travel expenses, Mr. Tornier was eligible to receive meeting fees of €3,000 per meeting attended, and earned €15,000 in total meeting fees in 2010.Name
Total amount
of retainers
converted
into stock
awards
($)Number of
stock awards
(#)Amount of
retainer
converted into
stock awards
attributable to
2012 service
($)Grant date fair
value of stock
awards
($)Incremental grant
date fair value of
stock awards
received during
2012
($)Mr. Carney
110,000 5,186 55,000 93,555 38,555 Mr. Emmitt
50,000 2,357 25,000 42,520 17,520 Mr. Tornier
40,000 1,886 20,000 34,023 14,023 Ms. Weatherman
45,000 2,122 22,500 38,281 15,781 On July 31, 2006 we entered into a consulting agreement with Mr. Tornier, pursuant to which, in exchange for his services to us as a consultant, he was entitled to receive a consulting fee of €16,000 per month. Pursuant to the agreement, Mr. Tornier advised us and our executive officers with respect to investments, new opportunities for growth and general business matters. The agreement, which had a specified term of one year, was subject to automatic renewal for one-year terms unless either party provides three months' advance notice of their desire not to renew and contained covenants intended to protect against the disclosure of confidential information during and following the term of the agreement. On June 4, 2010, we issued 43,633 ordinary shares to KCH, a Swedish entity which is wholly owned by Mr. Tornier, having a value equal to €0.7 million (the total amount owed to Mr. Tornier for past services performed under the terms of the consulting agreement as of April 4, 2010), based on a per-share price of $22.50 (which was equal to our estimate of the fair value of our ordinary shares at that time) and a foreign currency exchange rate of 1.3479 U.S. dollars for 1 Euro, the spot conversion rate on March 31, 2010. Mr. Tornier's consulting agreement was terminated effective as of March 31, 2010.Option Grant(2) On August 9, 2013, each non-executive director received a stock award (in the form of a restricted stock unit) for 3,490 ordinary shares granted under our stock incentive plan. The stock award vests and the underlying shares become issuable in two as nearly equal as possible annual installments, on the one-year and two-year anniversaries of the grant date, and in each case so long as the non-executive director is a director of our company as of such date. In addition, as described above in note (1), certain non-executive directors elected to convert their annual retainers covering the period of service from July 1, 2013 to June 30, 2014 into stock awards under our stock incentive plan. The amount reported in the “Stock awards” column represents the aggregate grant date fair value for the August 9, 2013 stock awards granted to each director in 2013 and for those directors who elected to convert their annual retainers covering the period of service from July 1, 2013 to June 30, 2014, the incremental grant date fair value for the August 9, 2013 stock awards granted to each director in 2013 above and beyond the amount of annual retainers for 2013 service converted into stock awards, in each case as computed in accordance with FASB ASC Topic 718. The grant date fair value for stock awards is determined based on the closing sale price of our ordinary shares on the grant date. (3) The table below provides information regarding the number of unvested stock awards (all of which are in the form of restricted stock units) held by each of the non-executive directors at December 29, 2013 on a per grant basis and on an aggregate basis. On June 3, 2010, our board of directors granted 50,000 stock options to Mr. O'Boyle pursuant to our stock option plan, with an exercise price of $22.50 per share. The options are subject to the same vesting schedule as those granted to our named executive officers, that is, subject to continued service on the board of directors, 25% of the options vested on the first anniversary of the applicable vesting commencement date, and the remaining 75% of the options will vest on a pro-rata basis on each quarterly anniversary of the vesting commencement date over the three-year period following the first anniversary of the vesting commencement date.Name
05/12/11
grant date08/10/12
grant date08/09/13
grant dateTotal number
of underlying
unvested
sharesMr. Carney
990 1,965 8,306 11,261 Mr. Emmitt
990 1,965 5,584 8,539 Mr. O’Boyle
990 1,965 3,490 6,445 Mr. Tornier
990 1,965 5,165 8,120 Mr. Wallman
990 1,965 3,490 6,445 Ms. Weatherman
990 1,965 5,374 8,329 (4) On August 9, 2013, each non-executive director received a stock option to purchase 7,538 ordinary shares at an exercise price of $19.45 per share granted under our stock incentive plan. Such option expires on August 9, 2023 and vests with respect to one-half of the underlying ordinary shares on each of the following dates, so long as the individual remains a director of our company as of such date: August 9, 2014 and August 9, 2015. Amount reported in the “Option awards” column represents the aggregate grant date fair value for option awards granted to each non-executive director in 2013 computed in accordance with FASB ASC Topic 718. The grant date fair value is determined based on our Black-Scholes option pricing model. The grant date value per share for the option granted on August 9, 2013 was $9.03 and was determined using the following specific assumptions: risk free interest rate: 1.70%; expected life: 6.11 years; expected volatility: 46.58%; and expected dividend yield: 0. (5) The table below provides information regarding the aggregate number of options to purchase our ordinary shares outstanding at December 29, 2013 and held by each of our non-executive directors: Name
Aggregate
number of shares
underlying
optionsExercisable/
unexercisableRange of
exercise
price(s) ($)Range of
expiration
date(s)Mr. Carney
21,786 7,349/14,437 18.04-25.20 05/12/2021-08/09/2023 Mr. Emmitt
21,786 7,349/14,437 18.04-25.20 05/12/2021-08/09/2023 Mr. O’Boyle
71,786 51,099/20,687 18.04-25.20 06/03/2020-08/09/2023 Mr. Tornier
21,786 7,349/14,437 18.04-25.20 05/12/2021-08/09/2023 Mr. Wallman
56,161 41,724/14,437 16.98-25.20 12/08/2018-08/09/2023 Ms. Weatherman
21,786 7,349/14,437 18.04-25.20 05/12/2021-08/09/2023 (6) We do not generally provide perquisites and other personal benefits to our non-executive directors. Any perquisites or personal benefits actually provided to any non-executive director were less than $10,000 in the aggregate. ItemITEM 12. SECURITY OWNERSHIP OF CERTAIN BENEFICIAL OWNERS AND MANAGEMENT AND RELATED STOCKHOLDER MATTERSSecurity Ownership of Certain Beneficial Owners and Management
and Related Stockholder Matters.The
followingtable below sets forth certain information concerning the beneficial ownership of our ordinary shares as ofMarch 7, 2011,February 10, 2014, by:•- each of our directors and named executive
and otherofficers;•all of our current directorsexecutiveandotherexecutive officers as a group; and•each person known by us to beneficially own more than 5% of our ordinary shares.The calculations in the table below assume that there are
39,039,994[48,508,612] ordinaryshares.shares outstanding. Beneficial ownership is determined in accordance with the rules and regulations of the SEC. In computing the number of ordinary shares beneficially owned by a person and the percentage ownership of that person, we have included ordinary shares that the person has the right to acquire within 60 days, including through the exercise of any option, warrant or other right,orthe conversion of any othersecurity.security and the issuance of ordinary shares upon the vesting of stock awards granted in the form of restricted stock units. The ordinary shares that a shareholder has the right to acquire within 60 days, however, are not included in the computation of the percentage ownership of any other person.Ordinary shares
beneficially owned (1)Number Percent Directors and named executive officers:
David H. Mowry
50,958 * Shawn T McCormick
18,438 * Gordon W. Van Ummersen
— — Terry M. Rich
39,158 * Stéphan Epinette
123,809 * Sean D. Carney(2)
15,868,354 32.7 % Richard B. Emmitt(3)
433,972 1.0 % Kevin C. O’Boyle
58,301 * Alain Tornier(4)
2,063,698 4.3 % Richard F. Wallman
93,374 * Elizabeth H. Weatherman(5)
15,861,776 32.7 % All directors and executive officers as a group (13 persons)
18,946,463 38.6 % Principal shareholders:
Warburg Pincus Entities (TMG Holdings Coöperatief U.A.)(6)
15,846,809 32.7 % T. Rowe Price Associates, Inc.(7)
4,555,390 9.3 % * Represents beneficial ownership of less than 1% of our outstanding ordinary shares. (1) Includes for the persons listed below the following ordinary shares subject to options held by that person that are currently exercisable or become exercisable within 60 days of February 10, 2014 and ordinary shares issuable upon the vesting of stock awards granted in the form of restricted stock units within 60 days of February 10, 2014: Name
Options Stock awards in the form
of restricted stock unitsDavid H. Mowry
43,433 — Shawn T McCormick
15,991 — Gordon W. Ummersen
— — Terry M. Rich
33,261 — Stéphan Epinette
118,871 — Sean D. Carney
7,349 1,605 Richard B. Emmitt
7,349 698 Kevin C. O’Boyle
54,224 — Alain Tornier
7,349 558 Richard F. Wallman
41,724 — Elizabeth H. Weatherman
7,349 628 All directors and executive officers as a group (13 persons)
511,815 3,489 Unless otherwise(2) Includes 15,846,809 ordinary shares held by affiliates of Warburg Pincus & Co. Mr. Carney is a Partner of Warburg Pincus & Co. and a Member and a Managing Director of Warburg Pincus LLC. All ordinary shares indicated as owned by Mr. Carney are included because of his affiliation with the Warburg Pincus Entities (as defined below). See note (6) below. Mr. Carney disclaims beneficial ownership of all securities that may be deemed to be beneficially owned by the Warburg Pincus Entities, except to the extent of any pecuniary interest therein. Mr. Carney’s address is c/o Warburg Pincus LLC, 450 Lexington Avenue, New York, New York 10017. (3) Includes: (i) 31,003 shares held in Mr. Emmitt’s IRA account, (ii) 402 shares held by Mr. Emmitt’s spouse, (iii) 316 shares held by an IRA account of Mr. Emmitt’s spouse, and (iv) 300,500 shares held by Vertical Fund I, L.P., a Delaware limited partnership (VFI), and 39,858 shares held by Vertical Fund II, L.P., a Delaware limited partnership (VFII). The Vertical Group, L.P., a Delaware limited partnership, is the sole general partner of each of VFI and VFII, and The Vertical Group GP, LLC controls The Vertical Group, L.P. Mr. Emmitt is a Member and Manager of The Vertical Group GP, LLC, which controls The Vertical Group, L.P. All ordinary shares indicated as owned by Mr. Emmitt are included because of his affiliation with The Vertical Group, L.P. Mr. Emmitt disclaims beneficial ownership of all securities that may be deemed to be beneficially owned by The Vertical Group, L.P., except to the extent of any indirect pecuniary interest therein. (4) Includes 2,049,290 ordinary shares held by KCH Oslo AS (KCH Oslo). KCH Stockholm AB wholly owns KCH Oslo, and Mr. Tornier wholly owns KCH Stockholm AB. All ordinary shares indicated as owned by Mr. Tornier are included because of his affiliation with these entities. (5) Includes 15,846,809 ordinary shares held by affiliates of Warburg Pincus & Co. Ms. Weatherman is a Partner of Warburg Pincus & Co. and a Member and a Managing Director of Warburg Pincus LLC. All ordinary shares indicated as owned by Ms. Weatherman are included because of her affiliation with the Warburg Pincus Entities. See note (6) below. Ms. Weatherman disclaims beneficial ownership of all securities that may be deemed to be beneficially owned by the Warburg Pincus Entities, except to the extent of any pecuniary interest therein. Ms. Weatherman’s address is c/o Warburg Pincus LLC, 450 Lexington Avenue, New York, New York 10017. (6) Reflects ordinary shares held by TMG Holdings Coöperatief U.A., a Dutch coöperatief (TMG). TMG is wholly owned by Warburg Pincus (Bermuda) Private Equity IX, L.P., a Bermuda limited partnership (WP Bermuda IX), and WP (Bermuda) IX PE One Ltd., a Bermuda company (WPIX PE One). The general partner of WP Bermuda IX is Warburg Pincus (Bermuda) Private Equity Ltd., a Bermuda company (WP Bermuda Ltd.). WP Bermuda IX is managed by Warburg Pincus LLC, a New York limited liability company (WP LLC, and together with WP Bermuda IX, WPIX PE One and WP Bermuda Ltd., the Warburg Pincus Entities). Charles R. Kaye and Joseph P. Landy are the Managing General Partners of Warburg Pincus & Co., a New York general partnership (WP), and Managing Members andCo-Chief Executive Officers of WP LLC and may be deemed to control the Warburg Pincus Entities. Each of the Warburg Pincus Entities, Mr. Kaye and Mr. Landy has shared voting and investment control of all of the ordinary shares referenced above. By reason of the provisions of Rule 16a-1 of the Securities Exchange Act of 1934, as amended, Mr. Kaye, Mr. Landy and the Warburg Pincus Entities may be deemed to be the beneficial owners of the ordinary shares held by TMG. Each of Mr. Kaye, Mr. Landy and the Warburg Pincus Entities disclaims beneficial ownership of the ordinary shares referenced above except to the extent of any pecuniary interest therein. The address of the Warburg Pincus entities is 450 Lexington Avenue, New York, New York 10017. (7) Based solely on information contained in a Schedule 13D of T. Rowe Price Associates, Inc., an investment advisor, filed with the SEC on February 12, 2014, reflecting beneficial ownership as of December 31, 2013, with sole investment discretion with respect to all such shares, sole voting authority with respect to 529,100 shares and no voting authority with respect to 4,027,290 shares. The address of T. Rowe Price Associates, Inc. is 100 East Pratt Street, Baltimore, Maryland 21202. Securities Authorized for
each listed shareholder is c/o Tornier N.V., Fred Roeskestraat 123, 1076 EE Amsterdam, the Netherlands.Issuance Under Equity Compensation PlansOrdinary shares
beneficially ownednumber % Directors, Executive and Other Officers:
Douglas W. Kohrs(1)
1,877,866 4.7 % Carmen L. Diersen
17,500 * Robert J. Ball(2)
146,874 * Ralph E. Barisano, Jr.(3)
63,095 * Stéphan Epinette(4)
45,278 * Andrew E. Joiner(5)
94,270 * Jamal D. Rushdy(6)
88,051 * James C. Harber(7)
68,438 * James E. Kwan(8)
125,590 * Kevin M. Klemz
— — Gregory Morrison
— — Michael J. Doty(9)
123,571 * Elizabeth H. Weatherman(10)
18,491,809 47.4 % Sean D. Carney(11)
18,799,507 48.2 % Pascal E.R. Girin
— — Alain Tornier(12)
3,953,089 10.1 % Richard B. Emmitt(13)
3,383,101 8.7 % Kevin C. O'Boyle
— — Richard F. Wallman(14)
54,708 * All Directors, Executive and Other Officers as a Group
28,514,740 69.7 % Principal Shareholders:
Warburg Pincus entities (TMG Holdings Coöperatief U.A.)(15)
18,491,809 47.4 % KCH Stockholm AB(16)
3,485,292 8.9 % Vertical Group, L.P.(17)
3,383,101 8.7 % *Represents beneficial ownership of less than 1% ofThe table below provides information about ourstock.(1)Includes 425,015ordinary shares307,698 ordinary shares held by STAK and options exercisable for 1,145,153 ordinary shares. Mr. Kohrs is a member of the board of directors of STAK, which board is authorized to act by the affirmative vote of two of its members. All shares indicated as owned by Mr. Kohrsthatare held by STAK are included because of his affiliation with STAK. Mr. Kohrs disclaims all beneficial ownership in such shares.(2)Includes options exercisable for 146,874 ordinary shares.(3)Includes 3,720 ordinary shares and options exercisable for 59,375 ordinary shares.(4)Includes 1,528 ordinary shares and options exercisable for 43,750 ordinary shares.(5)Includes options exercisable for 94,270 ordinary shares.(6)Includes 2,427 ordinary shares and options exercisable for 85,624 ordinary shares.(7)Includes 1,043 ordinary shares and options exercisable for 67,395 ordinary shares.(8)Includes 384 ordinary shares and options exercisable for 125,206 ordinary shares.
(9)Includes options exercisable for 113,541 shares held by Mr. Doty and 10,030 ordinary shares held by STAK, on behalf of Mr. Doty's wife, Diane M. Doty.(10)Includes 18,491,809 shares held by affiliates of Warburg Pincus & Co., or WP. Ms. Weatherman is a Partner of WP and a Managing Director of Warburg Pincus LLC, or WP LLC. All shares indicated as owned by Ms. Weatherman are included because of her affiliation with the Warburg Pincus entities. Ms. Weatherman disclaims all beneficial ownership in such shares. Ms. Weatherman's address is c/o Warburg Pincus LLC, 450 Lexington Avenue, New York, New York 10017.(11)Includes 18,491,809 shares held by affiliates of WP and 307,698 ordinary shares held by STAK. Mr. Carney is a Partner of WP and a Managing Director of WP LLC. All shares indicated as owned by Mr. Carney are included because of his affiliation with the Warburg Pincus entities. Mr. Carney disclaims all beneficial ownership in such shares. Mr. Carney is a member of the board of directors of STAK, which board is authorized to act by the affirmative vote of two of its members. All shares indicated as owned by Mr. Carney that are held by STAK are included because of his affiliation with STAK. Mr. Carney disclaims all beneficial ownership in such shares. Mr. Carney's address is c/o Warburg Pincus LLC, 450 Lexington Avenue, New York, New York 10017.(12)Includes 3,485,292 shares held by KCH Stockholm AB, or KCH, and 467,797 shares held by Phil Invest ApS. Mr. Tornier wholly owns both KCH and Phil Invest ApS. All shares indicated as owned by Mr. Tornier are included because of his affiliation with these entities.(13)Includes 3,383,101 shares held by the Vertical Group, L.P., or The Vertical Group. Mr. Emmitt is a Member and Manager of The Vertical Group GP, LLC, which controls The Vertical Group. All shares indicated as owned by Mr. Emmitt are included because of his affiliation with The Vertical Group. Mr. Emmitt disclaims all beneficial ownership in such shares. Mr. Emmitt's address is c/o The Vertical Group, L.P., 25 DeForest Avenue, Summit, New Jersey 07901.(14)Includes 42,208 ordinary shares held by STAK on behalf of Mr. Wallman and options exercisable for 12,500 ordinary shares.(15)Reflects shares held by TMG Holdings Coöperatief U.A., or TMG, a Dutch coöperatief. TMG is owned by WP Bermuda, a Bermuda limited partnership, and WP (Bermuda) IX PE One Ltd., or PE One, a Bermuda company. The general partner of WP Bermuda is Warburg Pincus (Bermuda) Private Equity Ltd., or WPPE, a Bermuda company. Each of WP Bermuda, PE One and WPPE is managed by WP LLC. Charles R. Kaye and Joseph P. Landy are the Managing General Partners of WP, and Managing Members and Co-Presidents of WP LLC andmay bedeemed to control the Warburg Pincus entities. Eachissued under our equity compensation plans as ofMr. Kaye and Mr. Landy disclaims beneficial ownership of all shares owned by Warburg Pincus entities. TMG, WP Bermuda, PE One, WPPE, WP LLC and WP are collectively referred to in this Prospectus as Warburg Pincus. The address of the Warburg Pincus entities is 450 Lexington Avenue, New York, New York 10017.(16)KCH, a Swedish entity, is wholly owned by Alain Tornier, a member of our board of directors. The address of KCH is Hamilton Advokatbyrå Karlstad AB, Kungsgatan 2A, Box 606, 651 13 Karlstad, Sweden.(17)Includes 3,383,101 shares held by Vertical Fund I, L.P., or VFI, a Delaware limited partnership, and Vertical Fund II, L.P., or VFII, a Delaware limited partnership. The Vertical Group L.P., a Delaware limited partnership, is the sole general partner of each of VFI and VFII, and The Vertical Group GP, LLC controls The Vertical Group L.P. The
Table of ContentsDecember 29, 2013.sole members and managers of The Vertical Group GP, LLC are Messrs. Tony M. Chou, Richard B. Emmitt, Yue-Teh Jang, Jack W. Lasersohn and John E. Runnells, and these five individuals share voting and investment power over securities held by The Vertical Group, VFI and VFII. The address of The Vertical Group L.P., the Vertical Group GP, LLC, VFI and VFII is 25 DeForest Avenue, Summit, New Jersey 07901.None of our shareholders has informed us that he or she is affiliated with a registered broker-dealer or is in the business of underwriting securities. We are not aware of any arrangement that may, at a subsequent date, result in a change of control of our Company.Plan category
Number of securities
to be issued upon
exercise of outstanding
options, warrants and
rights
(a)Weighted-average
exercise price of
outstanding options,
warrants and rights
(b)Number of securities
remaining available for
future issuance under
equity compensation
plans (excluding
securities
reflected in column (a))
(c)Equity compensation plans approved by security holders
3,195,521 $ 19.67 2,435,228 Equity compensation plans not approved by security holders
— — — Total
3,195,521 $ 19.67 2,435,228 (1) Amount includes ordinary shares issuable upon the exercise of stock options granted under the Tornier N.V. Amended and Restated Stock Option Plan and the Tornier N.V. Amended and Restated 2010 Incentive Plan and ordinary shares issuable upon the vesting of stock awards in the form of restricted stock units granted under the Tornier N.V. Amended and Restated 2010 Incentive Plan. (2) Excludes employee stock purchase rights under the Tornier N.V. 2010 Employee Stock Purchase Plan, as amended. Under such plan, each eligible employee may purchase ordinary shares at semi-annual intervals on June 30th and December 31st each calendar year at a purchase price per share equal to 85% of the closing sales price per share of our ordinary shares on the last day of the offering period. (3) Included in the weighted-average exercise price calculation are 572,303 stock awards granted in the form of restricted stock units with a weighted-average grant price of $19.54. The weighted-average per share exercise price of all outstanding stock options as of December 29, 2013 and reflected in column (a) was $18.69. (4) Amount includes 2,132,821 ordinary shares remaining available for future issuance under the Tornier N.V. Amended and Restated 2010 Incentive Plan and 302,407 ordinary shares remaining available for future issuance under the Tornier N.V. 2010 Employee Stock Purchase Plan, as amended. No shares remain available for grant under the Tornier N.V. Amended and Restated Stock Option Plan since such plan was terminated with respect to future grants upon our initial public offering in February 2011. ItemITEM 13. CERTAIN RELATIONSHIPS AND RELATED TRANSACTIONS, AND DIRECTOR INDEPENDENCECertain Relationships and Related Transactions
and Director Independence.Certain Relationships and Related TransactionsWe describe below transactions
and series of similar transactionsthat have occurredthissince the beginning of our last fiscal year, orduring our last three fiscal yearsany currently proposed transactions, to which we were or are aparty or will be a partyparticipant and in which:•- the amounts involved exceeded or will exceed $120,000; and
•a related person (including any director, executive officer, holder of more than 5% of our ordinary shares or any member of their immediatefamilyfamily) had or will have a direct or indirect material interest.We refer to these transactions as “related party transactions.” As provided in our audit committee charter, all related party transactions are to be reviewed and pre-approved by our audit committee. In determining whether to approve a related party transaction, our audit committee generally will evaluate the transaction in terms of (i) the benefits to us; (ii) the impact on a director’s independence in the event the related person is a director, an immediate family member of a director or an entity in which a director is a partner, shareholder or executive officer; (iii) the availability of other sources for comparable products or services; (iv) the terms and conditions of the transaction; and (v) the terms available to unrelated third parties or to employees generally. Our audit committee will then document its findings and conclusions in written minutes. In the event a transaction relates to a member of our audit committee, that member will not participate in the audit committee’s deliberations.
The following persons and entities that participated in the transactions
listeddescribed in this section were related persons at the time of the transaction:KCH Stockholm ABAlain Tornier and Related Entities.AlainTornier.KCH Stockholm AB, or KCH, holds more than 5% of our outstanding shares. In addition, KCHTornier iswholly owned by Mr. Tornier,a member of our board of directors. Mr. Tornier wholly owns KCH Stockholm AB, which wholly owns KCH Oslo AS, which holds approximately 4.2% of our outstanding ordinary shares as of February 20, 2014.TMG Holdings Coöperatief U.A., Warburg Pincus (Bermuda) Private Equity IX, L.P., Sean D. Carney and Elizabeth H.
Weatherman and Sean D. Carney.Weatherman. TMG Holdings Coöperatief U.A., or TMG, holdsmore than 5%approximately 32.7% of our outstandingshares.ordinary shares as of February 20, 2014. Our directors,Ms.Sean D. Carney and Elizabeth H. Weatherman,and Mr. Carneyare Managing Directors of Warburg Pincus LLC, which manages TMG as well as its parent entities Warburg Pincus (Bermuda) Private Equity IX, L.P., or WP Bermuda, WP (Bermuda) IX PE One Ltd. and Warburg Pincus (Bermuda) Private Equity Ltd., or WPPE. Furthermore, Mr. Carney and Ms. Weathermanand Mr. Carneyare Partners of Warburg Pincus & Co., the sole member of WPPE.Vertical Fund I, L.P., Vertical Fund II, L.P. and Richard B. Emmitt.
Vertical Fund I, L.P., or VFI, and Vertical Fund II, L.P., or VFII, together hold more than 5% of our outstanding shares. In addition, Mr.Richard B. Emmitt, a member of our board of directors, is a Member and Manager of The Vertical Group, L.P.,or The Vertical Group,which is the sole general partner of each ofVFIVertical Fund I, L.P. andVFII.Vertical Fund II, L.P. Mr. Emmitt is also a Member and Manager of The Vertical Group GP, LLC, which controls The VerticalGroup.Group, L.P.Douglas W. Kohrs.Mr. Kohrs is our Chief Executive Officer andWe are party to amembersecurityholders’ agreement with certain of ourboard of directors.Richard F. Wallman.Mr. Wallman is a member of our board of directors.Private PlacementsOn February 29, 2008, we issued warrants and notes in a private placement transaction to related parties. The warrants were immediately exercisable and issued at an exercise price of $16.98 per share as partial consideration for loans in the amounts indicated below. The notes carry a fixed interest rateof 8.0% per annum with interest payments accrued semi-annually and mature on February 28, 2013. The related parties involved in the transaction included:Related partyNumber of
warrants issuedAmount of note WP Bermuda
2,211,072 € 24,700,000 VFI and VFII
365,409 € 4,082,000 KCH
313,310 € 3,500,000 Douglas W. Kohrs
50,309 € 562,000 Diane Doty(1)
14,860 € 166,000 (1)Wife of Michael Doty, our Chief Financial Officer at the time.
On April 3, 2009, we issued immediately exercisable warrants in a private placement to related parties at an exercise price of $16.98 per share as partial consideration for loans in the amounts indicated below. The notes carry a fixed interest rate of 8.0% per annum with interest payments accrued semi-annually and mature on March 31, 2014. The related parties involved in the transaction included:Related partyNumber of
warrants issuedAmount of note WP Bermuda
890,777 € 11,204,000 KCH
190,813 € 2,400,000 Richard F. and Amy Wallman(1)
20,671 € 260,000 Douglas W. Kohrs
20,512 € 258,000 (1)Wife of Mr. Wallman.
On March 26, 2010, we sold 13,333 shares to Mr. Wallman for $300,000. Mr. Wallman's shares were purchased by Stichting Administratiekantoor Tornier, or STAK, on behalf of Mr. Wallman. STAK was established as a foundation under Dutch law to hold our ordinary shares on behalf of certain shareholders.Warrant ExchangeOn May 25, 2010, we completed agreements with 100% of the warrant holders that acquired warrants under the February 29, 2008, and April 3, 2009, private placement agreements listed above. Each warrant holder agreed to exchange their warrants under the February 29, 2008, and April 3, 2009, agreements for Tornier B.V. ordinary shares at an exchange ratio of 0.6133 and 0.6410, respectively. We completed this exchange in order to avoid future variability in our statement of operations from revaluation of the warrants as they were required to be valued at fair value at each reporting period with changes in the fair value reported in current period earnings. In addition, we believed that the number of existing warrants represented potential dilution that may not be desirable to future investors. The exchange ratio used was developed based on the ratio of our estimate of the fair value of each individual warrant to the fair value of each ordinary share. We estimated the fair value of each warrant used in the calculation of the exchange ratio using a Black-Scholes option pricing model.Acquisitions and Other Corporate Transactions with Related PartiesOn July 18, 2006, Tornier N.V., formerly known asshareholders, including TMG,B.V., entered into a Securityholders' Agreement with TMG, TMG Partners U.S. LLC, Mr. Kohrs, VFI, VFII, KCH, Mr. Tornier,WP Bermuda, Vertical Fund I, L.P., Vertical Fund II, L.P., KCH Stockholm AB and(by subsequent joinder agreements)Mr. Tornier. Under director nomination provisions of this agreement, TMGPartners II LLC, TMG Partners III LLC, Split Rock, STAK, Medtronic and DVO TH, or, collectively,has theSecurityholders. The agreement grants eachof the Securityholders arightof first refusal with respect to shares sold by another Securityholder. The Securityholders are further obligated to observe certain limitations on the transfer of their shares, such as tag-along and drag-along rights. These limitations will terminate in the event of an initial public offering approved by our board of directors. In addition, on August 27, 2010, the agreement was amended to allow TMGto designate threeof the eightdirectors to be nominated to our board of directors for so long as TMG beneficially owns at least 25% oftheour outstanding ordinary shares, twoof the eightdirectors for so long as TMG beneficially owns at least 10% but less than 25% oftheour outstanding ordinary shares and oneof the eight directorsdirector for so long as TMG beneficially owns at least 5% but less than 10% oftheour outstandingshares, and the Company hasordinary shares. We agreed to useitsour reasonable best efforts to cause the TMG designees to beelected. Further,elected as directors. TMG holds approximately 32.7% of our outstanding ordinary shares as of February 20, 2014. Mr.Kohrs will continue to be entitled to be nominated for election to our boardCarney, Ms. Weatherman and Mr. Emmitt are the current directors who are designees ofdirectors until termination of his employment.TMG. The securityholders’ agreement terminates upon the written consent of all parties to the agreement.Mr. Kohrs serves as ManagerWe are party to a registration rights agreement with certain of our shareholders, including entities affiliated with certain of our directors, including TMG, Vertical Fund I, L.P., Vertical Fund II, L.P. and KCH Stockholm AB. Pursuant to the registration rights agreement, we have agreed to (i) use our reasonable best efforts to effect up to three registered offerings of at least $10 million each upon a demand of TMG or its affiliates and one registered offering of at least $10 million upon a demand of Vertical Fund I, L.P. or Vertical Fund II, L.P., (ii) use our reasonable best efforts to become eligible for use of Form S-3 for registration statements and once we become eligible TMG or its affiliates shall have the right to demand an unlimited number of registrations of at least $10 million each on Form S-3 and (iii) maintain the effectiveness of each such registration statement for a period of 120 days or until the distribution of the
Boardregistrable securities pursuant to the registration statement is complete. We have also granted certain incidental or “piggyback” registration rights with respect to the registrable shares, subject to certain limitations and restrictions, including volume and marketing restrictions imposed by the underwriters of the offering with respect to which the rights are exercised. Under the registration rights agreement, we have agreed to bear the expenses, including the fees and disbursements of one legal counsel for the holders, in connection with the registration of the registrable securities, except for any underwriting commissions relating to the sale of the registrable securities.On May 15, 2013, we completed an underwritten public offering of our ordinary shares pursuant to which TMG,
Partners U.S. LLC,Vertical Fund I, L.P. andas Managing MemberVertical Fund II, L.P. participated and sold an aggregate ofTMG Partners II LLC and TMG Partners III LLC.2,875,000 ordinary shares in addition to the 5,175,000 shares sold by us at a per share price of $16.15. Pursuant to the terms of the registration rights agreement described above, we paid substantially all of the expenses in connection with the offering, other than underwriting commissions, which equaled approximately $560,000.On February 9, 2007, we signed an exclusive, worldwide license and supply agreement with Tepha for its poly-4-hydroxybutyrate polymer for a license fee of $110,000, plus an additional $750,000 as consideration for certain research and development. Tepha is further entitled to royalties of up to 5% of sales under these licenses. We amended this agreement in December 2011 to include certain additional rights and an option to license additional products. We paid
$30,000$0.1 million of minimum royalty paymentsin April of 2010during 2013 to Tepha under the terms of this agreement.VFIAdditionally, we made payments of $0.5 million during 2013 related to the purchase of materials. Vertical Fund I, L.P. andVFIIVertical Fund II, L.P. in the aggregate own approximately 20% ofTepha'sTepha’s outstanding common and preferred stock. In addition, Mr. Emmitt servesas a director to Tepha.on Tepha’s board of directors.At the time of the Axya acquisition, TMG entered into an agreement with KCH, which held mandatorily convertible zero coupon bonds issued by us at the time of the acquisition by the Investor Group. The bonds had a par value of €29,600,000 and were convertible into ordinary shares at a conversion price of €10.0629. In connection with the Axya transaction, TMG agreed that we would either issue to KCH additional mandatorily convertible zero coupon bonds or decrease the conversion price of the zero coupon bonds held by KCH to increase the number of shares issuable upon conversion, if the performance of Axya did not meet certain thresholds. Axya did not meet the performance thresholds within the prescribed time. On October 1, 2009, the mandatorily convertible zero coupon bonds were converted to ordinary shares pursuant to their terms and we issued 2,941,498 ordinary shares to KCH. Rather than adjust the notes or issue additional notes prior to conversion, we also issued KCH an additional 185,698 ordinary shares in satisfaction of the obligation created by TMG.On January 22, 2008, we signed an agreement with BioSET to develop, commercialize and distribute products incorporating
BioSET'sBioSET’s F2A synthetic growth factor technology in the field of orthopaedic and podiatric soft tissue repair. As amended on February 10, 2010, this agreement granted us an option to purchase an exclusive, worldwide license for such products in consideration for a payment of$1$1.0 million. We exercised this option on February 10, 2010. Upon FDA approval of certain products, an additional $2.5 million will become due. BioSET is entitled to royalties of up to 6% for sales of products under this agreement. We have not accrued or paid any royalties under the terms of this agreement.VFIVertical Fund I, L.P. andVFIIVertical Fund II, L.P. in the aggregate own approximately15%20% ofBioSET'sBioSET’s outstandingshares and Mr. Emmitt serves on its board of directors.capital stock.On June 4, 2010, we issued 43,633 ordinary shares to KCH, having a value equal to €0.7 million. This amount equaled the total amount we owed to Mr. Tornier for past services performed under the terms of his consulting agreement, dated July 31, 2006, based on a per-share price of $22.50 and a foreign currency exchange rate of 1.3479 U.S. dollars for 1 Euro, the spot conversion rate on March 31, 2010. Mr. Tornier's consulting agreement was terminated effective as of March 31, 2010.On July 29, 2008, we formed a real estate holding company,
(SCI Calyx)SCI Calyx, together with Mr. Tornier. SCI Calyx is owned 51% by us and 49% by Mr. Tornier. SCI Calyx was initially capitalized by a contribution of capital of €10,000 funded 51% by us and 49% by Mr. Tornier. SCI Calyx then acquireda combined manufacturing and office facility in Montbonnot, France, for approximately $6.1 million. The manufacturing and office facility
acquired will beis used to support the manufacture of certain of our current products and house certain of our operationsalready locatedin Montbonnot, France. This real estate purchase was funded through mortgage borrowings of $4.1 million and $2.0 million cash borrowed from the two current shareholders of SCI Calyx. The $2.0 million cash borrowed from the SCI Calyx shareholders originally consisted of a $1.0 million note due to Mr. Tornier and a $1.0 million note due to Tornier SAS, which is our wholly owned French operating subsidiary. Both of the notes issued by SCI Calyx bear interest at thethree month Euriborthree-month Euro Libor rate plus 0.5% and have no stated term. During 2010, SCI Calyx borrowed approximately $1.4 million from Mr. Tornier in order to fund on-going leasehold improvements necessary to prepare the Montbonnot facility for its intended use. This cash was borrowed under the same terms as the original notes. As ofJanuary 2, 2011,December 29, 2013, SCI Calyx hadrelated-party debt outstanding to Mr. Tornier of$2.4$2.3 million. The SCI Calyx entity is consolidated by us, and the related real estate and liabilities are included intheour consolidated balance sheets. On September 3, 2008, Tornier SAS, our French operating subsidiary, entered into a lease agreement with SCI Calyx relating to these facilities. The agreement, which terminates in 2018, provides for an annual rent payment of €440,000, which has subsequently been increased and is currently€748,074 annually.€904,908. As ofJanuary 2, 2011,December 29, 2013, future minimum payments under this lease were€5.7€4.3 million in the aggregate.Since 2006, Tornier SAS has entered into various lease agreements with entities affiliated with Mr. Tornier or members of his family. On May 30, 2006, Tornier SAS entered into two lease agreements with Mr. Tornier and his sister, Colette Tornier, relating to our facilities in Saint-Ismier, France. The agreements provide for annual rent payments of €104,393 and €28,500, respectively, which have subsequently been increased and are currently €119,362 and €32,587 annually, respectively.On December 29, 2007, Tornier SAS entered into a lease agreement with Animus SCI, relating to our facilities in Montbonnot Saint Martin, France. On August 18, 2012, the parties amended the lease agreement to extend the term until May 31, 2022 and reduce the annual rent. The amended agreement provides for an initial annual rent payment of
€252,545,€279,506 annually, whichhaswas subsequentlybeenincreasedand is currently €288,756 annually.to €288,564. Animus SCI is wholly owned by Mr.Tornier. On December 29, 2007, Tornier SAS entered into a lease agreement with Cymaise SCI, relating to our facilities in Saint-Ismier, France. The agreement provides for an annual rent payment of €315,865, which has subsequently been increased and is currently €361,158 annually. Cymaise SCI is wholly owned by Mr. Tornier and his sister, ColetteTornier. On February 6, 2008, Tornier SAS entered into a lease agreement with Balux SCI, effective as of May 22, 2006, relating to our facilities in Montbonnot Saint Martin, France. On August 18, 2012, the parties amended the lease agreement to extend the term until May 31, 2022 and reduce the annual rent. The amended agreement provides for an initial annual rent payment of€480,000,€252,545, whichhaswas subsequentlybeenincreasedand is currently €548,828 annually.to €548,465. Balux SCI is wholly owned by Mr. Tornier and his sister, Colette Tornier.Each of the agreements will terminate in 2012.As ofJanuary 2, 2011,December 29, 2013, future minimum payments under all of these agreements were€1.9€0.8 million in the aggregate.On June 17, 2008, we entered into an exclusive worldwide licensing agreement with C2M Medical, a medical device development company, under which we assumed the rights to certain intellectual property relating to bone anchor technology including the Cinch system. C2M had acquired the technology from Sapphire Medical, Inc., or Sapphire, in April 2007 for a purchase price of $7.5 million and milestone payments of $12.5 million, which C2M paid in 2008. In addition, we have committed, and are currently paying, to Sapphire quarterly earn-out fees of 25% of U.S. sales related to Cinch intellectual property for the first three years after launch, an obligation we assumed in the course of our agreement with C2M. The agreement also included an option to acquire C2M Medical. We exercised this option on March 26, 2010, when we purchased 100% of the stock of C2M Medical in exchange for approximately 1.0 million ordinary shares, valued at $22.50 per share at the time. C2M Medical had been founded and was held in part by TMG, VFI, VFII and Mr. Kohrs. In addition, Mr. Carney, Mr. Emmitt and Mr. Kohrs were members of C2M Medical's board of directors. Prior to our exercise of the option C2M Medical was determined to be a variable interest entity in accordance with U.S. GAAP and we consolidated C2M Medical in our financial statements beginning in June of 2008, the date at which we signed an exclusive technology license with C2M Medical.The transaction included:Related partyNumber of
shares issuedTotal consideration
value of shares issuedTMG
504,876 $ 11,359,714 VFI and VFII
504,876 $ 11,359,714 Douglas W. Kohrs
15,466 $ 348,000 Review, Approval or Ratification of Transactions with Related PersonsAs provided in our audit committee charter, all related party transactions are to be reviewed and pre-approved by our audit committee. A "related party transaction" is defined to include any transaction or series of transactions exceeding $120,000 in which we are a participant and any related person has a material interest. Related persons would include our directors, executive officers (and immediate family members of our directors and executive officers) and persons controlling over five percent of our outstanding ordinary shares. In determining whether to approve a related party transaction, the audit committee will generally evaluate the transaction in terms of (i) the benefits to us; (ii) the impact on a director's independence in the event the related person is a director, an immediate family member of a director or an entity in which a director is a partner, shareholder or executive officer; (iii) the availability of other sources for comparable products or services; (iv) the terms and conditions of the transaction; and (v) the terms available to unrelated third parties or to employees generally. The audit committee will then document its findings and conclusions in written minutes. In the event a transaction relates to a member of our audit committee, that member will not participate in the audit committee's deliberations.Director Independence
The information regarding director independence is disclosed in “Part III—Item
10 "Directors,10. Directors, Executive Officers and Corporate Governance—Committees of theBoardof Directors"Structure and Composition” and in “Part III—Item 10. Directors, Executive Officers and Corporate Governance—Board Committees” of thisannualreport.ItemITEM 14.Principal Accountant Fees and Services.
PRINCIPAL ACCOUNTING FEES AND SERVICESThe Audit CommitteeOur audit committee pre-approves all audit and permissible non-audit services to be provided to us by our independent registered public accounting firm prior to commencement of services.The Audit Committee ChairmanOur audit committee chairman has the delegated authority to pre-approve such services up to a specified aggregate fee amount. These pre-approval decisions are presented to the fullAudit Committeeaudit committee at its next scheduled meeting.The following table shows the fees that we paid or accrued for audit and other services provided by Ernst & Young LLP for
the years 20102013 and2009:2012:Fees2010 2009 Audit Fees
$ 841,226 $ 907,309 Audit-Related Fees
1,489,071 — Tax Fees
20,393 31,576 All other fees
3,155 128,455 Fees
2013 2012 Audit fees
$ 1,454,920 $ 1,467,055 Audit-related fees
— 113,060 Tax fees
— 84,015 All other fees
1,995 3,285 Total
$ 1,456,915 $ 1,667,415 In the above table,
"audit fees"“audit fees” are fees for professional services for the audit of our consolidated financial statements included in this annual report on Form 10-K, and the review of our consolidated financial statements included in quarterly reports on Form 10-Q and registration statements and for services that are normally provided by our independent registered public accounting firm in connection with statutory and regulatory filings or engagements;"audit-related fees"“audit-related fees” are fees for assurance and related servicesthat are reasonablyand include fees for services performed related tothe performance of the audit or review of our financial statements; "tax fees"due diligence on acquisitions.; “tax fees” are fees for tax compliance,tax advice on acquisitions, and tax planning; and
"all“all otherfees"fees” are fees for any services not included in the first three categories.ITEM 15. EXHIBITS, FINANCIAL STATEMENT SCHEDULES
Financial Statements
Our consolidated financial statements are included in “Part II—Item
Statements and Supplementary Data” of Part II of this report.15. Exhibits,8. FinancialStatement Schedules.(a)Financial Statement SchedulesFinancial Statements (See Item 8)The following financial statement schedule is provided below: Schedule II—Valuation and Qualifying Accounts.
Table of ContentsAll other schedules are omitted because the required information is inapplicable or the information is presented in the consolidated financial statements or related notes.Schedule II-Valuation and Qualifying Accounts
(In thousands)
Additions Deductions Balance at
beginning
of periodCharged to
costs &
expensesBalance at
end
of periodDescriptionDescribe(a) Describe(b) Allowance for Doubtful Accounts (in millions):
Year ended January 2, 2011
$ (2,667 ) $ (275 ) $ 307 $ 116 $ (2,519 ) Year ended December 27, 2009
$ (2,169 ) $ (601 ) $ 153 $ (50 ) $ (2,667 ) Year ended December 28, 2008
$ (1,879 ) $ (434 ) $ 119 $ 25 $ (2,169 ) (a)Additions Balance at
beginning
Charged to
costs &Deductions Balance at
endDescription
of period expenses Describe(a) Describe(b) of period Allowance for Doubtful Accounts:
Year ended December 29, 2013
$ (4,846 ) (1,220 ) 1,208 (222 ) $ (5,080 ) Year ended December 30, 2012
$ (2,486 ) (2,355 ) 87 (92 ) $ (4,846 ) Year ended January 1, 2012
$ (2,519 ) $ (775 ) $ 755 $ 53 $ (2,486 ) (a) Uncollectible amounts written off, net of recoveries. (b) Effect of changes in foreign exchange rates. Exhibits
The exhibits to this report are listed on an Exhibit Index, which follows the signature page to this report. A copy of any of the exhibits will be furnished at a reasonable cost, upon receipt of a written
off, netrequest for any such exhibit. Such request should be sent to Kevin M. Klemz, Senior Vice President, Chief Legal Officer and Secretary, Tornier, Inc., 10801 Nesbitt Avenue South, Bloomington, Minnesota 55437. The Exhibit Index indicates each management contract or compensatory plan or arrangement required to be filed as an exhibit to this report.Pursuant to the requirements of
recoveries.(b)EffectSection 13 or 15(d) ofchanges in foreign exchange rates.
Tablethe Securities Exchange Act ofContents1934, the registrant has duly caused this report to be signed on its behalf by the undersigned, thereunto duly authorized.(b) Exhibit IndexDated: February 21, 2014
TORNIER N.V. By /s/ David H. Mowry
David H. Mowry President and Chief Executive Officer (principal executive officer) By /s/ Shawn T McCormick Shawn T McCormick
Chief Financial Officer
(principal financial and accounting officer)Pursuant to the requirements of the Securities Exchange Act of 1934, this report has been signed below by the following persons on behalf of the registrant and in the capacities and on the dates indicated.
Name
Title
Date
/s/ DAVID H. MOWRY
President and Chief Executive Officer
(principal executive officer)
February 21, 2014 David H. Mowry /s/ SHAWN T MCCORMICK
Chief Financial Officer
(principal financial and accounting officer)
February 21, 2014 Shawn T McCormick /s/ SEAN D. CARNEY
Chairman of the Board February 21, 2014 Sean D. Carney /s/ RICHARD B. EMMITT
Director February 21, 2014 Richard B. Emmitt /s/ KEVIN C. O’BOYLE
Director February 21, 2014 Kevin C. O’Boyle /s/ ALAIN TORNIER
Director February 21, 2014 Alain Tornier /s/ RICHARDF. WALLMAN
Director February 21, 2014 Richard F. Wallman /s/ ELIZABETH H. WEATHERMAN
Director February 21, 2014 Elizabeth H. Weatherman TORNIER N.V.
EXHIBIT INDEX TO ANNUAL REPORT ON FORM10-K
FOR THE YEAR ENDED DECEMBER 29, 2013
Exhibit No.
Exhibit
Method of Filing
2.1
Agreement and Plan of Merger, dated as of August 23, 2012, by and among Tornier N.V., Oscar Acquisition Corp., OrthoHelix Surgical Designs, Inc. and the Representative* Incorporated by Reference Hereinreference to Exhibit NumberDescription of Document2.1 to Tornier’s Current Report on Form Date8-K as filed with the Securities and Exchange Commission on August 24, 2012 (File No. 001-35065) 3.1
Articles of Association of the Registrant*Tornier N.V.Incorporated by reference to Exhibit 3.1 to Tornier’s Current Report on Form 8-K as filed with the Securities and Exchange Commission on June 28, 2013 (File No. 001-35065) 4.1
4.1Registrant's Specimen Certificate for Ordinary Shares.Registration Statement on Form S-1, as amended (file number 333-167370)September 14, 20104.2
Registration Rights Agreement, dated July 16, 2010, by and among the investors on Schedule I thereto, the persons listed on Schedule II thereto and Tornier B.V.
Incorporated by reference to Exhibit 4.2 to Tornier’s Amendment No. 2 to Registration Statement on Form S-1as amended (file number 333-167370)
filed with the Securities and Exchange Commission on August 11, 2010 (Registration No. 333-167370)10.14.2
Amendment and Waiver to Registration Rights Agreement, dated as of July 16, 2010, by and among the Investors and Tornier N.V. Incorporated by reference to Exhibit 4.4 to Tornier’s Registration Statement on Form S-3 filed with the Securities and Exchange Commission on October 17, 2012 (Registration No. 333-184461) 10.1
Amended and Restated Employment Agreement, dated July 18, 2006,effective as of February 21, 2013, by and between Tornier, Inc. andDouglas W. Kohrs, as amended on August 26, 2010.David H. Mowry**
Registration StatementIncorporated by reference to Exhibit 10.1 to Tornier’s Current Report on FormS-1,8-K asamended (file number 333-167370)January 7, 2011filed with the Securities and Exchange Commission on February 21, 2013 (File No. 001-35065)10.210.2
Employment Agreement, dated June 21, 2010,September 4, 2012, by and between Tornier, Inc. andCarmen L. Diersen.Shawn T McCormick**
Registration StatementIncorporated by reference to Exhibit 10.5 to Tornier’s Annual Report on FormS-1, as amended (file number 333-167370)June 8, 201010-K for the fiscal year ended December 30, 2012 (File No. 001-35065)10.310.3
Employment Agreement, dated February 5, 2007,March 12, 2012, by and between Tornier, Inc. andMichael Doty.Terry M. Rich**
Registration StatementIncorporated by reference to Exhibit 10.9 to Tornier’s Annual Report on FormS-1, as amended (file number 333-167370)June 8, 201010-K for the fiscal year ended December 30, 2012 (File No. 001-35065)10.4Employment Agreement, dated April 28, 2008, by and between Tornier, Inc. and Andrew Joiner.Registration Statement on Form S-1, as amended (file number 333-167370)June 8, 201010.4
10.5
Permanent EmploymentAgreement,Contract, dated August 29, 2008, by and between Tornier, SAS and StéphanEpinette.Epinette**
Incorporated by reference to Exhibit 10.4 to Tornier’s Registration Statement on Form S-1as amended (file number 333-167370)
filed with the Securities and Exchange Commission on June 8, 2010 (Registration No. 333-167370)10.610.5
Employment Agreement, dated September 13, 2010,June 10, 2013, by and between Tornier, Inc. andKevin Klemz.Gordon Van Ummersen**
Registration StatementFiled herewith10.6
Tornier N.V. Amended and Restated 2010 Incentive Plan** Incorporated by reference to Exhibit 10.1 to Tornier’s Current Report on Form S-1, as amended (file number 333-167370)January 7, 20118-K filed with the Securities and Exchange Commission on June 29, 2012 (File No. 001-35065)10.710.7
Separation Agreement, dated February 19,Rules for the Grant of Qualified Stock Options to Participants in France under the Tornier N.V. 2010 Incentive Plan** Incorporated by and between Tornier, Inc. and Michael Doty.Registration Statementreference to Exhibit 10.1 to Tornier’s Quarterly Report on FormS-1, as amended (file number 333-167370)June 8, 201010.8Letter Agreement, dated December 8, 2008, by and between Tornier B.V. and Richard Wallman.Registration Statement on Form S-1, as amended (file number 333-167370)June 8, 201010-Q for the fiscal quarter ended July 3, 2011 (File No. 001-35065)Exhibit No.
Exhibit
Method of Filing
10.8
Rules for the Grant of Stock Grants in the Form of Qualified Restricted Stock Units to Grantees in France under the Tornier N.V. 2010 Incentive Plan** Incorporated by Reference Hereinreference to Exhibit 10.2 to Tornier’s Quarterly Report on Form 10-Q for the fiscal quarter ended July 3, 2011 (File No. 001-35065)ExhibitNumberDescription of DocumentFormDate10.9
10.9Form of Option Certificate under the Tornier N.V. 2010 Incentive Plan**Filed herewith 10.10
Form of Stock Grant Certificate (in the form of a Restricted Stock Unit) under the Tornier N.V. 2010 Incentive Plan** Filed herewith 10.11
Tornier N.V. Amended and Restated Stock Option Plan.Plan**Incorporated by reference to Exhibit 10.9 to Tornier’s Amendment No. 9 to Registration Statement on Form S-1 as amended (file numberfiled with the Securities and Exchange Commission on January 18, 2011 (Registration No. 333-167370)10.12
January 18, 201110.10
Form of Option Agreement under the Tornier N.V. Stock Option Plan for Directors andOfficers.Officers**
Incorporated by reference to Exhibit 10.9 to Tornier’s Registration Statement on Form S-1as amended (file number 333-167370)
filed with the Securities and Exchange Commission on June 8, 2010 (Registration No. 333-167370)10.1110.13
Tornier N.V. 2010 Employee Stock Purchase Plan** Incorporated by reference to Exhibit 10.42 to Tornier’s Amendment No. 9 to Registration Statement on Form S-1 filed with the Securities and Exchange Commission on January 18, 2011 (Registration No. 333-167370) 10.14
First Amendment of the Tornier N.V. 2010 Employee Stock Purchase Plan** Incorporated by reference to Exhibit 10.1 to Tornier’s Quarterly Report on Form 10-Q for the fiscal quarter ended October 2, 2011 (File No. 001-35065) 10.15
Tornier N.V. Corporate Performance Incentive Plan** Filed herewith 10.16
Retraite Supplémentaire maintained by Tornier SAS.SAS**
Incorporated by reference to Exhibit 10.10 to Tornier’s Registration Statement on Form S-1as amended (file number 333-167370)
filed with the Securities and Exchange Commission on June 8, 2010 (Registration No. 333-167370)10.1210.17
Asset Purchase Agreement, dated March 5, 2007,Form of Indemnification Agreement** Incorporated by and between DVO Acquisition, Inc. and Tornier B.V.
reference to Exhibit 10.40 to Tornier’s Amendment No. 3 to Registration Statement on Form S-1as amended (file numberfiled with the Securities and Exchange Commission on September 14, 2010 (Registration No. 333-167370)July 15, 201010.13Merger Agreement, dated January 22, 2007, by and among Nexa Orthopedics, Inc., Tornier US Holdings, Inc. and Nexa Acquisition, Inc.Registration Statement on Form S-1, as amended (file number 333-167370)July 15, 201010.18
10.14Agreement and Plan of Merger, dated February 27, 2007, by and among Tornier US Holdings, Inc., Axya Acquisition II, Inc. and Axya Holdings, Inc.Registration Statement on Form S-1, as amended (file number 333-167370)July 15, 201010.15
Contribution Agreement, dated March 26, 2010, by and between Tornier B.V., Vertical Fund I, L.P., Vertical Fund II, L.P., TMG Holdings Coöperatief U.A., Stichting Administratiekantoor Tornier, Fred B. Dinger III and Douglas W.Kohrs.Kohrs
Incorporated by reference to Exhibit 10.15 to Tornier’s Amendment No. 1 to Registration Statement on Form S-1as amended (file number 333-167370)
filed with the Securities and Exchange Commission on July 15, 2010 (Registration No. 333-167370)10.1610.19
WarrantLease Agreement dated February 29, 2008,as of May 14, 2012 between Liberty Property Limited Partnership, as Landlord, and Tornier, Inc., as TenantIncorporated by
and among Tornier B.V. and the former warrantholders party thereto.Registration Statementreference to Exhibit 10.1 to Tornier’s Current Report on FormS-1,8-K asamended (file number 333-167370)Julyfiled with theSecurities and Exchange Commission on May 15,
201010.17EUR 34,500,000 Loan Note Instrument, dated February 29, 2008, issued by Tornier B.V. in favor of the lenders thereto.Registration Statement on Form S-1, as amended (file number 333-167370)July 15, 20102012(File No. 001-35065)
Exhibit No.
Exhibit
Method of Filing
Incorporated by Reference HereinExhibitNumberDescription of DocumentFormDate10.1810.20
Warrant Agreement, dated April 3, 2009, by and among Tornier B.V. and the former warrantholders party thereto.Registration Statement on Form S-1, as amended (file number 333-167370)July 15, 201010.19EUR 37,000,000 Loan Note Instrument, dated April 3, 2009, issued by Tornier B.V. in favor of the lenders thereto.Registration Statement on Form S-1, as amended (file number 333-167370)July 15, 201010.20Warrant Exchange Agreement (2008), dated May 25, 2010, by and among Tornier B.V. and the former warrantholders party thereto.(3)Registration Statement on Form S-1, as amended (file number 333-167370)July 15, 201010.21Warrant Exchange Agreement (2009), dated May 25, 2010, by and among Tornier B.V. and the former warrantholders party thereto.Registration Statement on Form S-1, as amended (file number 333-167370)July 15, 201010.22
Commercialleases (two)Leases (Two), dated May 30, 2006, by and between Alain Tornier and Colette Tornier and TornierSAS.SAS
Incorporated by reference to Exhibit 10.22 to Tornier’s Amendment No. 2 to Registration Statement on Form S-1as amended (file number 333-167370)
filed with the Securities and Exchange Commission on August 11, 2010 (Registration No. 333-167370)10.2310.21
Commercial lease,Lease, dated December 29, 2007, by and between Animus SCI and TornierSAS.SAS
Incorporated by reference to Exhibit 10.23 to Tornier’s Amendment No. 2 to Registration Statement on Form S-1as amended (file number 333-167370)
filed with the Securities and Exchange Commission on August 11, 2010 (Registration No. 333-167370)10.2410.22
Rider No. 1 to Commercial
lease,Lease dated August 18, 2012 between Animus SCI andTornier SAS
Incorporated by reference to Exhibit 10.8 to Tornier’s Quarterly Report on Form 10-Q for the fiscal quarter ended September 30, 2012 (File No. 001-35065) 10.23
Commercial Lease, dated February 6, 2008, by and between Balux SCI and Tornier SAS.SAS
Incorporated by reference to Exhibit 10.24 to Tornier’s Amendment No. 2 to Registration Statement on Form S-1as amended (file number 333-167370)
filed with the Securities and Exchange Commission on August 11, 2010 (Registration No. 333-167370)10.2510.24
Rider No. 1 to the Commercial lease,Lease datedDecember 29, 2007, by andFebruary 6, 2008 dated August 18, 2012 betweenCymaiseBalux SCI and TornierSAS.SAS
Registration StatementIncorporated by reference to Exhibit 10.7 to Tornier’s Quarterly Report on FormS-1, as amended (file number 333-167370)August 11, 201010-Q for the fiscal quarter ended September 30, 2012 (File No. 001-35065)10.2610.25
Commercial lease,Lease, dated September 3, 2008, by and between SCI Calyx and TornierSAS.SAS
Incorporated by reference to Exhibit 10.26 to Tornier’s Amendment No. 2 to Registration Statement on Form S-1as amended (file number 333-167370)
filed with the Securities and Exchange Commission on August 11, 2010 (Registration No. 333-167370)10.2710.26
Commercial lease,Lease, dated December 23, 2008, by and between Seamus Geaney and Tornier Orthopedics IrelandLimited.Limited
Incorporated by reference to Exhibit 10.27 to Tornier’s Amendment No. 1 to Registration Statement on Form S-1as amended (file number 333-167370)
filed with the Securities and Exchange Commission on July 15, 2010 (Registration No. 333-167370)Incorporated by Reference HereinExhibitNumberDescription of DocumentFormDate10.2810.27
Securityholders'Securityholders’ Agreement, dated July 18, 2006, by and among the parties listed on Schedule I thereto, KCH Stockholm AB, Alain Tornier, Warburg Pincus (Bermuda) Private Equity IX, L.P., TMG B.V. (predecessor to Tornier B.V.).Incorporated by reference to Exhibit 10.28 to Tornier’s Amendment No. 3 to Registration Statement on Form S-1 as amended (file number 333-167370)filed with the Securities and Exchange Commission on September 14, 2010 (Registration No. 333-167370) 10.29Joinder Agreement, dated March 30, 2007, by and between Tornier B.V. and DVO—Extremity Solutions, LLC.Registration Statement on Form S-1, as amended (file number 333-167370)September 14, 201010.30Joinder Agreement, dated September 24, 2007, by and between Tornier B.V. and TMG Partners II LLC.Registration Statement on Form S-1, as amended (file number 333-167370)September 14, 201010.31Joinder Agreement, dated October 27, 2008, by and between Tornier B.V. and TMG Partners III LLC.Registration Statement on Form S-1, as amended (file number 333-167370)September 14, 201010.32Joinder Agreement, dated May 11, 2009, by and between Tornier B.V. and Split Rock Partners, L.P.Registration Statement on Form S-1, as amended (file number 333-167370)September 14, 201010.33Joinder Agreement, dated April 2008, by and between Tornier B.V. and Stichting Administratiekantoor Tornier.Registration Statement on Form S-1, as amended (file number 333-167370)September 14, 201010.34Joinder Agreement, dated May 25, 2010, by and between Tornier B.V. and Medtronic Bakken Research Center B.V.Registration Statement on Form S-1, as amended (file number 333-167370)September 14, 201010.35Quality Assurance Agreement, dated April 1, 1998, by and between CeramTec AG and Tornier SA.Registration Statement on Form S-1, as amended (file number 333-167370)September 14, 201010.36By-Laws of SCI Calyx.Registration Statement on Form S-1, as amended (file number 333-167370)August 11, 2010Incorporated by Reference HereinExhibitNumberDescription of DocumentFormDate10.3710.28
Amendment No. 1 to the Securityholders'Securityholders’ Agreement, dated August 27, 2010, by and among thesecurityholdersSecurityholders on Schedule I thereto and Tornier B.V.Incorporated by reference to Exhibit 10.37 to Tornier’s Amendment No. 3 to Registration Statement on Form S-1 as amended (file numberfiled with the Securities and Exchange Commission on September 14, 2010 (Registration No. 333-167370)10.29
September 14, 2010
By-Laws of SCI Calyx10.38Subscription Agreement, dated July 18, 2006,Incorporated byand between TMG B.V. and KCH Stockholm AB.
reference to Exhibit 10.36 to Tornier’s Amendment No. 2 to Registration Statement on Form S-1as amended (file number 333-167370)
filed with the Securities and Exchange Commission on August 11, 2010 (Registration No. 333-167370)Exhibit No.
10.39Exhibit
Conversion Notice,Method of Filing
10.30
Credit Agreement dated as of October 1, 2009,4, 2012 among Tornier N.V., Tornier, Inc., as Borrower, Bank of America, N.A., as Administrative Agent, SG Americas Securities, LLC, as Syndication Agent, BMO Capital Markets and JPMorgan Chase Bank, N.A., as Co-Documentation Agents, Merrill Lynch, Pierce, Fenner & Smith Incorporated and SG Americas Securities, LLC, as Joint Lead Arrangers and Joint Bookrunners, and the Other Lenders Party TheretoIncorporated by Tornier B.V. addressedreference toKCH Stockholm AB.Registration StatementExhibit 10.1 to Tornier’s Current Report on FormS-1,8-K asamended (file number 333-167370)August 11, 2010filed with the Securities and Exchange Commission on October 4, 2012 (File No. 001-35065)10.4010.31
FormFirst Amendment, dated as of Indemnification Agreement.May 6, 2013, to the Credit Agreement by and among Tornier N.V., Tornier, Inc., the Guarantors identified on the signature pages thereto, the Lenders party hereto and Bank of America, N.A., as Administrative Agent
Registration StatementIncorporated by reference to Exhibit 10.2 to Tornier’s Quarterly Report on FormS-1, as amended (file number 333-167370)September 14, 201010-Q for the fiscal quarter ended March 31, 2013 (File No. 001-35065)10.41Tornier N.V. 2010 Stock Incentive Plan.Registration Statement on Form S-1, as amended (file number 333-167370)October 4, 201012.1
10.42
Computation of Ratio of Earnings to Fixed ChargesTornier N.V. 2010 Employee Stock Purchase Plan.Registration Statement on Form S-1, as amended (file number 333-167370)January 18, 2011Filed herewith21.121.1
Subsidiaries of the Registrant.*Tornier N.V.
Filed herewith23.123.1
Consent of Ernst & Young LLP, an Independent Registered Public Accounting Firm.*Firm
Filed herewith31.131.1
Certification of Chief Executive Officer pursuant to Exchange Act Rules 13a-14(a)/15d-14(a), as adopted pursuant to Section 302 of theSarbanes-Oxley Act of 2002.*2002
Filed herewith31.231.2
Certification of Chief Financial Officer pursuant to Exchange Act Rules 13a-14(a)/15d-14(a), as adopted pursuant to Section 302 of theSarbanes-Oxley Act of 2002.*2002
Filed herewith32.132.1
Certification of Chief Executive Officer pursuant to 18 U.S.C. Section 1350, as adopted pursuant to Section 906 of theSarbanes-Oxley Act of 2002.*2002
Furnished herewithIncorporated by Reference HereinExhibitNumberDescription of DocumentFormDate32.2
Certification of Chief Financial Officer pursuant to 18 U.S.C. Section 1350, as adopted pursuant to Section 906 of theSarbanes-Oxley Act of 2002.*2002Furnished herewith *Filed herewith.
Pursuant to the requirements of Section 13 or 15(d) of the Securities Exchange Act of 1934, the registrant has duly caused this annual report to be signed on its behalf by the undersigned, thereunto duly authorized.Date: March 11, 2011Exhibit No.
Exhibit
Method of Filing
Tornier N.V.By:/s/ DOUGLAS W. KOHRSDouglas W. KohrsPresident and Chief Executive OfficerPursuant to the requirements of the Securities Exchange Act of 1934, this annual report has been signed below by the following persons on behalf of the registrant and in the capacity and on the dates indicated.SignatureTitleDate/s/ DOUGLAS W. KOHRSDouglas W. Kohrs101
President, Chief Executive OfficerThe following materials from Tornier N.V.’s Annual Report on Form 10-K for the fiscal year ended December 29, 2013, formatted in XBRL (Extensible Business Reporting Language): (i) the Consolidated Balance Sheets as of December 29, 2013 andDirector (Principal Executive Officer)December 30, 2012, (ii) the Consolidated Statements of Operations for each of the fiscal years in the three-year period ended December 29, 2013, (iii) the Consolidated Statements of Comprehensive Loss for each of the fiscal years in the three-year period ended December 29, 2013, (iv) the Consolidated Statements of Cash Flows for each of the fiscal years in the three-year period ended December 29, 2013, (v) Consolidated Statements of Shareholders’ Equity for each of the fiscal years in the three-year period ended December 29, 2013, and (vi) Notes to Consolidated Financial StatementsMarch 11, 2011/s/ CARMEN L. DIERSENCarmen L. DiersenGlobal Chief Financial Officer (Principal Financial Officer and Principal Accounting Officer)March 11, 2011/s/ SEAN D. CARNEYSean D. CarneyDirectorMarch 11, 2011/s/ RICHARD B. EMMITTRichard B. EmmittDirectorMarch 11, 2011/s/ KEVIN C. O'BOYLEKevin C. O'BoyleDirectorMarch 11, 2011/s/ ALAIN TORNIERAlain TornierDirectorMarch 11, 2011/s/ PASCAL E.R. GIRINPascal E.R. GirinDirectorMarch 11, 2011Filed herewith* SignatureTitleDate/s/ RICHARD F. WALLMANRichard F. WallmanDirectorMarch 11, 2011/s/ ELIZABETH H. WEATHERMANElizabeth H. WeathermanDirectorMarch 11, 2011All exhibits and schedules to this agreement have been omitted pursuant to Item 601(b)(2) of Regulation S-K. Tornier will furnish the omitted exhibits and schedules to the SEC upon request by the SEC.** A management contract or compensatory plan or arrangement.