Use these links to rapidly review the document
TABLE OF CONTENTSTABLE OF CONTENTS2ITEM 8. FINANCIAL STATEMENTS AND SUPPLEMENTARY DATA
UNITED STATES
SECURITIES AND EXCHANGE COMMISSION
Washington, D.C. 20549
FORM 10-K
ý | ANNUAL REPORT PURSUANT TO SECTION 13 OR 15(d) OF THE SECURITIES EXCHANGE ACT OF 1934 | |
For the fiscal year ended December 31, | ||
OR | ||
o | TRANSITION REPORT PURSUANT TO SECTION 13 OR 15(d) OF THE SECURITIES EXCHANGE ACT OF 1934 | |
Commission file number 00-30747
PACWEST BANCORP
(Exact Name of Registrant as Specified in Its Charter)
| Delaware (State or Other Jurisdiction of Incorporation or Organization) | 33-0885320 (I.R.S. Employer Identification No.) | |
10250 Constellation Blvd., Suite 1640 | ||
| Los Angeles, California | 90067 | |
| (Address of Principal Executive Offices) | (Zip Code) |
Registrant's telephone number, including area code:(310) 286-1144
Securities registered pursuant to Section 12(b) of the Act:
| Title of Each Class | Name of Each Exchange on Which Registered | |
|---|---|---|
| Common stock, $.01 par value per share | The Nasdaq Stock Market, LLC |
Securities registered pursuant to Section 12(g) of the Act:None
Indicate by check mark if the registrant is a well-known seasoned issuer, as defined in Rule 405 of the Securities Act. Yes o No ý
Indicate by check mark if the registrant is not required to file reports pursuant to Section 13 or Section 15(d) of the Act. Yes o No ý
Indicate by check mark whether the registrant (1) has filed all reports required to be filed by Section 13 or 15(d) of the Securities Exchange Act of 1934 during the preceding 12 months (or for such shorter period that the registrant was required to file such reports), and (2) has been subject to such filing requirements for the past 90 days. Yes ý No o
Indicate by check mark whether the registrant has submitted electronically and posted on its corporate Web site, if any, every Interactive Data File required to be submitted and posted pursuant to Rule 405 of Regulation S-T (§232.405 of this chapter) during the preceding 12 months (or for such shorter period that the registrant was required to submit and post such files). Yes oý No o
Indicate by check mark if disclosure of delinquent filers pursuant to Item 405 of Regulation S-K is not contained herein, and will not be contained, to the best of registrant's knowledge, in definitive proxy or information statements incorporated by reference in Part III of this Form 10-K or any amendment to this Form 10-K. o
Indicate by check mark whether the registrant is a large accelerated filer, an accelerated filer, a non-accelerated filer, or a smaller reporting company. See definition of "large accelerated filer," "accelerated filer" and "smaller reporting company" in Rule 12b-2 of the Exchange Act. (Check one):
Large Accelerated filer o | Accelerated filer ý | Non-Accelerated filer o (Do not check if a smaller reporting company) | Smaller reporting company o |
Indicate by check mark whether the registrant is a shell company (as defined by Rule 12b-2 of the Act.) Yes o No ý
As of June 30, 2010,2011, the aggregate market value of the voting common stock held by non-affiliates of the registrant, computed by reference to the average high and low sales prices on The Nasdaq Global Select Market as of the close of business on June 30, 2010,2011, was approximately $562.8$615.0 million. Registrant does not have any nonvoting common equities.
As of March 2, 2011,2012, there were 35,461,61035,680,378 shares of registrant's common stock outstanding, excluding 1,426,687treasury shares and 1,617,760 shares of unvested restricted stock.
DOCUMENTS INCORPORATED BY REFERENCE
The information required by Items 10, 11, 12, 13 and 14 of Part III of this Annual Report on Form 10-K will be found in the Company's definitive proxy statement for its 20112012 Annual Meeting of Stockholders, to be filed pursuant to Regulation 14A under the Securities Exchange Act of 1934, as amended, and such information is incorporated herein by this reference.
PACWEST BANCORP20102011 ANNUAL REPORT ON FORM 10-K
TABLE OF CONTENTS
PART I | ||||||
ITEM 1. | Business | 3 | ||||
General | 3 | |||||
Recent Transactions | 3 | |||||
Banking Business | ||||||
Strategic Evolution and Acquisition Strategy | ||||||
Competition | ||||||
Employees | ||||||
Financial and Statistical Disclosure | ||||||
Supervision and Regulation | ||||||
Available Information | ||||||
Forward-Looking Information | ||||||
ITEM 1A. | Risk Factors | |||||
ITEM 1B. | Unresolved Staff Comments | |||||
ITEM 2. | Properties | |||||
ITEM 3. | Legal Proceedings | |||||
ITEM 4. |
| |||||
| ||||||
ITEM 5. | Market For Registrant's Common Equity, Related Shareholder Matters and Issuer Purchases of Equity Securities | |||||
Marketplace Designation, Sales Price Information and Holders | ||||||
Dividends | ||||||
Securities Authorized for Issuance under Equity Compensation Plans | ||||||
Recent Sales of Unregistered Securities and Use of Proceeds | ||||||
Repurchases of Common Stock | ||||||
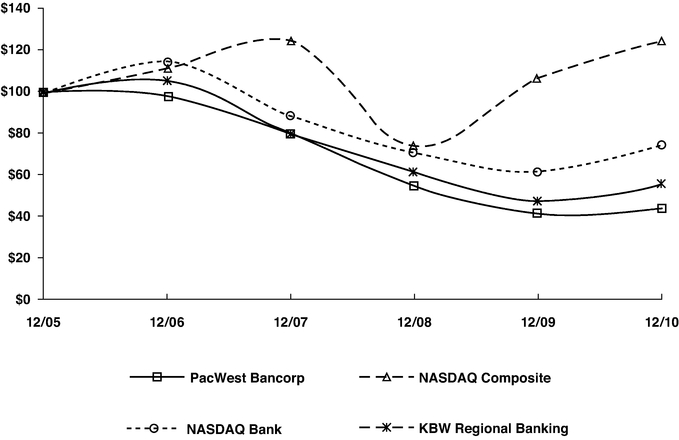
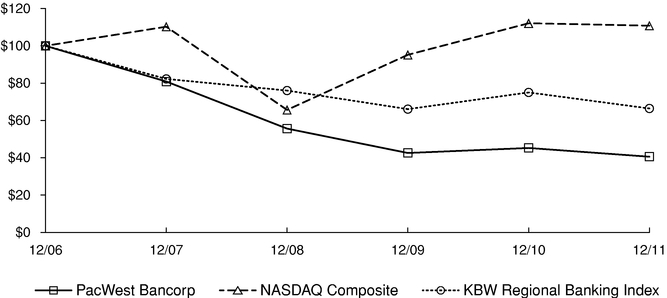
Five-Year Stock Performance Graph | ||||||
ITEM 6. | Selected Financial Data | |||||
ITEM 7. | Management's Discussion and Analysis of Financial Condition and Results of Operations | |||||
Overview | ||||||
Key Performance Indicators | ||||||
Critical Accounting Policies | ||||||
Non-GAAP Measurements | 50 | |||||
Results of Operations | ||||||
Financial Condition | ||||||
Borrowings | ||||||
Capital Resources | ||||||
Liquidity | ||||||
Contractual Obligations | ||||||
Off-Balance Sheet Arrangements | ||||||
Recent Accounting Pronouncements | ||||||
ITEM 7A. | Quantitative and Qualitative Disclosures About Market Risk | |||||
PACWEST BANCORP
20102011 ANNUAL REPORT ON FORM 10-K
TABLE OF CONTENTS (Continued)
ITEM 8. | Financial Statements and Supplementary Data | |||||
Contents | ||||||
Management's Report on Internal Control Over Financial Reporting | ||||||
Report of Independent Registered Public Accounting Firm | ||||||
Consolidated Balance Sheets as of December 31, | ||||||
Consolidated Statements of Earnings (Loss) for the Years Ended December 31, 2011, 2010, | ||||||
Consolidated Statements of Comprehensive Income (Loss) for the Years Ended December 31, 2011, 2010, and 2009 | 103 | |||||
Consolidated Statements of Changes in Stockholders' Equity | ||||||
Consolidated Statements of Cash Flows for the Years Ended December 31, 2011, 2010, | ||||||
Notes to Consolidated Financial Statements | ||||||
ITEM 9. | Changes in and Disagreements with Accountants on Accounting and Financial Disclosure | |||||
ITEM 9A. | Controls and Procedures | |||||
ITEM 9B. | Other Information | |||||
| ||||||
ITEM 10. | Directors, Executive Officers and Corporate Governance | |||||
ITEM 11. | Executive Compensation | |||||
ITEM 12. | Security Ownership of Certain Beneficial Owners and Management and Related Stockholder Matters | |||||
ITEM 13. | Certain Relationships and Related Transactions, and Director Independence | |||||
ITEM 14. | Principal Accountant Fees and Services | |||||
| ||||||
ITEM 15. | Exhibits and Financial Statement Schedules | |||||
SIGNATURES | ||||||
CERTIFICATIONS | ||||||
PacWest Bancorp is a bank holding company registered under the Bank Holding Company Act of 1956, as amended. Our principal business is to serve as the holding company for our banking subsidiary, Pacific Western Bank, which we refer to as Pacific Western or the Bank. When we say "we", "our" or the "Company", we mean the Company on a consolidated basis with the Bank. When we refer to "PacWest" or to the holding company, we are referring to the parent company on a stand-alone basis.
PacWest Bancorp was formerly known as First Community Bancorp. At a special meeting of the Company's shareholders held on April 23, 2008, the shareholders approved the reincorporation of the Company in Delaware from California and the change of the Company's name to PacWest Bancorp from First Community Bancorp. The reincorporation became effective on May 14, 2008. In connection with the reincorporation and name change, the Company also changed its ticker symbol on the NASDAQ Global Select Market to "PACW." Other than the name change, change in ticker symbol and change in corporate domicile, the reincorporation did not result in any change in the business, physical location, management, assets, liabilities or total stockholders' equity of the Company, nor did it result in any change in location of the Company's employees, including the Company's management. Additionally, the reincorporation did not alter any shareholder's percentage ownership interest or number of shares owned in the Company. The stockholders' equity section of the accompanying consolidated financial statements has been restated retroactively
In January 2012, Pacific Western Bank acquired Marquette Equipment Finance, or MEF, an equipment leasing company, for $35 million in cash. At January 3, 2012, MEF had $162.2 million in gross leases and leases in process outstanding, with no leases on nonaccrual status. In addition, Pacific Western Bank assumed $154.8 million in outstanding debt and other liabilities, which included $129 million payable to give effect to the reincorporation. Such reclassification had no effectMEF's former parent. Pacific Western Bank repaid MEF's intercompany debt on the results of operations orclosing date from its excess liquidity on deposit at the total amount of stockholders' equity.Federal Reserve Bank.
During 2010, we completed the following transactions:
During 2009, we completed the following transactions:
SeeAcquisition Strategy", "Item 7. Management's Discussion and Analysis of Financial Condition and Results of Operations—Overview", and NotesNote 3,Acquisitions, Note 4,Goodwill and Other Intangible Assets, Note 6,Loans, and 18Note 23,Subsequent Events, of the Notes to Consolidated Financial Statements contained in "Item 8. Financial Statements and Supplementary Data" for further information regarding recent transactions.
Pacific Western is a full-service commercial bank offering a broad range of banking products and services including: accepting timedemand, money market, and demandtime deposits; originating loans, including commercial, real estate construction, real estate miniperm, SBA guaranteed and consumer loans; and providing other business-oriented products. We have 7776 full-service community banking branches. Our operations are primarily located in Southern California andextending from California's Central Coast to San Diego County; we also operate three banking offices in the San Francisco Bay area, all of which were added through the Affinity acquisition. The Bank focuses on conducting business with small to medium size businesses in our marketplace and the owners and employees of those businesses. The majority of our loans are secured by the real estate collateral of such businesses. We extend credit to customers located primarily in counties we serve. We also provideOur asset-based lending and factoring of accounts receivable to small businesses located throughoutfunction operates in Arizona, California, Texas, and the Pacific NorthwestNorthwest. Our equipment leasing function, added through BFI Business Finance, or BFI, basedthe January 2012 MEF acquisition, operates in San Jose, CaliforniaUtah and First Community Financial, or FCF, basedhas lease receivables in Phoenix, Arizona.45 states. Special services, including international banking services, multi-state deposit
services and investment services, or requests beyond the lending limitsservice area or current offerings of the Bank can be arranged through correspondent banks. The Bank also issues ATM and debit cards, has a network of branded ATMs and offers access to ATM networks through other major service providers. We provide access to customer accounts via a 24-hour seven day a week toll-free automated telephone customer service and a secure online banking service.
At December 31, 2010 our assets totaled $5.5 billion, of which gross non-covered loans totaled $3.2 billion, or 57% of assets, and covered loans totaled $908.6 million, or 16% of assets. At this date, the non-covered loans were composed of approximately 22% in commercial loans, 64% in commercial real estate loans, 8% in residential real estate loans, 3% in commercial real estate construction loans, 2% in residential real estate construction loans, and 1% in consumer and other loans. These percentages include some foreign loans, primarily to entities, and on a limited basis to individuals, with business in Mexico, representing 1% of non-covered loans.
We are committed to maintaining premier, relationship-based community banking in Southern California serving the needs of those businesses in our marketplace, as well as serving the needs of growing businesses that may not yet meet the credit standards of the Bank, through tightly controlled asset-based lending and factoring of accounts receivable. We compete actively for deposits, and emphasize solicitation of noninterest-bearing deposits. In managing the top line of our business, we focus on making quality loans and gathering low-cost deposits to maximize our net interest margin, as
net interest income accounted for 84% of our net revenues (net interest income plus noninterest income) in 2010.margin. The strategy for serving our target markets is the delivery of a finely-focused set of value-added products and services that satisfy the primary needs of our customers, emphasizing superior service and relationships over transaction volume or low pricing.
We generate our revenue primarily from the interest received on the various loan products and investment securities and fees from providing deposit services, foreign exchange services and extending credit. Our major operating expenses are the interest paid by the Bank on deposits and borrowings, employee compensation and general operating expenses. The Bank relies on a foundation of locally generated and relationship-based deposits to fund loans. Our Bank has a relatively low cost of funds due to a high percentage of noninterest-bearing and low cost deposits to total deposits. Our operations, similar to other financial institutions with operations predominately focused in Southern California, are significantly influenced by economic conditions in Southern California, including the strength of the real estate market, the fiscal and regulatory policies of the federal and state governmentgovernments and the regulatory authorities that govern financial institutions. See "—Supervision and Regulation." Through our offices located in Northern California, and our asset-based lending operations with production and marketing offices located in Arizona, Northern California, and the Pacific Northwest, and our equipment leasing operations located in Utah, we are also subject to the economic conditions affecting these markets.
Lending Activities
Through the Bank, the Company concentrates its lending activities in four principal areas:
(1) Real Estate Loans. Real estate loans are comprised of construction loans, miniperm loans collateralized by first or junior deeds of trust on specific commercial properties and equity lines of credit. The properties collateralizing real estate loans are principally located in our primary market areas of Los Angeles, Orange, San Bernardino, Riverside, San Diego, Ventura, Santa Barbara and San Luis Obispo counties in California and the neighboring communities. Construction loans are comprised of loans on commercial, residential and income producing properties that generally have terms of less than two years and typically bear an interest rate that floats with the Bank's base rate or another established index. Miniperm loans finance the purchase and/or ownership of commercial properties, including owner-occupied and income producing properties. Miniperm loans are generally made with an amortization schedule ranging from 15 to 25 years with a lump sum balloon payment due in one to ten years. Equity lines of credit are revolving lines of credit collateralized by junior deeds of trust on residential real properties. They generally bear a rate of interest that floats with the Bank's base rate or the prime rate and have maturities of ten years. From time to time, we purchase participation interests in loans originated by other financial institutions. These loans are subject generally to the same underwriting criteria and approval process as loans originated directly by us.
The Bank's real estate portfolio is subject to certain risks, including, but not limited to: (i) the effects of economic downturns in the Southern California economy and in general; (ii) interest rate
increases; (iii) reduction in real estate values in Southern California and in general; (iv) increased competition in pricing and loan structure; (v) the borrower's ability to refinance or payoff the balloon or line of credit at maturity; and (vi) environmental risks, including natural disasters. In addition to the foregoing, construction loans are also subject to project specific risks including, but not limited to: (a) construction costs being more than anticipated; (b) construction taking longer than anticipated; (c) failure by developers and contractors to meet project specifications; (d) disagreement between contractors, subcontractors and developers; (e) demand for completed projects being less than anticipated; (f) buyers being unable to secure financing; and (g) loss through foreclosure.
When underwriting loans, we strive to reduce the exposure to such risks by (i) reviewing each loan request and renewal individually, (ii) using a dual signature approval system for the approval of each loan request for loans over a certain dollar amount, (iii) adhering to written loan policies, including,
among other factors, minimum collateral requirements, maximum loan-to-value ratio requirements, cash flow requirements and personal guarantees, (iv) obtaining independent third party appraisals which are reviewed by the Bank's appraisal department, (v) obtaining external independent credit reviews, (vi) evaluating concentrations as a percentage of capital and loans, and (vii) conducting environmental reviews, where appropriate. With respect to construction loans, in addition to the foregoing, we attempt to mitigate project specific risks by: (a) implementing a controlled disbursement process for loan proceeds in accordance with an agreed upon schedule; (b) conducting project site visits; and (c) adhering to release-price schedules to ensure the prices for which newly-built units to be sold are sufficient to repay the Bank. The risks related to buyer inability to secure financing and loss through foreclosure are not controllable. We review each loan request on the basis of our ability to recover both principal and interest in view of the inherent risks.
(2) Commercial Loans. Commercial loans, both domestic and foreign, are made to finance operations, to provide working capital, or for specific purposes such as to finance the purchase of assets, equipment or inventory. Since a borrower's cash flow from operations is generally the primary source of repayment, our policies provide specific guidelines regarding required debt coverage and other important financial ratios. Commercial loans include lines of credit and commercial term loans. Lines of credit are extended to businesses or individuals based on the financial strength and integrity of the borrower and guarantor(s) and generally (with some exceptions) are collateralized by short-term assets such as accounts receivable, inventory, equipment or real estate and have a maturity of one year or less. Such lines of credit bear an interest rate that floats with the Bank's base rate, LIBOR or another established index. Commercial term loans are typically made to finance the acquisition of fixed assets, refinance short-term debt originally used to purchase fixed assets or, in rare cases, to finance the purchase of businesses. Commercial term loans generally have terms from one to five years. They may be collateralized by the asset being acquired or other available assets and bear interest rates which either float with the Bank's base rate, LIBOR or another established index or remain fixed for the term of the loan.
The Bank's portfolio of commercial loans is subject to certain risks, including, but not limited to: (i) the effects of economic downturns in the Southern California economy; (ii) interest rate increases; (iii) deterioration of the value of the underlying collateral; and (iv) the deterioration of a borrower's or guarantor's financial capabilities. We strive to reduce the exposure to such risks through: (a) reviewing each loan request and renewal individually; (b) using a dual signature approval system; (c) adhering to written loan policies; (d) obtaining external independent credit reviews, and (e) in the case of certain commercial loans to Mexican or foreign entities, third party insurance which limits our exposure to anywhere from 20 to 30 percent of the underlying loan. In addition, loans based on short-term asset values and factoring arrangements are monitored on a daily, weekly, monthly or quarterly basis and may include lockbox or control account arrangements. In general, the Bank receives and reviews financial statements and other documents of borrowing customers on an ongoing basis during the term of the relationship and responds to any deterioration noted.
(3) SBA Loans. SBA loans are made through programs designed by the federal government to assist the small business community in obtaining financing from financial institutions that are given government guarantees as an incentive to make the loans. Our SBA loans fall into two categories, loans originated under the SBA's 7a Program ("7a Loans") and loans originated under the SBA's 504 Program ("504 Loans"). SBA 7a Loans are commercial business loans generally made for the purpose of purchasing real estate to be occupied by the business owner, providing working capital, and/or purchasing equipment, accounts receivable or inventory. SBA 504 Loans are collateralized by commercial real estate and are generally made to business owners for the purpose of purchasing or improving real estate for their use and for equipment used in their business. Due to declining SBA loan origination and loan sale opportunities, we suspended our loan sale operation during 2008 and reduced staff accordingly.
SBA lending is subject to federal legislation that can affect the availability and funding of the program. From time to time, this dependence on legislative funding causes limitations and uncertainties with regard to the continued funding of such programs, which could potentially have an adverse financial impact on our business.
The Bank's portfolio of SBA loans is subject to certain risks, including, but not limited to: (i) the effects of economic downturns in the Southern California economy; (ii) interest rate increases; (iii) deterioration of the value of the underlying collateral; and (iv) the deterioration of a borrower's or guarantor's financial capabilities. We strive to reduce the exposure of such risks through: (a) reviewing each loan request and renewal individually; (b) using a dual signature approval system; (c) adhering to written loan policies; (d) adhering to SBA written policies and regulations; (e) obtaining independent third party appraisals which are reviewed by the Bank's appraisal department; and (f) obtaining external independent credit reviews. In addition, SBA loans normally require monthly installment payments of principal and interest and therefore are continually monitored for past due conditions. In general, the Bank receives and reviews financial statements and other documents of borrowing customers on an ongoing basis during the term of the relationship and responds to any deterioration noted.
(4) Consumer Loans. Consumer loans include personal loans, auto loans, boat loans, home improvement loans, revolving lines of credit and other loans typically made by banks to individual borrowers. The Bank does not currently originate first trust deed home mortgage loans. The Bank's consumer loan portfolio is subject to certain risks, including: (i) amount of credit offered to consumers in the market; (ii) interest rate increases; and (iii) consumer bankruptcy laws which allow consumers to discharge certain debts. We strive to reduce the exposure to such risks through the direct approval of all consumer loans by: (a) reviewing each loan request and renewal individually; (b) using a dual signature approval system; (c) adhering to written credit policies; and (d) obtaining external independent credit reviews.
As part of our efforts to achieve long-term stable profitability and respond to a changing economic environment in Southern California and in other areas where we operate, we constantly evaluate a variety of options to augment our traditional focus by broadening the services and products we provide. Possible avenues of growth include more branch locations, expanded days and hours of operation and new types of loan and deposit products. To date, we have not expanded into areas of brokerage, annuity, insurance or similar investment products and services and have concentrated primarily on the core businesses of accepting deposits, making loans and extending credit.
Business Concentrations
The following tables present the composition of our loan portfolio by segment and class, showing the non-covered and covered components, as of the dates indicated:
| | December 31, 2011 | ||||||||||||||||||
|---|---|---|---|---|---|---|---|---|---|---|---|---|---|---|---|---|---|---|---|
| | Total Loans | Non-Covered Loans | Covered Loans | ||||||||||||||||
| | Amount | % of Total | Amount | % of Total | Amount | % of Total | |||||||||||||
| | (Dollars in thousands) | ||||||||||||||||||
Real estate mortgage: | |||||||||||||||||||
Hospitality | $ | 147,346 | 4 | % | $ | 144,402 | 5 | % | $ | 2,944 | — | ||||||||
SBA 504 | 58,377 | 2 | % | 58,377 | 2 | % | — | — | |||||||||||
Other | 2,513,099 | 69 | % | 1,779,685 | 63 | % | 733,414 | 91 | % | ||||||||||
Total real estate mortgage | 2,718,822 | 75 | % | 1,982,464 | 70 | % | 736,358 | 91 | % | ||||||||||
Real estate construction: | |||||||||||||||||||
Residential | 39,190 | 1 | % | 17,669 | 1 | % | 21,521 | 3 | % | ||||||||||
Commercial | 120,787 | 3 | % | 95,390 | 3 | % | 25,397 | 3 | % | ||||||||||
Total real estate construction | 159,977 | 4 | % | 113,059 | 4 | % | 46,918 | 6 | % | ||||||||||
Total real estate loans | 2,878,799 | 79 | % | 2,095,523 | 74 | % | 783,276 | 97 | % | ||||||||||
Commercial: | |||||||||||||||||||
Collateralized | 438,828 | 12 | % | 414,020 | 15 | % | 24,808 | 3 | % | ||||||||||
Unsecured | 79,739 | 2 | % | 78,937 | 3 | % | 802 | — | |||||||||||
Asset-based | 149,987 | 4 | % | 149,987 | 5 | % | — | — | |||||||||||
SBA 7(a) | 28,995 | 1 | % | 28,995 | 1 | % | — | — | |||||||||||
Total commercial | 697,549 | 19 | % | 671,939 | 24 | % | 25,610 | 3 | % | ||||||||||
Consumer | 24,446 | 1 | % | 23,711 | 1 | % | 735 | — | |||||||||||
Foreign | 20,932 | 1 | % | 20,932 | 1 | % | — | — | |||||||||||
Total gross loans | $ | 3,621,726 | 100 | % | $ | 2,812,105 | 100 | % | 809,621 | 100 | % | ||||||||
Covered loans: | |||||||||||||||||||
Discount | (75,323 | ) | |||||||||||||||||
Allowance for loan losses | (31,275 | ) | |||||||||||||||||
Covered loans, net | $ | 703,023 | |||||||||||||||||
| | December 31, 2010 | ||||||||||||||||||
|---|---|---|---|---|---|---|---|---|---|---|---|---|---|---|---|---|---|---|---|
| | Total Loans | Non-Covered Loans | Covered Loans | ||||||||||||||||
| | Amount | % of Total | Amount | % of Total | Amount | % of Total | |||||||||||||
| | (Dollars in thousands) | ||||||||||||||||||
Real estate mortgage: | |||||||||||||||||||
Hospitality | $ | 159,650 | 4 | % | $ | 156,652 | 5 | % | $ | 2,998 | — | ||||||||
SBA 504 | 69,287 | 2 | % | 69,287 | 2 | % | — | — | |||||||||||
Other | 2,965,094 | 70 | % | 2,048,794 | 65 | % | 916,300 | 87 | % | ||||||||||
Total real estate mortgage | 3,194,031 | 76 | % | 2,274,733 | 72 | % | 919,298 | 87 | % | ||||||||||
Real estate construction: | |||||||||||||||||||
Residential | 109,680 | 2 | % | 65,043 | 2 | % | 44,637 | 4 | % | ||||||||||
Commercial | 161,539 | 4 | % | 114,436 | 3 | % | 47,103 | 5 | % | ||||||||||
Total real estate construction | 271,219 | 6 | % | 179,479 | 5 | % | 91,740 | 9 | % | ||||||||||
Total real estate loans | 3,465,250 | 82 | % | 2,454,212 | 77 | % | 1,011,038 | 96 | % | ||||||||||
Commercial: | |||||||||||||||||||
Collateralized | 396,400 | 9 | % | 358,427 | 11 | % | 37,973 | 4 | % | ||||||||||
Unsecured | 130,945 | 3 | % | 129,743 | 4 | % | 1,202 | — | |||||||||||
Asset-based | 144,748 | 4 | % | 143,167 | 5 | % | 1,581 | — | |||||||||||
SBA 7(a) | 32,220 | 1 | % | 32,220 | 1 | % | — | — | |||||||||||
Total commercial | 704,313 | 17 | % | 663,557 | 21 | % | 40,756 | 4 | % | ||||||||||
Consumer | 26,005 | 1 | % | 25,058 | 1 | % | 947 | — | |||||||||||
Foreign | 22,608 | 0 | % | 22,608 | 1 | % | — | — | |||||||||||
Total gross loans | $ | 4,218,176 | 100 | % | $ | 3,165,435 | 100 | % | 1,052,741 | 100 | % | ||||||||
Covered loans: | |||||||||||||||||||
Discount | (110,901 | ) | |||||||||||||||||
Allowance for loan losses | (33,264 | ) | |||||||||||||||||
Covered loans, net | $ | 908,576 | |||||||||||||||||
No individual or single group of related accounts is considered material in relation to our total assets or deposits of the Bank, or in relation to the overall business of the Company. However, approximately 77%79% of our total gross non-covered and covered loan portfolio at December 31, 20102011 consisted of real estate-relatedestate loans, including construction loans, miniperm loans, commercial real estate mortgageSBA 504 loans, and commercial loans secured by commercial real estate.construction loans. See "Item 7. Management's Discussion and Analysis of Financial Condition and Results of Operations—Financial Condition—Non-coveredNon-Covered Loans," and also "Item 7. Management's Discussion and Analysis of Financial Condition and Results of Operations—Financial Condition—Covered Loans." Since our business activities are currently focused primarily in Southern California, with the majority of our business concentrated in Los Angeles, Orange, Riverside, San Bernardino, San Diego, Ventura, Santa Barbara and San Luis Obispo Counties, our results of operations and financial condition are dependent upon the general trends in the Southern California economies and, in particular, the residential and commercial real estate markets. The concentration of our operations in Southern California exposes us to greater risk than other banking companies with a wider geographic base in the event of catastrophes, such as earthquakes, fires and floods in this region. We conduct
Our foreign lending activities includingloans consist predominately of commercial and real estate lending, consisting predominantly of loans to individuals or entities located in Mexico. At December 31, 2010, our foreign loans consisted of approximatelyMexico and represent less than 1% of our non-covered loan portfolio.portfolio at December 31, 2011. Such foreign loans are denominated in U.S. dollars and most are collateralized by assets located in the United States or are guaranteed or insured by businesses located
in the United States. We have continued to allow our foreign loan portfolio to repay in the ordinary course of business without making any new privately-insured foreign loans other than those under existing commitments.
Strategic Evolution and Acquisition Strategy
The Company was organized on October 22, 1999 as a California corporation for the purpose of becoming a bank holding company and to acquire all the outstanding capital stock of Rancho Santa Fe National Bank. Since that time, we have grown through a series of business acquisitions. Most recently, in August 2010 we purchased certain assets and assumed certain liabilities of Los Padres Bank from the FDIC, as receiver of Los Padres Bank.
The following chart summarizes the acquisitions completed since our inception, some of which are described in more detail below. See also Note 3,Acquisitions, of the Notes to Consolidated Financial Statements contained in "Item 8. Financial Statements and Supplementary Data" in Part II of this Annual Report on Form 10-K for further details regarding ourrecent acquisitions.
| | Date | Institution/Company Acquired | ||
|---|---|---|---|---|
| (1) | May 2000 | Rancho Santa Fe National Bank | ||
| (2) | May 2000 | First Community Bank of the Desert | ||
| (3) | January 2001 | Professional Bancorp, Inc. | ||
| (4) | October 2001 | First Charter Bank | ||
| (5) | January 2002 | Pacific Western National Bank | ||
| (6) | March 2002 | W.H.E.C., Inc. | ||
| (7) | August 2002 | Upland Bank | ||
| (8) | August 2002 | Marathon Bancorp | ||
| (9) | September 2002 | First National Bank | ||
| (10) | January 2003 | Bank of Coronado | ||
| (11) | August 2003 | Verdugo Banking Company | ||
| (12) | March 2004 | First Community Financial Corporation | ||
| (13) | April 2004 | Harbor National Bank | ||
| (14) | August 2005 | First American Bank | ||
| (15) | October 2005 | Pacific Liberty Bank | ||
| (16) | January 2006 | Cedars Bank | ||
| (17) | May 2006 | Foothill Independent Bancorp | ||
| (18) | October 2006 | Community Bancorp Inc. | ||
| (19) | June 2007 | Business Finance Capital Corporation | ||
| (20) | November 2008 | Security Pacific Bank (deposits only) | ||
| (21) | August 2009 | Affinity Bank | ||
| (22) | August 2010 | Los Padres Bank | ||
| (23) | January 2012 | Marquette Equipment Finance |
Our acquisitions focused generally on increasing our banking presence in California and increasing earning assets. Our most recent acquisition of an interest-earning asset generation company added earning assets and deployed excess liquidity and the FDIC-assisted banking acquisitions expanded our operations and branch banking network in California.
Security Pacific Bank DepositMarquette Equipment Finance Acquisition
On November 7, 2008, we assumed $427.5January 3, 2012, Pacific Western Bank completed the acquisition of Marquette Equipment Finance, or MEF, an equipment leasing company located in Midvale, Utah. Pacific Western Bank acquired all of the capital stock of MEF from Meridian Bank, N.A. for $35 million in deposits fromcash. MEF focuses on business-essential equipment leases throughout the FDIC as receiver of Security Pacific Bank, or SPB, formerly a Los Angeles-based bank. We assumed all insuredUnited States with transactions primarily in the mid-ticket segment. This acquisition diversifies our loan portfolio, expands our product line, and uninsured deposits and paid a 2% premium of approximately $5.1 million related to the non-brokered deposit base of $258 million. The estimated brokered deposits as of the assumption date totaled $169 million. Such deposit assumption was net of acquiring cash, certificates of deposit in other financial institutions, federal funds sold, securities, and loans secured by assumed deposits. As part of the SPB deposit acquisition weprovides growth opportunities. It also purchased an additional $31importantly deployed our excess liquidity into higher-yielding assets.
At January 3, 2012, MEF had $162.2 million in loans. The Security Pacific Bank acquisition was made to expand our presencegross leases and leases in process outstanding, with no leases on nonaccrual status. MEF's leases are spread across 18 industries, with the Los Angeles area and to gain experience with FDIC-assisted transactions.top three being
Affinity Bank Acquisition
On August 28, 2009, we acquired substantially allfinancial services/insurance, manufacturing, and health care and representing 68% of the assets of Affinity Bank, including all loans,lease portfolio balance. The weighted average yield on the lease portfolio at year end 2011 was approximately 9% and assumed substantially all of its liabilities, including the insured and uninsured deposits and excluding certain brokered deposits, from the FDIC in an FDIC-assisted transaction, which we refer to as the Affinity acquisition.weighted average remaining maturity was 34 months. In addition, Pacific Western (i) acquired $675.6Bank assumed $154.8 million in loans, $22.9 million in foreclosed assets, $175.4 million in investments and $371.5 million in cashoutstanding debt and other liabilities, which included $129 million payable to MEF's former parent. Pacific Western Bank repaid MEF's intercompany debt on the closing date from its excess liquidity on deposit at the Federal Reserve Bank. This resulted in MEF's interest-earning assets and (ii) assumed $868.2 million in deposits, $305.8 million in borrowings, and $32.6 million in other liabilities. In connectionbeing funded with the Affinity acquisition, the FDIC made a cash paymentour low-cost deposit base.
Effective March 23, 2012, MEF will change its name to Pacific Western Equipment Finance and operate under this name as a division of $87.2 million. We entered into a loss sharing agreement with the FDIC, whereby the FDIC agreed to cover a substantial portion of any future losses on acquired loans, other real estate owned and certain investment securities. Under the terms of such loss sharing agreement, the FDIC will absorb 80% of losses and receive 80% of loss recoveries on the first $234 million of losses on covered assets and absorb 95% of losses and receive 95% of loss recoveries on covered assets exceeding $234 million. The loss sharing agreement is in effect for 5 years for commercial assets (non-residential loans, OREO and certain securities) and 10 years for residential loans from the August 28, 2009 acquisition date. The loss recovery provisions are in effect for 8 years for commercial assets and 10 years for residential loans from the acquisition date. We refer to the acquired assets subject to the loss sharing agreement collectively as "covered assets." Affinity was a full service commercial bank headquartered in Ventura, California that operated 10 branch locations in California. We made this acquisition to expand our presence in California.Pacific Western Bank. Pacific Western Bank retained all 71 MEF employees.
Los Padres Bank Acquisition
On August 20, 2010, we acquired certain assets of Los Padres Bank, including all loans, and assumed substantially all of its liabilities, including all deposits, from the FDIC in an FDIC-assisted acquisition, which we refer to as the Los Padres acquisition. Pacific Western (i) acquired $437.1 million in loans, $33.9 million in other real estate owned, $44.3 million in investments, and $261.5 million in cash and other assets and (ii) assumed $752.2 million in deposits, $70.0 million in borrowings, and $1.9 million in other liabilities. In connection with the Los Padres acquisition, the FDIC made a cash payment to Pacific Western of $144.0 million. Other than a deposit premium of $3.4 million, we paid no cash or other consideration to acquire Los Padres.
We entered into a loss sharing agreement with the FDIC, whereby the FDIC agreed to cover a substantial portion of any future losses on acquired loans, with the exception of consumer loans, and other real estate owned. Under the terms of such loss sharing agreement, the FDIC is obligated to reimburse the Bank for 80% of losses with respect to the covered assets. The Bank will reimburse the FDIC for 80% of recoveries with respect to losses for which the FDIC paid the Bank 80% reimbursement under the loss sharing agreement. The loss sharing arrangementprovisions for single family covered assets and commercial (non-single family) covered assets isare in effect for 10 years and 5 years, respectively, from the acquisition date, and the loss recovery provisions are in effect for 10 years and 8 years, respectively, from the acquisition date. We refer to the acquired assets subject to the loss sharing agreement collectively as "covered assets."
Los Padres was a federally chartered savings bank headquartered in Solvang, California that operated 14 branches, including 11 branches in California (three in Ventura County, four in Santa Barbara County, and four in San Luis Obispo County) and three branches in Arizona (Maricopa County). After office consolidations in February 2011, therewe are nine remainingoperating eight of the former Los Padres branch offices, with eightall of which are located in California and one in Arizona.California. We made this acquisition to expand our presence in the Central Coast of California.
Affinity Bank Acquisition
On August 28, 2009, we acquired substantially all of the assets of Affinity Bank, including all loans, and assumed substantially all of its liabilities, including the insured and uninsured deposits and excluding certain brokered deposits, from the FDIC in an FDIC-assisted transaction, which we refer to as the Affinity acquisition. Pacific Western (i) acquired $675.6 million in loans, $22.9 million in foreclosed assets, $175.4 million in investments and $371.5 million in cash and other assets, and (ii) assumed $868.2 million in deposits, $305.8 million in borrowings, and $32.6 million in other liabilities. In connection with the Affinity acquisition, the FDIC made a cash payment to Pacific Western of $87.2 million.
We entered into a loss sharing agreement with the FDIC, whereby the FDIC agreed to cover a substantial portion of any future losses on acquired loans, other real estate owned, or OREO, and
certain investment securities. Under the terms of such loss sharing agreement, the FDIC will absorb 80% of losses and receive 80% of loss recoveries on the first $234 million of losses on covered assets and absorb 95% of losses and receive 95% of loss recoveries on covered assets exceeding $234 million. The loss sharing provisions are in effect for 5 years for commercial assets (non-residential loans, OREO and certain securities) and 10 years for residential loans from the August 28, 2009 acquisition date. The loss recovery provisions are in effect for 8 years for commercial assets and 10 years for residential loans from the acquisition date. We refer to the acquired assets subject to the loss sharing agreement collectively as "covered assets." Affinity was a full service commercial bank headquartered in Ventura, California that operated 10 branch locations in California, all of which we continue to operate. We made this acquisition to expand our presence in California.
The banking business in California, and specifically in the Bank's primary service areas, is highly competitive with respect to originating loans, acquiring deposits and providing other banking services. The market is dominated by commercial banks in Southern California with assets between $500 million
and $25 billion, including ourselves, and a few banking giants with a large number of offices and full-service operations over a wide geographic area. In recent years, competition has increased from institutions not subject to the same regulatory restrictions as domestic banks and bank holding companies. Those competitors include savings and loan associations, brokerage houses, insurance companies, mortgage companies, credit unions, credit card companies, and other financial and non-financial institutions and entities.
Economic factors, along with legislative and technological changes, will have an ongoing impact on the competitive environment within the financial services industry. We work to anticipate and adapt to dynamic competitive conditions whether it may be developing and marketing innovative products and services, adopting or developing new technologies that differentiate our products and services, cross marketing, or providing highly personalized banking services. We strive to distinguish ourselves from other community banks and financial services providers in our marketplace by providing an extremely high level of service to enhance customer loyalty and to attract and retain business. However, we can provide no assurance as to the effectiveness of these efforts on our future business or results of operations, as to our continued ability to anticipate and adapt to changing conditions, and as to sufficiently improving our services and/or banking products in order to successfully compete in our primary service areas.
As of February 28, 2011,2012, the Company had 929982 full time equivalent employees.
Financial and Statistical Disclosure
Certain of our statistical information is presented within "Item 6. Selected Financial Data," "Item 7. Management's Discussion and Analysis of Financial Condition and Results of Operations" and "Item 7A. Qualitative and Quantitative Disclosure About Market Risk." This information should be read in conjunction with the consolidated financial statements contained in "Item 8. Financial Statements and Supplementary Data."
General
The banking and financial services business in which we engage is highly regulated. Such regulation is intended, among other things, to protect the interests of customers, including depositors. These regulations are not, however, generally charged with protecting the interests of our shareholders or
creditors. Described below are the material elements of selected laws and regulations applicable to PacWest and its subsidiaries. The descriptions are not intended to be complete and are qualified in their entirety by reference to the full text of the statutes and regulations described. Changes in applicable law or regulations, and in their application by regulatory agencies, cannot be predicted, but they may have a material effect on the business and results of PacWest and its subsidiaries.
The commercial banking business is also influenced by the monetary and fiscal policies of the federal government and the policies of the Board of Governors of the Federal Reserve Bank,System, or FRB. The FRB implements national monetary policies (with the dual mandate of price stability and maximum employment) by its open-market operations in United States Government securities, by adjusting the required level of and paying interest on reserves for financial intermediaries subject to its reserve requirements and by varying the discount rates applicable to borrowings by depository institutions. The actions of the FRB in these areas influence the growth of bank loans, investments and deposits and also affect interest rates charged on loans and paid on deposits. Indirectly, such actions may also impact the ability of non-bank financial institutions to compete with the Bank. The nature and impact of any future changes in monetary policies cannot be predicted.
The events of the past few years have led to numerous new laws in the United States and internationally for financial institutions. The Dodd-Frank Wall Street Reform and Consumer Protection Act (the "Dodd-Frank Act" or "Dodd-Frank"), which was enacted in July 2010, significantly restructuresrestructured the financial regulatory regime in the United States, including through the creation of a new systemic risk oversight body, the Financial Stability Oversight Council ("FSOC"). The FSOC will overseeoversees and coordinate the efforts of the primary U.S. financial regulatory agencies (including the FRB, the SEC, the Commodity Futures Trading Commission and the FDIC) in establishing regulations to address financial stability concerns. In addition to the framework for systemic risk oversight implemented through the FSOC, the Dodd-Frank Act broadly affectsaffected the financial services industry by creating a resolution authority, mandating higher capital and liquidity requirements, requiring banks to pay increased fees to regulatory agencies, and through numerous other provisions aimed at strengthening the sound operation of the financial services sector. As discussed further throughout this section, many aspects of Dodd-Frank arecontinue to be subject to further rulemaking and will take effect over several years, making it difficult to anticipate the overall financial impact on PacWest or across the industry.
Bank Holding Company Regulation
As a bank holding company, PacWest is registered with and subject to regulation by the FRB under the Bank Holding Company Act of 1956, as amended, or the BHCA. FRB policy historically has required bank holding companies to act as a source of financial strength to their bank subsidiaries and to commit capital and financial resources to support those subsidiaries in circumstances where it might not otherwise do so. The Dodd-Frank Act codifiescodified this policy as a statutory requirement. Under this requirement, the Company is expected to commit resources to support the Bank, including at times when we may not be in a financial position to do so. Similarly, under the cross-guarantee provisions of the Federal Deposit Insurance Act, the FDIC can hold any FDIC-insured depository institution liable for any loss suffered or anticipated by the FDIC in connection with (i) the default of a commonly controlled FDIC-insured depository institution or (ii) any assistance provided by the FDIC to such a commonly controlled institution. Under the BHCA, we are subject to periodic examination by the FRB. We are also required to file with the FRB periodic reports of our operations and such additional information regarding the Company and its subsidiaries as the FRB may require. Pursuant to the BHCA, we are required to obtain the prior approval of the FRB before we acquire all or substantially all of the assets of any bank or ownership or control of voting shares of any bank if, after giving effect to such acquisition, we would own or control, directly or indirectly, more than 5 percent of such bank.
Under the BHCA, we may not engage in any business other than managing or controlling banks or furnishing services to our subsidiaries that the FRB deems to be so closely related to banking as "to be a proper incident thereto." We are also prohibited, with certain exceptions, from acquiring direct or indirect ownership or control of more than 5 percent of the voting shares of any company unless the company is engaged in banking activities or the FRB determines that the activity is so closely related to banking as to be a proper incident to banking. The FRB's approval must be obtained before the shares of any such company can be acquired and, in certain cases, before any approved company can open new offices.
The BHCA and regulations of the FRB also impose certain constraints on the redemption or purchase by a bank holding company of its own shares of stock.
Additionally, bank holding companies that meet certain eligibility requirements prescribed by the BHCA and elect to operate as financial holding companies may engage in, or own shares in companies engaged in, a wider range of nonbanking activities, including securities and insurance activities and any other activity that the FRB, in consultation with the Secretary of the Treasury, determines by regulation or order is financial in nature, incidental to any such financial activity or complementary to any such financial activity and does not pose a substantial risk to the safety or soundness of depository institutions or the financial system generally. As of the date of this filing, we do not operate as a financial holding company.
Our earnings and activities are affected by legislation, by regulations and by local legislative and administrative bodies and decisions of courts in the jurisdictions in which we and the Bank conduct business. For example, these include limitations on the ability of the Bank to pay dividends to us and our ability to pay dividends to our shareholders. It is the policy of the FRB that bank holding companies should pay cash dividends on common stock only out of income available over the past year and only if prospective earnings retention is consistent with the organization's expected future needs and financial condition. The policy provides that bank holding companies should not maintain a level of cash dividends that undermines the bank holding company's ability to serve as a source of strength to its banking subsidiaries. Various federal and state statutory provisions limit the amount of dividends that subsidiary banks and savings associations can pay to their holding companies without regulatory approval.
In addition to these explicit limitations, the federal regulatory agencies have general authority to prohibit a banking subsidiary or bank holding company from engaging in an unsafe or unsound banking practice. Depending upon the circumstances, the agencies could take the position that paying a dividend would constitute an unsafe or unsound banking practice. Further, as discussed below under "—Regulation of the Bank", a bank holding company such as the Company is required to maintain minimum ratios of Tier 1 capital and total capital to total risk-weighted assets, and a minimum ratio of Tier 1 capital to total adjusted quarterly average assets as defined in such regulations. The level of our capital ratios may affect our ability to pay dividends. See "Item 5. Market for Registrant's Common Equity and Related Stockholder Matters—Dividends" and Note 19,Dividend Availability and Regulatory Matters, of the Notes to Consolidated Financial Statements contained in "Item 8. Financial Statements and Supplementary Data."
Banking subsidiaries of bank holding companies are also subject to certain restrictions imposed by federal law in dealings with their holding companies and other affiliates. Subject to certain exceptions set forth in the Federal Reserve Act, a bank can make a loan or extend credit to an affiliate, purchase or invest in the securities of an affiliate, purchase assets from an affiliate, accept securities of an affiliate as collateral for a loan or extension of credit to any person or company, issue a guarantee or accept letters of credit on behalf of an affiliate only if the aggregate amount of the above transactions of such subsidiary does not exceed 10 percent of such subsidiary's capital stock and surplus on an individual basis or 20 percent of such subsidiary's capital stock and surplus on an aggregate basis. Such
transactions must be on terms and conditions that are consistent with safe and sound banking practices. A bank holding company and its subsidiaries generally may not purchase a "low-quality asset," as that term is defined in the Federal Reserve Act, from an affiliate. Such restrictions also prevent a holding company and its other affiliates from borrowing from a banking subsidiary of the holding company unless the loans are secured by collateral. The Dodd-Frank Act significantly expands the coverage and scope of the limitations on affiliate transactions within a banking organization.
The FRB has cease and desist powers over parent bank holding companies and non-banking subsidiaries where the action of a parent bank holding company or its non-financial institutions represent an unsafe or unsound practice or violation of law. The FRB has the authority to regulate debt obligations, other than commercial paper, issued by bank holding companies by imposing interest ceilings and reserve requirements on such debt obligations.
The Dodd-Frank Act requires the federal financial regulatory agencies to adopt rules that prohibit banks and their affiliates from engaging in proprietary trading and investing in and sponsoring certain unregistered investment companies (defined as hedge funds and private equity funds), with implementation starting as early as July 2012. The statutory provision is commonly called the "Volcker Rule". In October 2011, federal regulators proposed rules to implement the Volcker Rule which were issued for public comment, with comments due by February 13, 2012. The proposed rules are highly complex, and many aspects of their application remain uncertain. Based on the proposed rules, we do not currently anticipate that the Volcker Rule will have a material effect on our operations since we do not engage in the businesses prohibited by the Volcker Rule. We may incur costs if we are required to adopt additional policies and systems to ensure compliance with the Volcker Rule, but any such costs are not expected to be material. Until a final rule is adopted, the precise financial impact of the rule on the Company, its customers or the financial industry more generally, cannot be determined.
Regulation of the Bank
The Bank is extensively regulated under both federal and state law.
Various requirements and restrictions under federal and state law affect the operations of the Bank. Federal and state statutes and regulations relate to many aspects of the Bank's operations, including standards for safety and soundness, reserves against deposits, interest payable on certain deposit products, investments, mergers and acquisitions, borrowings, dividends, locations of branch offices, fair lending requirements, Community Reinvestment Act activities and loans to affiliates.
Further, eachThe Dodd-Frank Act applies the same leverage and risk-based capital requirements that apply to insured depository institutions to bank holding companies, such as the Company. The guidelines of the Company and the Bank is required to maintain certain levels of capital. The FRB and the FDIC have substantially similar risk-based capital ratio and leverage ratio guidelines for banking organizations. The guidelines are intended to ensure that banking organizations have adequate capital given the risk levels of assets and off-balance sheet financial instruments. Under the guidelines, banking organizations are required to maintain minimum ratios for Tier 1 capital and total capital to risk-weighted assets (including certain off-balance sheet items, such as letters of credit). For purposes of calculating the ratios, a banking organization's assets and some of its specified off-balance sheet commitments and obligations are assigned to various risk categories. A depository institution's or holding company's capital, in turn, is classified in one of three tiers, depending on type:
convertible debt securities, qualifying subordinated debt, and allowances for possible credit losses, subject to limitations.
The following are the regulatory capital guidelines and the actual capitalization levels for Pacific Western and the Company as of December 31, 2010. Regulatory capital requirements limit the amount of deferred tax assets that may be included when determining the amount of regulatory capital. Deferred tax asset amounts in excess of the calculated limit are deducted from regulatory capital. AtSee "Item 7. Management's Discussion and Analysis of Financial Condition and Results of Operations—Capital Resources" for further information on regulatory capital requirements and ratios as of December 31, 2010, such amount was $51.0 million. No assurance can be given that2011 for Pacific Western and the regulatory capital deferred tax asset limitation will not increase in the future. There was no limitation on the Bank's regulatory capital due to deferred tax assets.Company.
| | December 31, 2010 | ||||||||||||
|---|---|---|---|---|---|---|---|---|---|---|---|---|---|
| | Adequately Capitalized | Well Capitalized | Pacific Western Bank | PacWest Bancorp Consolidated | |||||||||
Tier 1 leverage capital ratio | 4.00 | % | 5.00 | % | 8.51 | % | 8.54 | % | |||||
Tier 1 risk-based capital ratio | 4.00 | % | 6.00 | % | 12.71 | % | 12.68 | % | |||||
Total risk-based capital ratio | 8.00 | % | 10.00 | % | 13.99 | % | 13.96 | % | |||||
The Company issued subordinated debentures to trusts that were established by us or entities we have acquired, which, in turn, issued trust preferred securities, which totaled $123.0 million at December 31, 2010. These securities are currently included in our Tier I capital for purposes of determining the Company's Tier I and total risk-based capital ratios.2011. The Board of Governors of the Federal Reserve System, which is the holding company's banking regulator, has promulgated a modification of the capital regulations affecting trust preferred securities. Although this modification was scheduled to be effective on March 31, 2009, the Federal Reserve postponed the effective date to March 31, 2011. At that time, the Company will be allowed to includeincludes in Tier I1 capital an amount of trust preferred securities equal to no more than 25% of the sum of all core capital elements, which is generally defined as shareholders' equity less goodwill, net of any related deferred income tax liability. The regulations currently in effect through December 31, 2010, limit the amount of trust preferred securities that can be included in Tier I capital to 25% of the sum of core capital elements without a deduction for goodwill. We have determined that our Tier I capital ratios would remain above the well-capitalized level had the modification of the capital regulations been in effect at December 31, 2010. We expect that our Tier I capital ratios will be at or above the existing well-capitalized levels on
March 31, 2011, the first date on which the modified capital regulations must be applied. While our existing trust preferred securities are grandfathered under the Dodd-Frank precludesWall Street Reform and Consumer Protection Act that was enacted in July 2010, new issuances from qualifyingwill not qualify as Tier 1 capital. See "Item 7. Management's Discussion and Analysis of Financial Condition and Results of Operations—Borrowings" for information regarding the redemption in March 2012 of certain of our subordinated debentures.
The FDIC and FRB risk-based capital guidelines are based upon the 1988 Capital Accord ("Basel I") of the Basel Committee on Banking Supervision (the "Basel Committee"). The Basel Committee is a committee of central banks and bank supervisors/regulators from the major industrialized countries that develops broad policy guidelines that each country's supervisors can use to determine the supervisory policies they apply. After working on revisions for a number of years, in June 2004, the Basel Committee released the final version of itsa proposed new capital framework, with an update in November 2005 ("Basel II). Basel II proposes two approaches for setting capital standards for credit risk—an internal ratings-based approach tailored to individual institutions' circumstances (which for many asset classes is itself broken into a "foundation" approach and an "advanced" or "A-IRB" approach, the availability of which is subject to additional restrictions) and a standardized approach that bases risk weightings on external credit assessments to a much greater extent than permitted in existing risk-based capital guidelines. Basel II also would set capital requirements for operational risk and refine the existing capital requirements for market risk exposures.
The U.S. banking and thrift agencies are developing proposed revisions to their existing capital adequacy regulations and standards based on Basel II. In December 2006, the agencies issued a notice of proposed rulemaking setting forth a definitive proposal for implementing Basel II in the United States that would apply only to internationally active banking organizations—defined as those with consolidated total assets of $250 billion or more or consolidated on-balance sheet foreign exposures of $10 billion or more—but that other U.S. banking organizations could elect but would not be required to apply. In November 2007, the agencies adopted a definitive final rule for implementing Basel II in the United States that would apply only to internationally active banking organizations, or "core banks"—defined as those with consolidated total assets of $250 billion or more or consolidated on-balance sheet foreign exposures of $10 billion or more. The final rule was effective on April 1, 2008.
The Company is not required to comply with Basel II and we have not adopted the Basel II approach.
In June 2008, the U.S. banking and thrift agencies announced a proposed rule that would provide all non-core banking organizations (that is, banking organizations not required to adopt the advanced approaches) with the option to adopt a way to determine required regulatory capital that is more risk sensitive than the current Basel I-based rules, yet is less complex than the advanced approaches in the
final rule. The proposed standardized framework addresses (i) expanding the number of risk-weight categories to which credit exposures may be assigned; (ii) using loan-to-value ratios to risk weight most residential mortgages to enhance the risk sensitivity of the capital requirement; (iii) providing a capital charge for operational risk using the Basic Indicator Approach under the international Basel II capital accord; (iv) emphasizing the importance of a bank's assessment of its overall risk profile and capital adequacy; and (v) providing for comprehensive disclosure requirements to complement the minimum capital requirements and supervisory process through market discipline. This new proposal will replace the agencies' earlier Basel I-A proposal, issued in December 2006.
In December 2010, the Basel Committee released its final framework for strengthening international capital and liquidity regulation, now officially identified by the Basel Committee as "Basel III". Basel III, when implemented by the U.S. banking agencies and fully phased-in, will require bank holding companies and their bank subsidiaries to maintain substantially more capital, with a greater emphasis on common equity.
The Basel III final capital framework, among other things:
The capital conservation buffer is designed to absorb losses during periods of economic stress. Banking institutions with a ratio of CET1 to risk-weighted assets above the minimum but below the conservation buffer (or below the combined capital conservation buffer and countercyclical capital buffer, when the latter is applied) will face constraints on dividends, equity repurchases and compensation based on the amount of the short fall.
The implementation of the Basel III final framework will commence January 1, 2013. On that date, banking institutions will be required to meet the following minimum capital ratios:
The Basel III final framework provides for a number of new deductions from and adjustments to CET1. These include, for example, the requirement that mortgage servicing rights, deferred tax assets dependent upon future taxable income and significant investments in non-consolidated financial entities be deducted from CET1 to the extent that any one such category exceeds 10% of CET1 or all such categories in the aggregate exceed 15% of CET1.
Implementation of the deductions and other adjustments to CET1 will begin on January 1, 2014 and will be phased-in over a five-year period (20% per year). The implementation of the capital conservation buffer will begin on January 1, 2016 at 0.625% and be phased in over a four-year period (increasing by that amount on each subsequent January 1, until it reaches 2.5% on January 1, 2019).
The U.S. banking agencies have indicated informally that they expectare expected to propose regulations implementingpublish notice of proposed rule-making with respect to at least certain portions of Basel III in mid-2011 with final adoptionduring the first half of implementing regulations in mid-2012.2012. Given that the Basel III rules are subject to change, and the scope and content of capital regulations that the U.S. banking agencies may adopt under Dodd-Frank is uncertain, we cannot be certain of the impact new capital regulations will have on our capital ratios.
Historically, regulation and monitoring of bank and bank holding company liquidity has been addressed as a supervisory matter, both in the U.S. and internationally, without required formulaic measures. The Basel III final framework requires banks and bank holding companies to measure their liquidity against specific liquidity tests that, although similar in some respects to liquidity measures historically applied by banks and regulators for management and supervisory purposes, going forward will be required by regulation. One test, referred to as the liquidity coverage ratio ("LCR"), is designed to ensure that the banking entity maintains an adequate level of unencumbered high-quality liquid assets equal to the entity's expected net cash outflow for a 30-day time horizon (or, if greater, 25% of its expected total cash outflow) under an acute liquidity stress scenario. The other, referred to as the net stable funding ratio ("NSFR"), is designed to promote more medium- and long-term funding of the assets and activities of banking entities over a one-year time horizon. These requirements will incent banking entities to increase their holdings of U.S. Treasury securities and other sovereign debt as a component of assets and increase the use of long-term debt as a funding source. The LCR would be implemented subject to an observation period beginning in 2011, but would not be introduced as a requirement until January 1, 2015, and the NSFR would not be introduced as a requirement until January 1, 2018. These new standards are subject to further rulemaking and their terms may well change before implementation.
Prompt Corrective Action
The Federal Deposit Insurance Corporation Improvement Act, or FDICIA, requires each federal banking agency to take prompt corrective action to resolve the problems of insured depository institutions, including but not limited to those that fall below one or more prescribed minimum capital ratios. Pursuant to FDICIA, the FDIC promulgated regulations defining the following five categories in which an insured depository institution will be placed, based on the level of its capital ratios: well capitalized, adequately capitalized, undercapitalized, significantly undercapitalized and critically undercapitalized. Under the prompt corrective action provisions of FDICIA, an insured depository institution generally will be classified as undercapitalized if its total risk-based capital is less than 8% or its Tier 1 risk-based capital or leverage ratio is less than 4%. An institution that, based upon its capital
levels, is classified as "well capitalized", "adequately capitalized" or "undercapitalized" may be treated as though it were in the next lower capital category if the appropriate federal banking agency, after notice and opportunity for hearing, determines that an unsafe or unsound condition or an unsafe or unsound practice warrants such treatment. At each successive lower capital category, an insured depository institution is subject to more restrictions and prohibitions, including restrictions on growth, restrictions on interest rates paid on deposits, prohibitions on payment of dividends and restrictions on the acceptance of brokered deposits. Furthermore, if a bank is classified in one of the undercapitalized categories, it is required to submit a capital restoration plan to the federal bank regulator, and the holding company must guarantee the performance of that plan.
In addition to measures taken under the prompt corrective action provisions, commercial banking organizations may be subject to potential enforcement actions by the federal or state banking agencies for unsafe or unsound practices in conducting their businesses or for violations of any law, rule,
regulation or any condition imposed in writing by the agency or any written agreement with the agency. Enforcement actions may include the imposition of a conservator or receiver, the issuance of a cease-and-desist order that can be judicially enforced, the termination of insurance for deposits (in the case of a depository institution), the imposition of civil money penalties, the issuance of directives to increase capital, the issuance of formal and informal agreements, the issuance of removal and prohibition orders against institution-affiliatedinstitution- affiliated parties. The enforcement of such actions through injunctions or restraining orders may be based upon a judicial determination that the agency would be harmed if such equitable relief was not granted.
Deposit Insurance
Pacific Western is a state-chartered, "non-member" bank and therefore is regulated by the California Department of Financial Institutions, or DFI, and the FDIC. Pacific Western is also an FDIC insured financial institution whereby the FDIC provides deposit insurance for a certain maximum dollar amount per customer.
The Bank, as is the case with all FDIC insured banks, is subject to deposit insurance assessments as determined by the FDIC. Historically, the FDIC imposed insurance premiums based on the amount of deposits held and a risk matrix that takestook into account, among other factors, a bank's capital level and supervisory rating. ThePursuant to the Dodd-Frank Act, requires the FDIC to amendamended its regulations to determine insurance assessments based on the average consolidated assets less the average tangible equity of the insured depository institution during the assessment period. Based on the current FDIC insurance assessment methodology our FDIC insurance assessment was $5.6 million for 2011 and is estimated to be $4.3 million for 2012. In addition, the Dodd-Frank Act requires the FDIC to adopt a new Deposit Insurance Fund restoration plan to ensure that the fund reserve ratio reaches 1.35% by September 30, 2020. At least semi-annually, the FDIC will update its loss and income projections for the fund and, if needed, will increase or decrease assessment rates, following notice-and-comment rulemaking if required.
The proposed regulations could increasechanges to the assessments paid byFDIC insurance assessment calculation and fund requirements are a result of the Bank.
liquidity concerns that arose during the market disruption in 2008. In late 2008, in an effort to strengthen confidence and encourage liquidity in the banking system, the FDIC temporarily increased the maximum amount of deposit insurance to $250,000 per customer and adopted a number of programs, including the Transaction Account Guarantee Program. The Transaction Account Guarantee Program guaranteed the entire balance of non-interest bearing deposit transaction accounts through December 31, 2010. Institutions participating in the Transaction Account Guarantee Program were charged a 10-basis point fee on the balance of non-interest bearing deposit transaction accounts exceeding the existing deposit insurance limit of $250,000. The cost to the Bank for participating in this program was $794,000 for 2010 and $452,000 for 2009. Under Dodd-Frank, the $250,000 maximum amount was made permanent, and the unlimited protection for noninterest-bearing transaction accounts
was extended to December 31, 2012 and to all insured depository institutions.institutions without a separate surcharge.
On November 12,In the second quarter of 2009, the FDIC imposed a special assessment on all depository institutions; such assessment was $2.0 million for the Bank. In addition, the FDIC required insured depository institutions to prepay on December 30, 2009, their estimated quarterly assessments for the fourth quarter of 2009, and for all of 2010, 2011, and 2012. The amount of Pacific Western's FDIC assessment prepayment was $19.5 million, which we paid on December 30, 2009. In addition, the FDIC imposed a special assessment on all depository institutions in the second quarter of 2009; such assessment was $2.0 million for the Bank.
The 2009 prepayments and special assessment for FDIC insurance are in contrast to the lower FDIC insurance assessment expense for Pacific Western in 2008 and 2007. Because of favorable loss experience and a healthy reserve ratio in the deposit insurance fund of the FDIC, well-capitalized and well-managed banks, including Pacific Western, paid minimal premiums for FDIC insurance during 2008 and 2007. A deposit premium refund, in the form of credit offsets, was given to banks that were in existence on December 31, 1996 and paid deposit insurance premiums prior to that date. Pacific Western utilized its credit offset to eliminate a portion of its 2008 and nearly all of its 2007 FDIC insurance assessments.
Incentive Compensation
BasedThe Dodd-Frank Act requires the Federal bank regulatory agencies and the Securities and Exchange Commission to establish joint regulations or guidelines prohibiting incentive-based payment arrangements at specified regulated entities, such as the Company and the Bank, having at least $1 billion in total assets that encourage inappropriate risks by providing an executive officer, employee, director or principal shareholder with excessive compensation, fees, or benefits or that could lead to material financial loss to the entity. In addition, these regulators must establish regulations or guidelines requiring enhanced disclosure to regulators of incentive-based compensation arrangements. The agencies proposed such regulations in April 2011, which may become effective before the end of 2012. If the regulations are adopted in the form initially proposed, they will impose limitations on the currentmanner in which we may structure compensation for our executives.
In June 2010, the FRB and the FDIC insurance assessment methodologyissued comprehensive final guidance on incentive compensation policies intended to ensure that the incentive compensation policies of banking organizations do not undermine the safety and soundness of such organizations by encouraging excessive risk-taking. The guidance, which covers all employees that have the ability to materially affect the risk profile of an organization, either individually or as part of a group, is based upon the key principles that a banking organization's incentive compensation arrangements should (i) provide incentives that do not encourage risk-taking beyond the organization's ability to effectively identify and manage risks, (ii) be compatible with effective internal controls and risk management, and (iii) be supported by strong corporate governance, including our participationactive and effective oversight by the organization's board of directors. These three principles are incorporated into the proposed joint compensation regulations under Dodd-Frank, discussed above. The FRB will review, as part of its regular, risk-focused examination process, the incentive compensation arrangements of banking organizations, such as the Company, that are not "large, complex banking organizations." These reviews will be tailored to each organization based on the scope and complexity of the organization's activities and the prevalence of incentive compensation arrangements. The findings of the supervisory initiatives will be included in reports of examination. Deficiencies will be incorporated into the Transaction Account Guarantee Program, our FDIC insurance assessment was $8.1 million for 2010.organization's supervisory ratings, which can affect the organization's ability to make acquisitions and take other actions. Enforcement actions may be taken against a banking organization if its incentive compensation arrangements, or related risk-management control or governance processes, pose a risk to the organization's safety and soundness and the organization is not taking prompt and effective measures to correct the deficiency.
Consumer Regulation
The Dodd-Frank Act established the new Consumer Financial Protection Bureau (the "CFPB") with broad powers to supervise and enforce consumer protection laws. The CFPB has broad rule-making authority for a wide range of consumer protection laws that apply to all banks and savings institutions, including the authority to prohibit "unfair, deceptive or abusive" acts and practices. While CFPB's examination and enforcement authority only extends to banking organizations with more than $10 billion in assets, banks with less than $10 billion in assets, such as the Bank, will be examined for compliance with the CFPB's rules and regulations by their primary federal banking agency. Given the recent establishment of the CFPB, there is still uncertainty surrounding the expected impact of this bureau on us and other banks. The Dodd-Frank Act also weakens the federal preemption rules that have been applicable for national banks and gives state attorneys general the ability to enforce federal consumer protection laws.
Depositor Preference
The Federal Deposit Insurance Act provides that, in the event of the "liquidation or other resolution" of an insured depository institution, the claims of depositors of the institution, including the claims of the FDIC as subrogee of insured depositors, and certain claims for administrative expenses of the FDIC as a receiver, will have priority over other general unsecured claims against the institution. If an insured depository institution fails, insured and uninsured depositors, along with the FDIC, will have priority in payment ahead of unsecured, non-deposit creditors, including the parent bank holding company, with respect to any extensions of credit they have made to such insured depository institution.
Sarbanes-Oxley Act
As a publicly traded company, we are subject to the Sarbanes-Oxley Act of 2002 ("Sarbanes-Oxley Act"). The principal provisions of the Sarbanes-Oxley Act, many of which have been implemented or interpreted through regulations, provide for and include, among other things: (i) the creation of an independent accounting oversight board; (ii) auditor independence provisions that restrict non-audit services that accountants may provide to their audit clients; (iii) additional corporate governance and responsibility measures, including the requirement that the chief executive officer and chief financial officer of a public company certify financial statements; (iv) the forfeiture of bonuses or other incentive-based compensation and profits from the sale of an issuer's securities by directors and senior officers in the twelve month period following initial publication of any financial statements that later require restatement; (v) an increase in the oversight of, and enhancement of certain requirements relating to, audit committees of public companies and how they interact with the Company's independent auditors; (vi) requirements that audit committee members must be independent and are barred from accepting consulting, advisory or other compensatory fees from the issuer; (vii) requirements that companies disclose whether at least one member of the audit committee is a "financial expert" (as such term is defined by the SEC) and if not discussed, why the audit committee does not have a financial expert; (viii) expanded disclosure requirements for corporate insiders, including accelerated reporting of stock transactions by insiders and a prohibition on insider trading during pension blackout periods; (ix) a prohibition on personal loans to directors and officers, except certain loans made by insured financial institutions on nonpreferential terms and in compliance with other bank regulatory requirements; (x) disclosure of a code of ethics and filing a Form 8-K for a change or waiver of such code; (xi) a range of enhanced penalties for fraud and other violations; and (xii) expanded disclosure and certification relating to an issuer's disclosure controls and procedures and internal controls over financial reporting.
As a result of the Sarbanes-Oxley Act, and its implementing regulations, we have incurred substantial costs to interpret and ensure ongoing compliance with the law and its regulations. Future
changes in the laws, regulation, or policies that impact us cannot necessarily be predicted and may have a material effect on our business and earnings.
USA PATRIOT Act
The Uniting and Strengthening America by Providing Appropriate Tools Required to Intercept and Obstruct Terrorism Act of 2001, or the PATRIOT Act, designed to deny terrorists and others the ability to obtain access to the United States financial system, has significant implications for depository institutions, brokers, dealers and other businesses involved in the transfer of money. The PATRIOT Act, as implemented by various federal regulatory agencies, requires financial institutions, including the Company, to establish and implement policies and procedures with respect to, among other matters, anti-money laundering, compliance, suspicious activity and currency transaction reporting and due diligence on customers. The PATRIOT Act and its underlying regulations permit information sharing for counter-terrorist purposes between federal law enforcement agencies and financial institutions, as well as among financial institutions, subject to certain conditions, and require the FRB, the FDIC and
other federal banking agencies to evaluate the effectiveness of an applicant in combating money laundering activities when considering applications filed under Section 3 of the BHCA or the Bank Merger Act.
We regularly evaluate and continue to augment our systems and procedures to continue to comply with the PATRIOT Act and other anti-money laundering initiatives. We believe that the ongoing cost of compliance with the PATRIOT Act is not likely to be material to the Company. Failure of a financial institution to maintain and implement adequate programs to combat money laundering and terrorist financing, or to comply with all of the relevant laws or regulations, could have serious legal and reputational consequences for the institution.
Office of Foreign Assets Control Regulation
The United States has imposed economic sanctions that affect transactions with designated foreign countries, nationals and others. These are typically known as the "OFAC" rules based on their administration by the U.S. Treasury Department Office of Foreign Assets Control ("OFAC"). The OFAC-administered sanctions targeting countries take many different forms. Generally, however, they contain one or more of the following elements: (i) restrictions on trade with or investment in a sanctioned country, including prohibitions against direct or indirect imports from and exports to a sanctioned country and prohibitions on "U.S. persons" engaging in financial transactions relating to making investments in, or providing investment-related advice or assistance to, a sanctioned country; and (ii) a blocking of assets in which the government or specially designated nationals of the sanctioned country have an interest, by prohibiting transfers of property subject to U.S. jurisdiction (including property in the possession or control of U.S. persons). Blocked assets (e.g., property and bank deposits) cannot be paid out, withdrawn, set off or transferred in any manner without a license from OFAC. Failure to comply with these sanctions could have serious legal and reputational consequences.
Community Reinvestment Act
The Community Reinvestment Act of 1977, or the CRA, generally requires insured depository institutions to identify the communities they serve and to make loans and investments, offer products, and provide services designed to meet the credit needs of these communities. The CRA also requires banks to maintain comprehensive records of its CRA activities to demonstrate how it is meeting the credit needs of their communities; these documents are subject to periodic examination by the FDIC. During these examinations, the FDIC rates such institutions' compliance with CRA as "Outstanding," "Satisfactory," "Needs to Improve" or "Substantial Noncompliance." The CRA requires the FDIC to take into account the record of a bank in meeting the credit needs of the entire communities served, including low-and moderate income neighborhoods, in determining such rating. Failure of an institution
to receive at least a "Satisfactory" rating could inhibit such institution or its holding company from undertaking certain activities, including acquisitions. The Bank received a CRA rating of "Satisfactory" as of its most recent examination.
Customer Information Security
The FRB and other bank regulatory agencies have adopted final guidelines for safeguarding confidential, personal customer information. These guidelines require each financial institution, under the supervision and ongoing oversight of its board of directors or an appropriate committee thereof, to create, implement and maintain a comprehensive written information security program designed to ensure the security and confidentiality of customer information, protect against any anticipated threats or hazard to the security or integrity of such information and protect against unauthorized access to or use of such information that could result in substantial harm or inconvenience to any customer. We have adopted a customer information security program to comply with such requirements.
Privacy
The Gramm-Leach-Bliley Act of 1999 and the California Financial Information Privacy Act require financial institutions to implement policies and procedures regarding the disclosure of nonpublic personal information about consumers to non-affiliated third parties. In general, the statutes require explanations to consumers on policies and procedures regarding the disclosure of such nonpublic personal information, and, except as otherwise required by law, prohibit disclosing such information except as provided in the Bank's policies and procedures. Pacific Western has implemented privacy policies addressing these restrictions which are distributed regularly to all existing and new customers of the Bank.
Legislative and Regulatory Initiatives
From time to time, various legislative and regulatory initiatives are introduced in the U.S. Congress and state legislatures, as well as by regulatory agencies. Such initiatives may include proposals to expand or contract the powers of bank holding companies and depository institutions or proposals to substantially change the financial institution regulatory system. Such legislation could change banking statutes and our operating environment in substantial and unpredictable ways. If enacted, such legislation could increase or decrease the cost of doing business, limit or expand permissible activities or affect the competitive balance among banks, savings associations, credit unions, and other financial institutions. We cannot predict whether any such legislation will be enacted, and, if enacted, the effect that it, or any implementing regulations, would have on our financial condition, results of operations or cash flows. A change in statutes, regulations or regulatory policies applicable to the Company or any of its subsidiaries could have a material effect on our business.
Hazardous Waste Clean-Up and Climate-Related Risk
Our primary exposure to environmental laws is through our lending activities and through properties or businesses we may own, lease or acquire since we are not involved in any business that manufactures, uses or transports chemicals, waste, pollutants or toxins that might have a material adverse effect on the environment. Based on a general survey of the Bank's loan portfolio, conversations with local appraisers and the type of lending currently and historically done by the Bank, we are not aware of any potential liability for hazardous waste contamination that would be reasonably likely to have a material adverse effect on the Company as of February 16, 2010.29, 2012. In addition, we are not aware of any physical or regulatory consequence resulting from climate change that would have a material adverse effect upon the Company.
We maintain an Internet website atwww.pacwestbancorp.com, and a website for Pacific Western atwww.pacificwesternbank.com. Atwww.pacwestbancorp.com and via the "Investor Relations" link at the Bank's website, our annual report on Form 10-K, quarterly reports on Form 10-Q, current reports on Form 8-K and amendments to such reports filed or furnished pursuant to Section 13(a) or 15(d) of the Exchange Act are available, free of charge, as soon as reasonably practicable after such forms are electronically filed with, or furnished to, the SEC. The public may read and copy any materials we file with the SEC at the SEC's Public Reference Room, located at 100 F Street, NE, Washington, D.C. 20549. The public may obtain information on the operation of the Public Reference Room by calling the SEC at 1-800-SEC-0330. The SEC also maintains an Internet website athttp://www.sec.gov that contains reports, proxy and information statements, and other information regarding issuers that file electronically with the SEC. You may obtain copies of the Company's filings on the SEC site. These documents may also be obtained in print upon request by our stockholders to our Investor Relations Department.
We have adopted a written code of ethics that applies to all directors, officers and employees of the Company, including our principal executive officer and senior financial officers, in accordance with Section 406 of the Sarbanes-Oxley Act of 2002 and the rules of the Securities and Exchange Commission promulgated thereunder. The code of ethics, which we call our Code of Business Conduct and Ethics, is available on our corporate website,www.pacwestbancorp.com in the section entitled "Corporate Governance." In the event that we make changes in, or provide waivers from, the provisions of this code of ethics that the SEC requires us to disclose, we intend to disclose these events on our corporate website in such section. In the Corporate Governance section of our corporate website, we have also posted the charters for our Audit Committee and our Compensation, Nominating and Governance Committee, as well as our Corporate Governance Guidelines. In addition, information concerning purchases and sales of our equity securities by our executive officers and directors is posted on our website.
Our Investor Relations Department can be contacted at PacWest Bancorp, 275 N. Brea Blvd., Brea, CA 92821, Attention: Investor Relations, telephone (714) 671-6800, or via e-mail toinvestor-relations@pacwestbancorp.com.investor- relations@pacwestbancorp.com.
All website addresses given in this document are for information only and are not intended to be an active link or to incorporate any website information into this document.
This Annual Report on Form 10-K contains certain forward-looking information about the Company, which statements are intended to be covered by the safe harbor for "forward-looking statements" provided by the Private Securities Litigation Reform Act of 1995. All statements other than statements of historical fact are forward-looking statements. Such statements involve inherent risks and uncertainties, many of which are difficult to predict and are generally beyond the control of the Company. We caution readers that a number of important factors could cause actual results to differ materially from those expressed in, implied or projected by, such forward-looking statements. Risks and uncertainties include, but are not limited to:
If any of these risks or uncertainties materializes or if any of the assumptions underlying such forward-looking statements proves to be incorrect, our results could differ materially from those expressed in, implied or projected by, such forward-looking statements. Therefore, readers should be mindful that forward-looking statements are not guarantees of future performance and that they are subject to known and unknown risks and uncertainties that are difficult to predict. Except as required by law, we undertake no, and hereby disclaim any, obligation to update any forward-looking statements, whether as a result of new information, changed circumstances or otherwise. For additional information concerning risks and uncertainties related to us and our operations, please refer to Items 1 through 7A of this Annual Report on Form 10-K.
Ownership of our common stock involves risk. You should carefully consider, in addition to the other information set forth herein, the following risk factors.
Our business has been and may continue to be adversely affected by current conditions in the financial markets and economic conditions generally.
From December 2007 through June 2009, the U.S. economy was in recession and economic recovery through 20102011 has been sluggish. As a result, the global financial markets have undergone and may continue to experience pervasive and fundamental disruptions. In some cases, the markets have produced downward pressure on stock prices and credit availability for certain issuers without regard to those issuers' underlying financial strength. While economic conditions have recently shown signs of improvement, the sustainability of an economic recovery is uncertain as business activity across a wide range of industries continues to face difficulties due to the lack of consumer spending and sustained high levels of unemployment.
A sustained weakness or further weakening in business and economic conditions generally or specifically in the principal markets in which we do business could have one or more of the following adverse effects on our business:
Overall, the economic downturn has had an adverse effect on our business, and there can be no assurance that an economic recovery will be sustainable in the near term. Until conditions improve, we expect our business, financial condition and results of operations to be adversely affected.
Changes in economic conditions, in particular a worsening of the economic slowdown in Southern California, could materially and adversely affect our business.
Our business is directly impacted by factors such as economic, political and market conditions, broad trends in industry and finance, legislative and regulatory changes, and changes in government monetary and fiscal policies and inflation, all of which are beyond our control. The current economic conditions have caused a lack of consumer confidence, increased market volatility and widespread reduction of business activity generally. These circumstances may lead to a renewedan increase in nonaccrual and classified loans, which generally results in a provision for credit losses and in turn reduces the Company's net earnings. The State of California continues to face fiscal challenges, the long-term effects of which on the State's economy cannot be predicted. A further deterioration in the economic conditions, whether caused by national or local concerns, could materially and adversely affect our business. In particular, further deterioration of the economic conditions in Southern California could result in the following consequences, any of which could materially and adversely affect our business: loan delinquencies may increase; problem assets and foreclosures may increase; demand for our products and services may decrease; low cost or noninterest bearing deposits may decrease; and collateral for loans made by us, especially real estate, may decline in value, in turn reducing customers' borrowing power, and reducing the value of assets and collateral associated with our existing loans. Until conditions provide for sustainable improvement, we expect our business, financial condition and results of operations to be adversely affected.
Further disruptions in the real estate market could materially and adversely affect our business.
There has been a slow-down in the real estate market due to negative economic trends and credit market disruption, the impacts of which are not yet completely known or quantified. At December 31, 2010, 64%2011, 75% and 4% of our total gross loans, both non-covered loansand covered, were secured by commercialcomprised of real estate 3% were secured by commercialmortgage loans and real estate construction projects, 2% were secured by residential real estate construction projects and 8% were secured by residential real estate.loans, respectively. We have observed in the marketplace tighter credit underwriting and higher premiums on liquidity, both of which may continue to place downward pressure on real estate values. Any further downturn in the real estate market could materially and adversely affect our business because a significant portion of our non-covered loans are secured by real estate. Our ability to recover on defaulted non-covered loans by selling the real estate
collateral would then be diminished and we would be more likely to suffer losses on defaulted non-covered loans. Substantially all of our real property collateral is located in Southern California. If there is a further decline in real estate values, especially in Southern California, the collateral for our non-covered loans would provide less security. Real estate values could be affected by, among other things, a worsening of the economic conditions, an increase in foreclosures, a decline in home sale volumes, an increase in interest rates, continued high levels of unemployment, earthquakes and other natural disasters particular to California.
Our business is subject to interest rate risk, and variations in interest rates may materially and adversely affect our financial performance.
Changes in the interest rate environment may reduce our profits. It is expected that we will continue to realize income from the differential or "spread" between the interest earned on loans, securities and other interest earning assets, and interest paid on deposits, borrowings and other interest bearing liabilities. Net interest spreads are affected by the difference between the maturities and repricing characteristics of interest earning assets and interest bearing liabilities. Changes in market
interest rates generally affect loan volume, loan yields, funding sources and funding costs. Our net interest spread depends on many factors that are partly or completely out of our control, including competition, federal economic monetary and fiscal policies, and general economic conditions.
While an increase in the general level of interest rates may increase our loan yield, it may adversely affect the ability of certain borrowers with variable rate loans to pay the interest on and principal of their obligations. In addition, an increase in market interest rates on loans is generally associated with a lower volume of loan originations, which may reduce earnings. Following an increase in the general level of interest rates, our ability to maintain a positive net interest spreadsspread is dependent on our ability to increase our loan offering rates, replace loan maturities with new originations, minimize increases on our deposit rates, and maintain an acceptable level and mix of funding. We cannot provide assurances that we will be able to increase our loan offering rates and continue to originate loans due to the competitive landscape in which we operate. Additionally, we cannot provide assurances that we can minimize the increases in our deposit rates while maintaining an acceptable level of deposits. Finally, we cannot provide any assurances that we can maintain our current levels of noninterest bearing deposits as customers may seek higher yielding products when rates increase.
Following a decline in the general level of interest rates, our ability to maintain a positive net interest spread is dependent on our ability to reduce the interest paid on deposits, borrowings, and other interest bearing liabilities. We cannot provide assurance that we would be able to lower the rates paid on deposit accounts to support our liquidity requirements as lower rates may result in deposit outflows.
Accordingly, changes in levels of market interest rates could materially and adversely affect our net interest spread, asset quality, loan origination volume, liquidity, and overall profitability. We cannot assure you that we can minimize our interest rate risk.
We face strong competition from financial services companies and other companies that offer banking services which could materially and adversely affect our business.
We conduct our banking operations primarily in Southern California. Increased competition in our market may result in reduced loans and deposits.deposits or less favorable loan and deposit terms. Ultimately, we may not be able to compete successfully against current and future competitors. Many competitors offer the same banking services that we offer in our service area. These competitors include national banks, regional banks and other community banks. We also face competition from many other types of financial institutions, including without limitation, savings and loan institutions, finance companies, brokerage firms, insurance companies, credit unions, mortgage banks and other financial intermediaries.
In particular, our competitors include several major financial companies whose greater resources may afford them a marketplace advantage by enabling them to maintain numerous banking locations and ATMs and conduct extensive promotional and advertising campaigns.
Additionally, banks and other financial institutions with larger capitalization and financial intermediaries not subject to bank regulatory restrictions have larger lending limits and are thereby able to serve the credit needs of larger customers. Areas of competition include interest rates for loans and deposits, efforts to obtain deposits, and the range and quality of products and services provided, including new technology driven products and services. Technological innovation continues to contribute to greater competition in domestic and international financial services markets as technological advances enable more companies to provide financial services. We also face competition from out-of-state financial intermediaries that have opened production offices or that solicit deposits in our market areas. Should competition in the financial services industry intensify, our ability to market our products and services may be adversely affected. If we are unable to attract and retain banking customers, we may be unable to grow or maintain the levels of our loans and deposits and our results of operations and financial condition may be adversely affected.
Competition from financial institutions seeking to maintain adequate liquidity places upward pressure on the rates paid on certain deposit accounts relative to the level of market interest rates during times of both decreasing and increasing market liquidity. To maintain both attractive and adequate levels of liquidity, without exhausting secondary sources of liquidity, we may incur increased deposit costs.
Several rating agencies publish unsolicited ratings of the financial performance and relative financial health of many banks, including Pacific Western, based on publicly available data. As these ratings are publicly available, a decline in the Bank's ratings may result in deposit outflows or the inability of the Bank to raise deposits in the secondary market as broker-dealersbroker- dealers and depositors may use such ratings in deciding where to deposit their funds.
We may need to raise additional capital in the future and such capital may not be available when needed or at all.
We may need to raise additional capital in the future to provide us with sufficient capital resources and liquidity to meet our commitments and business needs. As a publicly traded company, a likely source of additional funds is the capital markets, accomplished generally through the issuance of equity, both common and preferred stock, and the issuance of subordinated debentures. Our ability to raise additional capital, if needed, will depend on, among other things, conditions in the capital markets at that time, which are outside of our control, and our financial performance. The current economic conditions and the loss of confidence in financial institutions may increase our cost of funding and limit our access to some of our customary sources of liquidity, including, but not limited to, the capital markets, inter-bank borrowings, repurchase agreements and borrowings from the discount window of the Federal Reserve.
We cannot assure you that access to such capital and liquidity will be available to us on acceptable terms or at all. Any occurrence that may limit our access to the capital markets, such as a decline in the confidence of debt purchasers, or depositors of the Bank or counterparties participating in the capital markets, may materially and adversely affect our capital costs and our ability to raise capital and, in turn, our liquidity. An inability to raise additional capital on acceptable terms when needed could have a materially adverse effect on our business.
We are subject to extensive regulation which could materially and adversely affect our business.
Our operations are subject to extensive regulation by federal and state governmental authorities, and we are subject to various laws and judicial and administrative decisions imposing requirements and
restrictions on part or all of our operations. The Dodd-Frank Act, enacted in July 2010, instituted major changes to the banking and financial institutions regulatory regimes in light of the recent performance of and government intervention in the financial services sector. Regulations affecting banks and other financial institutions, such as the Dodd-Frank Act, are undergoing continuous review and change frequently; the ultimate effect of such changes cannot be predicted. Because our business is highly regulated, compliance with such regulations and laws may increase our costs and limit our ability to pursue business opportunities. Also, participation in specific government stabilization programs may subject us to additional restrictions. There can be no assurance that proposed laws, rules and regulations will not be adopted in the future, which could (i) make compliance much more difficult or expensive, (ii) restrict our ability to originate, broker or sell loans or accept certain deposits, (iii) further limit or restrict the amount of commissions, interest or other charges earned on loans originated or sold by us, or (iv) otherwise materially and adversely affect our business or prospects for business.
The recently enacted Dodd-Frank Act will have material implications for the Company and the entire financial services industry. Among other things it will or potentially could:
As the Dodd-Frank Act requires that many studies be conducted and that hundreds of regulations be written in order to fully implement it, the full impact of this legislation on us, our business strategies, and financial performance cannot be known at this time, and may not be known for a number of years. However, these impacts are expected to be substantial and some of them are likely to adversely affect us and our financial performance. The Dodd-Frank Act and related regulations may also require us to invest significant management attention and resources to make any necessary changes, and could therefore also adversely affect our business, financial condition and results of operations.
Additionally, in order to conduct certain activities, including acquisitions, we are required to obtain regulatory approval. There can be no assurance that any required approvals can be obtained, or obtained without conditions or on a timeframe acceptable to us. For more information, please see the section entitled "Item 1. Business—Supervision and Regulation" above.Regulation."
The recentDodd-Frank repeal of federal prohibitions on payment of interest on demand deposits could increase our interest expense.
All federal prohibitions on the ability of financial institutions to pay interest on demand deposit accounts were repealed as part of the Dodd-Frank Act. As a result, beginning on July 21, 2011, financial institutions could commence offeringcan offer interest on demand deposits to compete for clients. We do not yet know what interest rates other institutions may offer. Our interest expense will increase and our net interest margin will decrease if the Bank begins offering interest on demand deposits to attract additional customers or maintain current customers, which could have a material adverse effect on our business, financial condition and results of operations.
Emergency measures designed to stabilize the U.S. financial system are beginning to wind down.
Since the middle of 2008, in addition to the programs initiated under the Emergency Economic Stabilization Act of 2008, other regulators have taken steps to attempt to stabilize and add liquidity to the financial markets. Some of these programs have begun to expire and the impact of the expiration of these programs on the financial industry and the economic recovery is unknown. A slowdown in or reversal of the economic recovery could have a material adverse effect on our business, financial condition and results of operations.
Increases in or required prepayments of FDIC insurance premiums may adversely affect our earnings.
Since 2008, higher levels of bank failures have dramatically increased resolution costs of the FDIC and depleted the deposit insurance fund. In addition, the FDIC instituted temporary programs, some of
which were made permanent by the Dodd-Frank Act, to further insure customer deposits at FDIC insured banks, which have placed additional stress on the deposit insurance fund.
In order to maintain a strong funding position and restore reserve ratios of the deposit insurance fund, the FDIC has increased assessment rates of insured institutions. In addition, on November 12, 2009, the FDIC adopted a rule requiring banks to prepay three years' worth of premiums to replenish the depleted insurance fund.
Historically, the FDIC utilized a risk-based assessment system that imposed insurance premiums based upon a risk matrix that takes into account several components including but not limited to the bank's capital level and supervisory rating. ThePursuant to the Dodd-Frank Act, requires the FDIC to amendamended its regulations to base insurance assessments on the average consolidated assets less the average tangible equity of the insured depository institution during the assessment period. The FDIC has proposed implementing regulations which could increase the assessments paid by the Bank. In addition, the FDIC has proposed regulations that would change the way the deposit insurance assessment rate is applied to banks to a system that is risk-based.
We are generally unable to control the amount of premiums that we are required to pay for FDIC insurance. Any future increases in or required prepayments of FDIC insurance premiums may adversely affect our financial condition or results of operations.
Our information systems may experience an interruption or security breach.
We rely heavily on communications and information systems to conduct our business. Any failure, interruption or breach in security of these systems could result in failures or disruptions in our customer relationship management, general ledger, deposit, loan and other systems. While we have policies and procedures designed to prevent or limit the effect of the possible failure, interruption or security breach of our information systems, there can be no assurance that any such failure, interruption or security breach will not occur or, if they do occur, that they will be adequately addressed. The occurrence of any failure, interruption or security breach of our information systems could damage our reputation, result in a loss of customer business, subject us to additional regulatory scrutiny or expose us to civil litigation and possible financial liability.
We are exposed to transactional, country and legal risk related to our foreign loans that is in addition to risks we face on loans to U.S. based borrowers.
Approximately 1% of our non-covered loan portfolio is represented by credit we extend and loans we make to businessbusinesses located outside the United States, predominantly in Mexico. These loans, which include commercial loans, real estate loans and credit extensions for the financing of international trade, are subject to risks in addition to risks we face with our loans to businesses located in the United States including, but not limited to transaction risk, country risk and legal risk. While these loans are denominated in U.S. dollars, the ability of the borrower to repay may be affected by fluctuations in the borrower's home country currency relative to the U.S. dollar. Additionally, while most of our foreign loans are insured by U.S.-based institutions, guaranteed by a U.S.-based entity, or collateralized with
U.S.-based assets or real property, our ability to collect in the event of default is subject to a number of conditions, as well as deductibles and co-payments with respect to insurance, and we may not be successful in obtaining partial or full repayment or reimbursement from the insurers. Furthermore, foreign laws may restrict our ability to foreclose on, take a security interest in, or seize collateral located in the foreign country.
We are exposed to risk of environmental liabilities with respect to properties to which we take title.
In the course of our business, we may own or foreclose and take title to real estate, and could be subject to environmental liabilities with respect to these properties. We may be held liable to a governmental entity or to third parties for property damage, personal injury, investigation and clean-up costs incurred by these parties in connection with environmental contamination, or may be required to investigate or clean up hazardous or toxic substances, or chemical releases at a property. The costs associated with investigation or remediation activities could be substantial. In addition, as the owner or former owner of a contaminated site, we may be subject to common law claims by third parties based on damages and costs resulting from environmental contamination emanating from the property. If we ever become subject to significant environmental liabilities, our business, financial condition, liquidity and results of operations could be materially and adversely affected.
We may not pay dividends on common stock.
Our stockholders are only entitled to receive such dividends as our Board of Directors may declare out of funds legally available for such payments. Although we have historically declared cash dividends on our common stock, we are not required to do so and may reduce or eliminate our common stock dividend in the future. Our ability to pay dividends to our stockholders is subject to the restrictions set forth in Delaware law, by our federal regulator, and by certain covenants contained in the indentures governing the trust preferred securities issued by us or entities we have acquired. Notification to the FRB is also required prior to our declaring and paying a cash dividend to our stockholders during any period in which our quarterly net earnings are insufficient to fund the dividend amount. We may not pay a dividend should the FRB object until such time as we receive approval from the FRB or no longer need to provide notice under applicable regulations. See "Item 5. Market for Registrant's Common Equity and Related Stockholder Matters—Dividends" of this Annual Report on Form 10-K for more information on these restrictions. In addition, we may be restricted by applicable law or regulation or actions taken by our regulators, or as a result of our participation in any specific government stabilization programs, now or in the future, from paying dividends to our stockholders. Accordingly, we cannot assure you that we will continue paying dividends on our common stock at current levels or at all. Our failure to pay dividends on our common stock could have a material adverse effect on the market price of our common stock.
The primary source of our income from which, among other things, we pay dividends is the receipt of dividends from the Bank.
We are a legal entity separate and distinct from the Bank and our other subsidiaries. The availability of dividends from the Bank is limited by various statutes and regulations. It is possible, depending upon the financial condition of the Bank and other factors, that the FRB, the FDIC and/or the DFI could assert that payment of dividends or other payments is an unsafe or unsound practice, or that such regulatory authority may impose restrictions on the Bank's ability to pay dividends as a condition to the Bank's participation in any stabilization program. In the event the Bank is unable to pay dividends to us, it is likely that we, in turn, would have to stop paying dividends on our common stock. Our failurestock and may have difficulty meeting our other financial obligations, including payments in respect of any outstanding indebtedness or trust preferred securities. The inability of the Bank to pay dividends on our common stockto us could have a material adverse effect on the market price of our common stock. See "Item 1.
Business—Supervision and Regulation" above for additional information on the regulatory restrictions to which we and the Bank are subject.
Only a limited trading market exists for our common stock which could lead to price volatility.
Our common stock trades on The NASDAQ Global Select Stock Market under the symbol "PACW" and our trading volume is modest. The limited trading market for our common stock may cause fluctuations in the market value of our common stock to be exaggerated, leading to price volatility in excess of that which would occur in a more active trading market of our common stock. In addition, even if a more active market in our common stock develops, we cannot assure you that such a market will continue or that stockholders will be able to sell their shares.
Our allowance for credit losses may not be adequate to cover actual losses.
In accordance with accounting principles generally accepted in the United States, we maintain an allowance for loan losses to provide for loan defaults and non-performance and a reserve for unfunded loan commitments which, when combined, we refer to as the allowance for credit losses. Our allowance for credit losses may not be adequate to address actual credit losses, and future provisions for credit losses could materially and adversely affect our operating results. Our allowance for credit losses is based on prior experience and an evaluation of the risks in the current portfolio. The amount of future losses is susceptible to changes in economic, operating and other conditions, including changes in interest rates that may be beyond our control, and these losses may exceed current estimates. Our federal and state regulators, as an integral part of their examination process, review our loans and allowance for credit losses. While we believe our allowance for credit losses is appropriate for the risk identified in the Company's loan portfolio, we cannot assure you that we will not further increase the
allowance for credit losses, that it will be sufficient to address losses, or that regulators will not require us to increase this allowance. Any of these occurrences could materially and adversely affect our earnings. See "Item 7. Management's Discussion and Analysis of Financial Condition and Results of Operations" of this Annual Report on Form 10-K for more information.
Our acquisitions may subject us to unknown risks.
We have completed 2223 acquisitions since May 2000, including the MEF acquisition in January 2012 and the FDIC-assisted acquisitions of Los Padres Bank in August 2010 and Affinity Bank in August 2009. Certain events may arise after the date of an acquisition, or we may learn of certain facts, events or circumstances after the closing of an acquisition, that may affect our financial condition or performance or subject us to risk of loss. These events include, but are not limited to: litigation resulting from circumstances occurring at the acquired entity prior to the date of acquisition; loan downgrades and credit loss provisions resulting from underwriting of certain acquired loans determined not to meet our credit standards; personnel changes that cause instability within a department; delays in implementing new policies or procedures or the failure to apply new policies or procedures; and other events relating to the performance of our business. Acquisitions involve inherent uncertainty and we cannot determine all potential events, facts and circumstances that could result in loss or give assurances that our investigation or mitigation efforts will be sufficient to protect against any such loss.
We are dependent on key personnel and the loss of one or more of those key personnel may materially and adversely affect our prospects.
We currently depend heavily on the services of our chairman, John Eggemeyer, our chief executive officer, Matthew Wagner, and a number of other key management personnel. The loss of Mr. Eggemeyer's or Mr. Wagner's services or that of other key personnel could materially and adversely affect our results of operations and financial condition. Our success also depends, in part, on our ability to attract and retain additional qualified management personnel. Competition for such
personnel is strong in the banking industry, and we may not be successful in attracting or retaining the personnel we require.
Concentrated ownership of our common stock creates a risk of sudden changes in our share price.
As of March 4, 2011,2, 2012, directors and members of our executive management team owned or controlled approximately 3.7%4% of our common stock, excluding shares that may be issued to executive officers upon vesting of restricted stock awards. Investors who purchase our common stock may be subject to certain risks due to the concentrated ownership of our common stock. The sale by any of our large stockholders of a significant portion of that stockholder's holdings could have a material adverse effect on the market price of our common stock. In addition, the registration of any significant amount of additional shares of our common stock will have the immediate effect of increasing the public float of our common stock and any such increase may cause the market price of our common stock to decline or fluctuate significantly.
Our largest stockholder is a registered bank holding company, and the activities and regulation of such stockholder may materially and adversely affect the permissible activities of the Company.
CapGen Capital Group II LP, which we refer to as CapGen, beneficially owned approximately 10.9%11% of the Company as of March 4, 2011.2, 2012. CapGen is a registered bank holding company under the BHCA and is regulated by the FRB. Under FRB guidelines,the Dodd-Frank Act and related regulations, bank holding companies must be a "source of strength" for their subsidiaries. See "Item 1. Business—Supervision and Regulation—Bank Holding Company Regulation" above for more information. Regulation of CapGen by the FRB may materially and adversely affect the activities and strategic plans of the Company should the FRB determine that CapGen or any other company in which either has invested has engaged in any unsafe
or unsound banking practices or activities. While we have no reason to believe that the FRB is proposing to take any action with respect to CapGen that would adversely affect the Company, we remain subject to such risk.
A natural disaster could harm the Company's business.
Historically, California, in which a substantial portion of the Company's business is located, has been susceptible to natural disasters, such as earthquakes, floods and wild fires. The nature and level of natural disasters cannot be predicted and may be exacerbated by global climate change. These natural disasters could harm the Company's operations through interference with communications, including the interruption or loss of the Company's computer systems, which could prevent or impede the Company from gathering deposits, originating loans and processing and controlling its flow of business, as well as through the destruction of facilities and the Company's operational, financial and management information systems. Additionally, natural disasters could negatively impact the values of collateral securing the Company's loans and interrupt our borrowers' abilities to conduct their business in a manner to support their debt obligations, either of which could result in losses and increased provisions for credit losses.
Our decisions regarding the fair value of assets acquired, including the FDIC loss sharing asset, could be inaccurate which could materially and adversely affect our business, financial condition, results of operations, and future prospects.
Management makes various assumptions and judgments about the collectibility of the acquired loans, including the creditworthiness of borrowers and the value of the real estate and other assets serving as collateral for the repayment of secured loans. In FDIC-assisted acquisitions that include loss sharing agreements, we may record a loss sharing asset that we consider adequate to absorb future losses which may occur in the acquired loan portfolio. In determining the size of the loss sharing asset, we analyze the loan portfolio based on historical loss experience, volume and classification of loans,
volume and trends in delinquencies and nonaccruals, local economic conditions, and other pertinent information. If our assumptions are incorrect, the balance of the FDIC loss sharing asset may at any time be insufficient to cover future loan losses, and credit loss provisions may be needed to respond to different economic conditions or adverse developments in the acquired loan portfolio. Any increase in future losses on loanloans and other assets covered by loss sharing agreements could have a negative effect on our operating results.
Our ability to obtain reimbursement under the loss sharing agreements on covered assets depends on our compliance with the terms of the loss sharing agreements.
Management must certify to the FDIC on a quarterly basis our compliance with the terms of the FDIC loss sharing agreements as a prerequisite to obtaining reimbursement from the FDIC for realized losses on covered assets. The required terms of the agreements are extensive and failure to comply with any of the guidelines could result in a specific asset or group of assets temporarily or permanently losing their loss sharing coverage. Additionally, management may decide to forgo loss share coverage on certain assets to allow greater flexibility over the management of certain assets. As of December 31, 2010, $1.0 billion,2011, $781.7 million, or 18.4%14.1%, of the Company's assets were covered by the FDIC loss sharing agreements.
Under the terms of the FDIC loss sharing agreements, the assignment or transfer of the loss sharing agreement to another entity generally requires the written consent of the FDIC. Based on the manner in which assignment is defined in the agreements, each of the following requires the prior written consent of the FDIC:
No assurances can be given that we will manage the covered assets in such a way as to always maintain loss share coverage on all such assets.
ITEM 1B. UNRESOLVED STAFF COMMENTS
None.
As of March 1, 2011,2012, we had a total of 9597 properties consisting of 7776 operating branch offices, 1two annex office, 3offices, three operations centers, 810 loan production offices, and 6six other properties of which 2 are subleased.properties. We own 8eight locations and the remaining properties are leased. Almost all properties are located in Southern California. Pacific Western's principal office is located at 10250 Constellation Blvd., Suite 1640, Los Angeles, CA 90067.
For additional information regarding properties of the Company and Pacific Western, see Note 9,Premises and Equipment, Net, of the Notes to Consolidated Financial Statements contained in "Item 8. Financial Statements and Supplementary Data."
In the ordinary course of our business, we are party to various legal actions, which we believe are incidental to the operation of our business. The outcome of such legal actions and the timing of ultimate resolution are inherently difficult to predict. Because of these factors, the Company cannot provide a meaningful estimate of the range of reasonably possible outcomes of claims in the aggregate or by individual claim. In the opinion of management, based upon information currently available to us, any resulting liability, isin addition to amounts already accrued, would not likely to have a material adverse effect on the Company's consolidated financial position, results of operationsstatements or cash flows.operations.
ITEM 4. RESERVEDMINE SAFETY DISCLOSURE
Not applicable.
ITEM 5. MARKET FOR REGISTRANT'S COMMON EQUITY, RELATED SHAREHOLDER MATTERS AND ISSUER PURCHASES OF EQUITY SECURITIES
Marketplace Designation, Sales Price Information and Holders
Our common stock is listed on The Nasdaq Global Select Market and is traded under the symbol "PACW." The following table summarizes the high and low sale prices for each quarterly period ended since January 1, 2009during the last two years for our common stock, as quoted and reported by The Nasdaq Stock Market, or Nasdaq:
| | Stock Sales Prices | Dividends Declared During Quarter | |||||||||||||||||||
|---|---|---|---|---|---|---|---|---|---|---|---|---|---|---|---|---|---|---|---|---|---|
| | High | Low | |||||||||||||||||||
2009 | |||||||||||||||||||||
First quarter | $ | 27.09 | $ | 9.36 | $ | 0.32 | |||||||||||||||
Second quarter | $ | 19.82 | $ | 11.64 | $ | 0.01 | |||||||||||||||
Third quarter | $ | 21.42 | $ | 11.66 | $ | 0.01 | Stock Sales Prices | Dividends Declared During Quarter | |||||||||||||
Fourth quarter | $ | 21.19 | $ | 15.43 | $ | 0.01 | High | Low | |||||||||||||
2010 | 2010 | ||||||||||||||||||||
First quarter | $ | 23.70 | $ | 19.03 | $ | 0.01 | |||||||||||||||
Second quarter | $ | 24.98 | $ | 18.25 | $ | 0.01 | |||||||||||||||
Third quarter | $ | 21.81 | $ | 16.85 | $ | 0.01 | |||||||||||||||
Fourth quarter | $ | 22.07 | $ | 16.56 | $ | 0.01 | |||||||||||||||
First quarter | $ | 23.70 | $ | 19.03 | $ | 0.01 | |||||||||||||||
Second quarter | $ | 24.98 | $ | 18.25 | $ | 0.01 | |||||||||||||||
Third quarter | $ | 21.81 | $ | 16.85 | $ | 0.01 | |||||||||||||||
Fourth quarter | $ | 22.07 | $ | 16.56 | $ | 0.01 | |||||||||||||||
2011 | |||||||||||||||||||||
First quarter | $ | 22.64 | $ | 19.61 | $ | 0.01 | |||||||||||||||
Second quarter | $ | 23.31 | $ | 19.00 | $ | 0.01 | |||||||||||||||
Third quarter | $ | 21.34 | $ | 13.82 | $ | 0.01 | |||||||||||||||
Fourth quarter | $ | 19.76 | $ | 13.00 | $ | 0.18 | |||||||||||||||
As of March 2, 2011,2012, the closing price of our common stock on Nasdaq was $20.20$21.26 per share. As of that date, based on the records of our transfer agent, there were approximately 2,0011,598 record holders of our common stock.
Our ability to pay dividends to our stockholders is subject to the restrictions set forth in the Delaware General Corporation Law, or the DGCL. The DGCL provides that a corporation, unless otherwise restricted by its certificate of incorporation, may declare and pay dividends out of its surplus or, if there is no surplus, out of net profits for the fiscal year in which the dividend is declared and/or for the preceding fiscal year, as long as the amount of capital of the corporation is not less than the aggregate amount of the capital represented by the issued and outstanding stock of all classes having a preference upon the distribution of assets. Surplus is defined as the excess of a corporation's net assets (i.e., its total assets minus its total liabilities) over the capital associated with issuances of its common stock. Moreover, DGCL permits a board of directors to reduce its capital and transfer such amount to its surplus. In determining the amount of surplus of a Delaware corporation, the assets of the corporation, including stock of subsidiaries owned by the corporation, must be valued at their fair market value as determined by the board of directors, regardless of their historical book value. Our ability to pay dividends is also subject to certain other limitations. See "Item 1. Business—Supervision and Regulation" in Part I of this Annual Report on Form 10-K and Note 19,Dividend Availability and Regulatory Matters, of the Notes to Consolidated Financial Statements contained in "Item 8. Financial Statements and Supplementary Data."
Set forth in the table above are the dividends declared and paid by the Company during the two most recent fiscal years. Our ability to pay cash dividends to our stockholders is also limited by certain covenants contained in the indentures governing trust preferred securities issued by us or entities that we have acquired, and the debentures underlying the trust preferred securities. Generally the
indentures provide that if an Event of Default (as defined in the indentures) has occurred and is
continuing, or if we are in default with respect to any obligations under our guarantee agreement which covers payments of the obligations on the trust preferred securities, or if we give notice of any intention to defer payments of interest on the debentures underlying the trust preferred securities, then we may not, among other restrictions, declare or pay any dividends (other than a dividend payable by the Bank to the holding company) with respect to our common stock. Notification to the FRB is also required prior to our declaring and paying a cash dividend to our stockholders during any period in which our quarterly net earnings are insufficient to fund the dividend amount. Under such circumstances, we may not pay a dividend should the FRB object until such time as we receive approval from the FRB or no longer need to provide notice under applicable regulations.
Holders of Company common stock are entitled to receive dividends declared by the Board of Directors out of funds legally available under state law governing the Company and certain federal laws and regulations governing the banking and financial services business. During 2011, 2010, 2009, and 2008,2009, the Company paid $7.6 million, $1.4 million, $11.1 million, and $35.4$11.1 million, respectively, in cash dividends on common stock.
We can provide no assurance that we will continue to declare dividends on a quarterly basis or otherwise. The declaration of dividends by the Company is subject to the discretion of our Board of Directors. Our Board of Directors will take into account such matters as general business conditions, our financial results, projected cash flows, capital requirements, contractual, legal and regulatory restrictions on the payment of dividends by us to our stockholders or by our subsidiary to the holding company, and such other factors as our Board of Directors may deem relevant.
PacWest's primary source of income is the receipt of cash dividends from the Bank. The availability of cash dividends from the Bank is limited by various statutes and regulations. It is possible, depending upon the financial condition of the bank in question, and other factors, that the FRB, the FDIC or the DFI could assert that payment of dividends or other payments is an unsafe or unsound practice. Pacific Western is subject to restrictions under certain federal and state laws and regulations governing banks which limit its ability to transfer funds to the holding company through intercompany loans, advances or cash dividends.
Dividends paid by state banks, such as Pacific Western, are regulated by the DFI under its general supervisory authority as it relates to a bank's capital requirements. A state bank may declare a dividend without the approval of the DFI as long as the total dividends declared in a calendar year do not exceed either the retained earnings or the total of net earnings for three previous fiscal years less any dividend paid during such period. During 2010, no2011, the Bank paid $25.5 million in dividends were paid to PacWest from the Bank. As of this date and forCompany. For the foreseeable future, any further cash dividends from the Bank to the Company will require DFI approval. See "Item 1. Business—Supervision and Regulation," in Part I of this Annual Report on Form 10-K for further discussion of potential regulatory limitations on the holding company's receipt of funds from the Bank, as well as "Item 7. Management's Discussion and Analysis of Financial Condition and Results of Operations—Liquidity" and Note 19,Dividend Availability and Regulatory Matters, of the Notes to Consolidated Financial Statements contained in "Item 8. Financial Statements and Supplementary Data" for a discussion of other factors affecting the availability of dividends and limitations on the ability to declare dividends.
Securities Authorized for Issuance Under Equity Compensation Plans
The following table provides information as of December 31, 2010,2011, regarding securities issued and to be issued under our equity compensation plans that were in effect during fiscal 2010:2011:
Plan Category | Plan Name | Number of Securities to be Issued Upon Exercise of Outstanding Options, Warrants and Rights | Weighted- Average Exercise Price of Outstanding Options, Warrants and Rights | Number of Securities Remaining Available for Future Issuance Under Equity Compensation Plans (Excluding Securities Reflected in Column (a)) | ||||||||
|---|---|---|---|---|---|---|---|---|---|---|---|---|
| | | (a) | (b) | (c) | ||||||||
Equity compensation plans approved by security holders | The PacWest Bancorp 2003 Stock Incentive Plan(1) | — | (2) | $ | — | (3) | ||||||
Equity compensation plans not approved by security holders | None | — | — | — | ||||||||
Recent Sales of Unregistered Securities and Use of Proceeds
None.
In January 2009, all participants in the Company's Directors Deferred Compensation Plan, or the DDCP, received distributions of amounts previously deferred and the DDCP was terminated. Upon termination of the DDCP 184,395 common shares were distributed to the participants.
Prior to 2009, participants in the DDCP were able to invest deferred amounts in the Company's common stock. The Company had the discretion whether to track purchases of common stock as if made, or to fully fund the DDCP via purchases of stock with deferred amounts. Purchases of Company common stock by the rabbi trust of the DDCP were considered repurchases of common stock by the Company since the rabbi trust was an asset of the Company. Actual purchases of Company common stock via the DDCP were made through open market purchases pursuant to the terms of the DDCP, which include a predetermined formula and schedule for the purchase of such stock in accordance with Rule 10b5-1 of the Securities Exchange Act of 1934. Pursuant to the terms of the DDCP, generally purchases were actually made or deemed to be made in the open market on the 15th of the month (or the next trading day) following the day on which deferred amounts were contributed to the DDCP, beginning March 15 of each year.
The following table presents stock purchases made during the fourth quarter of 2010:2011:
Purchase Dates | Total Number of Shares Purchased(1) | Average Price Paid Per Share | |||||
|---|---|---|---|---|---|---|---|
October 1 - October 31, 2011 | — | $ | — | ||||
November 1 - November 30, 2011 | 57,790 | 17.96 | |||||
December 1 - December 31, 2011 | — | — | |||||
Total | 57,790 | $ | 17.96 | ||||
| | Total Shares Purchased(1) | Average Price Per Share | ||||||
|---|---|---|---|---|---|---|---|---|
October 1 - October 31, 2010 | — | $ | — | |||||
November 1 - November 30, 2010 | 53,081 | 18.75 | ||||||
December 1 - December 31, 2010 | — | — | ||||||
Total | 53,081 | $ | 18.75 | |||||
Five-Year Stock Performance Graph
The following chart compares the yearly percentage change in the cumulative shareholder return on our common stock based on the closing price during the five years ended December 31, 2010,2011, with (1) the Total Return Index for U.S. companies traded on The Nasdaq Stock Market (the "NASDAQ Composite"), (2) the Total Return Index for NASDAQ Bank Stocks (the "NASDAQ Bank Index") and (3)(2) the Total Return Index for the KBW Regional Bank Stocks (the "KBW Regional Banking Index"). This comparison assumes $100 was invested on December 31, 2005,2006, in our common stock and the comparison groups and assumes the reinvestment of all cash dividends prior to any tax effect and retention of all stock dividends. PacWest's total cumulative loss was 55.6%59.4% over the five year period ending December 31, 20102011 compared to a gain of 25.9%10.8% and lossesloss of 24.7% and 44.0%33.6% for the NASDAQ Composite NASDAQ Bank Index, and KBW Regional Banking Index, respectively.
COMPARISON OF 5 YEAR CUMULATIVE TOTAL RETURN*
Among PacWest Bancorp, the NASDAQ Composite Index,the NASDAQ Bank Index and the KBW Regional Banking Index
| | Year Ended December 31, | Year Ended December 31, | ||||||||||||||||||||||||||||||||||||
|---|---|---|---|---|---|---|---|---|---|---|---|---|---|---|---|---|---|---|---|---|---|---|---|---|---|---|---|---|---|---|---|---|---|---|---|---|---|---|
Index | 2005 | 2006 | 2007 | 2008 | 2009 | 2010 | 2006 | 2007 | 2008 | 2009 | 2010 | 2011 | ||||||||||||||||||||||||||
PacWest Bancorp | $ | 100.00 | $ | 98.22 | $ | 79.44 | $ | 54.65 | $ | 41.81 | $ | 44.45 | $ | 100.00 | $ | 80.87 | $ | 55.63 | $ | 42.56 | $ | 45.25 | $ | 40.56 | ||||||||||||||
NASDAQ Composite | 100.00 | 111.74 | 124.67 | 73.77 | 107.12 | 125.93 | 100.00 | 110.26 | 65.65 | 95.19 | 112.10 | 110.81 | ||||||||||||||||||||||||||
NASDAQ Bank | 100.00 | 114.45 | 88.71 | 71.34 | 62.32 | 75.34 | ||||||||||||||||||||||||||||||||
KBW Regional Banking | 100.00 | 105.62 | 79.81 | 62.53 | 47.38 | 56.01 | 100.00 | 82.26 | 76.03 | 66.07 | 75.02 | 66.42 | ||||||||||||||||||||||||||
ITEM 6. SELECTED FINANCIAL DATA
The following table sets forth certain of our financial and statistical information for each of the years in the five-year period ended December 31, 2010.2011. This data should be read in conjunction with our audited consolidated financial statements as of December 31, 20102011 and 2009,2010, and for each of the years in the three-year period ended December 31, 20102011 and related Notes to Consolidated Financial Statements contained in "Item 8. Financial Statements and Supplementary Data."
| | | At or For the Year Ended December 31, | At or For the Year Ended December 31, | ||||||||||||||||||||||||||||||||
|---|---|---|---|---|---|---|---|---|---|---|---|---|---|---|---|---|---|---|---|---|---|---|---|---|---|---|---|---|---|---|---|---|---|---|---|
| | | 2010 | 2009 | 2008 | 2007 | 2006 | 2011 | 2010 | 2009 | 2008 | 2007 | ||||||||||||||||||||||||
| | | (In thousands, except per share amounts and percentages) | (In thousands, except per share amounts and percentages) | ||||||||||||||||||||||||||||||||
Results of Operations(a): | |||||||||||||||||||||||||||||||||||
Results of Operations(1): | |||||||||||||||||||||||||||||||||||
Interest income | $ | 295,284 | $ | 290,284 | $ | 269,874 | $ | 287,828 | $ | 350,981 | |||||||||||||||||||||||||
Interest expense | (32,643 | ) | (40,957 | ) | (53,828 | ) | (68,496 | ) | (85,866 | ) | |||||||||||||||||||||||||
Interest income | $ | 290,284 | $ | 269,874 | $ | 287,828 | $ | 350,981 | $ | 301,597 | |||||||||||||||||||||||||
Net interest income | 262,641 | 249,327 | 216,046 | 219,332 | 265,115 | ||||||||||||||||||||||||||||||
Interest expense | (40,957 | ) | (53,828 | ) | (68,496 | ) | (85,866 | ) | (59,640 | ) | |||||||||||||||||||||||||
Provision for credit losses: | |||||||||||||||||||||||||||||||||||
Non-covered loans | (13,300 | ) | (178,992 | ) | (141,900 | ) | (45,800 | ) | (3,000 | ) | |||||||||||||||||||||||||
Covered loans | (13,270 | ) | (33,500 | ) | (18,000 | ) | — | — | |||||||||||||||||||||||||||
Total provision for credit losses | (26,570 | ) | (212,492 | ) | (159,900 | ) | (45,800 | ) | (3,000 | ) | |||||||||||||||||||||||||
Net interest income | 249,327 | 216,046 | 219,332 | 265,115 | 241,957 | ||||||||||||||||||||||||||||||
Net interest income after provision for credit losses | 236,071 | 36,835 | 56,146 | 173,532 | 262,115 | ||||||||||||||||||||||||||||||
FDIC loss sharing income, net | 7,776 | 22,784 | 16,314 | — | — | ||||||||||||||||||||||||||||||
Other noninterest income | 23,650 | 20,454 | 22,604 | 24,427 | 32,920 | ||||||||||||||||||||||||||||||
Gain from Affinity acquisition | — | — | 66,989 | — | — | ||||||||||||||||||||||||||||||
Goodwill write-off | — | — | — | (761,701 | ) | — | |||||||||||||||||||||||||||||
Non-covered OREO costs, net | (7,010 | ) | (12,310 | ) | (21,569 | ) | (2,218 | ) | (105 | ) | |||||||||||||||||||||||||
Covered OREO costs, net | (3,666 | ) | (2,460 | ) | (1,753 | ) | — | — | |||||||||||||||||||||||||||
Other noninterest expense | (169,317 | ) | (174,033 | ) | (155,882 | ) | (142,016 | ) | (142,160 | ) | |||||||||||||||||||||||||
Earnings (loss) before income tax (expense) benefit | 87,504 | (108,730 | ) | (17,151 | ) | (707,976 | ) | 152,770 | |||||||||||||||||||||||||||
Income tax (expense) benefit | (36,800 | ) | 46,714 | 7,801 | (20,089 | ) | (62,444 | ) | |||||||||||||||||||||||||||
Provision for credit losses: | |||||||||||||||||||||||||||||||||||
Non-covered loans | (178,992 | ) | (141,900 | ) | (45,800 | ) | (3,000 | ) | (9,600 | ) | |||||||||||||||||||||||||
Covered loans | (39,046 | ) | (18,000 | ) | — | — | — | ||||||||||||||||||||||||||||
Total provision for credit losses | (218,038 | ) | (159,900 | ) | (45,800 | ) | (3,000 | ) | (9,600 | ) | |||||||||||||||||||||||||
Net interest income after provision for credit losses | 31,289 | 56,146 | 173,532 | 262,115 | 232,357 | ||||||||||||||||||||||||||||||
FDIC loss sharing income, net | 28,330 | 16,314 | — | — | — | ||||||||||||||||||||||||||||||
Other noninterest income | 20,454 | 22,604 | 24,427 | 32,920 | 16,466 | ||||||||||||||||||||||||||||||
Gain from Affinity acquisition | — | 66,989 | — | — | — | ||||||||||||||||||||||||||||||
Goodwill write-off | — | — | (761,701 | ) | — | — | |||||||||||||||||||||||||||||
Noninterest expense | (188,803 | ) | (179,204 | ) | (144,234 | ) | (142,265 | ) | (121,455 | ) | |||||||||||||||||||||||||
Net earnings (loss) before income tax benefit (expense) and effect of accounting change | (108,730 | ) | (17,151 | ) | (707,976 | ) | 152,770 | 127,368 | |||||||||||||||||||||||||||
Income tax benefit (expense) | 46,714 | 7,801 | (20,089 | ) | (62,444 | ) | (51,512 | ) | |||||||||||||||||||||||||||
Earnings (loss) before cumulative effect of accounting change | (62,016 | ) | (9,350 | ) | (728,065 | ) | 90,326 | 75,856 | |||||||||||||||||||||||||||
Cumulative effect on prior years (to December 31, 2005) of changing the method of accounting for stock-based compensation forfeitures | — | — | — | — | 142 | ||||||||||||||||||||||||||||||
Net earnings (loss) | $ | (62,016 | ) | $ | (9,350 | ) | $ | (728,065 | ) | $ | 90,326 | $ | 75,998 | ||||||||||||||||||||||
Net earnings (loss) | $ | 50,704 | $ | (62,016 | ) | $ | (9,350 | ) | $ | (728,065 | ) | $ | 90,326 | ||||||||||||||||||||||
Per Common Share Data: | Per Common Share Data: | ||||||||||||||||||||||||||||||||||
Earnings (loss) per share (EPS): | |||||||||||||||||||||||||||||||||||
Basic | $ | (1.77 | ) | $ | (0.30 | ) | $ | (26.81 | ) | $ | 3.08 | $ | 3.17 | ||||||||||||||||||||||
Diluted | $ | (1.77 | ) | $ | (0.30 | ) | $ | (26.81 | ) | $ | 3.08 | $ | 3.16 | ||||||||||||||||||||||
Dividends declared during year | $ | 0.04 | $ | 0.35 | $ | 1.28 | $ | 1.28 | $ | 1.21 | |||||||||||||||||||||||||
Book value per share(b) | $ | 13.06 | $ | 14.47 | $ | 13.17 | $ | 40.65 | $ | 39.42 | |||||||||||||||||||||||||
Tangible book value per share(b) | $ | 11.06 | $ | 13.52 | $ | 11.77 | $ | 11.88 | $ | 12.82 | |||||||||||||||||||||||||
Shares outstanding at year-end(b) | 36,672 | 35,015 | 28,528 | 28,002 | 29,636 | ||||||||||||||||||||||||||||||
Average shares outstanding: | |||||||||||||||||||||||||||||||||||
Basic EPS | 35,108 | 31,899 | 27,177 | 28,572 | 23,476 | ||||||||||||||||||||||||||||||
Diluted EPS | 35,108 | 31,899 | 27,177 | 28,591 | 23,588 | ||||||||||||||||||||||||||||||
Earnings (loss) per share (EPS): | |||||||||||||||||||||||||||||||||||
Basic | $ | 1.37 | $ | (1.77 | ) | $ | (0.30 | ) | $ | (26.81 | ) | $ | 3.08 | ||||||||||||||||||||||
Diluted | $ | 1.37 | $ | (1.77 | ) | $ | (0.30 | ) | $ | (26.81 | ) | $ | 3.08 | ||||||||||||||||||||||
Dividends declared during year | $ | 0.21 | $ | 0.04 | $ | 0.35 | $ | 1.28 | $ | 1.28 | |||||||||||||||||||||||||
Book value per share(2) | $ | 14.66 | $ | 13.06 | $ | 14.47 | $ | 13.17 | $ | 40.65 | |||||||||||||||||||||||||
Tangible book value per share(2) | $ | 13.14 | $ | 11.06 | $ | 13.52 | $ | 11.77 | $ | 11.88 | |||||||||||||||||||||||||
Shares outstanding at year-end(2) | 37,254 | 36,672 | 35,015 | 28,528 | 28,002 | ||||||||||||||||||||||||||||||
Average shares outstanding: | |||||||||||||||||||||||||||||||||||
Basic EPS | 35,491 | 35,108 | 31,899 | 27,177 | 28,572 | ||||||||||||||||||||||||||||||
Diluted EPS | 35,491 | 35,108 | 31,899 | 27,177 | 28,591 | ||||||||||||||||||||||||||||||
| | | At or For the Year Ended December 31, | At or For the Year Ended December 31, | |||||||||||||||||||||||||||||||
|---|---|---|---|---|---|---|---|---|---|---|---|---|---|---|---|---|---|---|---|---|---|---|---|---|---|---|---|---|---|---|---|---|---|---|
| | | 2010 | 2009 | 2008 | 2007 | 2006 | 2011 | 2010 | 2009 | 2008 | 2007 | |||||||||||||||||||||||
| | | (In thousands, except per share amounts and percentages) | (In thousands, except per share amounts and percentages) | |||||||||||||||||||||||||||||||
Balance Sheet Data: | Balance Sheet Data: | |||||||||||||||||||||||||||||||||
Total assets | $ | 5,528,237 | $ | 5,529,021 | $ | 5,324,079 | $ | 4,495,502 | $ | 5,179,040 | ||||||||||||||||||||||||
Cash and cash equivalents | 295,617 | 108,552 | 211,048 | 159,870 | 101,783 | |||||||||||||||||||||||||||||
Investment securities | 1,372,464 | 929,056 | 474,129 | 155,359 | 133,537 | |||||||||||||||||||||||||||||
Loans held for sale | — | — | — | — | 63,565 | |||||||||||||||||||||||||||||
Non-covered loans, net of unearned income(3) | 2,807,713 | 3,161,055 | 3,707,383 | 3,987,891 | 3,949,218 | |||||||||||||||||||||||||||||
Allowance for credit losses, non-covered loans(3) | 93,783 | 104,328 | 124,278 | 68,790 | 61,028 | |||||||||||||||||||||||||||||
Covered loans, net | 703,023 | 908,576 | 621,686 | — | — | |||||||||||||||||||||||||||||
FDIC loss sharing asset | 95,187 | 116,352 | 112,817 | — | — | |||||||||||||||||||||||||||||
Goodwill | 39,141 | 47,301 | — | — | 761,990 | |||||||||||||||||||||||||||||
Core deposit and customer relationship intangibles | 17,415 | 25,843 | 33,296 | 39,922 | 43,785 | |||||||||||||||||||||||||||||
Deposits | 4,577,453 | 4,649,698 | 4,094,569 | 3,475,215 | 3,245,146 | |||||||||||||||||||||||||||||
Borrowings | 225,000 | 225,000 | 542,763 | 450,000 | 612,000 | |||||||||||||||||||||||||||||
Subordinated debentures | 129,271 | 129,572 | 129,798 | 129,994 | 138,488 | |||||||||||||||||||||||||||||
Stockholders' equity | 546,203 | 478,797 | 506,773 | 375,726 | 1,138,352 | |||||||||||||||||||||||||||||
Performance Ratios: | ||||||||||||||||||||||||||||||||||
Stockholders' equity to total assets ratio | 9.88 | % | 8.66 | % | 9.52 | % | 8.36 | % | 21.98 | % | ||||||||||||||||||||||||
Tangible common equity ratio | 8.95 | % | 7.44 | % | 8.95 | % | 7.54 | % | 7.60 | % | ||||||||||||||||||||||||
Loans to deposits ratio | 76.70 | % | 87.52 | % | 105.73 | % | 114.75 | % | 121.70 | % | ||||||||||||||||||||||||
Net interest margin | 5.26 | % | 5.02 | % | 4.79 | % | 5.30 | % | 6.34 | % | ||||||||||||||||||||||||
Efficiency ratio(4) | 61.21 | % | 64.53 | % | 55.66 | % | 59.17 | % | 47.73 | % | ||||||||||||||||||||||||
Return on average assets | 0.92 | % | (1.14 | )% | (0.19 | )% | (15.43 | )% | 1.73 | % | ||||||||||||||||||||||||
Return on average equity | 9.92 | % | (12.56 | )% | (1.93 | )% | (106.28 | )% | 7.66 | % | ||||||||||||||||||||||||
Average equity to average assets | 9.32 | % | 9.10 | % | 10.06 | % | 14.52 | % | 22.55 | % | ||||||||||||||||||||||||
Dividend payout ratio | 15.04 | % | (5) | (5) | (5) | 41.56 | % | |||||||||||||||||||||||||||
Asset Quality: | ||||||||||||||||||||||||||||||||||
Non-covered nonaccrual loans(3) | $ | 58,260 | $ | 94,183 | $ | 240,167 | $ | 63,470 | $ | 22,473 | ||||||||||||||||||||||||
Non-covered OREO | 48,412 | 25,598 | 43,255 | 41,310 | 2,736 | |||||||||||||||||||||||||||||
Total assets | $ | 5,529,021 | $ | 5,324,079 | $ | 4,495,502 | $ | 5,179,040 | $ | 5,553,323 | ||||||||||||||||||||||||
Cash and cash equivalents | 108,552 | 211,048 | 159,870 | 101,783 | 151,411 | |||||||||||||||||||||||||||||
Investment securities | 929,056 | 474,129 | 155,359 | 133,537 | 120,128 | |||||||||||||||||||||||||||||
Loans held for sale | — | — | — | 63,565 | 173,319 | |||||||||||||||||||||||||||||
Non-covered loans, net of unearned income(c) | 3,161,055 | 3,707,383 | 3,987,891 | 3,949,218 | 4,189,543 | |||||||||||||||||||||||||||||
Allowance for credit losses, non-covered loans(c) | 104,328 | 124,278 | 68,790 | 61,028 | 61,179 | |||||||||||||||||||||||||||||
Covered loans, net | 908,576 | 621,686 | — | — | — | |||||||||||||||||||||||||||||
FDIC loss sharing asset | 116,352 | 112,817 | — | — | — | |||||||||||||||||||||||||||||
Goodwill | 47,301 | — | — | 761,990 | 738,083 | |||||||||||||||||||||||||||||
Core deposit and customer relationship intangibles | 25,843 | 33,296 | 39,922 | 43,785 | 50,427 | |||||||||||||||||||||||||||||
Deposits | 4,649,698 | 4,094,569 | 3,475,215 | 3,245,146 | 3,685,733 | |||||||||||||||||||||||||||||
Borrowings | 225,000 | 542,763 | 450,000 | 612,000 | 499,000 | |||||||||||||||||||||||||||||
Subordinated debentures | 129,572 | 129,798 | 129,994 | 138,488 | 149,219 | |||||||||||||||||||||||||||||
Stockholders' equity | 478,797 | 506,773 | 375,726 | 1,138,352 | 1,168,328 | |||||||||||||||||||||||||||||
Performance Ratios: | ||||||||||||||||||||||||||||||||||
Stockholders' equity to total assets ratio | 8.66 | % | 9.52 | % | 8.36 | % | 21.98 | % | 21.04 | % | ||||||||||||||||||||||||
Tangible common equity ratio | 7.44 | % | 8.95 | % | 7.54 | % | 7.60 | % | 7.97 | % | ||||||||||||||||||||||||
Loans to deposits ratio | 87.52 | % | 105.73 | % | 114.75 | % | 121.70 | % | 113.67 | % | ||||||||||||||||||||||||
Net interest margin | 5.02 | % | 4.79 | % | 5.30 | % | 6.34 | % | 6.67 | % | ||||||||||||||||||||||||
Efficiency ratio(d) | 63.33 | % | 55.66 | % | 59.17 | % | 47.73 | % | 47.00 | % | ||||||||||||||||||||||||
Return on average assets | (1.14 | )% | (0.19 | )% | (15.43 | )% | 1.73 | % | 1.72 | % | ||||||||||||||||||||||||
Return on average equity | (12.56 | )% | (1.93 | )% | (106.28 | )% | 7.66 | % | 9.13 | % | ||||||||||||||||||||||||
Average equity to average assets | 9.10 | % | 10.06 | % | 14.52 | % | 22.55 | % | 18.88 | % | ||||||||||||||||||||||||
Dividend payout ratio | (e) | (e) | (e) | 41.56 | % | 38.29 | % | |||||||||||||||||||||||||||
Asset Quality: | ||||||||||||||||||||||||||||||||||
Non-covered nonaccrual loans(c) | $ | 94,183 | $ | 240,167 | $ | 63,470 | $ | 22,473 | $ | 22,095 | ||||||||||||||||||||||||
Non-covered OREO | 25,598 | 43,255 | 41,310 | 2,736 | — | |||||||||||||||||||||||||||||
Non-covered nonperforming assets | $ | 119,781 | $ | 283,422 | $ | 104,780 | $ | 25,209 | $ | 22,095 | ||||||||||||||||||||||||
Non-covered nonperforming assets | $ | 106,672 | $ | 119,781 | $ | 283,422 | $ | 104,780 | $ | 25,209 | ||||||||||||||||||||||||
Asset Quality Ratios: | Asset Quality Ratios: | |||||||||||||||||||||||||||||||||
Non-covered nonaccrual loans to non-covered loans, net of unearned income(c) | 2.98 | % | 6.48 | % | 1.59 | % | 0.57 | % | 0.53 | % | ||||||||||||||||||||||||
Non-covered nonperforming assets to non-covered loans, net of unearned income, and OREO(c) | 3.76 | % | 7.56 | % | 2.60 | % | 0.64 | % | 0.53 | % | ||||||||||||||||||||||||
Allowance for credit losses to non-covered nonaccrual loans | 110.8 | % | 51.8 | % | 108.4 | % | 271.6 | % | 276.9 | % | ||||||||||||||||||||||||
Allowance for credit losses to non-covered loans, net of unearned income | 3.30 | % | 3.35 | % | 1.72 | % | 1.55 | % | 1.46 | % | ||||||||||||||||||||||||
Non-covered nonaccrual loans to non-covered loans, net of unearned income(3) | 2.07 | % | 2.98 | % | 6.48 | % | 1.59 | % | 0.57 | % | ||||||||||||||||||||||||
Non-covered nonperforming assets to non-covered loans, net of unearned income, and OREO(3) | 3.73 | % | 3.76 | % | 7.56 | % | 2.60 | % | 0.64 | % | ||||||||||||||||||||||||
Allowance for credit losses to non-covered nonaccrual loans | 161.0 | % | 110.8 | % | 51.8 | % | 108.4 | % | 271.6 | % | ||||||||||||||||||||||||
Allowance for credit losses to non-covered loans, net of unearned income | 3.34 | % | 3.30 | % | 3.35 | % | 1.72 | % | 1.55 | % | ||||||||||||||||||||||||
ITEM 7. MANAGEMENT'S DISCUSSION AND ANALYSIS OF FINANCIAL CONDITION AND RESULTS OF OPERATIONS
This section should be read in conjunction with the disclosure regarding "Forward-Looking Statements" set forth in "Item 1. Business—Forward-Looking Statements", as well as the discussion set forth in "Item 1. Business—Certain Business Risks" and "Item 8. Financial Statements and Supplementary Data," including the notes to consolidated financial statements.
We are a bank holding company registered under the Bank Holding Company Act of 1956, as amended. Our principal business is to serve as the holding company for our banking subsidiary, Pacific Western Bank, which we refer to as Pacific Western or the Bank. When we say "we", "our" or the "Company", we mean the Company on a consolidated basis with the Bank. When we refer to "PacWest" or to the holding company, we are referring to the parent company on a stand-alone basis.
Pacific Western is a full-service commercial bank offering a broad range of banking products and services including: accepting time,demand, money market, and demandtime deposits; originating loans, including commercial, real estate construction, SBA guaranteed and consumer loans; and providing other business-oriented products. Our operations are primarily located in Southern California andextending from California's Central Coast to San Diego County; we also operate three banking offices in the San Francisco Bay area, all of which were added through the Affinity acquisition. The Bank focuses on conducting business with small to medium size businesses in our marketplace and the owners and employees of those businesses and households in and around the communities we serve.businesses. The majority of our loans are secured by the real estate collateral of such businesses. Through ourOur asset-based lending offices we also operatefunction operates in Arizona, Northern California, Texas, and the Pacific Northwest. Our equipment leasing function, added through the January 2012 MEF acquisition, operates in Utah and has lease receivables in 45 states.
Over the last year, the Company's assets have grown $204.9 million, or 3.8%, and totaledessentially remained flat, declining $784,000 to $5.5 billion at December 31, 2010.2011. The growthchange was due primarily to decreases of $353.3 million, $205.6 million, $50.2 million, and $21.2 million in gross non-covered loans, covered loans, other assets, and FDIC loss sharing asset, respectively. These decreases were offset partially by increases of $450.3$452.3 million in securities available-for-sale attributable to purchases using excess liquidity and $286.9$176.9 million in covered loans due to the FDIC-assisted acquisition of Los Padres Bank on August 20, 2010. This was offset by a $547.9 million declineinterest-earning deposits in our gross non-covered loan portfolio duefinancial institutions attributable mostly to the $395.8 million sales of classifiedprincipal payments received on loans during 2010.and investment securities. At December 31, 2010, securities available-for-sale,2011, gross non-covered loans, securities available-for-sale, and covered loans totaled $874.0 million, $3.2$2.8 billion, $1.3 billion, and $908.6$703 million, respectively, or 15.8%51%, 57.3%24%, and 16.4%13% of total assets, respectively.
Pacific Western competes actively for deposits and emphasizes solicitation of noninterest-bearing deposits. In managing the top line of our business, we focus on loan growth, loan yield, deposit cost, and net interest margin, as net interest income accounted for 84%89% of our net revenues (net interest income plus noninterest income) for 2010.2011.
We have completed 2223 business acquisitions since the Company's inception in 1999, including the purchase of Marquette Equipment Finance in January 2012 and the FDIC-assisted acquisitions of Los Padres Bank and Affinity Bank in August 2010 and August 2009, respectively. These acquisitions affect the comparability of our reported financial information as the operating results of the acquired entities are included in our operating results only from their respective acquisition dates. For further information on our acquisitions, see NotesNote 3,Acquisitions, and Note 4, inGoodwill and Other Intangible Assets, of the Notes to Consolidated Financial Statements included in "Item 8. Financial Statement and Supplementary Data."
Marquette Equipment Finance Acquisition
On January 3, 2012, Pacific Western Bank completed the acquisition of Marquette Equipment Finance, or MEF, an equipment leasing company located in Midvale, Utah. Pacific Western Bank acquired all of the capital stock of MEF from Meridian Bank, N.A. for $35 million in cash. MEF focuses on business-essential equipment leases throughout the United States with transactions primarily in the mid-ticket segment. This acquisition diversifies our loan portfolio, expands our product line, and provides growth opportunities. It also importantly deployed our excess liquidity into higher-yielding assets.
At January 3, 2012, MEF had $162.2 million in gross leases and leases in process outstanding, with no leases on nonaccrual status. MEF's leases are spread across 18 industries, with the top three being financial services/insurance, manufacturing, and health care and representing 68% of the lease portfolio balance. The weighted average yield on the lease portfolio at year end 2011 was approximately 9% and its weighted average remaining maturity was 34 months. In addition, Pacific Western Bank assumed $154.8 million in outstanding debt and other liabilities, which included $129 million payable to MEF's former parent. Pacific Western Bank repaid MEF's intercompany debt on the closing date from its excess liquidity on deposit at the Federal Reserve Bank. This resulted in MEF's interest-earning assets being funded with our low-cost deposit base.
Effective March 23, 2012, MEF will change its name to Pacific Western Equipment Finance and operate under this name as a division of Pacific Western Bank. Pacific Western Bank retained all 71 MEF employees.
The following table presents the MEF balance sheet presented at fair value as of the acquisition date, January 3, 2012:
Marquette Equipment Finance | January 3, 2012 | |||
|---|---|---|---|---|
| | (In thousands) | |||
Assets Acquired: | ||||
Cash and cash equivalents | $ | 7,092 | ||
Direct financing leases | 142,989 | |||
Leases in process | 19,162 | |||
Customer relationship intangible | 1,700 | |||
Other intangible assets | 1,420 | |||
Goodwill | 17,004 | |||
Other assets | 467 | |||
| �� | ||||
Total assets acquired | $ | 189,834 | ||
Liabilities Assumed: | ||||
Borrowings | $ | 144,516 | ||
Accrued interest payable and other liabilities | 10,318 | |||
Total liabilities assumed | $ | 154,834 | ||
Cash consideration paid | $ | 35,000 | ||
2010 Material Loan Activity
Non-Covered Classified Loan Sales
During 2010, we made strategic decisions to sell $398.5 million of non-covered classified loans to reduce credit risk, thereby strengthening the Bank's balance sheet and enhancing its ability to continue to participate in bidding on FDIC-assisted acquisitions. Such sales resultedThe loans sold included $128.1 million in immediate reductions of classifiednonaccrual loans and improved credit quality metrics. The improvement in credit quality metrics for the non-covered portfolio is shown in the following table:
| | December 31, 2010 | September 30, 2010 | June 30, 2010 | March 31, 2010 | December 31, 2009 | |||||||||||
|---|---|---|---|---|---|---|---|---|---|---|---|---|---|---|---|---|
| | (Dollars in thousands) | |||||||||||||||
Nonaccrual loans | $ | 94,183 | $ | 105,539 | $ | 108,283 | $ | 99,920 | $ | 240,167 | ||||||
New nonaccrual loans in the quarter | 21,413 | (1) | 26,543 | 25,136 | 18,096 | 120,446 | ||||||||||
Nonperforming assets | 119,781 | 130,137 | 132,806 | 129,563 | 283,422 | |||||||||||
Performing restructured loans | 89,272 | 143,407 | 76,367 | 51,896 | 181,454 | |||||||||||
Allowance for credit losses to nonaccrual loans | 110.8 | % | 95.9 | % | 86.3 | % | 91.5 | % | 51.8 | % | ||||||
Allowance for credit losses to | 3.30 | % | 3.05 | % | 2.93 | % | 2.81 | % | 3.35 | % | ||||||
In December 2010, we sold non-covered classified loans totaling $74.9 million for $54.0$148.8 million in cash. Such sale resulted in a charge-off to the allowance for credit losses of $20.9 million, of which $6.6 million had been previously allocated to the loans sold through our allowance methodology and $14.3 million represented the market discount necessary for the loans to be sold to the buyer. The sale was on a servicing-released basis and without recourse to Pacific Western Bank.performing restructured loans. All of the loans sold were
originated by Pacific Western Bank and none were covered loans acquired in the Los Padres Bank or Affinity Bank acquisitions. The loans sold included $17.6These sales were for cash of $254.6 million and were completed on a servicing-released basis and without recourse to Pacific Western Bank. Such sales resulted in nonaccrual loans and $43.7 million in performing restructured loans asimmediate reductions of September 30, 2010.
In February 2010, the Bank sold non-covered classified loans totaling $323.6 million to an institutional buyer for $200.6 million in cash. Such saleand improved credit quality metrics.
These sales resulted in a charge-off to the allowance for credit losses of $123.0$143.9 million, of which $51.6$58.2 million had been previously allocated to the loans sold through our allowance methodology and $71.4$85.7 million represented the market discount necessary for the loans to be sold to the buyer. The sale was on
Loan Portfolio Purchase
On July 1, 2010, we purchased a servicing-released basis$234.1 million portfolio of 225 performing loans secured by Southern California real estate for a cash price of $228.3 million. These loans were part of the Foothill Independent Bank loan portfolio that we acquired when we completed the Foothill Independent Bancorp acquisition in May 2006. In March 2007, we had sold a 95% participating interest in these loans for cash and without recoursecontinued to Pacific Western Bank. All loans sold were originated by Pacific Western Bankservice them and none were covered loans acquiredmaintain the borrower relationships. When the opportunity to purchase this loan portfolio presented itself, we concluded it would be in the Affinitybest interests of the Company and the Bank acquisition. The loans sold included $110.5 millionto make this purchase as we are familiar with the credit risk and it would deploy excess liquidity in nonaccrual loansa manner that would increase interest income and $105.1 million in restructured loans.expand the net interest margin. As of December 31, 2011, such portfolio totaled $179.4 million.
August FDIC-Assisted Acquisitions
The estimated losses expected to be collected from the FDIC under the terms of the loss share agreements for the Los Padres and Affinity acquisitions are reflected in the loss share receivable. We file claims to the FDIC for the losses incurred on covered assets on a quarterly basis in the calendar month following each quarter-end. We received reimbursement from the FDIC, subject to their satisfactory review of our loss share claim certificates. As of January 2012, we have filed claims to the FDIC for losses on covered assets through the fourth quarter of 2011 in an aggregate amount of $191.7 million. We have received payment from the FDIC of $149.4 million, which represents 80% of our losses, and we expect to receive $3.9 million for recently submitted claims.
2010 Los Padres Acquisition
On August 20, 2010, we acquired certain assets of Los Padres Bank, including all loans, and assumed substantially all of its liabilities, including all deposits, from the FDIC in an FDIC-assisted acquisition, which we refer to as the Los Padres acquisition. Pacific Western (i) acquired $437.1 million in loans, $33.9 million in other real estate owned, $44.3 million in investments, and $261.5 million in cash and other assets, and (ii) assumed $752.2 million in deposits, $70.0 million in borrowings, and $1.9 million in other liabilities. In connection with the Los Padres acquisition, the FDIC made a cash payment to Pacific Western of $144.0 million. Other than a deposit premium of $3.4 million, we paid no cash or other consideration to acquire Los Padres. The estimated fair value of the liabilities assumed exceeded the estimated fair value of the assets acquired and we recorded $47.3 million of goodwill.
We entered into a loss sharing agreement with the FDIC, whereby the FDIC agreed to cover a substantial portion of any future losses on the acquired loans, with the exception of consumer loans, and other real estate owned. We refer to the acquired assets subject to the loss sharing agreement collectively as "covered assets." Under the terms of such loss sharing agreement, the FDIC is obligated
to reimburse the Bank for 80% of losses with respect to the covered assets. The Bank will reimburse the FDIC for 80% of recoveries with respect to losses for which the FDIC paid the Bank 80% reimbursement under the loss sharing agreement. The loss sharing arrangementprovisions for single family covered assets and commercial (non-single family) covered assets isare in effect for 10 years and 5 years,
respectively, from the acquisition date, and the loss recovery provisions are in effect for 10 years and 8 years, respectively, from the acquisition date.
Los Padres was a federally chartered savings bank headquartered in Solvang, California that operated 14 branches, including 11 branches in California (three in Ventura County, four in Santa Barbara County, and four in San Luis Obispo County) and three branches in Arizona (Maricopa County). After office consolidations in February 2011, therewe are nine remainingoperating eight of the former Los Padres branch offices, with eightall of which are located in California and one in Arizona.California. We made this acquisition to expand our presence in the Central Coast of California.
The Los Padres operation added $3.7 million in net earnings since its acquisition in August 2010, with $3.3 million of such amount in the fourth quarter of 2010.
The acquisition has beenassets acquired and liabilities assumed are accounted for under the acquisition method of accounting. The assets and liabilities, both tangible and intangible, were recorded at their estimated fair values as of the August 20, 2010 acquisition date. Such fair values are preliminary estimates and are subject to adjustment for up to one year after the acquisition date. The application of the acquisition method of accounting resulted in goodwill of $47.3 million of goodwill.million. Such goodwill represents the excess of the estimated fair value of the liabilities assumed over the estimated fair value of the assets acquired and is tax-deductible. The goodwill includesincluded $9.5 million related to the FDIC's settlement accounting for a wholly-owned subsidiary of Los Padres. We disagreedisagreed with the FDIC's accounting for this item and are in the process of negotiatingduring 2011 we successfully resolved this matter with the FDIC for resolution of this matter. Should we be successful in our negotiations, goodwill would be reduced bythrough a cash payment to us fromreceipt of $7.6 million and a goodwill reduction for the FDIC of $9.5 million. No assurance can be given, however, that we will be successful in our efforts.same amount. See NotesNote 3,Acquisitions, and Note 4,Goodwill and Other Intangible Assets, of the Notes to Consolidated Financial Statements contained in "Item 8. Financial Statements and Supplementary Data" for additional information regarding the Los Padres acquisition.
July 2010 Loan Portfolio Purchase
On July 1, 2010, we purchased a $234.1 million portfolio of 225 performing loans secured by Southern California real estate for a cash price of $228.3 million. Such loans had a weighted average coupon interest rate of 6.15% and a weighted average maturity of 4.6 years. These loans were part of the Foothill Independent Bank loan portfolio that we acquired when we completed the Foothill Independent Bancorp acquisition in May 2006. In March 2007, we sold a 95% participating interest in these loans for cash and continued to service them and maintain the borrower relationships. When the opportunity to purchase this loan portfolio presented itself, we concluded it would be in the best interests of the Company and the Bank to make this purchase as we are familiar with the credit risk and it would deploy excess liquidity in a manner that would increase interest income and expand the net interest margin.
August 2009 Affinity Acquisition
On August 28, 2009, we acquired substantially all of the assets of Affinity Bank, including all loans, and assumed substantially all of its liabilities, including the insured and uninsured deposits and excluding certain brokered deposits, from the FDIC in an FDIC-assisted transaction, which we refer to as the Affinity acquisition. Pacific Western (i) acquired $675.6 million in loans, $22.9 million in foreclosed assets, $175.4 million in investments and $371.5 million in cash and other assets, and (ii) assumed $868.2 million in deposits, $305.8 million in borrowings, and $32.6 million in other liabilities. In connection with the Affinity acquisition, the FDIC made a cash payment to Pacific Western of $87.2 million.
We entered into a loss sharing agreement with the FDIC, whereby the FDIC agreed to cover a substantial portion of any future losses on acquired loans, other real estate owned and certain investment securities. We refer to the acquired assets subject to the loss sharing agreement
collectively as "covered assets." Under the terms of such loss sharing agreement, the FDIC will absorb 80% of losses and receive 80% of loss recoveries on the first $234 million of losses on covered assets and absorb 95% of losses and receive 95% of loss recoveries on covered assets exceeding $234 million. The loss sharing agreement isprovisions are in effect for 5 years for commercial assets (non-residential loans, OREO and certain securities) and 10 years for residential loans from the August 28, 2009 acquisition date. The loss recovery provisions are in effect for 8 years for commercial assets and 10 years for residential loans from the acquisition date.
Affinity was a full service commercial bank headquartered in Ventura, California that operated 10 branch locations in California.California, all of which we continue to operate. We made this acquisition to expand our presence in California.
The acquisition has been accounted for under the acquisition method of accounting. Accordingly the acquired assets, including the FDIC loss sharing asset and identifiable intangible asset, and the assumed liabilities were recorded at their estimated fair values as of the August 28, 2009 acquisition date. The application of the acquisition method of accounting resulted in a gain of $67.0 million ($38.9 million after-tax). Such gain representsrepresented the excess of the estimated fair value of the assets acquired over the estimated fair value of the liabilities assumed. See NotesNote 3,Acquisitions, and Note 4,Goodwill and Other Intangible Assets, of the Notes to Consolidated Financial Statements contained in "Item
"Item 8. Financial Statements and Supplementary Data" for additional information regarding the Affinity acquisition.
Among other factors, our operating results depend generally on the following:
The Level of Our Net Interest Income
Net interest income is the excess of interest earned on our interest-earning assets over the interest paid on our interest-bearing liabilities. The low marketNet interest rate environment throughout 2009 and continuing in 2010 has reduced ourmargin is net interest margin relative to our historical performance.income expressed as a percentage of average interest-earning assets. A sustained low interest rate environment combined with low loan growth and high levels of marketplace liquidity may further lower both our net interest income and net interest margin going forward.
Our primary interest-earning asset is loans.assets are loans and investments. Our primary interest-bearing liabilities include deposits, borrowings, and subordinated debentures.are deposits. We attribute our high net interest margin to our loans-to-deposits ratio, which was approximately 88% at the end of 2010 and exceeded 100% in the prior four years, and a high level of noninterest-bearing deposits and low cost of deposits. While our deposit balances will fluctuate depending on deposit holders' perceptions of alternative yields available in the market, we attempt to minimize these variances by attracting a high percentage of noninterest-bearing deposits, which have no expectation of yield. At December 31, 2010,2011, approximately 32%37% of our total deposits were noninterest-bearing. In addition to deposits, we have borrowing capacity under various credit lines which we use for liquidity needs such as funding loan demand, managing deposit flows and interim acquisition financing. This borrowing capacity is relatively flexible and has become one of the least expensive sources of funds. However, our borrowing lines are considered a secondary source of liquidity as we serve our local markets and customers with our deposit products.
Loan Growth
We generally seek new lending opportunities in the $500,000 to $10$15 million range, try to limit loan maturities for commercial loans to one year, for construction loans up to 18 months, and for commercial real estate loans up to ten years, and to price lending products so as to preserve our interest spread and net interest margin. We sometimes encounter strong competition in pursuing lending opportunities such that potential borrowers obtain loans elsewhere at lower rates than those we offer. We have continued to reduce our exposure to residential construction and foreign loans, including limiting the amount of new loans in these categories. Our ability to make new loans is dependent on economic factors in our market area, borrower qualifications, competition, and liquidity,
among other items. Considering the current state of the economy inLoan growth remains tepid, as new loan volume is not replacing maturities. We continue to retain maturing lending relationships that contribute positively to our Southern California marketplace, loan growth was not a focus area for us in 2010profitability and we expect this to continue in 2011.
During 2010, we executed two classified loan sales which reduced non-coverednet interest margin, and selectively add new loans by $398.5 million. This reduction, combined with repayments, resolution activitiesthat meet our credit and low loan demand resulted in a decrease of $547.9 million during 2010 in our non-covered loan portfolio. The covered loan portfolio increased $286.9 million during 2010 due to the Los Padres acquisition and included a $130.7 million decrease in the acquired Affinity loans.pricing standards.
The Magnitude of Credit Losses
We stress credit quality in originating and monitoring the loans we make and measure our success by the levels of our nonperforming assets, net charge-offs and allowance for credit losses. OurWe maintain an allowance for credit losses on non-covered loans which is the sum of our allowance for loan losses and our reserve for unfunded loan commitments and relates only to our non-covered loans.commitments. Provisions for credit losses are charged to operations as and when needed for both on and off balance sheet credit exposure. Loans which are deemed uncollectible are charged off and deducted from the allowance for loan losses. Recoveries on loans previously charged off are added to the allowance for loan losses. During the year ended December 31, 2010, we made a provision for credit losses totaling $218.0 million composed of $179.0 million on non-covered loans and $39.0 million on covered loans. The provision for credit losses on the non-covered loan portfolio was based on our allowance methodology and reflected net charge-offs, the levels and trends of nonaccrual and classified loans, classified loan sales, and the migration of loans into various risk classifications. TheA provision for credit losses on the covered loan portfolio reflects an increasemay be recorded to reflect decreases in theexpected cash flows on covered loan allowance for credit losses resulting from credit deterioration since the acquisition dates.loans compared to those previously estimated.
We regularly review our loans to determine whether there has been any deterioration in credit quality stemming from economic conditions or other factors which may affect collectibility of our loans. Changes in economic conditions, such as inflation, unemployment, increases in the general level of interest rates, declines in real estate values and negative conditions in borrowers' businesses could negatively impact our customers and cause us to adversely classify loans and increase portfolio loss factors. An increase in classified loans generally results in increased provisions for credit losses. Any deterioration in the real estate market may lead to increased provisions for credit losses because of our concentration in real estate loans.
The Level of Our Noninterest Expense
Our noninterest expense includes fixed and controllable overhead, the major components of which are compensation, occupancy, data processing, and other professional service fees and communicationsservices. It also includes costs that tend to vary based on the volume of activity, such as OREO expense. We measure success in controlling suchboth fixed and variable costs through monitoring of the efficiency ratio. We calculate the base efficiency ratio by dividing noninterest expense by thenet revenues (the sum of net interest income plus noninterest income). We also calculate a non-GAAP measure called the "credit cost adjusted efficiency ratio." The credit cost adjusted efficiency ratio is calculated in the same manner as the base efficiency ratio except that noninterest income is reduced by FDIC loss sharing income and noninterest income. Accordingly, a lower percentage reflects lower expenses relative to income.expense is reduced by OREO expenses. See calculations in "Non-GAAP Measurements" contained herein.
The consolidated base and credit cost adjusted efficiency ratios have been as follows:
| ||||||||||||||||||||||||||||||||||||||||||||||||||||
|---|---|---|---|---|---|---|---|---|---|---|---|---|---|---|---|---|---|---|---|---|---|---|---|---|---|---|---|---|---|---|---|---|---|---|---|---|---|---|---|---|---|---|---|---|---|---|---|---|---|---|---|---|
| ||||||||||||||||||||||||||||||||||||||||||||||||||||
| ||||||||||||||||||||||||||||||||||||||||||||||||||||
| ||||||||||||||||||||||||||||||||||||||||||||||||||||
| ||||||||||||||||||||||||||||||||||||||||||||||||||||
The increasebase efficiency ratio fluctuations shown in the efficiency ratio forabove table result from the fourth quartervolatility of 2010 was due mostly to lower FDIC loss sharing income as covered loanand OREO expenses. The credit costs declinedcost adjusted efficiency ratio eliminates such volatility and certain covered loans, which are carried at a discount, were resolved at amounts above their carrying values.shows the trend in overhead related noninterest expense relative to net revenues.
The following discussion and analysis of financial condition and results of operations are based upon our consolidated financial statements and the notes thereto, which have been prepared in accordance with accounting principles generally accepted in the United States. The preparation of the consolidated financial statements requires us to make a number of estimates and assumptions that affect the reported amounts and disclosures in the consolidated financial statements. On an ongoing basis, we evaluate our estimates and assumptions based upon historical experience and various other factors and circumstances. We believe that our estimates and assumptions are reasonable; however, actual results may differ significantly from these estimates and assumptions which could have a material impact on the carrying value of assets and liabilities at the balance sheet dates and on our results of operations for the reporting periods.
Our significant accounting policies and practices are described in Note 1,Nature of Operations and Summary of Significant Accounting Policies, of the Notes to the Consolidated Financial Statements contained in "Item 8. Financial Statements and Supplementary Data." The accounting policies that involve significant estimates and assumptions by management, which have a material impact on the carrying value of certain assets and liabilities, are considered critical accounting policies. We have identified our policies for the allowances for credit losses, the carrying values of intangible assets, and deferred income tax assets as critical accounting policies.
Allowance for Credit Losses on Non-Covered Loans
The allowance for credit losses on non-covered loans is the combination of the allowance for loan losses and the reserve for unfunded loan commitments. The allowance for credit losses on non-covered loans relates only to loans which are not subject to loss sharing agreements with the FDIC. The allowance for loan losses is reported as a reduction of outstanding loan balances and the reserve for unfunded loan commitments is included within other liabilities. Generally, as loans are funded, the
amount of the commitment reserve applicable to such funded loans is transferred from the reserve for unfunded loan commitments to the allowance for loan losses based on our allowance methodology. At December 31, 2010, the allowance for credit losses on non-covered loans totaled $104.3 million and was comprised of the allowance for loan losses of $98.6 million and the reserve for unfunded loan commitments of $5.7 million. The following discussion is for non-covered loans and the allowance for credit losses thereon. Refer to "—Allowance for Credit Losses on Covered Loans" for the policy on covered loans.
The provision for credit losses increased $58.1 million to $218.0 million for 2010 compared to 2009, while the allowance for credit losses declined $20.0 million to $104.3 million at December 31, 2010 compared to $124.3 million at December 31, 2009. The increase in the provision reflects the growth of $112.5 million in net charge-offs to $198.9 million, attributed mostly to $144.6 million in charge-offs from the classified loans sold during 2010. The decline in the allowance for credit losses reflected, in part, the lower level of nonaccrual loans, which decreased $146.0 million in 2010 to $94.2 million at December 31, 2010. This was due mostly to the sales of $128.1 million in nonaccrual loans included in the $398.5 million of classified loans sold in 2010.
An allowance for loan losses is maintained at a level deemed appropriate by management to adequately provide for known and inherent risks in the loan portfolio and other extensions of credit at the balance sheet date. The allowance is based upon a continuing review of the portfolio, past loan loss experience, current economic conditions which may affect the borrowers' ability to pay, and the underlying collateral value of the loans. Loans which are deemed to be uncollectible are charged off
and deducted from the allowance. The provision for loan losses and recoveries on loans previously charged off are added to the allowance.
The methodology we use to estimate the amount of our allowance for credit losses is based on both objective and subjective criteria. While some criteria are formula driven, other criteria are subjective inputs included to capture environmental and general economic risk elements which may trigger losses in the loan portfolio, and to account for the varying levels of credit quality in the loan portfolios of the entities we have acquired that have not yet been captured in our objective loss factors.
Specifically, our allowance methodology contains three key elements: (i) amounts based on specific evaluations of impaired loans; (ii) amounts of estimated losses on several pools of loans categorized by risk rating and loan type; and (iii) amounts for environmental and general economic factors that indicate probable losses were incurred but were not captured through the other elements of our allowance process.
Impaired loans are identified at each reporting date based on certain criteria and the majority of which are individually reviewed for impairment. Non-covered nonaccrual loans with an unpaid principal balance over $250,000 and all performing restructured loans are reviewed individually for the amount of impairment, if any. Non-covered nonaccrual loans with an unpaid principal balance of $250,000 or less are evaluated for impairment collectively. The population of such loans totaled $4.3 million, represented by 64 loans, as of December 31, 2011. A loan is considered impaired when it is probable that a creditor will be unable to collect all amounts due according to the original contractual terms of the loan agreement. We measure impairment of a loan based upon the fair value of the loan's collateral if the loan is collateral dependent or the present value of cash flows, discounted at the loan's effective interest rate, if the loan is not collateral-dependent. The impairment amount on a collateral-dependent loan is charged-off to the allowance and the impairment amount on a loan that is not collateral-dependent is set up as a specific reserve. Increased charge-offs or additions to specific reserves generally result in increased provisions for credit losses.
Our loan portfolio, excluding impaired loans which are evaluated individually, is categorized into several pools for purposes of determining allowance amounts by loan pool. The loan pools we currently evaluate are: commercial real estate construction, residential real estate construction, SBA real estate, hospitality real estate, real estate other, commercial collateralized, commercial unsecured, SBA commercial, consumer, foreign, and commercial asset-based. Within these loan pools, we then evaluate loans not adversely classified, which we refer to as "pass" credits, separately from adversely classified loans. The adversely classified loans are further grouped into three credit risk rating categories: "special mention," "substandard" and "doubtful," which we define as follows:
In addition, we may refer to the loans classified as "substandard" and "doubtful" together as "criticized loans." For further information on classified loans, see Note 6,Loans, of the Notes to Consolidated Financial Statements contained in "Item 8. Financial Statements and Supplementary Data."
The allowance amounts for "pass" rated loans and those loans adversely classified, which are not reviewed individually, are determined using historical loss rates developed through migration analysis. The migration analysis is updated quarterly based on historic losses and movement of loans between ratings. As a result of this migration analysis and its quarterly updating, the increases we experienced in both charge-offs and adverse classifications resulted in increased loss factors. In addition, beginning with the third quarter of 2008, we shortened the allowance methodology's accumulated net charge-off
look-back data from 32 quarters to 16 quarters to allow greater emphasis on current charge-off activity. Such shortening also increased the loss factors.
Finally, in order to ensure our allowance methodology is incorporating recent trends and economic conditions, we apply environmental and general economic factors to our allowance methodology including: credit concentrations; delinquency trends; economic and business conditions; the quality of lending management and staff; lending policies and procedures; loss and recovery trends; nature and volume of the portfolio; nonaccrual and problem loan trends; usage trends of unfunded commitments; and other adjustments for items not covered by other factors.
Management believes that the allowance for loan losses is adequate and appropriate for the known and inherent risks in our non-covered loan portfolio. In making its evaluation, management considers certain quantitative and qualitative factors including the Company's historical loss experience, the volume and type of lending conducted by the Company, the results of our credit review process, the levels of classified and criticized loans, the levels of impaired loans, including nonperforming loans and performing restructured loans, regulatory policies, general economic conditions, underlying collateral values, and other factors regarding collectibility and impairment. To the extent we experience, for example, increased levels of documentation deficiencies, adverse changes in collateral values, or negative changes in economic and business conditions which adversely affect our borrowers, our classified loans may increase. Higher levels of classified loans generally result in higher allowances for loan losses.
We recognize that the determination of the allowance for loan losses is sensitive to the assigned credit risk ratings and inherent loss rates at any given point in time. Therefore, we perform sensitivity analyses to provide insight regarding the impact adverse changes in credit risk ratings may have on our allowance for loan losses. The sensitivity analyses have inherent limitations and isare based on various assumptions as of a point in time and, accordingly, it is not necessarily representative of the impact loan risk rating changes may have on the allowance for loan losses.
At December 31, 2010,2011, in the event that 1% of our non-covered loans were downgraded one credit risk rating category for each category (e.g., 1% of the "pass" category moved to the "special mention" category, 1% of the "special mention" category moved to "substandard" category, and 1% of the "substandard" category moved to the "doubtful" category within our current allowance methodology), the allowance for credit losses would have increased by approximately $2.0$1.4 million. In the event that 5% of our non-covered loans were downgraded one credit risk category, the allowance for credit losses would increase by approximately $10.0$7.2 million. Given current processes employed by the Company, management believes the credit risk ratings and inherent loss rates currently assigned are appropriate. It is possible that others, given the same information, may at any point in time reach different conclusions that could be significant to the Company's financial statements. In addition, current credit
risk ratings are subject to change as we continue to review loans within our portfolio and as our borrowers are impacted by economic trends within their market areas.
Management believes that the allowance for loan losses is adequate and appropriate for the known and inherent risks in our non-covered loan portfolio. In making its evaluation, management considers certain quantitative and qualitative factors including the Company's historical loss experience, the volume and type of lending conducted by the Company, the results of our credit review process, the levels of classified, criticized and nonperforming assets, regulatory policies, general economic conditions, underlying collateral values, and other factors regarding collectibility and impairment. To the extent we experience, for example, increased levels of documentation deficiencies, adverse changes in collateral values, or negative changes in economic and business conditions which adversely affect our borrowers, our classified loans may increase. Higher levels of classified loans generally result in higher allowances for loan losses.
Although we have established an allowance for loan losses that we consider adequate, there can be no assurance that the established allowance for loan losses will be sufficient to offset losses on loans in the future. Management also believes that the reserve for unfunded loan commitments is adequate. In making this determination, we use the same methodology for the reserve for unfunded loan commitments as we do for the allowance for loan losses and consider the same quantitative and qualitative factors, as well as an estimate of the probability of advances of the commitments correlated to their credit risk rating.
Allowance for Credit Losses on Covered Loans
The loans acquired in the Los Padres and Affinity acquisitions are covered by loss sharing agreements with the FDIC and we will be reimbursed for a substantial portion of any future losses. Under the terms of the Los Padres loss sharing agreement, the FDIC will absorb 80% of losses and
receive 80% of loss recoveries on the covered assets. The loss sharing agreement isprovisions are in effect for 10 years for single family covered assets and 5 years for commercial (non-single family) covered assets from the August 20, 2010 acquisition date. The loss recovery provisions are in effect for 10 years for single family assets and 8 years for commercial (non-single family) assets from the acquisition date. Under the terms of the Affinity loss sharing agreement, the FDIC will absorb 80% of losses and receive 80% of loss recoveries on the first $234 million of losses on covered assets and absorb 95% of losses and receive 95% of loss recoveries on covered assets exceeding the $234 million threshold. Through December 31, 2011, gross losses for Affinity covered assets totaled $144.6 million and gross losses for Los Padres covered assets totaled $47.1 million. The loss sharing agreement isprovisions are in effect for 10 years for residential loans and 5 years for commercial assets (non-residential loans, OREO and certain securities) and 10 years for residential loans from the August 28, 2009 acquisition date. The loss recovery provisions are in effect for 10 years for residential loans and 8 years for commercial assets and 10 years for residential loans from the acquisition date.
We evaluated the acquired covered loans and elected to account for them under ASCAccounting Standards Codification ("ASC") Subtopic 310-30, "Loans and Debt Securities Acquired with Deteriorated Credit Quality" ("ASC 310-30"), which we refer to as acquired impaired loan accounting.
The covered loans are subject to our internal and external credit review. If deterioration in the expected cash flows results in a reserve requirement, a provision for credit losses is charged to earnings without regard to the FDIC loss sharing agreement. The portion of the estimated loss reimbursable from the FDIC will beis recorded in FDIC loss sharing income and will increaseincreases the FDIC loss sharing asset. For acquired impaired loans, the allowance for loan losses is measured at the end of each financial reporting period based on expected cash flows. Decreases in the amount and changes in the timing of expected cash flows on the acquired impaired loans as of the financial reporting date compared to those previously estimated are usually recognized by recording a provision for credit losses on such covered loans. Acquired covered loans
Certain home equity lines of credit acquired in the Los Padres acquisition are not eligible for acquired impaired loan accounting and are therefore accounted for as impairedperforming acquired loans. Such acquired loans totaled $29.1 millionwere initially recorded at December 31, 2010a discount and are subject to our allowance for credit loss methodology. Although we estimate the requiredquarterly allowance for credit losses similarly to the methodology used for originated loans, wemethodology. We record a provision for such loan losses only when the reserve requirement exceeds any remaining credit discount on these covered loans. Please see "—Financial Condition—Allowance for Credit Losses on Covered Loans" and NotesNote 1(h),Nature of Operations and Summary of Significant Accounting Policies—Impaired Loans and Allowances for Credit Losses, and Note 6,Loans, of the Notes to Consolidated Financial Statements contained in "Item 8. Financial Statements and Supplementary Data" for more information.
Goodwill and Other Intangible Assets
Goodwill and intangible assets arise from purchase business combinations. Goodwill and other intangible assets generated from purchase business combinations and deemed to have indefinite lives are not subject to amortization and are instead tested for impairment at least annually. Intangible assets with definite lives arising from business combinations are tested for impairment quarterly.
At December 31, 2010, we had goodwill of $47.3 million, all of which is tax-deductible, related entirely to the Los Padres acquisition. In 2008 we determined that all of our then existing goodwill was impaired and we recorded a $761.7 million charge to earnings to write it off. Such charge had no effect on the Company's or the Bank's cash balances or liquidity. In addition, because goodwill and other intangible assets are not included in the calculation of regulatory capital, the Company's and the Bank's well-capitalized regulatory ratios were not affected by this non-cash expense.
Our other intangible assets with definite lives include core deposit and customer relationship intangibles. The establishment and subsequent amortization of these intangible assets requires several assumptions including, among other things, the estimated cost to service deposits acquired, discount rates, estimated attrition rates and useful lives. These intangibles are being amortized over their estimated useful lives up to 10 years and tested for impairment quarterly. If the value of the core deposit intangible or the customer relationship intangible is determined to be less than the carrying value in future periods, a write-down would be taken through a charge to our earnings. The most
significant element in evaluation of these intangibles is the attrition rate of the acquired deposits or loan relationships. If such attrition rate were to accelerate from that which we expected, the intangible may have to be reduced by a charge to earnings. The attrition rate related to deposit flows or loan flows is influenced by many factors, the most significant of which are alternative yields for loans and deposits available to customers and the level of competition from other financial institutions and financial services companies.
Deferred Income Tax Assets
Our deferred income tax assets arise from differences between the financial statement carrying amounts of existing assets and liabilities and their respective tax bases and net operating loss and tax credit carryforwards. Deferred tax assets and liabilities are measured and then established only forusing enacted tax rates expected to apply to taxable income in the years in which those items thattemporary differences are deemedexpected to be realizable based on our judgment.recovered or settled. From an accounting standpoint, we determine whether a deferred tax asset is realizable based on facts and circumstances, including the Company's current and projected future tax position, the historical level of our taxable income, and estimates of our future taxable income. In most cases, the realization of deferred tax assets is based on our future profitability. If we were to experience either reduced profitability or operating losses in a future period, the realization of our deferred tax assets may no longer be considered more likely than not that they will be realized. In such an instance, we could be required to record a valuation allowance on our deferred tax assets by charging earnings.
Table of Contents
Non-GAAP Measurements
Non-GAAP Measurements
Certain discussion in this Form 10-K contains non-GAAP financial disclosures for tangible common equity, pre-credit, pre-tax earnings, and a credit cost adjusted efficiency ratio. The Company uses certain non-GAAP financial measures to provide meaningful supplemental information regarding the Company's operational performance and to enhance investors' overall understanding of such financial performance. The discussion in this Annual Report on Form 10-K contains non-GAAP financial disclosures forGiven the use of tangible common equity. Tangibleequity amount and ratio is prevalent among banking regulators, investors and analysts, we disclose our tangible common equity is a non-GAAP financial measure used by investors,ratio in addition to equity-to-assets ratio. Also, as analysts and bank regulatory agencies. Tangible common equity represents total equity, less any preferred equity, goodwill and intangible assets.investors view pre-credit, pre-tax earnings as an indicator of the Company's ability to absorb credit losses, we disclose this amount in addition to net earnings. The methodology of determining tangible common equity and pre-credit, pre-tax earnings may differ among companies. Management reviews tangible common equity along with other measuresWe disclose the credit cost adjusted efficiency ratio as it eliminates the volatility of capital adequacy on a regular basisFDIC loss sharing income and has included this non-GAAP financial information,OREO expenses from the base efficiency ratio and shows the corresponding reconciliationtrend in overhead related noninterest expense relative to total equity, because of current interest in such information on the part of market participants.
net revenues. These non-GAAP financial measures are presented for supplemental informational purposes only for understanding the Company's financial condition and operating results and should not be considered a substitute for financial information presented in accordance with United States generally accepted accounting principles (GAAP)("GAAP").
The following table presentstables present performance amounts and ratios in accordance with GAAP and a reconciliation of the non-GAAP financial measurements to the GAAP financial measurements.
| | Year Ended December 31, | |||||||||||
|---|---|---|---|---|---|---|---|---|---|---|---|---|
GAAP to Non-GAAP Reconciliations (Unaudited) | 2010 | 2009 | 2008 | |||||||||
| | (Dollars in thousands) | |||||||||||
PacWest Bancorp Consolidated: | ||||||||||||
Stockholders' equity | $ | 478,797 | $ | 506,773 | $ | 375,726 | ||||||
Less: intangible assets | 73,144 | 33,296 | 39,922 | |||||||||
Tangible common equity | $ | 405,653 | $ | 473,477 | $ | 335,804 | ||||||
Total assets | $ | 5,529,021 | $ | 5,324,079 | $ | 4,495,502 | ||||||
Less: intangible assets | 73,144 | 33,296 | 39,922 | |||||||||
Tangible assets | $ | 5,455,877 | $ | 5,290,783 | $ | 4,455,580 | ||||||
Equity to assets ratio | 8.66 | % | 9.52 | % | 8.36 | % | ||||||
Tangible common equity ratio(1) | 7.44 | % | 8.95 | % | 7.54 | % | ||||||
Pacific Western Bank: | ||||||||||||
Stockholder's equity | $ | 570,118 | $ | 585,940 | $ | 494,858 | ||||||
Less: intangible assets | 73,144 | 33,296 | 39,922 | |||||||||
Tangible common equity | $ | 496,974 | $ | 552,644 | $ | 454,936 | ||||||
Total assets | $ | 5,513,601 | $ | 5,313,750 | $ | 4,488,680 | ||||||
Less: intangible assets | 73,144 | 33,296 | 39,922 | |||||||||
Tangible assets | $ | 5,440,457 | $ | 5,280,454 | $ | 4,448,758 | ||||||
Equity to assets ratio | 10.34 | % | 11.03 | % | 11.02 | % | ||||||
Tangible common equity ratio(1) | 9.13 | % | 10.47 | % | 10.23 | % | ||||||
| | Year Ended December 31, | |||||||||
|---|---|---|---|---|---|---|---|---|---|---|
Pre-Credit, Pre-Tax Earnings | 2011 | 2010 | 2009 | |||||||
| | (In thousands) | |||||||||
Net earnings (loss) | $ | 50,704 | $ | (62,016 | ) | $ | (9,350 | ) | ||
Plus: Total provision for credit losses | 26,570 | 212,492 | 159,900 | |||||||
Other real estate owned expense (income): | ||||||||||
Non-covered | 7,010 | 12,310 | 21,569 | |||||||
Covered | 3,666 | 2,460 | 1,753 | |||||||
Income tax expense (benefit) | 36,800 | (46,714 | ) | (7,801 | ) | |||||
Less: FDIC loss sharing income, net | 7,776 | 22,784 | 16,314 | |||||||
Pre-credit, pre-tax earnings | $ | 116,974 | $ | 95,748 | $ | 149,757 | ||||
| | Year Ended December 31, | |||||||||
|---|---|---|---|---|---|---|---|---|---|---|
Credit Cost Adjusted Efficiency Ratio | 2011 | 2010 | 2009 | |||||||
| | (Dollars in thousands) | |||||||||
Noninterest expense | $ | 179,993 | $ | 188,803 | $ | 179,204 | ||||
Less: Non-covered OREO expense | 7,010 | 12,310 | 21,569 | |||||||
Covered OREO expense | 3,666 | 2,460 | 1,753 | |||||||
Credit adjusted noninterest expense | $ | 169,317 | $ | 174,033 | $ | 155,882 | ||||
Net interest income | $ | 262,641 | $ | 249,327 | $ | 216,046 | ||||
Noninterest income | 31,426 | 43,238 | 105,907 | |||||||
Net revenues | 294,067 | 292,565 | 321,953 | |||||||
Less: FDIC loss sharing income, net | 7,776 | 22,784 | 16,314 | |||||||
Credit adjusted net revenues | $ | 286,291 | $ | 269,781 | $ | 305,639 | ||||
Base efficiency ratio(1)(3) | 61.2 | % | 64.5 | % | 55.7 | % | ||||
Credit cost adjusted efficiency ratio(2)(3) | 59.1 | % | 64.5 | % | 51.0 | % | ||||
| | December 31, | |||||||||
|---|---|---|---|---|---|---|---|---|---|---|
Tangible Common Equity | 2011 | 2010 | 2009 | |||||||
| | (Dollars in thousands) | |||||||||
PacWest Bancorp Consolidated: | ||||||||||
Stockholders' equity | $ | 546,203 | $ | 478,797 | $ | 506,773 | ||||
Less: Intangible assets | 56,556 | 73,144 | 33,296 | |||||||
Tangible common equity | $ | 489,647 | $ | 405,653 | $ | 473,477 | ||||
Total assets | $ | 5,528,237 | $ | 5,529,021 | $ | 5,324,079 | ||||
Less: Intangible assets | 56,556 | 73,144 | 33,296 | |||||||
Tangible assets | $ | 5,471,681 | $ | 5,455,877 | $ | 5,290,783 | ||||
Equity to assets ratio | 9.88 | % | 8.66 | % | 9.52 | % | ||||
Tangible common equity ratio(1) | 8.95 | % | 7.44 | % | 8.95 | % | ||||
Book value per share | $ | 14.66 | $ | 13.06 | $ | 14.47 | ||||
Tangible book value per share | $ | 13.14 | $ | 11.06 | $ | 13.52 | ||||
Shares outstanding | 37,254,318 | 36,672,429 | 35,015,322 | |||||||
Pacific Western Bank: | ||||||||||
Stockholders' equity | $ | 625,494 | $ | 570,118 | $ | 585,940 | ||||
Less: Intangible assets | 56,556 | 73,144 | 33,296 | |||||||
Tangible common equity | $ | 568,938 | $ | 496,974 | $ | 552,644 | ||||
Total assets | $ | 5,512,025 | $ | 5,513,601 | $ | 5,313,750 | ||||
Less: Intangible assets | 56,556 | 73,144 | 33,296 | |||||||
Tangible assets | $ | 5,455,469 | $ | 5,440,457 | $ | 5,280,454 | ||||
Equity to assets ratio | 11.35 | % | 10.34 | % | 11.03 | % | ||||
Tangible common equity ratio(1) | 10.43 | % | 9.13 | % | 10.47 | % | ||||
Acquisitions Impact Earnings Performance
The comparability of financial information is affected by our acquisitions. Our results include the operations of acquired entities from the dates of acquisition. Security Pacific Bank deposits ($441 million in assets) were acquired in November 2008, Affinity Bank ($1.2 billion in assets) was acquired in August 2009 and Los Padres Bank ($824.1 million in assets) was acquired in August 2010.
Fourth Quarter Results
The following table sets forth our unaudited, quarterly results for the three months ended December 31, 2010 and September 30, 2010:periods indicated:
| | | Three Months Ended | Three Months Ended | |||||||||||||
|---|---|---|---|---|---|---|---|---|---|---|---|---|---|---|---|---|
| | | December 31, 2010 | September 30, 2010 | December 31, 2011 | September 30, 2011 | |||||||||||
| | | (Dollars in thousands, except per share data) | (Dollars in thousands, except per share data) | |||||||||||||
Interest income | Interest income | $ | 77,898 | $ | 75,130 | $ | 70,913 | $ | 72,518 | |||||||
Interest expense | Interest expense | (9,378 | ) | (9,963 | ) | (7,140 | ) | (8,077 | ) | |||||||
Net interest income | 68,520 | 65,167 | ||||||||||||||
Net interest income | 63,773 | 64,441 | ||||||||||||||
Provision for credit losses: | Provision for credit losses: | |||||||||||||||
Non-covered loans | — | — | ||||||||||||||
Covered loans | (4,122 | ) | (348 | ) | ||||||||||||
Non-covered loans | (35,315 | ) | (17,050 | ) | ||||||||||||
Total provision for credit losses | (4,122 | ) | (348 | ) | ||||||||||||
Covered loans | (2,096 | ) | (7,400 | ) | ||||||||||||
Net interest income after provision for credit losses | 59,651 | 64,093 | ||||||||||||||
FDIC loss sharing income, net | 2,667 | 963 | ||||||||||||||
Other noninterest income | 5,587 | 6,180 | ||||||||||||||
Total provision for credit losses | (37,411 | ) | (24,450 | ) | ||||||||||||
Total noninterest income | 8,254 | 7,143 | ||||||||||||||
Non-covered OREO expense, net | (1,714 | ) | (2,293 | ) | ||||||||||||
Covered OREO expense, net | (226 | ) | (4,813 | ) | ||||||||||||
Other noninterest expense | (41,529 | ) | (41,481 | ) | ||||||||||||
Net interest income after provision for credit losses | 31,109 | 40,717 | ||||||||||||||
FDIC loss sharing income (expense), net | (1,277 | ) | 6,406 | |||||||||||||
Other noninterest income | 5,925 | 4,379 | ||||||||||||||
Noninterest expense | (49,286 | ) | (46,174 | ) | ||||||||||||
Income tax benefit (expense) | 5,841 | (1,828 | ) | |||||||||||||
Total noninterest expense | (43,469 | ) | (48,587 | ) | ||||||||||||
Income tax expense | (10,553 | ) | (9,345 | ) | ||||||||||||
Net earnings (loss) | $ | (7,688 | ) | $ | 3,500 | |||||||||||
Net earnings | $ | 13,883 | $ | 13,304 | ||||||||||||
Earnings (loss) per share: | ||||||||||||||||
Basic | $ | (0.22 | ) | $ | 0.10 | |||||||||||
Diluted | $ | (0.22 | ) | $ | 0.10 | |||||||||||
Earnings per share: | ||||||||||||||||
Basic | $ | 0.38 | $ | 0.36 | ||||||||||||
Diluted | $ | 0.38 | $ | 0.36 | ||||||||||||
Annualized return on: | ||||||||||||||||
Average assets | 1.00 | % | 0.97 | % | ||||||||||||
Average equity | 10.22 | % | 10.11 | % | ||||||||||||
Net interest margin | Net interest margin | 5.21 | % | 5.08 | % | 5.00 | % | 5.15 | % | |||||||
Efficiency ratio | Efficiency ratio | 67.4 | % | 60.8 | % | 60.4 | % | 67.9 | % | |||||||
Fourth Quarter of 20102011 Compared to Third Quarter of 20102011
We recorded a net lossearnings of $7.7$13.9 million for the fourth quarter of 20102011 compared to net earnings of $3.5$13.3 million for the third quarter of 2010.2011. The fourth quarter included a $35.3$579,000 increase in net earnings for the linked quarters was due to lower covered OREO costs of $4.6 million ($20.5 million after-tax) credit loss provision for non-covered loans, of which $14.3 million ($8.3 million after-tax) was attributed to the Company's December sale of classified loans, and a $1.9 million ($1.12.7 million after tax) penaltyand higher FDIC loss sharing income of $1.7 million ($1.0 million after tax), offset by a higher provision for the early repaymentcredit losses on covered loans of $50$3.8 million in FHLB advances. Los Padres, which was acquired on August 20, 2010, added $3.3($2.2 million inafter tax) and lower net earnings during the fourth quarterinterest income of 2010.$668,000 ($387,000 after tax).
Net interest income was $68.5$63.8 million for the fourth quarter of 20102011 compared to $65.2$64.4 million for the third quarter of 2010.2011. The $3.3 million increase$668,000 decline was due mostly to a $2.8$1.7 million increasedecrease in loan interest income from lower average loans. Offsetting the decline in interest income attributable to higher average loans from the Los Padres acquisition, the accelerated accretion of purchase discount on the disposal of certain covered loans, and the higher average balance of investments due to securities purchases. Contributing to the increase in net interest income was a
reduction in interest expense of $585,000$937,000 due mainly to rate reductionslower rates on our money marketall interest-bearing deposits and a decline in average time deposit accounts and maturities of higher cost brokered deposits.
Our net interest margin for the fourth quarter of 20102011 was 5.21%5.00%, an increasea decrease of 1315 basis points from the 5.08% posted5.15% reported for the third quarter of 2010. Such improvement reflects2011. The decrease reflected a shift in the mix of average interest-earning assets to lower yielding investment securities from higher yieldyielding loans and lower
accelerated accretion of discounts on covered loan payoffs. Average interest-earning assets increased $91.1 million for the linked quarters including a $141.1 million increase in average loans during the fourth quarter.investment securities. The yield on average loans was 6.64%6.87% for the fourth and third quarters of 2011. The yield on average non-covered loans was 6.49% and 6.53% for the fourth and third quarters, respectively, while the yield on average covered loans was 8.35% and 8.13%, respectively. The combination of accelerated accretion of discounts on covered loan payoffs and nonaccrual loan interest positively impacted the loan yield for the fourth quarter by 4 basis points and the third quarter by 17 basis points. The cost of 2010 comparedinterest-bearing deposits declined 12 basis points to 6.59% for0.57% due to lower rates on interest-bearing deposits and lower average time deposits, and all-in deposit cost declined 8 basis points to 0.36%.
The following table presents the prior quarter. The loan yield, earning asset yield andimpact on the net interest margin are all affected byof accelerated accretion of discounts on covered loan payoffs and loans being placed on or removed from nonaccrual status and the acceleration of purchase discounts on covered loan pay-offs; the loan yield and net interest margin for the fourth quarter were positively impacted by 20 basis points and 16 basis points, respectively, from the combination of these items. The loan yield and net interest margin for the third quarter were positively impacted by 12 basis points and 10 basis points, respectively, from these items. The cost of interest-bearing deposits and all-in deposit cost decreased 8 basis points and 5 basis points to 0.73% and 0.50%, respectively; such decreases resulted primarily from lower rates on our deposit products and maturities of higher cost brokered deposits.periods indicated:
| | Three Months Ended | ||||||
|---|---|---|---|---|---|---|---|
| | December 31, 2011 | September 30, 2011 | |||||
Net interest margin as reported | 5.00 | % | 5.15 | % | |||
Less: | |||||||
Accelerated accretion of purchase discounts on covered loan payoffs | 0.02 | % | 0.10 | % | |||
Nonaccrual loan interest | 0.01 | % | 0.03 | % | |||
Net interest margin as adjusted | 4.97 | % | 5.02 | % | |||
The fourth quarter provision for credit losses for the fourth and third quarters totaled $37.4$4.1 million and was composed of $35.3 million on the non-covered loan portfolio, including $14.3 million$348,000, respectively; such provisions related only to the December classified loan sale, and $2.1 million on the covered loan portfolio. The third quarterzero provision for credit losses totaled $24.5 million and was composed of $17.1 million on the non-covered loan portfolio and $7.4 million on the covered loan portfolio. The provisionlevel on the non-covered portfolio is generated by our allowance methodology and reflects net charge-offs, the levels of nonaccrual and classified loans, loan sales activity, and the migration of loans into various risk classifications. The covered loanprovision for credit loss provision increaseslosses on the covered loanloans results from decreases in expected cash flows on covered loans compared to those previously estimated.
Net charge-offs on non-covered loans for the fourth quarter of 2011 totaled $2.8 million compared to third quarter net charge-offs of $6.0 million. The allowance for credit losses on the non-covered portfolio totaled $93.8 million and results from credit deterioration on covered loans since$96.5 million at December 31, 2011 and September 30, 2011, respectively, and represented 3.34% of the acquisitionnon-covered loan balances at both of those dates.
The fourth quarter classified loan sale completed in December resulted in a charge-off of $20.9 million to the allowance for loancredit losses as a percent of which $6.6 million had been previously provided through the Company's allowance methodology. The additional $14.3 million charge-off represents the market discount in excess of the Company's allocated allowance necessary for thenonaccrual loans to be sold to a third party.was 161% at both December 31, 2011 and September 30, 2011.
Noninterest income for the fourth quarter of 20102011 totaled $4.6$8.3 million compared to $10.8$7.1 million for the third quarter of 2010.2011. The $6.2$1.1 million declineincrease was due mostly to lower FDIC loss sharing income stemming from lower credit-related costs on covered loans, OREO, and a third quarter other-than-temporary impairment ("OTTI") charge on one covered investment security. There was no OTTI charge in the fourth quarter. Loss sharing income also declined due to higher FDIC loss sharing income of $1.7 million stemming from a higher provision for credit losses on covered loans. FDIC loss sharing income also includes reductions of the FDIC loss sharing asset when the estimated amount of losses collectible from the FDIC decreases; this occurs when expected cash flows on covered loan pools improve during a reporting period causing the carrying value of the FDIC loss sharing asset to be reduced.
The following table presents the details of FDIC loss sharing income, net for the periods indicated:
| | Three Months Ended | |||||||||
|---|---|---|---|---|---|---|---|---|---|---|
| | December 31, 2011 | September 30, 2011 | Increase (Decrease) | |||||||
| | (In thousands) | |||||||||
FDIC Loss Sharing Income, Net: | ||||||||||
Gain (loss) on indemnification asset(1) | $ | 2,560 | $ | (2,782 | ) | $ | 5,343 | |||
Net reimbursement from FDIC for covered OREO write-downs and sales | 102 | 3,741 | (3,639 | ) | ||||||
Other | 5 | 6 | (1 | ) | ||||||
Total FDIC loss sharing income, net | $ | 2,667 | $ | 964 | $ | 1,703 | ||||
Noninterest expense totaled $49.3decreased $5.1 million forto $43.5 million during the fourth quarter of 20102011 compared to $46.2$48.6 million for the third quarter of 2010. The $3.1 million increase2011. This change was due mostly to a penaltylower covered OREO costs. Covered OREO costs decreased by $4.6 million due to lower write-downs of $1.9$7.7 million for the early repaymentand lower gains on sales of $50 million in FHLB advances and$3.1 million. The fourth quarter included an increase in other expense categories$885,000 charge to compensation related to a full quarterstaff reduction, which is expected to result in annual savings of approximately $2.4 million, and $600,000 in acquisition costs related to the Los Padres operations. Los Padres noninterest expense totaled $4.4 million forMarquette Equipment Finance transaction; there were no similar items in the fourth quarter compared to $2.1 million for the thirdprior quarter. Other professional services declined $861,000 during the fourth quarter as$293,000 due mostly to internal audit transition costs recognized in the third quarter included higher consulting,and a recovery of $368,000 in legal costs from an insurance claim in the fourth quarter. Occupancy costs declined $286,000 due mostly to third quarter leasing commissions and due diligence costs related to acquisition activity and ongoing loan workouts.a lease buyout.
Noninterest expense includes amortization of time-based restricted stock, which is included in compensation, and intangible asset amortization. Amortization of restricted stock totaled $1.9$1.4 million for the fourth quarter of 2010,and $2.1 million for the third quarter of 2010 and $8.5 million for the year ended December 31, 2010. Intangible asset amortization totaled $2.4 million for each of the fourth and third quarters of 20102011, respectively. Intangible asset amortization totaled $1.8 million and $9.6$2.0 million for the year ended December 31, 2010.
Tablefourth and third quarters of Contents2011, respectively.
Net Interest Income
Net interest income, which is our principal source of income, represents the difference between interest earned on interest-earning assets and interest paid on interest-bearing liabilities. Net interest margin is net interest income expressed as a percentage of average interest-earning assets. The following table presents, for the periods indicated, the distribution of average assets, liabilities and
stockholders' equity, as well as interest income and yields earned on average interest-earning assets and interest expense and rates paid on average interest-bearing liabilities.
| | Year Ended December 31, | |||||||||||||||||||||||||||
|---|---|---|---|---|---|---|---|---|---|---|---|---|---|---|---|---|---|---|---|---|---|---|---|---|---|---|---|---|
| | 2011 | 2010 | 2009 | |||||||||||||||||||||||||
| | Average Balance | Interest Income/ Expense | Yields and Rates | Average Balance | Interest Income/ Expense | Yields and Rates | Average Balance | Interest Income/ Expense | Yields and Rates | |||||||||||||||||||
| | (Dollars in thousands) | |||||||||||||||||||||||||||
ASSETS | ||||||||||||||||||||||||||||
Loans, net of unearned income(1) | $ | 3,755,190 | $ | 260,143 | 6.93 | % | $ | 4,068,450 | $ | 265,136 | 6.52 | % | $ | 4,111,379 | $ | 258,499 | 6.29 | % | ||||||||||
Investment securities(2) | 1,100,869 | 34,785 | 3.16 | % | 675,979 | 24,564 | 3.63 | % | 258,160 | 10,969 | 4.25 | % | ||||||||||||||||
Deposits in financial institutions | 136,447 | 356 | 0.26 | % | 226,276 | 584 | 0.26 | % | 144,216 | 406 | 0.28 | % | ||||||||||||||||
Federal funds sold | — | — | — | — | — | — | 135 | — | — | |||||||||||||||||||
Total interest-earning assets | 4,992,506 | $ | 295,284 | 5.91 | % | 4,970,705 | $ | 290,284 | 5.84 | % | 4,513,890 | $ | 269,874 | 5.98 | % | |||||||||||||
Other assets | 492,577 | 455,005 | 309,827 | |||||||||||||||||||||||||
Total assets | $ | 5,485,083 | $ | 5,425,710 | $ | 4,823,717 | ||||||||||||||||||||||
LIABILITIES AND STOCKHOLDERS' EQUITY | ||||||||||||||||||||||||||||
Interest checking deposits | $ | 491,145 | $ | 777 | 0.16 | % | $ | 458,703 | $ | 1,265 | 0.28 | % | $ | 390,605 | $ | 1,754 | 0.45 | % | ||||||||||
Money market deposits | 1,227,482 | 5,356 | 0.44 | % | 1,230,924 | 9,629 | 0.78 | % | 981,901 | 11,767 | 1.20 | % | ||||||||||||||||
Savings deposits | 150,837 | 226 | 0.15 | % | 121,793 | 249 | 0.20 | % | 114,933 | 270 | 0.23 | % | ||||||||||||||||
Time deposits | 1,077,930 | 14,290 | 1.33 | % | 1,181,735 | 15,094 | 1.28 | % | 874,786 | 18,125 | 2.07 | % | ||||||||||||||||
Total interest-bearing deposits | 2,947,394 | 20,649 | 0.70 | % | 2,993,155 | 26,237 | 0.88 | % | 2,362,225 | 31,916 | 1.35 | % | ||||||||||||||||
Borrowings | 225,542 | 7,071 | 3.14 | % | 324,150 | 9,126 | 2.82 | % | 550,888 | 15,497 | 2.81 | % | ||||||||||||||||
Subordinated debentures | 129,432 | 4,923 | 3.80 | % | 129,703 | 5,594 | 4.31 | % | 129,901 | 6,415 | 4.94 | % | ||||||||||||||||
Total interest-bearing liabilities | 3,302,368 | $ | 32,643 | 0.99 | % | 3,447,008 | $ | 40,957 | 1.19 | % | 3,043,014 | $ | 53,828 | 1.77 | % | |||||||||||||
Noninterest-bearing demand deposits | 1,627,729 | 1,437,493 | 1,245,512 | |||||||||||||||||||||||||
Other liabilities | 43,996 | 47,586 | 50,043 | |||||||||||||||||||||||||
Total liabilities | 4,974,093 | 4,932,087 | 4,338,569 | |||||||||||||||||||||||||
Stockholders' equity | 510,990 | 493,623 | 485,148 | |||||||||||||||||||||||||
Total liabilities and stockholders' equity | $ | 5,485,083 | $ | 5,425,710 | $ | 4,823,717 | ||||||||||||||||||||||
Net interest income | $ | 262,641 | $ | 249,327 | $ | 216,046 | ||||||||||||||||||||||
Net interest rate spread | 4.92 | % | 4.65 | % | 4.21 | % | ||||||||||||||||||||||
Net interest margin | 5.26 | % | 5.02 | % | 4.79 | % | ||||||||||||||||||||||
| | Year Ended December 31, | ||||||||||||||||||||||||||||
|---|---|---|---|---|---|---|---|---|---|---|---|---|---|---|---|---|---|---|---|---|---|---|---|---|---|---|---|---|---|
| | 2010 | 2009 | 2008 | ||||||||||||||||||||||||||
| | Average Balance | Interest Income/ Expense | Yields and Rates | Average Balance | Interest Income/ Expense | Yields and Rates | Average Balance | Interest Income/ Expense | Yields and Rates | ||||||||||||||||||||
| | (Dollars in thousands) | ||||||||||||||||||||||||||||
ASSETS | |||||||||||||||||||||||||||||
Loans, net of unearned income(1)(2) | $ | 4,068,450 | $ | 265,136 | 6.52 | % | $ | 4,111,379 | $ | 258,499 | 6.29 | % | $ | 3,958,963 | $ | 280,408 | 7.08 | % | |||||||||||
Investment securities(2) | 675,979 | 24,564 | 3.63 | % | 258,160 | 10,969 | 4.25 | % | 142,258 | 7,077 | 4.97 | % | |||||||||||||||||
Deposits in financial institutions | 226,276 | 584 | 0.26 | % | 144,216 | 406 | 0.28 | % | 26,564 | 182 | 0.69 | % | |||||||||||||||||
Federal funds sold | — | — | — | 135 | — | — | 11,064 | 161 | 1.46 | % | |||||||||||||||||||
Total interest-earning assets | 4,970,705 | $ | 290,284 | 5.84 | % | 4,513,890 | $ | 269,874 | 5.98 | % | 4,138,849 | $ | 287,828 | 6.95 | % | ||||||||||||||
Other assets | 455,005 | 309,827 | 578,463 | ||||||||||||||||||||||||||
Total assets | $ | 5,425,710 | $ | 4,823,717 | $ | 4,717,312 | |||||||||||||||||||||||
LIABILITIES AND STOCKHOLDERS' EQUITY | |||||||||||||||||||||||||||||
Interest checking deposits | $ | 458,703 | $ | 1,265 | 0.28 | % | $ | 390,605 | $ | 1,754 | 0.45 | % | $ | 358,308 | $ | 2,915 | 0.81 | % | |||||||||||
Money market deposits | 1,230,924 | 9,629 | 0.78 | % | 981,901 | 11,767 | 1.20 | % | 1,007,112 | 19,735 | 1.96 | % | |||||||||||||||||
Savings deposits | 121,793 | 249 | 0.20 | % | 114,933 | 270 | 0.23 | % | 105,938 | 253 | 0.24 | % | |||||||||||||||||
Time deposits | 1,181,735 | 15,094 | 1.28 | % | 874,786 | 18,125 | 2.07 | % | 561,288 | 18,254 | 3.25 | % | |||||||||||||||||
Total interest-bearing deposits | 2,993,155 | 26,237 | 0.88 | % | 2,362,225 | 31,916 | 1.35 | % | 2,032,646 | 41,157 | 2.02 | % | |||||||||||||||||
Borrowings | 324,150 | 9,126 | 2.82 | % | 550,888 | 15,497 | 2.81 | % | 578,783 | 18,742 | 3.24 | % | |||||||||||||||||
Subordinated debentures | 129,703 | 5,594 | 4.31 | % | 129,901 | 6,415 | 4.94 | % | 132,010 | 8,597 | 6.51 | % | |||||||||||||||||
Total interest-bearing liabilities | 3,447,008 | $ | 40,957 | 1.19 | % | 3,043,014 | $ | 53,828 | 1.77 | % | 2,743,439 | $ | 68,496 | 2.50 | % | ||||||||||||||
Noninterest-bearing demand deposits | 1,437,493 | 1,245,512 | 1,242,557 | ||||||||||||||||||||||||||
Other liabilities | 47,586 | 50,043 | 46,270 | ||||||||||||||||||||||||||
Total liabilities | 4,932,087 | 4,338,569 | 4,032,266 | ||||||||||||||||||||||||||
Stockholders' equity | 493,623 | 485,148 | 685,046 | ||||||||||||||||||||||||||
Total liabilities and stockholders' equity | $ | 5,425,710 | $ | 4,823,717 | $ | 4,717,312 | |||||||||||||||||||||||
Net interest income | $ | 249,327 | $ | 216,046 | $ | 219,332 | |||||||||||||||||||||||
Net interest rate spread | 4.65 | % | 4.21 | % | 4.45 | % | |||||||||||||||||||||||
Net interest margin | 5.02 | % | 4.79 | % | 5.30 | % | |||||||||||||||||||||||
Net interest income is affected by changes in both interest rates and the volume of average interest-earning assets and interest-bearing liabilities. The changes in the amount and mix of average interest-earning assets and interest-bearing liabilities isare referred to as a "volume change".changes in "volume." The changes in the yields earned on average interest-earning assets and rates paid on average interest-bearing liabilities isare referred to as a "rate change.changes in "rate." The change in interest income/expense attributable to volume reflects the change in volume multiplied by the prior year's rate and the change in interest income/expense attributable to rate reflects the change in rates multiplied by the prior year's volume. The changes in interest income and expense which are not attributable specifically to either volume or rate are allocated ratably between the two categories.
rate are allocated ratably between the two categories. The following table presents, for the years indicated, changes in interest income and expense and the amount of change attributable to changes in volume and rates:rate:
| | | 2010 Compared to 2009 | 2009 Compared to 2008 | 2011 Compared to 2010 | 2010 Compared to 2009 | |||||||||||||||||||||||||||||||||||
|---|---|---|---|---|---|---|---|---|---|---|---|---|---|---|---|---|---|---|---|---|---|---|---|---|---|---|---|---|---|---|---|---|---|---|---|---|---|---|---|---|
| | | | Increase (Decrease) Due to | | Increase (Decrease) Due to | | Increase (Decrease) Due to | | Increase (Decrease) Due to | |||||||||||||||||||||||||||||||
| | | Total Increase (Decrease) | Total Increase (Decrease) | Total Increase (Decrease) | Total Increase (Decrease) | |||||||||||||||||||||||||||||||||||
| | | Volume | Rate | Volume | Rate | Volume | Rate | Volume | Rate | |||||||||||||||||||||||||||||||
| | | (In thousands) | (In thousands) | |||||||||||||||||||||||||||||||||||||
Interest Income: | Interest Income: | |||||||||||||||||||||||||||||||||||||||
Loans | $ | (4,993 | ) | $ | (21,122 | ) | $ | 16,129 | $ | 6,637 | $ | (2,721 | ) | $ | 9,358 | |||||||||||||||||||||||||
Investment securities | 10,221 | 13,772 | (3,551 | ) | 13,595 | 15,394 | (1,799 | ) | ||||||||||||||||||||||||||||||||
Deposits in financial institutions | (228 | ) | (234 | ) | 6 | 178 | 214 | (36 | ) | |||||||||||||||||||||||||||||||
Loans | $ | 6,637 | $ | (2,721 | ) | $ | 9,358 | $ | (21,909 | ) | $ | 10,486 | $ | (32,395 | ) | |||||||||||||||||||||||||
Investment securities | 13,595 | 15,394 | (1,799 | ) | 3,892 | 5,052 | (1,160 | ) | ||||||||||||||||||||||||||||||||
Deposits in financial institutions | 178 | 214 | (36 | ) | 224 | 387 | (163 | ) | ||||||||||||||||||||||||||||||||
Federal funds sold | — | — | — | (161 | ) | (80 | ) | (81 | ) | |||||||||||||||||||||||||||||||
Total interest income | 20,410 | 12,887 | 7,523 | (17,954 | ) | 15,845 | (33,799 | ) | ||||||||||||||||||||||||||||||||
Total interest income | 5,000 | (7,584 | ) | 12,584 | 20,410 | 12,887 | 7,523 | |||||||||||||||||||||||||||||||||
Interest Expense: | Interest Expense: | |||||||||||||||||||||||||||||||||||||||
Interest checking deposits | (488 | ) | 84 | (572 | ) | (489 | ) | 269 | (758 | ) | ||||||||||||||||||||||||||||||
Money market deposits | (4,273 | ) | (27 | ) | (4,246 | ) | (2,138 | ) | 2,547 | (4,685 | ) | |||||||||||||||||||||||||||||
Savings deposits | (23 | ) | 52 | (75 | ) | (21 | ) | 15 | (36 | ) | ||||||||||||||||||||||||||||||
Time deposits | (804 | ) | (1,361 | ) | 557 | (3,031 | ) | 5,194 | (8,225 | ) | ||||||||||||||||||||||||||||||
Interest checking deposits | (489 | ) | 269 | (758 | ) | (1,161 | ) | 243 | (1,404 | ) | ||||||||||||||||||||||||||||||
Total interest-bearing deposits | (5,588 | ) | (1,252 | ) | (4,336 | ) | (5,679 | ) | 8,025 | (13,704 | ) | |||||||||||||||||||||||||||||
Borrowings | (2,055 | ) | (3,006 | ) | 951 | (6,371 | ) | (6,383 | ) | 12 | ||||||||||||||||||||||||||||||
Subordinated debentures | (671 | ) | (12 | ) | (659 | ) | (821 | ) | (10 | ) | (811 | ) | ||||||||||||||||||||||||||||
Money market deposits | (2,138 | ) | 2,547 | (4,685 | ) | (7,968 | ) | (482 | ) | (7,486 | ) | |||||||||||||||||||||||||||||
Total interest expense | (8,314 | ) | (4,270 | ) | (4,044 | ) | (12,871 | ) | 1,632 | (14,503 | ) | |||||||||||||||||||||||||||||
Savings deposits | (21 | ) | 15 | (36 | ) | 17 | 21 | (4 | ) | |||||||||||||||||||||||||||||||
Net interest income | $ | 13,314 | $ | (3,314 | ) | $ | 16,628 | $ | 33,281 | $ | 11,255 | $ | 22,026 | |||||||||||||||||||||||||||
Time deposits | (3,031 | ) | 5,194 | (8,225 | ) | (129 | ) | 7,953 | (8,082 | ) | ||||||||||||||||||||||||||||||
Total interest-bearing deposits | (5,679 | ) | 8,025 | (13,704 | ) | (9,241 | ) | 7,735 | (16,976 | ) | ||||||||||||||||||||||||||||||
Borrowings | (6,371 | ) | (6,383 | ) | 12 | (3,245 | ) | (871 | ) | (2,374 | ) | |||||||||||||||||||||||||||||
Subordinated debentures | (821 | ) | (10 | ) | (811 | ) | (2,182 | ) | (135 | ) | (2,047 | ) | ||||||||||||||||||||||||||||
Total interest expense | (12,871 | ) | 1,632 | (14,503 | ) | (14,668 | ) | 6,729 | (21,397 | ) | ||||||||||||||||||||||||||||||
Net interest income | $ | 33,281 | $ | 11,255 | $ | 22,026 | $ | (3,286 | ) | $ | 9,116 | $ | (12,402 | ) | ||||||||||||||||||||||||||
The following table presents the impact on the net interest margin of accelerated accretion of discounts on covered loan payoffs and loans being placed on or removed from nonaccrual status for the years indicated:
| | Year Ended December 31, | |||||||||
|---|---|---|---|---|---|---|---|---|---|---|
| | 2011 | 2010 | 2009 | |||||||
Net interest margin as reported | 5.26 | % | 5.02 | % | 4.79 | % | ||||
Less: | ||||||||||
Accelerated accretion of purchase discounts on covered loan payoffs | 0.18 | % | 0.10 | % | — | |||||
Nonaccrual loan interest | 0.01 | % | (0.02 | )% | (0.09 | )% | ||||
Net interest margin as adjusted | 5.07 | % | 4.94 | % | 4.88 | % | ||||
20102011 Compared to 20092010
Our net interest income and net interest margin are driven by the combination of our loan and securities volume, asset yield, high proportion of demand deposit balances to total deposits, and disciplined deposit pricing. There
The $13.3 million growth in net interest income for 2011 compared to 2010 was no changedue to a $5.0 million increase in interest income and an $8.3 million decline in interest expense. The increase in interest income was due mainly to purchases of investment securities and a higher yield on average loans, offset partially by lower average loans and a lower yield on average securities. The loan yield, earning asset yield and net interest margin are all affected by loans being placed on or removed from nonaccrual status and the acceleration of purchase discounts on covered loan pay-offs; the combination of these items increased interest income $9.5 million and positively impacted the net interest margin 19 basis points in 2011. For 2010, these items increased interest income $4.1 million and increased the net
interest margin 8 basis points. Accelerated accretion of purchase discounts on covered loan payoffs positively impacted the net interest margin by 18 basis points and 10 basis points for 2011 and 2010, respectively.
The decline in interest expense was due to a lower average rate on money market deposits, lower average time deposits and lower average borrowings as $260 million of FHLB advances were repaid in the Federal Fundsfirst half of 2010 and another $50 million were repaid in December 2010. Our overall cost of average deposits was 0.45% for 2011 compared to 0.59% for 2010. Noninterest-bearing demand deposits averaged $1.6 billion, or 36% of total average deposits for 2011 compared to $1.4 billion, or 32% of total average deposits for 2010.
The net interest margin for 2011 was 5.26%, an increase of 24 basis points when compared to 2010. The increase was due to a higher yield on loans, lower costs for money market rate ordeposits and subordinated debentures, and a lower average balance of FHLB advances. This was offset partially by a shift in the Bank's 4.00% lending rate during 2010.mix of average interest-earning assets to lower yielding investment securities from higher yielding loans. Average interest-earning assets increased $21.8 million due mostly to a $424.9 million increase in average investment securities while average loans decreased $313.3 million.
2010 Compared to 2009
The $33.3 million growth in net interest income for 2010 compared to 2009 was due to a $20.4 million increase in interest income and a $12.9 million decline in interest expense. The increase in interest income was due to higher average balances of investment securities from the purchase of $627.9 million of government-sponsored entity pass through securities during 2010, the interest-earning assets from the Los Padres and Affinity acquisitions, and a higher average yield on loans. The loan yield, earning asset yield and net interest margin are all affected byimpact from loans being placed on or removed from nonaccrual status and the acceleration of purchase discounts on covered loan pay-offs; the combination of these items increasedpay-offs was a $4.1 million increase to interest income $4.1 million and positively impactedan 8 basis point increase in the net interest margin 8 basis points infor 2010. For 2009, these items reduced interest income $4.1 million and decreased the net interest margin 9 basis points.
The decline in interest expense was due mainly to lower rates paid on deposits and borrowings and lower average borrowings. Our overall cost of average deposits was 0.59% for 2010 compared to 0.88% for 2009. Noninterest-bearing demand deposits averaged $1.4 billion, or 32% of total average deposits for 2010 compared to $1.2 billion, or 35% of total average deposits for 2009. For 2008, our overall cost of average deposits was 1.26% and noninterest-bearing demand deposits averaged $1.2 billion, or 38% of total average deposits.
The net interest margin for 2010 was 5.02%, an increase of 23 basis points when compared to 2009. The increase is due mostly to a higher yield on average loans and lower funding costs, due principally to lower rates paid on deposits and lower average borrowings.
2009 Compared to 2008
The $3.3 million decrease in net interest income for 2009 compared to 2008 is due mostly to reduced Accelerated accretion of purchase discounts on covered loan interest income offset by lower funding costs. The net interest margin fell 51 basis points year over year to 4.79% for 2009 when compared to 2008. The declines are driven largely by the lower level of market interest rates.
Loan interest income decreased $21.9 million from lower loan yields as a result of the lower level of market interest rates. Market interest rates declined during 2008 and then remained at historically low levels throughout 2009. Our base lending rate was lowered to 4.00% in December 2008 and remained at this level for 2009. The sustained lower interest rates contributed to our loan yields averaging 6.29% for 2009 compared to 7.08% for 2008. The higher level of nonaccrual loans also lowered loan interest income and loan yields. Of the $21.9 million decline in loan interest income, net reversals of interest income on nonaccrual loans contributed $2.4 million to this decrease; net reversals of interest income on nonaccrual loans reduced loan interest income $4.1 million for 2009 and $1.7 million for 2008. These reversals reducedpayoffs positively impacted the net interest margin 9by 10 basis points for 2009 and 4 basis points2010; there was no impact for 2008.2009.
We reduced interest expense $14.7 million by lowering the rates paid on money market and time deposit products. The effectTable of rate reductions on time deposits was offset somewhat by higher average balances from the Security Pacific Bank and Affinity Bank acquisitions. Borrowing costs declined from lower market interest rates and lower average FHLB borrowings.Contents
Provision for Credit Losses
The following table sets forthpresents the details of the provision for credit losses, the related year-over-year increases and presentsdecreases, and allowance for credit losses data for the years indicated. The columns titled "Increase (Decrease)" set forth the year-over-year changes between 2010 and 2009 and between 2009 and 2008.indicated:
| | | Year Ended December 31, | Year Ended December 31, | ||||||||||||||||||||||||||||||||
|---|---|---|---|---|---|---|---|---|---|---|---|---|---|---|---|---|---|---|---|---|---|---|---|---|---|---|---|---|---|---|---|---|---|---|---|
| | | 2010 | Increase (Decrease) | 2009 | Increase (Decrease) | 2008 | 2011 | Increase (Decrease) | 2010 | Increase (Decrease) | 2009 | ||||||||||||||||||||||||
| | | (In thousands) | (Dollars in thousands) | ||||||||||||||||||||||||||||||||
Provision For Credit Losses: | Provision For Credit Losses: | ||||||||||||||||||||||||||||||||||
Addition to allowance for loan losses | $ | 10,505 | $ | (168,373 | ) | $ | 178,878 | $ | 37,268 | $ | 141,610 | ||||||||||||||||||||||||
Addition (reduction) to reserve for unfunded loan commitments | 2,795 | 2,681 | 114 | (176 | ) | 290 | |||||||||||||||||||||||||||||
Addition to allowance for loan losses | $ | 178,878 | $ | 37,268 | $ | 141,610 | $ | 92,610 | $ | 49,000 | |||||||||||||||||||||||||
Total provision for non-covered loans | 13,300 | (165,692 | ) | 178,992 | 37,092 | 141,900 | |||||||||||||||||||||||||||||
Provision for covered loans | 13,270 | (20,230 | ) | 33,500 | 15,500 | 18,000 | |||||||||||||||||||||||||||||
Addition (reduction) to reserve for unfunded loan commitments | 114 | (176 | ) | 290 | 3,490 | (3,200 | ) | ||||||||||||||||||||||||||||
Total provision for non-covered loans | 178,992 | 37,092 | 141,900 | 96,100 | 45,800 | ||||||||||||||||||||||||||||||
Provision for covered loans | 39,046 | 21,046 | 18,000 | 18,000 | — | ||||||||||||||||||||||||||||||
Total provision for credit losses | $ | 218,038 | $ | 58,138 | $ | 159,900 | $ | 114,100 | $ | 45,800 | |||||||||||||||||||||||||
Total provision for credit losses | $ | 26,570 | $ | (185,922 | ) | $ | 212,492 | $ | 52,592 | $ | 159,900 | ||||||||||||||||||||||||
Allowance for Credit Losses Data: | Allowance for Credit Losses Data: | ||||||||||||||||||||||||||||||||||
Net charge-offs on non-covered loans | $ | 198,942 | $ | 112,530 | $ | 86,412 | $ | 48,374 | $ | 38,038 | |||||||||||||||||||||||||
Charge-offs on non-covered loans sold | 144,647 | 144,647 | — | (16,248 | ) | 16,248 | |||||||||||||||||||||||||||||
Allowance for loan losses (year-end) | 98,653 | (20,064 | ) | 118,717 | 55,198 | 63,519 | |||||||||||||||||||||||||||||
Allowance for credit losses (year-end) | 104,328 | (19,950 | ) | 124,278 | 55,488 | 68,790 | |||||||||||||||||||||||||||||
Allowance for credit losses to non-covered nonaccrual loans (year-end) | 110.8 | % | 51.8 | % | 108.4 | % | |||||||||||||||||||||||||||||
Allowance for credit losses to non-covered loans, net of unearned income (year-end) | 3.30 | % | 3.35 | % | 1.72 | % | |||||||||||||||||||||||||||||
Net charge-offs on non-covered loans | $ | 23,845 | $ | (175,097 | ) | $ | 198,942 | $ | 112,530 | $ | 86,412 | ||||||||||||||||||||||||
Charge-offs on classified loans sold | — | (144,647 | ) | 144,647 | 144,647 | — | |||||||||||||||||||||||||||||
Allowance for loan losses (year-end) | 85,313 | (13,340 | ) | 98,653 | (20,064 | ) | 118,717 | ||||||||||||||||||||||||||||
Allowance for credit losses (year-end) | 93,783 | (10,545 | ) | 104,328 | (19,950 | ) | 124,278 | ||||||||||||||||||||||||||||
Allowance for credit losses to non-covered loans, net of unearned income (year-end) | 3.34 | % | 3.30 | % | 3.35 | % | |||||||||||||||||||||||||||||
Allowance for credit losses to non-covered nonaccrual loans (year-end) | 161.0 | % | 110.8 | % | 51.8 | % | |||||||||||||||||||||||||||||
Net charge-off ratios: | |||||||||||||||||||||||||||||||||||
Net charge-offs to non-covered average loans | 0.81 | % | 5.94 | % | 2.22 | % | |||||||||||||||||||||||||||||
Net charge-offs, excluding charge-offs on classified loans sold, to non-covered average loans | 0.81 | % | 1.62 | % | 2.22 | % | |||||||||||||||||||||||||||||
The amount of theProvisions for credit losses are charged to earnings as and when needed for both on and off balance sheet credit exposures. We have a provision for credit losses in each year ison our non-covered loans and a charge against earnings in that year. The provisionsprovision for credit losses areon our covered loans. The provision for credit losses on our non-covered loans is based on our allowance methodology and reflectis an expense that, in our judgments aboutjudgment, is required to maintain the adequacy of the allowance for loan losses and the reserve for unfunded loan commitments. In determiningOur allowance methodology reflects net charge-offs, the amount of the provision, we consider certain quantitative and qualitative factors including our historical loan loss experience, the volume and type of lending we conduct, the results of our credit review process, the levellevels and trends of classified, criticized, past duenonaccrual and nonaccrual loans, regulatory policies, usage trends of unfunded loan commitments, portfolio concentrations, general economic conditions, underlying collateral values, off-balance sheet exposures, and other factors regarding collectability and impairment. To the extent we experience, for example, increased levels of documentation deficiencies, adverse changes in collateral values, or negative changes in economic and business conditions which adversely affect our borrowers, our classified loans, may increase. Increases in our classifiedand the migration of loans generally result in provisionsinto various risk classifications. The provision for credit losses.losses on our covered loans reflects decreases in expected cash flows on covered loans compared to those previously estimated.
We made provisions for credit losses totaling $218.0$26.6 million during 2011, $212.5 million during 2010, and $159.9 million during 2009,2009. The 2011 provision for credit losses was comprised of a $10.5 million addition to the allowance for loan losses on the non-covered loan portfolio, a $13.3 million addition to the covered loan allowance for credit losses, and $45.8a $2.8 million during 2008.addition to the reserve for unfunded loan commitments.
The 2010 provision for credit losses was comprised of a $179.0 million addition to the allowance for loan losses on the non-covered loan portfolio, a $39.0$33.5 million addition to the covered loan allowance for credit losses, and a $114,000 addition to the reserve for unfunded loan commitments. The 2010 provision for credit losses on non-covered loans includes $85.7 million related to $398.5 million of classified loans sold in 2010.
The 2009 provision for credit losses was composed of a $141.6 million addition to the allowance for loan losses on the non-covered loan portfolio, an $18.0 million addition to the covered loan allowance for credit losses and a $290,000 addition to the reserve for unfunded loan commitments. The 2008 provision for credit losses was composed of a $49.0 million addition to the allowance for loan losses and a $3.2 million reduction to the reserve for unfunded loan commitments.
Net charge-offs on non-covered loans charged-off in 2010 increaseddecreased by $112.5$175.1 million to $198.9$23.8 million when compared to 2009. Our 20102010. The net charge-offs are higher due primarily tofor 2010 included $144.6 million in charge-offs that we recorded in connection withrelated to the sales of $398.5 million in classified loans duringloans.
The allowance for credit losses on the year. The economic downturn has negatively impacted our borrowers and the collateral values underlying our loans. A protracted economic down cycle will increase the stress on ournon-covered loan portfolio and we may continue to experience increased levelstotaled $93.8 million, or 3.34% of charge-offs and provisions.
non-covered loans, net of unearned income, at December 31, 2011. The allowance for credit losses on the non-covered loan portfolio totaled $104.3 million, or 3.30% of non-covered loans, net of unearned income, at December 31, 2010. The allowance for credit losses totaled $124.3 million, or 3.35% of non-covered loans, net of unearned income, at December 31, 2009. Of these amounts, the allowance for loan losses totaled $85.3 million at December 31, 2011 and $98.6 million at December 31, 2010 and $118.7 million at December 31, 2009.2010.
Under the terms of our loss sharing agreements, the FDIC will absorb 80% of the losses on the covered loans. As a result, the effect on pre-tax earnings was 20% of the provision for covered loans as we recorded 80% of this provision as an offset in FDIC loss sharing income. The $39.0 million provisionprovisions for credit losses on covered loans for 2011, 2010 and 2009 were $13.3 million, $33.5 million and $18.0 million, respectively. The increase in the covered loan portfolioprovision for 2010 compared to 2009 reflects credit deterioration onthe additional covered loans subsequent tofrom the acquisition dates. This provision was based on an ongoing analysis of acquired loans, which indicated a decrease in expected cash flows compared to previous estimates. Under the terms of the FDIC loss sharing agreement, the FDIC absorbs 80% of the losses reflected by the provision. As a result, $31.2 million is included in the noninterest income caption "FDIC loss sharing income, net" and represents 80% of the credit loss provision for covered loans.Los Padres acquisition.
Increased provisions for credit losses may be required in the future based on loan and unfunded commitment growth, the effect changes in economic conditions, such as inflation, unemployment, market interest rate levels, and real estate values may have on the ability of our borrowers to repay their loans, and other negative conditions specific to our borrowers' businesses. See "—Critical Accounting Policies," "—Financial Condition—Allowance for Credit Losses on Non-Covered Loans," "—Financial Condition—Allowance for Credit Losses on Covered Loans," and NotesNote 1(h),Nature of Operations and Summary of Significant Accounting Policies—Impaired Loans and Allowances for Credit Losses, and Note 6,Loans, of the Notes to Consolidated Financial Statements contained in "Item 8. Financial Statements and Supplementary Data."
Noninterest Income
The following table sets forthpresents the details of noninterest income and related year-over-year increases and decreases for the years indicated. The columns titled "Increase (Decrease)" set forth the year-over-year changes between 2010 and 2009 and between 2009 and 2008.indicated:
| | Year Ended December 31, | |||||||||||||||||
|---|---|---|---|---|---|---|---|---|---|---|---|---|---|---|---|---|---|---|
| | 2010 | Increase (Decrease) | 2009 | Increase (Decrease) | 2008 | |||||||||||||
| | (In thousands) | |||||||||||||||||
Noninterest Income: | ||||||||||||||||||
Service charges on deposit accounts | $ | 11,561 | $ | (447 | ) | $ | 12,008 | $ | (1,006 | ) | $ | 13,014 | ||||||
Other commissions and fees | 7,291 | 340 | 6,951 | (326 | ) | 7,277 | ||||||||||||
Other-than-temporary-impairment loss on securities | (874 | ) | (874 | ) | — | — | — | |||||||||||
FDIC loss sharing income, net | 28,330 | 12,016 | 16,314 | 16,314 | — | |||||||||||||
Increase in cash surrender value of life insurance | 1,440 | (139 | ) | 1,579 | (841 | ) | 2,420 | |||||||||||
Gain from Affinity acquisition | — | (66,989 | ) | 66,989 | 66,989 | — | ||||||||||||
Loss on sale of loans | — | — | — | 303 | (303 | ) | ||||||||||||
Other income | 1,036 | (1,030 | ) | 2,066 | 47 | 2,019 | ||||||||||||
Total noninterest income | $ | 48,784 | $ | (57,123 | ) | $ | 105,907 | $ | 81,480 | $ | 24,427 | |||||||
| | Year Ended December 31, | |||||||||||||||
|---|---|---|---|---|---|---|---|---|---|---|---|---|---|---|---|---|
| | 2011 | Increase (Decrease) | 2010 | Increase (Decrease) | 2009 | |||||||||||
| | (In thousands) | |||||||||||||||
Noninterest Income: | ||||||||||||||||
Service charges on deposit accounts | $ | 13,829 | $ | 2,268 | $ | 11,561 | $ | (447 | ) | $ | 12,008 | |||||
Other commissions and fees | 7,616 | 325 | 7,291 | 340 | 6,951 | |||||||||||
Other-than-temporary-impairment loss on securities | — | 874 | (874 | ) | (874 | ) | — | |||||||||
Increase in cash surrender value of life insurance | 1,443 | 3 | 1,440 | (139 | ) | 1,579 | ||||||||||
FDIC loss sharing income, net | 7,776 | (15,008 | ) | 22,784 | 6,470 | 16,314 | ||||||||||
Gain from Affinity acquisition | — | — | — | (66,989 | ) | 66,989 | ||||||||||
Other income | 762 | (274 | ) | 1,036 | (1,030 | ) | 2,066 | |||||||||
Total noninterest income | $ | 31,426 | $ | (11,812 | ) | $ | 43,238 | $ | (62,669 | ) | $ | 105,907 | ||||
The following table presents the details of FDIC loss sharing income, net for the years indicated:
| | Year Ended December 31, | |||||||||
|---|---|---|---|---|---|---|---|---|---|---|
| | 2011 | 2010 | 2009 | |||||||
| | (In thousands) | |||||||||
FDIC Loss Sharing Income, Net: | ||||||||||
Gain (loss) on indemnification asset(1) | $ | 10,829 | $ | 25,010 | $ | 15,100 | ||||
Loan recoveries shared with FDIC | (5,513 | ) | (4,437 | ) | — | |||||
Net reimbursement from FDIC for covered OREO write-downs and sales | 2,416 | 1,512 | 1,214 | |||||||
Other | 44 | 699 | — | |||||||
Total FDIC loss sharing income, net | $ | 7,776 | $ | 22,784 | $ | 16,314 | ||||
2011 Compared to 2010
Noninterest income declined by $11.8 million to $31.4 million during the year ended December 31, 2011 compared to the same period last year. This reduction was attributable to the $15.0 million decrease in FDIC loss sharing income, due mostly to the lower provision for credit losses on covered loans. In addition to including the FDIC's share of losses and recoveries on covered assets, FDIC loss sharing income also includes reductions of the FDIC loss sharing asset when the estimated amount of losses collectible from the FDIC decreases. This occurs when expected cash flows on covered loan pools improve during a reporting period causing the carrying value of the FDIC loss sharing asset to be reduced. Service charges on deposit accounts increased due primarily to the growth in service charges on checking accounts and account analysis fees. In 2010 we recognized an $874,000 other-than-temporary impairment loss on one covered investment security due to deteriorating cash flows and significant delinquency of the underlying loan collateral. The 2010 impairment loss was offset partially by related FDIC loss sharing income of $699,000. There were no such impairments or impairment-related loss sharing income in 2011.
2010 Compared to 2009
Noninterest income declined in 2010 to $48.8$43.2 million from the $105.9 million earned in 2009. The $57.1$62.7 million decrease was due mainly to the $67.0 million gain on the Affinity acquisition recorded in August 2009; there was no similar gain in 2010. The 2010 overall decline compared to 2009 was offset partially by an increase of $12.0$6.5 million in FDIC loss sharing income to $28.3$22.8 million. The increase in FDIC loss sharing income for 2010 was attributable mostly to the FDIC's share of the $21.0$15.5 million increase in the provision for credit losses on covered loans. Another factor contributing to the decline in noninerestnoninterest income was an $874,000 other-than-temporary impairment loss that we recordedrecognized in 2010 on one covered investment security due to deteriorating cash flows and significant delinquency of the underlying loan collateral.2010. This impairment loss was offset partially by related FDIC loss sharing income of $699,000. Service charges on deposit accounts decreased $447,000 due mostly to a decrease in NSF handling fees because fewer checks were drawn against accounts with insufficient funds. The decline in other income is attributed to the receipt of a death benefit in 2009; there were no such benefits received in 2010.
Income from the cash surrender value of bank owned life insurance (BOLI) policies was lower for 2010 compared to 2009 and for 2009 when compared to 2008 due mostly to lower yields for our life insurance policies, which is in line with lower market interest rates. As of December 31, 2010, we owned $22.1 million in separate account BOLI policies and $44.1 million in general account BOLI policies. Our crediting rate, or yield for our life insurance policies, changes quarterly and is determined by the performance of the underlying investments. The income is recognized as an appreciation of the cash surrender value of life insurance policies. It is noncash income and not subject to income tax. The tax-equivalent yield for our life insurance policies was 3.76% during 2010, 4.07% during 2009, and 6.03% during 2008.
2009 Compared to 2008
Noninterest income increased $81.5 million for the year ended December 31, 2009 to $105.9 million from the $24.4 million earned during 2008. The increase is due mostly to the $67.0 million gain from the Affinity acquisition that occurred on August 28, 2009 coupled with FDIC loss sharing income of $16.3 million.
Noninterest Expense
The following table sets forthpresents the details of noninterest expense and related increases and decreases for the years indicated. The columns titled "Increase (Decrease)" set forth the year-over-year changes between 2010 and 2009 and between 2009 and 2008.indicated:
| | Year Ended December 31, | |||||||||||||||||
|---|---|---|---|---|---|---|---|---|---|---|---|---|---|---|---|---|---|---|
| | 2010 | Increase (Decrease) | 2009 | Increase (Decrease) | 2008 | |||||||||||||
| | (Dollars in thousands) | |||||||||||||||||
Noninterest Expense: | ||||||||||||||||||
Compensation | $ | 87,483 | $ | 9,310 | $ | 78,173 | $ | 5,988 | $ | 72,185 | ||||||||
Occupancy | 27,639 | 1,256 | 26,383 | 1,852 | 24,531 | |||||||||||||
Data processing | 8,538 | 1,592 | 6,946 | 714 | 6,232 | |||||||||||||
Other professional services | 8,567 | 1,653 | 6,914 | 374 | 6,540 | |||||||||||||
Business development | 2,463 | (78 | ) | 2,541 | (503 | ) | 3,044 | |||||||||||
Communications | 3,329 | 397 | 2,932 | (219 | ) | 3,151 | ||||||||||||
Insurance and assessments | 9,685 | 380 | 9,305 | 5,782 | 3,523 | |||||||||||||
Other real estate owned, net | 14,770 | (8,552 | ) | 23,322 | 21,104 | 2,218 | ||||||||||||
Intangible asset amortization | 9,642 | 95 | 9,547 | (73 | ) | 9,620 | ||||||||||||
Goodwill write-off | — | — | — | (761,701 | ) | 761,701 | ||||||||||||
Other expense | 16,687 | 3,546 | 13,141 | (49 | ) | 13,190 | ||||||||||||
Total noninterest expense | $ | 188,803 | $ | 9,599 | $ | 179,204 | $ | (726,731 | ) | $ | 905,935 | |||||||
| | Year Ended December 31, | |||||||||||||||
|---|---|---|---|---|---|---|---|---|---|---|---|---|---|---|---|---|
| | 2011 | Increase (Decrease) | 2010 | Increase (Decrease) | 2009 | |||||||||||
| | (In thousands) | |||||||||||||||
Noninterest Expense: | ||||||||||||||||
Compensation | $ | 86,800 | $ | (683 | ) | $ | 87,483 | $ | 9,310 | $ | 78,173 | |||||
Occupancy | 28,685 | 1,046 | 27,639 | 1,256 | 26,383 | |||||||||||
Data processing | 8,964 | 426 | 8,538 | 1,592 | 6,946 | |||||||||||
Other professional services | 8,986 | 1,151 | 7,835 | 1,521 | 6,314 | |||||||||||
Business development | 2,321 | (142 | ) | 2,463 | (78 | ) | 2,541 | |||||||||
Communications | 3,011 | (318 | ) | 3,329 | 397 | 2,932 | ||||||||||
Insurance and assessments | 7,171 | (2,514 | ) | 9,685 | 380 | 9,305 | ||||||||||
Non-covered other real estate owned, net | 7,010 | (5,300 | ) | 12,310 | (9,259 | ) | 21,569 | |||||||||
Covered other real estate owned, net | 3,666 | 1,206 | 2,460 | 707 | 1,753 | |||||||||||
Intangible asset amortization | 8,428 | (1,214 | ) | 9,642 | 95 | 9,547 | ||||||||||
Acquisition costs | 600 | (132 | ) | 732 | 132 | 600 | ||||||||||
Other expense | 14,351 | (2,336 | ) | 16,687 | 3,546 | 13,141 | ||||||||||
Total noninterest expense | $ | 179,993 | $ | (8,810 | ) | $ | 188,803 | $ | 9,599 | $ | 179,204 | |||||
The following tables present the components of non-covered and covered OREO expense, net for the years indicated:
| | Year Ended December 31, | |||||||||
|---|---|---|---|---|---|---|---|---|---|---|
| | 2011 | 2010 | 2009 | |||||||
| | (In thousands) | |||||||||
Non-Covered OREO Expense: | ||||||||||
Provision for losses | $ | 5,026 | $ | 12,271 | $ | 16,277 | ||||
Maintenance costs | 2,177 | 2,065 | 3,999 | |||||||
(Gain) loss on sale | (193 | ) | (2,026 | ) | 1,293 | |||||
Total non-covered OREO expense, net | $ | 7,010 | $ | 12,310 | $ | 21,569 | ||||
| | Year Ended December 31, | |||||||||
|---|---|---|---|---|---|---|---|---|---|---|
| | 2011 | 2010 | 2009 | |||||||
| | (In thousands) | |||||||||
Covered OREO Expense: | ||||||||||
Provision for losses | $ | 11,968 | $ | 5,389 | $ | 1,518 | ||||
Maintenance costs | 645 | 570 | 220 | |||||||
(Gain) loss on sale | (8,947 | ) | (3,499 | ) | 15 | |||||
Total covered OREO expense, net | $ | 3,666 | $ | 2,460 | $ | 1,753 | ||||
2011 Compared to 2010
Noninterest expense declined by $8.8 million to $180.0 million for 2011. This reduction was attributable to decreases in non-covered net OREO costs, insurance and assessments expense, other expense, intangible asset amortization, and compensation expense, offset partially by increases in covered OREO costs, other professional services, and occupancy expense. Non-covered OREO costs
declined $5.3 million due to lower write-downs of $7.2 million, offset by lower gains on sales of $1.8 million. Insurance and assessment costs decreased $2.5 million due to a reduction in FDIC deposit insurance costs. Other expense declined $2.3 million due mostly to $2.7 million in penalties for early repayment of $175 million in FHLB advances in 2010; there were no FHLB prepayment penalties in 2011. Intangible asset amortization decreased $1.2 million due mainly to $9.2 million of core deposit and customer relationship intangibles becoming fully amortized in 2011. Compensation expense declined $683,000 due primarily to a decrease in amortization of restricted stock. Included in compensation expense for 2011 was an $885,000 charge in the fourth quarter for a staff reduction, which is expected to result in annual savings of $2.4 million. Covered OREO costs increased by $1.2 million due to higher write-downs, which were offset by higher gains on sales. The increase in other professional services was due to higher legal costs for ongoing credit work-outs. For acquisitions completed after January 1, 2009, acquisition related costs, such as legal, accounting valuation and other professional fees, necessary to effect a business combination, are charged to earnings in periods in which the costs are incurred. We incurred and charged to expense approximately $600,000 and $732,000 of such costs in 2011 and 2010, respectively. Occupancy costs grew $1.0 million due to lease renewal activity and the inclusion for a full year of occupancy costs related to the branches added in the Los Padres acquisition, which was completed in August 2010. Initially we acquired 14 branches, and through branch consolidations, ended 2011 with eight former Los Padres branches.
Noninterest expense includes (i) amortization of time-based restricted stock, which vests either in increments over a three to five year period or at the end of such period and is included in compensation expense and (ii) intangible asset amortization, which is related to customer deposit and customer relationship intangible assets. Amortization of restricted stock totaled $7.6 million and $8.5 million for the years ended December 31, 2011 and 2010. Intangible asset amortization was $8.4 million and $9.6 million for 2011 and 2010.
2010 Compared to 2009
Noninterest expense increased $9.6 million year-over-year to $188.8 million for 2010. The growth in most expense categories was due primarily to higher overhead costs related to the Affinity and Los Padres acquisitions. Compensation increased $9.3 million due to the acquisitions and severance costs. Excluding employees gained in the Los Padres acquisition, we reduced our workforce by approximately 5% and paid $1.0 million in severance at the end of the third quarter of 2010; the annual pre-tax savings from these departures is approximately $3.6 million.2010. Occupancy costs increased $1.3 million due mostly to the 10 branches added in the Affinity acquisition and 14 branches added in the Los Padres acquisition. Other professional services increased $1.7$1.5 million due mostly to higher legal costs related to loan workout activity and consulting fees for acquisitions.various strategic initiatives. For acquisitions completed after January 1, 2009,our successful acquisition related costs, such as legal, accounting valuation and other professional fees, necessary to effect a business combination, are charged to earnings in periods in which the costs are incurred. Weactivity, we incurred and charged to expense approximately $900,000$732,000 and $600,000 of such costs in 2010 and 2009, respectively,professional services fees which are included in other professional fees.separately categorized as acquisition costs. Other expense increased $3.5 million due mostly to a $1.2 million increase in loan-related costs, $2.7 million in penalties for early repayment of $175 million in FHLB advances in 2010, and lower reorganization charges of $1.2 million. There were no FHLB prepayment penalties in 2009. The elevated loan-related costs were attributed to ongoing workout efforts. The 2009 reorganization charges totaled $1.2 million and related to a first quarter staff reduction, premises costs for the closing of two banking offices in the second quarter, and additional rent for a discontinued acquired office. OREO costs declined $8.6 million due mostly to higher net gains on sales and lower write-downs and costs in 2010.
Noninterest expense includes (i) amortization of time-based restricted stock, which vests either in increments over a three to five year period or at the end of such period and is included in compensation expense and (ii) intangible asset amortization, which is related to customer deposit and customer relationship intangible assets. Amortization of restricted stock totaled $8.5 million and
$8.2 $8.2 million for the years ended December 31, 2010 and 2009, respectively.2009. Intangible asset amortization was $9.6 million and $9.5 million for 2010 and 2009, respectively.2009.
2009 Compared to 2008
Noninterest expense for the year ended December 31, 2009 totaled $179.2 million compared to $905.9 million for the same period in 2008. The $726.7 million decrease is due mostly to the $761.7 million goodwill write-off in 2008. The remaining $35.0 million increase in noninterest expense is due to higher OREO costsTable of $21.1 million, higher deposit insurance costs of $5.8 million and higher compensation costs of $6.0 million. OREO costs reflect higher levels of writedowns on the portfolio, which totaled $17.8 million, due to the declining real estate market and increased holding costs during the year. The increased deposit insurance costs relate to higher FDIC deposit insurance premiums generally, plus the cost to participate in the Transaction Account Guarantee Program and the second quarter of 2009 special FDIC deposit insurance assessment of $2.0 million. Compensation costs increased year-over-year due to increased staff levels from our acquisitions and higher compensation expense from restricted stock awards.
Compensation expense included $8.2 million for 2009 and $930,000 for 2008 in amortization expense for shares of time-based and performance-based restricted stock awarded to employees. Time-based restricted stock vests either in increments over a three to five year period. Performance-based restricted stock vests when the Company attains specific long-term financial targets. Beginning with the fourth quarter of 2007, the amortization of certain performance-based restricted stock awards was suspended. During the fourth quarter of 2008 we concluded it was improbable that the financial targets would be met for the performance-based stock awards. Accordingly, we reversed the accumulated amortization on those awards through a credit of $4.5 million to compensation expense. If and when the attainment of such performance targets is deemed probable in future periods, a catch-up adjustment will be recorded and amortization of such performance-based restricted stock will begin again. The total amount of unrecognized compensation expense related to the performance-based restricted stock for which amortization was suspended and reversed totaled $26.6 million.Contents
Income Taxes
Effective income tax rates were 43.0%42.1%, 45.5%43.0%, and 2.8%45.5% for the years ended December 31, 2011, 2010, 2009, and 2008,2009, respectively. The difference in the effective tax rates between the annual periods relates mainly to the level of tax credits and tax deductions and the amount of tax exempt income recorded in each of the years. The 2008 effective rate was lowered by the goodwill write-off, the majority of which was not deductible for tax purposes. For further information on income taxes, see Note 14,Income Taxes, of the Notes to Consolidated Financial Statements contained in "Item 8. Financial Statements and Supplementary Data."
The following tables present our total gross loan portfolio by segment, showing the non-covered and covered components, as of the dates indicated:
| | December 31, 2011 | ||||||||||||||||||
|---|---|---|---|---|---|---|---|---|---|---|---|---|---|---|---|---|---|---|---|
| | Total Loans | Non-Covered Loans | Covered Loans(1) | ||||||||||||||||
Loan Segment | Amount | % of Total | Amount | % of Total | Amount | % of Total | |||||||||||||
| | (Dollars in thousands) | ||||||||||||||||||
Real estate mortgage | $ | 2,718,822 | 75 | % | $ | 1,982,464 | 70 | % | $ | 736,358 | 91 | % | |||||||
Real estate construction | 159,977 | 4 | % | 113,059 | 4 | % | 46,918 | 6 | % | ||||||||||
Commercial | 697,549 | 19 | % | 671,939 | 24 | % | 25,610 | 3 | % | ||||||||||
Consumer | 24,446 | 1 | % | 23,711 | 1 | % | 735 | — | |||||||||||
Foreign | 20,932 | 1 | % | 20,932 | 1 | % | — | — | |||||||||||
Total gross loans | $ | 3,621,726 | 100 | % | $ | 2,812,105 | 100 | % | $ | 809,621 | 100 | % | |||||||
| | December 31, 2010 | ||||||||||||||||||
|---|---|---|---|---|---|---|---|---|---|---|---|---|---|---|---|---|---|---|---|
| | Total Loans | Non-Covered Loans | Covered Loans(1) | ||||||||||||||||
Loan Segment | Amount | % of Total | Amount | % of Total | Amount | % of Total | |||||||||||||
| | (Dollars in thousands) | ||||||||||||||||||
Real estate mortgage | $ | 3,194,031 | 76 | % | $ | 2,274,733 | 72 | % | $ | 919,298 | 87 | % | |||||||
Real estate construction | 271,219 | 6 | % | 179,479 | 5 | % | 91,740 | 9 | % | ||||||||||
Commercial | 704,313 | 17 | % | 663,557 | 21 | % | 40,756 | 4 | % | ||||||||||
Consumer | 26,005 | 1 | % | 25,058 | 1 | % | 947 | — | |||||||||||
Foreign | 22,608 | — | 22,608 | 1 | % | — | — | ||||||||||||
Total gross loans | $ | 4,218,176 | 100 | % | $ | 3,165,435 | 100 | % | $ | 1,052,741 | 100 | % | |||||||
The following table presents our total real estate mortgage loan portfolio, showing the non-covered and covered components, as of December 31, 2011:
| | December 31, 2011 | ||||||||||||||||||
|---|---|---|---|---|---|---|---|---|---|---|---|---|---|---|---|---|---|---|---|
| | Total Loans | Non-Covered Loans | Covered Loans(1) | ||||||||||||||||
Loan Category | Amount | % of Total | Amount | % of Total | Amount | % of Total | |||||||||||||
| | (Dollars in thousands) | ||||||||||||||||||
Commercial real estate mortgage: | |||||||||||||||||||
Industrial/warehouse | $ | 401,249 | 14.8 | % | $ | 367,494 | 18.5 | % | $ | 33,755 | 4.6 | % | |||||||
Retail | 401,166 | 14.8 | % | 286,691 | 14.5 | % | 114,475 | 15.5 | % | ||||||||||
Office buildings | 367,841 | 13.5 | % | 290,074 | 14.6 | % | 77,767 | 10.6 | % | ||||||||||
Owner-occupied | 251,144 | 9.2 | % | 226,307 | 11.4 | % | 24,837 | 3.4 | % | ||||||||||
Hotel | 147,346 | 5.4 | % | 144,402 | 7.3 | % | 2,944 | 0.4 | % | ||||||||||
Healthcare | 148,476 | 5.5 | % | 131,625 | 6.6 | % | 16,851 | 2.3 | % | ||||||||||
Mixed use | 61,672 | 2.3 | % | 53,855 | 2.7 | % | 7,817 | 1.1 | % | ||||||||||
Gas station | 39,716 | 1.5 | % | 33,715 | 1.7 | % | 6,001 | 0.8 | % | ||||||||||
Self storage | 75,941 | 2.8 | % | 23,148 | 1.2 | % | 52,793 | 7.2 | % | ||||||||||
Restaurant | 25,081 | 0.9 | % | 22,549 | 1.1 | % | 2,532 | 0.3 | % | ||||||||||
Land acquisition/development | 14,015 | 0.5 | % | 14,015 | 0.7 | % | — | — | |||||||||||
Unimproved land | 3,121 | 0.1 | % | 1,369 | 0.1 | % | 1,752 | 0.2 | % | ||||||||||
Other | 223,039 | 8.2 | % | 206,504 | 10.4 | % | 16,535 | 2.2 | % | ||||||||||
Total commercial real estate mortgage | 2,159,807 | 79.4 | % | 1,801,748 | 90.9 | % | 358,059 | 48.6 | % | ||||||||||
Residential real estate mortgage: | |||||||||||||||||||
Multi-family | 344,499 | 12.7 | % | 93,866 | 4.7 | % | 250,633 | 34.0 | % | ||||||||||
Single family owner-occupied | 127,457 | 4.7 | % | 32,209 | 1.6 | % | 95,248 | 12.9 | % | ||||||||||
Single family nonowner-occupied | 44,965 | 1.7 | % | 19,341 | 1.0 | % | 25,624 | 3.5 | % | ||||||||||
Home equity lines of credit | 42,094 | 1.5 | % | 35,300 | 1.8 | % | 6,794 | 0.9 | % | ||||||||||
Total residential real estate | |||||||||||||||||||
mortgage | 559,015 | 20.6 | % | 180,716 | 9.1 | % | 378,299 | 51.4 | % | ||||||||||
Total gross real estate mortgage loans | $ | 2,718,822 | 100.0 | % | $ | 1,982,464 | 100.0 | % | $ | 736,358 | 100.0 | % | |||||||
Non-Covered Loans
The following table presents the balance of each major category of non-covered loans as of the dates indicated:
| | December 31, | ||||||||||||||||||||||||||||||
|---|---|---|---|---|---|---|---|---|---|---|---|---|---|---|---|---|---|---|---|---|---|---|---|---|---|---|---|---|---|---|---|
| | 2011 | 2010 | 2009 | 2008 | 2007 | ||||||||||||||||||||||||||
Loan Segment | Amount | % of Total | Amount | % of Total | Amount | % of Total | Amount | % of Total | Amount | % of Total | |||||||||||||||||||||
| | (Dollars in thousands) | ||||||||||||||||||||||||||||||
Real estate mortgage | $ | 1,982,464 | 70 | % | $ | 2,274,733 | 72 | % | $ | 2,423,712 | 65 | % | $ | 2,473,089 | 62 | % | $ | 2,280,963 | 58 | % | |||||||||||
Real estate construction | 113,059 | 4 | % | 179,479 | 5 | % | 440,286 | 12 | % | 579,884 | 15 | % | 717,419 | 18 | % | ||||||||||||||||
Commercial | 671,939 | 24 | % | 663,557 | 21 | % | 781,003 | 21 | % | 845,410 | 21 | % | 852,279 | 22 | % | ||||||||||||||||
Consumer | 23,711 | 1 | % | 25,058 | 1 | % | 32,138 | 1 | % | 44,938 | 1 | % | 49,943 | 1 | % | ||||||||||||||||
Foreign(2): | |||||||||||||||||||||||||||||||
Commercial | 19,531 | 1 | % | 21,057 | 1 | % | 34,524 | 1 | % | 50,918 | 1 | % | 56,916 | 1 | % | ||||||||||||||||
Other | 1,401 | — | 1,551 | — | 1,719 | — | 2,245 | — | 1,206 | — | |||||||||||||||||||||
Total gross non-covered loans | 2,812,105 | 100 | % | 3,165,435 | 100 | % | 3,713,382 | 100 | % | 3,996,484 | 100 | % | 3,958,726 | 100 | % | ||||||||||||||||
Less: unearned income | (4,392 | ) | (4,380 | ) | (5,999 | ) | (8,593 | ) | (9,508 | ) | |||||||||||||||||||||
Loans, net of unearned income | 2,807,713 | 3,161,055 | 3,707,383 | 3,987,891 | 3,949,218 | ||||||||||||||||||||||||||
Less: allowance for loan losses | (85,313 | ) | (98,653 | ) | (118,717 | ) | (63,519 | ) | (52,557 | ) | |||||||||||||||||||||
Total net non-covered loans | $ | 2,722,400 | $ | 3,062,402 | $ | 3,588,666 | $ | 3,924,372 | $ | 3,896,661 | |||||||||||||||||||||
Loans held for sale(1) | $ | — | $ | — | $ | — | $ | — | $ | 63,565 | |||||||||||||||||||||
| | December 31, | |||||||||||||||||||||||||||||||
|---|---|---|---|---|---|---|---|---|---|---|---|---|---|---|---|---|---|---|---|---|---|---|---|---|---|---|---|---|---|---|---|---|
| | 2010 | 2009 | 2008 | 2007 | 2006 | |||||||||||||||||||||||||||
Loan Category | Amount | % of Loans | Amount | % of Loans | Amount | % of Loans | Amount | % of Loans | Amount | % of Loans | ||||||||||||||||||||||
| | (Dollars in thousands) | |||||||||||||||||||||||||||||||
Domestic: | ||||||||||||||||||||||||||||||||
Real estate mortgage | $ | 2,274,733 | 72 | % | $ | 2,423,712 | 65 | % | $ | 2,473,089 | 62 | % | $ | 2,280,963 | 58 | % | $ | 2,374,010 | 57 | % | ||||||||||||
Commercial | 663,557 | 21 | % | 781,003 | 21 | % | 845,410 | 21 | % | 852,279 | 22 | % | 752,817 | 18 | % | |||||||||||||||||
Real estate construction | 179,479 | 5 | % | 440,286 | 12 | % | 579,884 | 15 | % | 717,419 | 18 | % | 939,463 | 22 | % | |||||||||||||||||
Consumer | 25,058 | 1 | % | 32,138 | 1 | % | 44,938 | 1 | % | 49,943 | 1 | % | 45,984 | 1 | % | |||||||||||||||||
Foreign: | ||||||||||||||||||||||||||||||||
Commercial | 21,057 | 1 | % | 34,524 | 1 | % | 50,918 | 1 | % | 56,916 | 1 | % | 83,359 | 2 | % | |||||||||||||||||
Other | 1,551 | — | 1,719 | — | 2,245 | — | 1,206 | — | 6,778 | — | ||||||||||||||||||||||
Total gross non-covered loans | 3,165,435 | 100 | % | 3,713,382 | 100 | % | 3,996,484 | 100 | % | 3,958,726 | 100 | % | 4,202,411 | 100 | % | |||||||||||||||||
Less: unearned income | (4,380 | ) | (5,999 | ) | (8,593 | ) | (9,508 | ) | (12,868 | ) | ||||||||||||||||||||||
Loans, net of unearned income | 3,161,055 | 3,707,383 | 3,987,891 | 3,949,218 | 4,189,543 | |||||||||||||||||||||||||||
Less: allowance for loan losses | (98,653 | ) | (118,717 | ) | (63,519 | ) | (52,557 | ) | (52,908 | ) | ||||||||||||||||||||||
Total net non-covered loans | $ | 3,062,402 | $ | 3,588,666 | $ | 3,924,372 | $ | 3,896,661 | $ | 4,136,635 | ||||||||||||||||||||||
Loans held for sale(1) | $ | — | $ | — | $ | — | $ | 63,565 | $ | 173,319 | ||||||||||||||||||||||
During 2011, gross non-covered loans declined $353.3 million due to repayments and resolution activities. The Bank continues to selectively generate loans and renew maturing loans that meet our credit quality and pricing standards and which will contribute positively to profitability and net interest margin.
During 2010, our gross non-covered loans declined $547.9 million due primarily to $398.5 million in non-covered classified loans sold during the year. The decline was offset partially by the $234.1 million purchase of performing loans in July 2010.
The strategic decision to sell the non-covered portfolio continuesclassified loans was made specifically to decline as a resultreduce credit risk in order to strengthen the Bank's balance sheet and to be able to continue to participate in bidding on FDIC-assisted acquisitions. Such sales resulted in immediate reductions of repayments, foreclosures, charge-offs and the stagnant economy which causes both a low demand fornon-covered classified loans and fewer acceptable lending opportunities. Real estate constructionimproved credit quality metrics as the loans declined $260.8sold included $128.1 million real estate mortgagein nonaccrual loans declined $149.0and $148.8 million in performing restructured loans. The loans were sold for cash of $254.6 million and commercial loans declined $130.9 million. We continuedwere completed on a servicing-released basis and without recourse to reduce our exposure to real estate construction. The real estate construction category at December 31, 2010 includes commercial real estate construction loans totaling $107.1 million compared to $265.6 million at the end of 2009 and residential real estate construction loans totaling $72.4 million at the end of 2010 compared to $174.7 million at December 31, 2009.
Our non-covered foreign loans totaled $22.6 million at December 31, 2010 and were primarily to individuals and entities located in Mexico.Pacific Western Bank. All of the loans sold were originated by Pacific Western Bank and none were covered loans acquired in our non-covered foreignFDIC-assisted acquisitions. These sales resulted in a charge-off to the allowance for credit losses of $143.9 million, of which $58.2 million had been previously allocated to the loans are denominated in U.S. dollarssold through our allowance methodology and $85.7 million represented the majority is collateralized by assets located inmarket discount necessary for the United States or guaranteed or insured by businesses located inloans to be sold to the United States. In additionbuyer. The decisions to our outstanding non-covered foreignenter into these transactions were made shortly before the sale dates and after the immediately preceding reporting periods. Therefore, the loans our non-covered foreign loan commitments totaled $17.2 million at December 31, 2010. We continuedwere not accounted for as being held for sale prior to allow our non-covered foreign loan portfolio to repay in the ordinary course of business without making any new privately-insured non-covered foreign loans other than those under existing commitments.transaction.
The following table presents the details of the non-covered real estate construction category, which includes loans secured by commercial and residential real estate, as of the dates indicated:
| | | December 31, | December 31, | |||||||||||||||||||||||||
|---|---|---|---|---|---|---|---|---|---|---|---|---|---|---|---|---|---|---|---|---|---|---|---|---|---|---|---|---|
| | | 2010 | 2009 | 2011 | 2010 | |||||||||||||||||||||||
Loan Category | Loan Category | Balance | % of Total | Balance | % of Total | Amount | % of Total | Amount | % of Total | |||||||||||||||||||
| | | (Dollars in thousands) | (Dollars in thousands) | |||||||||||||||||||||||||
Commercial real estate construction: | Commercial real estate construction: | |||||||||||||||||||||||||||
Unimproved land | $ | 27,434 | 24.3 | % | $ | 32,740 | 18.2 | % | ||||||||||||||||||||
Retail | 19,468 | 17.2 | % | 21,020 | 11.7 | % | ||||||||||||||||||||||
Industrial/warehouse | 18,786 | 16.6 | % | 11,329 | 6.3 | % | ||||||||||||||||||||||
Self storage | 13,037 | 11.5 | % | 13,191 | 7.3 | % | ||||||||||||||||||||||
Office buildings | 5,223 | 4.6 | % | 3,805 | 2.1 | % | ||||||||||||||||||||||
Land acquisition/development | 3,211 | 2.8 | % | 16,983 | 9.5 | % | ||||||||||||||||||||||
Owner-occupied | 476 | 0.4 | % | 2,000 | 1.1 | % | ||||||||||||||||||||||
Healthcare | — | — | 4,305 | 2.4 | % | |||||||||||||||||||||||
Other | 7,755 | 6.9 | % | 9,063 | 5.0 | % | ||||||||||||||||||||||
Unimproved land | $ | 26,032 | 14.5 | % | $ | 39,377 | 8.9 | % | ||||||||||||||||||||
Retail | 20,378 | 11.4 | % | 46,742 | 10.6 | % | ||||||||||||||||||||||
Land acquisition/development | 16,983 | 9.5 | % | 16,652 | 3.8 | % | ||||||||||||||||||||||
Self storage | 13,191 | 7.3 | % | 17,569 | 4.0 | % | ||||||||||||||||||||||
Industrial/warehouse | 11,329 | 6.3 | % | 57,714 | 13.1 | % | ||||||||||||||||||||||
Healthcare | 4,305 | 2.4 | % | 9,773 | 2.2 | % | ||||||||||||||||||||||
Office buildings | 3,805 | 2.1 | % | 37,300 | 8.5 | % | ||||||||||||||||||||||
Owner-occupied | 2,000 | 1.1 | % | 3,082 | 0.7 | % | ||||||||||||||||||||||
Other | 9,062 | 5.0 | % | 24,454 | 5.6 | % | ||||||||||||||||||||||
Gas station | — | 0.0 | % | 12,939 | 2.9 | % | ||||||||||||||||||||||
Total commercial real estate construction | 107,085 | 59.7 | % | 265,602 | 60.3 | % | ||||||||||||||||||||||
Total commercial real estate construction | 95,390 | 84.4 | % | 114,436 | 63.8 | % | ||||||||||||||||||||||
Residential real estate construction: | Residential real estate construction: | |||||||||||||||||||||||||||
Unimproved land | 11,097 | 9.8 | % | 36,704 | 20.5 | % | ||||||||||||||||||||||
Multi-family | 2,993 | 2.6 | % | 25,831 | 14.4 | % | ||||||||||||||||||||||
Land acquisition/development | 2,262 | 2.0 | % | 1,482 | 0.8 | % | ||||||||||||||||||||||
Single family nonowner-occupied | 427 | 0.4 | % | 1,026 | 0.6 | % | ||||||||||||||||||||||
Single family owner-occupied | 890 | 0.8 | % | — | — | |||||||||||||||||||||||
Unimproved land | 43,412 | 24.2 | % | 58,949 | 13.4 | % | ||||||||||||||||||||||
Total residential real estate construction | 17,669 | 15.6 | % | 65,043 | 36.2 | % | ||||||||||||||||||||||
Multi-family | 26,474 | 14.8 | % | 38,826 | 8.8 | % | ||||||||||||||||||||||
Total gross non-covered real estate construction loans | $ | 113,059 | 100.0 | % | $ | 179,479 | 100.0 | % | ||||||||||||||||||||
Land acquisition/development | 1,482 | 0.8 | % | 33,501 | 7.6 | % | ||||||||||||||||||||||
Single family nonowner-occupied | 1,026 | 0.6 | % | 32,209 | 7.3 | % | ||||||||||||||||||||||
Single family owner-occupied | — | 0.0 | % | 11,199 | 2.5 | % | ||||||||||||||||||||||
Total residential real estate construction | 72,394 | 40.3 | % | 174,684 | 39.7 | % | ||||||||||||||||||||||
Total gross non-covered real estate construction loans | $ | 179,479 | 100.0 | % | $ | 440,286 | 100.0 | % | ||||||||||||||||||||
Our largest loan portfolio concentration is the non-covered real estate mortgage category, which includes loans secured by commercial and residential real estate. The following table presents our non-covered real estate mortgage loan portfolio, excluding foreign loans, as of the dates indicated:
| | | December 31, | December 31, | |||||||||||||||||||||||||
|---|---|---|---|---|---|---|---|---|---|---|---|---|---|---|---|---|---|---|---|---|---|---|---|---|---|---|---|---|
| | | 2010 | 2009 | 2011 | 2010 | |||||||||||||||||||||||
Loan Category | Loan Category | Balance | % of Total | Balance | % of Total | Amount | % of Total | Amount | % of Total | |||||||||||||||||||
| | | (Dollars in thousands) | (Dollars in thousands) | |||||||||||||||||||||||||
Commercial real estate mortgage: | Commercial real estate mortgage: | |||||||||||||||||||||||||||
Industrial/warehouse | $ | 367,494 | 18.5 | % | $ | 432,263 | 19.0 | % | ||||||||||||||||||||
Retail | 286,691 | 14.5 | % | 374,027 | 16.4 | % | ||||||||||||||||||||||
Office buildings | 290,074 | 14.6 | % | 350,192 | 15.4 | % | ||||||||||||||||||||||
Owner-occupied | 226,307 | 11.4 | % | 263,603 | 11.6 | % | ||||||||||||||||||||||
Hotel | 144,402 | 7.3 | % | 156,652 | 6.9 | % | ||||||||||||||||||||||
Healthcare | 131,625 | 6.6 | % | 102,227 | 4.5 | % | ||||||||||||||||||||||
Mixed use | 53,855 | 2.7 | % | 57,230 | 2.5 | % | ||||||||||||||||||||||
Gas station | 33,715 | 1.7 | % | 38,502 | 1.7 | % | ||||||||||||||||||||||
Self storage | 23,148 | 1.2 | % | 26,432 | 1.2 | % | ||||||||||||||||||||||
Restaurant | 22,549 | 1.1 | % | 26,463 | 1.2 | % | ||||||||||||||||||||||
Land acquisition/development | 14,015 | 0.7 | % | 9,649 | 0.4 | % | ||||||||||||||||||||||
Unimproved land | 1,369 | 0.1 | % | 1,494 | 0.1 | % | ||||||||||||||||||||||
Other | 206,504 | 10.4 | % | 250,030 | 11.0 | % | ||||||||||||||||||||||
Industrial/warehouse | $ | 432,263 | 19.0 | % | $ | 328,709 | 13.6 | % | ||||||||||||||||||||
Retail | 374,027 | 16.4 | % | 434,902 | 17.9 | % | ||||||||||||||||||||||
Office buildings | 350,192 | 15.4 | % | 319,912 | 13.2 | % | ||||||||||||||||||||||
Owner-occupied | 263,603 | 11.6 | % | 291,198 | 12.0 | % | ||||||||||||||||||||||
Hotel | 156,614 | 6.9 | % | 262,556 | 10.8 | % | ||||||||||||||||||||||
Healthcare | 102,227 | 4.5 | % | 91,740 | 3.8 | % | ||||||||||||||||||||||
Gas station | 38,502 | 1.7 | % | 39,260 | 1.6 | % | ||||||||||||||||||||||
Self storage | 26,432 | 1.2 | % | 30,038 | 1.2 | % | ||||||||||||||||||||||
Restaurant | 26,463 | 1.2 | % | 26,723 | 1.1 | % | ||||||||||||||||||||||
Land acquisition/development | 9,649 | 0.4 | % | 9,819 | 0.4 | % | ||||||||||||||||||||||
Unimproved land | 1,494 | 0.1 | % | 5,485 | 0.2 | % | ||||||||||||||||||||||
Other | 250,068 | 11.0 | % | 268,269 | 11.1 | % | ||||||||||||||||||||||
Total commercial real estate mortgage | 2,031,534 | 89.3 | % | 2,108,611 | 87.0 | % | ||||||||||||||||||||||
Total commercial real estate mortgage | 1,801,748 | 90.9 | % | 2,088,764 | 91.8 | % | ||||||||||||||||||||||
Residential real estate mortgage: | Residential real estate mortgage: | |||||||||||||||||||||||||||
Multi-family | 93,866 | 4.7 | % | 81,880 | 3.6 | % | ||||||||||||||||||||||
Single family owner-occupied | 32,209 | 1.6 | % | 38,025 | 1.7 | % | ||||||||||||||||||||||
Single family nonowner-occupied | 19,341 | 1.0 | % | 26,618 | 1.2 | % | ||||||||||||||||||||||
Home equity lines of credit | 35,300 | 1.8 | % | 38,823 | 1.7 | % | ||||||||||||||||||||||
Unimproved land | — | — | 623 | — | ||||||||||||||||||||||||
Multi-family | 81,880 | 3.6 | % | 98,137 | 4.0 | % | ||||||||||||||||||||||
Total residential real estate mortgage | 180,716 | 9.1 | % | 185,969 | 8.2 | % | ||||||||||||||||||||||
Mixed use | 57,230 | 2.5 | % | 90,119 | 3.7 | % | ||||||||||||||||||||||
Total gross non-covered real estate mortgage loans | $ | 1,982,464 | 100.0 | % | $ | 2,274,733 | 100.0 | % | ||||||||||||||||||||
Single family owner-occupied | 38,025 | 1.7 | % | 53,521 | 2.2 | % | ||||||||||||||||||||||
Single family nonowner-occupied | 26,618 | 1.2 | % | 35,586 | 1.5 | % | ||||||||||||||||||||||
Home equity lines of credit | 38,823 | 1.7 | % | 37,738 | 1.6 | % | ||||||||||||||||||||||
Unimproved land | 623 | 0.0 | % | — | 0.0 | % | ||||||||||||||||||||||
Total residential real estate mortgage | 243,199 | 10.7 | % | 315,101 | 13.0 | % | ||||||||||||||||||||||
Total gross non-covered real estate mortgage loans | $ | 2,274,733 | 100.0 | % | $ | 2,423,712 | 100.0 | % | ||||||||||||||||||||
The largest subset of the "Other" commercial real estate mortgage category is for fixed base operators at airports with a balance of $38.4$40.2 million, or 15.4%19.5%, of the total.
Non-Covered Classified Loan Sales
During 2010, we made strategic decisions to sell $398.5 million of non-covered classified loans to reduce credit risk, thereby strengthening the Bank's balance sheet and enhancing its ability to continue to participate in bidding on FDIC-assisted acquisitions. Such sales resulted in immediate reductions of classified loans and improved credit quality metrics. The improvement in credit quality metrics for the non-covered portfolio is shown in the following table:
| | December 31, 2010 | September 30, 2010 | June 30, 2010 | March 31, 2010 | December 31, 2009 | |||||||||||
|---|---|---|---|---|---|---|---|---|---|---|---|---|---|---|---|---|
| | (Dollars in thousands) | |||||||||||||||
Nonaccrual loans | $ | 94,183 | $ | 105,539 | $ | 108,283 | $ | 99,920 | $ | 240,167 | ||||||
New nonaccrual loans in the quarter | $ | 21,413 | (1) | $ | 26,543 | $ | 25,136 | $ | 18,096 | $ | 120,446 | |||||
Nonperforming assets | $ | 119,781 | $ | 130,137 | $ | 132,806 | $ | 129,563 | $ | 283,422 | ||||||
Performing restructured loans | $ | 89,272 | $ | 143,407 | $ | 76,367 | $ | 51,896 | $ | 181,454 | ||||||
Allowance for credit losses to | 110.8 | % | 95.9 | % | 86.3 | % | 91.5 | % | 51.8 | % | ||||||
Allowance for credit losses to | 3.30 | % | 3.05 | % | 2.93 | % | 2.81 | % | 3.35 | % | ||||||
In December 2010, we sold non-covered classified loans totaling $74.9 million for $54.0 million in cash. Such sale resulted in a charge-off to the allowance for credit losses of $20.9 million, of which $6.6 million had been previously allocated to the loans sold through our allowance methodology and $14.3 million represented the market discount necessary for the loans to be sold to the buyer. The sale was on a servicing-released basis and without recourse to Pacific Western Bank. All loans sold were originated by Pacific Western Bank and none were covered loans acquired in the Los Padres Bank or Affinity Bank acquisitions. The loans sold included $17.6 million in nonaccrual loans and $43.7 million in performing restructured loans as of September 30, 2010.
In February 2010, the Bank sold non-covered classified loans totaling $323.6 million to an institutional buyer for $200.6 million in cash. Such sale resulted in a charge-off to the allowance for credit losses of $123.0 million, of which $51.6 million had been previously allocated to the loans sold through our allowance methodology and $71.4 million represented the market discount necessary for the loans to be sold to the buyer. The sale was on a servicing-released basis and without recourse to Pacific Western Bank. All loans sold were originated by Pacific Western Bank and none were acquired in the Affinity Bank acquisition. The loans sold included $110.5 million in nonaccrual loans and $105.1 million in restructured loans.
The decisions to enter into these transactions were made shortly before the sale dates and after the immediately preceding reporting periods. Therefore, the loans were not accounted for as being held for sale prior to the transaction.
July 2010 Loan Portfolio Purchase
On July 1, 2010, we purchased a $234.1 million portfolio of 225 performing loans secured by Southern California real estate for a cash price of $228.3 million. Such loans had a weighted average coupon interest rate of 6.15% and a weighted average maturity of 4.6 years. These loans were part of the Foothill Independent Bank loan portfolio that we acquired when we completed the Foothill Independent Bancorp acquisition in May 2006. In March 2007, we sold a 95% participating interest in these loans for cash and continued to service them and maintain the borrower relationships. When the opportunity to purchase this loan portfolio presented itself, we concluded it would be in the best interests of the Company and the Bank to make this purchase as we are familiar with the credit risk and it would deploy excess liquidity in a manner that would increase interest income and expand the net interest margin.
Covered Loans
Los Padres Bank Acquisition
On August 20, 2010, we acquired certain assets of Los Padres Bank, including all loans, and assumed substantially all of its liabilities, including all deposits, from the FDIC in an FDIC-assisted acquisition, which we refer to as the Los Padres acquisition. We entered into a loss sharing agreement with the FDIC, whereby the FDIC agreed to cover a substantial portion of any future losses on acquired loans, with the exception of consumer loans, and other real estate owned. Under the terms of such loss sharing agreement, the FDIC is obligated to reimburse the Bank for 80% of losses with respect to the covered assets. The Bank will reimburse the FDIC for 80% of recoveries with respect to losses for which the FDIC paid the Bank 80% reimbursement under the loss sharing agreement. The loss sharing arrangementprovisions for single family covered assets and commercial (non-single family) covered assets isare in effect for 10 years and 5 years, respectively, from the acquisition date, and the loss recovery provisions are in effect for 10 years and 8 years, respectively, from the acquisition date. We refer to the loans acquired in the Los Padres acquisition and subject to the loss sharing agreement as "covered loans." We refer to the acquired assets subject to the loss sharing agreement collectively as "covered assets."
Affinity Bank Acquisition
On August 28, 2009, Pacific Western Bank acquired certain assets and liabilities of Affinity Bank from the FDIC in an FDIC-assisted transaction. We entered into a loss sharing agreement with the FDIC, whereby the FDIC agreed to cover a substantial portion of any future losses on acquired loans, other real estate owned and certain investment securities. Under the terms of such loss sharing agreement, the FDIC will absorb 80% of losses and receive 80% of loss recoveries on the first $234 million of losses on covered assets and absorb 95% of losses and receive 95% of loss recoveries on covered assets exceeding $234 million. The loss sharing agreement isprovisions are in effect for 5 years for commercial assets (non-residential loans, OREO and certain securities) and 10 years for residential loans from the August 28, 2009 acquisition date. The loss recovery provisions are in effect for 8 years for commercial assets and 10 years for residential loans from the acquisition date.
We refer to the loans acquired in the Los Padres and Affinity acquisitionacquisitions and subject to the loss sharing agreementagreements as "covered loans".loans." We refer to the acquired assets subject to the loss sharing agreementagreements collectively as "covered assets."
At the acquisition dates, we estimated the fair values of the Los Padres and Affinity covered loans to be $436.3 million and $675.6 million, respectively. Fair value of acquired loans is determined using a discounted cash flow model based on assumptions about the amount and timing of principal and interest payments, estimated prepayments, estimated default rates, estimated loss severity in the event
of defaults, and current market rates. Estimated credit losses are included in the determination of fair value; therefore, an allowance for loan losses is not recorded on the acquisition date.
The following table reflects the net carrying valuevalues of the covered loans as of the dates indicated:
| | December 31, | |||||||
|---|---|---|---|---|---|---|---|---|
Loan Category | 2010 | 2009 | ||||||
| | (In thousands) | |||||||
Multi-family | $ | 417,277 | $ | 263,944 | ||||
Commercial real estate | 342,642 | 311,298 | ||||||
Single family | 151,874 | 17,078 | ||||||
Construction and land | 91,740 | 121,735 | ||||||
Commercial and industrial | 40,013 | 21,340 | ||||||
Home equity lines of credit | 8,248 | 6,565 | ||||||
Consumer | 947 | 575 | ||||||
Total gross covered loans | 1,052,741 | 742,535 | ||||||
Less: discount | (110,901 | ) | (102,849 | ) | ||||
Covered loans, net of discount | 941,840 | 639,686 | ||||||
Less: allowance for loan losses | (33,264 | ) | (18,000 | ) | ||||
Covered loans, net | $ | 908,576 | $ | 621,686 | ||||
| | December 31, | ||||||||||||
|---|---|---|---|---|---|---|---|---|---|---|---|---|---|
| | 2011 | 2010 | |||||||||||
| | Amount | % of Total | Amount | % of Total | |||||||||
| | (Dollars in thousands) | ||||||||||||
Real estate mortgage: | |||||||||||||
Hospitality | $ | 2,944 | — | $ | 2,998 | — | |||||||
Other | 733,414 | 91 | % | 916,300 | 87 | % | |||||||
Total real estate mortgage | 736,358 | 91 | % | 919,298 | 87 | % | |||||||
Real estate construction: | |||||||||||||
Residential | 21,521 | 3 | % | 44,637 | 4 | % | |||||||
Commercial | 25,397 | 3 | % | 47,103 | 5 | % | |||||||
Total real estate construction | 46,918 | 6 | % | 91,740 | 9 | % | |||||||
Commercial: | |||||||||||||
Collateralized | 24,808 | 3 | % | 37,973 | 4 | % | |||||||
Unsecured | 802 | — | 1,202 | — | |||||||||
Asset-based | — | — | 1,581 | — | |||||||||
Total commercial | 25,610 | 3 | % | 40,756 | 4 | % | |||||||
Consumer | 735 | — | 947 | — | |||||||||
Total gross covered loans | 809,621 | 100 | % | 1,052,741 | 100 | % | |||||||
Discount | (75,323 | ) | (110,901 | ) | |||||||||
Allowance for loan losses | (31,275 | ) | (33,264 | ) | |||||||||
Covered loans, net | $ | 703,023 | $ | 908,576 | |||||||||
The following table presents our gross covered real estate mortgage loan portfolio as of December 31, 2011 (the information in this format as of December 31, 2010 is not available):
| | December 31, 2011 | ||||||
|---|---|---|---|---|---|---|---|
Loan Category | Amount | % of Total | |||||
| | (Dollars in thousands) | ||||||
Commercial real estate mortgage: | |||||||
Industrial/warehouse | $ | 33,755 | 4.6 | % | |||
Retail | 114,475 | 15.5 | % | ||||
Office buildings | 77,767 | 10.6 | % | ||||
Owner-occupied | 24,837 | 3.4 | % | ||||
Hotel | 2,944 | 0.4 | % | ||||
Healthcare | 16,851 | 2.3 | % | ||||
Mixed use | 7,817 | 1.1 | % | ||||
Gas station | 6,001 | 0.8 | % | ||||
Self storage | 52,793 | 7.2 | % | ||||
Restaurant | 2,532 | 0.3 | % | ||||
Unimproved land | 1,752 | 0.2 | % | ||||
Other | 16,535 | 2.2 | % | ||||
Total commercial real estate mortgage | 358,059 | 48.6 | % | ||||
Residential real estate mortgage: | |||||||
Multi-family | 250,633 | 34.0 | % | ||||
Single family owner-occupied | 95,248 | 12.9 | % | ||||
Single family nonowner-occupied | 25,624 | 3.5 | % | ||||
Home equity lines of credit | 6,794 | 0.9 | % | ||||
Total residential real estate mortgage | 378,299 | 51.4 | % | ||||
Total gross covered real estate mortgage loans | $ | 736,358 | 100.0 | % | |||
We account for loans under ASC Subtopic 310-30, "Loans and Debt Securities Acquired with Deteriorated Credit QualityQuality" ("acquired impaired loan accounting") when (i) we acquire loans deemed to be impaired when there is evidence of credit deterioration since the origination and it is probable at the date of acquisition that we would be unable to collect all contractually required payments and (ii) as a general policy election for non-impaired loans that we acquire in a distressed bank acquisition. We may refer to acquired loans accounted for under ASC 310-30 as "acquired impaired loans." In connection with the Affinity acquisition, we applied acquired impaired loan accounting to all of the covered loans. In connection with the Los Padres acquisition, we applied acquired impaired loan accounting to $405.6 millionall of the covered loans. We also acquired inloans except the Los Padres acquisition $31.5 million of revolving credit agreements, mainly home equity loans and commercial asset-based lines of credit, where the borrower had revolving privileges; we accounted for such loans in accordance with accounting requirements for purchased non-impaired loans. GAAP excludes revolving credit agreements, such as home equity lines and credit card loans, from acquired impaired loan accounting requirements.
For acquired impaired loans, we (i) calculated the contractual amount and timing of undiscounted principal and interest payments (the "undiscounted contractual cash flows") and (ii) estimated the amount and timing of undiscounted expected principal and interest payments (the "undiscounted expected cash flows"). Under acquired impaired loan accounting, the difference between the undiscounted contractual cash flows and the undiscounted expected cash flows is the nonaccretable difference. The nonaccretable difference represents an estimate of the loss exposure of principal and interest related to the covered acquired impaired loans portfolio andloan portfolios; such amount is subject to change over time based on the performance of such covered loans. The carrying value of covered acquired impaired
loans is reduced by payments received, both principal and interest, and increased by the portion of the accretable yield recognized as interest income.
The excess of undiscounted expected cash flows at acquisition over the initial fair value of acquired impaired loans is referred to as the "accretable yield" and is recorded as interest income over the estimated life of the loans using the effective yield method if the timing and amount of the future cash flows is reasonably estimable. The accretable yield changes over time due to both accretion and as actual and expected cash flows vary from the acquisition date estimated cash flows. The accretable yield is measured at each financial reporting date and represents the difference between the remaining undiscounted expected cash flows and the current carrying value of the loans. The remaining
undiscounted expected cash flows are calculated at each financial reporting date based on information then currently available. Subsequent to acquisition, the Company aggregates loans into pools of loans with common credit risk characteristics such as loan type and risk rating. Increases in expected cash flows over those previously estimated increase the accretable yield and are recognized as interest income prospectively. Decreases in the amount and changes in the timing of expected cash flows compared to those previously estimated decrease the accretable yield and usually result in a provision for loan losses and the establishment of an allowance for loan losses.
Under acquired impaired loan accounting, purchased loans are generally considered accruing and performing loans as the loans accrete interest income over the estimated life of the loan when expected cash flows are reasonably estimable. Accordingly, acquired impaired loans that are contractually past due are still considered to be accruing and performing loans as long as there is an expectation that the estimated cash flows will be received. If the timing and amount of cash flows is not reasonably estimable, the loans may be classified as nonaccrual loans and interest income may be recognized on a cash basis or as a reduction of the principal amount outstanding.
The following table summarizes the changes in the carrying amount of covered acquired impaired loans and accretable yield on those loans for the periods indicated:
| | | Covered Acquired Impaired Loans | Covered Acquired Impaired Loans | ||||||||||||
|---|---|---|---|---|---|---|---|---|---|---|---|---|---|---|---|
| | | Carrying Amount | Accretable Yield | Carrying Amount | Accretable Yield | ||||||||||
| | | (In thousands) | (In thousands) | ||||||||||||
Balance, January 1, 2009 | $ | — | $ | — | |||||||||||
Addition from the Affinity acquisition | 675,616 | (248,174 | ) | ||||||||||||
Accretion | 17,622 | 17,622 | |||||||||||||
Payments received | (53,552 | ) | — | ||||||||||||
Decrease in expected cash flows | — | 4,106 | |||||||||||||
Provision for credit losses | (18,000 | ) | — | ||||||||||||
Balance, December 31, 2008 | $ | — | $ | — | |||||||||||
Addition from the Affinity acquisition | 675,616 | (248,174 | ) | ||||||||||||
Accretion | 17,622 | 17,622 | |||||||||||||
Payments received | (53,552 | ) | — | ||||||||||||
Decrease in expected cash flows, net | — | 4,106 | |||||||||||||
Provision for credit losses | (18,000 | ) | — | ||||||||||||
Balance, December 31, 2009 | Balance, December 31, 2009 | 621,686 | (226,446 | ) | 621,686 | (226,446 | ) | ||||||||
Addition from the Los Padres acquisition | 405,619 | (144,168 | ) | ||||||||||||
Accretion | 52,539 | 52,539 | |||||||||||||
Payments received | (161,312 | ) | — | ||||||||||||
Decrease in expected cash flows | — | 27,410 | |||||||||||||
Provision for credit losses | (39,046 | ) | — | ||||||||||||
Addition from the Los Padres acquisition | 405,619 | (144,168 | ) | ||||||||||||
Accretion | 52,539 | 52,539 | |||||||||||||
Payments received | (166,858 | ) | — | ||||||||||||
Decrease in expected cash flows, net | — | 27,410 | |||||||||||||
Provision for credit losses | (33,500 | ) | — | ||||||||||||
Balance, December 31, 2010 | Balance, December 31, 2010 | $ | 879,486 | $ | (290,665 | ) | 879,486 | (290,665 | ) | ||||||
Accretion | 65,282 | 65,282 | |||||||||||||
Payments received | (254,484 | ) | — | ||||||||||||
Increase in expected cash flows, net | — | (33,882 | ) | ||||||||||||
Provision for credit losses | (13,270 | ) | — | ||||||||||||
Balance, December 31, 2011 | $ | 677,014 | $ | (259,265 | ) | ||||||||||
The table above excludes the purchased non-impaired loans from the Los Padres acquisition, which totaled $26.0 million and $29.1 million at December 31, 2010.
The undiscounted contractual cash flows, undiscounted cash flows expected to be collected,2011 and the estimated fair value of the Los Padres covered acquired impaired loan portfolio as of the acquisition date were $694.5 million, $549.8 million, and $405.6 million,2010, respectively.
At December 31, 2010, the weighted average remaining contractual life of the covered loan portfolio was 9 years.
Loan Interest Rate Sensitivity
The following table presents contractual maturity and repricing information for the indicated covered and non-covered loans at December 31, 2010:2011:
| | Repricing or Maturing In | |||||||||||||
|---|---|---|---|---|---|---|---|---|---|---|---|---|---|---|
Loan Category | One Year Or Less | Over One to Five Years | Over Five Years | Total | ||||||||||
| | (In thousands) | |||||||||||||
Non-covered domestic: | ||||||||||||||
Real estate mortgage | $ | 482,368 | $ | 858,541 | $ | 933,824 | $ | 2,274,733 | ||||||
Commercial | 399,878 | 206,409 | 57,270 | 663,557 | ||||||||||
Real estate construction | 124,653 | 50,521 | 4,305 | 179,479 | ||||||||||
Consumer | 17,437 | 4,327 | 3,294 | 25,058 | ||||||||||
Non-covered foreign | 19,402 | 1,732 | 1,474 | 22,608 | ||||||||||
Total non-covered | 1,043,738 | 1,121,530 | 1,000,167 | 3,165,435 | ||||||||||
Covered | 435,024 | 340,493 | 166,323 | 941,840 | ||||||||||
Total | $ | 1,478,762 | $ | 1,462,023 | $ | 1,166,490 | $ | 4,107,275 | ||||||
| | Repricing or Maturing In | ||||||||||||
|---|---|---|---|---|---|---|---|---|---|---|---|---|---|
Loan Segment | One Year Or Less | Over One to Five Years | Over Five Years | Total | |||||||||
| | (In thousands) | ||||||||||||
Non-covered: | |||||||||||||
Real estate mortgage | $ | 337,446 | $ | 960,492 | $ | 684,526 | $ | 1,982,464 | |||||
Real estate construction | 93,330 | 18,097 | 1,632 | 113,059 | |||||||||
Commercial | 411,683 | 197,671 | 62,585 | 671,939 | |||||||||
Consumer | 17,849 | 3,438 | 2,424 | 23,711 | |||||||||
Foreign | 18,430 | 1,179 | 1,323 | 20,932 | |||||||||
Total non-covered | 878,738 | 1,180,877 | 752,490 | 2,812,105 | |||||||||
Covered | 395,858 | 215,098 | 123,342 | 734,298 | |||||||||
Total | $ | 1,274,596 | $ | 1,395,975 | $ | 875,832 | $ | 3,546,403 | |||||
The following table presents the interest rate profile of covered and non-covered loans due after one year for the indicated non-covered loan categories at December 31, 2010:2011:
| | Due After One Year | ||||||||||
|---|---|---|---|---|---|---|---|---|---|---|---|
Loan Category | Fixed Rate | Floating Rate | Total | ||||||||
| | (In thousands) | ||||||||||
Non-covered domestic: | |||||||||||
Real estate mortgage | $ | 1,273,328 | $ | 519,037 | $ | 1,792,365 | |||||
Commercial | 131,811 | 131,868 | 263,679 | ||||||||
Real estate construction | 15,620 | 39,206 | 54,826 | ||||||||
Consumer | 5,717 | 1,904 | 7,621 | ||||||||
Non-covered foreign | 3,040 | 166 | 3,206 | ||||||||
Total non-covered | 1,429,516 | 692,181 | 2,121,697 | ||||||||
Covered | 210,021 | 296,795 | 506,816 | ||||||||
Total | $ | 1,639,537 | $ | 988,976 | $ | 2,628,513 | |||||
| | Due After One Year | |||||||||
|---|---|---|---|---|---|---|---|---|---|---|
Loan Segment | Fixed Rate | Floating Rate | Total | |||||||
| | (In thousands) | |||||||||
Non-covered: | ||||||||||
Real estate mortgage | $ | 1,107,560 | $ | 537,458 | $ | 1,645,018 | ||||
Real estate construction | 8,882 | 10,847 | 19,729 | |||||||
Commercial | 161,547 | 98,709 | 260,256 | |||||||
Consumer | 4,412 | 1,450 | 5,862 | |||||||
Foreign | 2,199 | 303 | 2,502 | |||||||
Total non-covered | 1,284,600 | 648,767 | 1,933,367 | |||||||
Covered | 163,473 | 174,967 | 338,440 | |||||||
Total | $ | 1,448,073 | $ | 823,734 | $ | 2,271,807 | ||||
Allowance for Credit Losses on Non-Covered Loans
For a discussion of our policy and methodology on the allowance for credit losses on non-covered loans, see "—Critical Accounting Policies—Allowance for Credit Losses on Non-Covered Loans." For further information on the allowance for credit losses on non-covered loans, see Note 6,Loans, of the Notes to Consolidated Financial Statements contained in "Item 8. Financial Statements and Supplementary Data."
The following table presents the balance of our allowance for credit losses and certain credit quality measures as of the dates indicated:
| | December 31, | |||||||||||||||
|---|---|---|---|---|---|---|---|---|---|---|---|---|---|---|---|---|
| | 2011 | 2010 | 2009 | 2008 | 2007 | |||||||||||
| | (Dollars in thousands) | |||||||||||||||
Allowance for loan losses(1) | $ | 85,313 | $ | 98,653 | $ | 118,717 | $ | 63,519 | $ | 52,557 | ||||||
Reserve for unfunded loan commitments(1) | 8,470 | 5,675 | 5,561 | 5,271 | 8,471 | |||||||||||
Allowance for credit losses | $ | 93,783 | $ | 104,328 | $ | 124,278 | $ | 68,790 | $ | 61,028 | ||||||
Allowance for credit losses to non-covered loans, net of unearned income | 3.34 | % | 3.30 | % | 3.35 | % | 1.72 | % | 1.55 | % | ||||||
Allowance for credit losses to non-covered nonaccrual loans | 161.0 | % | 110.8 | % | 51.8 | % | 108.4 | % | 271.6 | % | ||||||
Allowance for credit losses to non-covered nonperforming assets | 87.9 | % | 87.1 | % | 43.9 | % | 65.7 | % | 242.1 | % | ||||||
| | December 31, | ||||||||||||||||
|---|---|---|---|---|---|---|---|---|---|---|---|---|---|---|---|---|---|
| | 2010 | 2009 | 2008 | 2007 | 2006 | ||||||||||||
| | (Dollars in thousands) | ||||||||||||||||
Allowance for loan losses(1) | $ | 98,653 | $ | 118,717 | $ | 63,519 | $ | 52,557 | $ | 52,908 | |||||||
Reserve for unfunded loan commitments(1) | 5,675 | 5,561 | 5,271 | 8,471 | 8,271 | ||||||||||||
Allowance for credit losses | $ | 104,328 | $ | 124,278 | $ | 68,790 | $ | 61,028 | $ | 61,179 | |||||||
Allowance for credit losses to non-covered loans, net of unearned income | 3.30 | % | 3.35 | % | 1.72 | % | 1.55 | % | 1.46 | % | |||||||
Allowance for credit losses to non-covered nonaccrual loans | 110.8 | % | 51.8 | % | 108.4 | % | 271.6 | % | 276.9 | % | |||||||
Allowance for credit losses to non-covered nonperforming assets | 87.10 | % | 43.85 | % | 65.65 | % | 242.10 | % | 276.90 | % | |||||||
The following table presents the changes in our allowance for loan losses for the years indicated:
| | Year Ended December 31, | |||||||||||||||
|---|---|---|---|---|---|---|---|---|---|---|---|---|---|---|---|---|
| | 2011 | 2010 | 2009 | 2008 | 2007 | |||||||||||
| | (Dollars in thousands) | |||||||||||||||
Allowance for loan losses, beginning of year | $ | 98,653 | $ | 118,717 | $ | 63,519 | $ | 52,557 | $ | 52,908 | ||||||
Loans charged off: | ||||||||||||||||
Real estate mortgage | (10,180 | ) | (117,029 | ) | (46,047 | ) | (2,617 | ) | (454 | ) | ||||||
Real estate construction | (6,886 | ) | (63,590 | ) | (28,542 | ) | (24,998 | ) | (660 | ) | ||||||
Commercial | (10,072 | ) | (18,548 | ) | (11,982 | ) | (7,664 | ) | (2,091 | ) | ||||||
Consumer | (1,422 | ) | (3,749 | ) | (1,180 | ) | (3,947 | ) | (166 | ) | ||||||
Foreign | — | (306 | ) | (368 | ) | (349 | ) | (1,414 | ) | |||||||
Total loans charged off(1) | (28,560 | ) | (203,222 | ) | (88,119 | ) | (39,575 | ) | (4,785 | ) | ||||||
Recoveries on loans charged off: | ||||||||||||||||
Real estate mortgage | 513 | 1,222 | 503 | 412 | 163 | |||||||||||
Real estate construction | 1,025 | 708 | 461 | 88 | — | |||||||||||
Commercial | 1,668 | 1,652 | 548 | 971 | 1,591 | |||||||||||
Consumer | 1,394 | 565 | 151 | 47 | 122 | |||||||||||
Foreign | 115 | 133 | 44 | 19 | 73 | |||||||||||
Total recoveries on loans charged off | 4,715 | 4,280 | 1,707 | 1,537 | 1,949 | |||||||||||
Net charge-offs | (23,845 | ) | (198,942 | ) | (86,412 | ) | (38,038 | ) | (2,836 | ) | ||||||
Provision for loan losses | 10,505 | 178,878 | 141,610 | 49,000 | 2,800 | |||||||||||
Reduction for loans sold | — | — | — | — | (2,461 | ) | ||||||||||
Additions due to acquisitions | — | — | — | — | 2,146 | |||||||||||
Allowance for loan losses, end of year | $ | 85,313 | $ | 98,653 | $ | 118,717 | $ | 63,519 | $ | 52,557 | ||||||
Allowance for loan losses as a percentage of non-covered loans, net of unearned income | 3.04 | % | 3.12 | % | 3.20 | % | 1.59 | % | 1.33 | % | ||||||
| | Year Ended December 31, | |||||||||||||||||
|---|---|---|---|---|---|---|---|---|---|---|---|---|---|---|---|---|---|---|
| | 2010 | 2009 | 2008 | 2007 | 2006 | |||||||||||||
| | (Dollars in thousands) | |||||||||||||||||
Allowance for loan losses, beginning of year | $ | 118,717 | $ | 63,519 | $ | 52,557 | $ | 52,908 | $ | 27,303 | ||||||||
Loans charged off: | ||||||||||||||||||
Domestic: | ||||||||||||||||||
Real estate mortgage | (117,029 | ) | (46,047 | ) | (2,617 | ) | (454 | ) | — | |||||||||
Real estate construction | (63,590 | ) | (28,542 | ) | (24,998 | ) | (660 | ) | (144 | ) | ||||||||
Commercial | (18,548 | ) | (11,982 | ) | (7,664 | ) | (2,091 | ) | (1,083 | ) | ||||||||
Consumer | (3,749 | ) | (1,180 | ) | (3,947 | ) | (166 | ) | (189 | ) | ||||||||
Foreign | (306 | ) | (368 | ) | (349 | ) | (1,414 | ) | (1,691 | ) | ||||||||
Total loans charged off(1) | (203,222 | ) | (88,119 | ) | (39,575 | ) | (4,785 | ) | (3,107 | ) | ||||||||
Recoveries on loans charged off: | ||||||||||||||||||
Domestic: | ||||||||||||||||||
Real estate mortgage | 1,222 | 503 | 412 | 163 | — | |||||||||||||
Real estate construction | 708 | 461 | 88 | — | — | |||||||||||||
Commercial | 1,652 | 548 | 971 | 1,591 | 1,361 | |||||||||||||
Consumer | 565 | 151 | 47 | 122 | 171 | |||||||||||||
Foreign | 133 | 44 | 19 | 73 | 187 | |||||||||||||
Total recoveries on loans charged off | 4,280 | 1,707 | 1,537 | 1,949 | 1,719 | |||||||||||||
Net loans charged off | (198,942 | ) | (86,412 | ) | (38,038 | ) | (2,836 | ) | (1,388 | ) | ||||||||
Provision for loan losses | 178,878 | 141,610 | 49,000 | 2,800 | 7,977 | |||||||||||||
Reduction for loans sold | — | — | — | (2,461 | ) | — | ||||||||||||
Additions due to acquisitions | — | — | — | 2,146 | 19,016 | |||||||||||||
Allowance for loan losses, end of year | $ | 98,653 | $ | 118,717 | $ | 63,519 | $ | 52,557 | $ | 52,908 | ||||||||
Allowance for loan losses as a percentage of non-covered loans, net of unearned income | 3.12 | % | 3.20 | % | 1.59 | % | 1.33 | % | 1.26 | % | ||||||||
The following table presents the changes in our reserve for unfunded loan commitments for the years indicated:
| | | Year Ended December 31, | Year Ended December 31, | ||||||||||||||||||||||||||||||
|---|---|---|---|---|---|---|---|---|---|---|---|---|---|---|---|---|---|---|---|---|---|---|---|---|---|---|---|---|---|---|---|---|---|
| | | 2010 | 2009 | 2008 | 2007 | 2006 | 2011 | 2010 | 2009 | 2008 | 2007 | ||||||||||||||||||||||
| | | (In thousands) | (In thousands) | ||||||||||||||||||||||||||||||
Reserve for unfunded loan commitments, beginning of year | Reserve for unfunded loan commitments, beginning of year | $ | 5,561 | $ | 5,271 | $ | 8,471 | $ | 8,271 | $ | 5,668 | $ | 5,675 | $ | 5,561 | $ | 5,271 | $ | 8,471 | $ | 8,271 | ||||||||||||
Provision | 114 | 290 | (3,200 | ) | 200 | 1,623 | |||||||||||||||||||||||||||
Additions due to acquisitions | — | — | — | — | 980 | ||||||||||||||||||||||||||||
Provision (recovery) | 2,795 | 114 | 290 | (3,200 | ) | 200 | |||||||||||||||||||||||||||
Reserve for unfunded loan commitments, end of year | Reserve for unfunded loan commitments, end of year | $ | 5,675 | $ | 5,561 | $ | 5,271 | $ | 8,471 | $ | 8,271 | $ | 8,470 | $ | 5,675 | $ | 5,561 | $ | 5,271 | $ | 8,471 | ||||||||||||
The following table allocatespresents the allowance for loan losses based on our judgmentby portfolio segment as of inherent losses in the respective loan portfolio categories.dates indicated:
| | Allowance for Loan Losses by Portfolio Segment | ||||||||||||||||||
|---|---|---|---|---|---|---|---|---|---|---|---|---|---|---|---|---|---|---|---|
| | Real Estate Mortgage | Real Estate Construction | Commercial | Consumer | Foreign | Total | |||||||||||||
| | (Dollars in thousands) | ||||||||||||||||||
December 31, 2011 | |||||||||||||||||||
Allowance for loan losses | $ | 50,205 | $ | 8,697 | $ | 23,308 | $ | 2,768 | $ | 335 | $ | 85,313 | |||||||
% of loans to total loans | 70 | % | 4 | % | 24 | % | 1 | % | 1 | % | 100 | % | |||||||
December 31, 2010 | |||||||||||||||||||
Allowance for loan losses | $ | 51,657 | $ | 8,766 | $ | 33,229 | $ | 4,652 | $ | 349 | $ | 98,653 | |||||||
% of loans to total loans | 72 | % | 5 | % | 21 | % | 1 | % | 1 | % | 100 | % | |||||||
December 31, 2009 | |||||||||||||||||||
Allowance for loan losses | $ | 58,241 | $ | 39,934 | $ | 17,710 | $ | 2,021 | $ | 811 | $ | 118,717 | |||||||
% of loans to total loans | 65 | % | 12 | % | 21 | % | 1 | % | 1 | % | 100 | % | |||||||
December 31, 2008 | |||||||||||||||||||
Allowance for loan losses | $ | 21,732 | $ | 22,166 | $ | 16,868 | $ | 1,672 | $ | 1,081 | $ | 63,519 | |||||||
% of loans to total loans | 62 | % | 15 | % | 21 | % | 1 | % | 1 | % | 100 | % | |||||||
December 31, 2007 | |||||||||||||||||||
Allowance for loan losses | $ | 20,787 | $ | 18,668 | $ | 11,149 | $ | 476 | $ | 1,477 | $ | 52,557 | |||||||
% of loans to total loans | 58 | % | 18 | % | 22 | % | 1 | % | 1 | % | 100 | % | |||||||
At December 31, 2010,2011, the portion of the allowance allocated to individual portfolio categories includessegments included an amount for both imprecision and uncertainty to better reflect our view of risk. Nonetheless, the allowance for loan losses is available to absorb any losses without restriction.
| | Allocation of Allowance for Loan Losses | |||||||||||||||||||
|---|---|---|---|---|---|---|---|---|---|---|---|---|---|---|---|---|---|---|---|---|
| | Real Estate Mortgage | Real Estate Construction | Commercial | Consumer | Foreign | Total | ||||||||||||||
| | (Dollars in thousands) | |||||||||||||||||||
December 31, 2010(1) | ||||||||||||||||||||
Allowance for loan losses | $ | 51,657 | $ | 8,766 | $ | 33,229 | $ | 4,652 | $ | 349 | $ | 98,653 | ||||||||
% of loans to total loans | 72 | % | 5 | % | 21 | % | 1 | % | 1 | % | 100 | % | ||||||||
December 31, 2009 | ||||||||||||||||||||
Allowance for loan losses | $ | 58,241 | $ | 39,934 | $ | 17,710 | $ | 2,021 | $ | 811 | $ | 118,717 | ||||||||
% of loans to total loans | 65 | % | 12 | % | 21 | % | 1 | % | 1 | % | 100 | % | ||||||||
December 31, 2008 | ||||||||||||||||||||
Allowance for loan losses | $ | 21,732 | $ | 22,166 | $ | 16,868 | $ | 1,672 | $ | 1,081 | $ | 63,519 | ||||||||
% of loans to total loans | 62 | % | 15 | % | 21 | % | 1 | % | 1 | % | 100 | % | ||||||||
December 31, 2007 | ||||||||||||||||||||
Allowance for loan losses | $ | 20,787 | $ | 18,668 | $ | 11,149 | $ | 476 | $ | 1,477 | $ | 52,557 | ||||||||
% of loans to total loans | 58 | % | 18 | % | 22 | % | 1 | % | 1 | % | 100 | % | ||||||||
December 31, 2006 | ||||||||||||||||||||
Allowance for loan losses | $ | 39,235 | $ | — | (2) | $ | 9,719 | $ | 553 | $ | 3,401 | $ | 52,908 | |||||||
% of loans to total loans | 79 | % | — | 18 | % | 1 | % | 2 | % | 100 | % | |||||||||
The allowance amount allocated to the commercial loan category increased during 2010 in consideration of the elevated risk profile of this category. The allowance amount allocated to the construction loan category decreased during 2010 in consideration of reduced exposure within that category and significant reduction in the size of that loan portfolio.
Allowance for Credit Losses on Covered Loans
For a discussion of our policy and methodology on the allowance for credit losses on covered loans, see "—Critical Accounting Policies—Allowance for Credit Losses on Covered Loans." For further information on the allowance for credit losses on covered loans, see Note 6,Loans, of the Notes to Consolidated Financial Statements contained in "Item 8. Financial Statements and Supplementary Data."
The following table presents the changes in our allowance for credit losses on covered loans for the years indicated:
| | | Year Ended December 31, | Year Ended December 31, | |||||||||||||||
|---|---|---|---|---|---|---|---|---|---|---|---|---|---|---|---|---|---|---|
| | | 2010 | 2009 | 2011 | 2010 | 2009 | ||||||||||||
| | | (In thousands) | (In thousands) | |||||||||||||||
Allowance for credit losses on covered loans, beginning of year | $ | 18,000 | $ | — | ||||||||||||||
Provision | 39,046 | 18,000 | ||||||||||||||||
Charge-offs, net | (23,782 | ) | — | |||||||||||||||
Allowance for credit losses on covered loans, | ||||||||||||||||||
beginning of year | $ | 33,264 | $ | 18,000 | $ | — | ||||||||||||
Provision | 13,270 | 33,500 | 18,000 | |||||||||||||||
Charge-offs, net | (15,259 | ) | (18,236 | ) | — | |||||||||||||
Allowance for credit losses on covered loans, end of year | Allowance for credit losses on covered loans, end of year | $ | 33,264 | $ | 18,000 | $ | 31,275 | $ | 33,264 | $ | 18,000 | |||||||
Non-Covered Nonperforming Assets and Performing Restructured Loans
The following table sets forth certain information with respect to our non-covered nonaccrual loans and other real estate owned. For the periods presented, we did not have any non-covered loans past due 90 days or more and still accruing.
| | December 31, | ||||||||||||||||
|---|---|---|---|---|---|---|---|---|---|---|---|---|---|---|---|---|---|
| | 2010 | 2009 | 2008 | 2007 | 2006 | ||||||||||||
| | (Dollars in thousands) | ||||||||||||||||
Non-covered nonaccrual loans | $ | 94,183 | $ | 240,167 | $ | 63,470 | $ | 22,473 | $ | 22,095 | |||||||
Non-covered other real estate owned | 25,598 | 43,255 | 41,310 | 2,736 | — | ||||||||||||
Total non-covered nonperforming assets | $ | 119,781 | $ | 283,422 | $ | 104,780 | $ | 25,209 | $ | 22,095 | |||||||
Non-covered performing restructured loans | $ | 89,272 | $ | 181,454 | $ | 12,637 | $ | 1,942 | $ | — | |||||||
Non-covered nonaccrual loans to non-covered loans, net of deferred fees and costs, including loans held for sale | 2.98 | % | 6.48 | % | 1.59 | % | 0.56 | % | 0.51 | % | |||||||
Non-covered nonperforming assets to non-covered loans, including loans held for sale, and non-covered other real estate owned | 3.76 | % | 7.56 | % | 2.60 | % | 0.63 | % | 0.51 | % | |||||||
During 2010,presents non-covered nonperforming assets declined by $163.6 million to $119.8 million at December 31, 2010, due mainly to lower nonaccrual loans. The drop in nonaccrual loans was attributable primarily to $398.5 million of non-covered classified loans sold in 2010, of which $128.1 million were nonaccrual loans and $148.8 million were performing restructured loans. All nonaccrual loans are considered impaired and are evaluated individually for loss exposure. At December 31, 2010, approximately $12.4 millioninformation as of the allowance for credit losses was allocated to nonaccrual loans.
The types of non-covered loans included in the nonaccrual category and accruing loans past due between 30 and 89 days as of December 31, 2010 and 2009 follow:dates indicated:
| | December 31, | |||||||||||||||
|---|---|---|---|---|---|---|---|---|---|---|---|---|---|---|---|---|
| | 2011 | 2010 | 2009 | 2008 | 2007 | |||||||||||
| | (Dollars in thousands) | |||||||||||||||
Nonaccrual loans(1) | $ | 58,260 | $ | 94,183 | $ | 240,167 | $ | 63,470 | $ | 22,473 | ||||||
Other real estate owned(1) | 48,412 | 25,598 | 43,255 | 41,310 | 2,736 | |||||||||||
Total nonperforming assets | $ | 106,672 | $ | 119,781 | $ | 283,422 | $ | 104,780 | $ | 25,209 | ||||||
Performing restructured loans(1) | $ | 116,791 | $ | 89,272 | $ | 181,454 | $ | 12,637 | $ | 1,942 | ||||||
Nonaccrual loans to loans, net of unearned income, including loans held for sale(1) | 2.07 | % | 2.98 | % | 6.48 | % | 1.59 | % | 0.56 | % | ||||||
Nonperforming assets ratio(1)(2) | 3.73 | % | 3.76 | % | 7.56 | % | 2.60 | % | 0.63 | % | ||||||
| | Nonaccrual Loans(1) | Accruing and Over 30 days Past Due(1) | |||||||||||||||||||
|---|---|---|---|---|---|---|---|---|---|---|---|---|---|---|---|---|---|---|---|---|---|
| | December 31, 2010 | December 31, 2009 | December 31, | ||||||||||||||||||
Loan Category | Balance | % of Loan Category | Balance | % of Loan Category | 2010 Balance | 2009 Balance | |||||||||||||||
| | (Dollars in thousands) | ||||||||||||||||||||
SBA: | |||||||||||||||||||||
SBA 504 | $ | 9,346 | 12.5 | % | $ | 22,849 | 20.1 | % | $ | 190 | $ | 1,603 | |||||||||
SBA 7(a) and Express | 6,518 | 19.7 | % | 12,026 | 28.5 | % | 423 | 1,487 | |||||||||||||
Total SBA | 15,864 | 34,875 | 613 | 3,090 | |||||||||||||||||
Residential land | 24,886 | 65.8 | % | 37,104 | 68.2 | % | — | — | |||||||||||||
Commercial real estate | 21,805 | 1.1 | % | 88,483 | 4.2 | % | 1,652 | 1,109 | |||||||||||||
Commercial | 16,219 | 2.6 | % | 6,052 | 0.8 | % | 746 | 2,592 | |||||||||||||
Residential | 8,255 | 7.7 | % | 19,127 | 16.3 | % | 585 | 178 | |||||||||||||
Commercial land | 1,897 | 4.3 | % | 9,113 | 15.6 | % | — | — | |||||||||||||
Commercial construction | 1,516 | 2.2 | % | 26,394 | 11.9 | % | — | 1,032 | |||||||||||||
Residential multi-family | 818 | 0.6 | % | 1,281 | 1.5 | % | — | — | |||||||||||||
Residential construction | 810 | 3.0 | % | 17,018 | 16.3 | % | — | — | |||||||||||||
Other, including foreign | 2,113 | 4.4 | % | 720 | 1.1 | % | 138 | 492 | |||||||||||||
| $ | 94,183 | 3.0 | % | $ | 240,167 | 6.5 | % | $ | 3,734 | $ | 8,493 | ||||||||||
During 2011, non-covered nonperforming assets declined by $13.1 million to $106.7 million at December 31, 2011, due mainly to a decrease of $35.9 million in nonaccrual loans, offset partially by an increase in other real estate owned of $22.8 million. The netratio of non-covered nonperforming assets to non-covered loans and non-covered OREO decreased to 3.73% at December 31, 2011 from 3.76% at December 31, 2010.
Nonaccrual Loans
The $35.9 million decrease in non-covered nonaccrual loans during 2010 is composed of additions of $91.2 million,2011 was attributable primarily to reductions, payoffs and returnreturns to accrual status of $46.4 million, sales of $127.3$33.4 million, charge-offs of $31.1$24.5 million, and foreclosures of $32.4$34.9 million, offset partially by additions of $56.9 million.
Included in the non-covered nonaccrual loans at December 31, 20102011 are $15.9$10.6 million of SBA related loans representing 17%18% of total non-covered nonaccrual loans at that date. The SBA 504 loans are secured by first trust deeds on owner-occupied business real estate with loan-to-value ratios of generally 50% or less at the time of origination. SBA 7(a) loans are secured by borrowers' real estate and/or business assets and are covered by an SBA guarantee of up to 85% of the loan amount. The SBA guaranteed portion on the 7(a) and Express loans shown abovebelow is $5.6$7.1 million. At December 31, 2010,2011, the SBA loan portfolio totaled $106.9$87.4 million and was composed of $75.3$58.4 million in SBA 504 loans and $31.6$29.0 million in SBA 7(a) and Express loans.
At December 31, 2010, 73%The following table presents our non-covered nonaccrual loans and accruing loans past due between 30 and 89 days by portfolio segment and class as of the nonaccrual loan total was represented by:dates indicated:
| | Nonaccrual Loans(1) | | | ||||||||||||||||
|---|---|---|---|---|---|---|---|---|---|---|---|---|---|---|---|---|---|---|---|
| | Accruing and 30 - 89 Days Past Due(1) | ||||||||||||||||||
| | December 31, 2011 | December 31, 2010 | |||||||||||||||||
Loan Category | Balance | % of Loan Category | Balance | % of Loan Category | December 31, 2011 Balance | December 31, 2010 Balance | |||||||||||||
| | (Dollars in thousands) | ||||||||||||||||||
Real estate mortgage: | |||||||||||||||||||
Hospitality | $ | 7,251 | 5.0 | % | $ | 4,151 | 2.6 | % | $ | — | $ | — | |||||||
SBA 504 | 2,800 | 4.8 | % | 9,346 | 13.5 | % | — | 190 | |||||||||||
Other | 21,286 | 1.2 | % | 27,452 | 1.3 | % | 13,237 | 2,237 | |||||||||||
Total real estate mortgage | 31,337 | 1.6 | % | 40,949 | 1.8 | % | 13,237 | 2,427 | |||||||||||
Real estate construction: | |||||||||||||||||||
Residential | 1,086 | 6.1 | % | 24,004 | 36.9 | % | — | — | |||||||||||
Commercial | 6,194 | 6.5 | % | 5,238 | 4.6 | % | 2,290 | — | |||||||||||
Total real estate construction | 7,280 | 6.4 | % | 29,242 | 16.3 | % | 2,290 | — | |||||||||||
Commercial: | |||||||||||||||||||
Collateralized | 8,186 | 2.0 | % | 6,241 | 1.7 | % | 593 | 680 | |||||||||||
Unsecured | 3,057 | 3.9 | % | 9,104 | 7.0 | % | 4 | 71 | |||||||||||
Asset-based | 14 | — | 15 | — | — | — | |||||||||||||
SBA 7(a) | 7,801 | 26.9 | % | 6,518 | 20.2 | % | 434 | 423 | |||||||||||
Total commercial | 19,058 | 2.8 | % | 21,878 | 3.3 | % | 1,031 | 1,174 | |||||||||||
Consumer | 585 | 2.5 | % | 1,951 | 7.8 | % | 31 | 133 | |||||||||||
Foreign | — | — | 163 | 0.7 | % | — | — | ||||||||||||
Total non-covered loans | $ | 58,260 | 2.1 | % | $ | 94,183 | 3.0 | % | $ | 16,589 | $ | 3,734 | |||||||
The following lending relationships, excluding SBA-related loans, were on nonaccrual operating income fromstatus at December 31, 2011:
Nonaccrual Amount December 31, 2011 | Description | ||
|---|---|---|---|
| (In thousands) | | ||
| $ | 10,226 | This loan is secured by three airplane hangar structures and two office buildings in Los Angeles County, California. Sale of the property securing this loan closed escrow in January 2012 and the outstanding balance was repaid in full. The Bank made a new loan to the buyer of the property to assist with the purchase. | |
7,251 | Two loans, each secured by a hotel in San Diego County, California. The borrower is paying according to the restructured terms of each loan. | ||
3,813 | Four loans, each secured by an industrial warehouse building in Riverside County, California. The borrower is paying according to the restructured terms of each loan. | ||
3,585 | This loan is unsecured. The borrower is paying according to the restructured terms of the loan. | ||
2,520 | This loan is secured by a strip retail center in Riverside County, California. The borrower is paying according to the restructured terms of the loan. | ||
2,306 | This loan is unsecured and has a specific reserve for 95% of the balance. The borrower is paying according to the restructured terms of the loan. | ||
1,963 | This loan is secured by a multi-tenant industrial building in Riverside County, California. The borrower is not paying currently. | ||
1,701 | Two unsecured loans that are fully reserved for. | ||
1,553 | Loan secured by unimproved land in Imperial County, California. The collateral for this loan was acquired by the Bank at a foreclosure sale in January 2012. | ||
1,492 | This loan is secured by a medical-related office building in Los Angeles County, California. The borrower is paying according to the restructured terms of the loan. | ||
$ | 36,410 | Total | |
OREO
Non-covered OREO grew $22.8 million in 2011 due primarily to foreclosures totaling $34.7 million, offset partially by write-downs of $5.0 million and sales totaling $8.5 million.
The following table presents non-covered OREO by property type as of the property has improveddates indicated:
| | December 31, | ||||||
|---|---|---|---|---|---|---|---|
Property Type | 2011 | 2010 | |||||
| | (In thousands) | ||||||
Commercial real estate | $ | 23,003 | $ | 18,205 | |||
Construction and land development | 24,788 | 4,650 | |||||
Single family residence | 621 | 2,743 | |||||
Total non-covered OREO | $ | 48,412 | $ | 25,598 | |||
The non-covered construction and it is projected to return to profitability.
Performing Restructured Loans
Non-covered performing restructured loans declinedgrew by $92.2$27.5 million during 2010,2011, to $89.3$116.8 million at December 31, 2010.2011. The declinechange was attributable primarilyto additions of $58.8 million, offset partially by the removal of $16.7 million in loans from restructured loan status due to the sales of $148.8 million in such loans as partperformance of the classified loan salesloans in 2010.accordance with their modified terms and the transfers of performing restructured loans to nonaccrual status of $14.6 million. At December 31, 2010,2011, we had $69.7$87.5 million in real estate mortgage loans, $18.1$24.5 million in real estate construction loans, and $1.5$4.7 million in commercial loans, and $144,000 in consumer loans that were accruing interest under the terms of troubled debt restructurings. The majority of our loan restructurings relates to commercial real estate lending and involves lowering the interest rate and/or a change to interest-only payments for a period of time. In these cases, we do not typically forgive principal or extend the maturity date as part of the loan modification.
The majority of the performing restructured loans werewas on accrual status prior to the loan modifications and havehas remained on accrual status after the loan modifications due to the borrowers making payments before and after the restructurings. In these circumstances, generally, a borrower may have had a fixed rate loan that they continued to repay, but may be having cash flow difficulties. In an effort to work with certain borrowers, we have agreed to interest rate reductions to reflect the lower market interest rate environment and/or interest-only payments for a period of time. In these cases, we do not forgive principal or extend the maturity date as part of the loan modification. As a result of the current economic environment in our market areas, we anticipate loan restructurings to continue during 2011.
The following table presents the non-covered OREO by property type as of the dates indicated:
| | December 31, | |||||||
|---|---|---|---|---|---|---|---|---|
Property Type | 2010 | 2009 | ||||||
| | (In thousands) | |||||||
Commercial real estate | $ | 18,205 | $ | 28,478 | ||||
Construction and land development | 4,650 | 7,514 | ||||||
Single family residence | 2,743 | 7,263 | ||||||
Total non-covered OREO | $ | 25,598 | $ | 43,255 | ||||
Non-covered OREO declined $17.7 million in 2010 due to foreclosures totaling $36.8 million, write-downs of $12.3 million and sales totaling $42.2 million.continue.
Covered Nonperforming Assets
Loans accounted for under ASC 310-30 are generally considered accruing and performing loans as the loans accrete interest income over the estimated life of the loan when cash flows are reasonably estimable. Accordingly, acquired impaired loans that are contractually past due are still considered to be accruing and performing loans. If the timing and amount of future cash flows is not reasonably estimable, the loans may be classified as nonaccrual loans and interest income is not recognized until the timing and amount of future cash flows can be reasonably estimated.
The following table presents a summary of covered loans that would normally be considered nonaccrual except for the accounting requirements regarding acquired impaired loans and other real estate owned covered by the loss sharing agreementagreements ("covered nonaccrual loans" and "covered OREO"; collectively, "covered nonperforming assets") as of the dates indicated:
| | | December 31, | December 31, | ||||||||||||
|---|---|---|---|---|---|---|---|---|---|---|---|---|---|---|---|
| | | 2010 | 2009 | 2011 | 2010 | ||||||||||
| | (In thousands) | ||||||||||||||
| �� | (In thousands) | ||||||||||||||
Covered nonaccrual loans | Covered nonaccrual loans | $ | 142,964 | $ | 87,653 | $ | 152,062 | $ | 142,964 | ||||||
Covered OREO | Covered OREO | 55,816 | 27,688 | 33,506 | 55,816 | ||||||||||
Total covered nonperforming assets | $ | 198,780 | $ | 115,341 | |||||||||||
Total covered nonperforming assets | $ | 185,568 | $ | 198,780 | |||||||||||
Covered performing restructured loans | Covered performing restructured loans | $ | 14,255 | $ | 13,566 | $ | 16,047 | $ | 14,255 | ||||||
Loan Portfolio Risk Elements
The increased level of nonaccrual loans overnegative trends throughout the last several years is due to theSouthern California economy and its effect on our borrowers. Certainhave affected certain industries and collateral types have been more affected than others. Our real estate loan portfolio is predominantly commercial and as such does not include any higher-riskexpose us to higher risks generally associated with residential mortgage loans such as option ARM, interest-only or subprime mortgage loans. Our portfolio does include mortgage loans on commercial property. Commercial mortgage loan repayments typically do not rely on either the sale of the underlying collateral orand instead rely on the income producing potential of the collateral.collateral as the source
of repayment. Ultimately, though, due to the loan amortization period being greater thatthan the contractual loan term, the borrower may be required to refinance the loan, either with us or another lender, or sell the underlying collateral in order to payoffpay off the loan.
We have $229.1At December 31, 2011, we had $205.5 million of non-covered commercial real estate mortgage loans maturing over the next 12 months. In the event we refinanceFor any of these loans, becausein the borrowers are unableevent we provide a concession through a refinance or modification that we would not ordinarily consider in order to obtain financing elsewhere due to the inabilityprotect as much of banks in our market area to make loans,investment as possible, such loans may be considered troubled debt restructurings even though they were performing throughout their terms. The circumstances regarding any modification and a borrower's specific situation, such as their ability to obtain financing from another source at similar market terms, are evaluated on an individual basis to determine if a troubled debt restructuring has occurred. Higher levels of troubled debt restructurings may lead to increased classified assets and credit loss provisions.
Investment Portfolio
Our investment activities are designed to assist in maximizing income consistent with quality and liquidity requirements, to supply collateral to secure public funds on deposit and lines of credit, and to provide a means for balancing market and credit risks through changing economic times. Our portfolio consists primarily of U.S. government agency obligations, obligations of government-sponsored entities, obligations of states and political subdivisions, private-label collateralized mortgage obligations ("CMOs"), corporate debt securities, and FHLB stock.
During 2011, 2010, and 2009, we purchasedmade market purchases of $658.3 million, $627.9 million, and $227.5 million of government-sponsored entity pass throughinvestment securities available-for-sale, respectively, utilizing our excess liquidity. During 2010, through the Los Padres acquisition, we obtained $44.3 million of investment securities, consisting of $10.7 million of FHLB stock and $33.6 million of investment securities available-for-sale. The securities available-for sale were comprised primarily of government and government-sponsored entity pass through securities. None of the acquired Los Padres investment securities are covered by an FDIC loss sharing agreement. During 2009, through the Affinity acquisition, we acquiredobtained $175.4 million of investment securities, consisting of $16.6 million of FHLB stock and $158.8 million of investment securities at their estimated fair value in the Affinity acquisition includingavailable-for-sale. The securities available-for-sale included $55.3 million of "private-label" CMOs which are covered by aan FDIC loss sharing agreement. The remaining acquired Affinity securities available-for-sale were predominatelypredominantly government orand government-sponsored entity CMOs.
The following table presents the detail of our market purchases of securities during the years indicated:
| | Year Ended December 31, | |||||||||
|---|---|---|---|---|---|---|---|---|---|---|
Security Type | 2011 | 2010 | 2009 | |||||||
| | (In thousands) | |||||||||
Market Purchases of Securities: | ||||||||||
Residential mortgage-backed securities: | ||||||||||
Government and government-sponsored entity pass through securities | $ | 449,927 | $ | 592,702 | $ | 175,500 | ||||
Government and government-sponsored entity collateralized mortgage obligations | 60,190 | — | — | |||||||
Municipal securities | 120,501 | — | 1,105 | |||||||
Corporate debt securities | 25,096 | — | — | |||||||
Government-sponsored entity debt securities | — | 35,182 | 50,941 | |||||||
Other securities | 2,596 | — | — | |||||||
Total purchases of securities available-for-sale | $ | 658,310 | $ | 627,884 | $ | 227,546 | ||||
The following table presents the detail of our securities obtained in the Los Padres and Affinity acquisitions as of the acquisition dates for the years indicated:
| | Year Ended December 31, | ||||||
|---|---|---|---|---|---|---|---|
Security Type | 2010 | 2009 | |||||
| | (In thousands) | ||||||
Securities Obtained Through Los Padres and | |||||||
Affinity Acquisitions: | |||||||
Residential mortgage-backed securities: | |||||||
Government and government-sponsored entity pass through securities | $ | 26,719 | $ | 941 | |||
Government and government-sponsored entity collateralized mortgage obligations | 6,885 | 102,029 | |||||
Covered private label collateralized mortgage obligations | — | 55,271 | |||||
Other securities | — | 514 | |||||
Total acquisitions of securities available-for-sale | 33,604 | 158,755 | |||||
Federal Home Loan Bank stock | 10,647 | 16,646 | |||||
Total acquisitions of investment securities | $ | 44,251 | $ | 175,401 | |||
The following table presents the composition of our investment portfolio at the dates indicated:
| | | December 31, | December 31, | ||||||||||||||||||
|---|---|---|---|---|---|---|---|---|---|---|---|---|---|---|---|---|---|---|---|---|---|
Security Type | 2011 | 2010 | 2009 | ||||||||||||||||||
| | | 2010 | 2009 | 2008 | (In thousands) | ||||||||||||||||
| | (In thousands) | ||||||||||||||||||||
Residential mortgage-backed securities: | |||||||||||||||||||||
Government and government-sponsored entity pass through securities | $ | 1,042,507 | $ | 756,065 | $ | 235,532 | |||||||||||||||
Government and government-sponsored entity collateralized mortgage obligations | 82,027 | 47,629 | 86,897 | ||||||||||||||||||
Covered private label collateralized mortgage obligations | 45,149 | 50,437 | 52,125 | ||||||||||||||||||
Municipal securities | 126,797 | 7,566 | 8,214 | ||||||||||||||||||
Corporate debt securities | 25,128 | — | — | ||||||||||||||||||
Government-sponsored entity debt securities | Government-sponsored entity debt securities | $ | 10,029 | $ | 38,648 | $ | 24,160 | — | 10,029 | 38,648 | |||||||||||
Municipal securities | 7,566 | 8,214 | 7,509 | ||||||||||||||||||
Residental mortgage-backed securities: | |||||||||||||||||||||
Government and government-sponsored entity pass through securities | 756,065 | 235,532 | 88,133 | ||||||||||||||||||
Government and government-sponsored entity collateralized mortgage obligations | 47,629 | 86,897 | — | ||||||||||||||||||
Covered private label collateralized mortgage obligations | 50,437 | 52,125 | — | ||||||||||||||||||
Other securities | Other securities | 2,290 | 2,284 | 1,775 | 4,750 | 2,290 | 2,284 | ||||||||||||||
Total securities available-for-sale | 874,016 | 423,700 | 121,577 | ||||||||||||||||||
Total securities available-for-sale | 1,326,358 | 874,016 | 423,700 | ||||||||||||||||||
Federal Home Loan Bank stock | Federal Home Loan Bank stock | 55,040 | 50,429 | 33,782 | 46,106 | 55,040 | 50,429 | ||||||||||||||
Total investment securities | $ | 1,372,464 | $ | 929,056 | $ | 474,129 | |||||||||||||||
Total investment securities | $ | 929,056 | $ | 474,129 | $ | 155,359 | |||||||||||||||
The following table presents a summary of yields and contractual maturities of securities available-for-sale at December 31, 2010:2011:
| | One Year or Less | One Year Through Five Years | Five Years Through Ten Years | Over Ten Years | Total | ||||||||||||||||||||||||||
|---|---|---|---|---|---|---|---|---|---|---|---|---|---|---|---|---|---|---|---|---|---|---|---|---|---|---|---|---|---|---|---|
December 31, 2011 | Amount | Yield | Amount | Yield | Amount | Yield | Amount | Yield | Amount | Yield | |||||||||||||||||||||
| | (Dollars in thousands) | ||||||||||||||||||||||||||||||
Residential mortgage-backed securities: | |||||||||||||||||||||||||||||||
Government and government-sponsored entity pass through securities | $ | — | — | $ | 5,310 | 5.19 | % | $ | 32,737 | 3.97 | % | $ | 1,004,460 | 3.79 | % | $ | 1,042,507 | 3.80 | % | ||||||||||||
Government and government-sponsored entity collateralized mortgage obligations | — | — | 385 | 4.46 | % | 1,548 | 5.17 | % | 80,094 | 3.80 | % | 82,027 | 3.82 | % | |||||||||||||||||
Covered private label collateralized mortgage obligations | — | — | 602 | 11.49 | % | 991 | 6.19 | % | 43,556 | 7.52 | % | 45,149 | 7.54 | % | |||||||||||||||||
Municipal securities(1) | — | — | 2,510 | 4.47 | % | 1,697 | 5.67 | % | 122,590 | 4.36 | % | 126,797 | 4.38 | % | |||||||||||||||||
Corporate debt securities | — | — | — | — | — | — | 25,128 | 6.39 | % | 25,128 | 6.39 | % | |||||||||||||||||||
Other securities | 4,750 | 0.73 | % | — | — | — | — | — | — | 4,750 | 0.73 | % | |||||||||||||||||||
Total securities available-for-sale(1) | $ | 4,750 | 0.73 | % | $ | 8,807 | 5.35 | % | $ | 36,973 | 4.15 | % | $ | 1,275,828 | 4.01 | % | $ | 1,326,358 | 4.02 | % | |||||||||||
| | One Year or Less | One Year Through Five Years | Five Years Through Ten Years | Over Ten Years | Total | |||||||||||||||||||||||||||
|---|---|---|---|---|---|---|---|---|---|---|---|---|---|---|---|---|---|---|---|---|---|---|---|---|---|---|---|---|---|---|---|---|
December 31, 2010 | Amount | Yield | Amount | Yield | Amount | Yield | Amount | Yield | Amount | Yield | ||||||||||||||||||||||
| | (Dollars in thousands) | |||||||||||||||||||||||||||||||
Government-sponsored entity debt securities | $ | — | — | $ | 10,029 | 3.00 | % | $ | — | — | $ | — | — | $ | 10,029 | 3.00 | % | |||||||||||||||
Municipal securities(1) | 2,469 | 5.19 | % | 3,403 | 4.54 | % | 1,694 | 5.67 | % | — | — | 7,566 | 5.01 | % | ||||||||||||||||||
Residential mortgage-backed securities: | ||||||||||||||||||||||||||||||||
Government and government-sponsored entity pass through securities | — | — | 5,762 | 5.27 | % | 39,940 | 4.01 | % | 710,363 | 3.84 | % | 756,065 | 3.86 | % | ||||||||||||||||||
Government and government-sponsored entity collateralized mortgage obligations | — | — | 769 | 4.36 | % | 4,457 | 4.75 | % | 42,403 | 5.11 | % | 47,629 | 5.07 | % | ||||||||||||||||||
Covered private label collateralized mortgage obligations | — | — | 737 | 11.49 | % | 573 | 5.18 | % | 49,127 | 7.68 | % | 50,437 | 7.70 | % | ||||||||||||||||||
Other securities | 2,290 | 1.05 | % | — | — | — | — | — | — | 2,290 | 1.05 | % | ||||||||||||||||||||
Total securities available-for-sale(1) | $ | 4,759 | 3.18 | % | $ | 20,700 | 4.17 | % | $ | 46,664 | 4.16 | % | $ | 801,893 | 4.12 | % | $ | 874,016 | 4.12 | % | ||||||||||||
The following table presentstables present, for those securities that were in a gross unrealized loss position, the carrying values, which are the estimated fair values, and the gross unrealized losses on securities by length of time the securities had been in an unrealized loss position at the dates indicated:
| | December 31, 2010 | December 31, 2009 | ||||||||||||||||||||||||||
|---|---|---|---|---|---|---|---|---|---|---|---|---|---|---|---|---|---|---|---|---|---|---|---|---|---|---|---|---|
| | Less than 12 months | 12 months or longer | Total | Less than 12 months | ||||||||||||||||||||||||
| | Estimated Fair Value | Gross Unrealized Losses | Estimated Fair Value | Gross Unrealized Losses | Estimated Fair Value | Gross Unrealized Losses | Estimated Fair Value | Gross Unrealized Losses | ||||||||||||||||||||
| | (In thousands) | |||||||||||||||||||||||||||
Government-sponsored entity debt securities | $ | — | $ | — | $ | — | $ | — | $ | — | $ | — | $ | 35,626 | $ | (319 | ) | |||||||||||
Residental mortgage-backed securities: | ||||||||||||||||||||||||||||
Government and government-sponsored entity pass through securities | 321,537 | (7,366 | ) | — | — | 321,537 | (7,366 | ) | 113,621 | (840 | ) | |||||||||||||||||
Government and government-sponsored entity collateralized mortgage obligations | 15,690 | (327 | ) | 1,553 | (25 | ) | 17,243 | (352 | ) | 64,661 | (2,702 | ) | ||||||||||||||||
Covered private label collateralized mortgage obligations | 1,579 | (472 | ) | 4,980 | (1,611 | ) | 6,559 | (2,083 | ) | 30,511 | (1,555 | ) | ||||||||||||||||
Total | $ | 338,806 | $ | (8,165 | ) | $ | 6,533 | $ | (1,636 | ) | $ | 345,339 | $ | (9,801 | ) | $ | 244,419 | $ | (5,416 | ) | ||||||||
| | December 31, 2011 | ||||||||||||||||||
|---|---|---|---|---|---|---|---|---|---|---|---|---|---|---|---|---|---|---|---|
| | Less than 12 months | 12 months or longer | Total | ||||||||||||||||
Security Type | Carrying Value | Gross Unrealized Losses | Carrying Value | Gross Unrealized Losses | Carrying Value | Gross Unrealized Losses | |||||||||||||
| | (In thousands) | ||||||||||||||||||
Residential mortgage-backed securities: | |||||||||||||||||||
Government and government- sponsored entity pass through securities | $ | 34,682 | $ | (64 | ) | $ | 22 | $ | (1 | ) | $ | 34,704 | $ | (65 | ) | ||||
Government and government- sponsored entity collateralized mortgage obligations | 10,790 | (21 | ) | 1,530 | (15 | ) | 12,320 | (36 | ) | ||||||||||
Covered private label collateralized mortgage obligations | 5,228 | (595 | ) | 4,427 | (1,560 | ) | 9,655 | (2,155 | ) | ||||||||||
Municipal securities | 7,755 | (56 | ) | — | — | 7,755 | (56 | ) | |||||||||||
Corporate debt securities | 10,758 | (26 | ) | — | — | 10,758 | (26 | ) | |||||||||||
Other securities | 2,445 | (135 | ) | — | — | 2,445 | (135 | ) | |||||||||||
Total | $ | 71,658 | $ | (897 | ) | $ | 5,979 | $ | (1,576 | ) | $ | 77,637 | $ | (2,473 | ) | ||||
| | December 31, 2010 | ||||||||||||||||||
|---|---|---|---|---|---|---|---|---|---|---|---|---|---|---|---|---|---|---|---|
| | Less than 12 months | 12 months or longer | Total | ||||||||||||||||
Security Type | Carrying Value | Gross Unrealized Losses | Carrying Value | Gross Unrealized Losses | Carrying Value | Gross Unrealized Losses | |||||||||||||
| | (In thousands) | ||||||||||||||||||
Residential mortgage-backed securities: | |||||||||||||||||||
Government and government- sponsored entity pass through securities | $ | 321,537 | $ | (7,366 | ) | $ | — | $ | — | $ | 321,537 | $ | (7,366 | ) | |||||
Government and government- sponsored entity collateralized mortgage obligations | 15,690 | (327 | ) | 1,553 | (25 | ) | 17,243 | (352 | ) | ||||||||||
Covered private label collateralized mortgage obligations | 1,579 | (472 | ) | 4,980 | (1,611 | ) | 6,559 | (2,083 | ) | ||||||||||
Total | $ | 338,806 | $ | (8,165 | ) | $ | 6,533 | $ | (1,636 | ) | $ | 345,339 | $ | (9,801 | ) | ||||
We reviewed the securities that were in a continuous loss position less than 12 months and longer than 12 months at December 31, 2010,2011, and concluded that their losses were a result of the level of market interest rates relative to the types of securities and not a result of the underlying issuers' abilities to repay. Accordingly, we determined that the securities were temporarily impaired. Additionally, we have the abilityno plans to holdsell these securities untiland believe that it is more likely than not we would not be required to sell these securities before recovery of their fair values recover to their costs, and thereforeamortized cost. Therefore, we did not recognize the temporary impairment in the consolidated statements of earnings (loss).
During 2010, we determined that one covered private label collateralized mortgage obligation security was fully impaired due to deteriorating cash flows and significant delinquency of the underlying loan collateral and recorded an other-than-temporary impairment loss of $874,000 in the consolidated statement of earnings (loss). This loss was offset by FDIC loss sharing income of $699,000, which represented the FDIC's share of the loss.
At December 31, 2010,2011, the Company had a $55.0$46.1 million investment in Federal Home Loan Bank of San Francisco (FHLB)("FHLB") stock carried at cost. In January 2009, the FHLB announced that it suspended excess FHLB stock redemptions and dividend payments. Since this announcement, the FHLB has declared and paid five cash dividends in 2010 and 2011, though at rates less than that paid in the past, and repurchased $6.0 millioncertain amounts of our excess stock. We evaluated the carrying value of our FHLB stock investment at December 31, 20102011, and determined that it was not impaired. Our evaluation considered the long-term nature of the investment, the current financial and liquidity position of the FHLB, the actions being taken by the FHLB to address its regulatory situation, and our intent and ability to hold this investment for a period of time sufficient to recover our recorded investment.
During 2011, the Company redeemed $8.9 million of FHLB stock. During 2010, the Company obtained $10.7 million of FHLB stock in connection with the Los Padres acquisition and redeemed $6.0 million of FHLB stock. During 2009, the Company obtained $16.6 million of FHLB stock in connection with the Affinity acquisition.
Deposits
The following table presents a summary of our average deposits as of the dates indicated and average rates paid:
| | | Year Ended December 31, | Year Ended December 31, | ||||||||||||||||||||||||||||||||||||
|---|---|---|---|---|---|---|---|---|---|---|---|---|---|---|---|---|---|---|---|---|---|---|---|---|---|---|---|---|---|---|---|---|---|---|---|---|---|---|---|
| | | 2010 | 2009 | 2008 | 2011 | 2010 | 2009 | ||||||||||||||||||||||||||||||||
Deposit Category | Deposit Category | Average Amount | Rate | Average Amount | Rate | Average Amount | Rate | Average Amount | Rate | Average Amount | Rate | Average Amount | Rate | ||||||||||||||||||||||||||
| | | (Dollars in thousands) | (Dollars in thousands) | ||||||||||||||||||||||||||||||||||||
Noninterest-bearing deposits | Noninterest-bearing deposits | $ | 1,437,493 | — | $ | 1,245,512 | — | $ | 1,242,557 | — | $ | 1,627,729 | — | $ | 1,437,493 | — | $ | 1,245,512 | — | ||||||||||||||||||||
Interest checking deposits | Interest checking deposits | 458,703 | 0.28 | % | 390,605 | 0.45 | % | 358,308 | 0.81 | % | 491,145 | 0.16 | % | 458,703 | 0.28 | % | 390,605 | 0.45 | % | ||||||||||||||||||||
Money market deposits | Money market deposits | 1,230,924 | 0.78 | % | 981,901 | 1.20 | % | 1,007,112 | 1.96 | % | 1,227,482 | 0.44 | % | 1,230,924 | 0.78 | % | 981,901 | 1.20 | % | ||||||||||||||||||||
Savings deposits | Savings deposits | 121,793 | 0.20 | % | 114,933 | 0.23 | % | 105,938 | 0.24 | % | 150,837 | 0.15 | % | 121,793 | 0.20 | % | 114,933 | 0.23 | % | ||||||||||||||||||||
Time deposits | Time deposits | 1,181,735 | 1.28 | % | 874,786 | 2.07 | % | 561,288 | 3.25 | % | 1,077,930 | 1.33 | % | 1,181,735 | 1.28 | % | 874,786 | 2.07 | % | ||||||||||||||||||||
Total average deposits | $ | 4,575,123 | 0.45 | % | $ | 4,430,648 | 0.59 | % | $ | 3,607,737 | 0.88 | % | |||||||||||||||||||||||||||
Total average deposits | $ | 4,430,648 | 0.59 | % | $ | 3,607,737 | 0.88 | % | $ | 3,275,203 | 1.26 | % | |||||||||||||||||||||||||||
The following table analyzes the increase (decrease) in deposit types during 20102011 compared to 2009:2010:
| | | December 31, | | December 31, | | ||||||||||||||||
|---|---|---|---|---|---|---|---|---|---|---|---|---|---|---|---|---|---|---|---|---|---|
| | | Increase (Decrease) | Increase (Decrease) | ||||||||||||||||||
Deposit Category | Deposit Category | 2010 | 2009 | 2011 | 2010 | ||||||||||||||||
| | | (In thousands) | (In thousands) | ||||||||||||||||||
Noninterest-bearing deposits | Noninterest-bearing deposits | $ | 1,465,562 | $ | 1,302,974 | $ | 162,588 | $ | 1,685,799 | $ | 1,465,562 | $ | 220,237 | ||||||||
Interest checking deposits | Interest checking deposits | 494,617 | 439,694 | 54,923 | 500,998 | 494,617 | 6,381 | ||||||||||||||
Money market deposits | Money market deposits | 1,321,780 | 1,171,386 | 150,394 | 1,265,282 | 1,321,780 | (56,498 | ) | |||||||||||||
Savings deposits | Savings deposits | 135,876 | 108,569 | 27,307 | 157,480 | 135,876 | 21,604 | ||||||||||||||
Total core deposits | 3,417,835 | 3,022,623 | 395,212 | ||||||||||||||||||
Total core deposits | 3,609,559 | 3,417,835 | 191,724 | ||||||||||||||||||
Time deposits, excluding brokered | Time deposits, excluding brokered | 1,148,125 | 890,673 | 257,452 | 926,326 | 1,148,125 | (221,799 | ) | |||||||||||||
Total deposits, excluding brokered | 4,565,960 | 3,913,296 | 652,664 | ||||||||||||||||||
Total deposits, excluding brokered | 4,535,885 | 4,565,960 | (30,075 | ) | |||||||||||||||||
Time deposits, brokered | Time deposits, brokered | 83,738 | 181,273 | (97,535 | ) | 41,568 | 83,738 | (42,170 | ) | ||||||||||||
Total deposits | $ | 4,649,698 | $ | 4,094,569 | $ | 555,129 | |||||||||||||||
Total deposits | $ | 4,577,453 | $ | 4,649,698 | $ | (72,245 | ) | ||||||||||||||
Deposits of foreign customers located primarily in Mexico included above | Deposits of foreign customers located primarily in Mexico included above | $ | 145,058 | $ | 135,091 | $ | 9,967 | $ | 142,082 | $ | 145,058 | $ | (2,976 | ) | |||||||
During 2010,2011, deposits increaseddecreased by $555.1$72.2 million to $4.6 billion at December 31, 2010,2011, due primarily to core deposit growth and the acquisitiona reduction of Los Padres, whose branches had$264.0 million in time deposits, which included a decrease of $360.7$42.2 million at December 31, 2010.in brokered deposits. The increasedecline in deposits was offset partially by a $97.5$191.7 million reductiongrowth in brokeredcore deposits. Included in brokeredBrokered time deposits are $47.5 million at the end of 2010 and $74.6 million at the end of 2009 ofrepresent customer deposits that were subsequently participated with other FDIC insured financial institutions through the CDARS program as a means to provide FDIC deposit insurance coverage for the full amount of our customers' deposits.
When Los Padres and brokered deposits are excluded, the net deposit increase during 2010 was $292.0 million summarized as follows:
Deposit Category | Increase During 2010 | |||||
|---|---|---|---|---|---|---|
| | (In thousands) | |||||
Noninterest-bearing deposits | $ | 131,049 | ||||
Interest checking deposits | 14,538 | |||||
Money market deposits | 83,749 | |||||
Savings deposits | 9,970 | |||||
Total core deposits | 239,306 | |||||
Time deposits, excluding brokered | 52,681 | |||||
Total deposits increase, excluding Los Padres | ||||||
and brokered deposits | $ | 291,987 | ||||
We increased noninterest-bearing demand and money market deposits during 20102011 due to a combination of new deposit relationships and increased deposits from our existing customers. We started 20102011 with nearly 61,00068,100 noninterest-bearing accounts and ended the year with approximately 68,10062,000 noninterest-bearing accounts. Approximately 5,000 low-balance accounts of which 3,900 related to former Los Padres offices.were closed in 2011 when we implemented monthly service charges on previously free accounts. Competition for deposits among banks and financial institutions in our Southern California market area was robust in 20102011 and is expected to continue through 2011.2012. Our deposit gathering activities may be negatively impacted by two of our business practices. First, we generally price our deposits lower than our competitors. Second, since a good portion of our deposits are tied to lending relationships, the economic downturn in
Southern California may lead to lower loan production and loss of existing customers. To mitigate these challenges, we actively review our deposit offerings to provide the optimum mix of service, product and rate, and continually seek new deposits through various programs.
ForThe following table summarizes the maturities of time deposits as of $100,000 or more, the following table presents a summary of maturities for the time periodsdate indicated:
December 31, 2010 | Due in 3 Months or Less | Due in Over 3 Months Through 6 Months | Due in Over 6 Months Through 12 Months | Due in Over 12 Months | Total | |||||||||||
|---|---|---|---|---|---|---|---|---|---|---|---|---|---|---|---|---|
| | (In thousands) | |||||||||||||||
Time deposits, $100,000 or more | $ | 178,704 | $ | 91,832 | $ | 149,511 | $ | 374,978 | $ | 795,025 | ||||||
| | December 31, 2011 | ||||||||||||
|---|---|---|---|---|---|---|---|---|---|---|---|---|---|
Maturity | Time Deposits Under $100,000 | Time Deposits $100,000 or More | Total Time Deposits | Rate | |||||||||
| | (In thousands) | ||||||||||||
Due in three months or less | $ | 62,239 | $ | 107,320 | $ | 169,559 | 0.55 | % | |||||
Due in over three months through six months | 38,300 | 84,502 | 122,802 | 0.91 | % | ||||||||
Due in over six months through twelve months | 50,475 | 77,341 | 127,816 | 0.66 | % | ||||||||
Due in over twelve months | 173,507 | 374,210 | 547,717 | 1.75 | % | ||||||||
Total | $ | 324,521 | $ | 643,373 | $ | 967,894 | 1.29 | % | |||||
The Bank has various lines of credit available. These include the ability to borrow funds from time to time on a long-term, short-term or overnight basis from the FHLB of San Francisco, the FRB or other financial institutions. The maximum amount that we could borrow under our credit lines with the FHLB at December 31, 20102011 was $1.4$1.3 billion, of which $1.2$1.0 billion was available on that date. The maximum amount that we could borrow under our secured credit line with the FRB at December 31, 20102011 was $373.3$347.4 million, all of which was available on that date. The FHLB lines are secured by a blanket lien on certain qualifying loans in our loan portfolio which are not pledged to the FRB and a portion of our available-for-sale investment securities. The FRB line is secured by a blanket lien on certain qualifying loans that are not pledged to the FHLB.
At December 31, 2011, our borrowings included $225.0 million in term FHLB advances and $129.3 million of subordinated debentures. At December 31, 2010, our borrowings included $225.0 million in term FHLB advances and $129.6 million of subordinated debentures. At December 31, 2009, our borrowings included $542.8 million in term FHLB advances and $129.8 million of subordinated debentures. The $317.8 million decline in
FHLB advances during 2010 was due to $135.0 million in maturities, $125.0 million that were prepaid in April 2010, for which we paid a $726,000 prepayment penalty, and $50.0 million that were prepaid in December 2010, for which we incurred a $1.9 million penalty. We prepaid the $175.0 million in FHLB advances during 2010 to lower excess liquidity and improve our net interest margin.
The following table summarizes information about our FHLB advances outstanding at December 31, 2010 and 2009:as of the dates indicated:
| | December 31, 2010 | December 31, 2009 | ||||||||||||
|---|---|---|---|---|---|---|---|---|---|---|---|---|---|---|
Maturity Date | Amount | Rate | Amount | Rate | ||||||||||
| | (Dollars in thousands) | |||||||||||||
January 11, 2010 | $ | — | — | $ | 75,000 | 3.04 | % | |||||||
February 8, 2010 | — | — | 10,000 | (1) | 4.81 | % | ||||||||
February 8, 2010 | — | — | 25,000 | (1) | 5.04 | % | ||||||||
February 26, 2010 | — | — | 25,000 | (1) | 4.99 | % | ||||||||
August 23, 2010 | — | — | 20,000 | (1) | 4.90 | % | ||||||||
December 29, 2010 | — | — | 25,000 | (1) | 4.23 | % | ||||||||
September 8, 2011 | — | — | 20,000 | (1) | 4.67 | % | ||||||||
January 11, 2013 | — | — | 50,000 | (2) | 2.71 | % | ||||||||
September 9, 2013 | — | — | 20,000 | (1) | 4.63 | % | ||||||||
August 25, 2014 | — | — | 20,000 | (1) | 4.26 | % | ||||||||
September 23, 2014 | — | — | 20,000 | (1) | 3.51 | % | ||||||||
December 11, 2017 | 200,000 | 3.16 | % | 200,000 | 3.16 | % | ||||||||
January 11, 2018 | 25,000 | 2.61 | % | 25,000 | 2.61 | % | ||||||||
Unamortized premium | — | 7,763 | (3) | |||||||||||
Total FHLB advances | $ | 225,000 | $ | 542,763 | ||||||||||
| | December 31, | ||||||||||||
|---|---|---|---|---|---|---|---|---|---|---|---|---|---|
| | 2011 | 2010 | |||||||||||
Contractual Maturity Date | Amount | Rate | Amount | Rate | |||||||||
| | (Dollars in thousands) | ||||||||||||
December 11, 2017 | 200,000 | 3.16 | % | 200,000 | 3.16 | % | |||||||
January 11, 2018 | 25,000 | 2.61 | % | 25,000 | 2.61 | % | |||||||
Total FHLB advances | $ | 225,000 | 3.10 | % | $ | 225,000 | 3.10 | % | |||||
On March 7 and 8, 2012, the Affinity acquisition,Company redeemed $18 million of which $125 million were prepaid in April 2010, for which we incurredthe subordinated debentures of Trust 1 and Trust CI and recognized a $0.7 million penalty chargedpre-tax gain of approximately $1.6 million. We redeemed these subordinated debentures to earnings at that time.
We have access to the capital markets to raise funds, which is accomplished generally through the issuance of equity, both common and preferred stock, and the issuance of subordinated debentures. We
may use the proceeds to invest in our business through organic growth or other acquisitions. We also have the ability to invest in our Company through stock repurchase programs, which we have elected to do from time to time.
On December 22, 2009, we filed a registration statement with the SEC to offer to sell, from time to time, shares of common stock, preferred stock, and other equity linked securities for an aggregate initial offering price of up to $350 million. This registration statement was declared effective on January 8, 2010. Proceeds from any offering under this registration statement are anticipated to be used to fund future acquisitions of banks and financial institutions and for general corporate purposes.
On August 25, 2009, we sold in a direct placement to institutional investors 2.7 million shares of common stock for $50 million, or a per share price of $18.36, which was the closing price of PacWest's common stock on Monday, August 24, 2009. In addition to the issuance of the common shares, PacWest issued to each investor two warrants exercisable for common shares worth up to an additional $54 million in the aggregate with an exercise price of $20.20 per share, or 110% of the price per share
at which the initial $50 million was sold. The Series A warrants had a six month term and originally expired on March 1, 2010; such warrants were exercised on March 1, 2010 for a total of $27.2 million in cash and we issued 1,348,040 shares of common stock. The net proceeds from the warrant exercises totaled $26.6 million after expenses. The 1,361,657 Series B warrants issued in August 2009 with a strike price of $20.20 expired in August 2010 without being exercised. The common shares were sold and the warrants were issued under our $150 million shelf registration statement, which became effective in June 2009 but subsequently terminated upon the effectiveeffectiveness declaration of our $350 million shelf registration statement on January 8, 2010.
On January 14, 2009, we issued in a private placement to CapGen Capital Group II LP 3,846,153 PacWest common shares at $26 per share for total cash consideration of approximately $100 million. CapGen Capital Group II LP has registered as a bank holding company and as a result of the investment it owned approximately 11% of PacWest outstanding common stock, excluding unvested restricted stock, as of December 31, 2010.2011.
Bank regulatory agencies measure capital adequacy through standardized risk-based capital guidelines which compare different levels of capital (as defined by such guidelines) to risk-weighted assets and off-balance sheet obligations. Banks and bank holding companies considered to be "adequately capitalized" are required to maintain a minimum total risk-based capital ratio of 8% of which at least 4.0% must be Tier 1 capital. Banks and bank holding companies considered to be "well capitalized" must maintain a minimum leverage ratio of 5% and a minimum risk-based capital ratio of 10% of which at least 6.0% must be Tier 1 capital.
The following table presents regulatory capital requirements and our regulatory capital ratios at December 31, 2010.2011. Regulatory capital requirements limit the amount of deferred tax assets that may be included when determining the amount of regulatory capital. Deferred tax asset amounts in excess of the calculated limit are deducted from regulatory capital. At December 31, 2010,2011, such amount was $51.0 million.$27.4 million for the Company and $21.9 million for the Bank. No assurance can be given that the regulatory capital deferred tax asset limitation will not increase in the future.
| | December 31, 2010 | December 31, 2011 | ||||||||||||||||||
|---|---|---|---|---|---|---|---|---|---|---|---|---|---|---|---|---|---|---|---|---|
| | Well Capitalized Requirement | Pacific Western Bank | PacWest Bancorp Consolidated | Well Capitalized Requirement | Pacific Western Bank | PacWest Bancorp Consolidated | ||||||||||||||
Tier 1 leverage capital ratio | 5.00 | % | 8.51 | % | 8.54 | % | 5.00 | % | 9.73 | % | 10.42 | % | ||||||||
Tier 1 risk-based capital ratio | 6.00 | % | 12.71 | % | 12.68 | % | 6.00 | % | 14.95 | % | 15.97 | % | ||||||||
Total risk-based capital ratio | 10.00 | % | 13.99 | % | 13.96 | % | 10.00 | % | 16.22 | % | 17.25 | % | ||||||||
As of December 31, 2010,2011, we exceeded each of the capital requirements of the FRB and were deemed to be "well capitalized." In addition, as of December 31, 2010,2011, Pacific Western exceeded the capital requirements to be "well capitalized." For further information on regulatory capital, see Note 19,Dividend Availability and Regulatory Matters, of the Notes to Consolidated Financial Statements contained in "Item 8. Financial Statements and Supplementary Data."
The Company issued subordinated debentures to trusts that were established by us or entities we have acquired, which, in turn, issued trust preferred securities, which totaled $123.0 million at December 31, 2010. These securities are currently included in our Tier I capital for purposes of determining the Company's Tier I and total risk-based capital ratios.2011. The Board of Governors of the Federal Reserve System, which is the holding company's banking regulator, has promulgated a modification of the capital regulations affecting trust preferred securities. Although this modification was scheduled to be effective on March 31, 2009, the Federal Reserve postponed the effective date to March 31, 2011. At that time, the Company will be allowed to includeincludes in Tier I1 capital an amount of trust preferred securities equal to no more than 25% of the sum of all core capital elements, which is
generally defined as shareholders' equity less goodwill, net of any related deferred income tax liability. The regulations currently in effect throughAt December 31, 2010, limit2011, the amount of trust preferred securities that can be included in Tier I capital to 25% of the sum of core capital elements without a deduction for goodwill. We have determined that our Tier I capital ratios would remain above the well-capitalized level had the modification of the capital regulations been in effect at December 31, 2010. We expect that our Tier I capital ratios will be at or above the existing well-capitalized levels on March 31, 2011, the first date on which the modified capital regulations must be applied.was $123.0 million. While our existing trust preferred securities are grandfathered under the Dodd-Frank Wall Street Reform and Consumer Protection Act that was enacted in July 2010, new issuances will not qualify as Tier 1 capital. See "—Borrowings" for information regarding the redemption in March 2012 of certain of our subordinated debentures.
Interest payments on subordinated debentures made by the Company are considered dividend payments under FRB regulations. As such, notification to the FRB is required prior to our paying such interest during any period in which our quarterly net earnings are insufficient to fund the interest due. Should the FRB object to payment of interest on the subordinated debenture we would not be able to make the payments until approval is received or we no longer need to provide notice under applicable regulations.
The goals of our liquidity management are to ensure the ability of the Company to meet its financial commitments when contractually due and to respond to other demands for funds such as the ability to meet the cash flow requirements of customers who may be either depositors wanting to withdraw funds or borrowers who may need assurance that sufficient funds will be available to meet their credit needs. We have an Executive Asset/Liability Management Committee, or Executive ALM Committee, which is comprised of members of senior management and responsible for managing balance sheet and off-balance sheet commitments to meet the needs of customers while achieving our financial objectives. Our Executive ALM Committee meets regularly to review funding capacities, current and forecasted loan demand, and investment opportunities.
Historically, the Bank's primaryThe Company manages its liquidity source has been its core deposit base. In addition, the Bank relies on collateralized FHLB advances as oneby maintaining pools of its sources of affordable and immediately available liquidity. The level of such wholesale funding is monitored based on the Bank's liquidity requirements, and we maintain what we believe to be an acceptable level of this collateralized borrowing capacity. The Bank's secured borrowing capacity with the FHLB was $1.4 billion, of which $1.2 billion was available as of December 31, 2010. In addition to the secured borrowing relationship with the FHLB, and to meet short term liquidity needs, the Bank maintains adequate balances in liquid assets which includeon-balance sheet, consisting of cash and due from banks, Federal Funds sold, interest-earning deposits in other financial institutions and unpledged investment securities available-for-sale. The Bankavailable-for-sale, which we refer to as our primary liquidity. In addition, we also maintains amaintain available borrowing capacity under secured line of creditborrowing lines with the FRB,Federal Home Loan Bank of San Francisco ("FHLB") and the Federal Reserve Bank of San Francisco ("FRB"), which had a borrowing capacity of $373.3 million and no amounts outstanding at December 31, 2010.we refer to as our secondary liquidity. In addition to its secured lines of credit, the BankCompany also maintains unsecured lines of credit, subject to availability, of $92.0$45.0 million with correspondent banks for purchase of overnight funds.
The disruption infollowing table provides a summary of the financial creditBank's primary and secondary liquidity markets in 2009 and 2008 hadlevels at the effectdates indicated:
| | December 31, | |||||||||
|---|---|---|---|---|---|---|---|---|---|---|
| | 2011 | 2010 | 2009 | |||||||
| | (Dollars in thousands) | |||||||||
Primary Liquidity—On-Balance Sheet: | ||||||||||
Cash | $ | 92,342 | $ | 82,170 | $ | 93,915 | ||||
Interest-earning deposits at financial institutions | 203,275 | 26,382 | 117,133 | |||||||
Investment securities available-for-sale | 1,326,358 | 874,016 | 423,700 | |||||||
Less pledged securities | (69,623 | ) | (140,730 | ) | (176,686 | ) | ||||
Total primary liquidity | $ | 1,552,352 | $ | 841,838 | $ | 458,062 | ||||
Ratio of primary liquidity to total deposits | 33.9 | % | 18.1 | % | 11.2 | % | ||||
Secondary Liquidity—Off-Balance Sheet Available Secured Borrowing Capacity: | ||||||||||
Total secured borrowing capacity with the FHLB | $ | 1,273,927 | $ | 1,389,806 | $ | 1,322,636 | ||||
Less secured letters of credit outstanding | (2,002 | ) | (2,002 | ) | (2,226 | ) | ||||
Less secured advances outstanding | (225,000 | ) | (225,000 | ) | (535,000 | ) | ||||
Net secured borrowing capacity with the FHLB | 1,046,925 | 1,162,804 | 785,410 | |||||||
Secured credit line with the FRB | 347,407 | 373,307 | 333,170 | |||||||
Total secondary liquidity | $ | 1,394,332 | $ | 1,536,111 | $ | 1,118,580 | ||||
During 2011, the Company's primary liquidity increased $710 million. The increased liquidity levels are a function of decreasing overallcurrent market conditions—loan demand has decreased while deposit balances have remained relatively unchanged. We expect to maintain higher levels of on-balance sheet liquidity in the marketplace. We have augmented our funding needs with collateralized FHLB borrowings and large denomination time deposits. During 2010, however, liquidity returned2012 compared to the marketplace andhistorical levels until we repaid FHLB advances with excess liquidity and allowed brokered depositsare able to mature without renewal.effectively increase loan portfolio balances.
At December 31, 2010,2011, the Company had pledged $3.0 billion of loans as collateral for the secured borrowing lines maintained with the FHLB and the FRB.
In addition to our primary liquidity, we generate liquidity from cash flow from our amortizing loan portfolio and from our large base of core customer deposits, defined as non-interest bearing demand, interest checking, savings and money market accounts. At December 31, 2011, such deposits totaled $3.6 billion and represented 79% of the Company's total deposits. These core deposits are normally less volatile, often with customer relationships tied to other products offered by the Company promoting long lasting relationships and stable funding sources. During 2011, total core deposits increased $192 million, mainly in non-interest bearing demand deposits from our small to medium sized business customer base. Some of the growth in our core deposits is attributed to businesses having a tendency to maintain higher cash balances because of current economic conditions and low rate investment alternatives. Deposits from our customers may decline if interest rates increase significantly or if corporate customers move funds from the Company generally. In order to address the Company's liquidity risk as deposit balances may fluctuate, the Company maintains adequate levels of available liquidity.
The following table provides a summary of the Bank's core deposits at the dates indicated:
| | December 31, | |||||||||
|---|---|---|---|---|---|---|---|---|---|---|
| | 2011 | 2010 | 2009 | |||||||
| | (In thousands) | |||||||||
Core Deposits: | ||||||||||
Non-interest bearing demand | $ | 1,685,799 | $ | 1,465,562 | $ | 1,302,974 | ||||
Interest checking | 500,998 | 494,617 | 439,694 | |||||||
Savings and money market | 1,422,762 | 1,457,656 | 1,279,955 | |||||||
Total core deposits | $ | 3,609,559 | $ | 3,417,835 | $ | 3,022,623 | ||||
Our asset/liability policy establishes various liquidity guidelines for the Company. The policy includes guidelines for On-Balance Sheet Liquidity (a measurement of primary liquidity to total deposits), Coverage and Crisis Coverage Ratios (measurements of liquid assets to expected short-term liquidity required for the loan and deposit portfolios under normal and stressed conditions), Loan to Funding Ratio, Wholesale Funding Ratio, and other guidelines developed for measuring and maintaining liquidity. As of December 31, 2011, the Company was in compliance with all liquidity guidelines established in the ALCO policy.
We may use large denomination brokered time deposits, the availability of which is uncertain and subject to competitive market forces, for liquidity management purposes. At December 31, 2011, the Bank had $36.2 millionnone of these large denomination timebrokered deposits. In addition, we have $47.5$41.6 million of customer deposits that were subsequently participated with other FDIC insured financial institutions through the CDARS program as a means to provide FDIC deposit insurance coverage for the full amount of our participating customers' deposits.
To meet short-term liquidity needs, the Bank maintains what we believe are adequate balances in cash, interest-earning deposits in other financial institutions and investment securities with a maturity or duration of five years or less. Our on balance sheet liquidity ratio, calculated as liquid assets (cash, interest-earning deposits in financial institutions and unpledged investment securities available-for-sale) as a percent of total deposits, was 18.1% as of December 31, 2010 and 11.2% at December 31, 2009. We built-up the Bank's on-balance sheet liquidity in order to have more flexibility during the current economic cycle.
Holding Company Liquidity
The primary sources of liquidity for the Company, on a stand-alone basis, include dividends from the Bank and our ability to raise capital, issue subordinated debt and secure outside borrowings. The ability of the Company to obtain funds for the payment of dividends to our stockholders and for other cash requirements is largely dependent upon the Bank's earnings. Pacific Western is subject to restrictions under certain federal and state laws and regulations which limit its ability to transfer funds to the Company through intercompany loans, advances or cash dividends.
Dividends paid by state banks, such as Pacific Western, are regulated by the DFI under its general supervisory authority as it relates to a bank's capital requirements. A state bank may declare a dividend without the approval of the DFI as long as the total dividends declared in a calendar year do not exceed either the retained earnings or the total of net profits for three previous fiscal years less any dividends paid during such period. During 2010,2011, PacWest received no$25.5 million in dividends from the Bank. For the forseeableforeseeable future, any dividends from the Bank to the Company require DFI approval. See also Note 19, inDividend Availability and Regulatory Matters, of the Notes to the Consolidated Financial Statements contained in "Item 8. Financial Statements and Supplementary Data".Data."
At December 31, 2010,2011, the Company had, on a stand-alone basis, approximately $24.1$35.9 million in cash on deposit at the Bank. Management believes this amount of cash along with other sources of liquidity is sufficient to fund the Company's 20112012 cash flow needs. See related discussion of liquidity sources at "—Capital Resources".Resources."
The known contractual obligations of the Company at December 31, 20102011 are as follows:
| | | December 31, 2010 | December 31, 2011 | ||||||||||||||||||||||||||||||
|---|---|---|---|---|---|---|---|---|---|---|---|---|---|---|---|---|---|---|---|---|---|---|---|---|---|---|---|---|---|---|---|---|---|
| | | Due Within One Year | Due in One to Three Years | Due in Three to Five Years | Due After Five Years | Total | Due Within One Year | Due in One to Three Years | Due in Three to Five Years | Due After Five Years | Total | ||||||||||||||||||||||
| | | (Dollars in thousands) | (Dollars in thousands) | ||||||||||||||||||||||||||||||
Time deposits | Time deposits | $ | 717,372 | $ | 511,223 | $ | 3,268 | $ | — | $ | 1,231,863 | $ | 420,177 | $ | 510,338 | $ | 37,379 | $ | — | $ | 967,894 | ||||||||||||
Long-term debt obligations | Long-term debt obligations | — | — | — | 354,572 | 354,572 | — | — | — | 354,271 | 354,271 | ||||||||||||||||||||||
Operating lease obligations | Operating lease obligations | 16,435 | 27,142 | 18,668 | 14,194 | 76,439 | 16,621 | 29,458 | 19,411 | 14,629 | 80,119 | ||||||||||||||||||||||
Other contractual obligations | Other contractual obligations | 3,122 | — | — | — | 3,122 | 9,278 | 8,510 | 2,489 | — | 20,277 | ||||||||||||||||||||||
Total | $ | 446,076 | $ | 548,306 | $ | 59,279 | $ | 368,900 | $ | 1,422,561 | |||||||||||||||||||||||
Total | $ | 736,929 | $ | 538,365 | $ | 21,936 | $ | 368,766 | $ | 1,665,996 | |||||||||||||||||||||||
Operating lease obligations, time deposits, and debt obligations are discussed in NotesNote 9,Premises and Equipment, Net, Note 10,Deposits, and Note 11,Borrowings and Subordinated Debentures, of the Notes to Consolidated Financial Statements contained in "Item 8. Financial Statements and Supplementary Data." The other contractual obligations relate to our minimum liability associated with our data and item processing contract with a third-party provider. These contracts mature in 20112012 but are expected to be renewed.
We believe that we will be able to meet our contractual obligations as they come due through the maintenance of adequate cash levels. We expect to maintain adequate cash levels through profitability,
loan and securities repayment and maturity activity, and continued deposit gathering activities. We have in place various borrowing mechanisms for both short-term and long-term liquidity needs.
Off-Balance Sheet Arrangements
Our obligations also include off-balance sheet arrangements consisting of loan-related commitments, of which only a portion are expected to be funded. At December 31, 2010,2011, our loan-related commitments, including standby letters of credit, totaled $777.8$723.5 million. The commitments, which result in a funded loanloans, increase our profitability through net interest income. Therefore, during the year, weWe manage our overall liquidity taking into consideration funded and unfunded commitments as a percentage of our liquidity sources. Our liquidity sources, as described in "—Liquidity," have been and are expected to be sufficient to meet the cash requirements of our lending activities. For further information on loan commitments, see Note 12,Commitments and Contingencies, of the Notes to Consolidated Financial Statements contained in "Item 8. Financial Statements and Supplementary Data."
Recent Accounting Pronouncements
See Note 1,Nature of Operations and Summary of Significant Accounting Policies, of the Notes to Consolidated Financial Statements contained in "Item 8. Financial Statements and Supplementary Data" for information on recent accounting pronouncements and their impact, if any, on our consolidated financial statements.
ITEM 7A. QUANTITATIVE AND QUALITATIVE DISCLOSURES ABOUT MARKET RISK
Our market risk arises primarily from credit risk and interest rate risk inherent in our lending and financing activities. To manage our credit risk, we rely on adherence to our underwriting standards and loan policies, internal loan monitoring and periodic credit review as well as our allowance for credit losses methodology, all of which are administered by the Bank's credit administration department and overseen by the Company's Credit Risk Committee. To manage our exposure to changes in interest rates, we perform asset and liability management activities which are governed by guidelines
pre-established by our Executive ALM Committee, and approved by our Asset/Liability Management Committee of the Board of Directors, which we refer to as our Board ALCO. Our Executive ALM Committee monitors our compliance with our asset/liability policies. These policies focus on providing sufficient levels of net interest income while considering capital constraints and acceptable levels of interest rate exposure and liquidity.
Market risk sensitive instruments are generally defined as derivatives and other financial instruments, which include investment securities, loans, deposits, and borrowings. At December 31, 20102011 and 2009,2010, we had not used any derivatives to alter our interest rate risk profile or for any other reason. However, both the repricing characteristics of our fixed rate loans and floating rate loans, the significant percentage of noninterest-bearing deposits compared to interest-earning assets, and the callable features in certain borrowings, may influence our interest rate risk profile. Our financial instruments include loans receivable, Federal funds sold, interest-earning deposits in financial institutions, Federal Home Loan Bank stock, investment securities, deposits, borrowings and subordinated debentures.
We measure our interest rate risk position on at least a quarterly basis using threetwo methods: (i) net interest income simulation analysis; and (ii) market value of equity modeling; and (iii) traditional gap analysis.modeling. The results of these analyses are reviewed by the Executive ALM Committee and the Board ALCO quarterly. If hypothetical changes to interest rates cause changes to our simulated net present value of equity and/or net interest income outside our pre-established limits, we may adjust our asset and liability mix in an effort to bring our interest rate risk exposure within our established limits.
We evaluated the results of our net interest income simulation and market value of equity models prepared as of December 31, 2010,2011, the results of which are presented herein.below. Our net interest income
simulation indicates that our balance sheet is liability sensitive as rising interest rates would result in a decline in our net interest margin. This profile is primarily a result of (a) the increased origination of fixed rate loans and variable rate loans with initial fixed rate terms which is driven bydue to customer demand for fixedpreference and (b) declining floating rate products in this low interest rate environment.construction loans. Our market value of equity model indicates an asset sensitive profile suggesting a sudden sustained increase in rates would result in an increase in our estimated market value of equity. This profile is a result of the assumed floors in the Company's offering rates, which are not expected to increase to the extent of the movement of market interest rates, and the significant value placed on the Company's noninterest-bearing deposits and the assumed floors in the discount rates used to value a portionfor purposes of the loan portfolio.this analysis.
The divergent profile between the net interest income simulation and market value of equity model is due primarily toa result of the Company's significant amountlevel of noninterest-bearing deposits. Static balances of noninterest bearingnoninterest-bearing deposits do not impact the net interest income simulation, while at the same time the value of these deposits increaseincreases substantially in the market value of equity model when market rates are assumed to rise. In general, we view the net interest income model results as more relevant to the Company's current operating profile and manage our balance sheet based on this information.
Net Interest Income Simulation
We used a simulation model to measure the estimated changes in net interest income that would result over the next 12 months from immediate and sustained changes in interest rates as of December 31, 2010.2011. This model is an interest rate risk management tool and the results are not necessarily an indication of our future net interest income. This model has inherent limitations and these results are based on a given set of rate changes and assumptions at one point in time. We have assumed no growth in either our total interest-sensitive assets or liabilities over the next 12 months; therefore, the results reflect an interest rate shock to a static balance sheet.
This analysis calculates the difference between net interest income forecasted using both increasing and declining interest rate scenarios and net interest income forecasted using a base market interest rate derived from the U.S. Treasury yield curve at December 31, 2010.2011. In order to arrive at the base
case, we extend our balance sheet at December 31, 20102011 one year and reprice any assets and liabilities that would contractually reprice or mature during that period using the products' pricing as of December 31, 2010.2011. Based on such repricings, we calculate an estimated net interest income and net interest margin.
The repricing relationship for each of our assets and liabilities includes many assumptions. For example, many of our assets are floating rate loans, which are assumed to reprice to the same extent as the change in market rates according to their contracted index except for floating rate loans tied to our base lending rate which are assumed to reprice upward only after the first 75 basis point increase in market rates. This assumption is due to the fact that we reduced our base lending rate 100 basis points when the Federal Reserve lowered the Federal Funds benchmark rate by 175 basis points in the fourth quarter of 2008. Some loans and investment vehicles include the opportunity of prepayment (imbedded options) and the simulation model uses national indexesa prepayment model to estimate these prepayments and reinvest these proceeds at current simulated yields. Our deposit products reprice at our discretion and are assumed to reprice more slowly in a rising or declining interest rate environment and usually repricingreprice at a rate less than the change in market rates. Also, a callable option feature on certain borrowings will reprice differently in a rising interest rate environment than in a declining interest rate environment. The effects of certain balance sheet attributes, such as fixed-ratefixed rate loans, floating rate loans that have reached their floors, and the volume of noninterest-bearing deposits as a percentage of earning assets, impact our assumptions and consequently the results of our interest rate risk management model. Changes that could vary significantly from our assumptions include loan and deposit growth or contraction, changes in the mix of our earning assets or funding sources, the performance of covered loans accounted for under the expected cash flow method, and future asset/liability management decisions, all of which may have significant effects on our net interest income.
The simulation analysis does not account for all factors that impact this analysis, including changes by management to mitigate the impact of interest rate changes or the impact a change in interest rates may have on our credit risk profile, loan prepayment estimates and spread relationships which can change regularly. In addition, the simulation analysis does not make any assumptions regarding loan fee income, which is a component of our net interest income and tends to increase our net interest margin. In 2010, loan fee income increased our net interest margin by 10 basis points. Management reviews the model assumptions for reasonableness on a quarterly basis.
The following table presents as of December 31, 2010,2011, forecasted net interest income and net interest margin for the next 12 months using a base market interest rate and the estimated change to the base scenario given immediate and sustained upward and downward movements in interest rates of 100, 200 and 300 basis points.
December 31, 2010 Interest Rate Scenario | Estimated Net Interest Income | Percentage Change From Base | Estimated Net Interest Margin | Estimated Net Interest Margin Change From Base | ||||||||||||||||||||||
|---|---|---|---|---|---|---|---|---|---|---|---|---|---|---|---|---|---|---|---|---|---|---|---|---|---|---|
December 31, 2011 Interest Rate Scenario | Estimated Net Interest Income | Percentage Change From Base | Estimated Net Interest Margin | Estimated Net Interest Margin Change From Base | ||||||||||||||||||||||
| | (Dollars in thousands) | (Dollars in thousands) | ||||||||||||||||||||||||
Up 300 basis points | $ | 252,604 | (5.7 | )% | 4.97 | % | (0.30 | )% | $ | 246,528 | (2.9 | )% | 4.80 | % | (0.14 | )% | ||||||||||
Up 200 basis points | $ | 252,778 | (5.6 | )% | 4.97 | % | (0.30 | )% | $ | 246,174 | (3.0 | )% | 4.79 | % | (0.15 | )% | ||||||||||
Up 100 basis points | $ | 256,650 | (4.2 | )% | 5.05 | % | (0.22 | )% | $ | 246,954 | (2.7 | )% | 4.81 | % | (0.13 | )% | ||||||||||
BASE CASE | $ | 267,804 | — | 5.27 | % | — | $ | 253,774 | — | 4.94 | % | — | ||||||||||||||
Down 100 basis points | $ | 264,694 | (1.2 | )% | 5.21 | % | (0.06 | )% | $ | 245,592 | (3.2 | )% | 4.78 | % | (0.16 | )% | ||||||||||
Down 200 basis points | $ | 258,784 | (3.4 | )% | 5.09 | % | (0.18 | )% | $ | 243,285 | (4.1 | )% | 4.74 | % | (0.20 | )% | ||||||||||
Down 300 basis points | $ | 258,848 | (3.3 | )% | 5.09 | % | (0.18 | )% | $ | 242,253 | (4.5 | )% | 4.72 | % | (0.22 | )% | ||||||||||
Our base case forecasted net interest income decreased $14.0 million to $253.8 million at December 31, 2011 from $267.8 million at December 31, 2010. The decrease in forecasted net interest income was due primarily to lower assumed loan volume, partially offset by higher assumed securities volume.
The net interest income simulation model prepared as of December 31, 20102011 suggests our balance sheet is liability sensitive. Liability sensitivity indicates that in a rising interest rate environment, our net interest margin would decrease. Due to the historically low market interest rates as of December 31, 2010,2011, the "down" scenarios are not considered meaningful and are excluded from the following discussion. The liability sensitive profile is due mostly to the mix of fixed rate loans to total loans in the loan portfolio relative to our amount of interest-bearing deposits that would reprice as interest rates change. Although $2.2$1.8 billion of the $4.1$3.5 billion of total loans in the portfolio have variable interest rate terms, only $674$708 million of those variable rate loans will reprice within twelve months. The remaining variable rate loans will behave as if they have fixed rates in the short run because of the effect of interest rate floors and hybrid ARM loan pricing structures of mini-perm commercial real estate loans, which generally contain initial fixed rate terms ranging from three to five years before becoming variable rate.
The following table presents as of December 31, 2009,2010, forecasted net interest income and net interest margin for the next 12 months using a base market interest rate and the estimated change to the base scenario given immediate and sustained upward and downward movements in interest rates of 100, 200 and 300 basis points.
December 31, 2009 Interest Rate Scenario | Estimated Net Interest Income | Percentage Change From Base | Estimated Net Interest Margin | Estimated Net Interest Margin Change From Base | ||||||||||||||||||||||
|---|---|---|---|---|---|---|---|---|---|---|---|---|---|---|---|---|---|---|---|---|---|---|---|---|---|---|
December 31, 2010 Interest Rate Scenario | Estimated Net Interest Income | Percentage Change From Base | Estimated Net Interest Margin | Estimated Net Interest Margin Change From Base | ||||||||||||||||||||||
| | (Dollars in thousands) | (Dollars in thousands) | ||||||||||||||||||||||||
Up 300 basis points | $ | 235,261 | (4.2 | )% | 4.76 | % | (0.21 | )% | $ | 252,604 | (5.7 | )% | 4.97 | % | (0.30 | )% | ||||||||||
Up 200 basis points | $ | 232,941 | (5.1 | )% | 4.71 | % | (0.26 | )% | $ | 252,778 | (5.6 | )% | 4.97 | % | (0.30 | )% | ||||||||||
Up 100 basis points | $ | 234,086 | (4.7 | )% | 4.74 | % | (0.23 | )% | $ | 256,650 | (4.2 | )% | 5.05 | % | (0.22 | )% | ||||||||||
BASE CASE | $ | 245,543 | — | 4.97 | % | — | $ | 267,804 | — | 5.27 | % | — | ||||||||||||||
Down 100 basis points | $ | 242,272 | (1.3 | )% | 4.90 | % | (0.07 | )% | $ | 264,694 | (1.2 | )% | 5.21 | % | (0.06 | )% | ||||||||||
Down 200 basis points | $ | 243,519 | (0.8 | )% | 4.92 | % | (0.05 | )% | $ | 258,784 | (3.4 | )% | 5.09 | % | (0.18 | )% | ||||||||||
Down 300 basis points | $ | 239,548 | (2.4 | )% | 4.85 | % | (0.12 | )% | $ | 258,848 | (3.3 | )% | 5.09 | % | (0.18 | )% | ||||||||||
Market Value of Equity
We measure the impact of market interest rate changes on the net present value of estimated cash flows from our assets, liabilities and off-balance sheet items, defined as the market value of equity, using a simulation model. This simulation model assesses the changes in the market value of our interest-sensitive financial instruments that would occur in response to an instantaneous and sustained increase or decrease in market interest rates of 100, 200 and 300 basis points. This analysis assigns significant value to our noninterest-bearing deposit balances. The projections are by their nature forward-looking and therefore inherently uncertain, and include various assumptions regarding cash flows and interest rates.
This model is an interest rate risk management tool and the results are not necessarily an indication of our actual future results. Actual results may vary significantly from the results suggested by the market value of equity table. Loan prepayments and deposit attrition, changes in the mix of our earning assets or funding sources, and future asset/liability management decisions, among others, may vary significantly from our assumptions. The base case is determined by applying various current market discount rates to the estimated cash flows from the different types of assets, liabilities and off-balance sheet items existing at December 31, 2010.2011.
The following table shows the projected change in the market value of equity for the set of rate shocks presented as of December 31, 2010:2011:
December 31, 2010 Interest Rate Scenario | Estimated Market Market Value | Dollar Change From Base | Percentage Change From Base | Percentage of Total Assets | Ratio of Estimated Market Value to Book Value | |||||||||||||||||||||||||||
|---|---|---|---|---|---|---|---|---|---|---|---|---|---|---|---|---|---|---|---|---|---|---|---|---|---|---|---|---|---|---|---|---|
December 31, 2011 Interest Rate Scenario | Estimated Market Value of Equity | Dollar Change From Base | Percentage Change From Base | Percentage of Total Assets | Ratio of Estimated Market Value to Book Value | |||||||||||||||||||||||||||
| | (Dollars in thousands) | (Dollars in thousands) | ||||||||||||||||||||||||||||||
Up 300 basis points | $ | 595,178 | $ | 10,763 | 1.8 | % | 10.8 | % | 124.3 | % | $ | 706,062 | $ | (1,192 | ) | (0.2 | )% | 12.8 | % | 129.3 | % | |||||||||||
Up 200 basis points | $ | 639,595 | $ | 55,180 | 9.4 | % | 11.6 | % | 133.6 | % | $ | 734,438 | $ | 27,184 | 3.8 | % | 13.3 | % | 134.5 | % | ||||||||||||
Up 100 basis points | $ | 622,514 | $ | 38,099 | 6.5 | % | 11.3 | % | 130.0 | % | $ | 740,136 | $ | 32,882 | 4.6 | % | 13.4 | % | 135.5 | % | ||||||||||||
BASE CASE | $ | 584,415 | — | — | 10.6 | % | 122.1 | % | $ | 707,254 | — | — | 12.8 | % | 129.5 | % | ||||||||||||||||
Down 100 basis points | $ | 517,807 | $ | (66,608 | ) | (11.4 | )% | 9.4 | % | 108.1 | % | $ | 635,138 | $ | (72,116 | ) | (10.2 | )% | 11.5 | % | 116.3 | % | ||||||||||
Down 200 basis points | $ | 464,710 | $ | (119,705 | ) | (20.5 | )% | 8.4 | % | 97.1 | % | $ | 618,032 | $ | (89,222 | ) | (12.6 | )% | 11.2 | % | 113.2 | % | ||||||||||
Down 300 basis points | $ | 434,424 | $ | (149,991 | ) | (25.7 | )% | 7.9 | % | 90.7 | % | $ | 597,303 | $ | (109,951 | ) | (15.5 | )% | 10.8 | % | 109.4 | % | ||||||||||
Our base case estimated market value of equity increased $122.9 million to $707.3 million at December 31, 2011 from $584.4 million at December 31, 2010. The increase in market value of equity was due primarily to (a) a $55.1 million increase in the fair value of our loan portfolio, which resulted from using a lower discount rate to value the loan portfolio in 2011, and (b) the $67.4 million increase in stockholders' equity during 2011. The loan portfolio discount rate was adjusted down to reflect changes in market conditions and lower assumed loan floor rates on mini-perm commercial real estate loans.
The results of our market value of equity model indicate an asset sensitive interest rate risk profile in 20102011 demonstrated by the increase in the market value of equity in the "up" interest rate scenarios compared to the "base case". Given the historically low market interest rates as of December 31, 2010,
2011, the "down" scenarios at December 31, 20102011 are not considered meaningful and are excluded from the following discussion.
Our asset sensitive position as of December 31, 20102011 is due primarily to the significant value placed on the Company'sour noninterest-bearing deposits and the assumed floors in the discount rates used to value a portion of the loan portfolio. The discount rate used to value our loan portfolio is derived from the expected offering rate for each loan type with a similar term and credit risk profile. In a rising rate environment, management does not expect to increase our offering rates on certain loan products to the same extent as market rates until the fully indexed offering rate exceeds the current pricing floor, and in turn, our loans are not projected to lose significant value in the up"up" 100 basis point and up"up" 200 basis point scenarios. Conversely, the discount rates for our liabilities are expected to immediately change when market rates change. Therefore, our liabilities are expected to immediately increase in value as rates rise thereby increasing the estimated market value of equity in the rising rate scenario.
The following table shows the projected change in the market value of equity for the set of rate shocks presented as of December 31, 2009:2010:
December 31, 2009 Interest Rate Scenario | Estimated Market Market Value | Dollar Change From Base | Percentage Change From Base | Percentage of Total Assets | Ratio of Estimated Market Value to Book Value | |||||||||||||||||||||||||||
|---|---|---|---|---|---|---|---|---|---|---|---|---|---|---|---|---|---|---|---|---|---|---|---|---|---|---|---|---|---|---|---|---|
December 31, 2010 Interest Rate Scenario | Estimated Market Value of Equity | Dollar Change From Base | Percentage Change From Base | Percentage of Total Assets | Ratio of Estimated Market Value to Book Value | |||||||||||||||||||||||||||
| | (Dollars in thousands) | (Dollars in thousands) | ||||||||||||||||||||||||||||||
Up 300 basis points | $ | 602,312 | $ | 13,252 | 2.2 | % | 11.3 | % | 118.9 | % | $ | 595,178 | $ | 10,763 | 1.8 | % | 10.8 | % | 124.3 | % | ||||||||||||
Up 200 basis points | $ | 638,917 | $ | 49,857 | 8.5 | % | 12.0 | % | 126.1 | % | $ | 639,595 | $ | 55,180 | 9.4 | % | 11.6 | % | 133.6 | % | ||||||||||||
Up 100 basis points | $ | 626,717 | $ | 37,657 | 6.4 | % | 11.8 | % | 123.7 | % | $ | 622,514 | $ | 38,099 | 6.5 | % | 11.3 | % | 130.0 | % | ||||||||||||
BASE CASE | $ | 589,060 | — | — | 11.1 | % | 116.2 | % | $ | 584,415 | — | — | 10.6 | % | 122.1 | % | ||||||||||||||||
Down 100 basis points | $ | 551,319 | $ | (37,741 | ) | (6.4 | )% | 10.4 | % | 108.8 | % | $ | 517,807 | $ | (66,608 | ) | (11.4 | )% | 9.4 | % | 108.1 | % | ||||||||||
Down 200 basis points | $ | 506,685 | $ | (82,375 | ) | (14.0 | )% | 9.5 | % | 100.0 | % | $ | 464,710 | $ | (119,705 | ) | (20.5 | )% | 8.4 | % | 97.1 | % | ||||||||||
Down 300 basis points | $ | 474,890 | $ | (114,170 | ) | (19.4 | )% | 8.9 | % | 93.7 | % | $ | 434,424 | $ | (149,991 | ) | (25.7 | )% | 7.9 | % | 90.7 | % | ||||||||||
Gap Analysis
As part of the interest rate risk management process we use a gap analysis. A gap analysis provides information about the volume and repricing characteristics and relationship between the amounts of interest-sensitive assets and interest-bearing liabilities at a particular point in time. An effective interest rate strategy attempts to match the volume of interest sensitive assets and interest bearing liabilities repricing over different time intervals. The main focus of this interest rate management tool is the gap sensitivity identified as the cumulative one year gap.
The following table illustrates the volume and repricing characteristics of our balance sheet at December 31, 20102011 over the indicated time intervals:
| | | Amounts Maturing or Repricing In | | | Amounts Maturing or Repricing In | | | |||||||||||||||||||||||||||||||||
|---|---|---|---|---|---|---|---|---|---|---|---|---|---|---|---|---|---|---|---|---|---|---|---|---|---|---|---|---|---|---|---|---|---|---|---|---|---|---|---|---|
December 31, 2010 | 3 Months Or Less | Over 3 Months to 12 Months | Over 1 Year to 5 Years | Over 5 Years | Non Interest Rate Sensitive | Total | ||||||||||||||||||||||||||||||||||
December 31, 2011 | 3 Months Or Less | Over 3 Months to 12 Months | Over 1 Year to 5 Years | Over 5 Years | Non-Interest Rate Sensitive | Total | ||||||||||||||||||||||||||||||||||
| | | (Dollars in thousands) | (Dollars in thousands) | |||||||||||||||||||||||||||||||||||||
ASSETS | ASSETS | |||||||||||||||||||||||||||||||||||||||
Cash and deposits in financial institutions | Cash and deposits in financial institutions | $ | 26,267 | $ | — | $ | 115 | $ | — | $ | 82,170 | $ | 108,552 | $ | 203,160 | $ | 115 | $ | — | $ | — | $ | 92,342 | $ | 295,617 | |||||||||||||||
Investment securities | Investment securities | 12,432 | 23,500 | 21,972 | 871,152 | — | 929,056 | 13,869 | 20,802 | 10,686 | 1,327,107 | — | 1,372,464 | |||||||||||||||||||||||||||
Loans, net of unearned income | Loans, net of unearned income | 1,328,626 | 479,553 | 1,187,005 | 1,107,711 | — | 4,102,895 | 1,111,244 | 364,596 | 1,184,964 | 881,207 | — | 3,542,011 | |||||||||||||||||||||||||||
Other assets | Other assets | — | — | — | — | 388,518 | 388,518 | — | — | — | — | 318,145 | 318,145 | |||||||||||||||||||||||||||
Total assets | $ | 1,367,325 | $ | 503,053 | $ | 1,209,092 | $ | 1,978,863 | $ | 470,688 | $ | 5,529,021 | ||||||||||||||||||||||||||||
Total assets | $ | 1,328,273 | $ | 385,513 | $ | 1,195,650 | $ | 2,208,314 | $ | 410,487 | $ | 5,528,237 | ||||||||||||||||||||||||||||
LIABILITIES AND STOCKHOLDERS' EQUITY | LIABILITIES AND STOCKHOLDERS' EQUITY | |||||||||||||||||||||||||||||||||||||||
Noninterest-bearing demand deposits | Noninterest-bearing demand deposits | $ | — | $ | — | $ | — | $ | — | $ | 1,465,562 | $ | 1,465,562 | $ | — | $ | — | $ | — | $ | — | $ | 1,685,799 | $ | 1,685,799 | |||||||||||||||
Interest-bearing checking, money market and savings | Interest-bearing checking, money market and savings | 1,952,273 | — | — | — | — | 1,952,273 | 1,923,760 | — | — | — | — | 1,923,760 | |||||||||||||||||||||||||||
Time deposits | Time deposits | 320,057 | 397,315 | 514,491 | — | — | 1,231,863 | 169,559 | 250,618 | 547,717 | — | — | 967,894 | |||||||||||||||||||||||||||
Borrowings | Borrowings | — | — | — | 225,000 | — | 225,000 | — | — | — | 225,000 | — | 225,000 | |||||||||||||||||||||||||||
Subordinated debentures | Subordinated debentures | 108,250 | — | — | 18,558 | 2,764 | 129,572 | 108,250 | — | — | 18,558 | 2,463 | 129,271 | |||||||||||||||||||||||||||
Other liabilities | Other liabilities | — | — | — | — | 45,954 | 45,954 | — | — | — | — | 50,310 | 50,310 | |||||||||||||||||||||||||||
Stockholders' equity | Stockholders' equity | — | — | — | — | 478,797 | 478,797 | — | — | — | — | 546,203 | 546,203 | |||||||||||||||||||||||||||
Total liabilities and stockholders' equity | $ | 2,380,580 | $ | 397,315 | $ | 514,491 | $ | 243,558 | $ | 1,993,077 | $ | 5,529,021 | ||||||||||||||||||||||||||||
Total liabilities and stockholders' equity | $ | 2,201,569 | $ | 250,618 | $ | 547,717 | $ | 243,558 | $ | 2,284,775 | $ | 5,528,237 | ||||||||||||||||||||||||||||
Period gap | Period gap | $ | (1,013,255 | ) | $ | 105,738 | $ | 694,601 | $ | 1,735,305 | $ | (1,522,389 | ) | $ | (873,296 | ) | $ | 134,895 | $ | 647,933 | $ | 1,964,756 | $ | (1,874,288 | ) | |||||||||||||||
Cumulative interest-earning assets | Cumulative interest-earning assets | $ | 1,367,325 | $ | 1,870,378 | $ | 3,079,470 | $ | 5,058,333 | $ | 1,328,273 | $ | 1,713,786 | $ | 2,909,436 | $ | 5,117,750 | |||||||||||||||||||||||
Cumulative interest-bearing liabilities | Cumulative interest-bearing liabilities | $ | 2,380,580 | $ | 2,777,895 | $ | 3,292,386 | $ | 3,535,944 | $ | 2,201,569 | $ | 2,452,187 | $ | 2,999,904 | $ | 3,243,462 | |||||||||||||||||||||||
Cumulative gap | Cumulative gap | $ | (1,013,255 | ) | $ | (907,517 | ) | $ | (212,916 | ) | $ | 1,522,389 | $ | (873,296 | ) | $ | (738,401 | ) | $ | (90,468 | ) | $ | 1,874,288 | |||||||||||||||||
Cumulative interest-earning assets to cumulative interest-bearing liabilities | Cumulative interest-earning assets to cumulative interest-bearing liabilities | 57.4 | % | 67.3 | % | 93.5 | % | 143.1 | % | 60.3 | % | 69.9 | % | 97.0 | % | 157.8 | % | |||||||||||||||||||||||
Cumulative gap as a percent of: | Cumulative gap as a percent of: | |||||||||||||||||||||||||||||||||||||||
Total assets | (18.3 | )% | (16.4 | )% | (3.9 | )% | 27.5 | % | ||||||||||||||||||||||||||||||||
Interest-earning assets | (20.1 | )% | (18.0 | )% | (4.2 | )% | 30.3 | % | ||||||||||||||||||||||||||||||||
Total assets | (15.8 | )% | (13.4 | )% | (1.6 | )% | 33.9 | % | ||||||||||||||||||||||||||||||||
Interest-earning assets | (17.8 | )% | (15.0 | )% | (1.8 | )% | 38.1 | % | ||||||||||||||||||||||||||||||||
All amounts are reported at their contractual maturity or repricing periods, except for $55.0$46.1 million in FHLB stock which is shown as a longer-term repricing investment because the timing of the FHLB's suspended/reducedwhen FHLB stock redemptions and dividend payments.may be redeemed is uncertain. This analysis makes certain assumptions as to interest rate sensitivity of savings and NOW accounts which have no stated maturity and have had very little price fluctuation in the past three years. Money market accounts are repriced at management's discretion and generally are more rate sensitive.
The preceding table indicates that we had a negative one-year cumulative gap of $907.5$738.4 million at December 31, 2010, an increase2011, a decline of $184.7$169.1 million from the $722.8$907.5 million negative one-year gap position at December 31, 2009.2010. The growthdecrease in the negative gap iswas attributable mostly to a decline in one-year liabilities of $325.7 million, reflecting decreases of $297.2 million and $28.5 million in one-year time deposits and interest-bearing checking, money market and savings, respectively. Partially offsetting this decline was a decline in one-year assets of $156.6 million, reflecting a decrease in one-year loans of $332.3 million and an increase in one-year cash and deposits in financial institutions of $177.0 million.
one-year assets of $354.2 million, reflecting a decrease in one-year loans of $284.6 million. Partially offsetting this was a decline in one-year liabilities of $169.5 million, reflecting decreases of $222.1 million and $180.0 million in one-year time deposits and FHLB advances, respectively, and an increase of $232.6 million in interest-bearing checking, money market and savings. This gap position suggests that we are liability sensitive and if rates were to increase, our net interest margin would most likely decrease. The ratio of interest-earning assets to interest-bearing liabilities maturing or repricing within one year at December 31, 20102011 was 67.3%69.9%. This one-year gap position indicates that interest expense is likely to be affected to a greater extent than interest income for any changes in interest rates within one year from December 31, 2010.2011.
Borrowings included two long-term FHLB advances totaling $225.0 million at December 31, 2010,2011, with maturity dates of 2017 and 2018, which contain quarterly call options and are currently callable by the FHLB. While the FHLB may call the advances to be repaid for any reason, they are likely to be called if market interest rates, for borrowings of similar remaining term, are higher than the advances' stated rates on the call dates. If the advances are called by the FHLB, there is no prepayment penalty. Should our FHLB advances be called, we would evaluate the funding opportunities available at that time, including new secured borrowings from the FHLB at the then market rates. As borrowing rates are currently lower than our contract rates, we do not expect our secured FHLB borrowings to be called. We may repay the advances with a prepayment penalty at any time.
The gap table has inherent limitations and actual results may vary significantly from the results suggested by the gap table. The gap table is unable to incorporate certain balance sheet characteristics or factors. The gap table assumes a static balance sheet and, accordingly, looks at the repricing of existing assets and liabilities without consideration of new loans and deposits that reflect a more current interest rate environment. Unlike the net interest income simulation, however, the interest rate risk profile of certain deposit products and floating rate loans that have reached their floors cannot be captured effectively in a gap table. Although the table shows the amount of certain assets and liabilities scheduled to reprice in a given time frame, it does not reflect when or to what extent such repricings may actually occur. For example, interest-bearing checking, money market and savings deposits are shown to reprice in the first 3 months, but we may choose to reprice these deposits more slowly and incorporate only a portion of the movement in market rates based on market conditions at that time. Alternatively, a loan which has reached its floor may not reprice even though market interest rates change causing such loan to act like a fixed rate loan regardless of its scheduled repricing date. The gap table as presented cannot factor in the flexibility we believe we have in repricing deposits or the floors on our loans.
We believe the estimated effect of a change in interest rates is better reflected in our net interest income and market value of equity simulations which incorporate many of the factors mentioned.
ITEM 8. FINANCIAL STATEMENTS AND SUPPLEMENTARY DATA
Management's Report on Internal Control Over Financial Reporting | ||
Report of Independent Registered Public Accounting Firm | ||
Consolidated Balance Sheets as of December 31, | ||
Consolidated Statements of Earnings (Loss) for the Years Ended December 31, 2011, 2010 | ||
Consolidated Statements of Comprehensive Income (Loss) for the Years Ended December 31, 2011, 2010, and 2009 | 103 | |
Consolidated Statements of Changes in Stockholders' Equity | ||
Consolidated Statements of Cash Flows for the Years Ended December 31, 2011, 2010, | ||
Notes to Consolidated Financial Statements |
MANAGEMENT'S REPORT ON INTERNAL CONTROL OVER FINANCIAL REPORTING
The management of PacWest Bancorp, including its consolidated subsidiaries, is responsible for establishing and maintaining adequate internal control over financial reporting. The Company's internal control system was designed to provide reasonable assurance to the Company's management and Board of Directors regarding the preparation and fair presentation of published financial statements in accordance with U.S. generally accepted accounting principles. All internal control systems, no matter how well designed, have inherent limitations. Therefore, even those systems determined to be effective can provide only reasonable assurance with respect to financial statement preparation and presentation.
Management maintains a comprehensive system of controls intended to ensure that transactions are executed in accordance with management's authorization, assets are safeguarded, and financial records are reliable. Management also takes steps to see that information and communication flows are effective and to monitor performance, including performance of internal control procedures.
As of December 31, 2010,2011, PacWest Bancorp management assessed the effectiveness of the Company's internal control over financial reporting based on the framework established inInternal Control—Integrated Framework issued by the Committee of Sponsoring Organizations of the Treadway Commission. Based on this assessment, management has determined that the Company's internal control over financial reporting as of December 31, 2010,2011, is effective.
Because of its inherent limitations, internal control over financial reporting may not prevent or detect misstatements should they occur. Also, projections of any evaluation of effectiveness to future periods are subject to the risk that controls may become inadequate because of changes in conditions, or that the degree of compliance with the control procedures may deteriorate.
KPMG LLP, the independent registered public accounting firm that audited the Company's consolidated financial statements included in this Annual Report on Form 10-K, has issued a report on the effectiveness of the Company's internal control over financial reporting as of December 31, 2010.2011. The report, which expresses an unqualified opinion on the effectiveness of the Company's internal control over financial reporting as of December 31, 2010,2011, is included in this Item under the heading "Report of Independent Registered Public Accounting Firm."
Report of Independent Registered Public Accounting Firm
The Board of Directors and Stockholders
PacWest Bancorp:
We have audited the accompanying consolidated balance sheets of PacWest Bancorp and subsidiaries as of December 31, 20102011 and 2009,2010, and the related consolidated statements of earnings (loss), comprehensive income (loss), changes in stockholders' equity, and comprehensive income (loss), and cash flows for each of the years in the three-year period ended December 31, 2010.2011. We also have audited PacWest Bancorp's internal control over financial reporting as of December 31, 2010,2011, based on criteria established inInternal Control—Integrated Framework issued by the Committee of Sponsoring Organizations of the Treadway Commission (COSO). PacWest Bancorp's management is responsible for these consolidated financial statements, for maintaining effective internal control over financial reporting, and for its assessment of the effectiveness of internal control over financial reporting, included in the accompanying management's report on internal control over financial reporting. Our responsibility is to express an opinion on these consolidated financial statements and an opinion on the Company's internal control over financial reporting based on our audits.
We conducted our audits in accordance with the standards of the Public Company Accounting Oversight Board (United States). Those standards require that we plan and perform the audits to obtain reasonable assurance about whether the financial statements are free of material misstatement and whether effective internal control over financial reporting was maintained in all material respects. Our audits of the consolidated financial statements included examining, on a test basis, evidence supporting the amounts and disclosures in the financial statements, assessing the accounting principles used and significant estimates made by management, and evaluating the overall financial statement presentation. Our audit of internal control over financial reporting included obtaining an understanding of internal control over financial reporting, assessing the risk that a material weakness exists, and testing and evaluating the design and operating effectiveness of internal control based on the assessed risk. Our audits also included performing such other procedures as we considered necessary in the circumstances. We believe that our audits provide a reasonable basis for our opinions.
A company's internal control over financial reporting is a process designed to provide reasonable assurance regarding the reliability of financial reporting and the preparation of financial statements for external purposes in accordance with generally accepted accounting principles. A company's internal control over financial reporting includes those policies and procedures that (1) pertain to the maintenance of records that, in reasonable detail, accurately and fairly reflect the transactions and dispositions of the assets of the company; (2) provide reasonable assurance that transactions are recorded as necessary to permit preparation of financial statements in accordance with generally accepted accounting principles, and that receipts and expenditures of the company are being made only in accordance with authorizations of management and directors of the company; and (3) provide reasonable assurance regarding prevention or timely detection of unauthorized acquisition, use, or disposition of the company's assets that could have a material effect on the financial statements.
Because of its inherent limitations, internal control over financial reporting may not prevent or detect misstatements. Also, projections of any evaluation of effectiveness to future periods are subject to the risk that controls may become inadequate because of changes in conditions, or that the degree of compliance with the policies or procedures may deteriorate.
In our opinion, the consolidated financial statements referred to above present fairly, in all material respects, the financial position of PacWest Bancorp and subsidiaries as of December 31, 20102011 and 2009,2010, and the results of their operations and their cash flows for each of the years in the three-year period ended December 31, 2010,2011, in conformity with U.S. generally accepted accounting principles. Also in our opinion, PacWest Bancorp maintained, in all material respects, effective internal control over financial reporting as of December 31, 2010,2011, based on criteria established inInternal Control—Integrated Framework issued by COSO.
/s/ /s/ KPMG LLP
Los Angeles, California
March 14, 20112012
PACWEST BANCORP AND SUBSIDIARIES
CONSOLIDATED BALANCE SHEETS
(Dollars in Thousands, Except Par Value Data)
| | | December 31, | December 31, | |||||||||||||
|---|---|---|---|---|---|---|---|---|---|---|---|---|---|---|---|---|
| | | 2010 | 2009 | 2011 | 2010 | |||||||||||
ASSETS | ASSETS | |||||||||||||||
Cash and due from banks | $ | 92,342 | $ | 82,170 | ||||||||||||
Interest-earning deposits in financial institutions | 203,275 | 26,382 | ||||||||||||||
Cash and due from banks | $ | 82,170 | $ | 93,915 | ||||||||||||
Total cash and cash equivalents | 295,617 | 108,552 | ||||||||||||||
Interest-earning deposits in financial institutions | 26,382 | 117,133 | ||||||||||||||
Securities available-for-sale, at fair value ($45,149 and $50,437 covered by FDIC loss sharing at December 31, 2011 and 2010, respectively) | 1,326,358 | 874,016 | ||||||||||||||
Federal Home Loan Bank stock, at cost | 46,106 | 55,040 | ||||||||||||||
Total investment securities | 1,372,464 | 929,056 | ||||||||||||||
Total cash and cash equivalents | 108,552 | 211,048 | ||||||||||||||
Non-covered loans, net of unearned income | 2,807,713 | 3,161,055 | ||||||||||||||
Allowance for loan losses | (85,313 | ) | (98,653 | ) | ||||||||||||
Non-covered loans, net | 2,722,400 | 3,062,402 | ||||||||||||||
Covered loans, net | 703,023 | 908,576 | ||||||||||||||
Securities available-for-sale, at fair value ($50,437 and $52,125 covered by FDIC loss share at December 31, 2010 and 2009, respectively) | 874,016 | 423,700 | ||||||||||||||
Total loans | 3,425,423 | 3,970,978 | ||||||||||||||
Federal Home Loan Bank stock, at cost | 55,040 | 50,429 | ||||||||||||||
Other real estate owned, net ($33,506 and $55,816 covered by FDIC loss sharing at December 31, 2011 and 2010, respectively) | 81,918 | 81,414 | ||||||||||||||
Premises and equipment, net | 23,068 | 22,578 | ||||||||||||||
FDIC loss sharing asset | 95,187 | 116,352 | ||||||||||||||
Cash surrender value of life insurance | 67,469 | 66,182 | ||||||||||||||
Goodwill | 39,141 | 47,301 | ||||||||||||||
Core deposit and customer relationship intangibles, net | 17,415 | 25,843 | ||||||||||||||
Other assets | 110,535 | 160,765 | ||||||||||||||
Total investment securities | 929,056 | 474,129 | ||||||||||||||
Non-covered loans, net of unearned income | 3,161,055 | 3,707,383 | ||||||||||||||
Allowance for loan losses | (98,653 | ) | (118,717 | ) | ||||||||||||
Total non-covered loans, net | 3,062,402 | 3,588,666 | ||||||||||||||
Covered loans, net | 908,576 | 621,686 | ||||||||||||||
Total loans | 3,970,978 | 4,210,352 | ||||||||||||||
Other real estate owned ($55,816 and $27,688 covered by FDIC loss share at December 31, 2010 and 2009, respectively) | 81,414 | 70,943 | ||||||||||||||
Premises and equipment, net | 22,578 | 22,546 | ||||||||||||||
FDIC loss sharing asset | 116,352 | 112,817 | ||||||||||||||
Cash surrender value of life insurance | 66,182 | 66,149 | ||||||||||||||
Core deposit and customer relationship intangibles | 25,843 | 33,296 | ||||||||||||||
Goodwill | 47,301 | — | ||||||||||||||
Other assets | 160,765 | 122,799 | ||||||||||||||
Total assets | $ | 5,529,021 | $ | 5,324,079 | ||||||||||||
Total assets | $ | 5,528,237 | $ | 5,529,021 | ||||||||||||
LIABILITIES | LIABILITIES | |||||||||||||||
Noninterest-bearing deposits | $ | 1,685,799 | $ | 1,465,562 | ||||||||||||
Interest-bearing deposits | 2,891,654 | 3,184,136 | ||||||||||||||
Noninterest-bearing deposits | $ | 1,465,562 | $ | 1,302,974 | ||||||||||||
Total deposits | 4,577,453 | 4,649,698 | ||||||||||||||
Borrowings | 225,000 | 225,000 | ||||||||||||||
Subordinated debentures | 129,271 | 129,572 | ||||||||||||||
Accrued interest payable and other liabilities | 50,310 | 45,954 | ||||||||||||||
Interest-bearing deposits | 3,184,136 | 2,791,595 | ||||||||||||||
Total deposits | 4,649,698 | 4,094,569 | ||||||||||||||
Borrowings | 225,000 | 542,763 | ||||||||||||||
Subordinated debentures | 129,572 | 129,798 | ||||||||||||||
Accrued interest payable and other liabilities | 45,954 | 50,176 | ||||||||||||||
Total liabilities | 5,050,224 | 4,817,306 | ||||||||||||||
Total liabilities | 4,982,034 | 5,050,224 | ||||||||||||||
Commitments and contingencies | Commitments and contingencies | |||||||||||||||
STOCKHOLDERS' EQUITY | STOCKHOLDERS' EQUITY | |||||||||||||||
Preferred stock, $0.01 par value; authorized 5,000,000 shares; none issued and outstanding | — | — | ||||||||||||||
Common stock, $0.01 par value; authorized 75,000,000 shares; issued 37,542,287 and 36,880,225 shares at December 31, 2011 and 2010, respectively (includes 1,675,730 and 1,230,582 shares of unvested restricted stock, respectively) | 375 | 369 | ||||||||||||||
Additional paid-in capital | 1,084,691 | 1,085,364 | ||||||||||||||
Accumulated deficit | (556,338 | ) | (607,042 | ) | ||||||||||||
Treasury stock, at cost—287,969 and 207,796 shares at December 31, 2011 and 2010 | (5,328 | ) | (3,863 | ) | ||||||||||||
Accumulated other comprehensive income | 22,803 | 3,969 | ||||||||||||||
Preferred stock, $0.01 par value; authorized 5,000,000 shares; none issued and outstanding | — | — | ||||||||||||||
Total stockholders' equity | 546,203 | 478,797 | ||||||||||||||
Common stock, $0.01 par value; authorized 75,000,000 and 50,000,000 shares at December 31, 2010 and 2009, respectively; issued 36,880,225 and 35,128,452 shares, respectively (includes 1,230,582 and 1,095,417 shares of unvested restricted stock, respectively) | 369 | 351 | ||||||||||||||
Total liabilities and stockholders' equity | $ | 5,528,237 | $ | 5,529,021 | ||||||||||||
Additional paid-in capital | 1,085,364 | 1,053,584 | ||||||||||||||
Accumulated deficit | (607,042 | ) | (545,026 | ) | ||||||||||||
Treasury stock, at cost—207,796 and 113,130 shares at December 31, 2010 and 2009, respectively | (3,863 | ) | (2,032 | ) | ||||||||||||
Accumulated other comprehensive income (loss) | 3,969 | (104 | ) | |||||||||||||
Total stockholders' equity | 478,797 | 506,773 | ||||||||||||||
Total liabilities and stockholders' equity | $ | 5,529,021 | $ | 5,324,079 | ||||||||||||
See accompanying Notes to Consolidated Financial Statements.
PACWEST BANCORP AND SUBSIDIARIES
CONSOLIDATED STATEMENTS OF EARNINGS (LOSS)
(Dollars in Thousands, Except Per Share Data)
| | Year Ended December 31, | |||||||||
|---|---|---|---|---|---|---|---|---|---|---|
| | 2011 | 2010 | 2009 | |||||||
INTEREST INCOME: | ||||||||||
Loans | $ | 260,143 | $ | 265,136 | $ | 258,499 | ||||
Investment securities | 34,785 | 24,564 | 10,969 | |||||||
Deposits in financial institutions | 356 | 584 | 406 | |||||||
Total interest income | 295,284 | 290,284 | 269,874 | |||||||
INTEREST EXPENSE: | ||||||||||
Deposits | 20,649 | 26,237 | 31,916 | |||||||
Borrowings | 7,071 | 9,126 | 15,497 | |||||||
Subordinated debentures | 4,923 | 5,594 | 6,415 | |||||||
Total interest expense | 32,643 | 40,957 | 53,828 | |||||||
Net interest income | 262,641 | 249,327 | 216,046 | |||||||
PROVISION FOR CREDIT LOSSES: | ||||||||||
Non-covered loans | 13,300 | 178,992 | 141,900 | |||||||
Covered loans | 13,270 | 33,500 | 18,000 | |||||||
Total provision for credit losses | 26,570 | 212,492 | 159,900 | |||||||
Net interest income after provision for credit losses | 236,071 | 36,835 | 56,146 | |||||||
NONINTEREST INCOME: | ||||||||||
Service charges on deposit accounts | 13,829 | 11,561 | 12,008 | |||||||
Other commissions and fees | 7,616 | 7,291 | 6,951 | |||||||
Other-than-temporary-impairment loss on covered securities | — | (874 | ) | — | ||||||
Increase in cash surrender value of life insurance | 1,443 | 1,440 | 1,579 | |||||||
FDIC loss sharing income, net | 7,776 | 22,784 | 16,314 | |||||||
Gain from Affinity acquisition | — | — | 66,989 | |||||||
Other income | 762 | 1,036 | 2,066 | |||||||
Total noninterest income | 31,426 | 43,238 | 105,907 | |||||||
NONINTEREST EXPENSE: | ||||||||||
Compensation | 86,800 | 87,483 | 78,173 | |||||||
Occupancy | 28,685 | 27,639 | 26,383 | |||||||
Data processing | 8,964 | 8,538 | 6,946 | |||||||
Other professional services | 8,986 | 7,835 | 6,314 | |||||||
Business development | 2,321 | 2,463 | 2,541 | |||||||
Communications | 3,011 | 3,329 | 2,932 | |||||||
Insurance and assessments | 7,171 | 9,685 | 9,305 | |||||||
Non-covered other real estate owned, net | 7,010 | 12,310 | 21,569 | |||||||
Covered other real estate owned, net | 3,666 | 2,460 | 1,753 | |||||||
Intangible asset amortization | 8,428 | 9,642 | 9,547 | |||||||
Acquisition costs | 600 | 732 | 600 | |||||||
Other expense | 14,351 | 16,687 | 13,141 | |||||||
Total noninterest expense | 179,993 | 188,803 | 179,204 | |||||||
Earnings (loss) before income taxes | 87,504 | (108,730 | ) | (17,151 | ) | |||||
Income tax (expense) benefit | (36,800 | ) | 46,714 | 7,801 | ||||||
NET EARNINGS (LOSS) | $ | 50,704 | $ | (62,016 | ) | $ | (9,350 | ) | ||
Earnings (loss) per share: | ||||||||||
Basic | $ | 1.37 | $ | (1.77 | ) | $ | (0.30 | ) | ||
Diluted | $ | 1.37 | $ | (1.77 | ) | $ | (0.30 | ) | ||
See accompanying Notes to Consolidated Financial Statements.
PACWEST BANCORP AND SUBSIDIARIES
CONSOLIDATED STATEMENTS OF COMPREHENSIVE INCOME (LOSS)
(In Thousands)
| | Year Ended December 31, | |||||||||
|---|---|---|---|---|---|---|---|---|---|---|
| | 2011 | 2010 | 2009 | |||||||
Net earnings (loss) | $ | 50,704 | $ | (62,016 | ) | $ | (9,350 | ) | ||
Other comprehensive income (loss), net of related income taxes: | ||||||||||
Unrealized holding gains (losses) on securities available-for-sale arising during the period: | ||||||||||
Before tax | 32,473 | 7,023 | (2,683 | ) | ||||||
Income tax (expense) benefit | (13,639 | ) | (2,950 | ) | 1,127 | |||||
Other comprehensive income (loss) | 18,834 | 4,073 | (1,556 | ) | ||||||
COMPREHENSIVE INCOME (LOSS) | $ | 69,538 | $ | (57,943 | ) | $ | (10,906 | ) | ||
See accompanying Notes to Consolidated Financial Statements.
PACWEST BANCORP AND SUBSIDIARIES
CONSOLIDATED STATEMENTS OF CHANGES IN STOCKHOLDERS' EQUITY
(Dollars in Thousands, Except Per Share Data)
| | Common Stock | | | Accumulated Other Comprehensive Income (Loss) | | |||||||||||||||||
|---|---|---|---|---|---|---|---|---|---|---|---|---|---|---|---|---|---|---|---|---|---|---|
| | Shares | Par Value | Additional Paid-in Capital | Accumulated Deficit | Treasury Stock | Total | ||||||||||||||||
BALANCE, DECEMBER 31, 2008 | 28,516,106 | 285 | 909,922 | (535,676 | ) | (257 | ) | 1,452 | 375,726 | |||||||||||||
Net loss | — | — | — | (9,350 | ) | — | — | (9,350 | ) | |||||||||||||
Decrease in net unrealized gain on securities available-for-sale, net of tax | — | — | — | — | — | (1,556 | ) | (1,556 | ) | |||||||||||||
Issuance of common stock | 6,569,466 | 66 | 148,716 | — | — | — | 148,782 | |||||||||||||||
Tax effect from vesting of restricted stock | — | — | (2,108 | ) | — | — | — | (2,108 | ) | |||||||||||||
Restricted stock awarded and earned stock compensation, net of shares forefeited | 30,520 | — | 8,199 | — | — | — | 8,199 | |||||||||||||||
Restricted stock surrendered | (100,770 | ) | — | — | — | (1,775 | ) | — | (1,775 | ) | ||||||||||||
Cash dividends paid ($0.35 per share) | — | — | (11,145 | ) | — | — | — | (11,145 | ) | |||||||||||||
BALANCE, DECEMBER 31, 2009 | 35,015,322 | $ | 351 | $ | 1,053,584 | $ | (545,026 | ) | $ | (2,032 | ) | $ | (104 | ) | $ | 506,773 | ||||||
Net loss | — | — | — | (62,016 | ) | — | — | (62,016 | ) | |||||||||||||
Increase in net unrealized gain on securities available-for-sale, net of tax | — | — | — | — | — | 4,073 | 4,073 | |||||||||||||||
Issuance of common stock | 1,348,040 | 14 | 26,573 | — | — | — | 26,587 | |||||||||||||||
Tax effect from vesting of restricted stock | — | — | (1,840 | ) | — | — | — | (1,840 | ) | |||||||||||||
Restricted stock awarded and earned stock compensation, net of shares forefeited | 403,733 | 4 | 8,492 | — | — | — | 8,496 | |||||||||||||||
Restricted stock surrendered | (94,666 | ) | — | — | — | (1,831 | ) | — | (1,831 | ) | ||||||||||||
Cash dividends paid ($0.04 per share) | — | — | (1,445 | ) | — | — | — | (1,445 | ) | |||||||||||||
BALANCE, DECEMBER 31, 2010 | 36,672,429 | $ | 369 | $ | 1,085,364 | $ | (607,042 | ) | $ | (3,863 | ) | $ | 3,969 | $ | 478,797 | |||||||
Net earnings | — | — | — | 50,704 | — | — | 50,704 | |||||||||||||||
Increase in net unrealized gain on securities available-for-sale, net of tax | — | — | — | — | — | 18,834 | 18,834 | |||||||||||||||
Tax effect from vesting of restricted stock | — | — | (937 | ) | — | — | — | (937 | ) | |||||||||||||
Restricted stock awarded and earned stock compensation, net of shares forefeited | 662,062 | 6 | 7,890 | — | — | — | 7,896 | |||||||||||||||
Restricted stock surrendered | (80,173 | ) | — | — | — | (1,465 | ) | — | (1,465 | ) | ||||||||||||
Cash dividends paid ($0.21 per share) | — | — | (7,626 | ) | — | — | — | (7,626 | ) | |||||||||||||
BALANCE, DECEMBER 31, 2011 | 37,254,318 | $ | 375 | $ | 1,084,691 | $ | (556,338 | ) | $ | (5,328 | ) | $ | 22,803 | $ | 546,203 | |||||||
See accompanying Notes to Consolidated Financial Statements.
PACWEST BANCORP AND SUBSIDIARIES
CONSOLIDATED STATEMENTS OF CASH FLOWS
(In Thousands)
| | Year Ended December 31, | |||||||||
|---|---|---|---|---|---|---|---|---|---|---|
| | 2011 | 2010 | 2009 | |||||||
CASH FLOWS FROM OPERATING ACTIVITIES: | ||||||||||
Net earnings (loss) | $ | 50,704 | $ | (62,016 | ) | $ | (9,350 | ) | ||
Adjustments to reconcile net earnings (loss) to net cash provided by operating activities: | ||||||||||
Depreciation and amortization | 20,084 | 16,722 | 14,606 | |||||||
Provision for credit losses | 26,570 | 212,492 | 159,900 | |||||||
Gain from Affinity acquisition | — | — | (66,989 | ) | ||||||
(Gain) loss on sale of other real estate owned | (9,140 | ) | (5,525 | ) | 1,308 | |||||
Provision for losses and valuation adjustments on other real estate owned | 16,994 | 17,660 | 17,795 | |||||||
(Gain) loss on sale of premises and equipment | (23 | ) | (4 | ) | 12 | |||||
Impairment loss on covered securities | — | 874 | — | |||||||
Earned stock compensation | 7,896 | 8,496 | 8,199 | |||||||
Tax effect in stockholders' equity of restricted stock vesting | 937 | 1,840 | 2,108 | |||||||
Increase (decrease) in accrued and deferred income taxes, net | 17,694 | (42,562 | ) | (19,274 | ) | |||||
Decrease in FDIC loss sharing asset | 21,165 | 67,669 | — | |||||||
Decrease (increase) in other assets | 18,053 | 27,205 | (13,573 | ) | ||||||
Increase in accrued interest payable and other liabilities | (661 | ) | (8,553 | ) | (18,718 | ) | ||||
Net cash provided by operating activities | 170,273 | 234,298 | 76,024 | |||||||
CASH FLOWS FROM INVESTING ACTIVITIES: | ||||||||||
Resolution of goodwill matter with FDIC | 7,636 | — | — | |||||||
Net cash and cash equivalents acquired in acquisitions | — | 171,366 | 251,679 | |||||||
Net decrease in loans | 450,492 | 126,813 | 122,708 | |||||||
Proceeds from sales of loans | 2,495 | 258,128 | 36,919 | |||||||
Securities available-for-sale: | ||||||||||
Proceeds from maturities and paydowns | 231,898 | 215,113 | 81,783 | |||||||
Purchases | (658,310 | ) | (627,884 | ) | (227,546 | ) | ||||
Net redemptions of Federal Home Loan Bank stock | 8,934 | 6,036 | — | |||||||
Proceeds from sale of other real estate owned | 61,954 | 83,141 | 42,496 | |||||||
Capitalized costs to complete other real estate owned | (125 | ) | (902 | ) | (1,504 | ) | ||||
Purchases of premises and equipment | (5,936 | ) | (5,271 | ) | (3,343 | ) | ||||
Proceeds from sale of premises and equipment | 27 | 27 | 69 | |||||||
Net cash provided by investing activities | 99,065 | 226,567 | 303,261 | |||||||
CASH FLOWS FROM FINANCING ACTIVITIES: | ||||||||||
Net increase (decrease) in deposits: | ||||||||||
Noninterest-bearing | 220,237 | 128,866 | 131,245 | |||||||
Interest-bearing | (292,482 | ) | (325,922 | ) | (380,067 | ) | ||||
Net decrease in borrowings | — | (387,776 | ) | (213,039 | ) | |||||
Net proceeds from issuance of common stock | — | 26,587 | 148,782 | |||||||
Tax effect in stockholders' equity of restricted stock vesting | (937 | ) | (1,840 | ) | (2,108 | ) | ||||
Restricted stock surrendered | (1,465 | ) | (1,831 | ) | (1,775 | ) | ||||
Cash dividends paid | (7,626 | ) | (1,445 | ) | (11,145 | ) | ||||
Net cash used in financing activities | (82,273 | ) | (563,361 | ) | (328,107 | ) | ||||
Net (decrease) increase in cash and cash equivalents | 187,065 | (102,496 | ) | 51,178 | ||||||
Cash and cash equivalents at beginning of year | 108,552 | 211,048 | 159,870 | |||||||
Cash and cash equivalents at end of year | $ | 295,617 | $ | 108,552 | $ | 211,048 | ||||
Supplemental disclosure of cash flow information: | ||||||||||
Cash paid during the year for interest | $ | 33,000 | $ | 41,844 | $ | 57,565 | ||||
Cash paid (received) during the year for income taxes | 19,083 | (4,193 | ) | 11,426 | ||||||
Supplemental disclosure of noncash investing and financing activities: | ||||||||||
Transfer of loans to other real estate owned | 68,683 | 68,447 | 66,096 | |||||||
See accompanying Notes to Consolidated Financial Statements.
PACWEST BANCORP AND SUBSIDIARIES
CONSOLIDATED STATEMENTS OF EARNINGS (LOSS)
(Dollars in Thousands, Except Per Share Data)
| | Year Ended December 31, | |||||||||||
|---|---|---|---|---|---|---|---|---|---|---|---|---|
| | 2010 | 2009 | 2008 | |||||||||
INTEREST INCOME: | ||||||||||||
Loans | $ | 265,136 | $ | 258,499 | $ | 280,408 | ||||||
Investment securities | 24,564 | 10,969 | 7,077 | |||||||||
Deposits in financial institutions | 584 | 406 | 182 | |||||||||
Federal funds sold | — | — | 161 | |||||||||
Total interest income | 290,284 | 269,874 | 287,828 | |||||||||
INTEREST EXPENSE: | ||||||||||||
Deposits | 26,237 | 31,916 | 41,157 | |||||||||
Borrowings | 9,126 | 15,497 | 18,742 | |||||||||
Subordinated debentures | 5,594 | 6,415 | 8,597 | |||||||||
Total interest expense | 40,957 | 53,828 | 68,496 | |||||||||
Net interest income | 249,327 | 216,046 | 219,332 | |||||||||
PROVISION FOR CREDIT LOSSES: | ||||||||||||
Non-covered loans | 178,992 | 141,900 | 45,800 | |||||||||
Covered loans | 39,046 | 18,000 | — | |||||||||
Total provision for credit losses | 218,038 | 159,900 | 45,800 | |||||||||
Net interest income after provision for credit losses | 31,289 | 56,146 | 173,532 | |||||||||
NONINTEREST INCOME: | ||||||||||||
Service charges on deposit accounts | 11,561 | 12,008 | 13,014 | |||||||||
Other commissions and fees | 7,291 | 6,951 | 7,277 | |||||||||
Other-than-temporary-impairment loss on covered securities | (874 | ) | — | — | ||||||||
FDIC loss sharing income, net | 28,330 | 16,314 | — | |||||||||
Increase in cash surrender value of life insurance | 1,440 | 1,579 | 2,420 | |||||||||
Gain from Affinity acquisition | — | 66,989 | — | |||||||||
Loss on sale of loans, net | — | — | (303 | ) | ||||||||
Other income | 1,036 | 2,066 | 2,019 | |||||||||
Total noninterest income | 48,784 | 105,907 | 24,427 | |||||||||
NONINTEREST EXPENSE: | ||||||||||||
Compensation | 87,483 | 78,173 | 72,185 | |||||||||
Occupancy | 27,639 | 26,383 | 24,531 | |||||||||
Data processing | 8,538 | 6,946 | 6,232 | |||||||||
Other professional services | 8,567 | 6,914 | 6,540 | |||||||||
Business development | 2,463 | 2,541 | 3,044 | |||||||||
Communications | 3,329 | 2,932 | 3,151 | |||||||||
Insurance and assessments | 9,685 | 9,305 | 3,523 | |||||||||
Other real estate owned, net | 14,770 | 23,322 | 2,218 | |||||||||
Intangible asset amortization | 9,642 | 9,547 | 9,620 | |||||||||
Goodwill write-off | — | — | 761,701 | |||||||||
Other expense | 16,687 | 13,141 | 13,190 | |||||||||
Total noninterest expense | 188,803 | 179,204 | 905,935 | |||||||||
Loss before income taxes | (108,730 | ) | (17,151 | ) | (707,976 | ) | ||||||
Income tax benefit (expense) | 46,714 | 7,801 | (20,089 | ) | ||||||||
NET LOSS | $ | (62,016 | ) | $ | (9,350 | ) | $ | (728,065 | ) | |||
Loss per share: | ||||||||||||
Basic | $ | (1.77 | ) | $ | (0.30 | ) | $ | (26.81 | ) | |||
Diluted | $ | (1.77 | ) | $ | (0.30 | ) | $ | (26.81 | ) | |||
See accompanying Notes to Consolidated Financial Statements.
PACWEST BANCORP AND SUBSIDIARIES
CONSOLIDATED STATEMENTS OF CHANGES IN STOCKHOLDERS' EQUITY ANDCOMPREHENSIVE INCOME (LOSS)
(Dollars in Thousands, Except Per Share Data)
| | Common Stock | | | Accumulated Other Comprehensive Income (Loss) | | ||||||||||||||||||
|---|---|---|---|---|---|---|---|---|---|---|---|---|---|---|---|---|---|---|---|---|---|---|---|
| | Retained Earnings (Accumulated Deficit) | | | ||||||||||||||||||||
| | Shares | Par Value | Additional Paid-in Capital | Treasury Stock | Total | ||||||||||||||||||
BALANCE, JANUARY 1, 2008 | 28,002,382 | $ | 280 | $ | 936,328 | $ | 201,220 | $ | — | $ | 524 | $ | 1,138,352 | ||||||||||
Comprehensive income (loss): | |||||||||||||||||||||||
Net loss | — | — | — | (728,065 | ) | — | — | (728,065 | ) | ||||||||||||||
Other comprehensive income-increase in net unrealized gain on securities available-for-sale, net of tax effect of $672 thousand | — | — | — | — | — | 928 | 928 | ||||||||||||||||
Total comprehensive loss | (727,137 | ) | |||||||||||||||||||||
Exercise of stock options | 1,000 | — | 30 | — | — | — | 30 | ||||||||||||||||
Tax effect from exercise of options and vesting of restricted stock | — | — | (466 | ) | — | — | — | (466 | ) | ||||||||||||||
Restricted stock awarded and earned stock compensation, net of shares forefeited | 537,215 | 5 | 925 | — | — | — | 930 | ||||||||||||||||
Restricted stock surrendered | (24,491 | ) | — | (288 | ) | — | (257 | ) | — | (545 | ) | ||||||||||||
Cash dividends paid ($1.28 per share) | — | — | (26,607 | ) | (8,831 | ) | — | — | (35,438 | ) | |||||||||||||
BALANCE, DECEMBER 31, 2008 | 28,516,106 | 285 | 909,922 | (535,676 | ) | (257 | ) | 1,452 | 375,726 | ||||||||||||||
Comprehensive income (loss): | |||||||||||||||||||||||
Net loss | — | — | — | (9,350 | ) | — | — | (9,350 | ) | ||||||||||||||
Other comprehensive income-increase in net unrealized gain on securities available-for-sale, net of tax effect of $1,127 thousand | — | — | — | — | — | (1,556 | ) | (1,556 | ) | ||||||||||||||
Total comprehensive loss | (10,906 | ) | |||||||||||||||||||||
Issuance of common stock | 6,569,466 | 66 | 148,716 | — | — | — | 148,782 | ||||||||||||||||
Tax effect from vesting of restricted stock | — | — | (2,108 | ) | — | — | — | (2,108 | ) | ||||||||||||||
Restricted stock awarded and earned stock compensation, net of shares forefeited | 30,520 | — | 8,199 | — | — | — | 8,199 | ||||||||||||||||
Restricted stock surrendered | (100,770 | ) | — | — | (1,775 | ) | — | (1,775 | ) | ||||||||||||||
Cash dividends paid ($0.35 per share) | — | — | (11,145 | ) | — | — | — | (11,145 | ) | ||||||||||||||
BALANCE, DECEMBER 31, 2009 | 35,015,322 | $ | 351 | $ | 1,053,584 | $ | (545,026 | ) | $ | (2,032 | ) | $ | (104 | ) | $ | 506,773 | |||||||
Comprehensive income (loss): | |||||||||||||||||||||||
Net loss | — | — | — | (62,016 | ) | — | — | (62,016 | ) | ||||||||||||||
Other comprehensive income-increase in net unrealized gain on securities available-for-sale, net of tax effect of $2,950 thousand | — | — | — | — | — | 4,073 | 4,073 | ||||||||||||||||
Total comprehensive loss | (57,943 | ) | |||||||||||||||||||||
Issuance of common stock | 1,348,040 | 14 | 26,573 | — | — | — | 26,587 | ||||||||||||||||
Tax effect from vesting of restricted stock | (1,840 | ) | — | — | — | (1,840 | ) | ||||||||||||||||
Restricted stock awarded and earned stock compensation, net of shares forefeited | 403,733 | 4 | 8,492 | — | — | — | 8,496 | ||||||||||||||||
Restricted stock surrendered | (94,666 | ) | — | — | — | (1,831 | ) | (1,831 | ) | ||||||||||||||
Cash dividends paid ($0.04 per share) | — | — | (1,445 | ) | — | — | — | (1,445 | ) | ||||||||||||||
BALANCE, DECEMBER 31, 2010 | 36,672,429 | $ | 369 | $ | 1,085,364 | $ | (607,042 | ) | $ | (3,863 | ) | $ | 3,969 | $ | 478,797 | ||||||||
See accompanying Notes to Consolidated Financial Statements.
PACWEST BANCORP AND SUBSIDIARIES
CONSOLIDATED STATEMENTS OF CASH FLOWS
(In Thousands)
| | Year Ended December 31, | ||||||||||||
|---|---|---|---|---|---|---|---|---|---|---|---|---|---|
| | 2010 | 2009 | 2008 | ||||||||||
CASH FLOWS FROM OPERATING ACTIVITIES: | |||||||||||||
Net loss | $ | (62,016 | ) | $ | (9,350 | ) | $ | (728,065 | ) | ||||
Adjustments to reconcile net earnings (loss) to net cash provided by operating activities: | |||||||||||||
Goodwill write-off | — | — | 761,701 | ||||||||||
Depreciation and amortization | 16,722 | 14,606 | 14,538 | ||||||||||
Provision for credit losses | 218,038 | 159,900 | 45,800 | ||||||||||
Gain from Affinity acquisition | — | (66,989 | ) | — | |||||||||
(Gain) loss on sale of other real estate owned | (5,525 | ) | 1,308 | (380 | ) | ||||||||
Provision for losses and valuation adjustments on other real estate owned | 17,660 | 17,795 | 1,268 | ||||||||||
Loss (gain) on sale of loans | — | — | 303 | ||||||||||
(Gain) loss on sale of premises and equipment | (4 | ) | 12 | 35 | |||||||||
Gain on sale of securities | — | — | (81 | ) | |||||||||
Impairment loss on covered securities | 874 | — | |||||||||||
Proceeds from sale of loans held for sale | — | — | 7,868 | ||||||||||
Origination of loans held for sale | — | — | (1,665 | ) | |||||||||
Restricted stock amortization | 8,496 | 8,199 | 930 | ||||||||||
Tax effect in stockholders' equity of restricted stock vesting and stock option exercises | 1,840 | 2,108 | 466 | ||||||||||
Decrease in accrued and deferred income taxes, net | (42,562 | ) | (19,274 | ) | (2,530 | ) | |||||||
Decrease in FDIC loss sharing asset | 67,669 | — | — | ||||||||||
Decrease (increase) in other assets | 27,205 | (13,464 | ) | 10,736 | |||||||||
(Increase) decrease in accrued interest payable and other liabilities | (8,553 | ) | (18,718 | ) | 4,520 | ||||||||
Stock dividends on Federal Home Loan Bank stock | — | — | (1,535 | ) | |||||||||
Net cash provided by operating activities | 239,844 | 76,133 | 113,909 | ||||||||||
CASH FLOWS FROM INVESTING ACTIVITIES: | |||||||||||||
Net cash and cash equivalents acquired in acquisitions | 171,366 | 251,570 | 400,526 | ||||||||||
Net decrease (increase) in net loans outstanding | 121,267 | 122,708 | (64,373 | ) | |||||||||
Proceeds from sale of loans | 258,128 | 36,919 | 22,110 | ||||||||||
Securities available-for-sale: | |||||||||||||
Sales | — | — | 16,527 | ||||||||||
Maturities | 215,113 | 81,783 | 30,684 | ||||||||||
Purchases | (627,884 | ) | (227,546 | ) | (56,934 | ) | |||||||
Net redemptions (purchases) of Federal Home Loan Bank stock | 6,036 | — | (5,598 | ) | |||||||||
Proceeds from sale of other real estate owned | 83,141 | 42,496 | 9,157 | ||||||||||
Capitalized costs to complete other real estate owned | (902 | ) | (1,504 | ) | — | ||||||||
Purchases of premises and equipment | (5,271 | ) | (3,343 | ) | (3,874 | ) | |||||||
Proceeds from sale of premises and equipment | 27 | 69 | 82 | ||||||||||
Net cash provided by investing activities | 221,021 | 303,152 | 348,307 | ||||||||||
CASH FLOWS FROM FINANCING ACTIVITIES: | |||||||||||||
Net increase (decrease) in deposits: | |||||||||||||
Noninterest-bearing | 128,866 | 131,245 | (81,082 | ) | |||||||||
Interest-bearing | (325,922 | ) | (380,067 | ) | (116,380 | ) | |||||||
Redemptions of subordinated debentures | — | — | (8,248 | ) | |||||||||
Net proceeds from issuance (repurchases) of common stock | 26,587 | 148,782 | (257 | ) | |||||||||
Net surrenders of stock awards | (1,831 | ) | (1,775 | ) | (258 | ) | |||||||
Tax effect in stockholders' equity of restricted stock vesting and stock option exercises | (1,840 | ) | (2,108 | ) | (466 | ) | |||||||
Net decrease in borrowings | (387,776 | ) | (213,039 | ) | (162,000 | ) | |||||||
Cash dividends paid | (1,445 | ) | (11,145 | ) | (35,438 | ) | |||||||
Net cash used in financing activities | (563,361 | ) | (328,107 | ) | (404,129 | ) | |||||||
Net (decrease) increase in cash and cash equivalents | (102,496 | ) | 51,178 | 58,087 | |||||||||
Cash and cash equivalents at beginning of year | 211,048 | 159,870 | 101,783 | ||||||||||
Cash and cash equivalents at end of year | $ | 108,552 | $ | 211,048 | $ | 159,870 | |||||||
Supplemental disclosure of cash flow information: | |||||||||||||
Cash paid during the year for interest | $ | 41,844 | $ | 57,565 | $ | 66,667 | |||||||
Cash (received) paid during the year for income taxes | (4,193 | ) | 11,426 | 22,550 | |||||||||
Supplemental disclosure of noncash investing and financing activities: | |||||||||||||
Transfer of loans to other real estate owned | 68,447 | 66,096 | 45,164 | ||||||||||
Transfer from loans held-for-sale to loans | — | — | 57,034 | ||||||||||
Transfer from loans to loans held-for-sale | — | — | 22,085 | ||||||||||
See accompanying Notes to Consolidated Financial Statements.
PACWEST BANCORP AND SUBSIDIARIES
Notes to Consolidated Financial Statements
NOTE 1—NATURE OF OPERATIONS AND SUMMARY OF SIGNIFICANT ACCOUNTING POLICIES
PacWest Bancorp is a bank holding company registered under the Bank Holding Company Act of 1956, as amended. Our principal business is to serve as a holding company for our banking subsidiary, Pacific Western Bank, which we refer to as "Pacific Western" or the "Bank." When we say "we", "our" or the "Company", we mean the Company on a consolidated basis with the Bank. When we refer to "PacWest" or to the holding company, we are referring to the parent company on a stand-alone basis.
We have completed 22 acquisitions sincefrom May 2000 through December 31, 2011, including the merger whereby the former Rancho Santa Fe National Bank and First Community Bank of the Desert became wholly-owned subsidiaries of the Company in a pooling-of-interests transaction. All other acquisitions have been accounted for using the purchase method of accounting and, accordingly, their operating results have been included in the consolidated financial statements from their respective dates of acquisition. See NotesNote 3,Acquisitions, and Note 4,Goodwill and Other Intangible Assets, for more information about our acquisitions.Los Padres Bank and Affinity Bank acquisitions completed on August 20, 2010 and August 28, 2009, respectively, and Note 23,Subsequent Events, for information about the January 3, 2012 acquisition of Marquette Equipment Finance, or MEF, an equipment leasing company located in Midvale, Utah.
Pacific Western is a full-service commercial bank offering a broad range of banking products and services. We accept timedemand, money market, and demandtime deposits, fund loans including real estate, construction, SBA and commercial loans, and offer other business orientedbusiness-oriented banking products. Although ourOur operations are primarily located in Southern California we expanded our presence inextending from California's Central Coast withto San Diego County; we also operate three banking offices in the FDIC-assisted acquisitionSan Francisco Bay area, all of Los Padres Bank on August 20, 2010.which were added through the Affinity acquisition. The Bank focuses on conducting business with small to medium sized businesses in our marketplace and the owners and employees of those businesses. The majority of our loans are secured by the real estate collateral of such businesses. We gained through our FDIC-assisted acquisitions three banking offices in the San Francisco Bay area and one office in Arizona. Our asset-based lending function operates in Arizona, California, Texas, and the Pacific Northwest. Our equipment leasing function, added through the January 2012 MEF acquisition, operates in Utah and has lease receivables in 45 states.
We generate our revenue primarily from interest received on loans and, to a lesser extent, from interest received on investment securities, and fees received in connection with deposit services, extending credit and other services offered, including foreign exchange services. Our major operating expenses are the interest paid by the Bank on deposits and borrowings, compensation and general operating expenses. The Bank relies on a foundation of locally generated and relationship-based deposits. The Bank has a relatively low cost of funds due to high balances of noninterest-bearing and low cost deposits.
Our operations, like those of other financial institutions operating in Southern California, are significantly influenced by economic conditions in Southern California, including local economies, the strength of the real estate market, and the fiscal and regulatory policies of the federal and state government and the regulatory authorities that govern financial institutions. With our operations in Arizona, Northern California, and the Pacific Northwest, we are also subject to the economic conditions affecting those markets. No individual or single group of related accounts is considered material in relation to our total assets or deposits of the Bank, or in relation to the overall business of the Company. However, approximately 75%79% of our coveredtotal gross non-covered and non-coveredcovered loan portfolio at December 31, 20102011 consisted of real estate related loans, including construction loans, commercial real estate mortgage loans and commercial loans secured by commercial real estate.
There has been a slow-down in the real estate market due to negative economic trends and credit market disruption, the impacts of which are not yet completely known or quantified. We have observed tighter credit underwriting and higher premiums on liquidity, both of which may continue to place downward pressure on real estate values. A continued downturn or any further deterioration in the realloans.
PACWEST BANCORP AND SUBSIDIARIES
Notes to Consolidated Financial Statements (Continued)
NOTE 1—NATURE OF OPERATIONS AND SUMMARY OF SIGNIFICANT ACCOUNTING POLICIES (Continued)
There has been a slow-down in the real estate market due to negative economic trends and credit market disruption, the impact of which has been significant over the last several years. We have observed tighter credit underwriting and higher premiums on liquidity, both of which may continue to place downward pressure on real estate values. A continued downturn or any further deterioration in the real estate market could materially and adversely affect our business because a significant portion of our loans are secured by real estate. Our ability to recover on defaulted loans by selling the real estate collateral would then be diminished and we would be more likely to suffer losses on defaulted loans. Substantially all of our real property collateral is located in Southern California. Consequently, our results of operations and financial condition are dependent upon the general trends in the Southern California economies and, in particular, the residential and commercial real estate markets.
Real estate values could be affected by, among other things, a worsening of economic conditions, an increase in foreclosures, a decline in home sale volumes, an increase in interest rates, earthquakes and other natural disasters particular to California. Further, we may experience an increase in the number of borrowers who become delinquent, file for protection under bankruptcy laws or default on their loans or other obligations to us given a sustained weakness or weakening in business and economic conditions generally or specifically in ourthe principal markets in which we do business. An increase in the number of delinquencies, bankruptcies or defaults could result in a higher level of nonperforming assets, net charge-offs and provision for credit losses.
(a) Basis of Presentation
The accounting and reporting policies of the Company are in accordance with U.S. generally accepted accounting principles, which we may refer to as U.S. GAAP. All significant intercompany balances and transactions have been eliminated.
(b) Use of Estimates
Management of the Company has made a number of estimates and assumptions relating to the reporting of assets and liabilities and the disclosure of contingent assets and liabilities at the date of the consolidated financial statements and the reported amounts of revenue and expenses during the reporting period to prepare these consolidated financial statements in conformity with U.S. GAAP. Actual results could differ from those estimates. Material estimates subject to change in the near term include, among other items, the allowances for credit losses, the carrying value of other real estate owned, the carrying value of intangible assets, the carrying value of the FDIC loss sharing asset, and the realization of deferred tax assets.
(c) Reclassifications
Certain prior year amounts have been reclassified to conform to the current year's presentation. During the second quarter of 2011, we reclassified recoveries on covered loans such that recoveries now reduce the credit loss provision for covered loans rather than increase FDIC loss sharing income. Such reclassifications had no effect on reported net earnings or losses.
PACWEST BANCORP AND SUBSIDIARIES
Notes to Consolidated Financial Statements (Continued)
NOTE 1—NATURE OF OPERATIONS AND SUMMARY OF SIGNIFICANT ACCOUNTING POLICIES (Continued)
(d) Cash and Cash Equivalents
For purposes of the consolidated statements of cash flows, cash and cash equivalents consist of cash, due from banks, interest-earning deposits in financial institutions, and federal funds sold. Generally, federal funds are sold for one-day periods. Interest-earning assets in financial institutions represent cash held at the Federal Reserve Bank, the majority of which is immediately available.
(e) Investment Securities and Securities Available-for-Sale
We determine the classification of securities at the time of purchase. If we have the intent and the ability at the time of purchase to hold securities until maturity, they are classified as held-to-maturity.
PACWEST BANCORP AND SUBSIDIARIES
Notes to Consolidated Financial Statements (Continued)
NOTE 1—NATURE OF OPERATIONS AND SUMMARY OF SIGNIFICANT ACCOUNTING POLICIES (Continued)
Investment securities held-to-maturity are stated at amortized cost. Securities to be held for indefinite periods of time, but not necessarily to be held-to-maturity or on a long-term basis, are classified as available-for-sale and carried at estimated fair value with unrealized gains or losses reported as a separate component of stockholders' equity in accumulated other comprehensive income, net of applicable income taxes. Securities available-for-sale include securities that management intends to use as part of its asset/liability management strategy and that may be sold in response to changes in interest rates, prepayment risk and other related factors. Securities are individually evaluated for appropriate classification when acquired; consequently, similar types of securities may be classified differently depending on factors existing at the time of purchase.
The carrying values of all securities are adjusted for amortization of premiums and accretion of discounts over the period to maturity of the related security using the interest method. Realized gains or losses on the sale of securities, if any, are determined using the amortized cost of the specific securities sold. If a decline in the fair value of a security below its amortized cost is judged by management to be other than temporary, the cost basis of the security is written down to its fair value and the amount of the write-down is included in operations.
Investments in Federal Home Loan Bank, or FHLB, stock are carried at cost because they can onlyand evaluated regularly for impairment. FHLB stock is expected to be redeemed at an amount not to exceed par and areis a required investmentsinvestment based on measurements of the Bank's assets and/or borrowing levels.
(f) Loans Held for Sale and Servicing Assets
Loans held for sale include loans originated or purchased for resale. Loans originated or purchased for resale include the principal amount outstanding net of unearned income, and are carried at the lower of cost or fair value on an aggregate basis. A decline in the aggregate fair value of the loans below their aggregate carrying amount is recognized through a charge to earnings in the period of such decline. Unearned income on these loans is taken into earnings when the loans are sold. At December 31, 20102011 and 2009,2010, the Company had no loans held for sale.
Gains or losses resulting from sales of loans are recognized at the date of settlement and are based on the difference between the cash received and the carrying value of the related loans less related transaction costs. A transfer of financial assets in which control is surrendered is accounted for as a sale to the extent that consideration other than beneficial interests in the transferred assets is received in the exchange. Assets, liabilities, derivative financial instruments or other retained interests issued or obtained through the sale of financial assets are measured at estimated fair value, if practicable.
PACWEST BANCORP AND SUBSIDIARIES
Notes to Consolidated Financial Statements (Continued)
NOTE 1—NATURE OF OPERATIONS AND SUMMARY OF SIGNIFICANT ACCOUNTING POLICIES (Continued)
The most common retained interest related to the loan sales we have made is a servicing asset. Servicing assets are amortized in proportion to and over the period of estimated future net servicing income. The amortization of the servicing asset and the servicing income are included in noninterest income in the consolidated statement of earnings (loss). The fair value of the servicing assets is estimated by discounting the future cash flows using market-based discount rates and prepayment speeds. Our servicing asset is evaluated regularly for impairment. We stratify the servicing asset based on the original term to maturity and the year of origination of the underlying loans for purposes of measuring impairment. The risk is that loans prepay faster than anticipated and the fair value of the asset declines. If the fair value of the servicing asset is less than the amortized carrying value, the asset is considered impaired and an impairment charge will be taken against earnings.
At December 31, 2010
PACWEST BANCORP AND SUBSIDIARIES
Notes to Consolidated Financial Statements (Continued)
NOTE 1—NATURE OF OPERATIONS AND SUMMARY OF SIGNIFICANT ACCOUNTING POLICIES (Continued)
2011 and 2009,2010, the servicing asset totaled $1.6$1.3 million and $1.9$1.6 million, respectively, and related to the servicing of approximately $82.5$70.6 million and $92.6$82.5 million in SBA loans, respectively. The servicing asset is included in other assets on the consolidated balance sheets. All loans sold after December 31, 2008, were sold on a servicing released basis.
(g) Loans and Loan Fees
As a result of the Los Padres and Affinity acquisitions, we have a class of loans that are covered by loss sharing agreements with the FDIC which we refer to as "covered loans." When we refer to non-covered loans, which we may also refer to as legacy loans, we are referring to loans not covered by our loss sharing agreements with the FDIC.
Non-covered loans. Non-covered loans are stated at the principal amount outstanding, net of any unearned discount or unamortized premium. Interest income is recorded on thean accrual basis in accordance with the terms of the respective loan and includes prepayment penalties. Nonrefundable loan fees and related direct costs associated with the origination or purchase of loans are deferred and netted against outstanding loan balances. The net deferred fees or costs are recognized as an adjustment to interest income over the contractual life of the loans using the interest method or taken into income when the related loans are paid off or sold. The amortization of loan fees or costs is discontinued when a loan is placed on nonaccrual status.
Loans are considered delinquent when principal or interest payments are past due 30 days or more; delinquent loans may remain on accrual status between 30 days and 89 days past due. Loans on which the accrual of interest has been discontinued are designated as nonaccrual loans. The accrual of interest on loans is discontinued when principal or interest payments are past due 90 days or when, in the opinion of management, there is a reasonable doubt as to collectibility in the normal course of business. When loans are placed on nonaccrual status, all interest previously accrued but not collected is reversed against current period interest income. Income on nonaccrual loans is subsequently recognized only to the extent that cash is received and the loan's principal balance is deemed collectible. Loans are restored to accrual status when the loans become both well-secured and are in the process of collection. Nonrefundable loan fees and related direct costs associated with the origination or purchase of loans are deferred and netted against outstanding loan balances. The net deferred fees or costs are recognized as an adjustment to interest income over the contractual life of the loans using the interest method or taken into income when the related loans are paid off or sold. The amortization of loan fees or costs is discontinued when a loan is placed on nonaccrual status.
Covered loans. We refer to "covered loans" as those loans that we acquired in the Los Padres and Affinity acquisitions for which we will be reimbursed for a substantial portion of any future losses on them under the terms of the FDIC loss sharing agreements. We account for loans under ASCAccounting
PACWEST BANCORP AND SUBSIDIARIES
Notes to Consolidated Financial Statements (Continued)
NOTE 1—NATURE OF OPERATIONS AND SUMMARY OF SIGNIFICANT ACCOUNTING POLICIES (Continued)
Standards Codification ("ASC") Subtopic 310-30, "Loans and Debt Securities Acquired with Deteriorated Credit Quality" ("acquired impaired loan accounting") when (i) we acquire loans deemed to be impaired when there is evidence of credit deterioration since their origination and it is probable at the date of acquisition that we would be unable to collect all contractually required payments and (ii) as a general policy election for non-impaired loans that we acquire in a distressed bank acquisition. We may refer to acquired loans accounted for under ASC 310-30 as "acquired impaired loans."
In connection with the Affinity acquisition, we applied acquired impaired loan accounting to all of the covered loans. In connection with the Los Padres acquisition, we applied acquired impaired loan accounting to $405.6 millionall of the covered loans. We alsoloans except for the acquired in the Los Padres acquisition $31.5 million of revolving credit agreements, mainly home equity loans and commercial asset-based lines of credit, where the borrower had revolving privileges; we accounted for such loans in accordance with accounting requirements for purchased non-impaired loans. GAAP excludes revolving credit agreements, such as home equity lines and credit card loans, from acquired impaired loan accounting requirements.
PACWEST BANCORP AND SUBSIDIARIES
Notes to Consolidated Financial Statements (Continued)
NOTE 1—NATURE OF OPERATIONS AND SUMMARY OF SIGNIFICANT ACCOUNTING POLICIES (Continued)
For acquired impaired loans, we (i) calculated the contractual amount and timing of undiscounted principal and interest payments (the "undiscounted contractual cash flows") and (ii) estimated the amount and timing of undiscounted expected principal and interest payments (the "undiscounted expected cash flows"). Under acquired impaired loan accounting, the difference between the undiscounted contractual cash flows and the undiscounted expected cash flows is the nonaccretable difference. The nonaccretable difference represents an estimate of the loss exposure of principal and interest related to the covered acquired impaired loans portfolio andloan portfolios; such amount is subject to change over time based on the performance of such covered loans. The carrying value of covered acquired impaired loans is reduced by payments received, both principal and interest, and increased by the portion of the accretable yield recognized as interest income.
The excess of expected cash flows at acquisition over the initial fair value of acquired impaired loans is referred to as the "accretable yield" and is recorded as interest income over the estimated life of the loans using the effective yield method if the timing and amount of the future cash flows is reasonably estimable. If the timing of cash flows is uncertain, any cash payments will be recognized when received. Subsequent to acquisition, the Company aggregates loans into pools of loans with common credit risk characteristics such as loan type and risk rating. Increases in expected cash flows over those previously estimated increase the accretable yield and are recognized as interest income prospectively. Decreases in the amount and changes in the timing of expected cash flows compared to those previously estimated decrease the accretable yield and usually result in a provision for loan losses and the establishment of an allowance for loan losses. As the accretable yield increases or decreases from changes in cash flow expectations, the offset is a decrease or increase to the nonaccretable difference. The accretable yield is measured at each financial reporting date based on information then currently available and represents the difference between the remaining undiscounted expected cash flows and the current carrying value of the loans.
Under acquired impaired loan accounting, purchased loans are generally considered accruing and performing loans as the loans accrete interest income over the estimated life of the loan when expected cash flows are reasonably estimable. Accordingly, acquired impaired loans that are contractually past due are still considered to be accruing and performing loans as long as there is an expectation that the estimated cash flows will be received. If the timing and amount of cash flows is not reasonably
PACWEST BANCORP AND SUBSIDIARIES
Notes to Consolidated Financial Statements (Continued)
NOTE 1—NATURE OF OPERATIONS AND SUMMARY OF SIGNIFICANT ACCOUNTING POLICIES (Continued)
estimable, the loans may be classified as nonaccrual loans.loans and interest income may be recognized on a cash basis or as a reduction of the principal amount outstanding.
(h) Impaired Loans and Allowances for Credit Losses
Impaired loans. A loan is considered impaired when it is probable that we will be unable to collect all amounts due according to the contractual terms of the loan agreement. Impaired loans include loans on nonaccrual status and performing restructured loans. Income from loans on nonaccrual status is recognized to the extent cash is received and when the loan's principal balance is deemed collectible. Depending on a particular loan's circumstances, we measure impairment of a loan based upon either the present value of expected future cash flows discounted at the loan's effective interest rate, the loan's observable market price, or the fair value of the collateral less estimated costs to sell if the loan is collateral-dependent. The impairment amount on a collateral-dependent loan is charged-off to the allowance and the impairment amount on a loan that is not collateral-dependent is set up as a specific reserve.
PACWEST BANCORP AND SUBSIDIARIES
Notes to Consolidated Financial Statements (Continued)
NOTE 1—NATURE OF OPERATIONS AND SUMMARY OF SIGNIFICANT ACCOUNTING POLICIES (Continued)
Troubled Debt Restructurings. A loan is classified as a troubled debt restructuring when we grant a concession to a borrower experiencing financial difficulties. These concessions may include a reduction of the interest rate, principal or accrued interest, extension of the maturity date or other actions intended to minimize potential losses. All loan modifications are evaluated on an individual basis to determine whether such modifications meet the criteria to be classified as a troubled debt restructuring under ASC Subtopic 310-40,"Troubled Debt Restructurings by Creditors."Loans restructured at a rate equal to or greater than that of a new loan with comparable risk at the time the loan is modified may be excluded from restructured loan disclosures in years subsequent to the restructuring if the loans are in compliance with their modified terms.
A loan that has been placed on nonaccrual status that is subsequently restructured will usually remain on nonaccrual status until the borrower is able to demonstrate repayment performance in compliance with the restructured terms for a sustained period, typically for six months. A restructured loan may return to accrual status sooner based on other significant events or mitigating circumstances. A loan that has not been placed on nonaccrual status may be restructured and such loan may remain on accrual status after such restructuring. In these circumstances, the borrower has made payments before and after the restructuring. Generally, this restructuring involves a reduction in the loan interest rate and/or a change to interest-only payments for a period of time. The restructured loan is considered impaired despite the accrual status and a specific reserve is calculated based on the present value of expected cash flows discounted at the loan's original effective interest rate.
Allowance for Credit Losses on Non-Covered Loans. The allowance for loancredit losses on non-covered loans is the combination of the allowance for loan losses and the reserve for unfunded loan commitments when combined are referred to as the allowance for credit losses.commitments. The allowance for credit losses on non-covered loans relates only to loans which are not subject to FDICthe loss sharing agreements.agreement with the FDIC. The allowance for loan losses is reported as a reduction of outstanding loan balances and the reserve for unfunded loan commitments is included within other liabilities.liabilities on the consolidated balance sheets. Generally, as loans are funded, the amount of the commitment reserve applicable to such funded loans is transferred from the reserve for unfunded loan commitments to the allowance for loan losses based on our allowance methodology. The
PACWEST BANCORP AND SUBSIDIARIES
Notes to Consolidated Financial Statements (Continued)
NOTE 1—NATURE OF OPERATIONS AND SUMMARY OF SIGNIFICANT ACCOUNTING POLICIES (Continued)
following discussion is for non-covered loans and the allowance for credit losses thereon. Refer to "Allowance for Credit Losses on Covered Loans" for the policy on covered loans.
The allowance for loan losses is maintained at a level deemed appropriate by management to adequately provide for known and inherent risks in the loan portfolio and other extensions of credit.credit at the balance sheet date. The allowance is based upon a continuing review of the portfolio, past loan loss experience, current economic conditions which may affect the borrowers' ability to pay, and the underlying collateral value of the loans. Loans which are deemed to be uncollectible are charged off and deducted from the allowance. The provision for loan losses and recoveries on loans previously charged off are added to the allowance.
The methodology we use to estimate the amount of our allowance for credit losses is based on both objective and subjective criteria. While some criteria are formula driven, other criteria are subjective inputs included to capture environmental and general economic risk elements which may trigger losses in the loan portfolio, and to account for the varying levels of credit quality in the loan portfolios of the entities we have acquired that have not yet been captured in our objective loss factors.
Specifically, our allowance methodology contains three key elements: (i) amounts based on specific evaluations of impaired loans; (ii) amounts of estimated losses on several pools of loans categorized by risk rating and loan type; and (iii) amounts for environmental and general economic factors that indicate probable losses were incurred but were not captured through the other elements of our allowance process.
Impaired loans are identified at each reporting date based on certain criteria and such loans over $250,000the majority of which are individually reviewed for impairment. Non-covered nonaccrual loans with an unpaid principal balance over $250,000 and all performing restructured loans are reviewed individually for the amount of impairment, if any. Non-covered nonaccrual loans with an unpaid principal balance of $250,000 or less are evaluated for impairment collectively. A loan is considered impaired when it is probable
PACWEST BANCORP AND SUBSIDIARIES
Notes to Consolidated Financial Statements (Continued)
NOTE 1—NATURE OF OPERATIONS AND SUMMARY OF SIGNIFICANT ACCOUNTING POLICIES (Continued)
that a creditor will be unable to collect all amounts due according to the original contractual terms of the loan agreement. We measure impairment of a loan based upon the fair value of the loan's collateral if the loan is collateral dependent or the present value of cash flows, discounted at the loan's effective interest rate, if the loan is not collateral-dependent. The impairment amount on a collateral-dependent loan is charged-off to the allowance and the impairment amount on a loan that is not collateral-dependent is set up as a specific reserve. Increased charge-offs or additions to specific reserves generally result in increased provisions for credit losses.
Our loan portfolio, excluding impaired loans which are evaluated individually, is categorized into several pools for purposes of determining allowance amounts by loan pool. The loan pools we currently evaluate are: commercial real estate construction, residential real estate construction, SBA real estate, hospitality real estate, real estate other, commercial collateralized, commercial unsecured, SBA commercial, consumer, foreign, and commercial asset-based. Within these loan pools, we then evaluate loans not adversely classified, which we refer to as "pass" credits, separately from adversely classified loans. The adversely classified loans are further grouped into three credit risk rating categories: "special mention," "substandard" and "doubtful," which we define as follows:
PACWEST BANCORP AND SUBSIDIARIES
Notes to Consolidated Financial Statements (Continued)
NOTE 1—NATURE OF OPERATIONS AND SUMMARY OF SIGNIFICANT ACCOUNTING POLICIES (Continued)
In addition, we may refer to the loans classified as "substandard" and "doubtful" together as "criticized loans." For additional information on classified loans, see Note 6,Loans.
The allowance amounts for "pass" rated loans and those loans adversely classified, which are not reviewed individually, are determined using historical loss rates developed through migration analysis. The migration analysis is updated quarterly based on historic losses and movement of loans between ratings.
Finally, in order to ensure our allowance methodology is incorporating recent trends and economic conditions, we apply environmental and general economic factors to our allowance methodology including: credit concentrations; delinquency trends; economic and business conditions; the quality of lending management and staff; lending policies and procedures; loss and recovery trends; nature and volume of the portfolio; nonaccrual and problem loan trends; usage trends of unfunded commitments; and other adjustments for items not covered by other factors.
Management believes that the allowance for loan losses is adequate and appropriate for the known and inherent risks in our non-covered loan portfolio. In making its evaluation, management considers certain quantitative and qualitative factors including the Company's historical loss experience, the volume and type of lending conducted by the Company, the results of our credit review process, the levels of classified and criticized loans, the levels of impaired loans, including nonperforming loans and performing restructured loans, regulatory policies, general economic conditions, underlying collateral values, and other factors regarding collectibility and impairment. To the extent we experience, for example, increased levels of documentation deficiencies, adverse changes in collateral values, or negative changes in economic and business conditions which adversely affect our borrowers, our classified loans may increase. Higher levels of adversely classified loans generally result in higher allowances for loan losses.
Management also believes that the reserve for unfunded loan commitments is adequate. In making this determination, management uses the same methodology for the reserve for unfunded loan commitments as for the allowance for loan losses and consider the same quantitative and qualitative factors, as well as off-balance sheet exposures and an estimate of the probability of drawdown of loan commitments correlated to their credit risk rating.
We recognize that the determination of the allowance for loan losses is sensitive to the assigned credit risk ratings and inherent loss rates at any given point in time. Therefore, we perform sensitivity analyses to provide insight regarding the impact adverse changes in credit risk ratings may have on our allowance for loan losses. OurThe sensitivity analyses do not imply any expectationhave inherent limitations and are based on various assumptions as of future deteriorationa point in our loans' risk ratingstime and, they doaccordingly, it is not necessarily reflectrepresentative of the nature and extent of futureimpact loan risk rating changes inmay have on the allowance for loan losses due to the numerous quantitative and qualitative factors considered inlosses.
PACWEST BANCORP AND SUBSIDIARIES
Notes to Consolidated Financial Statements (Continued)
NOTE 1—NATURE OF OPERATIONS AND SUMMARY OF SIGNIFICANT ACCOUNTING POLICIES (Continued)
determining our allowance for loan losses. Given current processes employed by the Company, management believes the risk ratings and inherent loss rates currently assigned are appropriate.
We believe that the allowance for loan losses is adequate. In making this determination, we consider certain quantitative and qualitative factors including our historical loan loss experience, the volume and type of lending conducted by the Company, the results of our credit review process, the amounts of classified, criticized and nonperforming assets, regulatory policies, general economic conditions, underlying collateral values, and other factors regarding the collectibility of loans in our portfolio.
We also believe that the reserve for unfunded loan commitments is adequate. In making this determination, we use the same methodology for the reserve for unfunded loan commitments as we do for the allowance for loan losses and consider the same quantitative and qualitative factors, as well as off-balance sheet exposures and an estimate of the probability of drawdown of loan commitments correlated to their credit risk rating.
Our federal and state banking regulators, as an integral part of their examination process, periodically review the Company's allowance for credit losses. Our regulators may require the Company to recognize additions to the allowance based on their judgments related to information available to them at the time of their examinations.
Allowance for Credit Losses on Covered Loans. CoveredThe covered loans are subject to our internal and external credit review. If and when credit deterioration occurs subsequent toin the acquisition dates,expected cash flows results in a reserve requirement, a provision for credit losses for acquired impaired loans will beis charged to earnings for the full amount without regard to the FDIC loss sharing agreements.agreement. The portion of the estimated loss on covered loans reimbursable from the FDIC iswill be recorded in noninterest income as "FDICFDIC loss sharing income net" and increaseswill increase the FDIC loss sharing asset. TheFor acquired impaired loans, the allowance for loan losses on acquired impaired loans is measured at the end of each financial reporting period or measurement date, based on expected cash flows. Decreases in the amount and changes in the timing of expected cash flows on the acquired impaired loans as of the measurementfinancial reporting date compared to those previously estimated are usually recognized by recording a provision for credit losses on acquired impairedsuch covered loans. Conversely, improvements in the amount and timing of expected cash flows on such loans result in a reduction of the provision for credit losses or a prospective increase in the accretable yield and a reduction in the FDIC loss sharing asset via a charge to FDIC loss sharing expense.
Acquired loans not accounted for as impaired loans are subject to our allowance for credit losses methodology. Although we estimate the required allowance for credit losses similar to the methodology used for non-covered loans, we record a provision for such loan losses only when the reserve requirement exceeds any remaining credit discount on these covered loans.
(i) FDIC Loss Sharing Asset
The FDIC loss sharing asset was measured at estimated fair value on the Los Padres and Affinity acquisition dates using expected future cash flows from the FDIC and a discount rate based on a long-term risk-free interest rate plus a premium. Since the FDIC loss sharing asset was initially recorded at estimated fair value using a discount rate, a portion of the discount is recognized as FDIC loss sharing income in each reporting period.
Under the terms of the Los Padres loss sharing agreement, the FDIC is obligated to reimburse the Bank for 80% of losses with respect to the covered assets. The Bank will reimburse the FDIC for 80% of recoveries with respect to losses for which the FDIC paid the Bank 80% reimbursement under the loss sharing agreement. The Los Padres loss sharing provisions expire in the third quarters of 2015 and 2020 for non-single family and single family covered assets, respectively, while the related loss recovery provisions expire in the third quarters of 2018 and 2020, respectively. Under the terms of the Affinity loss sharing agreement, with the FDIC, the FDIC will (a) absorb 80% of losses and receive 80% of loss recoveries on the first $234 million of losses on covered assets and (b) absorb 95% of losses and receive 95% of loss recoveries on covered assets exceeding $234 million. The Affinity loss sharing provisions expire in the third quarters of 2014 and 2019 for non-single family covered assets and single family covered assets, respectively, while the related loss recovery provisions expire in the third quarters of 2017 and 2019, respectively.
An increase in the expected amount of losses on the covered assets will increase the FDIC loss sharing asset; such increase is recognized through a credit to FDIC loss sharing income. Recoveries on previous losses paid to us by the FDIC reduce the FDIC loss sharing asset by a charge to FDIC loss
PACWEST BANCORP AND SUBSIDIARIES
Notes to Consolidated Financial Statements (Continued)
NOTE 1—NATURE OF OPERATIONS AND SUMMARY OF SIGNIFICANT ACCOUNTING POLICIES (Continued)
losses and receive 95% of loss recoveries on covered assets exceeding $234 million. An increasesharing expense. In addition, decreases in the expected amount of losses on the covered assets will increasedecrease the loss sharing asset by a creditamount of funds expected to be collected from the FDIC and will therefore reduce the FDIC loss sharing income, net. Recoveries on previous losses paid to us by the FDIC reduce the loss sharing asset byasset. These decreases are recognized as a charge to FDIC loss sharing income, net. Sinceexpense as the FDICrelated loss sharing asset was initially recorded atis amortized over its estimated fair value using a discount rate, a portion of the discount is recognized as FDIC loss sharing income in each reporting period.remaining life.
(j) Land, Premises and Equipment
Premises and equipment are stated at cost less accumulated depreciation and amortization. Land is not depreciated. Depreciation and amortization is charged to noninterest expense using the straight-line method over the estimated useful lives of the assets. The estimated useful lives of furniture, fixtures and equipment range from 3 to 10 years and for buildings up to 35 years. Leasehold improvements are amortized over their estimated useful lives, or the life of the lease, whichever is shorter.
(k) Other Real Estate Owned
Non-covered OREO. Other real estate owned, or OREO, is initially recorded at the estimated fair value of the property, based on current independent appraisals obtained at the time of acquisition, less estimated costs to sell, including senior obligations such as delinquent property taxes. The excess of the recorded loan balance over the estimated fair value of the property at the time of acquisition less estimated costs to sell is charged to the allowance for loan losses. Any subsequent write downswrite-downs are charged to noninterest expense and recognized through an OREO valuation allowance. Subsequent increases in the fair value of the asset less selling costs reduce the OREO valuation allowance, but not below zero, and are credited to noninterest expense. Gains and losses on the sale of foreclosed properties and operating expenses of such assets are also included in noninterest expense.
Covered OREO. Covered OREO was initially recorded at its estimated fair value on the acquisition date based on independent appraisals less estimated selling costs. Any subsequent write downswrite-downs due to declines in fair value are charged to noninterest expense with a partial offset to FDIC loss sharing income for the loss reimbursement under the FDIC loss sharing agreement. Any recoveries of previous write downswrite-downs are credited to noninterest expense with a corresponding charge to FDIC loss sharing income, net for the portion of the recovery that is due to the FDIC.
(l) Income Taxes
Income taxes are accounted for under the asset and liability method. Deferred tax assets and liabilities are recognized for the future tax consequences attributable to differences between the financial statement carrying amounts of existing assets and liabilities and their respective tax bases and operating loss and tax credit carryforwards. Deferred tax assets and liabilities are measured using enacted tax rates expected to apply to taxable income in the years in which those temporary differences are expected to be recovered or settled and then established only for those items that are deemed to be realizable based on our judgment.settled. The effect of a change in tax rates on deferred tax assets and liabilities is recognized in earnings in the period that includes the enactment date. Any interest or penalties assessed by the taxing authorities is classified in the financial statements as income tax expense. Deferred tax assets are included in other assets on the consolidated balance sheets.
PACWEST BANCORP AND SUBSIDIARIES
Notes to Consolidated Financial Statements (Continued)
NOTE 1—NATURE OF OPERATIONS AND SUMMARY OF SIGNIFICANT ACCOUNTING POLICIES (Continued)
On a quarterly basis, the Company evaluates its deferred tax assets to assess whether they are expected to be realized in the future. This determination is based on currently available facts and circumstances, including our current and projected future tax position, the historical level of our taxable income, and estimates of our future taxable income. In most cases, the realization of deferred tax assets is based on our future profitability. To the extent our deferred tax assets are no longer considered more likely than not to be realized, we could be required to record a valuation allowance on our deferred tax assets by charging earnings.
(m) Goodwill and Other Intangible Assets
Goodwill arises from business combinations and represents the excess of the purchase price over the fair value of the net assets and other indentifiableidentifiable intangible assets acquired. Goodwill and other intangible assets deemed to have indefinite lives generated from purchase business combinations are not subject to amortization and are instead assessed for impairment no less than annually. Impairment exists when the carrying value of the goodwill exceeds its implied fair value. Impairment charges are included in noninterest expense in the financial statements.
Intangible assets with estimable useful lives are amortized over such useful lives to their estimated residual values. Core deposit intangible assets, which we refer to as CDI, and customer relationship intangible assets, which we refer to as CRI, are recognized apart from goodwill at the time of acquisition based on market valuations prepared by independent third parties. In preparing such valuations, the third parties consider variables such as deposit servicing costs, attrition rates, and market discount rates. CDI assets are amortized to expense over their useful lives, which we have estimated to range from 7 to 10 years. CRI assets are amortized to expense over their useful lives, which we have estimated to range from 4 to 5 years. Both CDI and CRI are reviewed for impairment quarterly or earlier if events or changes in circumstances indicate that their carrying values may not be recoverable. If the recoverable amount of either CDI or CRI is determined to be less than its carrying value, we would then measure the amount of impairment based on an estimate of the intangible asset's fair value at that time. If the fair value is below the carrying value, the intangible asset is reduced to such fair value and the impairment is recognized as noninterest expense in the financial statements.
(n) Stock Incentive Plan
Compensation expense related to awards of restricted stock is based on the fair value of the underlying stock on the award date and is recognized over the vesting period using the straight-line method. The vesting of performance-based restricted stock awards and recognition of related compensation expense may occur over a shorter vesting period if financial performance targets are achieved earlier than anticipated. Amortization of unvested performance-based restricted stock is suspended when it becomes less than probable that the performance targets will be met. Amortization of unvested performance-based restricted stock is discontinued and previous amortization amounts are credited to earnings when it becomes improbable that performance targets will be met. When and if it becomes probable in the future that the performance target will be met a catch up adjustment is made and amortization begins.
Unvested restricted stock participates with common stock in any dividends declared and paid. Dividends paid on unvested restricted stock awards expected to vest and the related tax benefits are
PACWEST BANCORP AND SUBSIDIARIES
Notes to Consolidated Financial Statements (Continued)
NOTE 1—NATURE OF OPERATIONS AND SUMMARY OF SIGNIFICANT ACCOUNTING POLICIES (Continued)
included as a net reduction to stockholders' equity. Dividends paid on unvested restricted stock not expected to vest are charged to compensation expense.
(o) Business Segments
We have determined that we have one reportable business segment, banking operations.
(p) Comprehensive Income
Comprehensive income consists of net earnings and net unrealized gains (losses) on securities available-for-sale, net and is presented in the consolidated statements of stockholders' equity and comprehensive income. The components of comprehensive income are presented in Note 21.
(q) Earnings Per Share
On January 1, 2009, TheIn accordance with ASC Topic 260, "Earnings perPer Share topic of the Codification under the section regardingSpecial Issues Affecting Basic and Diluted EPS (ASC 260-10-45) became effective for us. This pronouncement clarified that," all outstanding unvested share-based payment awards that contain rights to nonforfeitable dividends are considered participating securities and are included in the two-class method of determining basic and diluted earnings per share. All of our unvested restricted stock participates with our common stockholders in dividends. While applicationAccordingly, earnings allocated to unvested restricted stock are deducted from net earnings to determine that amount of earnings available to common stockholders. In the new standard had no effect ontwo-class method, the reported amountsamount of net (loss) earnings for 2008, it resulted in a reduction of netour earnings available to common stockholders is divided by the weighted average shares outstanding, excluding any unvested restricted stock, for both the basic and therefore lowereddiluted earnings per share when compared to the previous requirements. The new standard's effect on the net diluted loss per share for 2008 was an increase of $0.02 to $26.81 from $26.79.share.
(r) Business Combinations
Business combinations are accounted for under the acquisition method of accounting in accordance with ASC Topic 805, "Business Combinations." Under the acquisition method the acquiring entity in a business combination recognizes 100 percent of the acquired assets and assumed liabilities, regardless of the percentage owned, at their estimated fair values as of the date of acquisition. Any excess of the purchase price over the fair value of net assets and other identifiable intangible assets acquired is recorded as goodwill. To the extent the fair value of net assets acquired, including other identifiable assets, exceedexceeds the purchase price, a bargain purchase gain is recognized. Assets acquired and liabilities assumed from contingencies must also be recognized at fair value, if the fair value can be determined during the measurement period. Results of operations of an acquired business are included in the statement of earnings from the date of acquisition. Acquisition-related costs, including conversion and restructuring charges, are expensed as incurred. We adopted this guidance as of January 1, 2009 and applied it to the Los Padres and Affinity acquisitions.
(s) Recently Issued or Adopted Accounting Standards
In May 2011, the Financial Accounting Standards Board ("FASB") issued Accounting Standards Update ("ASU") 2011-04, "FASB ASC 810 ConsolidationFair Value Measurement (Topic 820): Amendments to Achieve Common Fair Value Measurement and Disclosure Requirements in U.S. GAAP and IFRSs ("ASC 810") became effective for us on January 1, 2010,." ASU 2011-04 was issued concurrently with IFRS 13, "Fair Value Measurements," to provide largely identical guidance about fair value measurement and was amended to changedisclosure requirements. ASU 2011-04 does not extend the use of fair value but, rather, provides guidance about how a company determines when an entity that is insufficiently capitalized or is not controlled through voting (or similar rights)fair value should be consolidated. The determination of whether a companyapplied where it already is required to consolidate an entity is based on, among other things, an entity's purpose andor permitted under U.S. GAAP or International Financial Reporting Standards (IFRSs). For U.S. GAAP,
PACWEST BANCORP AND SUBSIDIARIES
Notes to Consolidated Financial Statements (Continued)
NOTE 1—NATURE OF OPERATIONS AND SUMMARY OF SIGNIFICANT ACCOUNTING POLICIES (Continued)
design and a company's ability to direct the activitiesmost of the entity that most significantly impact the entity's economic performance. The new authoritative accountingchanges are clarifications of existing guidance requires additional disclosures about the reporting entity's involvementor wording changes to align with variable-interest entities and any significant changes in risk exposure due to that involvement as well as its effect on the entity's financial statements. The new authoritative accounting guidance under ASC 810 wasIFRS 13. ASU 2011-04 is effective January 1, 2010 and did not have an impact on our financial statements.
FASB ASC 860 Transfers and Servicing ("ASC 860") was amended to enhance reporting about transfers of financial assets, including securitizations, and where companies have continuing exposure to the risks related to transferred financial assets. The new authoritative accounting guidance eliminates the concept of a "qualifying special-purpose entity" and changes the requirements for derecognizing financial assets. The new authoritative accounting guidance also requires additional disclosures about all continuing involvements with transferred financial assets including information about gains and losses resulting from transfers during the period. The new authoritative accounting guidance under ASC 860 was effective January 1, 2010 and did not have an impact on our financial statements.
In January 2010, the Financial Accounting Standards Board ("FASB") issued Accounting Standards Update ("ASU") 2010-06, "Improving Disclosures about Fair Value Measurements". ASU 2010-06 requires additional disclosures about fair value measurements including transfers in and out of Levels 1 and 2 and a higher level of disaggregation for the different types of financial instruments. For the reconciliation of Level 3 fair value measurements, information about purchases, sales, issuances and settlements are presented separately. This standard is effectiveprospectively for interim and annual reporting periods beginning after December 15, 2009 with2011. Early adoption is not permitted. In the exceptionperiod of revised Level 3 disclosure requirements which areadoption, a reporting entity will be required to disclose a change, if any, in valuation technique and related inputs that result from applying ASU 2011-04 and to quantify the total effect, if practicable. We have not as yet determined what effect, if any, adoption of ASU 2011-04 will have on our financial statements and related disclosures.
In June 2011, the FASB issued ASU 2011-05, "Comprehensive Income (Topic 220): Presentation of Comprehensive Income." Under ASU 2011-05, an entity will have the option to present the components of net earnings and comprehensive income in either one or two consecutive financial statements. This standard eliminates the option in U.S. GAAP to present other comprehensive income in the statement of changes in equity. ASU 2011-05 should be applied retrospectively and is effective for fiscal years, and interim and annual reporting periods within those years, beginning after December 15, 2010. Comparative disclosures are not required in the year2011. Early adoption is permitted. Adoption of adoption. We adopted the provisions of thethis standard on January 1, 2010, which didwill not have a material impacteffect on our financial statements.
In April 2010,December 2011, the FASB issued ASU 2010-18,2011-12, "EffectDeferral of a Loan Modification When the Loan is PartEffective Date for Amendments to the Presentation of a Pool That is Accounted for as a Single AssetReclassification of Items Out of Accumulated Other Comprehensive Income in Accounting Standards Update No. 2011-05." ASU 2010-18 requires2011-12 defers the effective date of those changes in ASU 2011-05 that relate to the presentation of reclassification adjustments to provide the FASB with more time to redeliberate whether to present the effects of reclassifications out of accumulated other comprehensive income on the face of the financial statements for all periods presented.
In September 2011, the FASB issued ASU 2011-08, "Intangibles—Goodwill and Other (Topic 350): Testing Goodwill for Impairment." Under ASU 2011-08, an entity is permitted to make a qualitative assessment of whether it is more likely than not that a modified loan inreporting unit's fair value is less than its carrying amount before applying the two-step goodwill impairment test. If an entity concludes it is not more likely than not that the fair value of a pool of purchased credit-impaired loans remain inreporting unit is less than its carrying amount, it need not perform the pool even if the modification would otherwise be considered a troubled debt restructuring. An entity will continue to be required to consider whether the pool of assets in which the loan is included is impaired if expected cash flows for the pool change. A one-time election to terminate accounting for loans in a pool, which may be made on a pool-by-pool basis, is provided upon adoption oftwo-step impairment test. ASU 2010-18. This ASU2011-08 is effective for modifications of loans accounted for within pools under ASC Subtopic 310-30, "Loansannual and Debt Securities Acquired with Deteriorated Credit Quality," occurringinterim goodwill impairment tests performed in the first interim and annual reporting period ending on orfiscal years beginning after JulyDecember 15, 2010. ASU 2010-182011. Early adoption is to be applied prospectively, but early application was permitted. We adopted the provisionsdo not believe adoption of this ASU effective September 30, 2010; such adoption had nostandard will have any material effect on our financial statements.
In July 2010,December 2011, the FASB issued ASU 2010-20,2011-11, "Disclosures about the Credit Quality of Financing ReceivablesOffsetting Assets and the Allowance for Credit LossesLiabilities." ASU 2010-202011-11 requires additional informationdisclosures about credit risk exposure for financing receivablesoffsetting and the related allowance for loan losses including an allowance rollforward on a portfolio segment basis, the recorded investment in financing receivables on a portfolio segment basis, the nonaccrual status of financing receivables by class, impaired financing receivables by class, aging of past due receivables by class, credit quality indicators by class, troubled
PACWEST BANCORP AND SUBSIDIARIES
Notesarrangements to Consolidatedallow investors to better compare financial statements issued under U.S. GAAP with financial statements prepared under International Financial Statements (Continued)
NOTE 1—NATURE OF OPERATIONS AND SUMMARY OF SIGNIFICANT ACCOUNTING POLICIES (Continued)
debt restructurings information by class, and significant purchases and sales of financing receivables.Reporting Standards ("IFRS"). ASU 2010-20 defines portfolio segment as the level at which an entity develops and documents a systematic method for determining its allowance for loan losses. Classes of financing receivables generally are a disaggregation of portfolio segments. The period end reporting requirements of ASU 2010-20 became2011-11 is effective for us on December 31, 2010. ASU 2010-20 disclosures that relate to activity during a reporting period will be required for us for interim and annual reporting periods beginning after December 15, 2010. ASU 2011-01,"Deferral of the Effective Date of Disclosures about Troubled Debt Restructurings in Update No. 2010-20," temporarily deferred the effective date for disclosures related to troubled debt restructurings to coincide with the effective date of a proposed accounting standards update related to troubled debt restructurings, whichJanuary 1, 2013, and interim periods within those annual periods. Retrospective application is currently expected to be effective for reporting periods ending after June 15, 2011.required. Adoption of the ASU 2010-20 disclosure requirements didthis standard will not have a material impacteffect on our financial statements.
ASU No. 2010-29,"Disclosure of Supplementary Pro Forma Information for Business Combinations," provides clarification regarding the acquisition date that should be used for reporting the pro forma financial information disclosures required by Topic 805 when comparative financial statements are presented. ASU 2010-29 also requires entities to provide a description of the nature and amount of material, nonrecurring pro forma adjustments that are directly attributable to the business combination. ASU 2010-29 is effective for the Company prospectively for business combinations occurring after December 31, 2010.
NOTE 2—RESTRICTED CASH BALANCES
The Company is required to maintain reserve balances with the Federal Reserve Bank, or FRB. Such reserve requirements are based on a percentage of deposit liabilities and may be satisfied by cash on hand. The average reserves required to be held at the FRB for the years ended December 31, 2011 and 2010 and 2009 were $1.2$2.2 million and $2.2$1.2 million.
PACWEST BANCORP AND SUBSIDIARIES
Notes to Consolidated Financial Statements (Continued)
NOTE 3—ACQUISITIONS
We completed the following acquisitions during the time period of January 1, 20082009 to December 31, 2010,2011, using the acquisition method of accounting, and, accordingly, the operating results of the acquired entities have been included in our consolidated financial statements from their respective dates of acquisition.
| | | Acquisition and Date Acquired | Acquisition and Date Acquired | ||||||||||||||||
|---|---|---|---|---|---|---|---|---|---|---|---|---|---|---|---|---|---|---|---|
| | | Los Padres Bank | Affinity Bank | Security Pacific Bank Deposits | Los Padres Bank | Affinity Bank | |||||||||||||
| | | August 2010 | August 2009 | November 2008 | August 2010 | August 2009 | |||||||||||||
| | | (In thousands) | (In thousands) | ||||||||||||||||
Assets Acquired: | Assets Acquired: | ||||||||||||||||||
Cash and cash equivalents | $ | 26,615 | $ | 1,471 | |||||||||||||||
Interest-earning deposits in other banks | 751 | 163,047 | |||||||||||||||||
Cash received from the FDIC | 144,000 | 87,161 | |||||||||||||||||
Investments: | |||||||||||||||||||
Covered by loss-sharing | — | 55,271 | |||||||||||||||||
Not covered by loss-sharing | 44,251 | 120,130 | |||||||||||||||||
Loans: | |||||||||||||||||||
Covered by loss-sharing | 436,291 | 675,616 | |||||||||||||||||
Not covered by loss-sharing | 828 | — | |||||||||||||||||
Other real estate owned covered by loss-sharing | 33,913 | 22,897 | |||||||||||||||||
Goodwill | 47,301 | — | |||||||||||||||||
Core deposit intangible assets | 2,189 | 2,812 | |||||||||||||||||
FDIC loss sharing asset | 71,204 | 107,718 | |||||||||||||||||
Other assets | 16,740 | 9,282 | |||||||||||||||||
Cash and cash equivalents | $ | 26,615 | $ | 1,471 | $ | 15,649 | |||||||||||||
Interest-earning deposits in other banks | 751 | 163,047 | 5,392 | ||||||||||||||||
Cash received from the FDIC | 144,000 | 87,161 | 379,485 | ||||||||||||||||
Investments: | |||||||||||||||||||
Covered by loss-sharing | — | 55,271 | — | ||||||||||||||||
Not covered by loss-sharing | 44,251 | 120,130 | 3,040 | ||||||||||||||||
Loans: | |||||||||||||||||||
Covered by loss-sharing | 436,291 | 675,616 | — | ||||||||||||||||
Not covered by loss-sharing | 828 | — | 31,103 | ||||||||||||||||
Other real estate owned covered by loss-sharing | 33,913 | 22,897 | — | ||||||||||||||||
Goodwill | 47,301 | — | — | ||||||||||||||||
Core deposit intangible assets | 2,189 | 2,812 | 5,757 | ||||||||||||||||
FDIC loss sharing asset | 71,204 | 107,718 | — | ||||||||||||||||
Other assets | 16,740 | 9,282 | 554 | ||||||||||||||||
Total assets acquired | $ | 824,083 | $ | 1,245,405 | $ | 440,980 | |||||||||||||
Total assets acquired | $ | 824,083 | $ | 1,245,405 | |||||||||||||||
Liabilities Assumed: | Liabilities Assumed: | ||||||||||||||||||
Noninterest-bearing deposits | $ | (33,722 | ) | $ | (6,244 | ) | |||||||||||||
Interest-bearing deposits | (718,463 | ) | (861,932 | ) | |||||||||||||||
Borrowings | (70,013 | ) | (289,492 | ) | |||||||||||||||
Securities sold under repurchase agreements | — | (16,310 | ) | ||||||||||||||||
Accrued interest payable and other liabilities | (1,885 | ) | (32,573 | ) | |||||||||||||||
Noninterest-bearing deposits | $ | (33,722 | ) | $ | (6,244 | ) | $ | (34,621 | ) | ||||||||||
Interest-bearing deposits | (718,463 | ) | (861,932 | ) | (392,910 | ) | |||||||||||||
Borrowings | (70,013 | ) | (289,492 | ) | — | ||||||||||||||
Securities sold under repurchase agreements | — | (16,310 | ) | — | |||||||||||||||
Accrued interest payable and other liabilities | (1,885 | ) | (32,573 | ) | (13,449 | ) | |||||||||||||
Total liabilities assumed | $ | (824,083 | ) | $ | (1,206,551 | ) | $ | (440,980 | ) | ||||||||||
Total liabilities assumed | $ | (824,083 | ) | $ | (1,206,551 | ) | |||||||||||||
Net assets acquired | Net assets acquired | $ | — | $ | 38,854 | $ | — | $ | — | $ | 38,854 | ||||||||
Deposit premium paid | Deposit premium paid | $ | 3,393 | $ | — | $ | 5,051 | $ | 3,393 | $ | — | ||||||||
Federally Assisted Acquisition of Los Padres Bank
On August 20, 2010, wePacific Western acquired certain assets of Los Padres Bank, including all loans, and assumed substantially all of its liabilities, including all deposits, from the Federal Deposit Insurance Corporation ("FDIC") in an FDIC-assisted acquisition, which we refer to as the Los Padres acquisition. We entered into a loss sharing agreement with the FDIC, whereby the FDIC agreed to cover a substantial portion of any future losses on acquired OREO and acquired loans, with the
PACWEST BANCORP AND SUBSIDIARIES
Notes to Consolidated Financial Statements (Continued)
NOTE 3—ACQUISITIONS (Continued)
We entered into a loss sharing agreement with the FDIC, whereby the FDIC agreed to cover a substantial portion of any future losses on acquired loans, with the exception of acquired consumer loans, and other real estate owned.loans. We refer to the acquired assets subject to the loss sharing agreement collectively as "covered assets." Under the terms of such loss sharing agreement, the FDIC is obligated to reimburse the Bank for 80% of losses with respect to the covered assets. The Bank will reimburse the FDIC for 80% of recoveries with respect to losses for which the FDIC paid the Bank 80% reimbursement under the loss sharing agreement. The loss sharing arrangementprovisions for single family covered assets and commercial (non-single family) covered assets isare in effect for 10 years and 5 years, respectively, from the August 20, 2010 acquisition date, and the loss recovery provisions are in effect for 10 years and 8 years, respectively, from the acquisition date. Through December 31, 2011, gross losses for Los Padres covered assets totaled $47.1 million.
Los Padres was a federally chartered savings bank headquartered in Solvang, California that operated 14 branches, including 11 branches in California (three in Ventura County, four in Santa Barbara County, and four in San Luis Obispo County) and three branches in Arizona (Maricopa County). After office consolidations in Februaryduring 2011, therewe are nine remainingoperating eight of the former Los Padres branch offices, with eightall of which are located in California and one in Arizona.California. We made this acquisition to expand our presence in the Central Coast of California.
The assets acquired and liabilities assumed have been accounted for under the acquisition method of accounting. The assets and liabilities, both tangible and intangible, were recorded at their estimated fair values as of the August 20, 2010 acquisition date. Such fair values are preliminary estimates and are subject to adjustment for up to one-year after the acquisition date. The application of the acquisition method of accounting resulted in goodwill of $47.3 million. Such goodwill includesincluded $9.5 million related to the FDIC's settlement accounting for a wholly-owned subsidiary of Los Padres. We disagreedisagreed with the FDIC's accounting for this item and are in process of negotiatingitem. During 2011, we resolved this matter with the FDIC to resolve this matter. Should we be successful in our negotiations, goodwill would be reduced byfor a cash payment to us fromof $7.6 million; goodwill was reduced by the FDIC of $9.5 million. No assurance can be given, however, that we will be successful in our efforts.same amount.
Federally Assisted Acquisition of Affinity Bank
On August 28, 2009, Pacific Western Bank acquired certain assets and assumed certain liabilities of Affinity Bank from the FDIC in an FDIC-assisted acquisition. We entered into a loss sharing agreement with the FDIC, whereby the FDIC agreed to cover a substantial portion of any future losses on acquired loans, other real estate owned and certain investment securities. We refer to the acquired assets subject to the loss sharing agreement collectively as "covered assets." Under the terms of such loss sharing agreement, the FDIC will absorb 80% of losses and receive 80% of loss recoveries on the first $234 million of losses on covered assets and absorb 95% of losses and receive 95% of loss recoveries on covered assets exceeding $234 million. The loss sharing agreement isprovisions are in effect for 5 years for commercial assets (non-residential loans, OREO and certain securities) and 10 years for residential loans from the August 28, 2009 acquisition date. The loss recovery provisions are in effect for 8 years for commercial assets and 10 years for residential loans from the acquisition date. Affinity was a full service commercial bank headquartered in Ventura, California that operated 10 branch locations in California. We made this acquisition to expand our presence in California.
PACWEST BANCORP AND SUBSIDIARIES
Notes to Consolidated Financial Statements (Continued)
NOTE 3—ACQUISITIONS (Continued) Through December 31, 2011, gross losses for Affinity covered assets totaled $144.6 million.
The assets acquired and liabilities assumed have been accounted for under the acquisition method of accounting. The assets and liabilities, both tangible and intangible, were recorded at their estimated fair values as of the August 28, 2009 acquisition date. The application of the acquisition method of accounting resulted in a net after-tax gain of $38.9 million ($67.0 million before tax).
Security Pacific Bank Deposit Acquisition
PACWEST BANCORP AND SUBSIDIARIES
On November 7, 2008, we assumed $427.5 million in deposits from the FDIC as receiver of Security Pacific Bank, or SPB, formerly a Los Angeles-based bank. We assumed all insured and uninsured deposits and paid a 2% premium of approximately $5.1 million relatedNotes to the non-brokered deposit base of $258 million. The estimated brokered deposits as of the assumption date totaled $169 million. Such deposit assumption was net of acquiring cash, certificates of deposit in other financial institutions, federal funds sold, securities, and loans secured by assumed deposits. As part of the SPB deposit acquisition we also purchased an additional $31 million in loans. We made this acquisition to augment our deposit base and to gain experience with FDIC-assisted transactions.Consolidated Financial Statements (Continued)
NOTE 3—ACQUISITIONS (Continued)
Acquisition-related charges
All of the acquisitions consummated after December 31, 2000 were completed using the acquisition method of accounting. For those acquisitions completed prior to January 1, 2009, we recorded the estimated merger-related charges associated with each acquisition as a liability at closing when the related purchase price was allocated. For each acquisition, we developed an integration plan for the Company that addressed, among other things, requirements for staffing, systems platforms, branch locations and other facilities. The remaining merger-related liability totaled $981,000$922,000 at December 31, 20102011 and represented the estimated lease payments, net of estimated sublease income, for the remaining life of leases for abandoned space. For acquisitions completed after January 1, 2009, acquisition-related costs, such as legal, accounting, valuation and other professional fees, necessary to effect a business combination, are charged to earnings in the periods in which the costs are incurred. We incurred and charged to expense approximately $900,000$600,000, $732,000 and $600,000 of such costs in 2011, 2010 and 2009, respectively.
Unaudited Pro Forma Results of Operations
The following table presents our unaudited pro forma results of operations for the periods presented as if the Los Padres acquisition had been completed on January 1, 2009 and the Affinity acquisition had been completed on January 1, 2008. The unaudited pro forma results of operations include the historical accounts of the Company and Affinity and pro forma adjustments as may be required, including the amortization of intangibles with definite lives and the amortization or accretion of any premiums or discounts arising from fair value adjustments for assets acquired and liabilities assumed. The unaudited pro forma information is intended for informational purposes only and is not necessarily indicative of our future operating results or operating results that would have occurred had the Los Padres acquisition been completed at the beginning of 2009 and the Affinity acquisition completed at the beginning of 2008. No assumptions have been applied to the pro forma results of operations regarding possible revenue enhancements, expense efficiencies or asset dispositions.
| | Year Ended December 31, | ||||||
|---|---|---|---|---|---|---|---|
| | 2010 | 2009 | |||||
| | (In thousands, except per share data) | ||||||
Pro forma revenues (net interest income plus noninterest income) | $ | 312,477 | $ | 336,341 | |||
Pro forma net loss | $ | (64,000 | ) | $ | (78,390 | ) | |
Pro forma net loss per share: | |||||||
Basic | $ | (1.82 | ) | $ | (2.47 | ) | |
Diluted | $ | (1.82 | ) | $ | (2.47 | ) | |
PACWEST BANCORP AND SUBSIDIARIES
Notes to Consolidated Financial Statements (Continued)
NOTE 3—ACQUISITIONS (Continued)
| | Year Ended December 31, | ||||||||||
|---|---|---|---|---|---|---|---|---|---|---|---|
| | 2010 | 2009 | 2008 | ||||||||
| | (In thousands, except per share data) | ||||||||||
Pro forma revenues (net interest income plus noninterest income) | $ | 312,477 | $ | 336,341 | $ | 357,424 | |||||
Pro forma net loss | $ | (64,000 | ) | $ | (78,390 | ) | $ | (688,701 | ) | ||
Pro forma net loss per share: | |||||||||||
Basic | $ | (1.82 | ) | $ | (2.47 | ) | $ | (25.37 | ) | ||
Diluted | $ | (1.82 | ) | $ | (2.47 | ) | $ | (25.37 | ) | ||
NOTE 4—GOODWILL AND OTHER INTANGIBLE ASSETS
In connection withAt December 31, 2011, we had goodwill of $39.1 million related entirely to the Los Padres acquisition, on August 20, 2010, we recorded goodwill of $47.3 million, all of which is deductible for tax purposes. In 2008, we determined that all of our then existing goodwill was impaired and we recorded a $761.7 million charge to write it off.
The following table presents the changes in the carrying amount of goodwill:
| | Goodwill | ||||
|---|---|---|---|---|---|
| | (In thousands) | ||||
Balance, January 1, 2008 | $ | 761,990 | |||
Adjustments related to prior acquisitions | (289 | ) | |||
Write-offs | (761,701 | ) | |||
Balance, December 31, 2008 and 2009 | — | ||||
Addition from the Los Padres acquisition | 47,301 | ||||
Balance, December 31, 2010 | $ | 47,301 | |||
| | Goodwill | |||
|---|---|---|---|---|
| | (In thousands) | |||
Balance, December 31, 2008 and December 31, 2009 | $ | — | ||
Addition from the Los Padres acquisition | 47,301 | |||
Balance, December 31, 2010 | 47,301 | |||
Adjustments to Los Padres goodwill, including resolution of matter with FDIC regarding settlement accounting for wholly-owned subsidiary of Los Padres | (8,160 | ) | ||
Balance, December 31, 2011 | $ | 39,141 | ||
Our intangible assets with definite lives are core deposit and customer relationship intangibles. These intangibles are amortized over their respective estimated useful lives to their estimated residual values and reviewed for impairment at least quarterly. The amortization expense represents the estimated decline in the value of the underlying deposits or loan customers acquired. As of December 31, 2011, all of our customer relationship intangible assets had been fully amortized. The weighted average amortization period remaining for our core deposit and customer relationship intangibles is 2.62.4 years. The estimated aggregate amortization expense related to these intangible assets for each of the next five years is $8.4 million, $6.1 million, $4.5 million, $2.9 million, $2.7 million and $2.7$1.2 million.
PACWEST BANCORP AND SUBSIDIARIES
Notes to Consolidated Financial Statements (Continued)
NOTE 4—GOODWILL AND OTHER INTANGIBLE ASSETS (Continued)
The following table presents the changes in the gross amounts of core deposit intangibles, or CDI, and customer relationship intangibles, or CRI, and the related accumulated amortization for the years indicated:
| | | Year Ended December 31, | Year Ended December 31, | |||||||||||||||||||
|---|---|---|---|---|---|---|---|---|---|---|---|---|---|---|---|---|---|---|---|---|---|---|
| | | 2010 | 2009 | 2008 | 2011 | 2010 | 2009 | |||||||||||||||
| | | (In thousands) | (In thousands) | |||||||||||||||||||
Gross amount of CDI and CRI: | Gross amount of CDI and CRI: | |||||||||||||||||||||
Balance, beginning of year | $ | 76,319 | $ | 75,911 | $ | 76,562 | ||||||||||||||||
Adjustment to Security Pacific Bank CDI | — | — | 109 | |||||||||||||||||||
Additions due to acquisitions | — | 2,189 | 2,812 | |||||||||||||||||||
Fully amortized portion | (9,219 | ) | (1,781 | ) | (3,572 | ) | ||||||||||||||||
Balance, beginning of year | $ | 75,911 | $ | 76,562 | $ | 70,805 | ||||||||||||||||
Balance, end of year | 67,100 | 76,319 | 75,911 | |||||||||||||||||||
Adjustment to Security Pacific Bank CDI | — | 109 | — | |||||||||||||||||||
Accumulated Amortization: | ||||||||||||||||||||||
Balance, beginning of year | (50,476 | ) | (42,615 | ) | (36,640 | ) | ||||||||||||||||
Amortization | (8,428 | ) | (9,642 | ) | (9,547 | ) | ||||||||||||||||
Fully amortized portion | 9,219 | 1,781 | 3,572 | |||||||||||||||||||
Additions due to acquisitions | 2,189 | 2,812 | 5,757 | |||||||||||||||||||
Fully amortized | (1,781 | ) | (3,572 | ) | — | |||||||||||||||||
Balance, end of year | 76,319 | 75,911 | 76,562 | |||||||||||||||||||
Accumulated amortization: | ||||||||||||||||||||||
Balance, beginning of year | (42,615 | ) | (36,640 | ) | (27,020 | ) | ||||||||||||||||
Amortization | (9,642 | ) | (9,547 | ) | (9,620 | ) | ||||||||||||||||
Fully amortized | 1,781 | 3,572 | — | |||||||||||||||||||
Balance, end of year | (50,476 | ) | (42,615 | ) | (36,640 | ) | ||||||||||||||||
Balance, end of year | (49,685 | ) | (50,476 | ) | (42,615 | ) | ||||||||||||||||
Net CDI and CRI, end of year | Net CDI and CRI, end of year | $ | 25,843 | $ | 33,296 | $ | 39,922 | $ | 17,415 | $ | 25,843 | $ | 33,296 | |||||||||
PACWEST BANCORP AND SUBSIDIARIES
Notes to Consolidated Financial Statements (Continued)
NOTE 5—INVESTMENT SECURITIES
Securities Available-for-Sale
The following tables present the amortized cost, gross unrealized gains and losses, and carrying value, which is the estimated fair value, of securities available-for-sale as of December 31, 2010 and 2009 are presented in the tables below.dates indicated. Other securities includeprimarily consist of equity securities and an investment in overnight money market funds at a financial institution.
| | | December 31, 2010 | December 31, 2011 | |||||||||||||||||||||||||
|---|---|---|---|---|---|---|---|---|---|---|---|---|---|---|---|---|---|---|---|---|---|---|---|---|---|---|---|---|
Security Type | Amortized Cost | Gross Unrealized Gains | Gross Unrealized Losses | Carrying Value | ||||||||||||||||||||||||
| | | Amortized Cost | Gross Unrealized Gains | Gross Unrealized Losses | Estimated Fair Value | (In thousands) | ||||||||||||||||||||||
| | (In thousands) | |||||||||||||||||||||||||||
Government-sponsored entity debt securities | $ | 10,014 | $ | 15 | $ | — | $ | 10,029 | ||||||||||||||||||||
Residential mortgage-backed securities: | ||||||||||||||||||||||||||||
Government and government-sponsored entity pass through securities | $ | 1,011,222 | $ | 31,350 | $ | (65 | ) | $ | 1,042,507 | |||||||||||||||||||
Government and government-sponsored entity collateralized mortgage obligations | 80,353 | 1,710 | (36 | ) | 82,027 | |||||||||||||||||||||||
Covered private label collateralized mortgage obligations | 41,426 | 5,878 | (2,155 | ) | 45,149 | |||||||||||||||||||||||
Municipal securities | Municipal securities | 7,437 | 129 | — | 7,566 | 124,079 | 2,774 | (56 | ) | 126,797 | ||||||||||||||||||
Residental mortgage-backed securities: | ||||||||||||||||||||||||||||
Government and government-sponsored entity pass through securities | 754,149 | 9,282 | (7,366 | ) | 756,065 | |||||||||||||||||||||||
Government and government-sponsored entity collateralized mortgage obligations | 47,416 | 565 | (352 | ) | 47,629 | |||||||||||||||||||||||
Covered private label collateralized mortgage obligations | 45,867 | 6,653 | (2,083 | ) | 50,437 | |||||||||||||||||||||||
Corporate debt securities | 25,077 | 77 | (26 | ) | 25,128 | |||||||||||||||||||||||
Other securities | Other securities | 2,290 | — | — | 2,290 | 4,885 | — | (135 | ) | 4,750 | ||||||||||||||||||
Total securities available-for-sale | $ | 1,287,042 | $ | 41,789 | $ | (2,473 | ) | $ | 1,326,358 | |||||||||||||||||||
Total securities available-for-sale | $ | 867,173 | $ | 16,644 | $ | (9,801 | ) | $ | 874,016 | |||||||||||||||||||
| | December 31, 2010 | ||||||||||||
|---|---|---|---|---|---|---|---|---|---|---|---|---|---|
Security Type | Amortized Cost | Gross Unrealized Gains | Gross Unrealized Losses | Carrying Value | |||||||||
| | (In thousands) | ||||||||||||
Residential mortgage-backed securities: | |||||||||||||
Government and government-sponsored entity pass through securities | $ | 754,149 | $ | 9,282 | $ | (7,366 | ) | $ | 756,065 | ||||
Government and government-sponsored entity collateralized mortgage obligations | 47,416 | 565 | (352 | ) | 47,629 | ||||||||
Covered private label collateralized mortgage obligations | 45,867 | 6,653 | (2,083 | ) | 50,437 | ||||||||
Government-sponsored entity debt securities | 10,014 | 15 | — | 10,029 | |||||||||
Municipal securities | 7,437 | 129 | — | 7,566 | |||||||||
Other securities | 2,290 | — | — | 2,290 | |||||||||
Total securities available-for-sale | $ | 867,173 | $ | 16,644 | $ | (9,801 | ) | $ | 874,016 | ||||
During 2011, 2010, and 2009, we made market purchases of $658.3 million, $627.9 million, and $227.5 million of investment securities available-for-sale, respectively, utilizing our excess liquidity. During 2010, through the Los Padres acquisition, we obtained $44.3 million of investment securities, including $10.7 million of FHLB stock and $33.6 million of securities available-for-sale, consisting primarily of government and government-sponsored entity pass through securities and none of which
PACWEST BANCORP AND SUBSIDIARIES
Notes to Consolidated Financial Statements (Continued)
NOTE 5—INVESTMENT SECURITIES (Continued)
| | December 31, 2009 | ||||||||||||||
|---|---|---|---|---|---|---|---|---|---|---|---|---|---|---|---|
| | Amortized Cost | Gross Unrealized Gains | Gross Unrealized Losses | Estimated Fair Value | |||||||||||
| | (In thousands) | ||||||||||||||
Government-sponsored entity debt securities | $ | 38,945 | $ | 22 | $ | (319 | ) | $ | 38,648 | ||||||
Municipal securities | 7,880 | 334 | — | 8,214 | |||||||||||
Residental mortgage-backed securities: | |||||||||||||||
Government and government-sponsored entity pass through securities | 232,717 | 3,655 | (840 | ) | 235,532 | ||||||||||
Government and government-sponsored entity collateralized mortgage obligations | 89,087 | 512 | (2,702 | ) | 86,897 | ||||||||||
Covered private label collateralized mortgage obligations | 52,967 | 713 | (1,555 | ) | 52,125 | ||||||||||
Other securities | 2,284 | — | — | 2,284 | |||||||||||
Total securities available-for-sale | $ | 423,880 | $ | 5,236 | $ | (5,416 | ) | $ | 423,700 | ||||||
During 2010, we purchased $627.9 million of government-sponsored entity pass through securities utilizing our excess liquidity.are covered by an FDIC loss sharing agreement. During 2009, in connection withthrough the August 28, 2009 Affinity acquisition, we acquiredobtained $175.4 million of investment securities, including $16.6 million of FHLB stock and $158.8 million of investment securities. Suchsecurities available-for-sale. The acquired Affinity securities included $55.3 million of "private label""private-label" collateralized mortgage obligations ("CMOs") which are covered by thean FDIC loss sharing agreement. Theagreement; the remaining securities acquired in the Affinity acquisition were predominantly government orand government-sponsored entity CMOs.
At December 31, 2010,2011, the fair value of debt securities and mortgage-backed securities issued by the Federal National Mortgage Association ("Fannie Mae") and the Federal Home Loan Mortgage Corporation ("Freddie Mac") was approximately $724.2 million.$1.1 billion. We do not own any equity securities issued by Fannie Mae or Freddie Mac. There were no sales of securities in 2011, 2010 and 2009. We sold $16.5 million of Fannie Mae and Freddie Mac debt securities at a gain of $81,000 during 2008. As of December 31, 20102011 and 2009,2010, securities available-for-sale with a carrying value of $69.6 million and $140.7 million, and $176.7 millionrespectively, were pledged as security for borrowings, public deposits and other purposes as required by various statutes and agreements.
Market valuations of our investment securities are provided by an independent third party. The fair values are determined by using several sources for valuing fixed income securities. Their techniques include pricing models that vary based on the type of asset being valued and incorporate available trade, bid and other market information. In accordance with the hierarchy established in ASC Topic 820, "Fair Value Measurement," the market valuation sources include observable market inputs for the majority of our securities and are therefore considered Level 2 inputs for purposes of determining the fair values. The valuation techniques for the covered private label CMOs are considered Level 3. See Note 13,Fair Value Measurements, for information on fair value measurements and methodology.
The following tables present, for those securities that were in a gross unrealized loss position, the carrying values, which are the estimated fair values, and the gross unrealized losses on securities by length of time the securities were in an unrealized loss position at the dates indicated:
| | December 31, 2011 | ||||||||||||||||||
|---|---|---|---|---|---|---|---|---|---|---|---|---|---|---|---|---|---|---|---|
| | Less than 12 months | 12 months or longer | Total | ||||||||||||||||
Security Type | Carrying Value | Gross Unrealized Losses | Carrying Value | Gross Unrealized Losses | Carrying Value | Gross Unrealized Losses | |||||||||||||
| | (In thousands) | ||||||||||||||||||
Residential mortgage-backed securities: | |||||||||||||||||||
Government and government-sponsored entity pass through securities | $ | 34,682 | $ | (64 | ) | $ | 22 | $ | (1 | ) | $ | 34,704 | $ | (65 | ) | ||||
Government and government-sponsored entity collateralized mortgage obligations | 10,790 | (21 | ) | 1,530 | (15 | ) | 12,320 | (36 | ) | ||||||||||
Covered private label collateralized mortgage obligations | 5,228 | (595 | ) | 4,427 | (1,560 | ) | 9,655 | (2,155 | ) | ||||||||||
Municipal securities | 7,755 | (56 | ) | — | — | 7,755 | (56 | ) | |||||||||||
Corporate debt securities | 10,758 | (26 | ) | — | — | 10,758 | (26 | ) | |||||||||||
Other securities | 2,445 | (135 | ) | — | — | 2,445 | (135 | ) | |||||||||||
Total | $ | 71,658 | $ | (897 | ) | $ | 5,979 | $ | (1,576 | ) | $ | 77,637 | $ | (2,473 | ) | ||||
PACWEST BANCORP AND SUBSIDIARIES
Notes to Consolidated Financial Statements (Continued)
NOTE 5—INVESTMENT SECURITIES (Continued)
The following table presents the estimated fair values and the gross unrealized loss on securities by length of time the securities that the securities were in an unrealized loss position at the dates indicated:
| | December 31, 2010 | December 31, 2009 | |||||||||||||||||||||||||
|---|---|---|---|---|---|---|---|---|---|---|---|---|---|---|---|---|---|---|---|---|---|---|---|---|---|---|---|
| | Less than 12 months | 12 months or longer | Total | Less than 12 months | |||||||||||||||||||||||
| | Estimated Fair Value | Gross Unrealized Losses | Estimated Fair Value | Gross Unrealized Losses | Estimated Fair Value | Gross Unrealized Losses | Estimated Fair Value | Gross Unrealized Losses | |||||||||||||||||||
| | (In thousands) | ||||||||||||||||||||||||||
Government-sponsored entity debt securities | $ | — | $ | — | $ | — | $ | — | $ | — | $ | — | $ | 35,626 | $ | (319 | ) | ||||||||||
Residental mortgage-backed securities: | |||||||||||||||||||||||||||
Government and government-sponsored entity pass through securities | 321,537 | (7,366 | ) | — | — | 321,537 | (7,366 | ) | 113,621 | (840 | ) | ||||||||||||||||
Government and government-sponsored entity collateralized mortgage obligations | 15,690 | (327 | ) | 1,553 | (25 | ) | 17,243 | (352 | ) | 64,661 | (2,702 | ) | |||||||||||||||
Covered private label collateralized mortgage obligations | 1,579 | (472 | ) | 4,980 | (1,611 | ) | 6,559 | (2,083 | ) | 30,511 | (1,555 | ) | |||||||||||||||
Total | $ | 338,806 | $ | (8,165 | ) | $ | 6,533 | $ | (1,636 | ) | $ | 345,339 | $ | (9,801 | ) | $ | 244,419 | $ | (5,416 | ) | |||||||
| | December 31, 2010 | ||||||||||||||||||
|---|---|---|---|---|---|---|---|---|---|---|---|---|---|---|---|---|---|---|---|
| | Less than 12 months | 12 months or longer | Total | ||||||||||||||||
Security Type | Carrying Value | Gross Unrealized Losses | Carrying Value | Gross Unrealized Losses | Carrying Value | Gross Unrealized Losses | |||||||||||||
| | (In thousands) | ||||||||||||||||||
Residential mortgage-backed securities: | |||||||||||||||||||
Government and government-sponsored entity pass through securities | $ | 321,537 | $ | (7,366 | ) | $ | — | $ | — | $ | 321,537 | $ | (7,366 | ) | |||||
Government and government-sponsored entity collateralized mortgage obligations | 15,690 | (327 | ) | 1,553 | (25 | ) | 17,243 | (352 | ) | ||||||||||
Covered private label collateralized mortgage obligations | 1,579 | (472 | ) | 4,980 | (1,611 | ) | 6,559 | (2,083 | ) | ||||||||||
Total | $ | 338,806 | $ | (8,165 | ) | $ | 6,533 | $ | (1,636 | ) | $ | 345,339 | $ | (9,801 | ) | ||||
We reviewed the securities that were in a continuous loss position less than 12 months and longer than 12 months at December 31, 2010,2011, and concluded that their losses were a result of the level of market interest rates relative to the types of securities and not a result of the underlying issuers' abilities to repay. Accordingly, we determined that the securities were temporarily impaired. Additionally, as we have the abilityno plans to holdsell these securities untiland believe that it is more likely than not we would not be required to sell these securities before recovery of their fair values recover to their costs and will not likely sell them,amortized cost. Therefore, we did not recognize the temporary impairment in the consolidated statements of earnings (loss).earnings.
During 2010, we determined that one covered private label collateralized mortgage obligation security was fully impaired due to deteriorating cash flows and significant delinquency of the underlying loan collateral and recorded an other-than-temporary impairment loss of $874,000 in the consolidated statement of earnings (loss).loss. This loss was offset by FDIC loss sharing income of $699,000, which represented the FDIC's 80% share of the loss.
Mortgage-backed securities have contractual terms to maturity, but require periodic payments to reduce principal. In addition, expected maturities may differ from contractual maturities because obligors and/or issuers may have the right to call or prepay obligations with or without call or prepayment penalties.
The contractual maturity distribution of our securities available-for-sale portfolio based on amortized cost and carrying value is shown as of the date below:
| | December 31, 2011 | ||||||
|---|---|---|---|---|---|---|---|
Maturity | Amortized Cost | Carrying Value | |||||
| | (In thousands) | ||||||
Due in one year or less | $ | 4,885 | $ | 4,750 | |||
Due after one year through five years | 8,592 | 8,807 | |||||
Due after five years through ten years | 35,452 | 36,973 | |||||
Due after ten years | 1,238,113 | 1,275,828 | |||||
Total securities available-for-sale | $ | 1,287,042 | $ | 1,326,358 | |||
PACWEST BANCORP AND SUBSIDIARIES
Notes to Consolidated Financial Statements (Continued)
NOTE 5—INVESTMENT SECURITIES (Continued)
The contractual maturity distribution of our securities available-for-sale portfolio based on amortized cost and fair value is shown as of the date below:
| | December 31, 2010 | |||||||
|---|---|---|---|---|---|---|---|---|
| | Amortized Cost | Estimated Fair Value | ||||||
| | (In thousands) | |||||||
Due in one year or less | $ | 4,726 | $ | 4,759 | ||||
Due after one year through five years | 20,211 | 20,700 | ||||||
Due after five years through ten years | 45,646 | 46,664 | ||||||
Due after ten years | 796,590 | 801,893 | ||||||
Total securities available-for-sale | $ | 867,173 | $ | 874,016 | ||||
FHLB Stock
At December 31, 2010,2011, the Company had a $55.0$46.1 million investment in Federal Home Loan Bank of San Francisco ("FHLB") stock carried at cost. In January 2009, the FHLB announced that it suspended excess FHLB stock redemptions and dividend payments. Since this announcement, the FHLB has declared and paid five cash dividends in 2010 and 2011, though at rates less than thatthose paid in the past, and repurchased $6.0 millioncertain amounts of our excess stock.stock at the carrying value. We evaluated the carrying value of our FHLB stock investment at December 31, 20102011, and determined that it was not impaired. Our evaluation considered the long-term nature of the investment, the current financial and liquidity position of the FHLB, the actions being taken by the FHLB to address its regulatory situation, repurchase activity of excess stock by the FHLB, and our intent and ability to hold this investment for a period of time sufficient to recover our recorded investment.
NOTE 6—LOANS
Non-Covered Loans
When we refer to non-covered loans we are referring to loans not covered by our FDIC loss sharing agreements.
The Company funds commercial, real estate and consumer loans to customers in the regions the Bank serves, which are mainly in Southern California. We haveThe non-covered foreign loans which are primarily to individuals and entities located in Mexico. All of our non-covered foreign loans are denominated in U.S. dollars and the majority is collateralized by assets located in the United States or guaranteed or insured by businesses located in the United States. As
The following table presents the composition of December 31, 2010 and 2009,our non-covered foreign loan balances totaled $22.6 million and $36.2 million, respectively.loans by portfolio segment as of the dates indicated:
| | December 31, | ||||||
|---|---|---|---|---|---|---|---|
Loan Segment | 2011 | 2010 | |||||
| | (In thousands) | ||||||
Real estate mortgage | $ | 1,982,464 | $ | 2,274,733 | |||
Real estate construction | 113,059 | 179,479 | |||||
Commercial | 671,939 | 663,557 | |||||
Consumer | 23,711 | 25,058 | |||||
Foreign | 20,932 | 22,608 | |||||
Total gross non-covered loans | 2,812,105 | 3,165,435 | |||||
Less: | |||||||
Unearned income | (4,392 | ) | (4,380 | ) | |||
Allowance for loan losses | (85,313 | ) | (98,653 | ) | |||
Total net non-covered loans | $ | 2,722,400 | $ | 3,062,402 | |||
PACWEST BANCORP AND SUBSIDIARIES
Notes to Consolidated Financial Statements (Continued)
NOTE 6—LOANS (Continued)
The following table presents the composition of non-covered loans as of the dates indicated:
| | December 31, | ||||||||
|---|---|---|---|---|---|---|---|---|---|
Loan Category | 2010 | 2009 | |||||||
| | (In thousands) | ||||||||
Real estate mortgage | $ | 2,274,733 | $ | 2,423,712 | |||||
Commercial | 663,557 | 781,003 | |||||||
Real estate construction | 179,479 | 440,286 | |||||||
Consumer | 25,058 | 32,138 | |||||||
Foreign | 22,608 | 36,243 | |||||||
Total gross non-covered loans | 3,165,435 | 3,713,382 | |||||||
Less: | |||||||||
Unearned income | (4,380 | ) | (5,999 | ) | |||||
Allowance for loan losses | (98,653 | ) | (118,717 | ) | |||||
Total net non-covered loans | $ | 3,062,402 | $ | 3,588,666 | |||||
The following table presents a summary of the activity in the allowance for credit losses on non-covered loans for the years indicated:
| | Components | | ||||||||
|---|---|---|---|---|---|---|---|---|---|---|
| | Total Allowance for Credit Losses | |||||||||
| | Allowance for Loan Losses | Reserve for Unfunded Loan Commitments | ||||||||
| | (In thousands) | |||||||||
Balance, December 31, 2008 | $ | 63,519 | $ | 5,271 | $ | 68,790 | ||||
Charge-offs | (88,119 | ) | — | (88,119 | ) | |||||
Recoveries | 1,707 | — | 1,707 | |||||||
Provision | 141,610 | 290 | 141,900 | |||||||
Balance, December 31, 2009 | 118,717 | 5,561 | 124,278 | |||||||
Charge-offs(1) | (203,222 | ) | — | (203,222 | ) | |||||
Recoveries | 4,280 | — | 4,280 | |||||||
Provision | 178,878 | 114 | 178,992 | |||||||
Balance, December 31, 2010 | 98,653 | 5,675 | 104,328 | |||||||
Charge-offs | (28,560 | ) | — | (28,560 | ) | |||||
Recoveries | 4,715 | — | 4,715 | |||||||
Provision | 10,505 | 2,795 | 13,300 | |||||||
Balance, December 31, 2011 | $ | 85,313 | $ | 8,470 | $ | 93,783 | ||||
| | Components | | |||||||||
|---|---|---|---|---|---|---|---|---|---|---|---|
| | Total Allowance for Credit Losses | ||||||||||
| | Allowance for Loan Losses | Reserve for Unfunded Loan Commitments | |||||||||
| | (In thousands) | ||||||||||
Balance, January 1, 2008 | $ | 52,557 | $ | 8,471 | $ | 61,028 | |||||
Loans charged-off(1) | (39,575 | ) | — | (39,575 | ) | ||||||
Recoveries on loans charged-off | 1,537 | — | 1,537 | ||||||||
Provision | 49,000 | (3,200 | ) | 45,800 | |||||||
Balance, December 31, 2008 | $ | 63,519 | $ | 5,271 | $ | 68,790 | |||||
Loans charged-off | (88,119 | ) | — | (88,119 | ) | ||||||
Recoveries on loans charged-off | 1,707 | — | 1,707 | ||||||||
Provision | 141,610 | 290 | 141,900 | ||||||||
Balance, December 31, 2009 | $ | 118,717 | $ | 5,561 | $ | 124,278 | |||||
Loans charged-off(1) | (203,222 | ) | — | (203,222 | ) | ||||||
Recoveries on loans charged-off | 4,280 | — | 4,280 | ||||||||
Provision | 178,878 | 114 | 178,992 | ||||||||
Balance, December 31, 2010 | $ | 98,653 | $ | 5,675 | $ | 104,328 | |||||
PACWEST BANCORP AND SUBSIDIARIES
Notes to Consolidated Financial Statements (Continued)
NOTE 6—LOANS (Continued)
The following table presents a summary of the activity in the allowance for loan losses on non-covered loans by portfolio segment for the year indicated:
| | Year Ended December 31, 2010 | |||||||||||||||||||
|---|---|---|---|---|---|---|---|---|---|---|---|---|---|---|---|---|---|---|---|---|
| | Real Estate Mortgage | Real Estate Construction | Commercial | Consumer | Foreign | Total | ||||||||||||||
| | (In thousands) | |||||||||||||||||||
Allowance for Loan Losses on Non-Covered Loans: | ||||||||||||||||||||
Beginning balance | $ | 58,241 | $ | 39,934 | $ | 17,710 | $ | 2,021 | $ | 811 | $ | 118,717 | ||||||||
Charge-offs | (117,029 | ) | (63,590 | ) | (18,548 | ) | (3,749 | ) | (306 | ) | (203,222 | ) | ||||||||
Recoveries | 1,222 | 708 | 1,652 | 565 | 133 | 4,280 | ||||||||||||||
Provision | 109,223 | 31,714 | 32,415 | 5,815 | (289 | ) | 178,878 | |||||||||||||
Ending balance | $ | 51,657 | $ | 8,766 | $ | 33,229 | $ | 4,652 | $ | 349 | $ | 98,653 | ||||||||
The ending balance is composed of amounts applicable to loans: | ||||||||||||||||||||
Individually evaluated for impairment | $ | 3,893 | $ | 1,125 | $ | 8,911 | $ | 1,049 | $ | — | $ | 14,978 | ||||||||
Collectively evaluated for | $ | 47,764 | $ | 7,641 | $ | 24,318 | $ | 3,603 | $ | 349 | $ | 83,675 | ||||||||
Non-Covered Loan Balances: | ||||||||||||||||||||
Ending balance | $ | 2,274,733 | $ | 179,479 | $ | 663,557 | $ | 25,058 | $ | 22,608 | $ | 3,165,435 | ||||||||
The ending balance is composed of loans: | ||||||||||||||||||||
Individually evaluated for impairment | $ | 94,171 | $ | 47,350 | $ | 39,820 | $ | 1,951 | $ | 163 | $ | 183,455 | ||||||||
Collectively evaluated for | $ | 2,180,562 | $ | 132,129 | $ | 623,737 | $ | 23,107 | $ | 22,445 | $ | 2,981,980 | ||||||||
PACWEST BANCORP AND SUBSIDIARIES
Notes to Consolidated Financial Statements (Continued)
NOTE 6—LOANS (Continued)
The following table presentstables present summaries of the activity in the allowance for loan losses on non-covered loans by portfolio segment for the years indicated:
| | Year Ended December 31, 2011 | ||||||||||||||||||
|---|---|---|---|---|---|---|---|---|---|---|---|---|---|---|---|---|---|---|---|
| | Real Estate Mortgage | Real Estate Construction | Commercial | Consumer | Foreign | Total | |||||||||||||
| | (In thousands) | ||||||||||||||||||
Allowance for Loan Losses on Non-Covered Loans: | |||||||||||||||||||
Beginning balance | $ | 51,657 | $ | 8,766 | $ | 33,229 | $ | 4,652 | $ | 349 | $ | 98,653 | |||||||
Charge-offs | (10,180 | ) | (6,886 | ) | (10,072 | ) | (1,422 | ) | — | (28,560 | ) | ||||||||
Recoveries | 513 | 1,025 | 1,668 | 1,394 | 115 | 4,715 | |||||||||||||
Provision (recovery) | 8,215 | 5,792 | (1,517 | ) | (1,856 | ) | (129 | ) | 10,505 | ||||||||||
Ending balance | $ | 50,205 | $ | 8,697 | $ | 23,308 | $ | 2,768 | $ | 335 | $ | 85,313 | |||||||
The ending balance of the allowance is composed of amounts applicable to loans: | |||||||||||||||||||
Individually evaluated for impairment | $ | 11,494 | $ | 2,073 | $ | 6,793 | $ | 413 | $ | — | $ | 20,773 | |||||||
Collectively evaluated for impairment | $ | 38,711 | $ | 6,624 | $ | 16,515 | $ | 2,355 | $ | 335 | $ | 64,540 | |||||||
Non-Covered Loan Balances: | |||||||||||||||||||
Ending balance | $ | 1,982,464 | $ | 113,059 | $ | 671,939 | $ | 23,711 | $ | 20,932 | $ | 2,812,105 | |||||||
The ending balance of the non-covered loan portfolio is composed of loans: | |||||||||||||||||||
Individually evaluated for impairment | $ | 118,821 | $ | 31,792 | $ | 23,710 | $ | 728 | $ | — | $ | 175,051 | |||||||
Collectively evaluated for impairment | $ | 1,863,643 | $ | 81,267 | $ | 648,229 | $ | 22,983 | $ | 20,932 | $ | 2,637,054 | |||||||
PACWEST BANCORP AND SUBSIDIARIES
Notes to Consolidated Financial Statements (Continued)
NOTE 6—LOANS (Continued)
| | Year Ended December 31, 2010 | ||||||||||||||||||
|---|---|---|---|---|---|---|---|---|---|---|---|---|---|---|---|---|---|---|---|
| | Real Estate Mortgage | Real Estate Construction | Commercial | Consumer | Foreign | Total | |||||||||||||
| | | | (In thousands) | | | | |||||||||||||
Allowance for Loan Losses on Non-Covered Loans: | |||||||||||||||||||
Beginning balance | $ | 58,241 | $ | 39,934 | $ | 17,710 | $ | 2,021 | $ | 811 | $ | 118,717 | |||||||
Charge-offs | (117,029 | ) | (63,590 | ) | (18,548 | ) | (3,749 | ) | (306 | ) | (203,222 | ) | |||||||
Recoveries | 1,222 | 708 | 1,652 | 565 | 133 | 4,280 | |||||||||||||
Provision (recovery) | 109,223 | 31,714 | 32,415 | 5,815 | (289 | ) | 178,878 | ||||||||||||
Ending balance | $ | 51,657 | $ | 8,766 | $ | 33,229 | $ | 4,652 | $ | 349 | $ | 98,653 | |||||||
The ending balance of the allowance is composed of amounts applicable to loans: | |||||||||||||||||||
Individually evaluated for impairment | $ | 3,893 | $ | 1,125 | $ | 8,911 | $ | 1,049 | $ | — | $ | 14,978 | |||||||
Collectively evaluated for impairment | $ | 47,764 | $ | 7,641 | $ | 24,318 | $ | 3,603 | $ | 349 | $ | 83,675 | |||||||
Non-Covered Loan Balances: | |||||||||||||||||||
Ending balance | $ | 2,274,733 | $ | 179,479 | $ | 663,557 | $ | 25,058 | $ | 22,608 | $ | 3,165,435 | |||||||
The ending balance of the non-covered loan portfolio is composed of loans: | |||||||||||||||||||
Individually evaluated for impairment | $ | 94,171 | $ | 47,350 | $ | 39,820 | $ | 1,951 | $ | 163 | $ | 183,455 | |||||||
Collectively evaluated for impairment | $ | 2,180,562 | $ | 132,129 | $ | 623,737 | $ | 23,107 | $ | 22,445 | $ | 2,981,980 | |||||||
PACWEST BANCORP AND SUBSIDIARIES
Notes to Consolidated Financial Statements (Continued)
NOTE 6—LOANS (Continued)
The following tables present the credit risk rating categories for non-covered loans by portfolio segment and class as of the datedates indicated. Nonclassified loans are those with a credit risk rating of either pass or special mention, while classified loans are those with a credit risk rating of either substandard or doubtful.
| | December 31, 2010 | ||||||||||||||||||||||||||||||
|---|---|---|---|---|---|---|---|---|---|---|---|---|---|---|---|---|---|---|---|---|---|---|---|---|---|---|---|---|---|---|---|
| | Nonclassified | Classified | Total | ||||||||||||||||||||||||||||
| | (In thousands) | ||||||||||||||||||||||||||||||
Commercial: | |||||||||||||||||||||||||||||||
Collateralized | $ | 342,607 | $ | 15,820 | $ | 358,427 | |||||||||||||||||||||||||
Unsecured | 119,326 | 10,417 | 129,743 | ||||||||||||||||||||||||||||
Asset-based | 141,813 | 1,354 | 143,167 | ||||||||||||||||||||||||||||
SBA 7(a) | 29,557 | 2,663 | 32,220 | ||||||||||||||||||||||||||||
Total commercial | 633,303 | 30,254 | 663,557 | ||||||||||||||||||||||||||||
Real estate construction: | |||||||||||||||||||||||||||||||
Residential | 39,644 | 25,399 | 65,043 | ||||||||||||||||||||||||||||
Commercial | 82,291 | 32,145 | 114,436 | ||||||||||||||||||||||||||||
| December 31, 2011 | December 31, 2010 | ||||||||||||||||||||||||||||||
Total real estate construction | 121,935 | 57,544 | 179,479 | Nonclassified | Classified | Total | Nonclassified | Classified | Total | ||||||||||||||||||||||
| (In thousands) | |||||||||||||||||||||||||||||||
Real estate mortgage: | Real estate mortgage: | ||||||||||||||||||||||||||||||
Hospitality | $ | 123,071 | $ | 21,331 | $ | 144,402 | $ | 137,952 | $ | 18,700 | $ | 156,652 | |||||||||||||||||||
SBA 504 | 51,522 | 6,855 | 58,377 | 55,774 | 13,513 | 69,287 | |||||||||||||||||||||||||
Other | 1,690,830 | 88,855 | 1,779,685 | 1,956,905 | 91,889 | 2,048,794 | |||||||||||||||||||||||||
Hospitality | 137,952 | 18,700 | 156,652 | ||||||||||||||||||||||||||||
Total real estate mortgage | 1,865,423 | 117,041 | 1,982,464 | 2,150,631 | 124,102 | 2,274,733 | |||||||||||||||||||||||||
SBA 504 | 55,774 | 13,513 | 69,287 | ||||||||||||||||||||||||||||
Real estate construction: | |||||||||||||||||||||||||||||||
Residential | 14,743 | 2,926 | 17,669 | 39,644 | 25,399 | 65,043 | |||||||||||||||||||||||||
Commercial | 64,667 | 30,723 | 95,390 | 82,291 | 32,145 | 114,436 | |||||||||||||||||||||||||
Other | 1,956,905 | 91,889 | 2,048,794 | ||||||||||||||||||||||||||||
Total real estate construction | 79,410 | 33,649 | 113,059 | 121,935 | 57,544 | 179,479 | |||||||||||||||||||||||||
Commercial: | |||||||||||||||||||||||||||||||
Collateralized | 395,041 | 18,979 | 414,020 | 342,607 | 15,820 | 358,427 | |||||||||||||||||||||||||
Unsecured | 75,017 | 3,920 | 78,937 | 119,326 | 10,417 | 129,743 | |||||||||||||||||||||||||
Asset-based | 149,947 | 40 | 149,987 | 141,813 | 1,354 | 143,167 | |||||||||||||||||||||||||
SBA 7(a) | 18,045 | 10,950 | 28,995 | 29,557 | 2,663 | 32,220 | |||||||||||||||||||||||||
Total real estate mortgage | 2,150,631 | 124,102 | 2,274,733 | ||||||||||||||||||||||||||||
Total commercial | 638,050 | 33,889 | 671,939 | 633,303 | 30,254 | 663,557 | |||||||||||||||||||||||||
Consumer | Consumer | 22,949 | 2,109 | 25,058 | 22,730 | 981 | 23,711 | 22,949 | 2,109 | 25,058 | |||||||||||||||||||||
Foreign | Foreign | 22,608 | — | 22,608 | 20,932 | — | 20,932 | 22,608 | — | 22,608 | |||||||||||||||||||||
Total non-covered | |||||||||||||||||||||||||||||||
loans | $ | 2,626,545 | $ | 185,560 | $ | 2,812,105 | $ | 2,951,426 | $ | 214,009 | $ | 3,165,435 | |||||||||||||||||||
Total non-covered loans | $ | 2,951,426 | $ | 214,009 | $ | 3,165,435 | |||||||||||||||||||||||||
OurIn addition to our internal credit risk rating process, our federal and state banking regulators, as an integral part of their examination process, periodically review the Company's loan risk rating classifications. Our regulators may require the Company to recognize rating downgrades based on their judgments related to information available to them at the time of their examinations. Risk rating downgrades generally result in higher allowances for credit losses.
PACWEST BANCORP AND SUBSIDIARIES
Notes to Consolidated Financial Statements (Continued)
NOTE 6—LOANS (Continued)
The following table presentstables present an aging analysis of our non-covered loans by portfolio segment and class as of the datedates indicated:
| | December 31, 2010 | |||||||||||||||||||||||||||||||||||||||
|---|---|---|---|---|---|---|---|---|---|---|---|---|---|---|---|---|---|---|---|---|---|---|---|---|---|---|---|---|---|---|---|---|---|---|---|---|---|---|---|---|
| | 30 - 59 Days Past Due | 60 - 89 Days Past Due | Greater Than 90 Days Past Due | Total Past Due | Current | Total | ||||||||||||||||||||||||||||||||||
| | (In thousands) | |||||||||||||||||||||||||||||||||||||||
Commercial: | ||||||||||||||||||||||||||||||||||||||||
Collateralized | $ | 725 | $ | 883 | $ | 1,457 | $ | 3,065 | $ | 355,362 | $ | 358,427 | ||||||||||||||||||||||||||||
Unsecured | — | 5,966 | 600 | 6,566 | 123,177 | 129,743 | ||||||||||||||||||||||||||||||||||
Asset-based | — | — | — | — | 143,167 | 143,167 | ||||||||||||||||||||||||||||||||||
SBA 7(a) | 1,254 | 494 | 751 | 2,499 | 29,721 | 32,220 | ||||||||||||||||||||||||||||||||||
Total commercial | 1,979 | 7,343 | 2,808 | 12,130 | 651,427 | 663,557 | ||||||||||||||||||||||||||||||||||
Real estate construction: | ||||||||||||||||||||||||||||||||||||||||
Residential | — | — | 24,004 | 24,004 | 41,039 | 65,043 | ||||||||||||||||||||||||||||||||||
Commercial | — | 667 | 2,145 | 2,812 | 111,624 | 114,436 | ||||||||||||||||||||||||||||||||||
| December 31, 2011 | ||||||||||||||||||||||||||||||||||||||||
Total real estate construction | — | 667 | 26,149 | 26,816 | 152,663 | 179,479 | 30 - 59 Days Past Due | 60 - 89 Days Past Due | Greater Than 90 Days Past Due | Total Past Due | Current | Total | ||||||||||||||||||||||||||||
| (In thousands) | ||||||||||||||||||||||||||||||||||||||||
Real estate mortgage: | Real estate mortgage: | |||||||||||||||||||||||||||||||||||||||
Hospitality | $ | — | $ | — | $ | — | $ | — | $ | 144,402 | $ | 144,402 | ||||||||||||||||||||||||||||
SBA 504 | 718 | — | 842 | 1,560 | 56,817 | 58,377 | ||||||||||||||||||||||||||||||||||
Other | 12,953 | 191 | 13,205 | 26,349 | 1,753,336 | 1,779,685 | ||||||||||||||||||||||||||||||||||
Hospitality | — | — | — | — | 156,652 | 156,652 | ||||||||||||||||||||||||||||||||||
Total real estate mortgage | 13,671 | 191 | 14,047 | 27,909 | 1,954,555 | 1,982,464 | ||||||||||||||||||||||||||||||||||
SBA 504 | 799 | 462 | 6,235 | 7,496 | 61,791 | 69,287 | ||||||||||||||||||||||||||||||||||
Real estate construction: | ||||||||||||||||||||||||||||||||||||||||
Residential | — | 475 | — | 475 | 17,194 | 17,669 | ||||||||||||||||||||||||||||||||||
Commercial | 2,290 | — | 2,182 | 4,472 | 90,918 | 95,390 | ||||||||||||||||||||||||||||||||||
Other | 426 | 2,566 | 13,936 | 16,928 | 2,031,866 | 2,048,794 | ||||||||||||||||||||||||||||||||||
Total real estate construction | 2,290 | 475 | 2,182 | 4,947 | 108,112 | 113,059 | ||||||||||||||||||||||||||||||||||
Commercial: | ||||||||||||||||||||||||||||||||||||||||
Collateralized | 275 | 423 | 1,701 | 2,399 | 411,621 | 414,020 | ||||||||||||||||||||||||||||||||||
Unsecured | 4 | — | 151 | 155 | 78,782 | 78,937 | ||||||||||||||||||||||||||||||||||
Asset-based | — | — | — | — | 149,987 | 149,987 | ||||||||||||||||||||||||||||||||||
SBA 7(a) | 996 | 646 | 274 | 1,916 | 27,079 | 28,995 | ||||||||||||||||||||||||||||||||||
Total real estate mortgage | 1,225 | 3,028 | 20,171 | 24,424 | 2,250,309 | 2,274,733 | �� | |||||||||||||||||||||||||||||||||
Total commercial | 1,275 | 1,069 | 2,126 | 4,470 | 667,469 | 671,939 | ||||||||||||||||||||||||||||||||||
Consumer | Consumer | 407 | 1,048 | — | 1,455 | 23,603 | 25,058 | 72 | 40 | 17 | 129 | 23,582 | 23,711 | |||||||||||||||||||||||||||
Foreign | Foreign | — | — | 163 | 163 | 22,445 | 22,608 | — | — | — | — | 20,932 | 20,932 | |||||||||||||||||||||||||||
Total non-covered loans | $ | 17,308 | $ | 1,775 | $ | 18,372 | $ | 37,455 | $ | 2,774,650 | $ | 2,812,105 | ||||||||||||||||||||||||||||
Total non-covered loans | $ | 3,611 | $ | 12,086 | $ | 49,291 | $ | 64,988 | $ | 3,100,447 | $ | 3,165,435 | ||||||||||||||||||||||||||||
At December 31, 2011 and 2010, the Company had no loans that were greater than 90 days past due and still accruing interest. It is the Company's policy to discontinue accruing interest when principal or interest payments are past due 90 days or when, in the opinion of management, there is a reasonable doubt as to collectibility in the normal course of business. At December 31, 2010, we had $12.02011, nonaccrual loans totaled $58.3 million. Nonaccrual loans included $2.5 million of loans 30 to 89 days past due and $32.9$37.4 million of current loans thatwhich were placed on nonaccrual status based on management's judgment aboutregarding the collectibility of such loans.
During 2011, all past due categories were reduced due to charge-offs and foreclosure activity. Reduction in the residential real estate construction past due category related to the foreclosure of two
PACWEST BANCORP AND SUBSIDIARIES
Notes to Consolidated Financial Statements (Continued)
NOTE 6—LOANS (Continued)
non-covered nonaccrual loans with an aggregate balance of $23.0 million secured by undeveloped land located in Ventura County, California.
| | December 31, 2010 | ||||||||||||||||||
|---|---|---|---|---|---|---|---|---|---|---|---|---|---|---|---|---|---|---|---|
| | 30 - 59 Days Past Due | 60 - 89 Days Past Due | Greater Than 90 Days Past Due | Total Past Due | Current | Total | |||||||||||||
| | (In thousands) | ||||||||||||||||||
Real estate mortgage: | |||||||||||||||||||
Hospitality | $ | — | $ | — | $ | — | $ | — | $ | 156,652 | $ | 156,652 | |||||||
SBA 504 | 799 | 462 | 6,235 | 7,496 | 61,791 | 69,287 | |||||||||||||
Other | 426 | 2,566 | 13,936 | 16,928 | 2,031,866 | 2,048,794 | |||||||||||||
Total real estate mortgage | 1,225 | 3,028 | 20,171 | 24,424 | 2,250,309 | 2,274,733 | |||||||||||||
Real estate construction: | |||||||||||||||||||
Residential | — | — | 24,004 | 24,004 | 41,039 | 65,043 | |||||||||||||
Commercial | — | 667 | 2,145 | 2,812 | 111,624 | 114,436 | |||||||||||||
Total real estate construction | — | 667 | 26,149 | 26,816 | 152,663 | 179,479 | |||||||||||||
Commercial: | |||||||||||||||||||
Collateralized | 725 | 883 | 1,457 | 3,065 | 355,362 | 358,427 | |||||||||||||
Unsecured | — | 5,966 | 600 | 6,566 | 123,177 | 129,743 | |||||||||||||
Asset-based | — | — | — | — | 143,167 | 143,167 | |||||||||||||
SBA 7(a) | 1,254 | 494 | 751 | 2,499 | 29,721 | 32,220 | |||||||||||||
Total commercial | 1,979 | 7,343 | 2,808 | 12,130 | 651,427 | 663,557 | |||||||||||||
Consumer | 407 | 1,048 | — | 1,455 | 23,603 | 25,058 | |||||||||||||
Foreign | — | — | 163 | 163 | 22,445 | 22,608 | |||||||||||||
Total non-covered loans | $ | 3,611 | $ | 12,086 | $ | 49,291 | $ | 64,988 | $ | 3,100,447 | $ | 3,165,435 | |||||||
Nonaccrual loans totaled $94.2 million at December 31, 2010, of which $12.0 million were 30 to 89 days past due and $32.9 million were current.
PACWEST BANCORP AND SUBSIDIARIES
Notes to Consolidated Financial Statements (Continued)
NOTE 6—LOANS (Continued)
The following table presentstables present our nonaccrual and performing non-covered loans by portfolio segment and class as of the date indicated:
| | December 31, 2010 | ||||||||||||||||||||||||||||||
|---|---|---|---|---|---|---|---|---|---|---|---|---|---|---|---|---|---|---|---|---|---|---|---|---|---|---|---|---|---|---|---|
| | Nonaccrual | Performing | Total | ||||||||||||||||||||||||||||
| | (In thousands) | ||||||||||||||||||||||||||||||
Commercial: | |||||||||||||||||||||||||||||||
Collateralized | $ | 6,241 | $ | 352,186 | $ | 358,427 | |||||||||||||||||||||||||
Unsecured | 9,104 | 120,639 | 129,743 | ||||||||||||||||||||||||||||
Asset-based | 15 | 143,152 | 143,167 | ||||||||||||||||||||||||||||
SBA 7(a) | 6,518 | 25,702 | 32,220 | ||||||||||||||||||||||||||||
Total commercial | 21,878 | 641,679 | 663,557 | ||||||||||||||||||||||||||||
Real estate construction: | |||||||||||||||||||||||||||||||
Residential | 24,004 | 41,039 | 65,043 | ||||||||||||||||||||||||||||
Commercial | 5,238 | 109,198 | 114,436 | ||||||||||||||||||||||||||||
| December 31, 2011 | December 31, 2010 | ||||||||||||||||||||||||||||||
Total real estate construction | 29,242 | 150,237 | 179,479 | Nonaccrual | Performing | Total | Nonaccrual | Performing | Total | ||||||||||||||||||||||
| (In thousands) | |||||||||||||||||||||||||||||||
Real estate mortgage: | Real estate mortgage: | ||||||||||||||||||||||||||||||
Hospitality | $ | 7,251 | $ | 137,151 | $ | 144,402 | $ | 4,151 | $ | 152,501 | $ | 156,652 | |||||||||||||||||||
SBA 504 | 2,800 | 55,577 | 58,377 | 9,346 | 59,941 | 69,287 | |||||||||||||||||||||||||
Other | 21,286 | 1,758,399 | 1,779,685 | 27,452 | 2,021,342 | 2,048,794 | |||||||||||||||||||||||||
Hospitality | 4,151 | 152,501 | 156,652 | ||||||||||||||||||||||||||||
Total real estate | |||||||||||||||||||||||||||||||
mortgage | 31,337 | 1,951,127 | 1,982,464 | 40,949 | 2,233,784 | 2,274,733 | |||||||||||||||||||||||||
SBA 504 | 9,346 | 59,941 | 69,287 | ||||||||||||||||||||||||||||
Real estate construction: | |||||||||||||||||||||||||||||||
Residential | 1,086 | 16,583 | 17,669 | 24,004 | 41,039 | 65,043 | |||||||||||||||||||||||||
Commercial | 6,194 | 89,196 | 95,390 | 5,238 | 109,198 | 114,436 | |||||||||||||||||||||||||
Other | 27,452 | 2,021,342 | 2,048,794 | ||||||||||||||||||||||||||||
Total real estate construction | 7,280 | 105,779 | 113,059 | 29,242 | 150,237 | 179,479 | |||||||||||||||||||||||||
Commercial: | |||||||||||||||||||||||||||||||
Collateralized | 8,186 | 405,834 | 414,020 | 6,241 | 352,186 | 358,427 | |||||||||||||||||||||||||
Unsecured | 3,057 | 75,880 | 78,937 | 9,104 | 120,639 | 129,743 | |||||||||||||||||||||||||
Asset-based | 14 | 149,973 | 149,987 | 15 | 143,152 | 143,167 | |||||||||||||||||||||||||
SBA 7(a) | 7,801 | 21,194 | 28,995 | 6,518 | 25,702 | 32,220 | |||||||||||||||||||||||||
Total real estate mortgage | 40,949 | 2,233,784 | 2,274,733 | ||||||||||||||||||||||||||||
Total commercial | 19,058 | 652,881 | 671,939 | 21,878 | 641,679 | 663,557 | |||||||||||||||||||||||||
Consumer | Consumer | 1,951 | 23,107 | 25,058 | 585 | 23,126 | 23,711 | 1,951 | 23,107 | 25,058 | |||||||||||||||||||||
Foreign | Foreign | 163 | 22,445 | 22,608 | — | 20,932 | 20,932 | 163 | 22,445 | 22,608 | |||||||||||||||||||||
Total non-covered loans | $ | 58,260 | $ | 2,753,845 | $ | 2,812,105 | $ | 94,183 | $ | 3,071,252 | $ | 3,165,435 | |||||||||||||||||||
Total non-covered loans | $ | 94,183 | $ | 3,071,252 | $ | 3,165,435 | |||||||||||||||||||||||||
Non-coveredNonaccrual loans and performing restructured loans are considered impaired for reporting purposes. Impaired loans include loans thatby portfolio segment are designated as nonaccrual or restructured and are summarized in the following tablefollows as of the dates indicated:
| | December 31, | |||||||
|---|---|---|---|---|---|---|---|---|
| | 2010 | 2009 | ||||||
| | (In thousands) | |||||||
Nonaccrual restructured loans | $ | 36,262 | $ | 88,274 | ||||
Other nonaccrual loans | 57,921 | 151,893 | ||||||
Total non-covered nonaccrual loans | 94,183 | 240,167 | ||||||
Performing restructured loans | 89,272 | 181,454 | ||||||
Total non-covered impaired loans | $ | 183,455 | $ | 421,621 | ||||
| | December 31, 2011 | December 31, 2010 | |||||||||||||||||
|---|---|---|---|---|---|---|---|---|---|---|---|---|---|---|---|---|---|---|---|
Loan Segment | Nonaccrual Loans | Performing Restructured Loans | Total Impaired Loans | Nonaccrual Loans | Performing Restructured Loans | Total Impaired Loans | |||||||||||||
| | (In thousands) | ||||||||||||||||||
Real estate mortgage | $ | 31,337 | $ | 87,484 | $ | 118,821 | $ | 40,949 | $ | 53,222 | $ | 94,171 | |||||||
Real estate construction | 7,280 | 24,512 | 31,792 | 29,242 | 18,108 | 47,350 | |||||||||||||
Commercial | 19,058 | 4,652 | 23,710 | 21,878 | 17,942 | 39,820 | |||||||||||||
Consumer | 585 | 143 | 728 | 1,951 | — | 1,951 | |||||||||||||
Foreign | — | — | — | 163 | — | 163 | |||||||||||||
Total | $ | 58,260 | $ | 116,791 | $ | 175,051 | $ | 94,183 | $ | 89,272 | $ | 183,455 | |||||||
We have commitments in the amount of $23,000 to lend on nonaccrual loans but are under no obligation to honor such commitment as long as the loan is on nonaccrual. We have commitments in the amount of $60,000 to lend on performing restructured loans.
During 2010, non-covered nonaccrual loans declined by $146.0 million, to $94.2 million, and non-covered performing restructured loans decreased by $92.2 million, to $89.3 million at December 31,
PACWEST BANCORP AND SUBSIDIARIES
Notes to Consolidated Financial Statements (Continued)
NOTE 6—LOANS (Continued)
2010. The drop At December 31, 2011, we had commitments in the amount of $1,000 to lend on nonaccrual loans but are under no obligation to honor such commitment as long as the loan is on nonaccrual. We had commitments in the amount of $4.0 million to lend on performing restructured loans.
During 2011, non-covered nonaccrual loans declined by $35.9 million, to $58.3 million; this decrease in nonaccrual loans was attributable primarily to reductions, payoffs and returns to accrual status of $33.4 million, charge-offs of $24.5 million, and foreclosures of $34.9 million, offset partially by additions of $56.9 million.
During 2011, non-covered performing restructured loans increased by $27.5 million, to $116.8 million, at December 31, 2011. The growth in performing restructured loans was attributable primarily to $398.5additions of $58.8 million, offset partially by the removal of non-covered classified$16.7 million in loans soldfrom restructured loan status due to the performance of the loans in 2010,accordance with their modified terms, and the transfers of which $128.1 million were nonaccrual loans and $148.8 million were performing restructured loans.
loans to nonaccrual status of $14.6 million. At December 31, 2010,2011, we had $89.3$116.8 million in loans that were accruing interest under the terms of troubled debt restructurings. This amount consisted of $69.7$87.5 million in real estate mortgage loans, $18.1$24.5 million in real estate construction loans, and $1.5$4.7 million in commercial loans. The majority of our loan restructurings relates to commercial real estate lendingloans and involves lowering the interest rate and/or a change to interest-only payments for a period of time. In these cases, we do not typically forgive principal or extend the maturity date as part of the loan modification.$144,000 in consumer loans.
The majority of the performing restructured loans were on accrual status prior to the loan modifications and have remained on accrual status after thetheir respective loan modifications due to the borrowers making payments before and after the restructurings. In these circumstances, generally, a borrower may have had a fixed rate loan that they continued to repay, but may be having cash flow difficulties. In an effort to work with certain borrowers, we have agreed to interest rate reductions to reflect the lower market interest rate environment and/or interest-only payments for a period of time. Generally, we do not forgive principal or extend the maturity date as part of the loan modification. As a result of the current economic environment in our market areas, we anticipate loan restructurings to continue during 2011.
The following table summarizes our non-covered nonaccrual and performing impaired loans:
| | Year Ended December 31, | ||||||||||
|---|---|---|---|---|---|---|---|---|---|---|---|
| | 2010 | 2009 | 2008 | ||||||||
| | (In thousands) | ||||||||||
Nonaccrual loans: | |||||||||||
Average balance | $ | 66,070 | $ | 165,445 | $ | 58,165 | |||||
Interest income recorded | 1,775 | 7,967 | 4,478 | ||||||||
Interest income foregone | 4,130 | 7,262 | 2,201 | ||||||||
Performing impaired loans: | |||||||||||
Average balance | 48,561 | 69,249 | 1,897 | ||||||||
Interest income recorded | 5,081 | 10,599 | 1,076 | ||||||||
PACWEST BANCORP AND SUBSIDIARIES
Notes to Consolidated Financial Statements (Continued)
NOTE 6—LOANS (Continued)continue.
The Company measures its impaired loans by using the estimated fair value of the collateral, less estimated costs to sell, including senior obligations such as delinquent property taxes, if the loan is collateral-dependent and the present value of the expected future cash flows discounted at the loan's effective interest rate if the loan is not collateral-dependent. The Company recognizes income from non-covered impaired loans on an accrual basis unless the loan is on nonaccrual status. Income from loans on nonaccrual status is recognized to the extent cash is received and the loan's principal balance is deemed collectible. For the years ended December 31, 2011, 2010, 2009, and 20082009, no interest income was recorded on non-covered impaired loans during the time such loans were on nonaccrual status.
The following table summarizes non-covered impaired loans andstatus; any related impairment allowance as of the dates indicated:interest payments received were credited to principal.
| | December 31, | ||||||||||||||
|---|---|---|---|---|---|---|---|---|---|---|---|---|---|---|---|
| | 2010 | 2009 | |||||||||||||
| | Recorded Investment | Impairment Allowance | Recorded Investment | Impairment Allowance | |||||||||||
| | (In thousands) | ||||||||||||||
With impairment allowance: | |||||||||||||||
Real estate loans | $ | 139,528 | $ | 5,018 | $ | 220,055 | $ | 28,330 | |||||||
Other loans | 34,907 | 9,960 | 14,496 | 2,094 | |||||||||||
Without impairment allowance: | |||||||||||||||
Real estate loans | 1,993 | — | 144,547 | — | |||||||||||
Other loans | 7,027 | — | 42,523 | — | |||||||||||
Total | $ | 183,455 | $ | 14,978 | $ | 421,621 | $ | 30,424 | |||||||
The recorded investment in a loan reflects the contractual amount due from the borrower reduced by charge-offs and any participation amount sold to a third party. The Company's policy is to charge-off to the allowance the impairment amount on a collateral-dependent loan and to set up as a specific reserve within the allowance the impairment amount on a loan that is not collateral-dependent.
PACWEST BANCORP AND SUBSIDIARIES
Notes to Consolidated Financial Statements (Continued)
NOTE 6—LOANS (Continued)
The following table presents information regarding our non-covered impaired loans by portfolio segment and class as of the datedates indicated:
| | | December 31, 2010 | December 31, 2011 | December 31, 2010 | |||||||||||||||||||||||||||
|---|---|---|---|---|---|---|---|---|---|---|---|---|---|---|---|---|---|---|---|---|---|---|---|---|---|---|---|---|---|---|---|
| | | Recorded Investment | Unpaid Principal Balance | Related Allowance | Recorded Investment | Unpaid Principal Balance | Related Allowance | Recorded Investment | Unpaid Principal Balance | Related Allowance | |||||||||||||||||||||
| | | (In thousands) | (In thousands) | ||||||||||||||||||||||||||||
With An Allowance Recorded: | With An Allowance Recorded: | ||||||||||||||||||||||||||||||
Real estate mortgage: | Real estate mortgage: | ||||||||||||||||||||||||||||||
Hospitality | $ | 17,548 | $ | 17,890 | $ | 4,369 | $ | 15,081 | $ | 15,138 | $ | 564 | |||||||||||||||||||
SBA 504 | 1,147 | 1,245 | 206 | 4,161 | 6,180 | 280 | |||||||||||||||||||||||||
Other | 78,349 | 81,921 | 6,919 | 47,188 | 47,343 | 3,049 | |||||||||||||||||||||||||
Real estate construction: | |||||||||||||||||||||||||||||||
Residential | 2,766 | 2,776 | 409 | 8,301 | 11,956 | 673 | |||||||||||||||||||||||||
Other | 12,477 | 12,520 | 1,664 | 5,341 | 5,701 | 452 | |||||||||||||||||||||||||
Hospitality | $ | 15,081 | $ | 15,138 | $ | 564 | |||||||||||||||||||||||||
SBA 504 | 9,346 | 12,500 | 280 | ||||||||||||||||||||||||||||
Other | 67,923 | 74,884 | 3,049 | ||||||||||||||||||||||||||||
Real estate construction: | |||||||||||||||||||||||||||||||
Residential | 30,965 | 35,152 | 673 | ||||||||||||||||||||||||||||
Other | 16,213 | 18,130 | 452 | ||||||||||||||||||||||||||||
Total real estate | 139,528 | 155,804 | 5,018 | ||||||||||||||||||||||||||||
Total real estate | 112,287 | 116,352 | 13,567 | 80,072 | 86,318 | 5,018 | |||||||||||||||||||||||||
Commercial: | Commercial: | ||||||||||||||||||||||||||||||
Collateralized | 20,038 | 20,270 | 1,174 | ||||||||||||||||||||||||||||
Unsecured | 9,427 | 9,512 | 7,696 | ||||||||||||||||||||||||||||
SBA 7(a) | 4,081 | 4,786 | 41 | ||||||||||||||||||||||||||||
Collateralized | 5,515 | 5,741 | 3,901 | 2,192 | 2,363 | 1,174 | |||||||||||||||||||||||||
Unsecured | 2,864 | 3,061 | 2,513 | 9,361 | 9,445 | 7,696 | |||||||||||||||||||||||||
SBA 7(a) | 3,397 | 3,428 | 379 | 1,999 | 2,123 | 41 | |||||||||||||||||||||||||
Consumer | Consumer | 1,361 | 1,372 | 1,049 | 433 | 459 | 413 | 1,125 | 1,127 | 1,049 | |||||||||||||||||||||
Total other | 34,907 | 35,940 | 9,960 | ||||||||||||||||||||||||||||
Total other | 12,209 | 12,689 | 7,206 | 14,677 | 15,058 | 9,960 | |||||||||||||||||||||||||
With No Related Allowance Recorded: | With No Related Allowance Recorded: | ||||||||||||||||||||||||||||||
Real estate mortgage: | Real estate mortgage: | ||||||||||||||||||||||||||||||
Hospitality | $ | — | $ | — | $ | — | $ | 667 | $ | 667 | $ | — | |||||||||||||||||||
SBA 504 | 2,262 | 3,007 | — | 5,185 | 6,320 | — | |||||||||||||||||||||||||
Other | 19,515 | 22,999 | — | 21,889 | 29,191 | — | |||||||||||||||||||||||||
Real estate construction: | |||||||||||||||||||||||||||||||
Residential | 611 | 611 | — | 22,676 | 23,208 | — | |||||||||||||||||||||||||
Other | 15,938 | 19,536 | — | 11,032 | 12,603 | — | |||||||||||||||||||||||||
Hospitality | $ | 667 | $ | 667 | $ | — | |||||||||||||||||||||||||
Other | 1,154 | 1,650 | — | ||||||||||||||||||||||||||||
Real estate construction: | |||||||||||||||||||||||||||||||
Residential | 12 | 12 | — | ||||||||||||||||||||||||||||
Other | 160 | 174 | — | ||||||||||||||||||||||||||||
Total real estate | 1,993 | 2,503 | — | ||||||||||||||||||||||||||||
Total real estate | 38,326 | 46,153 | — | 61,449 | 71,989 | — | |||||||||||||||||||||||||
Commercial: | Commercial: | ||||||||||||||||||||||||||||||
Collateralized | 2,673 | 2,761 | — | ||||||||||||||||||||||||||||
Unsecured | 157 | 169 | — | ||||||||||||||||||||||||||||
Asset-based | 15 | 15 | — | ||||||||||||||||||||||||||||
SBA 7(a) | 3,429 | 4,576 | — | ||||||||||||||||||||||||||||
Collateralized | 4,759 | 4,927 | — | 20,519 | 20,668 | — | |||||||||||||||||||||||||
Unsecured | 643 | 716 | — | 224 | 236 | — | |||||||||||||||||||||||||
Asset-based | 14 | 14 | — | 15 | 15 | — | |||||||||||||||||||||||||
SBA 7(a) | 6,518 | 8,181 | — | 5,510 | 7,239 | — | |||||||||||||||||||||||||
Consumer | Consumer | 590 | 631 | — | 295 | 351 | — | 826 | 876 | — | |||||||||||||||||||||
Foreign | Foreign | 163 | 238 | — | — | — | — | 163 | 238 | — | |||||||||||||||||||||
Total other | 7,027 | 8,390 | — | ||||||||||||||||||||||||||||
Total other | 12,229 | 14,189 | — | 27,257 | 29,272 | — | |||||||||||||||||||||||||
Total: | Total: | ||||||||||||||||||||||||||||||
Real estate mortgage | $ | 118,821 | $ | 127,062 | $ | 11,494 | $ | 94,171 | $ | 104,839 | $ | 3,893 | |||||||||||||||||||
Real estate construction | 31,792 | 35,443 | 2,073 | 47,350 | 53,468 | 1,125 | |||||||||||||||||||||||||
Commercial | 23,710 | 26,068 | 6,793 | 39,820 | 42,089 | 8,911 | |||||||||||||||||||||||||
Consumer | 728 | 810 | 413 | 1,951 | 2,003 | 1,049 | |||||||||||||||||||||||||
Foreign | — | — | — | 163 | 238 | — | |||||||||||||||||||||||||
Real estate mortgage | $ | 94,171 | $ | 104,839 | $ | 3,893 | |||||||||||||||||||||||||
Total non-covered loans | $ | 175,051 | $ | 189,383 | $ | 20,773 | $ | 183,455 | $ | 202,637 | $ | 14,978 | |||||||||||||||||||
Real estate construction | 47,350 | 53,468 | 1,125 | ||||||||||||||||||||||||||||
Commercial | 39,820 | 42,089 | 8,911 | ||||||||||||||||||||||||||||
Consumer | 1,951 | 2,003 | 1,049 | ||||||||||||||||||||||||||||
Foreign | 163 | 238 | — | ||||||||||||||||||||||||||||
Total non-covered loans | $ | 183,455 | $ | 202,637 | $ | 14,978 | |||||||||||||||||||||||||
PACWEST BANCORP AND SUBSIDIARIES
Notes to Consolidated Financial Statements (Continued)
NOTE 6—LOANS (Continued)
| | Year Ended December 31, 2011 | ||||||
|---|---|---|---|---|---|---|---|
| | Weighted Average Recorded Investment(1) | Interest Income Recognized | |||||
| | (In thousands) | ||||||
With An Allowance Recorded: | |||||||
Real estate mortgage: | |||||||
Hospitality | $ | 17,399 | $ | 962 | |||
SBA 504 | 895 | 54 | |||||
Other | 42,973 | 2,017 | |||||
Real estate construction: | |||||||
Residential | 2,520 | 81 | |||||
Other | 5,375 | 158 | |||||
Total real estate | 69,162 | 3,272 | |||||
Commercial: | |||||||
Collateralized | 4,745 | 183 | |||||
Unsecured | 2,767 | 154 | |||||
SBA 7(a) | 1,761 | 101 | |||||
Consumer | 291 | 15 | |||||
Total other | 9,564 | 453 | |||||
With No Related Allowance Recorded: | |||||||
Real estate mortgage: | |||||||
SBA 504 | $ | 1,916 | $ | 187 | |||
Other | 13,827 | 1,124 | |||||
Real estate construction: | |||||||
Residential | 611 | — | |||||
Other | 14,904 | 451 | |||||
Total real estate | 31,258 | 1,762 | |||||
Commercial: | |||||||
Collateralized | 1,584 | 131 | |||||
Unsecured | 499 | 49 | |||||
Asset-based | 14 | — | |||||
SBA 7(a) | 5,753 | 413 | |||||
Consumer | 234 | 27 | |||||
Total other | 8,084 | 620 | |||||
Total: | |||||||
Real estate mortgage | $ | 77,010 | $ | 4,344 | |||
Real estate construction | 23,410 | 690 | |||||
Commercial | 17,123 | 1,031 | |||||
Consumer | 525 | 42 | |||||
Total non-covered loans | $ | 118,068 | $ | 6,107 | |||
PACWEST BANCORP AND SUBSIDIARIES
Notes to Consolidated Financial Statements (Continued)
NOTE 6—LOANS (Continued)
The following tables present non-covered new troubled debt restructurings and defaulted troubled debt restructurings for the periods indicated:
| | Year Ended December 31, 2011 | |||||||||
|---|---|---|---|---|---|---|---|---|---|---|
| | Number of Loans | Pre- Modification Outstanding Recorded Investment | Post- Modification Outstanding Recorded Investment | |||||||
| | (Dollars in thousands) | |||||||||
Troubled Debt Restructurings: | ||||||||||
Real estate mortgage: | ||||||||||
Hospitality | 4 | $ | 17,053 | $ | 17,053 | |||||
SBA 504 | 4 | 2,124 | 2,124 | |||||||
Other | 46 | 91,187 | 90,994 | |||||||
Real estate construction: | ||||||||||
Residential | 3 | 924 | 924 | |||||||
Other | 7 | 16,539 | 16,539 | |||||||
Commercial: | ||||||||||
Collateralized | 20 | 4,226 | 4,226 | |||||||
Unsecured | 6 | 857 | 857 | |||||||
SBA 7(a) | 22 | 5,955 | 5,955 | |||||||
Consumer | 3 | 415 | 415 | |||||||
Total | 115 | $ | 139,280 | $ | 139,087 | |||||
| | Year Ended December 31, 2011 | ||||||
|---|---|---|---|---|---|---|---|
| | Number of Loans | Recorded Investment(1) | |||||
| | (Dollars in thousands) | ||||||
Troubled Debt Restructurings That Subsequently Defaulted(2): | |||||||
Real estate mortgage: | |||||||
Other | 4 | $ | 3,813 | ||||
Real estate construction: | |||||||
Other | 1 | 1,492 | |||||
Commercial: | |||||||
SBA 7(a) | 3 | 59 | |||||
Total | 8 | $ | 5,364 | ||||
PACWEST BANCORP AND SUBSIDIARIES
Notes to Consolidated Financial Statements (Continued)
NOTE 6—LOANS (Continued)
Covered Loans
We refer to the loans acquired in the Los Padres and Affinity acquisitions subject to loss sharing agreements with the FDIC as "covered loans" as we will be reimbursed for a substantial portion of any future losses on them under the terms of the agreements. At the August 20, 2010 Los Padresrespective acquisition date anddates, the August 28, 2009 Affinity acquisition date, we estimated the fair values of the Los Padres and Affinity covered loans to bewere $436.3 million and $675.6 million, respectively.million. Fair value of acquired loans is determined using a discounted cash flow model using assumptions about the amount and timing of principal and interest payments, estimated prepayments, estimated default rates, estimated loss severity in the event of defaults, and current market rates. Estimated credit losses are included in the determination of fair value; therefore, an allowance for loan losses is not recorded on the acquisition date.
The following table reflects the carrying values of the covered loans as of the dates indicated:
| | December 31, | |||||||
|---|---|---|---|---|---|---|---|---|
Loan Category | 2010 | 2009 | ||||||
| | (In thousands) | |||||||
Multi-family | $ | 417,277 | $ | 263,944 | ||||
Commercial real estate | 342,642 | 311,298 | ||||||
Single family | 151,874 | 17,078 | ||||||
Construction and land | 91,740 | 121,735 | ||||||
Commercial and industrial | 40,013 | 21,340 | ||||||
Home equity lines of credit | 8,248 | 6,565 | ||||||
Consumer | 947 | 575 | ||||||
Total gross covered loans | 1,052,741 | 742,535 | ||||||
Less: discount | (110,901 | ) | (102,849 | ) | ||||
Covered loans, net of discount | 941,840 | 639,686 | ||||||
Less: allowance for loan losses | (33,264 | ) | (18,000 | ) | ||||
Covered loans, net | $ | 908,576 | $ | 621,686 | ||||
| | December 31, | ||||||||||||
|---|---|---|---|---|---|---|---|---|---|---|---|---|---|
| | 2011 | 2010 | |||||||||||
| | Amount | % of Total | Amount | % of Total | |||||||||
| | (Dollars in thousands) | ||||||||||||
Real estate mortgage: | |||||||||||||
Hospitality | $ | 2,944 | — | $ | 2,998 | — | |||||||
Other | 733,414 | 91 | % | 916,300 | 87 | % | |||||||
Total real estate mortgage | 736,358 | 91 | % | 919,298 | 87 | % | |||||||
Real estate construction: | |||||||||||||
Residential | 21,521 | 3 | % | 44,637 | 4 | % | |||||||
Commercial | 25,397 | 3 | % | 47,103 | 5 | % | |||||||
Total real estate construction | 46,918 | 6 | % | 91,740 | 9 | % | |||||||
Commercial: | |||||||||||||
Collateralized | 24,808 | 3 | % | 37,973 | 4 | % | |||||||
Unsecured | 802 | — | 1,202 | — | |||||||||
Asset-based | — | — | 1,581 | — | |||||||||
Total commercial | 25,610 | 3 | % | 40,756 | 4 | % | |||||||
Consumer | 735 | — | 947 | — | |||||||||
Total gross covered loans | 809,621 | 100 | % | 1,052,741 | 100 | % | |||||||
Discount | (75,323 | ) | (110,901 | ) | |||||||||
Allowance for loan losses | (31,275 | ) | (33,264 | ) | |||||||||
Covered loans, net | $ | 703,023 | $ | 908,576 | |||||||||
The undiscounted contractual cash flows, undiscounted cash flows expected to be collected, and the estimated fair value of the Los Padres covered acquired impaired loan portfolio as of the acquisition date were $694.5 million, $549.8 million, and $405.6 million, respectively.
PACWEST BANCORP AND SUBSIDIARIES
Notes to Consolidated Financial Statements (Continued)
NOTE 6—LOANS (Continued)
The following table summarizes the changes in the carrying amount of covered acquired impaired loans and accretable yield on those loans for the periods indicated:
| | | Covered Acquired Impaired Loans | Covered Acquired Impaired Loans | ||||||||||||
|---|---|---|---|---|---|---|---|---|---|---|---|---|---|---|---|
| | | Carrying Amount | Accretable Yield | Carrying Amount | Accretable Yield | ||||||||||
| | | (In thousands) | (In thousands) | ||||||||||||
Balance, January 1, 2009 | $ | — | $ | — | |||||||||||
Addition from the Affinity acquisition | 675,616 | (248,174 | ) | ||||||||||||
Accretion | 17,622 | 17,622 | |||||||||||||
Payments received | (53,552 | ) | — | ||||||||||||
Decrease in expected cash flows | — | 4,106 | |||||||||||||
Provision for credit losses | (18,000 | ) | — | ||||||||||||
Balance, December 31, 2008 | $ | — | $ | — | |||||||||||
Addition from the Affinity acquisition | 675,616 | (248,174 | ) | ||||||||||||
Accretion | 17,622 | 17,622 | |||||||||||||
Payments received | (53,552 | ) | — | ||||||||||||
Decrease in expected cash flows, net | — | 4,106 | |||||||||||||
Provision for credit losses | (18,000 | ) | — | ||||||||||||
Balance, December 31, 2009 | Balance, December 31, 2009 | 621,686 | (226,446 | ) | 621,686 | (226,446 | ) | ||||||||
Addition from the Los Padres acquisition | 405,619 | (144,168 | ) | ||||||||||||
Accretion | 52,539 | 52,539 | |||||||||||||
Payments received | (161,312 | ) | — | ||||||||||||
Decrease in expected cash flows | — | 27,410 | |||||||||||||
Provision for credit losses | (39,046 | ) | — | ||||||||||||
Addition from the Los Padres acquisition | 405,619 | (144,168 | ) | ||||||||||||
Accretion | 52,539 | 52,539 | |||||||||||||
Payments received | (166,858 | ) | — | ||||||||||||
Decrease in expected cash flows, net | — | 27,410 | |||||||||||||
Provision for credit losses | (33,500 | ) | — | ||||||||||||
Balance, December 31, 2010 | Balance, December 31, 2010 | $ | 879,486 | $ | (290,665 | ) | 879,486 | (290,665 | ) | ||||||
Accretion | 65,282 | 65,282 | |||||||||||||
Payments received | (254,484 | ) | — | ||||||||||||
Increase in expected cash flows, net | — | (33,882 | ) | ||||||||||||
Provision for credit losses | (13,270 | ) | — | ||||||||||||
Balance, December 31, 2011 | $ | 677,014 | $ | (259,265 | ) | ||||||||||
The table above excludes the covered loans from the Los Padres acquisition which are accounted for as non-impaired loans and totaltotaled $26.0 million and $29.1 million at December 31, 2010.2011 and 2010, respectively.
The following table presents changes in our allowance for credit losses on the covered loans for the years indicated:
| | | Year Ended December 31, | Year Ended December 31, | |||||||||||||||
|---|---|---|---|---|---|---|---|---|---|---|---|---|---|---|---|---|---|---|
| | | 2010 | 2009 | 2011 | 2010 | 2009 | ||||||||||||
| | | (In thousands) | (In thousands) | |||||||||||||||
Allowance for credit losses on covered loans, beginning of year | Allowance for credit losses on covered loans, beginning of year | $ | 18,000 | $ | — | $ | 33,264 | $ | 18,000 | $ | — | |||||||
Provision | 39,046 | 18,000 | ||||||||||||||||
Charge-offs, net | (23,782 | ) | — | |||||||||||||||
Provision | 13,270 | 33,500 | 18,000 | |||||||||||||||
Charge-offs, net | (15,259 | ) | (18,236 | ) | — | |||||||||||||
Allowance for credit losses on covered loans, end of year | Allowance for credit losses on covered loans, end of year | $ | 33,264 | $ | 18,000 | $ | 31,275 | $ | 33,264 | $ | 18,000 | |||||||
PACWEST BANCORP AND SUBSIDIARIES
Notes to Consolidated Financial Statements (Continued)
NOTE 6—LOANS (Continued)
The following table presentstables present the credit risk rating categories for covered loans by portfolio segment as of the datedates indicated. Nonclassified loans are those with a credit risk rating of either pass or special mention, while classified loans are those with a credit risk rating of either substandard or doubtful. It should be noted, however, that all of these loans are covered by loss sharing agreements with the FDIC.
| | | December 31, 2010 | December 31, 2011 | December 31, 2010 | ||||||||||||||||||||||||||
|---|---|---|---|---|---|---|---|---|---|---|---|---|---|---|---|---|---|---|---|---|---|---|---|---|---|---|---|---|---|---|
| | | Nonclassified | Classified | Total | Nonclassified | Classified | Total | Nonclassified | Classified | Total | ||||||||||||||||||||
| | | (In thousands) | (In thousands) | |||||||||||||||||||||||||||
Real estate mortgage | Real estate mortgage | $ | 622,837 | $ | 180,944 | $ | 803,781 | $ | 478,291 | $ | 164,149 | $ | 642,440 | $ | 622,837 | $ | 180,944 | $ | 803,781 | |||||||||||
Real estate construction | Real estate construction | 21,370 | 51,729 | 73,099 | 5,762 | 35,337 | 41,099 | 21,370 | 51,729 | 73,099 | ||||||||||||||||||||
Commercial | Commercial | 14,630 | 16,219 | 30,849 | 11,076 | 8,221 | 19,297 | 14,630 | 16,219 | 30,849 | ||||||||||||||||||||
Consumer | Consumer | 722 | 125 | 847 | 6 | 181 | 187 | 722 | 125 | 847 | ||||||||||||||||||||
Total covered loans, net | $ | 495,135 | $ | 207,888 | $ | 703,023 | $ | 659,559 | $ | 249,017 | $ | 908,576 | ||||||||||||||||||
Total covered loans | $ | 659,559 | $ | 249,017 | $ | 908,576 | ||||||||||||||||||||||||
Our federal and state banking regulators, as an integral part of their examination process, periodically review the Company's loan classifications. Our regulators may require the Company to recognize rating downgrades based on their judgments related to information available to them at the time of their examinations.
NOTE 7—OTHER REAL ESTATE OWNED (OREO)
The following tables summarize OREO by property type at the dates indicated:
| | December 31, 2010 | ||||||||||
|---|---|---|---|---|---|---|---|---|---|---|---|
Property Type | Non-Covered OREO | Covered OREO | Total OREO | ||||||||
| | (In thousands) | ||||||||||
Commercial real estate | $ | 18,205 | $ | 21,658 | $ | 39,863 | |||||
Construction and land development | 4,650 | 19,205 | 23,855 | ||||||||
Multi-family | — | 10,393 | 10,393 | ||||||||
Single family residence | 2,743 | 4,560 | 7,303 | ||||||||
Total OREO, net | $ | 25,598 | $ | 55,816 | $ | 81,414 | |||||
| | | December 31, 2009 | December 31, 2011 | December 31, 2010 | ||||||||||||||||||||||||||
|---|---|---|---|---|---|---|---|---|---|---|---|---|---|---|---|---|---|---|---|---|---|---|---|---|---|---|---|---|---|---|
Property Type | Property Type | Non-Covered OREO | Covered OREO | Total OREO | Non-Covered OREO | Covered OREO | Total OREO | Non-Covered OREO | Covered OREO | Total OREO | ||||||||||||||||||||
| | | (In thousands) | (In thousands) | |||||||||||||||||||||||||||
Commercial real estate | Commercial real estate | $ | 28,478 | $ | 9,728 | $ | 38,206 | $ | 23,003 | $ | 15,053 | $ | 38,056 | $ | 18,205 | $ | 21,658 | $ | 39,863 | |||||||||||
Construction and land development | Construction and land development | 7,514 | 14,537 | 22,051 | 24,788 | 15,461 | 40,249 | 4,650 | 19,205 | 23,855 | ||||||||||||||||||||
Multi-family | — | — | — | — | 10,393 | 10,393 | ||||||||||||||||||||||||
Single family residence | Single family residence | 7,263 | 3,423 | 10,686 | 621 | 2,992 | 3,613 | 2,743 | 4,560 | 7,303 | ||||||||||||||||||||
Total OREO, net | $ | 48,412 | $ | 33,506 | $ | 81,918 | $ | 25,598 | $ | 55,816 | $ | 81,414 | ||||||||||||||||||
Total OREO, net | $ | 43,255 | $ | 27,688 | $ | 70,943 | ||||||||||||||||||||||||
PACWEST BANCORP AND SUBSIDIARIES
Notes to Consolidated Financial Statements (Continued)
NOTE 7—OTHER REAL ESTATE OWNED (OREO) (Continued)
The following table presents a rollforward of OREO, net of the valuation allowance, for the years indicated (there was no covered OREO in 2008):indicated:
| | Non-Covered OREO | Covered OREO | Total OREO | |||||||
|---|---|---|---|---|---|---|---|---|---|---|
| | (In thousands) | |||||||||
OREO Activity: | ||||||||||
Balance, December 31, 2008 | $ | 41,310 | $ | — | $ | 41,310 | ||||
Addition from the Affinity acquisition | — | 22,897 | 22,897 | |||||||
Foreclosures | 53,436 | 14,509 | 67,945 | |||||||
Payments to third parties(1) | 390 | — | 390 | |||||||
Provision for losses | (16,277 | ) | (1,518 | ) | (17,795 | ) | ||||
Reductions related to sales | (35,604 | ) | (8,200 | ) | (43,804 | ) | ||||
Balance, December 31, 2009 | 43,255 | 27,688 | 70,943 | |||||||
Addition from the Los Padres acquisition | — | 33,913 | 33,913 | |||||||
Foreclosures | 34,349 | 35,001 | 69,350 | |||||||
Payments to third parties(1) | 2,484 | — | 2,484 | |||||||
Provision for losses | (12,271 | ) | (5,389 | ) | (17,660 | ) | ||||
Reductions related to sales | (42,219 | ) | (35,397 | ) | (77,616 | ) | ||||
Balance, December 31, 2010 | 25,598 | 55,816 | 81,414 | |||||||
Foreclosures | 34,743 | 33,940 | 68,683 | |||||||
Payments to third parties(1) | 1,619 | 10 | 1,629 | |||||||
Provision for losses | (5,026 | ) | (11,968 | ) | (16,994 | ) | ||||
Reductions related to sales | (8,522 | ) | (44,292 | ) | (52,814 | ) | ||||
Balance, December 31, 2011 | $ | 48,412 | $ | 33,506 | $ | 81,918 | ||||
OREO Activity: | Non-Covered OREO | Covered OREO | Total OREO | ||||||||
|---|---|---|---|---|---|---|---|---|---|---|---|
| | (In thousands) | ||||||||||
Balance, January 1, 2008 | $ | 2,736 | $ | — | $ | 2,736 | |||||
Foreclosures | 48,978 | — | 48,978 | ||||||||
Provision for losses | (1,268 | ) | — | (1,268 | ) | ||||||
Reductions related to sales | (9,136 | ) | — | (9,136 | ) | ||||||
Balance, December 31, 2008 | $ | 41,310 | $ | — | $ | 41,310 | |||||
Addition from the Affinity acquisition | — | 22,897 | 22,897 | ||||||||
Foreclosures | 53,826 | 14,509 | 68,335 | ||||||||
Provision for losses | (16,277 | ) | (1,518 | ) | (17,795 | ) | |||||
Reductions related to sales | (35,604 | ) | (8,200 | ) | (43,804 | ) | |||||
Balance, December 31, 2009 | $ | 43,255 | $ | 27,688 | $ | 70,943 | |||||
Addition from the Los Padres acquisition | — | 33,913 | 33,913 | ||||||||
Foreclosures | 36,833 | 35,001 | 71,834 | ||||||||
Provision for losses | (12,271 | ) | (5,389 | ) | (17,660 | ) | |||||
Reductions related to sales | (42,219 | ) | (35,397 | ) | (77,616 | ) | |||||
Balance, December 31, 2010 | $ | 25,598 | $ | 55,816 | $ | 81,414 | |||||
The following table presents a rollforward of our OREO valuation allowance
OREO Valuation Allowance Activity: | Non-Covered OREO | Covered OREO | Total OREO | ||||||||
|---|---|---|---|---|---|---|---|---|---|---|---|
| | (In thousands) | ||||||||||
Balance, January 1, 2008 | $ | 38 | $ | — | $ | 38 | |||||
Provision for losses | 1,254 | — | 1,254 | ||||||||
Due from the SBA | 14 | — | 14 | ||||||||
Reductions related to sales | (52 | ) | — | (52 | ) | ||||||
Balance, December 31, 2008 | $ | 1,254 | $ | — | $ | 1,254 | |||||
Provision for losses | 16,277 | 1,518 | 17,795 | ||||||||
Due from the SBA | 1,403 | — | 1,403 | ||||||||
Reductions related to sales | (2,906 | ) | — | (2,906 | ) | ||||||
Balance, December 31, 2009 | $ | 16,028 | $ | 1,518 | $ | 17,546 | |||||
Provision for losses | 12,271 | 5,389 | 17,660 | ||||||||
Due from the SBA | 823 | — | 823 | ||||||||
Reductions related to sales | (15,291 | ) | (2,925 | ) | (18,216 | ) | |||||
Balance, December 31, 2010 | $ | 13,831 | $ | 3,982 | $ | 17,813 | |||||
PACWEST BANCORP AND SUBSIDIARIES
Notes to Consolidated Financial Statements (Continued)
NOTE 7—OTHER REAL ESTATE OWNED (OREO) (Continued)
The following tables present the componentstable presents a rollforward of our OREO expense, netvaluation allowance for the years indicated (there was no covered OREO in 2008):indicated:
| | Non-Covered OREO | Covered OREO | Total OREO | |||||||
|---|---|---|---|---|---|---|---|---|---|---|
| | (In thousands) | |||||||||
OREO Valuation Allowance Activity: | ||||||||||
Balance, December 31, 2008 | $ | 1,254 | $ | — | $ | 1,254 | ||||
Provision for losses | 16,277 | 1,518 | 17,795 | |||||||
Due from the SBA | 1,403 | — | 1,403 | |||||||
Reductions related to sales | (2,906 | ) | — | (2,906 | ) | |||||
Balance, December 31, 2009 | 16,028 | 1,518 | 17,546 | |||||||
Provision for losses | 12,271 | 5,389 | 17,660 | |||||||
Due from the SBA | 823 | — | 823 | |||||||
Reductions related to sales | (15,291 | ) | (2,925 | ) | (18,216 | ) | ||||
Balance, December 31, 2010 | 13,831 | 3,982 | 17,813 | |||||||
Provision for losses | 5,026 | 11,968 | 16,994 | |||||||
Selling costs(1) | — | 2,527 | 2,527 | |||||||
Due from the SBA | 108 | — | 108 | |||||||
Reductions related to sales | (9,431 | ) | (7,436 | ) | (16,867 | ) | ||||
Balance, December 31, 2011 | $ | 9,534 | $ | 11,041 | $ | 20,575 | ||||
| | Year Ended December 31, 2010 | ||||||||||
|---|---|---|---|---|---|---|---|---|---|---|---|
| | Non-Covered OREO | Covered OREO | Total OREO | ||||||||
| | (In thousands) | ||||||||||
Provision for losses | $ | 12,271 | $ | 5,389 | $ | 17,660 | |||||
Maintenance costs | 2,065 | 570 | 2,635 | ||||||||
(Gain) loss on sale | (2,026 | ) | (3,499 | ) | (5,525 | ) | |||||
Total OREO expense, net | $ | 12,310 | $ | 2,460 | $ | 14,770 | |||||
| | Year Ended December 31, 2009 | ||||||||||
|---|---|---|---|---|---|---|---|---|---|---|---|
| | Non-Covered OREO | Covered OREO | Total OREO | ||||||||
| | (In thousands) | ||||||||||
Provision for losses | $ | 16,277 | $ | 1,518 | $ | 17,795 | |||||
Maintenance costs | 3,999 | 220 | 4,219 | ||||||||
(Gain) loss on sale | 1,293 | 15 | 1,308 | ||||||||
Total OREO expense, net | $ | 21,569 | $ | 1,753 | $ | 23,322 | |||||
| | Year Ended December 31, 2008 | ||||||||||
|---|---|---|---|---|---|---|---|---|---|---|---|
| | Non-Covered OREO | Covered OREO | Total OREO | ||||||||
| | (In thousands) | ||||||||||
Provision for losses | $ | 1,254 | $ | — | $ | 1,254 | |||||
Maintenance costs | 1,344 | — | 1,344 | ||||||||
(Gain) loss on sale | (380 | ) | — | (380 | ) | ||||||
Total OREO expense, net | $ | 2,218 | $ | — | $ | 2,218 | |||||
NOTE 8—FDIC LOSS SHARING ASSET
The following table presents changes in the FDIC loss sharing asset for the years indicated:
| | Year Ended December 31, | ||||||
|---|---|---|---|---|---|---|---|
| | 2011 | 2010 | |||||
| | (In thousands) | ||||||
FDIC loss sharing asset, beginning of year | $ | 116,352 | $ | 112,817 | |||
Addition due to acquisition | — | 71,204 | |||||
FDIC share of additional losses, net of recoveries(1) | 15,246 | 31,799 | |||||
Cash received from FDIC | (41,390 | ) | (93,786 | ) | |||
Net accretion | (2,932 | ) | (5,682 | ) | |||
Subtotal | 87,276 | 116,352 | |||||
Filed claims receivable | 7,911 | — | |||||
FDIC loss sharing asset, end of year | $ | 95,187 | $ | 116,352 | |||
| | Year Ended December 31, | |||||||
|---|---|---|---|---|---|---|---|---|
| | 2010 | 2009 | ||||||
| | (In thousands) | |||||||
FDIC loss sharing asset, beginning of year | $ | 112,817 | $ | — | ||||
Additions due to acquisitions | 71,204 | 107,718 | ||||||
FDIC share of additional losses | 31,799 | 15,614 | ||||||
Cash payments received from FDIC | (93,786 | ) | (10,966 | ) | ||||
Net accretion(1) | (5,682 | ) | 451 | |||||
FDIC loss sharing asset, end of year | $ | 116,352 | $ | 112,817 | ||||
PACWEST BANCORP AND SUBSIDIARIES
Notes to Consolidated Financial Statements (Continued)
NOTE 9—PREMISES AND EQUIPMENT, NET
The following table presents the components of premises and equipment as of the dates indicated:
| | | December 31, | December 31, | ||||||||||||
|---|---|---|---|---|---|---|---|---|---|---|---|---|---|---|---|
| | | 2010 | 2009 | 2011 | 2010 | ||||||||||
| | | (In thousands) | (In thousands) | ||||||||||||
Land | Land | $ | 3,537 | $ | 2,897 | $ | 3,537 | $ | 3,537 | ||||||
Buildings | Buildings | 5,815 | 4,985 | 5,815 | 5,815 | ||||||||||
Furniture, fixtures and equipment | Furniture, fixtures and equipment | 26,268 | 24,035 | 29,466 | 26,268 | ||||||||||
Leasehold improvements | Leasehold improvements | 23,495 | 22,466 | 23,630 | 23,495 | ||||||||||
Premises and equipment, gross | 59,115 | 54,383 | |||||||||||||
Premises and equipment, gross | 62,448 | 59,115 | |||||||||||||
Less: accumulated depreciation and amortization | Less: accumulated depreciation and amortization | (36,537 | ) | (31,837 | ) | (39,380 | ) | (36,537 | ) | ||||||
Premises and equipment, net | $ | 23,068 | $ | 22,578 | |||||||||||
Premises and equipment, net | $ | 22,578 | $ | 22,546 | |||||||||||
Depreciation and amortization expense was $5.4 million, $5.1 million, $5.5 million, and $5.4$5.5 million for the years ended December 31, 2011, 2010, 2009, and 2008,2009, respectively.
We have obligations under a number of noncancelable operating leases for premises and equipment. The following table presents future minimum rental payments under noncancelable operating leases as of December 31, 2010:2011:
Estimated Lease Payments for Year Ending December 31 | Amount | ||||||||
|---|---|---|---|---|---|---|---|---|---|
Estimated Lease Payments for Year Ending December 31, | Amount | ||||||||
| | | (In thousands) | (In thousands) | ||||||
2011 | $ | 16,435 | |||||||
2012 | 2012 | 14,493 | $ | 16,621 | |||||
2013 | 2013 | 12,649 | 15,746 | ||||||
2014 | 2014 | 10,600 | 13,712 | ||||||
2015 | 2015 | 8,068 | 11,121 | ||||||
2016 | 8,289 | ||||||||
Thereafter | Thereafter | 14,194 | 14,629 | ||||||
Total | $ | 80,118 | |||||||
Total | $ | 76,439 | |||||||
Total gross rental expense for the years ended December 31, 2011, 2010, and 2009, and 2008 was $16.7 million, $16.8 million, $15.0 million, and $13.5$15.0 million, respectively. Most of the leases provide that the Company pay maintenance, insurance and certain other operating expenses applicable to the leased premises in addition to the monthly rental payments.
Total rental income for the years ended December 31, 2011, 2010, 2009, and 20082009, was approximately $587,000, $518,000, $441,000, and $424,000,$441,000, respectively. The future minimum rental payments to be received under noncancelable subleases are $2.1$2.3 million.
PACWEST BANCORP AND SUBSIDIARIES
Notes to Consolidated Financial Statements (Continued)
NOTE 10—DEPOSITS
The following table presents the components of interest-bearing deposits as of the dates indicated:
| | | December 31, | December 31, | ||||||||||||
|---|---|---|---|---|---|---|---|---|---|---|---|---|---|---|---|
Deposit Category | 2011 | 2010 | |||||||||||||
| | | 2010 | 2009 | (In thousands) | |||||||||||
| | (In thousands) | ||||||||||||||
Interest-bearing checking deposits | $ | 494,617 | $ | 439,694 | |||||||||||
Interest checking deposits | $ | 500,998 | $ | 494,617 | |||||||||||
Money market deposits | Money market deposits | 1,321,780 | 1,171,386 | 1,265,282 | 1,321,780 | ||||||||||
Savings deposits | Savings deposits | 135,876 | 108,569 | 157,480 | 135,876 | ||||||||||
Time deposits under $100,000 | Time deposits under $100,000 | 436,838 | 505,130 | 324,521 | 436,838 | ||||||||||
Time deposits of $100,000 or more | Time deposits of $100,000 or more | 795,025 | 566,816 | 643,373 | 795,025 | ||||||||||
Total interest-bearing deposits | $ | 2,891,654 | $ | 3,184,136 | |||||||||||
Total interest-bearing deposits | $ | 3,184,136 | $ | 2,791,595 | |||||||||||
Brokered time deposits totaled $83.7$41.6 million at December 31, 2010 and included $47.5 million2011, all of customerwhich represented deposits that were subsequently participated with other FDIC insured financial institutions through the CDARS program as a means to provide FDIC deposit insurance coverage for the full amount of our customers' deposits. Brokered time deposits totaled $181.3$83.7 million at December 31, 2009,2010, of which $74.6$47.5 million were part of the CDARS program.
The following table summarizes the maturitymaturities of time deposits as of December 31, 2010:
| | Time Deposits | ||||||||||
|---|---|---|---|---|---|---|---|---|---|---|---|
Year of Maturity | Under $100,000 | $100,000 or More | Total | ||||||||
| | (In thousands) | ||||||||||
2011 | $ | 297,325 | $ | 420,047 | $ | 717,372 | |||||
2012 | 32,118 | 80,692 | 112,810 | ||||||||
2013 | 105,896 | 292,517 | 398,413 | ||||||||
2014 | 1,230 | 662 | 1,892 | ||||||||
2015 | 269 | 1,107 | 1,376 | ||||||||
Total | $ | 436,838 | $ | 795,025 | $ | 1,231,863 | |||||
The following table presents interest expense on deposits for the yearsdate indicated:
| | Year Ended December 31, | |||||||||||
|---|---|---|---|---|---|---|---|---|---|---|---|---|
| | 2010 | 2009 | 2008 | |||||||||
| | (In thousands) | |||||||||||
Interest expense on: | ||||||||||||
Interest-bearing checking deposits | $ | 1,265 | $ | 1,754 | $ | 2,915 | ||||||
Money market deposits | 9,629 | 11,767 | 19,735 | |||||||||
Savings deposits | 249 | 270 | 253 | |||||||||
Time deposits under $100,000 | 7,764 | 10,966 | 8,554 | |||||||||
Time deposits of $100,000 or more | 7,330 | 7,159 | 9,700 | |||||||||
Total interest expense on deposits | $ | 26,237 | $ | 31,916 | $ | 41,157 | ||||||
| | December 31, 2011 | |||||||||
|---|---|---|---|---|---|---|---|---|---|---|
Year of Maturity | Time Deposits Under $100,000 | Time Deposits $100,000 or More | Total Time Deposits | |||||||
| | (In thousands) | |||||||||
2012 | $ | 151,014 | $ | 269,163 | $ | 420,177 | ||||
2013 | 124,538 | 271,877 | 396,415 | |||||||
2014 | 37,943 | 75,980 | 113,923 | |||||||
2015 | 225 | 970 | 1,195 | |||||||
2016 | 10,801 | 25,383 | 36,184 | |||||||
Total | $ | 324,521 | $ | 643,373 | $ | 967,894 | ||||
PACWEST BANCORP AND SUBSIDIARIES
Notes to Consolidated Financial Statements (Continued)
NOTE 11—BORROWINGS AND SUBORDINATED DEBENTURES
Borrowings
The Bank has established secured and unsecured lines of credit. We may borrow funds from time to time on a term or overnight basis from the FHLB, the FRB, or other financial institutions.
Federal Funds Arrangements with Commercial Banks. As of December 31, 2011, 2010, 2009, and 2008,2009, the Bank had unsecured lines of credit with correspondent banks, subject to availability, in the amount of $45.0 million, $52.0 million, and $117.0 million, and $155.0 million.respectively. These lines are renewable annually and have no unused commitment fees. As of December 31, 2011, 2010, 2009, and 2008,2009, there were no balances outstanding.
PACWEST BANCORP AND SUBSIDIARIES
Notes to Consolidated Financial Statements (Continued)
NOTE 11—BORROWINGS AND SUBORDINATED DEBENTURES (Continued)
FRB Secured Line of Credit. The Bank established a secured line of credit with the FRB during 2008. The secured borrowing capacity is collateralized by liens covering $470.9$439.1 million of our construction and commercial loans not already pledged to the FHLB as described below. As of December 31, 2010,2011, our secured FRB borrowing capacity was $373.3$347.4 million. As of December 31, 2011, 2010 and 2009 and during such periods, there were no balances outstanding.
FHLB Secured Lines of Credit. The borrowing arrangements with the FHLB are based on two separate FHLB programs and are collateralized by a portion of our securities available-for-sale and by a blanket lien covering the majority of our real estate secured loans. At December 31, 2010,2011, approximately $3.1$2.7 billion of real estate and commercial loans and securities with a carrying value of $107.4$37.6 million are pledged to secure our FHLB lines of credit.
The following table summarizes information about our collateralized FHLB borrowing arrangements for the years indicated:
| | At or For the Year Ended December 31, | At or For the Year Ended December 31, | ||||||||||||||||||
|---|---|---|---|---|---|---|---|---|---|---|---|---|---|---|---|---|---|---|---|---|
FHLB Borrowing Data | 2010 | 2009 | 2008 | 2011 | 2010 | 2009 | ||||||||||||||
| | (Dollars in thousands) | (Dollars in thousands) | ||||||||||||||||||
Collateralized borrowing limits | $ | 1,389,806 | $ | 1,322,636 | $ | 980,227 | $ | 1,273,927 | $ | 1,389,806 | $ | 1,322,636 | ||||||||
Carrying value of assets pledged | $ | 3,229,294 | $ | 3,125,442 | $ | 2,580,436 | $ | 2,706,917 | $ | 3,229,294 | $ | 3,125,442 | ||||||||
Unused borrowing capacity | $ | 1,162,804 | $ | 785,410 | $ | 527,790 | $ | 1,046,925 | $ | 1,162,804 | $ | 785,410 | ||||||||
Balance at the end of the year | $ | 225,000 | $ | 542,763 | $ | 450,000 | $ | 225,000 | $ | 225,000 | $ | 542,763 | ||||||||
Average balance outstanding during the year | $ | 324,139 | $ | 550,038 | $ | 574,358 | $ | 225,523 | $ | 324,139 | $ | 550,038 | ||||||||
Highest balance at any month-end | $ | 460,000 | $ | 722,921 | $ | 698,500 | $ | 225,000 | $ | 460,000 | $ | 722,921 | ||||||||
Weighted average interest cost for the year | 2.82 | % | 2.81 | % | 3.21 | % | 3.14 | % | 2.82 | % | 2.81 | % | ||||||||
PACWEST BANCORP AND SUBSIDIARIES
Notes to Consolidated Financial Statements (Continued)
NOTE 11—BORROWINGS AND SUBORDINATED DEBENTURES (Continued)
The following table summarizes our outstanding FHLB advances by their maturity dates as of the dates indicated:
| | December 31, 2010 | December 31, 2009 | ||||||||||||
|---|---|---|---|---|---|---|---|---|---|---|---|---|---|---|
Maturity Date | Amount | Rate | Amount | Rate | ||||||||||
| | (Dollars in thousands) | |||||||||||||
January 11, 2010 | $ | — | — | $ | 75,000 | 3.04 | % | |||||||
February 8, 2010 | — | — | 10,000 | (1) | 4.81 | % | ||||||||
February 8, 2010 | — | — | 25,000 | (1) | 5.04 | % | ||||||||
February 26, 2010 | — | — | 25,000 | (1) | 4.99 | % | ||||||||
August 23, 2010 | — | — | 20,000 | (1) | 4.90 | % | ||||||||
December 29, 2010 | — | — | 25,000 | (1) | 4.23 | % | ||||||||
September 8, 2011 | — | — | 20,000 | (1) | 4.67 | % | ||||||||
January 11, 2013 | — | — | 50,000 | (2) | 2.71 | % | ||||||||
September 9, 2013 | — | — | 20,000 | (1) | 4.63 | % | ||||||||
August 25, 2014 | — | — | 20,000 | (1) | 4.26 | % | ||||||||
September 23, 2014 | — | — | 20,000 | (1) | 3.51 | % | ||||||||
December 11, 2017 | 200,000 | 3.16 | % | 200,000 | 3.16 | % | ||||||||
January 11, 2018 | 25,000 | 2.61 | % | 25,000 | 2.61 | % | ||||||||
Unamortized premium | — | 7,763 | (3) | |||||||||||
Total FHLB advances | $ | 225,000 | $ | 542,763 | ||||||||||
| | December 31, | ||||||||||||
|---|---|---|---|---|---|---|---|---|---|---|---|---|---|
| | 2011 | 2010 | |||||||||||
Contractual Maturity Date | Amount | Rate | Amount | Rate | |||||||||
| | (Dollars in thousands) | ||||||||||||
December 11, 2017 | 200,000 | 3.16 | % | 200,000 | 3.16 | % | |||||||
January 11, 2018 | 25,000 | 2.61 | % | 25,000 | 2.61 | % | |||||||
Total FHLB advances | $ | 225,000 | 3.10 | % | $ | 225,000 | 3.10 | % | |||||
The FHLB advances outstanding at December 31, 2010,2011, are both term and callable advances. The maturities shown are the contractual maturities for all advances. The callable advances have all passed their initial call dates and are currently callable on a quarterly basis by the FHLB. While the FHLB may call the advances to be repaid for any reason, they are likely to be called if market interest rates, for borrowings of similar remaining term, are higher than the advances' stated rates on the call dates. We may repay the advances at any time with a prepayment penalty. In April 2010, we elected
PACWEST BANCORP AND SUBSIDIARIES
Notes to prepay $125.0 million in Affinity-acquired FHLB advances and incurred a $726,000 prepayment penalty. In December 2010, we elected to prepay $50 million in FHLB advances, for which we incurred a $1.9 million prepayment penalty. The prepayment penalties are included in other expenses.Consolidated Financial Statements (Continued)
NOTE 11—BORROWINGS AND SUBORDINATED DEBENTURES (Continued)
Subordinated Debentures
The Company had an aggregate of $129.6$129.3 million and $129.8$129.6 million in subordinated debentures outstanding at December 31, 20102011 and 2009,2010, respectively. The subordinated debentures outstanding at December 31, 20102011 were issued in seven separate series. Each issuance had a maturity of thirty years from its date of issue. Debt issuance costs are amortized on a straight-line basis over the period to the first call date. The subordinated debentures were issued to trusts established by us or entities we have acquired, which in turn issued trust preferred securities, which totaled $123.0 million at December 31, 2010.2011. These trust preferred securities are presently considered Tier 1 capital for regulatory purposes.
PACWEST BANCORP AND SUBSIDIARIES
Notes to Consolidated Financial Statements (Continued)
NOTE 11—BORROWINGS AND SUBORDINATED DEBENTURES (Continued)
WithThe subordinated debentures are each callable at par with the exception of Trust I and Trust CI, the subordinated debentureswhich are callable at par with a prepayment penalty, and only by the issuer, five years from the date of issuance, subject to certain exceptions. We were permitted to call the debentures in the first five years if theissuer. The prepayment election related to one of the following three events: (i) a change in the tax treatment of the debentures stemming from a change in the IRS laws; (ii) a change in the regulatory treatment of the underlying trust preferred securities as Tier 1 capital; and (iii) a requirement to register the underlying trust as a registered investment company. However, redemption in the first five years was subject to a prepayment penalty.penalty for Trust I and Trust CI may not be called for 10 years from the date of issuance unless one of the three events described above has occurred and then a prepayment penalty applies. In addition, there is a prepayment penalty if either of these debentures is called 10 to 20 years from the date of their issuance anddiminishes over time such that they may be called at par after 20 years.in the year 2020.
On March 7 and 8, 2012, the Company redeemed $18 million of the subordinated debentures of Trust 1 and Trust CI and recognized a pre-tax gain of approximately $1.6 million. We redeemed these subordinated debentures to reduce our cost of funds, as these two instruments carried fixed interest rates of 11.0% and 10.6%.
The proceeds of the subordinated debentures were used primarily to fund several of our acquisitions and to augment regulatory capital. Interest payments on subordinated debentures made by the Company are considered dividend payments by the Federal Reserve Bank. As such, notification to the Federal Reserve Bank is required prior to paying such interest during any period for which our quarterly net earnings are insufficient to fund the dividendinterest due. Should the FRB object to payment of interest on the subordinated debentures we would not be able to make the payments until approval is received or we no longer need to provide notice under applicable regulations.
The following table summarizes the terms of each issuance of the subordinated debentures outstanding as of December 31, 2010:2011:
Series | Date Issued | December 31, 2011 Amount | Maturity Date | Earliest Call Date by Company Without Penalty | Fixed or Variable Rate | Rate Index | Current Rate(2) | Next Reset Date | |||||||||||||||
|---|---|---|---|---|---|---|---|---|---|---|---|---|---|---|---|---|---|---|---|---|---|---|---|
| | | (In thousands) | | | | | | | |||||||||||||||
Trust CI | 3/23/00 | $ | 10,310 | 3/8/30 | 3/8/20 | Fixed | N/A | 11.00 | % | N/A | |||||||||||||
Trust I | 9/7/00 | 8,248 | 9/7/30 | 9/7/20 | Fixed | N/A | 10.60 | % | N/A | ||||||||||||||
Trust V | 8/15/03 | 10,310 | 9/17/33 | (1) | Variable | 3 month LIBOR + 3.10 | 3.66 | % | 3/15/12 | ||||||||||||||
Trust VI | 9/3/03 | 10,310 | 9/15/33 | (1) | Variable | 3 month LIBOR + 3.05 | 3.60 | % | 3/13/12 | ||||||||||||||
Trust CII | 9/17/03 | 5,155 | 9/17/33 | (1) | Variable | 3 month LIBOR + 2.95 | 3.51 | % | 3/15/12 | ||||||||||||||
Trust VII | 2/5/04 | 61,856 | 4/23/34 | (1) | Variable | 3 month LIBOR + 2.75 | 3.30 | % | 4/27/12 | ||||||||||||||
Trust CIII | 8/15/05 | 20,619 | 9/15/35 | (1) | Variable | 3 month LIBOR + 1.69 | 2.24 | % | 3/15/12 | ||||||||||||||
Gross subordinated debentures | 126,808 | ||||||||||||||||||||||
Unamortized premium(3) | 2,463 | ||||||||||||||||||||||
Net subordinated debentures | $ | 129,271 | |||||||||||||||||||||
Series | Date Issued | December 31, 2010 Amount | Maturity Date | Earliest Call Date by Company Without Penalty | Fixed or Variable Rate | Rate Index | Current Rate(2) | Next Reset Date | |||||||||||||||
|---|---|---|---|---|---|---|---|---|---|---|---|---|---|---|---|---|---|---|---|---|---|---|---|
| | | (In thousands) | | | | | | | |||||||||||||||
Trust CI | 3/23/00 | $ | 10,310 | 3/8/30 | 3/8/20 | Fixed | N/A | 11.00 | % | N/A | |||||||||||||
Trust I | 9/7/00 | 8,248 | 9/7/30 | 9/7/20 | Fixed | N/A | 10.60 | % | N/A | ||||||||||||||
Trust V | 8/15/03 | 10,310 | 9/17/33 | (1) | Variable | 3 month LIBOR + 3.10 | 3.40 | % | 3/15/10 | ||||||||||||||
Trust VI | 9/3/03 | 10,310 | 9/15/33 | (1) | Variable | 3 month LIBOR + 3.05 | 3.35 | % | 3/11/10 | ||||||||||||||
Trust CII | 9/17/03 | 5,155 | 9/17/33 | (1) | Variable | 3 month LIBOR + 2.95 | 3.25 | % | 3/15/10 | ||||||||||||||
Trust VII | 2/5/04 | 61,856 | 4/23/34 | (1) | Variable | 3 month LIBOR + 2.75 | 3.05 | % | 4/27/11 | ||||||||||||||
Trust CIII | 8/15/05 | 20,619 | 9/15/35 | (1) | Variable | 3 month LIBOR + 1.69 | 1.99 | % | 3/15/10 | ||||||||||||||
Gross subordinated debentures | 126,808 | ||||||||||||||||||||||
Unamortized premium(3) | 2,764 | ||||||||||||||||||||||
Net subordinated debentures | $ | 129,572 | |||||||||||||||||||||
PACWEST BANCORP AND SUBSIDIARIES
Notes to Consolidated Financial Statements (Continued)
NOTE 11—BORROWINGS AND SUBORDINATED DEBENTURES (Continued)
NOTE 12—COMMITMENTS AND CONTINGENCIES
Lending Commitments
The Bank is a party to financial instruments with off-balance-sheet risk in the normal course of business to meet the financing needs of its customers. These financial instruments include commitments to extend credit and standby letters of credit. Those instruments involve, to varying degrees, elements of credit risk in excess of the amount recognized in the consolidated balance sheets. The contract or notional amounts of those instruments reflect the extent of involvement the Company has in those particular classes of financial instruments.
The following presents a summary of the financial instruments described above as of the dates indicated:
| | December 31, | December 31, | ||||||||||||
|---|---|---|---|---|---|---|---|---|---|---|---|---|---|---|
| | 2010 | 2009 | 2011 | 2010 | ||||||||||
| | (In thousands) | (In thousands) | ||||||||||||
Commitments to extend credit—fixed | $ | 66,614 | $ | 59,459 | $ | 74,283 | $ | 66,614 | ||||||
Commitments to extend credit—variable | 656,531 | 699,916 | 617,246 | 656,531 | ||||||||||
Standby letters of credit | 23,707 | 31,203 | 31,956 | 23,707 | ||||||||||
Overdraft protection | 30,904 | 23,861 | ||||||||||||
| $ | 777,756 | $ | 814,439 | $ | 723,485 | $ | 746,852 | |||||||
Commitments to extend credit are agreements to lend to a customer as long as there is no violation of any condition established in the contract. Commitments generally have fixed expiration dates or other termination clauses and may require payment of a fee. Since many of the commitments are expected to expire without being drawn upon, the total commitment amounts do not necessarily represent future cash requirements. Of the $777.8$723.5 million of commitments to extend credit, $17.2$8.5 million is related to foreign loans.
Standby letters of credit are conditional commitments issued by the Company to guarantee the performance of a customer to a third party. Those guarantees are primarily issued to support private borrowing arrangements. Most guarantees will expire within one year. The Company generally requires collateral or other security to support financial instruments with credit risk.
In addition, the Company has investments in low income housing project partnerships, which provide the Company income tax credits, and also in several small business investment companies. The investments call for capital contributions up to an amount specified in the partnership agreements. The Company had commitments to contribute capital to these entities totaling $177,000$7.1 million and $277,000$177,000 as of December 31, 20102011 and 2009,2010, respectively.
Legal Matters
In the ordinary course of our business, we are party to various legal actions, which we believe are incidental to the operation of our business. The outcome of such legal actions and the timing of ultimate resolution are inherently difficult to predict. Because of these factors, the Company cannot provide a meaningful estimate of the range of reasonably possible outcomes of claims in the aggregate or by individual claim. In the opinion of management, based upon information currently available to us,
PACWEST BANCORP AND SUBSIDIARIES
Notes to Consolidated Financial Statements (Continued)
NOTE 12—COMMITMENTS AND CONTINGENCIES (Continued)
ultimate resolution are inherently difficult to predict. In the opinion of management, based upon information currently available to us, any resulting liability, isin addition to amounts already accrued, would not likely to have a material adverse effect on the Company's consolidated financial position, results of operationsstatements or cash flows.operations.
NOTE 13—FAIR VALUE OF FINANCIAL INSTRUMENTSMEASUREMENTS
ASC Topic 820, "Fair Value Measurements and Disclosures,Measurement," defines fair value, establishes a framework for measuring fair value including a three-level valuation hierarchy, and expands disclosures about fair value measurements. Fair value is defined as the exchange price that would be received to sell an asset or paid to transfer a liability in an orderly transaction between market participants at the measurement date reflecting assumptions that a market participant would use when pricing an asset or liability. The hierarchy uses three levels of inputs to measure the fair value of assets and liabilities as follows:
We use fair value to measure certain assets on a recurring basis, primarily securities available for sale; we have no liabilities being measured at fair value. For assets and liabilities measured at the lower of cost or fair value, the fair value measurement criteria may or may not be met during a reporting period and such measurements are therefore considered "nonrecurring" for purposes of disclosing our fair value measurements. Fair value is used on a nonrecurring basis to adjust carrying values for impaired loans and other real estate owned and also to record impairment on certain assets, such as goodwill, core deposit intangibles and other long-lived assets.
PACWEST BANCORP AND SUBSIDIARIES
Notes to Consolidated Financial Statements (Continued)
NOTE 13—FAIR VALUE OF FINANCIAL INSTRUMENTSMEASUREMENTS (Continued)
The following tables present information on the assets measured and recorded at fair value on a recurring and nonrecurring basis at and foras of the years ended December 31, 2010 and 2009:dates indicated:
| | | Fair Value Measurement as of December 31, 2010 | Fair Value Measurement as of December 31, 2011 | ||||||||||||||||||||||||
|---|---|---|---|---|---|---|---|---|---|---|---|---|---|---|---|---|---|---|---|---|---|---|---|---|---|---|---|
| | | Total | Quoted Prices in Active Markets for Identical Assets (Level 1) | Significant Other Observable Inputs (Level 2) | Significant Unobservable Inputs (Level 3) | Total | Quoted Prices in Active Markets for Identical Assets (Level 1) | Significant Other Observable Inputs (Level 2) | Significant Unobservable Inputs (Level 3) | ||||||||||||||||||
| | | (In thousands) | (In thousands) | ||||||||||||||||||||||||
Measured on a Recurring Basis: | Measured on a Recurring Basis: | ||||||||||||||||||||||||||
Securities available-for-sale: | Securities available-for-sale: | ||||||||||||||||||||||||||
Government-sponsored entity debt securities | $ | 10,029 | $ | — | $ | 10,029 | $ | — | |||||||||||||||||||
Municipal securities | 7,566 | — | 7,566 | — | |||||||||||||||||||||||
Government and government-sponsored entity residential mortgage-backed securities | 803,694 | — | 803,694 | — | |||||||||||||||||||||||
Covered private label CMOs | 50,437 | — | — | 50,437 | |||||||||||||||||||||||
Other securities | 2,290 | — | 2,290 | — | |||||||||||||||||||||||
Government and government-sponsored entity residential mortgage-backed securities | $ | 1,124,534 | $ | — | $ | 1,124,534 | $ | — | |||||||||||||||||||
Covered private label CMOs | 45,149 | — | — | 45,149 | |||||||||||||||||||||||
Municipal securities | 126,797 | — | 126,797 | — | |||||||||||||||||||||||
Corporate debt securities | 25,128 | — | 25,128 | — | |||||||||||||||||||||||
Other securities | 4,750 | 2,976 | 1,774 | — | |||||||||||||||||||||||
| $ | 874,016 | $ | — | $ | 823,579 | $ | 50,437 | $ | 1,326,358 | $ | 2,976 | $ | 1,278,233 | $ | 45,149 | ||||||||||||
Measured on a Nonrecurring Basis: | Measured on a Nonrecurring Basis: | ||||||||||||||||||||||||||
Non-covered impaired loans | $ | 114,353 | $ | — | $ | 13,803 | $ | 100,550 | |||||||||||||||||||
Non-covered other real estate owned | 44,106 | — | 3,679 | 40,427 | |||||||||||||||||||||||
Covered other real estate owned | 29,490 | — | 24,729 | 4,761 | |||||||||||||||||||||||
SBA loan servicing asset | 1,254 | — | — | 1,254 | |||||||||||||||||||||||
Non-covered impaired loans | $ | 117,854 | $ | — | $ | 43,530 | $ | 74,324 | |||||||||||||||||||
Covered impaired loans | 45,763 | — | 22,840 | 22,923 | $ | 189,203 | $ | — | $ | 42,211 | $ | 146,992 | |||||||||||||||
Non-covered other real estate owned | 12,087 | — | 11,857 | 230 | |||||||||||||||||||||||
Covered other real estate owned | 16,643 | — | 13,848 | 2,795 | |||||||||||||||||||||||
SBA loan servicing asset | 1,613 | — | — | 1,613 | |||||||||||||||||||||||
| $ | 193,960 | $ | — | $ | 92,075 | $ | 101,885 | ||||||||||||||||||||
PACWEST BANCORP AND SUBSIDIARIES
Notes to Consolidated Financial Statements (Continued)
NOTE 13—FAIR VALUE OF FINANCIAL INSTRUMENTSMEASUREMENTS (Continued)
| | | Fair Value Measurement as of December 31, 2009 | Fair Value Measurement as of December 31, 2010 | ||||||||||||||||||||||||
|---|---|---|---|---|---|---|---|---|---|---|---|---|---|---|---|---|---|---|---|---|---|---|---|---|---|---|---|
| | | Total | Quoted Prices in Active Markets for Identical Assets (Level 1) | Significant Other Observable Inputs (Level 2) | Significant Unobservable Inputs (Level 3) | Total | Quoted Prices in Active Markets for Identical Assets (Level 1) | Significant Other Observable Inputs (Level 2) | Significant Unobservable Inputs (Level 3) | ||||||||||||||||||
| | | (In thousands) | (In thousands) | ||||||||||||||||||||||||
Measured on a Recurring Basis: | Measured on a Recurring Basis: | ||||||||||||||||||||||||||
Securities available-for-sale: | Securities available-for-sale: | ||||||||||||||||||||||||||
Government-sponsored entity debt securities | $ | 38,648 | $ | — | $ | 38,648 | $ | — | |||||||||||||||||||
Municipal securities | 8,214 | — | 8,214 | — | |||||||||||||||||||||||
Government and government-sponsored entity residential mortgage-backed securities | 322,429 | — | 322,429 | — | |||||||||||||||||||||||
Covered private label CMOs | 52,125 | — | — | 52,125 | |||||||||||||||||||||||
Other securities | 2,284 | — | 2,284 | — | |||||||||||||||||||||||
Government-sponsored entity debt securities | $ | 10,029 | $ | — | $ | 10,029 | $ | — | |||||||||||||||||||
Government and government-sponsored entity residential mortgage-backed securities | 803,694 | — | 803,694 | — | |||||||||||||||||||||||
Covered private label CMOs | 50,437 | — | — | 50,437 | |||||||||||||||||||||||
Municipal securities | 7,566 | — | 7,566 | — | |||||||||||||||||||||||
Other securities | 2,290 | — | 2,290 | — | |||||||||||||||||||||||
| $ | 423,700 | $ | — | $ | 371,575 | $ | 52,125 | $ | 874,016 | $ | — | $ | 823,579 | $ | 50,437 | ||||||||||||
Measured on a Nonrecurring Basis: | Measured on a Nonrecurring Basis: | ||||||||||||||||||||||||||
Non-covered impaired loans | $ | 117,854 | $ | — | $ | 43,530 | $ | 74,324 | |||||||||||||||||||
Non-covered other real estate owned | 12,087 | — | 11,857 | 230 | |||||||||||||||||||||||
Covered other real estate owned | 16,643 | — | 13,848 | 2,795 | |||||||||||||||||||||||
SBA loan servicing asset | 1,613 | — | — | 1,613 | |||||||||||||||||||||||
Non-covered impaired loans | $ | 249,376 | $ | — | $ | 69,259 | $ | 180,117 | |||||||||||||||||||
Covered impaired loans | 21,245 | — | 21,245 | — | $ | 148,197 | $ | — | $ | 69,235 | $ | 78,962 | |||||||||||||||
Non-covered other real estate owned | 21,910 | — | 15,800 | 6,110 | |||||||||||||||||||||||
Covered other real estate owned | 3,542 | — | 2,300 | 1,242 | |||||||||||||||||||||||
SBA loan servicing asset | 1,937 | — | — | 1,937 | |||||||||||||||||||||||
| $ | 298,010 | $ | — | $ | 108,604 | $ | 189,406 | ||||||||||||||||||||
There were no significant transfers of assets between Level 1 and Level 2 of the fair value hierarchy during 2011.
The following table presents gains and (losses) recognized on assets measured on a nonrecurring basis for the years indicated:
| | | Year Ended December 31, | Year Ended December 31, | ||||||||||||||||||
|---|---|---|---|---|---|---|---|---|---|---|---|---|---|---|---|---|---|---|---|---|---|
| | | 2010 | 2009 | 2008 | 2011 | 2010 | 2009 | ||||||||||||||
| | | (In thousands) | (In thousands) | ||||||||||||||||||
Non-covered impaired loans | Non-covered impaired loans | $ | (30,639 | ) | $ | (67,762 | ) | $ | (7,118 | ) | $ | (22,796 | ) | $ | (30,639 | ) | $ | (67,762 | ) | ||
Covered impaired loans | (14,609 | ) | (12,623 | ) | — | ||||||||||||||||
Non-covered other real estate owned | Non-covered other real estate owned | (8,915 | ) | (14,615 | ) | (1,254 | ) | (4,381 | ) | (8,915 | ) | (14,615 | ) | ||||||||
Covered other real estate owned | Covered other real estate owned | (3,982 | ) | (1,518 | ) | — | (9,275 | ) | (3,982 | ) | (1,518 | ) | |||||||||
SBA loan servicing asset | SBA loan servicing asset | 204 | 375 | 8 | 2 | 204 | 375 | ||||||||||||||
Goodwill | — | — | (761,701 | ) | |||||||||||||||||
Loans transferred from held-for-sale to the regular portfolio | — | — | (673 | ) | |||||||||||||||||
Total loss on assets measured on a nonrecurring basis | $ | (36,450 | ) | $ | (43,332 | ) | $ | (83,520 | ) | ||||||||||||
Total loss on assets measured on a nonrecurring basis | $ | (57,941 | ) | $ | (96,143 | ) | $ | (770,738 | ) | ||||||||||||
PACWEST BANCORP AND SUBSIDIARIES
Notes to Consolidated Financial Statements (Continued)
NOTE 13—FAIR VALUE OF FINANCIAL INSTRUMENTSMEASUREMENTS (Continued)
The following table presents activity for assets measured at fair value on a recurring basis using significant unobservable inputs (Level 3) for the years indicated:
| | | Year Ended December 31, | Year Ended December 31, | |||||||||||||||
|---|---|---|---|---|---|---|---|---|---|---|---|---|---|---|---|---|---|---|
| | | 2010 | 2009 | 2011 | 2010 | 2009 | ||||||||||||
| | | (In thousands) | (In thousands) | |||||||||||||||
Covered private label CMOs, beginning of year | Covered private label CMOs, beginning of year | $ | 52,125 | $ | — | $ | 50,437 | $ | 52,125 | $ | — | |||||||
Addition from the Affinity acquisition | — | 55,270 | ||||||||||||||||
Total realized in earnings | 1,932 | 847 | ||||||||||||||||
Other-than-temporary impairment loss | (874 | ) | — | |||||||||||||||
Total unrealized in comprehensive income | 5,411 | (842 | ) | |||||||||||||||
Net settlements subsequent to acquisition | (8,157 | ) | (3,150 | ) | ||||||||||||||
Addition from the Afffinity acquisition | — | — | 55,270 | |||||||||||||||
Total realized in earnings | 2,097 | 1,932 | 847 | |||||||||||||||
Other-than-temporary impairment loss | — | (874 | ) | — | ||||||||||||||
Total unrealized in comprehensive income | (846 | ) | 5,411 | (842 | ) | |||||||||||||
Net settlements subsequent to acquisition | (6,539 | ) | (8,157 | ) | (3,150 | ) | ||||||||||||
Covered private label CMOs, end of year | Covered private label CMOs, end of year | $ | 50,437 | $ | 52,125 | $ | 45,149 | $ | 50,437 | $ | 52,125 | |||||||
ASC Topic 825, "Financial Instruments," requires disclosure of the estimated fair value of certain financial instruments and the methods and significant assumptions used to estimate such fair values. Additionally, certain financial instruments and all nonfinancial instruments are excluded from the applicable disclosure requirements.
The following table is a summary of the carrying values and fair value estimates of certain financial instruments as of the dates indicated:
| | December 31, | ||||||||||||
|---|---|---|---|---|---|---|---|---|---|---|---|---|---|
| | 2011 | 2010 | |||||||||||
| | Carrying or Contract Amount | Estimated Fair Value | Carrying or Contract Amount | Estimated Fair Value | |||||||||
| | (In thousands) | ||||||||||||
Financial Assets: | |||||||||||||
Cash and due from banks | $ | 92,342 | $ | 92,342 | $ | 82,170 | $ | 82,170 | |||||
Interest-earning deposits in financial institutions | 203,275 | 203,275 | 26,382 | 26,382 | |||||||||
Securities available-for-sale | 1,326,358 | 1,326,358 | 874,016 | 874,016 | |||||||||
Investment in FHLB stock | 46,106 | 46,106 | 55,040 | 55,040 | |||||||||
Loans, net(1) | 3,425,423 | 3,469,754 | 3,970,978 | 3,960,244 | |||||||||
Financial Liabilities: | |||||||||||||
Deposits | 4,577,453 | 4,587,148 | 4,649,698 | 4,664,575 | |||||||||
Borrowings | 225,000 | 249,000 | 225,000 | 243,273 | |||||||||
Subordinated debentures | 129,271 | 135,532 | 129,572 | 135,876 | |||||||||
| | December 31, | |||||||||||||
|---|---|---|---|---|---|---|---|---|---|---|---|---|---|---|
| | 2010 | 2009 | ||||||||||||
| | Carrying or Contract Amount | Estimated Fair Value | Carrying or Contract Amount | Estimated Fair Value | ||||||||||
| | (In thousands) | |||||||||||||
Financial Assets: | ||||||||||||||
Cash and due from banks | $ | 82,170 | $ | 82,170 | $ | 93,915 | $ | 93,915 | ||||||
Interest-earning deposits in financial institutions | 26,382 | 26,382 | 117,133 | 117,133 | ||||||||||
Securities available-for-sale | 874,016 | 874,016 | 423,700 | 423,700 | ||||||||||
Investment in FHLB stock | 55,040 | 55,040 | 50,429 | 50,429 | ||||||||||
Loans, net | 3,970,978 | 3,960,244 | 4,210,352 | 4,195,805 | ||||||||||
Financial Liabilities: | ||||||||||||||
Deposits | 4,649,698 | 4,664,575 | 4,094,569 | 4,102,467 | ||||||||||
Borrowings | 225,000 | 243,273 | 542,763 | 557,363 | ||||||||||
Subordinated debentures | 129,572 | 135,876 | 129,798 | 146,413 | ||||||||||
PACWEST BANCORP AND SUBSIDIARIES
Notes to Consolidated Financial Statements (Continued)
NOTE 13—FAIR VALUE OF FINANCIAL INSTRUMENTSMEASUREMENTS (Continued)
The following is a description of the valuation methodologies used to measure our assets recorded at fair value (under ASC Topic 820) and for estimating fair value for financial instruments not recorded at fair value (under ASC Topic 825):
Cash and Due from Banks and Federal Funds Sold. The carrying amount is assumed to be the fair value because of the liquidity of these instruments.
Interest-Earning Deposits in Financial Institutions. The carrying amount is assumed to be the fair value given the short-term nature of these deposits.
FHLB stock. The fair value of FHLB stock is based on our recorded investment. In January 2009, the FHLB announced that it suspended excess FHLB stock redemptions and dividend payments. Since this announcement, the FHLB has declared and paid five cash dividends in 2010 and 2011, though at rates less than thatthose paid in the past, and repurchased $6.0 millioncertain amounts of our excess stock. As a result of these actions, westock at the carrying value. We evaluated the carrying value of our FHLB stock investment. Based on the FHLB's most recent publicly available financial results, its capital positioninvestment at December 31, 2011 and its bond ratings, we concluded such investment2010, and determined that it was not impaired at either December 31, 2010 or 2009.impaired. Our evaluation considered the long-term nature of the investment, the current financial and liquidity position of the FHLB, the actions being taken by the FHLB to address its regulatory situation, repurchase activity of excess stock by the FHLB, and our intent and ability to hold this investment for a period of time sufficient to recover our recorded investment.
Securities available-for-sale. Securities available-for-sale are measured and carried at fair value on a recurring basis. Unrealized gains and losses on available-for-sale securities are reported as a component of accumulated other comprehensive income in the consolidated balance sheets. Also see noteNote 5,Investment Securities, for further information on unrealized gains and losses on securities available-for-sale.
Fair values for securities catagorized as Level 1, which are primarily equity securities, are based on readily available quoted market prices. In determining the fair value of the securities categorized as Level 2, we obtain a report from a nationally recognized broker-dealer detailing the fair value of each investment security we hold as of each reporting date. The broker-dealer uses observable market information to value our fixed income securities, with the primary source being a nationally recognized pricing service. The fair value ofWe review the municipal securities is based on a proprietary model maintainedmarket prices provided by the broker-dealer. We review all of the broker-dealer supplied quotes on thefor our securities we own as of the reporting date for reasonableness based on our understanding of the marketplace and we consider any credit issues related to the bonds.securities. As we have not made any adjustments to the market quotes provided to us and they are based on observable market data, they have been categorized as Level 2 within the fair value hierarchy.
Our covered private label CMOcollateralized mortgage obligation securities, which we refer to as private label CMOs, are categorized as Level 3 due in part to the inactive market for such securities. There is a wide range of prices quoted for private label CMOs among independent third party pricing services and this range reflects the significant judgment being exercised over the assumptions and variables that determine the pricing of such securities. We consider this subjectivity to be a significant unobservable input and have concluded that the private label CMOs should be categorized as a Level 3 measured asset. While the private label CMOs may be based on significant unobservable inputs, ourOur fair value estimate was based on prices provided to us by a nationally recognized pricing service which we also use to determine the fair value of the majority of our securities portfolio. We determined the reasonableness of the fair values by reviewing assumptions at the individual security level about prepayment, default expectations, estimated severity loss factors, projected cash flows and
PACWEST BANCORP AND SUBSIDIARIES
Notes to Consolidated Financial Statements (Continued)
NOTE 13—FAIR VALUE MEASUREMENTS (Continued)
estimated collateral performance, all of which are not directly observable in the market. During 2010, we recorded $874,000 in losses on one covered impaired security with a resulting fair value of zero.
PACWEST BANCORP AND SUBSIDIARIES
Notes to Consolidated Financial Statements (Continued)
NOTE 13—FAIR VALUE OF FINANCIAL INSTRUMENTS (Continued)
Non-covered loans. As non-covered loans are not measured at fair value, the following discussion relates to estimating the fair value disclosures under ASC Topic 825. Fair values are estimated for portfolios of loans with similar financial characteristics. Loans are segregated by type and further segmented into fixed and adjustable rate interest terms and by credit risk categories. The fair value estimates do not take into consideration the value of the loan portfolio in the event the loans have to be sold outside the parameters of normal operating activities. The fair value of performing fixed rate loans is estimated by discounting scheduled cash flows through the estimated maturity using estimated market prepayment speeds and estimated market discount rates that reflect the credit and interest rate risk inherent in the loans. The estimated market discount rates used for performing fixed rate loans are the Company's current offering rates for comparable instruments with similar terms. The fair value of performing adjustable rate loans is estimated by discounting scheduled cash flows through the next repricing date. As these loans reprice frequently at market rates and the credit risk is not considered to be greater than normal, the market value is typically close to the carrying amount of these loans.
Non-covered impaired loans. Non-coveredNonaccrual loans and performing restructured loans are considered impaired loansfor reporting purposes and are measured and recorded at fair value on a non-recurring basis. All of our non-coveredNon-covered nonaccrual loans with an unpaid principal balance over $250,000 and all performing restructured loans are considered impaired and are reviewed individually for the amount of impairment, if any. MostNon-covered nonaccrual loans with an unpaid principal balance of our loans$250,000 or less are evaluated for impairment collectively.
To the extent a loan is collateral dependent, and, accordingly, we measure such impaired loansloan based on the estimated fair value of suchthe underlying collateral. The fair value of each loan's collateral is generally based on estimated market prices from an independently prepared appraisal, which is then adjusted for the cost related to liquidating such collateral; such valuation inputs result in a nonrecurring fair value measurement that is categorized as a Level 2 measurement.
When adjustments are made to an appraised value to reflect various factors such as the age of the appraisal or known changes in the market or the collateral, such valuation inputs are considered unobservable and the fair value measurement is categorized as a Level 3 measurement. The impaired loans categorized as Level 3 also include unsecured loans and other secured loans whose fair values are based significantly on unobservable inputs such as the strength of a guarantor, including an SBA government guarantee, cash flows discounted at the effective loan rate, and management's judgment.
The non-covered impaired loan balances shown in the above tables represent those nonaccrual and restructured loans for which impairment was recognized during 2011 and 2010. The amounts shown as losses represent, for the loan balances shown, the impairment recognized during 2010.the years ended December 31, 2011, 2010, and 2009. Of the $94.2$58.3 million of nonaccrual loans at December 31, 2010, loans totaling $50.72011, $18.2 million were written down to their fair values through charge-offs in 2010.
Covered loans. Covered loans were measured at estimated fair value on the date of acquisition. Thereafter, the fair value of covered loans is measured using the same methology as that for non-covered loans. The above discussion for non-covered loans and non-covered impaired loans is applicable to covered loans following their acquisition date.during 2011.
Other real estate owned. The fair value of foreclosed real estate, both non-covered and covered, is generally based on estimated market prices from independently prepared current appraisals or negotiated sales prices with potential buyers;buyers, less estimated costs to sell; such valuation inputs result in a fair value measurement that is categorized as a Level 2 measurement on a nonrecurring basis. As a matter of policy, appraisals are required annually and may be updated more frequently as circumstances require in the opinion of management. With the deterioration of real estate values during this economic downturn, appraisals have been obtained more regularly and as a result our Level 2 measurement is based on appraisals that are generally less than 9 months old. When a current appraised value is not available or management
PACWEST BANCORP AND SUBSIDIARIES
Notes to Consolidated Financial Statements (Continued)
NOTE 13—FAIR VALUE OF FINANCIAL INSTRUMENTSMEASUREMENTS (Continued)
circumstances require in the opinion of management. The Level 2 measurement for OREO is based on appraisals obtained within the last 12 months and for which a write-down was recognized in 2011 and 2010.
When a current appraised value is not available or management determines the fair value of the collateral is further impaired below the appraised value as a result of known changes in the market or the collateral and there is no observable market price, such valuation inputs result in a fair value measurement that is categorized as a Level 3 measurement. To the extent a negotiated sales price or reduced listing price represents a significant discount to an observable market price, such valuation input would result in a fair value measurement that is also considered a Level 3 measurement. The OREO losses disclosed are write-downs based on either a recent appraisal obtained after foreclosure or an accepted purchase offer by an independent third party received after foreclosure.
SBA servicing asset. In accordance with ASC Topic 860, "Accounting forTransfers and Servicing of Financial Assets," the SBA servicing asset, included in other assets in the balance sheet, is carried at its implied fair value of $1.6 million.value. The fair value of the servicing asset is estimated by discounting future cash flows using market-based discount rates and prepayment speeds. The discount rate is based on the current US Treasury yield curve, as published by the Department of the Treasury, plus a spread for the marketplace risk associated with these assets. We utilize estimated prepayment vectors using SBA prepayment information provided by Bloomberg for pools of similar assets to determine the timing of the cash flows. These nonrecurring valuation inputs are considered to be Level 3 inputs.
Deposits. Deposits are carried at historical cost. The fair value of deposits with no stated maturity, such as noninterest-bearing demand deposits, money market, savings and checking accounts, is equal to the amount payable on demand as of the balance sheet date. The fair value of time deposits is based on the discounted value of contractual cash flows. The discount rate is estimated using the rates currently offered for deposits of similar remaining maturities. No value has been separately assigned to the Company's long-term relationships with its deposit customers, such as a core deposit intangible.
Borrowings. Borrowings are carried at amortized cost. The fair value of fixed rate borrowings is calculated by discounting scheduled cash flows through the estimated maturity or call dates using estimated market discount rates that reflect current rates offered for borrowings with similar remaining maturities and characteristics.
Subordinated debentures. Subordinated debentures are carried at amortized cost. In accordance with ASC Topic 825, the fair value of the subordinated debentures is based on the discounted value of contractual cash flows for fixed rate securities. The discount rate is estimated using the rates currently offered for similar securities of similar maturity. The fair value of subordinated debentures with variable rates is deemed to be the carrying value.
Commitments to extend credit and standby letters of credit. The majority of our commitments to extend credit carry current market interest rates if converted to loans. Because these commitments are generally unassignable by either the borrower or us, they only have value to the borrower and us. The estimated fair value approximates the recorded deferred fee amounts and is excluded from the table above because it is not materialmaterial.
PACWEST BANCORP AND SUBSIDIARIES
Notes to Consolidated Financial Statements (Continued)
NOTE 13—FAIR VALUE MEASUREMENTS (Continued)
Limitations
Fair value estimates are made at a specific point in time and are based on relevant market information and information about the financial instrument. These estimates do not reflect income taxes or any premium or discount that could result from offering for sale at one time the Company's entire holdings of a particular financial instrument. Because no market exists for a portion of the Company's financial instruments, fair value estimates are based on what management believes to be
PACWEST BANCORP AND SUBSIDIARIES
Notes to Consolidated Financial Statements (Continued)
NOTE 13—FAIR VALUE OF FINANCIAL INSTRUMENTS (Continued)
conservative judgments regarding expected future cash flows, current economic conditions, risk characteristics of various financial instruments, and other factors. These estimated fair values are subjective in nature and involve uncertainties and matters of significant judgment and therefore cannot be determined with precision. Changes in assumptions could significantly affect the estimates. Since the fair values have been estimated as of December 31, 20102011 and 2009,2010, the amounts that will actually be realized or paid at settlement or maturity of the instruments could be significantly different.
NOTE 14—INCOME TAXES
The following table presents the components of income tax benefit (expense) for the years indicated:
| | | Year Ended December 31, | Year Ended December 31, | |||||||||||||||||||
|---|---|---|---|---|---|---|---|---|---|---|---|---|---|---|---|---|---|---|---|---|---|---|
| | | 2010 | 2009 | 2008 | 2011 | 2010 | 2009 | |||||||||||||||
| | | (In thousands) | (In thousands) | |||||||||||||||||||
Current Income Taxes: | Current Income Taxes: | |||||||||||||||||||||
Federal | $ | (15,129 | ) | $ | 7,912 | $ | 10,716 | |||||||||||||||
State | (9,562 | ) | (3,557 | ) | (528 | ) | ||||||||||||||||
Federal | $ | 7,912 | $ | 10,716 | $ | (20,041 | ) | |||||||||||||||
State | (3,557 | ) | (528 | ) | (6,476 | ) | ||||||||||||||||
Total current income tax benefit (expense) | 4,355 | 10,188 | (26,517 | ) | ||||||||||||||||||
Total current income tax (expense) benefit | (24,691 | ) | 4,355 | 10,188 | ||||||||||||||||||
Deferred Income Taxes: | Deferred Income Taxes: | |||||||||||||||||||||
Federal | (11,726 | ) | 27,263 | (4,100 | ) | |||||||||||||||||
State | (383 | ) | 15,096 | 1,713 | ||||||||||||||||||
Federal | 27,263 | (4,100 | ) | 4,322 | ||||||||||||||||||
Total deferred income tax (expense) benefit | (12,109 | ) | 42,359 | (2,387 | ) | |||||||||||||||||
State | 15,096 | 1,713 | 2,106 | |||||||||||||||||||
Total income tax (expense) benefit | $ | (36,800 | ) | $ | 46,714 | $ | 7,801 | |||||||||||||||
Total deferred income tax benefit (expense) | 42,359 | (2,387 | ) | 6,428 | ||||||||||||||||||
Total income tax benefit (expense) | $ | 46,714 | $ | 7,801 | $ | (20,089 | ) | |||||||||||||||
PACWEST BANCORP AND SUBSIDIARIES
Notes to Consolidated Financial Statements (Continued)
NOTE 14—INCOME TAXES (Continued)
The following table presents a reconciliation of the recorded income tax benefit (expense) to the amount of taxes computed by applying the applicable statutory Federal income tax rate of 35% to earnings or loss before income taxes:
| | | Year Ended December 31, | Year Ended December 31, | ||||||||||||||||||
|---|---|---|---|---|---|---|---|---|---|---|---|---|---|---|---|---|---|---|---|---|---|
| | | 2010 | 2009 | 2008 | 2011 | 2010 | 2009 | ||||||||||||||
| | | (In thousands) | (In thousands) | ||||||||||||||||||
Computed expected income tax benefit at Federal statutory rate | $ | 38,056 | $ | 6,003 | $ | 247,792 | |||||||||||||||
State tax benefit (expense), net of federal tax benefit | 7,500 | 770 | (2,840 | ) | |||||||||||||||||
Goodwill impairment | — | — | (264,935 | ) | |||||||||||||||||
Computed expected income tax (expense) benefit at Federal statutory rate | $ | (30,626 | ) | $ | 38,056 | $ | 6,003 | ||||||||||||||
State tax (expense) benefit, net of federal tax benefit | (6,464 | ) | 7,500 | 770 | |||||||||||||||||
Increase in cash surrender value of life insurance | Increase in cash surrender value of life insurance | 486 | 553 | 847 | 504 | 486 | 553 | ||||||||||||||
Tax credits | Tax credits | 523 | 690 | 727 | 556 | 523 | 690 | ||||||||||||||
Other, net | Other, net | 149 | (215 | ) | (1,680 | ) | (770 | ) | 149 | (215 | ) | ||||||||||
Recorded income tax (expense) benefit | $ | (36,800 | ) | $ | 46,714 | $ | 7,801 | ||||||||||||||
Recorded income tax benefit (expense) | $ | 46,714 | $ | 7,801 | $ | (20,089 | ) | ||||||||||||||
The Company had net income taxes receivable of $20.5$14.6 million and $20.4$20.5 million at December 31, 20102011 and 2009,2010, respectively, on its consolidated balance sheets.
PACWEST BANCORP AND SUBSIDIARIES
Notes to Consolidated Financial Statements (Continued)
NOTE 14—INCOME TAXES (Continued)
The Company had available at December 31, 2010,2011, approximately $28.6$1.1 million of unused Federal net operating loss carryforwards that may be applied against future taxable income through 2030. The Company had available at December 31, 2010,2011, approximately $83.2$90.7 million of unused state net operating loss carryforwards that may be applied against future taxable income through 2032. Utilization of the net operating loss and other carryforwards are subject to annual limitations set forth in Section 382 of the Internal Revenue Code.
PACWEST BANCORP AND SUBSIDIARIES
Notes to Consolidated Financial Statements (Continued)
NOTE 14—INCOME TAXES (Continued)
The following table presents the tax effects of temporary differences that give rise to significant portions of deferred tax assets and deferred tax liabilities as of the dates indicated:
| | | December 31, | December 31, | ||||||||||||||
|---|---|---|---|---|---|---|---|---|---|---|---|---|---|---|---|---|---|
| | | 2010 | 2009 | 2011 | 2010 | ||||||||||||
| | | (In thousands) | (In thousands) | ||||||||||||||
Deferred Tax Assets: | Deferred Tax Assets: | ||||||||||||||||
Book allowance for loan losses in excess of tax specific charge-offs | $ | 39,520 | $ | 43,757 | |||||||||||||
Interest on nonaccrual loans | 641 | 1,986 | |||||||||||||||
Deferred compensation | 3,999 | 4,216 | |||||||||||||||
Net operating losses | 6,467 | 15,890 | |||||||||||||||
Premises and equipment, principally due to differences in depreciation | 5,526 | 5,284 | |||||||||||||||
OREO valuation allowance | 9,689 | 8,949 | |||||||||||||||
Assets acquired in FDIC-assisted acquisition | 23,364 | 32,650 | |||||||||||||||
State tax benefit | 3,311 | — | |||||||||||||||
Accrued liabilities | 9,550 | 8,137 | |||||||||||||||
Other | 5,336 | 7,544 | |||||||||||||||
Goodwill | 4,764 | 5,991 | |||||||||||||||
Book allowance for loan losses in excess of tax specific charge-offs | $ | 29,184 | $ | 52,074 | |||||||||||||
Interest on nonaccrual loans | 1,986 | 3,298 | |||||||||||||||
Deferred compensation | 4,216 | 4,438 | |||||||||||||||
Net operating losses | 15,890 | 2,665 | |||||||||||||||
Premises and equipment, principally due to differences in depreciation | 5,284 | 5,460 | |||||||||||||||
OREO valuation allowance | 8,949 | 10,586 | |||||||||||||||
Assets acquired in FDIC-assisted acquisitions | 31,787 | 16,205 | |||||||||||||||
Unrealized loss on securities available-for-sale | — | 76 | |||||||||||||||
Accrued liabilities | 8,137 | 7,768 | |||||||||||||||
Other | 7,857 | 3,850 | |||||||||||||||
Goodwill | 21,426 | — | |||||||||||||||
Gross deferred tax assets | 134,716 | 106,420 | |||||||||||||||
Gross deferred tax assets | 112,167 | 134,404 | |||||||||||||||
Deferred Tax Liabilities: | Deferred Tax Liabilities: | ||||||||||||||||
Core deposit and customer relationship intangibles | 4,504 | 8,061 | |||||||||||||||
Deferred loan fees and costs | 76 | 154 | |||||||||||||||
Unrealized gain on securities available-for-sale | 16,513 | 2,885 | |||||||||||||||
FHLB stock and dividends | 7,709 | 7,709 | |||||||||||||||
Unrealized income from FDIC-assisted acquisition | 35,427 | 41,261 | |||||||||||||||
Core deposit and customer relationship intangibles | 8,061 | 12,606 | |||||||||||||||
Gross deferred tax liabilities | 64,229 | 60,070 | |||||||||||||||
Deferred loan fees and costs | 466 | 428 | |||||||||||||||
Total net deferred tax asset | $ | 47,938 | $ | 74,334 | |||||||||||||
Unrealized gain on securities available-for-sale | 2,885 | — | |||||||||||||||
FHLB stock and dividends | 7,709 | 4,925 | |||||||||||||||
Unrealized income from FDIC-assisted acquisition | 41,261 | 52,229 | |||||||||||||||
Gross deferred tax liabilities | 60,382 | 70,188 | |||||||||||||||
Total net deferred tax asset | $ | 74,334 | $ | 36,232 | |||||||||||||
Based upon our taxpaying history and estimates of taxable income over the years in which the items giving rise to the deferred tax assets are deductible, management believes it is more likely than not the Company will realize the benefits of these deductible differences.
We adopted the provisions of ASC Topic 740-10,740, "Accounting for Uncertainty in Income Taxes on January 1, 2007,," which clarifiesrelate to the accounting for uncertainty in income taxes recognized in an enterprise's financial statements.statements on January 1, 2007. ASC Topic 740-10740 prescribes a threshold and a measurement process for recognizing in the financial statements a tax position taken or expected to be taken in a tax return. ASC Topic 740 also provides guidance on derecognition, classification, interest and penalties, accounting in interim periods, disclosure and transition.
Our evaluation of tax positions was performed for those tax years which remain open to audit. As of December 31, 2011, all the federal returns filed since 2008 and state returns filed since 2007 are subject to adjustment upon audit.
PACWEST BANCORP AND SUBSIDIARIES
Notes to Consolidated Financial Statements (Continued)
NOTE 14—INCOME TAXES (Continued)
ASC Topic 740-10 also provides guidance on derecognition, classification, interest and penalties, accounting in interim periods, disclosure and transition. Upon adoption we determined that the reserve for uncertain tax positions already recorded was appropriate.
Our evaluation of tax positions was performed for those tax years which remain open to audit. As of December 31, 2010, all the federal returns filed since 2007 and state returns filed since 2006 are subject to adjustment upon audit.
The following table presents a reconciliation of unrecognized net tax benefit positions for the year ended December 31, 2010:2011:
| | Unrecognized Tax Benefit Positions | Unrecognized Tax Benefit Positions | ||||||
|---|---|---|---|---|---|---|---|---|
| | (In thousands) | (In thousands) | ||||||
Balance as of January 1, 2010 | $ | 2,069 | ||||||
Payments made | (774 | ) | ||||||
Balance as of December 31, 2010 | $ | 117 | ||||||
Reductions due to lapse of statutes of limitations | (1,178 | ) | (117 | ) | ||||
Balance as of December 31, 2010 | $ | 117 | ||||||
Balance as of December 31, 2011 | $ | — | ||||||
While it is expected that the amount of unrecognized tax benefits willmay change in the next twelve months, the Company does not expect this change to have a material impact on the results of operations or the financial position of the Company. We may from time to time be assessed interest or penalties by taxing authorities, although any such assessments historically have been minimal and immaterial to our financial results. In the event we are assessed for interest and/or penalties, such amounts will be classified in the financial statements as income tax expense.
PACWEST BANCORP AND SUBSIDIARIES
Notes to Consolidated Financial Statements (Continued)
NOTE 15—EARNINGS PER SHARE
The following table presents a summary of the calculation of basic and diluted net earnings (loss) per share for the years indicated:
| | Year Ended December 31, | |||||||||
|---|---|---|---|---|---|---|---|---|---|---|
| | 2011 | 2010 | 2009 | |||||||
| | (In thousands, except per share data) | |||||||||
Basic Earnings (Loss) Per Share: | ||||||||||
Net earnings (loss) | $ | 50,704 | $ | (62,016 | ) | $ | (9,350 | ) | ||
Less: earnings allocated to unvested restricted stock(1) | (2,072 | ) | (31 | ) | (245 | ) | ||||
Net earnings (loss) allocated to common shares | $ | 48,632 | $ | (62,047 | ) | $ | (9,595 | ) | ||
Weighted-average basic shares and unvested restricted stock outstanding | 37,141.5 | 36,438.7 | 33,114.9 | |||||||
Less: weighted-average unvested restricted stock outstanding | (1,650.7 | ) | (1,330.6 | ) | (1,216.2 | ) | ||||
Weighted-average basic shares outstanding | 35,490.8 | 35,108.1 | 31,898.7 | |||||||
Basic earnings (loss) per share | $ | 1.37 | $ | (1.77 | ) | $ | (0.30 | ) | ||
Diluted Earnings (Loss) Per Share: | ||||||||||
Net earnings (loss) allocated to common shares | $ | 48,632 | $ | (62,047 | ) | $ | (9,595 | ) | ||
Weighted-average basic shares outstanding | 35,490.8 | 35,108.1 | 31,898.7 | |||||||
Diluted earnings (loss) per share | $ | 1.37 | $ | (1.77 | ) | $ | (0.30 | ) | ||
| | Year Ended December 31, | |||||||||||
|---|---|---|---|---|---|---|---|---|---|---|---|---|
| | 2010 | 2009 | 2008 | |||||||||
| | (In thousands except per share data) | |||||||||||
Basic Loss Per Share: | ||||||||||||
Net loss | $ | (62,016 | ) | $ | (9,350 | ) | $ | (728,065 | ) | |||
Less: earnings allocated to unvested restricted stock(1) | (31 | ) | (245 | ) | (646 | ) | ||||||
Net loss allocated to common shares | $ | (62,047 | ) | $ | (9,595 | ) | $ | (728,711 | ) | |||
Weighted-average basic shares and unvested restricted stock outstanding | 36,438.7 | 33,114.9 | 28,203.3 | |||||||||
Less: weighted-average unvested restricted stock outstanding | (1,330.6 | ) | (1,216.2 | ) | (1,026.7 | ) | ||||||
Weighted-average basic shares outstanding | 35,108.1 | 31,898.7 | 27,176.6 | |||||||||
Basic loss per share | $ | (1.77 | ) | $ | (0.30 | ) | $ | (26.81 | ) | |||
Diluted Loss Per Share: | ||||||||||||
Net loss allocated to common shares | $ | (62,047 | ) | $ | (9,595 | ) | $ | (728,711 | ) | |||
Weighted-average basic shares outstanding(2) | 35,108.1 | 31,898.7 | 27,176.6 | |||||||||
Diluted loss per share | $ | (1.77 | ) | $ | (0.30 | ) | $ | (26.81 | ) | |||
On January 1, 2009, theEarnings per Share topic of the Codification under the section regardingSpecial Issues Affecting Basic and Diluted EPS (ASC 260-10-45) became effective for us. This pronouncement clarified that all outstanding unvested share-based payment awards that contain rights to nonforfeitable dividends are considered participating securities and are included in the two-class method of determining basic and diluted earnings per shares. All our unvested restricted stock participates with our common stockholders in dividends. Application of the new standard results in a reduction of net earnings available to common stockholders and lower earnings per share when compared to the previous requirements. Application of the new standard had no effect on the reported amounts of net (loss) earnings for 2008. The new standard's effect on the net diluted loss per share for 2008 was an increase of $0.02 to $26.81 from $26.79.
PACWEST BANCORP AND SUBSIDIARIES
Notes to Consolidated Financial Statements (Continued)
NOTE 16—STOCK COMPENSATION PLANS
The Company's 2003 Stock Incentive Plan, or the 2003 Plan, permits stock-based compensation awards to officers, directors, key employees and consultants. The 2003 Plan authorizes grants of stock-based compensation instruments to purchase or issue up to 5,000,000 shares of authorized but unissued Company common stock, subject to adjustments provided by the 2003 Plan. In May 2011, the Board of Directors approved the equity award of 13,740 common shares to non-employee directors of the Company. Such shares were granted outright and vested immediately with a charge to other noninterest expense of $300,000 at that time. As of December 31, 2010,2011, there were 1,176,427514,365 shares available for grant under the 2003 Plan.
Restricted Stock
The Company began awarding time-based and performance-based restricted stock in 2003. The grantsfollowing table presents a summary of restricted stock awards replacedtransactions for the practiceyears indicated:
| | Number of Shares | Weighted Average Fair Value on Award Date | |||||
|---|---|---|---|---|---|---|---|
Unvested restricted stock, December 31, 2009 | 1,095,417 | $ | 42.86 | ||||
Awarded | 443,050 | 19.99 | |||||
Shares issued by the Company upon vesting | (268,568 | ) | 36.78 | ||||
Forfeited | (39,317 | ) | 45.82 | ||||
Unvested restricted stock, December 31, 2010 | 1,230,582 | 35.86 | |||||
Awarded | 692,900 | 20.50 | |||||
Shares issued by the Company upon vesting | (203,174 | ) | 30.13 | ||||
Forfeited | (44,578 | ) | 23.56 | ||||
Unvested restricted stock, December 31, 2011 | 1,675,730 | $ | 30.53 | ||||
At December 31, 2011, there were outstanding 825,730 shares of grantingunvested time-based restricted common stock options.and 850,000 shares of unvested performance-based restricted common stock. The awarded shares of time-based restricted common stock vest over a service period of three to five years from the date of the grant. The awarded shares of performance-based restricted common stock vest in full or in part on the date the Compensation, Nominating and Governance, or CNG, Committee of the Board of Directors, as Administrator of the 2003 Plan, determines that the Company achieved certain financial goals established by the CNG Committee as set forth in the grantaward documents. Both time-based and performance-based restricted common stock vest immediately upon a change in control of the Company as defined in the 2003 Plan and upon death of the employee.
The following table presents a summaryIn March 2011, the CNG awarded 350,000 shares of performance-based restricted common stock, which will expire on March 31, 2016 if the net earnings performance target established for such awards is not met. Such restricted stock transactionswill vest upon a change in control, however, as defined in the 2003 Plan. We have determined that it is not probable at the present time that the net earnings performance target will be achieved. Accordingly, no expense is being recognized for these shares.
Compensation expense related to time-based restricted stock awards is based on the fair value of the underlying stock on the award date and is recognized over the vesting period using the straight-line method. Restricted stock amortization totaled $7.6 million, $8.5 million, and $8.2 million for the years indicated:
| | Number of Shares | Weighted Average Fair Value on Award Date | ||||||
|---|---|---|---|---|---|---|---|---|
Unvested restricted stock, December 31, 2008 | 1,309,586 | $ | 43.01 | |||||
Awarded | 57,812 | 15.88 | ||||||
Shares issued by the Company upon vesting | (244,689 | ) | 37.59 | |||||
Forfeited | (27,292 | ) | 40.37 | |||||
Unvested restricted stock, December 31, 2009 | 1,095,417 | 42.86 | ||||||
Awarded | 443,050 | 19.99 | ||||||
Shares issued by the Company upon vesting | (268,568 | ) | 36.78 | |||||
Forfeited | (39,317 | ) | 45.82 | |||||
Unvested restricted stock, December 31, 2010 | 1,230,582 | $ | 35.86 | |||||
At
PACWEST BANCORP AND SUBSIDIARIES
Notes to Consolidated Financial Statements (Continued)
NOTE 16—STOCK COMPENSATION PLANS (Continued)
ended December 31, 2011, 2010, there were 730,582 sharesand 2009, respectively. Such amounts are included in compensation expense on the accompanying consolidated statements of earnings (loss). As of December 31, 2011, total unrecognized compensation cost related to unvested time-based restricted stock and 500,000 shareswas $11.4 million. This cost is expected to be recognized over a weighted average period of unvested performance-based restricted stock. In 2007 we determined that attainment of the financial targets related to the 2006 and 2007 awards of1.6 years.
Currently no compensation expense is being recognized for any performance-based restricted stock within their remaining vesting horizons was less than probable and we suspended amortization ofawards as management has concluded that it is improbable that the expense related to these awards. During the fourth quarter of 2008 we further determined that attainment of therespective financial targets related to suchfor any outstanding performance-based restricted stock within their remaining vesting horizons was improbable and we reversed the amounts previously expensed related to these awards of $4.5 million.will be met. If and when the attainment of such financial targets is deemed probable in future periods, a catch-up adjustment will be recorded and amortization of such performance-based restricted stock will begin again. The total amount of unrecognized compensation expense related to theall performance-based restricted stock for which amortization was suspended and reversedor has not commenced totaled $26.6$33.8 million at December 31, 2010. The remaining amount of2011 as presented in the time-based restricted stockfollowing table:
| | December 31, 2011 | |||||||||
|---|---|---|---|---|---|---|---|---|---|---|
| | Number of Shares Outstanding | Total Unrecognized Compensation Expense | Expiration Year of Award | |||||||
| | (Dollars in thousands) | |||||||||
Performance-based restricted stock awarded in: | ||||||||||
2006 | 275,000 | $ | 14,924 | 2013 | ||||||
2007 | 205,000 | 11,259 | 2017 | |||||||
2008 | 20,000 | 453 | 2013 | |||||||
2011 | 350,000 | 7,161 | 2016 | |||||||
Outstanding performance-based restricted stock awards | 850,000 | $ | 33,797 | |||||||
PACWEST BANCORP AND SUBSIDIARIES
Notes to Consolidated Financial Statements (Continued)
NOTE 16—STOCK COMPENSATION PLANS (Continued)
amortization related to the unvested awards totaled $13.3 million as of December 31, 2010 and will be recognized over the weighted average remaining contractual life of 1.7 years. The unvested performance-based restricted stock awarded in 2006 and 2008 expires in 2013. The unvested performance-based restricted stock awarded in 2007 expires in 2017.
Restricted stock amortization totaled $8.5 million, $8.2 million, and $930,000 for the years ended December 31, 2010, 2009, and 2008, respectively, and is included in compensation expense in the accompanying consolidated statements of earnings.
The following table summarizes information about outstanding time-based and performance-based restricted stock awards at December 31, 2010:2011:
| | At Award Date | Vested | Forfeited | Outstanding at December 31, 2011 | |||||||||||||||||||||||||||
|---|---|---|---|---|---|---|---|---|---|---|---|---|---|---|---|---|---|---|---|---|---|---|---|---|---|---|---|---|---|---|---|
| | Number of Shares Awarded | Weighted Average Fair Value | Number of Shares Vested | Weighted Average Fair Value on Award Date | Number of Shares Forfeited | Weighted Average Fair Value on Award Date | Number of Shares Outstanding | Weighted Average Fair Value on Award Date | Weighted Average Fair Value(1) (000) | Weighted Average Remaining Contractual Life (Years) | |||||||||||||||||||||
Time-based restricted stock awarded in: | |||||||||||||||||||||||||||||||
2008 | 577,730 | $ | 29.52 | 481,060 | $ | 28.91 | 32,876 | $ | 31.37 | 63,794 | $ | 33.14 | $ | 1,209 | 0.6 | ||||||||||||||||
2009 | 57,812 | $ | 15.88 | 36,376 | $ | 15.79 | — | $ | — | 21,436 | $ | 16.03 | 406 | 0.9 | |||||||||||||||||
2010 | 443,050 | $ | 19.99 | — | $ | — | 20,000 | $ | 22.24 | 423,050 | $ | 19.88 | 8,017 | 1.2 | |||||||||||||||||
2011 | 342,900 | $ | 20.54 | — | $ | — | 25,450 | $ | 21.76 | 317,450 | $ | 20.44 | 6,016 | 2.3 | |||||||||||||||||
Outstanding time-based restricted stock awards | 1,421,492 | 517,436 | 78,326 | 825,730 | 15,648 | 1.6 | |||||||||||||||||||||||||
Performance-based stock awarded in: | |||||||||||||||||||||||||||||||
2006 | 315,000 | $ | 54.27 | — | $ | — | 40,000 | $ | 54.21 | 275,000 | $ | 54.27 | 5,211 | 1.2 | |||||||||||||||||
2007 | 205,000 | $ | 54.92 | — | $ | — | — | $ | — | 205,000 | $ | 54.92 | 3,885 | 5.1 | |||||||||||||||||
2008 | 20,000 | $ | 22.66 | — | $ | — | — | $ | — | 20,000 | $ | 22.66 | 379 | 1.2 | |||||||||||||||||
2011 | 350,000 | $ | 20.46 | — | $ | — | — | $ | — | 350,000 | $ | 20.46 | 6,632 | 4.2 | |||||||||||||||||
Outstanding performance-based restricted stock awards | 890,000 | — | 40,000 | 850,000 | 16,107 | 3.4 | |||||||||||||||||||||||||
Total awards | 2,311,492 | 517,436 | 118,326 | 1,675,730 | $ | 31,755 | 2.5 | ||||||||||||||||||||||||
| | At Award Date | Vested | Forfeited | Outstanding at December 31, 2010 | ||||||||||||||||||||||||||||
|---|---|---|---|---|---|---|---|---|---|---|---|---|---|---|---|---|---|---|---|---|---|---|---|---|---|---|---|---|---|---|---|---|
| | Number of Shares Awarded | Weighted Average Fair Value | Number of Shares Vested | Weighted Average Fair Value on Award Date | Number of Shares Forfeited | Weighted Average Fair Value on Award Date | Number of Shares Outstanding | Weighted Average Fair Value on Award Date | Weighted Average Fair Value(1) | Weighted Average Remaining Contractual Life | ||||||||||||||||||||||
| | (Dollars in thousands) | |||||||||||||||||||||||||||||||
Time-based restricted stock awarded in: | ||||||||||||||||||||||||||||||||
2007 | 96,800 | $ | 51.08 | 51,809 | $ | 50.82 | 20,133 | $ | 52.12 | 24,858 | $ | 50.78 | 531,464 | 0.7 | ||||||||||||||||||
2008 | 577,730 | $ | 29.52 | 320,849 | $ | 29.00 | 29,914 | $ | 31.05 | 226,967 | $ | 30.04 | 4,852,554 | 1.0 | ||||||||||||||||||
2009 | 57,812 | $ | 15.88 | 17,105 | $ | 15.69 | — | $ | — | 40,707 | $ | 15.96 | 870,316 | 1.4 | ||||||||||||||||||
2010 | 443,050 | $ | 19.99 | — | $ | — | 5,000 | $ | 19.94 | 438,050 | $ | 19.99 | 9,365,509 | 2.2 | ||||||||||||||||||
Outstanding time-based restricted stock awards | 1,175,392 | 389,763 | 55,047 | 730,582 | 15,619,843 | 1.7 | ||||||||||||||||||||||||||
Performance-based stock awarded in: | ||||||||||||||||||||||||||||||||
2006 | 315,000 | $ | 54.27 | — | $ | — | 40,000 | $ | 54.21 | 275,000 | $ | 54.27 | 5,879,500 | 2.3 | ||||||||||||||||||
2007 | 205,000 | $ | 54.92 | — | $ | — | — | $ | — | 205,000 | $ | 54.92 | 4,382,900 | 6.1 | ||||||||||||||||||
2008 | 20,000 | $ | 22.66 | — | $ | — | — | $ | — | 20,000 | $ | 22.66 | 427,600 | 2.3 | ||||||||||||||||||
Outstanding performance- based restricted stock awards | 540,000 | — | 40,000 | 500,000 | 10,690,000 | 3.9 | ||||||||||||||||||||||||||
Total awards | 1,715,392 | 389,763 | 95,047 | 1,230,582 | $ | 26,309,843 | 2.6 | |||||||||||||||||||||||||
Stock Options
There were no outstanding stock options at December 31, 2010 and 2009.
PACWEST BANCORP AND SUBSIDIARIES
Notes to Consolidated Financial Statements (Continued)
NOTE 17—BENEFIT PLANS
Directors Deferred Compensation Plan
The Company had a deferred compensation plan, or the DDCP, in which some of the Company's directors and executive officers participated. The DDCP was administered by an administrative committee, which consists of certain non-director executive officers of the Company. The DDCP allowed participants to defer payment of all or a portion of their directors' fees, in the case of outside directors, or base salary, bonus or other compensation, including restricted stock awards, in the case of employee participants, for the next succeeding calendar year. Participation in the DDCP was voluntary and participants could not change their investment elections once made. Participants could elect to have their contributions used to purchase Company common stock. In December 2008 the Company elected to terminate the DDCP and in January 2009 all participants in the DDCP received distributions of amounts previously deferred, including 184,395 shares of Company common stock, and the DDCP was terminated.
401(K) Plans
The Company sponsors a defined contribution plan for the benefit of its employees. Participants are eligible to participate immediately as long as they work a minimum of 1,000 hours and are at least 21 years of age. Eligible participants may contribute up to 60% of their annual compensation, not to exceed the dollar limit imposed by the Internal Revenue Code. Employer contributions are determined annually by the Board of Directors in accordance with plan requirements and made on an annual basis. The Company may match 25% up to the first 6% of annual compensation, not to exceed the dollar limit set by theapplicable tax code.
Expense related to 401(k) contributions was $433,000, $498,000, $430,000, and $1.0 million$430,000 for the years ended December 31, 2011, 2010, 2009, and 2008,2009, respectively.
NOTE 18—STOCKHOLDERS' EQUITY
On December 22, 2009, we filed a registration statement with the SEC to offer to sell, from time to time, shares of common stock, preferred stock, and other equity linked securities for an aggregate
PACWEST BANCORP AND SUBSIDIARIES
Notes to Consolidated Financial Statements (Continued)
NOTE 18—STOCKHOLDERS' EQUITY (Continued)
initial offering price of up to $350 million. This registration statement was declared effective on January 8, 2010. Proceeds from any offering under this registration statement are anticipated to be used to fund future acquisitions of banks and other financial institutionsservices companies and for general corporate purposes.
On August 25, 2009, PacWest Bancorp sold in a direct placement to institutional investors 2.7 million shares of common stock for $50 million, or a per share price of $18.36, which was the closing price of PacWest's common stock on Monday, August 24, 2009. In addition to the issuance of the common shares, PacWest issued to each investor two warrants exercisable for common shares worth up to an additional $50 million in the aggregate with an exercise price of $20.20 per share, or 110% of the price per share at which the initial $50 million was sold. The Series A warrants had a six month term and originally expired on March 1, 2010; such warrants were exercised on March 1, 2010 for a total of $27.2 million in cash and we issued 1,348,040 shares of common stock. The net proceeds from the warrant exercises totaled $26.6 million after expenses. The 1,361,657 Series B warrants issued in August 2009 with a strike price of $20.20 expired in August 2010 without being exercised. The common shares were sold and the warrants were issued under our $150 million shelf registration statement, which became effective in June 2009, but was subsequently terminated upon the effectiveeffectiveness declaration of our $350 million shelf registration statement on January 8, 2010.
PACWEST BANCORP AND SUBSIDIARIES
Notes to Consolidated Financial Statements (Continued)
NOTE 18—STOCKHOLDERS' EQUITY (Continued)
On January 14, 2009, we issued in a private placement to CapGen Capital Group II LP 3,846,153 PacWest common shares at $26 per share for total cash consideration of approximately $100 million. CapGen Capital Group II LP has registered as a bank holding company and as a result of the investment it owned approximately 11% of PacWest outstanding common stock, excluding unvested restricted stock, as of December 31, 2010.2011.
Subsequent toAs a Delaware corporation, the May 2008 change of our state of incorporation to Delaware, the Company now records treasury shares for shares surrendered to the Company resulting from statutory payroll tax obligations arising from the vesting of restricted stock. During 2011, the Company purchased 80,173 treasury shares at a weighted average price of $18.27 per share. During 2010, the Company purchased 94,666 treasury shares at a weighted average price of $19.34 per share. During 2009, the Company purchased 100,770 treasury shares at a weighted average price of $17.62 per share. During 2008, the Company purchased 12,360 treasury shares at a weighted average price of $20.78 per share.
NOTE 19—DIVIDEND AVAILABILITY AND REGULATORY MATTERS
Holders of Company common stock are entitled to receive dividends declared by the Board of Directors out of funds legally available under state law governing the Company and certain federal laws and regulations governing the banking and financial services business. Our ability to pay dividends to our stockholders is subject to the restrictions set forth in Delaware General Corporation Law and certain covenants contained in the indentures governing trust preferred securities issued by us or entities that we have acquired. Notification to the Federal Reserve Bank ("FRB") is also required prior to our declaring and paying dividends on common stock during any period in which our quarterly net earnings is insufficient to fund the dividend amount. In such circumstances, we may not pay a dividend shouldShould the FRB object to payment of dividends on common stock, we would not be able to make the payment until such time asapproval is received or we receive approval from the FRB or no longer need to provide notice under applicable regulations.
It is possible, depending upon the financial condition of the Bank, and other factors, that the FRB, the FDIC or the California Department of Financial Institutions ("DFI"), could assert that payment of dividends or other payments is an unsafe or unsound practice. Pacific Western is subject to restrictions
PACWEST BANCORP AND SUBSIDIARIES
Notes to Consolidated Financial Statements (Continued)
NOTE 19—DIVIDEND AVAILABILITY AND REGULATORY MATTERS (Continued)
under certain federal and state laws and regulations governing banks which limit its ability to transfer funds to the holding company through intercompany loans, advances or cash dividends. Dividends paid by state banks such as Pacific Western are regulated by the DFI under its general supervisory authority as it relates to a bank's capital requirements. A state bank may declare a dividend without the approval of the DFI as long as the total dividends declared in a calendar year do not exceed either the retained earnings or the total of net earnings for three previous fiscal years less any dividend paid during such period. During 2008,2011, PacWest received $25.5 million in dividends of $106.0 million from the Bank. For the foreseeable future, further dividends from the Bank to the Company will require DFI approval.
PacWest, as a bank holding company, is subject to regulation by the Board of Governors of the Federal Reserve System under the Bank Holding Company Act of 1956, as amended. The Federal Deposit Insurance Corporation Improvement Act of 1991 required that the federal regulatory agencies adopt regulations defining capital tiers for banks: well capitalized, adequately capitalized, undercapitalized, significantly undercapitalized and critically undercapitalized. Failure to meet minimum capital requirements can initiate certain mandatory and possibly additional discretionary actions by regulators that, if undertaken, could have a direct material effect on the Company's consolidated financial statements. Under capital adequacy guidelines and the regulatory framework for prompt corrective action, the Company and the Bank must meet specific capital guidelines that involve
PACWEST BANCORP AND SUBSIDIARIES
Notes to Consolidated Financial Statements (Continued)
NOTE 19—DIVIDEND AVAILABILITY AND REGULATORY MATTERS (Continued)
quantitative measures of the Company's and the Bank's assets, liabilities and certain off-balance sheet items as calculated under regulatory accounting practices. The capital amounts and classification are also subject to qualitative judgments by the regulators about components, risk weightings and other factors.
Quantitative measures established by regulation to ensure capital adequacy require the Company and the Bank to maintain minimum amounts and ratios of total and Tier I capital to risk-weighted assets, and of Tier I capital to average assets ("leverage ratio"). Tier 1 Capital includes common stockholders' equity, trust preferred securities, less goodwill and certain other deductions (including a portion of servicing assets and the unrealized net gains and losses, after taxes on securities available for sale). Total risk-based capital includes Tier 1 capital and other items such as subordinated debt and the allowance for credit losses. Both measures are stated as a percentage of risk-weighted assets, which are measured based on their perceived credit risk and include certain off-balancesoff-balance sheet exposures, such as unfunded loan commitments and letters of credit. The Company is also subject to a leverage ratio requirement, a non risk-based asset ratio, which is defined as Tier 1 Capital as a percentage of average assets, adjusted for goodwill and other non-qualifying intangibles and other assets.
Bank holding companies considered to be "adequately capitalized" are required to maintain a minimum total risk-based capital ratio of 8% of which at least 4.0% must be Tier 1 capital and a minimum leverage ratio of 4.0%. Bank holding companies considered to be "well capitalized" must maintain a minimum risk-based capital ratio of 10.0% of which at least 6.0% must be Tier 1 capital and a minimum leverage ratio of 5%. As of December 31, 2010,2011, the most recent notification date to the regulatory agencies, the Company and the Bank are each "well capitalized" under the regulatory framework for prompt corrective action. There are no conditions or events since that notification that management believes have changed the Company's or any of the Bank's categories.
Management believes, as of December 31, 2010,2011, that we have met all capital adequacy requirements to which we are subject.
PACWEST BANCORP AND SUBSIDIARIES
Notes to Consolidated Financial Statements (Continued)
NOTE 19—DIVIDEND AVAILABILITY AND REGULATORY MATTERS (Continued)
Actual capital amounts and ratios for the Company and the Bank as of December 31, 2010 and 2009 are presented in the following table. Regulatory capital requirements limit the amount of deferred tax assets that may be included when determining the amount of regulatory capital. Deferred tax asset amounts in excess of the calculated limit are deducted from regulatory capital. At December 31, 2010,2011, such amount was $51.0 million.$27.4 million for the Company and $21.9 million for the Bank. No assurance can be given that the regulatory capital deferred tax asset limitation will not increase in the future. There was no limitation onThe following table presents actual capital amounts and ratios for the Bank's regulatory capital due to deferred tax assets.Company and the Bank as of the dates indicated:
| | | | Well Capitalized Minimum Requirement | | ||||||||||||||
|---|---|---|---|---|---|---|---|---|---|---|---|---|---|---|---|---|---|---|
| | Actual | | ||||||||||||||||
| | Excess Capital Amount | |||||||||||||||||
| | Amount | Ratio | Amount | Ratio | ||||||||||||||
| | (Dollars in thousands) | |||||||||||||||||
December 31, 2010 | ||||||||||||||||||
Tier I capital (to average assets): | ||||||||||||||||||
PacWest Bancorp Consolidated | $ | 481,066 | 8.54 | % | $ | 281,713 | 5.00 | % | $ | 199,353 | ||||||||
Pacific Western Bank | 480,710 | 8.51 | 282,602 | 5.00 | 198,108 | |||||||||||||
Tier I capital (to risk-weighted assets): | ||||||||||||||||||
PacWest Bancorp Consolidated | 481,066 | 12.68 | 227,578 | 6.00 | 253,488 | |||||||||||||
Pacific Western Bank | 480,710 | 12.71 | 226,873 | 6.00 | 253,837 | |||||||||||||
Total capital (to risk-weighted assets): | ||||||||||||||||||
PacWest Bancorp Consolidated | 529,591 | 13.96 | 379,297 | 10.00 | 150,294 | |||||||||||||
Pacific Western Bank | 529,090 | 13.99 | 378,121 | 10.00 | 150,969 | |||||||||||||
December 31, 2009 | ||||||||||||||||||
Tier I capital (to average assets): | ||||||||||||||||||
PacWest Bancorp Consolidated | $ | 597,014 | 10.85 | % | $ | 275,015 | 5.00 | % | $ | 321,999 | ||||||||
Pacific Western Bank | 563,431 | 10.23 | 275,338 | 5.00 | 288,093 | |||||||||||||
Tier I capital (to risk-weighted assets): | ||||||||||||||||||
PacWest Bancorp Consolidated | 597,014 | 14.31 | 250,398 | 6.00 | 346,616 | |||||||||||||
Pacific Western Bank | 563,431 | 13.52 | 250,002 | 6.00 | 313,429 | |||||||||||||
Total capital (to risk-weighted assets): | ||||||||||||||||||
PacWest Bancorp Consolidated | 650,293 | 15.58 | 417,330 | 10.00 | 232,963 | |||||||||||||
Pacific Western Bank | 616,628 | 14.80 | 416,669 | 10.00 | 199,959 | |||||||||||||
| | | | Well Capitalized Minimum Requirement | | ||||||||||||
|---|---|---|---|---|---|---|---|---|---|---|---|---|---|---|---|---|
| | Actual | | ||||||||||||||
| | Excess Capital Amount | |||||||||||||||
| | Amount | Ratio | Amount | Ratio | ||||||||||||
| | (Dollars in thousands) | |||||||||||||||
December 31, 2011: | ||||||||||||||||
Tier I capital (to average assets): | ||||||||||||||||
PacWest Bancorp Consolidated | $ | 566,908 | 10.42 | % | $ | 272,142 | 5.00 | % | $ | 294,766 | ||||||
Pacific Western Bank | 528,782 | 9.73 | 271,721 | 5.00 | 257,061 | |||||||||||
Tier I capital (to risk-weighted assets): | ||||||||||||||||
PacWest Bancorp Consolidated | 566,908 | 15.97 | 213,022 | 6.00 | 353,886 | |||||||||||
Pacific Western Bank | 528,782 | 14.95 | 212,269 | 6.00 | 316,513 | |||||||||||
Total capital (to risk-weighted assets): | ||||||||||||||||
PacWest Bancorp Consolidated | 612,284 | 17.25 | 355,037 | 10.00 | 257,247 | |||||||||||
Pacific Western Bank | 574,003 | 16.22 | 353,781 | 10.00 | 220,222 | |||||||||||
December 31, 2010: | ||||||||||||||||
Tier I capital (to average assets): | ||||||||||||||||
PacWest Bancorp Consolidated | $ | 481,066 | 8.54 | % | $ | 281,713 | 5.00 | % | $ | 199,353 | ||||||
Pacific Western Bank | 480,710 | 8.51 | 282,602 | 5.00 | 198,108 | |||||||||||
Tier I capital (to risk-weighted assets): | ||||||||||||||||
PacWest Bancorp Consolidated | 481,066 | 12.68 | 227,578 | 6.00 | 253,488 | |||||||||||
Pacific Western Bank | 480,710 | 12.71 | 226,873 | 6.00 | 253,837 | |||||||||||
Total capital (to risk-weighted assets): | ||||||||||||||||
PacWest Bancorp Consolidated | 529,591 | 13.96 | 379,297 | 10.00 | 150,294 | |||||||||||
Pacific Western Bank | 529,090 | 13.99 | 378,121 | 10.00 | 150,969 | |||||||||||
PACWEST BANCORP AND SUBSIDIARIES
Notes to Consolidated Financial Statements (Continued)
NOTE 19—DIVIDEND AVAILABILITY AND REGULATORY MATTERS (Continued)
We have The Company issued subordinated debentures to trusts that were established by us or entities we have acquired, which, in turn, issued trust preferred securities, which totaled $129.6 million and $129.8$123.0 million at December 31, 2010 and 2009, respectively. These securities are currently included in our Tier I capital for purposes of determining the Company's Tier I and total risk-based capital ratios.2011. The Board of Governors of the Federal Reserve System, which is the holding company's banking regulator, has promulgated a modification of the capital regulations affecting trust preferred securities. Although this modification was scheduled to be effective on March 31, 2009, the Federal Reserve postponed the effective date to March 31, 2011. At that time, the Company will be allowed to includeincludes in Tier I1 capital an amount of trust preferred securities equal to no more than 25% of the sum of all core capital elements, which is generally defined as shareholders' equity less goodwill, net of any related deferred income tax liability. The regulations currently in effect throughAt December 31, 2010, limit2011, the amount of trust preferred securities that can be included in Tier I capital to 25% ofwas $123.0 million. While our existing trust preferred securities are grandfathered under the sum of core capital elements without a deductionDodd-Frank Wall Street Reform and Consumer Protection Act that was enacted in July 2010, new issuances will not qualify as Tier 1 capital. See Note 11,Borrowings and Subordinated Debentures, and Note 23,Subsequent Events, for goodwill. We have determined that our Tier I capital ratios would remain aboveinformation regarding the well-capitalized level had the modification of the capital regulations been in effect at December 31, 2010. We expect that our Tier I capital ratios will be at or above the existing well-capitalized levelsredemption on March 31, 2011, the first date on which the modified capital regulations must be applied.7 and 8, 2012 of certain of our subordinated debentures.
Interest payments made by the Company to subordinated debentures are considered dividend payments by the Federal Reserve Bank. As such, notification to the Federal Reserve Bank is required prior to our intent to pay such dividendsinterest during any period in which our quarterly net earnings are not sufficient to fund the dividendinterest due. Should the FRB object to payment of interest on the subordinated debentures we would not be able to make the payments until approval is received or we no longer need to provide notice under applicable regulations.
PACWEST BANCORP AND SUBSIDIARIES
Notes to Consolidated Financial Statements (Continued)
NOTE 20—CONDENSED FINANCIAL INFORMATION OF PARENT COMPANY
The parent company only condensed balance sheets as of December 31, 20102011 and 20092010 and the related condensed statements of net lossearnings (loss) and condensed statements of cash flows for each of the years in the three-year period ended December 31, 20102011 are presented below:
| | December 31, | ||||||||
|---|---|---|---|---|---|---|---|---|---|
Parent Company Only Condensed Balance Sheets | 2010 | 2009 | |||||||
| | (In thousands) | ||||||||
Assets: | |||||||||
Cash and due from banks | $ | 24,141 | $ | 44,037 | |||||
Investments in subsidiaries | 570,118 | 585,940 | |||||||
Other assets | 15,421 | 10,328 | |||||||
Total assets | $ | 609,680 | $ | 640,305 | |||||
Liabilities: | |||||||||
Subordinated debentures | $ | 129,572 | $ | 129,798 | |||||
Other liabilities | 1,311 | 3,734 | |||||||
Total liabilities | 130,883 | 133,532 | |||||||
Stockholders' equity | 478,797 | 506,773 | |||||||
Total liabilities and stockholders' equity | $ | 609,680 | $ | 640,305 | |||||
| | Year Ended December 31, | ||||||||||
|---|---|---|---|---|---|---|---|---|---|---|---|
Parent Company Only Condensed Statements of Net Loss | 2010 | 2009 | 2008 | ||||||||
| | (In thousands) | ||||||||||
Miscellaneous income | $ | 174 | $ | 197 | $ | 273 | |||||
Dividends from subsidiaries | — | — | 106,000 | ||||||||
Total income | 174 | 197 | 106,273 | ||||||||
Interest expense | 5,594 | 6,448 | 8,905 | ||||||||
Operating expenses | 9,665 | 17,026 | 13,552 | ||||||||
Total expenses | 15,259 | 23,474 | 22,457 | ||||||||
Earnings (loss) before income taxes and equity in undistributed earnings of subsidiaries | (15,085 | ) | (23,277 | ) | 83,816 | ||||||
Income tax benefit | (6,356 | ) | (8,623 | ) | (9,286 | ) | |||||
Earnings (loss) before equity in undistributed earnings (losses) of subsidiaries | (8,729 | ) | (14,654 | ) | 93,102 | ||||||
Equity in undistributed earnings (losses) of subsidiaries | (53,287 | ) | 5,304 | (821,167 | ) | ||||||
Net loss | $ | (62,016 | ) | $ | (9,350 | ) | $ | (728,065 | ) | ||
| | December 31, | ||||||
|---|---|---|---|---|---|---|---|
Parent Company Only Condensed Balance Sheets | 2011 | 2010 | |||||
| | (In thousands) | ||||||
Assets: | |||||||
Cash and due from banks | $ | 35,900 | $ | 24,141 | |||
Investments in subsidiaries | 625,494 | 570,118 | |||||
Other assets | 22,455 | 15,421 | |||||
Total assets | $ | 683,849 | $ | 609,680 | |||
Liabilities: | |||||||
Subordinated debentures | $ | 129,271 | $ | 129,572 | |||
Other liabilities | 8,375 | 1,311 | |||||
Total liabilities | 137,646 | 130,883 | |||||
Stockholders' equity | 546,203 | 478,797 | |||||
Total liabilities and stockholders' equity | $ | 683,849 | $ | 609,680 | |||
PACWEST BANCORP AND SUBSIDIARIES
Notes to Consolidated Financial Statements (Continued)
NOTE 20—CONDENSED FINANCIAL INFORMATION OF PARENT COMPANY (Continued)
| | Year Ended December 31, | ||||||||||||
|---|---|---|---|---|---|---|---|---|---|---|---|---|---|
Parent Company Only Condensed Statements of Cash Flows | 2010 | 2009 | 2008 | ||||||||||
| | (In thousands) | ||||||||||||
Cash flows from operating activities: | |||||||||||||
Net loss | $ | (62,016 | ) | $ | (9,350 | ) | $ | (728,065 | ) | ||||
Adjustments to reconcile net loss to net cash provided by operating activities: | |||||||||||||
Change in other assets | (5,093 | ) | (600 | ) | (930 | ) | |||||||
Change in liabilities | (2,650 | ) | (4,379 | ) | 4,889 | ||||||||
Amortization of unearned compensation related to stock awards | 4,174 | 4,555 | (2,138 | ) | |||||||||
Distributed (undistributed) earnings of subsidiaries | 53,287 | (5,304 | ) | 821,167 | |||||||||
Net cash (used in) provided by operating activities | (12,298 | ) | (15,078 | ) | 94,923 | ||||||||
Cash flows from investing activities: | |||||||||||||
Net (increase) decrease in investment in subsidiaries | (30,000 | ) | (83,690 | ) | 844 | ||||||||
Net cash provided by (used in) investing activities | (30,000 | ) | (83,690 | ) | 844 | ||||||||
Cash flows from financing activities: | |||||||||||||
Net surrenders from exercise and vesting of stock awards | — | — | (258 | ) | |||||||||
Tax effect included in stockholders' equity of stock option exercises and restricted stock vesting | (909 | ) | (2,108 | ) | (466 | ) | |||||||
Cash dividends paid | (1,445 | ) | (11,145 | ) | (35,438 | ) | |||||||
Redemptions of subordinated debentures | — | — | (8,248 | ) | |||||||||
Net decrease in borrowings | — | — | (45,000 | ) | |||||||||
Common stock issuances (repurchases), net | 24,756 | 147,007 | (257 | ) | |||||||||
Net cash provided by (used in) financing activities | 22,402 | 133,754 | (89,667 | ) | |||||||||
Net (decrease) increase in cash and cash equivalents | (19,896 | ) | 34,986 | 6,100 | |||||||||
Cash, beginning of the period | 44,037 | 9,051 | 2,951 | ||||||||||
Cash, end of the period | $ | 24,141 | $ | 44,037 | $ | 9,051 | |||||||
| | Year Ended December 31, | |||||||||
|---|---|---|---|---|---|---|---|---|---|---|
Parent Company Only Condensed Statements of Earnings (Loss) | 2011 | 2010 | 2009 | |||||||
| | (In thousands) | |||||||||
Miscellaneous income | $ | 157 | $ | 174 | $ | 197 | ||||
Dividends from Bank subsidiary | 25,500 | — | — | |||||||
Total income | 25,657 | 174 | 197 | |||||||
Interest expense | 4,923 | 5,594 | 6,448 | |||||||
Operating expenses | 8,255 | 9,665 | 17,026 | |||||||
Total expenses | 13,178 | 15,259 | 23,474 | |||||||
Earnings (loss) before income taxes and equity in undistributed earnings of subsidiaries | 12,479 | (15,085 | ) | (23,277 | ) | |||||
Income tax benefit | 5,671 | 6,356 | 8,623 | |||||||
Earnings (loss) before equity in undistributed earnings (losses) of subsidiaries | 18,150 | (8,729 | ) | (14,654 | ) | |||||
Equity in undistributed earnings (losses) of subsidiaries | 32,554 | (53,287 | ) | 5,304 | ||||||
Net earnings (loss) | $ | 50,704 | $ | (62,016 | ) | $ | (9,350 | ) | ||
| | Year Ended December 31, | |||||||||
|---|---|---|---|---|---|---|---|---|---|---|
Parent Company Only Condensed Statements of Cash Flows | 2011 | 2010 | 2009 | |||||||
| | (In thousands) | |||||||||
Cash flows from operating activities: | ||||||||||
Net earnings (loss) | $ | 50,704 | $ | (62,016 | ) | $ | (9,350 | ) | ||
Adjustments to reconcile net earnings (loss) to net cash provided by (used in) operating activities: | ||||||||||
Change in other assets | (4,533 | ) | (6,002 | ) | (2,708 | ) | ||||
Change in liabilities | 6,262 | (2,650 | ) | (4,379 | ) | |||||
Tax effect in stockholders' equity of restricted stock vesting | 501 | 909 | 2,108 | |||||||
Earned stock compensation | 3,551 | 4,174 | 4,555 | |||||||
Equity in undistributed (earnings) losses of subsidiaries | (32,554 | ) | 53,287 | (5,304 | ) | |||||
Net cash provided by (used in) operating activities | 23,931 | (12,298 | ) | (15,078 | ) | |||||
Cash flows from investing activities: | ||||||||||
Purchases of securities available-for-sale | (2,580 | ) | — | — | ||||||
Net increase in investment in subsidiaries | — | (30,000 | ) | (83,690 | ) | |||||
Net cash used in investing activities | (2,580 | ) | (30,000 | ) | (83,690 | ) | ||||
Cash flows from financing activities: | ||||||||||
Net proceeds from issuance of common stock | — | 26,587 | 148,782 | |||||||
Tax effect in stockholders' equity of restricted stock vesting | (501 | ) | (909 | ) | (2,108 | ) | ||||
Restricted stock surrendered | (1,465 | ) | (1,831 | ) | (1,775 | ) | ||||
Cash dividends paid | (7,626 | ) | (1,445 | ) | (11,145 | ) | ||||
Net cash (used in) provided by financing activities | (9,592 | ) | 22,402 | 133,754 | ||||||
Net increase (decrease) in cash and cash equivalents | 11,759 | (19,896 | ) | 34,986 | ||||||
Cash and cash equivalents, beginning of year | 24,141 | 44,037 | 9,051 | |||||||
Cash and cash equivalents, end of year | $ | 35,900 | $ | 24,141 | $ | 44,037 | ||||
PACWEST BANCORP AND SUBSIDIARIES
Notes to Consolidated Financial Statements (Continued)
NOTE 21—COMPREHENSIVE INCOME (LOSS)
The following table presents the detail of comprehensive income (loss) for the years indicated:
| | Year Ended December 31, | ||||||||||||
|---|---|---|---|---|---|---|---|---|---|---|---|---|---|
| | 2010 | 2009 | 2008 | ||||||||||
| | (In thousands) | ||||||||||||
Net loss | $ | (62,016 | ) | $ | (9,350 | ) | $ | (728,065 | ) | ||||
Other comprehensive income (loss), net of income taxes: | |||||||||||||
Unrealized gains (losses) on securities available-for-sale: | |||||||||||||
Unrealized holding gains (losses) on securities arising during the period | 4,073 | (1,556 | ) | 1,056 | |||||||||
Reclassification of realized gains included in income | — | — | (128 | ) | |||||||||
Other comprehensive income (loss), net | 4,073 | (1,556 | ) | 928 | |||||||||
Total comprehensive loss | $ | (57,943 | ) | $ | (10,906 | ) | $ | (727,137 | ) | ||||
NOTE 22—SELECTED QUARTERLY FINANCIAL DATA (Unaudited)
The following table sets forth our unaudited, quarterly results for the periods indicated:indicated. For all such periods, we reclassified recoveries on covered loans such that recoveries now reduce the credit loss provision for covered loans rather than increase FDIC loss sharing income. Such reclassifications had no effect on reported net earnings or losses.
| | | Three Months Ended | Three Months Ended | |||||||||||||||||||||||||
|---|---|---|---|---|---|---|---|---|---|---|---|---|---|---|---|---|---|---|---|---|---|---|---|---|---|---|---|---|
| | | December 31, 2010 | September 30, 2010 | June 30, 2010 | March 31, 2010 | December 31, 2011 | September 30, 2011 | June 30, 2011 | March 31, 2011 | |||||||||||||||||||
| | | (Dollars in thousands, except per share data) | (Dollars in thousands, except per share data) | |||||||||||||||||||||||||
Interest income | Interest income | $ | 77,898 | $ | 75,130 | $ | 68,261 | $ | 68,995 | $ | 70,913 | $ | 72,518 | $ | 77,196 | $ | 74,657 | |||||||||||
Interest expense | Interest expense | (9,378 | ) | (9,963 | ) | (10,644 | ) | (10,972 | ) | (7,140 | ) | (8,077 | ) | (8,507 | ) | (8,919 | ) | |||||||||||
Net interest income | 68,520 | 65,167 | 57,617 | 58,023 | ||||||||||||||||||||||||
Net interest income | 63,773 | 64,441 | 68,689 | 65,738 | ||||||||||||||||||||||||
Provision for credit losses: | Provision for credit losses: | |||||||||||||||||||||||||||
Non-covered loans | — | — | (5,500 | ) | (7,800 | ) | ||||||||||||||||||||||
Covered loans | (4,122 | ) | (348 | ) | (5,890 | ) | (2,910 | ) | ||||||||||||||||||||
Non-covered loans | (35,315 | ) | (17,050 | ) | (14,100 | ) | (112,527 | ) | ||||||||||||||||||||
Total provision for credit losses | (4,122 | ) | (348 | ) | (11,390 | ) | (10,710 | ) | ||||||||||||||||||||
Covered loans | (2,096 | ) | (7,400 | ) | (8,850 | ) | (20,700 | ) | ||||||||||||||||||||
Total provision for credit losses | (37,411 | ) | (24,450 | ) | (22,950 | ) | (133,227 | ) | ||||||||||||||||||||
Net interest income (expense) after provision for credit losses | 31,109 | 40,717 | 34,667 | (75,204 | ) | |||||||||||||||||||||||
Net interest income after provision for credit losses | 59,651 | 64,093 | 57,299 | 55,028 | ||||||||||||||||||||||||
FDIC loss sharing income (expense), net | FDIC loss sharing income (expense), net | (1,277 | ) | 6,406 | 7,029 | 16,172 | 2,667 | 963 | 5,316 | (1,170 | ) | |||||||||||||||||
Other noninterest income | Other noninterest income | 5,925 | 4,379 | 5,053 | 5,097 | 5,587 | 6,180 | 5,924 | 5,959 | |||||||||||||||||||
Noninterest expense | (49,286 | ) | (46,174 | ) | (42,773 | ) | (50,570 | ) | ||||||||||||||||||||
Income tax benefit (expense) | 5,841 | (1,828 | ) | (1,271 | ) | 43,972 | ||||||||||||||||||||||
Non-covered OREO expense, net | (1,714 | ) | (2,293 | ) | (2,300 | ) | (703 | ) | ||||||||||||||||||||
Covered OREO expense, net | (226 | ) | (4,813 | ) | (1,205 | ) | 2,578 | |||||||||||||||||||||
Other noninterest expense | (41,529 | ) | (41,481 | ) | (43,033 | ) | (43,274 | ) | ||||||||||||||||||||
Income tax expense | (10,553 | ) | (9,345 | ) | (9,160 | ) | (7,742 | ) | ||||||||||||||||||||
Net earnings | $ | 13,883 | $ | 13,304 | $ | 12,841 | $ | 10,676 | ||||||||||||||||||||
Net earnings (loss) | $ | (7,688 | ) | $ | 3,500 | $ | 2,705 | $ | (60,533 | ) | ||||||||||||||||||
Earnings (loss) per share: | ||||||||||||||||||||||||||||
Basic | $ | (0.22 | ) | $ | 0.10 | $ | 0.07 | $ | (1.76 | ) | ||||||||||||||||||
Diluted | $ | (0.22 | ) | $ | 0.10 | $ | 0.07 | $ | (1.76 | ) | ||||||||||||||||||
Earnings per share: | ||||||||||||||||||||||||||||
Basic | $ | 0.38 | $ | 0.36 | $ | 0.35 | $ | 0.29 | ||||||||||||||||||||
Diluted | $ | 0.38 | $ | 0.36 | $ | 0.35 | $ | 0.29 | ||||||||||||||||||||
PACWEST BANCORP AND SUBSIDIARIES
Notes to Consolidated Financial Statements (Continued)
NOTE 22—21—SELECTED QUARTERLY FINANCIAL DATA (Unaudited) (Continued)
| | | Three Months Ended | Three Months Ended | |||||||||||||||||||||||||
|---|---|---|---|---|---|---|---|---|---|---|---|---|---|---|---|---|---|---|---|---|---|---|---|---|---|---|---|---|
| | | December 31, 2009 | September 30, 2009 | June 30, 2009 | March 31, 2009 | December 31, 2010 | September 30, 2010 | June 30, 2010 | March 31, 2010 | |||||||||||||||||||
| | | (Dollars in thousands, except per share data) | (Dollars in thousands, except per share data) | |||||||||||||||||||||||||
Interest income | Interest income | $ | 75,569 | $ | 67,510 | $ | 63,341 | $ | 63,454 | $ | 77,898 | $ | 75,130 | $ | 68,261 | $ | 68,995 | |||||||||||
Interest expense | Interest expense | (13,242 | ) | (13,273 | ) | (12,632 | ) | (14,681 | ) | (9,378 | ) | (9,963 | ) | (10,644 | ) | (10,972 | ) | |||||||||||
Net interest income | 62,327 | 54,237 | 50,709 | 48,773 | ||||||||||||||||||||||||
Net interest income | 68,520 | 65,167 | 57,617 | 58,023 | ||||||||||||||||||||||||
Provision for credit losses: | Provision for credit losses: | |||||||||||||||||||||||||||
Non-covered loans | (35,315 | ) | (17,050 | ) | (14,100 | ) | (112,527 | ) | ||||||||||||||||||||
Covered loans | 1,100 | (6,500 | ) | (7,825 | ) | (20,275 | ) | |||||||||||||||||||||
Non-covered loans | (34,900 | ) | (75,000 | ) | (18,000 | ) | (14,000 | ) | ||||||||||||||||||||
Total provision for credit losses | (34,215 | ) | (23,550 | ) | (21,925 | ) | (132,802 | ) | ||||||||||||||||||||
Covered loans | (18,000 | ) | — | — | — | |||||||||||||||||||||||
Total provision for credit losses | (52,900 | ) | (75,000 | ) | (18,000 | ) | (14,000 | ) | ||||||||||||||||||||
Net interest income (expense) after provision for credit losses | 9,427 | (20,763 | ) | 32,709 | 34,773 | |||||||||||||||||||||||
FDIC loss sharing income, net | 16,314 | — | — | — | ||||||||||||||||||||||||
Net interest income (expense) after provision for credit losses | 34,305 | 41,617 | 35,692 | (74,779 | ) | |||||||||||||||||||||||
FDIC loss sharing income (expense), net | (4,473 | ) | 5,506 | 6,004 | 15,747 | |||||||||||||||||||||||
Other noninterest income | Other noninterest income | 5,514 | 5,636 | 5,373 | 6,081 | 5,925 | 4,379 | 5,053 | 5,097 | |||||||||||||||||||
Gain from Affinity acquisition | — | 66,989 | — | — | ||||||||||||||||||||||||
Noninterest expense | (45,213 | ) | (47,091 | ) | (47,931 | ) | (38,969 | ) | ||||||||||||||||||||
Non-covered OREO expense, net | (1,093 | ) | (2,151 | ) | (625 | ) | (8,441 | ) | ||||||||||||||||||||
Covered OREO expense, net | (699 | ) | 319 | 89 | (2,169 | ) | ||||||||||||||||||||||
Other noninterest expense | (47,494 | ) | (44,342 | ) | (42,237 | ) | (39,960 | ) | ||||||||||||||||||||
Income tax benefit (expense) | Income tax benefit (expense) | 6,178 | (2,046 | ) | 4,109 | (440 | ) | 5,841 | (1,828 | ) | (1,271 | ) | 43,972 | |||||||||||||||
Net earnings (loss) | $ | (7,780 | ) | $ | 2,725 | $ | (5,740 | ) | $ | 1,445 | ||||||||||||||||||
Net earnings (loss) | $ | (7,688 | ) | $ | 3,500 | $ | 2,705 | $ | (60,533 | ) | ||||||||||||||||||
Earnings (loss) per share: | Earnings (loss) per share: | |||||||||||||||||||||||||||
Basic | $ | (0.23 | ) | $ | 0.08 | $ | (0.18 | ) | $ | 0.04 | ||||||||||||||||||
Diluted | $ | (0.23 | ) | $ | 0.08 | $ | (0.18 | ) | $ | 0.04 | ||||||||||||||||||
Basic | $ | (0.22 | ) | $ | 0.10 | $ | 0.07 | $ | (1.76 | ) | ||||||||||||||||||
Diluted | $ | (0.22 | ) | $ | 0.10 | $ | 0.07 | $ | (1.76 | ) | ||||||||||||||||||
NOTE 23—22—RELATED PARTY TRANSACTIONS
Castle Creek Financial, LLC, or Castle Creek Financial, serves as the exclusive financial advisor for the Company pursuant to a services agreement dated April 30, 2010May 18, 2011, between Castle Creek Financial and the Company. Castle Creek Financial is an affiliate of Castle Creek Capital, LLC, which is controlled by the Company's chairman. During 2011, 2010, 2009, and 2008,2009, there were no amounts paid by the Company to Castle Creek Financial.
As of December 31, 20102011 and 2009,2010, there were no loans outstanding to any members of our board of directors or executive management. Such parties' deposits as of those dates totaled $6.1$4.6 million and $11.7$6.1 million, respectively, and bear market rates and terms.
NOTE 24—23—SUBSEQUENT EVENTS (Unaudited)
On January 3, 2012, Pacific Western Bank completed the acquisition of Marquette Equipment Finance, or MEF, an equipment leasing company located in Midvale, Utah. Pacific Western Bank acquired all of the capital stock of MEF from Meridian Bank, N.A. for $35 million in cash.
At January 3, 2012, MEF had $162.2 million in gross leases and leases in process outstanding, with no leases on nonaccrual status. In addition, Pacific Western Bank assumed $154.8 million in outstanding debt and other liabilities, which included $129 million payable to MEF's former parent.
PACWEST BANCORP AND SUBSIDIARIES
Notes to Consolidated Financial Statements (Continued)
NOTE 23—SUBSEQUENT EVENTS (Unaudited) (Continued)
Pacific Western Bank repaid MEF's intercompany debt on the closing date from its excess liquidity on deposit at the Federal Reserve Bank.
The following table presents the MEF balance sheet presented at fair value as of the acquisition date, January 3, 2012:
Marquette Equipment Finance | January 3, 2012 (Unaudited) | |||
|---|---|---|---|---|
| | (In thousands) | |||
Assets Acquired: | ||||
Cash and cash equivalents | $ | 7,092 | ||
Direct financing leases | 142,989 | |||
Leases in process | 19,162 | |||
Customer relationship intangible | 1,700 | |||
Other intangible assets | 1,420 | |||
Goodwill | 17,004 | |||
Other assets | 467 | |||
Total assets acquired | $ | 189,834 | ||
Liabilities Assumed: | ||||
Borrowings | $ | 144,516 | ||
Accrued interest payable and other liabilities | 10,318 | |||
Total liabilities assumed | $ | 154,834 | ||
Cash consideration paid | $ | 35,000 | ||
All of the MEF goodwill is expected to be deductible for tax purposes.
On March 7 and 8, 2012, the Company redeemed $18 million of the subordinated debentures of Trust I and Trust CI and recognized a pre-tax gain of approximately $1.6 million. We redeemed these subordinated debentures to reduce our cost of funds, as these two instruments carried fixed interest rates of 11.0% and 10.6%.
We have evaluated events that have occurred subsequent to December 31, 20102011 and have concluded there are no subsequent events that would require recognition in the accompanying consolidated financial statements.
ITEM 9. CHANGES IN AND DISAGREEMENTS WITH ACCOUNTANTS ON ACCOUNTING AND FINANCIAL DISCLOSURE
None.
ITEM 9A. CONTROLS AND PROCEDURES
(a) Evaluation of disclosure controls and procedures. Our Chief Executive Officer and Chief Financial Officer have evaluated our disclosure controls and procedures as of December 31, 20102011 and have concluded that these disclosure controls and procedures are effective to ensure that information required to be disclosed by us in the reports that we file or submit under the Securities Exchange Act of 1934 is recorded, processed, summarized and reported within the time periods specified in the SEC's rules and forms. These disclosure controls and procedures include, without limitation, controls and procedures designed to ensure that information required to be disclosed by us in the reports we file or submit is accumulated and communicated to management, including the Chief Executive Officer and Chief Financial Officer, as appropriate to allow timely decisions regarding required disclosure.
(b) Management's Report on Internal Control over Financial Reporting. Our management is responsible for establishing and maintaining adequate internal control over financial reporting, as such term is defined in Exchange Act Rules 13a-15(f). Our management conducted an evaluation of the effectiveness of our internal control over financial reporting based on the framework in Internal Control—Integrated Framework issued by the Committee of Sponsoring Organizations of the Treadway Commission. Based on this evaluation under the framework in Internal Control—Integrated Framework, our management concluded that our internal control over financial reporting was effective as of December 31, 2010.2011.
Report of the Registered Public Accounting Firm. KPMG LLP, an independent registered public accounting firm, has audited the consolidated financial statements included in this Annual Report on Form 10-K and, as part of their audit, has issued their report, included herein, on the effectiveness of our internal control over financial reporting.
(c) Changes in Internal Control Over Financial Reporting. There were no changes in our internal control over financial reporting that occurred during the fourth quarter of 20102011 that have materially affected, or are reasonably likely to materially affect, our internal control over financial reporting.
None.
ITEM 10. DIRECTORS, EXECUTIVE OFFICERS AND CORPORATE GOVERANCE
Information required by this Item regarding the Company's directors and executive officers, and corporate governance, including information with respect to beneficial ownership reporting compliance, will appear in the Proxy Statement we will deliver to our stockholders in connection with our 20112012 Annual Meeting of Stockholders. Such information is incorporated herein by reference. Information relating to the registrant's Code of Business Conduct and Ethics that applies to its employees, including its senior financial officers, is included in Part I of this Annual Report on Form 10-K under "Item 1. Business—Available Information."
ITEM 11. EXECUTIVE COMPENSATION
The information required by this Item will appear in the Proxy Statement we will deliver to our shareholders in connection with our 20112012 Annual Meeting of Stockholders. Such information is incorporated herein by reference.
ITEM 12. SECURITY OWNERSHIP OF CERTAIN BENEFICIAL OWNERS AND MANAGEMENT AND RELATED STOCKHOLDER MATTERS
The information required by this Item regarding security ownership of certain beneficial owners and management will appear in the Proxy Statement we will deliver to our stockholders in connection with our 20112012 Annual Meeting of Stockholders. Such information is incorporated herein by reference. Information relating to securities authorized for issuance under the Company's equity compensation plans is included in Part II of this Annual Report on Form 10-K under "Item 5. Market for Registrant's Common Equity, Related Shareholder Matters and Issuer Purchases of Equity Securities."
ITEM 13. CERTAIN RELATIONSHIPS AND RELATED TRANSACTIONS, AND DIRECTOR INDEPENDENCE
The information required by this Item will appear in the Proxy Statement we will deliver to our stockholders in connection with our 20112012 Annual Meeting of Stockholders. Such information is incorporated herein by reference.
ITEM 14. PRINCIPAL ACCOUNTANT FEES AND SERVICES
The information required by this Item will appear in the Proxy Statement we will deliver to our stockholders in connection with our 20112012 Annual Meeting of Stockholders. Such information is incorporated herein by reference.
ITEM 15. EXHIBITS AND FINANCIAL STATEMENT SCHEDULES
The consolidated financial statements of PacWest Bancorp and its subsidiaries and independent auditors' report are included in Item 8 under Part II of this Form 10-K.
All financial statement schedules have been omitted, as they are either inapplicable or included in the Notes to Consolidated Financial Statements.
The following documents are included or incorporated by reference in this Annual Report on Form 10-K:
| 3.1 | Certificate of Incorporation, as amended, of PacWest Bancorp, a Delaware Corporation, dated April 22, 2008 (Exhibit 3.1 to Form 8-K filed on May 14, 2008 and incorporated herein by this reference). | ||
3.2 | Certificate of Amendment of Certificate of Incorporation of PacWest Bancorp, a Delaware Corporation, dated May 14, 2010 (Exhibit 3.1 to Form 8-K filed on May 14, 2010 and incorporated herein by this reference). | ||
3.3 | Bylaws of PacWest Bancorp, a Delaware corporation, dated April 22, 2008 (Exhibit 3.2 to Form 8-K filed on May 14, 2008 and incorporated herein by this reference). | ||
4.1 | Indenture between | ||
Indenture between First Community Bancorp, as Issuer, and The Bank of New York, as Trustee, dated as of September 3, 2003 (Exhibit 4.6 to Form 10-Q filed on November 7, 2003 and incorporated herein by this reference). | |||
Indenture between First Community Bancorp, as Issuer and JPMorgan Chase Bank, as Trustee, dated as of February 5, 2004 (Exhibit 4.7 to Form 10-K filed on March 12, 2004 and incorporated herein by this reference). | |||
Indenture between Community Bancorp Inc. and U.S. Bank National Association, as Trustee, dated as of September 17, 2003, as supplemented by the First Supplemental Indenture between First Community Bancorp and U.S. Bank National Association, as Trustee, dated as of October 26, 2006 (Exhibit 4.8 to Form 10-K filed on February 27, 2007 and incorporated herein by reference). | |||
Indenture, between Community Bancorp Inc. and Wilmington Trust Company, as Trustee, dated as of August 15, 2005, as supplemented by the First Supplemental Indenture between First Community Bancorp and Wilmington Trust Company, as Trustee, dated as of October 26, 2006 (Exhibit 4.9 to Form 10-K filed on February 27, 2007 and incorporated herein by reference). | |||
10.1* | PacWest Bancorp 2003 Stock Incentive Plan, as amended and restated, effective December 15, 2008 (Exhibit 10.1 to Form 10-K filed on March 2, 2009 and incorporated herein by this reference) | ||
10.2* | Executive Severance Pay Plan, as amended and restated effective December 15, 2008, applicable to the executive officers of PacWest Bancorp and certain senior officers of the PacWest Bancorp and its subsidiaries (Exhibit 10.2 to Form 10-K filed on March 2, 2009 and incorporated herein by this reference). | ||
10.3* | 2007 Executive Incentive Plan, as amended and restated, effective May 11, 2010 (pages A-1 to A-5 of the Company's Definitive Proxy Statement filed on April 9, 2010 and incorporated herein by this reference). |
10.4* | |||
Indemnification Agreement, as amended, applicable to the directors and executive officers of the Company (Exhibit 10.24 to Form 10-K filed on March 12, 2004 and incorporated herein by this reference). |
10.5* | Form of Stock Award Agreement and Grant Notice pursuant to the Company's 2003 Stock Incentive Plan, as amended (Exhibit 10.5 to Form 10-K filed on March 2, 2009 and incorporated herein by this reference). | ||
10.6 | |||
Amended and Restated Declaration of Trust of First Community/CA Statutory Trust V by and among U.S. Bank, N.A. as Institutional Trustee, First Community Bancorp, as Sponsor and Matthew P. Wagner, Lynn M. Hopkins and Jared M. Wolff, as Administrators dated as of August 15, 2003 (Exhibit 10.6 to Form 10-Q filed on November 7, 2003 and incorporated herein by this reference). | |||
Guarantee Agreement by and between First Community Bancorp and U.S. Bank, N.A. dated as of August 15, 2003 (Exhibit 10.18 to Form 10-Q filed on November 7, 2003 and incorporated herein by this reference). | |||
Amended and Restated Trust Agreement of First Community/CA Statutory Trust VI among First Community Bancorp as Depositor, The Bank of New York as Property Trustee, The Bank of New York (Delaware) as the Delaware Trustee, and the Administrative Trustees named therein, dated as of September 3, 2003 (Exhibit 10.7 to Form 10-Q filed on November 7, 2003 and incorporated herein by this reference). | |||
Guarantee Agreement between First Community Bancorp and The Bank of New York, dated as of September 3, 2003 (Exhibit 10.19 to Form 10-Q filed on November 7, 2003 and incorporated herein by this reference). | |||
Amended and Restated Trust Agreement of First Community/CA Statutory Trust VII among First Community Bancorp as Sponsor, Chase Manhattan Bank USA, N.A. as Delaware Trustee, JPMorgan Chase Bank, as Institutional Trustee, and the Administrators named therein, dated as of February 5, 2004 (Exhibit 10.19 to Form 10-K filed on March 12, 2004 and incorporated herein by this reference). | |||
Guarantee Agreement between First Community Bancorp and JPMorgan Chase Bank, dated as of February 5, 2004 (Exhibit 10.20 to Form 10-K filed on March 12, 2004 and incorporated herein by this reference). | |||
Amended and Restated Declaration of Trust of Community (CA) Capital Statutory Trust II, dated as of September 17, 2003 (Exhibit 10.22 to Form 10-K files filed February 27, 2007 and incorporated herein by this reference). |
10.13 | |||
Guarantee Agreement By and Between Community Bancorp Inc. and U.S. Bank National Association, dated as of September 17, 2003 (Exhibit 10.23 to Form 10-K files filed February 27, 2007 and incorporated herein by this reference). | |||
Amended and Restated Declaration of Trust of Community (CA) Capital Statutory Trust III, dated as of August 15, 2005 (Exhibit 10.24 to Form 10-K files filed February 27, 2007 and incorporated herein by this reference). | |||
Guarantee Agreement By and Between Community Bancorp Inc. and Wilmington Trust Company, dated as of August 15, 2005 (Exhibit 10.25 to Form 10-K files filed February 27, 2007 and incorporated herein by this reference). | |||
Services Agreement, dated as of |
| 10.17 | Lease Agreement, as amended through January 1, 2004, between DL FNBC, L.P. and First National Bank, for the premises located at 401 West "A" Street, San Diego, California (Exhibit 10.29 to Form 10-K filed on March 14, 2005 and incorporated herein by this reference). | ||
Stock Purchase Agreement, by and between PacWest Bancorp and CapGen Capital Group II LP, dated August 29, 2008 (Exhibit 10.1 to Form 8-K filed on September 4, 2008 and incorporated herein by this reference). | |||
Purchase and Assumption Agreement, dated as of August 28, 2009, between Federal Deposit Insurance Corporation and Pacific Western Bank (Exhibit 2.1 to Form 8-K filed on September 2, 2009 and incorporated herein by this reference). | |||
Purchase and Assumption Agreement, dated as of August 20, 2010, between Federal Deposit Insurance Corporation and Pacific Western Bank (Exhibit 2.1 to Form 8-K filed on August 26, 2010 and incorporated herein by this reference). | |||
11.1 | Statement re: Computation of Per Share Earnings (See Note | ||
12.1 | Statement re: Computation of Ratios (See "Item 6. Selected Financial Data" of this Annual Report on Form 10-K). | ||
21.1 | Subsidiaries of the Registrant. | ||
23.1 | Consent of KPMG LLP. | ||
24.1 | Powers of Attorney (included on signature page). | ||
31.1 | Section 302 Certifications. | ||
32.1 | Section 906 Certifications. | ||
101 | Interactive data files pursuant to Rule 405 of Regulation S-T: (i) the Consolidated Balance Sheets as of December 31, 2011 and 2010, (ii) the Consolidated Statements of Earnings (Loss) for the years ended December 31, 2011, 2010, and 2009, (iii) the Consolidated Statements of Comprehensive Income (Loss) for the years ended December 31, 2011, 2010, and 2009, (iv) the Consolidated Statement of Changes in Stockholders' Equity for the years ended December 31, 2011, 2010, and 2009, (v) the Consolidated Statements of Cash Flows for the years ended December 31, 2011, 2010, and 2009, and (vi) the Notes to Consolidated Financial Statements. (Pursuant to Rule 406T of Regulation S-T, this information is deemed furnished and not filed for purposes of Sections 11 and 12 of the Securities Act of 1933 and Section 18 of the Securities Exchange Act of 1934.) |
The exhibits listed in Item 15(a)3 are incorporated by reference or attached hereto.
Not Applicable.
Pursuant to the requirements of Section 13 or 15(d) of the Securities Exchange Act of 1934, the registrant has duly caused this report to be signed on its behalf by the undersigned, thereunto duly authorized.
| PACWEST BANCORP | ||||
Dated: March 14, | By: | /s/ MATTHEW P. WAGNER Matthew P. Wagner (Chief Executive Officer) | ||
KNOW ALL PERSONS BY THESE PRESENTS, that each person whose signature appears below constitutes and appoints John M. Eggemeyer, Matthew P. Wagner, Stephen M. Dunn, Victor R. Santoro and Jared M. Wolff, and each of them severally, his or her true and lawful attorney-in-fact with power of substitution and resubstitution to sign in his or her name, place and stead, in any and all capacities, to do any and all things and execute any and all instruments that such attorney may deem necessary or advisable under the Securities Exchange Act of 1934 and any rules, regulations and requirements of the U.S. Securities and Exchange Commission in connection with this Annual Report on Form 10-K and any and all amendments hereto, as fully for all intents and purposes as he or she might or could do in person, and hereby ratifies and confirms all said attorneys-in-fact and agents, each acting alone, and his or her substitute or substitutes, may lawfully do or cause to be done by virtue hereof.
Pursuant to the requirements of the Securities Exchange Act of 1934, this report has been signed by the following persons on behalf of the registrant and in the capacities and on the dates indicated.
Signature | Title | Date | ||
|---|---|---|---|---|
| /s/ JOHN M. EGGEMEYER John M. Eggemeyer | Chairman of the Board of Directors | March 14, | ||
/s/ MATTHEW P. WAGNER Matthew P. Wagner | Chief Executive Officer and Director (Principal Executive Officer) | March 14, | ||
/s/ VICTOR R. SANTORO Victor R. Santoro | Executive Vice President and Chief Financial Officer (Principal Financial Officer and Principal Accounting Officer) | March 14, | ||
/s/ MARK N. BAKER Mark N. Baker | Director | March 14, |
Signature | Title | Date | ||
|---|---|---|---|---|
| /s/ CRAIG A. CARLSON Craig A. Carlson | Director | March 14, | ||
/s/ STEPHEN M. DUNN Stephen M. Dunn | Director | March 14, | ||
/s/ BARRY C. FITZPATRICK Barry C. Fitzpatrick | Director | March 14, | ||
/s/ GEORGE E. LANGLEY George E. Langley | Director | March 14, | ||
/s/ SUSAN E. LESTER Susan E. Lester | Director | March 14, | ||
/s/ TIMOTHY B. MATZ Timothy B. Matz | Director | March 14, | ||
/s/ ARNOLD W. MESSER Arnold W. Messer | Director | March 14, | ||
/s/ DANIEL B. PLATT Daniel B. Platt | Director | March 14, | ||
/s/ JOHN W. ROSE John W. Rose | Director | March 14, | ||
/s/ ROBERT A. STINE Robert A. Stine | Director | March 14, |