

SECURITIES AND EXCHANGE COMMISSION
Washington, D.C. 20549
FORM 10-K
| (Mark One) | ||
ý | ANNUAL REPORT PURSUANT TO SECTION 13 OR 15(d) OF THE SECURITIES EXCHANGE ACT OF 1934 | |
For the fiscal year ended December 31, | ||
o | TRANSITION REPORT PURSUANT TO SECTION 13 OR 15(d) OF THE SECURITIES EXCHANGE ACT OF 1934 | |
For the transition period from to | ||
| Commission File Number 0-31313 | ||
Commission File Number 0-31313
BROADWIND ENERGY, INC.
(Exact name of Registrant as specified in its charter)
| Delaware (State of or other jurisdiction of incorporation or organization) | 88-0409160 (I.R.S. Employer Identification No.) | |
47 East Chicago Avenue, Suite 332 Naperville, Illinois | ||
| (Address of principal executive offices) | 60540 (zip code) | |
| Registrant's telephone number, including area code:(630) 637-0315 | ||
| Securities registered pursuant to Section 12(b) of the Act:None | ||
| Securities registered pursuant to Section 12(g) of the Act: Common Stock, $0.001 par value | ||
Registrant's telephone number, including area code:(630) 637-0315
Securities registered pursuant to Section 12(b) of the Act:None
Securities registered pursuant to Section 12(g) of the Act: Common Stock, $0.001 par value
Indicate by check mark whether the Registrant is a well-known seasoned issuer, as defined in Rule 405 of the Securities Act of 1933. Yes o No ý
Indicate by check mark if the Registrant is not required to file reports pursuant to Section 13 or 15(d) of the Securities Exchange Act of 1934. Yes o No ý
Indicate by check mark whether the Registrant (1) has filed all reports required to be filed by Section 13 or 15(d) of the Securities Exchange Act of 1934 during the preceding 12 months (or for such shorter period that the Registrant was required to file such reports), and (2) has been subject to such filing requirements for the past 90 days. Yes ý No o
Indicate by check mark whether the registrantRegistrant has submitted electronically and posted on its corporate Web site, if any, every Interactive Data File required to be submitted and posted pursuant to Rule 405 of Regulation S-T (§232.405 of this chapter) during the preceding 12 months (or for such shorter period that the registrantRegistrant was required to submit and post such files). Yes oý No o
Indicate by check mark if disclosure of delinquent filers pursuant to Item 405 of Regulation S-K is not contained herein, and will not be contained, to the best of Registrant's knowledge, in definitive proxy or information statements incorporated by reference in Part III of this Form 10-K or any amendment to this Form 10-K. o
Indicate by check mark whether the Registrant is a large accelerated filer, an accelerated filer, a non-accelerated filer or a smaller reporting company. See the definitions of "large accelerated filer," "accelerated filer" and "smaller reporting company" in Rule 12b-2 of the Exchange Act.
| Large accelerated filer o | Accelerated filer ý | Non-accelerated filer o (Do not check if a smaller reporting company) | Smaller reporting company o |
Indicate by check mark whether the Registrant is a shell company, as defined in Rule 12b-2 of the Securities Exchange Act of 1934. Yes o No ý
TheAs of June 30, 2011 the aggregate market value of the Registrant's voting common stock held by non-affiliates of the Registrant was approximately $123,975,813, based upon the $2.80$1.45 per share closing sale price of the Registrant's common stock as reported on June 30, 2010 (the last business day of the Registrant's most recently completed second quarter) was approximately $204,543,259.NASDAQ Global Select Market. For purposes of this calculation, the Registrant's directors and executive officers and holders of 10% or more of the Registrant's outstanding shares of voting common stock have been assumed to be affiliates, with such affiliates holding an aggregate of 33,789,92121,804,883 shares of the Registrant's voting common stock on June 30, 2010,2011, and shares held by such affiliates are not included in this calculation.
Number of shares of the Registrant's common stock, par value $0.001, outstanding as of March 1, 2011,February 29, 2012, was 107,113,135.139,782,742.
DOCUMENTS INCORPORATED BY REFERENCE
Portions of the Registrant's Proxy Statement for the Registrant's 20112012 Annual Meeting of Stockholders are incorporated by reference in Part III of this Form 10-K.
BROADWIND ENERGY, INC.
FORM 10-K
TABLE OF CONTENTS
| | | Page | ||||
|---|---|---|---|---|---|---|
PART I | ||||||
ITEM 1. | BUSINESS | 1 | ||||
ITEM 1A. | RISK FACTORS | 9 | ||||
ITEM 1B. | UNRESOLVED STAFF COMMENTS | |||||
ITEM 2. | PROPERTIES | |||||
ITEM 3. | LEGAL PROCEEDINGS | |||||
ITEM 4. |
| |||||
PART II | ||||||
ITEM 5. | MARKET FOR REGISTRANT'S COMMON EQUITY, RELATED STOCKHOLDER MATTERS AND ISSUER PURCHASES OF EQUITY SECURITIES | |||||
ITEM 6. | SELECTED FINANCIAL DATA | |||||
ITEM 7. | MANAGEMENT'S DISCUSSION AND ANALYSIS OF FINANCIAL CONDITION AND RESULTS OF OPERATIONS | |||||
ITEM 7A. | QUANTITATIVE AND QUALITATIVE DISCLOSURES ABOUT MARKET RISK | |||||
ITEM 8. | FINANCIAL STATEMENTS AND SUPPLEMENTARY DATA | |||||
ITEM 9. | CHANGES IN AND DISAGREEMENTS WITH ACCOUNTANTS ON ACCOUNTING AND FINANCIAL DISCLOSURE | |||||
ITEM 9A. | CONTROLS AND PROCEDURES | |||||
ITEM 9B. | OTHER INFORMATION | |||||
PART III | ||||||
ITEM 10. | DIRECTORS, EXECUTIVE OFFICERS AND CORPORATE GOVERNANCE | |||||
ITEM 11. | EXECUTIVE COMPENSATION | |||||
ITEM 12. | SECURITY OWNERSHIP OF CERTAIN BENEFICIAL OWNERS AND MANAGEMENT AND RELATED STOCKHOLDER MATTERS | |||||
ITEM 13. | CERTAIN RELATIONSHIPS AND RELATED TRANSACTIONS, AND DIRECTOR INDEPENDENCE | |||||
ITEM 14. | PRINCIPAL ACCOUNTANT FEES AND SERVICES | |||||
PART IV | ||||||
ITEM 15. | EXHIBITS AND FINANCIAL STATEMENT SCHEDULES | 48 | ||||
Cautionary Note Regarding Forward-Looking Statements
This Annual Report on Form 10-K contains "forward-looking statements"—that is, statements related to future, not past, events—as defined in Section 21E of the Securities Exchange Act of 1934, as amended (the "Exchange Act"), that reflect our current expectations regarding our future growth, results of operations, financial condition, cash flows, performance and business prospects, and opportunities, as well as assumptions made by, and information currently available to, our management. Forward-looking statements include any statement that does not directly relate to a current or historical fact. We have tried to identify forward-looking statements by using words such as "anticipate," "believe," "expect," "intend," "will," "should," "may," "plan" and similar expressions, but these words are not the exclusive means of identifying forward-looking statements. These statements are based on information currently available to us and are subject to various risks, uncertainties, and other factors, including, but not limited to, those discussed in Item 1A "Risk Factors" in Part I of this Annual Report on Form 10-K, that could cause our actual growth, results of operations, financial condition, cash flows, performance and business prospects, and opportunities to differ materially from those expressed in, or implied by, these statements. Our forward-looking statements may include or relate to the following: (i) our plans to continue to grow our business through organic growth and integration of previous and future acquisitions; (ii) our beliefs with respect to the sufficiency of our liquidity and our plans to evaluate alternate sources of funding if necessary; (iii) our plans and assumptions, including estimated costs and saving opportunities, regarding our ongoing restructuring efforts designed to improve our financial performance; (iv) our expectations relating to state, local and federal regulatory frameworks affecting the wind energy industry, including the extension, continuation or renewal of federal tax incentives and grants and state renewable portfolio standards; (iv)(v) our expectations relating to construction of new facilities, expansion and/or restructuring of existing facilities and sufficiency of our existing capacity to meet the demands of our customers and support expectations regarding our growth; (v)(vi) our expectations with respect to our efforts to diversify our customer base and sector focus; (vii) our plans with respect to the use of proceeds from financing activities and our ability to operate our business efficiently, manage capital expenditures and costs effectively, and generate cash flow; (vi)(viii) our beliefs and expectations relating to the economy and the potential impact it may have on our business, including our customers;(vii) (ix) our beliefs regarding the state of the wind energy market and other energy and industrial markets generally; and (viii)(x) our expectations relating to the impact of pending securities litigation, as well asthe inquiry by the U.S. Securities and Exchange Commission, and environmental compliance matters. You should not consider any list of such factors to be an exhaustive statement of all of the risks, uncertainties, or potentially inaccurate assumptions that could cause our current expectations or beliefs to change. Except as expressly required by the federal securities laws, we undertake no obligation to update such factors or to publicly announce the results of any of the forward-looking statements contained herein to reflect future events, developments, or changed circumstances or for any other reason.
As used in this Annual Report on Form 10-K, the terms "we," "us," "our," "Broadwind," "Broadwind Energy," and the "Company" refer to Broadwind Energy, Inc., a Delaware incorporated company headquartered in Naperville, Illinois, and its wholly-owned subsidiaries. Dollars are presented in thousands unless otherwise stated.
Business Overview
Broadwind provides technologically advanced high-value products and services to energy, mining and infrastructure sector customers, primarily in the U.S. Our most significant presence is within the U.S. wind industry, wherealthough we believe we are the only independent company that offershave increasingly diversified into other industrial markets in order to improve our breadth of productscapacity utilization and servicesreduce our exposure to uncertainty related to the market.extension or renewal of tax incentives and other favorable governmental policies currently supporting the U.S. wind industry. Our product and service portfolio provides our wind energy customers, including wind turbine
manufacturers, wind farm developers and wind farm operators, with access to a broad array of component and service offerings. Outside of the wind market, we provide precision gearing and specialty weldments to a broad range of industrial customers particularly in the energy,for oil and gas, mining and infrastructure sectors.
We are well positioned to capture market opportunities associated with growth in wind energy and other industrial markets in the U.S. We believe that growth in theapplications.
The market for new U.S. wind energy market will be driven by:installations is affected by the following factors: (i) macroeconomic factors, including an economic recoverygrowth and increasedthe associated demand for new electricity risinggeneration, (ii) the cost of competing energy prices andsources, primarily natural gas, (iii) federal and state-level wind development incentives, (ii)(iv) upgrades to existing transmission infrastructure and increasingthe proliferation of smart grid technology, and (iii)(v) improvements in wind energy cost competitiveness resulting from the maturation of technologies and services within the wind industry, including increased turbine efficiencies development of a coordinated global supply chain and improved focus on equipment maintenance and reliability. Given
In 2011, approximately 73% of our significantsales were associated with new wind turbine manufacturing and installations and 7% were related to servicing the installed capital base,fleet of wind turbines. The remaining 20% of our sales primarily consisted of gearing and specialty weldments for industrial customers. During this time we believe we will be ablecontinued to substantially grow revenues without making significant investmentexecute our diversification strategy for our operations, focusing on increasing sales to industrial customers within our Gearing segment. Of our total company backlog at the end of 2011, 16% represents industrial customer demand, which is up from 8% in additional capital equipment or manufacturing capacity.2010.
Segments
In December 2009, we revised our reporting segment presentation into four reportable operating segments: Towers, Gearing, Technical and Engineering Services, and Logistics. Within our Logistics segment, the Companywe offered specialized transportation, permitting and logistics management to the wind industry for oversize and overweight machinery and equipment. In December of 2010, our Board of Directors approved a plan to divest our Logistics business segment, and on March 4, 2011, we completed the disposition of our Logistics business to a third party purchaser. Consequently, this business unit is now reported as discontinued operations and we have revised our segment presentation to include three reportable operating segments: Towers, Gearing and Services (previously Technical and Engineering Services). In conjunction with the preparation of our consolidated financial statements included in this Annual Report on Form 10-K, we have changed the name of our Towers segment to "Towers and Weldments" to better describe our offerings within this segment. All current and prior period financial results have been revised to reflect these changes. For additional financial information related to our segments, please refer to Item 7, "Management's Discussion and Analysis of Financial Condition and Results of Operations" and Note 1917 "Segment Reporting" in Item 15 in the notes to our consolidated financial statements for a discussion of summary financial information by segment.
The following is a description of products and services offered in each segment:
Towers and Weldments
We manufactureThe Towers and Weldments segment specializes in the production of wind turbine towers, and continues to diversify its customer base by expanding the portion of the business which fabricates specialty weldments for wind turbines.oil and gas, mining and other industrial applications. Our production facilities, located in Manitowoc, Wisconsin and Abilene, Texas, are situated in close proximity to the primary U.S. domestic energy and equipment manufacturing locations. We specialize in heavier "next generation" wind towers that are larger, more technically advanced towers, designed for 2two megawatt ("MW") and larger wind turbines. Since starting commercial production in 2005, we have produced approximately 800 towers. Our production facilities in Manitowoc, Wisconsin and Abilene, Texas are well-placed in close proximity to the primary U.S.1,100 towers for a wide variety of wind resource regions.turbine manufacturers. The two facilities have a combined annual tower production capacity of approximately 500 towers, sufficient to support turbines generating more than 1,200 MW of power. However, pursuant to our diversification strategy, we are shifting a portion of this capacity to support an expansion of our specialty weldments business.
Our towers for wind turbines are predominantly sold to wind turbine manufacturers who utilize our products in the assembly of wind turbines. Due to the customized nature of our products, they are generally sold through our direct sales force following an evaluation, qualification and testing period, which may occur over a number of months. We compete based on product performance, quality, price, location and available capacity.
We are also applying our core competency in welding large structures to other industries, including the mining, heavy equipment and medical fields. We have periodically entered into framework agreements underproduction facilities to fabricate specialty weldments in Manitowoc, Wisconsin and Abilene, Texas, which we provide products to certain key customers over multi-year periods.large-scale sites, capacity and support equipment. Our principal wind tower customers are Gamesa, Nordexcapabilities include integrated blasting, cutting, beveling, rolling and Vestas. Within this segment, we also manufacture specialty fabricationswelding capabilities. In addition, the Abilene facility offers the industry a large, modern blast booth and heavy weldments for wind energy and other industrial customers.a large, modern paint booth.
Gearing
We manufacture highengineer, build and remanufacture precision gears and gearing systems for wind, turbines. We also manufacture custom-engineered gearing systemsoil and gearboxes for energy,gas, and mining and other industrial customers. We target niche markets and applications that require the strict tolerances and high quality standards of our processes.
We produce to the highest industry quality standards, and we were the first U.S. gear manufacturer to achieve ISO 9001 certification.applications. We use an integrated manufacturing process, which includes a machining processprocesses in Cicero, Illinois, a heat treatment process in Neville Island, Pennsylvania, and a finishing process in a second Cicero factory. We have announced our intention to consolidate the operations of the two Cicero IL factory. These complex production processes allow usfacilities into one of the existing facilities in 2012.
In 2011, as demand for wind gearing decreased, we increased our sales force and shifted our focus to the manufacture custom products to meetof custom-engineered gearing systems and gearboxes for oil and gas, mining and other industrial customers. Although our wind gearing business serving gearbox manufacturers has declined, we anticipate growth in demand for replacement gearing on the stringent tolerances and high quality standards of our customers.
existing installed wind turbine fleet. Due to the highly specialized nature of our gearing, it is generally sold through our direct sales force following an evaluation, qualifying, prototyping and testing period, which may occur over a number of months. We compete based on product performance, quality, price and available capacity. We have periodically entered into framework agreements under which we provide products to certain key customers over multi-year periods. Our most significant Gearing segment customers include Clipper Windpower, Gardner Denver and General Electric.
Services
We offer technical and precision repair and engineeringa comprehensive range of services primarily to manufacturers of wind turbines andfarm developers and operators of wind farms. Our technicaloperators. We specialize in non-routine blade and gearbox maintenance services business provides construction supportfor both kilowatt and operations and maintenancemegawatt turbines. We also offer comprehensive field services to the wind industry. Our precision repairWe are increasingly focusing our efforts on the identification and/or development of product and engineering services include repairservice offerings which will improve the reliability and refurbishment of the complex systems and componentsefficiency of wind turbines, including control systems, drivetrains and blades. During 2010,therefore enhance the economic benefits to our customers. We provide wind services across the U.S., with primary service locations in South Dakota and Texas. In February 2011, we approved an investment of approximately $7 million to develop aput into operation our dedicated drivetrain service center in Abilene, Texas, which is focused on servicing the growing installed base of MW wind turbines as they come off warranty. The drivetrainwarranty and to a limited extent, industrial gearboxes requiring precision repair and testing.
Our Services business competes with a number of wind turbine manufacturers and independent service center was dedicated and put into operationproviders in February 2011.
a highly-fragmented but growing industry. Sales contacts are typically initiated through a small direct sales force, orand through operating unit managers located in our geographically dispersed service locations. Sales are generally made under individual purchase orders, although we havemay enter into blanket purchase orders or multi-year operations and maintenance agreements in place with select key customers. Our Services business competes with a number of independent service providers in a highly-fragmented but growing industry. Our principal Services segment customers include FPL Energy, NexGen Energy Partners and Siemens Energy. Our primary service locations are in Illinois, California, South Dakota and Texas. Our vision is to become the most comprehensive independent service provider to the North American wind industry.
Competitive Strengths
We believe our business model offers a number of competitive strengths that will contribute to our commercial success and will enable us to capitalize on significant opportunities for growth. These competitive strengths include the following:
system manufacturing expertise positions us to enter the market for drivetrain services, including gearbox repair and refurbishment which, for MW-scale turbines, has historically been performed by non-domestic sources. We believe that our broad service offerings and technical capabilities will allow us to grow our services business significantly as the installed wind turbine base grows and wind turbines come off warranty.
Business and Operating Strategy
We intend to capitalize on the anticipated growth of the wind energy market and growing oil and gas and mining market in North America by providing our technologically advanced, highly reliable, value-added products and components and customized services across the wind supply chain. While our focus will remain on the wind energy, sector, we also plan to take advantage of growth opportunities by expanding our existing presence in other energy infrastructure and industrial markets.
Our strategic objectives include the following:
Restructuring Activities
During the third quarter of 2011, we conducted a review of our business strategies and product plans given the outlook for the economy at large, the forecast for the industries we serve and our own business environment. As a result, we have recently completed an investment inbegun to execute a new drivetrain service centerrestructuring plan to rationalize our facility capacity and our management structure, and to consolidate and increase the efficiencies of our operations.
We have concluded that will serviceour manufacturing footprint and fixed cost base are too large and expensive for our medium-term needs. We are planning to reduce our facility footprint by approximately 30% through the installed basesale and/or closure during the next fifteen months of wind turbines.
allowing for growth for the next several years. These factors have required management to reassess its estimates of the fair value of some of our assets.
We expect to incur restructuring costs associated with the restructuring plan totaling an estimated $13,600, of which $874 has been incurred through the end of 2011. Costs are expected to include approximately $5,200 in capital expenditures and $8,400 in expenses, of which approximately $4,000 is anticipated to be non-cash expenses and $4,400 is anticipated to be cash expenses. Net proceeds from associated asset sales, projected to be approximately $7,600, will be used to fund cash costs. We anticipate annual cost savings going forward of approximately $5,500 related to the restructuring.
COMPANY HISTORY
We were incorporated in Nevada in 1996 as Blackfoot Enterprises Inc. ("Blackfoot"). In February 2006, Blackfoot completed a reverse shell transaction with Tower Tech Systems Inc. ("Tower Tech"), whereupon Blackfoot became a holding company for Tower Tech and subsequently changed its name to Tower Tech Holdings Inc. In 2008, Tower Tech Holdings Inc. reincorporated in Delaware and changed its name to Broadwind Energy, Inc. Through our October 2007 acquisitions of R.B.A. Inc. ("RBA") and Brad Foote Gear Works, Inc. ("Brad Foote"), and acquisitions of Energy Maintenance Services, LLC ("EMS") and Badger Transport Inc. ("Badger") in January and June of 2008, respectively, we expanded upon our core platform as a wind tower component manufacturer and established our gearing systems, industrial products, technical services, precision repair and engineering and logistics businesses. In December 2010, our Board of Directors approved a plan to divest our logistics business, Badger, which was sold to a third party purchaser on March 4, 2011, and is now treated as a discontinued operation. Effective February 1, 2011, EMS changed its name to Broadwind Services, LLC ("Broadwind Services"), and effective March 1, 2011, Tower Tech changed its name to Broadwind Towers, Inc. ("Broadwind Towers").
SALES AND MARKETING
We market our towers, gearing and welding products and our maintenance services through our direct sales force. Our sales and marketing strategy is to develop and maintain long-term relationships with our energy and infrastructure sector customers and to offer a comprehensivean integrated suite of products and services to them. We pursuebelieve this strategy by working closelybest leverages our gearbox and blade knowledge and our core competency in specialty welding with customers. We believe this strategy also offers opportunities to cross-sell products and services across our customers in developing and designing customized product, manufacturing, and service solutions.platform of products. We also intend for our offerings to fulfill needs that our customers may consider non-core and do not desire to provide for within their organizations. We attempt to base-load our manufacturing facilities by negotiating long-term agreements, under which we supply our customers with gearing, towers or industrial products. Similarly, we seek to establish long-term relationships to provide services to our customers, which may be subject to framework agreements or undertaken on a project by project basis. Within the wind industry, our predominant focus, our customer base consists of wind turbine manufacturers who supply end-users and wind turbinefarm developers with completed wind turbines, as well as wind farm developers and wind farm operators themselves. Within the windoil and gas and mining industries, our customer base consists of manufacturers of hydraulic fracturing and mud pumps, mining equipment and off-highway vehicles. To support the efforts of our sales force, we utilize a number of marketing tactics to build our brand and position and promote our products and services. Our efforts include participation in industry we have long-standing relationshipsconferences, media relations, use of social media channels, use of our website and other channels to connect with customers, engaging them at various levels from key account management, site management, research and development, product design and manufacturing up to senior management.customers.
COMPETITION
We do not believe that any competitors exist that have developed a similar suite of products and services for the North American wind industry assimilar to those offered by our businesses. However, each of our businesses faces competition from both domestic and international companies, and some of our customers maintain internal capabilities that compete with our offerings. Many of these competitors are larger and better capitalized than we are.
For our Towers and Weldments segment, the largest North American based competitors are Trinity Industries and DMI Industries. Additionally, we face competition from a number of smaller tower
producers, including Katana Summit Ameron International and SIAG, as well as imports from a number of Asian tower manufacturers. On December 29, 2011, along with other U.S. based producers of wind towers, we asked the U.S. Department of Commerce and the International Trade Commission to conduct anti-dumping investigations of Chinese and Vietnamese imports of wind towers and a countervailing duty investigation into Chinese imports of wind towers.
In our Gearing segment, which is focused on the oil and gas and mining markets, our key competitors include Overton Chicago Gear, Oerlikon Fairfield Drive Systems, Horsburgh & Scott, Milwaukee Gear and Philadelphia Gear (affiliated with Timken). In addition, we also compete with the internal gear manufacturing capacity of relevant equipment manufacturers. With the increased demand for oil and gas gearing capacity and increased mining demand, we are experiencing a significant resurgence of third party gearing demand. We are a major North American supplier ofalso manufacture wind energy gear sets, but do not manufacture complete gearboxes for this segment. Wind gearbox manufacturers include Winergy (affiliated with Siemens), Bosch-Rexroth, Moventas and Hansen Transmissions (affiliated with Suzlon Energy)ZF Friedrichshafen AG). Because wind gearbox manufacturers often source all or a portion of their gear sets from third parties, these companies are also potential customers for Broadwind. The competitor group participating to provide industrial gearing is more fragmented, comprised of a large number of privately held gearing manufacturers. These gearing manufacturers compete based upon price, quality, location, available capacity, and several other factors.
The market for independent technicalblade, drivetrain and engineeringfield services in which our Services segment competes is highly fragmented, and includes companiesoriginal equipment manufacturers such as GE Services and Siemens, large-scale service providers such as enXco, (affiliated with EDF),and a number of independent service providers, including Outland Energy Services and UpWind Solutions.
ENVIRONMENTAL REGULATION AND COMPLIANCE
Our operations are subject to numerous federal, state, and local environmental laws and regulations. While it is our objective to maintain compliance with these respective laws and regulations, it may not be possible to quantify with certainty the potential impact of actions regarding environmental matters, particularly remediation and other compliance efforts that we may undertake in the future. Many of our facilities have a history of industrial operations and contaminants have been detected at some of our facilities. Refer to Item 3 "Legal Proceedings" for further discussion of environmental regulation and compliance.
BACKLOG
We sell our towers and gearing under either long-term supply agreements or individual purchase orders, depending on the size and the duration of the purchase and sale commitment. Some of these supply agreements are structured as framework agreements, wherebypursuant to which customers commit to purchase a certain fixed quantity or share of their annual requirements from us, and we reserve a portion of our manufacturing capacity to meet these requirements. Under these framework agreements, we typically receive purchase orders on a monthly or other periodic basis based upon our customer's forecast of production volume levels. These long-term agreements have various terms, but generally range from several months to three years with some contracts carrying automatic renewal provisions. In recent years, the markets for wind towers and gearing capacity have generally shifted from multi-year framework agreements to individual purchase orders relating to specific projects scheduled for production within the following six to twelve months. In the future, we expect that our remaining multi-year agreements will expire, and that the mix of our business will continue to shift to shorter term project orders. As this trend continues, we anticipate our backlog will decrease, and we will likely experience greater month-to-month variations in backlog levels. For our Services segment, purchases are based either on individual purchase orders or longer-term operationsoperation and maintenance contracts. As of December 31, 2010,2011, the dollar amount of our backlog believed to be firm under our supply agreements, purchase orders awarded and service contracts was approximately $226$200 million, of which $116$161 million is expected to be delivered during 2011. Deliveries during 2011 may2012. Beyond 2012, due to the structural change in order patterns, backlog is only expected to be subjectreflective of six to change as a resulttwelve months of any future modifications to our existing customer framework agreements or purchase orders.sales.
SEASONALITY
The majority of our business is not affected by seasonality. Within our Services segment, there can be some seasonality as project completions are typically heaviest in the fourth quarter, and the provision of servicesrevenues can be negatively affected by weather related constraints, typically during portions of the first quarterand fourth quarters of the year.
EMPLOYEES
We had 850833 employees at December 31, 2010,2011, of which 684683 were in manufacturing, service and field support related functions and 166150 were in administrative functions. Approximately 23% of our employees are covered by two collective bargaining agreements with local unions in Cicero, Illinois and Neville Island, Pennsylvania. Collective bargaining agreements with our Neville Island and Cicero unions are scheduled to remain in effect through October 2012 and February 2014, respectively. We consider our union and employee relations to be satisfactory.
RAW MATERIALS
The primary raw material used in the construction of wind towers and gearing products is steel in the form of steel plate, forgings and castings. Although we are generally responsible for procurement of the raw materials, in some cases our customers source and retain title to steel plate which we convert into finished wind towers.
We operate a multiple supplier sourcing strategy and source our raw materials through various suppliers located throughout the U.S. and abroad. We do not generally have long-term supply agreements with any of our raw materials suppliers and closely match terms with those of our customers to limit our exposure to commodity price fluctuations. We believe that we will be able to obtain an adequate supply of steel and other raw materials to meet our manufacturing requirements, although from time to time we have faced shortages of specific grades of steel, which may limit our ability to meet customer demand and cause manufacturing inefficiencies.
QUALITY CONTROL
We have a long-standing focus on processes for ensuring the manufacture of high qualityhigh-quality products. To achieve high standards of production and operational quality, we implement strict and extensive quality control and inspection throughout our production processes. We maintain internal quality controls over all core manufacturing processes and carry out quality assurance inspections at the completion of each major manufacturing step to ensure the quality of our products. The manufacturing process at our Gearing operation, for example, involves transforming forged steel into highly technical specificationprecision gears through rough machining, hobbing, reinforcing thermal treatment, fine machininggear cutting, heat treating, testing and fine grinding.finishing. We inspect and test raw materials before they enter the assembly process, re-test the raw materials after rough machining, test the functioning of gear teeth and cores after thermal treatment and accuracy test final outputs for product specifications. We believe our investment in industry leadingindustry-leading heat treatment, high precision machining, specialized grinding technologies and cutting edgecutting-edge welding has contributed to our high product reliability and the consistent performance of our products under varying operating conditions. Our Gearing segment is ISO 9001:20002008 certified. Our tower manufacturing plant in Manitowoc, Wisconsin has received ISO 9001:20082010 certification, and our Abilene, Texas tower manufacturing plant is currently in the certification process.
CUSTOMERS
We manufacture products for and provide services to a variety of customers in the wind energy, oil and gas, mining and other infrastructure industries. The majority of our wind industry customer base consists of wind turbine manufacturers, who supply wind farm operators and wind farm developers with completed wind turbines. In the other industrial sectors, we sell our products through our trained sales force or through manufacturers' representatives to a wide variety of customers. The wind turbine market is very concentrated. According to AWEA's 2009the American Wind Energy Association ("AWEA") 2011 industry data, the top ten wind turbine manufacturers constituted over 99% of the North American market. As a result, our concentration with a limited number of customers accounted for the majority of our revenues. Sales to each of Gamesa and General Electric represented an amount greater than 10% of our consolidated revenues for the year ended December 31, 20102010; sales to each of Gamesa and Goldwind represented an amount greater than 10% of our consolidated revenues for the year ended December 31, 2011. The loss of one of these customers could have a material adverse effect on our business. This is down from 2009 when sales to each of four customers represented an amount greater than 10%As discussed as a component of our consolidated revenues for the year. We intend to continuebusiness strategies, we are seeking to diversify our customer base as we grow our business.
Our current portfolio of key customers includes: Clipper Windpower, Gamesa, Gardner Denver, General Electric, NexGen Energy Partners, Nordex, Siemens and Vestas.base.
WORKING CAPITAL
Our primary customers are wind turbine manufacturers, wind farm developers and wind farm operators. The industry has historically entered into customized contracts with varying terms and conditions between suppliers and customers, depending on the specific objectives of each party. Our practices mirror this historical industry practice for negotiating agreements on a case-by-case basis. As a result, working capital needs, including levels of accounts receivable and inventory, can vary
significantly from quarter to quarter based on the contractual terms associated with that quarter's sales, such as whether we are required to purchase and supply steel pursuant to such contractual terms.
Our most relevant internal metric to analyze our liquidity is operating working capital, which is comprised of accounts receivable and inventories, net of accounts payable and customer deposits. Our operating working capital at December 31, 2011 was $13,980, or 6% of trailing three months of sales annualized. This is an increase of $6,037 from December 31, 2010, when operating working capital was $7,943, or 4% of trailing three months of sales annualized. We anticipate our working capital needs to continue to grow in the future based on the transactional structural changes of raw material (steel) purchasing pursuant to orders for our Towers and Weldments segment, which remains our largest potential use of working capital.
CORPORATE INFORMATION
Our principal executive office is located at 47 East Chicago Avenue, Suite 332, Naperville, IL 60540. Our phone number is (630) 637-0315 and our website address iswww.bwen.com.
OTHER INFORMATION
On our website atwww.bwen.com, we make available under the "Investors" menu selection, free of charge, our Annual Reports on Form 10-K, Quarterly Reports on Form 10-Q, Current Reports on Form 8-K, and amendments to these reports filed or furnished pursuant to Section 13(a) or 15(d) of the Exchange Act as soon as reasonably practicable after such reports or amendments are electronically filed with, or furnished to, the Securities and Exchange Commission ("SEC"). Materials that we file or furnish to the SEC may also be read and copied at the SEC's Public Reference Room at 100 F Street, N.E., Washington, DC 20549. Information on the operation of the Public Reference Room may be obtained by calling the SEC at 1-800-SEC-0330. Also, the SEC maintains an Internet site atwww.sec.gov that contains reports, proxy and information statements, and other information that we file electronically with the SEC.
Risks Related to Our Business
Our businesses, and therefore our results of operations and financial condition, may continue to be adversely affected by dislocation in the global credit marketsnegative economic conditions and economic uncertainty.
The disruption in therecent global credit markets, the re-pricing of credit risk and the deterioration of the financial and real estate markets generally in recent years, particularly in the U.S. and Europe, have all contributed to a reduction in consumer spending and a contraction in global economic growth including the wind energy sector. The recession has had negative effects on demand for alternative sources of energy and consequently for many of our product and service offerings. Although there is a growing confidence thatsome parts of the global economieseconomy have resumed growth, there remains risk that thethis limited recovery may not be sustained, or that the recovery may not include the industries or markets in which we conduct our business. In addition, because there is a long lead-time between orders for wind productsbusiness, or that the economy may revert to further contraction and delivery, there is generally a lag before the impact of changed economic conditions affects our results,corresponding uncertainty and an improvement in economic conditions may not be reflected in our financial results of operations in a corresponding manner.volatility. Any deterioration in economic conditions could have a material adverse effect on our business in a number of ways, including lower sales and extended renewal cycles if there is a reduction in demand for wind energy, and such deterioration could have a material adverse effect on our liquidity, results of operations and financial condition.
In particular, risks we might face could include potential declines in revenues in our business segments due to reduced orders or other factors caused by economic challenges faced by our customers and prospective customers, and an inability to finance our operating needs on reasonable terms.
The U.S. wind industry is reliant on tax and other economic incentives and political and governmental policies. A significant change in these incentives and policies could negatively impact our results of operations and growth.
Our business segments are focused on supplyingWe supply products and services to wind turbine manufacturers and owners and operators of wind energy generation facilities. The U.S. wind industry is dependent in part upon federal tax incentives and state renewable portfolio standards and may not be
economically viable in its current form absent such incentives. The federal government provides economic incentives to the owners of wind energy facilities, including a federal production tax credit, an investment tax credit and a cash grant equal in value to the investment tax credit. The production tax credit was extended by the American Recovery and Reinvestment Act ("ARRA") in February 2009 and provides the owner of a qualifying wind energy facility placed in service before the end of 2012 with a ten-year tax credit against the owner's federal income tax obligations based on the amount of electricity generated by the qualifying wind energy facility and sold to unrelated third parties. Alternatively, wind project owners (i) may (i) elect to receive an investment tax credit equal to 30% of the qualifying basis of facilities placed in service before the end of 2012 or (ii) for facilities placed in service in 2009 through 2011 (or, if construction beginsbegan before the end of 2011, placed in service before the end of 2012), applycould have applied to receive a cash grant from the Department of Treasury, equal in value to the investment tax credit.
These programs, many of which expire at the end of 2012, provide material incentives to develop wind energy generation facilities and thereby impact the demand for our manufactured products and services. The increased demand for our products and services resultingthat generally results from the credits and incentives may continue until such credits or incentives lapse. Thehas been impacted by the pending expiration of these programs at the end of 2012. Because of the long lead times necessary to develop wind energy projects, the failure of Congress to extend or renew these incentives beyond their current expiration dates could significantlyin 2012 has already negatively impacted potential wind energy installations planned for 2013. The failure to immediately renew or extend these incentives will likely further delay the development of wind energy generation facilities and the demand for wind turbines, towers, gearing and related components. In addition, we cannot assure you that any subsequent extension or renewal of the production tax credit, investment tax credit or cash grant program will be enacted prior to its expiration or, if allowed to expire, that any extension or renewal enacted thereafter would be enacted with retroactive effect. It is possible that these federal incentives will not be extended beyond their current expiration dates. AnyAlthough we believe that the production tax credit may be renewed or extended in 2012 or 2013, the duration thereof and whether such extension or renewal will be retroactive is unclear. Moreover, we currently believe it is unlikely that the investment tax credit and cash grant program will be renewed or extended in 2012 or 2013. The continued delay or failure to extend or renew the federal production tax credit, investment tax creditthese or cash grant programsimilar incentives in the future could have a
material adverse impact on our business, results of operations, financial performance and future development efforts.
State renewable energy portfolio standards generally require or encourage state-regulated electric utilities to supply a certain proportion of electricity from renewable energy sources or devote a certain portion of their plant capacity to renewable energy generation. Typically, utilities comply with such standards by qualifying for renewable energy credits evidencing the share of electricity that was produced from renewable sources. Under many state standards, these renewable energy credits can be unbundled from their associated energy and traded in a market system, allowing generators with insufficient credits to meet their applicable state mandate. These standards have spurred significant growth in the wind energy industry and a corresponding increase in the demand for our manufactured products. Currently, the majority of states and the District of Colombia have renewable energy portfolio standards in place and certain states have voluntary utility commitments to supply a specific percentage of their electricity from renewable sources. The enactment of renewable energy portfolio standards in additional states or any changes to existing renewable energy portfolio standards (including changes due to the failure to renew or extend the federal incentives described above), or the enactment of a federal renewable energy portfolio standard or imposition of other greenhouse gas regulations, may impact the demand for our products.products and services. We cannot assure you that government support for renewable energy will continue. The elimination of, or reduction in, state or federal government policies that support renewable energy could have a material adverse impact on our business, results of operations, financial performance and future development efforts.
Our diversification outside of the wind energy market exposes us to business risks associated with the oil and gas and mining industries, among others, which may slow our growth or penetration in these markets.
While we have some experience in the oil and gas and mining markets through our gearing and specialty weldments businesses, these industries have not been our primary focus. In further diversifying our business to serve these markets we will face competitors who may have more resources, longer operating histories and more well-established relationships than we do, and we may not be able to successfully or profitably generate additional business opportunities in these industries. Moreover, if we are able to successfully diversify into these markets our business may be exposed to risks associated with these industries, which could adversely affect our future earnings and growth. These risks include, among other things:
We could incur substantial costs to comply with environmental, health and safety laws and regulations and to address violations of or liabilities under these requirements.
Our operations are subject to a variety of environmental, health and safety laws and regulations in the jurisdictions in which we operate and sell products governing, among other things, air emissions, wastewater discharges,health, safety, pollution and protection of the environment and natural resources, including the use, handling, transportation, and disposal of non-hazardous and hazardous materials soil and wastes, as well as emissions and discharges into the environment, including discharges to air, surface water, groundwater contamination, employee health and safety, and soil,
product content, performance and packaging. We cannot guarantee that we have been or will at all times be in compliance with such laws and regulations, and if we failregulations. Failure to comply with
these laws and regulations, obtain the necessary permits to operate our business, or comply with the terms and conditions of such permits may subject us to a variety of administrative, civil and criminal enforcement measures, including the imposition of civil and criminal sanctions, monetary fines and penalties, remedial obligations, and the issuance of compliance requirements limiting or preventing some or all of our permitting and other requirements, we may be required to pay fines, limit production at our facilities or beoperations.
We also are subject to other sanctions. Also, certain environmental laws can impose all or a portion of the cost of investigating and cleaning up a contaminated site, regardless of fault, upon any one or more of a number of parties, including the current or previous owner or operator of the site. These environmental laws alsoregulations that impose liability on any person who arrangesand cleanup responsibility for the disposal or treatment of hazardous substances at a contaminated site. Third parties may also make claims against owners or operators of sites and users of disposal sites for personal injuries and property damage associated with releases of hazardous substances from those sites.into the environment. Under certain of these laws and regulations, such liabilities can be imposed for cleanup of currently and formerly owned, leased or operated properties, or properties to which hazardous substances or wastes were sent by current or former operators at our current or former facilities, regardless of whether we directly caused the contamination or violated any law at the time of discharge or disposal. Many of our facilities have a history of industrial operations, and contaminants have been detected at some of our facilities. The presence of contamination from hazardous substances or wastes could interfere with ongoing operations or adversely affect our ability to sell, lease or use our properties as collateral for financing. We also could be held liable under third-party claims for property damage, natural resource damage, or personal injury and for penalties and other damages under such environmental laws and regulations, which could materially and adversely affect our business and results of operations.
We are aware of an investigation commenced by the United States Attorney's Office, Northern District of Illinois, for potential violation of federal environmental laws. On February 15, 2011, pursuant to a search warrant, officials from the United States Environmental Protection Agency ("USEPA") entered and conducted a search of one of our facilities in Cicero, Illinois. Also onIllinois, in connection with the alleged improper disposal of industrial wastewater to the sewer. On or about February 15,11, 2011, in connection with the same matter, we received a grand jury subpoena requesting testimony and the production of certain documents relating to the facility's past compliance with certain environmental laws and regulations relating to the generation, discharge and disposal of wastewater from certain of our processes frombetween 2004 toand the present. On or about February 23, 2011, we also received an additionalanother grand jury subpoena relating to the same investigation, requesting testimony and the production of certain other documents relating to certain of ourthe facility's employees, and environmental and manufacturing processes.processes, and disposal practices. We do not currently have informationproduced e-mails, reports and correspondence as requested in response to whenthese subpoenas. We have also voluntarily instituted corrective measures at the investigation may be concluded, and we are also conducting an internal investigation of any possible noncompliance. At this time, we have not been formally notified that we are a subject or target of the investigation and no fines or penalties have been suggested.facility, including changes to our wastewater disposal practices. There can be no assurances that the conclusion of the investigation will not result in a determination that we have violated applicable laws. If we areenvironmental, health and safety laws and regulations. Any violations found, to have violated such laws, weor any criminal or civil fines, penalties and/or other sanctions imposed could be subject to fines, civil penaltiessubstantial and criminal penalties. In connection with this investigation, we have recorded a liability of $675 at December 31, 2010, which represents the low end of our estimate of costsmaterially and expenses that have been incurred, or which are expected to be incurred during 2011. Due to the preliminary nature of the investigation, it is reasonably possible that our estimate of the obligation may change in the near term.adversely affect us.
The assertion of further claims relating to on-regulatory compliance, on or off-site contamination, natural resource damage, the discovery of previously unknown environmental liabilities, or the imposition of unanticipatedcriminal or civil fines or penalties, or the obligation to undertake investigation, remediation or cleanup obligationsmonitoring activities could result in potentially significant costs and expenditures to address contamination or resolve claims or liabilities. Such costs and expenditures could have a material adverse effect on our business, financial condition, or results of operations.
Changes in existing environmental, health and safety laws and regulations, or their application, could cause us to incur additional or unexpected costs to achieve or maintain compliance. Our facilities emit greenhouse gases which may be subject to pending or future environmental laws or regulations, which could cause us to incur additional or unexpected costs to achieve and maintain compliance.
Our financial and operating performance is subject to certain factors which are out of our control, including prevailing economic conditions and the state of the wind energy market in North America.
As a supplier of products and services to wind turbine manufacturers and owners and operators of wind energy generation facilities, our results of operations (like those of our customers) are subject to general economic conditions, and specifically, to the state of the wind energy market. In addition to the state and federal government policies supporting renewable energy described above, the growth and development of the larger wind energy market in North America is subject to a number of factors, including, among other things:
In addition, while some of the factors listed above may only affect individual wind project developments or portions of the market, in the aggregate they may have a significant effect on the successful development of the wind energy market as a whole, and thus affect our operating and financial results.
We are substantially dependent on a few significant customers.
The wind turbine market in the U.S. is very concentrated, with ten manufacturers controlling in excess of 99% of the market. Like us, these customers were adversely affected by the recent downturn in the economy and the wind energy market, and we have seen, and may continue to see, a decrease in order volume from such customers. Historically, the majority of our revenues are highly concentrated with a limited number of customers. In 2010,2011, two customers—Gamesa and General Electric—Goldwind—each accounted for more than 10% of our consolidated revenues and our five largest customers accounted for 78%76% of our consolidated revenues. Our customers periodically have expressed their intent to scale back, delay or restructure existing customer agreements, which has led to reduced revenues from these customers and which may occur again in the future. As a result, our operating profits and gross margins have been negatively affected by a decline in production levels, which has created production volume inefficiencies in our operations and cost structures.
Additionally, if our relationships with significant customers should change materially, it could be difficult for us to immediately and profitably replace lost sales in a market with such concentration, which would materially adversely affect our results. We could be adversely impacted by decreased customer demand for our products and services due to (1) the impact of current or future economic conditions on our customers, (2) our customers' loss of market share to competitors of theirs that do not use our products, and (3) our loss of market share with our customers. We could lose market share with our customers to competitors or to our customers themselves, should they decide to become more vertically integrated and produce our products or deliver ourthe services we provide internally. Finally,
most of our customers do not purchase all of our products and services, so if some of our customers gain market share, it could impact our mix of products and services among our segments.
In addition, even if our customers continue to do business with us, we can be adversely affected by a number of other potential developments with our customers. For example:
Our customers may be significantly affected by disruptions and volatility in the economy and in the wind energy market.
Current market disruptions and regular market volatility may have adverse impacts on our customers' ability to pay when due the amounts payable to us and could cause related increases in our working capital or borrowing needs. In addition, our customers have in the past attempted and may attempt in the future to renegotiate the terms of contracts or reduce the size of orders with us as a result of disruptions and volatility in the markets. Our backlog is significant, but we cannot predict with any degree of certainty the amount of our backlog that we will ultimately ship to our customers.
Market disruptions and regular market volatility may also result in an increased likelihood of our customers asserting warranty or remediation claims in connection with our products or services that they would not ordinarily assert in a more stable economic environment. In the event of such a claim, we may incur costs if we decide to compensate the affected customer or to engage in litigation against the affected customer regarding the claim. We maintain product liability insurance, but there can be no guarantee that such insurance will be available or adequate to protect against such claims. A successful claim against us could result in a material adverse effect on our business.
We may have difficulty raisingobtaining additional financing when needed or on acceptable terms and there can be no assurances that our operations will generate cash flows in an amount sufficient to enable us to pay our indebtedness.
We rely on banks and capital markets as a source of liquidity for capital requirements not satisfied by cash flows from operations. Whileoperations or asset sales. We have experienced operating losses for each of the years during which we have operated and we anticipate that we will incur additional expenses in the
near term in connection with our current cash resourcescontemplated restructuring efforts. We expect to fund our facility restructuring efforts in part by using proceeds from the sale of surplus assets. We may be unable to complete these sales on a timely basis, and cash generated through our operations and credit line will be adequate to meet our liquidity needs for at least the next twelve months, our committed sources of liquidity may be inadequate to satisfy our operational and restructuring needs. There can be no assurances that our restructuring efforts will be successful in improving our profitability. If we are not able to access capital at competitive rates, the ability to implement our business plans may be adversely affected. Additionally, we have a limited number of shares of common stock authorized for issuance under our certificate of incorporation after the consummation of our stock offering in the third quarter of 2011; accordingly, our ability to raise capital through future equity issuances may be restricted unless we are successful in increasing the number of authorized shares of common stock, which would require the approval of holders of a majority of our outstanding shares. In the absence of access to capital resources, we could face substantial liquidity problems and might be required to dispose of material assets or operations at times when the prices for such assets are depressed. In such event, we may not be able to consummate those dispositions. Furthermore, the proceeds of any such dispositions may not be adequate to meet our debt service obligations when due.
Additionally, our ability to make scheduled payments on our existing or future debt obligations and fund operations will depend on our future financial and operating performance. While we believe we will continue to have sufficient cash flows to operate our businesses, thereThere can be no assurances that our operations will generate sufficient cash flows to enable us to pay our remaining indebtedness or to fund our other liquidity needs. If we cannot make scheduled payments on our debt, we will be in default and, as a result, among other things, our debt holders could declare all outstanding principal and interest to be due and payable which could force us to liquidate certain assets or substantially restructure or alter our business operations or debt obligations. Moreover, if we are unable to obtain additional capital or if our current sources of financing are reduced or unavailable, we will likely be
required to delay, reduce the scope of, or eliminate our plans for expansionrestructuring and growthexpansion and this could affect our overall operations.
GrowthOur plans for growth and diversification through acquisitions and internal expansion may not be successful, and could result in poor financial performance.
To executeIn 2011, approximately 73% of our business strategy,revenue was derived through the sale of our products and services tied to new wind energy installations in the U.S. While we anticipate that economic conditions within the wind industry may seek to acquire new businesses. We may notbe strong in the second and third quarters of 2012, we can provide no assurances that long-term improved market conditions within the wind industry will occur or that we will be able to identify appropriate acquisition candidatescapitalize on these opportunities. Moreover, the failure to immediately extend or successfully negotiate, financerenew the federal production tax credit or integrate acquisitions.other federal incentive programs will likely have a material adverse impact on our wind energy business, results of operations, financial performance and future development efforts. A continued or prolonged economic slowdown in the wind industry or other unfavorable market factors could result in further revisions to our expectations with respect to future financial results and cash flows. In response to these conditions, we have made a strategic decision to diversify our business further into oil, gas, mining, and other industries, particularly within our gearing and specialty weldments businesses. While we have historically participated in these lines of business, there is no assurance that we will be able to grow our presence in these businesses at a rate sufficient to compensate for a potentially weaker wind energy market. Moreover, our participation in these markets may require additional investments in personnel, equipment and operational infrastructure. If we are unable to make acquisitions, wefurther penetrate these markets, our plans to diversify our operations may not be unable to realize thesuccessful and our anticipated future growth we anticipate. Future acquisitions could involve numerous risks including difficulties in integrating the operations, services, products and personnel of the acquired business, and the potential loss of key employees, customers and suppliers of the acquired business. If we are unable to successfully manage these acquisition risks, future earnings may be adversely affected.
We may also grow our existing business through increased production levels at existing facilities and through expansion to new manufacturing facilities and locations, such as our recently completed drivetrain service center in Abilene, Texas. Such expansion and any future expansion will require coordinated efforts across the Company and continued enhancements to our current operating
infrastructure, including management and operations personnel, systems and equipment, and property. Difficulties or delays in acquiring and effectively integrating any new facilities may adversely affect future performance. For example, we recorded higher costs in 2009 in connection with the startup of production at our Abilene, Texas tower manufacturing facility. Moreover, if our expansion efforts do not adequately predict the demand of our customers and our potential customers, our future earnings may be adversely affected.
We face competition from industry participants who may have greater resources than we do.
Our businesses are subject to risks associated with competition from new or existing industry participants who may have more resources and better access to capital. Many of our competitors and potential competitors may have substantially greater financial, customer support, technical and marketing resources, larger customer bases, longer operating histories, greater name recognition and more established relationships in the industry than we do. Among other things, these industry participants compete with us based upon price, quality, location and available capacity. We cannot be sure that we will have the resources or expertise to compete successfully in the future. Some of our competitors may also be able to provide customers with additional benefits at lower overall costs to increase market share. We cannot be sure that we will be able to match cost reductions by our competitors or that we will be able to succeed in the face of current or future competition. In addition, we may face competition from our customers as they seek to be more vertically integrated and offer full service packages. Some of our customers are also performing more services themselves.
We have generated net losses and negative cash flows since our inception.
We have experienced operating losses for each of the years during which we have operated. In addition, in light of current economic conditions and the state of the wind energy market in the U.S., we anticipate that losses and periods of negative cash flow may occur in the foreseeable future. We have incurred significant costs in connection with the development of our businesses, and there is no assurance that we will achieve sufficient revenues to offset anticipated operating costs. Although we anticipate deriving revenues from the sale of our products and services, no assurance can be given that these products and services can be sold on a profitable basis. If we achieve profitability, we cannot give any assurance that we would be able to sustain or increase profitability on a quarterly or annual basis in the future.
Limitations on our ability to utilize our net operating losses may negatively affect our financial results.
We may not be able to utilize all of our net operating losses. To the extent available, we will use any net operating loss carryforwards to reduce the U.S. corporate income tax liability associated with our operations. However, if we do not achieve profitability prior to their expiration, we will not be able to fully utilize our net operating losses to offset income. For financial statement presentation, all benefits associated with the loss carryforwards have been reserved. Section 382 of the Internal Revenue Code of 1986, as amended ("the IRC"), generally imposes an annual limitation on the amount of net operating loss carryforwards that may be used to offset taxable income when a corporation has undergone certain changes in stock ownership. Our ability to utilize net operating loss carryforwards and built-in losses may be limited, under this section or otherwise, by our issuance of common stock or by other changes in stock ownership. Upon completion of our analysis of IRC Section 382, we have determined that aggregate changes in our stock ownership have triggered an annual limitation of net operating loss carryforwards and built-in losses available for utilization. Although this event limits the amount of pre-ownership change date net operating losses and built-in losses we can utilize annually, it would not preclude us from fully utilizing our current carryforwards prior to their expiration. To the extent our use of net operating loss carryforwards and associated built-in losses is significantly limited in the future due to additional changes in stock ownership, our income could be subject to U.S.
We may not becorporate income tax earlier than it would if we were able to identify alternative uses, sell or otherwise dispose of our wind tower manufacturing facilityuse net operating loss carryforwards and built-in losses without annual limitation, which could result in Brandon, South Dakota.
In the first quarter of 2010, we completed construction of a third wind tower manufacturing facility in Brandon, South Dakota, but as of the date hereof, we have not commenced production at this facility. Following the Company's strategic planning meetings that took place in the fourth quarter of 2010, we determined that due to the oversupply of capacity in the U.S. tower marketlower profits and the significant levelloss of towers importedbenefits from Asia, it would be difficult or impossible to operate this facility in a profitable or cost-effective manner. We are currently exploring alternative uses for the building and equipment comprising this facility. In connection with this determination, during the fourth quarter of 2010, we recorded an impairment charge of $13.3 million. We may elect to sell or otherwise dispose of the facility and equipment, or use them for a different business purpose. If we are unable to find an alternative use or are unable to sell or otherwise dispose of the facility and equipment, we would continue to incur significant fixed costs associated with ownership of the facility. There can be no assurance that we will be able to identify alternate uses, sell or otherwise dispose of the facility and equipment on terms deemed to be commercially reasonable by us.these attributes.
Our future operating results and the market price of our common stock could be materially adversely affected if we are required to take additional write downswrite-downs to the carrying value of long-lived assets associated with any of our operating segments in the future.
We review our long-lived assets, including intangibles, for impairment whenever events or changes in circumstances indicate the carrying amounts of these assets may not be recoverable. Recoverability is measured by a comparison of the assets' carrying amount to their expected future undiscounted net cash flows. If such assets are considered to be impaired, the impairment to be recognized is measured based on the amount by which the carrying amount of the asset exceeds its fair value.
In addition to the impairment related to our Brandon, South Dakota wind tower manufacturing facility, during the fourth quarter of 2010 we performed a review of other long-lived assets and concluded that the projected fair value of the Services segment assets was less than the carrying value. As a result, we recorded an impairment charge of $22.9 million related to intangible and other long-lived assets.
In the future, if our projected undiscounted cash flows associated with our operating segments do not exceed the carrying value of their net assets, we may be required to record additional write-downs of the carrying value of intangible assets or other long-lived assets associated with any of oursuch operating segments and our operating results and the market price of our common stock may be materially adversely affected.
Disruptions in the supply of parts and raw materials, or changes in supplier relations, may negatively impact our operating results.
We are dependent upon the supply of certain raw materials used in our production process, and these raw materials are exposed to price fluctuations on the open market. Raw material costs for items such as steel, the primary raw material used by us, have fluctuated significantly and may continue to fluctuate. To reduce price risk caused by market fluctuations, we have generally incorporated price adjustment clauses in our sales contracts. However, limitations on availability of raw materials or increases in the cost of raw materials (including steel), energy, transportation and other necessary services may impact our operating results if our manufacturing businesses are not able to fully pass on the costs associated with such increases to their respective customers. Alternatively, we will not realize material improvements from declines in steel prices as the terms of many of our contracts providerequire that we pass through these costscost savings to our customers.
In addition, we may encounter supplier constraints, be unable to maintain favorable supplier arrangements and relations or be affected by disruptions in the supply chain caused by such events as natural disasters, power outages and labor strikes. In the event of significant increases or decreases in the price of raw materials, particularly steel, our margins and profitability could be negatively impacted.
If our projections regarding the future market demand for our products and services are inaccurate, our operating results and our overall business may be adversely affected.
We hadhave previously made significant capital investments in anticipation of rapid growth in the U.S. wind energy market. However, the growth in the U.S. wind energy market has not kept pace with the expectations we had when some of these capital investments were made, and there can be no assurance that the U.S. wind energy market will grow and develop in a manner consistent with our past expectations.expectations, or that we will be able to fill our idle capacity through the further diversification of our operations. The expansion of our internal manufacturing and service capabilities has required significant up-front fixed costs. If market demand for our products and services does not increase at the pace we have anticipated and align with our expanded manufacturing capacity, we may be unable to offset these costs and to achieve economies of scale, and our operating results may continue to be adversely affected as a result of high fixed costs, reduced margins and underutilization of capacity. In light of these considerations, we may be forced to temporarily idle existing capacity or sell to third
parties manufacturing capacity that we cannot utilize in the near term. Alternatively, if we experience rapid demand for our products and services in excess of our estimates, or we have reduced our manufacturing capacity, our installed capital equipment and existing workforce may be insufficient to support higher production volumes, which could harm our customer relationships and overall reputation. In addition, we may not be able to expand our workforce and operations in a timely manner, procure adequate resources, or locate suitable third-party suppliers, to respond effectively to changes in demand for our existing products and services or to the demand for new products and services requested by our customers, and our business could be adversely affected. Our ability to meet such excess customer demand could also depend on our ability to raise additional capital and effectively scale our manufacturing operations.
If our estimates for warranty expenses differ materially from actual claims made, or if we are unable to reasonably estimate future warranty expense for our products and services, our business and financial results could be negatively affected.
We provide warranty terms generally ranging between one and seven years to our tower, gearing and services customers depending upon the specific product or service and terms of the customer agreement. We reserve for warranty claims based on industry experience and estimates made by management based upon a percentage of our sales revenues related to such products or services. From time to time, customers have submitted warranty claims againstto us. However, we have a limited history on which to base our warranty estimates for certain products that we manufacture and services that we provide. Our assumptions could be materially different from the actual performance of our products in the future and could exceed the levels against which we have reserved. In some instances our customers have interpreted the scope and coverage of certain of our warranty provisions differently from our interpretation of such provisions. The expenses associated with remediation activities in the wind energy industry can be substantial, and if we are required to pay such costs in connection with a customer's warranty claim we could be subject to additional unplanned cash expenditures. If our estimates prove materially incorrect, or if we are required to cover remediation expenses in addition to our regular warranty coverage, we could be required to incur additional expenses and could face a material unplanned cash expenditure, which could harm our financial and operating results.
Material weaknesses or other deficiencies in our internal controls over financial reporting, including potential failure to prevent or detect errors or fraud, could affect the accuracy of our reported financial results.
We are required to design, implement and maintain effective controls over financial reporting. A material weakness is a deficiency, or a combination of deficiencies, in internal control over financial reporting such that there is a reasonable possibility that a material misstatement of a company's annual or interim financial statements will not be prevented or detected on a timely basis.
As referenced in Item 9A, "Controls and Procedures" of this Annual Report on Form 10-K, management of the Company has determined that as of December 31, 2010, the Company maintained effective controls over financial reporting. However, in each of 2008 and 2009 management concluded that the Company had material weaknesses over its internal controls over financial reporting. While we have now remediated these past material weaknesses and believe that we have designed and implemented procedures to maintain effective controls over financial reporting, we cannot be certain that we will not in the future have material weaknesses or significant deficiencies in our internal controls over financial reporting, or that we will successfully remediate any weaknesses or deficiencies that we find. Internal control weaknesses or deficiencies in the future could affect our ability to complete our financial reporting on a timely basis or report accurate numbers. If we are not able to maintain the requirements of Section 404 of the Sarbanes-Oxley Act of 2002 ("Sarbanes-Oxley") in a timely manner or with adequate compliance, we may be subject to sanctions or investigation by regulatory authorities. This type of action could adversely affect our financial results or investors' confidence in our company and our ability to access capital markets, and could cause our stock price to decline.
Trade restrictions may present barriers to entry in certain international markets.
Restrictions on trade with certain international markets could affect our ability to expand into those markets. In addition, the existence of government subsidies available to our competitors in certain countries may affect our ability to compete on a price basis.
We may be unable to keep pace with rapidly changing technology in wind turbine component and other industrial manufacturing.
The global market for wind turbines, as well as for other industrial components we manufacture, is rapidly evolving technologically. Our component manufacturing equipment and technology may not be suited for future generations of products being developed by wind turbine companies. For example, some wind turbine manufacturers are using wind turbine towers made from concrete instead of steel. Other wind turbine designs have reduced the use of gearing or eliminated the gearbox entirely through the use of direct or compact drive technologies. To maintain a successful business in our field, we must keep pace with technological developments and changing standards of our customers and potential customers and meet their constantly evolving demands. If we fail to adequately respond to the technological changes in our industry, or are not suited to provide components for new types of wind turbines, our net worth, financial condition and operating results may be adversely affected.
We rely on unionized labor, the loss of which could adversely affect our future success.
We are dependent on the services of unionized labor and have collective bargaining agreements with certain of our operations workforce at our Cicero, Illinois and Neville Island, Pennsylvania gearing facilities. The loss of the services of these and other personnel, whether through terminations, attrition, labor strike, or otherwise, or a material change in our collective bargaining agreements, could have a material adverse impact on us and our future profitability. Collective bargaining agreements have been ratified by collective bargaining units in place at our Cicero Illinois and Neville Island Pennsylvania facilities and expire in February 2014 and October 2012, respectively. As of December 31, 2010,2011, our collective bargaining units represented approximately 23% of our workforce.
We need to hire additional qualified personnel, including management personnel, and the loss of our key personnel could harm our business.
Our future success will depend largely on the skills, efforts and motivation of our executive officers and other key personnel. Our success also depends, in large part, upon our ability to attract and retain highly qualified management and key personnel throughout our organization. During 2011,the remainder of 2012, we will likely need to hire additional personnel, including management, engineering and sales personnel, to fill in our organization. We face competition in the attraction and retention of personnel who possess the skill sets that we seek. In addition, key personnel may leave our company and subsequently compete against us. The loss of the services of any of our key personnel, or our failure to attract and retain other qualified and experienced personnel on acceptable terms, could have a material adverse effect on our business, results of operations, or financial condition.
Our ability to comply with regulatory requirements is critical to our future success and our current level of controls cannot guarantee that we are in compliance with all such requirements.
As a manufacturer and distributor of wind and other energy industry products we may be or become subject to the requirements of federal, state and local or foreign regulatory authorities. In addition, we are subject to a number of industry standard-setting authorities, such as the American Gear Manufacturers Association and the American Welding Society. Changes in the standards and requirements imposed by such authorities could have a material adverse effect on us. In the event we are unable to meet any such standards when adopted, our business could be adversely affected. We may not be able to obtain all regulatory approvals, licenses and permits that may be required in the future, or any necessary modifications to existing regulatory approvals, licenses and permits, or maintain all required regulatory approvals, licenses and permits.
There can be no guarantee that our businesses are in full compliance with such standards and requirements. We continue to develop our internal controls with a goal of providing a greater degree of certainty that our businesses are in compliance with applicable governmental and regulatory requirements, but our current level of internal control may fail to reveal to us material instances of non-compliance with such requirements, and such non-compliance could have a material adverse effect on our business.
Our principal stockholder hasCertain stockholders have the ability to influence our affairs significantly.
Tontine Capital Management, L.L.C. ("TCM"), Tontine Capital Overseas GP, L.L.C. ("TCO"), Tontine Management, L.L.C. ("TM"), Tontine Overseas Associates, L.L.C. ("TOA"), Tontine Capital Overseas Master Fund II, L.P. ("TCP II"), Tontine Assets Associates, L.L.C. ("TAA"), Tontine Power Partners, L.P. ("TPP") and Tontine Associates, L.L.C. ("TA,"TA", and collectively with TCM, TCO, TM, TOA, TCP II, TAA and TPP and their affiliates, "Tontine") owns approximately 18.3%12.7% of our outstanding common stock. Although Tontine currently does not have any representatives on our Board of Directors, Tontine has, and for so long as they hold at least 10% of our then issued and outstanding
common stock will continue to have, the right to designate two individuals on our Board of Directors pursuant to a Securities Purchase Agreement entered into with Broadwind in August 2007. As a result, Tontine may have the ability to significantly influence our policies, business and affairs, and the outcome of any corporate transaction or other matter, including mergers, consolidations and the sale of all, or substantially all, of our assets. Tontine's significant ownership level may have the effect of delaying, deterring or preventing a change in control that otherwise could result in a premium in the price of our common stock. In addition, the actions of Tontine may have the effect of influencing changes in control or changes in management, or limiting the ability of our other stockholders to approve transactions that they may deem to be in their best interest.
Table In addition, Special Situations Fund III QP, L.P. ("SSFQP"), Special Situations Cayman Fund, L.P. ("SSF Cayman"), Special Situations Technology Fund, L.P. ("SSFTF"), and Special Situations Technology Fund II, L.P. ("SSFTF II," and collectively with SSFQP, SSF Cayman, and SSFTF and their affiliates, "SSF"), owns approximately 22% of Contentsour outstanding common stock. As a result of such ownership, SSF may be able to influence certain matters which are subject to stockholder action.
We may not have the technical expertise and we may be unable to secure the necessary patents or other intellectual property rights needed to successfully market new products that we may develop.
A key element of our business and operating strategy is to exploit our technological ability to design new manufacturing and service processes and products to take advantage of the anticipated growth in the North American wind market. Historically, we have not developed patented technology or engaged in technical design work on a significant scale. If we are unable to develop new manufacturing and service processes and products that are attractive to our customers and potential customers, or if we are unable to secure the necessary patents or other intellectual property rights needed to prevent our competitors from developing and marketing substantially similar products, we could experience a material adverse effect on our business and results of operations.
Current or future litigation and regulatory actions could have a material adverse impact on us.
From time to time, we are subject to litigation and other legal and regulatory proceedings relating to our business. We are currently defendants in a number of litigation matters and the subject of an investigation by the SEC as further described under the heading "Legal Proceedings" in this report. No assurances can be given that the results of these or new matters will be favorable to us. An adverse resolution of lawsuits, investigations or arbitrations could have a material adverse effect on our financial condition and results of operations. Defending ourselves in these matters may be time-consuming, expensive and disruptive to normal business operations and may result in significant expense and a diversion of management's time and attention from the operation of our business, which could impede our ability to achieve our business objectives. Additionally, any amount that we may be required to pay to satisfy a judgment or settlement may not be covered by insurance. Under our charter and the indemnification agreements that we have entered into with our officers, directors and certain third parties, we are required to indemnify and advance expenses to them in connection with their participation in certain proceedings. There can be no assurance that any of these payments will not be material.
We cannot insure against all potential risks and may have difficulty insuring our business activities or become subject to increased insurance premiums.
Our business is subject to a number of risks, including inherent risks associated with manufacturing and service and construction support for wind turbines. To mitigate the risks associated with our business, we have obtained various insurance policies. However, our insurance policies have high deductibles in certain instances and do not cover losses as a result of certain events such as terrorist attacks.events. In addition, our insurance policies are subject to annual review by our insurers and these policies may not be renewed
at all or on similar or favorable terms. If we were to incur a significant uninsured loss or a loss in excess of the limits of our insurance policies, the results could have a material adverse effect on our business, financial condition and results of operations.
We may fail to meet continued listing requirements with NASDAQ.
We must comply with numerous NASDAQ Marketplace rules in order to maintain the listing of our common stock, which includes maintaining a minimum closing bid price of at least $1.00 per share for our common stock. On September 19, 2011, we received a notification letter from NASDAQ advising us that for 30 consecutive trading days preceding the date of the notice, the bid price of our common stock had closed below the $1.00 per share minimum required for continued listing on the NASDAQ Global Select Market pursuant to NASDAQ's minimum bid price rule. The notice has no effect on the listing of our common stock at this time and our common stock will continue to trade on the NASDAQ under the symbol "BWEN". The notice also stated that we will be provided 180 calendar days, or until March 19, 2012, to regain compliance with the minimum bid price rule. In December 2011, we changed the listing of our common stock from the NASDAQ Global Select Market to the NASDAQ Capital Market. In February 2012, we requested from the NASDAQ Capital Market an additional 180 day period to regain compliance with the minimum bid price rule. Provided that we meet all applicable standards for initial listing on the NASDAQ Capital Market (with the exception of the minimum bid price rule), we believe we will be granted an additional 180 calendar days, or until September 15, 2012, to regain compliance. To regain compliance with the minimum bid price rule, the bid price of our common stock must close at or above $1.00 per share for a minimum of ten consecutive trading days. If compliance with the minimum bid price rule cannot be demonstrated by September 15, 2012, or, if we do not receive the 180 calendar day compliance period extension, NASDAQ will provide a written notification to us that our common stock is subject to delisting.
We intend to continue to monitor the bid price for our common stock. If our common stock does not trade at a level that is likely to regain compliance with the NASDAQ requirements, our Board of Directors will consider other options that may be available to achieve compliance, including, but not limited to, seeking implementation of a reverse stock split, which would require approval of our stockholders. There can be no assurance that we would be successful in obtaining the approvals necessary to effect a reverse stock split or that, following any reverse stock split, the per share price of our common stock would remain above $1.00 per share. If we are unable to regain compliance, our common stock will be delisted by NASDAQ. If we were to be delisted from NASDAQ, our common stock could be subject to "penny stock" rules which could negatively impact our liquidity and our stockholders' ability to sell their shares.
ITEM 1B. UNRESOLVED STAFF COMMENTS
None.
Our corporate headquarters is located in Naperville, Illinois, which is a suburb located west of Chicago, Illinois. In addition, our subsidiaries own or lease operating facilities, which are presented by operating segment as follows:
Operating Segment and Facility Type | Location | Leased | Approximate Square Footage | |||||
|---|---|---|---|---|---|---|---|---|
Towers and Weldments | ||||||||
Tower Manufacturing | Manitowoc, WI | Leased | 200,000 | |||||
Tower Manufacturing | Abilene, TX | Owned | 146,000 | |||||
Tower Manufacturing | Brandon, SD(1) | Owned | 146,000 | |||||
Specialty Structures | Manitowoc, WI | Leased | 45,000 | |||||
Specialty Structures | Clintonville, WI | Owned | 63,000 | |||||
Gearing | ||||||||
Gearing System Manufacturing—Finishing | Cicero, IL | Owned | ||||||
Gearing System Manufacturing—Machining | Cicero, IL | Leased | 301,000 | |||||
Gearing System Manufacturing—Heat Treatment | Neville Island, PA | Owned | 70,000 | |||||
Services | ||||||||
Service and Maintenance | Gary, SD | Leased | 25,000 | |||||
Service and Maintenance | Abilene, TX | Leased | 297,000 | |||||
Service and Maintenance | Howard, SD | Owned | 25,000 | |||||
Service and Maintenance | Tehachapi, | Leased | 5,000 | |||||
Corporate | ||||||||
Administrative | Naperville, IL | Leased | 6,800 | |||||
We consider that our facilities are in good condition and are adequate for our present and future needs.
Shareholder Lawsuits
On February 11, 2011, a putative class action was filed in the United States District Court for the Northern District of Illinois, Eastern Division, against Broadwindthe Company and certain of its current or former officers and directors. The lawsuit is purportedly brought on behalf of purchasers of ourthe Company's common stock between March 17, 2009 and August 9, 2010. A lead plaintiff has been appointed and an amended complaint was filed on September 13, 2011. The amended complaint names as additional defendants certain of the Company's current and former directors, certain Tontine entities, and Jeffrey Gendell, a principal of Tontine. The complaint seeks to allege that the defendants violated Section 10(b) of the Exchange Act, and Rule 10b-5 promulgated thereunder, andand/or Section 20(a) of
the Exchange Act by issuing or causing to be issued a series of allegedly false and/or misleading statements concerning ourthe Company's financial results, operations, and prospects, including with respect to the January 2010 secondary public offering of ourthe Company's common stock. The plaintiffs allege that the Company's statements were false and misleading because, among other things, the Company's reported financial results during the class period allegedly violated generally accepted accounting principles because they failed to reflect the impairment of goodwill and other intangible assets, and the Company allegedly failed to disclose known trends and other information regarding certain customer relationships at Brad Foote. In support of their claims, the plaintiffs rely in part upon six alleged confidential informants, all of whom are alleged to be former employees of the Company. The Company's motion to dismiss was filed on November 18, 2011, and is now fully briefed and awaiting a ruling. Between February 15, 2011 and March 9,30, 2011, three putative shareholder derivative lawsuits were filed in the United States District Court for the Northern District of Illinois, Eastern Division and one putative shareholder derivative lawsuit was filed in the Circuit Court of Cook County, Illinois, Chancery Division, against certain of ourthe Company's current and former officers and directors, and certain Tontine entities, seeking to challenge alleged breaches of fiduciary duty,
waste of corporate assets, and unjust enrichment, including in connection with the January 2010 secondary public offering of ourthe Company's common stock. One of the lawsuits also alleges that certain directors violated Section 14(a) of the Exchange Act in connection with ourthe Company's Proxy Statement for ourits 2010 Annual Meeting of Stockholders. Two of the matters pending in the federal court have been consolidated and the Company filed a motion to dismiss these matters on September 19, 2011, and is now fully briefed and awaiting a ruling. The Company has received a request from the Tontine defendants for indemnification in the derivative suits and the class action lawsuit and may receive additional requests for indemnification from Tontine and/or Mr. Gendell pursuant to various agreements related to shares owned by Tontine. The Company maintains directors and officers liability insurance; however, the costs of indemnification for Mr. Gendell and/or Tontine would not be covered by any Company insurance policy. Because of the preliminary nature of these lawsuits, we arethe Company is not able to estimate a loss or range of loss, but basedif any, that may be incurred in connection with this matter at this time.
SEC Inquiry
In August 2011, the Company received a subpoena from the SEC seeking documents and other records related to certain accounting practices at Brad Foote. The subpoena was issued in connection with an informal inquiry that the Company received from the SEC in November 2010 arising out of a whistleblower complaint received by the SEC related to revenue recognition, cost accounting and intangible and fixed asset valuations at Brad Foote. The Company has been voluntarily providing information to the SEC as a part of that inquiry and is in the process of responding to the subpoena with respect to the outstanding requests. The Company cannot currently predict the outcome of this investigation. The Company does not believe that the resolution of this matter will have a material adverse effect on currently available information we expectthe Company's consolidated financial position or results of operations. No estimate regarding the loss or range of loss, if any, that any liability resulting from these claims wouldmay be substantially covered by our insurance policies.incurred in connection with this matter is possible at this time.
Environmental
We areThe Company is aware of an investigation commenced by the United States Attorney's Office, Northern District of Illinois, for potential violation of federal environmental laws. On February 15, 2011, pursuant to a search warrant, officials from the USEPA entered and conducted a search of one of ourBrad Foote's facilities in Cicero, Illinois. DuringIllinois, in connection with the search, officials interviewed a numberalleged improper disposal of our employees and seized documents relatingindustrial wastewater to the facility's compliance with certain environmental laws and regulations.sewer. Also on or about February 15,11, 2011, wein connection with the same matter, the Company received a grand jury subpoena requesting testimony and the production of certain documents relating to the facility's past compliance with certain environmental laws and regulations relating to the generation, discharge and disposal of wastewater from certain of ourits processes frombetween 2004 toand the present. We are in the process of responding to this subpoena, which response is currently due on March 24, 2011. On or about February 23, 2011, we alsothe Company received an additional another grand jury
subpoena relating to the same investigation, requesting testimony and the production of certain other documents relating to certain of ourthe facility's employees, and environmental and manufacturing processes. We areprocesses, and disposal practices. The Company has produced e-mails, reports and correspondence as requested in response to these subpoenas. The Company has also voluntarily instituted corrective measures at the process of respondingfacility, including changes to this subpoena, and have requested an extension of the time allotted to respond. Such extensions are generally granted as a matter of routine, but we have not yet received a new date by which such response will be due. We do not currently have information as to when the investigation may be concluded, and we are also conducting an internal investigation of any possible noncompliance. At this time, we have not been formally notified that we are a subject or target of the investigation and no fines or penalties have been suggested.its wastewater disposal practices. There can be no assurances that the conclusion of the investigation will not result in a determination that we havethe Company has violated applicable laws. If we areenvironmental, health and safety laws and regulations. Any violations found, to have violated such laws, weor any criminal or civil fines, penalties and/or other sanctions imposed could be subject to fines, civil penaltiessubstantial and criminal penalties. We havematerially and adversely affect the Company. The Company had recorded a liability of $675 at December 31, 2010, which representsrepresented the low end of ourits estimate of remediation-related costs and expenses thatexpenses; as of December 31, 2011, those initial costs have been incurred, and additional costs have been expensed as incurred. No additional remediation related expenses are anticipated or which are expected tohave been accrued; however, the outcome of the investigation, the liability in connection therewith, and the impact on the Company's operations cannot be predicted at this time. The Company does not believe that the resolution of this matter will have a material adverse effect on the Company's consolidated financial position or results of operations. No estimate regarding the loss or range of loss, if any, that may be incurred during 2011 in connection with this matter. Due to the preliminary nature of the investigation, itmatter is reasonably possible that our estimate of the obligation may change in the near term.at this time.
Other
We are also a party to additional claims and legal proceedings arising in the ordinary course of business. Due to the inherent uncertainty of litigation, there can be no assurance that the resolution of any particular claim or proceeding would not have a material adverse effect on our results of operations, financial position or liquidity. It is possible that if one or more of the matters described above were decided against us, the effects could be material to our results of operations in the period in which we would be required to record or adjust the related liability and could also be material to our cash flows in the periodsperiod in which we would be required to pay such liability.
ITEM 4. RESERVEDMINE SAFETY DISCLOSURES
Not Applicable
ITEM 5. MARKET FOR REGISTRANT'S COMMON EQUITY, RELATED STOCKHOLDER MATTERS AND ISSUER PURCHASES OF EQUITY SECURITIES
Prior to April 9, 2009, our common stock was quoted on the OTC Bulletin Board ("OTCBB") under the symbol "BWEN.OB." Our common stock began trading on the NASDAQ Global Select Market ("NASDAQ") on April 9, 2009 under the symbol "BWEN."
The following table sets forth the range of high and low bid quotations as reported by the OTCBB for the first quarter of 2009 and for the second quarter for the period of April 1 through April 8, 2009. Quotations on the OTCBB reflect inter-dealer prices, which do not include retail mark-up, mark-down or commissions, and may not represent actual sale prices. For the second quarter of 2009 since April 9, 2009 and for all subsequent quarters, the table sets forth the high and low bid prices of our common stock traded on the NASDAQ Global Select Market. In December 2011, we changed the listing of our common stock from the NASDAQ Global Select Market to the NASDAQ Capital Market.
| | Common Stock | |||||||
|---|---|---|---|---|---|---|---|---|
| | High | Low | ||||||
2010 | ||||||||
First quarter | $ | 8.47 | $ | 4.05 | ||||
Second quarter | 4.57 | 2.15 | ||||||
Third quarter | 3.83 | 1.42 | ||||||
Fourth quarter | 2.42 | 1.59 | ||||||
| | High | Low | ||||||
|---|---|---|---|---|---|---|---|---|
2009 | ||||||||
First quarter | $ | 5.45 | $ | 2.60 | ||||
Second quarter | 11.45 | 4.05 | ||||||
Third quarter | 12.49 | 7.18 | ||||||
Fourth quarter | 9.92 | 5.01 | ||||||
| | Common Stock | ||||||
|---|---|---|---|---|---|---|---|
| | High | Low | |||||
2011 | |||||||
First quarter | $ | 2.52 | $ | 1.21 | |||
Second quarter | 1.94 | 1.26 | |||||
Third quarter | 1.53 | 0.29 | |||||
Fourth quarter | 0.92 | 0.26 | |||||
High | Low | ||||||
2010 | |||||||
First quarter | $ | 8.47 | $ | 4.05 | |||
Second quarter | 4.57 | 2.15 | |||||
Third quarter | 3.83 | 1.42 | |||||
Fourth quarter | 2.42 | 1.59 | |||||
The closing price for our common stock as of March 1, 2011February 29, 2012 was $1.51.$0.63. As of March 1, 2011,February 29, 2012, there were 82107 holders of record of our common stock.
We have never paid cash dividends on our common stock and have no current plan to do so in the foreseeable future. The declaration and payment of dividends on our common stock are subject to the discretion of our Board of Directors and are further limited by our credit agreements and other contractual agreements we may have in place from time to time. The decision of our Board of Directors to pay future dividends will depend on general business conditions, the effect of a dividend payment on our financial condition, and other factors the Board of Directors may consider relevant. The current policy of our Board of Directors is to reinvest cash generated in our operations to promote future growth and to fund potential investments.
Performance Graph
The following Performance Graph and related information shall not be deemed "soliciting material" or "filed" under the Securities Act of 1933 or the Securities Exchange Act of 1934, each as amended, nor shall such information be incorporated by reference by any general statement incorporating by reference this Annual Report on Form 10-K into any filing under such Acts, except to the extent that the Company specifically incorporates it by reference into such filing.
The following graph compares cumulative shareholder returns for our common stock as compared with the S&P 500 and the Clean Edge Global Wind Energy Index for the period from April 9, 2009 (the date our common stock began trading on the NASDAQ Global Select Market)NASDAQ) to December 31, 2010.2011. The graph assumes an investment of $100 as of April 9, 2009 and that dividends were reinvested.
At December 31, 2010, the Company changed the index used in the performance graph to the Clean Edge Global Wind Energy Index from the PowerShares Global Wind Energy Index, which had been used in the prior year, as we believe it will be a better representation of the overall wind market in future periods. The historical results obtained from using the Clean Edge Global Wind Energy Index are materially consistent with those obtained from using the PowerShares Global Wind Energy Index.
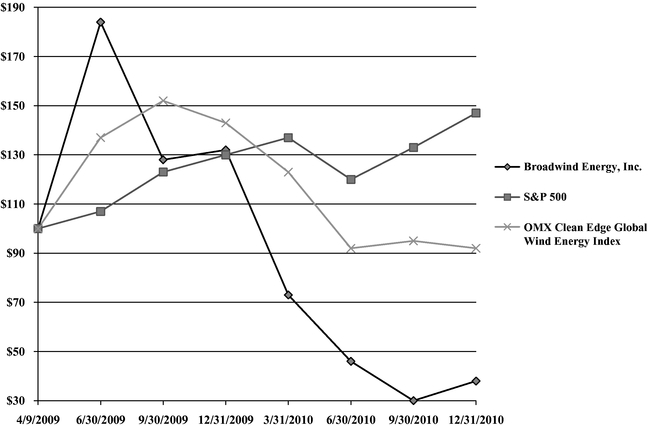
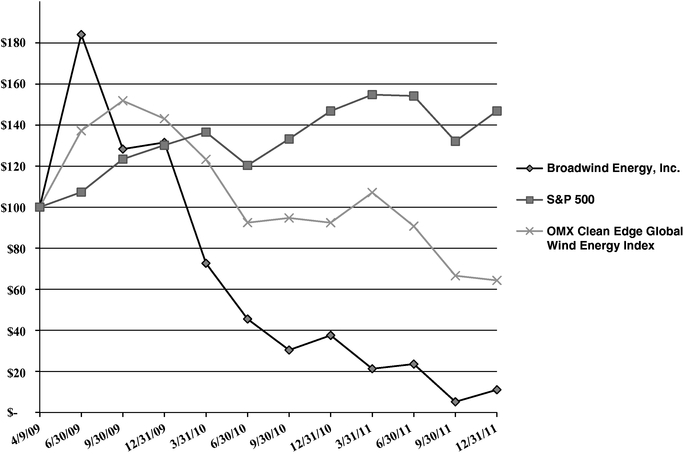
Repurchases
We did not engage in any repurchases of our common stock during the fourth quarter of the year ended December 31, 2010.2011.
Unregistered Sales of Equity Securities
There were no unregistered sales of equity securities during the fourth quarter or for the year ended December 31, 2010.2011.
Securities Authorized for Issuance Under Equity Compensation Plans
See Part III, Item 12 "Security Ownership of Certain Beneficial Owners and Management and Related Stockholder Matters" of this Annual Report on Form 10-K for information as of December 31, 20102011 with respect to shares of our common stock that may be issued under our existing share-based compensation plans.
ITEM 6. SELECTED FINANCIAL DATA
The following selected historical consolidated financial and other data are qualified in their entirety by reference to, and should be read in conjunction with, our consolidated financial statements and the related notes thereto appearing elsewhere herein and Part II, Item 7 "Management's Discussion and Analysis of Financial Condition and Results of Operations." Our selected statement of continuing operations data set forth below for each of the years ended December 31, 2011, 2010, 2009, 2008 2007 and 2006,2007, and the balance sheet data as of December 31, 2011, 2010, 2009, 2008 2007 and 2006,2007, are derived from our consolidated financial statements. The selected statement of continuing operations data excludes the results of our Badger subsidiary, which is now reported as a discontinued operations.operation.
(In thousands, except per share data)
| | For the Year Ended December 31, | |||||||||||||||
|---|---|---|---|---|---|---|---|---|---|---|---|---|---|---|---|---|
| | 2011 | 2010 | 2009 | 2008 | 2007 | |||||||||||
Selected Statement of Operations Data | ||||||||||||||||
Revenues | $ | 185,854 | $ | 136,896 | $ | 184,798 | $ | 207,349 | $ | 29,804 | ||||||
Gross profit (loss) | 7,187 | 1,946 | 11,904 | 31,696 | 3,939 | |||||||||||
Gross profit (loss) percentage | 3.9 | % | 1.4 | % | 6.4 | % | 15.3 | % | 13.2 | % | ||||||
Impairment charges | $ | — | $ | 40,777 | $ | 82,211 | $ | 2,409 | $ | — | ||||||
Intangible amortization | 859 | 2,992 | 9,524 | 10,645 | 1,750 | |||||||||||
Operating loss | (20,429 | ) | (69,227 | ) | (112,253 | ) | (21,874 | ) | (3,535 | ) | ||||||
Loss from continuing operations | (20,742 | ) | (69,753 | ) | (107,026 | ) | (25,278 | ) | (3,362 | ) | ||||||
Net loss per share—basic and diluted: | ||||||||||||||||
Loss from continuing operations | (0.18 | ) | (0.66 | ) | (1.11 | ) | (0.28 | ) | (0.07 | ) | ||||||
Cash dividends per common share | — | — | — | — | — | |||||||||||
As of December 31, | ||||||||||||||||
| | 2011 | 2010 | 2009 | 2008 | 2007 | |||||||||||
Selected Balance Sheet Data | ||||||||||||||||
Assets: | ||||||||||||||||
Property and equipment, net | $ | 87,766 | $ | 106,317 | $ | 129,619 | $ | 136,133 | $ | 58,890 | ||||||
Total assets | 172,891 | 183,506 | 231,488 | 380,609 | 205,818 | |||||||||||
Liabilities: | ||||||||||||||||
Total long-term debt, net of current maturities | 4,797 | 9,671 | 13,396 | 24,397 | 17,620 | |||||||||||
Total stockholders' equity | 117,859 | 126,196 | 155,595 | 262,156 | 124,536 | |||||||||||
For the Year Ended December 31, | ||||||||||||||||
| | 2011 | 2010 | 2009 | 2008 | 2007 | |||||||||||
Selected Other Data—Non GAAP Financial Measures | ||||||||||||||||
Adjusted EBITDA(1) | $ | (2,129 | ) | $ | (9,210 | ) | $ | 2,004 | $ | 2,420 | $ | 103 | ||||
Adjusted EBITDA margin percentage(2) | (1.1 | )% | (6.7 | )% | 1.1 | % | 1.2 | % | 0.3 | % | ||||||
| | For the Year Ended December 31, | |||||||||||||||||
|---|---|---|---|---|---|---|---|---|---|---|---|---|---|---|---|---|---|---|
| | 2010 | 2009 | 2008 | 2007 | 2006 | |||||||||||||
Selected Statement of Operations Data | ||||||||||||||||||
Revenues | $ | 136,896 | $ | 184,798 | $ | 207,349 | $ | 29,804 | $ | 4,023 | ||||||||
Gross profit (loss) | 1,946 | 11,904 | 31,696 | 3,939 | (799 | ) | ||||||||||||
Gross profit (loss) percentage | 1.4 | % | 6.4 | % | 15.3 | % | 13.2 | % | (19.9 | )% | ||||||||
Impairment charges(1) | $ | 40,777 | $ | 82,211 | $ | 2,409 | $ | — | $ | — | ||||||||
Intangible amortization | 2,992 | 9,524 | 10,645 | 1,750 | 21 | |||||||||||||
Operating loss | (69,227 | ) | (112,253 | ) | (21,874 | ) | (3,535 | ) | (2,321 | ) | ||||||||
Loss from continuing operations | (69,753 | ) | (107,026 | ) | (25,278 | ) | (3,362 | ) | (2,735 | ) | ||||||||
Net loss per share—basic and diluted: | ||||||||||||||||||
Loss from continuing operations | (0.66 | ) | (1.11 | ) | (0.28 | ) | (0.07 | ) | (0.08 | ) | ||||||||
Cash dividends per common share | — | — | — | — | — | |||||||||||||
| | As of December 31, | |||||||||||||||||
|---|---|---|---|---|---|---|---|---|---|---|---|---|---|---|---|---|---|---|
| | 2010 | 2009 | 2008 | 2007 | 2006 | |||||||||||||
Selected Balance Sheet Data | ||||||||||||||||||
Assets: | ||||||||||||||||||
Property and equipment, net | $ | 106,317 | $ | 129,619 | $ | 136,133 | $ | 58,890 | $ | 2,799 | ||||||||
Total assets | 183,506 | 231,488 | 380,609 | 205,818 | 3,895 | |||||||||||||
Liabilities: | ||||||||||||||||||
Total long-term debt, net of current maturities | 9,671 | 13,396 | 24,397 | 17,620 | 807 | |||||||||||||
Total stockholders' equity (deficit) | 126,196 | 155,595 | 262,156 | 124,536 | (5,314 | ) | ||||||||||||
| | For the Year Ended December 31, | ||||||||||||||||
|---|---|---|---|---|---|---|---|---|---|---|---|---|---|---|---|---|---|
| | 2010 | 2009 | 2008 | 2007 | 2006 | ||||||||||||
Selected Other Data—Non GAAP Financial Measures | |||||||||||||||||
Adjusted EBITDA(2) | $ | (9,833 | ) | $ | 1,913 | $ | 2,420 | $ | 103 | $ | (1,643 | ) | |||||
Adjusted EBITDA margin percentage(3) | (7.2 | )% | 1.0 | % | 1.2 | % | 0.3 | % | (40.8 | )% | |||||||
acquisitions have played in our development. Historically, our growth through acquisitions has resulted in significant non-cash depreciation and amortization expense because a significant portion of the purchase price of our acquired businesses is generally allocated to depreciable fixed
assets and long-lived assets, which primarily consist of goodwill and amortizable intangible assets. Please note that Adjusted EBITDA should not be considered an alternative to, nor is there any implication that Adjusted EBITDA is more meaningful than, any measure of performance or liquidity promulgated under accounting principles generally accepted in the U.S. ("GAAP"). Additionally, the calculation of Adjusted EBITDA excludes the effect of any goodwill, intangible and long-lived asset impairment charges.
| | For the Year Ended December 31, | ||||||||||||||||
|---|---|---|---|---|---|---|---|---|---|---|---|---|---|---|---|---|---|
| | 2010 | 2009 | 2008 | 2007 | 2006 | ||||||||||||
Loss from continuing operations | $ | (69,753 | ) | $ | (107,026 | ) | $ | (25,278 | ) | $ | (3,362 | ) | $ | (2,735 | ) | ||
(Benefit) provision for income taxes | (160 | ) | (947 | ) | 1,096 | (1,039 | ) | — | |||||||||
Interest expense, net | 1,172 | 2,174 | 2,104 | 839 | 411 | ||||||||||||
Impairment charges | 40,777 | 82,211 | 2,409 | — | — | ||||||||||||
Depreciation and amortization | 16,463 | 22,696 | 20,090 | 3,523 | 328 | ||||||||||||
Share-based compensation | 1,668 | 2,805 | 1,999 | 142 | 353 | ||||||||||||
Adjusted EBITDA | $ | (9,833 | ) | $ | 1,913 | $ | 2,420 | $ | 103 | $ | (1,643 | ) | |||||
| | For the Year Ended December 31, | ||||||||||||||||
|---|---|---|---|---|---|---|---|---|---|---|---|---|---|---|---|---|---|
| | 2011 | 2010 | 2009 | 2008 | 2007 | ||||||||||||
Loss from continuing operations | $ | (20,742 | ) | $ | (69,753 | ) | $ | (107,026 | ) | $ | (25,278 | ) | $ | (3,362 | ) | ||
Provision (benefit) for income taxes | 68 | (160 | ) | (947 | ) | 1,096 | (1,039 | ) | |||||||||
Interest expense, net | 1,117 | 1,172 | 2,174 | 2,104 | 839 | ||||||||||||
Impairment charges | — | 40,777 | 82,211 | 2,409 | — | ||||||||||||
Depreciation and amortization | 14,534 | 16,463 | 22,696 | 20,090 | 3,523 | ||||||||||||
Restructuring | 869 | — | — | — | — | ||||||||||||
Share-based compensation and other stock payments | 2,025 | 2,291 | 2,896 | 1,999 | 142 | ||||||||||||
Adjusted EBITDA | $ | (2,129 | ) | $ | (9,210 | ) | $ | 2,004 | $ | 2,420 | $ | 103 | |||||
ITEM 7. MANAGEMENT'S DISCUSSION AND ANALYSIS OF FINANCIAL CONDITION AND RESULTS OF OPERATIONS
The discussion below contains "forward-looking statements," as defined in Section 21E of the Exchange Act, that reflect our current expectations regarding our future growth, results of operations, cash flows, performance and business prospects and opportunities, as well as assumptions made by, and information currently available to, our management. We have tried to identify forward-looking statements by using words such as "anticipate," "believe," "plan," "expect," "intend," "will," and similar expressions, but these words are not the exclusive means of identifying forward-looking statements. These statements are based on information currently available to us and are subject to various risks, uncertainties, and other factors, including, but not limited to, those matters discussed in Item 1A "Risk Factors" in Part I of this Annual Report on Form 10-K, that could cause our actual growth, results of operations, cash flows, performance and business prospects and opportunities to differ materially from those expressed in, or implied by, these statements. Except as expressly required by the federal securities laws, we undertake no obligation to update such factors or to publicly announce the results of any of the forward-looking statements contained herein to reflect future events, developments, or changed circumstances, or for any other reason.
As used in this Annual Report on Form 10-K, the terms "we," "us," "our," "Broadwind," "Broadwind Energy" and the "Company" refer to Broadwind Energy, Inc. and its wholly-owned subsidiaries.
(Dollars are presented in thousands unless otherwise stated)
Business Overview
Broadwind Energy provides technologically advanced high-value products and services to energy, mining and infrastructure sector customers, primarily in the U.S. Our most significant presence is within the U.S. wind industry, wherealthough we believe we are the only independent company that offershave increasingly diversified into other industrial markets in order to improve our breadth of productscapacity utilization and servicesreduce our exposure to uncertainty related to the market.extension or renewal of tax incentives and other favorable policies currently supporting the U.S. wind industry. Our product and service portfolio provides our wind energy customers, including wind turbine manufacturers, wind farm developers and wind farm operators, with access to a broad array of component and service offerings. Outside of the wind market, we provide precision gearing and specialty weldments to a broad range of industrial customers particularly in the energy,for oil and gas, mining and infrastructure sectors.
The Company was built primarily through acquisitions made in 2007 and 2008. Beginning in late 2008, the severe impacts of the global economic downturn and banking crisis significantly impacted the wind energy business in general and Broadwind in particular. The recession and lack of adequate capital to fund new wind farm developments caused new equipment order intake to drop, contributed to pressure on product margins and reduced service opportunities. Although we had a number of multi-year framework agreements in place with key customers, their purchase requirements dropped sharply which necessitated renegotiations of volume commitments and prices in certain instances. Accordingly, the decline in production levels across our business units has created production volume inefficiencies within our operations and cost structures, which has had a negative effect on our operating profits and gross margins.
We have taken a number of steps to reduce operating costs, repay debt and improve our financial position and product offerings. As such, we believe we are well-positioned to capture market opportunities associated with growth in wind energy and other industrial demand in the U.S. We believe that growth in theapplications.
The market for new U.S. wind energy market will be driven by:installations is affected by the following factors: (i) macroeconomic factors, including economic recoverygrowth and increasedthe associated demand for new electricity risinggeneration, (ii) the cost of competing alternatives to conventional energy prices andsources, primarily natural gas, (iii) federal and state-level wind development incentives, (ii)(iv) upgrades to existing transmission infrastructure and increasingthe proliferation of smart grid technology, and (iii)(v) improvements in wind energy cost competitiveness resulting from the maturation of technologies and services within the wind industry, including increased turbine efficiencies, a coordinated global supply chain and improved focus on equipment maintenance and reliability.
In 2011, approximately 73% of our sales were associated with new wind turbine manufacturing and installations and 7% were related to servicing the installed fleet of wind turbines. The remaining 20% of our sales primarily consisted of gearing and specialty weldments for industrial customers. During this time we continued to execute our diversification strategy for our operations focusing on increasing sales to industrial customers within our Gearing segment. Of our total company backlog at the end of 2011, 16% represents industrial customer demand, which is up from 8% in 2010.
While we believe that we will continue to have sufficient cash flows to operate our business and meet our financial debt covenants, there can be no assurances that our operations will generate sufficient cash or that credit facilities will be available in an amount sufficient to enable us to pay our
indebtedness or to fund our other liquidity needs. If assumptions regarding our restructuring efforts (which are described in greater detail below), sales and subsequent collections from several of our large customers, as well as revenues generated from new customer orders, are not materially consistent with management's expectations, we may encounter cash flow and liquidity issues. Additional funding may not be available when needed or on terms acceptable to us, which could affect our overall operations. Any additional equity financing, if available, may be dilutive to stockholders, and additional debt financing, if available, will likely require financial covenants or other restrictions. Additionally, we have a limited number of shares of common stock authorized for issuance under our certificate of incorporation following our recent common stock offering. As such, our ability to raise capital through future equity issuances may be restricted unless we increase the number of authorized shares of common stock, which would require the approval of a majority of the holders of our outstanding shares.
During the third quarter of 2011, we conducted a review of our business strategies and product plans given the outlook for the economy at large, the forecast for the industries we serve, and our own business environment. As a result, we have begun to execute a restructuring plan to rationalize our facility capacity and our management structure, and to consolidate and increase the efficiencies of our operations.
We have concluded that our manufacturing footprint and fixed cost base are too large and expensive for our medium-term needs. We are planning to reduce our facility footprint by approximately 30% through the sale and/or closure during the next fifteen months of facilities comprising a total of approximately 440,000 square feet. The most significant planned reductions consist of one of our Cicero, Illinois gearing facilities and our non-operational Brandon, South Dakota tower manufacturing facility. We believe the remaining locations will be sufficient to support our Towers and Weldments, Gearing, Services and general corporate and administrative activities while allowing for growth for the next several years. These factors have required management to reassess its estimates of the fair value of some of our reportable segments and could result in further review of our intangible assets and fixed assets.
We expect to incur restructuring costs associated with the restructuring plan totaling an estimated $13,600, of which $874 has been incurred through the end of 2011. Costs are expected to include approximately $5,200 in capital expenditures and $8,400 in expenses, of which approximately $4,000 is anticipated to be non-cash expenses and $4,400 is anticipated to be cash expenses. Net proceeds from associated asset sales, projected to be approximately $7,600, will be used to fund cash costs. We anticipate annual savings going forward of approximately $5,500 related to the restructuring.
In connection with our December 2010 decision to divest our Badger Transport, Inc. subsidiary ("Badger"), which formerly comprised our Logistics segment, we classified Badger as a discontinued operation. The assets and liabilities of Badger were classified as "Assets held for sale" and "Liabilities held for sale" in our Consolidated Balance Sheet as of December 31, 2010. In connection with the reclassification to assets held for sale, in 2010 we recorded an impairment charge of $10,020 to write down the assets to their net realizable value. The impairment charge was included in "Loss from Discontinued Operations" in our Consolidated Statement of Operations for the year ended December 31, 2010.
RESULTS OF OPERATIONS
Year Ended December 31, 2011 Compared to Year Ended December 31, 2010
The summary of selected financial data table below should be referenced in connection with a review of the following discussion of our results of operations for the year ended December 31, 2011 compared to the year ended December 31, 2010.
| | For the Year Ended December 31, | | | ||||||||||||||||
|---|---|---|---|---|---|---|---|---|---|---|---|---|---|---|---|---|---|---|---|
| | 2011 vs. 2010 | ||||||||||||||||||
| | | % of Total Revenue | | % of Total Revenue | |||||||||||||||
| | 2011 | 2010 | $ Change | % Change | |||||||||||||||
Revenues | $ | 185,854 | 100.0 | % | $ | 136,896 | 100.0 | % | $ | 48,958 | 35.8 | % | |||||||
Cost of sales | 178,536 | 96.1 | % | 134,950 | 98.6 | % | 43,586 | 32.3 | % | ||||||||||
Restructuring costs | 131 | 0.1 | % | — | 0.0 | % | 131 | 100.0 | % | ||||||||||
Gross profit | 7,187 | 3.8 | % | 1,946 | 1.4 | % | 5,241 | 269.3 | % | ||||||||||
Operating expenses | |||||||||||||||||||
Selling, general and administrative expenses | 26,316 | 14.2 | % | 27,404 | 20.0 | % | (1,088 | ) | (4.0 | )% | |||||||||
Impairment charges | — | 0.0 | % | 40,777 | 29.8 | % | (40,777 | ) | (100.0 | )% | |||||||||
Intangible amortization | 859 | 0.5 | % | 2,992 | 2.2 | % | (2,133 | ) | (71.3 | )% | |||||||||
Restructuring costs | 441 | 0.2 | % | — | 0.0 | % | 441 | 100.0 | % | ||||||||||
Total operating expenses | 27,616 | 14.9 | % | 71,173 | 52.0 | % | (43,557 | ) | (61.2 | )% | |||||||||
Operating loss | (20,429 | ) | (11.1 | )% | (69,227 | ) | (50.6 | )% | 48,798 | 70.5 | % | ||||||||
Other (expense) income | |||||||||||||||||||
Interest expense, net | (1,117 | ) | (0.6 | )% | (1,172 | ) | (0.9 | )% | 55 | 4.7 | % | ||||||||
Other, net | 1,169 | 0.6 | % | 486 | 0.4 | % | 683 | 140.5 | % | ||||||||||
Restructuring costs | (297 | ) | (0.1 | )% | — | 0.0 | % | (297 | ) | (100.0 | )% | ||||||||
Total other (expense) income, net | (245 | ) | (0.1 | )% | (686 | ) | (0.5 | )% | 441 | 64.3 | % | ||||||||
Net loss from continuing operations before provision (benefit) for income taxes | (20,674 | ) | (11.2 | )% | (69,913 | ) | (51.1 | )% | 49,239 | 70.4 | % | ||||||||
Provision (benefit) for income taxes | 68 | 0.0 | % | (160 | ) | (0.1 | )% | 228 | 142.5 | % | |||||||||
Loss from continuing operations | (20,742 | ) | (11.2 | )% | (69,753 | ) | (51.0 | )% | 49,011 | 70.3 | % | ||||||||
Loss from discontinued operations, net of tax | (1,206 | ) | (0.6 | )% | (15,422 | ) | (11.3 | )% | 14,216 | 92.2 | % | ||||||||
Net loss | $ | (21,948 | ) | (11.8 | )% | $ | (85,175 | ) | (62.3 | )% | $ | 63,227 | 74.2 | % | |||||
Consolidated
Total revenues increased $48,958 or 36%, from $136,896 during the year ended December 31, 2010, to $185,854 during the year ended December 31, 2011. The increase in revenues was primarily attributable to a 54%, or $40,776, increase in our Towers and Weldments segment revenue due to increased customer demand and improved capacity utilization. Our Gearing segment total revenues increased by 11% as increases in industrial gearing revenue more than offset the declines in wind revenue, consistent with our focus on equipment maintenancediversifying our business. Revenues in our Services segment increased by 35% due to increased blade services to our two largest customers, as well as the initial
sales of gearboxes and reliability. Givenloose gearing in connection with our significant installed manufacturingAbilene, Texas drivetrain service center facility which opened in February 2011.
Total gross profit increased $5,241 or 269%, from $1,946 for the year ended December 31, 2010 to $7,187 for the year ended December 31, 2011. The gross margin percentage rose from 1.4% in 2010 to 3.8% in 2011. The improvement was primarily attributable to increased tower and gearing sales volumes and a higher margin mix of gearing sales. Partly offsetting the increase were the impact of more competitive pricing within Towers and Weldments, and higher facility costs within Services due to the start-up of our Abilene drivetrain service platform, we believe we will be ablecenter facility which operated at a low utilization level during 2011.
Selling, general and administrative expenses decreased from $27,404 during the year ended December 31, 2010, to substantially grow revenues without making significant investment$26,316 during the year ended December 31, 2011, as a reduction in additional capital equipment or manufacturing capacity.employee compensation costs was partially offset by $1,839 in increased legal costs.
We review our goodwill balances for impairment on at least an annual basis and review our intangible and other long-lived assets for impairment whenever events or changes in circumstances indicate that the asset's carrying value amount may not be recoverable. During the second quarter of 2010 the Companywe identified a triggering event associated with the continued deterioration in the financial performance within our Services segment. This triggering event required a revision of the Company'sour projection of future operating results and cash flows for this segment in light of the continued economic weakness in the wind energy industry. We performed our review of goodwill based on the carrying value of these assets as of June 30, 2010, and the estimate of fair-valuefair value for each of our operating segments was based primarily on projected future results, cash flows and other assumptions. As a result of this review, we recorded a goodwill impairment charge of $4,561 at June 30, 2010 in our Services segment. During the fourth quarter of 2010, the Companywe identified triggering events associated with the Company'sour current period operating losses, itsour history of continued operating losses and itsour revised projections of operating results and cash flows developed as part of the strategic planning process. As a result, our review of other long-lived assets indicated that the carrying values of customer relationships, trade name and property and equipment atwithin our Services segment were also impaired. Accordingly, we recorded an impairment charge during the fourth quarter of $22,890. In addition, following our strategic planning meetings that took place in the fourth quarter 2010, we determined that our Brandon, South Dakota tower manufacturing facility was impaired and recorded an impairment charge to fixed assets of $13,326.
In connection During 2011, we identified triggering events associated with our December 2010 decision to divestcurrent period operating losses combined with our Badger Transport, Inc. subsidiary ("Badger"), which formerly comprisedhistory of continued operating losses. As a result, we evaluated the recoverability of certain of our Logistics segment, we have classified Badger as a discontinued operation. Theidentifiable intangible assets and liabilities of Badger have been classified as "Assets held for sale"certain property and "Liabilities held for sale"equipment assets. We did not record any corresponding impairment in our Consolidated Balance Sheet. In connection with2011.
Intangible amortization expense decreased from $2,992 during the reclassificationyear ended December 31, 2010, to assets held for sale, we recorded an impairment charge of $10,020 to write down$859 during the assets to their net realizable value.year ended December 31, 2011. The impairment charge is included in "Loss from Discontinued Operations" in our Consolidated Statement of Operations.
In connection with our annual goodwill impairment analysis as of October 31, 2009, we determined that the goodwill balance attributable to our Gearing segmentdecrease was impaired due to a deteriorationlower asset base because of the impairment charges noted above.
We recorded restructuring costs of $441 in financial performanceselling, general and administrative expenses in 2011, primarily due to the closure of our European sales office and subsidiary. We also recorded $297 in other restructuring costs related primarily to losses on the sale of surplus equipment.
Total other income, net, was an expense of $686 during 2009 and asthe year ended December 31, 2010, compared to other expense, net, of $245 during the year ended December 31, 2011. The net improvement was a result of increased grant income associated with local economic development initiatives partially offset by the subsequent fourth quarter revision in our projectionrestructuring costs mentioned above.
During the year ended December 31, 2010, we reported a benefit for income taxes of future operating results and cash flows in light of the effect of the continued economic downturn on the wind gearing industry. Additionally, we determined that the carrying value of our RBA trade name was impaired as a result of the merger of the operations of our subsidiary R.B.A. Inc. ("RBA") into our Towers segment in December 2009 and that RBA's customer relationship intangible was impaired due$160, compared to a revisionprovision for income taxes of $68 during the year ended December 31, 2011. The decrease in projected revenuesincome tax benefit and cash flows associated with this customer relationship. We recorded goodwill and intangible impairment charges of $24,269 and $57,942, respectively,increase in income tax provision for 2011 compared to properly reflect the carrying value of these assets.
In the future, if our projected discounted cash flows associated with our operating segments do not exceed the carrying value of their net assets, we may be required to record additional write downs of the carrying value of intangible assets or other long-lived assets associated with any of our operating segments, in which event our operating results, and the market price of our common stock may be materially adversely affected.
Summary of Recent Events:
Bank of America debt agreements and $3,066 of outstanding indebtedness under our line of credit with Investors Community Bank ("ICB").
primarily attributable to the accrual of state income taxes in 2011 and the one-time reduction of deferred income tax liabilities in connection with reversal of naked tax credits during 2010.
Net loss from continuing operations decreased from $69,753 during the year ended December 31, 2010, to $20,742 during the year ended December 31, 2011, primarily as a result of the factors as described above.
Net loss from discontinued operations, net of tax was $15,422 during the year ended December 31, 2010, compared to $1,206 during the year ended December 31, 2011. The 2010 loss included impairment charges of $10,020.
Net loss decreased from $85,175 during the year ended December 31, 2010, to $21,948 during the year ended December 31, 2011, primarily as a result of the factors as described above.
RESULTS OF OPERATIONSTowers and Weldments Segment
The following table summarizes the Towers and Weldments segment operating results for the years ended December 31, 2011 and 2010:
| | Twelve Months Ended December 31, | ||||||
|---|---|---|---|---|---|---|---|
| | 2011 | 2010 | |||||
Revenues | $ | 116,926 | $ | 76,150 | |||
Impairment charges | — | 13,326 | |||||
Operating income (loss) | 5,187 | (11,436 | ) | ||||
Operating margin | 4.4 | % | (15.0 | )% | |||
Towers and Weldments segment revenues increased by $40,776, from $76,150 during the year ended December 31, 2010, to $116,926 during the year ended December 31, 2011. The increase in revenues is attributable to a 43% increase in tower sections produced during 2011 versus 2010. The increase in volume also increased the MW's sold, with 593 MW's sold during the year ended December 31, 2011, versus 518 MW's sold during the year ended December 31, 2010.
Towers and Weldments segment operating income improved by $16,623 from a loss of $11,436 during the year ended December 31, 2010, to operating income of $5,187 during the year ended December 31, 2011. Excluding a one-time impairment charge in 2010 of $13,326, operating income for the year would have improved by $3,297 compared to the prior year. The increase in section volume positively impacted operating margin, however competitive pricing pressures and inefficiencies that resulted from the production of new tower designs eroded a portion of those gains. Our operating margin was 4.4% for year ended December 31, 2011, versus a negative operating margin of (15.0%) for year ended December 31, 2010.
Gearing Segment
The following table summarizes the Gearing segment operating results for the years ended December 31, 2011 and 2010:
| | Twelve Months Ended December 31, | ||||||
|---|---|---|---|---|---|---|---|
| | 2011 | 2010 | |||||
Revenues | $ | 54,296 | $ | 48,996 | |||
Operating loss | (10,733 | ) | (13,678 | ) | |||
Operating margin | (19.8 | )% | (27.9 | )% | |||
Gearing segment revenues increased $5,300, from $48,966 during the year ended December 31, 2010, to $54,296 during the year ended December 31, 2011. The increase in industrial gearing revenue of 60% more than offset the decline in wind revenue of 26%, consistent with our strategic diversification focus. The challenges in the wind industry depressed the manufacture of wind turbine gearing, which had typically accounted for the majority of our gearing revenues in the recent past. In 2011, as demand for wind gearing decreased, we increased our sales force and shifted our focus to the manufacture of custom-engineered gearing systems and gearboxes for oil and gas, mining and other industrial customers. Gearing sales to oil and gas, mining and other industrial customers in 2011 represented 60% of our total revenues, and orders from these customers represented 80% of our backlog as of December 31, 2011.
Gearing segment operating loss improved by $2,945, from $13,678 during the year ended December 31, 2010, to $10,733 during the year ended December 31, 2011. The operating margin improvement is due to improved sales volume and mix, partially offset by higher legal expenses of $1,209 as well as additional selling costs. Gearing operating margin was (27.9%) during the year ended December 31, 2010 compared to (19.8%) during the year ended December 31, 2011, due to these factors.
Services Segment
The following table summarizes the Services segment operating results for the years ended December 31, 2011 and 2010:
| | Twelve Months Ended December 31, | ||||||
|---|---|---|---|---|---|---|---|
| | 2011 | 2010 | |||||
Revenues | $ | 16,291 | $ | 12,090 | |||
Impairment charges | — | 27,451 | |||||
Operating loss | (5,247 | ) | $ | (34,747 | ) | ||
Operating margin | (32.2 | )% | (287.4 | )% | |||
Services segment revenues increased $4,201, from $12,090 during the year ended December 31, 2010, to $16,291 during the year ended December 31, 2011. Revenues within our Services segment increased by 35% due to increased blade services to our two largest customers, as well as the initial sales of gearboxes and loose gearing in connection with our Abilene, Texas drivetrain service center facility which opened in February, 2011.
Services segment operating loss improved $29,500, from $34,747 during the year ended December 31, 2010, to $5,247 during the year ended December 31, 2011. Excluding a one-time impairment charge in 2010 of $27,451, the operating loss for the year would have improved by $2,049 compared to the prior year. Services segment operating loss improvement was primarily due to the absence of the 2010 intangible amortization expense of $2,133, partially offset by higher facility costs related to the startup of the Abilene facility and labor cost inefficiencies as we ramped up new blade service projects. Services operating margin was (287.4%) during the year ended December 31, 2010 compared to (32.2%) during the year ended December 31, 2011, due to these factors.
Corporate and Other
Corporate and Other operating loss increased $270 from $9,366 during the year ended December 31, 2010, to $9,636 during the year ended December 31, 2011. The small increase was due to higher legal fees of $881 and European office related restructuring costs of $406, largely offset by lower employee compensation costs.
Year Ended December 31, 2010 Compared to Year Ended December 31, 2009
The summary of selected financial data table below should be referenced in connection with a review of the following discussion of our results of operations for the year ended December 31, 2010 compared to the year ended December 31, 2009.
| | For the Year Ended December 31, | | | |||||||||||||||||||||||||||||||||||||
|---|---|---|---|---|---|---|---|---|---|---|---|---|---|---|---|---|---|---|---|---|---|---|---|---|---|---|---|---|---|---|---|---|---|---|---|---|---|---|---|---|
| 2010 vs. 2009 | ||||||||||||||||||||||||||||||||||||||||
| | | For the Year Ended December 31, | 2010 vs. 2009 | | % of Total Revenue | | % of Total Revenue | |||||||||||||||||||||||||||||||||
| | | 2010 | % of Total | 2009 | % of Total | $ Change | % Change | 2010 | 2009 | $ Change | % Change | |||||||||||||||||||||||||||||
Revenues | Revenues | $ | 136,896 | 100.0 | % | $ | 184,798 | 100.0 | % | $ | (47,902 | ) | (25.9 | )% | $ | 136,896 | 100.0 | % | $ | 184,798 | 100.0 | % | $ | (47,902 | ) | (25.9 | )% | |||||||||||||
Cost of sales | Cost of sales | 134,950 | 98.6 | % | 172,894 | 93.6 | % | (37,944 | ) | (21.9 | )% | 134,950 | 98.6 | % | 172,894 | 93.6 | % | (37,944 | ) | (21.9 | )% | |||||||||||||||||||
Gross profit | Gross profit | 1,946 | 1.4 | % | 11,904 | 6.4 | % | (9,958 | ) | (83.7 | )% | 1,946 | 1.4 | % | 11,904 | 6.4 | % | (9,958 | ) | (83.7 | )% | |||||||||||||||||||
Operating expenses | Operating expenses | |||||||||||||||||||||||||||||||||||||||
Selling, general and administrative expenses | 27,404 | 20.0 | % | 32,422 | 17.5 | % | (5,018 | ) | (15.5 | )% | ||||||||||||||||||||||||||||||
Impairment charges | 40,777 | 29.8 | % | 82,211 | 44.5 | % | (41,434 | ) | (50.4 | )% | ||||||||||||||||||||||||||||||
Intangible amortization | 2,992 | 2.2 | % | 9,524 | 5.2 | % | (6,532 | ) | (68.6 | )% | ||||||||||||||||||||||||||||||
Total operating expenses | 71,173 | 52.0 | % | 124,157 | 67.2 | % | (52,984 | ) | (42.7 | )% | ||||||||||||||||||||||||||||||
Total operating expenses | 71,173 | 52.0 | % | 124,157 | 67.2 | % | (52,984 | ) | (42.7 | )% | ||||||||||||||||||||||||||||||
Operating loss | Operating loss | (69,227 | ) | (50.6 | )% | (112,253 | ) | (60.8 | )% | 43,026 | (38.3 | )% | (69,227 | ) | (50.6 | )% | (112,253 | ) | (60.8 | )% | 43,026 | 38.3 | % | |||||||||||||||||
Other (expense) income | Other (expense) income | |||||||||||||||||||||||||||||||||||||||
Interest expense, net | (1,172 | ) | (0.9 | )% | (2,174 | ) | (1.2 | )% | 1,002 | 46.1 | % | |||||||||||||||||||||||||||||
Other, net | 486 | 0.4 | % | 6,454 | 3.5 | % | (5,968 | ) | (92.5 | )% | ||||||||||||||||||||||||||||||
Interest expense, net | (1,172 | ) | (0.9 | )% | (2,174 | ) | (1.2 | )% | 1,002 | (46.1 | )% | |||||||||||||||||||||||||||||
Other, net | 486 | 0.4 | % | 6,454 | 3.5 | % | (5,968 | ) | (92.5 | )% | ||||||||||||||||||||||||||||||
Total other (expense) income, net | (686 | ) | (0.5 | )% | 4,280 | 2.3 | % | (4,966 | ) | (116.0 | )% | |||||||||||||||||||||||||||||
Total other (expense) income, net | (686 | ) | (0.5 | )% | 4,280 | 2.3 | % | (4,966 | ) | (116.0 | )% | |||||||||||||||||||||||||||||
Net loss from continuing operations before benefit for income taxes | Net loss from continuing operations before benefit for income taxes | (69,913 | ) | (51.1 | )% | (107,973 | ) | (58.5 | )% | 38,060 | (35.2 | )% | (69,913 | ) | (51.1 | )% | (107,973 | ) | (58.5 | )% | 38,060 | 35.2 | % | |||||||||||||||||
Benefit for income taxes | Benefit for income taxes | (160 | ) | (0.1 | )% | (947 | ) | (0.6 | )% | 787 | (83.1 | )% | (160 | ) | (0.1 | )% | (947 | ) | (0.6 | )% | 787 | 83.1 | % | |||||||||||||||||
Loss from continuing operations | Loss from continuing operations | (69,753 | ) | (51.0 | )% | (107,026 | ) | (57.9 | )% | 37,273 | (34.8 | )% | (69,753 | ) | (51.0 | )% | (107,026 | ) | (57.9 | )% | 37,273 | 34.8 | % | |||||||||||||||||
Loss from discontinued operations, net of tax | Loss from discontinued operations, net of tax | (15,422 | ) | (11.3 | )% | (3,093 | ) | (1.7 | )% | (12,329 | ) | 398.6 | % | (15,422 | ) | (11.3 | )% | (3,093 | ) | (1.7 | )% | (12,329 | ) | (398.6 | )% | |||||||||||||||
Net loss | Net loss | $ | (85,175 | ) | (62.3 | )% | $ | (110,119 | ) | (59.6 | )% | $ | 24,944 | (22.7 | )% | $ | (85,175 | ) | (62.3 | )% | $ | (110,119 | ) | (59.6 | )% | $ | 24,944 | 22.7 | % | |||||||||||
Consolidated
Total revenues decreased $47,902 or 26%, from $184,798 during the year ended December 31, 2009, to $136,896 during the year ended December 31, 2010. The decrease in revenues was primarily attributable to an 18% decline in our Towers and Weldments segment revenue due mainly to a reduction in the price of the steel component included in the overall tower section price compared to the prior year. Our Gearing segment experienced decreases in wind and industrial gearing revenues of 21% and 29%, respectively, due primarily to reduced or delayed production orders in 2010 from key customers. Revenues in our Services segment decreased 56% due to the absence of a large blade program completed in 2009, and an overall reduction in technical services provided in 2010.
Total cost of sales decreased $37,944 or 22%, from $172,894 during the year ended December 31, 2009, to $134,950 during the year ended December 31, 2010. The decrease in cost of sales within our Towers and Weldments segment was primarily attributable to the 18% decline in revenues as compared to the prior year, as well as the absence of start-up and production costs for our new wind tower manufacturing facility in Abilene, Texas in 2009. The decrease in cost of sales within our Gearing segment was
primarily due to the 24% decline in revenues compared to the prior year as well as enhanced production efficiencies during the second half of 2010. The decrease in cost of sales in our Services segment was due to lower direct labor costs for field technicians as a result of the 56% decline in revenues compared to the prior year.
Selling, general and administrative expenses decreased from $32,422 during the year ended December 31, 2009, to $27,404 during the year ended December 31, 2010. The decrease was primarily attributable to cost reduction initiatives, namely the reduction of third party professional fees, implemented during 2010 to mitigate the effects of an overall decline in production volumes, the absence of charges incurred in 2009 associated with amendments to our credit agreement with Bank of America and reserves established in connection with a customer dispute in 2009.
We review our goodwill balances for impairment on at least an annual basis and review our intangible and other long-lived assets for impairment whenever events or changes in circumstances indicate that the asset's carrying value amount may not be recoverable. During the second quarter of 2010, the Companywe identified a triggering event associated with the continued deterioration in the financial performance within our Services segment. This triggering event required a revision of the Company'sour projection of future operating results and cash flows for this segment in light of the continued economic weakness in the wind energy industry. We performed our review of goodwill based on the carrying value of these assets as of June 30, 2010, and the estimate of fair value for each of our operating segments was based primarily on projected future results, cash flows and other assumptions. As a result of this review, we recorded a goodwill impairment charge of $4,561 at June 30, 2010 in our Services segment. During the fourth quarter of 2010, the Companywe identified triggering events associated with the Company'sour current period operating losses, itsour history of continued operating losses and itsour revised projections of operating results and cash flows developed as part of the strategic planning process. As a result, our review of other long-lived assets indicated that the carrying values of customer relationships, trade name and property and equipment within our Services segment were also impaired. Accordingly, we recorded an impairment charge during the fourth quarter of $22,890. In addition, following the Company'sour strategic planning meetings that took place in the fourth quarter 2010, we determined that our Brandon, South Dakota tower manufacturing facility was impaired and recorded an impairment charge to fixed assets of $13,326.
Our 2009 impairment analysis indicated that the fair value of our goodwill and intangible assets related to our Gearing segment was less than the carrying value of these assets. Our analysis also indicated impairment to our customer relationship and trade name intangible assets in our Towers and Weldments segment as a result of the merger of our industrial weldment business into our Towers and Weldments segment in December 2009, and due to a revision in projected revenues and cash flows
associated with these customer relationships. Accordingly, we recorded goodwill and intangible impairment charges of $24,269 and $57,942, respectively, to properly reflect the carrying value of these assets.
Intangible amortization expense decreased from $9,524 during the year ended December 31, 2009, to $2,992 during the year ended December 31, 2010. The decrease was primarily due to a $6,015 reduction in amortization expense in our Gearing segment as a result of the impairment in 2009 to its customer relationship intangibles. In addition, amortization expense in our Services segment decreased $427 due to the impairment of its intangible assets as of October 31, 2010.
Total other income, net, was $4,280 during the year ended December 31, 2009, compared to other expense, net, of $686 during the year ended December 31, 2010. The decrease was primarily attributable to the recognition of $5,082 in income related to an escrow agreement settlement with the former owners of Brad Foote during the second quarter of 2009.
During the year ended December 31, 2009, we reported a benefit for income taxes of $947, compared to a benefit for income taxes of $160 during the year ended December 31, 2010. The decrease in income tax benefit for 2010 compared to 2009 was primarily attributable to a reduction in
our deferred income tax liabilities in connection with the goodwill impairment charge recorded during 2009.
Net loss from continuing operations decreased from $107,026 during the year ended December 31, 2009, to $69,753 during the year ended December 31, 2010, primarily as a result of the factors as described above.
Net loss from discontinued operations, net of tax was $3,093 during the year ended December 31, 2009, compared to $15,422 during the year ended December 31, 2010. The 2010 loss included impairment charges of $10,020.
Net loss decreased from $110,119 during the year ended December 31, 2009, to $85,175 during the year ended December 31, 2010, primarily as a result of the factors as described above.
Towers and Weldments Segment
The following table summarizes the Towers and Weldments segment operating results for the years ended December 31, 2010 and 2009:
| | Twelve Months Ended December 31, | ||||||
|---|---|---|---|---|---|---|---|
| | 2010 | 2009 | |||||
Revenues | $ | 76,150 | $ | 93,316 | |||
Impairment charges | 13,326 | 1,916 | |||||
Operating loss | (11,436 | ) | (499 | ) | |||
Operating margin | (15.0 | )% | (0.5 | )% | |||
Towers and Weldments segment revenues declined $17,166, from $93,316 during the year ended December 31, 2009, to $76,150 during the year ended December 31, 2010. The reduction in sales is attributable to a 3% decline in tower section production and lower average tower prices reflecting, in part, 20% lower average steel costs.
Towers and Weldments segment operating loss increased by $10,937, from a loss of $499 during the year ended December 31, 2009, to a loss of $11,436 during the year ended December 31, 2010. The increased loss from operations was primarily attributable to a fixed asset impairment charge of $13,326 related to our investment in the Brandon, South Dakota tower facility. Additionally, a less profitable sales mix resulted in margin degradation of $2,819 as well as $965 in higher labor costs mainly associated with premium costs and inefficiencies that were incurred to support the increased production
volume during the fourth quarter. These items were partially offset by the absence of $3,350 of start-up costs incurred in 2009 associated with our wind tower manufacturing facility in Abilene, Texas and a non-recurring impairment charge with respect to a customer relationship and trade name intangible in the aggregate amount of $1,916 taken in 2009. Towers and Weldments operating margins deteriorated from (0.5%) during the year ended December 31, 2009 to (15%) during the year ended December 31, 2010, as a result of these factors.
Gearing Segment
The following table summarizes the Gearing segment operating results for the years ended December 31, 2010 and 2009:
| | Twelve Months Ended December 31, | ||||||
|---|---|---|---|---|---|---|---|
| | 2010 | 2009 | |||||
Revenues | $ | 48,996 | $ | 64,518 | |||
Impairment charges | — | 80,295 | |||||
Operating loss | (13,678 | ) | (97,058 | ) | |||
Operating margin | (27.9 | )% | (150.4 | )% | |||
Gearing segment revenues decreased $15,522, from $64,518 during the year ended December 31, 2009, to $48,996 during the year ended December 31, 2010. The decrease in revenues was primarily attributable to 21% and 29% declines in wind gearing and industrial revenues, respectively, due mainly to reduced or delayed production orders from key customers. The manufacture of wind turbine gearing, which typically accounts for the majority of our gearing revenues, continued to be negatively affected by reduced or delayed production orders from our key gearing customers, predominantly in the first half of the year, as well as ongoing challenges in the wind industry.
Gearing segment operating loss decreased by $83,380, from $97,058 during the year ended December 31, 2009, to $13,678 during the year ended December 31, 2010. The decrease in operating loss was largely attributable to the absence of impairment charges of $80,295 recorded during 2009. As a result of the 2009 impairment recorded, the corresponding amortization expense decreased by approximately $6,000 in 2010 compared to 2009. These two factors were partially offset by the establishment of an environmental reserve of approximately $675 in 2010. Gearing operating margin was (150.4%) during the year ended December 31, 2009 compared to (27.9%) during the year ended December 31, 2010, due to these factors.
Services Segment
The following table summarizes the Services segment operating results for the years ended December 31, 2010 and 2009:
| | Twelve Months Ended December 31, | ||||||
|---|---|---|---|---|---|---|---|
| | 2010 | 2009 | |||||
Revenues | $ | 12,090 | $ | 27,575 | |||
Impairment charges | 27,451 | — | |||||
Operating loss | (34,747 | ) | $ | (610 | ) | ||
Operating margin | (287.4 | )% | (2.2 | )% | |||
Services segment revenues decreased $15,485, from $27,575 during the year ended December 31, 2009, to $12,090 during the year ended December 31, 2010. The decrease in revenues was primarily the result of the absence of a large blade program completed in 2009, a reduction in services provided in
2010 to two large clients due in part to their divestiture of wind farm sites and lower outsourced project activity overall.
Services segment operating loss increased $34,137, from $610 during the year ended December 31, 2009, to $34,747 during the year ended December 31, 2010. The operating margin declined from (2.2%) in 2009 to (287.4%) in 2010. The deterioration in operating loss and operating margin were primarily attributable to the $5,100 adverse effect of reduced sales, a goodwill impairment charge of $4,561 recorded in the second quarter of 2010, an impairment charge of $22,890 related to customer relationships, trade name and property and equipment taken in fourth quarter of 2010, less favorable labor utilization during the first half of the year and start-up costs related to the Company'sour drivetrain service center in Abilene, Texas.
Corporate and Other
Corporate and Other operating loss decreased $4,720 from $14,086 during the year ended December 31, 2009, to $9,366 during the year ended December 31, 2010. The decrease in operating loss was primarily attributable to a $2,930 reduction in professional fees associated with tax, accounting and legal services, as well as the absence of costs associated with an acquisition we did not complete during 2009. In addition, the decrease in operating loss was attributable to the absence of a $1,200 expense related to a customer dispute incurred in 2009.
Year Ended December 31, 2009 Compared to Year Ended December 31, 2008
The summary of selected financial data table below should be referenced in connection with a review of the following discussion of our results of operations for the year ended December 31, 2009 compared to the year ended December 31, 2008.
| | For the Year Ended December 31, | | | ||||||||||||||||||
|---|---|---|---|---|---|---|---|---|---|---|---|---|---|---|---|---|---|---|---|---|---|
| | 2009 vs. 2008 | ||||||||||||||||||||
| | | % of Total Revenue | | % of Total Revenue | |||||||||||||||||
| | 2009 | 2008 | $ Change | % Change | |||||||||||||||||
Revenues | $ | 184,798 | 100.0 | % | $ | 207,349 | 100.0 | % | $ | (22,551 | ) | (10.9 | )% | ||||||||
Cost of sales | 172,894 | 93.6 | % | 175,653 | 84.7 | % | (2,759 | ) | (1.6 | )% | |||||||||||
Gross profit | 11,904 | 6.4 | % | 31,696 | 15.3 | % | (19,792 | ) | (62.4 | )% | |||||||||||
Operating expenses | |||||||||||||||||||||
Selling, general and administrative expenses | 32,422 | 17.5 | % | 40,516 | 19.5 | % | (8,094 | ) | (20.0 | )% | |||||||||||
Impairment charges | 82,211 | 44.5 | % | 2,409 | 1.2 | % | 79,802 | 3312.7 | % | ||||||||||||
Intangible amortization | 9,524 | 5.2 | % | 10,645 | 5.1 | % | (1,121 | ) | (10.5 | )% | |||||||||||
Total operating expenses | 124,157 | 67.2 | % | 53,570 | 25.8 | % | 70,587 | 131.8 | % | ||||||||||||
Operating loss | (112,253 | ) | (60.8 | )% | (21,874 | ) | (10.5 | )% | (90,379 | ) | 413.2 | % | |||||||||
Other income (expense) | |||||||||||||||||||||
Interest expense, net | (2,174 | ) | (1.2 | )% | (2,104 | ) | (1.0 | )% | (70 | ) | 3.3 | % | |||||||||
Other (expense), net | 6,454 | 3.5 | % | (204 | ) | (0.1 | )% | 6,658 | (3263.7 | )% | |||||||||||
Total other income (expense), net | 4,280 | 2.3 | % | (2,308 | ) | (1.1 | )% | 6,588 | (285.4 | )% | |||||||||||
Net loss from continuing operations before (benefit) provision for income taxes | (107,973 | ) | (58.5 | )% | (24,182 | ) | (11.6 | )% | (83,791 | ) | 346.5 | % | |||||||||
(Benefit) provision for income taxes | (947 | ) | (0.6 | )% | 1,096 | 0.6 | % | (2,043 | ) | (186.4 | )% | ||||||||||
Loss from continuing operations | (107,026 | ) | (57.9 | )% | (25,278 | ) | (12.2 | )% | (81,748 | ) | 323.4 | % | |||||||||
Loss from discontinued operations, net of tax | (3,093 | ) | (1.7 | )% | (7 | ) | 0.0 | % | (3,086 | ) | 44085.7 | % | |||||||||
Net loss | $ | (110,119 | ) | (59.6 | )% | $ | (25,285 | ) | (12.2 | )% | $ | (84,834 | ) | 335.5 | % | ||||||
Consolidated
Total revenues decreased $22,551 or 11%, from $207,349 during the year ended December 31, 2008, to $184,798 during the year ended December 31, 2009. The decrease in revenues was primarily attributable to a 38% decline in gearing revenues, which was the result of a reduction in wind turbine gearing production as compared to the prior year. Revenues in our Services segment decreased 12% due to the completion of a large blade refurbishment project that did not recur during 2009. These declines were partially offset by a 29% increase in wind turbine tower revenues as a result of new
customer orders and increased manufacturing capacity associated with our wind tower manufacturing facility in Abilene, Texas in January 2009.
Total cost of sales decreased $2,759, from $175,653 during the year ended December 31, 2008, to $172,894 during the year ended December 31, 2009. The change in cost of sales was primarily the result of 30% and 10% declines in cost of sales within our Gearing and Services segments, respectively. The decrease in cost of sales in our Gearing segment was primarily attributable to the 38% decline in revenues as compared to the prior year. The decrease in cost of sales in our Services segment was due to lower direct labor costs for field technicians as a result of a 12% decline in revenues as compared to the prior year. The decrease in cost of sales was partially offset by an increase in cost of sales of 49% in our Towers segment. The increase in cost of sales within our Towers segment was primarily attributable to a higher percentage of steel included in the selling price of wind turbine towers manufactured, an increase in production costs related to higher production volumes and the inclusion of start-up and production costs for our wind tower manufacturing facility in Abilene, Texas.
Selling, general and administrative expenses decreased from $40,516 during the year ended December 31, 2008, to $32,422 during the year ended December 31, 2009. The decrease was primarily attributable to cost reduction initiatives implemented during 2009 across all reportable segments to mitigate the effects of an overall decline in production volumes. These cost reduction initiatives were partially offset by an $806 increase in share-based compensation expense as a result of an increase in restricted stock units granted and professional fees and costs of $1,201 associated with amendments to our credit agreement with Bank of America.
Our annual test of goodwill impairment as of October 31, 2009 indicated that the fair value of our goodwill and intangible assets related to our Gearing segment was less than the carrying value of these assets. Our analysis also indicated impairment to our trade name and customer relationship intangible assets in our Towers segment as a result of the merger of our industrial weldment business into our Towers segment in December 2009 and due to a revision in projected revenues and cash flows associated with this customer relationship. Accordingly, we recorded goodwill and intangible impairment charges of $24,269 and $57,942, respectively, to properly reflect the carrying value of these assets.
Intangible amortization expense decreased from $10,645 during the year ended December 31, 2008, to $9,524 during the year ended December 31, 2009. The decrease was primarily due to a $1,203 reduction in amortization expense in our Gearing segment as a result of the impairment in 2009 to its customer relationship intangibles.
Total other expense, net, was $2,308 during the year ended December 31, 2008, compared to other income, net, of $4,280 during the year ended December 31, 2009. The increase was primarily attributable to the recognition of $5,082 in income related to an escrow agreement settlement with the former owners of Brad Foote during the second quarter of 2009.
During the year ended December 31, 2009 we reported a benefit for income taxes of $947 compared to a provision for income taxes of $1,096 during the year ended December 31, 2008. The increase in income tax benefit for 2009 compared to 2008 was primarily attributable to a reduction in our deferred income tax liabilities in connection with the goodwill impairment charge recorded during 2009.
Net loss from continuing operations increased from $25,278 during the year ended December 31, 2008, to $107,026 during the year ended December 31, 2009, primarily as a result of the factors as described above.
Net loss from discontinued operations, net of tax increased from $7 during the year ended December 31, 2008, to $3,093 during the year ended December 31, 2009. The effects of the economic downturn on the wind industry and competitive pricing pressure negatively affected the 2009 results.
Net loss increased from $25,285 during the year ended December 31, 2008, to $110,119 during the year ended December 31, 2009, primarily as a result of the factors as described above.
Towers Segment
The following table summarizes the Towers segment operating results for the years ended December 31, 2009 and 2008:
| | Twelve Months Ended December 31, | ||||||
|---|---|---|---|---|---|---|---|
| | 2009 | 2008 | |||||
Revenues | $ | 93,316 | $ | 72,561 | |||
Impairment charges | 1,916 | 2,409 | |||||
Operating (loss) income | (499 | ) | 5,813 | ||||
Operating margin | (0.5 | )% | 8.0 | % | |||
Towers segment revenues increased $20,755, from $72,561 during the year ended December 31, 2008, to $93,316 during the year ended December 31, 2009. Approximately 21% of the increase in revenues was attributable to an increase in materials included in the selling price of wind turbine towers manufactured. Additionally, revenues increased by approximately 28% in connection with new customer agreements and the corresponding increase in production volumes at our Manitowoc, Wisconsin and Abilene, Texas facilities.
Despite higher revenues, the segment incurred an operating loss of $499 due in part to the impairment charge with respect to a customer relationship and trade name intangible in the aggregate amount of $1,916. The trade name intangible impairment charge was attributable to the merger of our specialty weldment operations into our Towers segment in December 2009, and the customer relationship intangible impairment was due to a revision in projected revenues and cash flows associated with this customer relationship. The decrease in operating income and operating margin was also due to production inefficiencies and increased travel and administrative expenses of approximately $3,350 associated with the start-up of our wind tower manufacturing facility in Abilene, Texas, and our operating margins were negatively impacted by approximately $4,200 due to less profitable customer contracts as compared to the prior year.
Gearing Segment
The following table summarizes the Gearing segment operating results for the years ended December 31, 2009 and 2008:
| | Twelve Months Ended December 31, | ||||||
|---|---|---|---|---|---|---|---|
| | 2009 | 2008 | |||||
Revenues | $ | 64,518 | $ | 104,553 | |||
Impairment charges | 80,295 | — | |||||
Operating loss | (97,058 | ) | (6,614 | ) | |||
Operating margin | (150.4 | )% | (6.3 | )% | |||
Gearing segment revenues decreased $40,035, from $104,553 during the year ended December 31, 2008, to $64,518 during the year ended December 31, 2009. The decrease in revenues was primarily attributable to 46% and 27% declines in wind gearing and industrial revenues, respectively. The manufacture of wind turbine gearing, which typically accounts for the majority of our gearing revenues, continued to be negatively affected by reduced or delayed production orders from our key gearing customers.
Gearing operating loss increased $90,444, from $6,614 during the year ended December 31, 2008, to $97,058 during the year ended December 31, 2009. The increase in operating loss was largely
attributable to impairment charges of $80,295 recorded during 2009. The impairment charges were the result of a revision in our estimates of future results of operations and associated cash flows due to a decline in production volumes. Additionally, the increase in operating loss was also the result of a continued decline in wind gearing production volumes, which resulted in direct labor and manufacturing overhead inefficiencies and under-absorption of fixed operating costs. Material costs were $3,972 higher due to additional product rework costs and scrap associated with specification adjustments for new wind gearing production orders. The increase in operating loss was also impacted by higher depreciation expense of $1,792 associated with capital investments made in 2008, and expenses and fees of $1,201 incurred in connection with the negotiation of amendments to our credit facility with Bank of America, partially offset by lower outside service expenses associated with a reduced level of activity and lower selling, general and administrative expenses due to cost reduction initiatives. Gearing operating margins deteriorated from (6.3%) during the year ended December 31, 2008 to (150.4%) during the year ended December 31, 2009, as a result of these factors.
Services Segment
The following table summarizes the Services segment operating results for the years ended December 31, 2009 and 2008:
| | Twelve Months Ended December 31, | ||||||
|---|---|---|---|---|---|---|---|
| | 2009 | 2008 | |||||
Revenues | $ | 27,575 | $ | 31,249 | |||
Impairment charges | — | — | |||||
Operating loss | (610 | ) | (1,822 | ) | |||
Operating margin | (2.2 | )% | (5.8 | )% | |||
Services segment revenues decreased $3,674, from $31,249 during the year ended December 31, 2008, to $27,575 during the year ended December 31, 2009. The decrease in revenues was primarily the result of 9% and 16% declines in our technical services and precision repair and engineering service revenues, respectively, during the year ended December 31, 2009. The decline in our technical services revenues was the result of a continued slowdown in operations and maintenance services performed for wind farm owners and operators, particularly in the fourth quarter of the year. The decline in engineering services revenues primarily relates to a decision by one of our large service customers to in-service work which was previously contracted to us.
Services segment operating loss improved $1,212, from $1,822 during the year ended December 31, 2008, to $610 during the year ended December 31, 2009. The operating margin improved from (5.8%) in 2008 to (2.2%) in 2009. The improvements in operating loss and operating loss margin were primarily attributable to cost reduction initiatives to align our administrative and field technicians cost structures as a result of the reduction in service contracts during the year ended December 31, 2009.
Corporate and Other
Corporate and Other operating loss improved $5,165, from $19,251 during the year ended December 31, 2008, to $14,086 during the year ended December 31, 2009. The decrease in operating loss was primarily attributable to a $4,279 reduction in professional fees associated with due diligence and acquisition-related costs incurred in connection with acquisitions we did not complete during 2008 and also related to Sarbanes-Oxley and other compliance initiatives, in addition to an $882 reduction in bad debt expense.
SUMMARY OF CRITICAL ACCOUNTING POLICIES
The methods, estimates and judgments that we use in applying our critical accounting policies have a significant impact on the results that we report in our financial statements. Some of our accounting
policies require us to make difficult and subjective judgments, often as a result of the need to make estimates regarding matters that are inherently uncertain.
We have identified the accounting policies listed below to be critical to obtain an understanding of our consolidated financial statements. This section should also be read in conjunction with Note 1 "Description of Business and Summary of Significant Accounting Policies" in Part IV, Item 15 in the notes to our consolidated financial statements for further discussion of these and other significant accounting policies.
Revenue Recognition
We recognize revenue when the earnings process is complete and when persuasive evidence of an arrangement exists, transfer of title has occurred or services have been rendered, the selling price is fixed or determinable, collectability is reasonably assured and delivery has occurred per the terms of the contract. Customer deposits and other receipts are deferred and recognized when the revenue is realized and earned.
In some instances, typically within our Towers and Weldments segment, products are sold under terms included in bill and hold sales arrangements that result in different timing for revenue recognition. We recognize revenue under these arrangements only when the buyer requests the bill and hold arrangement, a fixed schedule for delivery exists, the ordered goods are segregated from inventory and not available to fill other orders and the goods are complete and ready for shipment. Assuming these required revenue recognition criteria are met, revenue is recognized upon completion of product manufacture and customer acceptance.
Warranty Liability
We provide warranty terms that generally range from one to seven years for various products and services relating to workmanship and materials supplied by us. In certain contracts, we have recourse
provisions for items that would enable recovery from third parties for amounts paid to customers under warranty provisions.
Inventories
Inventories are stated at the lower of cost or market. We have recorded a reserve for excess of cost over market value in our inventory allowance. Market value of inventory, and management's judgment of the need for reserves, encompasses consideration of other business factors including physical condition, inventory holding period, contract terms, and usefulness. Inventories are valued based on an average cost method, which approximates the first-in, first-out (FIFO) basis.
Inventories consist of raw materials, work-in-process, and finished goods. Raw materials consist of components and parts for general production use. Work-in-process consists of labor and overhead, processing costs, purchased subcomponents, and materials purchased for specific customer orders. Finished goods consist of components purchased from third parties as well as components manufactured by us that will be used to produce final customer products.
Goodwill and Intangible Assets
Goodwill represents the excess of cost over fair market value of identifiable net assets acquired through business purchases. We perform our annual goodwill impairment test during the fourth quarter of each year, or more frequently when events or circumstances indicate that the carrying value of our assets may not be recovered. We test intangible assets for impairment when events or circumstances indicate that the carrying value of our assets may not be recovered. In evaluating the recoverability of the carrying value of goodwill and other intangible assets, we must make assumptions regarding the fair value of our reporting units. Our methodRecoverability is measured by comparing the assets' carrying amounts to their expected future undiscounted net cash flows. If such assets are considered to be impaired, the impairment recognized is measured based on the amount by which the carrying amount of determiningthe assets exceeds the fair value is based upon our estimate of the projected future discounted cash flows of our reporting units.
value. If our fair value estimates or related assumptions change in the future, we may be required to record additional impairment charges related to intangible assets.
Long-Lived Assets
We review property and equipment and other long-lived assets for impairment whenever events or circumstances indicate that carrying amounts may not be recoverable. If such events or changes in circumstances occur, we will recognize an impairment loss if the undiscounted future cash flows expected to be generated by the asset are less than the carrying value of the related asset. The impairment loss would adjust the asset to its fair value.
In evaluating the recoverability of long-lived assets, we must make assumptions regarding estimated future cash flows and other factors to determine the fair value of such assets. If our fair value estimates or related assumptions change in the future, we may be required to record impairment charges related to property and equipment and other long-lived assets.
Income Taxes
We account for income taxes based upon an asset and liability approach. Deferred tax assets and liabilities represent the future tax consequences of the differences between the financial statement carrying amounts of assets and liabilities versus the tax basis of assets and liabilities. Under this method, deferred tax assets are recognized for deductible temporary differences, and operating loss and tax credit carryforwards. Deferred tax liabilities are recognized for taxable temporary differences. Deferred tax assets are reduced by a valuation allowance when, in the opinion of management, it is more likely than not that some portion or all of the deferred tax assets will not be realized. The impact of tax rate changes on deferred tax assets and liabilities is recognized in the year that the change is enacted.
In connection with the preparation of our consolidated financial statements, we are required to estimate our income tax liability for each of the tax jurisdictions in which we operate. This process involves estimating our actual current income tax expense and assessing temporary differences resulting from differing treatment of certain income or expense items for income tax reporting and financial reporting purposes. We also recognize the expected future income tax benefits of net operating loss carryforwards as deferred income tax assets. In evaluating the realizability of deferred income tax assets associated with net operating loss carryforwards, we consider, among other things, expected future taxable income, the expected timing of the reversals of existing temporary reporting differences, and the expected impact of tax planning strategies that may be implemented to prevent the potential loss of future income tax benefits. Changes in, among other things, income tax legislation, statutory income tax rates, or future taxable income levels could materially impact our valuation of income tax assets and liabilities and could cause our income tax provision to vary significantly among financial reporting periods.
We also account for the uncertainty in income taxes related to the recognition and measurement of a tax position taken or expected to be taken in an income tax return. We follow the applicable pronouncement guidance on derecognition, classification, interest and penalties, accounting in interim periods, disclosure, and transition related to the uncertainty in these income tax positions.
Recent Accounting Pronouncements
The following is a listing of recent accounting standards issued by the Financial Accounting Standards Board (the "FASB") and their effect on the Company.
In JanuaryJuly 2010, the FASB issued Accounting Standards Update ("ASU") 2010-06,2010-20,Fair Value MeasurementsDisclosures about the Credit Quality of Financing Receivables and Disclosuresthe Allowance for Credit Losses (Topic 820)("ASU 2010-20"). ASU 2010-06 provides additional disclosure requirements related to fair value measurements. ASU 2010-06 is effective for interim and annual reporting periods beginning after December 15, 2009, except for the2010-20 requires increased disclosures about purchases, sales, issuancesthe credit quality of financing receivables and
settlements in the roll forwardfinancing receivables. We have adopted this standard as of activity in Level 3 fair value measurements. Disclosure requirements applicable to Level 3 transactions are effective for fiscal years beginning after December 15, 2010January 1, 2011 and for interim periods within those fiscal years, with early adoption permitted. The portion of ASU 2010-06 that was effective beginning after December 15, 2009 did not have ait had no material effectimpact on our consolidated financial position, results of operations or cash flows. Additionally, we do not anticipate that the disclosure requirements applicable to Level 3 transactions that are effective for fiscal years beginning after December 15, 2010 will have a material effect on our financial position, results of operations or cash flows.
In October 2009, the FASB issued ASU 2009-13,Revenue Recognition (Topic 605). ASU 2009-13 provides additional guidance related to the accounting for multiple-deliverable arrangements to account for products or services (deliverables) separately rather than as a combined unit and eliminates the residual method of allocation. ASU 2009-13 is effective prospectively for revenue arrangements entered into or materially modified in fiscal years beginning on or after September 15, 2010, with early adoption permitted. We do not anticipate that the provisions of ASU 2009-13 will have a material effect on our financial position,condition, results of operations or cash flows.
LIQUIDITY, FINANCIAL POSITION AND CAPITAL RESOURCES
At December 31, 2010,2011, cash and cash equivalentsassets totaled $15,331,$14,216, compared to our cash and cash equivalentsassets which totaled $4,701$15,501 at December 31, 2009.2010. On September 21, 2011, we completed a public offering of our common stock, par value $0.001 per share, at an offering price of $0.40 per share. In January 2010,the offering, we sold ten million32,500,000 newly issued shares of our common stock for approximately $12,155 in proceeds, of approximately $54,625, net ofafter deducting underwriting discounts. Additionally, the completion of our equitydiscounts, but before deducting other offering enabled us to use a portion of theserelated costs. The proceeds to reduce our outstanding indebtedness. In January 2010, we repaid outstanding indebtedness due to Bank of America and ICB in the amounts of $16,076 and $3,066, respectively. The repayment of this indebtedness reduced our future debt service requirements, and eliminated subsidiary-specific financial covenant requirements and asset liens. Wewill be used the remainder of these proceeds for general operating purposespurposes. We feel that we have adequate internal and specificexternal cash resources to meet current and future operating requirements.
Our most relevant internal metric to analyze our liquidity is operating working capital, expenditures, specificallywhich is comprised of accounts receivable and inventories, net of accounts payable and customer deposits. Our operating working capital at December 31, 2011 was $13,980, or 6% of trailing three months of sales annualized. This is an increase of $6,037 from December 31, 2010, when operating working capital was $7,943, or 4% of trailing three months of sales annualized. We anticipate our working capital needs to help us startcontinue to grow in the future based on the transactional structural changes of raw material (steel) purchasing pursuant to orders for our drivetrain service center.Towers and Weldments segment, which remains our largest potential use of working capital.
In September 2010, Brad Foote, Broadwind Services and Broadwind Towers (collectively, the Company's domestic subsidiaries ("Subsidiaries""Subsidiaries") and Badger entered into account purchase agreements (the "AP Agreements") with Wells Fargo.Fargo Bank, N.A. ("Wells Fargo"). The aggregate facility limit of the AP Agreements is $10,000. At December 31, 2010, no amounts were drawn underOn October 19, 2011, the AP Agreements were amended to modify the month-end minimum total cash balance requirement from $5,000 to the greater of $2,000 or the outstanding purchased amount, not to exceed $5,000. At December, 2011, $523 of financed receivables remained outstanding, and wethe
Subsidiaries had the ability to borrowdraw up to $10,000,$9,477, subject to maintaining a month-end minimum total cash balance of $5,000.$2,000.
Our abilityWhile we believe that we will continue to make scheduled payments onhave sufficient cash flows to operate our business and meet our financial debt andcovenants, there can be no assurances that our operations will generate sufficient cash or that credit facilities will be available in an amount sufficient to enable us to pay our indebtedness or to fund our other financial obligations will depend onliquidity needs. If assumptions regarding our future financial and operating performance. However, ifrestructuring efforts, sales and subsequent collections from several of our large customers, as well as revenues generated from new customer orders, are not materially consistent with management's expectations, we may encounter cash flow and liquidity issues. Additional funding may not be available when needed or on terms acceptable to us. Furthermore, if we are unable to obtain additional capital, we will likely be required to delay, reduce the scope of or eliminate our plans for expansion and growth, and thisus, which could affect our overall operations. Any additional equity financing, if available, may be dilutive to stockholders, and additional debt financing, if available, will likely require financial covenants or other restrictions. WhileAdditionally, we believe thathave a limited number of shares of common stock authorized for issuance under our certificate of incorporation following our recent common stock offering. As such, our ability to raise capital through future equity issuances may be restricted unless we will continue to have sufficient cash flows to operateincrease the number of authorized shares of common stock, which would require the approval of a majority of the holders of our businesses and meet our financial debt covenants, there can be no assurances that our operations will generate sufficient cash or that credit facilities will be available to us in an amount sufficient to enable us to pay our indebtedness or to fund our other liquidity needs.
Table of Contentsoutstanding shares.
Sources and Uses of Cash
Operating Cash Flows
During the year ended December 31, 2010,2011, net cash flows used in operating activities totaled $10,807,$10,304, compared to net cash provided byused in operating activities of $4,611$10,123 for the year ended December 31, 2009.2010. The decreaseincrease in net cash provided byused in operating activities as compared to the prior year was primarily attributable to increases in our inventory and accounts receivable balances, along with a decrease in our accounts payable. Partially offsetting this increase was an increase in our inventory balances.customer deposits, and reduced loss from operations. The increase in inventoriesloss from operations was $8,234 lower than the resultprior year loss exclusive of replenishing raw material inventories to meet current production needs.prior year impairment charges.
Investing Cash Flows
During the years ended December 31, 20102011 and 2009,2010, net cash used in investing activities totaled $5,015$2,588 and $11,952,$5,015, respectively. The decrease in net cash used in investing activities as compared to the prior year was primarily attributable to a reduction in capital expenditures due toand the completionsale of certain capital projects initiatedexcess equipment in prior years. During the year ended December 31, 2009, we made capital expenditures totaling $11,271, which primarily related to the construction of our wind tower manufacturing facility in Abilene, Texas. During the year ended December 31, 2010, we made capital expenditures totaling $6,893, primarily related to equipment purchases for our newly constructed wind tower manufacturing facility in Brandon, South Dakota and purchases related to our drivetrain service center in Abilene, Texas. Cash flows from investing activities also increased $1,840 during the year ended December 31, 2010, due to the release of a security interest as part of the conversion of the Construction Loan into the Great Western Term Loan (as such terms are defined below).2011.
Financing Cash Flows
During the year ended December 31, 2010,2011, net cash provided by financing activities totaled $32,637,$11,305, compared to net cash usedprovided by financing activities of $2,326$31,953 for the year ended December 31, 2009.2010. The increasedecrease in net cash provided by financing activities as compared to the prior year was attributable to thelarger proceeds from an equity offering weof $53,347 completed in January 2010, compared to proceeds from an equity offering of $11,697 completed in which we sold 10,000,000 newly issued shares of our common stock for approximately $54,625, net of underwriting discounts.September 2011. Partially offsetting the increase in net cash provided by financing activities was higherdecrease associated with the reduced proceeds from the equity offerings, were lower payments on lines of credit and notes payable. The decreasepayable of $1,517 in lines of credit and notes payable was primarily2011 versus $21,231 in 2010, due to the repaymentreduction of our outstanding indebtedness due to Bank of Americadebt balances during 2011 and ICB in the aggregate amount of $19,142 in January 2010.
Credit Facilities
Bank of America Debt (Repaid)
In connection with our acquisition of Brad Foote in October 2007, we assumed outstanding debt and available lines of credit totaling approximately $25,500 under various secured debt facilities (the "BOA Debt Facilities") with Bank of America. As of December 31, 2009, the total principal amount outstanding under the BOA Debt Facilities was approximately $15,964, and the effective per annum interest rate was 7%. On January 22, 2010, (i) Brad Foote repaid all of the outstanding principal and interest under the BOA Debt Facilities in the aggregate amount of approximately $16,076 from proceeds of the public offering of common stock; and (ii) the BOA Debt Facilities were terminated.
Investors Community Bank Credit Line (Expired March 12, 2010)
In October 2007, Tower Tech obtained a secured line of credit (the "ICB Line") from ICB in the amount of $2,500, which was subsequently increased to $5,500 on March 21, 2008. On March 13, 2009, ICB agreed to extend the maturity date of the ICB Line to March 13, 2010. Pursuant to a Master Amendment dated as of December 30, 2009 among ICB, Tower Tech and Broadwind (as guarantor)
(the "Master Amendment"), the amount of the ICB Line was increased to $6,500, subject to borrowing base availability. Tower Tech repaid all of the outstanding indebtedness under the ICB Line in the amount of $3,066 on January 26, 2010, and allowed the ICB Line to expire on March 13, 2010.
Investors Community Bank—NotesLoans
On April 7, 2008, RBA executed four (4) promissory notes with ICB (the "ICB Notes"in favor of Investors Community Bank ("ICB") in the aggregate principal amount of approximately $3,781, as follows: (i) a$3,781. Three of these promissory notes were term note in the maximumnotes, with initial principal amount of approximately $421,balances totaling $2,049, bearing interest at afixed rates ranging from 5.65% to 6.85% per annum, rate of 6.85%, with a maturity date ofmaturities ranging from October 5, 2012; (ii) a term2012 to April 2013 (collectively, the "ICB Notes"). The fourth promissory note in the maximum principal amount of $700, bearing interest at a per annum rate of 5.65%, with a maturity date of April 25, 2013; (iii) a term note in the maximum principal amount of $928, bearing interest at a per annum rate of 5.65%, with a maturity date of April 25, 2013; and (iv)was a line of credit note, which has been repaid in the maximum principal amount of $1,732, bearing interest at a per annum rate of 4.48% until May 1, 2008 and thereafter at the London Interbank Offered Rate ("LIBOR") plus 1.75%, with a maturity date of April 5, 2009 (the "Line of Credit Note"). The Line of Credit Note was subsequently modified on March 13, 2009 to extend the maturity date to March 13, 2010 and to change the interest rate to the greater of (A) 5% or (B) prime. The ICB Notes provide for multiple advances, and were secured by substantially all of the assets of RBA.full.
Pursuant to the merger of RBA into Tower TechBroadwind Towers on December 31, 2009, Tower Tech became the successor by merger to RBA's interest in the loans from ICB to RBA evidenced by the ICB Notes (other than(collectively, the Line"ICB Loans") were modified pursuant to a Master Amendment among ICB, Broadwind Towers and the Company (as guarantor) (the "Master Amendment"). Under the terms of Credit Note, which was repaid in full in January 2010). Pursuantthe Master Amendment, Broadwind Towers agreed to a number of security and financial covenants. As the outstanding balances under the ICB Loans have declined, certain of these requirements have been removed through subsequent amendments to the Master Amendment, Tower Tech agreed toAmendment. The remaining security requirements are that Broadwind Towers maintain a minimum debt service coverage ratio in addition to certain other requirements. The Master Amendment was amended as of December 30, 2010, (i) to delete the requirements that Tower Tech maintain a collateral account as security for the obligations under the ICB Notes and that no additional loans or leases would be entered into by Tower Tech without the prior approval of ICB, and (ii) to replace the requirement that Tower Tech maintain its primary deposit accounts with ICB with the requirement that Tower Tech maintain with ICB a depository relationship of not less than $700 with such fundsICB and maintain a debt service ratio of not less than 1.25 to be deposited into1.0 at all times. The ICB Loans are also secured by a money market account or certificate of depositmortgage on a facility owned by no later than January 7, 2011.Broadwind Towers in Clintonville, Wisconsin, and a guaranty by the Company. As of December 31, 2010,2011, (i) Tower Tech was in compliance with all covenants under its credit facilities with ICB, (ii) the total amount of outstanding indebtedness under the remaining ICB Notes was $1,371 and (iii)$1,101, (ii) the effective per annum interest rate under the remaining ICB Notes was 5.81%.5.75%, and (iii) Broadwind Towers was in compliance with all covenants under the documents evidencing and securing the ICB Loans.
Great Western Bank Loan
On April 28, 2009, Tower TechBroadwind Towers entered into a Construction Loan Agreement with Great Western Bank ("GWB"), pursuant to which GWB agreed to provide up to $10,000 in financing (the "Construction Loan") to fund construction of Tower Tech'sBroadwind Towers' wind tower manufacturing facility in Brandon, South Dakota (the "Facility"). Pursuant to a Change in Terms Agreement dated April 5, 2010 between GWB and Tower Tech,Broadwind Towers, the Construction Loan was converted to a term loan (the "Great Western"GWB Term Loan") providing for monthly payments of principal plus interest, extending the maturity date to November 5, 2016, reducing the principal amount to $6,500, and changing the per annum interest rate to 8.5%. Tower TechBroadwind Towers was required to pay a 1.0% origination fee upon the conversion.
The Great WesternGWB Term Loan is secured by a first mortgage on the Facility and all fixtures and proceeds relating thereto, pursuant to a Mortgage and a Commercial Security Agreement, each between Tower TechBroadwind Towers and GWB, and by a Commercial Guaranty from the Company. In addition, the Company haswe have agreed to subordinate all intercompany debt with Tower TechBroadwind Towers to the Great WesternGWB Term Loan. The Great WesternGWB Term Loan contains representations, warranties and covenants that are customary for a term financing arrangement and contains no financial covenants. As of December 31, 2010,2011, the total outstanding indebtedness under the Great WesternGWB Term Loan was $5,750.
Table of Contents$4,833, which is included in our financial statements as Liabilities Held for Sale.
Wells Fargo Account Purchase Agreements
On September 29, 2010, the Subsidiaries entered into the AP Agreements with Wells Fargo. Under the AP Agreements, when requested by us, Wells Fargo will advance funds against certain receivables arising from sales of the Subsidiaries' products and services. In connection with the entry into the AP Agreements, the Company and each Subsidiary have executed guaranties (including cross-guaranties) in favor of Wells Fargo. With respect to the Subsidiaries, the AP Agreements contain provisions providing for cross-defaults and cross-collateralization. In addition, each Subsidiary has granted to Wells Fargo a security interest against all financed receivables and related collateral. Prior to entering into the AP Agreements, there was no material relationship between the Company, the Subsidiaries and Wells Fargo.
Under the terms of the AP Agreements, when requested by us, Wells Fargo will advance approximately 80% of the face value of eligible receivables to the Subsidiaries. Wells Fargo will have full recourse to the Subsidiaries for collection of the financed receivables. The aggregate facility limit of the AP Agreements is $10,000. For Wells Fargo's services under the AP Agreements, the Subsidiaries have agreed to pay Wells Fargo (i) a floating discount fee ofequal to the then-prevailing LIBORLondon Interbank Offered Rate ("LIBOR") plus 3.75% per annum on the sum of the outstanding financed accounts, (ii) an annual facility fee of 1% of the aggregate facility limit, and (iii) an annual unused line fee of 0.042% on the portion of the credit facility which is unused. The initial term of the AP Agreements ends on September 29, 2013. If the AP Agreements are terminated prior to thisthat date, an early termination fee of up to 3%2% of the aggregate facility limit may apply. At December 31, 2010, no amounts were drawn under the AP Agreements, and the Subsidiaries had the ability to borrow up to $10,000, subject to maintaining a month-end minimum total cash balance of $5,000.
In connection with the sale of Badger to a third party purchaser on March 4, 2011, the AP Agreement between Badger and Wells Fargo and the guaranty provided by Badger to Wells Fargo with respect to the other AP Agreements were each terminated, pursuant to an Omnibus Amendment to Account Purchase Agreements and Guaranties dated as of March 4, 2011, by and among the Company, the Subsidiaries and Wells Fargo. On October 19, 2011, the AP Agreements were further amended to modify the month-end minimum total cash balance requirement from $5,000 to the greater of $2,000 or the outstanding purchased amount, not to exceed $5,000.
During 2011, we financed approximately $981 of accounts receivable with Wells Fargo. At December 31, 2011, $523 of financed receivables remained outstanding, and the Subsidiaries had the ability to draw up to $9,477, subject to maintaining a month-end minimum total cash balance of $2,000.
Selling Shareholder Notes
On May 26, 2009, the Companywe entered into a settlement agreement (the "Settlement Agreement") with the former owners of Brad Foote, (the "Selling Shareholders"), including J. Cameron Drecoll, who served as our Chief Executive Officer and a member of our Board of Directors until December 1, 2010. The Settlement Agreement related to the post-closing escrow established in connection with our acquisition of Brad Foote. Under the terms of the Settlement Agreement, among other terms, we issued three promissory notes to the Selling Shareholdersformer owners in the aggregate principal amount of $3,000 (the "Selling Shareholder Notes"). The Selling Shareholder Notes issued to the former owners other than Mr. Drecoll mature on May 28, 2012
and bear interest at a rate of 7% per annum, with interest payments due quarterly. The Selling Shareholder Note issued to Mr. Drecoll in the principal amount of $2,320 and pursuant to the terms of the Settlement Agreement (the "Drecoll Note") also was originally scheduled to mature on May 28, 2012 and bore interest at a rate of 7% per annum, with interest payments due quarterly; however, effective as of July 1, 2011, the Drecoll Note was amended and restated to effect the following modifications: (i) the maturity date was changed to January 10, 2014; (ii) the interest rate was changed to 9% per annum; and (iii) the payment schedule was changed to quarterly payments of principal and interest, such that the Drecoll Note is deemed by usnow self-amortizing with payments that commenced in the fourth quarter of 2011. We agreed to bepay Mr. Drecoll a related party transaction.restructuring fee in the amount of $10 in connection with the restructuring of the Drecoll Note. As of December 31, 2010,2011, principal of $3,000$2,791 and accrued interest of $53$59 were outstanding under the Selling Shareholder Notes. We have accounted for
Other
Included in Long Term Debt, Net of Current Maturities is $2,280 associated with the Selling Shareholder Notes as long-term debtNew Markets Tax Credit Agreement described further in described in Note 19, "New Markets Tax Credit" in Part IV, Item 15 in the notes to our consolidated balance sheets as of December 31, 2010.
Table of Contentsfinancial statements.
Contractual Obligations
The following table sets forth, as of December 31, 2010,2011, minimum future cash payments due under contractual obligations, including, among others, our debt and credit agreements, non-cancelable operating and capital lease agreements and purchase commitments as follows:
| | 2011 | 2012 | 2013 | 2014 | 2015 | 2016 & Thereafter | Total | 2012 | 2013 | 2014 | 2015 | 2016 | 2017 & Thereafter | Total | ||||||||||||||||||||||||||||||
|---|---|---|---|---|---|---|---|---|---|---|---|---|---|---|---|---|---|---|---|---|---|---|---|---|---|---|---|---|---|---|---|---|---|---|---|---|---|---|---|---|---|---|---|---|
Debt and credit agreements (1) | $ | 1,577 | $ | 4,550 | $ | 1,330 | $ | 1,176 | $ | 1,178 | $ | 1,437 | $ | 11,248 | ||||||||||||||||||||||||||||||
Estimated interest payments (2) | 785 | 553 | 330 | 233 | 149 | 54 | 2,104 | |||||||||||||||||||||||||||||||||||||
Debt and credit agreements(1) | $ | 2,202 | $ | 1,390 | $ | 493 | $ | 188 | $ | 46 | $ | 2,680 | $ | 6,999 | ||||||||||||||||||||||||||||||
Liabilities held for sale | 4,833 | — | — | — | — | — | 4,833 | |||||||||||||||||||||||||||||||||||||
Estimated interest payments(2) | 732 | 202 | 125 | 109 | 106 | 494 | 1,768 | |||||||||||||||||||||||||||||||||||||
Operating lease obligations | 4,270 | 3,666 | 2,468 | 2,142 | 1,601 | 3,915 | 18,062 | 3,588 | 3,132 | 2,803 | 2,235 | 2,265 | 22,644 | 36,667 | ||||||||||||||||||||||||||||||
Capital lease obligations (3) | 1,172 | 1,054 | 908 | — | — | — | 3,134 | |||||||||||||||||||||||||||||||||||||
Capital lease obligations(3) | 1,091 | 944 | 35 | 46 | — | — | 2,116 | |||||||||||||||||||||||||||||||||||||
Purchase commitments | 2,610 | — | — | — | — | — | 2,610 | 390 | — | — | — | — | — | 390 | ||||||||||||||||||||||||||||||
Total contractual cash obligations | $ | 10,414 | $ | 9,823 | $ | 5,036 | $ | 3,551 | $ | 2,928 | $ | 5,406 | $ | 37,158 | $ | 12,836 | $ | 5,668 | $ | 3,456 | $ | 2,578 | $ | 2,417 | $ | 25,818 | $ | 52,773 | ||||||||||||||||
Debt and Credit Agreements. Debt and credit agreements include outstanding borrowings under our lines of credit, term notes related to vehicle and equipment purchases, and notes payable related to an escrow agreement settlement and a purchase agreement for manufacturing equipment. See Note 10 "Debt and Credit Agreements" in Part IV, Item 15 in the notes to our consolidated financial statements for further discussion of our outstanding indebtedness and credit agreements.
Operating Lease Obligations. We lease a number of our facilities and certain equipment under operating leases expiring at various dates through 2023.2026. Lease terms generally range from 3 to 15 years with renewal options for extended terms. The amounts in the table above represent future minimum lease payments for non-cancelable operating leases. During 2011 we extended the lease for one of our Cicero, Illinois manufacturing facilities by an additional seven years, resulting in an increase in our operating lease obligations when compared to the prior year.
Capital Lease Obligations. We have capital lease obligations related to certain manufacturing equipment and vehicles expiring at various dates through 2013.2015. As of December 31, 2010,2011, the balance of our outstanding capital lease obligations was approximately $3,134,$2,116, which includes accrued interest of approximately $366.$176.
Purchase Commitments. Purchase commitments represent remaining payments due on equipment purchase contracts related to the construction of our Brandon, South Dakota wind tower manufacturing facility as well as equipment purchase orders associated with our drivetrain service center located in Abilene, Texas.facility.
Off-Balance Sheet Arrangements
During April 2009, Tower TechBroadwind Towers entered into a sale-leaseback agreement with Varilease, Finance, Inc. ("Varilease"), whereby Tower Techit sold certain equipment to Varilease in exchange for $2,935 in cash and agreed to lease the equipment back from Varilease for a certain period of time. The primary purpose of this arrangement was to provide additional liquidity for meeting working capital
requirements. The lease agreement is for a three-year period with rental payments of $85 due monthly. In addition, the sale of the assets resulted in a gain on disposition of $40, which is being amortized to other income in our statement of operations over the life of the operating lease.
ITEM 7A. QUANTITATIVE AND QUALITATIVE DISCLOSURES ABOUT MARKET RISK
We are exposed to financial market risks, which include changes in interest rates on our variable rate obligations, (of which we have none outstanding as of December 31, 2010), credit risks on accounts receivable and raw material price fluctuations.
Interest Rate Exposure
As of December 31, 2010, all2011, the majority of our third party borrowings under our debt and credit agreements bear annual interest at fixed interest rates; therefore, we had nohave limited interest rate exposure. TheWe are subject to interest rate fluctuation exposure only through amounts financed under the AP Agreements. As of December 31, 2011, we had $523 of financed receivables outstanding borrowings under the AP Agreements. Our potential interest rate exposure over a one-year period that would result from a hypothetical, instantaneous and unfavorable change of 100 basis points in the interest rate of our variable rate obligations were $10,601 aswould be approximately $5 on a pre-tax basis. As of December 31, 2009.2010, all of our third party borrowings under our debt and credit agreements were at fixed interest rates
Credit Risk Exposure
We are exposed to credit risk on our accounts receivable balances and cash balances. Historically, our accounts receivable are highly concentrated with a select number of financially stable customers. During the years ended December 31, 20102011 and 2009,2010, our five largest customers accounted for approximately 78%76% and 73%78%, respectively, of consolidated revenues. Additionally, as of December 31, 20102011 and 2009,2010, our five largest customers comprised approximately 79%62% and 65%79%, respectively, of our outstanding accounts receivable balances. We are also exposed to potentially significant credit risk as our cash deposits often exceed the federally insured amounts. To address this we adhere to a formal investment policy which requires us to invest excess cash in efforts to diversify our cash away from any single financial institution.
Commodity Risk Exposure
We are dependent upon the supply of certain raw materials used in our production processes, and these raw materials are exposed to price fluctuations on the open market. The primary raw material we use is steel. To reduce price risk caused by market fluctuations, we have incorporated price adjustment clauses in certain sales contracts. Management believes a hypothetical 10% change in the price of steel and other raw materials would not have a significant effect on our consolidated results of operations or cash flows because these costs are generally passed through to our customers.
ITEM 8. FINANCIAL STATEMENTS AND SUPPLEMENTARY DATA
The financial information required by Item 8 is contained in Part IV, Item 15 of this Annual Report on Form 10-K.
ITEM 9. CHANGES IN AND DISAGREEMENTS WITH ACCOUNTANTS ON ACCOUNTING AND FINANCIAL DISCLOSURE
None.
ITEM 9A. CONTROLS AND PROCEDURES
Evaluation of Disclosure Controls and Procedures
We maintain disclosure controls and procedures (as defined in Rules 13a-15(e) and 15d-15(e) under the Exchange Act) that are designed to ensure that information required to be disclosed in our reports filed under the Exchange Act is recorded, processed, summarized and reported within the time periods specified in the SEC's rules and forms. This information is also accumulated and
communicated to management, including our Chief Executive Officer and Chief Financial Officer, as appropriate, to allow timely decisions regarding required disclosure. Our management, under the supervision and with the participation of our Chief Executive Officer and Chief Financial Officer, evaluated the effectiveness of the design and operation of our disclosure controls and procedures as of the end of the most recent fiscal quarter reported on herein. Based on that evaluation, our Chief Executive Officer and Chief Financial Officer concluded that our disclosure controls and procedures are effective.
Changes in Internal Control over Financial Reporting
As of December 31, 2009, management determined that, we did not maintain effective internal control over financial reporting due to the previously reported material weakness related to non-routine revenue transactions, and the related accounting treatment of those transactions was not appropriately reviewed to ensure compliance with accounting principles generally accepted in the U.S. ("GAAP") at our Gearing segment.
We have made enhancements to our internal control structure to address our previously disclosed material weakness. We hired additional experienced and qualified financial professionals to strengthen our accounting and financial controls functions, implemented enhancements to our monthly financial reporting, developed enhancements to our overall reporting procedures and continued to enhance our control environment. Enhancements included improved procedures for the tracking and reconciliation of revenue transactions and enhanced due diligence by corporate personnel over month end reporting. We have also upgraded our enterprise resource planning software and server databases. These changes were tested during the fourth quarter of 2010 and were found to be effective.
Report of Management on Internal Control Over Financial Reporting
TheOur management, of the Company, including the Company's Chief Executive Officer and Chief Financial Officer, is responsible for establishing and maintaining adequate internal control over financial reporting (as defined in Rules 13a-15(f) and 15d-15(f) under the Exchange Act).
TheOur management, of the Company, including the Company'sour Chief Executive Officer and Chief Financial Officer, assessed the effectiveness of the Company'sour internal control over financial reporting as of December 31, 2010.2011. Management based this assessment on criteria for effective internal control over financial reporting described in "Internal Control—Integrated Framework" issued by the Committee of Sponsoring Organizations of the Treadway Commission.
Based on this assessment, management determined that, as of December 31, 2010,2011, our internal control over financial reporting is effective.
Grant Thornton LLP, an independent registered public accounting firm, who audited our consolidated financial statements included in this Annual Report on Form 10-K, has also audited the effectiveness of our internal control over financial reporting as stated in its report.
None.
ITEM 10. DIRECTORS, EXECUTIVE OFFICERS AND CORPORATE GOVERNANCE
Directors and Executive Officers
With the exception of the description of our Code of Ethics and Business Conduct below, the information required by this item is incorporated herein by reference from the discussion under the headings "Directors and Director Compensation," "Corporate Governance" and "Other Matters—Section 16(a) Beneficial Ownership Reporting Compliance" in our definitive Proxy Statement to be filed in connection with our 20112012 Annual Meeting of Stockholders (the "2011"2012 Proxy Statement").
Code of Ethics
We have adopted a Code of Ethics and Business Conduct that applies to all of our directors, executive officers and senior financial officers (including our principal executive officer, principal financial officer, principal accounting officer, controller, and any person performing similar functions). The Code of Ethics and Business Conduct is available on our website atwww.bwen.com under the caption "Investors" and is available in print, free of charge, to any stockholder who sends a request for a paper copy to Broadwind Energy, Inc., Attn: Investor Relations, 47 East Chicago Avenue, Suite 332, Naperville, IL 60540. Broadwind intendsWe intend to include on our website any amendment to, or waiver from, a provision of our Code of Ethics and Business Conduct that applies to our principal executive officer, principal financial officer, principal accounting officer or controller, or persons performing similar functions, that relates to any element of the code of ethics definition enumerated in Item 406(b) of Regulation S-K.
ITEM 11. EXECUTIVE COMPENSATION
Information regarding director and executive compensation is incorporated by reference from the discussion under the headings "Directors and Director Compensation" and "Compensation Discussion and Analysis" in the 20112012 Proxy Statement.
ITEM 12. SECURITY OWNERSHIP OF CERTAIN BENEFICIAL OWNERS AND MANAGEMENT AND RELATED STOCKHOLDER MATTERS
Certain of the information required by this item is incorporated herein by reference from the discussion under the heading "Security Ownership of Certain Beneficial Holders and Management" in the 20112012 Proxy Statement.
The following table provides information as of December 31, 2010,2011, with respect to shares of our common stock that may be issued under our existing equity compensation plans:
EQUITY COMPENSATION PLAN INFORMATION
| | | (a) | (b) | (c) | (a) | (b) | (c) | |||||||||||||||
|---|---|---|---|---|---|---|---|---|---|---|---|---|---|---|---|---|---|---|---|---|---|---|
Plan Category | Plan Category | Number of securities to be issued upon exercise of outstanding options, warrants, and rights | Weighted-average exercise price of outstanding options, warrants, and rights | Number of securities remaining available for future issuances under equity compensation plans (excluding securities reflected in column (a)) | Number of securities to be issued upon exercise of outstanding options, warrants, and rights | Weighted-average exercise price of outstanding options, warrants, and rights | Number of securities remaining available for future issuances under equity compensation plans (excluding securities reflected in column (a)) | |||||||||||||||
Equity compensation plans approved by stockholders | Equity compensation plans approved by stockholders | 1,630,095 | (1) | $ | 6.71 | 3,514,040 | (2) | 4,921,414 | (1) | $ | 2.54 | 62,119 | ||||||||||
Total | 4,921,414 | $ | 2.54 | 62,119 | ||||||||||||||||||
Total | 1,630,095 | $ | 6.71 | 3,514,040 | ||||||||||||||||||
ITEM 13. CERTAIN RELATIONSHIPS AND RELATED TRANSACTIONS, AND DIRECTOR INDEPENDENCE
The information required by this item is incorporated herein by reference from the discussion under the headings "Certain Transactions and Business Relationships" and "Corporate Governance" in our 20112012 Proxy Statement.
ITEM 14. PRINCIPAL ACCOUNTANT FEES AND SERVICES
The information required by this item is incorporated herein by reference from the discussion under the heading "Ratification of Appointment of Independent Registered Public Accounting Firm" in our 20112012 Proxy Statement.
ITEM 15. EXHIBITS AND FINANCIAL STATEMENT SCHEDULES
1. Financial Statements
The financial statements listed on the Index to Financial Statements (page 49) are filed as part of this Annual Report.Report on Form 10-K.
2. Financial Statement Schedules
These schedules have been omitted because the required information is included in the consolidated financial statements or notes thereto or because they are not applicable or not required.
3. Exhibits
The exhibits listed on the Index to Exhibits (pages 9392 through 98)97) are filed as part of this Annual Report.Report on Form 10-K.
| | Page | |
|---|---|---|
Reports of Independent Registered Public Accounting Firm | 50 | |
Consolidated Balance Sheets as of December 31, | 52 | |
Consolidated Statements of Operations for the Years Ended December 31, 2011, 2010, | 53 | |
Consolidated Statements of Stockholders' Equity for the Years Ended December 31, 2011, 2010, | 54 | |
Consolidated Statements of Cash Flows for the Years Ended December 31, 2011, 2010, | 55 | |
Notes to Consolidated Financial Statements | 56 |
REPORT OF INDEPENDENT REGISTERED PUBLIC ACCOUNTING FIRM
To the Board of Directors and
Stockholders of Broadwind Energy, Inc.
We have audited Broadwind Energy, Inc.'s (a Delaware Corporation) internal control over financial reporting as of December 31, 2010,2011, based on criteria established inInternal Control—Integrated Framework issued by the Committee of Sponsoring Organizations of the Treadway Commission (COSO). Broadwind Energy, Inc.'s management is responsible for maintaining effective internal control over financial reporting and for its assessment of the effectiveness of internal control over financial reporting, included in the accompanying Management's Report on Internal Control over Financial Reporting. Our responsibility is to express an opinion on Broadwind Energy, Inc.'s internal control over financial reporting based on our audit.
We conducted our audit in accordance with the standards of the Public Company Accounting Oversight Board (United States). Those standards require that we plan and perform the audit to obtain reasonable assurance about whether effective internal control over financial reporting was maintained in all material respects. Our audit included obtaining an understanding of internal control over financial reporting, assessing the risk that a material weakness exists, testing and evaluating the design and operating effectiveness of internal control based on the assessed risk, and performing such other procedures as we considered necessary in the circumstances. We believe that our audit provides a reasonable basis for our opinion.
A company's internal control over financial reporting is a process designed to provide reasonable assurance regarding the reliability of financial reporting and the preparation of financial statements for external purposes in accordance with generally accepted accounting principles. A company's internal control over financial reporting includes those policies and procedures that (1) pertain to the maintenance of records that, in reasonable detail, accurately and fairly reflect the transactions and dispositions of the assets of the company; (2) provide reasonable assurance that transactions are recorded as necessary to permit preparation of financial statements in accordance with generally accepted accounting principles, and that receipts and expenditures of the company are being made only in accordance with authorizations of management and directors of the company; and (3) provide reasonable assurance regarding prevention or timely detection of unauthorized acquisition, use, or disposition of the company's assets that could have a material effect on the financial statements.
Because of its inherent limitations, internal control over financial reporting may not prevent or detect misstatements. Also, projections of any evaluation of effectiveness to future periods are subject to the risk that controls may become inadequate because of changes in conditions, or that the degree of compliance with the policies or procedures may deteriorate.
In our opinion, Broadwind Energy, Inc. maintained, in all material respects, effective internal control over financial reporting as of December 31, 2010,2011, based on the criteria established inInternal Control—Integrated Framework issued by COSO.
We also have audited, in accordance with the standards of the Public Company Accounting Oversight Board (United States), the consolidated balance sheets of Broadwind Energy, Inc. and subsidiaries as of December 31, 20102011 and 2009,2010, and the related consolidated statements of operations, stockholders' equity and cash flows for each of the three years in the period ended December 31, 20102011 and our report dated March 16, 201113, 2012 expressed an unqualified opinion.
/s/ GRANT THORNTON LLP
GRANT THORNTON LLP
Chicago, Illinois
March 16, 201113, 2012
REPORT OF INDEPENDENT REGISTERED PUBLIC ACCOUNTING FIRM
To the Board of Directors and
Stockholders of Broadwind Energy, Inc.
We have audited the accompanying consolidated balance sheets of Broadwind Energy, Inc. (a Delaware corporation) and subsidiaries (the "Company") as of December 31, 20102011 and 2009,2010, and the related consolidated statements of operations, stockholders' equity and cash flows for each of the three years in the period ended December 31, 2010.2011. These financial statements are the responsibility of the Company's management. Our responsibility is to express an opinion on these financial statements based on our audits.
We conducted our audits in accordance with the standards of the Public Company Accounting Oversight Board (United States). Those standards require that we plan and perform the audit to obtain reasonable assurance about whether the financial statements are free of material misstatement. An audit includes examining, on a test basis, evidence supporting the amounts and disclosures in the financial statements. An audit also includes assessing the accounting principles used and significant estimates made by management, as well as evaluating the overall financial statement presentation. We believe that our audits provide a reasonable basis for our opinion.
In our opinion, the consolidated financial statements referred to above present fairly, in all material respects, the financial position of Broadwind Energy, Inc. and subsidiaries as of December 31, 20102011 and 2009,2010, and the results of their operations and their cash flows for each of the three years in the period ended December 31, 20102011 in conformity with accounting principles generally accepted in the United States of America.
We also audited, in accordance with the standards of the Public Company Accounting Oversight Board (United States), Broadwind Energy, Inc.'s internal control over financial reporting as of December 31, 2010,2011, based on criteria establishedin Internal Control—Integrated Framework issued by the Committee of Sponsoring Organizations of the Treadway Commission (COSO), and our report dated March 16, 201113, 2012 expressed an unqualified opinion.
/s/ GRANT THORNTON LLP
GRANT THORNTON LLP
Chicago, Illinois
March 16, 201113, 2012
BROADWIND ENERGY, INC. AND SUBSIDIARIES
CONSOLIDATED BALANCE SHEETS
(In thousands, except share data)
| | | As of December 31, | As of December 31, | |||||||||||||
|---|---|---|---|---|---|---|---|---|---|---|---|---|---|---|---|---|
| | | 2010 | 2009 | 2011 | 2010 | |||||||||||
ASSETS | ASSETS | ASSETS | ||||||||||||||
CURRENT ASSETS: | CURRENT ASSETS: | |||||||||||||||
Cash and cash equivalents | $ | 13,340 | $ | 15,331 | ||||||||||||
Restricted cash | 876 | 170 | ||||||||||||||
Accounts receivable, net | 25,311 | 21,427 | ||||||||||||||
Inventories, net | 23,355 | 17,739 | ||||||||||||||
Prepaid expenses and other current assets | 4,033 | 3,476 | ||||||||||||||
Assets held for sale | 8,052 | 6,847 | ||||||||||||||
Cash and cash equivalents | $ | 15,331 | $ | 4,701 | ||||||||||||
Total current assets | 74,967 | 64,990 | ||||||||||||||
Restricted cash | 170 | 2,010 | ||||||||||||||
Accounts receivable, net | 21,427 | 21,487 | ||||||||||||||
Inventories, net | 17,739 | 8,825 | ||||||||||||||
Prepaid expenses and other current assets | 3,476 | 4,549 | ||||||||||||||
Assets held for sale | 6,847 | 2,004 | ||||||||||||||
Total current assets | 64,990 | 43,576 | ||||||||||||||
LONG-TERM ASSETS: | ||||||||||||||||
Property and equipment, net | Property and equipment, net | 106,317 | 129,619 | 87,766 | 106,317 | |||||||||||
Goodwill | — | 4,561 | ||||||||||||||
Intangible assets, net | Intangible assets, net | 10,073 | 32,401 | 9,214 | 10,073 | |||||||||||
Long-term assets held for sale | — | 17,993 | ||||||||||||||
Other assets | Other assets | 2,126 | 3,338 | 944 | 2,126 | |||||||||||
TOTAL ASSETS | TOTAL ASSETS | $ | 183,506 | $ | 231,488 | $ | 172,891 | $ | 183,506 | |||||||
|
|
| ||||||||||||||
CURRENT LIABILITIES: | CURRENT LIABILITIES: | |||||||||||||||
Lines of credit and notes payable | $ | 1,566 | $ | 140 | ||||||||||||
Current maturities of long-term debt | 636 | 1,437 | ||||||||||||||
Current portions of capital lease obligations | 965 | 966 | ||||||||||||||
Accounts payable | 17,358 | 22,342 | ||||||||||||||
Accrued liabilities | 5,749 | 6,515 | ||||||||||||||
Customer deposits | 17,328 | 8,881 | ||||||||||||||
Liabilities held for sale | 4,833 | 4,221 | ||||||||||||||
Lines of credit and notes payable | $ | 140 | $ | 10,717 | ||||||||||||
Current maturities of long-term debt | 1,437 | 7,782 | ||||||||||||||
Current portions of capital lease obligations | 966 | 882 | ||||||||||||||
Accounts payable | 22,342 | 14,499 | ||||||||||||||
Accrued liabilities | 6,515 | 6,679 | ||||||||||||||
Customer deposits | 8,881 | 10,199 | ||||||||||||||
Liabilities held for sale | 4,221 | 1,984 | ||||||||||||||
Total current liabilities | 44,502 | 52,742 | ||||||||||||||
Total current liabilities | 48,435 | 44,502 | ||||||||||||||
LONG-TERM LIABILITIES: | LONG-TERM LIABILITIES: | |||||||||||||||
Long-term debt, net of current maturities | 4,797 | 9,671 | ||||||||||||||
Long-term capital lease obligations, net of current portions | 975 | 1,802 | ||||||||||||||
Other | 825 | 1,335 | ||||||||||||||
Long-term debt, net of current maturities | 9,671 | 13,396 | ||||||||||||||
Long-term capital lease obligations, net of current portions | 1,802 | 2,749 | ||||||||||||||
Interest rate swap agreements | — | 253 | ||||||||||||||
Deferred income tax liabilities | — | 403 | ||||||||||||||
Long-term liabilities held for sale | — | 4,409 | ||||||||||||||
Other | 1,335 | 1,941 | ||||||||||||||
Total long-term liabilities | 12,808 | 23,151 | ||||||||||||||
Total long-term liabilities | 6,597 | 12,808 | ||||||||||||||
COMMITMENTS AND CONTINGENCIES | COMMITMENTS AND CONTINGENCIES | |||||||||||||||
STOCKHOLDERS' EQUITY: | STOCKHOLDERS' EQUITY: | |||||||||||||||
Preferred stock, $0.001 par value; 10,000,000 shares authorized; no shares issued or outstanding | — | — | ||||||||||||||
Common stock, $0.001 par value; 150,000,000 shares authorized; 139,779,197 and 107,112,817 shares issued and outstanding as of December 31, 2011 and 2010, respectively | 140 | 107 | ||||||||||||||
Additional paid-in capital | 370,123 | 356,545 | ||||||||||||||
Accumulated deficit | (252,404 | ) | (230,456 | ) | ||||||||||||
Preferred stock, $0.001 par value; 10,000,000 shares authorized; no shares issued or outstanding | — | — | ||||||||||||||
Common stock, $0.001 par value; 150,000,000 shares authorized; 107,112,817 and 96,701,127 shares issued and outstanding as of December 31, 2010 and 2009, respectively | 107 | 97 | ||||||||||||||
Additional paid-in capital | 356,545 | 300,779 | ||||||||||||||
Accumulated deficit | (230,456 | ) | (145,281 | ) | ||||||||||||
Total stockholders' equity | 126,196 | 155,595 | ||||||||||||||
Total stockholders' equity | 117,859 | 126,196 | ||||||||||||||
TOTAL LIABILITIES AND STOCKHOLDERS' EQUITY | TOTAL LIABILITIES AND STOCKHOLDERS' EQUITY | $ | 183,506 | $ | 231,488 | $ | 172,891 | $ | 183,506 | |||||||
The accompanying notes are an integral part of these consolidated financial statements.
BROADWIND ENERGY, INC. AND SUBSIDIARIES
CONSOLIDATED STATEMENTS OF OPERATIONS
(In thousands, except per share data)
| | | For the Years Ended December 31, | For the Years Ended December 31, | |||||||||||||||||||
|---|---|---|---|---|---|---|---|---|---|---|---|---|---|---|---|---|---|---|---|---|---|---|
| | | 2010 | 2009 | 2008 | 2011 | 2010 | 2009 | |||||||||||||||
Revenues | Revenues | $ | 136,896 | $ | 184,798 | $ | 207,349 | $ | 185,854 | $ | 136,896 | $ | 184,798 | |||||||||
Cost of sales | Cost of sales | 134,950 | 172,894 | 175,653 | 178,536 | 134,950 | 172,894 | |||||||||||||||
Restructuring | 131 | — | — | |||||||||||||||||||
Gross profit | Gross profit | 1,946 | 11,904 | 31,696 | 7,187 | 1,946 | 11,904 | |||||||||||||||
OPERATING EXPENSES: | OPERATING EXPENSES: | |||||||||||||||||||||
Selling, general and administrative | 26,316 | 27,404 | 32,422 | |||||||||||||||||||
Impairment charges | — | 40,777 | 82,211 | |||||||||||||||||||
Intangible amortization | 859 | 2,992 | 9,524 | |||||||||||||||||||
Restructuring | 441 | — | — | |||||||||||||||||||
Selling, general and administrative | 27,404 | 32,422 | 40,516 | |||||||||||||||||||
Impairment charges | 40,777 | 82,211 | 2,409 | |||||||||||||||||||
Intangible amortization | 2,992 | 9,524 | 10,645 | |||||||||||||||||||
Total operating expenses | 71,173 | 124,157 | 53,570 | |||||||||||||||||||
Total operating expenses | 27,616 | 71,173 | 124,157 | |||||||||||||||||||
Operating loss | Operating loss | (69,227 | ) | (112,253 | ) | (21,874 | ) | (20,429 | ) | (69,227 | ) | (112,253 | ) | |||||||||
OTHER (EXPENSE) INCOME, net: | OTHER (EXPENSE) INCOME, net: | |||||||||||||||||||||
Interest expense, net | (1,117 | ) | (1,172 | ) | (2,174 | ) | ||||||||||||||||
Other income, net | 1,169 | 486 | 6,454 | |||||||||||||||||||
Restructuring | (297 | ) | — | — | ||||||||||||||||||
Interest expense, net | (1,172 | ) | (2,174 | ) | (2,104 | ) | ||||||||||||||||
Total other (expense) income, net | (245 | ) | (686 | ) | 4,280 | |||||||||||||||||
Other income (expense), net | 486 | 6,454 | (204 | ) | ||||||||||||||||||
Total other (expense) income, net | (686 | ) | 4,280 | (2,308 | ) | |||||||||||||||||
Net loss from continuing operations before (benefit) provision for income taxes | (69,913 | ) | (107,973 | ) | (24,182 | ) | ||||||||||||||||
(Benefit) provision for income taxes | (160 | ) | (947 | ) | 1,096 | |||||||||||||||||
Net loss from continuing operations before provision (benefit) for income taxes | (20,674 | ) | (69,913 | ) | (107,973 | ) | ||||||||||||||||
Provision (benefit) for income taxes | 68 | (160 | ) | (947 | ) | |||||||||||||||||
LOSS FROM CONTINUING OPERATIONS | LOSS FROM CONTINUING OPERATIONS | (69,753 | ) | (107,026 | ) | (25,278 | ) | (20,742 | ) | (69,753 | ) | (107,026 | ) | |||||||||
LOSS FROM DISCONTINUED OPERATIONS, NET OF TAX | LOSS FROM DISCONTINUED OPERATIONS, NET OF TAX | (15,422 | ) | (3,093 | ) | (7 | ) | (1,206 | ) | (15,422 | ) | (3,093 | ) | |||||||||
NET LOSS | NET LOSS | $ | (85,175 | ) | $ | (110,119 | ) | $ | (25,285 | ) | $ | (21,948 | ) | $ | (85,175 | ) | $ | (110,119 | ) | |||
NET LOSS PER COMMON SHARE—BASIC AND DILUTED: | ||||||||||||||||||||||
NET LOSS PER COMMON SHARE—Basic and diluted: | ||||||||||||||||||||||
Loss from continuing operations | Loss from continuing operations | $ | (0.66 | ) | $ | (1.11 | ) | $ | (0.28 | ) | $ | (0.18 | ) | $ | (0.66 | ) | $ | (1.11 | ) | |||
Loss from discontinued operations | Loss from discontinued operations | (0.14 | ) | (0.03 | ) | — | (0.01 | ) | (0.14 | ) | (0.03 | ) | ||||||||||
Net Loss | Net Loss | $ | (0.80 | ) | $ | (1.14 | ) | $ | (0.28 | ) | $ | (0.19 | ) | $ | (0.80 | ) | $ | (1.14 | ) | |||
WEIGHTED AVERAGE COMMON SHARES OUTSTANDING—Basic and diluted | WEIGHTED AVERAGE COMMON SHARES OUTSTANDING—Basic and diluted | 106,272 | 96,574 | 89,899 | 116,170 | 106,272 | 96,574 | |||||||||||||||
The accompanying notes are an integral part of these consolidated financial statements.
BROADWIND ENERGY, INC. AND SUBSIDIARIES
CONSOLIDATED STATEMENTS OF STOCKHOLDERS' EQUITY
(In thousands, except share data)
| | Common Stock | | | | | |||||||||||||||||||||||||||||||
|---|---|---|---|---|---|---|---|---|---|---|---|---|---|---|---|---|---|---|---|---|---|---|---|---|---|---|---|---|---|---|---|---|---|---|---|---|
| | | | Interest in Variable Interest Entity | | ||||||||||||||||||||||||||||||||
| | Shares Issued and Outstanding | Issued Amount | Additional Paid-in Capital | Accumulated Deficit | Total | |||||||||||||||||||||||||||||||
BALANCE, December 31, 2007 | 76,260,912 | $ | 76 | $ | 133,033 | $ | (9,877 | ) | $ | 1,304 | $ | 124,536 | ||||||||||||||||||||||||
Stock issued for restricted stock | 7,500 | — | — | — | — | — | ||||||||||||||||||||||||||||||
Stock issued for the acquisition of Energy Maintenance Service, LLC | 1,629,834 | 2 | 13,819 | — | — | 13,821 | ||||||||||||||||||||||||||||||
Stock issued for the acquisition of Badger Transport, Inc. | 581,959 | 1 | 5,999 | — | — | 6,000 | ||||||||||||||||||||||||||||||
Stock issued for the conversion of related-party notes | 3,333,332 | 3 | 24,997 | — | — | 25,000 | ||||||||||||||||||||||||||||||
Stock issued in private equity placements, net of costs of $336 | 14,656,878 | 14 | 117,375 | — | — | 117,389 | ||||||||||||||||||||||||||||||
Share-based compensation | — | — | 1,999 | — | — | 1,999 | ||||||||||||||||||||||||||||||
Reclassification of variable interest entity | — | — | — | — | (1,304 | ) | (1,304 | ) | ||||||||||||||||||||||||||||
Net loss | — | — | — | (25,285 | ) | — | (25,285 | ) | Common Stock | | | | ||||||||||||||||||||||||
| Shares Issued and Outstanding | Issued Amount | Additional Paid-in Capital | Accumulated Deficit | Total | ||||||||||||||||||||||||||||||||
BALANCE, December 31, 2008 | BALANCE, December 31, 2008 | 96,470,415 | $ | 96 | $ | 297,222 | $ | (35,162 | ) | $ | — | $ | 262,156 | 96,470,415 | $ | 96 | $ | 297,222 | $ | (35,162 | ) | $ | 262,156 | |||||||||||||
Stock issued under stock option plans | 91,940 | — | 675 | — | — | 675 | ||||||||||||||||||||||||||||||
Stock issued for restricted stock | 129,715 | 1 | — | — | — | 1 | ||||||||||||||||||||||||||||||
Stock issued under defined contribution 401(k) retirement savings plan | 9,057 | — | 76 | — | — | 76 | ||||||||||||||||||||||||||||||
Share-based compensation | — | — | 2,806 | — | — | 2,806 | ||||||||||||||||||||||||||||||
Net loss | — | — | — | (110,119 | ) | — | (110,119 | ) | ||||||||||||||||||||||||||||
Stock issued under stock option plans | 91,940 | — | 675 | — | 675 | |||||||||||||||||||||||||||||||
Stock issued for restricted stock | 129,715 | 1 | — | — | 1 | |||||||||||||||||||||||||||||||
Stock issued under defined contribution 401(k) retirement savings plan | 9,057 | — | 76 | — | 76 | |||||||||||||||||||||||||||||||
Share-based compensation | — | — | 2,806 | — | 2,806 | |||||||||||||||||||||||||||||||
Net loss | — | — | — | (110,119 | ) | (110,119 | ) | |||||||||||||||||||||||||||||
BALANCE, December 31, 2009 | BALANCE, December 31, 2009 | 96,701,127 | $ | 97 | $ | 300,779 | $ | (145,281 | ) | $ | — | $ | 155,595 | 96,701,127 | $ | 97 | $ | 300,779 | $ | (145,281 | ) | $ | 155,595 | |||||||||||||
Stock issued under equity offering (net of offering costs of $1,278) | 10,000,000 | 10 | 53,337 | — | — | 53,347 | ||||||||||||||||||||||||||||||
Stock issued for restricted stock | 126,710 | — | — | — | — | — | ||||||||||||||||||||||||||||||
Stock issued under defined contribution 401(k) retirement savings plan | 284,980 | — | 684 | — | — | 684 | ||||||||||||||||||||||||||||||
Share-based compensation | — | — | 1,745 | — | — | 1,745 | ||||||||||||||||||||||||||||||
Net loss | — | — | — | (85,175 | ) | (85,175 | ) | |||||||||||||||||||||||||||||
Stock issued under equity offering (net of offering costs of $1,278) | 10,000,000 | 10 | 53,337 | — | 53,347 | |||||||||||||||||||||||||||||||
Stock issued for restricted stock | 126,710 | — | — | — | — | |||||||||||||||||||||||||||||||
Stock issued under defined contribution 401(k) retirement savings plan | 284,980 | — | 684 | — | 684 | |||||||||||||||||||||||||||||||
Share-based compensation | — | — | 1,745 | — | 1,745 | |||||||||||||||||||||||||||||||
Net loss | — | — | — | (85,175 | ) | (85,175 | ) | |||||||||||||||||||||||||||||
BALANCE, December 31, 2010 | BALANCE, December 31, 2010 | 107,112,817 | $ | 107 | $ | 356,545 | $ | (230,456 | ) | $ | — | $ | 126,196 | 107,112,817 | $ | 107 | $ | 356,545 | $ | (230,456 | ) | $ | 126,196 | |||||||||||||
Stock issued under equity offering (net of offering costs of $458) | 32,500,000 | 33 | 11,664 | — | 11,697 | |||||||||||||||||||||||||||||||
Stock issued for restricted stock | 160,605 | — | — | — | — | |||||||||||||||||||||||||||||||
Stock issued under defined contribution 401(k) retirement savings plan | 105,775 | — | 150 | — | 150 | |||||||||||||||||||||||||||||||
Stock repurchased as part of the sale of the sale of Badger Transport, Inc | (100,000 | ) | — | (142 | ) | (142 | ) | |||||||||||||||||||||||||||||
Share-based compensation | — | — | 1,906 | — | 1,906 | |||||||||||||||||||||||||||||||
Net loss | — | — | — | (21,948 | ) | (21,948 | ) | |||||||||||||||||||||||||||||
BALANCE, December 31, 2011 | 139,779,197 | $ | 140 | $ | 370,123 | $ | (252,404 | ) | $ | 117,859 | ||||||||||||||||||||||||||
The accompanying notes are an integral part of these consolidated financial statements.
BROADWIND ENERGY, INC. AND SUBSIDIARIES
CONSOLIDATED STATEMENTS OF CASH FLOWS
(In thousands)
| | | For the Years Ended December 31, | For the Years Ended December 31, | ||||||||||||||||||||
|---|---|---|---|---|---|---|---|---|---|---|---|---|---|---|---|---|---|---|---|---|---|---|---|
| | | 2010 | 2009 | 2008 | 2011 | 2010 | 2009 | ||||||||||||||||
CASH FLOWS FROM OPERATING ACTIVITIES: | CASH FLOWS FROM OPERATING ACTIVITIES: | ||||||||||||||||||||||
Net loss | $ | (21,948 | ) | $ | (85,175 | ) | $ | (110,119 | ) | ||||||||||||||
Loss from discontinued operations | 1,206 | 15,422 | 3,093 | ||||||||||||||||||||
Net loss | $ | (85,175 | ) | $ | (110,119 | ) | $ | (25,285 | ) | ||||||||||||||
Loss from discontinued operations | 15,422 | 3,093 | 7 | ||||||||||||||||||||
Loss from continuing operations | (69,753 | ) | (107,026 | ) | (25,278 | ) | |||||||||||||||||
Adjustments to reconcile net cash provided (used in) by operating activities: | |||||||||||||||||||||||
Depreciation and amortization expense | 16,463 | 22,696 | 20,090 | ||||||||||||||||||||
Impairment charges | 40,777 | 82,211 | 2,409 | ||||||||||||||||||||
Change in fair value of interest rate swap agreements | (253 | ) | (330 | ) | 194 | ||||||||||||||||||
Deferred income taxes | 1,338 | (813 | ) | 535 | |||||||||||||||||||
Stock-based compensation | 1,745 | 2,805 | 1,999 | ||||||||||||||||||||
Allowance for doubtful accounts | (1,142 | ) | 248 | (1,675 | ) | ||||||||||||||||||
Loss on disposal of assets | 70 | 165 | 113 | ||||||||||||||||||||
Changes in operating assets and liabilities: | |||||||||||||||||||||||
Accounts receivable | 1,202 | 13,928 | (16,479 | ) | |||||||||||||||||||
Inventories | (8,914 | ) | 32,896 | (28,246 | ) | ||||||||||||||||||
Prepaid expenses and other current assets | 1,072 | 163 | (1,268 | ) | |||||||||||||||||||
Accounts payable | 7,565 | (24,556 | ) | 21,649 | |||||||||||||||||||
Accrued liabilities | (332 | ) | (5,311 | ) | 2,442 | ||||||||||||||||||
Customer deposits | (1,317 | ) | (10,627 | ) | 19,674 | ||||||||||||||||||
Other non-current assets and liabilities | 672 | (1,838 | ) | (61 | ) | ||||||||||||||||||
Loss from continuing operations | (20,742 | ) | (69,753 | ) | (107,026 | ) | |||||||||||||||||
Adjustments to reconcile net cash (used in) provided by operating activities: | |||||||||||||||||||||||
Depreciation and amortization expense | 14,534 | 16,463 | 22,696 | ||||||||||||||||||||
Impairment charges | — | 40,777 | 82,211 | ||||||||||||||||||||
Change in fair value of interest rate swap agreements | — | (253 | ) | (330 | ) | ||||||||||||||||||
Deferred income taxes | — | 1,338 | (813 | ) | |||||||||||||||||||
Stock-based compensation | 1,906 | 1,745 | 2,805 | ||||||||||||||||||||
Allowance for doubtful accounts | 1,004 | (1,142 | ) | 248 | |||||||||||||||||||
Common stock issued under defined contribution 401(k) plan | 150 | 684 | 76 | ||||||||||||||||||||
Loss on disposal of assets | 474 | 70 | 165 | ||||||||||||||||||||
Changes in operating assets and liabilities: | |||||||||||||||||||||||
Accounts receivable | (4,888 | ) | 1,202 | 13,928 | |||||||||||||||||||
Inventories | (5,616 | ) | (8,914 | ) | 32,896 | ||||||||||||||||||
Prepaid expenses and other current assets | (10 | ) | 1,072 | 163 | |||||||||||||||||||
Accounts payable | (5,008 | ) | 7,565 | (24,556 | ) | ||||||||||||||||||
Accrued liabilities | (648 | ) | (332 | ) | (5,311 | ) | |||||||||||||||||
Customer deposits | 8,447 | (1,317 | ) | (10,627 | ) | ||||||||||||||||||
Other non-current assets and liabilities | 93 | 672 | (1,838 | ) | |||||||||||||||||||
Net cash (used in) provided by operating activities of continued operations | Net cash (used in) provided by operating activities of continued operations | (10,807 | ) | 4,611 | (3,902 | ) | (10,304 | ) | (10,123 | ) | 4,687 | ||||||||||||
CASH FLOWS FROM INVESTING ACTIVITIES: | CASH FLOWS FROM INVESTING ACTIVITIES: | ||||||||||||||||||||||
Cash paid for acquisitions, net of cash received | — | — | (23,125 | ) | |||||||||||||||||||
Purchases of property and equipment | (6,893 | ) | (11,271 | ) | (79,092 | ) | |||||||||||||||||
Proceeds from disposals of property and equipment | 38 | 829 | 40 | ||||||||||||||||||||
Decrease (increase) in restricted cash | 1,840 | (1,510 | ) | — | |||||||||||||||||||
Proceeds from the sale of logistics business | 952 | — | — | ||||||||||||||||||||
Purchases of property and equipment | (4,708 | ) | (6,893 | ) | (11,271 | ) | |||||||||||||||||
Proceeds from disposals of property and equipment | 1,874 | 38 | 829 | ||||||||||||||||||||
(Increase) decrease in restricted cash | (706 | ) | 1,840 | (1,510 | ) | ||||||||||||||||||
Net cash used in investing activities of continued operations | Net cash used in investing activities of continued operations | (5,015 | ) | (11,952 | ) | (102,177 | ) | (2,588 | ) | (5,015 | ) | (11,952 | ) | ||||||||||
CASH FLOWS FROM FINANCING ACTIVITIES: | CASH FLOWS FROM FINANCING ACTIVITIES: | ||||||||||||||||||||||
Net proceeds from issuance of stock | 53,347 | 675 | 117,390 | ||||||||||||||||||||
Common stock issued under defined contribution 401(k) plan | 684 | 76 | — | ||||||||||||||||||||
Payments on lines of credit and notes payable | (21,231 | ) | (11,810 | ) | (5,604 | ) | |||||||||||||||||
Payments on related party notes payable | — | — | (1,365 | ) | |||||||||||||||||||
Proceeds from lines of credit and notes payable | 700 | 5,952 | 9,075 | ||||||||||||||||||||
Proceeds from sale-leaseback transactions | — | 2,980 | — | ||||||||||||||||||||
Proceeds from deposits on equipment | — | 665 | — | �� | |||||||||||||||||||
Principal payments on capital leases | (863 | ) | (864 | ) | (307 | ) | |||||||||||||||||
Net proceeds from issuance of stock | 11,697 | 53,347 | 675 | ||||||||||||||||||||
Payments on lines of credit and notes payable | (1,517 | ) | (21,231 | ) | (11,810 | ) | |||||||||||||||||
Payments on related party notes payable | (209 | ) | — | — | |||||||||||||||||||
Proceeds from lines of credit and notes payable | 2,311 | 700 | 5,952 | ||||||||||||||||||||
Proceeds from sale-leaseback transactions | — | — | 2,980 | ||||||||||||||||||||
Proceeds from deposits on equipment | — | — | 665 | ||||||||||||||||||||
Principal payments on capital leases | (977 | ) | (863 | ) | (864 | ) | |||||||||||||||||
Net cash provided by (used in) financing activities of continued operations | Net cash provided by (used in) financing activities of continued operations | 32,637 | (2,326 | ) | 119,189 | 11,305 | 31,953 | (2,402 | ) | ||||||||||||||
DISCONTINUED OPERATIONS: | DISCONTINUED OPERATIONS: | ||||||||||||||||||||||
Operating cash flows | (851 | ) | (2,666 | ) | (1,687 | ) | |||||||||||||||||
Investing cash flows | — | (113 | ) | (568 | ) | ||||||||||||||||||
Financing cash flows | (83 | ) | (3,003 | ) | 1,498 | ||||||||||||||||||
Operating cash flows | (2,666 | ) | (1,687 | ) | 1,756 | ||||||||||||||||||
Investing cash flows | (113 | ) | (568 | ) | (4,519 | ) | |||||||||||||||||
Financing cash flows | (3,003 | ) | 1,498 | (877 | ) | ||||||||||||||||||
Net cash provided by (used in) discontinued operations | (5,782 | ) | (757 | ) | (3,640 | ) | |||||||||||||||||
Net cash used in discontinued operations | (934 | ) | (5,782 | ) | (757 | ) | |||||||||||||||||
Add: Cash balance of discontinued operations, beginning of period | Add: Cash balance of discontinued operations, beginning of period | 127 | 1,246 | — | 530 | 127 | 1,246 | ||||||||||||||||
Less: Cash balance of discontinued operations, end of period | Less: Cash balance of discontinued operations, end of period | 530 | 127 | 1,246 | — | 530 | 127 | ||||||||||||||||
NET (DECREASE) INCREASE IN CASH AND CASH EQUIVALENTS | NET (DECREASE) INCREASE IN CASH AND CASH EQUIVALENTS | 10,630 | (9,305 | ) | 8,224 | (1,991 | ) | 10,630 | (9,305 | ) | |||||||||||||
CASH AND CASH EQUIVALENTS, beginning of the year | CASH AND CASH EQUIVALENTS, beginning of the year | 4,701 | 14,006 | 5,782 | 15,331 | 4,701 | 14,006 | ||||||||||||||||
CASH AND CASH EQUIVALENTS, end of the year | CASH AND CASH EQUIVALENTS, end of the year | $ | 15,331 | $ | 4,701 | $ | 14,006 | $ | 13,340 | $ | 15,331 | $ | 4,701 | ||||||||||
Supplemental cash flow information: | Supplemental cash flow information: | ||||||||||||||||||||||
Interest paid, net of capitalized interest | $ | 1,171 | $ | 1,913 | $ | 3,255 | |||||||||||||||||
Income taxes paid | $ | 38 | $ | 505 | $ | 28 | |||||||||||||||||
Interest paid, net of capitalized interest | $ | 1,029 | $ | 1,171 | $ | 1,913 | |||||||||||||||||
Income taxes paid | $ | 34 | $ | 38 | $ | 505 | |||||||||||||||||
Non-cash investing and financing activities: | Non-cash investing and financing activities: | ||||||||||||||||||||||
Common stock issued for acquisitions | $ | — | $ | — | $ | 19,821 | |||||||||||||||||
Conversion of related party notes payable to equity | $ | — | $ | — | $ | 25,000 | |||||||||||||||||
Issuance of restricted stock grants | $ | 803 | $ | 936 | $ | 214 | |||||||||||||||||
Common stock issued under defined contribution 401(k) plan | $ | 684 | $ | 76 | $ | — | |||||||||||||||||
Issuance of restricted stock grants | $ | 900 | $ | 803 | $ | 936 | |||||||||||||||||
Common stock issued under defined contribution 401(k) plan | $ | 150 | $ | 684 | $ | 76 | |||||||||||||||||
The accompanying notes are an integral part of these consolidated financial statements.
BROADWIND ENERGY, INC. AND SUBSIDIARIES
NOTES TO CONSOLIDATED FINANCIAL STATEMENTS
December 31, 2011, 2010, 2009, and 20082009
(in thousands, except share and per share data)
1. DESCRIPTION OF BUSINESS AND SUMMARY OF SIGNIFICANT ACCOUNTING POLICIES
Description of Business
Broadwind Energy Inc. (the "Company") provides technologically advanced high-value products and services to energy, mining and infrastructure sector customers, primarily in the U.S. The Company's most significant presence is within the U.S. wind industry, wherealthough the Company believes it is the only independent company that offershas increasingly diversified into other industrial markets in order to improve its breadth of productscapacity utilization and servicesreduce its exposure to uncertainty related to the market.extension or renewal of federal tax incentives and other favorable policies currently supporting the U.S. wind industry. The Company's product and service portfolio provides ourits wind energy customers, including wind turbine manufacturers, wind farm developers and wind farm operators, with access to a broad array of component and service offerings. Outside of the wind market, the Company provides precision gearing and specialty weldments to a broad range of industrial customers, particularly in the energy, mining and infrastructure sectors.customers.
In December 2009, theThe Company revised its reporting segment presentation into four reportable operating segments: Towers, Gearing, Technical and Engineering Services, and Logistics. In December of 2010, the Company's Board of Directors approved a plan to divest its Logistics business segment; consequently, this business unit is now reported as a Discontinued Operation and the Company has revised its segment presentation to include three reportable operating segments: Towers and Weldments, Gearing, and Services (previously TechnicalServices. In conjunction with the preparation of the consolidated financial statements on this Annual Report on Form 10-K, the Company has changed the name of its Towers segment to Towers and Engineering Services). All current and prior period financial results have been revisedWeldments in order to reflect these changes.better describe the offerings within this segment. See Note 1917 "Segment Reporting" of these consolidated financial statements for further discussion of reportable segments.
Towers and Weldments
The Company manufactures towers for wind turbines, specifically the large and heavier wind towers that are designed for 2 megawatt ("MW") and larger wind turbines. Production facilities, located in Manitowoc, Wisconsin and Abilene, Texas, are situated in close proximity to the primary U.S. domestic energy and equipment manufacturing locations. The two facilities have a combined annual tower production capacity of approximately 500 towers, sufficient to support turbines generating more than 1200 MW of power. This product segment also encompasses the manufacture of specialty fabrications and specialty weldments for mining and other industrial customers.
Gearing
The Company engineers, builds and remanufactures precision gears and gearing systems for wind, oil and gas, mining and other industrial applications. The Company uses an integrated manufacturing process, which includes machining processes in Cicero, Illinois, heat treatment in Neville Island, Pennsylvania and a finishing process in a second Cicero facility.
Services
The Company offers a comprehensive range of services, primarily to wind farm developers and operators. The Company specializes in non-routine blade and gearbox maintenance services for both kilowatt and megawatt turbines. The Company also offers comprehensive field services to the wind industry. The Company is increasingly focusing its efforts on the identification and/or development of product and service offerings which will improve the reliability and efficiency of wind turbines, and therefore enhance the economic benefits to its customers. The Company provides wind services across the U.S., with primary service locations in South Dakota and Texas. In February 2011, the Company
BROADWIND ENERGY, INC. AND SUBSIDIARIES
NOTES TO CONSOLIDATED FINANCIAL STATEMENTS (Continued)
December 31, 2011, 2010, and 2009
(in thousands, except share and per share data)
1. DESCRIPTION OF BUSINESS AND SUMMARY OF SIGNIFICANT ACCOUNTING POLICIES (Continued)
put into operation its dedicated drivetrain service center in Abilene, Texas, which is focused on servicing the growing installed base of MW wind turbines as they come off warranty and, to a limited extent, industrial gearboxes requiring precision repair and testing.
Liquidity
The Company has a limited history of operations and has incurred operating losses since inception. The Company anticipates that current cash resources and cash to be generated from operations in 20112012 will be adequate to meet the Company's liquidity needs for at least the next twelve months. As discussed further in Note 10, "Debt and Credit Agreements" of these consolidated financial statements, the Company is obligated to make principal payments on outstanding debt totaling $1,577$2,202 during 2011,2012, has $4,833 of indebtedness associated with its Liabilities Held for sale and is obligated to make purchases of $2,610$390 under purchase commitments described in Note 12, "Commitments and Contingencies" of these consolidated financial statements. Additionally, working capital requirements are expected to increase due to structural changes of tower contracts related to raw material purchases. If sales and subsequent collections from several of the Company's large customers, as well as revenues generated from new customer orders, are not materially consistent with management's plans, the Company may encounter cash flow and liquidity issues. Additional funding may not be available when needed or on terms acceptable to the Company, which could affect its overall operations. Any additional equity financing, if available, may be dilutive to stockholders, and additional debt financing, if available, will likely require financial covenants or other restrictions on the Company. There can be no assurances the Company's efforts to obtain sufficient cash flow will be successful.
Summary of Significant Accounting Policies
TowersPrinciples of Consolidation and Basis of Presentation
These consolidated financial statements include the accounts of Broadwind and entities in which it has a controlling financial interest. All significant intercompany transactions and balances have been eliminated in consolidation. The Company manufactures towers for wind turbines, specificallydetermines whether it has a controlling financial interest in an entity by first evaluating whether the largeentity is a voting interest entity or a variable interest entity.
When the Company obtains an economic interest in an entity, the Company evaluates the entity to determine if the entity is deemed a variable interest entity ("VIE"), and heavier wind towers that are designed for 2 megawatt ("MW") and larger wind turbines. Production facilities, located in Manitowoc, Wisconsin and Abilene, Texas, are situated in close proximityif the Company is deemed to be the primary U.S. wind resource regions.beneficiary, in accordance with the accounting standard for the consolidation of variable interest entities. The accounting standard for the consolidation of VIE's requires the Company to qualitatively assess if the Company was the primary beneficiary of the VIE's based on whether the Company had (i) the power to direct those matters that most significantly impacted the activities of the VIE and (ii) the obligation to absorb losses or the right to receive benefits of the VIE. Refer to Note 19, "New Markets Tax Credit Transaction" of these consolidated financial statements for a description of two facilities have a combined annual tower production capacity of approximately 500 towers, sufficient to support turbines generating more than 1200 MW of power. Thisvariable interest entities included in the Company's consolidated financial statements.
BROADWIND ENERGY, INC. AND SUBSIDIARIES
NOTES TO CONSOLIDATED FINANCIAL STATEMENTS (Continued)
December 31, 2011, 2010, 2009, and 20082009
(in thousands, except share and per share data)
1. DESCRIPTION OF BUSINESS AND SUMMARY OF SIGNIFICANT ACCOUNTING POLICIES (Continued)
product segment also encompasses the manufacture of specialty fabrications and heavy weldments for wind energy and other industrial customers.
Gearing
The Company manufactures high precision gearing systems for wind turbines and custom-engineered gearing systems and gearboxes for energy, mining and other industrial customers. The Company uses an integrated manufacturing process, which includes machining processes in Cicero, Illinois, heat treatment in Neville Island, Pennsylvania and a finishing process in the Cicero factory.
Services
The Company offers technical and precision repair and engineering services to developers and operators of wind farms and manufacturers of wind turbines. Technical services offerings include construction support and operations and maintenance services for wind farm developers and operators. Precision repair and engineering services include repair and refurbishment of complex systems and components of wind turbines, including control systems, drivetrains and blades. The Company's primary service locations are in Illinois, California, South Dakota and Texas. During 2010, the Company approved an investment of approximately $7 million to develop a dedicated drivetrain service center in Abilene, Texas, focused on servicing the growing installed base of MW wind turbines as they come off warranty. The drivetrain service center was placed into operation in February 2011.
Summary of Significant Accounting Policies
Principles of Consolidation and Basis of Presentation
These consolidated financial statements include the accounts of Broadwind and its wholly-owned subsidiaries. All significant intercompany transactions and balances have been eliminated in consolidation. The results of operations of all acquired businesses have been consolidated for all periods subsequent to the date of acquisition.
Reclassifications
Where appropriate, certain reclassifications have been made to prior years' financial statements to conform to the current year presentation.
Management's Use of Estimates
The preparation of financial statements in conformity with accounting principles generally accepted in the U.S. ("GAAP") requires management to make certain estimates and assumptions that affect the reported amounts of assets and liabilities and the disclosure of contingent liabilities as of the date of the financial statements and reported amounts of revenues and expenses during the reported period. Significant estimates, among others, include revenue recognition, future tax rates, inventory reserves, warranty reserves, stock option fair values and allowance for doubtful accounts, and allocation of purchase price to the fair value of net assets and liabilities acquired in connection with business combinations.
BROADWIND ENERGY, INC. AND SUBSIDIARIES
NOTES TO CONSOLIDATED FINANCIAL STATEMENTS (Continued)
December 31, 2010, 2009, and 2008
(in thousands, except share and per share data)
1. DESCRIPTION OF BUSINESS AND SUMMARY OF SIGNIFICANT ACCOUNTING POLICIES (Continued)
accounts. Although these estimates are based upon management's best knowledge of current events and actions that the Company may undertake in the future, actual results could differ from these estimates.
Cash and Cash Equivalents
Cash and cash equivalents primarily consist of cash balances and money market funds. Cash and cash equivalents were $15,331$13,340 and $4,701$15,331 as of December 31, 20102011 and 2009,2010, respectively. The Company's policy is to invest excess cash in money market account funds, which are generally of a short-term duration based upon operating requirements. Income earned on these investments is recorded to interest income within Other Income in the consolidated statements of operations. For the years ended December 31, 2011, 2010 2009 and 2008,2009, interest income was $28, $43 $123 and $584,$123, respectively.
Restricted Cash
Restricted cash consistsat December 31, 2011 relates primarily to proceeds from the New Markets Tax Credit Agreement discussed further in Note 19, "New Markets Tax Credit" of these consolidated financial statements. There are also restricted cash down payments pertainingbalances related to certain contracts under which the use of suchvendor agreements. The Company anticipates that all restricted cash is restricted as per the terms of the agreement as well asbalances will be used for collateral to secure vendor services.current purposes. As of December 31, 20102011 and 2009,2010, the Company had restricted cash in the amounts of $170$876 and $2,010,$170, respectively.
Revenue Recognition
The Company recognizes revenue when the earnings process is complete and when persuasive evidence of an arrangement exists, transfer of title has occurred or services have been rendered, the selling price is fixed or determinable, collectability is reasonably assured and delivery has occurred per the terms of the contract. Customer deposits, deferred revenue and other receipts are deferred and recognized when the revenue is realized and earned.
In some instances, typically within the Company's Towers and Weldments segment, products are sold under terms included in bill and hold sales arrangements that result in different timing for revenue
BROADWIND ENERGY, INC. AND SUBSIDIARIES
NOTES TO CONSOLIDATED FINANCIAL STATEMENTS (Continued)
December 31, 2011, 2010, and 2009
(in thousands, except share and per share data)
1. DESCRIPTION OF BUSINESS AND SUMMARY OF SIGNIFICANT ACCOUNTING POLICIES (Continued)
recognition. The Company recognizes revenue under these arrangements only when the buyer requests the bill and hold arrangement, a fixed schedule for delivery exists, the ordered goods are segregated from inventory and not available to fill other orders and the goods are complete and ready for shipment. Assuming these required revenue recognition criteria are met, revenue is recognized upon completion of product manufacture and customer acceptance.
Cost of Sales
Cost of sales represents all direct and indirect costs associated with the production of products for sale to customers. These costs include operation, repair and maintenance of equipment, direct and indirect labor and benefit costs, insurance, equipment rentals, freight in and depreciation. Freight out to customers is at times classified as a selling expense and is then excluded from cost of sales. For the years ended December 31, 2011, 2010 and 2009, freight out included in selling, general and administrative expenses was $303, $0 and $104, respectively.
Accounts Receivable
The Company generally grants uncollateralized credit to customers on an individual basis based upon the customer's financial condition and credit history. Credit is typically on net 30-day terms and
BROADWIND ENERGY, INC. AND SUBSIDIARIES
NOTES TO CONSOLIDATED FINANCIAL STATEMENTS (Continued)
December 31, 2010, 2009, and 2008
(in thousands, except share and per share data)
1. DESCRIPTION OF BUSINESS AND SUMMARY OF SIGNIFICANT ACCOUNTING POLICIES (Continued)
customer deposits are frequently required at various stages of the production process to minimize credit risk.
Historically, ourthe Company's accounts receivable are highly concentrated with a select number of customers. During the year ended December 31, 2010, our2011, the Company's five largest customers accounted for 78%76% of ourits consolidated revenues and 79%62% of outstanding account receivable balances, compared to the year ended December 31, 20092010 when ourthe Company's five largest customers accounted for 73%78% of ourits consolidated revenues and 65%79% of its outstanding account receivable balances.
Allowance for Doubtful Accounts
Based upon past experience and judgment, the Company establishes an allowance for doubtful accounts with respect to accounts receivable. OurThe Company's standard allowance estimation methodology considers a number of factors that, based on ourits collections experience, the Company believes will have an impact on ourits credit risk and the realizability of ourits accounts receivable. These factors include individual customer circumstances, history with the Company and other relevant criteria. Accounts receivable balances that remain outstanding after the Company has used reasonable collection efforts are written off through a charge to the valuation allowance and a credit to accounts receivable.
The Company monitors ourits collections and write-off experience to assess whether or not adjustments to ourits allowance estimates are necessary. Changes in trends in any of the factors that the Company believes may impact the realizability of ourits accounts receivable, as noted above, or modifications to ourthe Company's credit standards, collection practices and other related policies may impact ourits allowance for doubtful accounts and ourits financial results. Bad debt expense for the years ended December 31, 2011, 2010 and 2009 was $1,036, $1,011 and 2008 was $1,011, $1,438, respectively.
BROADWIND ENERGY, INC. AND SUBSIDIARIES
NOTES TO CONSOLIDATED FINANCIAL STATEMENTS (Continued)
December 31, 2011, 2010, and $1,196, respectively.2009
(in thousands, except share and per share data)
1. DESCRIPTION OF BUSINESS AND SUMMARY OF SIGNIFICANT ACCOUNTING POLICIES (Continued)
Inventories
Inventories are stated at the lower of cost or market. Cost is determined either based on the first-in, first-out ("FIFO") basis, or on a standard cost basis that approximates the FIFO method. Market is determined based on net realizable value. Any excess of cost over market value is included in the Company's inventory allowance. Market value of inventory, and management's judgment of the need for reserves, encompasses consideration of other business factors including physical condition, inventory holding period, contract terms and usefulness. Inventories are valued based on a weighted average cost method that approximates the first-in, first-out (FIFO) basis.
Inventories consist of raw materials, work-in-process and finished goods. Raw materials consist of components and parts for general production use. Work-in-process consists of labor and overhead, processing costs, purchased subcomponents and materials purchased for specific customer orders. Finished goods consist of components purchased from third parties as well as components manufactured by the Company that will be used to produce final customer products.
Property and Equipment
Property and equipment are stated at cost less accumulated depreciation. Depreciation is recognized using the straight-line method over the estimated useful lives of the related assets for financial reporting purposes and an accelerated method for income tax reporting purposes. Depreciation expense for the years ended December 31, 2011, 2010 and 2009 was $13,675, $13,470 and $13,172, respectively. Expenditures for additions and improvements are capitalized, while replacements, maintenance and repairs that do not improve or extend the useful lives of the respective assets are expensed as incurred.
BROADWIND ENERGY, INC. AND SUBSIDIARIES
NOTES TO CONSOLIDATED FINANCIAL STATEMENTS (Continued)
December 31, 2010, 2009, and 2008
(in thousands, except share and per share data)
1. DESCRIPTION OF BUSINESS AND SUMMARY OF SIGNIFICANT ACCOUNTING POLICIES (Continued)
The Company capitalizes interest costs incurred on indebtedness used to construct property and equipment. Capitalized interest is recorded as part of the asset to which it relates and is amortized over the asset's estimated useful life. Interest cost capitalized was $0, $74 $465 and $230$465 for the years ended December 31, 2011, 2010 2009 and 2008,2009, respectively. Property or equipment sold or disposed of is removed from the respective property accounts, with any corresponding gains and losses recorded to other income or expense in ourthe Company's consolidated statement of operations.
Goodwill
Goodwill is reviewed for impairment on at least an annual basis by applying a fair value based test. In evaluating the recoverability of the carrying value of goodwill, the Company must make assumptions regarding the fair values of our reporting units. Our estimate of the fair value of each of our reporting units is based primarily on projected future operating results and cash flows and other assumptions. The failure of a reporting unit to achieve projected future operating results and cash flows, or adjustments to other valuation assumptions, could change our estimate of reporting unit fair value, in which case the Company may be required to record an impairment charge. The Company's remaining goodwill was fully impaired at June 30, 2010, at which time the carrying value was reduced to zero.
Intangible and Other Long-lived Intangible Assets
The Company reviews intangible and other long-lived assets for impairment whenever events or changes in circumstances indicate that the asset's carrying amount may not be recoverable. Recoverability is measured by comparing the assets' carrying amounts to their expected future undiscounted net cash flows. If such assets are considered to be impaired, the impairment recognized is measured based on the amount by which the carrying amount of the assets exceeds the fair value.
Warranty Liability
The Company provides warranty terms that generally range from one to seven years for various products and services relating to workmanship and materials supplied by the Company. In certain contracts, the Company has recourse provisions for items that would enable recovery from third parties for amounts paid to customers under warranty provisions. The changes in the carrying amount of the Company's total product warranty liability for the years ended December 31, 2010, 2009 and 2008 were as follows:
| | As of December 31, | |||||||||
|---|---|---|---|---|---|---|---|---|---|---|
| | 2010 | 2009 | 2008 | |||||||
Balance, beginning of year | $ | 918 | $ | 890 | $ | 242 | ||||
Warranty expense | 1,110 | 591 | 648 | |||||||
Warranty claims | (957 | ) | (563 | ) | — | |||||
Balance, end of year | $ | 1,071 | $ | 918 | $ | 890 | ||||
BROADWIND ENERGY, INC. AND SUBSIDIARIES
NOTES TO CONSOLIDATED FINANCIAL STATEMENTS (Continued)
December 31, 2011, 2010, 2009, and 20082009
(in thousands, except share and per share data)
1. DESCRIPTION OF BUSINESS AND SUMMARY OF SIGNIFICANT ACCOUNTING POLICIES (Continued)
Company's total product warranty liability for the years ended December 31, 2011, 2010 and 2009 were as follows:
| | As of December 31, | |||||||||
|---|---|---|---|---|---|---|---|---|---|---|
| | 2011 | 2010 | 2009 | |||||||
Balance, beginning of year | $ | 1,071 | $ | 918 | $ | 890 | ||||
Warranty expense | 210 | 1,110 | 591 | |||||||
Warranty claims | (298 | ) | (957 | ) | (563 | ) | ||||
Balance, end of year | $ | 983 | $ | 1,071 | $ | 918 | ||||
Income Taxes
The Company accounts for income taxes based upon an asset and liability approach. Deferred tax assets and liabilities represent the future tax consequences of the differences between the financial statement carrying amounts of assets and liabilities versus the tax basis of assets and liabilities. Under this method, deferred tax assets are recognized for deductible temporary differences, and operating loss and tax credit carryforwards. Deferred tax liabilities are recognized for taxable temporary differences. Deferred tax assets are reduced by a valuation allowance when, in the opinion of management, it is more likely than not that some portion or all of the deferred tax assets will not be realized. The impact of tax rate changes on deferred tax assets and liabilities is recognized in the year that the change is enacted.
In connection with the preparation of ourits consolidated financial statements, the Company is required to estimate ourits income tax liability for each of the tax jurisdictions in which the Company operates. This process involves estimating ourthe Company's actual current income tax expense and assessing temporary differences resulting from differing treatment of certain income or expense items for income tax reporting and financial reporting purposes. The Company also recognizes as deferred income tax assets the expected future income tax benefits of net operating loss carryforwards. In evaluating the realizability of deferred income tax assets associated with net operating loss carryforwards, the Company considers, among other things, expected future taxable income, the expected timing of the reversals of existing temporary reporting differences and the expected impact of tax planning strategies that may be implemented to prevent the potential loss of future income tax benefits. Changes in, among other things, income tax legislation, statutory income tax rates or future taxable income levels could materially impact ourthe Company's valuation of income tax assets and liabilities and could cause ourits income tax provision to vary significantly among financial reporting periods.
The Company also accounts for the uncertainty in income taxes related to the recognition and measurement of a tax position taken or expected to be taken in an income tax return. The Company follows the applicable pronouncement guidance on derecognition, classification, interest and penalties, accounting in interim periods, disclosure and transition related to the uncertainty in these income tax positions.
Interest Rate Swap Agreements
The Company has periodically used derivative financial instruments in the form of interest rate swaps to minimize the effect of interest rate fluctuations on certain of our outstanding debt agreements. Our derivative financial instruments are recognized on our consolidated balance sheet at fair value. These derivatives do not qualify for hedge accounting treatment, and accordingly, all gains or losses on the change in the fair value of these derivative financial instruments are reported in our consolidated statements of operations.
BROADWIND ENERGY, INC. AND SUBSIDIARIES
NOTES TO CONSOLIDATED FINANCIAL STATEMENTS (Continued)
December 31, 2011, 2010, 2009, and 20082009
(in thousands, except share and per share data)
1. DESCRIPTION OF BUSINESS AND SUMMARY OF SIGNIFICANT ACCOUNTING POLICIES (Continued)
Share-Based Compensation
The Company grants incentive stock options and restricted stock units to certain officers, directors, employees and consultants. The Company accounts for share-based compensation related to these awards based on the estimated fair value of the equity award and recognizes expense ratably over the vesting term of the award. See Note 1816 "Share-Based Compensation" of these consolidated financial statements for further discussion of ourthe Company's share-based compensation plans, the nature of share-based awards issued and ourthe Company's accounting for share-based compensation.
Net Income (Loss) Per Share
The Company presents both basic and diluted net income (loss) per share. Basic net income (loss) per share is based solely upon the weighted average number of common shares outstanding and excludes any dilutive effects of options, warrants and convertible securities. Diluted net income (loss) per share is based upon the weighted average number of common shares and common-share equivalents outstanding during the year excluding those common-share equivalents where the impact to basic net income (loss) per share would be anti-dilutive.
2. EARNINGS PER SHARE
The following table presents a reconciliation of basic and diluted earnings per share for the years ended December 31, 2011, 2010 2009 and 20082009 as follows:
| | For the Years Ended December 31, | |||||||||
|---|---|---|---|---|---|---|---|---|---|---|
| | 2011 | 2010 | 2009 | |||||||
Basic earnings per share calculation: | ||||||||||
Net loss to common stockholders | $ | (21,948 | ) | $ | (85,175 | ) | $ | (110,119 | ) | |
Weighted average common shares outstanding | 116,170 | 106,272 | 96,574 | |||||||
Basic net loss per share | $ | (0.19 | ) | $ | (0.80 | ) | $ | (1.14 | ) | |
Diluted earnings per share calculation: | ||||||||||
Net loss to common stockholders | $ | (21,948 | ) | $ | (85,175 | ) | $ | (110,119 | ) | |
Weighted average common shares outstanding | 116,170 | 106,272 | 96,574 | |||||||
Common stock equivalents: | ||||||||||
Stock options and non-vested stock awards(1) | — | — | — | |||||||
Weighted average common shares outstanding | 116,170 | 106,272 | 96,574 | |||||||
Diluted net loss per share | $ | (0.19 | ) | $ | (0.80 | ) | $ | (1.14 | ) | |
| | For the Years Ended December 31, | ||||||||||
|---|---|---|---|---|---|---|---|---|---|---|---|
| | 2010 | 2009 | 2008 | ||||||||
Basic earnings per share calculation: | |||||||||||
Net loss to common stockholders | $ | (85,175 | ) | $ | (110,119 | ) | $ | (25,285 | ) | ||
Weighted average common shares outstanding | 106,272 | 96,574 | 89,899 | ||||||||
Basic net loss per share | $ | (0.80 | ) | $ | (1.14 | ) | $ | (0.28 | ) | ||
Diluted earnings per share calculation: | |||||||||||
Net loss to common stockholders | $ | (85,175 | ) | $ | (110,119 | ) | $ | (25,285 | ) | ||
Weighted average common shares outstanding | 106,272 | 96,574 | 89,899 | ||||||||
Common stock equivalents: | |||||||||||
Stock options and non-vested stock awards(1) | — | — | — | ||||||||
Weighted average common shares outstanding | 106,272 | 96,574 | 89,899 | ||||||||
Diluted net loss per share | $ | (0.80 | ) | $ | (1.14 | ) | $ | (0.28 | ) | ||
BROADWIND ENERGY, INC. AND SUBSIDIARIES
NOTES TO CONSOLIDATED FINANCIAL STATEMENTS (Continued)
December 31, 2011, 2010, 2009, and 2008
2009
(in thousands, except share and per share data)
3. DISCONTINUED OPERATIONS
In December 2010, the Company's Board of Directors approved a plan to divest the Company's wholly owned subsidiary Badger Transport, Inc. ("Badger"), which formerly comprised ourits Logistics segment. The adverse effects of rail providers entering the heavy haul market for wind energy components as well as the effects of the global economic downturn have resulted in continued operating losses at Badger. Badger's intercompany revenues and expenses were not significant in the years ended December 31, 2011, 2010 2009 or 2008. On March 4, 2011, the Company completed the sale of Badger. Refer to Note 22 "Subsequent Events" for further discussion of the Badger sale.
2009. During the fourth quarter of 2010, the Company recorded an asset impairment charge of approximately $10,020 (pre-tax) to reduce the carrying value of the net assets held for sale to estimated fair value.value, and there were no material adjustments to that charge in 2011. The impairment charge is included in "Loss before benefitprovision (benefit) for income taxes" in "Resultsthe table below.
In March 2011, the Company completed the sale of Discontinued Operations" below.Badger to BTI Logistics, LLC ("BTI Logistics"). Proceeds from the sale included approximately $800 in cash, a $1,500 secured promissory note payable in quarterly installments of $125 beginning September 30, 2011, and 100,000 shares of Broadwind common stock held by the buyer. The purchase price is subject to final working capital adjustments and certain contingencies and indemnifications. In addition, BTI Logistics assumed approximately $2,600 of debt and capital leases, plus approximately $1,600 of operating lease obligations.
Results As of Discontinued Operations
December 31, 2010, the assets and liabilities of Badger were reflected as held for sale. At December 31, 2010 these balances consisted of $1,847 of current assets, $6,847 of total assets, $1,775 of current liabilities, and $4,221 of total liabilities. These balances were eliminated as of the end of the first quarter of 2011 in conjunction with the Badger sale. Results of operations for Badger, which are reflected as discontinued operations in the Company's consolidated statements of income for the twelve months ended December 31, 2011, 2010 2009 and 2008,2009, were as follows:
| | For the Years Ended December 31, | |||||||||
|---|---|---|---|---|---|---|---|---|---|---|
| | 2010 | 2009 | 2008 | |||||||
Revenues | $ | 9,925 | $ | 13,033 | $ | 9,972 | ||||
Loss before benefit for income taxes | (15,730 | ) | (3,734 | ) | (41 | ) | ||||
Income tax benefit | (308 | ) | (641 | ) | (34 | ) | ||||
Loss from discontinued operations | $ | (15,422 | ) | $ | (3,093 | ) | $ | (7 | ) | |
BROADWIND ENERGY, INC. AND SUBSIDIARIES
NOTES TO CONSOLIDATED FINANCIAL STATEMENTS (Continued)
December 31, 2010, 2009, and 2008
(in thousands, except share and per share data)
3. DISCONTINUED OPERATIONS (Continued)
Assets and Liabilities Held for Sale
Assets and liabilities classified as held for sale in the Company's consolidated balance sheets as of December 31, 2010 and 2009 includes the following:
| | As of December 31, | |||||||
|---|---|---|---|---|---|---|---|---|
| | 2010 | 2009 | ||||||
Assets: | ||||||||
Cash | $ | 530 | $ | 127 | ||||
Accounts receivable | 673 | 433 | ||||||
Inventories | 292 | 214 | ||||||
Prepaid expenses and other current assets | 352 | 1,230 | ||||||
Total current assets | $ | 1,847 | $ | 2,004 | ||||
Property plant and equipment, net | 4,248 | 6,630 | ||||||
Goodwill and other intangible assets | — | 10,000 | ||||||
Other noncurrent assets | 752 | 1,363 | ||||||
Total Assets | $ | 6,847 | $ | 19,997 | ||||
Liabilities: | ||||||||
Current debt obligations | $ | 1,370 | $ | 1,487 | ||||
Account payable and accrued liabilities | 405 | 497 | ||||||
Total current liabilities | $ | 1,775 | $ | 1,984 | ||||
Long-term debt | 1,550 | 2,920 | ||||||
Other long-term liabilities | 896 | 1,489 | ||||||
Total Liabilities | $ | 4,221 | $ | 6,393 | ||||
| | For the Years Ended December 31, | |||||||||
|---|---|---|---|---|---|---|---|---|---|---|
| | 2011 | 2010 | 2009 | |||||||
Revenues | $ | 435 | $ | 9,925 | $ | 13,033 | ||||
Loss before provision (benefit) for income taxes | (1,205 | ) | (15,730 | ) | (3,734 | ) | ||||
Income tax provision (benefit) | 1 | (308 | ) | (641 | ) | |||||
Loss from discontinued operations | $ | (1,206 | ) | $ | (15,422 | ) | $ | (3,093 | ) | |
4. RECENT ACCOUNTING PRONOUNCEMENTS
The following is a listing of recent accounting standards issued by the Financial Accounting Standards Board (the "FASB") and their effect on the Company.
In JanuaryJuly 2010, the FASB issued Accounting Standards Update ("ASU") 2010-06,2010-20,Fair Value MeasurementsDisclosures about the Credit Quality of Financing Receivables and Disclosuresthe Allowance for Credit Losses (Topic 820)("ASU 2010-20"). ASU 2010-06 provides additional disclosure requirements related to fair value measurements. ASU 2010-06 is effective for interim and annual reporting periods beginning after December 15, 2009, except for the2010-20 requires increased disclosures about purchases, sales, issuancesthe credit quality of financing receivables and settlements inallowances for credit losses, including disclosures about credit quality indicators, past due information and modifications of financing receivables. The Company has adopted this standard as of January 1, 2011 and it had no material impact on the roll forward of activity in Level 3 fair value measurements. Disclosure requirements applicable to Level 3 transactions are effective for fiscal years beginning after December 15, 2010 and for interim periods within those fiscal years, with early adoption permitted. The portion of ASU 2010-06 that was effective beginning after December 15, 2009 did not have a material effect on ourCompany's consolidated financial position,condition, results of operations or cash flows. Additionally, the Company does not anticipate that the disclosure requirements applicable to Level 3 transactions that are effective for fiscal
BROADWIND ENERGY, INC. AND SUBSIDIARIES
NOTES TO CONSOLIDATED FINANCIAL STATEMENTS (Continued)
December 31, 2011, 2010, 2009, and 20082009
(in thousands, except share and per share data)
4. RECENT ACCOUNTING PRONOUNCEMENTS (Continued)
years beginning after December 15, 2010 will have a material effect on our financial position, results of operations or cash flows.
In October 2009, the FASB issued ASU 2009-13,Revenue Recognition (Topic 605). ASU 2009-13 provides additional guidance related to the accounting for multiple-deliverable arrangements to account for products or services (deliverables) separately rather than as a combined unit and eliminates the residual method of allocation. ASU 2009-13 is effective prospectively for revenue arrangements entered into or materially modified in fiscal years beginning on or after September 15, 2010, with early adoption permitted. We do not anticipate that the provisions of ASU 2009-13 will have a material effect on the Company's financial position, results of operations or cash flows.
5. ALLOWANCE FOR DOUBTFUL ACCOUNTS
The activity in the accounts receivable allowance from continuing operations for the years ended December 31, 2011, 2010 2009 and 20082009 consists of the following:
| | For the Years Ended December 31, | For the Years Ended December 31, | ||||||||||||||||||
|---|---|---|---|---|---|---|---|---|---|---|---|---|---|---|---|---|---|---|---|---|
| | 2010 | 2009 | 2008 | 2011 | 2010 | 2009 | ||||||||||||||
Balance at beginning of year | $ | 1,631 | $ | 1,383 | $ | 2,983 | $ | 489 | $ | 1,631 | $ | 1,383 | ||||||||
Bad debt expense | 1,011 | 1,438 | 1,196 | 1,036 | 1,011 | 1,438 | ||||||||||||||
Write-offs | (2,125 | ) | (395 | ) | (2,899 | ) | (1,087 | ) | (2,125 | ) | (395 | ) | ||||||||
Other adjustments | (28 | ) | (795 | ) | 103 | — | (28 | ) | (795 | ) | ||||||||||
Balance at end of year | $ | 489 | $ | 1,631 | $ | 1,383 | $ | 438 | $ | 489 | $ | 1,631 | ||||||||
6. INVENTORIES
InventoriesThe components of inventories from continuing operations as of December 31, 2011 and 2010 are stated at the lower of cost or market value and primarily consist of raw material, work-in-process, and finished goods. Work-in-process consists of labor and overhead, processing costs, purchased subcomponents and materials purchased for specific customer orders. Finished goods consist of components purchased from third partiessummarized as well as components manufactured by the Company that will be used to produce final customer products.follows:
| | As of December 31, | ||||||
|---|---|---|---|---|---|---|---|
| | 2011 | 2010 | |||||
Raw materials | $ | 11,943 | $ | 9,359 | |||
Work-in-process | 7,437 | 5,869 | |||||
Finished goods | 4,921 | 3,481 | |||||
| 24,301 | 18,709 | ||||||
Less: Reserve for excess and obsolete inventory | (946 | ) | (970 | ) | |||
Net inventories | $ | 23,355 | $ | 17,739 | |||
BROADWIND ENERGY, INC. AND SUBSIDIARIES
NOTES TO CONSOLIDATED FINANCIAL STATEMENTS (Continued)
December 31, 2011, 2010, 2009, and 20082009
(in thousands, except share and per share data)
6. INVENTORIES (Continued)
The components of inventories from continuing operations as of December 31, 2010 and 2009 are summarized as follows:
| | As of December 31, | ||||||
|---|---|---|---|---|---|---|---|
| | 2010 | 2009 | |||||
Raw materials | $ | 9,359 | $ | 4,743 | |||
Work-in-process | 5,869 | 2,921 | |||||
Finished goods | 3,481 | 3,338 | |||||
| 18,709 | 11,002 | ||||||
Less: Reserve for excess and obsolete inventory | (970 | ) | (2,177 | ) | |||
Net inventories | $ | 17,739 | $ | 8,825 | |||
7. PROPERTY AND EQUIPMENT
The cost basis and estimated lives of property and equipment from continuing operations as of December 31, 20102011 and 20092010 are as follows:
| | As of December 31, | | As of December 31, | | ||||||||||||
|---|---|---|---|---|---|---|---|---|---|---|---|---|---|---|---|---|
| | 2010 | 2009 | Life | 2011 | 2010 | Life | ||||||||||
Land | $ | 4,191 | $ | 4,018 | $ | 2,352 | $ | 4,191 | ||||||||
Buildings | 23,574 | 23,501 | 39 years | 23,574 | 23,574 | 39 years | ||||||||||
Machinery and equipment | 100,153 | 95,227 | 2-10 years | 101,510 | 100,153 | 2-10 years | ||||||||||
Office furniture and equipment | 2,319 | 2,468 | 3-7 years | 2,205 | 2,319 | 3-7 years | ||||||||||
Leasehold improvements | 2,457 | 2,611 | Asset life or life of lease | 3,565 | 2,457 | Asset life or life of lease | ||||||||||
Construction in progress | 11,650 | 26,511 | 4,285 | 11,650 | ||||||||||||
| 144,344 | 154,336 | 137,491 | 144,344 | |||||||||||||
Less-accumulated depreciation | (38,027 | ) | (24,717 | ) | (49,725 | ) | (38,027 | ) | ||||||||
| $ | 106,317 | $ | 129,619 | $ | 87,766 | $ | 106,317 | |||||||||
In the first quarter of 2010, the Company completed construction of a third wind tower manufacturing facility in Brandon, South Dakota (the "Brandon Facility"), but the Company has notnever commenced production at this facility. Following the Company's strategic planning meetings that took place in fourth quarter of 2010, the Company concluded it would be difficult or impossible to operate this facility in a profitable or cost-effective manner at the Company's current expected production levels. The Company is currently exploring alternative uses for the building and equipment comprising this facility. In connection with this determination, during the fourth quarter of 2010, the Company recorded an impairment charge of $13,326 to reduce the carrying value of the assets to fair value. The impairment charge iswas included in impairment charges in the consolidated statements of operations. The Company estimated the fair value of these assets primarily based on independent appraisals.
In conjunction with the Company's third quarter 2011 decision to sell the Brandon Facility referenced in Note 20, "Restructuring" of these consolidated financial statements, the Company has reclassified the land, building and fixtures valued at $8,000 from Property and Equipment to Assets Held for Sale. The Company reviewed the value of the Brandon Facility assets through the date of this Annual Report on Form 10-K and determined that no further impairment charges were required. The Company expects to sell the Brandon Facility within the next twelve months.
BROADWIND ENERGY, INC. AND SUBSIDIARIES
NOTES TO CONSOLIDATED FINANCIAL STATEMENTS (Continued)
December 31, 2010, 2009, and 2008
(in thousands, except share and per share data)
7. PROPERTY AND EQUIPMENT (Continued)
The Company conducted an impairment analysis of its Services segment during the fourth quarter of 2010. The analysis indicated an impairment of long-lived assets, $3,554 of which was allocated to property and equipment. The impairment charge is included in impairment charges in the consolidated statements of operations. See Note 8 "Goodwill and Intangible Assets" of these consolidated financial statements for further discussion of impairment charges.
8. GOODWILL AND INTANGIBLE ASSETS
Goodwill
Changes in the carrying value of goodwill during the years ended December 31,2011, 2010, and 2009 are as follows:
| | Gearing | Technical and Engineering Services | Total | ||||||||
|---|---|---|---|---|---|---|---|---|---|---|---|
Goodwill balance as of December 31, 2008 | $ | 21,239 | $ | 4,561 | $ | 25,800 | |||||
Purchase accounting adjustments | 3,030 | — | 3,030 | ||||||||
Impairment charge | (24,269 | ) | — | (24,269 | ) | ||||||
Goodwill balance as of December 31, 2009 | — | 4,561 | 4,561 | ||||||||
Impairment charge | — | (4,561 | ) | (4,561 | ) | ||||||
Goodwill balance as of December 31, 2010 | $ | — | $ | — | $ | — | |||||
Goodwill represents the excess of cost over fair market value of identifiable net assets acquired through business purchases. The Company performs an annual impairment test through the application of a fair-value based test as of October 31 of each year, or more frequently when events or circumstances indicate that the carrying value of its assets may not be recoverable. The Company's estimate of fair value for each of the Company's operating segments is based primarily on projected future results, cash flows and other assumptions. The first step involves a comparison of the estimated fair value of a reporting unit to its carrying amount, including goodwill. In performing the first step, the Company determines the fair value of our reporting units using a combination of an income approach by preparing a discounted cash flow analysis and a market-based approach based on our market capitalization. If the estimated fair value of the reporting unit exceeds its carrying amount, goodwill of the reporting unit is not impaired, and the second step of the impairment test is not necessary. If the carrying amount of a reporting unit exceeds its estimated fair value, then the second step of the goodwill impairment test must be performed. The second step of the goodwill impairment test compares the implied fair value of the reporting unit's goodwill with its carrying amount to measure the amount of impairment loss, if any. The implied fair value of goodwill is determined in the same manner as the amount of goodwill recognized in a business combination. As a result, the estimated fair value of the reporting unit is allocated to all of the assets and liabilities of that unit (including any unrecognized intangible assets) as if the reporting unit had been acquired in a business combination and the fair value of the reporting unit was the purchase price paid. If the carrying amount of the
BROADWIND ENERGY, INC. AND SUBSIDIARIES
NOTES TO CONSOLIDATED FINANCIAL STATEMENTS (Continued)
December 31, 2010, 2009, and 2008
(in thousands, except share and per share data)
8. GOODWILL AND INTANGIBLE ASSETS (Continued)
reporting unit's goodwill exceeds the implied fair value of that goodwill, an impairment loss is recognized in an amount equal to that excess.
The increase in goodwill in 2009 in the Gearing segment relates to purchase accounting adjustments of $3,030 recorded in connection with an escrow settlement agreement with the former owners of our wholly owned subsidiary Brad Foote Gear Works, Inc. ("Brad Foote") in May 2009. The Company did not identify a triggering event during 2009 which would indicate an early assessment of goodwill impairment, however, upon the completion of our annual impairment analysis as of October 31, 2009, the Company determined that the goodwill balance attributable to our Gearing segment was impaired due to a deterioration in financial performance during 2009 and as a result of the subsequent revision in our projection of future operating results and cash flows in light of the effect of the continued economic downturn on the wind gearing industry. Accordingly, the Company's analysis indicated that projected fair value of the Gearing segment assets did not exceed the carrying value of these net assets. As a result, the Company recorded a goodwill impairment charge of $24,269 during the fourth quarter, and the impairment charge was recorded to operating expenses in the Company's consolidated statements of operations for the year ended December 31, 2009.
During the second quarter of 2010, the Company identified a triggering event associated with a continued deterioration in financial performance within its Services segment. This triggering event required a subsequent revision in the Company's projection of future operating results and cash flows for this segment in light of the continued economic weakness in the wind energy industry. The Company's analysis indicated that the projected fair value of the Services segment assets did not exceed the carrying value of these assets. The method used in determining the fair value was based upon the Company's estimate of the projected future discounted cash flows of its reporting unit. As a result, the Company recorded a goodwill impairment charge of $4,561 during the second quarter and the impairment charge was recorded to operating expenses in its consolidated statement of operations.
Intangible and Other Long-lived Assets
As of December 31, 20102011 and 2009,2010, the cost basis, accumulated amortization and net book value of intangible assets were as follows:
| | | December 31, 2010 | December 31, 2009 | December 31, 2011 | December 31, 2010 | ||||||||||||||||||||||||||||||||||||||||||||||||||||||||||
|---|---|---|---|---|---|---|---|---|---|---|---|---|---|---|---|---|---|---|---|---|---|---|---|---|---|---|---|---|---|---|---|---|---|---|---|---|---|---|---|---|---|---|---|---|---|---|---|---|---|---|---|---|---|---|---|---|---|---|---|---|---|---|---|
| | | Cost | Accumulated Amortization | Impairment Charge | Net Book Value | Weighted Average Amortization Period | Cost | Accumulated Amortization | Impairment Charge | Net Book Value | Weighted Average Amortization Period | Cost | Accumulated Amortization | Impairment Charge | Net Book Value | Weighted Average Amortization Period | Cost | Accumulated Amortization | Impairment Charge | Net Book Value | Weighted Average Amortization Period | ||||||||||||||||||||||||||||||||||||||||||
Intangible assets: | Intangible assets: | ||||||||||||||||||||||||||||||||||||||||||||||||||||||||||||||
Customer relationships | $ | 28,679 | $ | (7,529 | ) | $ | (17,796 | ) | $ | 3,354 | 10.8 | $ | 102,258 | $ | (20,755 | ) | $ | (57,835 | ) | $ | 23,668 | 10.1 | |||||||||||||||||||||||||||||||||||||||||
Trade names | 9,789 | (1,530 | ) | (1,540 | ) | 6,719 | 20.0 | 9,909 | (1,069 | ) | (107 | ) | 8,733 | 20.0 | |||||||||||||||||||||||||||||||||||||||||||||||||
Customer relationships | $ | 3,979 | $ | (1,084 | ) | $ | — | $ | 2,895 | 10.8 | $ | 28,679 | $ | (7,529 | ) | $ | (17,796 | ) | $ | 3,354 | 10.8 | ||||||||||||||||||||||||||||||||||||||||||
Trade names | 7,999 | (1,680 | ) | — | 6,319 | 20.0 | 9,789 | (1,530 | ) | (1,540 | ) | 6,719 | 20.0 | ||||||||||||||||||||||||||||||||||||||||||||||||||
Intangible assets | Intangible assets | $ | 38,468 | $ | (9,059 | ) | $ | (19,336 | ) | $ | 10,073 | 17.0 | $ | 112,167 | $ | (21,824 | ) | $ | (57,942 | ) | $ | 32,401 | 12.6 | $ | 11,978 | $ | (2,764 | ) | $ | — | $ | 9,214 | 17.0 | $ | 38,468 | $ | (9,059 | ) | $ | (19,336 | ) | $ | 10,073 | 17.0 | |||||||||||||||||||
The Company reviews intangible and other long-lived assets for impairment whenever events or changes in circumstances indicate that the asset's carrying amount may not be recoverable. Due to the revision in our projections of operating results and cash flows within our Gearing segment duringDuring the fourth quarter of 2009,2011, the Company deemed thisidentified triggering events associated with the Company's current period operating loss combined with its history of continued operating losses. As a triggering event, and subsequently tested our
Tableresult, the Company evaluated the recoverability of Contents
BROADWIND ENERGY, INC. AND SUBSIDIARIES
NOTES TO CONSOLIDATED FINANCIAL STATEMENTS (Continued)
certain of its identifiable intangible assets. Based upon the Company's assessment, no impairment to these assets was identified as of December 31, 2010, 2009, and 2008
(in thousands, except share and per share data)
8. GOODWILL AND INTANGIBLE ASSETS (Continued)
intangible2011. In the future, asset recoverability will be measured by comparing the assets' carrying amounts to their expected future undiscounted net cash flows. If such assets for impairment. The completionare considered to be impaired, the impairment recognized is measured based on the amount by which the carrying amount of our impairment analysis indicated that the customer relationship intangibles associated with our Gearing segment were impaired. The decline in our estimates of future operating results and corresponding discounted cash flows indicated thatassets exceeds the fair value of these customer relationships was less than the carrying value of these assets. Additionally, the Company determined that our RBA trade name was impaired as a result of the merger of RBA's operations into our Towers segment in December 2009 and that RBA's customer relationship intangible was impaired due to a revision in projected revenues and cash flows associated with this customer relationship. Accordingly, the Company recorded an intangible impairment charge of $57,942 to properly reflect the carrying value of these assets.value.
During the fourth quarter of 2010, the Company identified triggering events associated with the Company's current period operating loss, its history of continued operating losses and its revised projections of operating results and cash flows developed as part of the strategic planning process. As a result, wethe Company tested ourits intangible and other long-lived assets for impairment. The decline in ourthe Company's estimates of future operating results and corresponding cash flows indicated that the fair value of these assets was less than the carrying value. Accordingly, the Company recorded an impairment charge of $22,890 related to the Services segment. The impairment was allocated as follows: customer relationships $17,796: trade name $1,540; and property and equipment $3,554. In the future, if our projected discounted cash flows associated with our operating segments do not exceed the carrying value of their net assets, the Company may be required to record additional write downs of the carrying value of our intangible and other long-lived assets.
Intangible assets are amortized on a straight-line basis over their estimated useful lives, which range from 10 to 20 years. Amortization expense was $859, $2,992 $9,524 and $10,645$9,524 for the years ended December 31, 2011, 2010 2009 and 2008,2009, respectively. As of December 31, 2010,2011, estimated future amortization expense is as follows:
2011 | $ | 859 | ||||||
2012 | 859 | $ | 859 | |||||
2013 | 859 | 859 | ||||||
2014 | 859 | 859 | ||||||
2015 | 859 | 859 | ||||||
2016 and thereafter | 5,778 | |||||||
2016 | 859 | |||||||
2017 and thereafter | 4,919 | |||||||
Total | $ | 10,073 | $ | 9,214 | ||||
BROADWIND ENERGY, INC. AND SUBSIDIARIES
NOTES TO CONSOLIDATED FINANCIAL STATEMENTS (Continued)
December 31, 2011, 2010, 2009, and 20082009
(in thousands, except share and per share data)
9. ACCRUED LIABILITIES
Accrued liabilities as of December 31, 20102011 and 20092010 consisted of the following:
| | December 31, | December 31, | ||||||||||||
|---|---|---|---|---|---|---|---|---|---|---|---|---|---|---|
| | 2010 | 2009 | 2011 | 2010 | ||||||||||
Accrued payroll and benefits | $ | 2,845 | $ | 2,228 | $ | 2,762 | $ | 2,845 | ||||||
Accrued property taxes | 387 | 269 | 250 | 387 | ||||||||||
Income taxes payable | 401 | 225 | 386 | 401 | ||||||||||
Accrued professional fees | 211 | 1,067 | 433 | 211 | ||||||||||
Accrued warranty liability | 1,071 | 918 | 983 | 1,071 | ||||||||||
Accrued environmental reserve | 675 | — | — | 675 | ||||||||||
Accrued other | 925 | 1,972 | 935 | 925 | ||||||||||
Total accrued liabilities | $ | 6,515 | $ | 6,679 | $ | 5,749 | $ | 6,515 | ||||||
10. DEBT AND CREDIT AGREEMENTS
The Company's outstanding debt balances as of December 31, 20102011 and 20092010 consisted of the following:
| | December 31, | ||||||
|---|---|---|---|---|---|---|---|
| | 2010 | 2009 | |||||
Lines of credit | $ | — | $ | 10,601 | |||
Term loans and notes payable | 8,928 | 18,974 | |||||
Related party note | 2,320 | 2,320 | |||||
| 11,248 | 31,895 | ||||||
Less—Current portion | (1,577 | ) | (18,499 | ) | |||
Long-term debt, net of current maturities | $ | 9,671 | $ | 13,396 | |||
As of December 31, 2010, future annual principal payments on our outstanding debt obligations were as follows:
2011 | $ | 1,577 | ||
2012 | 4,550 | |||
2013 | 1,330 | |||
2014 | 1,176 | |||
2015 | 1,178 | |||
2016 and thereafter | 1,437 | |||
Total | $ | 11,248 | ||
| | December 31, | ||||||
|---|---|---|---|---|---|---|---|
| | 2011 | 2010 | |||||
Term loans and notes payable | 6,999 | 11,248 | |||||
Less—Current portion | (2,202 | ) | (1,577 | ) | |||
Long-term debt, net of current maturities | $ | 4,797 | $ | 9,671 | |||
BROADWIND ENERGY, INC. AND SUBSIDIARIES
NOTES TO CONSOLIDATED FINANCIAL STATEMENTS (Continued)
December 31, 2011, 2010, 2009, and 20082009
(in thousands, except share and per share data)
10. DEBT AND CREDIT AGREEMENTS (Continued)
As of December 31, 2011, future annual principal payments on the Company's outstanding debt obligations were as follows:
2012 | $ | 2,202 | ||
2013 | 1,390 | |||
2014 | 493 | |||
2015 | 188 | |||
2016 | 46 | |||
2017 and thereafter | 2,680 | |||
Total | $ | 6,999 | ||
Credit Facilities
Bank of America Debt (Repaid)
In connection with the Company's acquisition of Brad Foote in October 2007, the Company assumed outstanding debt and available lines of credit totaling approximately $25,500 under various secured debt facilities (the "BOA Debt Facilities") with Bank of America. As of December 31, 2009, the total principal amount outstanding under the BOA Debt Facilities was approximately $15,964, and the effective per annum interest rate was 7%. On January 22, 2010, Brad Foote repaid all of the outstanding principal and interest under the BOA Debt Facilities in the aggregate amount of $16,076, and the BOA Debt Facilities were terminated.
Investors Community Bank Credit Line (Expired March 12, 2010)Loans
In October 2007, Tower Tech obtained a secured line of credit (the "ICB Line") from Investors Community Bank ("ICB") in the amount of $2,500, which was subsequently increased to $5,500 on March 21, 2008. On March 13, 2009, ICB agreed to extend the maturity date of the ICB Line to March 13, 2010. Pursuant to a Master Amendment dated as of December 30, 2009 among ICB, Tower Tech and Broadwind (as guarantor) (the "Master Amendment"), the amount of the ICB Line was increased to $6,500, subject to borrowing base availability. Tower Tech repaid all of the outstanding indebtedness under the ICB Line in the amount of $3,066 on January 26, 2010, and allowed the ICB Line to expire on March 13, 2010. The effective interest rate related to the ICB Line was 6% at December 31, 2009.
Investors Community Bank Notes
On April 7, 2008, the Company's wholly ownedwholly-owned subsidiary R.B.A. Inc. ("RBA") executed four (4) promissory notes with ICB (the "ICB Notes"Investors Community Bank ("ICB") in the aggregate principal amount of approximately $3,781, as follows: (i) a$3,781. Three of these notes were term note in the maximumnotes, with initial principal amount of approximately $421,balances totaling $2,049, bearing interest at afixed rates ranging from 5.65% to 6.85% per annum, rate of 6.85%, with a maturity date ofmaturities ranging from October 5, 2012; (ii) a term2012 to April 2013 (collectively, the "ICB Notes"). The fourth note in the maximum principal amount of $700, bearing interest at a per annum rate of 5.65%, with a maturity date of April 25, 2013; (iii) a term note in the maximum principal amount of $928, bearing interest at a per annum rate of 5.65%, with a maturity date of April 25, 2013; and (iv)was a line of credit note, which has been repaid in the maximum principal amount of $1,732, bearing interest at a per annum rate of 4.48% until May 1, 2008 and thereafter at the London Interbank Offered Rate ("LIBOR") plus 1.75%, with a maturity date of April 5, 2009 (the "Line of Credit Note"). The Line of Credit Note was subsequently modified on March 13, 2009 to extend the maturity date to March 13, 2010 and to change the interest rate to the greater of (A) 5% or (B) prime. The ICB Notes provide for multiple advances, and were secured by substantially all of the assets of RBA.full.
Pursuant to the merger of RBA into the Company's wholly-owned subsidiary Broadwind Towers, Inc. (f/k/a Tower Tech Systems, Inc.) ("Broadwind Towers") on December 31, 2009, Tower Tech became the successor by merger to RBA's interest in the loans from ICB to RBA evidenced by the ICB Notes (other than(collectively, the Line"ICB Loans") were modified pursuant to a Master Amendment among ICB, Broadwind Towers and the Company (as guarantor) (the "Master Amendment"). Under the terms of Credit Note, which was repaid in full in January 2010). Pursuant to the Master Amendment, Tower TechBroadwind Towers agreed to maintain a minimum debt service coverage ratio in addition to certain other requirements. The Master Amendment was amended asnumber of December 30, 2010, (i) to
BROADWIND ENERGY, INC. AND SUBSIDIARIES
NOTES TO CONSOLIDATED FINANCIAL STATEMENTS (Continued)
December 31, 2010, 2009,security and 2008
(in thousands, except share and per share data)
10. DEBT AND CREDIT AGREEMENTS (Continued)
deletefinancial covenants. As the requirements that Tower Tech maintain a collateral account as security for the obligationsoutstanding balances under the ICB Notes andLoans have declined, certain of these requirements have been removed through subsequent amendments of the Master Amendment. The remaining security requirements are that no additional loans or leases would be entered into by Tower Tech without the prior approval of ICB, and (ii) to replace the requirement that Tower TechBroadwind Towers maintain its primary deposit accounts with ICB with the requirement that Tower Tech maintain with ICB a depository relationship of not less than $700 with such fundsICB and maintain a debt service ratio of not less than 1.25 to be deposited into1.0 at all times. The ICB Loans are also secured by a money market account or certificate of depositmortgage on a facility owned by no later than January 7, 2011.Broadwind Towers in Clintonville, Wisconsin, and a guarantee by the Company. As of December 31, 2010,2011, (i) Tower Tech was in compliance with all covenants under its credit facilities with ICB, (ii) the total amount of outstanding indebtedness under the remaining ICB Notes was $1,371 and (iii)$1,101, (ii) the effective per annum interest rate under the remaining ICB Notes was 5.81%.5.75%, and (iii) Broadwind Towers was in compliance with all covenants under the documents evidencing and securing the ICB Loans.
Great Western Bank Loan
On April 28, 2009, Tower TechBroadwind Towers entered into a Construction Loan Agreement with Great Western Bank ("GWB"), pursuant to which GWB agreed to provide up to $10,000 in financing (the "Construction Loan") to fund construction of Tower Tech's wind tower manufacturing facility inthe Brandon South Dakota (the "Facility").Facility. Pursuant to a Change in Terms Agreement dated April 5, 2010 between GWB and Tower Tech,Broadwind Towers, the Construction Loan was
BROADWIND ENERGY, INC. AND SUBSIDIARIES
NOTES TO CONSOLIDATED FINANCIAL STATEMENTS (Continued)
December 31, 2011, 2010, and 2009
(in thousands, except share and per share data)
10. DEBT AND CREDIT AGREEMENTS (Continued)
converted to a term loan (the "Great Western"GWB Term Loan") providing for monthly payments of principal plus interest, extending the maturity date to November 5, 2016, reducing the principal amount to $6,500, and changing the per annum interest rate to 8.5%. Tower Tech was required to pay a 1.0% origination fee upon the conversion.
The Great WesternGWB Term Loan is secured by a first mortgage on the Brandon Facility and all fixtures and proceeds relating thereto, pursuant to a Mortgage and a Commercial Security Agreement, each between Tower TechBroadwind Towers and GWB, and by a Commercial Guaranty from the Company. In addition, the Company has agreed to subordinate all intercompany debt with Tower TechBroadwind Towers to the Great WesternGWB Term Loan. The Great WesternGWB Term Loan contains representations, warranties and covenants that are customary for a term financing arrangement and contains no financial covenants. As of December 31, 2010,2011, the total outstanding indebtedness under the Great WesternGWB Term Loan was $5,750.$4,833, which is recorded as Liabilities Held for Sale within the consolidated balance sheet.
Wells Fargo Account Purchase Agreements
On September 29, 2010, the Company's domesticwholly-owned subsidiaries Broadwind Towers, Brad Foote Gear Works, Inc. ("Subsidiaries"Brad Foote"), Broadwind Services, LLC f/k/a Energy Maintenance Service, LLC ("Broadwind Services), (collectively, the "Subsidiaries"), and Badger entered into account purchase agreements (the "AP Agreements") with Wells Fargo Business Credit, a division of Wells Fargo Bank, N.A. ("Wells Fargo"). Under the AP Agreements, when requested by the Company, Wells Fargo will advance funds against certain receivables arising from sales of the Subsidiaries' products and services. In connection with the entry into the AP Agreements, the Company and each Subsidiary have executed guaranties (including cross-guaranties) in favor of Wells Fargo. With respect to the Subsidiaries, the AP Agreements contain provisions providing for cross-defaults and cross-collateralization. In addition, each Subsidiary has granted to Wells Fargo a security interest against all financed receivables and related collateral. Prior to entering into the AP Agreements, there was no material relationship between the Company, the Subsidiaries and Wells Fargo.
Under the terms of the AP Agreements, when requested by the Company, Wells Fargo will advance approximately 80% of the face value of eligible receivables to the Subsidiaries. Wells Fargo will have full recourse to the Subsidiaries for collection of the financed receivables. The aggregate facility limit of the AP Agreements is $10,000.
BROADWIND ENERGY, INC. AND SUBSIDIARIES
NOTES TO CONSOLIDATED FINANCIAL STATEMENTS (Continued)
December 31, 2010, 2009, and 2008
(in thousands, except share and per share data)
10. DEBT AND CREDIT AGREEMENTS (Continued)
For Wells Fargo's services under the AP Agreements, the Subsidiaries have agreed to pay Wells Fargo (i) a floating discount fee of the then-prevailing LIBOR plus 3.75% per annum on the sum of the outstanding financed accounts, (ii) an annual facility fee of 1% of the aggregate facility limit, and (iii) an annual unused line fee of 0.042% on the portion of the credit facility which is unused. The initial term of the AP Agreements ends on September 29, 2013. If the AP Agreements are terminated prior to this date, an early termination fee of up to 3%2% of the aggregate facility limit may apply.
In connection with the sale of Badger to a third party purchaser on March 4, 2011, the AP Agreement between Badger and Wells Fargo and the guaranty provided by Badger to Wells Fargo with respect to the other AP Agreements were each terminated, pursuant to an Omnibus Amendment to Account Purchase Agreements and Guaranties dated as of March 4, 2011, by and among the Company, the Subsidiaries and Wells Fargo.
BROADWIND ENERGY, INC. AND SUBSIDIARIES
NOTES TO CONSOLIDATED FINANCIAL STATEMENTS (Continued)
December 31, 2011, 2010, and 2009
(in thousands, except share and per share data)
10. DEBT AND CREDIT AGREEMENTS (Continued)
On October 19, 2011 the AP Agreements were amended to modify the month-end minimum total cash balance requirement from $5,000 to the greater of $2,000 or the outstanding purchased amount, not to exceed $5,000.
During 2011, the Company financed approximately $981 of accounts receivable with Wells Fargo. At December 31, 2010, no amounts were drawn under the AP Agreements,2011, $523 of financed receivables remained outstanding, and the Subsidiaries had the ability to borrowdraw up to $10,000,$9,477, subject to maintaining a month-end minimum total cash balance of $5,000.$2,000.
Selling Shareholder Notes
On May 26, 2009, the Company entered into a settlement agreement (the "Settlement Agreement") with the former owners of Brad Foote, (the "Selling Shareholders"), including J. Cameron Drecoll, who served as the Company's Chief Executive Officer and a member of its Board of Directors until December 1, 2010. The Settlement Agreement related to the post-closing escrow established in connection with the Company's acquisition of Brad Foote. Under the terms of the Settlement Agreement, among other terms, the Company issued three promissory notes to the Selling Shareholdersformer owners in the aggregate principal amount of $3,000 (the "Selling Shareholder Notes"). The Selling Shareholder Notes issued to the former owners other than Mr. Drecoll mature on May 28, 2012 and bear interest at a rate of 7% per annum, with interest payments due quarterly. The Selling Shareholder Note issued to Mr. Drecoll in the principal amount of $2,320 and pursuant to the terms of the Settlement Agreement (the "Drecoll Note") also was originally scheduled to mature on May 28, 2012 and bore interest at a rate of 7% per annum, with interest payments due quarterly; however, effective as of July 1, 2011, the Drecoll Note was amended and restated to effect the following modifications: (i) the maturity date was changed to January 10, 2014; (ii) the interest rate was changed to 9% per annum; and (iii) the payment schedule was changed to quarterly payments of principal and interest, such that the Drecoll Note is deemed bynow self-amortizing with payments that commenced in the fourth quarter of 2011. The Company agreed to bepay Mr. Drecoll a related party transaction.restructuring fee in the amount of $10 in connection with the restructuring of the Drecoll Note. As of December 31, 2010,2011, principal of $3,000$2,791 and accrued interest of $53$59 were outstanding under the Selling Shareholder Notes. The Company has accounted for
Other
Included in Long Term Debt, Net of Current Maturities is $2,280 associated with the Selling Shareholder Notes as long-term debtNew Markets Tax Credit Agreement described further in itsdescribed in Note 19, "New Markets Tax Credit" of these consolidated balance sheets.financial statements.
11. LEASES
The Company leases various property and equipment under operating lease arrangements. Lease terms generally range from 3 to 15 years with renewal options for extended terms. The Company is required to make additional payments under certain property leases for taxes, insurance and other operating expenses incurred during the operating lease period. Rental expense for the years ended December 31, 2011, 2010 and 2009 was $4,779, $4,289 and 2008 was $4,289, $4,510, respectively.
BROADWIND ENERGY, INC. AND SUBSIDIARIES
NOTES TO CONSOLIDATED FINANCIAL STATEMENTS (Continued)
December 31, 2011, 2010, and $2,911, respectively.2009
(in thousands, except share and per share data)
11. LEASES (Continued)
In addition, the Company has entered into capital lease arrangements to finance property and equipment and assumed capital lease obligations in connection with certain acquisitions. The cost basis and accumulated depreciation of assets recorded under capital leases, which are included in property and equipment, are as follows as of December 31, 20102011 and 2009:2010:
| | December 31, | December 31, | ||||||||||||
|---|---|---|---|---|---|---|---|---|---|---|---|---|---|---|
| | 2010 | 2009 | 2011 | 2010 | ||||||||||
Cost | $ | 6,154 | $ | 6,134 | $ | 6,264 | $ | 6,154 | ||||||
Accumulated depreciation | (1,317 | ) | (680 | ) | (1,903 | ) | (1,317 | ) | ||||||
Net book value | $ | 4,837 | $ | 5,454 | $ | 4,361 | $ | 4,837 | ||||||
BROADWIND ENERGY, INC. AND SUBSIDIARIES
NOTES TO CONSOLIDATED FINANCIAL STATEMENTS (Continued)
December 31, 2010, 2009, and 2008
(in thousands, except share and per share data)
11. LEASES (Continued)
Depreciation expense recorded in connection with assets recorded under capital leases was $620, $624 $626 and $138$626 for the years ended December 31, 2011, 2010 2009 and 2008,2009, respectively.
As of December 31, 2010,2011, future minimum lease payments under capital leases and operating leases are as follows:
| | Capital Leases | Operating Leases | Total | Capital Leases | Operating Leases | Total | ||||||||||||||
|---|---|---|---|---|---|---|---|---|---|---|---|---|---|---|---|---|---|---|---|---|
2011 | $ | 1,172 | $ | 4,270 | $ | 5,442 | ||||||||||||||
2012 | 1,054 | 3,666 | 4,720 | $ | 1,091 | $ | 3,588 | $ | 4,679 | |||||||||||
2013 | 908 | 2,468 | 3,376 | 944 | 3,132 | 4,076 | ||||||||||||||
2014 | — | 2,142 | 2,142 | 35 | 2,803 | 2,838 | ||||||||||||||
2015 | — | 1,601 | 1,601 | 46 | 2,235 | 2,281 | ||||||||||||||
2016 and thereafter | — | 3,915 | 3,915 | |||||||||||||||||
2016 | 2,265 | 2,265 | ||||||||||||||||||
2017 and thereafter | 22,644 | 22,644 | ||||||||||||||||||
Total | 3,134 | $ | 18,062 | $ | 21,196 | 2,116 | $ | 36,667 | $ | 38,783 | ||||||||||
Less—portion representing interest at a weighted average annual rate of 8.8% | (366 | ) | ||||||||||||||||||
Less—portion representing interest at a weighted average annual rate of 8.6% | (176 | ) | ||||||||||||||||||
Principal | 2,768 | 1,940 | ||||||||||||||||||
Less—current portion | (966 | ) | (965 | ) | ||||||||||||||||
Capital lease obligations, noncurrent portion | $ | 1,802 | $ | 975 | ||||||||||||||||
12. COMMITMENTS AND CONTINGENCIES
Purchase Commitments
The Company issued purchase commitments in connection with equipment purchases for its wind tower manufacturing facility located in Brandon, South Dakota, and its drivetrain service center located in Abilene, Texas.Dakota. As of December 31, 2010,2011, outstanding purchase commitments totaled approximately $1,021 and $1,589, respectively.$390. The Company expects that these commitments will be fully satisfied in 2011.
During 2008, the Company issued purchase commitments to two equipment manufacturers in connection with equipment purchases totaling $4,888. Under the terms of the purchase orders, the Company was required to make deposits totaling approximately $1,324. In the second quarter of 2010, the Company informed one of the manufacturers of the Company's election to cancel the equipment purchase commitment with such manufacturer, which resulted in the forfeiture of a non-refundable deposit in the amount of approximately $650. In the fourth quarter of 2010, the Company reached an agreement with the second manufacturer pursuant to which the Company agreed to purchase a different piece of equipment in exchange for a credit of the deposit under the original purchase order with such manufacturer and the trade-in of two pieces of used equipment. As of December 31, 2010, there were no outstanding purchase commitments associated with these equipment purchases.2012.
BROADWIND ENERGY, INC. AND SUBSIDIARIES
NOTES TO CONSOLIDATED FINANCIAL STATEMENTS (Continued)
December 31, 2011, 2010, 2009, and 20082009
(in thousands, except share and per share data)
12. COMMITMENTS AND CONTINGENCIES (Continued)
Legal Proceedings
From time to time, the Company is subject to legal proceedings or claims arising from its normal course of operations. The Company accrues for costs related to loss contingencies when such costs are probable and reasonably estimable. As of December 31, 2010,2011, the Company is not aware of any material pending legal proceedings or threatened litigation that would have a material adverse effect on the Company's financial condition or results of operations, although no assurance can be given with respect to the ultimate outcome of pending actions. Refer to Note 22 "Subsequent Events""Legal Proceedings" of these consolidated financial statements for further discussion of legal proceedings.
Environmental Compliance and Remediation Liabilities
The Company's operations and products are subject to a variety of environmental laws and regulations in the jurisdictions in which the Company operates and sells products governing, among other things, air emissions, wastewater discharges, the use, handling and disposal of hazardous materials, soil and groundwater contamination, employee health and safety, and product content, performance and packaging. Also, certain environmental laws can impose the entire cost or a portion of the cost of investigating and cleaning up a contaminated site, regardless of fault, upon any one or more of a number of parties, including the current or previous owners or operators of the site. These environmental laws also impose liability on any person who arranges for the disposal or treatment of hazardous substances at a contaminated site. Third parties may also make claims against owners or operators of sites and users of disposal sites for personal injuries and property damage associated with releases of hazardous substances from those sites. Refer to Note 22 "Subsequent Events""Legal Proceedings" of these consolidated financial statements for further discussion of environmental compliance and remediation liabilities.
Collateral
In select instances, the Company has pledged specific inventory and machinery and equipment assets to serve as collateral on related payable or financing obligations.
Warranty Liability
The Company provides warranty terms that generally range from one to seven years for various products and services relating to workmanship and materials supplied by the Company. In certain contracts, the Company has recourse provisions for items that would enable recovery from third parties for amounts paid to customers under warranty provisions.
Liquidated Damages
In certain customer contracts, the Company has agreed to pay liquidated damages in the event of qualifying delivery or production delays. These damages are typically limited to a specific percentage of the value of the product in question.
BROADWIND ENERGY, INC. AND SUBSIDIARIES
NOTES TO CONSOLIDATED FINANCIAL STATEMENTS (Continued)
December 31, 2011, 2010, and 2009
(in thousands, except share and per share data)
12. COMMITMENTS AND CONTINGENCIES (Continued)
Sale-Leaseback Transactions
During 2009, the Company entered into sale-leaseback agreements whereby certain owned equipment was sold to a third party financing company in exchange for cash and the Company subsequently entered into an equipment lease agreement with the purchaser. The primary purpose of these arrangements was to provide additional liquidity to meet working capital requirements. DependingBased on the terms of the lease agreement,agreements, the lease may beleases were classified as an operating or capital lease.leases. In addition, the sale of the assets may resultresulted in a gain or loss, which must beis being amortized to other income or loss in the Company's statement of operations over the life of the operating lease.leases. As of December 31, 2010,2011, the minimum monthly payments due under these lease agreements totaled $85.
BROADWIND ENERGY, INC. AND SUBSIDIARIES
NOTES TO CONSOLIDATED FINANCIAL STATEMENTS (Continued)
December 31, 2010, 2009, and 2008
(in thousands, except share and per share data)
12. COMMITMENTS AND CONTINGENCIES (Continued)
Other
Collective bargaining agreements have been ratified by collective bargaining units in place at ourthe Company's Cicero and Neville Island facilities and expire in February 2014 and October 2012, respectively. As of December 31, 2010, our2011, the Company's collective bargaining units represented approximately 23% of ourits workforce.
13. INTEREST RATE SWAP AGREEMENTS
As part of our acquisition of Brad Foote in October 2007, On July 20, 2011, the Company assumed twoentered into a strategic financing agreement including the following third parties: AMCREF, a registered community development entity and Capital One, National Association ("Capital One"). This agreement allows the Company to receive below market interest rate swap agreements. These swap agreements were intendedfunds through the New Markets Tax Credit program, see Note 19, "New Markets Tax Credit Transaction" of these consolidated financial statements. Under the New Markets Tax Credit program, the gross loan and investment in the Company's Abilene, Texas gearbox facility of $10,000 generates $3,900 in tax credits over a period of seven years, which the financing agreement makes available to minimizeCapital One. The gearbox facility must operate and be in compliance with the impact of interest rate fluctuations on certain debt instruments. Interest rate swap agreements involve exchanges of fixed or floating rate interest payments periodically over the lifeterms and conditions of the agreement withoutduring the exchange of the underlying principal amounts. Derivatives are measured at fair value and recognized as either assetsseven year compliance period, or liabilities on the Company's balance sheet. The accounting for changes in the fair value of a derivative is dependent upon the use of the derivative and its resulting designation. Unless specific hedge accounting criteria are met, changes in the fair value of the derivative must be recognized currently in earnings. The Company's interest rate swaps did not qualify for hedge accounting, and therefore, the Company may be liable for the recapture of $3,900 in tax credits to which Capital One is required to recognize the swap agreements at their fair market value and record the fluctuations in the fair value of the swap agreements in current earnings.
In February 2010, theotherwise entitled. The Company settled both interest rate swap agreements for $270does not anticipate any credit recaptures will be required in connection with the repayment of all outstanding indebtedness to Bank of America in January 2010. During the year ended December 31, 2009, the Company reported a gain related to the change in the fair value of these instruments of $330 compared to a loss of $194 for the year ended December 31, 2008. The fair market value of the interest rate swaps of $253 was recorded as a long-term liability in our consolidated balance sheets as of December 31, 2009. The fair values of our interest rate swap agreements were calculated using Level 2 assumptions, and the corresponding gain or loss was recognized as other income (expense) in our consolidated statements of operations.this arrangement.
14.13. FAIR VALUE MEASUREMENTS
The Company measures its financial assets and liabilities at fair value. Fair value is defined as the price that would be received to sell an asset or paid to transfer a liability (i.e., exit price) in an orderly transaction between market participants at the measurement date. Additionally, the Company is required to provide disclosure and categorize assets and liabilities measured at fair value into one of three different levels depending on the assumptions (i.e., inputs) used in the valuation. Level 1 provides the most reliable measure of fair value while Level 3 generally requires significant management judgment. Financial assets and liabilities are classified in their entirety based on the lowest level of input significant to the fair value measurement. The fair value hierarchy is defined as follows:
Level 1—Valuations are based on unadjusted quoted prices in active markets for identical assets or liabilities.
BROADWIND ENERGY, INC. AND SUBSIDIARIES
NOTES TO CONSOLIDATED FINANCIAL STATEMENTS (Continued)
December 31, 2011, 2010, 2009, and 20082009
(in thousands, except share and per share data)
14.13. FAIR VALUE MEASUREMENTS (Continued)
Level 2—Valuations are based on quoted prices for similar assets or liabilities in active markets, or quoted prices in markets that are not active for which significant inputs are observable, either directly or indirectly.
Level 3—Valuations are based on prices or valuation techniques that require inputs that are both unobservable and significant to the overall fair value measurement. Inputs reflect management's best estimate of what market participants would use in valuing the asset or liability at the measurement date.
Fair value of financial instruments
The carrying amounts of the Company's financial instruments, which include cash and cash equivalents, accounts receivable, accounts payable and customer deposits approximate their respective fair values due to the relatively short-term nature of these instruments. Based upon interest rates currently available to the Company for debt with similar terms, the carrying value of the Company's long-term debt is approximately equal to its fair value.
As of December 31, 2009, the Company had two interest rate swap agreements totaling $253, which were required to be measured at fair value on a recurring basis. In February 2010, the Company settled both interest rate swap agreements in connection with the repayment of all outstanding indebtedness to Bank of America. See Note 13 "Interest Rate Swap Agreements" of these consolidated financial statements for a discussion of these interest rate swap agreements.
Assets measured at fair value on a nonrecurring basis
The Company reviews its goodwill balances for impairment on at least an annual basis based on the carrying value of these assets as of October 31 and tests its intangible and long-lived assets whenever events or changes in circumstances indicate that its carrying value may not be recoverable. Due to the continuing effects of the economic downturn on the wind energy industry, the Company tested goodwill and intangible assets for impairment using a fair value measurement approach. The fair value measurement approach for long-lived assets utilizes a number of significant unobservable inputs or Level 3 assumptions. These assumptions include, among others, projections of ourthe Company's future operating results, the implied fair value of these assets using an income approach by preparing a discounted cash flow analysis and a market basedmarket-based approach based on ourthe Company's market capitalization, and other subjective assumptions. During the fourth quarter of 2011, the Company identified triggering events associated with the Company's current period operating loss combined with its history of continued operating losses. As a result, the Company evaluated the recoverability of certain of its identifiable intangible assets and certain property and equipment assets. Based upon the Company's assessment, no impairment to these assets was identified as of December 31, 2011.
Upon completion of ourits 2009 impairment analysis, the Company determined that the carrying value of its goodwill and intangible assets exceeded their fair value. Accordingly, the fairCompany recorded goodwill and intangible impairment charges of $24,269 and $57,942, respectively, to properly reflect the carrying value of these assets.
Upon completion of its 2010 impairment analysis, the Company determined that the carrying value of its goodwill and intangible assets exceeded their fair value. Accordingly, the Company recorded goodwill and intangible impairment charges of $4,561 and $19,336, respectively, to properly reflect the carrying value of these assets. In addition, the Company recorded an impairment charge to fixed assets of $13,326 related to its Brandon, South Dakota tower manufacturing facility, and $3,554 related to property and equipment at its Services segment. See Note 7 "Property and Equipment" of these consolidated financial statements for further discussion of this impairment charge.The following table presents the fair value
BROADWIND ENERGY, INC. AND SUBSIDIARIES
NOTES TO CONSOLIDATED FINANCIAL STATEMENTS (Continued)
December 31, 2011, 2010, 2009, and 20082009
(in thousands, except share and per share data)
14.13. FAIR VALUE MEASUREMENTS (Continued)
The following table presents the fair value measurements of ourthe Company's nonrecurring assets for continuing operations as of December 31, 2010 and 2009:2010:
| | Fair Value Measurements Using | |||||||||||||||||||||||||||||||
|---|---|---|---|---|---|---|---|---|---|---|---|---|---|---|---|---|---|---|---|---|---|---|---|---|---|---|---|---|---|---|---|---|
Description | Year Ended 12/31/10 | Quoted Prices in Active Markets for Identical Assets (Level 1) | Significant Other Observable Inputs (Level 2) | Significant Unobservable Inputs (Level 3) | Total Gains (Losses) | Year Ended 12/31/10 | Quoted Prices in Active Markets for Identical Assets (Level 1) | Significant Other Observable Inputs (Level 2) | Significant Unobservable Inputs (Level 3) | Total Gains (Losses) | ||||||||||||||||||||||
Goodwill | $ | — | $ | — | $ | — | $ | — | $ | (4,561 | ) | $ | — | $ | — | $ | — | $ | — | $ | (4,561 | ) | ||||||||||
Intangible assets, net | 10,073 | — | — | 10,073 | (19,336 | ) | 10,073 | — | — | 10,073 | (19,336 | ) | ||||||||||||||||||||
Property and equipment, net | 106,317 | — | — | 106,317 | (16,880 | ) | 106,317 | — | — | 106,317 | (16,880 | ) | ||||||||||||||||||||
| $ | (40,777 | ) | $ | (40,777 | ) | |||||||||||||||||||||||||||
Description | Year Ended 12/31/09 | Quoted Prices in Active Markets for Identical Assets (Level 1) | Significant Other Observable Inputs (Level 2) | Significant Unobservable Inputs (Level 3) | Total Gains (Losses) | |||||||||||||||||||||||||||
Goodwill | $ | 4,561 | $ | — | $ | — | $ | 4,561 | $ | (24,269 | ) | |||||||||||||||||||||
Intangible assets, net | 32,401 | — | — | 32,401 | (57,942 | ) | ||||||||||||||||||||||||||
Property and equipment, net | 129,619 | — | — | 129,619 | — | |||||||||||||||||||||||||||
| $ | (82,211 | ) | ||||||||||||||||||||||||||||||
BROADWIND ENERGY, INC. AND SUBSIDIARIES
NOTES TO CONSOLIDATED FINANCIAL STATEMENTS
December 31, 2011, 2010, and 2009
(in thousands, except share and per share data)
14. INCOME TAXES
The Company accounts for income taxes based upon an asset and liability approach. Deferred tax assets and liabilities represent the future tax consequences of the differences between the financial statement carrying amounts of assets and liabilities versus the tax basis of assets and liabilities. Under this method, deferred tax assets are recognized for deductible temporary differences, and operating loss and tax credit carryforwards. Deferred tax liabilities are recognized for taxable temporary differences. Deferred tax assets are reduced by a valuation allowance when, in the opinion of management, it is more likely than not that some portion or all of the deferred tax assets will not be realized. The impact of tax rate changes on deferred tax assets and liabilities is recognized in the year that the change is enacted.
BROADWIND ENERGY, INC. AND SUBSIDIARIES
NOTES TO CONSOLIDATED FINANCIAL STATEMENTS (Continued)
December 31, 2010, 2009, and 2008
(in thousands, except share and per share data)
15. INCOME TAXES (Continued)
The provision for income taxes for the years ended December 31, 2011, 2010 2009 and 20082009 consists of the following:
| | | For the Years Ended December 31, | For the Years Ended December 31, | ||||||||||||||||||
|---|---|---|---|---|---|---|---|---|---|---|---|---|---|---|---|---|---|---|---|---|---|
| | | 2010 | 2009 | 2008 | 2011 | 2010 | 2009 | ||||||||||||||
Current provision | Current provision | ||||||||||||||||||||
Federal | $ | — | $ | — | $ | — | |||||||||||||||
Foreign | 5 | 4 | — | ||||||||||||||||||
State | 63 | 62 | (37 | ) | |||||||||||||||||
Federal | $ | — | $ | — | $ | — | |||||||||||||||
Foreign | 4 | — | — | ||||||||||||||||||
State | 62 | (37 | ) | 554 | |||||||||||||||||
Total current provision | 66 | (37 | ) | 554 | |||||||||||||||||
Total current provision | 68 | 66 | (37 | ) | |||||||||||||||||
Deferred credit | Deferred credit | ||||||||||||||||||||
Federal | (9,149 | ) | (23,871 | ) | (38,143 | ) | |||||||||||||||
State | (1,222 | ) | (6,076 | ) | (5,612 | ) | |||||||||||||||
Federal | (23,871 | ) | (38,143 | ) | (7,666 | ) | |||||||||||||||
State | (6,076 | ) | (5,612 | ) | (410 | ) | |||||||||||||||
Total deferred credit | (29,947 | ) | (43,755 | ) | (8,076 | ) | |||||||||||||||
Total deferred credit | (10,371 | ) | (29,947 | ) | (43,755 | ) | |||||||||||||||
Increase in deferred tax valuation allowance | Increase in deferred tax valuation allowance | 29,721 | 42,845 | 8,618 | 10,371 | 29,721 | 42,845 | ||||||||||||||
Total (benefit) provision for income taxes | $ | (160 | ) | $ | (947 | ) | $ | 1,096 | |||||||||||||
Total provision (benefit) for income taxes | $ | 68 | $ | (160 | ) | $ | (947 | ) | |||||||||||||
The increase in the deferred tax valuation allowance was $10,371, $29,721 $42,845, and $8,618$42,845 for the years ended December 31, 2011, 2010 2009 and 2008,2009, respectively. The change in the deferred tax valuation allowance in 20102011 was the result of an increase to the deferred tax assets in connection with the impairment of goodwill and intangible assets, andpertaining to additional federal and state net operating losses. The change in the deferred tax valuation allowance in 20092010 was the result of a significant increase to deferred tax assets in connection with the impairment of goodwill and intangible assets, and additional federal and state net operating losses.
BROADWIND ENERGY, INC. AND SUBSIDIARIES
NOTES TO CONSOLIDATED FINANCIAL STATEMENTS (Continued)
December 31, 2011, 2010, 2009, and 20082009
(in thousands, except share and per share data)
15.14. INCOME TAXES (Continued)
The tax effects of the temporary differences and net operating losses that give rise to significant portions of deferred tax assets and liabilities are as follows:
| | | As of December 31, | As of December 31, | ||||||||||||
|---|---|---|---|---|---|---|---|---|---|---|---|---|---|---|---|
| | | 2010 | 2009 | 2011 | 2010 | ||||||||||
Current deferred income tax assets: | Current deferred income tax assets: | ||||||||||||||
Accrual and reserves | $ | 2,598 | $ | 2,573 | |||||||||||
Accrual and reserves | $ | 3,526 | $ | 2,598 | |||||||||||
Total current deferred tax assets | Total current deferred tax assets | 2,598 | 2,573 | 3,526 | 2,598 | ||||||||||
Valuation allowance | Valuation allowance | (2,598 | ) | (2,573 | ) | (3,526 | ) | (2,598 | ) | ||||||
Current deferred tax assets, net of valuation allowance | Current deferred tax assets, net of valuation allowance | — | — | — | — | ||||||||||
Noncurrent deferred income tax assets: | Noncurrent deferred income tax assets: | ||||||||||||||
Net operating loss carryforwards | $ | 45,387 | $ | 30,900 | |||||||||||
Intangible assets | 40,248 | 29,296 | |||||||||||||
Other | 100 | 735 | |||||||||||||
Net operating loss carryforwards | $ | 55,397 | $ | 45,387 | |||||||||||
Intangible assets | 36,570 | 40,248 | |||||||||||||
Other | 110 | 100 | |||||||||||||
Total noncurrent deferred tax assets | Total noncurrent deferred tax assets | 85,735 | 60,931 | 92,077 | 85,735 | ||||||||||
Valuation allowance | Valuation allowance | (80,619 | ) | (47,704 | ) | (88,165 | ) | (80,619 | ) | ||||||
Noncurrent deferred tax assets, net of valuation allowance | Noncurrent deferred tax assets, net of valuation allowance | 5,116 | 13,227 | 3,912 | 5,116 | ||||||||||
Noncurrent deferred income tax liabilities: | Noncurrent deferred income tax liabilities: | ||||||||||||||
Fixed assets | $ | (5,116 | ) | $ | (13,630 | ) | |||||||||
Intangible assets | — | — | |||||||||||||
Fixed assets | $ | (3,912 | ) | $ | (5,116 | ) | |||||||||
Intangible assets | — | — | |||||||||||||
Total noncurrent deferred tax liabilities | Total noncurrent deferred tax liabilities | (5,116 | ) | (13,630 | ) | (3,912 | ) | (5,116 | ) | ||||||
Net deferred income tax liability | Net deferred income tax liability | $ | — | $ | (403 | ) | $ | — | $ | — | |||||
The Company has indefinite long-lived intangible assets consistingValuation allowances of goodwill, which are not amortized$91,691 and $83,217 have been provided for financial reporting purposes. However, the expense related to the amortization of these assets is tax deductible, and therefore the assets are amortized for income tax purposes. As a result, deferred income tax expenseassets for which realization is uncertain as of December 31, 2011 and deferred income tax liabilities arise as a result2010, respectively. A reconciliation of the tax-deductibility of these indefinite long-lived intangible assets. The resulting deferred tax liability, which is anticipated to continue to increase over time, has an indefinite life, resulting in what is referred to as a "naked tax credit." This deferred tax liability would remain on our consolidated balance sheets indefinitely unless there is an impairmentbeginning and ending amounts of the related assets for financial reporting purposes, or the businesses to which the assets relate are to be disposed of.valuation was as follows:
Valuation allowance as of December 31, 2010 | $ | (83,217 | ) | |
Gross increase for current year activity | (8,474 | ) | ||
Valuation allowance as of December 31, 2011 | $ | (91,691 | ) | |
As of December 31, 2010,2011, the Company has fully impaired all indefinite long-lived intangible assets. Therefore,had federal net operating loss carryforwards of approximately $136,189 expiring in various years through 2031. The majority of the net operating loss carry forwards will expire in 2028, 2029, 2030 and 2031.
As of December 31, 2011, the Company no longer recognizes any deferred tax liabilities arisinghad unapportioned state net operating losses in the aggregate of approximately $136,189 expiring in various years from 2021 through 2031 based upon various net operating loss periods as designated by the amortization of these items.different taxing jurisdictions.
BROADWIND ENERGY, INC. AND SUBSIDIARIES
NOTES TO CONSOLIDATED FINANCIAL STATEMENTS (Continued)
December 31, 2011, 2010, 2009, and 20082009
(in thousands, except share and per share data)
15.14. INCOME TAXES (Continued)
Valuation allowances of $83,217 and $50,277 have been provided for deferred income tax assets for which realization is uncertain as of December 31, 2010 and 2009, respectively. A reconciliation of the beginning and ending amounts of the valuation was as follows:
Valuation allowance as of December 31, 2009 | $ | (50,277 | ) | |
Gross increase for current year activity | (32,940 | ) | ||
Valuation allowance as of December 31, 2010 | $ | (83,217 | ) | |
As of December 31, 2010, the Company had federal net operating loss carryforwards of approximately $112,292 expiring in various years through 2030. The majority of the net operating loss carry forwards will expire in 2028, 2029, and 2030.
As of December 31, 2010, the Company had unapportioned state net operating losses in the aggregate of approximately $112,292 expiring in various years from 2021 through 2030 based upon various net operating loss periods as designated by the different taxing jurisdictions.
The reconciliation of the tax (benefit) provision computed at the statutory rate to the effective tax rate is as follows:
| | For the Year Ended December 31, | For the Year Ended December 31, | ||||||||||||||||||
|---|---|---|---|---|---|---|---|---|---|---|---|---|---|---|---|---|---|---|---|---|
| | 2010 | 2009 | 2008 | 2011 | 2010 | 2009 | ||||||||||||||
Statutory U.S. federal income tax rate | 35.0 | % | 35.0 | % | 35.0 | % | 35.0 | % | 35.0 | % | 35.0 | % | ||||||||
State and local income taxes, net of federal income tax benefit | 3.2 | 3.4 | (0.4 | ) | 5.0 | 3.2 | 3.4 | |||||||||||||
Permanent differences | (0.5 | ) | (0.3 | ) | (5.0 | ) | (1.5 | ) | (0.5 | ) | (0.3 | ) | ||||||||
Change in valuation allowance | (37.5 | ) | (37.4 | ) | (34.7 | ) | (38.7 | ) | (37.5 | ) | (37.4 | ) | ||||||||
FIN48 changes | — | (0.1 | ) | — | ||||||||||||||||
Change in uncertain tax positions | (0.1 | ) | — | (0.1 | ) | |||||||||||||||
Other | 0.1 | 0.3 | 0.5 | — | 0.1 | 0.3 | ||||||||||||||
Effective income tax rate | 0.3 | % | 0.9 | % | (4.6 | )% | (0.3 | )% | 0.3 | % | 0.9 | % | ||||||||
The Company accounts for the uncertainty in income taxes by prescribing a minimum recognition threshold for a tax position taken, or expected to be taken, in a tax return that is required to be met before being recognized in the financial statements. The changes in the Company's uncertain income tax positions for the years ended December 31, 2011 and 2010 consisted of the following:
| | For the Year Ended December 31, | ||||||
|---|---|---|---|---|---|---|---|
| | 2011 | 2010 | |||||
Beginning balance | $ | 382 | $ | 349 | |||
Tax positions related to current year: | |||||||
Additions | — | — | |||||
Reductions | — | — | |||||
| — | — | ||||||
Tax positions related to prior years: | |||||||
Additions | 35 | 33 | |||||
Reductions | — | — | |||||
Settlements | — | — | |||||
Lapses in statutes of limitations | — | — | |||||
Additions from current year acquisitions | — | — | |||||
| 35 | 33 | ||||||
Ending balance | $ | 417 | $ | 382 | |||
The amount of unrecognized tax benefits at December 31, 2011 that would affect the effective tax rate if the tax benefits were recognized was $417.
BROADWIND ENERGY, INC. AND SUBSIDIARIES
NOTES TO CONSOLIDATED FINANCIAL STATEMENTS (Continued)
December 31, 2011, 2010, 2009, and 20082009
(in thousands, except share and per share data)
15.14. INCOME TAXES (Continued)
before being recognized in the financial statements. The changes in the Company's uncertain income tax positions for the years ended December 31, 2010 and 2009 consisted of the following:
| | For the Year Ended December 31, | |||||||
|---|---|---|---|---|---|---|---|---|
| | 2010 | 2009 | ||||||
Beginning balance | $ | 349 | $ | 193 | ||||
Tax positions related to current year: | ||||||||
Additions | — | — | ||||||
Reductions | — | — | ||||||
| — | — | |||||||
Tax positions related to prior years: | ||||||||
Additions | 33 | 196 | ||||||
Reductions | — | — | ||||||
Settlements | — | (40 | ) | |||||
Lapses in statutes of limitations | — | — | ||||||
Additions from current year acquisitions | — | — | ||||||
| 33 | 156 | |||||||
Ending balance | $ | 382 | $ | 349 | ||||
It is the Company's policy to include interest and penalties in tax expense. During the years ended December 31, 20102011 and 2009,2010, the Company recognized and accrued approximately $32$35 and $10,$32, respectively, of interest and penalties.
The Company files income tax returns in the U.S. federal and state jurisdictions. As of December 31, 2010,2011, open tax years in the federal and some state jurisdictions date back to 1996 due to the taxing authorities' ability to adjust operating loss carryforwards. No changesDuring 2011, the Company closed an audit initiated by the Internal Revenue Service of its federal tax returns for the tax years ended December 31, 2008 and 2009. Although these periods have been audited, they continue to remain open until all net operating losses generated in settledthose tax years have occurred through December 31, 2010.been utilized or expire.
The Company does not anticipate there will be a material change in the total amount of unrecognized tax benefits within the next 12 months. However, Section 382 of the Internal Revenue Code of 1986, as amended (the "IRC"), generally imposes an annual limitation on the amount of net operating loss carryforwards and associated built-in losses that may be used to offset taxable income when a corporation has undergone certain changes in stock ownership. The Company's ability to utilize net operating loss carryforwards and built-in losses may be limited, under this section or otherwise, by the Company's issuance of common stock or by other changes in stock ownership. Upon completion of the Company's analysis of IRC Section 382, the Company has determined that aggregate changes in stock ownership have triggered an annual limitation of net operating loss carryforwards and built-in losses available for utilization. Although this event limits the amount of pre-ownership change date net operating loss and built-in losses the Company can utilize annually, it would not preclude the Company from fully utilizing its current carryforwards prior to their expiration. To the extent the Company's use of net operating loss carryforwards and associated built-in losses is currently under audit for its federalsignificantly limited in the future due to additional changes in stock ownership, the Company's income could be subject to U.S. corporate income tax returns for periods ended December 31, 2008earlier than it would if the Company were able to use net operating loss carryforwards and 2009. The Company believes that it has appropriate support forbuilt-in losses without such annual limitation, which could result in lower profits and the positions taken on its tax returns and its annual tax provision includes amounts sufficient to pay any assessments. Nonetheless, the amounts ultimately paid, if any, may differ significantlyloss of benefits from the amounts currently accrued.these attributes.
16.15. STOCKHOLDERS' EQUITY
On JanuarySeptember 21, 2010,2011, the Company completed a public offering of its common stock, par value $0.001 per share, at an offering price of $5.75$0.40 per share. In the offering, the Company sold 10,000,00032,500,000 newly issued shares of its common stock for approximately $54,625$12,155 in proceeds, after deducting underwriting discounts, but before deducting other offering related costs. In connection with the
BROADWIND ENERGY, INC. AND SUBSIDIARIES
NOTES TO CONSOLIDATED FINANCIAL STATEMENTS (Continued)
December 31, 2010, 2009, and 2008
(in thousands, except share and per share data)
16. STOCKHOLDERS' EQUITY (Continued)
offering, the Company incurred $1,278$458 in costs associated with professional and other offering related expenses, which have been netted against the proceeds received in additional paid-in capital in the Company's consolidated balance sheet as of December 31, 2010.2011.
17. RELATED PARTY TRANSACTIONS16. SHARE-BASED COMPENSATION
Overview of Share-Based Compensation Plan
On May 26, 2009, the Company entered into the Settlement Agreement with the Selling Shareholders, including J. Cameron Drecoll, who served as the Company's Chief Executive Officer and a member of the Company's Board of Directors until December 1, 2010. The Settlement Agreement related to the post-closing escrow established in connection with the Company's acquisition of Brad Foote. The post-closing escrow fund was created to provide a source of funds for claims for indemnification made by the Company and certain other indemnified persons against the Selling Shareholders under the Stock Purchase Agreement executed in connection with the Company's acquisition of Brad Foote. On October 19, 2007, the date the Company consummated its acquisition of Brad Foote, the Company deposited a portion of its total purchase price for Brad Foote (in the amount of $5,000 in cash and 2,500,000 shares of its common stock) into the escrow fund. The consideration deposited into the escrow fund was to be held by an escrow agent until five business days after the eighteen month anniversary of the Brad Foote acquisition. Under the terms of the Settlement Agreement, the Company received the entire cash escrow balance of $5,000 plus accrued interest income of $82, which was recorded as other income. In exchange, the Company agreed to cause the release to the Selling Shareholders of 2,500,000 shares of the Company's common stock held under the escrow agreement in proportion to their ownership interest in Brad Foote prior to its acquisition by the Company. In addition, the Company agreed to make a cash payment of $30 to one Selling Shareholder and issued the Selling Shareholder Notes to the three Selling Shareholders in the aggregate principal amount of $3,000. The cash payment and Selling Shareholder Notes were recorded as an increase to the purchase price through goodwill as these amounts were calculated in accordance with the purchase agreement. The Company also paid to Mr. Drecoll certain tax refunds in the aggregate amount of approximately $2,212 related to our acquisition of Brad Footegrants incentive stock options and tax payments in respect of the period prior to the acquisition to which the Company believes the Selling Shareholders are entitled (or to which the Company is entitled on their behalf). The Selling Shareholder Notes mature on May 28, 2012 and bear interest at a rate of 7% per annum, with interest payments due quarterly. The Selling Shareholder Note issued to Mr. Drecoll in the principal amount of $2,320 andother equity awards pursuant to the terms of the Settlement Agreement is deemedAmended and Restated Broadwind Energy, Inc. 2007 Equity Incentive Plan (the "EIP"), which was approved by the Company to be a related party transaction. As of December 31, 2010, principal of $3,000 and accrued interest of $53 was outstanding under the Selling Shareholder Notes. The Company has accounted for the Selling Shareholder Notes as long-term debt in our consolidated balance sheets as of December 31, 2010.
During the years ended December 31, 2010, 2009 and 2008, interest expense of $210, $128 and $1,226, respectively, was incurred on shareholder and related party notes.
BROADWIND ENERGY, INC. AND SUBSIDIARIES
NOTES TO CONSOLIDATED FINANCIAL STATEMENTS (Continued)
December 31, 2011, 2010, 2009, and 20082009
(in thousands, except share and per share data)
18.16. SHARE-BASED COMPENSATION (Continued)
Overview of Share-Based Compensation Plan
The Company grants incentive stock options and other equity awards pursuant to the Broadwind Energy, Inc. 2007 Equity Incentive Plan (the "EIP"), which was approved by the Company's Board of Directors in October 2007 and by the Company's stockholders in June 2008. The EIP was subsequentlyhas been amended in August 2008 by the Company's Board of Directors to include certain non-material amendments to clarify the terms and conditions of restricted stock awards and to provide that the administrator ofperiodically since its original approval. Specifically, the EIP has the authority to authorize future amendments to the EIP. The EIP was further amended by the Company's stockholders in June 2009 to increase the number of shares of common stock authorized for issuance under the EIP.EIP, and the EIP was further amended and restated in March 2011 by the Company's Board of Directors to limit share recycling under the EIP, to include a minimum vesting period for time-vesting restricted stock awards and restricted stock units and to add a clawback provision. As amended, the EIP reserves 5,500,000 shares of ourthe Company's common stock for grants to officers, directors, employees, consultants and advisors upon whose efforts the success of the Company and its affiliates will depend to a large degree. As of December 31, 2010,2011, the Company had reserved 917,1931,275,115 shares for the exercise of stock options outstanding, 712,9023,646,299 shares for restricted stock unit awards outstanding and 3,514,04062,119 additional shares for future stock awards under the EIP. As of December 31, 2010, 355,8652011, 516,467 shares of common stock reserved for stock options and restricted stock unit awards under the EIP have been issued in the form of common stock.
Stock Options. The exercise price of stock options granted under the EIP is equal to the closing price of ourthe Company's common stock on the date of grant. Stock options generally become exercisable on the anniversary of the grant date, with vesting terms that may range from one to five years from the date of grant. Additionally, stock options expire ten years after the date of grant. If a plan participant's employment is terminated during the vesting period, he or she forfeits the right to unvested stock option awards. The fair value of stock options granted is expensed ratably over their vesting term.
Restricted Stock. The granting of restricted stock units is provided for under the EIP. Restricted stock units generally vest on the anniversary of the grant date, with vesting terms that range from immediate vesting to five years from the date of grant. The fair value of each unit granted is equal to the closing price of ourthe Company's common stock on the date of grant and is expensed ratably over the vesting term of the restricted stock award. If a plan participant's employment is terminated during the vesting period, he or she forfeits the right to any unvested portion of the restricted stock units.
BROADWIND ENERGY, INC. AND SUBSIDIARIES
NOTES TO CONSOLIDATED FINANCIAL STATEMENTS (Continued)
December 31, 2011, 2010, 2009, and 20082009
(in thousands, except share and per share data)
18.16. SHARE-BASED COMPENSATION (Continued)
Stock option activity during the years ended December 31, 2011, 2010 2009 and 20082009 under the EIP was as follows:
| | Options | Weighted Average Exercise Price | Weighted Average Remaining Contractual Term | Aggregate Intrinsic Value (in thousands) | |||||||||||||||||||||
|---|---|---|---|---|---|---|---|---|---|---|---|---|---|---|---|---|---|---|---|---|---|---|---|---|---|
Outstanding as of December 31, 2007 | 950,000 | $ | 7.92 | ||||||||||||||||||||||
Granted | 1,165,000 | $ | 14.59 | ||||||||||||||||||||||
Exercised | — | — | |||||||||||||||||||||||
Forfeited | (85,000 | ) | $ | 11.38 | |||||||||||||||||||||
Cancelled | — | — | |||||||||||||||||||||||
| Options | Weighted Average Exercise Price | Weighted Average Remaining Contractual Term | Aggregate Intrinsic Value (in thousands) | ||||||||||||||||||||||
Outstanding as of December 31, 2008 | Outstanding as of December 31, 2008 | 2,030,000 | $ | 11.60 | 2,030,000 | $ | 11.60 | ||||||||||||||||||
Granted | 209,193 | $ | 7.66 | ||||||||||||||||||||||
Exercised | (91,940 | ) | $ | 7.34 | |||||||||||||||||||||
Forfeited | (723,257 | ) | $ | 12.05 | |||||||||||||||||||||
Expired | (21,833 | ) | $ | 10.23 | |||||||||||||||||||||
Granted | 209,193 | 7.66 | |||||||||||||||||||||||
Exercised | (91,940 | ) | 7.34 | ||||||||||||||||||||||
Forfeited | (723,257 | ) | 12.05 | ||||||||||||||||||||||
Cancelled | (21,833 | ) | 10.23 | ||||||||||||||||||||||
Outstanding as of December 31, 2009 | Outstanding as of December 31, 2009 | 1,402,163 | $ | 11.08 | 1,402,163 | $ | 11.08 | ||||||||||||||||||
Granted | 464,828 | $ | 3.65 | ||||||||||||||||||||||
Exercised | — | $ | 0.00 | ||||||||||||||||||||||
Forfeited | (647,766 | ) | $ | 9.37 | |||||||||||||||||||||
Expired | (302,032 | ) | $ | 10.37 | |||||||||||||||||||||
Granted | 464,828 | 3.65 | |||||||||||||||||||||||
Exercised | — | — | |||||||||||||||||||||||
Forfeited | (647,766 | ) | 9.37 | ||||||||||||||||||||||
Cancelled | (302,032 | ) | 10.37 | ||||||||||||||||||||||
Outstanding as of December 31, 2010 | Outstanding as of December 31, 2010 | 917,193 | $ | 8.75 | 8.4 years | $ | 119 | 917,193 | $ | 8.75 | |||||||||||||||
Exercisable as of December 31, 2010 | 223,798 | $ | 12.51 | 7.5 years | $ | 0 | |||||||||||||||||||
Granted | 447,255 | 1.36 | |||||||||||||||||||||||
Exercised | — | — | |||||||||||||||||||||||
Forfeited | (63,500 | ) | 9.96 | ||||||||||||||||||||||
Cancelled | (25,833 | ) | 13.26 | ||||||||||||||||||||||
Outstanding as of December 31, 2011 | 1,275,115 | $ | 6.01 | 8.08 years | $ | — | |||||||||||||||||||
Exercisable as of December 31, 2011 | 388,296 | $ | 10.30 | 7.02 years | $ | — | |||||||||||||||||||
The following table summarizes information with respect to all outstanding and exercisable stock options under the EIP as of December 31, 2010:2011:
| | Options Outstanding | Options Exercisable | Options Outstanding | Options Exercisable | ||||||||||||||||||||||||||
|---|---|---|---|---|---|---|---|---|---|---|---|---|---|---|---|---|---|---|---|---|---|---|---|---|---|---|---|---|---|---|
Exercise Price Ranges | Number of options outstanding | Weighted Average Exercise Price | Weighted Average Remaining Contractual Term | Number Exercisable | Weighted Average Exercise Price | Number of options outstanding | Weighted Average Exercise Price | Weighted Average Remaining Contractual Term | Number Exercisable | Weighted Average Exercise Price | ||||||||||||||||||||
$1.77 - $7.78 | 437,693 | $ | 3.85 | 9.4 years | 14,414 | $ | 7.78 | |||||||||||||||||||||||
$1.35 - $7.78 | 855,315 | $ | 2.47 | 8.8 years | 114,796 | $ | 4.15 | |||||||||||||||||||||||
$8.00 - $12.85 | 294,500 | 10.21 | 7.5 years | 135,384 | 9.99 | 259,800 | 10.25 | 6.5 years | 177,500 | 10.11 | ||||||||||||||||||||
$17.80 - $18.20 | 185,000 | 18.03 | 7.6 years | 74,000 | 18.03 | 160,000 | 18.00 | 6.6 years | 96,000 | 18.00 | ||||||||||||||||||||
| 917,193 | $ | 8.75 | 8.4 years | 223,798 | $ | 12.51 | 1,275,115 | $ | 4.02 | 388,296 | $ | 6.00 | ||||||||||||||||||
BROADWIND ENERGY, INC. AND SUBSIDIARIES
NOTES TO CONSOLIDATED FINANCIAL STATEMENTS (Continued)
December 31, 2011, 2010, 2009, and 20082009
(in thousands, except share and per share data)
18.16. SHARE-BASED COMPENSATION (Continued)
The following table summarizes information with respect to outstanding restricted stock units as of December 31, 2011, 2010 2009 and 2008:2009:
| | Number of Shares | Weighted Average Grant-Date Fair Value Per Share | |||||||||||||
|---|---|---|---|---|---|---|---|---|---|---|---|---|---|---|---|
Outstanding as of December 31, 2007 | 15,000 | $ | 10.90 | ||||||||||||
Granted | 120,000 | $ | 10.70 | ||||||||||||
Vested | (7,500 | ) | $ | 10.90 | |||||||||||
Forfeited | — | — | |||||||||||||
| Number of Shares | Weighted Average Grant-Date Fair Value Per Share | ||||||||||||||
Outstanding as of December 31, 2008 | Outstanding as of December 31, 2008 | 127,500 | $ | 10.71 | 127,500 | $ | 10.71 | ||||||||
Granted | 367,215 | $ | 6.86 | ||||||||||||
Vested | (176,663 | ) | $ | 5.79 | |||||||||||
Forfeited | (38,901 | ) | $ | 9.63 | |||||||||||
Granted | 367,215 | $ | 6.86 | ||||||||||||
Vested | (176,663 | ) | $ | 5.79 | |||||||||||
Forfeited | (38,901 | ) | $ | 9.63 | |||||||||||
Outstanding as of December 31, 2009 | Outstanding as of December 31, 2009 | 279,151 | $ | 8.76 | 279,151 | $ | 8.76 | ||||||||
Granted | 709,373 | $ | 3.12 | ||||||||||||
Vested | (143,485 | ) | $ | 5.71 | |||||||||||
Forfeited | (132,137 | ) | $ | 6.95 | |||||||||||
Granted | 709,373 | $ | 3.12 | ||||||||||||
Vested | (143,485 | ) | $ | 5.71 | |||||||||||
Forfeited | (132,137 | ) | $ | 6.95 | |||||||||||
Outstanding as of December 31, 2010 | Outstanding as of December 31, 2010 | 712,902 | $ | 4.09 | 712,902 | $ | 4.09 | ||||||||
Granted | 3,211,744 | $ | 0.95 | ||||||||||||
Vested | (187,704 | ) | $ | 4.09 | |||||||||||
Forfeited | (90,643 | ) | $ | 4.58 | |||||||||||
Outstanding as of December 31, 2011 | 3,646,299 | $ | 1.32 | ||||||||||||
The fair value of each stock option award is estimated on the date of grant using the Black-Scholes option pricing model. OurThe Company's determination of the fair value of each stock option is affected by ourits stock price on the date of grant, as well as assumptions regarding a number of highly complex and subjective variables. These variables include, but are not limited to, ourthe Company's expected stock price volatility over the expected life of the awards and actual and projected stock option exercise behavior. The weighted average fair value per share of stock option awards granted during the years ended December 31, 2011, 2010 2009 and 2008,2009, and assumptions used to value stock options, are as follows:
| | For the Years Ended December 31, | For the Years Ended December 31, | ||||||||||||||||||
|---|---|---|---|---|---|---|---|---|---|---|---|---|---|---|---|---|---|---|---|---|
| | 2010 | 2009 | 2008 | 2011 | 2010 | 2009 | ||||||||||||||
Dividend yield | — | — | — | — | — | — | ||||||||||||||
Risk-free interest rate | 2.5 | % | 2.6 | % | 3.1 | % | 2.6 | % | 2.5 | % | 2.6 | % | ||||||||
Weighted average volatility | 91.5 | % | 85.0 | % | 65.5 | % | 96.1 | % | 91.5 | % | 85.0 | % | ||||||||
Expected life (in years) | 6.3 | 6.5 | 6.5 | 6.3 | 6.3 | 6.5 | ||||||||||||||
Weighted average grant date fair value per share of options granted | $ | 2.75 | $ | 5.64 | $ | 7.18 | $ | 1.07 | $ | 2.75 | $ | 5.64 | ||||||||
Dividend yield is zero as the Company currently does not pay a dividend.
Risk-free rate is based on the implied yield currently available on U.S. Treasury zero coupon issues with a remaining term equal to the expected life of the award.
BROADWIND ENERGY, INC. AND SUBSIDIARIES
NOTES TO CONSOLIDATED FINANCIAL STATEMENTS (Continued)
December 31, 2011, 2010, 2009, and 20082009
(in thousands, except share and per share data)
18.16. SHARE-BASED COMPENSATION (Continued)
During the years ended December 31, 20102011 and 2009,2010, the Company utilized a standard volatility assumption of 91.5%96.1% and 85.0%91.5%, respectively, for estimating the fair value of stock options awarded based on comparable volatility averages for the energy related sector.
The expected life of each stock option award granted is derived using the "simplified method" for estimating the expected term of a "vanilla-option" in accordance with Staff Accounting Bulletin ("SAB") No. 107, "Share-Based Payment," as amended by SAB No. 110, "Share-Based Payment." The fair value of each unit of restricted stock is equal to the fair market value of the Company's common stock as of the date of grant.
During the years ended December 31, 20102011 and 2009,2010, the Company utilized a forfeiture rate of 25% and 10%, respectively, for estimating the forfeitures of stock options granted. During the second quarter of 2010, the Company revised its forfeiture rate to 25% based upon the Company's historical forfeiture rates. The revision to the Company's forfeiture was applied to stock options and restricted stock units outstanding as of June 30, 2010 and on a prospective basis.
The following table summarizes share-based compensation expense included in ourthe Company's consolidated statements of operations for the years ended December 31, 2011, 2010 2009 and 20082009 as follows:
| | For the Years Ended December 31, | |||||||||
|---|---|---|---|---|---|---|---|---|---|---|
| | 2011 | 2010 | 2009 | |||||||
Share-based compensation expense: | ||||||||||
Selling, general and administrative | $ | 1,906 | $ | 1,668 | $ | 2,805 | ||||
Income tax benefit(1) | — | — | — | |||||||
Net effect of share-based compensation expense on net loss | $ | 1,906 | $ | 1,668 | $ | 2,805 | ||||
Reduction in earnings per share: | ||||||||||
Basic and diluted earnings per share(2) | $ | 0.02 | $ | 0.02 | $ | 0.03 | ||||
| | For the Years Ended December 31, | |||||||||||
|---|---|---|---|---|---|---|---|---|---|---|---|---|
| | 2010 | 2009 | 2008 | |||||||||
Share-based compensation expense: | ||||||||||||
Selling, general and administrative | $ | 1,668 | $ | 2,805 | $ | 1,999 | ||||||
Income tax benefit(1) | — | — | — | |||||||||
Net effect of share-based compensation expense on net loss | $ | 1,668 | $ | 2,805 | $ | 1,999 | ||||||
Reduction in earnings per share: | ||||||||||||
Basic and diluted earnings per share(2) | $ | 0.02 | $ | 0.03 | $ | 0.02 | ||||||
As of December 31, 2010,2011, the Company estimates that pre-tax compensation expense for all unvested share-based awards, including both stock options and restricted stock units, in the amount of approximately $4,093$3,539 will be recognized through the year 2015. The Company expects to satisfy the exercise of stock options and future distribution of shares of restricted stock by issuing new shares of common stock.
BROADWIND ENERGY, INC. AND SUBSIDIARIES
NOTES TO CONSOLIDATED FINANCIAL STATEMENTS (Continued)
December 31, 2011, 2010, 2009, and 20082009
(in thousands, except share and per share data)
19.17. SEGMENT REPORTING
In December 2009,The Company is organized into reporting segments based on the Company revised its reporting segment presentation into four reportable operating segments: Towers, Gearing, Technicalnature of the products and Engineering Services,services offered and Logistics. In December of 2010,business activities from which it earns revenues and incurs expenses for which discrete financial information is available and regularly reviewed by the Company's Board of Directors approved a plan to divest its Logistics business segment; consequently, this business unit is now reported as a Discontinued Operation and the Company has revised its segment presentation to include three reportablechief operating segments: Towers, Gearing, and Services (previously Technical and Engineering Services). All current and prior period financial results have been revised to reflect these changes.
decision maker. The Company's segments and their product and service offerings are summarized below:
Towers and Weldments
The Company manufactures towers for wind turbines, specifically the large and heavier wind towers that are designed for 2 MW and larger wind turbines. Production facilities, located in Manitowoc, Wisconsin and Abilene, Texas, are situated in close proximity to the primary U.S. wind resource regions.domestic energy and equipment manufacturing hubs. The two facilities have a combined annual tower production capacity of approximately 500 towers, sufficient to support turbines generating more than 1,2001200 MW of power. This product segment also encompasses the manufacture of specialty fabrications and heavyspecialty weldments for wind energymining and other industrial customers.
Gearing
The Company manufactures highengineers, builds and remanufactures precision gears and gearing systems for wind, turbinesoil and custom-engineered gearing systems and gearboxes for energy,gas, mining and other industrial customers.applications. The Company uses an integrated manufacturing process, which includes machining and finishing processes in Cicero, Illinois, and heat treatment in Neville Island, Pennsylvania and a finishing process in the Cicero factory.Pennsylvania.
Services
The Company offers technical and precision repair and engineeringa comprehensive range of services, primarily to developers and operators of wind farms and manufacturers of wind turbines. Technical services offerings include construction support, and operations and maintenance services for wind farm developers and operators. Precision repairThe Company specializes in non-routine maintenance services for both kilowatt and engineeringmegawatt turbines. The Company also offers comprehensive field services include repairto the wind industry. The Company is increasingly focusing its efforts on the identification and/or development of product and refurbishment of complex systemsservice offerings which will improve the reliability and componentsefficiency of wind turbines, including control systems, drivetrains and blades.therefore enhance the economic benefits to its customers. The Company'sCompany provides wind services across the U.S., with primary service locations are in Illinois, California, South Dakota and Texas. During 2010,In February 2011, the Company approved an investment of approximately $7 million to develop aput into operation its dedicated drivetrain service center in Abilene, Texas, which is focused on servicing the growing installed base of MW wind turbines as they come off warranty. The drivetrain service center was dedicatedwarranty and put into operation in February 2011.to a limited extent, industrial gearboxes requiring precision repair and testing.
Corporate and Other
"Corporate and Other" is comprised of adjustments to reconcile segment results to consolidated results, which primarily includes corporate administrative expenses and intercompany eliminations.
BROADWIND ENERGY, INC. AND SUBSIDIARIES
NOTES TO CONSOLIDATED FINANCIAL STATEMENTS (Continued)
December 31, 2011, 2010, 2009, and 20082009
(in thousands, except share and per share data)
19.17. SEGMENT REPORTING (Continued)
The accounting policies of the reportable segments are the same as those referenced in Note 1, "Description of Business and Summary of Significant Accounting Policies" of these consolidated financial statements. Summary financial information by reportable segment is as follows:
| Revenues For the Years Ended | Operating (Loss) Profit For the Years Ended | |||||||||||||||||||||||||||||||||||||
|---|---|---|---|---|---|---|---|---|---|---|---|---|---|---|---|---|---|---|---|---|---|---|---|---|---|---|---|---|---|---|---|---|---|---|---|---|---|---|
| | Revenues For the Years Ended | Operating (Loss) Profit For the Years Ended | 2011 | 2010 | 2009 | 2011 | 2010 | 2009 | ||||||||||||||||||||||||||||||
Segments: | 2010 | 2009 | 2008 | 2010 | 2009 | 2008 | ||||||||||||||||||||||||||||||||
Towers | $ | 76,150 | $ | 93,316 | $ | 72,561 | $ | (11,436 | ) | $ | (499 | ) | $ | 5,813 | ||||||||||||||||||||||||
Towers and Weldments | $ | 116,926 | $ | 76,150 | $ | 93,316 | $ | 5,187 | $ | (11,436 | ) | $ | (499 | ) | ||||||||||||||||||||||||
Gearing | 48,996 | 64,518 | 104,553 | (13,678 | ) | (97,058 | ) | (6,614 | ) | 54,296 | 48,996 | 64,518 | (10,733 | ) | (13,678 | ) | (97,058 | ) | ||||||||||||||||||||
Services | 12,090 | 27,575 | 31,249 | (34,747 | ) | (610 | ) | (1,822 | ) | 16,291 | 12,090 | 27,575 | (5,247 | ) | (34,747 | ) | (610 | ) | ||||||||||||||||||||
Corporate and Other(1) | (340 | ) | (611 | ) | (1,014 | ) | (9,366 | ) | (14,086 | ) | (19,251 | ) | (1,659 | ) | (340 | ) | (611 | ) | (9,636 | ) | (9,366 | ) | (14,086 | ) | ||||||||||||||
| $ | 136,896 | $ | 184,798 | $ | 207,349 | $ | (69,227 | ) | $ | (112,253 | ) | $ | (21,874 | ) | $ | 185,854 | $ | 136,896 | $ | 184,798 | $ | (20,429 | ) | $ | (69,227 | ) | $ | (112,253 | ) | |||||||||
| | Depreciation and Amortization For the Years Ended | Capital Expenditures For the Years Ended | Depreciation and Amortization For the Years Ended | Capital Expenditures For the Years Ended | ||||||||||||||||||||||||||||||||||
|---|---|---|---|---|---|---|---|---|---|---|---|---|---|---|---|---|---|---|---|---|---|---|---|---|---|---|---|---|---|---|---|---|---|---|---|---|---|---|
| | 2010 | 2009 | 2008 | 2010 | 2009 | 2008 | 2011 | 2010 | 2009 | 2011 | 2010 | 2009 | ||||||||||||||||||||||||||
Segments: | ||||||||||||||||||||||||||||||||||||||
Towers | $ | 3,416 | $ | 3,393 | $ | 1,625 | $ | 2,113 | $ | 10,295 | $ | 47,524 | ||||||||||||||||||||||||||
Towers and Weldments | $ | 3,508 | $ | 3,416 | $ | 3,393 | $ | 526 | $ | 2,113 | $ | 10,295 | ||||||||||||||||||||||||||
Gearing | 9,970 | 15,929 | 15,340 | 1,398 | 262 | 26,566 | 9,922 | 9,970 | 15,929 | 287 | 1,398 | 262 | ||||||||||||||||||||||||||
Services | 2,909 | 3,250 | 3,024 | 3,283 | 485 | 3,267 | 937 | 2,909 | 3,250 | 3,829 | 3,283 | 485 | ||||||||||||||||||||||||||
Corporate and Other(1) | 168 | 124 | 101 | 99 | 229 | 1,735 | 167 | 168 | 124 | 66 | 99 | 229 | ||||||||||||||||||||||||||
| $ | 16,463 | $ | 22,696 | $ | 20,090 | $ | 6,893 | $ | 11,271 | $ | 79,092 | $ | 14,534 | $ | 16,463 | $ | 22,696 | $ | 4,708 | $ | 6,893 | $ | 11,271 | |||||||||||||||
| | Total Assets as of December 31, | ||||||
|---|---|---|---|---|---|---|---|
| | 2011 | 2010 | |||||
Segments: | |||||||
Towers and Weldments | $ | 69,235 | $ | 76,931 | |||
Gearing | 72,699 | 81,336 | |||||
Services | 16,743 | 10,480 | |||||
Assets held for sale | 8,052 | 6,847 | |||||
Corporate and Other(2) | 6,162 | 7,912 | |||||
| $ | 172,891 | $ | 183,506 | ||||
| | Total Assets as of December 31, | ||||||
|---|---|---|---|---|---|---|---|
| | 2010 | 2009 | |||||
Segments: | |||||||
Towers | $ | 76,931 | $ | 80,146 | |||
Gearing | 81,336 | 92,665 | |||||
Services | 10,480 | 36,417 | |||||
Assets held for sale | 6,847 | 19,997 | |||||
Corporate and Other(2) | 7,912 | 2,263 | |||||
| $ | 183,506 | $ | 231,488 | ||||
The Company generates revenues entirely from transactions completed in the U.S. and its long-lived assets are predominantly located in the U.S. During 2010, two customers each accounted for more than 10% of total net revenues. During the years ended December 31, 2010, 2009, and 2008, five customers accounted for 78%, 73% and 79%, respectively, of total net revenues.
BROADWIND ENERGY, INC. AND SUBSIDIARIES
NOTES TO CONSOLIDATED FINANCIAL STATEMENTS (Continued)
December 31, 2011, 2010, 2009, and 20082009
(in thousands, except share and per share data)
20.17. SEGMENT REPORTING (Continued)
The Company generates revenues entirely from transactions completed in the U.S. and its long-lived assets are all located in the U.S. All intercompany revenue is eliminated in consolidation. During 2011, two customers each accounted for more than 10% of total net revenues. During the years ended December 31, 2011, 2010, and 2009, five customers accounted for 76%, 78% and 73%, respectively, of total net revenues.
18. EMPLOYEE BENEFIT PLANS
Retirement Savings and Profit Sharing Plans
Prior to January 1, 2009, the Company and each of its business units had defined contribution or profit sharing 401(k) retirement savings plans with varying levels of contributions.
Effective January 1, 2009, the Company replaced all of its 401(k) retirement savings plans with one defined contribution 401(k) safe harbor plan covering substantially all of the Company's non-union employees. Under this plan, an eligible employee may elect to contribute a portion of salary on a pre-tax basis, subject to federal statutory limitations. The plan requires the Company to make basic matching contributions equal to 100% of the first 3% of the eligible participant's plan compensation contributed as elective deferral contributions and 50% of the next 2% of the eligible participant's plan compensation contributed as an elective deferral contribution. Under the plan, elective deferrals and basic company matching will be 100% vested at all times. EffectiveStarting in the fourth quarter of 2009 and for all subsequent Company matching contributions,through the first quarter of 2011, the Company began fundingfunded these contributions in shares of the Company's common stock in lieu of a cash contribution. ForStarting in the second quarter of 2011 and through December 31, 2011, the Company resumed funding 401(k) matching contributions in cash.
Consistent with the collective bargaining agreements in place at its two union locations, for the Company's union employees in Illinois, the Company continued its discretionary match in an amount up to 50% of each participant's first 4% of elective compensation contributed, perand for the collective bargaining agreement.
Effective January 1, 2010, based on the collective bargaining agreement with the Brad FooteCompany's union employees in Pennsylvania, the Company continued its discretionary match changedin an amount up to 100% of theeach participant's first 3% of the eligible participant's plan compensation contributed as elective deferral contributions and 50% of the next 2% of the eligible participant's planelective compensation contributed as an elective deferral contribution.contributed.
For the years ended December 31, 2011, 2010 2009 and 2008,2009, the Company recorded expense under these plans of approximately $636, $721$636 and $368,$721, respectively.
Deferred Compensation Plan
The Company maintains a deferred compensation plan for certain key employees and nonemployee directors, whereby certain wages earned, compensation for services rendered, and discretionary company-matching contributions may be deferred and deemed to be invested in the Company's common stock. Changes in the fair value of the plan liability are recorded as charges or credits to compensation expense. Compensation expense associated with the deferred compensation plan recorded during the years ended December 31, 2011, 2010, 2009, and 2008,2009, was ($154)45), $64($154) and ($90),$64, respectively. The fair value of the plan liability to the Company is included in accrued liabilities in ourthe Company's consolidated balance sheets. As of December 31, 20102011 and 2009,2010, the fair value of plan liability to the Company was $39 and $61, respectively.
BROADWIND ENERGY, INC. AND SUBSIDIARIES
NOTES TO CONSOLIDATED FINANCIAL STATEMENTS (Continued)
December 31, 2011, 2010, and $215, respectively.2009
(in thousands, except share and per share data)
18. EMPLOYEE BENEFIT PLANS (Continued)
In addition to the employee benefit plans described above, the Company participates in certain customary employee benefits plans, including those which provide health and life insurance benefits to employees.
19. NEW MARKETS TAX CREDIT TRANSACTION
On July 20, 2011, the Company received $2,280 in proceeds via a transaction involving tax credits linked to the Company's capital investment in its Abilene, Texas gearbox refurbishment facility (the "Gearbox Facility"). The transaction qualifies under the federal New Markets Tax Credit ("NMTC") program and included a gross loan from AMCREF Fund VII, LLC to Broadwind Services in the principal amount of $10,000, with a term of fifteen years and interest payable at the rate of 1.4% per annum, largely offset by a gross loan in the principal amount of $7,720 from the Company to COCRF Investor VIII, LLC, with a term of fifteen years and interest payable at the rate of 2.5% per annum.
The NMTC regulations permit taxpayers to claim credits against their federal income taxes for up to 39% of qualified investments in the equity of community development entities. The program could generate $3,900 in tax credits which the Company has made available under the structure by passing them through to Capital One, National Association ("Capital One"). Most of the proceeds have been applied to the Company's recent investment in the Gearbox Facility assets and operating costs, as permitted under this program; the December 31, 2011 consolidated balance sheet has $646 in cash classified as restricted cash related to this arrangement which has yet to be used under this program.
The Gearbox Facility must operate and be in compliance with various regulations and restrictions for the next seven years to comply with terms of the agreement, or the Company may be liable under its indemnification agreement with Capital One for the recapture of tax credits. The NMTC is subject to 100% recapture for a period of seven years as provided in the IRC. The Company does not anticipate any tax credit recapture events or that it will be required to make a payment to Capital One under the indemnification agreement.
The Capital One contribution has been included in the Company's consolidated balance sheet at December 31, 2011. This transaction includes a put/call provision whereby the Company may be obligated or entitled to repurchase Capital One's interest. Capital One may exercise an option to put its investment and receive $130 from the Company. If Capital One does not exercise its put option, the Company can exercise a call option at the then fair market value of the call. The Company believes that Capital One will exercise the put option in 2018 at the end of the recapture period. The Capital One contribution other than the amount allocated to the put obligation will be recognized as income only after the put/call is exercised and when Capital One has no ongoing interest. However, there is no legal obligation for Capital One to exercise the put, and the Company has attributed only an insignificant value to the put option included in this structure.
The Company has determined that two pass-through financing entities created under this structure are VIE's. The ongoing activities of the VIE's—collecting and remitting interest and fees and complying with NMTC requirements—were considered in the initial design of the transaction and are not expected to significantly affect economic performance throughout the life of the VIE's. Management also considered the contractual arrangements that obligate the Company to deliver tax
BROADWIND ENERGY, INC. AND SUBSIDIARIES
NOTES TO CONSOLIDATED FINANCIAL STATEMENTS (Continued)
December 31, 2011, 2010, 2009, and 20082009
(in thousands, except share and per share data)
19. NEW MARKETS TAX CREDIT TRANSACTION (Continued)
benefits and provide various other guarantees under the transaction structure, Capital One's lack of a material interest in the underlying economics of the project, and the fact that the Company is obligated to absorb losses of the VIE's. The Company has concluded that it is required to consolidate the VIEs because the Company has both (i) the power to direct those matters that most significantly impacted the activities of the VIE and (ii) the obligation to absorb losses or the right to receive benefits of the VIE.
The $262 of issue costs paid to third parties are recorded as an offset to the related loan, and are being amortized over the expected seven year term of the NMTC arrangement. Capital One's net contribution of $2,280 is included in Long Term Debt, Net of Current Maturities in the consolidated balance sheet. Incremental costs to maintain the structure during the compliance period will be recognized as they are incurred.
20. RESTRUCTURING
During the third quarter of 2011, the Company conducted a review of its business strategies and product plans based on the outlook for the economy at large, the forecast for the industries it serves, and its business environment. The Company concluded that its manufacturing footprint and fixed cost base are too large and expensive for its medium-term needs and has begun restructuring its facility capacity and its management structure to consolidate and increase the efficiencies of its operations.
The Company plans to reduce its facility footprint by approximately 30% through the sale and/or closure during the next fifteen months of facilities comprising a total of approximately 440,000 square feet. The Company believes the remaining locations will be sufficient to support its Towers and Weldments, Gearing, Services and general corporate and administrative activities, while allowing for growth for the next several years.
As part of this plan, in the third quarter of 2011, the Company determined that its tower manufacturing facility in Brandon, South Dakota should be sold, and as a result the Company has reclassified the land, building and fixtures valued at $8,000 from Property and Equipment to Assets Held for Sale. In addition, the related indebtedness associated with this facility of $4,833 has been reclassified from Long-Term Debt Net of Current Maturities and Current Maturities of Long-Term Debt to Liabilities Held for Sale. The Company expects that this sale will be completed in the next twelve months. The Company had previously recorded an impairment charge of $13,326 in the fourth quarter of 2010 to bring these assets to fair value; no further impairment charges were recorded in 2011.
Additional future restructuring plans were formally approved in the fourth quarter of 2011. The Company expects to incur a total of $13,600 of expenses to implement its restructuring plan. Of the total projected expenses, the Company anticipates $4,000 will consist of non-cash expenditures. The Company expects the remaining cash expenditures will be funded substantially by net proceeds from
BROADWIND ENERGY, INC. AND SUBSIDIARIES
NOTES TO CONSOLIDATED FINANCIAL STATEMENTS (Continued)
December 31, 2011, 2010, and 2009
(in thousands, except share and per share data)
20. RESTRUCTURING (Continued)
asset sales of $7,600. The table below details the Company's total expected restructuring charges as of December 31, 2011:
| | 2011 Actual | Total Projected | |||||
|---|---|---|---|---|---|---|---|
Capital Expenditures | $ | (5 | ) | $ | (5,200 | ) | |
Cash Expense | |||||||
Cost of Sales | (131 | ) | (3,400 | ) | |||
Selling, general, and administrative expenses | (441 | ) | (1,000 | ) | |||
Non Cash Expense-Other Income (Loss) | (297 | ) | (4,000 | ) | |||
| $ | (874 | ) | $ | (13,600 | ) | ||
21. QUARTERLY FINANCIAL SUMMARY (UNAUDITED)
The following table provides a summary of selected financial results of operations by quarter for the years ended December 31, 20102011 and 20092010 as follows:
2010 | First | Second | Third | Fourth | |||||||||||||||||||||||
|---|---|---|---|---|---|---|---|---|---|---|---|---|---|---|---|---|---|---|---|---|---|---|---|---|---|---|---|
2011 | First | Second | Third | Fourth | |||||||||||||||||||||||
Revenues | Revenues | $ | 21,743 | $ | 33,580 | $ | 34,022 | $ | 47,551 | $ | 43,530 | $ | 39,332 | $ | 47,899 | $ | 55,093 | ||||||||||
Gross (loss) profit | (3,496 | ) | 214 | (221 | ) | 5,449 | |||||||||||||||||||||
Gross profit | 2,579 | 2,932 | 712 | 964 | |||||||||||||||||||||||
Operating loss | Operating loss | (12,066 | ) | (12,198 | ) | (7,798 | ) | (37,165 | ) | (3,973 | ) | (4,311 | ) | (6,244 | ) | (5,901 | ) | ||||||||||
Loss from continuing operations, net of tax | Loss from continuing operations, net of tax | (11,991 | ) | (13,200 | ) | (7,260 | ) | (37,302 | ) | (4,053 | ) | (4,401 | ) | (6,586 | ) | (5,702 | ) | ||||||||||
Net loss | Net loss | (14,124 | ) | (14,181 | ) | (8,299 | ) | (48,571 | ) | (5,180 | ) | (4,458 | ) | (6,586 | ) | (5,724 | ) | ||||||||||
Loss from continuing operations per share: | Loss from continuing operations per share: | ||||||||||||||||||||||||||
Basic and Diluted | (0.11 | ) | (0.12 | ) | (0.07 | ) | (0.36 | ) | |||||||||||||||||||
Basic and Diluted | (0.04 | ) | (0.04 | ) | (0.06 | ) | (0.04 | ) | |||||||||||||||||||
Net loss per share: | Net loss per share: | ||||||||||||||||||||||||||
Basic and Diluted | $ | (0.14 | ) | $ | (0.13 | ) | $ | (0.08 | ) | $ | (0.45 | ) | |||||||||||||||
Basic and Diluted | $ | (0.05 | ) | $ | (0.04 | ) | $ | (0.06 | ) | $ | (0.04 | ) | |||||||||||||||
2009 | First | Second | Third | Fourth | |||||||||||||||||||||||
|---|---|---|---|---|---|---|---|---|---|---|---|---|---|---|---|---|---|---|---|---|---|---|---|---|---|---|---|
2010 | First | Second | Third | Fourth | |||||||||||||||||||||||
Revenues | Revenues | $ | 50,370 | $ | 47,728 | $ | 54,549 | $ | 32,151 | $ | 21,743 | $ | 33,580 | $ | 34,022 | $ | 47,551 | ||||||||||
Gross profit (loss) | 4,680 | 2,684 | 5,869 | (1,329 | ) | ||||||||||||||||||||||
Gross (loss) profit | (3,496 | ) | 214 | (221 | ) | 5,449 | |||||||||||||||||||||
Operating loss | Operating loss | (6,185 | ) | (9,849 | ) | (4,591 | ) | (91,628 | ) | (12,066 | ) | (12,198 | ) | (7,798 | ) | (37,165 | ) | ||||||||||
Loss from continuing operations, net of tax | Loss from continuing operations, net of tax | (6,246 | ) | (4,546 | ) | (5,005 | ) | (91,229 | ) | (11,991 | ) | (13,200 | ) | (7,260 | ) | (37,302 | ) | ||||||||||
Net loss | Net loss | (7,150 | ) | (5,426 | ) | (4,944 | ) | (92,599 | ) | (14,124 | ) | (14,181 | ) | (8,299 | ) | (48,571 | ) | ||||||||||
Loss from continuing operations per share: | Loss from continuing operations per share: | ||||||||||||||||||||||||||
Basic and Diluted | (0.06 | ) | (0.05 | ) | (0.05 | ) | (0.95 | ) | |||||||||||||||||||
Basic and Diluted | (0.11 | ) | (0.12 | ) | (0.07 | ) | (0.36 | ) | |||||||||||||||||||
Net loss per share: | Net loss per share: | ||||||||||||||||||||||||||
Basic and Diluted | $ | (0.07 | ) | $ | (0.06 | ) | $ | (0.05 | ) | $ | (0.96 | ) | |||||||||||||||
Basic and Diluted | $ | (0.14 | ) | $ | (0.13 | ) | $ | (0.08 | ) | $ | (0.45 | ) | |||||||||||||||
BROADWIND ENERGY, INC. AND SUBSIDIARIES
NOTES TO CONSOLIDATED FINANCIAL STATEMENTS (Continued)
December 31, 2011, 2010, and 2009
(in thousands, except share and per share data)
22. SUBSEQUENT EVENTSLEGAL PROCEEDINGS
Legal ProceedingsShareholder Lawsuits
On February 11, 2011, a putative class action was filed in the United States District Court for the Northern District of Illinois, Eastern Division, against Broadwindthe Company and certain of its current or former officers and directors. The lawsuit is purportedly brought on behalf of purchasers of the Company's common stock between March 17, 2009 and August 9, 2010. A lead plaintiff has been appointed and an amended complaint was filed on September 13, 2011. The amended complaint names as additional defendants certain of the Company's current and former directors, certain Tontine entities, and Jeffrey Gendell, a principal of Tontine. The complaint seeks to allege that the defendants violated Section 10(b) of the Securities Exchange Act of 1934, as amended (the "Exchange Act"), and Rule 10b-5 promulgated thereunder, andand/or Section 20(a) of the Exchange Act by issuing or causing to be issued a series of allegedly false and/or misleading statements concerning the Company's financial results, operations, and prospects, including with respect to the January 2010 secondary public offering of the Company's common stock. The plaintiffs allege that the Company's statements were false and misleading because, among other things, the Company's reported financial results during the class period allegedly violated generally accepted accounting principles because they failed to reflect the impairment of goodwill and other intangible assets, and the Company allegedly failed to disclose known trends and other information regarding certain customer relationships at Brad Foote. In support of their claims, the plaintiffs rely in part upon six alleged confidential informants, all of whom are alleged to be former employees of the Company. The Company's motion to dismiss was filed on November 18, 2011, and is now fully briefed and awaiting a ruling. Between February 15, 2011 and March 9,30, 2011, three putative shareholder derivative lawsuits were filed in the United States District Court for the Northern District of Illinois, Eastern Division, and one putative shareholder derivative lawsuit was filed in the Circuit Court of Cook County, Illinois, Chancery Division against certain of the Company's current and former officers and directors, and certain Tontine entities, seeking to challenge alleged breaches of fiduciary duty, waste of corporate assets, and unjust enrichment, including in connection with the January 2010 secondary public offering of the Company's common stock. One of the lawsuits also alleges that certain directors violated Section 14(a) of the Exchange Act in connection with ourthe Company's Proxy Statement for ourits 2010 Annual Meeting of Stockholders. Two of the matters pending in the federal court have been consolidated and the Company filed a motion to dismiss these matters on September 19, 2011, which is now fully briefed and awaiting a ruling. The Company has received a request from the Tontine defendants for indemnification in the derivative suits and the class action lawsuit and may receive additional requests for indemnification from Tontine and/or Mr. Gendell pursuant to various agreements related to shares owned by Tontine. The Company maintains directors and officers liability insurance, however, the costs of indemnification for Mr. Gendell and/or Tontine would not be covered by any Company insurance policy. Because of the preliminary nature of these lawsuits, the Company is not able to estimate a loss or range of loss, if any, that may be incurred in connection with this matter at this time.
SEC Inquiry
In August 2011, the Company received a subpoena from the United States Securities and Exchange Commission ("SEC") seeking documents and other records related to certain accounting practices at Brad Foote. The subpoena was issued in connection with an informal inquiry that the
BROADWIND ENERGY, INC. AND SUBSIDIARIES
NOTES TO CONSOLIDATED FINANCIAL STATEMENTS (Continued)
December 31, 2011, 2010, 2009, and 20082009
(in thousands, except share and per share data)
22. SUBSEQUENT EVENTSLEGAL PROCEEDINGS (Continued)
Annual MeetingCompany received from the SEC in November 2010 arising out of Stockholders. Becausea whistleblower complaint received by the SEC related to revenue recognition, cost accounting and intangible and fixed asset valuations at Brad Foote. The Company has been voluntarily providing information to the SEC as a part of that inquiry and is in the preliminary natureprocess of these lawsuits,responding to the subpoena with respect to the outstanding requests. The Company iscannot currently predict the outcome of this investigation. The Company does not able tobelieve that the resolution of this matter will have a material adverse effect on the Company's consolidated financial position or results of operations. No estimate aregarding the loss or range of loss, but it expects, based on currently available information,if any, that any liability resulting from these claims wouldmay be substantially covered by its insurance policies.incurred in connection with this matter is possible at this time.
Environmental Compliance and Remediation Liabilities
The Company is aware of an investigation commenced by the United States Attorney's Office, Northern District of Illinois, for potential violation of federal environmental laws. On February 15, 2011, pursuant to a search warrant, officials from the United States Environmental Protection Agency ("USEPA") entered and conducted a search of one of the Company'sBrad Foote's facilities in Cicero, Illinois. DuringIllinois, in connection with the search, officials interviewed a numberalleged improper disposal of the Company's employees and seized documents relatingindustrial wastewater to the facility's compliance with certain environmental laws and regulations.sewer. Also on or about February 15,11, 2011, in connection with the same matter, the Company received a grand jury subpoena requesting testimony and the production of certain documents relating to the facility's past compliance with certain environmental laws and regulations relating to the generation, discharge and disposal of wastewater from certain of the Company'sits processes frombetween 2004 toand the present. The Company is in the process of responding to this subpoena, which response is currently due on March 24, 2011. On or about February 23, 2011, the Company also received an additionalanother grand jury subpoena relating to the same investigation, requesting testimony and the production of certain other documents relating to certain of the Company'sfacility's employees, and environmental and manufacturing processes.processes, and disposal practices. The Company ishas produced e-mails, reports and correspondence as requested in the process of respondingresponse to this subpoena, and has requested an extension of the time allotted to respond. Such extensions are generally granted as a matter of routine, but thethese subpoenas. The Company has not yet received a new date by which such response will be due. The Company does not currently have information asalso voluntarily instituted corrective measures at the facility, including changes to when the investigation may be concluded, and it is also conducting an internal investigation of any possible noncompliance. At this time, the Company has not been formally notified that it is a subject or target of the investigation and no fines or penalties have been suggested.its wastewater disposal practices. There can be no assurances that the conclusion of the investigation will not result in a determination that the Company has violated applicable laws. If the Company isenvironmental, health and safety laws and regulations. Any violations found, to have violated such laws, itor any criminal or civil fines, penalties and/or other sanctions imposed could be subject to fines, civil penaltiessubstantial and criminal penalties.materially and adversely affect the Company. The Company hashad recorded a liability of $675 at December 31, 2010, which representsrepresented the low end of its estimate of remediation-related costs and expenses whichexpenses; as of December 31, 2011, those initial costs have been incurred, and additional costs have been expensed as incurred. No additional remediation related expenses are anticipated or which are expectedhave been accrued; however, the outcome of the investigation, the liability in connection therewith, and the impact to the Company's operations cannot be predicted at this time. The Company does not believe that the resolution of this matter will have a material adverse effect on the Company's consolidated financial position or results of operations. No estimate regarding the loss or range of loss, if any, that may be incurred during 2011 in connection with this matter. Due to the preliminary nature of the Company's investigation, itmatter is reasonably possible that the estimate of the obligation may change in the near term.
Sale of Logistics Business
On March 4, 2011, the Company completed the sale of its logistics business, through the sale of its Badger subsidiary, to BTI Logistics, LLC ("BTI Logistics"). Proceeds from the sale included $1.0 million in cash, a $1.5 million secured promissory note and 100,000 shares of Broadwind common stock held by the buyer. In addition, BTI Logistics assumed approximately $2.9 million of debt and capital leases, plus approximately $1.6 million of operating lease obligations. The purchase price is subject to final working capital adjustments. In connection with the sale, the AP Agreement between Badger and Wells Fargo, and the guaranty provided by Badger to Wells Fargo with respect to the other AP Agreements were each terminated, pursuant to an Omnibus Amendment to Account Purchase Agreements and Guaranties dated as of March 4, 2011, by and among the Company, the Subsidiaries and Wells Fargo.at this time.
| Exhibit Number | Description | ||
|---|---|---|---|
| 2.1 | Share Exchange Agreement | ||
2.2 | Stock Purchase Agreement dated September 13, 2007 among the Company, R.B.A. Inc. and the | ||
2.3 | Stock Purchase Agreement dated August 22, 2007 among the Company, Brad Foote Gear Works, Inc. and the shareholders of Brad Foote Gear Works, Inc. (incorporated by reference to Exhibit 2.1 to the Company's Current Report on Form 8-K filed August 24, 2007) | ||
2.4 | Stock Purchase Agreement dated April 24, 2008 among | ||
2.5 | Membership Interest Purchase Agreement dated December 9, 2007 among the Company, Energy Maintenance Service, LLC, Joseph A. Kolbach and the members of Energy Maintenance Service, LLC (incorporated by reference to Exhibit 2.1 to the Company's Current Report on Form 8-K filed December 13, 2007) | ||
2.6 | Amendment No. 1 to the Membership Interest Purchase Agreement dated December 9, 2007 among the Company, Energy Maintenance Service, LLC, Joseph A. Kolbach and the members of Energy Maintenance Service, LLC (incorporated by reference to Exhibit 2.1 to the Company's Current Report on Form 8-K filed January 14, 2008) | ||
2.7 | Stock Purchase Agreement dated March 4, 2011 among | ||
3.1 | Certificate of Incorporation of the Company (incorporated by reference to Exhibit 3.1 to the Company's Quarterly Report on Form 10-Q for the quarterly period ended June 30, 2008) | ||
3.2 | Amended and Restated Bylaws of the Company, as amended and restated through November 3, 2010 (incorporated by reference to Exhibit 3.1 to the Company's Current Report on Form 8-K filed November 5, 2010) | ||
10.1 | Form of Irrevocable Proxy of each of Christopher Allie, Raymond L. Brickner, III, Terence P. Fox and Daniel P. Wergin, each dated March 1, 2007, pursuant to the Securities Purchase Agreement | ||
10.2 | Proxy Agreement dated August 22, 2007 between Tontine Capital Partners, L.P., Tontine Capital Overseas Master Fund, L.P., J. Cameron Drecoll, Patrick Rosmonowski, Dennis Palmer and Noel Davis | ||
10.3 | |||
| Lease Agreement dated December 26, 2007 between Tower Tech Systems Inc. and City Centre, LLC (incorporated by reference to Exhibit 10.3 to the Company's Annual Report on Form 10-KSB for the fiscal year ended December 31, 2007) | |||
| Exhibit Number | Description | ||
|---|---|---|---|
10.4 | Purchase Agreement Addendum effective February 11, 2008 between Brad Foote Gear Works, Inc. and BFG Cicero LLC (incorporated by reference to Exhibit 10.1 to the Company's Current Report on Form 8-K filed February 21, 2008) | ||
10.5 | Assignment and Assumption of Purchase Agreement effective February 11, 2008 between Brad Foote Gear Works, Inc. and 1309 South Cicero Avenue, LLC (incorporated by reference to Exhibit 10.2 to the Company's Current Report on Form 8-K filed February 21, 2008) | ||
10.6 | Purchase Agreement Addendum effective February 11, 2008 between Brad Foote Gear Works, Inc. and BFG Pittsburgh LLC (incorporated by reference to Exhibit 10.3 to the Company's Current Report on Form 8-K filed February 21, 2008) | ||
10.7 | Assignment and Assumption of Purchase Agreement effective February 11, 2008 between Brad Foote Gear Works, Inc. and 5100 Neville Road, LLC (incorporated by reference to Exhibit 10.4 to the Company's Current Report on Form 8-K filed February 21, 2008) | ||
10.8 | Securities Purchase Agreement dated March 1, 2007 among the Company, Tontine Capital Partners, L.P. and Tontine Capital Overseas Master Fund, L.P. (incorporated by reference to Exhibit 10.2 to the Company's Current Report on Form 8-K filed March 5, 2007) | ||
10.9 | Securities Purchase Agreement dated August 22, 2007 among the Company, Tontine Capital Partners, L.P. | ||
10.10 | Amended and Restated Securities Purchase Agreement dated January 3, 2008 | ||
10.11 | Securities Purchase Agreement dated April 22, 2008 | ||
10.12 | Securities Purchase Agreement dated April 22, 2008 between | ||
10.13 | Registration Rights Agreement dated March 1, 2007 among the Company, Tontine Capital Partners, L.P. | ||
10.14 | Amendment to Registration Rights Agreement dated October 19, 2007 among the Company, Tontine Capital Partners, L.P., Tontine Capital Overseas Master Fund, L.P., Tontine Partners, L.P., Tontine Overseas Fund, Ltd. and Tontine 25 Overseas Master Fund, L.P. (incorporated by reference to Exhibit 10.6 to the Company's Current Report on Form 8-K filed October 24, 2007) | ||
10.15 | Amendment No. 2 to Registration Rights Agreement dated July 18, 2008 among the Company, Tontine Capital Partners L.P., Tontine Partners, L.P., Tontine Capital Overseas Master Fund, L.P., Tontine 25 Overseas Master Fund, L.P. and Tontine Overseas Fund, Ltd. (incorporated by reference to Exhibit 10.1 to the Company's Current Report on Form 8-K filed July 23, 2008) | ||
| Exhibit Number | Description | ||
|---|---|---|---|
| Amendment No. | |||
10.17 | Amendment No. 4, dated October 31, 2008, to Registration Rights Agreement dated March 1, 2007 and amended October 19, 2007, July 18, 2008 and September 12, 2008, among | ||
10.18 | Waiver relating to Registration Rights Agreement, dated January 9, 2009, by Tontine Capital Partners, L.P., Tontine Capital Overseas Master Fund, L.P., Tontine Partners, L.P., Tontine Overseas Fund, Ltd. and Tontine 25 Overseas Master Fund, L.P. (incorporated by reference to Exhibit 10.1 to the Company's Current Report on Form 8-K filed January 15, 2009) | ||
10.19 | Registration Rights Agreement dated October 19, 2007 among the Company, J. Cameron Drecoll, Pat Rosmonowski, Dennis Palmer and Noel Davis (incorporated by reference to Exhibit 10.2 to the Company's Current Report on Form 8-K filed October 24, 2007) | ||
10.20 | Registration Rights Agreement dated January 16, 2008 among the Company, EMS, Inc., Fagen, Inc., Joseph A. Kolbach and Daniel A. Yarano (incorporated by reference to Exhibit 10.2 to the Company's Current Report on Form 8-K filed January 23, 2008) | ||
10.21 | Registration Rights Agreement dated April 24, 2008 between | ||
10.22 | Registration Rights Agreement dated June 4, 2008 between | ||
10.23 | † | Employment Agreement dated as of August 1, 2008 between the Company and Jesse E. Collins, Jr. (incorporated by reference to Exhibit 99.2 to the Company's Current Report on Form 8-K filed January 14, 2010) | |
10.24 | † | Employment Agreement dated as of June 30, 2008 between the Company and J.D. Rubin (incorporated by reference to Exhibit 10.3 to the Company's Current Report on Form 8-K filed March 16, 2009) | |
10.25 | † | Employment Agreement dated as of July 29, 2009 between the Company and Stephanie K. Kushner (incorporated by reference to Exhibit 10.1 to the Company's Current Report on Form 8-K filed August 3, 2009) | |
10.26 | † | Employment Agreement dated as of November 15, 2010 between | |
10.27 | † | Deferred Compensation Plan (incorporated by reference to Exhibit 10.2 to the Company's Current Report on Form 8-K filed October 26, 2007) | |
10.28 | † | Amended and Restated Broadwind Energy, Inc. 2007 Equity Incentive Plan (incorporated by reference to Exhibit 10.1 to the Company's Current Report on Form 8-K filed March 29, 2011) | |
| Exhibit Number | Description | ||
|---|---|---|---|
| † | |||
Form of Executive Incentive Stock Option Agreement (incorporated by reference to Exhibit 10.1 to the Company's Quarterly Report on Form 10-Q for the quarterly period ended June 30, 2010) | |||
† | Form of Incentive Stock Option Agreement (incorporated by reference to Exhibit 10.2 to the Company's Quarterly Report on Form 10-Q for the quarterly period ended June 30, 2010) | ||
† | Form of Nonqualified Option Agreement (incorporated by reference to Exhibit 10.3 to the Company's Quarterly Report on Form 10-Q for the quarterly period ended June 30, 2010) | ||
† | Form of Restricted Stock Award Agreement (incorporated by reference to Exhibit 10.4 to the Company's Quarterly Report on Form 10-Q for the quarterly period ended June 30, 2010) | ||
† | Form of Restricted Stock Unit Award Agreement (incorporated by reference to Exhibit 10.5 to the Company's Quarterly Report on Form 10-Q for the quarterly period ended June 30, 2010) | ||
† | Form of Performance Award Agreement (incorporated by reference to Exhibit 10.6 to the Company's Quarterly Report on Form 10-Q for the quarterly period ended June 30, 2010) | ||
† | Form of Stock Appreciation Rights Agreement (incorporated by reference to Exhibit 10.7 to the Company's Quarterly Report on Form 10-Q for the quarterly period ended June 30, 2010) | ||
† | Broadwind Energy, Inc. Executive Short-Term Incentive Plan (incorporated by reference to Exhibit 10.1 to the Company's Current Report on Form 8-K filed March 16, 2009) | ||
Commercial Security Agreement dated October 4, 2007 between Tower Tech Systems Inc. and Investors Community Bank (incorporated by reference to Exhibit 10.38 to the Company's Annual Report on Form 10-KSB for the fiscal year ended December 31, 2007) | |||
Guaranty dated October 22, 2008 by the Company to Investors Community Bank for Tower Tech Systems Inc. (incorporated by reference to Exhibit 10.57 to the Company's Annual Report on Form 10-K for the fiscal year ended December 31, 2008) | |||
Agreement Governing Extensions of Credit dated April 22, 2009 between Investors Community Bank and R.B.A. Inc. (incorporated by reference to Exhibit 10.1 to the Company's Quarterly Report on Form 10-Q for the quarterly period ended March 31, 2009) | |||
Master Amendment dated as of December 30, 2009 among Investors Community Bank, Tower Tech Systems Inc., and | |||
Construction Loan Agreement, dated April 28, 2009, | |||
10.42 | |||
| Promissory Note, dated April 28, 2009, from Tower Tech Systems Inc. to Great Western Bank (incorporated by reference to Exhibit 10.2 to the Company's Current Report on Form 8-K filed May 1, 2009) | |||
Letter Agreement, dated April 28, 2009, | |||
| Exhibit Number | Description | ||
|---|---|---|---|
| 10.44 | Commercial Security Agreement, dated April 28, 2009, | ||
Mortgage, dated April 28, 2009, from Tower Tech Systems Inc. to Great Western Bank (incorporated by reference to Exhibit 10.5 to the Company's Current Report on Form 8-K filed May 1, 2009) | |||
Assignment of Deposit Account, dated April 28, 2009, | |||
Subordination Agreement, dated April 27, 2009, | |||
Commercial Guaranty, dated April 27, 2009, from | |||
Change in Terms Agreement, dated December 22, 2009, | |||
Letter Agreement, dated December 22, 2009, | |||
Change in Terms Agreement, dated February 16, 2010, | |||
Letter Agreement, dated February 16, 2010, | |||
Letter Agreement, dated April 5, 2010, | |||
Amendment to Mortgage, dated April 5, 2010, | |||
Business Loan Agreement, dated April 5, 2010, | |||
10.56 | |||
| Change in Terms Agreement, dated April 5, 2010, | |||
Amended and Restated Lease for Industrial/Manufacturing Space, dated as of May 1, 2010, | |||
| Exhibit Number | Description | ||
|---|---|---|---|
| 10.58 | Form of Indemnification Agreement (incorporated by reference to Exhibit 10.6 to the Company's Quarterly Report on Form 10-Q for the quarterly period ended March 31, 2010) | ||
Form of Account Purchase Agreement, dated as of September 28, 2010, between Wells Fargo Bank, National Association and each of Badger Transport, Inc.; Brad Foote Gear Works, Inc.; Energy Maintenance Service, LLC; and Tower Tech Systems Inc. (incorporated by reference to Exhibit 10.1 to the Company's Quarterly Report on Form 10-Q for the quarterly period ended September 30, | |||
Form of Continuing Guaranty, dated as of September 28, 2010, executed by each of Badger Transport, Inc.; Brad Foote Gear Works, Inc.; Energy Maintenance Service, LLC; and Tower Tech Systems Inc. in favor of Wells Fargo Bank, National Association (incorporated by reference to Exhibit 10.3 to the Company's Quarterly Report on Form 10-Q for the quarterly period ended September 30, 2010) | |||
10.61 | Continuing Guaranty, dated as of September 28, 2010, executed by the Company in favor of Wells Fargo Bank, National Association (incorporated by reference to Exhibit 10.2 to the Company's Quarterly Report on Form 10-Q for the quarterly period ended September 30, 2010) | ||
10.62 | |||
10.63 | Second Amendment to Master Amendment, dated as of May 31, 2011, among Investors Community Bank, Broadwind Towers, Inc. f/k/a Tower Tech Systems Inc., and the Company (incorporated by reference to Exhibit 10.1 to the Company's Quarterly Report on Form 10-Q for the quarterly period ended | ||
10.64 | Omnibus Amendment to Account Purchase Agreements and Guaranties dated as of March 4, 2011 | ||
10.65 | Second Amendment to Account Purchase Agreements dated as of October 19, 2011 among Brad Foote Gear Works, Inc., Broadwind Services, LLC, Broadwind Towers, Inc. and Wells Fargo National Association (incorporated by reference to Exhibit 10.1 to the Company's Quarterly Report on Form 10-Q for the quarterly period ended September 30, 2011) | ||
21.1 | Subsidiaries of | ||
23.1 | Consent of Grant Thornton LLP (filed herewith) | ||
31.1 | Rule 13a-14(a) Certification of Chief Executive Officer (filed herewith) | ||
31.2 | Rule 13a-14(a) Certification of Chief Financial Officer (filed herewith) | ||
32.1 | Certification Pursuant to 18 U.S.C. Section 1350, as Adopted Pursuant to Section 906 of the Sarbanes-Oxley Act of 2002, of Chief Executive Officer (filed herewith) | ||
32.2 | Certification Pursuant to 18 U.S.C. Section 1350, as Adopted Pursuant to Section 906 of the Sarbanes-Oxley Act of 2002, of Chief Financial Officer (filed herewith) | ||
Pursuant to the requirements of Section 13 or 15(d) of the Securities Exchange Act of 1934, the registrant has duly caused this report to be signed on its behalf by the undersigned, thereunto duly authorized, on the 1613th day of March, 2011.2012.
| BROADWIND ENERGY, INC. | ||||
By: | /s/ PETER C. DUPREY PETER C. DUPREY President and Chief Executive Officer (Principal Executive Officer) | |||
Pursuant to the requirements of the Securities Exchange Act of 1934, this report has been signed below by the following persons on behalf of the registrant and in the capacities and on the dates indicated.
| /s/ PETER C. DUPREY Peter C. Duprey | President and Chief Executive Officer and Director (Principal Executive Officer) | March | ||||
/s/ STEPHANIE K. KUSHNER Stephanie K. Kushner | Chief Financial Officer (Principal Financial Officer and Principal Accounting Officer) | March | ||||
/s/ DAVID P. REILAND David P. Reiland | Director and Chairman of the Board | March | ||||
/s/ CHARLES H. BEYNON Charles H. Beynon | Director | March | ||||
/s/ WILLIAM T. FEJES, JR. William T. Fejes, Jr. | Director | March | ||||
/s/ TERENCE P. FOX Terence P. Fox | Director | March 13, 2012 | ||||
/s/ THOMAS A. WAGNER Thomas A. Wagner | Director | March 13, 2012 | ||||