Minnesota State or other jurisdiction of incorporation or organization | 41-0749934 (I.R.S. Employer Identification No.) | |
7201 Metro Boulevard, Edina, Minnesota (Address of principal executive offices) | 55439 (Zip Code) | |
registrant'sRegistrant's telephone number, including area code)Title of each class Name of each exchange on which registered Common Stock, par value $0.05 per share New York Stock Exchange Preferred Share Purchase Rights New York Stock Exchange ýo (Do 2010,2013, was approximately $944,774,658.$670,414,816. The registrant has no non-voting common equity.12, 2011,15, 2014, the registrant had 57,728,62455,641,456 shares of Common Stock, par value $0.05 per share, issued and outstanding.27, 201128, 2014 (the "2011"2014 Proxy Statement") (to be filed pursuant to Regulation 14A within 120 days after the registrant's fiscal year-end of June 30, 2011)2014) are incorporated by reference into Part III.
| Page(s) | |||||||
4
| ||||||||
Executive Officers of the Registrant | ||||||||
| ||||||||
| ||||||||
| ||||||||
17
| ||||||||
Management's Statement of Responsibility for Financial Statements and Report on Internal Control over Financial Reporting | ||||||||
Report of Independent Registered Public Accounting Firm | ||||||||
| ||||||||
Haircutting and styling (including shampooing & conditioning) Hair coloring Hair waving Other Company's retail assortment include Biolage, Paul Mitchell, Regis designLINE, Redken, Nioxin, Tigi, It's a 10, Sexy Hair Concepts, Kenra, and Moroccanoil. REGIS SALONS Open at beginning of period Salons constructed Acquired Less relocations Salon openings Conversions Salons closed Total, Regis Salons MASTERCUTS Open at beginning of period Salons constructed Acquired Less relocations Salon openings Conversions Salons closed Total, MasterCuts TRADE SECRET Company-owned salons: Open at beginning of period Salons constructed Acquired Franchise buybacks Less relocations Salon openings Conversions Salons sold Salons closed Total company-owned salons Franchise salons: Open at beginning of period Salons constructed Acquired(2) Less relocations Salon openings Franchise buybacks Interdivisional reclassification(4) Salons sold Salons closed Total franchise salons Total, Trade Secret SMARTSTYLE/COST CUTTERS IN WALMART Company-owned salons: Open at beginning of period Salons constructed Acquired Franchise buybacks Less relocations Salon openings Conversions Salons closed Total company-owned salons Franchise salons: Open at beginning of period Salons constructed Salon openings Franchise buybacks Salons closed Total franchise salons Total, SmartStyle/Cost Cutters in Walmart SUPERCUTS Company-owned salons: Open at beginning of period Salons constructed Acquired Franchise buybacks Less relocations Salon openings Conversions Salons closed Total company-owned salons Franchise salons: Open at beginning of period Salons constructed Acquired(2) Less relocations Salon openings Conversions Franchise buybacks Salons closed Total franchise salons Total, Supercuts PROMENADE Company-owned salons: Open at beginning of period Salons constructed Acquired Franchise buybacks Less relocations Salon openings Conversions Salons closed Total company-owned salons Franchise salons: Open at beginning of period Salons constructed Acquired(2) Less relocations Salon openings Conversions Franchise buybacks Interdivisional reclassification(4) Salons closed Total franchise salons Total, Promenade Company-owned salons: Open at beginning of period Salons constructed Acquired Franchise buybacks Less relocations Salon openings Conversions Affiliated joint ventures Salons closed Total company-owned salons Franchise salons: Open at beginning of period Salons constructed Acquired(2) Less relocations Salon openings Conversions Franchise buybacks Affiliated joint ventures(3) Salons closed Total franchise salons Total, International Salons TOTAL SYSTEM WIDE SALONS Company-owned salons: Open at beginning of period Salons constructed Acquired Franchise buybacks Less relocations Salon openings Conversions Affiliated joint ventures Salons sold Salons closed Total company-owned salons Franchise salons: Open at beginning of period Salons constructed Acquired(2) Less relocations Salon openings Conversions Franchise buybacks Affiliated joint ventures(3) Salons sold Salons closed Total franchise salons Total Salons 1,213 franchised Supercuts locations. The Company provides its franchisees with a comprehensive system of business training, stylist education, site approval and lease negotiation, construction management services, professional marketing, promotion, and advertising programs, and other forms of support designed to help the franchisee build a successful business. discharge. Franchisee Training. The Company provides new franchisees with training, focusing on the various aspects of store management, including operations, personnel management, marketing fundamentals, and financial controls. Existing franchisees receive training, counseling and information from the Company on a continuous basis. The Company provides store managers and stylists with extensive technical training for Supercuts franchises. intent to create more clear communication platforms, identities and differentiation points for our brands to drive consumer preference. Company-owned hair restoration centers: Open at beginning of period Constructed Acquired Franchise buybacks Less relocations Site openings Sites closed Total company-owned hair restoration centers Franchise hair restoration centers: Open at beginning of period Acquired Franchise buybacks Less Relocations Site openings Sites closed Total franchise hair restoration centers Total hair restoration centers Financial Information about Foreign and North American Operations results of operations. Changes in manufacturers' choice of distribution channels may negatively affect our revenues. and earnings may be impaired. performance. Statements. 2014 the Special Litigation Committee filed a motion requesting the court dismiss the shareholder derivative action. 1st Quarter 2nd Quarter 3rd Quarter 4th Quarter dividends. companies the Company utilized as its peer group for executive compensation purposes in fiscal years 2014 and 2013. Information regarding executive compensation will be set forth in the 2014 Proxy statement. Regis S & P 500 S & P 400 Midcap Dow Jones Consumer Service Index Peer Group The Company did not repurchase any shares during fiscal year 2014 or 2012. The Company repurchased 909,175 shares of Revenues(a) Operating income(b) (Loss) income from continuing operations(c) (Loss) income from continuing operations per diluted share(c) Total assets Long-term debt and capital lease obligations, including current portion Dividends declared operations. During 2014, EEG has no goodwill. As of June 30, 2014, our share of EEG's deferred tax assets was $7.8 million. See Note 5 to the Consolidated Financial Statements. Discount Rate Same-Store Sales Discount Rate Same-Store Sales Discount Rate Same-Store Sales As of June 30, premium of 30.0%. Regis MasterCuts SmartStyle Supercuts Promenade Total North America Salons Hair Restoration Centers Consolidated Goodwill Consolidated Financial Statements. data and salon level revenues and expenses. Long-lived asset impairment charges are recorded within depreciation and amortization in the Consolidated Statement of Operations. derivative shareholder action. During fiscal year Service revenues Product revenues Royalties and fees Operating expenses: Cost of service(1) Cost of product(2) Site operating expenses General and administrative Rent Depreciation and amortization Goodwill impairment Lease termination costs Operating income (Loss) income from continuing operations before income taxes and equity in income (loss) of affiliated companies (Loss) income from continuing operations Income (loss) from discontinued operations Net (loss) income North American salons: Regis MasterCuts SmartStyle Supercuts Promenade(3) Total North American Salons(2) International salons Hair restoration centers Consolidated revenues Percent change from prior year Salon same-store sales decrease(1) Acquisitions (previous twelve months) Organic Foreign currency Franchise revenues Closed salons 2011 2010 2009 2011 2010 2009 2011 2010 2009 2011 2010 2009 2011 2010 2009 2011 2010 2009 Product Product sold to purchaser of Trade Secret Total product revenues Cost of product Cost of product sold to purchaser of Trade Secret Total cost of product Margin on product other than sold to purchaser of Trade Secret Margin on product sold to purchaser of Trade Secret Total product margin 2011 2010 2009 2011 2010 2009 2011 2010 2009 2011 2010 2009 2011 2010 2009 2011 2010 2009 2011 2010 2009 2011 2010 2009 2011 2010 2009 2011 2010 2009 2011 2010 2009 Canadian dollar British pound Euro Total 2011 2010 2009 Acquisitions (previous twelve months) Organic Foreign currency Franchise revenues Closed salons 2011 2010 2009 2011 2010 2009 Acquisitions (previous twelve months) Organic Foreign currency Franchise revenues Closed salons 2011 2010 2009 2011 2010 2009 Acquisitions (previous twelve months) Organic Franchise revenues 2011 2010 2009 2011 2010 2009 2011 2010 2009 2011 2010 2009 2011 2010 2009 Net (loss) income Depreciation and amortization Equity in (income) loss of affiliated companies Dividends received from affiliated companies Deferred income taxes Impairment on discontinued operations Goodwill and asset impairments Note receivable bad debt expense Receivables Inventories Income tax receivable Other current assets Other assets Accounts payable and accrued expenses Other noncurrent liabilities Other Business and salon acquisitions Capital expenditures for remodels or other additions Capital expenditures for the corporate office (including all technology-related expenditures) Capital expenditures for new salon construction Proceeds from loans and investments Disbursements for loans and investments Freestanding derivative settlement Proceeds from sale of assets Regis MasterCuts Trade Secret(1) SmartStyle Supercuts Promenade International Hair restoration centers Net repayments on revolving credit facilities Net repayments of long-term debt Proceeds from the issuance of common stock Excess tax benefit from stock-based compensation plans Dividend payments Other On-balance sheet: Long-term debt obligations Capital lease obligations Other long-term liabilities Total on-balance sheet Off-balance sheet(a): Operating lease obligations Interest on long-term debt and capital lease obligations Total off-balance sheet Total(b) Item 7A. Quantitative and Qualitative Disclosures About Market Risk Fixed rate debt Variable rate debt In addition, access to variable rate debt is available through the Company's revolving credit facility. The Company Liabilities (U.S.$ equivalent in thousands) Long-term debt: Fixed rate (U.S.$) Average interest rate Variable rate (U.S.$) Average interest rate Total liabilities Interest rate derivatives (U.S.$ equivalent in thousands) Pay fixed/receive variable (U.S.$) Foreign Currency Exchange Risk: $0.4 million, respectively. During Forecasted Transactions (U.S.$ equivalent in thousands) Intercompany transactions with Canadian salons (U.S.$) Foreign currency denominated intercompany assets and liabilities (U.S.$) Total contracts Average contractual exchange rate ASSETS ASSETS Current assets: Current assets: Cash and cash equivalents Receivables, net Inventories Deferred income taxes Income tax receivable Other current assets Total current assets Property and equipment, net Property and equipment, net Goodwill Goodwill Other intangibles, net Other intangibles, net Investment in and loans to affiliates Other assets Other assets Total assets LIABILITIES AND SHAREHOLDERS' EQUITY LIABILITIES AND SHAREHOLDERS' EQUITY Current liabilities: Current liabilities: Long-term debt, current portion Accounts payable Accrued expenses Total current liabilities Long-term debt and capital lease obligations Long-term debt and capital lease obligations Other noncurrent liabilities Other noncurrent liabilities Total liabilities Commitments and contingencies (Note 10) Shareholders' equity: Shareholders' equity: Common stock, $0.05 par value; issued and outstanding, 57,710,811 and 57,561,180 common shares at June 30, 2011 and 2010, respectively Additional paid-in capital Accumulated other comprehensive income Retained earnings Total shareholders' equity Total liabilities and shareholders' equity Revenues: Revenues: Service Product Royalties and fees Operating expenses: Operating expenses: Cost of service Cost of product Site operating expenses General and administrative Rent Depreciation and amortization Goodwill impairment Lease termination costs Total operating expenses Operating income Other income (expense): Interest expense Interest income and other, net (Loss) income from continuing operations before income taxes and equity in income (loss) of affiliated companies Income taxes Income taxes Equity in income (loss) of affiliated companies, net of income taxes (Loss) income from continuing operations Income (loss) from discontinued operations, net of taxes (Note 2) Net (loss) income Net (loss) income per share: Net (loss) income per share: Basic: (Loss) income from continuing operations Income (loss) from discontinued operations Net (loss) income per share, basic(1) Diluted: (Loss) income from continuing operations Income (loss) from discontinued operations Net (loss) income per share, diluted(1) Weighted average common and common equivalent shares outstanding: Weighted average common and common equivalent shares outstanding: Basic Diluted Cash dividends declared per common share Cash dividends declared per common share The accompanying notes are an integral part of the Consolidated Financial Statements. Balance, June 30, 2008 Net loss Foreign currency translation adjustments Changes in fair market value of financial instruments designated as cash flow hedges, net of taxes Proceeds from exercise of stock options Stock-based compensation Shares issued through franchise stock incentive program Recognition of deferred compensation and other, net of taxes (Note 14) Tax benefit realized upon exercise of stock options Issuance of restricted stock Restricted stock forfeitures Taxes related to restricted stock Dividends Equity issuance costs Adjustment to stock option tax benefit Balance, June 30, 2009 Net income Foreign currency translation adjustments Changes in fair market value of financial instruments designated as cash flow hedges, net of taxes Issuance of common stock Equity component of convertible debt, net of taxes Proceeds from exercise of stock options Stock-based compensation Shares issued through franchise stock incentive program Recognition of deferred compensation and other, net of taxes (Note 14) Tax benefit realized upon exercise of stock options Issuance of restricted stock Restricted stock forfeitures Taxes related to restricted stock Dividends Equity issuance costs Adjustment to stock option tax benefit Balance, June 30, 2010 Net loss Foreign currency translation adjustments Changes in fair market value of financial instruments designated as cash flow hedges, net of taxes Proceeds from exercise of stock options Stock-based compensation Shares issued through franchise stock incentive program Recognition of deferred compensation and other, net of taxes (Note 14) Tax benefit realized upon exercise of stock options Issuance of restricted stock Restricted stock forfeitures Taxes related to restricted stock Vested stock option expirations Dividends Balance, June 30, 2011 Cash flows from operating activities: Net (loss) income Adjustments to reconcile net (loss) income to net cash provided by operating activities: Depreciation Amortization Equity in (income) loss of affiliated companies Dividends received from affiliated companies Deferred income taxes Impairment on discontinued operations Goodwill impairment Salon asset impairments Note receivable bad debt expense Excess tax benefits from stock-based compensation plans Stock-based compensation Amortization of debt discount and financing costs Other noncash items affecting earnings Changes in operating assets and liabilities(1): Receivables Inventories Income tax receivable Other current assets Other assets Accounts payable Accrued expenses Other noncurrent liabilities Net cash provided by operating activities Cash flows from investing activities: Capital expenditures Proceeds from sale of assets Asset acquisitions, net of cash acquired and certain obligations assumed Proceeds from loans and investments Disbursements for loans and investments Freestanding derivative settlement Net cash used in investing activities Cash flows from financing activities: Borrowings on revolving credit facilities Payments on revolving credit facilities Proceeds from issuance of long-term debt, net of $5.2 million underwriting discount Repayments of long-term debt and capital lease obligations Excess tax benefits from stock-based compensation plans Proceeds from issuance of common stock, net of $7.2 million underwriting discount Dividends paid Other Net cash used in financing activities Effect of exchange rate changes on cash and cash equivalents (Decrease) increase in cash and cash equivalents Cash and cash equivalents: Beginning of year End of year revised its prior period financial information to conform to the new segment structure. Historical financial information presented herein reflects this change. wholly owned. The Company consolidated variable interest entities where it has determined it is the primary beneficiary of those entities' operations. credit. The restricted cash balance is classified within other current assets on the Consolidated Balance Sheet. Beginning balance Bad debt expense Write-offs Other (primarily the impact of foreign currency fluctuations) Ending balance is determined by applying estimated of June 30, 2012. Beginning balance Provision for incurred losses Prior year actuarial loss development Claim payments Other, net Ending balance realize material impairment charges. based on the relative fair values under the assumption of a taxable transaction. The excess of the fair value of the reporting unit over the amount assigned to its assets and liabilities is the implied fair value of goodwill. The goodwill impairment is measured as the excess of the carrying value of goodwill over its implied fair value. recorded during fiscal year 2013. Regis MasterCuts SmartStyle Supercuts Promenade Total North America Salons Hair Restoration Centers Consolidated Goodwill affiliated companies by approximately $4.8 million for fiscal years 2014, 2013 and 2012. The Company North American salons International salons Hair restoration centers Total Company's self-insurance accruals. use. pays for the See Note 8 to the Consolidated Financial Statements. See Note 1 to the Consolidated Financial Statements. Advertising costs included in continuing operations Advertising costs included in discontinued operations Total advertising costs The Company participates in cooperative advertising programs under which The Accumulated Other Comprehensive Income, balance at July 1 Cumulative translation adjustment: Balance at July 1 Pre-tax amount Tax effect Net of tax amount Balance at June 30 Changes in fair market value of financial instruments designated as cash flow hedges: Balance at July 1 Pre-tax amount Tax effect Net of tax amount Balance at June 30 Recognition of deferred compensation: Balance at July 1 Pre-tax amount Tax effect Net of tax amount Balance at June 30 Accumulated Other Comprehensive Income, balance at June 30 flows of the Company's international subsidiaries are measured using local currency as the functional currency. Assets and liabilities of these subsidiaries are translated at the exchange rates in effect at each fiscal year end. Translation adjustments arising from the use of differing exchange rates from period to period are included in accumulated other comprehensive income within shareholders' equity. Statement of Operations accounts are translated at the average rates of exchange prevailing during the year. During fiscal years 2014, 2013 and 2012, the foreign currency gain (loss) recorded within interest income and other, net in the Consolidated Statement of Operations was $0.1, $33.4 and $0.4 million, respectively. During fiscal year 2013, Company recognized a $33.8 million foreign currency translation gain in connection with the sale of Provalliance and subsequent liquidation of all foreign entities with Euro denominated operations within interest income and other, net in the Consolidated Statement of Operations. of Hair Club as discontinued operations for all periods presented in the Consolidated Statement of Operations. There was no significant continuing involvement by the Company in the operations of Hair Club after the disposal. Carrying value: Warehouse services Note receivable, current Note receivable, current valuation allowance Note receivable, long-term Note receivable, long-term valuation allowance Total note receivable, net Balance at July 1, 2010 Provision associated with nonaccrual status of interest income Balance at September 30, 2010 Provision associated with nonaccrual status of interest income Cash payments Balance at December 31, 2010 Provision associated with nonaccrual status of interest income Valuation allowance Balance at March 31, 2011 Provision associated with nonaccrual status of interest income Valuation allowance Cash payments Balance at June 30, 2011 Revenues Income (loss) from discontinued operations, before income taxes Income tax benefit on discontinued operations Income (loss) from discontinued operations, net of income taxes 3. OTHER FINANCIAL STATEMENT DATA Accounts receivable Less allowance for doubtful accounts Other current assets: Prepaids Notes receivable, primarily affiliates Property and equipment: Property and equipment: Land Buildings and improvements Equipment, furniture and leasehold improvements Internal use software Equipment, furniture and leasehold improvements under capital leases Less accumulated depreciation and amortization Less amortization of equipment, furniture and leasehold improvements under capital leases Investment in and loans to affiliates: Equity-method investments Noncurrent loans to affiliates Other assets: Notes receivable, net Other noncurrent assets Accrued expenses: Accrued expenses: Payroll and payroll related costs Insurance Deferred revenues Taxes payable Other Other noncurrent liabilities: Other noncurrent liabilities: Deferred income taxes Deferred rent Deferred benefits Insurance Equity put option Other Amortized intangible assets: Brand assets and trade names Customer lists Franchise agreements Lease intangibles Non-compete agreements Other Amortized intangible assets: Brand assets and trade names Customer lists Franchise agreements Lease intangibles Non-compete agreements Other Total Total amortization expense related to 2012 2013 2014 2015 2016 The following provides supplemental disclosures of cash flow activity: Cash paid (received) during the year for: Interest Income taxes, net of refunds Components of aggregate purchase prices: Cash Liabilities assumed or payable Allocation of the purchase prices: Current assets Property and equipment Deferred income tax asset Goodwill Identifiable intangible assets Accounts payable and accrued expenses Other noncurrent liabilities Amortized intangible assets: Brand assets and trade names Customer lists Franchise agreements Lease intangibles Non-compete agreements Other Total Gross goodwill at June 30, 2009 Accumulated impairment losses Net goodwill at June 30, 2009 Goodwill acquired(1) Translation rate adjustments Resolution to pre-acquisition income tax contingency Goodwill impairment(2) Gross goodwill at June 30, 2010 Accumulated impairment losses Net goodwill at June 30, 2010 Goodwill acquired(1) Translation rate adjustments Goodwill impairment(3) Gross goodwill at June 30, 2011 Accumulated impairment losses Net goodwill at June 30, 2011 Balance at June 30, 2009 Payment of loans by affiliates Equity in income of affiliated companies, net of income taxes(1) Cash dividends received Other, primarily translation adjustments Balance at June 30, 2010 Acquisition of additional interest(3) Payment of loans by affiliates Loans to affiliates Equity in income of affiliated companies, net of income taxes(2) Other than temporary impairment(4) Cash dividends received Other, primarily translation adjustments Balance at June 30, 2011 Percentage ownership at June 30, 2011 Summarized Balance Sheet Information: Current assets Noncurrent assets Current liabilities Noncurrent liabilities Summarized Statement of Operations Information: Gross revenue Gross profit Operating income Net income net impairment charge. Investment in Provalliance Equity Put Option Other than temporary impairment(1) Equity in income, net of income taxes Equity in income, net of income taxes Cash dividends received Investment in cost method investment. The Company lowest level of significant input used: Level 1 markets); Level 2 Level 3 data). ASSETS Non-current assets Derivative instruments LIABILITIES Current liabilities Derivative instruments Non-current liabilities Equity put option ASSETS Non-current assets Derivative instruments Preferred shares LIABILITIES Current liabilities Derivative instruments Non-current liabilities Derivative instruments Equity put option The Balance at July 1, 2010 Total realized and unrealized gains (losses): Included in other comprehensive income (loss) Included in equity in income (loss) of affiliated companies Transfer out of Level 3 Other than temporary impairment Balance at June 30, 2011 Balance at July 1, 2009 Total realized and unrealized gains (losses): Additions to Level 3 Included in other comprehensive income (loss) Included in equity in income (loss) of affiliated companies Balance at June 30, 2010 The fair 2014. Assets Goodwill—Promenade(1) Total Assets Goodwill—Regis(1) Total Convertible senior notes Senior term notes Convertible senior notes Term loan Revolving credit facility Equipment and leasehold notes payable Other notes payable Less current portion Long-term portion Aggregate maturities of long-term debt, including associated capital lease obligations of 2012 2013 2014 2015 2016 Thereafter Convertible Senior Notes 8.9%. Principal amount on the convertible senior notes Unamortized debt discount Net carrying amount of convertible debt The following table provides interest rate and interest expense amounts related to the convertible senior notes: Interest cost related to contractual interest coupon—5.0% Interest cost related to amortization of the discount Total interest cost each year, beginning on June 1, 2014. The Senior Term Notes rank equally with the Company's existing senior unsecured debt. The Company’s revolving credit facility. As of June 30, Designated as hedging instruments—Cash Flow Hedges: Interest rate swaps Forward foreign currency contracts Freestanding derivative contracts—not designated as hedging instruments: Forward foreign currency contracts Total Designated as hedging instruments—Cash Flow Hedges: Interest rate swaps Forward foreign currency contracts Treasury lock contracts Total Designated as hedging instruments—Fair Value Hedges: Fair value interest rate swap Freestanding derivative contracts—not designated as hedging instruments: Forward foreign currency contracts Total Statement of Operations. In most cases, the amount of rental income related to sublease arrangements with franchisees approximates the amount of rent expense from the primary lease, thereby having no net impact on rent expense or net income (loss). However, in limited cases, the Company charges a Minimum rent Percentage rent based on sales Real estate taxes and other expenses 2012 2013 2014 2015 2016 Thereafter Total minimum lease payments locations. Balance at July 1, Provision for lease termination costs: Provisions associated with store closings Cash payments Balance at June 30, The Company is a defendant in various lawsuits and claims arising out of the normal course of business. Like certain other large retail employers, the Company has been faced with allegations of purported class-wide consumer and wage and hour violations. Litigation is inherently unpredictable and the outcome of these matters cannot presently be determined. Although the derivative shareholder action. During fiscal year (Loss) income before income taxes: U.S. International Current: U.S. International Deferred: U.S. International U.S. statutory rate State income taxes, net of federal income tax benefit Tax effect of goodwill impairment Foreign income taxes at other than U.S. rates Work Opportunity and Welfare-to-Work Tax Credits Adjustment of prior year income tax balances Other, net Deferred tax assets: Deferred rent Payroll and payroll related costs Net operating loss carryforwards Salon asset impairment Inventories Derivatives Deferred gift card revenue Federal and state benefit on uncertain tax positions Allowance for doubtful accounts/notes Insurance Other Total deferred tax assets Deferred tax liabilities: Depreciation Amortization of intangibles Accrued property taxes Deferred debt issuance costs Other Total deferred tax liabilities Net deferred tax liabilities At June 30, no expiration date. It is not practicable for the Company to determine the amount of unrecognized deferred tax liabilities on these indefinitely reinvested earnings. Balance at beginning of period Additions based on tax positions related to the current year (Reductions) additions based on tax positions of prior years Reductions on tax positions related to the expiration of the statue of limitations Settlements Balance at end of period Plan: 1974 ("ERISA"). Certain participants within the Executive Plan also receive a matching contribution from the Company. these deferred compensation contracts in the Consolidated Balance Sheet: Profit sharing plan Executive Profit Sharing Plan ESPP FSPP Deferred compensation contracts share as the convertible debt was not dilutive. Weighted average shares for basic earnings per share Weighted average shares for basic earnings per share Effect of dilutive securities: Effect of dilutive securities: Dilutive effect of convertible debt Dilutive effect of stock-based compensation(1) Weighted average shares for diluted earnings per share Weighted average shares for diluted earnings per share Basic earnings per share: RSAs(1) RSUs(1) Diluted earnings per share: Stock options(2) SARs(2) RSAs(2) RSUs(2) Shares issuable upon conversion of debt(2) Net (loss) income from continuing operations available to common shareholders Effect of dilutive securities: Interest on convertible debt Net (loss) income from continuing operations for diluted earnings per share continuous service. 2000 Plan 2004 Plan Balance, June 30, 2008 Granted Cancelled Exercised Balance, June 30, 2009 Granted Cancelled Exercised Balance, June 30, 2010 Granted Cancelled Exercised Balance, June 30, 2011 Exercisable June 30, 2011 Balance, June 30, 2008 Granted Cancelled Vested/Exercised Balance, June 30, 2009 Granted Cancelled Vested/Exercised Balance, June 30, 2010 Granted Cancelled Vested/Exercised Balance, June 30, 2011 Using the fair value of each grant on the date of grant, the weighted average fair values per stock-based compensation award granted during fiscal years Stock options SARs Restricted stock awards Restricted stock units Risk-free interest rate Expected term (in years) Expected volatility Expected dividend yield RSUs that is expected to be recognized over a weighted-average period of 2.2 years. Shareholders' Rights Plan: second quarter of fiscal year 2014. The Company Revenues: Service Product Royalties and fees Operating expenses: Cost of service Cost of product Site operating expenses General and administrative Rent Depreciation and amortization Goodwill impairment Lease termination costs Total operating expenses Operating income (loss) Other income (expense): Interest expense Interest income and other, net Income (loss) from continuing operations before income taxes and equity in income (loss) of affiliated companies Total assets Long-lived assets Capital expenditures Purchases of salon assets Revenues: Service Product Royalties and fees Operating expenses: Cost of service Cost of product Site operating expenses General and administrative Rent Depreciation and amortization Goodwill impairment Lease termination costs Total operating expenses Operating income (loss) Other income (expense): Interest expense Interest income and other, net Income (loss) from continuing operations before income taxes and equity in income (loss) of affiliated companies Total assets Long-lived assets Capital expenditures Purchases of salon assets Revenues: Service Product Royalties and fees Operating expenses: Cost of service Cost of product Site operating expenses General and administrative Rent Depreciation and amortization Goodwill impairment Lease termination costs Total operating expenses Operating income (loss) Other income (expense): Interest expense Interest income and other, net Income (loss) from continuing operations before income taxes and equity in (loss) income of affiliated companies Total assets Long-lived assets Capital expenditures Purchases of salon assets Total revenues and U.S. Other countries Total 2011 Revenues Gross margin, excluding depreciation Operating income (loss)(a)(b) Income (loss) from continuing operations(a)(b)(e) Net income (loss)(a)(b)(e) Income (loss) from continuing operations per share, basic Net income (loss) per basic share(f) Income (loss) from continuing operations per share, diluted Net income (loss) per diluted share(f) Dividends declared per share Refer to Management's Discussion and Analysis of Financial Condition and Results of Operations in Part II, Item 2010 Revenues(c) Gross margin, excluding depreciation(c) Operating income (loss)(b)(c) Income (loss) from continuing operations(b) Income from discontinued operations(d) Net income (loss)(b)(d) Income (loss) from continuing operations per share, basic Income (loss) from discontinued operations per share, basic(d) Net income (loss) per basic share(f) Income (loss) from continuing operations per share, diluted Income (loss) from discontinued operations per share, diluted(f) Net income (loss) per diluted share(f) Dividends declared per share(a) General Development of Business In 1922, Paul and Florence Kunin opened Kunin Beauty Salon, which quickly expanded into a chain of value priced salons located in department stores. In 1958, the chain was purchased by their son and renamed Regis Corporation. In December 2004, the Company purchased Hair Club for Men and Women. On August 1, 2007, the Company contributed its 51 wholly-owned accredited cosmetology schools to Empire Education Group, Inc (EEG). On January 31, 2008, the Company merged its continental European franchise salon operations with the operations of the Franck Provost Salon Group in the newly formed entity, Provalliance. The Company acquired an additional equity interest in Provalliance in March 2011. On February 20, 2008, the Company acquired the capital stock of Cameron Capital I, Inc. (CCI), a wholly-owned subsidiary of Cameron Capital Investments, Inc. CCI owned and operated PureBeauty and BeautyFirst salons. On February 16, 2009, the Company sold its Trade Secret salon concept (Trade Secret), which included CCI. Additionally, the Company continues to acquire hair and retail product salons. Regis Corporation is listed on the NYSE under the ticker symbol "RGS." Discussions of the general development of the business take place throughout this Annual Report on Form 10-K.(b) Financial Information about Segments Segment data for the years ended June 30, 2011, 2010 and 2009 are included in Note 16 to the Consolidated Financial Statements in Part II, Item 8, of this Form 10-K.(c) Narrative Description of Business The following topical areas are discussed below in order to aid in understanding the Company and its operations:TopicPage(s)Background4Industry Overview5Salon Business Strategy5Salon Concepts8Salon Franchising Program14Salon Markets and Marketing16Salon Education and Training Programs16Salon Staff Recruiting and Retention17Salon Design17Salon Management Information Systems17Salon Competition18Hair Restoration Business Strategy18Affiliated Ownership Interest20Corporate Trademarks20Corporate Employees21Executive Officers21Corporate Community Involvement22Governmental Regulations22 Based in Minneapolis, Minnesota, the Company's primary business is owning, operating and franchising hair and retail product salons. In addition to the primary hair and retail product salons, the Company owns Hair Club for Men and Women, a provider of hair restoration services. As of June 30, 2011,2014, the Company owned, franchised or held ownership interests in approximately 12,700 worldwide locations.9,674 locations worldwide. The Company's locations consistedconsist of 9,8199,456 company-owned and franchisefranchised salons 96 hair restoration centers, and 2,786218 locations in which the Company maintains anwe maintain a non-controlling ownership interest of less than 100 percent.100%. Each of the Company's salon concepts generally offer similar salon products and services and serve the mass market consumer marketplace. The Company's hair restoration centers offer three hair restoration solutions; hair systems, hair transplants and hair therapy, which are targeted at the mass market consumer. The Company is organized to manage its operations based on significant lines of business—salons and hair restoration centers. Salon operations are managed based on geographical location—North America and International. The Company's North American salon operations are comprised of 7,483 company-owned salons and 1,936 franchise salons operating in the United States, Canada and Puerto Rico. The Company's International operations are comprised of 400 company-owned salons. The Company's worldwide salon locations operate primarily under the trade names of Regis Salons, MasterCuts, SmartStyle, Supercuts, Cost Cutters, and Sassoon. The Company's hair restoration centers are located in the United States and Canada. During fiscal year 2011, the number of customer visits at the Company's company-owned salons approximated 91 million. The Company had approximately 55,000 corporate employees worldwide during fiscal year 2011. On August 1, 2007, the Company contributed 51 of its wholly-owned accredited cosmetology schools to EEG in exchange for a 49.0 percent equity interest in EEG. EEG is the largest beauty school operator in North America with 102 accredited cosmetology schools with revenues of approximately $193 million annually and is overseen by the Empire Beauty School management team. In January 2008, the Company's effective ownership interest increased to 55.1 percent related to the buyout of EEG's minority interest shareholder. The Company accounts for the investment in EEG under the equity method of accounting as Empire Beauty School retains majority voting interest and has full responsibility for managing EEG. Refer to Note 6 to the Consolidated Financial Statements for additional information. On January 31, 2008, the Company merged its continental European franchise salon operations with the operations of the Franck Provost Salon Group in exchange for a 30.0 percent equity interest in the newly formed entity, Provalliance. The merger with the operations of the Franck Provost Salon Group which are also located in continental Europe, created Europe's largest salon operator with approximately 2,600 company-owned and franchise salons as of June 30, 2011. The Company contributed to Provalliance the shares of each of its European operating subsidiaries, other than the Company's operating subsidiaries in the United Kingdom and Germany. The contributed subsidiaries operate retail hair salons in France, Spain, Switzerland and several other European countries primarily under the Jean Louis David™ and Saint Algue™ brands. This transaction has created significant growth opportunities for Europe's salon brands. The Franck Provost Salon Group management structure has a proven platform to build and acquire company-owned stores as well as a strong franchise operating group that is positioned for expansion. The merger agreement contains a right (Equity Put) to require the Company to purchase an additional ownership interest in Provalliance between specified dates in 2010 to 2018. The Company recorded a $25.7 million other than temporary impairment charge in its fourth quarter ended June 30, 2009 on its investment in Provalliance as a result of increased debt and reduced earnings expectations that reduced the fair value of Provalliance below carrying value as of June 30, 2009. In March of 2011, the Company elected to honor and settle a portion of the Equity Put and acquired approximately 17 percent additional equity interest in Provalliance for $57.3 million (approximately € 40.4 million), bringing the Company's total equity interest to approximately 47 percent. On February 16, 2009, the Company sold Trade Secret. The Company concluded, after a comprehensive review of its strategic and financial options, to divest Trade Secret. The sale of Trade Secret included 655 company-owned salons and 57 franchise salons, all of which had historically been reported within the Company's North America reportable segment. The Company recorded an impairment charge related to this transaction of $183.3 million during the year ended June 30, 2009. Management estimates that annual revenues of the hair care industry are approximately $50 to $56 billion in the United States and approximately $150 to $170 billion worldwide. The Company estimates that it holds approximately two percent of the worldwide market. The hair salon and hair restoration markets are each highly fragmented, with the vast majority of locations independently owned and operated. However, the influence of salon chains on these markets, both franchise and company-owned, has increased substantially. Management believes that salon chains will continue to have a significant influence on these markets and will continue to increase their presence. As the Company is the principal consolidator of these chains in the hair care industry, it prevails as an established exit strategy for independent salon owners and operators, which affords the Company numerous opportunities for continued selective acquisitions. The Company's goal is to provide high quality, affordable hair care services and products to a wide range of mass market consumers, which enables the Company to expand in a controlled manner. The key elements of the Company's strategy to achieve these goals are taking advantage of (1) growth opportunities, (2) economies of scale and (3) centralized control over salon operations in order to ensure (i) consistent, quality services and (ii) a superior selection of high quality, professional products. Each of these elements is discussed below. Salon Growth Opportunities. The Company's salon expansion strategy focuses on organic (new salon construction and same-store sales growth of existing salons) and salon acquisition growth. Organic Growth. The Company executes its organic growth strategy through a combination of new construction of company-owned and franchise salons, as well as same-store sales increases. The square footage requirements related to opening new salons allow the Company great flexibility in securing real estate for new salons as the Company has small or flexible square footage requirements for its salons. The Company's long-term outlook for organic expansion remains strong. The Company has at least one salon in all major cities in the U.S. and has penetrated every viable U.S. market with at least one concept. However, because the Company has a variety of concepts, it can place several of its salons within any given market. Once customer visitations stabilize, the Company plans to continue to expand in North America. A key component to successful North American organic growth relates to site selection, as discussed in the following paragraphs. Salon Site Selection. The Company's salons are located in high-traffic locations such as regional shopping malls, strip centers, lifestyle centers, Walmart Supercenters, high-street locations and department stores. The Company is an attractive tenant to landlords due to its financial strength, successful salon operations and international recognition. In evaluating specific locations for both company-owned and franchise salons, the Company seeks conveniently located, visiblesites which allow customers adequate parking and quick and easy location access. Various other factors are considered in evaluating sites, including area demographics, availability and cost of space, the strength of the major retailers within the area, location and strength of competitors, proximity of other company-owned and franchise salons, traffic volume, signage and other leasehold factors in a given center or area. Because the Company's various salon concepts target slightly different mass market customer groups, more than one of the Company's salon concepts may be located in the same real estate development without impeding sales of either concept. As a result, there are numerous leasing opportunities for all of its salon concepts. While same-store sales growth plays an important role in the Company's organic growth strategy, it is not critical to achieving the Company's long-term revenue growth objectives. However, same-store sales growth is important to achieving improved annual operating profit. New salon construction and salon acquisitions (described below) are expected to generate low single-digit annual revenue growth. The recent trend has been slowly improving visitation patterns and marginal increases in average ticket price resulting in negative to low single-digit same-store sales growth. The Company expects fiscal year 2012 same-store sales to be in the range of negative 1.0 percent to positive 1.0 percent. Pricing is a factor in same-store sales growth. The Company actively monitors the prices charged by its competitors in each market and makes every effort to maintain prices which remain competitive with prices of other salons offering similar services. Price increases are considered on a market-by-market basis and are established based on local market conditions. Salon Acquisition Growth. In addition to organic growth, another key component of the Company's growth strategy is the acquisition of salons. With an estimated two percent worldwide market share, management believes the opportunity to continue to make selective acquisitions exists. Over the past 17 years, the Company has acquired 8,050 salons, expanding both in North America and internationally. When contemplating an acquisition, the Company evaluates the existing salon or salon group with respect to the same characteristics as discussed above in conjunction with site selection for constructed salons (conveniently located, visible, strong retailers within the area, etc.). The Company generally acquires mature strip center locations, which are systematically integrated within the salon concept that it most clearly emulates. In addition to adding new salon locations each year, the Company has an ongoing program of remodeling its existing salons, ranging from redecoration to substantial reconstruction. This program is implemented as management determines that a particular location will benefit from remodeling, or as required by lease renewals. A total of 271 and 333 salons had major remodels in fiscal years 2011 and 2010, respectively. Recent Salon Additions. During fiscal year 2011, the Company constructed 213 new salons (146 company-owned and 67 franchise). Additionally, the Company acquired 105 company-owned salons, including 78 franchise salon buybacks. During fiscal year 2010, the Company constructed 217 new salons (139 company-owned and 78 franchise). Additionally, the Company acquired 26 company-owned salons, including 23 franchise salon buybacks. Salon Closures. The Company evaluates its salon performance on a regular basis. Upon evaluation, the Company may close a salon for operational performance or real estate issues. In either case, the closures generally occur at the end of a lease term and typically do not require significant lease buyouts. During fiscal year 2011, 305 salons were closed, including 245 company-owned salons and 60 franchise salons (excluding 78 franchise buybacks). We expect to close approximately 160 company-owned salons in fiscal year 2012. During fiscal year 2010, 269 salons were closed, including 204 company-owned salons and 65 franchise salons (excluding 23 franchise buybacks). In June of 2009, the Company approved a plan to close up to 80 underperforming United Kingdom company-owned salons in fiscal year 2010, in addition to the normal closure activity of salons at the end of a lease term. As of June 30, 2010, 36 stores under the June 2009 plan ceased using the rights to use the leased property or negotiated a lease termination agreement with the lessor in which the Company ceased using the right to the leased property subsequent to June 30, 2010. The plans are substantially complete. Economies of Scale. Management believes that due to its size and number of locations, the Company has certain advantages which are not available to single location salons or small chains. Economies of scale are realized through the centralized support system offered by the home office. Additionally, due to its size, the Company has numerous financing and capital expenditure alternatives, as well as the benefits of buying retail products, supplies and salon fixtures directly from manufacturers. Furthermore, the Company can offer employee benefit programs, training and career path opportunities that are often superior to its smaller competitors. Centralized Control Over Salon Operations. The Company manages its expansive salon base through a combination of area and regional supervisors, corporate salon directors and chief operating officers. Each area supervisor is responsible for the management of approximately ten to 12 salons. Regional supervisors oversee the performance of five to seven area supervisors or approximately 50 to 80 salons. Salon directors manage approximately 200 to 300 salons while chief operating officers are responsible for the oversight of an entire salon concept. This operational hierarchy is key to the Company's ability to expand successfully. In addition, the Company has an extensive training program, including the production of training DVDs for use in the salons, to ensure its stylists are knowledgeable in the latest haircutting and fashion trends and provide consistent quality hair care services. Finally, the Company tracks salon activity for all of its company-owned salons through the utilization of daily sales detail delivered from the salons' point of sale system. This information is used to reconcile cash on a daily basis. Consistent, Quality Service. The Company is committed to meeting its customers' hair care needs by providing competitively priced services and products with professional and knowledgeable stylists. The Company's operations and marketing emphasize high quality services to create customer loyalty, to encourage referrals and to distinguish the Company's salons from its competitors. To promote quality and consistency of services provided throughout the Company's salons, the Company employs full and part-time artistic directors whose duties are to train salon stylists in current styling trends. The major services supplied by the Company's salons are haircutting and styling (including shampooing and conditioning), hair coloring and waving. During fiscal years 2011, 2010, and 2009, theother services. The percentage of company-owned service revenues in each fiscal year 2014, 2013 and 2012 attributable to haircutting and styling, hair coloring and other services were 72%, 19% and 9%, respectively.services wasareas and to create additional points of differentiation versus the competition.1. Earn the Hearts and Minds of Our Team 2. Develop Positive, Professional and High Performing Salon Leaders 3. Drive Guest Trial and Loyalty 4. Standardize Operating Procedures Across Brands follows:the foundation for ongoing leadership development. Role clarity and talent assessments help us identify ways to develop and upgrade field leadership. Execution disciplines are used to drive accountability, execution and business performance. Incentives are designed to align field interests with those of the Company's shareholders by rewarding behaviors focused on profitable revenue growth. This new organization structure also provides a clear career path for our people who desire to ascend within the Company. 2011 2010 2009 72 % 72 % 73 % 18 18 17 3 4 4 7 6 6 100 % 100 % 100 % High Quality, Professional Products. Convenience. Our different salon concepts enable our guests to select different service scheduling options based upon their preference. In the value category, the ability to serve walk-in appointments and minimize guest wait times is an essential element in delivering upon convenience. We have invested in staffing by increasing stylists' hours and have begun to optimize schedules and leverage recently installed point-of-sale systems to help us balance stylist hours with guest traffic and manage guest wait times. In the premium category, our salons generally schedule appointments in advance of service. Our salons are located in high-traffic strip centers, Walmart Supercenters and shopping malls, with guest parking and easy access, and are generally open seven days per week, offering guests a variety of convenient ways to fulfill their beauty needs.lineassortment of private label products sold under the Regis, MasterCuts and Cost Cutters labels. The retailown-branded products. Retail products offered by the Company are intended to be sold only through professional salons. The top selling brands include Paul Mitchell, Biolage, Redken, Regis designLINE, Nioxin, It's a 10, Tigi Bedhead, Sexy Hair Concepts, Kenra, Sebastiansalons, and the Company's various private label brands. The Company has launched a product diversion website for the entire industry to use as a measurement tool to track diversion. Diversion involves the selling of salon exclusive hair care products to unauthorized distribution channels such as discount retailers and pharmacies. Diversion is harmful to the consumer because diverted product can be old, tainted or damaged. It is also harmful to the salon owners and stylists because their credibility with the consumer may be questioned. The Company has the most comprehensive assortment of retail products in the industry. Although the Company constantly strives to carry an optimal level of inventory in relation to consumer demand, it is more economical for the Company to have a higher amount of inventory on hand than to run the risk of being under stocked should demand prove higher than expected. The extended shelf life and lack of seasonality related to the beauty products allows the cost of carrying inventory to be relatively low and lessens the importance of inventory turnover ratios. The Company's primary goal is to maximize revenues rather than inventory turns. The retail portion of the Company's business complementscomplement its salon services business. The Company's stylists and beauty consultants are compensated and regularly trained to sell hair care and beauty products to their customers.guests. Additionally, customersguests are enticedencouraged to purchase products after a stylist demonstrates its effectstylists demonstrate their efficacy by using itthem in the styling of our guests' hair. The top selling brands within the customer's hair.middle consumermass market. The Company's North American salon operations consist of 9,419 salons (including 1,936 franchise salons), operating under several concepts, each offering attractive and affordable hair care products and services in the United States, Canada and Puerto Rico. The Company's International salon operations consist of 400 hair care salons located in Europe, primarily in the United Kingdom. The number of new salons expected to be opened within the upcoming fiscal year is discussed within Management's Discussion and Analysis of Financial Condition and Results of Operations. In addition to these openings, the Company typically acquires several hundred salons each year. The number of acquired salons, and the concept under which the acquisitions will fall, vary based on the acquisition opportunities which develop throughout the year.Salon Development The table on the following pages set forth the number of system wide salons (company-owned and franchise) opened at the beginning and end of eachA description of the last five years, as well as the number of salons opened, closed, relocated, converted and acquired during each of these periods.COMPANY-OWNED AND FRANCHISE SALON SUMMARY 2011 2010 2009 2008 2007 1,049 1,071 1,078 1,099 1,079 12 14 20 14 17 9 3 23 4 49 (10 ) (11 ) (14 ) (11 ) (14 ) 11 6 29 7 52 (1 ) — — 1 (1 ) (36 ) (28 ) (36 ) (29 ) (31 ) 1,023 1,049 1,071 1,078 1,099 600 602 615 629 642 6 15 14 7 15 — — — — — (5 ) (7 ) (10 ) (6 ) (12 ) 1 8 4 1 3 1 — — — — (14 ) (10 ) (17 ) (15 ) (16 ) 588 600 602 615 629 — — 674 613 615 — — 10 16 20 — — — 65 3 — — — 5 — — — �� (4 ) (11 ) (11 ) — — 6 75 12 — — — 5 1 — — (655 ) — — — — (25 ) (19 ) (15 ) — — — 674 613 — — 106 19 19 — — 1 2 — — — — 93 — — — — (1 ) — — — 1 94 — — — — (5 ) — — — (43 ) — — — — (57 ) — — — — (7 ) (2 ) — — — — 106 19 — — — 780 632 2011 2010 2009 2008 2007 2,374 2,300 2,212 2,000 1,739 65 80 71 207 242 — — — — — — 5 24 12 21 (1 ) (3 ) (2 ) (3 ) (2 ) 64 82 93 216 261 — — — — — (45 ) (8 ) (5 ) (4 ) — 2,393 2,374 2,300 2,212 2,000 119 122 146 151 164 3 2 1 7 8 3 2 1 7 8 — (5 ) (24 ) (12 ) (21 ) (2 ) — (1 ) — — 120 119 122 146 151 2,513 2,493 2,422 2,358 2,151 1,100 1,114 1,132 1,094 1,036 24 10 27 33 45 — — — 3 — 73 12 6 38 37 (3 ) (2 ) (2 ) (6 ) (5 ) 94 20 31 68 77 13 — (2 ) — — (49 ) (34 ) (47 ) (30 ) (19 ) 1,158 1,100 1,114 1,132 1,094 1,034 1,022 997 990 978 43 42 51 71 69 — — — — — (7 ) (6 ) (7 ) (6 ) (7 ) 36 36 44 65 62 10 9 1 — 1 (73 ) (12 ) (6 ) (38 ) (37 ) (20 ) (21 ) (14 ) (20 ) (14 ) 987 1,034 1,022 997 990 2,145 2,134 2,136 2,129 2,084 2011 2010 2009 2008 2007 2,382 2,450 2,399 2,223 1,995 26 18 36 33 56 18 — 71 135 193 5 6 53 95 35 (10 ) (10 ) (16 ) (8 ) (12 ) 39 14 144 255 272 (14 ) — 1 (5 ) — (86 ) (82 ) (94 ) (74 ) (44 ) 2,321 2,382 2,450 2,399 2,223 867 901 914 1,008 1,026 21 34 40 49 66 — — — — — (7 ) (9 ) (7 ) (5 ) (12 ) 14 25 33 44 54 (9 ) (9 ) — — (1 ) (5 ) (6 ) (53 ) (95 ) (35 ) — — 43 — — (38 ) (44 ) (36 ) (43 ) (36 ) 829 867 901 914 1,008 3,150 3,249 3,351 3,313 3,231 2011 2010 2009 2008 2007 404 444 472 481 453 13 2 4 15 25 — — — 25 12 — — — — 4 (2 ) — (1 ) (1 ) (3 ) 11 2 3 39 38 — — — 1 — — — — (40 ) — (15 ) (42 ) (31 ) (9 ) (10 ) 400 404 444 472 481 — — — 1,574 1,587 — — — 50 110 — — — — — — — — — (1 ) — — — 50 109 — — — 3 — — — — — (4 ) — — — (1,587 ) — — — — (40 ) (118 ) — — — — 1,574 400 404 444 472 2,055 2011 2010 2009 2008 2007 7,909 7,981 8,582 8,139 7,559 146 139 182 325 420 27 3 94 232 257 78 23 83 150 97 (31 ) (33 ) (49 ) (46 ) (59 ) 220 132 310 661 715 (1 ) — (1 ) 2 — — — — (40 ) — — — (655 ) — — (245 ) (204 ) (255 ) (180 ) (135 ) 7,883 7,909 7,981 8,582 8,139 2,020 2,045 2,163 3,742 3,774 67 78 93 179 253 — — — 93 — (14 ) (15 ) (14 ) (12 ) (20 ) 53 63 79 260 233 1 — 1 3 — (78 ) (23 ) (83 ) (150 ) (97 ) — — — (1,587 ) — — — (57 ) — — (60 ) (65 ) (58 ) (105 ) (168 ) 1,936 2,020 2,045 2,163 3,742 9,819 9,929 10,026 10,745 11,881 (1)Canadian and Puerto Rican salons are included in the Regis Salons, MasterCuts, SmartStyle, Supercuts, and Promenade and not included in the International salon totals.(2)Represents primarily the acquisition of franchise networks.(3)Represents European operating subsidiaries contributed to Franck Provost Salon Group.(4)On February 16, 2009, the Company announced the completion of the sale of its Trade Secret retail product division. As a result of this transaction, the Company reported the Trade Secret operations as discontinued operations for all periods presented. Forty-three franchise salons were not included in the sale of Trade Secret to the purchaser of Trade Secret and are not reported as discontinued operations. These franchise salons are now included in Promenade salons. In the preceding table, relocations represent a transfer of location by the same salon concept and conversions represent the transfer of one concept to another concept. Regis Salons.SmartStyle. Regis Salons are primarily mall based, full service salons providing complete hair care and beauty services aimed at moderate to upscale, fashion conscious consumers. In recent years, the Company has expanded its Regis Salons into strip centers. As of June 30, 2011, of the 1,023 total Regis Salons, 156 Regis Salons were located in strip centers. The customer mix at Regis Salons is approximately 79 percent women, and both appointments and walk-in customers are common. TheseSmartStyle salons offer a full range of custom styling, cutting, and hair coloring, and waving services, as well as professional hair care products.products and are located exclusively in Walmart Supercenters. SmartStyle has a walk-in guest base with value pricing. Service revenues represent approximately 83 percent69% of total company-owned SmartStyle revenues. Additionally, the concept's total revenues. The average ticket was approximately $42 and $41 for fiscal years 2011 and 2010, respectively. Regis Salons competeCompany has 126 franchised Cost Cutters salons located in their existing markets primarily by emphasizing theWalmart Supercenters.services provided. Included within the Regis Salon concept are various other trade names, including Carlton Hair, Sassoon, Mia & Maxx Hair Studios, Hair by Stewarts, Hair Excitement, and Heidi's. The average initial capital investment required for a new Regis Salon is approximately $190,000 to $240,000, excluding average opening inventory costs of approximately $18,900. Average annual salon revenues in a Regis Salon whichCompany has been open five years or more are approximately $400,000.issalons are a full service, mall based salon group which focuses on the walk-in consumer (no appointment necessary) thatwho demands moderately priced hair care services. MasterCuts salons emphasize quality hair care services, affordable prices, and time saving services for the entire family. These salons offer a full range of custom styling, cutting and hair coloring and waving services, as well as professional hair care products. The customer mix at MasterCuts is split relatively evenly between men and women. Service revenues composecomprise approximately 81 percent82% of the concept's total revenues. The average ticket was approximately $22 and $21 for fiscal years 2011 and 2010, respectively. The average initial capital investment required for a new MasterCuts salon is approximately $125,000 to $175,000, excluding average opening inventory costs of approximately $14,600. Average annual salon revenues in a MasterCuts salon which has been open five years or more are approximately $277,000. SmartStyle.Other Value. The SmartStyleOther Value salons share many operating characteristics of the Company's other salon concepts; however, they are located exclusively in Walmart Supercenters. SmartStyle has a walk-in customer base, pricing is promotional and services are focused on the family. These salons offer a full range of custom styling, cutting, hair coloring and waving services, as well as professional hair care products. The customer mix at SmartStyle Salons is approximately 76 percent women. Professional retail product sales contribute considerably to overall revenues at approximately 33 percent. Additionally, the Company has 120 franchise salons located in Walmart Supercenters. The average ticket was approximately $21 and $20 for fiscal years 2011 and 2010, respectively. The average initial capital investment required for a new SmartStyle salon is approximately $35,000 to $45,000, excluding average opening inventory costs of approximately $12,700. Average annual salon revenues in a SmartStyle salon which has been open five years or more are approximately $244,000. Strip Center Salons. The Company's Strip Center Salons are comprised of company-owned and franchise salons operating in strip centers across North America under the following concepts: Supercuts. The Supercuts concept provides consistent, high quality hair care services and professional products to its customers at convenient times and locations and at a reasonable price. This concept appeals to men, women and children, although male customers account for approximately 66 percent of the customer mix. Service revenues represent approximately 89 percent of total company-owned Supercuts revenues. The average ticket was approximately $17 for fiscal years 2011 and 2010. The average initial capital investment required for a new Supercuts salon is approximately $75,000 to $100,000, excluding average opening inventory costs of approximately $7,600. Average annual salon revenues in a company-owned Supercuts salon which has been open five years or more are approximately $269,000. The Supercuts franchise salons provide consistent, high quality hair care services and professional products to customers at convenient times and locations and at a reasonable price. These Supercuts franchise salons appeal to men, women and children. Service revenues represent approximately 92 percent of the Supercuts franchise total revenues. Average annual revenues in a Supercuts franchise salon which has been open five years or more are approximately $338,000. Cost Cutters (franchise salons). The Cost Cutters concept is a full service salon concept providing value priced hair care services for men, women and children. These full service salons also sell a complete line of professional hair care products. The customer mix at Cost Cutters is split relativelyevenly between men and women. Average annual salon revenues in a franchised Cost Cutters salon which has been open five years or more are approximately $280,000. In addition to the franchise salons, the Company operates company-owned Cost Cutters salons, as discussed below under Promenade Salons. Promenade Salons. Promenade Salons are made up of successfulacquired regional company-owned salon groups acquired over the past several years operating under the primary concepts of Hair Masters, Cool Cuts for Kids, Style America, First Choice Haircutters, Famous Hair, Cost Cutters, BoRics, Magicuts, Holiday Hair, Head Start, Fiesta Salons, and TGF, as well as other concept names. Most concepts offer a full range of custom hairstyling, cutting and coloring and waving,services, as well as hair care products. Hair Masters offers moderately-priced services, to a predominately female demographic, while the other concepts primarily cater to time-pressed, value-oriented families. The customer mix is split relatively evenly between men and women at most concepts. Service revenues represent approximately 89 percent90% of total company-owned Other Value salons revenues. Additionally, the Company has 840 franchised locations of Other Value salons. Other Value salons were previously referred to as Promenade revenues. The average ticket was approximately $20 and $19 for fiscal years 2011 and 2010, respectively.salons. The average initial capital investment required for a new Promenade Salon is approximately $60,000 to $80,000, excluding average opening inventory costs of approximately $8,600. Average annual salon revenues in a Promenade Salon which has been open five years or more are approximately $241,000. Other Franchise Concepts.Regis Salons. This group of franchiseRegis Salons are primarily mall based, full service salons includes primarily First Choice Haircutters, Magicuts, Beauty Supply Outlets and Pro-Cuts. These concepts function primarily in the high volume, value pricedproviding complete hair care market segment, with key selling featuresand beauty services aimed at moderate to upscale, fashion conscious consumers. At Regis Salons both appointments and walk-in guests are common. These salons offer a full range of value, convenience, qualitycustom styling, cutting and friendliness,hair coloring services, as well as a complete line of professional hair care products. In addition to these franchise salons,Service revenues represent approximately 82% of the Company operates company-owned First Choice Haircuttersconcept's total revenues. Regis Salons compete in their existing markets primarily by providing high quality services. Included within the Regis Salon concept are various other trade names, including Carlton Hair, Sassoon, Hair by Stewarts, Hair Excitement, and Magicuts salons, as previously discussed above under "Strip Center Salons".Renee Beauty. Subsequent to June 30, 2011, the Company acquired an ownership interest in a franchise concept that combines modern grooming techniques with classic barbershop elements. This ownership interest along with the Company's other men's franchise concepts will allow the Company to expand its focus on the male demographic.theour North American salons previously mentioned. However, the initial capital investment required is typically between £135,000 and £145,000 for a Regis salon, and between £55,000 and £65,000 for a Supercuts salon. Average annual salon revenues for a salon which has been open five years or more are approximately £225,000 in a Regis salon and £189,000 in a Supercuts salon.salons. Sassoon is one of the world's most recognized names in hair fashion and appeals to women and men looking for a prestigious full service hair salon. Salons are usually located onin prominent high-streethigh-traffic locations and offer a full range of custom hairstyling, cutting and coloring and waving,services, as well as professional hair care products. Service revenues comprise approximately 75% of total company-owned international locations.initial capital investment required is approximately £450,000. Average annualtables on the following pages set forth the number of system wide locations (company-owned and franchised) and activity within the various salon revenues for a salon which has been open five years or more is approximately £826,000.concepts. June 30, 2014 2013 2012 Company-owned salons: SmartStyle/Cost Cutters in Walmart stores 2,574 2,490 2,441 Supercuts 1,176 1,210 1,228 MasterCuts 505 532 569 Other Value 1,846 1,990 2,133 Regis 816 862 953 Total North American salons(3) 6,917 7,084 7,324 Total International salons(4) 360 351 398 Total, Company-owned salons 7,277 7,435 7,722 Franchised salons: SmartStyle/Cost Cutters in Walmart stores 126 123 122 Supercuts 1,213 1,116 1,040 Other Value 840 843 854 Total North American salons 2,179 2,082 2,016 Total International salons(4) — — — Total, Franchised salons 2,179 2,082 2,016 Ownership interest locations: Equity ownership interest locations(5) 218 246 2,811 Grand Total, System-wide 9,674 9,763 12,549 Fiscal Years 2014 2013 2012 Company-owned salons: SmartStyle/Cost Cutters in Walmart stores 85 51 49 Supercuts 13 45 56 MasterCuts 1 3 2 Other Value 4 39 43 Regis 1 3 3 Total North American salons(3) 104 141 153 Total International salons(4) 23 12 13 Total, Company-owned salons 127 153 166 Franchised salons: SmartStyle/Cost Cutters in Walmart stores 3 1 2 Supercuts 94 70 65 Other Value 37 47 37 Total North American salons 134 118 104 Total International salons(4) — — — Total, Franchised salons 134 118 104 Fiscal Years 2014 2013 2012 Company-owned salons: SmartStyle/Cost Cutters in Walmart stores (1 ) (2 ) (1 ) Supercuts (44 ) (49 ) (48 ) MasterCuts (27 ) (40 ) (21 ) Other Value (126 ) (179 ) (174 ) Regis (47 ) (94 ) (73 ) Total North American salons(3) (245 ) (364 ) (317 ) Total International salons(4) (14 ) (59 ) (16 ) Total, Company-owned salons (259 ) (423 ) (333 ) Franchised salons: SmartStyle/Cost Cutters in Walmart Stores — — — Supercuts (19 ) (11 ) (12 ) Other Value (44 ) (58 ) (39 ) Total North American salons(3) (63 ) (69 ) (51 ) Total International salons(4) — — — Total, Franchised salons (63 ) (69 ) (51 ) Fiscal Years 2014 2013 2012 Company-owned salons: SmartStyle/Cost Cutters in Walmart stores — — — Supercuts (3 ) (14 ) 61 MasterCuts (1 ) — — Other Value (22 ) (3 ) (57 ) Regis — — — Total North American salons(3) (26 ) (17 ) 4 Total International salons(4) — — — Total, Company-owned salons (26 ) (17 ) 4 Franchised salons: SmartStyle/Cost Cutters in Walmart Stores — — — Supercuts 22 17 — Other Value 4 — (4 ) Total North American salons(3) 26 17 (4 ) Total International salons(4) — — — Total, Franchised salons 26 17 (4 ) (1) In April 2013, the Company sold Hair Club, which operated 98 locations as of June 30, 2012. These locations are excluded from system-wide location counts presented. (2) During fiscal 2012, the Company acquired two locations that were categorized within the Supercuts (one location) and International (one location) salon concepts and a franchise network of 31 locations that was categorized within the Other Value salon concept. No salons were acquired in fiscal 2013 and 2014. (3) The North American Value operating segment is comprised primarily of the SmartStyle, Supercuts, MasterCuts and Other Value salon brands. The North American Premium operating segment is comprised primarily of the Regis salon brands. (4) Canadian and Puerto Rican salons are included in the North American salon totals. (5) On September 27, 2012, the Company sold its equity interest in Provalliance. (6) During fiscal years 2014, 2013, and 2012, the Company acquired two, zero, and 11 salon locations, respectively, from franchisees. During fiscal years 2014, 2013, and 2012, the Company sold 28, 17, and seven salon locations, respectively, to franchisees. 1,936 franchise2,179 franchised salons as of June 30, 2011,2014, consisting mainly of Supercuts, Cost Cutters, First Choice Haircutters, Magicuts, and Pro-Cuts.Magicuts. These salons have been included in the discussions regarding salon counts and concepts on the preceding pages.concepts.hiringemployment, benefits and firing,wage determination, establishing prices to charge for products and services, business hours, personnel management, and capital expenditure decisions. However, the franchise agreements afford certain rights to the Company, such as the right to approve location,locations, suppliers and the sale of a franchise. Additionally, franchisees are required to conform to the Company's established operational policies and procedures relating to quality of service, training, salon design and decor, of stores, and trademark usage. The Company's field personnel make periodic visits to franchise storesfranchised salons to ensure that the storesthey are operating in conformity with the standards for each franchising program. All of the rights afforded to the Company with regard to the franchisefranchised operations allow the Company to protect its brands, but do not allow the Company to control the franchise operations or make decisions that have a significant impact on the success of the franchised salons. The Company’s franchise salons. To further ensure conformity,agreements do not give the Company may enter into the leaseany right, ability or potential to determine or otherwise influence any terms and/or conditions of employment of franchisees’ employees (except for the store site directly with the landlord,those, if any, that are specifically related to quality of service, training, salon design, decor, and subsequently sublease the sitetrademark usage), including, but not limited to, the franchisee. The franchise agreementfranchisees’ employees’ wages, employee benefits, hours of work, scheduling, leave programs, seniority rights, promotional or transfer opportunities, layoff/recall arrangements, grievance and sublease provide the Company with the right to terminate the subleasedispute resolution procedures, uniforms, and/or discipline and gain possession of the store if the franchisee fails to comply with the Company's operational policies and procedures. See Note 10 to the Consolidated Financial Statements for further information about the Company's commitments and contingencies, including leases.theira franchise agreement with the Company, each franchisee pays an initial fee for each store and ongoing royalties to the Company. In addition, for most franchise concepts, the Company collects advertising funds from franchisees and administers the funds on behalf of the concept. Franchisees are responsible for the costs of leasehold improvements, furniture, fixtures, equipment, supplies, inventory, payroll costs and certain other items, including initial working capital. The majority of franchise agreements provide the Company a right of first refusal if the store is to be sold and the franchisee must obtain the Company's approval in all instances where there is a sale of a franchise location.franchiseefranchised brands is listed below: (North America) The majority of existing TheAll new franchisees enter into development agreements, also providewhich give them the Companyright to enter into a rightdefined number of first refusal if the store is to be sold. The franchisee must obtain the Company's approval in all instances where there is a sale of the franchise. The current franchise agreement is site specific and does not provide any territorial protection to a franchisee, although some olderagreements. These franchise agreements do includeare site specific. The development agreement provides limited territorial protection. Development agreements for new markets include limited territory protection for the Supercuts concept.stores developed under those franchise agreements. Older franchisees have grandfathered expansion rights which allow them to develop stores outside of development agreements and provide them with greater territorial protections in their markets. The Company has a comprehensive impact policy that resolves potential conflicts among Supercuts franchisees and/or the Company's Supercuts locations regarding proposed salonstore sites. (North America)Cutters'Cutters franchise agreements have a 15 year term with a 15 year option to renew (at the option of the franchisee), while the majority of First Choice Haircutters'Haircutters franchise agreements have a ten year term with a five year option to renew. The majority of Magicuts'Magicuts franchise agreements have a term equal to the greater of five years or the All of the agreements also provide the Company a right of first refusal if the store is to be sold. The franchisee must obtain the Company's approval in all instances where there is a sale of thefranchise. The current franchise agreement is site specific. Franchisees may enter into development agreements with the Company which provide limited territorial protection.Pro-Cuts (North America) The majority of existing Pro-Cuts franchise agreements have a ten year term with a ten year option to renew. The agreements also provide the Company a right of first refusal if the store is to be sold or transferred. The current franchise agreement is site specific. Franchisees may enter into development agreements with the Company which provide limited territorial protection. For further description of the Company's education and training programs, see the "Salon Education and Training Programs" section of this document.maintainsutilizes various advertising, sales and promotion programsmarketing vehicles for its salons, budgeting aincluding traditional advertising, guest relationship management, digital channels and promotional/pricing based programs. A predetermined percentallocation of revenuesrevenue is used for such programs. The Company has developed promotional tactics and institutional sales messages for each of its concepts targeting certain customer types and positioning each concept in the marketplace. Print,Most marketing vehicles including radio, television,print, online and billboardtelevision advertising are developed and supervised at the Company's headquarters, but mostSalon Support headquarters; however, the majority of advertising is done increated for our local markets. The Company reviews its brand strategy with the immediate market of the particular salon.(the Funds) that provide comprehensive advertisingmarketing and sales promotion support for each system. The Supercuts advertising fund is the Company's largest advertising fund and is administered by a council consisting of primarily franchisee representatives. The council has overall control of all of the advertising fund's expenditures and operates in accordance with terms of the franchise operating and other agreements. All stores, company-owned and franchised, contribute to the Funds,advertising funds, the majority of which are allocated to the contributing market for media placement and local marketing activities. The remainder is allocated for the creation of national advertising campaigns and system widesystem-wide activities. This intensive advertising program creates significant consumer awareness, a strong concept image and high loyalty.Salon Education and Training Programs: The Company has an extensive hands-on training program for their stylists which emphasizes technical training in hairstyling and cutting, hair coloring, texturizing services and hair treatment regimes, as well as customer service skills and product sales. The objective of the training programs is to ensure that customers receive professional and quality services, which the Company believes will result in additional repeat customers, referrals and product sales. The Company has over 130 full and part-time artistic directors who train stylists the techniques to provide salon services and instruct stylists in current styling trends. Stylist training is achieved through seminars, workshops and DVD-based programs. The Company was the first in its industry to develop a DVD-based training system in its salons and currently has over 200 DVD titles designed to enhance the technical skills of stylists. The Company has customer service training programs designed to improve the interaction between employees and customers. Employees are trained in the proper techniques in greeting the customer, telephone courtesy and professional behavior through a series of professionally designed DVDs, along with instructional seminars. The Company also provides regulatory compliance training for all its field employees. This training is designed to help supervisors and stylists understand employee regulatory requirements and compliance with these standards.Salon Staff Recruiting and Retention: Recruiting quality managers and stylists is essential to the establishment and operation of successful salons. In search of salon managers, the Company's supervisory team recruits or develops and promotes from within those stylists that display initiative and commitment. The Company has been and believes it will continue to be successful in recruiting capable managers and stylists. The Company believes that its compensation structure for salon managers and stylists is competitive within the industry. Stylists benefit from the Company's high-traffic locations and receive a steady source of new business from walk-in customers. In addition, the Company offers a career path with the opportunity to move into managerial and training positions within the Company. The Company's salons are designed, built and operated in accordance with uniform standards and practices developed by the Company based on its experience. Salon fixtures and equipment are generally uniform, allowing the Company to place large orders for these items with cost savings due to the economies of scale. The size of the Company's salons ranges from 500 to 5,000 square feet, with the typical salon having about 1,200 square feet. At present, the cost to the Company of normal tenant improvements and furnishing of a new salon, including inventories, ranges from approximately $25,000 to $225,000, depending on the size of the salon and the concept. Less than ten percent of all new salons will have costs greater than normal with a cost between $225,000 and $500,000 to furnish. International Sassoon salons costs could be even greater than the ranges above. Of the total leasehold costs, approximately 70 percent of the cost is for leasehold improvements and the balance is for salon fixtures, equipment and inventories. The Company maintains its own design and real estate department, which designs and supervises the leasehold installations, furnishing and fixturing of all new company-owned salons and certain franchise locations. The Company has developed considerable expertise in designing salons. The design and real estate staff focus on visual appeal, efficient use of space, cost and rapid completion times.Salon Management Information Systems: At all of its company-owned salons, the Company utilizes a point-of-sale (POS) information system to collect daily sales information and customer demographics. Salon employees deposit cash receipts into a local bank account on a daily basis. The POS system sends the amount expected to be deposited to the corporate office, where the amount is reconciled daily with local deposits transferred into a centralized corporate bank account. The customer information is then used to determine effectiveness of promotions and the loyalty base of each salon that feed into salon operational decisions. The information is also used to generate payroll information, monitor salon performance, manage salon staffing and payroll costs, and anticipate industry pricing and staffing trends. The corporate information systems deliver information on product sales to improve its inventory control system, including recommendations for each salon of monthly product replenishments. Recent innovations to increase inventory cycle counts and install high speed connections at each salon are expected to improve stylist productivity and improve customer satisfaction with the checkout process. The goal of information systems is to maximize the overall value to the business while improving the output per dollar spent by implementing cost-effective solutions and services. Management believes that its information systems provide the Company with operational efficiencies as well as advantages inplanning and analysis which are generally not available to competitors. The Company continually reviews and improves its information systems to ensure systems and processes are kept up to date and that they will meet the growing needs of the Company. Historically, because of the Company's large size and scale requirements it has been necessary for the Company to internally develop and support its own proprietary POS information system. The Company has recently identified a third party POS software alternative that has a system that meets our current and enhanced functionality requirements and will cost significantly less to implement and support. This new technology will be implemented in our salons in fiscal year 2012 will allow the Company to stay current and meet customers' expectations. The hair care industry is highly fragmented and competitive. In every area in which the Company has a salon, there are competitors offering similar hair care services and products at similar prices. The Company faces competition within malls from companies which operate salons within department stores and from smaller chains of salons, independently owned salons and, to a lesser extent, salons which, although independently owned, are operating under franchises from a franchising company that may assist such salons in areas of training, marketing and advertising. At the individual salon level the barriers to enter the market are not considerable; however, barriers exist for chains to expand nationally due to the need to establish systems and infrastructure, recruitment of experienced hair care management and adequate store staff, and leasing of quality sites. The principal factors of competition in the affordable hair care category are quality, consistency and convenience. The Company continually strives to improve its performance in each of these areas and to create additional points of differentiation versus the competition. In order to obtain locations in shopping malls, the Company must be competitive as to rentals and other customary tenant obligations.Hair Restoration Business Strategy: Hair Club for Men and Women (Hair Club) is the largest U.S. provider of hair loss solutions and the only company offering a comprehensive menu of proven hair loss products and services. The Company leverages its strong brand, best-in-class service model and comprehensive menu of hair restoration alternatives to build an increasing base of repeat customers that generate recurring cash flow for the Company. From its traditional non-surgical hair replacement systems, to hair transplants, hair therapies and hair care products and services, Hair Club offers a solution for anyone experiencing or anticipating hair loss. The Company's operations, presented under the Hair Restoration Centers reporting unit, consist of 96 locations (29 franchise locations) in the United States and Canada. The domestic hair restoration market is estimated to generate over $4 billion annually. The competitive landscape is highly fragmented and comprised of approximately 4,000 locations. Hair Club and its franchisees have the largest market share, with approximately five percent based on customer count. In an effort to provide privacy to its customers, Hair Club offices are located primarily in office and professional buildings within larger metropolitan areas. Following is a summary of the company-owned and franchise hair restoration centers in operation at June 30, 2011, 2010, and 2009: 2011 2010 2009 62 62 57 3 4 8 — — — 4 — 2 (1 ) (4 ) (5 ) 6 — 5 (1 ) — — 67 62 62 33 33 35 — — — (4 ) — (2 ) — — — (4 ) — (2 ) — — — 29 33 33 96 95 95 Hair Restoration Growth Opportunities. The Company's hair restoration centers expansion strategy focuses on organic growth (successfully converting new leads into customers at existing centers, broadening the menu of services and products at each location and to a lesser extent, new center construction) and acquisition growth. Organic Growth. The hair restoration centers' business model is driven by productive lead generation that ultimately produces recurring customers. The primary marketing vehicle is direct response television in the form of infomercials that creates leads into the hair restoration centers' telemarketing center. Call center employees receive calls and schedule a consultation at a local hair restoration company-owned or franchise center. At the consultation, sales consultants assess the needs of each individual client and educate them on the hair restoration centers' suite of hair loss solutions. The Company's long term outlook for organic expansion remains favorable due to several factors, including favorable industry dynamics, addressing new market opportunities, menu expansion, developing new locations and new cross marketing initiatives. The aging "baby boomer" population is expanding the number of individuals within the hair restoration centers' target market. This group of individuals is entering their peak years of disposable income and has demonstrated a willingness to improve their physical appearance. In 2003, Hair Club began marketing to women and changed its name to Hair Club for Men and Women. This represents a large and relatively untapped market. Women now represent approximately 35 percent of new customers. Currently, all locations offer hair systems, hair therapy and hair care products. Among the hair restoration centers' product offerings are hair transplants. The hair restoration centers employa hub and spoke strategy for hair transplants. As of June 30, 2011, 30 locations were equipped and staffed to perform the procedure. Currently, a total of 69 hair restoration centers offer this service to their customers. The Company plans to add the capability to conduct hair transplants to more centers in future periods. Company-owned-and franchise hair restoration centers are located in markets representing 74 percent of all U.S. television (TV) households. The Company's hair restoration centers advertise on cable TV to over 86 million households. There is an opportunity to add a limited number of new centers in under penetrated markets. Hair Restoration Acquisition Growth. The Company plans to supplement organic growth with opportunistic acquisition activity. The hair restoration industry is comprised of a highly-fragmented group of 4,000 locations. This landscape provides an opportunity for consolidation. Given the existing coverage of Hair Club locations, it is anticipated that transactions may involve the acquisition of customer lists, rather than physical locations.salons, beauty schools and hair restoration centers.salons. The primary ownership interests areinterest is a 54.5% interest in Provalliance, EEG and Hair Club for Men, Ltd.Empire Education Group, Inc. (EEG), which areis accounted for as an equity method investments. The Company maintains a 46.7 percent ownership interest in Provalliance. The fiscal year 2008 merger ofinvestment. See Note 1 to the operations of the European operating subsidiaries with the Franck Provost Salon Group created a newly formed entity, Provalliance. The Franck Provost Salon Group management structure has a proven platform to build and acquire company-owned stores as well as a strong franchise operating group that is positioned for expansion. In March of 2011, the Company acquired approximately 17 percent additional equity interest in Provalliance. The Company maintains a 55.1 percent ownership interest in EEG.Consolidated Financial Statements. EEG operates accredited cosmetology schools. Contributing the Company's beauty schools in fiscal year 2008 to EEG leveragesleveraged EEG's management expertise, while enabling the Company to maintain a vested interest in the highly profitable beauty school industry. The Additionally, we utilize our EEG relationship to recruit stylists straight from beauty school.maintainshas a 50.0 percent27.1% ownership interest in Hair ClubMY Style, which is accounted for Men, Ltd. Hair Club for Men, Ltd.as a cost method investment. MY Style operates Hair Club centerssalons in Illinois and Wisconsin."Regis Salons,"SmartStyle," "Supercuts," "MasterCuts," "SmartStyle,"Regis Salons," "Cost Cutters," "Hair Masters," "First Choice Haircutters," "Magicuts" and "Hair Club for Men and Women."Magicuts." "Sassoon" Although the Company believes the use of these trademarks is an element in establishing and maintaining its reputation as a national operator of high quality hairstyling salons, and is committed to protecting these trademarks by vigorously challenging any unauthorized use, the Company's success and continuing growth are the result of the quality of its salon location selections and real estate strategies.2011,2014, the Company had approximately 55,000 full-49,000 full and part-time employees worldwide, of which approximately 48,00043,000 employees were located in the United States. None of the Company's employees is subject to a collective bargaining agreement and the Company believes that its employee relations are amicable. In February 2011 the Company announced that Randy Pearce would assume the rolefollows:Name Age Position Daniel Hanrahan 57 President and Chief Executive Officer Eric Bakken 47 Executive Vice President, Chief Administrative Officer and General Counsel Jim Lain 50 Executive Vice President, Chief Operating Officer Steven Spiegel 52 Executive Vice President and Chief Financial Officer Heather Passe 43 Senior Vice President and Chief Marketing Officer Doug Reynolds 58 Senior Vice President and Chief Information Officer Carmen Thiede 47 Senior Vice President and Chief Human Resources Officer from Paul Finkelstein, effective immediately.and Chief Executive Officer since September 2007. Mr. Finkelstein will continue to serve as Chairman ofHanrahan has served on the Board of Directors of Cedar Fair, L.P., an amusement-resort operator, since 2012 and Chief Executive Officer until the appointmentis a member of a new Chief Executive Officer, which is expected to be in February 2012. Mr. Finkelstein will become Executive Chairman upon the appointment of a new Chief Executive Officer. In connection with these executive changes, its Audit Committee and Compensation Committee.was promoted tohas served as Executive Vice President, Chief Administrative Officer and General Counsel since April 2013. He served as Executive Vice President, General Counsel and Business Development David Bortnem was promoted toand Interim Corporate Chief Operating Officer from 2012 to April 2013, and Brent Moen was promoted to Chief Financial Officer. Information relating to Executive Officersperformed the function of the Company follows:NameAgePositionPaul Finkelstein69Chairman of the Board of Directors and Chief Executive OfficerRandy Pearce56PresidentDavid Bortnem45Executive Vice President, Corporate Chief Operating OfficerEric Bakken44Executive Vice President, General Counsel and Business DevelopmentGordon Nelson60Executive Vice President, Fashion, EducationNorma Knudsen53Executive Vice President, MerchandisingBrent Moen44Senior Vice President and Chief Financial Officer Paul Finkelstein is the Chairman of the Board of Directorsprincipal executive officer between July 2012 and Chief Executive Officer. He served as Chairman of the Board of Directors, President and CEO from 2004 to 2011, as President and Chief Executive Officer from 1996 to 2004, as President and Chief Operating Officer from 1988 to 1996 and asAugust 2012, Executive Vice President from 19872010 to 1988. Randy Pearce was appointed to President in 2011. He served as Senior Executive Vice President from 2006 to 2011, as Executive Vice President from 1999 to 2006, as Chief Administrative Officer from 1999 to 2011 and as Chief Financial Officer from 1998 to 2011. Additionally, he was Senior Vice President, Finance from 1998 to 1999, Vice President of Finance from 1995 to 1997 and Vice President of Financial Reporting from 1991 to 1994. During fiscal year 2006, he was also elected Director and Audit Committee Chair of Ascena Retail Group, Inc., which operates a chain of women's apparel specialty stores. David Bortnem was appointed to Corporate Chief Operating Officer in 2011. He served as Chief Operating Officer of MasterCuts from 2006 to 2011, as Vice President for the MasterCuts division from 2003 to 2006, and as Vice President for the Regis division from 2000 to 2003. He joined the Company in 1998 as a Salon Director. Eric Bakken has served as Executive Vice President since 2010. He served as2012, Senior Vice President from 2006 to 2009, General Counsel from 2004 to 2006, as Vice President, Law from 1998 to 2004 and as a lawyer to the Company from 1994 to 1998. Gordon NelsonFashion, Education and Marketing of the CompanyChief Operating Officer since 2006. In April of 2011 the Company announced the retirement of Gordon Nelson effective June 30, 2012. He served as Senior Vice President from 1994 to 2006 and in other roles with the Company from 1977 to 1994.November 2013. Norma KnudsenSteven Spiegel has served as Executive Vice President Merchandisingand Chief Financial Officer since July 2006. SheDecember 2012. Chief Operating Officer, Trade Secret from February 1999 through 2009 and as Vice President, Trade Secret Operations from 1995 to 1999. Brent Moen was appointed to Senior Vice President and Chief FinancialMarketing Officer in 2011. Hesince July 2012.Corporate Controller from 2006 to 2011,Chief Information Officer since May 2012.of Finance from 2002 to 2006, and as Director of Finance from 2000 to 2002.Corporate Community Involvement: Many of the Company's employees volunteer their time to support charitable events for breast cancer research. Proceeds collected from such events are distributed through the Regis Foundation for Breast Cancer Research. The Company's community involvement also includes a major sponsorship role for the Susan G. Komen Twin Cities Race for the Cure. This 5K run and one mile walk is held in Minneapolis, Minnesota on Mother's Day to help fund breast cancer research, education, screening and treatment. Through its community involvement efforts, the Company has helped raise millions of dollars in fundraising for breast cancer research.bothfranchise laws and regulations in the provinces of Ontario, Alberta, Franchise ActManitoba, New Brunswick and the Ontario Franchise Act.Prince Edward Island. The offering of franchises in Canada occurs by way of a disclosure document, which contains certain disclosures required by the Ontarioapplicable provincial laws. The provincial franchise laws and Alberta Franchise Acts. Both the Ontario and Alberta Franchise Actsregulations primarily focus on disclosure requirements, although each requires certain relationship requirements such as a duty of fair dealing and the right of franchisees to associate and organize with other franchisees. Governmental regulations surrounding franchise operations in Europe are similar to those in the United States. U.SU.S. Department of Education's Title IV Higher Education Act of 1965. For the students to receive financial assistance at the school, the beauty schools must maintain eligibility requirements established by the U.SU.S. Department of Education.1614 to the Consolidated Financial Statements in Part II, Item 8 of this Form 10-K.information regarding issuers that file electronically.information.Changesgeneral economic environment may impactCompany began executing upon a number of significant foundational initiatives to support and focus on its business strategies to return the Company to sustainable long-term growth and profitability. The Company has since rolled out new POS systems and salon workstations in all of its North American salons, restructured the Company’s North American field organization, standardized plan-o-grams and simplified its retail product assortments, and enhanced its asset protection capabilities. In addition, the Company’s management engaged in a strategic review of non-core assets to focus on our core business of operating beauty salons, improving long-term profitability and maximizing shareholder value.operations. Changesthe foundational changes the Company implemented in the fourth quarter of fiscal year 2013. During the twelve months ended June 30, 2014, our same-store sales declined 4.8% from the comparable prior period. During the fiscal year ended June 30, 2014, we recorded a non-cash goodwill impairment charge of $34.9 million associated with the Regis salon concept, non-cash long-lived asset impairment charges of $18.3 million and $84.4 million of non-cash charges to establish a valuation allowance against the United States Canadian,(U.S.) and United Kingdom Asian and other European economies have an impact on our business. General economic factors that(U.K.) deferred tax assets. If we are beyond our control, such as interest rates, recession, inflation, deflation, tax rates and policy, energy costs, unemploymentunable to reverse these trends and other matters that influence consumer confidenceeffectively execute upon our foundational initiatives, our financial results may continue to be negatively affected and spending,we may impact our business. In particular, visitation patternsbe required to take future impairment charges. Such impairments could be material to our salonsconsolidated balance sheet and hair restoration centers can be adversely impacted by increases in unemployment rates and decreases in discretionary income levels.gross marginscost of service and product and operating margins. Comparable same-store sales are affected by average ticket and same-store customerguest visits. A variety of factors affect same-store customerguest visits, including the guest experience, fashion trends, competition, current economic conditions, changes in our product assortment, the successeffectiveness of marketing programs and weather conditions. These factors may cause our comparable same-store sales results to differ materially from prior periods and from our expectations. Our comparable same-store sales results for the twelve months ended June 30, 2011fiscal year 2014 declined 1.7 percent4.8% compared to the twelve months ended June 30, 2010. We impaired $74.1 million of goodwill associated with our Promenade salon concept during fiscal year 2011. We impaired $35.3 million of goodwill associated with our Regis salon concept during fiscal year 2010. We also impaired $41.7 million of goodwill associated with our salon concepts in the United Kingdom during fiscal year 2009.2013. If negative same-store sales continue and we are unable to offset the impact with operational savings, our financial results may be further affected. Weaffected and we may be required to take additional impairment charges and to impair certain long-lived assets and goodwill and suchcharges. Such impairments could be material to our consolidated balance sheet and results of operations. The concepts that have the highest likelihoodDuring fiscal years 2014 and 2012, we recorded goodwill impairment charges of impairment are Promenade, Regis,$34.9 and Hair Restoration Centers.$67.7 million, respectively, bothunablereceiving the best possible care, we need to improvefocus on attracting, training and retaining highly qualified stylists. To continue to be successful in the future we will need to continue to offer competitive wages, benefits and education and training programs to attract and retain talented stylists. Any shortcomings by stylists or the training and guidance they receive, particularly an issue affecting the quality of the guest service experience or compliance with safety and health regulations, may be attributed to the Company as a whole, thus damaging our comparable same-store sales on a long-term basis or offsetreputation and brand equity and potentially affecting our results of operations.impact with operational savings,minimum wage and changes that make collective bargaining easier, may result in increased costs to our business. Furthermore, continued declines in same-storemay cause usmanage salon staffing and payroll costs, inventory control and other functions. Certain of our management information systems are developed and maintained by external vendors, including our POS system. The failure of our management information systems to be in defaultperform as we anticipate, or to meet the continuously evolving needs of certain covenants in our financing arrangements.Failure to control costbusiness, could disrupt our business and may adversely affect our operating results.Changes inrelationships may adversely affect our operating results. We maintain key relationships with certain companies, including Walmart. Termination or modification of any of these relationships, including Walmart, could significantly reduce our revenues and have a material and adverse impact on our business, our operating results and our abilityvendors becomes unable to grow.Changes in fashion trends may impact our revenue. Changes in consumer tastes and fashion trends can have an impact on our financial performance. For example, trends in wearing longer hair may reduce the number of visits to, and therefore, sales at our salons.Changes in regulatory and statutory laws may result in increased costs to our business. With approximately 12,700 locations and 55,000 employees worldwide, our financial results can be adversely impacted by regulatory or statutory changes in laws. Due to the number of people we employ, laws that increase minimum wage rates or increase costscontinue to provide employee benefits may result in additional costs to our company. Compliance with new, complexproducts and changing laws may cause our expenses to increase. In addition, any non-compliance with these laws could result in fines, product recalls and enforcement actionsservices, or otherwise restrict our ability to market certain products, which could adversely affect our business, financial condition and results of operations. Wetheir systems fail or are also subject to laws that affect the franchisor-franchisee relationship.If we are not able to successfully compete in our business segments, our financial results may be affected. Competition on a market by market basis remains strong. Therefore, our ability to raise prices in certain markets can be adversely impacted by this competition. If we are not able to raise prices, our ability to grow same-store sales and increase our revenue and earnings may be impaired.If our joint ventures are unsuccessful our financial results may be affected. We have entered into joint venture arrangements with other companies in the hair salon and beauty school businesses in order to maintain and expand our operations in the United States, Asia and continental Europe. If our joint venture partners are unwilling or unable to devote their financial resources or marketing and operational capabilities to our joint venture businesses, or if any of our joint ventures are terminated,compromised, we may not be able to realize anticipated revenuessuffer operational difficulties and profits in the countries where our joint ventures operate and our business could be materially adversely affected. If our joint venture arrangements are not successful, we may have a limited ability to terminate or modify these arrangements. If any of our joint ventures are terminated, there can be no assurance that we will be able to attract new joint venture partners to continue the activities of the terminated joint venture or to operate independently in the countries in which the terminated joint venture conducted business. During fiscal year 2011, we recorded an impairment of $9.2 million related to our investment in MY Style. During fiscal year 2009, we recorded impairments of $25.7 million and $7.8 million ($4.8 million net of tax) related to our investment in Provalliance and investment in and loans to Intelligent Nutrients, LLC, respectively. Due to economic and other factors, we may be required to take additional impairment charges related to our investments and such impairments could be material to our consolidated balance sheet and results of operations. In addition, our joint venture partners may be required to take impairment charges related to long-lived assets and goodwill, and our share of such impairment charges could be material to our consolidated balance sheet and results of operations. Our share of our investment's goodwill balances as of June 30, 2011 is $102.1 million.We are subject to default risk on our accounts and notes receivable. We have outstanding accounts and notes receivable subject to collectability. If the counterparties are unable to repay the amounts due or if payment becomes unlikely our results of operations would be adversely affected. For example, during the twelve months ended June 30, 2011 the Company recorded a $31.2 million valuation reserve on the note receivable from the purchaser of Trade Secret to reflect the net realizable value. that we sell are licensed to be carried exclusively by professional salons. The products we purchase for sale in our salons are purchased pursuant to purchase orders, as opposed to long-term contracts and generally can be terminated by the producer without much advance notice. Should the variousour product manufacturers decide to utilize other distribution channels, such as large discount retailers, it could negatively impact product sales revenue. In addition as e-commerce evolves and expands, our product sales could negatively be impacted if we are unable to sell retail products in a similar fashion.earned from product sales.Currently,Historically, we managehave managed the risk related to fluctuations in interestthese rates through the use of variablefixed rate debt instruments and other financial instruments.We rely heavily onmanagement information systems. If our systems fail to perform adequately or if we experience an interruption in their operation, our results of operations may be affected. The efficient operation of our business is dependent on our management information systems. We rely heavily on our management information systems to collect daily sales information and customer demographics, generate payroll information, monitor salon performance, manage salon staffing and payroll costs, inventory control and other functions. The failure of our management information systems to perform as we anticipate, or to meet the continuously evolving needs of our business, could disrupt our business and may adversely affect our operating results. The Company plans to implement a new point-of-sale system in our salons during fiscal year 2012. Failure to effectively implement the point-of-sale system may adversely affect our operating results.If we fail to protect the security of personal information about our customers, we could be subject to costly government enforcement actions or private litigation and our reputation could suffer. The nature of our business involves processing, transmission and storage of personal information about our customers. If we experience a data security breach, we could be exposed to government enforcement actions and private litigation. In addition, our customers could lose confidence in our ability to protect their personal information, which could cause them to stop visiting our salons altogether. Such events could lead to lost future sales and adversely affect our results of operations.Certain of the termsprovisions of the convertible notes we issued in July 2009 may adversely affectfashion trends can have an impact on our financial condition and operating results and impose other risks. In July 2009, we issued $172.5 million aggregate principal amount of our 5.0 percent convertible senior notes due 2014 in a public offering. Certain terms of the notes we issued may adversely affect our financial condition and operating results or impose other risks, such as the following:•Holders of notes may convert their notes into shares of our common stock, which may dilute the ownership interest of our shareholders,•If we elect to settle all or a portion of the conversion obligation exercised by holders of the notes through the payment of cash, it could adversely affect our liquidity,•Holders of notes may require us to purchase their notes upon certain fundamental changes, and any failure by us to purchase the notes in such event would result in an event of default with respect to the notes,•The fundamental change provisions contained in the notes may delay or prevent a takeover attempt of the Company that might otherwise be beneficial to our investors,•Recent changes in the accounting method for convertible debt securities that may be settled in cash require us to include both the current period's amortization of the debt discount and the instrument's coupon interest as interest expense, which will decrease our financial results,•Our ability to pay principal and interest on the notes depends on our future operating performance and any failure by us to make scheduled payments could allow the note holders to declare all outstanding principal and interest to be due and payable, result in termination of other debt commitments and foreclosure proceedings by other lenders, or force us into bankruptcy or liquidation, and•The debt obligations represented by the notes may limit our ability to obtain additional financing, require us to dedicate a substantial portion of our cash flow from operations to pay our debt, limit our ability to adjust rapidly to changing market conditions and increase our vulnerability to downtowns in general economic conditions in our business.270,000170,000 square foot, fourthree building complex in Edina, Minnesota that is owned or leased by the Company. Boca Raton, Florida; and Chattanooga, Tennessee. These offices are occupied under long-term leases.maycan be expanded to 290,000 square feet to accommodate future growth. and hair restoration centers under leases or license agreements. Substantially all of its North American locations in regional malls are operating under leases with an original term of at least ten years. Salons operating within strip centers and Walmart Supercenters have leases with original terms of at least five years, generally with the ability to renew, at the Company's option, for one or more additional five year periods. Salons operating within department stores in Canada and Europe operate under license agreements, while freestanding or shopping center locations in those countries have real property leases comparable to the Company's domesticNorth American locations.certainapproximately 80% of our franchisees operate and has entered into corresponding sublease arrangements with the franchisees. These leases have a five year initial term and one or more five year renewal options. All lease costs are passed through to the franchisees. Remaining franchisees who do not enter into sublease arrangements with the Company negotiate and enter into leases on their own behalf.expire.expire or identify and secure other suitable locations. See Note 108 to the Consolidated Financial Statements in Part II, Item 8 of this Form 10-K.Company's counsel believes thatactions are being vigorously defended, the Company has valid defenses in these matters, it could in the future incur judgments or enter into settlements of claims that could have a material adverse effect on its results of operations in any particular period. During fiscal year 2011,settledwas a legal claim with thenominal defendant, and nine current and former ownerdirectors and officers of Hair Club for $1.7 million. During fiscal year 2010, the Company settled two legalwere named defendants, in a shareholder derivative action in Minnesota state court. The derivative shareholder action alleged that the individual defendants breached their fiduciary duties to the Company in connection with their approval of certain executive compensation arrangements and certain related party transactions. The Board of Directors appointed a Special Litigation Committee to investigate the claims regarding certain customer and employee matters for an aggregate chargeallegations made in the derivative action, and to decide on behalf of $5.2 million plusthe Company whether the claims and allegations should be pursued. In April 2014, the Special Litigation Committee issued a commitment to provide discount coupons. Duringreport and concluded the twelve months endedclaims and allegations should not be pursued, and in June 30, 2011 and 2010, payments aggregating $4.3 million and $0.9 million, respectively, were made.Reserved
Mine Safety Disclosures Item 5. Market for Registrant's Common Equity, Related Stockholder Matters and Issuer Repurchase of Equity Securities(a)Market Price of and Dividends on the Registrant's Common Equity and Related Stockholder Matters; Performance GraphItem 5. Market for Registrant's Common Equity, Related Stockholder Matters and Issuer Repurchase of Equity Securities 20112014 and 20102013 as reported by the New York Stock Exchange (under the symbol "RGS"). The quotations reflect inter-dealer prices, without retail mark-up, mark-down or commission, and may not necessarily represent actual transactions.2011,2014, Regis shares were owned by approximately 21,00017,000 shareholders based on the number of record holders and an estimate of individual participants in security position listings. The common stock price was $13.59$14.46 per share on August 12, 2011.2014. Fiscal Years 2011 2010 2014 2013 High Low High Low High Low High Low $ 19.53 $ 12.84 $ 18.46 $ 11.90 $ 17.97 $ 14.50 $ 19.54 $ 16.26 21.69 15.58 17.54 14.89 16.15 13.99 19.59 15.79 18.47 16.25 19.02 14.95 14.64 11.48 18.69 16.34 19.20 13.83 20.46 15.55 14.20 12.62 19.14 16.04 quarterly dividends of $0.06 per share per quarter during eachfiscal year 2013 and the first and second quarters of fiscal year 2014. In December 2013, the three month periods ended March 31, 2011 and June 30, 2011. The Company paid quarterly dividendsannounced a new capital allocation policy. As a result of $0.04 per share in fiscal years 2010, and during eachthis policy, the Board of the three month periods ended September 30, 2010 and December 31, 2010. The Company expectsDirectors elected to continue payingdiscontinue declaring regular quarterly dividends in the foreseeable future.Notwithstanding anything to the contrary set forth in any of our previous filings under the Securities Act of 1933 or the Securities Exchange Act of 1934 that might incorporate future filings or this Annual Report, the following performance graph and accompanying data shall not be deemed to be incorporated by reference into any such filings. In addition, they shall not be deemed to be "soliciting material" or "filed" with the SEC.AutoZone, Inc.Boyd Gaming Corp., Brinker International, Inc., CBRLOuterwall, Inc. (formerly Coinstar, Inc.), Cracker Barrel Old Country Store, DineEquity, Inc., Fossil Group, Inc., DineEquity,Fred's, Inc., Foot Locker,Keurig Green Mountain, Inc., GameStop Corp., H&R Block, Inc., Jack in the Box, Inc., Papa John's International,Panera Bread Co., Penn National Gaming, Inc., PetSmart,Revlon, Inc., RadioShack Corp.Sally Beauty Holdings, Inc., Service Corporation International, The Cheesecake Factory, Inc. and Starbucks Corp.Ulta Salon, Cosmetics & Fragrance Inc. The Peer Group is a self-constructed peer group of companies that have comparable annual revenues, the customerguest service element is a critical component to the business and a target of moderate customersguests in terms of income and style, excluding apparel companies.Table The Peer Group is the same group of Contents20062009 and thosethat dividends, if any, were reinvested.20112014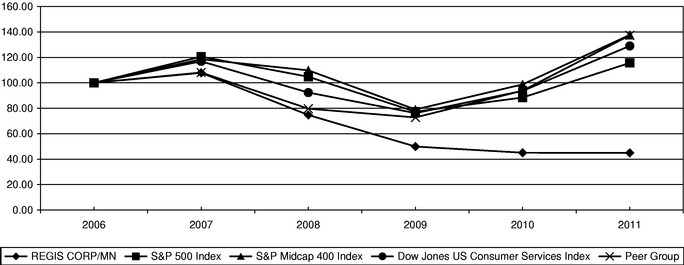
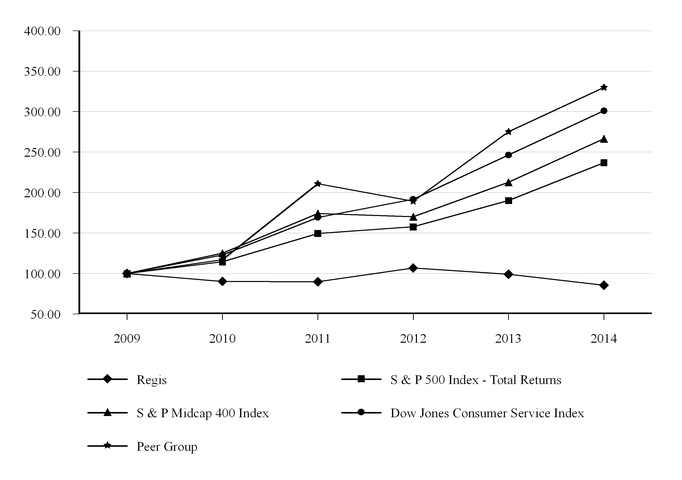
June 30, 2006 2007 2008 2009 2010 2011 2009 2010 2011 2012 2013 2014 $ 100.00 $ 107.86 $ 74.71 $ 49.90 $ 45.06 $ 44.86 $ 100.00 $ 90.29 $ 89.85 $ 106.87 $ 99.03 $ 85.58 100.00 120.59 104.77 77.30 88.46 115.61 100.00 114.43 149.55 157.70 190.18 236.98 100.00 118.51 109.81 79.04 98.74 137.63 100.00 124.93 174.13 170.07 212.90 266.63 100.00 116.91 92.34 76.21 93.68 128.99 100.00 122.92 169.26 191.77 246.31 301.09 100.00 108.11 79.68 72.77 93.83 137.32 100.00 117.07 210.96 189.19 275.21 329.90 (b) Share Repurchase Program(BOD)(Board) approved a stock repurchase program. Originally, the program authorized up to $50.0 million to be expended for the repurchase of the Company's stock. The BODBoard elected to increase this maximum to $100.0 million in August 2003, to $200.0 million on May 3, 2005 and to $300.0 million on April 26, 2007. The timing and amounts of any repurchases will depend on many factors, including the market price of the common stock and overall market conditions. Historically, repurchases to date have been made primarily to eliminate the dilutive effect of shares issued in conjunction with acquisitions, restricted stock grants and stock option exercises. All repurchased shares become authorized but unissued shares of the Company. This repurchase program has no stated expiration date. As of June 30, 2014, a total accumulated 7.7 million shares have been repurchased for $241.3 million. As of June 30, 2014, $58.7 million remained outstanding under the approved stock repurchase program. Fiscal Years 2014 2013 2012 Repurchased shares — 909,175 — Average Price (per share) $ — $16.32 $ — Price range (per share) $ — $15.99 - $16.84 $ — Total $ — $14.9 million $ — Fiscal Years 2014 2013 2012 2011 2010 (Dollars in thousands, except per share data) Revenues $ 1,892,437 $ 2,018,713 $ 2,122,227 $ 2,180,181 $ 2,216,648 Operating (loss) income(a) (33,990 ) 12,326 (2,167 ) (14,282 ) 76,881 (Loss) income from continuing operations(a) (137,080 ) 4,166 (51,743 ) (20,939 ) 25,728 (Loss) income from continuing operations per diluted share (2.43 ) 0.07 (0.91 ) (0.37 ) 0.46 Dividends declared, per share 0.12 0.24 0.24 0.20 0.16 June 30, 2014 2013 2012 2011 2010 (Dollars in thousands) Total assets, including discontinued operations $ 1,415,949 $ 1,390,492 $ 1,571,846 $ 1,805,753 $ 1,919,572 Long-term debt and capital lease obligations, including current portion 293,503 174,770 287,674 313,411 440,029 (a) The following significant items affected operating (loss) income and (loss) income from continuing operations: Fiscal Years 2014 2013 2012 2014 2013 2012 2014 2013 2012 (Dollars in millions) % of Total Revenues Service revenues $ 1,480.1 $ 1,563.9 $ 1,643.9 78.2 % 77.5 % 77.5 % 70 — (30 ) Product revenues 371.5 415.7 440.0 19.6 20.6 20.7 (100 ) (10 ) 20 Franchise royalties and fees 40.9 39.1 38.3 2.2 1.9 1.8 30 10 10 Cost of service(1) 907.3 930.7 941.7 61.3 59.5 57.3 180 220 (10 ) Cost of product(2) 187.2 228.6 221.6 50.4 55.0 50.4 (460 ) 460 10 Site operating expenses 202.4 203.9 207.0 10.7 10.1 9.8 60 30 10 General and administrative 172.8 226.7 249.6 9.1 11.2 11.8 (210 ) (60 ) (130 ) Rent 322.1 324.7 331.8 17.0 16.1 15.6 90 50 30 Depreciation and amortization 99.7 91.8 105.0 5.3 4.5 4.9 80 (40 ) 70 Goodwill impairment 34.9 — 67.7 1.8 — 3.2 180 (320 ) (20 ) Interest expense 22.3 37.6 28.2 1.2 1.9 1.3 (70 ) 60 (30 ) Interest income and other, net 2.0 35.4 5.1 0.1 1.8 0.2 (170 ) 160 — Income taxes(3) (71.1 ) 10.0 4.4 (130.9 ) (99.3 ) 17.5 N/A N/A N/A Equity in loss of affiliated companies, net of income taxes (11.6 ) (16.0 ) (30.9 ) (0.6 ) (0.8 ) (1.5 ) 20 70 (180 ) Income (loss) from discontinued operations, net of taxes 1.4 25.0 (62.4 ) 0.1 1.2 (2.9 ) (110 ) 410 (350 ) (1) Computed as a percent of service revenues and excludes depreciation and amortization expense. (2) Computed as a percent of product revenues and excludes depreciation and amortization expense. (3) Computed as a percent of (loss) income from continuing operations before income taxes and equity in loss of affiliated companies. The income tax (expense) benefit basis point change is noted as not applicable (N/A) as the discussion below is related to the effective income tax rate. Fiscal Years 2014 2013 2012 (Dollars in thousands) North American Value salons: SmartStyle $ 487,722 $ 509,537 $ 514,050 Supercuts 343,372 343,464 343,764 MasterCuts 127,758 146,506 159,627 Other Value 471,231 516,074 553,101 Total North American Value salons 1,430,083 1,515,581 1,570,542 North American Premium salons 333,858 373,820 410,563 International salons 128,496 129,312 141,122 Consolidated revenues $ 1,892,437 $ 2,018,713 $ 2,122,227 Percent change from prior year (6.3 )% (4.9 )% (2.7 )% Salon same-store sales decrease(1) (4.8 )% (2.4 )% (3.5 )% (1) Same-store sales are calculated on a daily basis as the total change in sales for company-owned locations which were open on a specific day of the week during the current period and the corresponding prior period. Quarterly and fiscal year same-store sales are the sum of the same-store sales computed on a daily basis. Locations relocated within a one mile radius are included in same-store sales as they are considered to have been open in the prior period. International same-store sales are calculated in local currencies to remove foreign currency fluctuations from the calculation. Fiscal Years Factor 2014 2013 2012 Same-store sales (4.8 )% (2.4 )% (3.5 )% Closed salons (2.6 ) (3.3 ) (2.3 ) New stores and conversions 0.8 1.3 1.3 Other 0.3 (0.5 ) 1.8 (6.3 )% (4.9 )% (2.7 )% Fiscal Years 2014 2013 2012 SmartStyle (5.4 )% (1.1 )% (4.3 )% Supercuts 0.5 % (0.7 )% (0.3 )% MasterCuts (9.4 )% (5.1 )% (3.3 )% Other Value (5.4 )% (2.8 )% (2.7 )% Total North American Value salons (4.5 )% (2.0 )% (2.9 )% North American Premium salons (6.7 )% (3.1 )% (4.2 )% International salons (1.5 )% (4.3 )% (9.1 )% Consolidated same-store sales (4.8 )% (2.4 )% (3.5 )% Interest rate % Fiscal Years June 30, Maturity Dates 2014 2013 2014 2013 (fiscal year) (Dollars in thousands) Convertible senior notes(1)(2) 2015 5.0% 5.0% $ 172,246 $ 166,454 Senior term notes 2018 5.75 — 120,000 — Revolving credit facility 2018 — — — — Equipment and leasehold notes payable 2015 - 2016 4.90 - 8.75 4.90 - 8.75 1,257 8,316 293,503 174,770 Less current portion (1) (173,501 ) (173,515 ) Long-term portion $ 120,002 $ 1,255 (1) As of June 30, 2013, the Company included the convertible senior notes within long-term debt, current portion on the Consolidated Balance Sheet as the holders of the senior convertible notes had the option to convert at any time after April 15, 2014. (2) In July 2014, the Company settled the convertible senior notes with $172.5 million in cash. As of June 30, 2014 28.9 % 1,200 2013 16.9 (750 ) 2012 24.4 110 (1) Represents the basis point change in debt to capitalization as compared to prior fiscal year-end (June 30). Payments due by period Contractual Obligations Total 1 - 3 years 3 - 5 years (Dollars in thousands) On-balance sheet: Debt obligations $ 292,246 $ 172,246 $ — $ 120,000 $ — Capital lease obligations 1,257 1,255 2 — — Other long-term liabilities 16,338 3,242 3,570 2,166 7,360 Total on-balance sheet 309,841 176,743 3,572 122,166 7,360 Off-balance sheet(a): Operating lease obligations 952,010 299,067 411,510 178,635 62,798 Interest on long-term debt and capital lease obligations 24,705 7,321 13,800 3,584 — Total off-balance sheet 976,715 306,388 425,310 182,219 62,798 Total $ 1,286,556 $ 483,131 $ 428,882 $ 304,385 $ 70,158 (a) In accordance with accounting principles generally accepted in the United States of America, these obligations are not reflected in the Consolidated Balance Sheet. As of June 30, 2011, 2010, and 2009, a total accumulated 6.8 million shares have been repurchased for $226.5 million. As of June 30, 2011, $73.5 million remains to be spent on share repurchases under this program. its common stock through its share repurchase program during the twelve months ended June 30, 2011.CEO and CFO Certifications The certifications by our president and chief financial officer required under Section 302 of the Sarbanes-Oxley Act of 2002, have been filed as exhibits to this Annual Report on Form 10-K. Our CEO's annual certification pursuant to NYSE Corporate Governance Standards Section 303A.12(a) that our CEO was not aware of any violation by the Company of the NYSE's Corporate Governance listing standards was submitted to the NYSE on November 15, 2010. Item 6. Selected Financial Data Beginning with the period ended December 31, 2008 the operations of Trade Secret concept within the North American reportable segment were accounted for as discontinued operations. All periods presented will reflect Trade Secret as a discontinued operation. The following discussion of results of operations will reflect results from continuing operations. Discontinued operations will be discussed at the end of this section. The following table sets forth, in thousands (except per share data), for the periods indicated, selected financial data derived from the Company's Consolidated Financial Statements in Part II, Item 8. 2011 2010 2009 2008 2007 $ 2,325,869 $ 2,358,434 $ 2,429,787 $ 2,481,391 $ 2,373,338 3,948 97,218 109,073 173,340 141,506 (8,905 ) 39,579 6,970 83,901 67,739 (0.16 ) 0.71 0.16 1.92 1.48 1,805,753 1,919,572 1,892,486 2,235,871 2,132,114 313,411 440,029 634,307 764,747 709,231 $ 0.20 $ 0.16 $ 0.16 $ 0.16 $ 0.16 (a)Revenues from salons, schools or hair restorations centers acquired each year were $25.6, $17.8, $82.1, $110.0, and $105.1 million during fiscal years 2011, 2010, 2009, 2008, and 2007, respectively. Revenues from the 51 accredited cosmetology schools contributed to Empire Education Group, Inc. on August 1, 2007 were $5.6, and $68.5 million in fiscal years 2008 and 2007, respectively. Revenues from the deconsolidated European franchise salon operations were $36.2 and $57.0 million in fiscal years 2008 and 2007, respectively.(b)The following significant items affected operating income:•During fiscal year 2011, the Company recorded a $31.2 million valuation reserve related to the note receivable with the purchaser of Trade Secret.•An impairment charge of $74.1 million associated with the Company's Promenade salon concept was recorded in fiscal year 2011. An impairment charge of $35.3 million associated with the Company's Regis salon concept was recorded in fiscal year 2010. An impairment charge of $41.7 million associated with the Company's United Kingdom salon division was recorded in fiscal year 2009. An impairment charge of $23.0 million associated with the Company's accredited cosmetology schools was recorded in fiscal year 2007.•Loss development was recorded in fiscal years 2011, 2010, 2009, 2008, and 2007 related to a change in estimate of the Company's self insurance accruals, primarily prior years' workers' compensation claims reserves. Site operating expenses increased by $1.4 million, and decreasedby $1.7, $9.9, $6.9, and $10.0 million in fiscal years 2011, 2010, 2009, 2008, and 2007, respectively, as a result in the change in estimate.•Expenses of $6.7, $6.4, $10.2, $6.1, and $5.1 million related to the impairment of property and equipment at underperforming locations were recorded during fiscal years 2011, 2010, 2009, 2008, and 2007, respectively.•Charges of $2.1 and $5.7 million were recorded in fiscal years 2010 and 2009, respectively associated with disposal charges and lease termination fees related to the closure of salons other than in the normal course of business.•During fiscal year 2011, the Company settled a legal claim with the former owner of Hair Club2013 for $1.7$14.9 million. Fiscal year 2010 included a $5.2 million charge related to the settlement of two legal claims regarding certain customer and employee matters.•Operating loss from the 51 accredited cosmetology schools contributed to Empire Education Group, Inc. on August 1, 2007 was $0.3 and $18.6 million in fiscal years 2008 and 2007, respectively. Operating income from the deconsolidated European franchise salon operations was $5.1 and $7.5 million in fiscal years 2008 and 2007, respectively.(c)The following significant items affected (loss) income from continuing operations and (loss) income from continuing operations per diluted share:•Upon the March 2011 acquisition of the approximately 17 percent additional ownership interest in Provalliance, the Company recognized a net gain of approximately $2.4 million representing the settlement of a portion of the company's equity put liability and additional ownership of the Frank Provost Group in Provalliance.•During fiscal year 2011, the Company recorded an $9.2 million other than temporary impairment on its investment in preferred shares of Yamano and premium paid at the time of it initial investment in MY Style. Impairment charges of $25.7 and $7.8 million associated with the Company's investment in Provalliance and for the full carrying value of our investment in and loans to Intelligent Nutrients, LLC were recorded in fiscal year 2009.•Fiscal year 2010 includes interest expense of $18.0 million related to make-whole payments and other fees associated with the repayment of private placement debt.•An income tax charge of approximately $3.8 million was recorded during fiscal year 2009 associated with an adjustment to correct our prior year deferred income tax balances. An income tax charge of approximately $3.0 million of which $1.3 million was recorded through income tax expense and $1.7 million was recorded through other comprehensive income during fiscal year 2008 was associated with repatriating approximately $30.0 million of cash previously considered to be indefinitely reinvested outside of the United States. Item 7. Management's Discussion and Analysis of Financial Condition and Results of Operations Management's Discussion and Analysis of Financial Condition and Results of Operations (MD&A) is designed to provide a reader of our financial statements with a narrative from the perspective of our management on our financial condition, results of operations, liquidity and certain other factors that may affect our future results. Our MD&A is presented in five sections:•Management's Overview•Critical Accounting Policies•Overview of Fiscal Year 2011 Results•Results of Operations•Liquidity and Capital ResourcesMANAGEMENT'S OVERVIEW Regis Corporation (RGS) owns or franchises beauty salons and hair restoration centers. As of June 30, 2011, we owned, franchised or held ownership interests in approximately 12,700 worldwide locations. Our locations consisted2014, a total accumulated 7.7 million shares have been repurchased for $241.3 million. As of 9,819 system wide North American and International salons, 96 hair restoration centers, and 2,786 locations in which we maintain an ownership interest less than 100 percent. Our salon concepts offer generally similar products and services and serve mass market consumers. Our salon operations are organized to be managed based on geographical location. Our North American salon operations include 9,419 salons, including 1,936 franchise salons, operating in the United States, Canada and Puerto Rico primarilyJune 30, 2014, $58.7 million remained outstanding under the trade names of Regis Salons, MasterCuts, SmartStyle, Supercuts and Cost Cutters. Our international salon operations include 400 salons located in Europe, primarily in the United Kingdom. Hair Club for Men and Women includes 96 North American locations, including 29 franchise locations. During fiscal year 2011, we had approximately 55,000 corporate employees worldwide. Our fiscal year 2012 growth strategy is focused on increasing customer visits. We plan to execute our strategy through four focus areas of putting customers and stylists first, leveraging the power of our salon brands, technology and connectivity, and delivering improved financial performance. Initiatives of these four focus areas include:•Putting customers and stylists first through improving both the experience for the person in the chair and behind the chair. The Company will work on attracting, developing and retaining the best stylists through orientation programs, training and development and rewards and recognition.•Leveraging the power of our salon brands through focusing on the best brands within the best markets, enhanced focus and alignment and aggressive strategies including discounting.•Using technology and connectivity, including internet in the salons, to enhance effectiveness of field management and improve customer satisfaction and retention.•Delivering improved financial performance through undertaking cost savings initiatives in the range of $20.0 to $30.0 million with examples including renegotiated interest rates and a planned reduction in travel costs.Salon Business The strength of our salon business is in the fundamental similarity and broad appeal of our salon concepts that allow flexibility and multiple salon concept placements in shopping centers and neighborhoods. Each concept generally targets the middle market customer, however, each attracts a different demographic. We believe there are growth opportunities in all of our salon concepts. When commercial opportunities arise, we anticipate testing and developing new salon concepts to complement our existing concepts. We execute our salon growth strategy by focusing on real estate. Our salon real estate strategy is to add new units in convenient locations with good visibility and customer traffic, as well as appropriate trade demographics. Our various salon and product concepts operate in a wide range of retailing environments, including regional shopping malls, strip centers and Walmart Supercenters. We believe that the availability of real estate will augment our ability to achieve the aforementioned long-term growth objectives. In fiscal 2012, our outlook for constructed salons is approximately 285 units. In fiscal year 2012, capital expenditures and acquisitions are expected to be approximately $95.0 and $25.0 million, respectively. Organic salon revenue is achieved through the combination of new salon construction and salon same-store sales results. Once customer visitations stabilize, we expect we will continue with our historical trend of building several hundred company-owned salons. We anticipate our franchisees will open approximately 100 to 120 salons in fiscal year 2012. Older, unprofitable salons will be closed or relocated. Our long-term outlook for our salon business is annual consolidated low single digit same-store sales increases. We project our annual fiscal year 2012 consolidated same-store sales to be in a range of negative 1.0 percent to positive 1.0 percent. Historically, our salon acquisitions have varied in size from as small as one salon to over one thousand salons. The median acquisition size is approximately ten salons. From fiscal year 1994 to fiscal year 2011, we acquired 8,050 salons, net of franchise buybacks. Once customer visitations normalize, we anticipate adding several hundred company-owned salons each year from acquisitions. Some of these acquisitions may include buying salons from our franchisees.Hair Restoration Business In December 2004, we acquired Hair Club for Men and Women. Hair Club for Men and Women is a provider of hair loss solutions with an estimated five percent share of the $4 billion domestic market. This industry is comprised of numerous locations domestically and is highly fragmented. As a result, we believe there is an opportunity to consolidate this industry through acquisition. Expanding the hair loss business organically and through acquisition would allow us to add incremental revenue which is neither dependent upon, nor dilutive to, our existing salon businesses. Our organic growth plans for the hair restoration business include the construction of a modest number of new locations in untapped markets domestically and internationally. However, the success of our hair restoration business is not dependent on the same real estate criteria used for salon expansion. In an effort to provide confidentiality for our customers, our hair restoration centers operate primarily in professional or medical office buildings. Further, the hair restoration business is more marketing intensive. As a result, organic growth at our hair restoration centers will be dependent on successfully generating new leads and converting them into hair restoration customers. Our growth expectations for our hair restoration business are not dependent on referral business from, or cross marketing with, our hair salon business, but these concepts continue to be evaluated closely for additional growth opportunities.Statements contained in Part II, Item 8 of this Form 10-K.Statements. We believe the following accounting policies are most critical to aid in fully understanding and evaluating our reported financial condition and results of operations.InvestmentInvestments In and Loans to Affiliates The Company also has loan receivables from certain of these entities. Investments accounted for under the equity method are recorded at the amount of the Company's investment and adjusted each period for the Company's share of the investee's income or loss. Investments are reviewed for changes in circumstance or the occurrence of events that suggest the Company's investment may not be recoverable.year 2011, weyears 2013 and 2012, the Company recorded an impairmentnoncash impairments of $9.2$17.9 and $19.4 million, respectively, related to ourits investment in MY Style. DuringEEG. Due to economic, regulatory and other factors, including declines in enrollment, revenue and profitability in the for-profit secondary educational market, the Company may be required to take additional noncash impairment charges related to its investments and such noncash impairments could be material to its consolidated balance sheet and results of operations. Based on EEG's annual goodwill impairment assessment during fiscal year 2009, we recorded2014, the Company's portion of EEG's estimated fair value exceeds carrying value of its investment by approximately 10 percent. Any meaningful underperformance against plan or reduced outlook by EEG, changes to the carrying value of EEG or further erosion in valuations of the for-profit secondary educational market could lead to other than temporary impairments of $25.7 and $7.8 million ($4.8 million net of tax) related to our investment in Provalliance and investment in and loans to Intelligent Nutrients, LLC, respectively.Note Receivables, Net The note receivable balances within the Company's Consolidated Balance Sheet primarily include a note receivable with the purchaser of Trade Secret and a note receivable related to the Company's investment in MY Style. The balances are presented net of aEEG. In addition, EEG may be required to record noncash impairment charges related to long-lived assets or establish valuation reserve for expected losses. The Company monitors the financial conditionallowances against certain of its counterparties with an outstanding note receivabledeferred tax assets and records provisions for estimated losses on receivables when it believes the counterparties are unableour share of such noncash impairment charges or valuation allowances could be material to make their required payments. The valuation reserve is the Company's best estimateconsolidated balance sheet and results of the amount of probable credit losses related to existing notes receivable.the third quarter of fiscal year 2011, the Company did not receive a scheduled interest payment related to the outstanding note receivable with the purchaser of Trade Secret, the fair value of the collateral decreased to a level below the carrying value of the outstanding note receivable,years 2014, 2013 and the purchaser of Trade Secret provided the Company with a new five year business plan that was well below the purchaser of Trade Secret's original projections. Due to these factors that occurred during the third quarter of fiscal year 2011, the Company evaluated the note receivable for impairment based on a probability weighted expected future cash flow analysis. During the third quarter of fiscal year 2011,2012, the Company recorded a $9.0its share, $21.2, $2.1 and $8.9 million, valuation reserverespectively, of noncash impairment charges recorded directly by EEG for the excess of the carrying value of the note receivable over the present value of expected future cash flows. During the fourth quarter of fiscal year 2011, the Company did not receive a scheduled interest payment related to the outstanding note receivable with the purchaser of Trade Secretgoodwill and the fair value of the collateral continued to decreaselong-lived and was at a level significantly below the carrying value of the outstanding note receivable. In addition, the Company received updated financial projections that were below the projections received during the third quarter of fiscal year 2011. Due to these negative financial events in the fourth quarter of fiscal year 2011, the Company performed an extensive evaluation on the Company's option to realize the collateral under the note receivable and recorded an additional $22.2 million valuation reserve that fully reserved the carrying value of the note receivable asintangible assets. As of June 30, 2011. Thethe estimated fair valuevalues of the reporting units based on discounted future cash flows that utilizeutilizing estimates in annual revenue, grossservice and product margins, fixed expense rates, allocated corporate overhead, and long-term growth rates for determining terminal value. The Company's estimatedfuture cash flows also take into consideration acquisition integration and maturation. Where available and as appropriate, comparative market multiples are used to corroboratein conjunction with the results of the discounted cash flow. The Company considers its various concepts to be reporting units when testing for goodwill impairment because that is where the Company believes the goodwill resides.flows. The Company periodically engages third-party valuation consultants to assist in evaluation ofevaluating the Company's estimated fair value calculations. the situations where a reporting unit's carrying value exceeds its estimated fair value, the amount of the impairment loss must be measured. The measurement of impairment is calculated by determining the implied fair value of a reporting unit's goodwill. In calculating the implied fair value of goodwill, the fair value of the reporting unit is allocated to all other assets and liabilities of that unit based on the relative fair values under the assumption of a taxable transaction. The excess of the fair value of the reporting unit over the amount assigned to its assets and liabilities is the implied fair value of goodwill. The goodwill impairment is measured as the excess of the carrying value of goodwill over its implied fair value.analysistesting of goodwill, as of February 28, 2011, a $74.1 million impairment charge was recorded within continuing operations for the excessrespective fair values of the Company's reporting units with goodwill exceeded carrying valuevalues by greater than 20.0%.goodwill overfiscal year 2014, the implied fair value ofCompany experienced two triggering events that resulted in the Company testing its goodwill for impairment. First, the Promenade salon concept. Historically, goodwillCompany redefined its operating segments to reflect how the chief operating decision maker evaluates the business as a result of restructuring the Company's North American field organization. The field reorganization, which impacted all North American salons except for salons in the mass premium category, was tested annually for impairment during the third quarter, as of February 28, of each fiscal year. Effectiveannounced in the fourth quarter of fiscal year 2011,2013 and completed in the Company adopted a new accounting policy whereby the annual impairment review of goodwill will be performed during the fourth quarter, as of April 30 instead of the thirdsecond quarter of each fiscal year.year 2014. The changeCompany did not completely operate under the realigned operating structure prior to the second quarter of fiscal year 2014.testing date was made to better align the annual goodwill impairment test with the timingtest. The disruptive impact of the Company's annual budgeting process. The changefoundational initiatives announced in accounting principle does not delay, accelerate or avoid an impairment charge. Accordingly, the Company believes that the accounting change described above is preferable under the circumstances. As a result of the Company's annual impairment testing of goodwill performed during the fourth quarter of fiscal year 2011,2013 on the first two fiscal quarters of 2014 was greater than anticipated.charges were recorded. As it is reasonably likely that there could be additional impairment ofon the former Promenade salon concept's goodwill in future periods along with the sensitivity of the Company's critical assumptions in estimating fair value of this reporting unit, the Company has provided additional information related to this reporting unit. A summary of the critical assumptions utilized during the annual impairment tests of the Promenade salon concept are outlined below: Annual revenue growth. Annual revenue growth is primarily driven by assumed same-store sales rates of approximately negative 2.0 to positive 3.0 percent. Other considerations include anticipated economic conditions and moderate acquisition growth. Gross margin. Adjusted for anticipated salon closures, new salon construction and acquisitions estimated future gross margins were held constant. Fixed expense rates. Fixed expense rate increases of approximately 1.0 to 2.0 percent based on anticipated inflation. Fixed expenses consisted of rent, site operating, and allocated general and administrative corporate overhead. Allocated corporate overhead. Corporate overhead incurred by the home office based on the number of Promenade company-owned salons as a percent of total company-owned salons. Long-term growth. A long-term growth rate of 2.5 percent was applied to terminal cash flow based on anticipated economic conditions. Discount rate. A discount rate of 12.0 percent based on the weighted average cost of capital that equals the rate of return on debt capital and equity capital weighted in proportion to the capital structure common to the industry. The following table summarizes the approximate impact that a change in certain critical assumptions would have on theits estimated fair value of our Promenade salon concept reporting unit (the approximate impact of the change in the critical assumptions assumes all other assumptions and factors remain constant, in thousands, except percentages): Increase
(Decrease) Approximate
Impact on
Fair Value (In thousands) 1.0 % $ 26,000 (1.0 ) 14,000 As of our fiscal year 2011 annual impairment tests, the estimated fair value of the Hair Restoration Centers reporting unit exceeded its respective carrying value by approximately 9.0 percent. As it is reasonably likely that there could be12.0%. The impairment was only partly deductible for tax purposes resulting in a tax benefit of $6.3 million. See Note 9 to the Hair Restoration Centers reporting unit's goodwill in future periods alongConsolidated Financial Statements.sensitivity ofchange in operating segment structure, the Company changed its North American reporting units from five reporting units: SmartStyle, Supercuts, MasterCuts, Regis and Promenade, to two reporting units: North American Value and North American Premium. Based on the changes to the Company's criticaloperating segment structure, goodwill has been reallocated to the new reporting units at June 30, 2014 and 2013.in estimating fair value of this reporting unit, the Company has provided additional information relatedand to this reporting unit. A summary of the critical assumptions utilized during the annual impairment tests of the Hair Restoration Centers reporting unit are outlined below: Annual revenue growth. Annual revenue growth is primarily drivenapply judgment, including forecasting future sales and expenses, and selecting appropriate discount rates, which can be affected by assumed same-store sales rates of approximately positive 2.0 to positive 3.0 percent. Other considerations include anticipated economic conditions and moderate acquisition growth. Gross margin. Adjusted for anticipated center closures, new center construction and acquisitions estimated future gross margins were held constant. Fixed expense rates. Fixed expense rate increases of approximately 1.0other factors that can be difficult to 2.0 percent based on anticipated inflation. Fixed expenses consisted of rent, site operating, and allocated general and administrative corporate overhead. Allocated corporate overhead. Corporate overhead incurred by the home officepredict. The Company does not believe there is not allocated as the Hair Restoration Centers reporting unit incurs its own overhead. Long-term growth. A long-term growth rate of 2.5 percent was applied to terminal cash flow based on anticipated economic conditions. Discount rate. A discount rate of 12.0 percent based on the weighted average cost of capitala reasonable likelihood that equals the rate of return on debt capital and equity capital weighted in proportion to the capital structure common to the industry. The following table summarizes the approximate impact thatthere will be a change in certain critical assumptions would have on the estimated fair value of our Hair Restoration Centers reporting unitgoodwill balance (the approximate impact of thematerial change in the criticalestimates or assumptions assumes all otherit uses to calculate impairment losses of goodwill. However, if actual results are not consistent with the estimates and assumptions used in the calculations, the Company may be exposed to future impairment losses that could be material.factors remain constant, in thousands, except percentages): Increase
(Decrease) Approximate
Impact on
Fair Value (In thousands) 1.0 % $ 21,000 (1.0 ) 5,000 As2012, the Company impaired $34.9 and $67.7 million, respectively, of goodwill associated with our North American Premium reporting unit. No goodwill impairment charges were recorded during fiscal year 2011 annual impairment test, the estimated fair value of the Regis salon concept exceeded its respective carrying value by approximately 18.0 percent. As it is reasonably likely that there could be impairment of the Regis salon concept's goodwill in future periods along with the sensitivity of the Company's critical assumptions in estimating fair value of this reporting unit, the Company has provided additional information related to this reporting unit. A summary of the critical assumptions utilized during the annual impairment tests of the Regis salon concept are outlined below: Annual revenue growth. Annual revenue growth is primarily driven by assumed same-store sales rates of approximately negative 1.0 to positive 3.0 percent. Other considerations include anticipated economic conditions and moderate acquisition growth. Gross margin. Adjusted for anticipated salon closures, new salon construction and acquisitions estimated future gross margins were held constant. Fixed expense rates. Fixed expense rate increases of approximately 1.0 to 2.0 percent based on anticipated inflation. Fixed expenses consisted of rent, site operating, and allocated general and administrative corporate overhead. Allocated corporate overhead. Corporate overhead incurred by the home office based on the number of Regis salons as a percent of total company-owned salons. Long-term growth. A long-term growth rate of 2.5 percent was applied to terminal cash flow based on anticipated economic conditions. Discount rate. A discount rate of 12.0 percent based on the weighted average cost of capital that equals the rate of return on debt capital and equity capital weighted in proportion to the capital structure common to the industry. The following table summarizes the approximate impact that a change in certain critical assumptions would have on the estimated fair value of our Regis salon concept goodwill balance (the approximate impact of the change in the critical assumptions assumes all other assumptions and factors remain constant, in thousands, except percentages): Increase
(Decrease) Approximate
Impact on
Fair Value (In thousands) 1.0 % $ 13,000 (1.0 ) 10,000 The respective fair values of the Company's remaining reporting units exceeded fair value by greater than 20.0 percent. While the Company has determined the estimated fair values of the Promenade, Regis, and Hair Restoration Centers reporting units to be appropriate based on the projected level of revenue growth, operating income and cash flows, it is reasonably likely that the Promenade, Regis, and Hair Restoration Centers reporting units may become impaired in futureperiods. The term "reasonably likely" refers to an occurrence that is more than remote but less than probable in the judgment of the Company. Because some of the inherent assumptions and estimates used in determining the fair value of the reportable segments are outside the control of management, changes in these underlying assumptions can adversely impact fair value. Potential impairment of a portion or all of the carrying value of goodwill for the Promenade salon concept, Regis salon concept, and Hair Restoration Centers reporting units is dependent on many factors and cannot be predicted.2011,2014, the Company's estimated fair value, as determined by the sum of our reporting units' fair value, reconciled to within a reasonable range of our market capitalization, which included an assumed control premium.asby reporting unit follows: June 30, Reporting Unit 2014 2013 (Dollars in thousands) North American Value $ 425,264 $ 425,932 North American Premium — 34,953 Total $ 425,264 $ 460,885 2011 by2014 and 2013, the International reporting unit is as follows: As of June 30,
2011 As of June 30,
2010 (Dollars in thousands) $ 103,761 $ 102,180 4,652 4,652 48,916 48,280 129,477 121,693 240,910 309,804 527,716 586,609 152,796 150,380 $ 680,512 $ 736,989 As a result ofSee Note 4 to the Company's annual impairment analysis of goodwill during the third quarter of fiscal year 2010, a $35.3 million impairment charge was recorded within continuing operations for the excess of the carrying value of goodwill over the implied fair value of goodwill for the Regis salon concept. As a result of the Company's interim impairment test of goodwill during the three months ended December 31, 2008, a $41.7 million impairment charge for the full carrying amount of goodwill within the salon concepts in the United Kingdom was recorded within continuing operations. The recent performance challenges of the international salon operations indicated that the estimated fair value was less than the current carrying of this reporting unit's net assets, including goodwill. We assessannually or when events or changes in circumstances indicate thatat the carrying value of the assets or the asset grouping may not be recoverable. Our impairment analysis on salon property and equipment is performed on a salon by salon basis. The Company's test for impairment is performed at aindividual salon level, as this is the lowest level for which identifiable cash flows are largely independent of the cash flows of other groups of assets and liabilities.liabilities, when events or changes in circumstances indicate the carrying value of the assets or the asset grouping may not be recoverable. Factors considered in deciding when to perform an impairment review include significant under-performance of an individual salon in relation to expectations, significant economic or geographic trends, and significant changes or planned changes in our use of the assets. Impairment is evaluated based on the sum of undiscounted estimated future cash flows expected to result from use of the related salonlong-lived assets that doesdo not recover the carrying value ofvalues. If the salon assets. When the sum of a salon's undiscounted estimated future cash flow is zero or negative, impairment is measured as the full carrying value of the related salon's equipment and leasehold improvements. When the sum of a salon's undiscounted cash flows is greater than zero butare less than the carrying value of the related salon's equipment and leasehold improvements, a discounted cash flow analysis is performed to estimateassets, the fair value ofCompany calculates an impairment charge based on the salon assets and impairment is measured as the difference between the carrying valueof the salon assets and theassets' estimated fair value. The fair value estimateof the long-lived assets is estimated using a discounted cash flow model based on the best information available, including market data.usthe Company to realize material impairment charges. During fiscal years 2011, 2010, and 2009, $6.7, $6.4, and $10.2 million, respectively,was recorded within depreciation and amortization in the Consolidated Statement of Operations. In June 2009, we approved a plan to close up to 80 underperforming United Kingdom company-owned salons in fiscal year 2010 that was in addition to the July 2008 approved plan of closing up to 160 underperforming company-owned salons in fiscal year 2009. We also evaluated the appropriateness of the remaining useful lives of its affected property and equipment and whether a change to the depreciation charge was warranted.Purchase Price Allocation We make numerous acquisitions. The purchase prices are allocated to assets acquired, including identifiable intangiblecharges follows: Fiscal Years 2014 2013 2012 (Dollars in thousands) North American Value $ 11,714 $ 5,031 $ 2,892 North American Premium 5,014 3,042 3,174 International 1,599 151 570 Total $ 18,327 $ 8,224 $ 6,636 assumed based on their estimated fair values atare recognized for the datesexpected future tax consequences of acquisition. Fair value is estimated based on the amount for which the asset or liability could be bought or soldevents that have been included in a current transaction between willing parties. For our acquisitions, the majority of the purchase price that is not allocated to identifiable assets, or liabilities assumed, is accounted for as residual goodwill rather than identifiable intangible assets. This stems from the value associated with the walk-in customer base of the acquired salons, the value of which is not recorded as an identifiable intangible asset under current accounting guidance and the limited value of the acquired leased site and customer preference associated with the acquired hair salon brand. Residual goodwill further represents our opportunity to strategically combine the acquired business with our existing structure to serve a greater number of customers through our expansion strategies. Identifiable intangible assets purchased in fiscal year 2011, 2010, and 2009 acquisitions totaled $2.0, $0.1, and $1.3 million, respectively. The residual goodwill generated by fiscal year 2011, 2010, and 2009 acquisitions totaled $12.5, $2.6, and $30.8 million, respectively. See Note 4 to the Consolidated Financial Statements for further information.Self Insurance Accruals The Company uses a combination of third party insuranceor income tax returns. Deferred income tax assets and self-insurance for a number of risks including workers' compensation, health insurance, employment practice liability and general liability claims. The liability represents the Company's estimate of the undiscounted ultimate cost of uninsured claims incurred as of the balance sheet date. The workers' compensation, general liability and employment practice liability analysis includes applying loss development factors to the Company's historical claims data (total paid and incurred amounts per claim) for all policy years where the Company has not reached its aggregate limits to project the future development of incurred claims. The workers' compensation analysis is performed for three models; California, Texas and all other states. A variety of accepted actuarial methodologies are followed to determine these liabilities, including several methods to predict the loss development factors for each policy period. These liabilities are determined based on the differences between the financial statement and tax basis of assets and liabilities using currently enacted tax rates in effect for the years in which the differences are expected to reverse. A valuation allowance is established for any portion of deferred tax assets that are not considered more likely than not to be realized. The Company evaluates all evidence, including recent financial performance, the existence of cumulative year losses and our forecast of future taxable income, to assess the need for a valuation allowance against our deferred tax assets. While the determination of whether or not to record a valuation allowance is not fully governed by modelinga specific objective test, accounting guidance places significant weight on recent financial performance.frequency (number of claims)impacts from the foundational initiatives implemented in the prior year continued to negatively impact the Company's financial performance. Due to recent negative financial performance and severity (cost of claims), fitting statistical distributions to the experience, and then running simulations. A similar analysis is performed for both general liability and employment practices liability;cumulative losseshowever, it is a single model for all liability claims rather than the three separate models used for workers' compensation. The health insurance analysis utilizes trailing twelve months of paid and 24 months of medical and prescription claims to project the amount of incurred but not yet reported claims liability amount. The lag factors are developed based on the Company's specific claim data utilizing a completion factor methodology. The developed factor, expressed as a percentage of paid claims, is applied to the trailing twelve months of paid claims to calculate the estimated liability amount. The calculated liability amount is reviewed for reasonableness based on reserve adequacy ranges for historical periods by testing prior reserve levels against actual expenses to date. Althoughin recent years, the Company doeswas no longer able to conclude that it was more likely than not expect the amounts ultimately paid to differ significantly from the estimates, self insurance accruals could be affected if future claims experience differs significantly from the historical trendsU.S. and actuarial assumptions. For fiscal year 2011, the Company recorded an increase in expense from changes in estimates related to prior year open policy periods of $1.4 million. For fiscal years 2010 and 2009, the Company recorded decreases in expense from changes in estimates related to prior year open policy periods of $1.7 and $9.9 million, respectively. A 10.0 percent change in the self-insurance reserve would affect income from continuing operations before income taxes and equity in income of affiliated companies by $4.6, $4.5, and $4.0 million for the three years ended June 30, 2011, 2010 and 2009, respectively. The Company updates loss projections twice each year and adjusts its recorded liability to reflect the current projections. The updated loss projections consider new claims and developments associated with existing claims for each open policy period. As certain claims can take years to settle, the Company has multiple policy periods open at any point in time.Income Taxes In determining income for financial statement purposes, management must make certain estimates and judgments. These estimates and judgments occur in the calculation of certain tax liabilities and in the determination of the recoverability of certainU.K. deferred tax assets which arise from temporary differences betweenwould be fully realized and established a valuation allowance on the taxU.S. and financial statement recognition of revenue and expense. Management must assess the likelihood thatU.K. deferred tax assets will be recovered. If recovery is not likely, we must increase our provision for taxes by recording a reserve, inassets.form of a valuation allowance,activity for the deferred tax assets thatasset valuation allowance follows: (Dollars in thousands) Balance, June 30, 2013 $ — Establishment of valuation allowance against U.S. & U.K. deferred tax assets 84,391 Changes to deferred tax asset valuation allowance (469 ) Balance, June 30, 2014 $ 83,922 not be ultimately recoverable. Should there be a change in ourcontinue to assess its ability to recover ourrealize its deferred tax assets ouron a quarterly basis and will reverse the valuation allowance and record a tax provision would increase inbenefit when the period in which it is determined thatCompany generates sufficient sustainable pretax earnings to make the recovery is not likely. In addition,realizability of the calculation ofdeferred tax liabilities involves dealing with uncertainties in the application of complex tax regulations. Management recognizes a reserveassets more likely than not.forrelated to anticipated tax audit issues in the United StatesU.S. and other tax jurisdictions based on ouran estimate of whether additional taxes will be due. If payment of these amounts ultimately proves to be unnecessary, the reversal of the liabilities would result in tax benefits being recognized in the period when we determineit is determined the liabilities are no longer necessary. If ourthe estimate of tax liabilities proves to be less than the ultimate assessment, a further charge to expense would result. InInherent in the United States, fiscal years 2007measurement of deferred balances are certain judgments and after remain open for federalinterpretations of tax audit. Thelaws and published guidance with respect to the Company's United States federal incomeoperations. Income tax returnsexpense is primarily the current tax payable for the years 2007 through 2009 are currently under audit. For stateperiod and the change during the period in certain deferred tax audits, the statute of limitations generally spans three to four years, resulting in a number of states remaining open for tax audits dating back to fiscal year 2007. However, the Company is under audit in a number of states in which the statute of limitations has been extended for fiscal years 2000assets and forward. Internationally (including Canada), the statute of limitations for tax audits varies by jurisdiction, but generally ranges from three to five years. As of June 30, 2011 the Company's liability for uncertain tax positions was $13.5 million. See Note 13 to the Consolidated Financial Statements for further information.
ContingenciesContingencieswhere determinable, an estimate of the liability amount.can be reasonably estimated. Management considers many factors in making these assessments including past history and the specifics of each case. However, litigation is inherently unpredictable and excessive verdicts do occur, which could have a material impact on our Consolidated Financial Statements.2011,2014 and 2013, the Company settled a legal claimincurred $3.3 million and $1.2 million of expense in conjunction with the former owner of Hair Club for $1.7 million.2010,2012, the Company settled two legal claims regarding certain customer and employee matters for an aggregate charge of $5.2was awarded $1.1 million plus a commitment to provide discount coupons. During the twelve months ended June 30, 2011, the final payments aggregating $4.3 million were made.OVERVIEW OF FISCAL YEAR 2011 RESULTS The following summarizes key aspects of our fiscal year 2011 results:•Revenues decreased 1.4 percent to $2.3 billion during fiscal year 2011. The Company experienced a decline in customer visitation partially offset by an increase in average ticket price, resulting in a decrease in consolidated same-store sales of 1.7 percent. Fiscal year 2010 revenues included a one-time sale of $20.0 million of product to the purchaser of Trade Secret.•The Company recorded a goodwill impairment charge of $74.1 million associated with our Promenade salon concept during fiscal year 2011.•Long-lived asset impairment charges of $6.7 million were recorded during fiscal year 2011.•The Company recorded a $31.2 million valuation reserve on the note receivable with the purchaser of Trade Secret.•During fiscal year 2011, the Company settled a legal claim with the former owner of Hair Club for $1.7 million.•The Company recorded a $9.2 million other than temporary impairment on its investment in preferred shares of Yamano Holdings Corporation and premium paid on an investment with a subsidiary of Yamano Holdings Corporation.•Upon the March 2011 acquisition of the approximately 17 percent additional ownership interest in Provalliance, the Company recognized a net gain of approximately $2.4 million representing the settlement of a portion of the company's equity put liability and additional ownership of the Frank Provost Group in Provalliance.•Total debt at the end of fiscal year 2011 declined to $313.4 million and our debt-to-capitalization ratio, calculated as total debt as a percentage of total debt and shareholders' equity at fiscal year end, improved 700 basis points to 23.3 percent as compared to June 30, 2010. The decrease in debt-to-capitalization ratio from fiscal year 2010 to fiscal year 2011 was primarily due to the repayment of an $85.0 million term loan during fiscal year 2011 and foreign currency translation adjustments due to the weakening of the United States dollar against the Canadian dollar and British pound.•The annual effective income tax rate of 37.1 percent was impacted by employment credits related to the Small Business and Work Opportunity Tax Act of 2007 which benefited the effective income tax rate by 15.3 percent. Based upon current legislation these credits arescheduled to expire on December 31, 2011. Partially offsetting the impact of the employment credits was the pre-tax non-cash goodwill impairment charge of $74.1 million, recorded during the three months ended March 31, 2011, which is only partially deductible for tax purposes.RESULTS OF OPERATIONS Beginning with the period ended December 31, 2008 the operations of Trade Secret concept within the North American reportable segment were accounted for as discontinued operations. All periods presented will reflect Trade Secret as a discontinued operation. The following discussion of results of operations will reflect results from continuing operations. Discontinued operations will be discussed at the end of this section.Consolidated Results of Operations The following table sets forth, for the periods indicated, certain information derived from our Consolidated Statement of Operations in Item 8, expressed as a percent of revenues. The percentages are computed as a percent of total revenues, except as noted.Results of Operations as a Percent of Revenues For the Years Ended
June 30, 2011 2010 2009 75.8 % 75.6 % 75.5 % 22.5 22.7 22.9 1.7 1.7 1.6 57.5 56.9 57.0 47.8 49.4 50.9 8.5 8.5 7.8 14.6 12.4 12.0 14.7 14.6 14.3 4.5 4.6 4.8 3.2 1.5 1.7 — 0.1 0.2 0.2 4.1 4.5 (1.1 ) 2.3 3.2 (0.4 ) 1.7 0.3 — 0.1 (5.4 ) (0.4 ) 1.8 (5.1 ) (1)Computed as a percent of service revenues and excludes depreciation expense.(2)Computed as a percent of product revenues and excludes depreciation expense.Consolidated Revenues Consolidated revenues primarily include revenues of company-owned salons, product and equipment sales to franchisees, hair restoration center revenues, and franchise royalties and fees. As compared to the prior fiscal year, consolidated revenues decreased 1.4 percent during fiscal year 2011 and decreased 2.9 percent during fiscal year 2010. The following table details our consolidated revenues by concept. All service revenues, product revenues (which include product and equipment sales to franchisees), and franchise royalties and fees are included within their respective concept within the table. For the Years Ended June 30, 2011 2010 2009 (Dollars in thousands) $ 434,249 $ 437,990 $ 474,964 165,729 166,821 170,338 531,090 533,094 529,782 321,881 314,698 310,913 576,995 607,960 631,701 2,029,944 2,060,563 2,117,698 150,237 156,085 171,569 145,688 141,786 140,520 $ 2,325,869 $ 2,358,434 $ 2,429,787 (1.4 )% (2.9 )% (2.1 )% (1.7 )% (3.2 )% (3.1 )% (1)Salon same-store sales are calculated on a daily basis as the total change in sales for company-owned salons which were open on a specific day of the week during the current period and the corresponding prior period. Quarterly and year-to-date salon same-store sales are the sum of the same-store sales computed on a daily basis. Salons relocated within a one mile radius are included in same-store sales as they are considered to have been open in the prior period. International same-store sales are calculated in local currencies so that foreign currency fluctuations do not impact the calculation. Management believes that same-store sales, a component of organic growth, are useful in determining the increase in salon revenues attributable to its organic growth (new salon construction and same-store sales growth) versus growth from acquisitions.(2)Beginning with the period ended December 31, 2008, the operations of Trade Secret concept within the North American reportable segment were accounted for as discontinued operations. All periods presented reflect Trade Secret as a discontinued operation. Accordingly, Trade Secret revenues are excluded from this presentation.(3)Trade Secret, Inc. was sold by Regis Corporation on February 16, 2009. The agreement included a provision that the Company would supply product to the purchaser of Trade Secret and provide certain administrative services for a transition period. For the fiscal year ended June 30, 2010 and 2009, the Company generated revenue of $20.0 and $32.2 million in product revenues, respectively, which represented 0.8 and 1.3 percent of consolidated revenues, respectively. The agreement was substantially complete as of September 30, 2009. The decreases of 1.4, 2.9, and 2.1 percent in consolidated revenues during fiscal years 2011, 2010, and 2009, respectively, were driven by the following: Percentage Increase
(Decrease) in Revenues
For the Years Ended
June 30, 2011 2010 2009 1.1 % 0.8 % 3.4 % (1.4 ) (3.0 ) (1.4 ) 0.4 0.2 (2.2 ) 0.0 0.0 (1.1 ) (1.5 ) (0.9 ) (0.8 ) (1.4 )% (2.9 )% (2.1 )% We acquired 105 company-owned salons (including 78 franchise buybacks), and bought back four hair restoration centers from franchisees during fiscal year 2011 compared to 26 company-owned salons (including 23 franchise buybacks), and bought back zero hair restoration centers from franchisees during fiscal year 2010. The decline in organic sales during fiscal year 2011 was primarily due to consolidated same-store sales decrease of 1.7 percent due to a decline in same-store customer visits, partially offset by an increase in average ticket. The decline in organic sales was also due to the completion of an agreement in the prior year to supply the purchaser of Trade Secret product at cost. The Company generated revenues of $20.0 million for product sold to the purchaser of Trade Secret during the twelve months ended June 30, 2010. Partially offsetting the organic sales decrease was the construction of 146 company-owned salons during the twelve months ended June 30, 2011. We closed 305 and 269 salons (including 60 and 65 franchise salons) during the twelve months ended June 30, 2011 and 2010, respectively. We acquired 26 company-owned salons (including 23 franchise buybacks), and bought back zero hair restoration centers from franchisees during fiscal year 2010 compared to 177 company-owned salons (including 83 franchise buybacks), and bought back two hair restoration centers from franchisees during fiscal year 2009. The decline in organic sales during fiscal year 2010 was primarily due to consolidated same-store sales decrease of 3.2 percent due to a decline in same-store customer visits, partially offset by an increase in average ticket. The decline in organic sales was also due to the completion of an agreement to supply the purchaser of Trade Secret product at cost. The Company generated revenues of $20.0 and $32.2 million for product sold to the purchaser of Trade Secret during the twelve months ended June 30, 2010 and 2009, respectively. Partially offsetting the organic sales decrease was the construction of 143 company-owned salons during the twelve months ended June 30, 2010. We closed 269 and 281 salons (including 65 and 51 franchise salons) during the twelve months ended June 30, 2010 and 2009, respectively. During fiscal year 2011, the foreign currency impact was driven by the weakening of the United States dollar against the Canadian dollar and British pound, as compared to the prior fiscal year's exchange rates. During fiscal year 2010, the foreign currency impact was driven by the weakening of the United States dollar against the Canadian dollar, partially offset by the strengthening of the United Stated dollar against the British pound and Euro as compared to the prior fiscal year's exchange rates. During fiscal year 2009, the foreign currency impact was driven by the strengthening of the United States dollar against the Canadian dollar, British pound, and Euro as compared to the prior fiscal year's exchange rates. Consolidated revenues are primarily composed of service and product revenues,as well as franchise royalties and fees. Fluctuations in these three major revenue categories were as follows: Service Revenues. Service revenues include revenues generated from company-owned salons and service revenues generated by hair restoration centers. Consolidated service revenues were as follows: Decrease
Over Prior Fiscal Year Revenues Dollar Percentage (Dollars in thousands) $ 1,762,974 $ (21,163 ) (1.2 )% 1,784,137 (49,821 ) (2.7 ) 1,833,958 (28,532 ) (1.5 ) The decrease in service revenues during fiscal year 2011 was due to same-store service sales decreasing 2.3 percent, as a result of a decline in same-store customer visits. Partially offsetting the decrease was growth due to new and acquired salons during the twelve months ended June 30, 2011, price increases, sales mix as the company continues to increase hair color and waxing services, and the weakening of the United States dollar against the Canadian dollar during the twelve months ended June 30, 2011. The decrease in service revenues during fiscal year 2010 was due to same-store service sales decreasing 3.4 percent, as many consumers have continued to lengthen their visitation pattern due to the economy. In addition, service revenues decreased due to the strengthening of the United States dollar against the British pound. Partially offsetting the decrease was growth due to acquisitions during the twelve months and the weakening of the United States dollar against the Canadian dollar during the twelve months ended June 30, 2010. The decrease in service revenues during fiscal year 2009 was due to same-store service sales decreasing 2.5 percent. Same-store service sales decreased 2.5 percent due to a decline in customer visits. Service revenues were also negatively impacted due to the strengthening of the United States dollar against the Canadian dollar, British pound, and Euro and the deconsolidation of the European franchise salon operations on January 31, 2008. Partially offsetting the decrease was growth due to acquisitions during the twelve months and an increase in average ticket. Product Revenues. Product revenues are primarily sales at company-owned salons and hair restoration centers, and sales of product and equipment to franchisees. Consolidated product revenues were as follows: (Decrease) Increase
Over Prior Fiscal Year Revenues Dollar Percentage (Dollars in thousands) $ 523,194 $ (11,399 ) (2.1 )% 534,593 (21,612 ) (3.9 ) 556,205 4,919 0.9 The decrease in product revenues during fiscal year 2011 was primarily due to the decrease in product sales to the purchaser of Trade Secret from $20.0 million in fiscal year 2010 to zero in fiscal year 2011. Partially offsetting the decrease was same-store product sales increasing 0.4 percent, product sales from new and acquired salons, and the weakening of the United States dollar against the Canadian dollar during the twelve months ended June 30, 2011. The decrease in product revenues during fiscal year 2010 was primarily due to the decrease in product sales to the purchaser of Trade Secret from $32.2 in fiscal year 2009 to $20.0 in fiscal year2010, as well as due to same-store product sales decreasing 2.3 percent and the strengthening of the United States dollar against the British pound. Partially offsetting the decrease was the weakening of the United States dollar against the Canadian dollar during the twelve months ended June 30, 2010. The growth in product revenues during fiscal year 2009 was primarily due to product sales of $32.2 million to the purchaser of Trade Secret, partially offset by same-store product sales decreasing 5.1 percent. Same-store product sales decreased 5.1 percent during the fiscal year 2009 due to a decline in customer visits and a change in product mix, as a larger percentage of product sales came from promotional items. Royalties and Fees. Consolidated franchise revenues, which include royalties and franchise fees, were as follows: (Decrease) Increase
Over Prior Fiscal Year Revenues Dollar Percentage (Dollars in thousands) $ 39,701 $ (3 ) (0.0 )% 39,704 80 0.2 39,624 (27,991 ) (41.4 ) Total franchise locations open at June 30, 2011 and 2010 were 1,965 (including 29 franchise hair restoration centers) and 2,053 (including 33 franchise hair restoration centers), respectively. The decrease in franchise locations was offset by the impact of the weakening of the United States dollar against the Canadian dollar. Total franchise locations open at June 30, 2010 and 2009 were 2,053 (including 33 franchise hair restoration centers) and 2,078 (including 33 franchise hair restoration centers), respectively. The increase in consolidated franchise revenues during fiscal year 2010 was primarily due to the weakening of the United States dollar against the Canadian dollar during the twelve months ended June 30, 2010. Total franchise locations open at June 30, 2009 and 2008 were 2,078 (including 33 franchise hair restoration centers) and 2,134 (including 35 franchise hair restoration centers), respectively. The decrease in consolidated franchise revenues during fiscal year 2009 was primarily due to the merger of the 1,587 European franchise salon operations with Franck Provost Salon Group on January 31, 2008.Gross Margin (Excluding Depreciation) Our cost of revenues primarily includes labor costs related to salon employees and hair restoration center employees, the cost of product used in providing services and the cost of products sold to customers and franchisees. The resulting gross margin was as follows: (Decrease) Increase
Over Prior Fiscal Year Gross
Margin Margin as % of
Service and
Product Revenues Dollar Percentage Basis Point(1) (Dollars in thousands) $ 1,023,321 44.8 % $ (15,806 ) (1.5 )% — 1,039,127 44.8 (23,279 ) (2.2 ) 40 1,062,406 44.4 (24,420 ) (2.2 ) (60 ) (1)Represents the basis point change in gross margin as a percent of service and product revenues as compared to the corresponding period of the prior fiscal year. Service Margin (Excluding Depreciation). Service margin was as follows: (Decrease) Increase
Over Prior Fiscal Year Service
Margin Margin as % of
Service Revenues Dollar Percentage Basis Point(1) (Dollars in thousands) $ 750,106 42.5 % $ (18,311 ) (2.4 )% (60 ) 768,417 43.1 (20,822 ) (2.6 ) 10 789,239 43.0 (10,692 ) (1.3 ) 10 (1)Represents the basis point change in service margin as a percent of service revenues as compared to the corresponding period of the prior fiscal year. The basis point decrease in service margins as a percent of service revenues during fiscal year 2011 was primarily due to an unexpected increase in salon health insurance costs due to several unusually large claims and an increase in payroll taxes as a result of states increasing unemployment taxes. The basis point improvement in service margins as a percent of service revenues during fiscal year 2010 was primarily due to the benefit of the new leveraged salon pay plans implemented in the 2009 calendar year. Increases in salon health insurance and payroll taxes partially offset the basis point improvement. The basis point improvement in service margins as a percent of service revenues during fiscal year 2009 was primarily due to an improvement in labor expenses. Labor expenses improved as a result of cost control initiatives and new leveraged salon pay plans. Product Margin (Excluding Depreciation). Product margin was as follows: Increase (Decrease)
Over Prior Fiscal Year Product
Margin Margin as % of
Product Revenues Dollar Percentage Basis Point(1) (Dollars in thousands) $ 273,215 52.2 % $ 2,505 0.9 % 160 270,710 50.6 (2,457 ) (0.9 ) 150 273,167 49.1 (13,728 ) (4.8 ) (290 ) (1)Represents the basis point change in product margin as a percent of product revenues as compared to the corresponding period of the prior fiscal year. Trade Secret, Inc. was sold by Regis Corporation on February 16, 2009. The agreement included a provision that Regis Corporation would supply product to the purchaser at cost for a transition period. The agreement was substantially completed as of September 30, 2009. The following tables breakout product revenues, cost of product and product margin as a percent of product revenues between product and product sold to the purchaser of Trade Secret. For the Years Ended June 30, 2011 2010 2009 $ 523,194 $ 514,631 $ 523,968 — 19,962 32,237 $ 523,194 $ 534,593 $ 556,205 For the Years Ended June 30, 2011 2010 2009 $ 249,979 $ 243,921 $ 250,801 — 19,962 32,237 $ 249,979 $ 263,883 $ 283,038 For the Years Ended
June 30, 2011 2010 2009 52.2 % 52.6 % 52.1 % — — — 52.2 % 50.6 % 49.1 % The basis point decrease in product margin other than sold to purchaser of Trade Secret as a percentage of product revenues during fiscal year 2011 was primarily due to an increase in sales of slightly lower-profit margin appliances in our International segment and an increase in the cost of hair systems in our Hair Restoration Centers segment, partially offset by reduced commissions paid to new employees on retail product sales in our North American segment. The basis point improvement in product margin other than sold to purchaser of Trade Secret as a percentage of product revenues during fiscal year 2010 was due to a planned reduction in retail commissions paid to new employees on retail product sales. The basis point improvement in product margin other than sold to purchaser of Trade Secret as a percentage of product revenues during fiscal year 2009 was due to selling higher cost inventories in fiscal year 2008 obtained in conjunction with several acquisitions. In addition, product margins improved due to the deconsolidation of the European franchise salon operations and a write-off of slow moving inventories in fiscal year 2008. Partially offsetting the improvement was mix play, as a larger than expected percentage of product sales came from lower-margin promotional items. We are not promoting or discounting at a higher rate, but we are continuing to see customers be more value-focused through buying promotional items at a higher rate than prior periods.Site Operating Expenses This expense category includes direct costs incurred by our salons and hair restoration centers, such as on-site advertising, workers' compensation, insurance, utilities and janitorial costs. Site operating expenses were as follows: (Decrease) Increase
Over Prior Fiscal Year Site
Operating Expense as %
of Consolidated
Revenues Dollar Percentage Basis Point(1) (Dollars in thousands) $ 197,722 8.5 % $ (1,616 ) (0.8 )% — 199,338 8.5 8,882 4.7 70 190,456 7.8 5,687 3.1 40 (1)Represents the basis point change in site operating expenses as a percent of consolidated revenues as compared to the corresponding period of the prior fiscal year. Site operating expenses as a percent of consolidated revenues during fiscal year 2011 was consistent with fiscal year 2010. A reduction in legal claims expense and a favorable sales tax audit
class-action lawsuit.adjustment were offset by a planned increase in advertising expense within the Company's Promenade concept and an increase in self insurance accruals. The basis point increase in site operating expenses as a percent of consolidated revenues during fiscal year 2010 was primarily due to higher self insurance expense. The Company recorded a reduction in self insurance accruals of $1.7 million in fiscal year 2010 compared to a $9.9 million reduction in fiscal year 2009. In addition the Company settled two legal claims related to customer and employee matters resulting in a $5.2 million charge during fiscal year 2010. The basis point increase in site operating expenses as a percent of consolidated revenues during fiscal year 2009 was primarily due to the reclassification of rubbish removal and utilities that we pay our landlords as part of our operating lease agreements from rent into site operating expense. Partially offsetting the basis point increase was an incremental $3.0 million benefit due to the reduction in self insurance accruals compared to the fiscal year 2008 reduction in self insurance accruals. The reduction was primarily related to prior years' workers' compensation reserves as a result of successful safety and return-to-work programs implemented over the past few years.General and Administrative General and administrative (G&A) includes costs associated with our field supervision, salon training and promotions, product distribution centers and corporate offices (such as salaries and professional fees), including costs incurred to support franchise and hair restoration center operations. G&A expenses were as follows: Increase (Decrease)
Over Prior Fiscal Year G&A Expense as %
of Consolidated
Revenues Dollar Percentage Basis Point(1) (Dollars in thousands) $ 339,857 14.6 % $ 47,866 16.4 % 220 291,991 12.4 330 0.1 40 291,661 12.0 (29,902 ) (9.3 ) (100 ) (1)Represents the basis point change in G&A as a percent of consolidated revenues as compared to the corresponding period of the prior fiscal year. The basis point increase in G&A costs as a percentage of consolidated revenues during fiscal year 2011 was primarily due to the $31.2 million valuation reserve on the note receivable with the purchaser of Trade Secret, incremental costs associated with the Company's senior management restructure, expenditures associated with the Regis salon concept re-imaging project, professional fees incurred related to the exploration of strategic alternatives and information technology projects, legal claims expense and negative leverage on fixed costs within this category due to negative same-store sales. The basis point increase in G&A costs as a percentage of consolidated revenues during fiscal year 2010 was primarily due to negative leverage from the decrease in same-store sales, partially offset by the continuation of cost savings initiatives implemented by the Company. The basis point improvement in G&A costs as a percentage of consolidated revenues during fiscal year 2009 was primarily due to cost savings initiatives implemented by the Company during the first half of fiscal year 2009 including the reduction of field supervisory staff and the reduction of the fiscal year 2009 marketing budget. The basis point improvement was also related to the deconsolidation of the European franchise salon operations.Rent Rent expense, which includes base and percentage rent, common area maintenance and real estate taxes, was as follows: (Decrease) Increase
Over Prior Fiscal Year Rent Expense as %
of Consolidated
Revenues Dollar Percentage Basis Point(1) (Dollars in thousands) $ 342,286 14.7 % $ (1,812 ) (0.5 )% 10 344,098 14.6 (3,694 ) (1.1 ) 30 347,792 14.3 (13,684 ) (3.8 ) (30 ) (1)Represents the basis point change in rent expense as a percent of consolidated revenues as compared to the corresponding period of the prior fiscal year. The basis point increase in rent expense as a percent of consolidated revenues during fiscal year 2011 was primarily due to negative leverage in this fixed cost category due to negative same-store sales, partially offset by a favorable reduction to our common area maintenance expenses. The basis point increase in rent expense as a percent of consolidated revenues during fiscal year 2010 was primarily due to negative leverage in this fixed cost category, partially offset by a reduction in our percentage rent payments, both due to negative same-store sales. The basis point improvement in rent expense as a percent of consolidated revenues during fiscal year 2009 was primarily due to the reclassification of rubbish removal and utilities that we pay our landlords as part of our operating lease agreements to site operating expense from rent expense. Partially offsetting the basis point improvement was negative leverage in this fixed cost category due to negative same-store sales.Depreciation and Amortization Depreciation and amortization expense (D&A) was as follows: (Decrease) Increase
Over Prior Fiscal Year D&A Expense as %
of Consolidated
Revenues Dollar Percentage Basis Point(1) (Dollars in thousands) $ 105,109 4.5 % $ (3,655 ) (3.4 )% (10 ) 108,764 4.6 (6,891 ) (6.0 ) (20 ) 115,655 4.8 2,362 2.1 20 (1)Represents the basis point change in depreciation and amortization as a percent of consolidated revenues as compared to the corresponding period of the prior fiscal year. The basis point decrease in D&A as a percent of consolidated revenues during fiscal year 2011 was primarily due to a decrease in depreciation expense from a reduction in salon construction beginning in fiscal year 2009 as compared to historical levels prior to fiscal year 2009. The basis point decrease was partially offset by negative leverage from the decrease in same-store sales. The basis point improvement in D&A as a percent of consolidated revenues during fiscal year 2010 was primarily due to a reduction in the impairment of property and equipment at underperforming locations as compared to fiscal year 2009. The Company recorded impairment charges of $6.4 and $10.2 million during fiscal years 2010 and 2009, respectively. Partially offsetting the improvements was a decline due to negative leverage from the decrease in same-store sales. The basis point increase in D&A as a percent of consolidated revenues during fiscal year 2009 was primarily due to the decrease in same-store sales. In addition, the Company recorded impairment charges of $10.2 million related to the impairment of property and equipment at underperforming locations, including those salons under the Company approved plan to close up to 80 underperforming United Kingdom company-owned salons.Goodwill Impairment Goodwill impairment was as follows: Increase (Decrease)
Over Prior Fiscal Year Goodwill
Impairment Expense as %
of Consolidated
Revenues Dollar Percentage Basis Point(1) (Dollars in thousands) $ 74,100 3.2 % $ 38,823 110.1 % 170 35,277 1.5 (6,384 ) (15.3 ) (20 ) 41,661 1.7 41,661 100.0 170 (1)Represents the basis point change in goodwill impairment as a percent of consolidated revenues as compared to the corresponding period of the prior fiscal year. The Company recorded a $74.1 million goodwill impairment charge related to the Promenade salon concept during fiscal year 2011. Due to lower than expected earnings and same-store sales, the estimated fair value of the Promenade salon operations was less than the carrying value of this concept's net assets, including goodwill. The $74.1 million impairment charge was the excess of the carrying value of goodwill over the implied fair value of goodwill for the Promenade salon operations. The Company recorded a $35.3 million goodwill impairment charge related to the Regis salon concept during fiscal year 2010. Due to the current economic conditions, the estimated fair value of the Regis salon operations was less than the carrying value of this concept's net assets, including goodwill. The $35.3 million impairment charge was the excess of the carrying value of goodwill over the implied fair value of goodwill for the Regis salon operations. The Company recorded a $41.7 million goodwill impairment charge related to the salon concepts in the United Kingdom during fiscal year 2009. The recent performance challenges of the international salon operations indicated that the estimated fair value of the international salon operations was less than the current carrying value of the reporting unit's net assets, including goodwill. There is no remaining goodwill recorded within the salon concepts in the United Kingdom.Lease Termination Costs Lease termination costs were as follows: (Decrease) Increase
Over Prior Fiscal Year Lease
Termination
Costs Expense as %
of Consolidated
Revenues Dollar Percentage Basis Point(1) (Dollars in thousands) $ — — % $ (2,145 ) (100.0 )% (10 ) 2,145 0.1 (3,587 ) (62.6 ) (10 ) 5,732 0.2 5,732 100.0 20 (1)Represents the basis point change in lease termination costs as a percent of consolidated revenues as compared to the corresponding periods of the prior fiscal year. As the Company's July 2008 and June 2009 plans to close underperforming company-owned salons were substantially complete as of June 30, 2010, the Company did not incur lease termination costs during the twelve months ended June 30, 2011. The fiscal year 2010 lease termination costs are associated with the Company's June 2009 plan to close underperforming United Kingdom company-owned salons in fiscal year 2010. During fiscal year 2010 we closed 29 salons under the June 2009 plan. The fiscal year 2009 lease termination costs are primarily associated with the Company's July 2008 plan to close underperforming company-owned salons in fiscal year 2009. The planned closures in fiscal year 2009 included salons in North America and the United Kingdom. During fiscal year 2009 we closed 64 salons under the July 2008 plan. See further discussion within Note 11 of the Consolidated Financial Statements.Interest Expense Interest expense was as follows: (Decrease) Increase
Over Prior Fiscal Year Interest Expense as %
of Consolidated
Revenues Dollar Percentage Basis Point(1) (Dollars in thousands) $ 34,388 1.5 % $ (20,026 ) (36.8 )% (80 ) 54,414 2.3 14,646 36.8 70 39,768 1.6 (4,511 ) (10.2 ) (20 ) (1)Represents the basis point change in interest expense as a percent of consolidated revenues as compared to the corresponding period of the prior fiscal year. The basis point improvement in interest as a percent of consolidated revenues during the twelve months ended June 30, 2011 was primarily due to a reduction in interest expense due to the twelve months ended June 30, 2010 including $18.0 million of make-whole payments and other fees associated with the repayment of private placement debt, and decreased debt levels during fiscal year 2011. The basis point increase in interest as a percent of consolidated revenues during the twelve months ended June 30, 2010 was primarily due to $18.0 million of make-whole payments and other fees associated with the repayment of private placement debt. The increase due to the make-whole payments and other fees was partially offset by a reduction in interest expense due to decreased debt levels. The basis point improvement in interest as a percent of consolidated revenues during the twelve months ended June 30, 2009 was primarily due to lower average interest rates on variable rate debt and decreased debt levels as a result of the Company's commitment to reduce debt levels.Interest Income and Other, net Interest income and other, net was as follows: (Decrease) Increase
Over Prior Fiscal Year Interest Income as %
of Consolidated
Revenues Dollar Percentage Basis Point(1) (Dollars in thousands) $ 4,811 0.2 % $ (5,599 ) (53.8 )% (20 ) 10,410 0.4 949 10.0 — 9,461 0.4 1,288 15.8 10 (1)Represents the basis point change in interest income and other, net as a percent of consolidated revenues as compared to the corresponding period of the prior fiscal year. The basis point decrease in the interest income and other, net as a percent of consolidated revenues during the twelve months ended June 30, 2011 was primarily due to the foreign currency impact of the Company's investment in MY Style, $1.9 million received from the purchaser of Trade Secret in the comparable prior period for administrative services, and $1.9 million in interest income recorded in the comparable prior period on the outstanding note receivable due from the purchaser of Trade Secret. Interest income and other, net as a percent of consolidated revenues during the twelve months ended June 30, 2010 was consistent with the twelve months ended June 30, 2009. Interest income increased as a result of higher cash balances available to earn interest, partially offset by a decline in rates. The basis point improvement in interest income and other, net as a percent of consolidated revenues during the twelve months ended June 30, 2009 was primarily due to the Company receiving $2.9 million for administrative services from the purchaser of Trade Secret and foreign currency transaction gains. Partially offsetting the basis point improvement was a decrease in interest income due to a decline in interest rates.Income Taxes Our reported effective tax rate was as follows: Effective
Rate Basis Point
(Decrease) Increase (37.1 )% (8,520 ) 48.1 (520 ) 53.3 1,380 (1)Represents the basis point change in income tax expense as a percent of (loss) income from continuing operations before income taxes and equity in income (loss) of affiliated companies as compared to the corresponding periods of the prior fiscal year. For fiscal year 2011, the Company reported a $25.6 million loss from continuing operations before income taxes as compared to income from continuing operations before income taxes of $53.2 and $78.8 million in fiscal years 2010 and 2009, respectively. The rate reconciliation items have a greater impact on the annual effective income tax rate in fiscal year 2011 as the magnitude of the loss from continuing operations before income taxes is less than the magnitude of income from continuing operations before income taxes in fiscal year 2010. The annual effective tax rate was favorably impacted by the employment credits related to the Small Business and Work Opportunity Tax Act of 2007. Based upon current legislation, these credits are scheduled to expire on December 31, 2011. Partiallyoffsetting the favorable impact of the employment credits was the adverse impact of the pre-tax non-cash goodwill impairment charge of $74.1 million recorded during the third quarter of fiscal year 2011, which is only partially deductible for tax purposes. Additionally, the foreign income taxes at other than U.S. rates adversely impacted the annual effective tax rate due to a decrease in foreign income from continuing operations before income taxes and other foreign non-deductible items. The basis point improvement in our overall effective income tax rate for the fiscal year ended June 30, 2010 was primarily due to a decrease in the impact of the non-cash goodwill impairment charge recorded during the year ended June 30, 2010 compared to the impact of the non-cash goodwill impairment charge recorded during the year ended June 30, 2009 and an increase in the employment credits received. In addition, a 0.9 percent decrease in the tax rate was due to adjustments to the income tax balances, which had a smaller impact than the charge recorded in the prior year related to the adjustment of prior year deferred income taxes. The basis point increase in our overall effective income tax rate for the fiscal year ended June 30, 2009 was primarily the result of the pre-tax non-cash goodwill impairment charge of $41.7 million recorded during the three months ended December 31, 2008 which caused an increase in the tax rate of 14.5 percent. The majority of the impairment charge was not deductible for tax purposes. In addition, a 4.8 percent increase in the tax rate was due to an adjustment of prior year deferred income taxes. Offsetting the unfavorable shifts in the income tax rate was a 7.3 percent decrease in the tax rate due to the release of reserves for unrecognized tax benefits upon the expiration of the statute of limitation in federal, state and international jurisdictions.Equity in Income (Loss) of Affiliated Companies, Net of Income Taxes Equity in income (loss) of affiliates, representing the income or loss generated by our equity investment in Empire Education Group, Inc., Provalliance, and other equity method investments was as follows: (Decrease) Increase
Over Prior Fiscal Year Equity
Income
(Loss) Dollar Percentage (Dollars in thousands) $ 7,228 $ (4,714 ) (39.5 )% 11,942 41,788 140.0 (29,846 ) (30,695 ) (3,615.4 ) Equity in income of affiliated companies, net of taxes for the year ended June 30, 2011 was due to equity in income of $7.8, $5.5 and $0.6 million recorded for our investments in Provalliance, EEG and Hair Club for Men, Ltd., respectively. In addition, the Company recorded a $9.0 million impairment loss related to the Company's investment in MY Style. The impairment charge was based on the decline in equity value of MY Style as a result of changes in projected revenue growth after the natural disasters that occurred in Japan during March 2011. The Company also recorded a $2.4 million net gain related to the settlement of a portion of the Company's equity put liability and additional ownership of the Frank Provost Group in Provalliance. Equity in income of affiliated companies, net of taxes for the year ended June 30, 2010 was due to equity in income of $4.1, $6.4 and $0.9 million recorded for our investments in Provalliance, EEG and Hair Club for Men, Ltd., respectively. The increase in losses of affiliated companies, net of taxes for the year ended June 30, 2009 was primarily due to the impairment losses of $25.7 and $4.8 million, on our investment in Provalliance and investment in and loans to Intelligent Nutrients, LLC, respectively. Primarily the result of the weakened economy across continental Europe, Provalliance had recorded income at levels much less thanexpected by Regis management during the Company's fiscal year ended June 30, 2009. In addition, Provalliance significantly increased its debt levels resulting from acquisitions since January 31, 2008 but had significantly reduced future income expectations as a result of current economic conditions. The Company calculated the estimated fair value of Provalliance based on discounted future cash flows that utilize estimates in annual revenue growth, gross margins, capital expenditures, income taxes and long-term growth for determining terminal value. The discounted cash flow model utilizes projected financial results based on Provalliance's business plans and historical trends. The increased debt and reduced earnings expectations reduced the fair value of Provalliance as of June 30, 2009. Accordingly, the Company could no longer justify the carrying amount of its investment in Provalliance and recorded a $25.7 million other than temporary impairment charge in its fourth quarter ended June 30, 2009. The $4.8 million impairment charge was based on Intelligent Nutrients, LLC's inability to develop a professional organic brand of shampoo and conditioner with broad consumer appeal. The Company determined the losses in value to be other than temporary. Partially offsetting the impairment losses was equity in income recorded for our investments in Provalliance, EEG and Hair Club for Men, Ltd. See Note 6 to the Consolidated Financial Statements for further discussion of each respective affiliated company.Income (Loss) from Discontinued Operations, net of Taxes Income (loss) from discontinued operations was as follows: (Decrease) Increase
Over Prior Fiscal Year Income (Loss)
from Discontinued
Operations,
Net of Taxes Dollar Percentage (Dollars in thousands) $ — $ (3,161 ) (100.0 )% 3,161 134,597 102.4 (131,436 ) (132,739 ) (10,187.2 ) During fiscal year 2010, the Company recorded a $3.0 million tax benefit in discontinued operations to correct the prior year calculation of the income tax benefit related to the disposition of the Trade Secret Salon concept. During the quarter ended December 31, 2008, we concluded that our Trade Secret concept was held for sale and presented it as discontinued operations for all comparable prior periods. The loss from discontinued operations during fiscal year 2009 represents operating losses and non-cash impairment charges of $183.3 million. The decrease in income from discontinued operations during fiscal year 2008 was primarily due to same-store sales decreasing 7.9 percent and reduced retail product margins, largely the result of recent salon acquisitions which have lower product margins. The decrease in income from discontinued operations during fiscal year 2008 was also due to long-lived asset impairment charges of $4.4 million in fiscal year 2008 as compared to $1.7 million during fiscal year 2007. See Note 2 to the Consolidated Financial Statements for further discussion.Recent Accounting Pronouncements Recent accounting pronouncements are discussed in Note 1 to the Consolidated Financial Statements.Effects of Inflation We compensate some of our salon employees with percentage commissions based on sales they generate, thereby enabling salon payroll expense as a percent of company-owned salon revenues to remain relatively constant. Accordingly, this provides us certain protection against inflationary increases, as payroll expense and related benefits (our major expense components) are variable costs of sales. In addition, we may increase pricing in our salons to offset any significant increases in wages. Therefore, we do not believe inflation has had a significant impact on the results of our operations.Constant Currency Presentation The presentation below demonstrates the effect of foreign currency exchange rate fluctuations from year to year. To present this information, current period results for entities reporting in currencies other than United States dollars are converted into United States dollars at the average exchange rates in effect during the corresponding period of the prior fiscal year, rather than the actual average exchange rates in effect during the current fiscal year. Therefore, the foreign currency impact is equal to current year results in local currencies multiplied by the change in the average foreign currency exchange rate between the current fiscal period and the corresponding period of the prior fiscal year. During the fiscal year ended June 30, 2011, foreign currency translation had a favorable impact on consolidated revenues due to the strengthening of the Canadian dollar and British Pound against the United States dollar. During the fiscal year ended June 30, 2010, foreign currency translation had a favorable impact on consolidated revenues due to the strengthening of the Canadian dollar against the United States dollar, partially offset by the weakening of the British pound and Euro against the United States dollar. During the fiscal year ended June 30, 2009, foreign currency translation had an unfavorable impact on consolidated revenues due to the weakening of the Canadian dollar, British pound, and Euro against the United States dollar. Favorable (Unfavorable) Impact of Foreign Currency Exchange Rate Fluctuations Impact on Income Before Income Taxes Impact on Revenues Fiscal 2011 Fiscal 2010 Fiscal 2011 Fiscal 2010 Fiscal 2009 Fiscal 2009 (Dollars in thousands) $ 9,736 $ 10,422 $ (18,509 ) $ 937 $ 1,761 $ (3,009 ) 653 (4,928 ) (36,624 ) 15 (184 ) 7,248 (137 ) (34 ) (496 ) 39 (5 ) (252 ) $ 10,252 $ 5,460 $ (55,629 ) $ 991 $ 1,572 $ 3,987 Results of Operations by Segment Based on our internal management structure, we report three segments: North American salons, International salons and Hair Restoration Centers. Significant results of operations are discussed below with respect to each of these segments.North American Salons North American Salon Revenues. Total North American salon revenues were as follows: (Decrease) Increase
Over Prior Fiscal Year Same-Store Sales
Decrease Revenues Dollar Percentage (Dollars in thousands) $ 2,029,944 $ (30,619 ) (1.5 )% (1.8 )% 2,060,563 (57,135 ) (2.7 ) (3.3 ) 2,117,698 27,952 1.3 (2.9 ) The percentage (decreases) increases during the years ended June 30, 2011, 2010, and 2009 were due to the following factors: Percentage
(Decrease) Increase in
Revenues For the
Years Ended June 30, 2011 2010 2009 1.2 % 0.8 % 3.7 % (1.7 ) (3.6 ) (0.9 ) 0.5 0.5 (0.9 ) 0.0 — (0.1 ) (1.5 ) (0.4 ) (0.5 ) (1.5 )% (2.7 )% 1.3 % We acquired 105 North American salons during the twelve months ended June 30, 2011, including 78 franchise buybacks. The decline in organic sales was the result of a same-store sales decrease of 1.8 percent due to a decline in same-store customer visits, partially offset by an increase in average ticket. Contributing to the organic sales decline during the twelve months ended June 30, 2011 was the completion of an agreement to supply the purchaser of Trade Secret product at cost. The Company generated revenues of $20.0 million for product sold to the purchaser of Trade Secret during the twelve months ended June 30, 2010. The foreign currency impact during fiscal year 2011 resulted primarily from the weakening of the United States dollar against the Canadian dollar. We acquired 26 North American salons during the twelve months ended June 30, 2010, including 23 franchise buybacks. The decline in organic sales was the result of a same-store sales decrease of 3.3 percent due to a decline in same-store customer visits, partially offset by an increase in average ticket. Contributing to the organic sales decline during the twelve months ended June 30, 2010 was the completion of an agreement to supply the purchaser of Trade Secret product at cost. The Company generated revenues of $20.0 and $32.2 million for product sold to the purchaser of Trade Secret during the twelve months ended June 30, 2010 and 2009, respectively. The foreign currency impact during fiscal year 2010 resulted from the weakening of the United States dollar against the Canadian dollar as compared to the exchange rate for fiscal year 2009. We acquired 177 North American salons during the twelve months ended June 30, 2009, including 83 franchise buybacks. The organic decrease was due primarily to same-store sales decrease of 2.9 percent, partially offset by the construction of 168 company-owned salons in North America and $32.2 million of product sales to the purchaser of Trade Secret during the twelve months ended June 30, 2009. The foreign currency impact during fiscal year 2009 resulted from the strengthening of the United States dollar against the Canadian dollar as compared to the exchange rate for fiscal year 2008. North American Salon Operating Income. Operating income for the North American salons was as follows: Decrease Over Prior Fiscal Year Operating
Income Operating
Income as % of
Total Revenues Dollar Percentage Basis Point(1) (Dollars in thousands) $ 166,683 8.2 % $ (53,172 ) (24.2 )% (250 ) 219,855 10.7 (55,773 ) (20.2 ) (230 ) 275,628 13.0 (10,227 ) (3.6 ) (70 ) (1)Represents the basis point change in North American salon operating income as a percent of total North American salon revenues as compared to the corresponding period of the prior fiscal year. The basis point decrease in North American salon operating income as a percent of North American salon revenues during fiscal year 2011 was primarily due to the $74.1 million goodwill impairment of the Company's Promenade salon concept and negative leverage in fixed cost categories due to negative same-store sales. Partially offsetting the basis point decrease was lower depreciation expense due to a reduction in salon construction. The basis point decrease in North American salon operating income as a percent of North American salon revenues during fiscal year 2010 was primarily due to the $35.3 million goodwill impairment of the Company's Regis salon concept and negative leverage in fixed cost categories due to negative same-store sales. In addition, the basis point decrease was due to the settlement of two legal claims regarding customer and employee matters totaling $5.2 million, higher self insurance expense (the Company recorded reduction in self insurance accruals of $1.7 million in the twelve months ended June 30, 2010 compared to a $9.9 million reduction in the twelve months ended June 30, 2009), partially offset by the Company's cost saving initiatives and gross margin improvement. The basis point decrease in North American salon operating income as a percent of North American salon revenues during fiscal year 2009 was primarily due to negative leverage in fixed cost categories due to negative same-store sales and lease termination costs associated with the Company's plan to close underperforming company-owned salons. In addition, the basis point decrease was due to an increase in North American revenues of $32.2 million related to product sales to the purchaser of Trade Secret at cost.International Salons International Salon Revenues. Total International salon revenues were as follows: Decrease
Over Prior Fiscal Year Same-Store Sales
Decrease Revenues Dollar Percentage (Dollars in thousands) $ 150,237 $ (5,848 ) (3.7 )% (3.1 )% 156,085 (15,484 ) (9.0 ) (3.8 ) 171,569 (84,494 ) (33.0 ) (7.2 ) The percentage (decreases) increases during the years ended June 30, 2011, 2010, and 2009 were due to the following factors: Percentage (Decrease)
Increase in Revenues For
the Years Ended June 30, 2011 2010 2009 — % — % — % (0.3 ) 1.5 (4.8 ) 0.3 (2.9 ) (14.5 ) — — (9.2 ) (3.7 ) (7.6 ) (4.5 ) (3.7 )% (9.0 )% (33.0 )% We did not acquire any International salons during the twelve months ended June 30, 2011. The organic sales decrease was primarily due to a decrease in same-store sales of 3.1 percent for the twelve months ended June 30, 2011, partially offset by the rebranding of certain salons that had previously been operating under a different salon concept. The foreign currency impact during fiscal year 2011 resulted from the weakening of the United States dollar against the British Pound. We closed 15 company-owned salons during the twelve months ended June 30, 2011. We did not acquire any International salons during the twelve months ended June 30, 2010. The organic sales increase was primarily due to the rebranding of certain salons that had previously been operating under a different salon concept, partially offset by a decrease in same-store sales of 3.8 percent for the twelve months ended June 30, 2010. The foreign currency impact during fiscal year 2010 resulted from the weakening of the United States dollar against the British Pound and Euro as compared to the exchange rates for fiscal year 2009. We closed 42 company-owned salons during the twelve months ended June 30, 2010, of which 29 related to the June 2009 plan to close underperforming salons in the United Kingdom. We did not acquire any International salons during the twelve months ended June 30, 2009. The organic sales decline was primarily due to a decrease of same-store sales of 7.2 percent for the twelve months ended June 30, 2009, partially offset by the four company-owned international salons constructed. The foreign currency impact during fiscal year 2009 resulted from the strengthening of the United States dollar against the British Pound and Euro as compared to the exchange rates for fiscal year 2008. Franchise revenues decreased primarily due to the merger of our continental Europe franchise salon operations with Franck Provost Salon Group on January 31, 2008. International Salon Operating Income (Loss). Operating income (loss) for the International salons was as follows: (Decrease) Increase
Over Prior Fiscal Year Operating
Income (Loss) Operating Income
(Loss) as % of
Total Revenues Dollar Percentage Basis Point(1) (Dollars in thousands) $ 6,738 4.5 % $ (41 ) (0.6 )% 20 6,779 4.3 52,260 114.9 3,080 (45,481 ) (26.5 ) (57,132 ) (490.4 ) (3,110 ) (1)Represents the basis point change in International salon operating income (loss) as a percent of total International salon revenues as compared to the corresponding period of the prior fiscal year. The basis point improvement in International salon operating income as a percent of International salon revenues during fiscal year 2011 was primarily due to $2.1 million of lease termination costs recognized during fiscal year 2010 associated with the Company's planned closure of underperforming salons. Partially offsetting the basis point improvement was a decline on product margins from mix play, as a larger than expected percentage of our product sales came from lower-margin products. The basis point improvement in International salon operating income as a percent of International salon revenues during fiscal year 2010 was primarily due to the comparable prior period including a $41.7 million goodwill impairment of the United Kingdom reporting unit and higher impairment charges related to the impairment of property and equipment at underperforming locations. In addition the Company's planned closure of underperforming United Kingdom salons and the continuation of the Company's expense control and payroll management contributed to the basis point improvement during fiscal year 2010. The basis point decrease in International salon operating income as a percent of International salon revenues during fiscal year 2009 was primarily due to negative same-store sales and the $41.7 million goodwill impairment of the United Kingdom reporting unit during the fiscal year 2009.Hair Restoration Centers Hair Restoration Center Revenues. Total Hair Restoration Centers revenues were as follows: Increase Over
Prior Fiscal Year Same-Store Sales
Increase
(Decrease) Revenues Dollar Percentage (Dollars in thousands) $ 145,688 $ 3,902 2.8 % 1.2 % 141,786 1,266 0.9 0.4 140,520 4,938 3.6 (0.8 ) The percentage increases (decreases) during the years ended June 30, 2011, 2010, and 2009 were due to the following factors: Percentage Increase
(Decrease) in Revenues
For the Years Ended
June 30, 2011 2010 2009 1.1 % 0.2 % 5.9 % 1.0 1.0 (0.9 ) 0.7 (0.3 ) (1.4 ) 2.8 % 0.9 % 3.6 % We acquired four hair restoration centers during the twelve months ended June 30, 2011, all of which were franchise buybacks, and constructed three hair restoration centers during the twelve months ended June 30, 2011. The increase in organic Hair Restoration Centers revenues during fiscal year 2011 was due to the increase in same-store sales of 1.2 percent. We constructed four hair restoration centers during the twelve months ended June 30, 2010. The increase in organic Hair Restoration Centers revenues during fiscal year 2010 was due to the increase in same-store sales of 0.4 percent. We acquired two hair restoration centers during the twelve months ended June 30, 2009, both of which were franchise buybacks, and constructed eight hair restoration centers during the twelve monthsended June 30, 2009. The decrease in organic Hair Restoration Centers revenues during fiscal year 2009 was due to the decrease in same-store sales of 0.8 percent. Hair Restoration Center Operating Income. Operating income for our Hair Restoration Centers was as follows: Decrease Over Prior Fiscal Year Operating
Income Operating Income
as % of
Total Revenues Dollar Percentage Basis Point(1) (Dollars in thousands) $ 18,230 12.5 % $ (2,107 ) (10.4 )% (180 ) 20,337 14.3 (3,534 ) (14.8 ) (270 ) 23,871 17.0 (4,310 ) (15.3 ) (380 ) (1)Represents the basis point change in Hair Restoration Centers operating income as a percent of total Hair Restoration Centers revenues as compared to the corresponding period of the prior fiscal year. The basis point decrease in Hair Restoration Centers operating income as a percent of Hair Restoration Centers revenues during the twelve months ended June 30, 2011 was primarily due to an increase in the cost of hair systems and expenses associated with a legal claim. Partially offsetting the basis point decrease was a benefit related to a favorable ruling on a state sales tax issue. The basis point decrease in Hair Restoration Centers operating income as a percent of Hair Restoration Centers revenues during the twelve months ended June 30, 2010 was primarily due to an increase in advertising spend and the settlement of a vendor dispute totaling $0.6 million. The basis point decrease in Hair Restoration Centers operating income as a percent of Hair Restoration Centers revenues during fiscal year 2009 was primarily due to lower operating margins on newly constructed and acquired centers and negative leverage in fixed cost categories due to negative same-store sales.Unallocated Corporate Unallocated Corporate Operating Loss. Unallocated corporate operating expenses include salaries, stock-based compensation, professional fees, rent, depreciation and other expenses that are not allocated. Unallocated corporate operating losses were as follows: Increase (Decrease)
Over Prior Fiscal Year Operating
Loss Dollar Percentage (Dollars in thousands) $ (187,703 ) $ 37,950 25.3 % (149,753 ) 4,808 3.3 (144,945 ) (7,402 ) (4.9 ) The increase in unallocated corporate operating loss during the twelve months ended June 30, 2011 as compared to the twelve months ended June 30, 2010 was primarily due to the $31.2 million valuation reserve on the note receivable with the purchaser of Trade Secret, incremental costs associated with the Company's senior management restructure, professional fees incurred related to the exploration of strategic alternatives and information technology projects and legal claims expense. The increase in unallocated corporate operating loss during the twelve months ended June 30, 2010 as compared to the twelve months ended June 30, 2009 was primarily due to an increase in professional fees and distribution costs from an agreement with the purchaser of Trade Secret. The decrease in unallocated corporate operating loss during the twelve months ended June 30, 2009 as compared to the twelve months ended June 30, 2008 was primarily due to the cost savings initiatives implemented during the first half of fiscal year 2009 and a reduction in professional fees.LIQUIDITY AND CAPITAL RESOURCESOverview We continue to maintain a strong balance sheet to support system growth and financial flexibility. Our debt to capitalization ratio, calculated as total debt as a percentage of total debt and shareholders' equity at fiscal year end, was as follows: Debt to
Capitalization Basis Point
(Decrease) Increase(1) 23.3 % (700 ) 30.3 (1,380 ) 44.1 20 (1)Represents the basis point change in debt to capitalization as compared to prior fiscal year end (June 30). The basis point improvement in the debt to capitalization ratio as of June 30, 2011 compared to June 30, 2010 was primarily due to the repayment of an $85.0 million term loan during fiscal year 2011 and foreign currency translation adjustments due to the weakening of the United States dollar against the Canadian dollar and British Pound. The basis point improvement in the debt to capitalization ratio as of June 30, 2010 compared to June 30, 2009 was primarily due to the July 2009 common stock offering and decreased debt levels stemming from the repayment of private placement debt during fiscal year 2010. Our principal on-going cash requirements are to finance construction of new stores, remodel certain existing stores, acquire salons and purchase inventory. Customers pay for salon services and merchandise in cash at the time of sale, which reduces our working capital requirements. The basis point increase in the debt to capitalization ratio as of June 30, 2009 compared to June 30, 2008 was primarily due to a decrease in shareholders' equity from the non-cash goodwill impairment within the United Kingdom salon division, the loss from discontinued operations related to the sale of Trade Secret, the non-cash impairment of our investment in Provalliance and foreign currency due to the strengthening of the United States dollar against the Canadian dollar, Euro and British Pound. The impact of the decrease in shareholders' equity on the debt to capitalization ratio was partially offset by a decrease in debt from June 30, 2008 to June 30, 2009. As of June 30, 2009 and 2008, approximately $55.5 and $230.2 million, respectively, of our debt outstanding is classified as a current liability. As of June 30, 2009 and 2008 we had borrowings on our revolving credit facility of $5.0 and $139.1 million, respectively. Total assets at June 30, 2011, 2010, and 2009 were as follows: (Decrease) Increase
Over Prior Fiscal Year Total
Assets Dollar Percentage (Dollars in thousands) $ 1,805,753 $ (113,819 ) (5.9 )% 1,919,572 27,086 1.4 1,892,486 (343,385 ) (15.4 ) The $74.1 million goodwill impairment charge related to the Promenade salon concept, a $31.2 million valuation reserve on the note receivable due from the purchaser of Trade Secret, and a $9.2 million impairment on the Company's investment in MY Style, partially offset by cash flows from operations, were the primary factors for the decrease in total assets as of June 30, 2011 compared to June 30, 2010. Cash flows from operations, partially offset by the $35.3 million goodwill impairment charge related to the Regis salon concept were the primary factors for the increase in total assets as of June 30, 2010 compared to June 30, 2009. The non-cash goodwill impairment within the United Kingdom salon division, non-cash impairment of our investment in Provalliance, non-cash impairment related to the sale of Trade Secret salon concept, and a planned reduction in inventory were the primary factors for the decrease in total assets as of June 30, 2009 compared to June 30, 2008. Total shareholders' equity at June 30, 2011, 2010, and 2009 was as follows: Increase (Decrease)
Over Prior Fiscal Year Shareholders'
Equity Dollar Percentage (Dollars in thousands) $ 1,032,619 $ 19,326 1.9 % 1,013,293 210,433 26.2 802,860 (173,326 ) (17.8 ) During the twelve months ended June 30, 2011, equity increased primarily as a result of $30.4 million of foreign currency translation and $9.6 million of stock based compensation, partially offset by $11.5 million of dividends and $8.9 million of net loss. During the twelve months ended June 30, 2010, equity increased primarily as a result of the issuance of the $163.6 million in common stock, the $24.7 million ($15.2 million net of tax) equity component of the convertible debt, stock based compensation of $9.3 million and the $42.7 million of earnings during fiscal year 2010. Partially offsetting the increase was $9.1 million of dividends, $8.2 million in equity issuance costs and $5.4 million of foreign currency translation adjustments. During the twelve months ended June 30, 2009, equity decreased primarily as a result of the non-cash goodwill impairment within the United Kingdom salon division, the non-cash impairment of our investment in Provalliance, the non-cash impairment related to the sale of Trade Secret and foreign currency due to the strengthening of the United States dollar against the Canadian dollar, Euro, and British Pound.Cash FlowsOperating Activities Net cash provided by operating activities during the twelve months ended June 30, 2011, 2010 and 2009 were a result of the following: Operating Cash Flows
For the Years Ended June 30, 2011 2010 2009 (Dollars in thousands) $ (8,905 ) $ 42,740 $ (124,466 ) 98,428 102,336 115,016 (7,228 ) (11,942 ) 28,940 10,023 2,404 906 (14,711 ) 5,115 (3,843 ) — (154 ) 183,289 80,781 41,705 51,862 31,227 — — (2,358 ) 1,192 (12,104 ) 4,629 4,823 7,128 23,855 957 (34,652 ) 4,725 2,657 (52 ) (11,050 ) (14,951 ) (1,327 ) 368 1,040 (26,977 ) 1,818 1,954 387 17,576 12,347 3,957 $ 229,178 $ 192,223 $ 188,064 Fiscal year 2011 cash provided by operating activities was greater than fiscal year 2010 cash provided by operating activities due to an increase of $7.6 million in dividends received from affiliated companies and a $23.9 million reduction in income tax receivables. Fiscal year 2010 cash provided by operating activities was consistent with fiscal year 2009 cash provided by operating activities. During fiscal year 2009, cash provided by operating activities was lower than in the twelve months ended June 30, 2008 primarily due to a decrease in working capital cash flow, primarily related to a current year receivable from the purchaser of Trade Secret and a decrease in accrued payroll.Investing Activities Net cash used in investing activities during the twelve months ended June 30, 2011, 2010 and 2009 was the result of the following: Investing Cash Flows
For the Years Ended June 30, 2011 2010 2009 (Dollars in thousands) $ (17,990 ) $ (3,664 ) $ (40,051 ) (44,855 ) (40,561 ) (35,081 ) (13,826 ) (7,828 ) (13,113 ) (12,788 ) (9,432 ) (25,380 ) 16,804 16,099 19,008 (72,301 ) — (20,971 ) — 736 — 626 70 77 $ (144,330 ) $ (44,580 ) $ (115,511 ) Cash used by investing activities was greater during fiscal year 2011 compared to fiscal year 2010 due to the acquisition of approximately 17 percent additional equity interest in Provalliance for $57.3 million (€ 40.4 million), a disbursement of $15.0 million on the revolving credit facility with EEG and the planned increase in acquisitions and capital expenditures. The Company completed 271 major remodeling projects during fiscal year 2011, compared to 333 and 280 during fiscal years 2010 and 2009, respectively. During fiscal year 2011, we constructed 146 company-owned salons and three hair restoration centers, and acquired 105 company-owned salons (78 of which were franchise buybacks) and four hair restoration centers (all of which were franchise buybacks). Cash used by investing activities was lower during fiscal year 2010 compared to fiscal year 2009 due to the planned reduction in acquisitions and capital expenditures and the receipt of $15.0 million on the revolving credit facility with EEG of which there was $0.0 and $15.0 million outstanding as of June 30, 2010 and 2009, respectively. The Company completed 333 major remodeling projects during fiscal year 2010, compared to 280 and 186 during fiscal years 2009 and 2008, respectively. We constructed 139 company-owned salons, four hair restoration centers and acquired 26 company-owned salons (23 of which were franchise buybacks) and zero hair restoration centers. Cash used by investing activities was lower during fiscal year 2009 compared to fiscal year 2008 due to the planned reduction in acquisitions and capital expenditures. Acquisitions during fiscal year 2009 were primarily funded by a combination of operating cash flows and debt. Additionally, the Company completed 280 major remodeling projects during fiscal year 2009, compared to 186 during fiscal year 2008. We constructed 182 company-owned salons, eight hair restoration centers and acquired 177 company-owned salons (83 of which were franchise buybacks) and two hair restoration centers, all of which were franchise buybacks. In addition during fiscal year 2008, there was a $36.4 million loan to Empire Education Group, Inc. and a transfer of $10.9 million in cash related to the deconsolidation of our schools and European franchise salon business. The company-owned constructed and acquired locations (excluding franchise buybacks) consisted of the following number of locations in each concept: Years Ended June 30, 2011 2010 2009 Constructed Acquired Constructed Acquired Constructed Acquired 12 9 14 3 20 23 6 — 15 — 14 — — — — — 10 — 65 — 80 — 71 — 24 — 10 — 27 — 26 18 18 — 36 71 13 — 2 — 4 — 3 — 4 — 8 — 149 27 143 3 190 94 (1)Beginning with the period ended December 31, 2008, the operations of Trade Secret concept within the North American reportable segment were accounted for as discounted operations. All comparable periods will reflect Trade Secret as discontinued operations.Financing Activities Net cash used in financing activities during the twelve months ended June 30, 2011, 2010 and 2009 was the result of the following: Financing Cash Flows
For the Years Ended June 30, 2011 2010 2009 (Dollars in thousands) $ — $ (5,000 ) $ (134,100 ) (137,671 ) (181,850 ) (7,504 ) 682 159,498 3,894 67 243 163 (11,509 ) (9,146 ) (6,912 ) — (2,878 ) (3,848 ) $ (148,431 ) $ (39,133 ) $ (148,307 ) During fiscal year 2011, the primary use of cash within financing activities was for repayments of long-term debt and dividends. During fiscal year 2010, the primary use of cash within financing activities was for net repayments of long-term debt, partially offset by the issuance of common stock. During fiscal year 2009, the primary use of cash within financing activities was for net repayments on revolving credit facilities as reducing debt levels was one step the Company took to help maintain its compliance with debt covenants. The Company utilized intercompany borrowings on a short-term basis as allowed by a recently expanded IRS ruling to reduce debt.New Financing ArrangementsFiscal Year 2011 On June 30, 2011, the Company entered into a Fifth Amended and Restated Credit Agreement, which amended and restated in its entirety, the Company's existing Fourth Amended and Restated Credit Agreement. The Fifth Amended and Restated Credit Agreement provides for a $400.0 million senior unsecured five-year revolving credit facility. The amendments included increasing the Company's minimum net worth covenant from $800.0 to $850.0 million, and amending or adding certain definitions, including Change in Law, Defaulting Lender, EBITDA, Fronting Exposure, Replacement Lender, and Accounting Principles. In addition, under the Fifth Amended and Restated Credit Agreement, the Company may request an increase in revolving credit commitments under the facility of up to $200.0 million under certain circumstances. Under the new agreement, indebtedness related to Capital Leases is limited to $50.0 million, and Restricted Payments are tiered based on Debt to EBITDA. Events of default under the Credit Agreement include change of control of the Company and the Company's default of other debt exceeding $10.0 million. We were in compliance with all covenants and other requirements of our credit agreement and senior notes as of June 30, 2011.Fiscal Year 2010 On July 8, 2009, the Company entered into an agreement to sell to underwriters $150 million aggregate principal amount of 5.0 percent convertible senior notes due 2014, and 11,500,000 shares of its common stock at $12.37 per share, which was the closing price per share on July 8, 2009. The Company completed the agreement on July 14, 2009. In addition, under the July 8, 2009 agreement, the Company granted the underwriters an over-allotment option to purchase up to an additional $22.5 million aggregate principal amount of notes, and up to an additional 1,725,000 shares of common stock, on the same terms and conditions. The underwriters exercised such options in their entirety and, on July 21, 2009, the Company completed the issuance of the additional shares and notes for the exercise by the underwriters of the over-allotment option of $22.5 million aggregate principal amount of notes and an additional 1,725,000 shares of common stock. The notes are unsecured, senior obligations of the Company and interest will be payable semi-annually at a rate of 5.0 percent per year. The notes will mature on July 15, 2014. The notes will be convertible subject to certain conditions at an initial conversion rate of 64.6726 shares of the Company's common stock per $1,000 principal amount of notes (representing an initial conversion price of approximately $15.46 per share of the Company's common stock), subject to adjustment in certain circumstances, see further discussion within Note 8 to the Consolidated Financial Statements. The net proceeds to the Company from the offerings of convertible senior notes and common stock were approximately $323.8 million after deducting underwriting discounts and before estimated offering expenses. The Company utilized the proceeds to repay $267.0 million of private placement senior term notes of varying maturities and $30.0 million of senior term notes under the Private Shelf Agreement. As a result of the repayment of a portion of the senior term notes during the twelve months ended June 30, 2010, the Company incurred $12.8 million in make-whole payments and other fees along with $5.2 million in interest rate swap settlements, as discussed in Note 9 to the Consolidated Financial Statements, totaling $18.0 million that was recorded as interest expense within the Consolidated Statement of Operations. The remaining proceeds were used for general corporate purposes including the repayment of bank debt. In connection with the offerings above, on July 14, 2009, the Company amended the Fourth Amended and Restated Credit Agreement, the Term Loan Agreement and the Amended and Restated Private Shelf Agreement, all subject to the completion of the issuances of the convertible senior notes and common stock discussed above. The amendments included increasing the Company's minimum net worth covenant from $675 to $800 million, lowering the fixed charge coverage ratio requirementfrom 1.5x to 1.3x, amending certain definitions, including EBITDA and Fixed Charges, and limiting the Company's Restricted Payments to $20 million if the Company's Leverage Ratio is greater than 2.0x. In addition, the amendments to the Fourth Amended and Restated Credit Agreement reduced the borrowing capacity of the revolving credit facility from $350.0 to $300.0 million and the amendments to the Restated Private Shelf Agreement incorporated a risk based capital fee calculated on the daily average outstanding principal amount equal to an annual rate of 1.0 percent which commences one year after the effective date of the amendment.Fiscal Year 2009 During fiscal year 2009, we completed a $85 million term loan that matures in July 2012. The monthly interest payments are based on a one-month LIBOR plus a 1.75 percent spread. The term loan includes customary financial covenants including a leverage ratio, fixed charge ratio and minimum net equity test. We used the proceeds from the term loan to pay down our revolving line of credit facility.Other Financing ArrangementsPrivate Shelf Agreement At June 30, 2011 and 2010, we had $133.6 and $174.1 million, respectively, in unsecured, fixed rate, senior term notes outstanding under a Private Shelf Agreement. The notes require quarterly payments, and final maturity dates range from June 2013 through December 2017. The interest rates on the notes range from 6.69 to 8.50 percent as of June 30, 2011, and range from 5.65 to 8.39 percent as of June 30, 2010. The Private Shelf Agreement includes financial covenants including debt to earnings before interest, taxes, depreciation and amortization (EBITDA) ratios, fixed charge coverage ratios and minimum net equity tests (as defined within the Private Shelf Agreement), as well as other customary terms and conditions. The maturity date for the debt may be accelerated upon the occurrence of various Events of Default, including breaches of the agreement, certain cross-default situations, certain bankruptcy related situations, and other customary events of default. In July 2009, the Company amended the Restated Private Shelf Agreement. The amendments included increasing the Company's minimum net worth covenant from $675 to $800 million, lowering the fixed charge coverage ratio requirement from 1.5x to 1.3x, amending certain definitions, including EBITDA and Fixed Charges, limiting the Company's Restricted Payments to $20 million if the Company's Leverage Ratio is greater than 2.0x and the addition of a risk based capital fee calculated on the daily average outstanding principal amount equal to an annual rate of 1.0 percent that commences one year after the amendment date. During fiscal year 2010, the net proceeds from the convertible senior notes and common stock issuances in July 2009 were utilized in part to repay $30.0 million of senior term notes under the Private Shelf Agreement.Private Placement Senior Term Notes On June 29, 2009, the Company entered into a prepayment amendment on the private placement senior term notes whereby the Company negotiated to prepay the notes with a premium over the principal amount that was less than the make-whole premium that would otherwise be payable upon redemption. During fiscal year 2010, the net proceeds from the convertible senior notes and common stock issuances in July 2009 were utilized to repay the remaining outstanding private placement senior term notes totaling $267.0 million. As a result of the repayment of a portion of the senior term notes during the twelve months ended June 30, 2010, the Company incurred $12.8 million in make-whole payments and other fees along with $5.2 million in interest rate swap settlements, as discussed in Note 9 to the Consolidated Financial Statements, totaling $18.0 million that was recorded as interest expense within the Consolidated Statement of Operations.Acquisitions Acquisitions are discussed throughout Management's Discussion and Analysis in this Item 7, as well as in Note 4 to the Consolidated Financial Statements in Part II, Item 8 of this Form 10-K. The acquisitions were funded primarily from operating cash flow, debt and the issuance of common stock.Contractual Obligations and Commercial Commitments The following table reflects a summary of obligations and commitments outstanding by payment date as of June 30, 2011: Payments due by period Within 1
years 1 - 3
years 3 - 5
years More than
5 years Total (Dollars in thousands) $ 23,130 $ 196,580 $ 35,714 $ 35,714 $ 291,138 9,122 10,711 2,440 — 22,273 4,657 3,546 2,990 18,545 29,738 36,909 210,837 41,144 54,259 343,149 312,038 444,678 212,607 95,546 1,064,869 21,946 36,056 10,879 4,554 73,435 333,984 480,734 223,486 100,100 1,138,304 $ 370,893 $ 691,571 $ 264,630 $ 154,359 $ 1,481,453 (a)In accordance with accounting principles generally accepted in the United States of America, these obligations are not reflected in the Consolidated Balance Sheet.(b)As of June 30, 2011, we have liabilities for uncertain tax positions. We are not able to reasonably estimate the amount by which the liabilities will increase or decrease over time; however, at this time, we do not expect a significant payment related to these obligations within the next fiscal year. See Note 13 to the Consolidated Financial Statements for more information on our uncertain tax positions.On-Balance Sheet Obligations Our long-term obligations are composed primarily of senior term notes, convertible debt and a revolving credit facility. Interest payments on long-term debt and capital lease obligations were estimated based on each debt obligation's agreed upon rate as of June 30, 2011 and scheduled contractual repayments. Other long-term liabilities include a total of $22.6 million related to the Executive Profit Sharing Plan and a salary deferral program, $7.1 million (including $0.2 million in interest) related toestablished contractual payment obligations under retirement and severance payment agreements for a small number of retired employees. This table excludes the short-term liabilities, other than the current portion of long-term debt, disclosed on our balance sheet as the amounts recorded for these items will be paid in the next year. We have no unconditional purchase obligations, as defined by long-term obligations guidance. Also excluded from the contractual obligations table are payment estimates associated with employee health and workers' compensation claims for which we are self-insured. The majority of our recorded liability for self-insured employee health and workers' compensation losses represents estimated reserves for incurred claims that have yet to be filed or settled. The Company has unfunded deferred compensation contracts covering certain management and executive personnel. The deferred compensation contracts are offered to key executives based on their performance within the Company. Because we cannot predict the timing or amount of our future payments related to these contracts, such amounts were not included in the table above. Related obligations totaled $5.0 and $28.6 million, respectively at June 30, 2011, and are included in accrued liabilities and other noncurrent liabilities in the Consolidated Balance Sheet. Refer to Note 14 to the Consolidated Financial Statements for additional information. The obligations are funded by insurance contracts.Off-Balance Sheet Arrangements Operating leases primarily represent long-term obligations for the rental of salon and hair restoration center premises, including leases for company-owned locations, as well as future salon franchisee lease payments of approximately $141.2 million, which are reimbursed to the Company by franchisees, and the guarantee of approximately 40 salons operated by the purchaser of Trade Secret. Regarding the franchisee subleases, we generally retain the right to the related salon assets net of any outstanding obligations in the event of a default by a franchise owner. Management has not experienced and does not expect any material loss to result from these arrangements. We have forward foreign currency contracts. See Part II, Item 7A, "Quantitative and Qualitative Disclosures about Market Risk," for a detailed discussion of our derivative instruments. Future net settlements under these agreements are not included in the table above. We are a party to a variety of contractual agreements under which we may be obligated to indemnify the other party for certain matters, which indemnities may be secured by operation of law or otherwise, in the ordinary course of business. These contracts primarily relate to our commercial contracts, operating leases and other real estate contracts, financial agreements, credit facility of EEG, agreements to provide services, and agreements to indemnify officers, directors and employees in the performance of their work. While our aggregate indemnification obligation could result in a material liability, we are not aware of any current matter that we expect to result in a material liability. We do not have other unconditional purchase obligations or significant other commercial commitments such as commitments under lines of credit and standby repurchase obligations or other commercial commitments. As a part of our salon development program, we continue to negotiate and enter into leases and commitments for the acquisition of equipment and leasehold improvements related to future salon locations, and continue to enter into transactions to acquire established hair care salons and businesses. We do not have any relationships with unconsolidated entities or financial partnerships, such as entities often referred to as structured finance or special purpose entities, which would have been established for the purpose of facilitating off-balance sheet financial arrangements or other contractually narrow or limited purposes at June 30, 2011. As such, we are not materially exposed to any financing, liquidity, market or credit risk that could arise if we had engaged in such relationships.Financing Financing activities are discussed under "Liquidity and Capital Resources" in this Item 7 and in Note 8 to the Consolidated Financial Statements in Part II, Item 8. Derivative activities are discussed in Note 9 to the Consolidated Financial Statements in Part II, Item 8 and Part II, Item 7A, "Quantitative and Qualitative Disclosures about Market Risk." Management believes that cash generated from operations and amounts available under existing debt facilities will be sufficient to fund its anticipated capital expenditures, acquisitions and required debt repayments for the foreseeable future. As of June 30, 2011, we have available an unused committed line of credit amount of $374.0 million under our existing revolving credit facility.Dividends We paid dividends of $0.20 during fiscal year 2011 and $0.16 per share during fiscal years 2010 and 2009. On August 25, 2011, the Board of Directors of the Company declared a $0.06 per share quarterly dividend payable September 22, 2011 to shareholders of record on September 8, 2011.Share Repurchase Program In May 2000, the Company's Board of Directors (BOD) approved a stock repurchase program. Originally, the program authorized up to $50.0 million to be expended for the repurchase of the Company's stock. The BOD elected to increase this maximum to $100.0 million in August 2003, to $200.0 million on May 3, 2005, and to $300.0 million on April 26, 2007. The timing and amounts of any repurchases will depend on many factors, including the market price of the common stock and overall market conditions. Historically, the repurchases to date have been made primarily to eliminate the dilutive effect of shares issued in conjunction with acquisitions, restricted stock grants and stock option exercises. All repurchased shares become authorized but unissued shares of the Company. This repurchase program has no stated expiration date. The Company did not repurchase any shares during fiscal year 2011. As of June 30, 2011, 2010, and 2009, a total accumulated 6.8 million shares have been repurchased for $226.5 million. As of June 30, 2011, $73.5 million remains to be spent on share repurchases under this program.SAFE HARBOR PROVISIONS UNDER THE PRIVATE SECURITIES LITIGATION REFORM ACT OF 1995 This annual report, as well as information included in, or incorporated by reference from, future filings by the Company with the Securities and Exchange Commission and information contained in written material, press releases and oral statements issued by or on behalf of the Company contains or may contain "forward-looking statements" within the meaning of the federal securities laws, including statements concerning anticipated future events and expectations that are not historical facts. These forward-looking statements are made pursuant to the safe harbor provisions of the Private Securities Litigation Reform Act of 1995. The forward-looking statements in this document reflect management's best judgment at the time they are made, but all such statements are subject to numerous risks and uncertainties, which could cause actual results to differ materially from those expressed in or implied by the statements herein. Such forward-looking statements are often identified herein by use of words including, but not limited to, "may," "believe," "project," "forecast," "expect," "estimate," "anticipate," and "plan." In addition, the following factors could affect the Company's actual results and cause such results to differ materially from those expressed in forward-looking statements. These factors include, competition within the personal hair care industry, which remains strong, both domestically and internationally, price sensitivity; changes in economic conditions; changes in consumer tastes and fashion trends; the ability of the Company to implement its planned spending and cost reduction plan and to continue to maintain compliance with financial covenants in its credit agreements; labor andbenefit costs; legal claims; risk inherent to international development (including currency fluctuations); the continued ability of the Company and its franchisees to obtain suitable locations and financing for new salon development and to maintain satisfactory relationships with landlords and other licensors with respect to existing locations; governmental initiatives such as minimum wage rates, taxes and possible franchise legislation; the ability of the Company to successfully identify, acquire and integrate salons that support its growth objectives; the ability of the Company to maintain satisfactory relationships with suppliers; or other factors not listed above. The ability of the Company to meet its expected revenue target is dependent on salon acquisitions, new salon construction and same-store sales increases, all of which are affected by many of the aforementioned risks. Additional information concerning potential factors that could affect future financial results is set forth under Item 1A of this Form 10-K. We undertake no obligation to publicly update or revise any forward-looking statements, whether as a result of new information, future events or otherwise. However, your attention is directed to any further disclosures made in our subsequent annual and periodic reports filed or furnished with the SEC on Forms 10-Q and 8-K and Proxy Statements on Schedule 14A.some ofspecifically the revolving credit facility which bears interest at variable rates based on LIBOR plus an applicable borrowing margin. Additionally, the Company is exposed to foreign currency translation risk related to its net investments in its foreign subsidiaries and, to a lesser extent, changes in the Canadian dollar exchange rate.and British Pound. The Company has established policies and procedures that govern the management of these exposures through the use of derivative financial instrument contracts. By policy, the Company does not enter into such contracts for the purpose of speculation. The following details the Company's policies and use of financial instruments.the earnings implications associated with the volatility ofin short-term interest rates. As part of this policy, the Company has historically maintained a combination of variable and fixed rate debt. Considering the effect of interest rate swaps and including no increases to long-term debt related to fair value swaps at June 30, 2011 and 2010, the Company had the following outstanding debt balances: As of June 30, 2011 2010 (Dollars in thousands) $ 313,411 $ 395,029 — 45,000 $ 313,411 $ 440,029 The Company manages its interest rate risk by continually assessing the amount of fixed and variable rate debt. On occasion, the Company uses interest rate swaps to further mitigate the risk associated with changing interest rates and to maintain its desired balances of fixed and floating rate debt.Company has entered into the following financial instruments:Interest Rate Swap Contracts:managesreviews its policy and interest rate risk by balancingmanagement quarterly and makes adjustments in accordance with market conditions and the amountCompany's short and long-term borrowing needs. As of fixed andJune 30, 2014, the Company did not have any outstanding variable rate debt. On occasion, the Company uses interest rate swaps to further mitigate the risk associated withchanging interest rates and to maintain its desired balances of fixed and variable rate debt. Generally, the terms of the interest rate swap agreements contain monthly and quarterly settlement dates baseddebt as there were no amounts outstanding on the notional amounts of the swap contracts.Pay fixed rates, receive variable rates During the three months ended December 31, 2008, therevolving credit facility. The Company entered into two interest rate swap contracts that pay fixed rates of interest and receive variable rates of interest (based on the one-month LIBOR) on notional amounts of indebtedness of $20.0 million each, that had maturation dates in July 2011, respectively. These swaps were designated and were effective as cash flow hedges. These cash flow hedges were recorded at fair value within other noncurrent liabilities in the Consolidated Balance Sheet, with a corresponding offset in deferred income taxes and other comprehensive income within shareholders' equity. These contracts were terminated during fiscal year 2011 in conjunction with the repayment of the $85.0 million term loan. The contracts were settled for an aggregate loss of $0.1 million recorded within interest expense in the Consolidated Statement of Operations during fiscal year 2011. Prior to the termination of the contracts, the Company paid fixed rates of interest of approximately 3.0 percent and 3.4 percent on their respective $20.0 million. During the three months ended December 31, 2005, the Company entered into interest rate swap contracts that pay fixed rates of interest and receive variable rates of interest (based on the three-month LIBOR) on notional amounts of indebtedness of $35.0 and $15.0 million, and mature in March 2013 and March 2015, respectively. These swaps were designated and were effective as cash flow hedges. These cash flow hedges were recorded at fair value within other noncurrent liabilities in the Consolidated Balance Sheet, with a corresponding offset in other comprehensive income within shareholders' equity. These contracts were terminated during fiscal year 2010 in conjunction with the repayment of the private placement senior term notes as discussed in Note 9 to the Consolidated Financial Statements. The contracts were settled for an aggregate loss of $5.2 million recorded within interest expense in the Consolidated Statement of Operations during fiscal year 2010.Tabular Presentation: The following table presents information about the Company's debt obligations and derivative financial instruments that are sensitive to changes in interest rates. Foroutstanding fixed rate debt obligations, the table presents principal amountsbalances of $293.5 and related weighted-average interest rates by fiscal year of maturity. For variable rate obligations, the table presents principal amounts and the weighted-average forward LIBOR interest rates as of$174.8 million at June 30, 2011 through June 30, 2016. For the Company's derivative financial instruments, the table presents notional amounts2014 and weighted-average interest rates byexpected (contractual) maturity dates. Notional amounts are used to calculate the contractual payments to be exchanged under the contract. June 30, 2011 Expected maturity date as of June 30, 2011 Fair
Value 2012 2013 2014 2015 2016 Thereafter Total $ 32,252 $ 29,091 $ 178,200 $ 19,959 $ 18,195 $ 35,714 $ 313,411 $ 335,354 8.4 % 8.4 % 5.5 % 8.6 % 8.5 % 8.5 % 6.7 % — — — — — — — — $ 32,252 $ 29,091 $ 178,200 $ 19,959 $ 18,195 $ 35,714 $ 313,411 $ 335,354 $ — $ — $ — $ — $ — $ — $ — $ — The majoritypound and Euro.pound. In preparing the Consolidated Financial Statements, the Company is required to translate the financial statements of its foreign subsidiaries from the currency in which they keep their accounting records, generally the local currency, into United States dollars. Different exchange rates from period to period impact the amounts of reported income and the amount of foreign currency translation recorded in accumulated other comprehensive income.income (AOCI). As part of its risk management strategy, the Company frequently evaluates its foreign currency exchange risk by monitoring market data and external factors that may influence exchange rate fluctuations. As a result, the Company may engage in transactions involving various derivative instruments to hedge assets, liabilities and purchases denominated in foreign currencies. As of June 30, 2011,2014, the Company has entered into the following financialdid not have any derivative instruments to manage its foreign currency exchange risk:Hedge ofrisk. Net Investment in Foreign Subsidiaries: The Company has numerous investments in foreign subsidiaries, and the net assets of these subsidiaries are exposed to exchange rate volatility. The Company frequently evaluates its foreign currency exchange risk by monitoring market datagain included in net income was $0.1, $33.4 and external factors that may influence exchange rate fluctuations. As a result, the Company may engage in transactions involving various derivative instruments to hedge assets, liabilities and purchases denominated in foreign currencies. September 2006, the Company's cross-currency swap (which had a notional amount of $21.3 million and hedged a portion of the Company's net investment in its foreign operations) was settled, resulting in a cash outlay of $8.9 million. This cash outlay was recorded within investing activities within the Consolidated Statement of Cash Flows. The related cumulative tax-effected net loss of $7.9 million was recorded in accumulated other comprehensive income (AOCI) in fiscal year 2007. This amount will remain deferred within AOCI indefinitely, as the event which would trigger its release from AOCI and recognition2013, Company recognized a $33.8 million foreign currency translation gain in earnings isconnection with the sale or liquidation of the Company's international operations that the cross-currency swap hedged. The Company currently has no intent to sell or liquidate this portion of its business operations.Forward Foreign Currency Contracts: The Company's exposure to foreign exchange risk includes risks related to fluctuations in the Canadian dollar relative to the U.S. dollar. The exposure to Canadian dollar exchange rates on the Company's fiscal year 2011 cash flows is primarily associated with certain forecasted intercompany transactions. The Company seeks to manage exposure to changes in the value of the Canadian dollar. In order to do so, the Company has entered into forward currency contracts from fiscal year 2007 to the first quarter of fiscal year 2012 in order to reduce the risk of significant negative impact on its U.S. dollar cash flows or income. The Company does not hedge foreign currency exposure in a manner that would entirely eliminate the effect of changes in foreign currency exchange rates on net income and cash flows. During fiscal year 2011, the Company entered into several forward foreign currency contracts to sell Canadian dollars and buy an aggregate of $8.7 million U.S. dollars, respectively, with maturation dates between July 2011 and September 2012. The purpose of the forward contracts was to protect against adverse movements in the Canadian dollar exchange rate. The contracts were designated and were effective as cash flow hedges. They were recorded at fair value within other noncurrent liabilities or other current assets in the Consolidated Balance Sheet, with corresponding offsets primarily recorded in other comprehensive income (loss), net of tax. Forward currency contracts to sell Canadian dollars and buy $8.7 million U.S. dollars were outstanding as of June 30, 2011 to hedge intercompany transactions. See Note 9 to the Consolidated Financial Statements for further discussion. The Company uses freestanding derivative forward contracts to offset the Company's exposure to the change in fair value of certain foreign currency denominated intercompany assets and liabilities. These derivatives are not designated as hedges and therefore, changes in the fair value of these forward contracts are recognized currently in earnings thereby offsetting the current earnings effect of the related foreign currency denominated assets and liabilities. In June 2011, the Company entered into a freestanding derivative forward contract to sell an aggregate $9.0 million U.S. dollars and buy Canadian dollars, with a maturation date in July 2011. The table below provides information about the Company's forecasted transactions in U.S. dollar equivalents. (The information is presented in U.S. dollars because that is the Company's reporting currency.) The table summarizes information on transactions that are sensitive to foreign currency exchange rates and the related foreign currency forward exchange agreements. For the foreign currency forward exchange agreements, the table presents the notional amounts and weighted average exchange rates by expected (contractual) maturity dates. These notional amounts are used to calculate the contractual payments to be exchanged under the contract. Expected Transaction date June 30, June 30,
2011
Fair Value 2012 2013 2014 2015 Total $ 6,875 $ 1,804 $ — $ — $ 8,679 $ (599 ) 9,000 — — — 9,000 — $ 15,875 $ 1,804 $ — $ — $ 17,679 $ (599 ) 1.0129 0.9978 1.0114 Index to Consolidated Financial Statements: Index to Consolidated Financial Statements: presidentchief executive officer and chief financial officer, is responsible for establishing and maintaining adequate internal control over financial reporting and for assessing effectiveness of internal control over financial reporting.2011,2014, based on criteria established inInternal Control—Integrated Framework issued by the Committee of Sponsoring Organizations of the Treadway Commission (COSO). in 1992. Based on the assessment of the Company's internal control over financial reporting, management has concluded that, as of June 30, 2011,2014, the Company's internal control over financial reporting was effective.2011,2014, as stated in their report which follows in Item 8 of this Form 10-K.of changes incomprehensive loss, shareholders' equity and comprehensive income and of cash flows present fairly, in all material respects, the financial position of Regis Corporation and its subsidiaries at June 30, 20112014 and June 30, 2010,2013, and the results of their operations and their cash flows for each of the three years in the period ended June 30, 20112014 in conformity with accounting principles generally accepted in the United States of America. Also in our opinion, the Company maintained, in all material respects, effective internal control over financial reporting as of June 30, 2011,2014, based on criteria established inInternal Control—Integrated Framework issued by the Committee of Sponsoring Organizations of the Treadway Commission (COSO). in 1992. The Company's management is responsible for these financial statements, for maintaining effective internal control over financial reporting and for its assessment of the effectiveness of internal control over financial reporting, included in the accompanying Management's Statement of Responsibility for Financial Statements and Report on Internal Control over Financial Reporting. Our responsibility is to express opinions on these financial statements and on the Company's internal control over financial reporting based on our integrated audits. We conducted our audits in accordance with the standards of the Public Company Accounting Oversight Board (United States). Those standards require that we plan and perform the audits to obtain reasonable assurance about whether the financial statements are free of material misstatement and whether effective internal control over financial reporting was maintained in all material respects. Our audits of the financial statements included examining, on a test basis, evidence supporting the amounts and disclosures in the financial statements, assessing the accounting principles used and significant estimates made by management, and evaluating the overall financial statement presentation. Our audit of internal control over financial reporting included obtaining an understanding of internal control over financial reporting, assessing the risk that a material weakness exists, and testing and evaluating the design and operating effectiveness of internal control based on the assessed risk. Our audits also included performing such other procedures as we considered necessary in the circumstances. We believe that our audits provide a reasonable basis for our opinions.20112014 June 30, June 30, 2011 2010 2014 2013 $ 96,263 $ 151,871 27,149 24,312 150,804 153,380 17,887 16,892 22,341 46,207 32,118 36,203 346,562 428,865 Cash and cash equivalents $ 378,627 $ 200,488 Receivables, net 25,808 33,062 Inventories 137,151 139,607 Deferred income taxes 133 24,145 Income tax receivable 6,461 33,346 Other current assets 65,086 57,898 Total current assets 613,266 488,546 347,811 359,250 266,538 313,460 680,512 736,989 425,264 460,885 111,328 118,070 19,812 21,496 261,140 195,786 Investment in affiliates 28,611 43,319 58,400 80,612 62,458 62,786 $ 1,805,753 $ 1,919,572 Total assets $ 1,415,949 $ 1,390,492 $ 32,252 $ 51,629 55,107 57,683 167,321 160,797 254,680 270,109 Long-term debt, current portion $ 173,501 $ 173,515 Accounts payable 68,491 66,071 Accrued expenses 142,720 137,226 Total current liabilities 384,712 376,812 281,159 388,400 120,002 1,255 237,295 247,770 190,454 155,011 773,134 906,279 Total liabilities 695,168 533,078 Commitments and contingencies (Note 8) 2,886 2,878 341,190 332,372 77,946 47,032 610,597 631,011 1,032,619 1,013,293 $ 1,805,753 $ 1,919,572 Common stock, $0.05 par value; issued and outstanding, 56,651,166 and 56,630,926 common shares at June 30, 2014 and 2013, respectively 2,833 2,832 Additional paid-in capital 337,837 334,266 Accumulated other comprehensive income 22,651 20,556 Retained earnings 357,460 499,760 Total shareholders' equity 720,781 857,414 Total liabilities and shareholders' equity $ 1,415,949 $ 1,390,492 InDollars in thousands, except per share data) Years Ended June 30, Fiscal Years 2011 2010 2009 2014 2013 2012 $ 1,762,974 $ 1,784,137 $ 1,833,958 523,194 534,593 556,205 39,701 39,704 39,624 Service $ 1,480,103 $ 1,563,890 $ 1,643,891 Product 371,454 415,707 440,048 Royalties and fees 40,880 39,116 38,288 2,325,869 2,358,434 2,429,787 1,892,437 2,018,713 2,122,227 1,012,868 1,015,720 1,044,719 249,979 263,883 283,038 197,722 199,338 190,456 339,857 291,991 291,661 342,286 344,098 347,792 105,109 108,764 115,655 74,100 35,277 41,661 — 2,145 5,732 2,321,921 2,261,216 2,320,714 3,948 97,218 109,073 (34,388 ) (54,414 ) (39,768 ) 4,811 10,410 9,461 (25,629 ) 53,214 78,766 Cost of service 907,294 930,687 941,671 Cost of product 187,204 228,577 221,635 Site operating expenses 202,359 203,912 207,031 General and administrative 172,793 226,740 249,634 Rent 322,105 324,716 331,769 Depreciation and amortization 99,733 91,755 104,970 Goodwill impairment 34,939 — 67,684 Total operating expenses 1,926,427 2,006,387 2,124,394 Operating (loss) income (33,990 ) 12,326 (2,167 ) Other (expense) income: Interest expense (22,290 ) (37,594 ) (28,245 ) Interest income and other, net 1,952 35,366 5,098 (Loss) income from continuing operations before income taxes and equity in loss of affiliated companies (54,328 ) 10,098 (25,314 ) 9,496 (25,577 ) (41,950 ) (71,129 ) 10,024 4,430 7,228 11,942 (29,846 ) (8,905 ) 39,579 6,970 — 3,161 (131,436 ) $ (8,905 ) $ 42,740 $ (124,466 ) Equity in loss of affiliated companies, net of income taxes (11,623 ) (15,956 ) (30,859 ) (Loss) income from continuing operations (137,080 ) 4,166 (51,743 ) Income (loss) from discontinued operations, net of taxes (Note 2) 1,353 25,028 (62,350 ) Net (loss) income $ (135,727 ) $ 29,194 $ (114,093 ) (0.16 ) 0.71 0.16 — 0.06 (3.06 ) $ (0.16 ) $ 0.77 $ (2.90 ) (0.16 ) 0.71 0.16 — 0.05 (3.05 ) $ (0.16 ) $ 0.75 $ (2.89 ) Basic and diluted: (Loss) income from continuing operations (2.43 ) 0.07 (0.91 ) Income (loss) from discontinued operations 0.02 0.44 (1.09 ) Net (loss) income per share, basic and diluted (1) $ (2.40 ) $ 0.51 $ (2.00 ) 56,704 55,806 42,897 56,704 66,753 43,026 Basic 56,482 56,704 57,137 Diluted 56,482 56,846 57,137 $ 0.20 $ 0.16 $ 0.16 $ 0.12 $ 0.24 $ 0.24 (1) Total is a recalculation; line items calculated individually may not sum to total due to rounding. (1)Total is a recalculation; line items calculated individually may not sum to total due to rounding.CHANGESIN SHAREHOLDERS' EQUITY AND COMPREHENSIVE INCOME
LOSSthousands, except per share data)
thousands) Common Stock Accumulated
Other
Comprehensive
Income Additional
Paid-In
Capital Retained
Earnings Comprehensive
Income Shares Amount Total 43,070,927 $ 2,153 $ 143,265 $ 101,973 $ 728,795 $ 976,186 $ 108,899 (124,466 ) (124,466 ) (124,466 ) (47,666 ) (47,666 ) (47,666 ) (2,112 ) (2,112 ) (2,112 ) 234,523 12 3,882 3,894 7,525 7,525 13,808 — 378 378 (340 ) (340 ) (340 ) 712 712 617,550 31 (31 ) — (28,119 ) (1 ) 1 — (27,325 ) (1 ) (490 ) (491 ) (6,912 ) (6,912 ) (243 ) (243 ) (3,605 ) (3,605 ) 43,881,364 2,194 151,394 51,855 597,417 802,860 (174,584 ) 42,740 42,740 42,740 (5,416 ) (5,416 ) (5,416 ) 2,467 2,467 2,467 13,225,000 661 162,932 163,593 15,245 15,245 202,700 10 3,055 3,065 9,337 9,337 16,053 1 290 291 (1,874 ) (1,874 ) (1,874 ) 262 262 304,200 15 (15 ) — (1,976 ) — — — (66,161 ) (3 ) (1,710 ) (1,713 ) (9,146 ) (9,146 ) (8,154 ) (8,154 ) (264 ) (264 ) 57,561,180 2,878 332,372 47,032 631,011 1,013,293 37,917 (8,905 ) (8,905 ) (8,905 ) 30,405 30,405 30,405 132 132 132 45,933 2 680 682 9,596 9,596 24,472 1 397 398 377 377 377 67 67 277,300 14 (14 ) — (121,343 ) (6 ) 6 — (76,731 ) (3 ) (1,787 ) (1,790 ) (127 ) (127 ) (11,509 ) (11,509 ) 57,710,811 $ 2,886 $ 341,190 $ 77,946 $ 610,597 $ 1,032,619 $ 22,009 Fiscal Years 2014 2013 2012 Net (loss) income $ (135,727 ) $ 29,194 $ (114,093 ) Other comprehensive income (loss): Foreign currency translation adjustments: Foreign currency translation adjustments during the period 1,930 (1,349 ) (24,254 ) Reclassification adjustments for gains included in net (loss) income — (33,842 ) — Net current period foreign currency translation adjustments 1,930 (35,191 ) (24,254 ) Recognition of deferred compensation and other, net of tax expense of $411 and $644, in fiscal years 2013 and 2012, respectively 165 656 1,029 Change in fair market value of financial instruments designated as cash flow hedges, net of tax (benefit) expense of $0, $(12) and $210, respectively — (23 ) 393 Other comprehensive income (loss) 2,095 (34,558 ) (22,832 ) Comprehensive loss $ (133,632 ) $ (5,364 ) $ (136,925 ) CASH FLOWS
SHAREHOLDERS' EQUITYIn thousands)
Dollars in thousands, except share data) Years Ended June 30, 2011 2010 2009 $ (8,905 ) $ 42,740 $ (124,466 ) 88,602 92,466 105,145 9,826 9,870 9,871 (7,228 ) (11,942 ) 28,940 10,023 2,404 906 (14,711 ) 5,115 (3,843 ) — (154 ) 183,289 74,100 35,277 41,661 6,681 6,428 10,201 31,227 — — (67 ) (243 ) (163 ) 9,596 9,337 7,525 6,469 6,406 — 1,578 (3,153 ) (3,405 ) (2,358 ) 1,192 (12,104 ) 4,629 4,823 7,128 23,855 957 (34,652 ) 4,725 2,657 (52 ) (11,050 ) (14,951 ) (1,327 ) (2,973 ) (4,966 ) (3,613 ) 3,341 6,006 (23,364 ) 1,818 1,954 387 229,178 192,223 188,064 (71,469 ) (57,821 ) (73,574 ) 626 70 77 (17,990 ) (3,664 ) (40,051 ) 16,804 16,099 19,008 (72,301 ) — (20,971 ) — 736 — (144,330 ) (44,580 ) (115,511 ) — 337,000 6,391,100 — (342,000 ) (6,525,200 ) — 167,325 85,000 (137,671 ) (349,175 ) (92,504 ) 67 243 163 682 159,498 3,894 (11,509 ) (9,146 ) (6,912 ) — (2,878 ) (3,848 ) (148,431 ) (39,133 ) (148,307 ) 7,975 823 (9,335 ) (55,608 ) 109,333 (85,089 ) 151,871 42,538 127,627 $ 96,263 $ 151,871 $ 42,538 Common Stock Additional
Paid-In
Capital Total Shares Amount Balance, June 30, 2011 57,710,811 $ 2,886 $ 341,190 $ 77,946 $ 610,597 $ 1,032,619 Net loss (114,093 ) (114,093 ) Foreign currency translation adjustments (24,254 ) (24,254 ) Proceeds from exercise of SARs & stock options 60 — — — Stock-based compensation 7,597 7,597 Shares issued through franchise stock incentive program 18,844 1 305 306 Recognition of deferred compensation and other, net of taxes (Note 10) 1,422 1,422 Net restricted stock activity (314,474 ) (16 ) (1,426 ) (1,442 ) Vested stock option expirations (723 ) (723 ) Cumulative minority interest (Note 1) 1,580 1,580 Dividends (13,855 ) (13,855 ) Balance, June 30, 2012 57,415,241 2,871 346,943 55,114 484,229 889,157 Net income 29,194 29,194 Foreign currency translation adjustments (35,191 ) (35,191 ) Stock repurchase program (909,175 ) (45 ) (14,823 ) (14,868 ) Proceeds from exercise of SARs & stock options 3,051 — 41 41 Stock-based compensation 5,881 5,881 Shares issued through franchise stock incentive program 19,583 1 356 357 Recognition of deferred compensation and other, net of taxes (Note 10) 633 633 Net restricted stock activity 102,226 5 (2,728 ) (2,723 ) Vested stock option expirations (1,404 ) (1,404 ) Minority interest (Note 1) 45 45 Dividends (13,708 ) (13,708 ) Balance, June 30, 2013 56,630,926 2,832 334,266 20,556 499,760 857,414 Net loss (135,727 ) (135,727 ) Foreign currency translation adjustments 1,930 1,930 Proceeds from exercise of SARs & stock options 11 — — — Stock-based compensation 6,400 6,400 Shares issued through franchise stock incentive program 20,095 1 289 290 Recognition of deferred compensation (Note 10) 165 165 Net restricted stock activity 134 — (2,603 ) (2,603 ) Vested stock option expirations (515 ) (515 ) Minority interest (Note 1) 220 220 Dividends (6,793 ) (6,793 ) Balance, June 30, 2014 56,651,166 $ 2,833 $ 337,837 $ 22,651 $ 357,460 $ 720,781 (1)Changes in operating assets and liabilities exclude assets acquired and liabilities assumed through acquisitions Fiscal Years 2014 2013 2012 Cash flows from operating activities: Net (loss) income $ (135,727 ) $ 29,194 $ (114,093 ) Adjustments to reconcile net (loss) income to net cash provided by operating activities: Depreciation and amortization 81,406 84,018 111,435 Equity in loss of affiliated companies 11,623 15,328 30,043 Dividends received from affiliated companies — 1,095 4,047 Deferred income taxes 68,781 10,322 (14,171 ) Accumulated other comprehensive income reclassification adjustments (Note 5) — (33,842 ) — Gain from sale of discontinued operations — (17,827 ) — Loss on write down of inventories 854 12,557 — Goodwill impairment 34,939 — 146,110 Salon asset impairments 18,327 8,224 6,636 Note receivable bad debt recovery — (333 ) (805 ) Stock-based compensation 6,400 5,881 7,597 Amortization of debt discount and financing costs 8,152 7,346 6,696 Other noncash items affecting earnings 224 394 31 Changes in operating assets and liabilities(1): Receivables 5,681 (4,332 ) (4,502 ) Inventories 2,555 (10,745 ) 2,644 Income tax receivable 26,884 (23,421 ) 2,809 Other current assets (6,503 ) (8,064 ) (5,272 ) Other assets (103 ) 239 (841 ) Accounts payable 1,907 19,086 (4,856 ) Accrued expenses 3,505 (26,431 ) (8,657 ) Other noncurrent liabilities (11,502 ) 459 (11,151 ) Net cash provided by operating activities 117,403 69,148 153,700 Cash flows from investing activities: Capital expenditures (49,439 ) (105,857 ) (85,769 ) Proceeds from sale of assets 14 163,916 502 Salon acquisitions, net of cash acquired (15 ) — (2,587 ) Proceeds from loans and investments 5,056 131,581 11,995 Disbursements for loans and investments — — (15,000 ) Change in restricted cash — (24,500 ) — Net cash (used in) provided by investing activities (44,384 ) 165,140 (90,859 ) Cash flows from financing activities: Borrowings on revolving credit facilities — 5,200 471,500 Payments on revolving credit facilities — (5,200 ) (471,500 ) Proceeds from issuance of long-term debt, net of fees 118,058 — — Repayments of long-term debt and capital lease obligations (7,059 ) (118,223 ) (29,693 ) Repurchase of common stock — (14,868 ) — Dividends paid (6,793 ) (13,708 ) (13,855 ) Net cash provided by (used in) financing activities 104,206 (146,799 ) (43,548 ) Effect of exchange rate changes on cash and cash equivalents 914 1,056 (3,613 ) Increase in cash and cash equivalents 178,139 88,545 15,680 Cash and cash equivalents: Beginning of year 200,488 111,943 96,263 End of year $ 378,627 $ 200,488 $ 111,943 (1) Changes in operating assets and liabilities exclude assets acquired and liabilities assumed through acquisitions. Rico and several other countries. In addition, the Company owns and operates hair restoration centers in the U.S. and Canada.Rico. Substantially all of the hairstyling and hair care salons owned and operated by the Company in the U.S., Canada and Puerto Rico are located in leased space in enclosed mall shopping centers, strip shopping centers or Walmart Supercenters. FranchiseFranchised salons throughout the U.S. are primarily located in strip shopping centers. The company-ownedCompany-owned salons in the U.K. are owned and operated in malls, leading department stores, mass merchants and high-street locations. The hair restoration centers, including both company-ownedfranchise locations, are typically locatedInternational salons. Prior to this change, the Company had two reportable operating segments: North American salons and International salons. See Note 14 to the Consolidated Statement of Operations. Concurrent with the change in leased space within office buildings. Thereportable operating segments, the Company maintains ownership interest in salons, beauty schools and hair restoration centers through equity-method investments.allits subsidiaries after the elimination of its wholly-owned subsidiaries. In consolidation, all intercompany accounts and transactionstransactions. All material subsidiaries are eliminated.U.S.United States of America (GAAP) requires management to make certain estimates and assumptions that affect the reported amounts of assets and liabilities and disclosure of contingent assets and liabilities at the date of the financial statements and the reported amounts of revenues and expenses during the reporting period. Actual results could differ from those estimates.Foreign Currency Translation: Financial position, results of operations and cash flows of the Company's international subsidiaries are measured using local currency as the functional currency. Assets and liabilities of these subsidiaries are translated at the exchange rates in effect at each fiscal year end. Translation adjustments arising from the use of differing exchange rates from period to period are included in accumulated other comprehensive income within shareholders' equity. Statement of Operations accounts are translated at the average rates of exchange prevailing during the year. The different exchange rates from period to period impact the amount of reported income from the Company's international operations.20112014 and 2010.2013.NOTES TO CONSOLIDATED FINANCIAL STATEMENTS (Continued)1. BUSINESS DESCRIPTION AND SUMMARY OF SIGNIFICANT ACCOUNTING POLICIES (Continued)includeincludes credit card receivables and accounts and notes receivable from franchisees and credit card receivables.franchisees. The balance is presented net of an allowance for expected losses (i.e., doubtful accounts), primarily related to the receivables from the Company's franchisees. The Company monitors the financial condition of its franchisees and records provisions for estimated losses on receivables when it believes its franchisees are unable to make their required payments based on factors such as delinquencies and aging trends. The following table summarizes the activity in As of June 30, 2014 and 2013, the allowance for doubtful accounts: For the Years Ended June 30, 2011 2010 2009 (Dollars in thousands) $ 3,170 $ 2,382 $ 1,515 853 1,040 1,089 (2,549 ) (252 ) (225 ) 8 — 3 $ 1,482 $ 3,170 $ 2,382 Note Receivables, Net: The note receivable balances within the Company's Consolidated Balance Sheet primarily include a note receivable with the purchaserTrade Secret and a note receivable related to the Company's investment in MY Style. The balances are presented net of a valuation reserve for expected losses. The Company monitors the financial condition of its counterparties with an outstanding note receivable and records provisions for estimated losses on receivables when it believes the counterparties are unable to make their required payments. The valuation reserve is the Company's best estimate of the amount of probable credit losses related to existing notes receivable. See discussion of the note receivable with the purchaser of Trade Secret and the note receivable related to the Company's investment in MY Style within Notes 2 and 6, respectively, to the Consolidated Financial Statements.Inventories: Inventoriesfinished goods consist principally of hair care products for retail product sales. A portion of inventories are also used for salon services consisting of hair color, hair care products including shampoo and conditioner and hair care treatments including permanents, neutralizers and relaxers. Inventories are stated at the lower of cost or market, with cost determined on a weighted average cost basis.semi-annually.annually in the fourth quarter of the fiscal year. Product and service inventories are adjusted based on the results of the physical inventory counts. BetweenDuring the physical inventory counts,fiscal year, cost of retail product sold to salon customersguests is determined based on the weighted average cost of product sold, adjusted for an estimated shrinkage factor and the cost of product used in salon servicesNOTES TO CONSOLIDATED FINANCIAL STATEMENTS (Continued)1. BUSINESS DESCRIPTION AND SUMMARY OF SIGNIFICANT ACCOUNTING POLICIES (Continued)gross profit marginspercentage of total cost of service and product to service revenues. The estimated gross profit marginspercentage related to service inventories areis updated semi-annuallyquarterly based on thecycle count results of the physical inventory counts and other factors that could impact the Company's margin rate estimates such as mix of service sales mix, discounting and special promotions. Actual results for the estimated gross margin percentage as compared to the semi-annualquarterly estimates have not historically resulted in material adjustments to our Statement of Operations.and amortization of property and equipment areis computed onusing the straight-line method over their estimated useful asset lives (30 to 39 years for buildings, 10 years for improvements and three to ten years for equipment, furniture and software). Depreciation expense was $88.6, $92.5,$79.7, $81.8 and $105.1$96.4 million in fiscal years 2011, 2010,2014, 2013 and 2009,2012, respectively. Leasehold improvements are amortized over the shorter of their estimated useful lives or the related lease term, generally ten years. For leases with renewal periods at the Company's option, management may determine at the inception of the lease that renewal is reasonably assured if failure to exercise a renewal option imposes an economic penalty to the Company. In such cases, the Company will include the renewal option period along with the original lease term in the determination of appropriate estimated useful lives.At June 30, 2011 and 2010, the net book value of capitalized software costs was $34.1 and $35.2 million, respectively. Amortization expense related to capitalized software, included within depreciation expense disclosed above, was $8.4, $8.5,$7.5, $6.8 and $9.1$22.3 million in fiscal years 2011, 2010,2014, 2013 and 2009,2012, respectively, which has been determined based on an estimated useful life oflives ranging from five orto seven years. Historically, because of the Company's large size and scale requirements it has been necessary for the Company to internally develop and support its own proprietary POS information system. has recently identifiedimplemented a third party POS alternative that has a system that meets our current and enhanced functionality requirements and will cost significantly less to implement and support. Due to the Company's plan to replace the POSpoint-of-sale (POS) information system the Company reviewed the capitalized software carrying value for impairment at June 30, 2011. As a result of the Company's long-lived asset impairment testing at June 30, 2011 for this grouping of assets, no impairment charges were recorded.in fiscal year 2013. The Company has reassessed and adjusted the useful liferecorded $16.2 million of the capitalized software as the POS alternative is expected be implementedaccelerated amortization expense in salons during the first half of fiscal year 2012. The Company expects to fully amortize the net balance of the existing POS information system, approximately $20 million at June 30, 2011, during fiscal year 2012 associated with a previously developed POS system that became fully depreciated as locations using the Company's existing POS information system move to a third party POS alternative.
Long-Lived Asset Impairment Assessments, Excluding Goodwill:NOTES TO CONSOLIDATED FINANCIAL STATEMENTS (Continued)1. BUSINESS DESCRIPTION AND SUMMARY OF SIGNIFICANT ACCOUNTING POLICIES (Continued)Investment In and Loans to Affiliates:has equity investments in securitiesassesses the impairment of certain privately held entities. The Company accounts for these investments under the equity method of accounting. The Company also has loans receivable from certain of these entities. Investments accounted for under the equity method are recordedlong-lived assets at the amountindividual salon level, as this is the lowest level for which identifiable cash flows are largely independent of other groups of assets and liabilities, when events or changes in circumstances indicate the carrying value of the Company's investment and adjusted each period for the Company's share of the investee's income or loss. Investments are reviewed for changes in circumstanceassets or the occurrence of events that suggest the Company's investmentasset grouping may not be recoverable. During fiscal year 2011, we recordedFactors considered in deciding when to perform an impairment review include significant under-performance of $9.2 million relatedan individual salon in relation to expectations, significant economic or geographic trends, and significant changes or planned changes in our investment in MY Style. During fiscal year 2009, we recorded impairments of $25.7 and $7.8 million ($4.8 million net of tax) related to our investment in Provalliance and investment in and loans to Intelligent Nutrients, LLC, respectively.Self Insurance Accruals: The Company uses a combination of third party insurance and self-insurance for a number of risks including workers' compensation, health insurance, employment practice liability and general liability claims. The liability represents the Company's estimateuse of the undiscounted ultimate cost of uninsured claims incurred as of the balance sheet date. The workers' compensation, general liability and employment practice liability analysis includes applying loss development factors to the Company's historical claims data (total paid and incurred amounts per claim) for all policy years where the Company has not reached its aggregate limits to project the future development of incurred claims. The workers' compensation analysisassets. Impairment is performed for three models; California, Texas and all other states. A variety of accepted actuarial methodologies are followed to determine these liabilities, including several methods to predict the loss development factors for each policy period. These liabilities are determined by modeling the frequency (number of claims) and severity (cost of claims), fitting statistical distributions to the experience, and then running simulations. A similar analysis is performed for both general liability and employment practices liability; however, it is a single model for all liability claims rather than the three separate models used for workers' compensation. The health insurance analysis utilizes trailing twelve months of paid and 24 months of incurred medical and prescription claims to project the amount of incurred but not yet reported claims liability amount. The lag factors are developedevaluated based on the Company's specific claim data utilizing a completion factor methodology. The developed factor, expressed as a percentagesum of paid claims, is appliedundiscounted estimated future cash flows expected to result from use of the trailing twelve monthslong-lived assets that do not recover the carrying values. If the undiscounted estimated cash flows are less than the carrying value of paid claims to calculate the estimated liability amount. The calculated liability amount is reviewed for reasonablenessassets, the Company calculates an impairment charge based on reserve adequacy ranges for historical periods by testing prior reserve levels against actual expenses to date. Although the Company does not expectassets' estimated fair value. The fair value of the amounts ultimately paid to differ significantly fromlong-lived assets is estimated using a discounted cash flow model based on the estimates, self insurance accruals could be affected if future claims experience differs significantly from the historical trendsbest information available, including market data and actuarial assumptions. For fiscal year 2011, the Companysalon level revenues and expenses. Long-lived asset impairment charges are recorded an increase in expense from changes in estimates related to prior year open policy periods related to continuing operations of $1.4 million. For fiscal years 2010within depreciation and 2009, the Company recorded decreases in expense from changes in estimates related to prior year open policy periods related to continuing operations of $1.7 and $9.9 million, respectively. A 10.0 percent changeamortization in the self-insurance reserve would affect (loss) income from continuing operations before income taxes and equity in income (loss)Consolidated Statement of affiliated companiesOperations.$4.6, $4.5, and $4.0 million for the three years ended June 30, 2011, 2010 and 2009,NOTES TO CONSOLIDATED FINANCIAL STATEMENTS (Continued)1. BUSINESS DESCRIPTION AND SUMMARY OF SIGNIFICANT ACCOUNTING POLICIES (Continued)respectively. The Company updates loss projections twice each year and adjusts its recorded liability to reflect the current projections. The updated loss projections consider new claims and developments associated with existing claims for each open policy period. As certain claims can take years to settle, the Company has multiple policy periods open at any point in time. As the workers' compensation accrual is the majority of the self insurance accrual, below is a rollforward of the activity within the Company's workers' compensation self insurance accrual: For the Years Ended June 30, 2011 2010 2009 (Dollars in thousands) $ 30,082 $ 31,505 $ 35,123 13,993 14,739 14,676 2,231 35 (7,715 ) (12,584 ) (14,867 ) (12,145 ) (728 ) (1,330 ) 1,566 $ 32,994 $ 30,082 $ 31,505 As of June 30, 2011, the Company had $14.7 and $30.9 million recorded in current liabilities and non-current liabilities, respectively,management related to the Company's self insurance accruals which includesexpected useful lives of long-lived assets and the workers' compensation self insurance accrual.ability to realize undiscounted cash flows in excess of the carrying amounts of such assets are affected by factors such as the ongoing maintenance and improvement of the assets, changes in economic conditions and changes in operating performance. As the ongoing expected cash flows and carrying amounts of June 30, 2010,long-lived assets are assessed, these factors could cause the Company had $18.4 and $26.5 million recorded in current liabilities and non-current liabilities, respectively, related to the Company's self insurance accruals which includes the workers' compensation self insurance accrual. Fiscal Years 2014 2013 2012 (Dollars in thousands) North American Value $ 11,714 $ 5,031 $ 2,892 North American Premium 5,014 3,042 3,174 International 1,599 151 570 Total $ 18,327 $ 8,224 $ 6,636 Thethe estimated fair valuevalues of the reporting units based on discounted future cash flows that utilizeutilizing estimates in annual revenue, grossservice and product margins, fixed expense rates, allocated corporate overhead, and long-term growth rates for determining terminal value. The Company's estimated future cash flows also take into consideration acquisition integration and maturation. Where available and as appropriate, comparative market multiples are used to corroboratein conjunction with the results of the discounted cash flow. The Company considers its various concepts to be reporting units when testing for goodwill impairment because that is where the Company believes the goodwill resides.flows. The Company periodically engages third-party valuation consultants to assist in evaluation ofevaluating the Company's estimated fair value calculations. the situations where a reporting unit's carrying value exceeds its estimated fair value, the amount of the impairment loss must be measured. The measurement of impairment is calculated by determining the implied fair value of a reporting unit's goodwill. In calculating the implied fair value of goodwill, the fair value of the reporting unit is allocated to all other assets and liabilities of that unitNOTES TO CONSOLIDATED FINANCIAL STATEMENTS (Continued)1. BUSINESS DESCRIPTION AND SUMMARY OF SIGNIFICANT ACCOUNTING POLICIES (Continued) during the third quarter of fiscal year 2011, a $74.1 million impairment charge was recorded within continuing operations for the excess of the carrying value of goodwill over the implied fair value of the goodwill for the Promenade salon concept. The Promenade salon concept reported same-store sales results of negative 3.3 percent for the three months ended March 31, 2011, which was unfavorable compared to the Company's budgeted same-store sales. As visitation patterns have not been rebounding as quickly as the Company had originally projected for fiscal year 2011, the Company reduced the budgeted financial projections for fiscal year 2012. The projections assume that the Promenade salon concept remains a strong viable business but will have a slow recovery. As a result of the lowered projections, the estimated fair value of the Promenade salon concept decreased to a level below the Promenade salon concept's carrying value. The estimated fair values of the Hair Restoration Centers reporting unit and Regis salon concept exceeded the respective carrying values by approximately 9.0 and 18.0 percent, respectively. The respective fair values of the Company's remaining reporting units with goodwill exceeded fair valuecarrying values by greater than 20.0 percent. While20.0%.has determined the estimated fair values of Promenade, Hair Restoration Centers, and Regis to be appropriate based on the historical level of revenue growth, operating income and cash flows, it is reasonably likelyexperienced two triggering events that Promenade, Hair Restoration Centers, and Regis may become impaired in future periods. The term "reasonably likely" refers to an occurrence that is more than remote but less than probableresulted in the judgmentCompany testing its goodwill for impairment. First, the Company redefined its operating segments to reflect how the chief operating decision maker evaluates the business as a result of restructuring the Company. Because some ofCompany's North American field organization. The field reorganization, which impacted all North American salons except for salons in the inherent assumptions and estimates used in determining the fair value of the reportable segment are outside the control of management, changes in these underlying assumptions can adversely impact fair value. Potential impairment of a portion or all of the carrying value of the Promenade and Regis salon concepts and Hair Restoration Centers goodwill is dependent on many factors and cannot be predicted with certainty. Historically, goodwillmass premium category, was tested annually for impairment during the third quarter, as of February 28, of each fiscal year. Effectiveannounced in the fourth quarter of fiscal year 2011,2013 and completed in the Company adopted a new accounting policy whereby the annual impairment review of goodwill will be performed during the fourth quarter, as of April 30 instead of the thirdsecond quarter of each fiscal year.year 2014. The changeCompany did not completely operate under the realigned operating structure prior to the second quarter of fiscal year 2014.testing date was made to better align the annual goodwill impairment test with the timingtest. The disruptive impact of the Company's annual budgeting process. The changefoundational initiatives announced in accounting principle does not delay, accelerate or avoid an impairment charge. Accordingly, the Company believes that the accounting change described above is preferable under the circumstances. As a result of the Company's annual impairment testing of goodwill during the fourth quarter of fiscal year 2011, 2013 on the first two fiscal quarters of 2014 was greater than anticipated.recorded.2011,2014, the Company's estimated fair value, as determined by the sum of our reporting units' fair value, reconciled to within a reasonable range of our market capitalization, which included an assumed control premium.premium of 30.0%.asby reporting unit follows: Fiscal Reporting Unit 2014 2013 (Dollars in thousands) North American Value $ 425,264 $ 425,932 North American Premium — 34,953 Total $ 425,264 $ 460,885 20112014 and 2010 by2013, the International reporting unit is as follows: As of June 30,
2011 As of June 30,
2010 (Dollars in thousands) $ 103,761 $ 102,180 4,652 4,652 48,916 48,280 129,477 121,693 240,910 309,804 527,716 586,609 152,796 150,380 $ 680,512 $ 736,989 As a resultanalysis of goodwillassessment during the third quarter of fiscal year 2010, a $35.3 million impairment charge was recorded within continuing operations for2014, the excessCompany's portion of EEG's estimated fair value exceeds carrying value of its investment by approximately 10%. Any meaningful underperformance against plan or reduced outlook by EEG, changes to the carrying value of goodwill overEEG or further erosion in valuations of the implied fair value of goodwill for the Regis salon concept. As a resultfor-profit secondary educational market could lead to other than temporary impairments of the Company's interiminvestment in EEG. In addition, EEG may be required to record noncash impairment testcharges related to long-lived assets or establish valuation allowances against certain of its deferred tax assets and our share of such noncash impairment charges or valuation allowances could be material to the Company's consolidated balance sheet and results of operations. During fiscal years 2014, 2013 and 2012, the Company recorded its share, $21.2, $2.1 and $8.9 million, respectively, of noncash impairment charges recorded directly by EEG for goodwill duringand long-lived and intangible assets. As of June 30, 2014, EEG has no goodwill. As of June 30, 2014, our share of EEG's deferred tax assets was $7.8 million. See Note 5 to the three months ended December 31, 2008,Consolidated Financial Statements.$41.7combination of third party insurance and self-insurance for a number of risks including workers' compensation, health insurance, employment practice liability and general liability claims. The liability represents the Company's estimate of the undiscounted ultimate cost of uninsured claims incurred as of the balance sheet date.impairment charge for the full carrying amount of goodwill within the salon conceptsrespectively. A 10.0% change in the United Kingdom was recorded withinself-insurance reserve would affect income (loss) from continuing operations. The recent performance challengesoperations before income taxes and equity in (loss) income of the international salon operations indicated that the estimated fair value was less than the current carrying of this reporting unit's net assets, including goodwill.Long-Lived Asset Impairment Assessments, Excluding Goodwill:reviews long-lived assetsupdates loss projections twice each year and adjusts its recorded liability to reflect updated projections. The updated loss projections consider new claims and developments associated with existing claims for impairmenteach open policy period. As certain claims can take years to settle, the Company has multiple policy periods open at the salon level annually or if events or circumstances indicate that the carrying value of such assets may not be recoverable. The Company's test for impairment of property and equipment is performed at a salon level as this is the lowest level for which identifiable cash flows are largely independent of the cash flows of other groups of assets and liabilities. Impairment is evaluated based on the sum of undiscounted estimated future cash flows expected to result from use of the assets that does not recover the carrying value of the related salon assets. When the sum of a salon's undiscounted estimated future cash flow is zero or negative, impairment is measured as the full carrying value of the related salon's equipment and leasehold improvements. When the sum of a salon's undiscounted cash flows is greater than zero but less than the carrying value of the related salon's equipment and leasehold improvements, a discounted cash flow analysis is performed to estimate the fair value of the salon assets and impairment is measured as the difference between the carrying value of the salon assets and the estimated fair value. The fair value estimate is based on the best information available, including market data.a result of June 30, 2014, the Company's annual impairment analysis of long-lived assets, the following impairment charges were recognized during fiscal years 2011, 2010,Company had $14.9 and 2009,$32.7 million recorded in current liabilities and noncurrent liabilities, respectively, related primarily to the carrying value of certain salons' property and equipment within our North American, International, and Hair Restoration Centers segments: For the Years Ended June 30, 2011 2010 2009 (Dollars in thousands $ 6,115 $ 6,253 $ 4,309 394 175 5,892 172 — — $ 6,681 $ 6,428 $ 10,201 The International impairment charges in fiscal year 2009 included charges related to the Company's self-insurance accruals. As of June 2009 plan to close up to 80 underperforming company-owned salons30, 2013, the Company had $14.8 and $32.4 million recorded in the United Kingdom in fiscal year 2010. The Company also evaluated the appropriateness of the remaining useful lives of its non-impaired propertycurrent liabilities and equipment and whether a changenoncurrent liabilities, respectively, related to the depreciation charge was warranted. Impairment charges for continuing operations are included in depreciation related to company-owned salons in the Consolidated Statement of Operations. and hair restoration center locations under operating leases. Rent expense is recognized on a straight-line basis over the lease term. Tenant improvement allowances funded by landlord incentives, rent holidays and rent escalation clauses which provide for scheduled rent increases during the lease term or for rental payments commencing at a date other than the date of initial occupancy are recorded in the Consolidated Statements of Operations on a straight-line basis over the lease term (including one renewal option period if renewal is reasonably assured based on the imposition of an economic penalty for failure to exercise the renewal option). The difference between the rent due under the stated periods of the lease compared to that ofand the straight-line basis is recorded as deferred rent within accrued expenses and other noncurrent liabilities in the Consolidated Balance Sheet.over the terms of the leases, the Company uses the date that it obtains the legal right to use and control the leased space to begin amortization, which is generally when the Company enters the space and begins to make improvements in preparation of its intended use of the leased space. and related cost of sales are recognized at the time of sale, as this is when the services have been provided or, inare provided. Product revenues are recognized when the case of product revenues, delivery has occurred,guest receives andNOTES TO CONSOLIDATED FINANCIAL STATEMENTS (Continued)1. BUSINESS DESCRIPTION AND SUMMARY OF SIGNIFICANT ACCOUNTING POLICIES (Continued)salon receives the customer's payment.merchandise. Revenues from purchases made with gift cards are also recorded when the customerguest takes possession of the merchandise or services are provided. Gift cards issued by the Company are recorded as a liability (deferred revenue) until they are redeemed. The related cost of product sold to franchisees is included within cost of product in the Consolidated Statement of Operations. Company-owned hair restoration center revenues stem primarily from servicing hair systems and surgical procedures, as well as through product and hair system sales. The Company records deferred revenue for contracts related to the servicing of hair systems and recognizes the revenue ratably over the term of the service contract. Revenues are recognized related to surgical procedures when the procedure is performed. Product revenues, including sales of hair systems, are recognized at the time of application, as this is when delivery occurs and payment is probable.income (see Note 10).income. Royalties are recognized as revenue in the month in which franchisee services are rendered. The Company recognizes revenue from initial franchise fees at the time franchise locations are opened, as this is generally when the Company has performed all initial services required under the franchise agreement.Promotion and advertising reimbursements are discussed under Advertising within this note.ofto the cost of inventory over the period in which the rebate is earned based upon historical purchasing patterns and the terms of the volume rebate program. A periodicquarterly analysis is performed at least quarterly, in order to ensure that the estimated rebate accrued is reasonable and any necessary adjustments are recorded.$3.5, $2.9,$3.2, $3.6 and $2.7$3.8 million during fiscal years 2011, 2010,2014, 2013 and 2009,2012, respectively and are included within general and administrative expenses.expenses on the Consolidated Statement of Operations. Any amounts billed to the franchiseefranchisees for shipping and handling are included in product revenues within the Consolidated Statement of Operations.
Advertising:NOTES TO CONSOLIDATED FINANCIAL STATEMENTS (Continued)1. BUSINESS DESCRIPTION AND SUMMARY OF SIGNIFICANT ACCOUNTING POLICIES (Continued)Advertising:The following table breaks out advertisingAdvertising costs expensed and included in continuing operations and advertising costs expensed and included in discontinued operations in fiscal years 2011, 20102014, 2013 and 2009: For the Years Ended June 30, 2011 2010 2009 $ 63,275 $ 54,850 $ 56,926 — — 4,451 $ 63,275 $ 54,850 $ 61,377 the vendor reimbursesvendors reimburse the Company for costs related to advertising for its products. The Company records such reimbursements as a reduction of advertising expense when the expense is incurred. During fiscal years 2011, 2010,2014, 2013 and 2009,2012, no amounts were received in excess of the Company's related expense.concepts consisting of Supercuts, Cost Cutters, First Choice Haircutters, Magicuts, Pro-Cuts, Beauty Supply Outlet and Hair Club.concepts. Most of the concepts maintain advertising funds that provide comprehensive advertising and sales promotion support.SupercutsCompany is required to participate in the advertising fund isfunds for company-owned locations under the Company's largestsame salon concept. The Company assists in the administration of the advertising fund. The Supercuts advertising fund is administered byfunds. However, a councilgroup of individuals consisting primarily of franchisee representatives. The councilrepresentatives has overall control ofover all of the fund's expenditures and operates the funds in accordance with terms of the franchise operating and other agreements. Each Supercuts salon contributes 5.0 percent of service revenues to the fund (contributions for other concepts range between 1.5 and 5.0 percent). The majority of the advertising funds are spent to support media placement and local marketing activities. The remainder is allocated for the creation of national advertising campaigns and system wide activities. None of the Supercuts advertising funds collected may be used by the Company as reimbursement for the cost of administering the advertising fund. Advertising funds can only be used as directed by the fund's council and are considered to be restricted. The Company records all advertising funds as assets and liabilities within the Company's Consolidated Balance Sheet. As of June 30, 2011 and 2010, approximately $16.7 and $18.0 million, respectively, of the advertising funds' assets and liabilities were recorded within total assets and total liabilities, respectively, in the Company's Consolidated Balance Sheet.2011, 2010,2014, 2013 and 20092012, total contributions to the franchise brand advertising funds totaled $41.9, $39.8,$18.6, $19.0, $19.2 million, respectively.$39.4liabilities within the Company's Consolidated Balance Sheet. As of June 30, 2014 and 2013, approximately $26.8 and $20.8 million, respectively.respectively, representing the advertising funds' assets and liabilities were recorded within total assets and total liabilities in the Company's Consolidated Balance Sheet. The Company acts as an agent for the franchisees with regard to these contributions to the advertising funds. Thus, in accordance with guidance for accounting for franchise fee revenue, the Company does not reflect contributions to these advertising funds by its franchisees in its Consolidated Statement of Operations or Consolidated Statement of Cash Flows but reflects the related assets and liabilities in its Consolidated Balance Sheet.RealizationA valuation allowance is established for any portion of deferred tax assets is ultimately dependent uponthat are not considered more likely than not to be realized. The Company evaluates all evidence, including recent financial performance, the existence of cumulative year losses and our forecast of future taxable income.income, to assess the need for a valuation allowance against our deferred tax assets. While the determination of whether or not to record a valuation allowance is not fully governed by a specific objective test, accounting guidance places significant weight on recent financial performance. (Dollars in thousands) Balance, June 30, 2013 $ — Establishment of valuation allowance against U.S. & U.K. deferred tax assets 84,391 Changes to deferred tax asset valuation allowance (469 ) Balance, June 30, 2014 $ 83,922 for the Company include net (loss) income, foreign currency translation adjustments, changes in fair value of financialderivative instruments, designated as hedges of interest rate or foreign currency exposure, recognition of deferred compensation and foreign currency translation charged or credited to the cumulativeTablereclassification adjustments, net of ContentsNOTES TO CONSOLIDATED FINANCIAL STATEMENTS (Continued)1. BUSINESS DESCRIPTION AND SUMMARY OF SIGNIFICANT ACCOUNTING POLICIES (Continued)translation accounttax within shareholders' equity. These amounts are presented in the Consolidated Statements of Changes in Shareholders' Equity and Comprehensive Income. 2011 2010 2009 (Dollars in thousands) $ 47,032 $ 51,855 $ 101,973 57,991 63,407 111,073 30,405 (5,416 ) (47,666 ) — — — 30,405 (5,416 ) (47,666 ) 88,396 57,991 63,407 (8,436 ) (10,903 ) (8,791 ) 218 3,949 (3,421 ) (86 ) (1,482 ) 1,309 132 2,467 (2,112 ) (8,304 ) (8,436 ) (10,903 ) (2,523 ) (649 ) (309 ) 609 3,184 (514 ) (232 ) (1,310 ) 174 377 (1,874 ) (340 ) (2,146 ) (2,523 ) (649 ) $ 77,946 $ 47,032 $ 51,855 Derivative Instruments: The Company may manage its exposure to interest rate and foreign currency risk within the Consolidated Statements through the use of derivative financial instruments, according to its hedging policy. The Company does not use derivatives with a level of complexity or with a risk higher than the exposures to be hedged and does not hold or issue derivatives for trading or speculative purposes. The Company currently has or has had interest rate swaps designated as both cash flow and fair value hedges, treasury locks designated as cash flow hedges, a hedge of its net investment in its European operations and forward foreign currency contracts designated as cash flow hedges of forecasted transactions denominated in a foreign currency. Refer to Note 9 to the Consolidated Financial Statements for further discussion. The Company follows guidance for accounting for derivative instruments and hedging activities, as amended and interpreted, which requires that all derivatives be recorded on the balance sheet at fair value. This guidance also requires companies to designate all derivatives that qualify as hedging instruments as fair value hedges, cash flow hedges or hedges of net investments in foreign operations.NOTES TO CONSOLIDATED FINANCIAL STATEMENTS (Continued)1. BUSINESS DESCRIPTION AND SUMMARY OF SIGNIFICANT ACCOUNTING POLICIES (Continued)This designation is based upon the exposure being hedged. Cash flow and fair value hedges are designated and documented at the inception of each hedge by matching the terms of the contract to the underlying transaction. At inception, as dictated by the facts and circumstances, all hedges are expected to be highly effective, as the critical terms of these instruments are generally the same as those of the underlying risks being hedged. All derivatives designated as hedging instruments are assessed for effectiveness on an on-going basis. For purposes of the Consolidated Statement of Cash Flows, cash flows associated with all derivatives (designated as hedges or freestanding economic hedges) are classified in the same category as the related cash flows subject to the hedging relationship.Stock-Based Employee Compensation Plans: Stock-based awards are granted under the terms of the 2004 Long Term Incentive Plan (2004 Plan). Additionally, the Company has outstanding stock options under its 2000 Stock Option Plan (2000 Plan), although the Plan terminated in 2010. On October 28, 2010 our stockholders approved an amendment to the 2004 Plan to increase the maximum number of shares of the Company's common stock authorized for issuance from 2,500,000 to 6,750,000. Under these plans, four types of stock-based compensation awards are granted: stock options, equity-based stock appreciation rights (SARs), restricted stock awards (RSAs) and restricted stock units (RSUs). The stock options and SARs have a maximum term of ten years. The stock-based awards, other than the RSUs, generally vest at a rate of 20.0 percent annually on each of the first five anniversaries of the date of grant. The RSUs cliff vest after five years, and payment of the RSUs is deferred until January 31 of the year following vesting. Unvested awards are subject to forfeiture in the event of termination of employment. The Company utilizes an option-pricing model to estimate the fair value of options and SARs at their grant date. Stock options and SARs are granted at not less than fair market value on the date of grant. The Company generally recognizes compensation expense for its stock-based compensation awards on a straight-line basis over a five-year vesting period. Awards granted do not contain acceleration of vesting terms for retirement eligible recipients. The Company's primary employee stock-based compensation grant occurs during the fourth fiscal quarter. Total compensation cost for stock-based payment arrangements totaled $9.6, $9.3, and $7.5 million for the fiscal years ended June 30, 2011, 2010 and 2009, respectively. Guidance adopted by the Company for share-based payments requires that the cash retained as a result of the tax deductibility of increases in the value of stock-based arrangements be presented as a cash inflow from financing activity in the Consolidated Statement of Cash Flows. The amount presented as a financing activity for fiscal years 2011, 2010 and 2009 was $0.1, $0.2, and $0.2 million, respectively.Recent Accounting Standards Adopted by the Company:Disclosure about the Credit Quality of Financing Receivables and the Allowance for Credit Losses In July 2010, the Financial Accounting Standards Board (FASB) issued guidance to amend the disclosure requirements related to the credit quality of financing receivables and the allowance for credit losses. The guidance requires disclosures on a disaggregated basis on two defined levels: (1) portfolio segment; and (2) class of financing receivable. The guidance amends existing disclosures to require an entity to provide the following disclosures on a disaggregated basis: rollforward schedule of the allowance for credit losses from the beginning to the end of the reporting period on a portfolio segment basis, the related recorded investment in financing receivables for each disaggregated endingNOTES TO CONSOLIDATED FINANCIAL STATEMENTS (Continued)1. BUSINESS DESCRIPTION AND SUMMARY OF SIGNIFICANT ACCOUNTING POLICIES (Continued)balance, the nonaccrual status of financing receivables by class of financing receivables, and impaired financing receivables by class of financing receivables. Additionally, the guidance requires, among other things, new disclosures on the credit quality indicators of financing receivables at the end of the reporting period by class of financing receivables and the aging of past due financing receivables at the end of the reporting period by class of financing receivables. The Company is in compliance with the new disclosure requirements.Disclosures about Fair Value of Financial Instruments In January 2010, the FASB issued guidance to amend the disclosure requirements related to recurring and nonrecurring fair value measurements. The guidance requires new disclosures on the transfers of assets and liabilities between Level 1 (unadjusted quoted prices in active market for identical assets or liabilities) and Level 2 (significant other observable inputs) of the fair value measurement hierarchy, including the reasons and the timing of the transfers. Additionally, the guidance requires a roll forward of activities on purchases, sales, issuance, and settlements of the assets and liabilities measured using significant unobservable inputs (Level 3 fair value measurements). The Company adopted the new disclosure guidance on January 1, 2010 and the disclosure on the roll forward activities for Level 3 fair value measurements will be adopted by the Company on July 1, 2011.Multiple-Deliverable Revenue Arrangements In October 2009, the FASB issued guidance on the accounting for multiple-deliverable revenue arrangements. The guidance removes the criterion that entities must use objective and reliable evidence of fair value in separately accounting for deliverables and provides entities with a hierarchy of evidence that must be considered when allocating arrangement consideration. The new guidance also requires entities to allocate arrangement consideration to the separate units of accounting based on the deliverables' relative selling price. The adoption of the new guidance on July 1, 2010, for multiple-deliverable revenue arrangements, did not have a material effect on the Company's financial position, results of operations, or cash flows.Amendments to Accounting for Variable Interest Entities In June 2009, the FASB issued guidance on the accounting for variable interest entities (VIE). The guidance requires a qualitative approach to identifying a controlling financial interest in a VIE and requires ongoing assessment of whether an entity is a VIE and whether an entity is a primary beneficiary of a VIE. This guidance requires enhanced disclosures that will provide users of financial statements with more transparent information about an enterprise's involvement in a VIE. The adoption of the new guidance on July 1, 2010, for variable interest entities, did not have a material effect on the Company's financial position, results of operations and cash flows.Comprehensive IncomeJune 2011,May 2014, the FASBFinancial Accounting Standards Board ("FASB") issued updated guidance onfor revenue recognition. The updated accounting guidance provides a comprehensive new revenue recognition model that requires a Company to recognize revenue to depict the presentationexchange for goods or services to a customer at an amount that reflects the consideration it expects to receive for those goods or services. The guidance also requires additional disclosure about the nature, amount, timing and uncertainty of comprehensive income. Specifically, the newrevenue and cash flows arising from customer contracts. This guidance allows an entity to present components of net income and otherNOTES TO CONSOLIDATED FINANCIAL STATEMENTS (Continued)1. BUSINESS DESCRIPTION AND SUMMARY OF SIGNIFICANT ACCOUNTING POLICIES (Continued)comprehensive income in one continuous statement, referred to as the statement of comprehensive income, or in two separate, but consecutive statements. The new guidance eliminates the current option to report other comprehensive income and its componentswill be effective in the statementfirst quarter of changes in equity. Whilefiscal year 2018. This update permits the new guidance changesuse of either the presentation of comprehensive income, there are no changes toretrospective or simplified transition method. The Company does not expect the components that are recognized in net income or other comprehensive income under current accounting guidance. This new guidance is effective for fiscal years and interim periods beginning after December 15, 2011. The adoption of the guidance on July 1, 2012 will notthis update to have an impact on the Company's financial position, results of operations or cash flows.Fair Value Measurement In April 2011, the FASB issued guidance to achieve common fair value measurement and disclosure requirements between GAAP and International Financial Reporting Standards. This new guidance amends current fair value measurement and disclosure guidance to include increased transparency around valuation inputs and investment categorization. This new guidance is effective for fiscal years and interim periods beginning after December 15, 2011. The adoption of the guidance on July 1, 2012 will not have ana material impact on the Company's consolidated financial position,statements and is evaluating the effect this guidance will have on its related disclosures.or cash flows.2. DISCONTINUED OPERATIONS Fiscal Years 2013 2012 (Dollars in thousands) Revenues $ 115,734 $ 151,552 Income (loss) from discontinued operations, before income taxes $ 28,643 $ (65,114 ) Income tax (provision) benefit on discontinued operations (4,242 ) 849 Equity in income of affiliated companies, net of tax 627 816 Income (loss) from discontinued operations, net of income taxes $ 25,028 $ (63,449 ) concluded, after a comprehensive review of strategic and financial options, to divest Trade Secret. The sale ofreported Trade Secret included 655 company-owned salonsas a discontinued operation. During fiscal years 2014 and 57 franchise salons, all of which had historically been reported within the Company's North America reportable segment. The sale of Trade Secret included Cameron Capital I, Inc. (CCI). CCI owned and operated PureBeauty and BeautyFirst salons which were acquired by2012, the Company on February 20, 2008. The Company concluded that Trade Secret qualified as held for sale asrecorded tax benefits of December 31, 2008, under accounting for the impairment or disposal of long-lived asset guidance,$1.4 and is presented as$1.1 million, respectively, in discontinued operations in the Consolidated Statements of Operations for all periods presented. The operations and cash flows of Trade Secret have been eliminated from ongoing operations of the Company and there will be no significant continuing involvement in the operations after disposal pursuant to guidance in determining whether to report discontinued operations. The agreement included a provision that the Company would supply product to the purchaser of Trade Secret and provide certain administrative services for a transition period. Under this agreement, the Company recognized $20.0 and $32.2 million of product revenues on the supply of product sold to the purchaser of Trade Secret and $1.9 and $2.9 million of other income related to the administrative services duringrelease of tax reserves associated with the years ended June 30, 2010 and 2009, respectively. The agreement was substantially complete as of September 30, 2009. Beginning within the second quarter of fiscal year 2010, the Company has an agreement in which the Company provides warehouse services to the purchaserdisposition of Trade Secret. Under the warehouse services agreement, the Company recognized $2.7 and $3.0 million of other income related to warehouse services during the twelve months ended June 30, 2011 and 2010, respectively.2. DISCONTINUED OPERATIONS (Continued) The following table provides the amounts due to the Company from the purchaser of Trade Secret: Classification June 30,
2011 June 30,
2010 (Dollars in thousands) Receivables, net $ 320 $ 359 Other current assets 2,607 2,838 Other current assets (2,607 ) (611 ) Other assets 31,086 29,000 Other assets (31,086 ) — $ 320 $ 31,586 During fiscal year 2010, the Company entered into a formal note receivable agreement with the purchaser of Trade Secret. On July 6, 2010, the purchaser of Trade Secret filed for Chapter 11 bankruptcy. The purchaser of Trade Secret emerged from bankruptcy in October 2010 and in conjunction, the note receivable agreement was amended. The note receivable agreement accrues interest at 8.0 percent which is payable quarterly beginning in December 2010. Principal payments of $0.5 million are due quarterly beginning in December 2011 with the remainder of the principal due in September 2015. During the third quarter of fiscal year 2011, the Company did not receive a scheduled interest payment related to the outstanding note receivable with the purchaser of Trade Secret, the fair value of the collateral decreased to a level below the carrying value of the outstanding note receivable, and the purchaser of Trade Secret provided the Company with a new five year business plan that was well below the purchaser of Trade Secret's original projections. Due to these factors that occurred during the third quarter of fiscal year 2011, the Company evaluated the note receivable for realizability based on a probability weighted expected future cash flow analysis. During the third quarter of fiscal year 2011, the Company recorded a $9.0 million valuation reserve for the excess of the carrying value of the note receivable over the present value of expected future cash flows. During the fourth quarter of fiscal year 2011, the Company did not receive a scheduled interest payment related to the outstanding note receivable with the purchaser of Trade Secret and the fair value of the collateral continued to decrease and was at a level significantly below the carrying value of the outstanding note receivable. In addition, the Company received updated financial projections that were below the projections received during the third quarter of fiscal year 2011. Due to these negative financial events in the fourth quarter of fiscal year 2011, the Company performed an extensive evaluation on the Company's option to realize the collateral under the note receivable and recorded an additional $22.2 million valuation reserve that fully reserved the carrying value of the note receivable as of June 30, 2011. The Company has determined the collectibility of accrued interest on the note receivable to be less than probable. The Company suspended recognition of interest income effective April 2010, has recorded a valuation allowance of $2.5 million as of June 30, 2011 related to the accrued interest, and will use the cash basis method for recognizing future interest income. During fiscal year 2011, the Company received interest payments from the purchaser of Trade Secret totaling $0.8 million.NOTES TO CONSOLIDATED FINANCIAL STATEMENTS (Continued)2. DISCONTINUED OPERATIONS (Continued) The following table summarizes the activity in the valuation allowance related to the note receivable with the purchaser of Trade Secret: For the Twelve Months
Ended June 30, 2011 (Dollars in thousands) $ (611 ) (688 ) $ (1,299 ) (670 ) 670 $ (1,299 ) (655 ) (9,000 ) $ (10,954 ) (662 ) (22,227 ) 150 $ (33,693 ) The Company utilized the consolidation of variable interest entities guidance to determine whether or not Trade Secret was a VIE, and if so, whether the Company was the primary beneficiary of Trade Secret. The Company concluded that Trade Secret is a VIE based on the fact that the equity investment at risk in Trade Secret is insufficient. The Company determined that the purchaser of Trade Secret has met the power criterion due to the purchaser of Trade Secret having the authority to direct the activities that most significantly impact Trade Secret's economic performance. The Company concluded based on the consideration above that the primary beneficiary of Trade Secret is the purchaser of Trade Secret. The exposure to loss related to the Company's involvement with Trade Secret is the carrying value of the amount due from the purchaser of Trade Secret and the guarantee of approximately 40 operating leases. The Company has determined the exposure to the risk of loss on the guarantee of the operating leases to be reasonably possible. See Note 10 to the Consolidated Financial Statements for further information on the guaranteed leases. The income (loss) from discontinued operations is summarized below: For the Years Ended June 30, 2011 2010 2009 (Dollars in thousands) $ — $ — $ 163,436 — 154 (190,433 ) — 3,007 58,997 $ — $ 3,161 $ (131,436 ) During the first quarter of fiscal year 2010, the Company recorded a $3.0 million tax benefit in discontinued operations to correct the prior year calculation of the income tax benefit related to the disposition of the Trade Secret salon concept. The Company does not believe the adjustment is material to its results of operations for the twelve months ended June 30, 2010 or its financial position or results of operations of any prior periods.NOTES TO CONSOLIDATED FINANCIAL STATEMENTS (Continued)accounts as of June 30, 2011 and 2010:accounts: 2011 2010 (Dollars in thousands) $ 28,631 $ 27,482 (1,482 ) (3,170 ) $ 27,149 $ 24,312 $ 29,705 $ 31,760 2,413 4,443 June 30, $ 32,118 $ 36,203 2014 2013 (Dollars in thousands) Other current assets: Prepaids $ 36,951 $ 29,629 Restricted cash 27,500 27,500 Notes receivable 635 769 $ 65,086 $ 57,898 Land $ 3,864 $ 3,864 Buildings and improvements 48,108 47,842 Equipment, furniture and leasehold improvements 797,757 789,737 Internal use software 122,826 118,093 Equipment, furniture and leasehold improvements under capital leases 77,223 81,489 $ 3,864 $ 3,864 1,049,778 1,041,025 47,907 48,837 775,527 736,469 94,507 87,286 88,297 88,534 1,010,102 964,990 (611,669 ) (561,174 ) (50,622 ) (44,566 ) $ 347,811 $ 359,250 $ 258,930 $ 183,670 2,210 12,116 $ 261,140 $ 195,786 $ 1,072 $ 30,200 57,328 50,412 $ 58,400 $ 80,612 Less accumulated depreciation and amortization (718,959 ) (665,924 ) Less amortization of equipment, furniture and leasehold improvements under capital leases (64,281 ) (61,641 ) $ 266,538 $ 313,460 $ 89,788 $ 87,831 19,127 22,323 8,313 8,455 8,113 9,206 41,980 32,982 $ 167,321 $ 160,797 Payroll and payroll related costs $ 69,319 $ 74,940 Insurance 18,710 19,035 Other 54,691 43,251 $ 142,720 $ 137,226 Deferred income taxes $ 83,201 $ 36,399 Deferred rent 36,958 39,389 Insurance 25,965 29,378 Deferred benefits 32,728 32,435 Other 11,602 17,410 $ 55,208 $ 68,059 $ 190,454 $ 155,011 53,102 53,914 58,150 55,706 30,925 26,455 22,700 22,009 17,210 21,627 $ 237,295 $ 247,770 the other intangibles, net, balance sheet account as of June 30, 2011 and 2010:net: June 30, 2011 June 30, 2010 Cost Accumulated
Amortization Net Cost Accumulated
Amortization Net (Dollars in thousands) $ 80,310 $ (14,329 ) $ 65,981 $ 79,596 $ (12,139 ) $ 67,457 53,188 (34,096 ) 19,092 52,045 (28,652 ) 23,393 22,221 (8,909 ) 13,312 21,245 (7,543 ) 13,702 14,948 (5,168 ) 9,780 14,674 (4,360 ) 10,314 353 (232 ) 121 320 (146 ) 174 4,429 (1,387 ) 3,042 6,755 (3,725 ) 3,030 $ 175,449 $ (64,121 ) $ 111,328 $ 174,635 $ (56,565 ) $ 118,070 June 30, 2014 2013 Weighted Average Amortization Periods (1) Cost Net Weighted Average Amortization Periods (1) Cost Net (In years) (Dollars in thousands) (In years) (Dollars in thousands) Amortized intangible assets: Brand assets and trade names 32 $ 9,203 $ (3,510 ) $ 5,693 32 $ 9,310 $ (3,226 ) $ 6,084 Franchise agreements 19 11,063 (7,163 ) 3,900 19 11,187 (6,839 ) 4,348 Lease intangibles 20 14,775 (7,326 ) 7,449 20 14,754 (6,582 ) 8,172 Other 20 5,074 (2,304 ) 2,770 20 4,815 (1,923 ) 2,892 22 $ 40,115 $ (20,303 ) $ 19,812 22 $ 40,066 $ (18,570 ) $ 21,496 All intangible assets have been assigned an estimated finite useful life, and are amortized on a straight-line basis over the number of years that approximate their expected period of benefit (ranging from one to 40 years). The cost of intangible assets is amortized to earnings in proportion to the amount of economic benefits obtained by the Company in that reporting period. The weighted average amortization periods, in total and by major intangible asset class, are as follows:(1) All intangible assets have been assigned an estimated finite useful life and are amortized on a straight-line basis over the number of years that approximate their expected period of benefit (ranging from one to 40 years). Weighted
Average
Amortization
Period
(In years)
June 30, 2011 2010 39 39 10 10 22 22 20 20 5 5 25 18 26 26 amortizable intangible assets during thefiscal years ended June 30, 2011, 2010,2014, 2013 and 20092012 was approximately $9.8, $9.9,$1.7, $1.8 and $9.9$1.9 million, respectively. As of June 30, 2011,2014, future estimated amortization expense related to amortizable intangible assets is estimated to be: (Dollars in thousands) $ 9,702 9,395 9,177 6,152 $ 1,710 4,011 1,644 2017 1,589 2018 1,575 2019 1,575 Thereafter 11,719 Total $ 19,812 NOTES TO CONSOLIDATED FINANCIAL STATEMENTS (Continued)3. OTHER FINANCIAL STATEMENT DATA (Continued) 2011 2010 2009 (Dollars in thousands) $ 33,493 $ 53,547 $ 40,992 (15,083 ) 17,058 21,878 Fiscal Years 2014 2013 2012 (Dollars in thousands) Cash paid (received) for: Interest $ 21,173 $ 38,990 (1) $ 28,448 Income taxes, net (16,266 ) 1,088 14,754 Significant non-cash investing and financing activities include the following: In fiscal years 2011, 2010, and 2009, the Company financed capital expenditures totaling $6.0, $7.9, and $7.5 million, respectively, through capital leases.4. ACQUISITIONS During fiscal years 2011, 2010, and 2009, the Company made acquisitions and the purchase prices have been allocated to assets acquired and liabilities assumed based on their estimated fair values at the dates of acquisition. These acquisitions individually and in the aggregate are not material to the Company's operations. Operations of the acquired companies have been included in the operations of the Company since the date of the respective acquisition. Based upon purchase price allocations, the components of the aggregate purchase prices of the acquisitions made during fiscal years 2011, 2010, and 2009 and the allocation of the purchase prices were as follows:(1) Includes $10.6 million of cash paid for make-whole associated with prepayment of senior notes. 2011 2010 2009 (Dollars in thousands) $ 17,990 $ 3,664 $ 40,051 561 — 75 $ 18,551 $ 3,664 $ 40,126 $ 641 $ 178 $ 1,337 4,232 873 5,989 — — 1,787 12,489 2,581 30,812 1,964 134 1,322 (534 ) (102 ) (818 ) (241 ) — (303 ) $ 18,551 $ 3,664 $ 40,126 4. ACQUISITIONS (Continued) The value and related weighted average amortization periods for the intangibles acquired during fiscal years 2011 and 2010 business acquisitions, in total and by major intangible asset class, are as follows: Purchase Price
Allocation Weighted
Average
Amortization
Period Year Ended
June 30, (in years) 2011 2010 2011 2010 (Dollars in
thousands) $ 159 $ 61 10 20 1,207 — 7 — 269 — 40 — 151 15 20 20 — — — — 178 58 20 20 $ 1,964 $ 134 14 20 The majority of the purchase price in salon acquisitions is accounted for as residual goodwill rather than identifiable intangible assets. This stems from the value associated with the walk-in customer base of the acquired salons, which is not recorded as an identifiable intangible asset under current accounting guidance, as well as the limited value and customer preference associated with the acquired hair salon brand. Key factors considered by consumers of hair salon services include personal relationships with individual stylists, service quality and price point competitiveness. These attributes represent the "going concern" value of the salon. Residual goodwill further represents the Company's opportunity to strategically combine the acquired business with the Company's existing structure to serve a greater number of customers through its expansion strategies. In the acquisitions of international salons and hair restoration centers, the residual goodwill primarily represents the growth prospects that are not captured as part of acquired tangible or identified intangible assets. Generally, the goodwill recognized in the North American salon transactions is expected to be fully deductible for tax purposes and the goodwill recognized in the international salon transactions is non-deductible for tax purposes. Goodwill generated in certain acquisitions, such as the acquisition of hair restoration centers, is not deductible for tax purposes due to the acquisition structure of the transaction. During fiscal years 2011, 2010, and 2009, the Company purchased salon operations from its franchisees. The Company evaluated the effective settlement of the pre-existing franchise contracts and associated rights afforded by those contracts. The Company determined that the effective settlement of the pre-existing franchise contracts at the date of the acquisition did not result in a gain or loss, as the agreements were neither favorable nor unfavorable when compared to similar current market transactions, and no settlement provisions exist in the pre-existing contracts. Therefore, no settlement gain or loss was recognized with respect to the Company's franchise buybacks.NOTES TO CONSOLIDATED FINANCIAL STATEMENTS (Continued)5. GOODWILLgoodwill for the years ended June 30, 2011 and 2010:goodwill: Salons Hair Restoration
Centers North America International Consolidated (Dollars in thousands) $ 693,181 $ 41,661 $ 149,367 $ 884,209 (78,126 ) (41,661 ) — (119,787 ) 615,055 — 149,367 764,422 2,581 — — 2,581 4,250 — 13 4,263 — — 1,000 1,000 (35,277 ) — — (35,277 ) 700,012 41,661 150,380 892,053 (113,403 ) (41,661 ) — (155,064 ) 586,609 — 150,380 736,989 10,070 — 2,419 12,489 5,137 — (3 ) 5,134 (74,100 ) — — (74,100 ) 715,219 41,661 152,796 909,676 (187,503 ) (41,661 ) — (229,164 ) $ 527,716 $ — $ 152,796 $ 680,512 June 30, 2014 2013 Net (2) Net (Dollars in thousands) Goodwill $ 678,925 $ (253,661 ) $ 425,264 $ 679,607 $ (218,722 ) $ 460,885 (1) The table below contains additional information regarding accumulated impairment losses: (1)See Note 4Fiscal Year Impairment Charge Reporting Unit (3) (Dollars in thousands) 2009 $ (41,661 ) International 2010 (35,277 ) North American Premium 2011 (74,100 ) North American Value 2012 (67,684 ) North American Premium 2014 (4) (34,939 ) North American Premium Total $ (253,661 ) (2) Remaining net goodwill relates to the Company's North American Value reporting unit. (3) See Notes 1 and 14 to the Consolidated Financial Statements. (4) See Note 1 to the Consolidated Financial Statements. Consolidated Financial Statements.(2)As a result of the Company's annual impairment testing of goodwill, a $35.3 million impairment charge was recorded within continuing operations for the excess of the carrying value of goodwill over the implied fair value of goodwill for the Regis salon concept.(3)As a result of the Company's annual impairment testing of goodwill, a $74.1 million impairment charge was recorded within continuing operations for the excess of the carrying value of goodwill over the implied fair value of goodwill for the Promenade salon concept. North American Value North American Premium Consolidated (Dollars in thousands) Goodwill, net at June 30, 2012 $ 427,287 $ 34,992 $ 462,279 Translation rate adjustments (1,355 ) (39 ) (1,394 ) Goodwill, net at June 30, 2013 425,932 34,953 460,885 Goodwill impairment — (34,939 ) (34,939 ) Goodwill acquired 130 — 130 Translation rate adjustments (798 ) (14 ) (812 ) Goodwill, net at June 30, 2014 $ 425,264 $ — $ 425,264 Table of ContentsNOTES TO CONSOLIDATED FINANCIAL STATEMENTS (Continued)6.AND LOANS TO AFFILIATES June 30, 2014 2013 (Dollars in thousands) Empire Education Group, Inc. $ 28,398 $ 43,098 MY Style 213 221 $ 28,611 $ 43,319 Greater Than 50 Percent Owned (1) Less Than 50 Percent Owned (2) 2014 2013 2012 2014 2013 2012 (Dollars in thousands) Summarized Balance Sheet Information: Current assets $ 54,774 $ 35,900 $ 56,516 $ — $ — $ 84,700 Noncurrent assets 57,803 91,847 96,639 — — 316,282 Current liabilities 24,797 25,317 61,074 — — 106,995 Noncurrent liabilities 33,004 21,560 13,947 — — 78,815 Summarized Statement of Operations Information: Gross revenue $ 166,540 $ 170,964 $ 182,326 $ — $ — $ 305,515 Gross profit 52,440 58,457 67,201 — — 132,647 Operating (loss) income (33,526 ) 4,981 (1,335 ) — — 35,569 Net (loss) income (26,699 ) 2,359 (7,211 ) — — 24,067 (1) Represents the summarized financial information of EEG. As EEG is a significant subsidiary for the fiscal year 2014 financial statements, the separate financial statements of EEG are included subsequent to the Company's financial statements. Gross profit includes depreciation and amortization expense of $5.8, $7.4, and $7.5 million for fiscal years 2014, 2013 and 2012, respectively. (2) The Company previously owned a 46.7% equity interest in Provalliance. During fiscal year 2013, the Company completed the sale of its investment in Provalliance. loans2013, the Company's ownership interest in Empire Education Group, Inc. (EEG) was 54.5%. EEG operates accredited cosmetology schools and is managed by the Empire Beauty School executive team. The Company accounts for EEG as an equity investment under the voting interest model.affiliatesaccount for the negative business impacts resulting from regulatory changes including declines in enrollment, revenue and profitability in the for-profit secondary educational market. The Company did not receive a tax benefit on these impairment charges.20112014. As of June 30, 2014, our share of EEG's deferred tax assets was $7.8 million.2010: Provalliance Empire
Education
Group, Inc. MY Style Hair Club
for
Men, Ltd. Total (Dollars in thousands) $ 82,135 $ 111,451 $ 12,718 $ 5,096 $ 211,400 — (15,000 ) — — (15,000 ) 4,134 6,431 — 909 11,474 (1,141 ) — — (1,263 ) (2,404 ) (9,647 ) — (602 ) 565 (9,684 ) $ 75,481 $ 102,882 $ 12,116 $ 5,307 $ 195,786 57,301 — — — 57,301 — (15,000 ) — — (15,000 ) — 15,000 — — 15,000 7,752 5,463 — 567 13,782 — — (9,173 ) — (9,173 ) (4,814 ) (4,129 ) — (1,080 ) (10,023 ) 13,525 324 (733 ) 351 13,467 $ 149,245 $ 104,540 $ 2,210 $ 5,145 $ 261,140 46.7 % 55.1 % — 50.0 % (1)Equity in incomeThe Company previously provided EEG with a $15.0 million revolving credit facility and outstanding loan, both of affiliated companies, net of income taxes perwhich matured during fiscal year 2013. At June 30, 2012, there was $15.0 and $11.4 million outstanding on the Consolidated Statement of Operations includes $4.1revolving credit facility and loan outstanding, respectively. The Company received $15.0 million in equity incomepayments on the revolving credit facilityforrespectively, of interest income related to the increaseloan and revolving credit facility.the Provalliance equity put valuation.(2)Equity in income of affiliated companies, net of income taxes per the Consolidated Statement of Operations includes $7.8 million in equity income of Provalliance and a $2.4 million gain for the decrease in the Provalliance equity put valuation.(3)In March of 2011,elected to honor and settle a portion of the equity put option and acquired approximately 17 percent additionalsold its 46.7% equity interest in Provalliance for $57.3 million (€ 40.4 million), bringing the Company's total equity interest to approximately 47 percent.(4)Due to the natural disasters in Japan that occurred in March 2011, the$103.4 million. The Company was required to assess the preferred shares and premium for other than temporary impairment. As a result, the Company recorded an other than temporary impairment during the twelve months ended June 30, 2011 for the carrying value of the preferred shares and premium of $3.9 million (326,700,000 Yen) and $5.3 million (435,000,000 Yen), respectively. Of the total impairment, $9.0 million was recorded through the equity in income of affiliated companies and $0.2 million was recorded through the interest income and other, net, line items in the Consolidated Statement of Operations.NOTES TO CONSOLIDATED FINANCIAL STATEMENTS (Continued)6. INVESTMENTS IN AND LOANS TO AFFILIATES (Continued) The table below presents the summarized financial information of the equity method investees as of June 30, 2011 and 2010. The financial information of the equity investees was based on results as of and for the twelve months ended June 30. Equity Method
Investee Greater
Than 50 Percent Owned Equity Method
Investees Less
Than 50 Percent Owned 2011 2010 2009 2011 2010 2009 (Dollars in thousands) $ 34,715 $ 35,070 $ 34,990 $ 93,280 $ 74,040 $ 109,700 113,249 105,469 99,858 314,127 263,472 313,763 29,340 27,458 25,583 109,416 91,077 137,169 33,658 32,017 39,661 98,269 93,055 115,067 $ 192,864 $ 176,535 $ 153,693 $ 283,442 $ 299,188 $ 290,978 73,068 64,661 48,173 120,992 123,210 124,361 18,994 19,752 7,656 30,084 21,227 19,047 11,023 11,082 3,611 21,154 14,763 13,295 Investment in Provalliance On January 31, 2008, the Company merged its continental European franchise salon operations with the operations of the Franck Provost Salon Group in exchange for a 30.0 percent equity interest in the newly formed Provalliance entity (Provalliance). The merger with the operations of the Franck Provost Salon Group, which are also located in continental Europe, created Europe's largest salon operator with approximately 2,600 company-owned and franchise salons as of June 30, 2011. The merger agreement containspreviously had a right (Equity(Provalliance Equity Put) to, which if exercised, would require the Company to purchase an additional ownership interest in Provalliance between specified dates in 2010 to 2018. The acquisition price isProvalliance Equity Put was classified as a Level 3 fair value measurement as the fair value was determined based on a multiple ofunobservable inputs that could not be corroborated by observable market data. During fiscal year 2013, the earnings before interest, taxes, depreciation and amortization of Provalliance for a trailing twelve month period adjusted for certain items as defined in the agreement which is intended to approximate fair value. The initial estimated fair value of the Equity Put as of January 31, 2008, approximately $24.8 million, has been included as a component of the Company's investment in Provalliance. A corresponding liability for the same amount as the Equity Put was recorded in other noncurrent liabilities. Any changes in the estimated fair value of the Equity Put are recorded in the Company's consolidated statement of operations. The Company recorded a $2.4$0.6 million decrease in the fair value of the Provalliance Equity Put that automatically terminated upon the sale.2011, see further discussion below and within Note 7 to2012. In addition, the Consolidated Financial Statements. Any changes related to foreign currency translation are recorded in accumulated other comprehensive income. The Company recorded a $3.8 million increase infair value of the Provalliance Equity Put relateddecreased by $20.2 to foreign currency translation during fiscal year 2011, see further discussion within Note 7 to the Consolidated Financial Statements. If the Equity Put is exercised,$0.6 million as of June 30, 2012. The other than temporary impairment charge and the Company fails to complete the purchase, the parties exercising the Equity Put will be entitled to exercise various remedies against the Company, including the right to purchase the Company's interest in Provalliance for a purchase price determined based on a discounted multiple of the earnings before interest and taxes of Provalliance for a trailing twelve month period. The mergerNOTES TO CONSOLIDATED FINANCIAL STATEMENTS (Continued)6. INVESTMENTS IN AND LOANS TO AFFILIATES (Continued)agreement also contains an option (Equity Call) whereby the Company can acquire additional ownership interest in Provalliance between specific dates in 2018 to 2020 at an acquisition price determined consistent with the Equity Put. In December 2010, a portion of the Equity Put was exercised. In March of 2011, the Company elected to honor and settle a portion of the Equity Put and acquired approximately 17 percent additional equity interest in Provalliance for $57.3 million (approximately € 40.4 million), bringing the Company's total equity interest to 46.7 percent. Upon the acquisition of the additional ownership interest, the Company recognized a net gain of approximately $2.4 million representing the reversal of the Equity Put liability that was extinguished upon settlement, partially offset by an increasereduction in the fair value of the remaining Equity Put. The Company's liability under theProvalliance Equity Put to purchase the remainderresulted in a net impairment charge of $17.2 million that is recorded within the equity interest in Provalliance continues to exist through 2018 and is valued at $22.7 million as(loss) income of June 30, 2011. The Company utilized the consolidation of variable interest entities guidance to determine whether oraffiliated companies during fiscal year 2012. Regis did not its investment in Provalliance wasreceive a VIE, and if so, whether the Company was the primary beneficiary of the VIE. The Company concluded that Provalliance is a VIE basedtax benefit on the fact that the holders of the equity investment at risk, as a group, lack the obligation to absorb the expected losses of the entity. The Equity Put is based on a formula that may or may not be at market when exercised, therefore, it could provide the Company with the characteristic of a controlling financial interest or could prevent the Franck Provost Salon Group from absorbing its share of expected losses by transferring such obligation to the Company. Under certain circumstances, including a decline in the fair value of Provalliance, the Equity Put could be exercised and the Franck Provost Group could be protected from absorbing the downside of the equity interest. As the Equity Put absorbs a large amount of variability this characteristic results in Provalliance being a VIE. Regis determined that the Franck Provost Group has met the power criterion due to the Franck Provost Group having the authority to direct the activities that most significantly impact Provalliance's economic performance. The Company concluded based on the considerations above that the primary beneficiary of Provalliance is the Franck Provost Group. The Company has accounted for its interest in Provalliance as an equity method investment. The exposure to loss related to the Company's involvement with Provalliance is the carrying value of the investment and future changes in fair value of the Equity Put that is unable to be quantified as of this date. In connection with the purchase of the additional equity interest, the Company reassessed the consolidation of variable interest entities guidance to determine whether the Company will now be considered the primary beneficiary of the VIE. Consistent with the previous assessment, the Company has determined the Frank Provost Group continues to meet the power criterion and is considered the primary beneficiary of Provalliance.years 2011, 2010, and 2009,year 2012, the Company recorded $7.8 and $4.1, and $2.0$9.8 million respectively, of equity in incomeearnings and received $2.8 million of cash dividends related to its investment in Provalliance.TableDue to the sale of ContentsNOTES TO CONSOLIDATED FINANCIAL STATEMENTS (Continued)6. INVESTMENTS IN AND LOANS TO AFFILIATES (Continued) The tables below contain details related to the Company's investment in Provalliance, the Company liquidated its foreign entities with Euro denominated operations. Amounts previously classified within accumulated other comprehensive income that were recognized in earnings were foreign currency translation rate gain adjustments of $43.4 million, a cumulative tax-effected net loss of $7.9 million associated with a cross-currency swap that was settled in fiscal year 2007 that hedged the Company's European operations, and a $1.7 million net loss associated with cash repatriation, which netted to $33.8 million for the twelve months ended June 30, 2011, 2010,fiscal year 2013, recorded within interest income and 2009:Impactother, net on Consolidated Balance Sheet Carrying Value at
June 30, Classification 2011 2010 (Dollars in thousands) Investment in and loans to affiliates $ 149,245 $ 75,481 Other noncurrent liabilities 22,700 22,009 Impact onthe Consolidated Statement of Operations For the Twelve Months
Ended June 30, Classification 2011 2010 2009 (Dollars in thousands) Equity in income (loss) of affiliated companies, net of income taxes $ — $ — $ (25,732 ) Equity in income (loss) of affiliated companies, net of income taxes 7,752 4,134 1,979 Impact on Consolidated Statement of Cash Flows For the Twelve Months
Ended June 30, Classification 2011 2010 2009 (Dollars in thousands) Equity in income of affiliated companies $ (7,752 ) $ (4,134 ) $ (1,979 ) Dividends received from affiliated companies 4,814 1,141 — (1)Due to increased debt and reduced earnings expectations, the Company could no longer justify the carrying amount of its investment in Provalliance and recorded a $25.7 million other than temporary impairment charge in its fourth quarter ended June 30, 2009. The exposure to loss related to the Company's involvement with Provalliance is the carrying value of the investment and future changes in fair value of the Equity Put.Empire Education Group, Inc. On August 1, 2007, the Company contributed its 51 wholly-owned accredited cosmetology schools to Empire Education Group, Inc. (EEG) in exchange for a 49.0 percent equity interest in EEG. In January 2008, the Company's effective ownership interest increased to 55.1 percent related to theNOTES TO CONSOLIDATED FINANCIAL STATEMENTS (Continued)6. INVESTMENTS IN AND LOANS TO AFFILIATES (Continued)buyout of EEG's minority interest shareholder. EEG operates 102 accredited cosmetology schools, has revenues of approximately $193 million annually and is overseen by the Empire Beauty School management team. At June 30, 2011 and 2010, the Company had a $21.4 million outstanding loan receivable with EEG that is due in January 2013. The Company has also provided EEG with a $15.0 million revolving credit facility, against which there no outstanding borrowings as of June 30, 2011 and 2010. During fiscal year 2011, 2010, and 2009, the Company recorded $0.7, $0.7, and $0.9 million, respectively, of interest income related to the loan and revolving credit facility. The Company has also guaranteed a credit facility of EEG. The exposure to loss related to the Company's involvement with EEG is the carrying value of the investment, the outstanding loan and the guarantee of the credit facility. The Company utilized consolidation of variable interest entities guidance to determine whether or not its investment in EEG was a variable interest entity (VIE), and if so, whether the Company was the primary beneficiary of the VIE. The Company concluded that EEG was not a VIE based on the fact that EEG had sufficient equity at risk. As the substantive voting control relates to the voting rights of the Board of Directors, the Company granted the other shareholder a proxy to vote such number of the Company's shares such that the other shareholder would have voting control of 51.0 percent of the common stock of EEG. The Company accounts for EEG as an equity investment under the votingits 27.1% ownership interest model. During fiscal years ended June 30, 2011, 2010, and 2009, the Company recorded $5.5, $6.4, and $2.1 million of equity earnings related to its investment in EEG. During the twelve months ended June 30, 2011, EEG declared and distributed a dividend in which the Company received $4.1 million in cash and recorded tax expense of $0.3 million.Investment in MY Style In April 2007, the Company purchased exchangeable notes issued by Yamano Holding Corporation (Exchangeable Note) and as a loan obligation of a Yamano Holdings subsidiary, MY Style, formally known as Beauty Plaza Co. Ltd., (MY Style Note) for an aggregate amount of $11.3 million (1.3 billion Yen as of April 2007). The Exchangeable Note contains an option for the Company to exchange a portion of the Exchangeable Note for shares of common stock of MY Style. In connection with the issuance of the Exchangeable Note, the Company paid a premium of approximately $5.5 million (573,000,000 Yen as of April 2007). Exchangeable Note. In September 2008, the Company advanced an additional $3.0 million (300,000,000 Yen as of September 2008) to Yamano Holding Corporation (Yamano). In connection with the 300,000,000 Yen advance, the exchangeable portion of the Exchangeable Note increased from approximately 14.8 percent to 27.1 percent of the 800 outstanding shares of MY Style for 21,700,000 Yen. This exchange feature is akin to a deep-in-the-money option permitting the Company to purchase shares of common stock of MY Style. The option is embedded in the Exchangeable Note and does not meet the criteria for separate accounting under accounting for derivative instruments and hedging activities.determined that the September 2008 modifications to the Exchangeable Note were more than minor and the loan modification should be treated aspreviously had an extinguishment. The Company recorded a $2.1 million (224,000,000 Yen as of September 2008) gain related to the modification of the Exchangeable Note. However, based upon the overall fair value of the Exchangeable Note on the date of modification, the Company recorded an other than temporary impairment loss of $3.4 million (370,000,000 Yen as of September 2008). The $1.3 million net amount of the gain and other thanNOTES TO CONSOLIDATED FINANCIAL STATEMENTS (Continued)6. INVESTMENTS IN AND LOANS TO AFFILIATES (Continued)temporary impairment was recorded within equity in loss of affiliates within the Consolidated Statement of Operations during the fourth quarter of fiscal year 2009. On March 28, 2010, the Company entered into an amendment agreement with Yamano in connection with the Exchangeable Note. The amendment revised the redemptions schedule for the 100,000,000 Yen and 211,131,284 Yen payments due September 30, 2013 and 2014, respectively, to March 28, 2010. The amendment was entered into in connection with a preferred share subscription agreement dated March 29, 2010 between the Company and Yamano. Under the preferred share subscription agreement, Yamano issued and the Company purchased one share of Yamano Class A Preferred Stock with a subscription amount of $1.1 million (100,000,000 Yen) and one share of Yamano Class B Preferred Stock with a subscription amount of $2.3 million (211,131,284 Yen), collectively the "Preferred Shares". The portions of the Exchangeable Note that became due as of March 28, 2010 were contributed in-kind as payment for the Preferred Shares. The Preferred Shares have the same terms and rights, yield a 5.0 percent dividend that accrues if not paid and have no voting rights. The Company determined that the March 2010 modifications were minor and the loan modification should not be treated as an extinguishment. The preferred shares will be accounted for as an available for sale debt security. Due to the natural disasters in Japan that occurred in March 2011, the Company was required to assess the preferred shares and premium for other than temporary impairment. The fair value of the collateral which is the equity value of MY Style, declined due to changes in projected revenue growth rates after the natural disasters. As MY Style is highly leveraged, any change in growth rates has a significant impact on fair value. The estimated fair value was negligible as of March 31, 2011. The Company recorded an other than temporary impairment during the third quarter of fiscal year 2011 for the carrying value of the preferred shares and premium of $3.9 million (326,700,000 Yen) and $5.3 million (435,000,000 Yen), respectively. As of June 30, 2011, the principal amount outstanding under the Exchangeable Note is $2.5 million (200,000,000 Yen). Principal payments of 100,000,000 Yen are due annually on September 30 through September 30, 2012. The Company reviews the Exchangeable Note with Yamano for changes in circumstances or the occurrence of events that suggest the Company's note may not be recoverable. The $2.5 million outstanding Exchangeable Note with Yamano as of June 30, 2011 is in good standing with no associated valuation allowance. The Company has determined the future cash flows of Yamano support the ability to make payments on the Exchangeable Note. The Exchangeable Note accrues interest at 1.845 percent and interest is payable on September 30, 2012 with the final principal payment. The Company recorded approximately $0.1 million in interest income related to the Exchangeable Note during fiscal years 2011, 2010, and 2009. MY Style Note. As of June 30, 2011, the principal amount outstanding under the MY Style Note is $1.3 million (104,328,000 Yen). Principal payments of 52,164,000 Yen along with accrued interest are due annually on May 31 through May 31, 2013. The Company reviews the outstanding note with MY Style, for changes in circumstances or the occurrence of events that suggest the Company's note may not be recoverable. The $1.3 million outstanding note with MY Style as of June 30, 2011 is in good standing with no associated valuation allowance. The Company has determined the future cash flows of MY Style support the ability to make payments on the outstanding note. The MY Style Note accrues interest at 3.0 percent.which matured during fiscal year 2013. The Company recorded less than $0.1 million in interest income related to the MY Style Notenote during fiscal years 2011, 2010,2013 and 2009.NOTES TO CONSOLIDATED FINANCIAL STATEMENTS (Continued)6. INVESTMENTS IN AND LOANS TO AFFILIATES (Continued) As of June 30,$1.9 and $2.2 million are recorded in the Consolidated Balance Sheet as current assets and investment in and loans to affiliates, respectively, representingCompany had estimated the Company's Exchangeable Note and outstanding note with MY Style. The exposure to loss related to the Company's involvement with MY Style is the carrying valuefair values of the outstanding notes. All foreign currency transaction gainsYamano Class A and lossesClass B Preferred Stock to be negligible and recorded an other than temporary non-cash impairment. The Company reported the gain associated with Yamano's redemption within equity in loss of affiliated companies on the Exchangeable Note and MY Style Note are recorded through other income within the Consolidated Statement of Operations. The foreign currency transaction (loss) gain was $(1.1), $3.1, and $2.1 million during fiscal years 2011, 2010, and 2009, respectively.Investment in Hair Club for Men, Ltd. The Company acquired a 50.0 percent interest in Hair Club for Men, Ltd. through its acquisition of Hair Club in fiscal year 2005. The Company accounts for its investment in Hair Club for Men, Ltd. under the equity method of accounting. Hair Club for Men, Ltd. operates Hair Club centers in Illinois and Wisconsin. During fiscal years 2011, 2010, and 2009, the Company recorded income and received dividends of $0.6 and $1.1 million, $0.9 and $1.3 million, and $0.6 and $0.9 million, respectively. The exposure to loss related to the Company's involvement with Hair Club for Men, Ltd. is the carrying value of the investment.7. The fairmeasurement guidance for financial and nonfinancial assets and liabilities defines fair value, establishes a framework for measuring fair value and expands disclosure requirements about fair value measurements. This guidance defines fair value as the price that would be received to sell an asset or paid to transfer a liability (an exit price) in the principal or most advantageous market for the asset or liability in an orderly transaction between market participantsmeasurements are categorized into one of three levels based on the measurement date. The fair value hierarchy prescribed by this guidance contains three levels as follows:—Unadjusted (unadjusted quoted prices that are available in active markets for the identical assets or liabilities at the measurement date.—Other observable (observable market inputs available at the measurement date, other than quoted prices included in Level 1, either directly or indirectly, including:•Quoted prices for similar assets or liabilities in active markets;•Quoted prices for identical or similar assets in non-active markets;•Inputs other than quoted prices that are observable for the asset or liability;1); and•Inputs that are derived principally from or corroborated by other observable market data.—Unobservable (unobservable inputs that cannot be corroborated by observable market data and reflect the use of significant management judgment. These values are generally determined using pricing models for which the assumptions utilize management's estimates of market participant assumptions. that are Measured at Fair Value on a Recurring Basis The fair value hierarchy requires the use of observable market data when available. In instances in which the inputs used to measure fair value fall into different levels of the fair value hierarchy, the fairNOTES TO CONSOLIDATED FINANCIAL STATEMENTS (Continued)7. FAIR VALUE MEASUREMENTS (Continued)value measurement has been determined based on the lowest level input that is significant to the fair value measurement in its entirety. The Company's assessment of the significance of a particular item to the fair value measurement in its entirety requires judgment, including the consideration of inputs specific to the asset or liability. The following tables sets forth by level within the fair value hierarchy, the Company's financial assets and liabilities that were accounted for at fair value on a recurring basis at June 30, 2011 and June 30, 2010, according to the valuation techniques the Company used to determine their fair values. Fair Value Measurements
Using Inputs Considered as Fair Value at
June 30, 2011 Level 1 Level 2 Level 3 (Dollars in thousands) $ 212 $ — $ 212 $ — $ 599 $ — $ 599 $ — $ 22,700 $ — $ — $ 22,700 Fair Value Measurements
Using Inputs Considered as Fair Value at
June 30, 2010 Level 1 Level 2 Level 3 (Dollars in thousands) $ 274 $ — $ 274 $ — 3,502 — — 3,502 $ 401 $ — $ 401 $ — $ 1,039 $ — $ 1,039 $ — 22,009 — — 22,009 NOTES TO CONSOLIDATED FINANCIAL STATEMENTS (Continued)7. FAIR VALUE MEASUREMENTS (Continued)Changes in Financial Instruments Measured at Level 3 Fair Value on a Recurring Basis following tables present the changes during the twelve ended June 30, 2011 and 2010 in our Level 3 financial instruments that are measured at fair value on a recurring basis. Changes in Financial Instruments
Measured at Level 3 Fair Value
Classified as Preferred Shares Equity Put Option (Dollars in thousands) $ 3,502 $ 22,009 433 3,847 — (2,442 ) — (714 ) (3,935 ) — $ — $ 22,700 Changes in Financial Instruments
Measured at Level 3 Fair Value
Classified as Preferred Shares Equity Put Option (Dollars in thousands) $ — $ 24,161 3,362 — 140 (2,620 ) — 468 $ 3,502 $ 22,009 The following methods and assumptions were used to estimate the fair value of each class of financial instrument: Derivative instruments. The Company's derivative instrument assets and liabilities consist of cash flow hedges represented by interest rate swaps and forward foreign currency contracts. The instruments are classified as Level 2 as the fair value is obtained using observable inputs available for similar liabilities in active markets at the measurement date that are reviewed by the Company. See breakout by type of contract and reconciliation to the balance sheet line item that each contract is classified within Note 9 of the Consolidated Financial Statements. Equity put option. The Company's merger of the European franchise salon operations with the operations of the Franck Provost Salon Group on January 31, 2008 contained an equity put and an equity call. In March 2011, a portion of the equity put option was settled. See further discussion within Note 6 to the Consolidated Financial Statements. The equity put option is valued using binomial lattice models that incorporate assumptions including the business enterprise value at that date and future estimates of volatility and earnings before interest, taxes, and depreciation and amortization multiples.NOTES TO CONSOLIDATED FINANCIAL STATEMENTS (Continued)7. FAIR VALUE MEASUREMENTS (Continued)At June 30, 2011, the fair value of the equity put option was $22.7 million and is classified within other noncurrent liabilities on the balance sheet. Preferred Shares. The Company has preferred shares in Yamano Holding Corporation. The preferred shares are classified as Level 3 as there are no quoted market prices and minimal market participant data for preferred shares of similar rating. The preferred shares are classified within investment in and loans to affiliates on the Consolidated Balance Sheet. The fair value of the preferred shares is based on the financial health of Yamano Holding Corporation and terms within the preferred share agreement which allow the Company to convert the subscription amount of the preferred shares into equity of MY Style, a wholly owned subsidiary of Yamano Holding Corporation. The Company recorded an other than temporary impairment for the full carrying value of the preferred shares during the twelve months ended June 30, 2011. See further discussion within Note 6 to the Consolidated Financial Statements. Financial Instruments. In addition to the financial instruments listed above, the Company's financial instruments also include cash, cash equivalents, receivables, accounts payable and debt.valuevalues of cash and cash equivalents, receivables, and accounts payable and debt approximated the carrying values as of June 30, 2011 and 2010. At June 30, 2011, the estimated fair values and carrying amounts of debt were $335.4 and $313.4 million, respectively. At June 30, 2010, the estimated fair values and carrying amounts of debt were $458.6 and $440.0 million, respectively. The estimated fair value of debt was determined based on internal valuation models, which utilize quoted market prices and interest rates for the same or similar instruments.Company'sCompany’s equity method investments, tangible fixed and other assets and goodwill, at fair value on a nonrecurring basis when they are deemed to be other than temporarily impaired. The fair values of ourthe Company’s investments are determined based on valuation techniques using the best information available, and may include quoted market prices, market comparables, and discounted cash flow projections. The following tables present the fair value in our assets measured at fair value on a nonrecurring basis during the twelve months ended June 30, 2011 and 2010, respectively: June 30,
2011 Level 1 Level 2 Level 3 Total Losses (Dollars in thousands) $ 240,910 $ — $ — $ 240,910 $ (74,100 ) $ 240,910 $ — $ — $ 240,910 $ (74,100 ) (1)GoodwillNOTES TO CONSOLIDATED FINANCIAL STATEMENTS (Continued)PromenadeRegis salon concept reporting unit with a carrying value of $315.0$34.9 million was written down to its implied fair value of zero, resulting in ana non-cash impairment charge of $74.1 million, which was recorded during$34.9 million. See Notes 1 and 4 to the Consolidated Financial Statements.2011. The Company recorded $0.3 million ofNOTES TO CONSOLIDATED FINANCIAL STATEMENTS (Continued)7. FAIR VALUE MEASUREMENTS (Continued)translation rate adjustments during2013, the fourth quarter of fiscal year 2011 on the Promenade salon concept goodwill balance. June 30,
2010 Level 1 Level 2 Level 3 Total Losses (Dollars in thousands) $ 102,180 $ — $ — $ 102,180 $ (35,277 ) $ 102,180 $ — $ — $ 102,180 $ (35,277 )
Consolidated Financial Statements.(1)Goodwill of the Regis salon conceptCompany's investment in EEG with a carrying value of $136.6$59.9 million was written down to its implied fair value of $42.0 million, resulting in an impairment charge of $35.3 million, which was recorded during fiscal year 2010. The Company recorded $0.8 million of translation rate adjustments during$17.9 million. See Note 5 to the fourth quarter of fiscal year 2010 on the Regis salon concept goodwill balance.8.as of June 30, 2011 and 2010 consists of the following: Interest rate % Amounts outstanding Maturity
Dates
(fiscal year) Interest rate % 2011 2010 2011 2010 Fiscal Years June 30, (Dollars in thousands) Maturity Dates 2014 2013 2014 2013 (fiscal year) (Dollars in thousands) (2) 2015 5.00% 5.00% $ 172,246 $ 166,454 2013 - 2018 6.69 - 8.50 % 5.65 - 8.39 % $ 133,571 $ 174,107 2018 5.75 — 120,000 — (2) 2015 5.00 5.00 156,248 151,760 2011 — 2.86 — 85,000 2016 — — — — 2018 — — — — 2015 - 2016 8.80 - 9.14 8.93 - 9.35 22,273 27,473 2015 - 2016 4.90 - 8.75 4.90 - 8.75 1,257 8,316 2012 - 2013 5.75 - 8.00 3.00 - 8.00 1,319 1,689 293,503 174,770 313,411 440,029 (32,252 ) (51,629 ) Less current portion (1) (173,501 ) (173,515 ) $ 281,159 $ 388,400 $ 120,002 $ 1,255 (1) As of June 30, 2013, the Company included the convertible senior notes within long-term debt, current portion on the Consolidated Balance Sheet as the holders of the senior convertible notes had the option to convert at any time after April 15, 2014. (2) In July 2014, the Company settled the convertible senior notes with $172.5 million in cash. ratios, as well as minimum net worth levels. We wereratios. The Company was in compliance with all covenants and other requirements of our financing arrangements as of June 30, 2011. Additional details are included below with the discussion of the specific categories of debt.2014.NOTES TO CONSOLIDATED FINANCIAL STATEMENTS (Continued)8. FINANCING ARRANGEMENTS (Continued)$22.3$1.3 million at June 30, 2011,2014, are as follows: (Dollars in thousands) (Dollars in thousands) $ 32,252 29,091 178,200 19,959 $ 173,501 18,195 2 2017 — 2018 120,000 2019 — 35,714 — $ 293,503 $ 313,411 Senior Term NotesPrivate Shelf Agreement At June 30, 2011 and 2010, the Company had $133.6 and $174.1 million, respectively, in unsecured, fixed rate, senior term notes outstanding under a Private Shelf Agreement, of which $22.1 and $40.5 million were classified as part of the current portion of the Company's long-term debt at June 30, 2011 and 2010, respectively. The notes require quarterly payments, and final maturity dates range from June 2013 through December 2017. The Private Shelf Agreement includes financial covenants including debt to EBITDA ratios, fixed charge coverage ratios and minimum net equity tests (as defined within the Private Shelf Agreement), as well as other customary terms and conditions. The maturity date for the debt may be accelerated upon the occurrence of various events of default, including breaches of the agreement, certain cross-default situations, certain bankruptcy related situations, and other customary events of default. In July 2009, the Company amended the Restated Private Shelf Agreement. The amendments included increasing the Company's minimum net worth covenant from $675.0 to $800.0 million, lowering the fixed charge coverage ratio requirement from 1.5x to 1.3x, amending certain definitions, including EBITDA and Fixed Charges, limiting the Company's restricted payments to $20.0 million if the Company's leverage ratio is greater than 2.0x and the addition of a risk based capital fee calculated on the daily average outstanding principal amount equal to an annual rate of 1.0 percent that commences one year after the amendment date. During fiscal year 2010, the net proceeds from the convertible senior notes and common stock issuances in July 2009 were utilized in part to repay $30.0 million of senior term notes under the Restated Private Shelf Agreement.Private Placement Senior Term Notes At June 30, 2011, the Company did not have any outstanding private placement senior term notes. On June 29, 2009, the Company entered into a prepayment amendment on the private placement senior term notes whereby the Company negotiated to prepay the notes with a premium over the principal amount that is less than the make-whole premium that is otherwise payable upon redemption. During fiscal year 2010, the net proceeds from the convertible senior notes and common stock issuances in July 2009 were utilized to repay the $267.0 million of private placement senior term notesNOTES TO CONSOLIDATED FINANCIAL STATEMENTS (Continued)8. FINANCING ARRANGEMENTS (Continued)of varying maturities and $30.0 million of additional senior term notes under a Private Shelf Agreement. As a result of the repayment of a portion of the senior term notes during the twelve months ended June 30, 2010, the Company incurred $12.8 million in make-whole payments and other fees along with $5.2 million in interest rate swap settlements, as discussed in Note 9 of the Consolidated Financial Statements, totaling $18.0 million that was recorded as interest expense within the Consolidated Statement of Operations.5.0 percent5.0% convertible senior notes due July 2014. The notes arewere unsecured, senior obligations of the Company and interest will bewas payable semi-annually in arrears on January 15 and July 15 of each year at a rate of 5.0 percent5.0% per year. TheAs of June 30, 2014, the notes will bewere convertible subject to certain conditions further described below at an initiala conversion64.672665.6019 shares of the Company's common stock per $1,000 principal amount of notes, (representing an initialrepresenting a conversion price of approximately $15.46$15.24 per share of the Company's common stock). Asstock.June 30, 2011,issuance, the conversion rate was 64.8263 shares of the Company's common stock per $1,000 principal amount of notes (representing a conversion price of approximately $15.43 per share of the Company's common stock). Holders may convert their notes at their option prior to April 15, 2014 if the Company's stock price meets certain price triggers or upon the occurrence of specified corporate events as defined in the convertible senior note agreement. On or after April 15, 2014, holders may convert each of their notes at their option at any time prior to the maturity date for the notes. The Company hashad the choice of net-cash settlement, settlement in its own shares or a combination thereof and concluded the conversion option iswas indexed to its own stock. As a result, in July 2009 the Company allocated $24.7 million of the $172.5 million principal amount of the convertible senior notes to equity, which resulted in a $24.7 million debt discount. The allocation was based on measuring the fair value of the convertible senior notes using a discounted cash flow analysis. The discount rate was based on an estimated credit rating for the Company. In July 2009, the estimated fair value of the convertible senior notes was $147.8 million. The resulting $24.7 million debt discount will bewas amortized over the period the convertible senior notes arewere expected to be outstanding, which iswas five years, as additional non-cash interest expense. The combined debt discount amortization and the contractual interest coupon resulted in an effective interest rate on the convertible debt of 8.9 percent. Convertible Senior Notes
Due 2014 at June 30, 2011 June 30, 2010 June 30, 2014 2013 (Dollars in thousands) $ 172,500 $ 172,500 $ 172,500 $ 172,500 (16,252 ) (20,740 ) (254 ) (6,046 ) $ 156,248 $ 151,760 $ 172,246 $ 166,454 NOTES TO CONSOLIDATED FINANCIAL STATEMENTS (Continued)8. FINANCING ARRANGEMENTS (Continued) Convertible Senior Notes Due
2014 Twelve Months Ended June 30, 2011 June 30, 2010 Fiscal Years 2014 2013 (Dollars in thousands) $ 8,625 $ 8,266 $ 8,625 $ 8,625 4,488 3,956 5,792 5,320 $ 13,113 $ 12,222 $ 14,417 $ 13,945 connection with the convertible senior note offering,November 2013, the Company issued 13,225,000 shares$120.0 million aggregate principal amount of common stock resulting5.75% senior unsecured notes due December 2017 (Senior Term Notes). Net proceeds from the issuance of the Senior Term Notes were $118.1 million. Interest on the Senior Term Notes is payable semi-annually in net proceedsarrears on June 1 and December 1 of $163.5 million.LoanCompany had a term loanSenior Term Notes are unsecured and not guaranteed by any of the Company's subsidiaries or any third party.monthly interest payments based on a one-month LIBOR plus 2.25 percent. In June 2011,affiliates, none of which are more restrictive than those under the Company repaid the outstanding term loan totaling $85.0 million. On June 30, 2011, theamended its revolving credit agreement which now provides forhas a $400.0 million senior unsecured five-year revolving credit facility.facility agreement, that expires in June 2018. The revolving credit facility has rates tied to a LIBOR plus 145 basis points as of June 30, 2011. The revolving credit facility requiresspread and a quarterly facility fee on the average daily amount of the facility (whether used or unused) calculated at a rate of 30 basis points as of June 30, 2011.. Both the LIBOR credit spread and the facility fee are based on the Company's debt to EBITDA ratio at the end of each fiscal quarter. The amendments included increasing the Company's minimum net worth covenant from $800.0 to $850.0 million, and amending or adding certain definitions, including Change in Law, Defaulting Lender, EBITDA, Fronting Exposure, Replacement Lender, and Accounting Principles. In addition, the Company may request an increase in revolving credit commitments under the facility of up to $200.0 million under certain circumstances. Under the new agreement, indebtedness related to Capital Leases is limited to $50.0 million, and Restricted Payments are tiered based on Debt to EBITDA. Events of default under the Credit Agreementcredit agreement include change of control of the Company and the Company's default ofwith respect to other debt exceeding $10.0 million. The facility expires in July 2016. We were in compliance with all covenants and other requirements of our credit agreement and senior notes as of June 30, 2011.20112014 and 2010,2013, the Company had no outstanding borrowings under this revolving credit facility. Additionally, the Company had outstanding standby letters of credit under the revolving credit facility of $26.0 and $24.6$2.2 million at June 30, 20112014 and 2010,2013, respectively, primarily related to its self-insurance program. Unused available credit under the facility at June 30, 20112014 and 20102013 was $374.0 and $275.4$397.8 million, respectively.obligations which are payable in monthly installments through fiscalobligations. In September 2011, the Company entered into an agreement to refinance existing capital leases to a three year 2016. The capital lease obligations are collateralized by the assets purchased under the agreement.Other Notes Payable The Company had $1.3 and $1.7 million in unsecured outstanding notes at June 30, 2011 and 2010, respectively, related to debt assumed in acquisitions.9. DERIVATIVE FINANCIAL INSTRUMENTS The Company's primary market risk exposures innormal coursecapital lease balance was $1.3 million and will be amortized at the historical rate of business are changes in interest rates and foreign currency exchange rates. The Company has established policies and procedures that govern the management of these exposures through the use of a variety of strategies, including the use of derivative financial instrument contracts. By policy, the Company does not enter into such contracts for the purpose of speculation or trading. Hedging transactions are limited to an underlying exposure. The Company has established an interest rate management policy that manages the interest rate mix of its total debt portfolio and related overall cost of borrowing. The Company's foreign currency exchange rate risk management policy includes frequently monitoring market data and external factors that may influence exchange rate fluctuations in order to minimize fluctuation in earnings due to changes in exchange rates. The Company enters into arrangements with counterparties that the Company believes are creditworthy. Generally, derivative contract arrangements settle on a net basis. The Company assesses the effectiveness of its hedges on a quarterly basis using the critical terms method in accordance with guidance for accounting for derivative instruments and hedging activities. The Company has primarily utilized derivatives which are designated as either cash flow or fair value hedges and qualify for hedge accounting treatment. For cash flow hedges and fair value hedges, changes in fair value are deferred in accumulated other comprehensive income (loss) within shareholders' equity until the underlying hedged item is recognized in earnings. Any hedge ineffectiveness is recognized immediately in current earnings. To the extent the changes offset, the hedge is effective. Any hedge ineffectiveness the Company has historically experienced has not been material. By policy, the Company designs its derivative instruments to be effective as hedges and aims to minimize fluctuations in earnings due to market risk exposures. If a derivative instrument is terminated prior to its contract date, the Company continues to defer the related9.2%. There was no gain or loss and recognizes it in current earnings overrecorded on the remaining liferefinance. The Company entered into the refinancing to reduce cash interest payments.related hedged item. Theprepayment, the Company also utilizes freestanding derivative contracts which do not qualify for hedge accounting treatment. The Company marks to market such derivatives with the resulting gains and lossesincurred a make-whole payment of $10.6 million that was recorded in interest expense within current earnings in the Consolidated Statement of Operations. For purposes of the Consolidated Statement of Cash Flows, cash flows associated with all derivatives (designated as hedges or freestanding economic hedges) are classified in the same category as the related cash flows subject to the hedging relationship.Cash Flow Hedges As of June 30, 2011, the Company's cash flow hedges consist of forward foreign currency contracts. In the past, the Company used interest rate swaps to maintain its variable to fixed rate debt ratio in accordance with its established policy. repaid variable and fixed rate debt during the twelve months ended June 30, 2011. Prior to the repayments, the Company had two outstanding interest rate swaps totaling $40.0 million on $85.0 million aggregate variable rate debt with maturity dates in fiscal year 2012. The interest rate swaps were terminated prior to the maturity dates in conjunction with the repayments of debt and were settled for an aggregate loss of $0.1 million. The $0.1 million loss was recorded during the fourth quarter of fiscal year 2011 on the termination of the interest rate swaps and was recorded within interest expense in the Consolidated Statement of Operations. The Company repaid variable and fixed rate debt during the twelve months ended June 30, 2010. Prior to the repayments, the Company had two outstanding interest rate swaps totaling $50.0 million on $100.0 million aggregate variable rate debt with maturity dates between fiscal years 2013 and 2015. TheNOTES TO CONSOLIDATED FINANCIAL STATEMENTS (Continued)9. DERIVATIVE FINANCIAL INSTRUMENTS (Continued)interest rate swaps were terminated prior to the maturity dates in conjunction with the repayments of debt and were settled for an aggregate loss of $5.2 million. The $5.2 million loss recorded during the first quarter of fiscal year 2010 on the termination of the interest rate swaps was recorded within interest expense in the Consolidated Statement of Operations as described in Note 8 to the Consolidated Financial Statements. The Company also had two outstanding treasury lock agreements with maturity dates between fiscal years 2013 and 2015. The treasury lock agreements were terminated prior to the maturity dates in conjunction with the repayments of debt and were settled for a loss of less than $0.1 million during the twelve months ended June 30, 2010 and recorded within interest expense in the Consolidated Statement of Operations. The Company uses forward foreign currency contracts to manage foreign currency rate fluctuations associated with certain forecasted intercompany transactions. The Company's primary forward foreign currency contracts hedge approximately $0.6 million of monthly payments in Canadian dollars for intercompany transactions. The Company's forward foreign currency contracts hedge transactions through September 2012. These cash flow hedges were designed and are effective as cash flow hedges. They were recorded at fair value within other noncurrent liabilities or other current assets in the Consolidated Balance Sheet, with corresponding offsets primarily recorded in other comprehensive income (loss), net of tax.Fair Value Hedges In the past, the Company had two interest rate swaps designated as fair value hedges. The Company paid variable rates of interest and received fixed rates of interest under these contracts. The contracts and related debt matured during the twelve months ended June 30, 2009.Freestanding Derivative Forward Contracts The Company uses freestanding derivative forward contracts to offset the Company's exposure to the change in fair value of certain foreign currency denominated investments and intercompany assets and liabilities. These derivatives are not designated as hedges and therefore, changes in the fair value of these forward contracts are recognized currently in earnings, thereby offsetting the current earnings effect of the related foreign currency denominated assets and liabilities. In November 2009, the Company terminated its freestanding derivative contract on its remaining payments on the MY Style Note and recorded a gain of $0.7 million. The contract was settled in cash, discounted to present value. Gains and losses over the life of the contract were recognized in earnings in conjunction with marking the contract to fair value. A net loss of $0.2 million was recognized during fiscal year 2010.NOTES TO CONSOLIDATED FINANCIAL STATEMENTS (Continued)9. DERIVATIVE FINANCIAL INSTRUMENTS (Continued) The Company had the following derivative instruments in its Consolidated Balance Sheet as of June 30, 2011 and 2010: Asset Liability Fair Value Fair Value Classification June 30,
2011 June 30,
2010 Classification June 30,
2011 June 30,
2010 (In thousands) (In thousands) — $ — $ — Other noncurrent liabilities $ — $ (1,039 ) Other current assets $ — $ 274 Other current liabilities $ (599 ) $ — Other current assets $ 212 $ — Other current liabilities $ — $ (401 ) $ 212 $ 274 $ (599 ) $ (1,440 ) The table below sets forth the (gain) or loss on the Company's derivative instruments recorded within accumulated other comprehensive income (AOCI) in the Consolidated Balance Sheet for the twelve months ended June 30, 2011 and 2010. The table also sets forth the (gain) or loss on the Company's derivative instruments that has been reclassified from AOCI into current earnings during the twelve months ended June 30, 2011 and 2010 within the following line items in the Consolidated Statement of Operations. (Gain) Loss Recognized in
Other Comprehensive Income
Twelve Months Ended June 30, (Gain) Loss Reclassified from
Accumulated OCI into
Income (Loss) at June 30, 2011 2010 2009 Classification 2011 2010 2009 (In thousands) (In thousands) $ (636 ) $ (2,967 ) $ (2,732 ) — $ — $ — $ — 456 519 (495 ) Cost of sales 48 (261 ) (142 ) — (146 ) 41 Interest income — 388 (25 ) $ (180 ) $ (2,594 ) $ (3,186 ) $ 48 $ 127 $ (167 ) As of June 30, 2011 the Company estimates that it will reclassify into earnings during the next twelve months a gain of $0.6 million from the pretax amount recorded in AOCI as the anticipated cash flows occur.NOTES TO CONSOLIDATED FINANCIAL STATEMENTS (Continued)9. DERIVATIVE FINANCIAL INSTRUMENTS (Continued) The table below sets forth the gain or (loss) on the Company's derivative instruments for the years ended June 30, 2011 and 2010 recorded within interest income and other, net in the Consolidated Statement of Operations. Derivatives Impact on Income (Loss) at June 30, Classification 2011 2010 2009 (In thousands) Interest income and other, net $ — $ — $ 335 Interest income and other, net $ 613 $ (811 ) $ 1,147 $ 613 $ (811 ) $ 1,482 10. COMMITMENTS AND CONTINGENCIES:Operating Leases: The Company is committed under long-term operating leases for the rental of most of its company-owned salonsalons and hair restoration center locations.some of its corporate facilities and distribution centers under operating leases. The original terms of the salon leases range from one to 20 years, with many leases renewable for an additional five to ten year termterms at the option of the Company, and certain leases include escalation provisions.Company. For certainmost leases, the Company is required to pay additional rent based on a percent of sales in excess of a predetermined amount and, in most cases, real estate taxes and other occupancy expenses. Rent expense for the Company's international department store salons is based primarily on a percentpercentage of sales. the franchisees. These leases, generally with terms of approximately five years, are expected to be renewed on expiration. All additional lease costs are passed through to the franchisees. During fiscal year 2005, the Company entered into a lease agreement for a 102,448 square foot building, located in Edina, Minnesota. The Company began to recognize rent expense related to this property during the three months ended September 30, 2005, which was the date that it obtained the legal right to use and control the property. The original lease term ends in May 2016 and the aggregate amount of lease payments to be made over the remaining original lease term are approximately $5.6 million. The lease agreement includes an option to purchase the property or extend the original term for two successive periods of five years. In addition, the Company leases an 89,900 square foot building near the company-owned distribution center located in Chattanooga, Tennessee. The original lease term ends in August 2013 and the aggregate amount of lease payments to be made over the remaining original lease term are approximately $0.5 million$28.4, $29.2,$29.5, $29.1 and $29.9$28.3 million in fiscal years 2011, 20102014, 2013 and 2009,2012, respectively. Rent expense on premises subleased was $27.9, $28.8,$29.1, $28.7 and $29.5$27.9 million in fiscal years 2011, 20102014, 2013 and 2009,2012, respectively. Rent expense and the related rental income on the sublease arrangements with franchisees is netted within the rent expense line item on the ConsolidatedNOTES TO CONSOLIDATED FINANCIAL STATEMENTS (Continued)10. COMMITMENTS AND CONTINGENCIES: (Continued)ten percent10.0% mark-up in its sublease arrangements. The net rental income resulting from such arrangements totaled $0.5 million for fiscal year 2011, and $0.4 million for each fiscal year 20102014, 2013 and 2009,2012 and was classified in the royalties and fees caption of the Consolidated Statement of Operations. Fiscal Years 2011 2010 2009 2014 2013 2012 (Dollars in thousands) (Dollars in thousands) $ 260,644 $ 259,984 $ 260,140 $ 246,687 $ 246,787 $ 250,487 9,225 10,138 11,623 7,164 7,566 8,938 72,417 73,976 76,029 68,254 70,363 72,344 $ 322,105 $ 324,716 $ 331,769 $ 342,286 $ 344,098 $ 347,792 2011,2014, future minimum lease payments (excluding percentage rents based on sales) due under existing noncancelable operating leases with remaining terms of greater than one year are as follows: Corporate
leases Franchisee
leases Guaranteed
leases (Dollars in thousands) $ 266,339 $ 43,549 $ 2,150 216,435 35,135 1,215 164,420 26,686 787 Fiscal Year (Dollars in thousands) 115,048 18,269 552 $ 246,000 $ 52,663 $ 404 68,458 9,871 409 193,779 44,600 310 2017 138,255 34,371 195 2018 90,605 24,387 85 2019 49,327 14,197 34 87,410 7,653 483 51,392 11,392 14 $ 918,110 $ 141,163 $ 5,596 $ 769,358 $ 181,610 $ 1,042 Salon Development Program: As a part of its salon development program, thelocations, and continues to enter into transactions to acquire established hair care salons.NOTES TO CONSOLIDATED FINANCIAL STATEMENTS (Continued)11. LEASE TERMINATION COSTS The Company approved plans in June 2009Litigation and July 2008 to close approximately 80 and 160, respectively, underperforming company-owned salons. As lease settlements were negotiated, the Company found that some lessors were willing to negotiate rent reductions which allowed the Company to keep operating certain salons. As a result, the number of salons closed was less than the amount of salons per the approved plans. For salons that did not receive rent reductions, the Company ceased using the right to use the leased property or negotiated a lease termination agreement with the lessors. Lease termination costs represents either the lease settlement or the net present value of remaining contractual lease payments related to closed salons, reduced by estimated sublease rentals. Lease termination costs from continuing operations are presented as a separate line item in the Consolidated Statement of Operations. The plans are substantially complete. The activity reflected in the accrual for lease termination costs is as follows: For the Twelve
Months Ended
June 30, 2011 2010 (Dollars in thousands) $ 1,386 $ 2,760 — 2,145 (1,059 ) (3,519 ) $ 327 $ 1,386 12. LITIGATIONCompany's counsel believes thatactions are being vigorously defended, the Company has valid defenses in these matters, it could in the future incur judgments or enter into settlements of claims that could have a material adverse effect on its Consolidated Financial Statementsresults of operations in any particular period.2011,2014 and 2013, the Company settled a legal claimincurred $3.3 and $1.2 million of expense in conjunction with the former owner of Hair Club for $1.7 million.2010,2012, the Company settled two legal claims regarding certain customer and employee matters for an aggregate charge of $5.2was awarded $1.1 million plusin conjunction with a commitment to provide discount coupons. Payments aggregating $4.3 and $0.9 million were made during fiscal years 2011 and 2010, respectively. 2011 2010 2009 (Dollars in thousands) $ (31,963 ) $ 35,289 $ 112,524 6,334 17,925 (33,758 ) $ (25,629 ) $ 53,214 $ 78,766 Fiscal Years 2014 2013 2012 (Dollars in thousands) (Loss) income before income taxes: U.S. $ (51,866 ) $ (25,177 ) $ (35,430 ) International (2,462 ) 35,275 10,116 $ (54,328 ) $ 10,098 $ (25,314 ) provision for income taxes consists of: 2011 2010 2009 (Dollars in thousands) $ 3,658 $ 5,580 $ 48,935 1,557 14,882 (3,142 ) (17,882 ) 4,007 568 3,171 1,108 (4,411 ) Fiscal Years $ (9,496 ) $ 25,577 $ 41,950 2014 2013 2012 (Dollars in thousands) Current: U.S. $ 1,460 $ (21,053 ) $ (1,095 ) International 890 707 2,261 Deferred: U.S. 67,992 10,405 (5,519 ) International 787 (83 ) (77 ) $ 71,129 $ (10,024 ) $ (4,430 ) earnings before income taxes, as a result of the following: 2011 2010 2009 (35.0 )% 35.0 % 35.0 % (0.1 ) 3.4 3.4 10.8 11.4 14.5 7.9 (0.8 ) (1.6 ) (15.3 ) (6.4 ) (4.9 ) — 3.9 4.8 (5.4 ) 1.6 2.1 (37.1 )% 48.1 % 53.3 % Fiscal Years 2014 2013 2012 U.S. statutory rate (benefit) (35.0 )% 35.0 % (35.0 )% State income taxes, net of federal income tax benefit (0.2 ) 3.6 3.5 Valuation allowance (1) 160.8 — — Tax effect of goodwill impairment 11.5 — 47.7 Foreign income taxes at other than U.S. rates 1.4 4.1 (0.5 ) Tax effect of foreign currency translation gain — (107.0 ) — Work Opportunity and Welfare-to-Work Tax Credits (5.3 ) (42.8 ) (19.4 ) Other, net (2.3 ) 7.8 (13.8 ) 130.9 % (99.3 )% (17.5 )% For fiscal year 2011, the Company reported a $25.6 million loss from continuing operations before income taxes as compared to income from continuing operations before income taxes of $53.2 and $78.8 million in fiscal years 2010 and 2009, respectively. The rate reconciliation items have a greater impact on the annual effective income tax rate in fiscal year 2011 as the magnitude of the loss from continuing operations before income taxes is less than the magnitude of income from continuing operations before income taxes in fiscal year 2010. The annual effective tax rate was favorably impacted by the employment credits relatedSmall Business and Work Opportunity Tax ActConsolidated Financial Statements.2007. Based upon current legislation, these credits are scheduled to expire on December 31, 2011. Partially offsetting the favorable impact of the employment credits was the adverse impact of the pre-tax non-cash goodwill impairment charge of $74.1 million recorded during the third quarter of fiscal year 2011, which is only partially deductible for tax purposes. Additionally, the foreign income taxes at otherNOTES TO CONSOLIDATED FINANCIAL STATEMENTS (Continued)13. INCOME TAXES (Continued)than U.S. rates adversely impacted the annual effective tax rate due to a decrease in foreign income from continuing operations before income taxes and other foreign non-deductible items. The (5.4) percent of other,Other, net in fiscal year 20112014 does not include the rate impact of any items in excess of 5% of computed tax.2.8, (3.0)4.9%, (3.7)(3.4)%, 5.5% and (1.5) percent,0.8%, respectively. During the2010,2012 includes the Company recorded adjustments to correct its incomerate impact of meals and entertainment expense disallowance, unrecognized tax balances. The adjustments increased the Company's fiscal year 2010 income tax provision by $2.1 millionbenefits and increased its effective income tax rate by 3.9 percent. Included in the income tax provision are U.S.miscellaneous items of 2.1%, (9.1)% and international income tax adjustments resulting in a shift(6.8)%, respectively. June 30, 2011 2010 2014 2013 (Dollars in thousands) (Dollars in thousands) $ 15,233 $ 15,677 $ 12,625 $ 12,953 37,852 34,294 24,857 34,073 1,210 2,106 17,180 2,484 5,176 4,154 Tax credit carryforwards 20,134 4,366 2,968 3,136 2,926 7,920 229 311 1,536 1,581 8,549 10,178 9,855 575 216 7,004 5,669 6,301 6,195 6,106 6,167 5,481 8,815 14,353 Subtotal $ 92,948 $ 89,259 Valuation allowance (83,922 ) — $ 94,444 $ 83,794 $ 9,026 $ 89,259 $ (29,348 ) $ (17,603 ) $ (8,086 ) $ (20,684 ) (94,257 ) (107,392 ) (77,650 ) (72,635 ) (1,942 ) (2,029 ) (6,215 ) (7,937 ) (3 ) — (5,689 ) (7,206 ) $ (131,765 ) $ (134,961 ) $ (91,425 ) $ (100,525 ) $ (37,321 ) $ (51,167 ) Net deferred tax (liability) asset $ (82,399 ) $ (11,266 ) NOTES TO CONSOLIDATED FINANCIAL STATEMENTS (Continued)13. INCOME TAXES (Continued)2011,2014, the Company hadhas tax effected federal, state and foreignU.K. net operating loss carryforwards of approximately $12.4, $3.7 and $1.1 million, respectively. The federal loss carryforward expires in 2034. The state loss carryforwards expire from 2016 to 2034. The U.K. loss carryforward has no expiration.and $8.4that will expire from 2031 to 2034. The remaining $1.5 million respectively. These losses relate to various states, the U.K., Netherlands, and Luxembourg. The Companycarryforward has recorded a valuation allowance of $7.5 million relating to losses in the Netherlands and Luxembourg. The Company expects to fully utilize all of the loss carryforwards for which a valuation allowance has not been established. At June 30, 2010, the Company had set up a valuation allowance of $1.0 million relating to the Netherlands tax losses. The valuation allowance increase of $6.5 million is due to additional tax losses in the Netherlands and Luxemborg.2011,2014, undistributed earnings of international subsidiaries of approximately $42.3$23.7 million were considered to have been reinvested indefinitely and, accordingly, the Company has not provided for U.S. income taxes on such earnings.U.S,U.S., Canada, the U.K., and Luxembourg and the Netherlands as well as states, cities, and provinces within these jurisdictions. In the U.S,U.S., fiscal years 20072010 and afterbeyond remain open for federal tax audit. The Company's U.S. federal income tax returns for the fiscal years 2007 through 20092010 and 2011 are currently under audit.examination by the Internal Revenue Service (IRS). The IRS has identified certain issues that may result in audit adjustments. The Company is reviewing the issues identified to date. In anticipation of resolution of the issues identified, the Company made a payment of $9.5 million to the IRS during the fourth quarter ended June 30, 2014. The majority of the amount paid relates to timing differences and will be recovered by claiming future tax deductions and by receiving a benefit when the Company's U.S. deferred tax asset valuation allowance is reversed. Final resolution of these issues is not expected to have a material impact on the Company’s financial statements. The Company is currently under audit in a number of states in which the statute of limitations has been extended for fiscal years 2007 and forward. For state tax audits, the statute of limitations generally spans three to four years, resulting in a number of states remaining open for tax audits dating back to fiscal year 2007. However, the company is under audit in a number of states in which the statute of limitations has been extended for fiscal years 2000 and forward.2009. Internationally, (including Canada),including Canada, the statute of limitations for tax audits varies by jurisdiction, but generally ranges from three to five years. Fiscal Years 2014 2013 2012 2011 2010 2009 (Dollars in thousands) $ 16,856 $ 14,787 $ 20,400 $ 10,015 $ 4,381 $ 13,493 796 5,549 2,765 (759 ) (185 ) 121 (2,718 ) (2,993 ) (8,167 ) (Reductions)/additions based on tax positions related to the current year (2,114 ) 44 482 (Reductions)/additions based on tax positions of prior years (505 ) 7,132 (7 ) Reductions on tax positions related to the expiration of the statute of limitations (994 ) (1,403 ) (1,571 ) (682 ) (302 ) (332 ) (4,934 ) (139 ) (8,016 ) $ 13,493 $ 16,856 $ 14,787 $ 1,468 $ 10,015 $ 4,381 $6.0$1 million of the $13.5 million reserve would benefitbe recorded in the effective tax rate. Interest and penalties associated with unrecognized tax benefits are recorded within income tax expense. During the fiscal years ended June 30, 2011, 20102014, 2013 and 20092012, we recorded income tax (benefit) expenseinterest and penalties of approximately $(0.6), $(1.1),$0.1, $0.7 and $2.1$(1.2) million, respectively, foras additions to the accrual net of the respective reversal of previously accrued interest and penalties. As of June 30, 2011,2014, the Company had accrued interest and penalties related to unrecognized tax benefits of $2.7$1.1 million. This amount is not included in the gross unrecognized tax benefits noted above.twelve months.fiscal year. However, we do not expectan estimate of the amount or range of the change to have a significant effect on our results of operations or our financial position.cannot be made at this time.NOTES TO CONSOLIDATED FINANCIAL STATEMENTS (Continued)14.Plancontributedcontribution 401(k) plan, the Regis Retirement Savings Plan (the RRSP)(RRSP). The RRSP is a defined contribution profit sharing plan with a 401(k) feature that is intended to qualify withunder Section 401(a) of the Internal Revenue Code (Code) and is subject to the Employee Retirement Income Security Act of 1974.PlanRRSP is a contributory defined contribution plancash or deferred arrangement intended to qualify under section 401(k) of the Code and under which eligible employees may elect to contribute a percentage of their eligible compensation. Employees who are 18 years of age or older and who were not highly compensated employees as defined by the Code during the preceding PlanRRSP year are eligible to participate in the PlanRRSP commencing with the first day of the month following their completion of one month of service.PlanRRSP is a noncontributory defined contribution component covering full-time and part-time employees of the Company who have at least one year of eligible service, defined as 1,000 hours of service during the PlanRRSP year, are employed by the EmployerCompany on the last day of the PlanRRSP year and are employed at the home office orSalon Support, distribution centers, or as area or regional supervisors,field leaders, artistic directors or educators,consultants, and that are not highly compensated employees as defined by the Code. Participants' interest in the noncontributory defined contribution component become 20.0 percent20.0% vested after completing two years of service with vesting increasing 20.0 percent20.0% for each additional year of service, and with participants becoming fully vested after six full years of service.field supervisors, warehouse and corporate officeall other employees who are highly compensated.compensated as defined by the Code. The discretionary employer contribution profit sharing portion of the Executive Plan is a noncontributory defined contributionprofit sharing component in which a participants interest become 20.0 percentbecomes 20.0% vested after completing two years of service with vesting increasing 20.0 percent20.0% for each additional year of service, and with participants becoming fully vested after six full years of service.substantially allqualifying employees. Under the terms of the ESPP, eligible employees may purchase the Company's common stock through payroll deductions. The Company contributes an amount equal to 15.0 percent15.0% of the purchase price of the stock to be purchased on the open market and pays all expenses of the ESPP and its administration, not to exceed an aggregate contribution of $10.0$11.8 million. As of June 30, 2011,2014, the Company's cumulative contributions to the ESPP totaled $8.5$9.6 million.Franchise Stock Purchase Plan:a franchise stock purchase plan (FSPP) availableunfunded deferred compensation contracts covering certain current and former key executives. Prior to substantially all franchisee employees. Under the terms of the plan, eligible franchisees and their employees may purchase the Company's common stock. The Company contributes an amount equal to five percent of the purchase price of the stock to be purchasedJune 30, 2012, deferred compensation benefits were based on the open marketexecutive's years of service and pays all expenses ofcompensation for the plan60 months preceding the executive's termination date. Effective June 30, 2012, these contracts were amended and its administration, not to exceed an aggregate contribution of $0.7 million. Asthe benefits were frozen as of June 30, 2011,2012.Company's cumulative contributions todeferred compensation contracts included in general and administrative expenses on the FSPPConsolidated Statement of Operations totaled $0.2 million.$0.9, $1.6 and $5.9 million for fiscal years 2014, 2013 and 2012, respectively.TableThe table below presents the projected benefit obligation of ContentsNOTES TO CONSOLIDATED FINANCIAL STATEMENTS (Continued)14. BENEFIT PLANS (Continued)Deferred Compensation Contracts: June 30, 2014 2013 (Dollars in thousands) Current portion (included in Accrued liabilities) $ 2,913 $ 3,532 Long-term portion (included in Other noncurrent liabilities) 7,677 9,446 $ 10,590 $ 12,978 hashad previously agreed to pay the Chief Executive Officer, commencing upon his retirement,former Vice Chairman an annual amount equal to 60.0 percent of his salary,$0.6 million, adjusted for inflation to $0.9 million in fiscal years 2014 and 2013, for the remainder of his life. Additionally, the Company has a survivor benefit plan payable upon his deathfor the former Vice Chairman's spouse at a rate of one half of his deferred compensation benefit, adjusted for inflation, for the remaining life of his spouse. In addition,October 2013, the former Vice Chairman passed away and the Company has other unfunded deferred compensation contracts covering key executives withinbegan paying survivor benefits to his spouse. At this time, the Company. The key executives'Company reduced the accrual for future obligations to account for the reduction in benefits are based on yearsto the survivor. In connection with the passing of service and the employee's compensation prior to departure.former Vice Chairman, the Company received $5.8 million in life insurance proceeds. The Company utilizesrecorded a June 30 measurement date for these deferred compensation contracts, a discount rate based on the Aa Bond index rate (5.5 and 5.4 percent at June 30, 2011 and 2010, respectively) and projected salary increasesgain of 4.0 percent at June 30, 2011 and 2010 to estimate the obligations associated with these deferred compensation contracts. Compensation associated with these agreements is charged to expense as services are provided. Associated costs included$1.0 million recorded in general and administrative expenses onin the Consolidated Statement of Operations totaled $4.3, $5.2, and $3.7 million for fiscal years 2011, 2010, and 2009, respectively. The accrued liability and projected benefit obligation of these deferred compensation contracts totaled $33.6 and $30.2 million at June 30, 2011 and 2010, respectively, in the Consolidated Balance Sheet. As of June 30, 2011 and 2010, $28.6 and $29.6 million is included in other noncurrent liabilities, respectively. As of June 30, 2011 and 2010, $5.0 and $0.6 million of the balance is included in accrued liabilities, respectively. The tax-affected accumulated other comprehensive loss for the deferred compensation contracts, consisting of primarily unrecognized actuarial loss, was $1.6 and $1.9 million at June 30, 2011 and 2010, respectively. The amount included in accumulated other comprehensive loss expected to be recognized as a component of net periodic deferred compensation expense in fiscal year 2012 is approximately $0.2 million. The Company intends to fund its future obligations under these arrangements through company-owned life insurance policies on the participants. Cash values of these policies totaled $22.3 and $20.2 million at June 30, 2011 and 2010, respectively, and are included in other assets in the Consolidated Balance Sheet. The Company has agreed to pay the former Vice Chairman an annual amount of $0.6 million, adjusted for inflation to $0.9 million in fiscal years 2011 and 2010, for the remainder of his life. The former Vice Chairman has agreed that during the period in which payments are made, as provided in the agreement, he will not engage in any business competitiveassociated with the business conducted by the Company. Additionally, the Company has a survivor benefit plan for the former Vice Chairman's spouse, payable upon his death, at a rate of one half of his deferred compensation benefit, adjusted for inflation, for the remaining life of his spouse.proceeds. Estimated associated costs included in general and administrative expenses on the Consolidated Statement of Operations totaled $(2.1), $0.7 $0.6, and $0.8 million for each of fiscal years 2011, 2010,2014, 2013 and 2009,2012, respectively. Related obligations totaled $5.9$2.5 and $6.2$5.7 million at June 30, 20112014 and 2010,2013, respectively, with $0.5 and $0.9 million within accrued expenses at June 30, 2014 and 2013, respectively and arethe remainder included in other noncurrent liabilities in the Consolidated Balance Sheet. Theintends to fund all future obligations under this agreement through company-owned life insurance policiespaid the former Chief Executive Officer $15.1 million in fiscal year 2013. Associated compensation expense included in general and administrative expenses on the former Vice Chairman. Cash valuesConsolidated Statement of these policiesOperations totaled $4.2 and $3.9$3.7 million at June 30, 2011 and 2010, respectively, and are included in other assets in the Consolidated Balance Sheet. The policy death benefits exceed the obligations under this agreement.for fiscal year 2012.14.for the three years ended June 30, 2011, 2010 and 2009, included the following: 2011 2010 2009 (Dollars in thousands) $ 1,907 $ 3,206 $ 1,697 477 654 303 494 484 634 8 8 12 4,977 5,814 4,479 Fiscal Years 2014 2013 2012 (Dollars in thousands) Executive Plan (including profit sharing) $ 203 $ 311 $ 394 ESPP 347 441 449 Deferred compensation contracts 1,641 2,370 10,452 15. SHAREHOLDERS' EQUITYIncome Per Share: The Company's basic earnings per share is calculated as(loss) income from continuing operations available to common shareholders and net (loss) income divided by weighted average common shares outstanding, excluding unvested outstanding RSAs and RSUs. The Company's dilutive earnings per share is calculated as net income divided by weighted average common shares and common share equivalents outstanding, which includes shares issuable underfrom continuing operations for the Company's stock option plan and long-term incentive plan, and dilutive securities. Stock-based awards with exercise prices greater than the average market value of the Company's common stock are excluded from the computation of diluted earnings per share. The Company's dilutive earnings per share will also reflect the assumed conversion under the Company's convertible debt if the impact is dilutive, along with the exclusion of interest expense, net of taxes. The impact of the convertible debt is excluded from the computation of diluted earnings per share when interest expense per common share obtainable upon conversion is greater than basicunder the if-converted method was the same for all periods presented. Interest on the convertible debt was excluded from net (loss) income from continuing operations for diluted earnings per share. Fiscal Years 2011 2010 2009 2014 2013 2012 (Shares in thousands) (Shares in thousands) 56,704 55,806 42,897 56,482 56,704 57,137 — 10,730 — — 217 129 Dilutive effect of stock-based compensation(1) — 142 — 56,704 66,753 43,026 56,482 56,846 57,137 (1)For fiscal year 2011, 334(1) For fiscal year 2014 and 2012, 119,750 and 182,270 common stock equivalents of potentially dilutive common stock were not included in the diluted earnings per share calculation due to the net loss from continuing operations. included indilutive under the diluted earnings per share calculation because to do so would have been anti-dilutive.treasury stock method. The computation of weighted average shares outstanding, assuming dilution also excluded 11,307,605, 11,260,261 and 11,208,552 of shares from convertible debt for fiscal years 2014, 2013 and 2012, respectively. These amounts were excluded as they were not dilutive.NOTES TO CONSOLIDATED FINANCIAL STATEMENTS (Continued)15. SHAREHOLDERS' EQUITY (Continued)following table sets forth theCompany grants long-term equity-based awards which are excluded from the various earnings per share calculations: 2011 2010 2009 (Shares in thousands) 862 931 817 215 215 215 1,077 1,146 1,032 890 960 899 1,084 1,110 613 580 677 301 — — 215 11,163 — — 13,717 2,747 2,028 (1)Awards were not vested(2)Awards were anti-dilutive The following table sets forth a reconciliation of the net income from continuing operations available to common shareholders and the net income from continuing operations for diluted earnings per share under the if-converted method: 2011 2010 2009 (Dollars in thousands) $ (8,905 ) $ 39,579 $ 6,970 — 7,520 — $ (8,905 ) $ 47,099 $ 6,970 Stock-based Compensation Award Plans: In May of 2004, the Company's Board of Directors approved theAmended and Restated 2004 Long Term Incentive Plan (2004 Plan)(the "2004 Plan"). The 2004 Plan received shareholder approval at the annual shareholders' meeting held on October 28, 2004. The 2004 Plan provides for the granting of nonqualified stock options, equity-based stock appreciation rights (SARs), restricted stock awards (RSAs), restricted stock units (RSUs) and restricted stock,stock-settled performance share units (PSUs), as well as cash-based performance grants, to employees and non-employee directors of the Company. On March 8, 2007, the Company's Board of Directors approved an amendment toUnder the 2004 Plan, to permit the granting and issuancea maximum of restricted stock units (RSUs). On6,750,000 shares were approved for issuance. In October 28, 2010, the shareholders of Regis Corporation approved an amendment to2013, the 2004 Plan was amended to increaselimit the maximum number of shares of the Company's commonfuture full value awards (awards other than stock authorized for issuance pursuantoptions and SARs) to grants and awards from 2,500,000 to 6,750,000. The 2004 Plan expires on May 26, 2014. Stock options, SARs and restricted stock3,465,701. Shares issued under the 2004 Plan generally vest at a rateare issued from new shares. As of 20.0 percentNOTES TO CONSOLIDATED FINANCIAL STATEMENTS (Continued)15. SHAREHOLDERS' EQUITY (Continued)annually on each ofJune 30, 2014 there were 3,905,483 partial shares or 3,029,874 full shares available for grant under the first five anniversaries of the date of grant. The stock options and SARs have a maximum term of ten years. The cash-based performance grants will be tied to the achievement of certain performance goals during a specified performance period, not less than one fiscal year in length. The RSUs cliff vest after five years and payment of the RSUs is deferred until January 31 of the year following vesting. Unvested2004 Plan. All unvested awards are subject to forfeiture in the event of termination of employment. See Noteemployment, unless accelerated. SAR and RSU awards granted subsequent to July 1, to the Consolidated Financial Statements2012 generally include various acceleration terms for discussionparticipants aged sixty-two years or older and employees aged fifty-five or older and have fifteen years of the Company's measure of compensation cost for its incentive stock plans, as well as an estimate of future compensation expense related to these awards.(2000(the "2000 Plan), although the plan terminated in 2010 whichand no additional awards have since been or will be made under the 2000 Plan. The 2000 Plan allowed the Company to grant both incentive and nonqualified stock options and replaced the Company's 1991 Stock Option Plan.(1991 Plan). Total options covering 3,500,000 shares of common stock were available for grant underand the 2000 Plan, to employees of the Company for a term not to exceed ten years from the date of grant. The term may not exceed five years for incentive stock optionsstock-based awards are granted to employees of the Company possessing more than ten percent of the total combined voting power of all classes of stock of the Companyat an exercise price or any subsidiary of the Company. Options may also be grantedinitial value equal to the Company's outside directors for a term not to exceed ten years from the grant date. The 2000 Plan contains restrictions on transferability, time of exercise, exercise price and on disposition of any shares acquired through exercise of the options. Stock options were granted at not less than fair market value on the date of grant. The Board of Directors determines the 2000 Plan participants and establishes the terms and conditions of each option. The terms and conditions of the shares granted under the 1991 Plan are similar to the 2000 Plan. The 1991 Plan terminated in 2001. All shares granted under the 1991 Plan have been exercised, forfeited, or cancelled as of June 30, 2011. Common shares available for grant under the following plans as of June 30 were: 2011 2010 2009 (Shares in thousands) — 4 268 4,209 12 103 4,209 16 371 NOTES TO CONSOLIDATED FINANCIAL STATEMENTS (Continued)15. SHAREHOLDERS' EQUITY (Continued) Stock options outstanding and weighted average exercise prices were as follows: Options Outstanding Shares Weighted
Average
Exercise Price (in thousands) 1,713 $ 24.55 9 35.15 (102 ) 30.20 (235 ) 16.60 1,385 25.55 135 18.90 (337 ) 17.74 (203 ) 15.12 980 29.48 — — (96 ) 18.89 (46 ) 15.04 838 $ 31.48 670 $ 33.22 Outstanding options of 838,318 at June 30, 2011 had an intrinsic value (the amount by which the stock price exceeded the exercise or grant date price) of zero and a weighted average remaining contractual term of 4.7 years. Exercisable options of 670,198 at June 30, 2011 had an intrinsic value of zero and a weighted average remaining contractual term of 3.9 years. An additional 154,708 options are expected to vest with a $24.81 per share weighted average exercise price and a weighted average remaining contractual life of 7.7 years that have a total intrinsic value of zero. All options granted relate to stock option plans that have been approved by the shareholders of the Company. Stock options granted in fiscal year 2010 were granted under the 2000 and 2004 plan. Stock options granted in fiscal year 2009 were granted under the 2004 Plan.NOTES TO CONSOLIDATED FINANCIAL STATEMENTS (Continued)15. SHAREHOLDERS' EQUITY (Continued) A rollforward of RSAs, RSUs and SARs outstanding, as well as other relevant terms of the awards, were as follows: Nonvested SARs Outstanding Restricted
Stock
Outstanding
Shares/Units Weighted
Average
Grant Date
Fair Value Shares Weighted
Average
Exercise
Price (in thousands) (in thousands) 523 $ 36.76 527 $ 35.70 618 19.14 632 19.14 (28 ) 35.41 (45 ) 35.73 (81 ) 35.72 — — 1,032 26.33 1,114 26.30 304 19.12 2 28.57 (2 ) 20.02 (6 ) 38.63 (188 ) 24.74 — — 1,146 24.70 1,110 26.24 277 16.60 103 16.60 (118 ) 20.42 (126 ) 24.35 (228 ) 22.69 — — 1,077 $ 23.48 1,087 $ 25.54 Outstanding and unvested RSAs of 862,094 at June 30, 2011 had an intrinsic value of $13.2 million and a weighted average remaining vesting term of 2.2 years. Due to estimated forfeitures, 806,986 awards are expected to vest with a total intrinsic value of $12.4 million. Outstanding and unvested RSUs of 215,000 at June 30, 2011 had an intrinsic value of $3.3 million and a weighted average remaining vesting term of 0.7 years. All unvested RSUs are expected to vest in fiscal year 2012. Outstanding SARs of 1,087,460 at June 30, 2011 had a total intrinsic value of zero and a weighted average remaining contractual term of 6.9 years. Exercisable SARs of 604,140 at June 30, 2011 had a total intrinsic value of zero and a weighted average contractual term of 6.0 years. An additional 459,838 SARs are expected to vest with a $20.39 per share weighted average grant price, a weighted average remaining contractual life of 8.0 years and a total intrinsic value of zero. During fiscal year 2011, the Company accelerated the vesting of 68,390 unvested RSAs held by the Company's Chief Executive Officer and the Company's Executive Vice President, Fashion and Education. Under the terms of the modifications, any unvested RSAs granted to the Chief Executive Officer and the Executive Vice President, Fashion and Education fully vest on their last days of employment, which is expected to be February 8, 2012 and June 30, 2012, respectively. As a result of the modifications, the Company recognized an incremental compensation cost of less than $0.1 million during fiscal year 2011. Total cash received from the exercise of share-based instruments in fiscal years 2011, 2010 and 2009 was $0.7, $3.1 and $3.9 million, respectively.NOTES TO CONSOLIDATED FINANCIAL STATEMENTS (Continued)15. SHAREHOLDERS' EQUITY (Continued) As of June 30, 2011, the total unrecognized compensation cost related to all unvested stock-based compensation arrangements was $20.9 million. The related weighted average period over which such cost is expected to be recognized was approximately 3.1 years as of June 30, 2011. The total intrinsic value of all stock-based compensation that was exercised during fiscal years 2011, 2010 and 2009 was $0.2, $0.7, and $1.9 million, respectively.2011, 20102014, 2013 and 20092012 were as follows: 2011 2010 2009 $ — $ 7.36 $ 8.60 6.26 8.60 7.07 16.60 19.12 19.14 — — — 2014 2013 2012 Stock options & SARs $ 6.00 $ 6.63 N/A RSAs & RSUs 15.50 17.40 $ 16.94 PSUs 15.73 18.33 N/A expense associated with the RSAfair value of stock options and RSU grants is basedSARs granted prior to June 30, 2013 was estimated on the market price of the Company's stock at the date of grant.grant using a lattice option valuation model. Effective July 1, 2013, the Company changed from the lattice option valuation model to the Black-Scholes-Merton (BSM) option valuation model for valuing SARs. The Company elected to make the change in valuation methodology because the Company's historical grants of SARs lacked complex vesting conditions or maximum payout limitations on the value of the awards. The Company does not expect a material difference in future valuations as a result of the change in models. The fair value of market-based RSUs granted during fiscal year 2013 was estimated on the date of grant using a Monte Carlo simulation model. The significant assumptions used in determining the underlyingestimated fair value on the date of grant of each stock optionoptions, SARs and SAR grant issuedmarket-based RSUs granted during the fiscal years 2011, 20102014, 2013 and 2009 is presented below:2012 were as follows: 2011 2010 2009 2014 2013 2012 2.29 % 2.79 % 2.45 - 3.29% 1.67 - 1.96% 0.66 - 0.87% N/A 5.50 5.50 5.50 6.00 6.00 N/A 44.00 % 42.00 % 28.00 - 40.00% 44.00% 44.00 - 47.00% N/A 1.45 % 0.85 % 0.56 - 0.84% 1.52 - 1.61% 1.33 - 1.46% N/A Compensationincludedrecorded within General and Administrative expense in the Consolidated Statement of Operations, was as follows: 2014 2013 2012 SARs & stock options $ 2,145 $ 1,986 $ 1,447 RSAs, RSUs, & PSUs 4,255 3,895 6,150 Total stock-based compensation expense 6,400 5,881 7,597 Less: Income tax benefit — (2,235 ) (2,898 ) Total stock-based compensation expense, net of tax $ 6,400 $ 3,646 $ 4,699 SARs Outstanding balance at June 30, 2013 860 429 $ 25.26 Granted 470 — 15.74 Forfeited/Expired (189 ) (177 ) 30.06 Exercised (1 ) — 16.60 Outstanding balance at June 30, 2014 1,140 252 $ 20.80 6.8 — Exercisable at June 30, 2014 383 246 $ 25.85 4.5 — Unvested options, net of estimated forfeitures 686 6 $ 16.68 8.7 — before income taxestax benefit associated with the exercise of SARs and stock options during fiscal years 2014, 2013 and 2012 were immaterial. As of June 30, 2014, there was $2.9 million of unrecognized expense related to stock- based compensation was $9.6, $9.3,SARs and $7.5 millionstock options that is to be recognized over a weighted-average period of 1.8 years.three years endedCompany's stock over a specified period of time. RSUs granted to non-employee directors under the 2004 Plan generally vest in equal monthly amounts over a one year period from the Company's previous annual shareholder meeting date. Distributions on vested RSUs granted to non-employee directors are deferred until the director's board service ends. RSAs RSUs Outstanding balance at June 30, 2013 315 250 $ 17.46 Granted — 362 15.50 Forfeited (26 ) (19 ) 17.05 Vested (103 ) (81 ) 17.92 Outstanding balance at June 30, 2014 186 512 $ 16.34 $ 9,817 Vested at June 30, 2014 — 81 $ 16.42 $ 1,145 Unvested awards, net of estimated forfeitures 179 361 $ 16.40 $ 7,602 2011, 2010,2014, there was $6.6 million of unrecognized expense related to RSAs and 2009, respectively.NOTES TO CONSOLIDATED FINANCIAL STATEMENTS (Continued)15. SHAREHOLDERS' EQUITY (Continued)15.0 percent20.0% or more of the Company's voting stock, or following the announcement of a tender offer or exchange offer to acquire an interest of 15.0 percent20.0% or more. If the rights become exercisable, they entitle all holders, except the takeover bidder, to purchase one one-thousandth of a share of preferred stock at an exercise price of $140, subject to adjustment, or in lieu of purchasing the preferred stock, to purchase for the same exercise price common stock of the Company (or in certain cases common stock of an acquiring company) having a market value of twice the exercise price of a right.(BOD)(Board) approved a stock repurchase program. Originally, the program authorized up to $50.0 million to be expended for the repurchase of the Company's stock. The BODBoard elected to increase this maximum to $100.0 million in August 2003, to $200.0 million on May 3, 2005, and to $300.0 million on April 26, 2007. The timing and amounts of any repurchases will depend on many factors, including the market price of the common stock and overall market conditions. Historically, the repurchases to date have been made primarily to eliminate the dilutive effect of shares issued in conjunction with acquisitions, restricted stock grants and stock option exercises. All repurchased shares become authorized but unissued shares of the Company. This repurchase program has no stated expiration date. As of June 30, 2011, 2010, and 2009,2014, a total accumulated 6.87.7 million shares have been repurchased for $226.5$241.3 million. As of June 30, 2011, $73.52014, $58.7 million remains to be spentremained outstanding under the approved stock repurchase program. June 30, 2014 2013 (Dollars in thousands) Foreign currency translation $ 22,364 $ 20,434 Unrealized gain on deferred compensation contracts 287 122 Accumulated other comprehensive income $ 22,651 $ 20,556 share repurchases under this program.16. SEGMENT INFORMATION Asthe same basis the chief operating decision maker reviews financial information for operational decision-making purposes. During the second quarter of June 30, 2011,fiscal year 2014, the Company owned, franchised or held ownership interests in approximately 12,700 worldwide locations.redefined its operating segments to reflect how the chief operating decision maker evaluates the business as a result of the restructuring of the Company's North American field organization. The Company's locations consisted of 9,419field reorganization, which impacted all North American salons (locatedexcept for salons in the U.S., Canadamass premium category, was announced in the fourth quarter of fiscal year 2013 and Puerto Rico), 400 international salons, 96 hair restoration centers, and 2,786 locationscompleted in which the Company maintains an ownership interest through its investments in affiliates.operatesnow reports its operations in three operating segments: North American salon operations through five primary concepts: Regis Salons, MasterCuts, SmartStyle, Supercuts and Promenade salons. The concepts offer similar products and services, concentrate on the mass market consumer marketplace and have consistent distribution channels. All of the company-owned and franchise salons within theValue, North American salon concepts are located in high traffic, retail shopping locations that attract mass market consumers, and the individual salons display similar long-term economic characteristics. The salons share interdependencies and a common support base.16.itsin the United States, Canada and Puerto Rico and primarily includes the Regis salons concept, among other trade names.salon operations, primarilyreportable operating segment is comprised of 360 company-owned salons located in malls, department stores and high-traffic locations. International salons offer a full range of custom hair care and beauty services and retail products. This segment operates in the United Kingdom through three primary concepts:primarily under the Supercuts, Regis Supercuts, and Sassoon salons. Consistent with the North American concepts, the international concepts offer similar products and services, concentrate on the mass market consumer marketplace and have consistent distribution channels. All of the international salon concepts are company-owned and are located in malls, leading department stores, and high-street locations. Individual salons display similar long-term economic characteristics. The salons share interdependencies and a common support base. The Company's company-owned and franchise hair restoration centers are located in the U.S. and Canada. The Company's hair restoration centers offer three hair restoration solutions; hair systems, hair transplants, and hair therapy, which are targeted at the mass market consumer. Hair restoration centers are located primarily in office and professional buildings within larger metropolitan areas. Based on the way the Company manages its business, it has reported its North American salons, International salons, and Hair Restoration Centers as three separate reportable segments. The accounting policies of the reportable operating segments are the same as those described in Note 1 to the Consolidated concepts. Statements. Corporate assets detailed below are primarily comprised of property and equipment associated with the Company's headquarters and distribution centers, corporate cash, inventories located at corporate distribution centers, deferred income taxes, franchise receivables and other corporate assets. Intersegment sales and transfers are not significant.NOTES TO CONSOLIDATED FINANCIAL STATEMENTS (Continued)16. SEGMENT INFORMATION (Continued)Summarized financial information concerning the Company's reportable operating segments is shown in the following table as of June 30, 2011, 2010, and 2009: For the Year Ended June 30, 2011 Salons Hair
Restoration
Centers Unallocated
Corporate North America International Consolidated (Dollars in thousands) $ 1,588,690 $ 106,734 $ 67,550 $ — $ 1,762,974 403,962 43,503 75,729 — 523,194 37,292 — 2,409 — 39,701 2,029,944 150,237 145,688 — 2,325,869 919,526 54,213 39,129 — 1,012,868 201,560 23,631 24,788 — 249,979 183,552 9,852 4,318 — 197,722 122,281 12,630 37,038 167,908 339,857 292,479 38,423 9,227 2,157 342,286 69,763 4,750 12,958 17,638 105,109 74,100 — — — 74,100 — — — — — 1,863,261 143,499 127,458 187,703 2,321,921 166,683 6,738 18,230 (187,703 ) 3,948 — — — (34,388 ) (34,388 ) — — — 4,811 4,811 $ 166,683 $ 6,738 $ 18,230 $ (217,280 ) $ (25,629 ) $ 881,526 $ 69,932 $ 306,005 $ 548,290 $ 1,805,753 254,939 15,193 17,784 59,895 347,811 51,091 2,957 5,542 11,879 71,469 18,551 — — — 18,551 Fiscal Years 2014 2013 2012 (Dollars in thousands) Revenues(1): North American Value salons $ 1,430,083 $ 1,515,581 $ 1,570,542 North American Premium salons 333,858 373,820 410,563 International salons 128,496 129,312 141,122 $ 1,892,437 $ 2,018,713 $ 2,122,227 Depreciation and amortization expense(1): North American Value salons $ 66,038 $ 56,364 $ 55,317 North American Premium salons 15,859 15,893 15,936 International salons 5,227 5,222 5,297 Total segment depreciation and amortization expense 87,124 77,479 76,550 Unallocated Corporate 12,609 14,276 28,420 $ 99,733 $ 91,755 $ 104,970 Operating (loss) income(1): North American Value salons $ 118,935 $ 141,103 $ 197,478 North American Premium salons(2) (46,274 ) (13,850 ) (57,504 ) International salons (3,356 ) (1,380 ) 2,505 Total segment operating income 69,305 125,873 142,479 Unallocated Corporate (103,295 ) (113,547 ) (144,646 ) Operating (loss) income(1) $ (33,990 ) $ 12,326 $ (2,167 ) Interest expense (22,290 ) (37,594 ) (28,245 ) Interest income and other, net 1,952 35,366 5,098 (Loss) income from continuing operations before income taxes and equity in loss of affiliated companies $ (54,328 ) $ 10,098 $ (25,314 ) (1) See Note 2 to the Consolidated Financial Statements for discussion of the classification of the results of operations of Hair Club as discontinued operations. 16. For the Year Ended June 30, 2010 Salons Hair
Restoration
Centers Unallocated
Corporate North America International Consolidated (Dollars in thousands) $ 1,605,979 $ 111,833 $ 66,325 $ — $ 1,784,137 417,363 44,252 72,978 — 534,593 37,221 — 2,483 — 39,704 2,060,563 156,085 141,786 — 2,358,434 920,905 57,657 37,158 — 1,015,720 219,745 22,570 21,568 — 263,883 183,881 10,152 5,305 — 199,338 113,956 13,115 36,207 128,713 291,991 294,263 38,681 9,013 2,141 344,098 72,681 4,986 12,198 18,899 108,764 35,277 — — — 35,277 — 2,145 — — 2,145 1,840,708 149,306 121,449 149,753 2,261,216 219,855 6,779 20,337 (149,753 ) 97,218 — — — (54,414 ) (54,414 ) — — — 10,410 10,410 $ 219,855 $ 6,779 $ 20,337 $ (193,757 ) $ 53,214 $ 992,410 $ 74,633 $ 284,615 $ 567,914 $ 1,919,572 262,575 15,654 17,484 63,537 359,250 40,393 1,764 3,658 12,006 57,821 3,664 — — — 3,664 NOTES TO CONSOLIDATED FINANCIAL STATEMENTS (Continued)16. SEGMENT INFORMATION (Continued)(2) Included in the North American Premium salons segment's operating loss for fiscal years 2014 and 2012 are goodwill impairment charges of $34.9 and $67.7 million, respectively. For the Year Ended June 30, 2009(1) Salons Hair
Restoration
Centers Unallocated
Corporate North America International Consolidated (Dollars in thousands) $ 1,646,239 $ 122,664 $ 65,055 $ — $ 1,833,958 434,340 48,905 72,960 — 556,205 37,119 — 2,505 — 39,624 2,117,698 171,569 140,520 — 2,429,787 944,782 64,326 35,611 — 1,044,719 235,520 25,855 21,663 — 283,038 173,457 11,762 5,237 — 190,456 117,673 15,720 33,924 124,344 291,661 292,253 44,492 8,887 2,160 347,792 73,395 12,492 11,327 18,441 115,655 — 41,661 — — 41,661 4,990 742 — — 5,732 1,842,070 217,050 116,649 144,945 2,320,714 275,628 (45,481 ) 23,871 (144,945 ) 109,073 — — — (39,768 ) (39,768 ) — — — 9,461 9,461 $ 275,628 $ (45,481 ) $ 23,871 $ (175,252 ) $ 78,766 $ 966,596 $ 49,779 $ 293,017 $ 583,094 $ 1,892,486 281,504 20,314 18,234 71,486 391,538 49,355 3,081 9,858 11,280 73,574 39,215 22 889 — 40,126 (1)Beginning with the period ended December 31, 2008, the operations of Trade Secret concept within the North American reportable segment were accounted for as discontinued operations. All comparable periods will reflect Trade Secret as discontinued operations. See further discussion at Note 2 to the Consolidated Financial Statements.NOTES TO CONSOLIDATED FINANCIAL STATEMENTS (Continued)16. SEGMENT INFORMATION (Continued)long-lived assetsproperty and equipment, net associated with business operations in the U.S. and all other countries in aggregate were as follows: Year Ended June 30, June 30, 2011 2010 2009 2014 2013 2012 Total
Revenues Long-lived
Assets Total
Revenues Long-lived
Assets Total
Revenues Long-lived
Assets (Dollars in thousands) (Dollars in thousands) $ 2,007,042 $ 314,406 $ 2,055,059 $ 327,753 $ 2,121,531 $ 355,330 $ 1,626,794 $ 240,460 $ 1,737,517 $ 285,111 $ 1,815,797 $ 274,711 318,827 33,405 303,375 31,497 308,256 36,208 265,643 26,078 281,196 28,349 306,430 31,088 $ 2,325,869 $ 347,811 $ 2,358,434 $ 359,250 $ 2,429,787 $ 391,538 $ 1,892,437 $ 266,538 $ 2,018,713 $ 313,460 $ 2,122,227 $ 305,799 17. Summarized quarterly data for fiscal years 2011 and 2010 follows: Quarter Ended September 30 December 31 March 31 June 30 Year Ended (Dollars in thousands, except per share amounts) $ 578,245 $ 574,372 $ 581,267 $ 591,985 $ 2,325,869 257,558 251,132 253,017 261,614 1,023,321 33,434 22,864 (59,504 ) 7,154 3,948 18,320 14,505 (25,335 ) (16,395 ) (8,905 ) 18,320 14,505 (25,335 ) (16,395 ) (8,905 ) 0.32 0.26 (0.45 ) (0.29 ) (0.16 ) 0.32 0.26 (0.45 ) (0.29 ) (0.16 ) 0.30 0.24 (0.45 ) (0.29 ) (0.16 ) 0.30 0.24 (0.45 ) (0.29 ) (0.16 ) 0.04 0.04 0.06 0.06 0.20 67 in this Form 10-K for explanations of items, which impacted fiscal year 2011years 2014 and 2013 revenues, operating and net (loss) income. Quarter Ended September 30(e) December 31 March 31 June 30 Year Ended (Dollars in thousands, except per share amounts) 2014 Revenues $ 468,583 $ 468,367 $ 471,561 $ 483,926 $ 1,892,437 Cost of service and product revenues, excluding depreciation and amortization 269,039 273,874 272,490 279,095 1,094,498 Operating income (loss)(a) 1,429 (34,660 ) (3,221 ) 2,462 (33,990 ) (Loss) income from continuing operations(a)(b) (136 ) (109,085 ) (10,093 ) (17,766 ) (137,080 ) Income from discontinued operations(c) — — 609 744 1,353 Net (loss) income (a)(b)(c) (136 ) (109,085 ) (9,484 ) (17,022 ) (135,727 ) (Loss) income from continuing operations per share, basic and diluted(d) — (1.93 ) (0.18 ) (0.31 ) (2.43 ) Income from discontinued operations per share, basic and diluted — — 0.01 0.01 0.02 Net (loss) income per basic and diluted share(d) — (1.93 ) (0.17 ) (0.30 ) (2.40 ) Dividends declared per share 0.06 0.06 — — 0.12 17. Quarter Ended September 30 December 31 March 31 June 30 Year Ended (Dollars in thousands, except per share amounts) $ 605,550 $ 575,365 $ 587,571 $ 589,948 $ 2,358,434 259,967 254,564 260,199 264,397 1,039,127 28,257 32,063 1,184 35,714 97,218 4,611 18,154 (1,525 ) 18,339 39,579 3,161 — — — 3,161 7,772 18,154 (1,525 ) 18,339 42,740 0.09 0.32 (0.03 ) 0.32 0.71 0.06 — — — 0.06 0.14 0.32 (0.03 ) 0.32 0.77 0.09 0.30 (0.03 ) 0.30 0.71 0.06 — — — 0.05 0.14 0.30 (0.03 ) 0.30 0.75 0.04 0.04 0.04 0.04 0.16 Refer to Management's Discussion and Analysis of Financial Condition and Results of Operations in Part II, Item 6 in this Form 10-K for explanations of items which impacted fiscal year 2010 revenues, operating and net income.(a)Operating income and net income decreased $31.2 million ($19.2 million net of tax) as a result of a valuation reserve on a note receivable with the purchase of Trade Secret that was recorded in the third quarter ($9.0 million) and fourth quarter ($22.2 million) of fiscal year 2011.(b)Expense of $74.1 million ($50.8 million net of tax) was recorded in the third quarter ended March 31, 2011 related to our Promenade salon concept goodwill impairment due to recent performance challenges in that concept. Expense of $35.3 million ($28.7 million net of tax) was recorded in the third quarter ended March 31, 2010 related to our Regis salon concept goodwill impairment due to recent performance challenges in that concept and current economic conditions.(c)The Company sold $20.0 million of product to the purchaser of Trade Secret at cost for the three months ended September 30, 2009.(d)During the second quarter ended December 31, 2008, the Company determined Trade Secret to be held for sale and accounted for it as a discontinued operation. An income tax benefit of $3.0 million was recorded in the first quarter ended September 30, 2009 to correct the prior year calculation of the income tax benefit related to the disposition of the Trade Secret concept.(e)Income (loss) from continuing operations and net income decreased as a result of $9.2 million that was recorded in the third quarter ($8.7 million) and in the fourth quarter ($0.5 million) as a result of an other than temporary impairment on an investment in preferred shares of Yamano and a premium paid at the time of an initial investment in MY Style.(f)Total is a recalculation; line items calculated individually may not sum to total. Quarter Ended September 30 December 31 March 31 June 30(e) Year Ended (Dollars in thousands, except per share amounts) 2013 Revenues $ 505,360 $ 506,165 $ 504,937 $ 502,251 $ 2,018,713 Cost of service and product revenues, excluding depreciation and amortization 285,660 289,329 287,597 296,678 1,159,264 Operating income (loss)(a) 9,273 8,723 3,308 (8,978 ) 12,326 Income (loss) from continuing operations(a)(b) 34,647 (16,119 ) 896 (15,258 ) 4,166 Income (loss) from discontinued operations(c) 3,777 3,853 1,465 15,933 25,028 Net income (loss)(a)(b)(c) 38,424 (12,266 ) 2,361 675 29,194 Income (loss) from continuing operations per share, basic 0.60 (0.28 ) 0.02 (0.27 ) 0.07 Income (loss) from discontinued operations per share, basic(d) 0.07 0.07 0.03 0.28 0.44 Net income (loss) per basic share(d) 0.67 (0.22 ) 0.04 0.01 0.51 Income (loss) from continuing operations per share, diluted 0.54 (0.28 ) 0.02 (0.27 ) 0.07 Income (loss) from discontinued operations per share, diluted 0.06 0.07 0.03 0.28 0.44 Net income (loss) per diluted share(d) 0.59 (0.22 ) 0.04 0.01 0.51 Dividends declared per share 0.06 0.06 0.06 0.06 0.24 (a) During the second quarter of fiscal year 2014, the Company recorded a goodwill impairment charge of $34.9 million, an $84.4 million non-cash charge to establish a valuation allowance against the Company’s U.S. and U.K. deferred tax assets and non-cash salon asset impairment charge of $4.7 million. During the third quarter of fiscal 2014, the Company recorded non-cash salon impairment of $8.9 million. During the fourth quarter of fiscal year 2013, the Company recorded a $12.6 million ($7.7 million net of tax) inventory write-down associated with the Company's implementation of standardized plan-o-grams. (b) During the fourth quarter of fiscal year 2014, the Company recorded a $12.6 million charge representing its share of goodwill impairment charges recorded by EEG. During the first quarter of fiscal year 2013, the Company recorded a $32.2 million net of tax foreign currency gain associated with the sale of Provalliance. During the second quarter of fiscal year 2013, the Company recorded a $17.9 million impairment charge net of tax related to the impairment of EEG. During the fourth quarter of fiscal year 2013, the Company incurred $6.7 million net of tax of expense for a make-whole payment associated with the prepayment of debt. (c) During the fourth quarter of fiscal year 2013, the Company recorded a $15.4 million gain, net of professional and transaction fees and taxes, associated with the disposition of Hair Club. (d) Total is an annual recalculation; line items calculated quarterly may not sum to total. (e) During the fourth quarter of fiscal year 2013, the Company recorded a cumulative adjustment to correct prior period errors that related to an understatement of interest expense and certain uncertain tax positions. The impact of these items on the Company's Consolidated Statement of Operations increased interest expense by $0.4 million, increased income tax expense by $0.3 million and decreased net income by $0.7 million. During first quarter of fiscal year 2014, the Company recorded adjustments to correct errors related to the fourth quarter of fiscal year 2013 for an overstatement of inventory and self-insurance accruals and an understatement of cash. The impact of these items on the Company's Consolidated Statement of Operations decreased Site Operating expenses by $1.3 million, increased Cost of Product by $0.3 million and decreased net loss by $0.6 million. Because these errors were not material to the Company's consolidated financial statements for any prior periods, the respective quarter, or respective fiscal year, the Company recorded adjustments to correct the errors during each respective quarter. presidentchief executive officer and chief financial officer, as appropriate, to allow timely decisions regarding required disclosure.presidentchief executive officer and chief financial officer evaluated the effectiveness of the design and operation of the Company's disclosure controls and procedures (as defined in Rules 13a-5(e) and 15d-15(e) promulgated under the Exchange Act) at the conclusion of the period ended June 30, 2011.2014. Based upon this evaluation, the presidentchief executive officer and chief financial officer concluded that the Company's disclosure controls and procedures were effective.2011.2014. In addition, PricewaterhouseCoopers LLP, the Company's independent registered public accounting firm, provided a report on the Company's effectiveness of internal control over financial reporting. The full text of management's report and PricewaterhouseCoopers' report appears on pages 7739 and 7840 herein. that there were no changes in the Company's internal control over financial reporting that has materially affected, or is reasonably likely to materially affect, the Company's internal control over financial reporting that occurred during the Company's most recent fiscal quarter. None.20112014 Proxy, and is incorporated herein by reference. The information required by Item 401 of Regulation S-K regarding the Company's executive officers is included under "Executive Officers" in Item 1 of this Annual Report on Form 10-K. Additionally, information regarding the Company's audit committee and audit committee financial expert, as well nominating committee functions, will be set forth in the section titled "Committees of the Board" and shareholder communications with directors will be set forth in the section titled "Communications with the Board" of the Company's 20112014 Proxy Statement, and is incorporated herein by reference./- Guidelines" (within the "Investor Information" section). The Company intends to disclose any substantive amendments to, or waivers from, its Code of Business Conduct & Ethics on its website or in a report on Form 8-K. In addition, the charters of the Company's Audit Committee, Compensation Committee and Nominating and Corporate Governance Committee and the Company's Corporate Governance Guidelines may be found on the Company's website. Copies of any of these documents are available upon request to any shareholder of the Company by writing to the Company's Secretary at Regis Corporation, 7201 Metro Boulevard, Edina, Minnesota 55439.20112014 Proxy Statement, and is incorporated herein by reference.20112014 Proxy Statement, and isare incorporated herein by reference.20112014 Proxy Statement, and is incorporated herein by reference. Information regarding director independence is includedwill be set forth in the section titled "Corporate Governance—Director Independence" of the Company's 20102014 Proxy Statement, and is incorporated herein by reference.2—3—Ratification of Appointment of Independent Registered Public Accounting Firm" of the Company's 20112014 Proxy Statement and is incorporated herein by reference.(a)(1). All financial statements:(b) (1). All financial statements: (b)Exhibits:(c) Exhibits: 2(a)Contribution Agreement, dated April 18, 2007, between the Company and Empire Beauty School Inc. (Incorporated by reference to Exhibit 2.1 of the Company's Report on Form 8-K filed on April 24, 2007.)2(b)Purchase Agreement, dated November 13, 2004, between the Company and Hair Club Group Inc. (Incorporated by reference to Exhibit 2 of the Company's Report on Form 10-Q filed on February 9, 2005, for the quarter ended December 31, 2004.)2(c)Stock Purchase Agreement dated as of January 26, 2009 between Regis Corporation, Trade Secret, Inc. and Premier Salons Beauty Inc. (Incorporated by reference to Exhibit 2.1 to the Company's Report on Form 8-K filed on January 27, 2009.)3(a) Election of the Company to become governed by Minnesota Statutes Chapter 302A and Restated Articles of Incorporation of the Company, dated March 11, 1983; Articles of Amendment to Restated Articles of Incorporation, dated October 29, 1984; Articles of Amendment to Restated Articles of Incorporation, dated August 14, 1987; Articles of Amendment to Restated Articles of Incorporation, dated October 21, 1987; Articles of Amendment to Restated Articles of Incorporation, dated November 20, 1996; Articles of Amendment to Restated Articles of Incorporation, dated July 25, 2000. (Incorporated by reference2000; Articles of Amendment to Exhibit 3(a)Restated Articles of the Company's Report on Form 10-Q filed on February 8, 2006, for the quarter ended December 31, 2005.)Incorporation, dated October 22, 2013. 3(b) By-Laws of the Company. (Incorporated by reference to Exhibit 3.1 of the Company's Report on Form 8-K filed on October 31, 2006.) 3(c) Certificate of the Voting Powers, Designations, Preferences and Relative Participating, Optional and Other Special Rights and Qualifications, Limitations or Restrictions of Series A Junior Participating Preferred Stock of the Company. (Attached as Exhibit A to the Rights Agreement dated December 26, 2006, and incorporated by reference to Exhibit 2 of the Company's Registration Statement on Form 8-A12B filed on December 26, 2006.) 4(a) Shareholder Rights Agreement, dated December 23, 1996, between the Company and Norwest Bank Minnesota, N.A. as Rights Agent. (Incorporated by reference to Exhibit 4 of the Company's Report on Form 8-A12G filed on February 4, 1997.) 4(b) Rights Agreement, dated December 26, 2006, between the Company and Wells Fargo Bank, N.A., as Rights Agent, and Form of Right Certificate attached as Exhibit B to the Rights Agreement. (Incorporated by reference to Exhibits 1 and 3 of the Company's Registration Statement on Form 8-A12B, filed on December 26, 2006.) 4(c) Amendment No. 1,2, dated as of October 29, 2008,June 13, 2013, to Rights Agreement, dated December 26, 2006, between Regis Corporation and Wells Fargo Bank, N.A. (Incorporated by reference to Exhibit 4 to the Company's Registration Statement on Form 8-A12B/A filed on October 29, 2008.June 19, 2013.) 4(d) Form of Stock Certificate. (Incorporated by reference to Exhibit 4.1of4.1 of the Company's Registration Statement on Form S-1 (Reg. No. 40142).) 4(e) July 14, 2009November 27, 2013 by and between the Company and Wells Fargo Bank, N.A, as Trustee (Incorporated by reference to Exhibit 4.1 of the Company's Report on Form 8-K filed July 17, 2009.)10(a)(*)Survivor Benefit Agreement, dated June 27, 1994, between the Company and Myron Kunin. (Incorporated by reference to Exhibit 10(t) part of the Company's Report on Form 10-K filed on September 28, 1994, for the year ended June 30, 1994.)10(b)Series G Senior Note, dated July 10, 1998, between the Company and Prudential Insurance Company of America. (Incorporated by reference to Exhibit 10(jj) of the Company's Report on Form 10-K filed on September 17, 1998, for the year ended June 30, 1998.)10(c)Amended and Restated Private Shelf Agreement, dated October 3, 2000, between the Company and Prudential Insurance Company of America. (Incorporated by reference to Exhibit 10(ff) of the Company's Report on Form 10-Q filed on November 13, 2000, for the quarter ended September 30, 2000.)10(d)Senior Series I Note, dated October 3, 2000, between the Company and Prudential Insurance Company of America. (Incorporated by reference to Exhibit 10(aa) of the Company's Report on Form 10-K filed on September 12, 2001, for the year ended June 30, 2001.)10(e)Note Purchase Agreement, dated March 1, 2002, between the Company and purchasers listed in Schedule A attached thereto. (Incorporated by reference to Exhibit 10(aa) of the Company's Report on Form 10-K filed on September 24, 2002, for the year ended June 30, 2002.)10(f)Form of Series A Senior Note. (Attached as Exhibit 1(a) to the Note Purchase Agreement dated March 1, 2002, and incorporated by reference to Exhibit 10(aa) of the Company's Report on Form 10-K filed on September 24, 2002, for the year ended June 30, 2002.)10(g)Series J Senior Notes, dated June 9, 2003, between the Company and Prudential Insurance Company of America. (Incorporated by reference to Exhibit 10(dd) of the Company's Report on Form 10-K filed on September 17, 2003, for the year ended June 30, 2003.)10(h)Promissory Note dated November 26, 2003, between the Company and Information Leasing Corporation. (Incorporated by reference to Exhibit 10(ee) of the Company's Report on Form 10-K filed on September 10, 2004, for the year ended June 30, 2004.)10(i)Lease Agreement commencing October 1, 2005, between the Company and France Edina, Property, LLP. (Incorporated by reference to Exhibit 99 of the Company's Report on Form 8-K filed on May 6, 2005.)10(j)Third Amended and Restated Credit Agreement, dated April 7, 2005, among the Company, Bank of America, N.A., as Administrative Agent, LaSalle Bank National Association, as Co-Administrative Agent and Co-Arranger and as Swing-Line Lender, J.P. Morgan Chase Bank, N.A., as Syndication Agent, Wachovia Bank, National Association, as Documentation Agent, Other Financial Institutions Party thereto, and Banc of America Securities LLC as Co-Arranger and Sole Book Manager. (Incorporated by reference to Exhibit 99.1 of the Company's Report on Form 8-K filed April 12, 2005.)10(k)Prepayment Agreement between Regis Corporation and various holders of Senior Notes of Regis Corporation, dated June 29, 2009 (Incorporated by reference to Exhibit 10.1 of the Company's Report on Form 8-K filed July 6, 2009.)10(l)First Amendment to Term Loan agreement dated as of October 3, 2008 among Regis Corporation and various lenders, and JP Morgan Chase Bank, N.A, dated July 3, 2009 (Incorporated by reference to Exhibit 10.2 of the Company's Report on Form 8-K filed July 6, 2009.)10(m)First Amendment to Fourth Amendment and Restated Credit Agreement dated as of July 12, 2007 among Regis Corporation and various lenders and JP Morgan Chase Bank, N.A, dated July 3, 2009 (Incorporated by reference to Exhibit 10.3 of the Company's Report on Form 8-K filed July 6, 2009.)10(n)Amendment No.6 to Amend and Restated Private Shelf Agreement between Regis Corporation and Prudential Investment Management, Inc., The Prudential Insurance Company of America, Pruco Life Insurance Company, Pruco Life Insurance Company of New Jersey and other Prudential affiliates dated July 3, 2009Trustee. (Incorporated by reference to Exhibit 10.4 of the Company's Report on FromForm 8-K filed July 6, 2009.December 4, 2013.) 10(o)10(a)* First Amendment to Note Purchase Agreement dated March 1, 2005, between the Company and the purchasers listed in Schedule I attached thereto. (Incorporated by reference to Exhibit 99.3 of the Company's Report on Form 8-K filed April 12, 2005.)10(p)(*) 10(q)10(b)* Consulting Agreement, dated April 18, 2007, between the Company and Empire Beauty School Inc. (Incorporated by reference to Exhibit 10.1 of the Company's Report on Form 8-K filed on April 24, 2007.)10(r)(*)Amended and Restated Compensation Agreement, dated June 29, 2007, between the Company and Myron Kunin. (Incorporated by reference to Exhibit 10.1 of the Company's Report on Form 8-K filed on July 5, 2007.)10(s)Master Agreement, dated October 11, 2007, between Mr. Yvon Provost, Mr. Fabien Provost, Mrs. Olivia Provost, Mrs. Monique La Rizza, Artal Services N.V., Mr. Jean Mouton, RHS Netherlands Holdings BV, RHS France SAS, the Company and Artal Group S.A. (Incorporated by reference to Exhibit 10 of the Company's Report on Form 10-Q filed on February 7, 2008, for the quarter ended December 31, 2007.)10(t)Stock Purchase Agreement, dated January 17, 2008, between the Company, Cameron Capital Investments, Inc., Stephen Powell and Mackenzie Limited Partnership. (Incorporated by reference to Exhibit 10(z) to the Company's Report on Form 10-K filed on August 29, 2008, for the year ended June 30, 2008.)10(u)(*)Regis Corporation Executive Retirement Savings Plan Adoption Agreement and Trust Agreement, dated November 15, 2008 between the Company and Fidelity Management Trust Company (The CORPORATE Plan for Retirement EXECUTIVE PLAN basic plan document is incorporated by reference to Exhibit 10(c) to the Company's Report on Form 10-K filed on August 29, 2007, for the year ended June 30, 2007). (Incorporated by reference to Exhibit 10(a) of the Company's Report on Form 10-Q filed February 9, 2009.) 10(c)* 10(v)(*)Employment Agreement, as Amended and Restated effective March 1, 2011,dated August 31, 2012, between the Company and Paul D. Finkelstein.Daniel J. Hanrahan. (Incorporated by reference to Exhibit 10(a) of the Company's Report on Form 10-Q filed May 10, 2011)November 9 2012.) 10(d)* 10(w)(*)Employment Agreement, as Amended and Restated effective December 31, 2008,dated November 28, 2012, between the Company and Randy L. Pearce.Steven M. Spiegel. (Incorporated by reference to Exhibit 10(a) of the Company's Report on Form 10-Q filed February 4, 2013.)10(e)* Form of Amended and Restated Senior Officer Employment and Deferred Compensation Agreement, dated August 31, 2012, between the Company and certain senior executive officers. (Incorporated by reference to Exhibit 10(b) of the Company's Report on Form 10-Q filed November 9, 2012.) 10(f)* Employment Agreement, dated November 11, 2013, between the Company and Jim B. Lain. (Incorporated by reference to Exhibit 10(c) of the Company's Report on Form 10-Q filed February 9, 2009.3, 2014.) 10(g)* 10(x)(*)Amended and Restated Senior Officer and Deferred Compensation Agreement, dated December 31, 2008,October 21, 2013, between the Company and Gordon Nelson.Carmen Thiede. (Incorporated by reference to Exhibit 10(d)10(b) of the Company's Report on Form 10-Q filed February 9, 2009.3, 2014.) 10(h)* 10(y)(*)Form of AmendedTransition and Restated Senior Officer Employment and Deferred CompensationSeparation Agreement, dated December 31, 2008,January 9, 2014, between the Company and certain senior executive officers.Norma Knudsen. (Incorporated by reference to Exhibit 10(e)10(a) of the Company's Report on Form 10-Q filed February 9, 2009.April 30, 2014.) 10(i)* 10(z)(*)Amendment to Compensation Agreement, dated December 23, 2008, between the Company,2004 Long Term Incentive Plan as amended and Myron Kuninrestated effective October 22, 2013. (Incorporated by reference to Exhibit 10(f)10.1 of the Company's Report on Form 10-Q8-K filed February 9, 2009.on October 11, 2013.) 10(aa)(*)2004 Long Term Incentive Plan as Amended and Restated, effective October 28, 2011, (Incorporated by reference to Appendix A of the Company's Report on Form DEF14A filed September 14, 2010.)10(j) 10(bb)(*)Separation Agreement and Release between Bruce Johnson, former EVP, Real Estate Design & Construction effective July 1, 2011.10(cc)(*)Separation Agreement and Release between Mark Kartarik, former EVP and President, Franchise division effective July 1, 2011.10(dd)(*)Amendment to Amended and Restated Senior Officer Employment and Deferred Compensation Agreement, dated April 26, 2011, between the Company and Gordon Nelson.10(ee)FifthSixth Amended and Restated Credit Agreement, dated June 30, 2011,11, 2013, among the Company, and various financial institutions party thereto, JPMorgan Chase Bank, N.A., as Administrative Agent, Swing Line Lender, and Issuer, Bank of America, as Syndication Agent, and The Bank of Tokyo-Mitsubishi UFJ, Ltd., U.S. Bank National Association, and Wells Fargo Bank, N.A., as Documentation AgentsAgents.10(k) July 6, 2011.December 4, 2013.)18.1Preferability Letter of Independent Registered Public Accounting Firm dated August 26, 2011 10(l) 10(m) 21 List of Subsidiaries of Regis Corporation 2323.1 Consent of PricewaterhouseCoopers LLP 23.2 Consent of ParenteBeard LLC 31.1 PresidentChief Executive Officer of the Company: Certification pursuant to Section 302 of the Sarbanes-Oxley Act of 2002 31.2 SeniorExecutive Vice President and Chief Financial Officer of the Company: Certification pursuant to Section 302 of the Sarbanes-Oxley Act of 2002 32.132 President of the Company: Certification pursuant to Section 906 of the Sarbanes-Oxley Act of 200232.2Senior Vice PresidentChief Executive Officer and Chief Financial Officer of the Company: Certification pursuant to Section 906 of the Sarbanes-Oxley Act of 2002 101.INS (**)XBRL Instance Document 101.SCH (**)XBRL Taxonomy Extension Schema 101.CAL (**)XBRL Taxonomy Extension Calculation Linkbase 101.LAB (**)XBRL Taxonomy Extension Label Linkbase 101.PRE (**)XBRL Taxonomy Extension Presentation Linkbase 101.DEF (**)XBRL Taxonomy Extension Definition Linkbase (*) Management contract, compensatory plan or arrangement required to be filed as an exhibit to the Company's Report on Form 10-K. (*)Management contract, compensatory plan or arrangement required to be filed as an exhibit to the Company's Report on Form 10-K.(**)The XBRL related information in Exhibit 101 to this Annual Report on Form 10-K shall not be deemed "filed" for purposes of Section 18 of the Securities Exchange Act of 1934, as amended, or otherwise subject to liability of that section and shall not be incorporated by reference into any filing or other document pursuant to the Securities Act of 1933, as amended, except as shall be expressly set forth by specific reference in such filing or document. REGIS CORPORATION
ByBy
/s/ RANDY L. PEARCERandy L. Pearce,PresidentDANIEL J. HANRAHAN
ByPresident and Chief Executive Officer
By /s/ BRENT A. MOEN
STEVEN M. SPIEGELBrent A. Moen,SeniorExecutive Vice President,
DATE: August 26, 20112014/s/ PAUL D. FINKELSTEIN
STEPHEN E. WATSONPaul D. Finkelstein, Chairman of the
Board of Directors Date: August 26, 20112014/s/ DAVID B. KUNINDavid B. Kunin, Director
Date: August 26, 2011
/s/ ROLF BJELLANDRolf Bjelland, DirectorDANIEL J. HANRAHAN
Date: August 26, 2011/s/ VAN ZANDT HAWNVan Zandt Hawn, DirectorDate: August 26, 2011/s/ SUSAN S. HOYTSusan S. Hoyt, DirectorDate: August 26, 2011/s/ THOMAS L. GREGORYThomas L. Gregory, DirectorDate: August 26, 2011/s/ STEPHEN E. WATSONStephen E. Watson, Director Date: August 26, 20112014/s/ JOSEPH L. CONNER
DANIEL G. BELTZMANJoseph L. Conner, Director
Date: August 26, 20112014/s/ JAMES P. FOGARTY Date: August 26, 2014 /s/ MICHAEL J. MERRIMAN Date: August 26, 2014 /s/ DAVID P. WILLIAMS Date: August 26, 2014 /s/ DAVID J. GRISSEN Date: August 26, 2014 /s/ MARK LIGHT Date: August 26, 2014 Page Consolidated Financial Statements 2014 2013 2014 2013 Assets Liabilities and Shareholders' Equity Current Assets Current liabilities Cash and cash equivalents $ 37,891,769 $ 23,318,183 Current maturities, capital lease obligation Restricted cash, trust liabilities 104,079 113,710 and long term debt $ 465,312 $ 487,165 Accounts receivable: Accounts payable, trade 2,977,521 2,444,428 Students (net of allowance of $6,710,886 and Accounts payable, affiliates — 2,802 $7,825,432 in 2014 and 2013, respectively) 3,238,576 1,945,076 Accounts payable, accrued 3,452,460 2,013,977 Other 94,329 63,602 Accrued payroll 2,726,493 3,958,597 Affiliates, unsecured 17,165 17,513 Accrued expenses 1,361,940 1,337,715 Inventories 3,971,048 2,194,686 Trust liabilities 104,079 113,710 Prepaid expenses 2,457,756 1,614,491 Unearned tuition 13,708,876 14,958,832 Prepaid corporate income taxes 3,863,741 3,055,978 Deferred tax asset, net 3,135,326 3,576,542 Total current liabilities 24,796,681 25,317,226 Total current assets 54,773,789 35,899,781 Capital Lease Obligation 7,268,653 7,512,802 Property and Equipment, Net 36,528,003 49,128,108 Long-Term Debt 21,278,840 9,585,003 Other Assets Deferred Rent 4,238,890 4,244,747 Goodwill — 28,582,562 Intangibles, not subject to amortization 8,704,186 8,977,460 Deferred Compensation 217,768 217,768 Intangibles, net 234,355 326,565 Prepublication costs (net of accumulated Total liabilities 57,800,832 46,877,546 amortization of $24,408 in 2014) 279,134 49,532 Commitments and Contingencies (Note 10, 12) Notes receivable, employees, secured 269,754 — Deposits and other assets 744,082 953,345 Shareholders' Equity Deferred tax asset, net 11,043,038 3,829,115 Preferred stock: Series A, 8% cumulative, redeemable, $0.001 Total other assets 21,274,549 42,718,579 par value, 150 shares authorized, none issued and outstanding Series B, 8% cumulative, redeemable, $0.001 par value, 114 shares authorized, none issued and outstanding Common stock, $0.001 par value; 10,000 shares authorized, 899.938 and 889.938 shares Issued and outstanding in 2014 and 2013, respectively 1 1 Additional paid-in capital 66,595,868 65,990,071 (Accumulated deficit) Retained earnings (11,820,360 ) 14,878,850 Total shareholders' equity 54,775,509 80,868,922 Total $ 112,576,341 $ 127,746,468 Total $ 112,576,341 $ 127,746,468
See Notes to Consolidated Financial Statements 2014 2013 2012 Revenue Educational services $ 146,462,085 $ 150,474,847 $ 161,512,264 Products 20,078,121 20,489,289 20,813,487 Total revenue 166,540,206 170,964,136 182,325,751 Operating Expenses Cost of educational services 95,493,987 91,750,973 94,248,513 Cost of product sales 12,815,299 13,337,935 13,420,023 General, selling, and administrative 42,850,496 43,816,472 46,134,002 Depreciation and amortization 7,385,895 9,327,185 9,574,160 Other operating expenses 3,052,561 4,126,347 4,430,601 Loss (gain) on disposal and sale of assets 14,026 (256,898 ) (337,132 ) Impairment loss 38,454,344 3,881,298 16,190,513 Total operating expenses 200,066,608 165,983,312 183,660,680 (Loss) Income from Operations (33,526,402 ) 4,980,824 (1,334,929 ) Other Income (Expense) Interest expense (661,863 ) (670,607 ) (1,204,148 ) Interest income 38,702 11,960 9,966 Miscellaneous income 185,167 704,531 683,052 Total other (expense) income, net (437,994 ) 45,884 (511,130 ) (Loss) Income Before Provision for Income Taxes (33,964,396 ) 5,026,708 (1,846,059 ) (Benefit) Provision for Income Taxes (7,265,186 ) 2,667,765 5,365,372 Net (Loss) Income $ (26,699,210 ) $ 2,358,943 $ (7,211,431 )
See Notes to Consolidated Financial Statements Additional Retained Earnings Common Stock Paid-in (Accumulated Shares Amount Capital Deficit) Total Balance, June 30, 2011 889.938 $ 1 $ 65,235,225 $ 19,731,338 $ 84,966,564 Net Loss — — (7,211,431 ) (7,211,431 ) Compensation Costs from Stock Options — 379,305 — 379,305 Balance, June 30, 2012 889.938 1 65,614,530 12,519,907 78,134,438 Net Income — — 2,358,943 2,358,943 Compensation Costs from Stock Options — 375,541 — 375,541 Balance, June 30, 2013 889.938 1 65,990,071 14,878,850 80,868,922 Net Loss — — (26,699,210 ) (26,699,210 ) Stock Option Exercise 10 — 234,020 — 234,020 Compensation Costs from Stock Options — 371,777 — 371,777 Balance, June 30, 2014 899.938 $ 1 $ 66,595,868 $ (11,820,360 ) $ 54,775,509
See Notes to Consolidated Financial Statements 2014 2013 2012 Cash Flows from Operating Activities Net (loss) income $ (26,699,210 ) $ 2,358,943 $ (7,211,431 ) Adjustments to reconcile net (loss) income to net cash provided by operating activities: Depreciation 7,269,278 8,925,160 9,048,389 Amortization of intangibles 92,210 145,686 225,924 Amortization of prepublication costs 24,408 286,261 342,686 Impairment loss 38,454,344 3,881,298 16,190,513 Provision for uncollectible accounts (1,114,546 ) (558,967 ) (392,072 ) Compensation cost from stock options 371,777 375,541 379,305 Gain on disposal and sale of equipment 14,026 (256,898 ) (337,132 ) Deferred income taxes (6,772,707 ) 62,005 1,376,221 Changes in assets and liabilities: Accounts receivable, student (178,954 ) 345,548 (456,533 ) Inventories (1,776,362 ) 867,656 192,249 Prepaid expenses and other assets (1,472,144 ) (193,142 ) (512,728 ) Notes receivable, employee, secured (35,734 ) — — Accounts payable and accrued expenses 760,895 (423,604 ) 1,225,446 Unearned tuition (1,249,956 ) (382,903 ) (4,747,410 ) Deferred rent (5,857 ) 200,851 119,911 Total adjustments 34,380,678 13,274,492 22,654,769 Net cash provided by operating activities 7,681,468 15,633,435 15,443,338 Cash Flows from Investing Activities Purchases of property and equipment (4,336,333 ) (8,503,783 ) (10,356,175 ) Proceeds from disposal and sale of equipment 54,626 401,049 996,457 Investment in prepublication costs (254,010 ) (49,532 ) (36,777 ) Net cash used in investing activities (4,535,717 ) (8,152,266 ) (9,396,495 ) Cash Flows from Financing Activities Net proceeds of long-term debt 11,915,000 8,000,000 25,657,377 Net repayment of long-term debt (261,464 ) (35,232,983 ) (10,146,657 ) Repayment of capital lease obligation (225,701 ) (208,648 ) (192,882 ) Net cash provided by (used in) financing activities 11,427,835 (27,441,631 ) 15,317,838 Net Increase (Decrease) in Cash and Cash Equivalents 14,573,586 (19,960,462 ) 21,364,681 Cash and Cash Equivalents, Beginning 23,318,183 43,278,645 21,913,964 Cash and Cash Equivalents, End $ 37,891,769 $ 23,318,183 $ 43,278,645 Supplemental Disclosure of Cash Flow Information Interest paid, net of capitalized interest $ 667,278 $ 655,464 $ 1,287,549 Income taxes paid, net of refunds $ 81,264 $ 3,711,969 $ 2,718,359 Supplemental Disclosure of Non-Cash Operating and Financing Activities Additional paid-in capital - stock option exercise $ 234,020 $ — $ —
See Notes to Consolidated Financial Statements1. Nature of Operations and Summary of Significant Accounting Policies 1. Nature of Operations and Summary of Significant Accounting Policies (Continued) 1. Nature of Operations and Summary of Significant Accounting Policies (Continued) 1. Nature of Operations and Summary of Significant Accounting Policies (Continued) 2. Property and Equipment, Net 2014 2013 Land $ 950,000 $ 950,000 Building 415,000 415,000 Capital lease asset (Note 4) 8,200,000 8,200,000 Leasehold improvements 43,997,366 46,265,469 Furniture, fixtures, and equipment 26,558,285 29,742,328 Automotive equipment 349,809 421,669 Audio-video equipment 2,563,610 2,631,214 Signs 1,655,237 1,822,536 Construction in progress 1,263,836 4,063,277 Total cost 85,953,143 94,511,493 Less accumulated depreciation and amortization 49,425,140 45,383,385 Property and equipment, net $ 36,528,003 $ 49,128,108 3. Intangible Assets 3. Intangible Assets (Continued) 2014 Cost Accumulated Amortization Copyrights and trade names $ 2,763,883 $ 2,738,358 $ 25,525 Below market rate leases 1,372,503 1,206,218 166,285 Business covenants 730,100 687,555 42,545 Customer lists 50,000 50,000 — Total $ 4,916,486 $ 4,682,131 $ 234,355 2013 Cost Accumulated Amortization Copyrights and trade names $ 2,763,883 $ 2,735,432 $ 28,451 Below market rate leases 1,372,503 1,146,954 225,549 Business covenants 730,100 657,535 72,565 Customer lists 50,000 50,000 — Total $ 4,916,486 $ 4,589,921 $ 326,565 Years ending June 30: 2015 $ 76,714 2016 46,901 2017 26,154 2018 15,596 2019 15,595 Total $ 180,960 4. Capital Lease Obligation 4. Capital Lease Obligation (Continued) Years ending June 30: 2015 $ 827,651 2016 827,651 2017 827,651 2018 827,651 2019 827,651 Thereafter 9,104,154 Total future minimum lease payments 13,242,409 Less amounts representing interest 5,729,607 Present value of minimum lease payments 7,512,802 Less current portion 244,149 Long-term obligation $ 7,268,653 5. Long-Term Debt 6. Deferred Compensation 7. Income Taxes 2014 2013 2012 U.S. $ (33,964,396 ) $ 5,026,708 $ (1,846,059 ) 2014 2013 2012 Current Federal $ (157,680 ) $ 2,054,682 $ 3,149,644 State (334,799 ) 551,078 839,507 Deferred Federal (5,698,153 ) 106,827 880,430 State (1,074,554 ) (44,822 ) 495,791 Total $ (7,265,186 ) $ 2,667,765 $ 5,365,372 2014 2013 Current assets $ 3,135,326 $ 3,576,542 Noncurrent assets 11,043,038 6,964,727 Noncurrent liabilities — (3,135,612 ) Net noncurrent deferred income taxes $ 11,043,038 $ 3,829,115 7. Income Taxes (Continued) 2014 2013 2012 Statutory U.S. federal income tax rate (35.0 )% 35.0 % (35.0 )% State and local income taxes (2.4 )% 10.8 % 72.3 % Nondeductible goodwill 15.7 % — — Nondeductible Accreditation — — 249.5 % Business Interruption booked in 6-30-12 for books — 5.8 % — Other 0.3 % 1.5 % 3.8 % Effective income tax rate (21.4 )% 53.1 % 290.6 % 2014 2013 Deferred tax assets: Deferred rent $ 1,681,362 $ 1,616,681 Payroll and payroll related costs 1,063,691 936,609 Allowance for doubtful accounts 2,668,017 3,078,213 State deferred bonus depreciation 876,271 1,445,959 Depreciation and amortization 4,507,000 — Capital lease 3,005,350 3,058,623 Other 376,673 405,184 Total deferred income taxes assets $ 14,178,364 $ 10,541,269 Deferred income tax liabilities: Depreciation and amortization $ — $ 3,074,598 Other — 61,014 Total deferred income tax liabilities $ — $ 3,135,612 Net deferred income tax assets $ 14,178,364 $ 7,405,657 7. Income Taxes (Continued) 9. Stock Transactions 9. Stock Transactions (Continued) 10. Commitments Years ending June 30: 2015 $ 14,378,173 2016 12,592,081 2017 11,123,399 2018 10,132,755 2019 7,732,411 Thereafter 14,825,961 Total minimum future rental payments $ 70,784,780 11. Related Party Transactions 12. Contingencies 13. Concentrations of Credit Risk 14. Stock Options Outstanding, June 30, 2013 10 $ 27,476 0.25 Outstanding, June 30, 2013 50 $ 129,400 5.00 Total Outstanding, June 30, 2013 60 $ 112,413 4.21 Exercised, September 30, 2013 10 $ 27,476 0.00 Outstanding, June 30, 2014 50 $ 129,400 4.00 Weighted Average fair value of options granted: $55,929 Option Price Range (Fair Value): $45,233 - $109,408 Weighted Average remaining contractual life (in years): 4.00 15. Fair Value of Financial Instruments 2014 2013 Fair Value Fair Value Assets: Cash, Cash equivalents, and restricted cash $ 37,891,769 $ 37,891,769 $ 23,431,893 $ 23,431,893 Accounts receivable, net 3,332,905 3,332,905 2,008,678 2,008,678 Accounts receivable, affiliates 17,165 N/A 17,513 N/A Liabilities: Long Term Debt, other 21,500,003 21,500,003 9,846,468 9,846,468 Accounts payable, trade 2,977,521 2,977,521 2,444,428 2,444,428 Accounts payable, affiliates — — 2,802 N/A ▪ Cash, cash equivalents, and restricted cash; accounts receivable, net; and accounts payable, trade - the carrying amounts approximate fair value because of the short-term maturity of these instruments and they are considered level 2 inputs under Fair Value Measurements. ▪ Accounts receivable, affiliate; accounts payable, affiliates; and long-term debt, affiliate - estimating the fair value of these instruments is not practicable because the terms of these transactions would not necessarily be duplicated in the market. ▪ Long-term debt, other - The carrying amounts of long-term debt, other approximate fair value based on borrowing rates available to the Company for debt with similar terms and they are considered level 2 inputs under Fair Value Measurements. Description Value Level 3 Impairment $ — $ — $ 28,582,562 $ 8,704,186 $ 8,704,186 $ 273,274 $ 139,763 $ 139,763 $ 9,598,508 Description Value Level 3 Impairment $ 8,977,460 $ 8,977,460 $ 172,946 $ 1,638,601 $ 1,638,601 $ 2,910,067